UNITED STATES
SECURITIES AND EXCHANGE COMMISSION
Washington, D.C. 20549
FORM N-CSR
CERTIFIED SHAREHOLDER REPORT OF REGISTERED MANAGEMENT INVESTMENT
COMPANIES
Investment Company Act file number: 811-08797 and 811-09049
Name of Fund: BlackRock Small Cap Growth Fund II of BlackRock Series, Inc. and BlackRock Master Small Cap
Growth Portfolio of BlackRock Master LLC
Fund Address: 100 Bellevue Parkway, Wilmington, DE 19809
Name and address of agent for service: John M. Perlowski, Chief Executive Officer, BlackRock Small Cap Growth
Fund II of BlackRock Series, Inc. and BlackRock Master Small Cap Growth Portfolio of BlackRock Master
LLC, 55 East 52nd Street, New York, NY 10055
Registrants’ telephone number, including area code: (800) 441-7762
Date of fiscal year end: 05/31/2017
Date of reporting period: 05/31/2017
Item 1 – Report to Stockholders
MAY 31, 2017
ANNUAL REPORT
| BLACKROCK® |
| BlackRock Advantage Small Cap Core Fund | of BlackRock FundsSM |
| BlackRock Small Cap Growth Fund II | of BlackRock Series, Inc. |
| Not FDIC Insured ◾ May Lose Value ◾ No Bank Guarantee |
| The Markets in Review |
Dear Shareholder,
In the 12 months ended May 31, 2017, risk assets, such as stocks and high-yield bonds, delivered strong performance. These markets showed great resilience during a period with big surprises, including the United Kingdom’s vote to leave the European Union and the outcome of the U.S. presidential election, which brought only brief spikes in equity market volatility. However, interest rates rose, which worked against high-quality assets with more interest rate sensitivity. U.S. Treasuries posted mixed returns, as rising energy prices, modest wage increases and steady job growth led to expectations of higher inflation and anticipation of interest rate increases by the U.S. Federal Reserve (the “Fed”).
The global reflationary theme – rising nominal growth, wages and inflation – was the dominant driver of asset returns during the period, outweighing significant political upheavals and economic uncertainty. Reflationary expectations accelerated after the U.S. election in November 2016 and continued into the beginning of 2017, stoked by expectations that the new administration’s policies would provide an extra boost to U.S. growth. The Fed has responded to these positive developments by setting expectations for additional interest rate increases and by moving toward normalizing monetary policy.
In recent months, growing skepticism about the near-term likelihood of significant U.S. tax reform and infrastructure spending has tempered enthusiasm around the reflation trade. Nonetheless, financial markets — and to an extent the Fed — have adopted a “wait-and-see” approach to the economic data and potential fiscal stimulus. Although uncertainty has persisted, benign credit conditions and the outlook for economic growth have kept markets relatively tranquil.
In the fifth edition of our Global Investor Pulse Survey, we heard from 28,000 individuals across 18 countries, including more than 4,000 respondents from the United States. While retirement remains the single most important issue for American investors, only a third of respondents feel confident that they will have enough retirement income, and nearly 40% of respondents have yet to begin saving for retirement. We encourage you to talk with your financial advisor and visit blackrock.com for further insight about investing in today’s markets.
Sincerely,

Rob Kapito
President, BlackRock Advisors, LLC

Rob Kapito
President, BlackRock Advisors, LLC
| Total Returns as of May 31, 2017 | ||||||||
| 6-month | 12-month | |||||||
U.S. large cap equities | 10.81 | % | 17.47 | % | ||||
U.S. small cap equities | 4.33 | 20.36 | ||||||
International equities | 17.91 | 16.44 | ||||||
Emerging market | 17.51 | 27.41 | ||||||
3-month Treasury bills | 0.26 | 0.44 | ||||||
U.S. Treasury securities | 2.46 | (1.76 | ) | |||||
U.S. investment-grade | 2.52 | 1.58 | ||||||
Tax-exempt municipal | 4.52 | 1.58 | ||||||
U.S. high yield bonds | 6.72 | 13.57 | ||||||
| Past performance is no guarantee of future results. Index performance is shown for illustrative purposes only. You cannot invest directly in an index. | ||||||||
| 2 | THIS PAGE NOT PART OF YOUR FUND REPORT |
| Table of Contents |
| Page | ||||
| 2 | ||||
Annual Report: | ||||
| 4 | ||||
| 8 | ||||
| 8 | ||||
| 9 | ||||
Fund Financial Statements: | ||||
Schedule of Investments: BlackRock Advantage Small Cap Core Fund | 10 | |||
| 16 | ||||
| 18 | ||||
| 19 | ||||
| 20 | ||||
| 28 | ||||
Fund Report of Independent Registered Public Accounting Firm | 41 | |||
| 41 | ||||
Master Portfolio Information: BlackRock Master Small Cap Growth Portfolio | 42 | |||
Master Portfolio Financial Statements: | ||||
| 43 | ||||
| 49 | ||||
| 50 | ||||
| 51 | ||||
| 51 | ||||
| 52 | ||||
Master Portfolio Report of Independent Registered Public Accounting Firm | 59 | |||
| 60 | ||||
| 65 | ||||
| 68 |
|
Shareholders can sign up for e-mail notifications of quarterly statements, annual and semi-annual shareholder reports and prospectuses by enrolling in the electronic delivery program. Electronic copies of shareholder reports and prospectuses are also available on BlackRock’s website.
TO ENROLL IN ELECTRONIC DELIVERY:
Shareholders Who Hold Accounts with Investment Advisors, Banks or Brokerages: Please contact your financial advisor. Please note that not all investment advisors, banks or brokerages may offer this service.
Shareholders Who Hold Accounts Directly with BlackRock: 1. Access the BlackRock website at blackrock.com 2. Select “Access Your Account” 3. Next, select “eDelivery” in the “Related Resources” box and follow the sign-up instructions
|

| ANNUAL REPORT | MAY 31, 2017 | 3 |
| Fund Summary as of May 31, 2017 | BlackRock Advantage Small Cap Core Fund |
| Investment Objective |
BlackRock Advantage Small Cap Core Fund’s (the “Fund”) investment objective is to seek capital appreciation over the long term.
On December 15, 2016, the Board approved a proposal to change the name of BlackRock Disciplined Small Cap Core Fund to BlackRock Advantage Small Cap Core Fund, which was effective on February 15, 2017.
| Portfolio Management Commentary |
How did the Fund perform?
| • | For the 12-month period ended May 31, 2017, the Fund’s Institutional, Investor A and Class K Shares outperformed the benchmark, the Russell 2000® Index, while the Fund’s Investor C Shares underperformed the benchmark. |
What factors influenced performance?
| • | Positive contributions to performance during the period included insights related to sentiment, fundamentals and macroeconomics. Specifically, text-based analyses that capture sentiment trends in stock price performance performed well. This was realized from multiple sentiment sources including sell side analyst reports and company executive conference calls. These signals led to an overweight in Sandy Spring Bancorp, Inc., which performed well as expectations increased for a lighter regulatory burden for regional banks. Also, analyzing sell side analyst reports led to the establishment of an overweight in Ultra Clean Holdings, Inc., a semiconductor company specializing in precision robotic solutions. The company performed well after the November 2016 U.S. election results prompted analysts to expect resurgent domestic manufacturing. A macro-based insight that evaluates a company’s sensitivity to states with economic strength performed well by underweighting companies with exposure to Northeastern states. Finally, a fundamental signal that captures the relative value of a company when compared to top-line sales was additive as the market demonstrated a strong rotation towards value in the fourth quarter of 2016. This signal worked particularly well across technology stocks. |
| • | Negative contributions to performance during the period were driven by a few stock-specific events and a small number of portfolio insights. Specifically, an overweight position in retailer Big 5 Sporting Goods Corp. detracted as the company missed revenues in the fourth quarter and posted a loss. The impact on the stock was magnified by concerns around U.S. retail consumption. Across portfolio insights, evaluating companies with respect to their ability to generate cash flow detracted. This manifested itself across several insights including dividend growth, free cash flow generation as a measure of value, and efficiency in using assets to generate cash flows. These signals struggled against a market that rotated away from yield as a characteristic and towards relative value. |
Describe recent portfolio activity.
| • | As the 12-month period progressed, the Fund positioned itself to capture the developing reflationary theme. This prompted a broader rotation toward pockets of value, which established performance trends in the market. Specifically, the weightings of financial, health care and industrial companies were increased, while weightings of materials and energy stocks were decreased. |
Describe portfolio positioning at period end.
| • | Relative to the Russell 2000® Index, the Fund ended the period with its largest sector overweights in health care, industrials, and consumer discretionary stocks, and its most significant underweights in materials and energy stocks. |
The views expressed reflect the opinions of BlackRock as of the date of this report and are subject to change based on changes in market, economic or other conditions. These views are not intended to be a forecast of future events and are no guarantee of future results.
| Portfolio Information |
| Ten Largest Holdings | Percent of Net Assets | ||||
Southwest Gas Holdings, Inc. | 2 | % | |||
Applied Industrial Technologies, Inc. | 2 | ||||
Insperity, Inc. | 2 | ||||
NorthWestern Corp. | 2 | ||||
Cantel Medical Corp. | 2 | ||||
CSG Systems International, Inc. | 2 | ||||
Mueller Water Products, Inc., Class A | 2 | ||||
Entegris, Inc. | 2 | ||||
Universal Forest Products, Inc. | 1 | ||||
Sanmina Corp. | 1 | ||||
| Sector Allocation | Percent of Net Assets | ||||
Financials | 19 | % | |||
Information Technology | 19 | ||||
Industrials | 15 | ||||
Health Care | 14 | ||||
Consumer Discretionary | 13 | ||||
Real Estate | 7 | ||||
Materials | 4 | ||||
Utilities | 4 | ||||
Consumer Staples | 2 | ||||
Energy | 2 | ||||
Short-Term Securities | 2 | ||||
Liabilities in Excess of Other Assets | (1 | ) | |||
For Fund compliance purposes, the Fund’s sector classifications refer to one or more of the sector sub-classifications used by one or more widely recognized market indexes or ratings group indexes, and/or as defined by the investment adviser. These definitions may not apply for purposes of this report, which may combine such sector sub-classifications for reporting ease.
| 4 | ANNUAL REPORT | MAY 31, 2017 |
| BlackRock Advantage Small Cap Core Fund |
| Total Return Based on a $10,000 Investment |
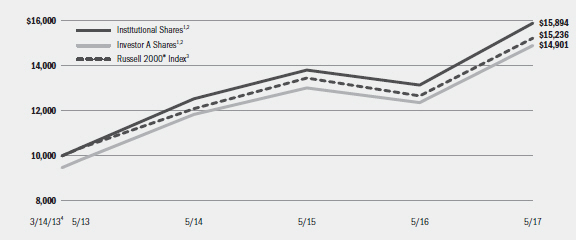
| 1 | Assuming maximum sales charges, if any, transaction costs and other operating expenses, including investment advisory fees and administration fees, if any. Institutional Shares do not have a sales charge. |
| 2 | Under normal circumstances, the Fund seeks to invest at least 80% of its net assets plus any borrowings for investment purposes in equity securities or other financial instruments that are components of, or have market capitalizations similar to, the securities included in the Russell 2000® Index. |
| 3 | An unmanaged index that is a subset of the Russell 3000® Index representing approximately 10% of the total market capitalization of that index. It includes approximately 2,000 of the smallest securities based on a combination of their market cap and current index membership. |
| 4 | Commencement of operations. |
| Performance Summary for the Period Ended May 31, 2017 |
| Average Annual Total Returns5 | ||||||||||||||||||||||
| 1 Year | Since Inception6 | |||||||||||||||||||||
| 6-Month Total Returns | w/o sales charge | w/ sales charge | w/o sales charge | w/ sales charge | ||||||||||||||||||
Institutional | 3.61% | 20.84 | % | N/A | 11.62 | % | N/A | |||||||||||||||
Investor A | 3.46 | 20.51 | 14.18 | % | 11.34 | 9.93 | % | |||||||||||||||
Investor C | 3.08 | 19.47 | 18.47 | 10.48 | 10.48 | |||||||||||||||||
Class K | 3.54 | 20.74 | N/A | 11.71 | N/A | |||||||||||||||||
Russell 2000® Index | 4.33 | 20.36 | N/A | 10.52 | N/A | |||||||||||||||||
| 5 | Assuming maximum sales charges, if any. Average annual total returns with and without sales charges reflect reductions for distribution and service fees. See “About Fund Performance” on page 8 for a detailed description of share classes, including any related sales charges and fees. |
| 6 | The Fund commenced operations on March 14, 2013. |
| N/A—Not applicable as share class and index do not have a sales charge. |
| Past performance is not indicative of future results. |
| Performance results may include adjustments made for financial reporting purposes in accordance with U.S. generally accepted accounting principles. |
| Expense Example |
| Actual | Hypothetical8 | |||||||||||||
| Beginning Account Value December 1, 2016 | Ending Account Value May 31, 2017 | Expenses Paid During the Period7 | Beginning Account Value December 1, 2016 | Ending Account Value May 31, 2017 | Expenses Paid During the Period7 | Annualized Expense Ratio | ||||||||
Institutional | $1,000.00 | $1,036.10 | $2.52 | $1,000.00 | $1,022.46 | $2.50 | 0.50% | |||||||
Investor A | $1,000.00 | $1,034.60 | $3.80 | $1,000.00 | $1,021.19 | $3.78 | 0.75% | |||||||
Investor C | $1,000.00 | $1,030.80 | $7.60 | $1,000.00 | $1,017.45 | $7.55 | 1.50% | |||||||
Class K | $1,000.00 | $1,035.40 | $2.28 | $1,000.00 | $1,022.69 | $2.27 | 0.45% | |||||||
| 7 | For each class of the Fund, expenses are equal to the annualized expense ratio for the class, multiplied by the average account value over the period, multiplied by 182/ 365 (to reflect the one-half year period shown). |
| 8 | Hypothetical 5% annual return before expenses is calculated by prorating the number of days in the most recent fiscal half year divided by 365. |
| See “Disclosure of Expenses” on page 8 for further information on how expenses were calculated. |
| ANNUAL REPORT | MAY 31, 2017 | 5 |
| Fund Summary as of May 31, 2017 | BlackRock Small Cap Growth Fund II |
| Investment Objective |
BlackRock Small Cap Growth Fund II’s (the “Fund”) investment objective is to seek long-term capital growth. In other words, the Fund tries to choose investments that will increase in value. Current income from dividends and interest will not be an important consideration in selecting portfolio securities.
On March 23, 2017, the Boards of the Fund, BlackRock Master Small Cap Growth Portfolio (the “Master Portfolio”) and BlackRock Advantage Small Cap Growth Fund (the “Acquiring Fund”) approved an in-kind liquidation of the Master Portfolio into the Fund and the reorganization of the Fund with and into the Acquiring Fund, with the Acquiring Fund continuing as the surviving fund after the liquidation and the reorganization. The liquidation and the reorganization are subject to shareholder approval by the Fund’s shareholders and certain other conditions.
| Portfolio Management Commentary |
How did the Fund perform?
| • | For the 12-month period ended May 31, 2017, through its investment in the Master Portfolio, the Fund underperformed its benchmark, the Russell 2000® Growth Index. |
What factors influenced performance?
| • | Positive contributors to the Master Portfolio’s performance included insights related to fundamentals, sentiment and macroeconomics. Sentiment-based insights performed well as the reflationary regime evolved and began filtering through broader market expectations. Picking up stock price trends through text analyses of company executive conference calls and sell side analyst reports was additive as broader economic expectations improved. This was realized predominantly within banks, such as Wintrust Financial Corp., as the industry performed well amid anticipation of a lower regulatory burden following the November 2016 U.S. elections. A fundamental insight that identifies quality by evaluating asset efficiency in generating cash flows performed well during the period in health care and real estate. Finally, a macro-based insight that identifies a company’s sensitivity to states with economic strength was positive as it led to underweights to companies with exposure to Northeastern states. |
| • | Conversely, negative contributions during the period were driven by stock selection, which saw the portfolio wrong-footed by some earnings announcements. Specifically, an underweight to Chemours Co., a North American chemical provider, detracted during the period as the company |
| delivered upside earnings surprises. The underweight position had been motivated by deteriorating sentiment from bond analysts and investors as well as deterioration in expectations for cash flow growth. Additionally, bond sentiment indicators struggled to capture trends as yields dropped despite the Fed raising interest rates. Unsurprisingly, this was observed across diversified financials companies such as PRA Group, Inc., a nonperforming loan management company. Another insight that struggled was one that rewards companies that show lower sensitivity to growth as a style factor. This signal broadly detracted across energy and technology companies as the market continued to grind higher toward period-end with growth as a main driver of performance. |
Describe recent portfolio activity.
| • | As the 12-month period progressed, the Master Portfolio positioned itself to capture the developing reflationary theme. This prompted a broader rotation toward pockets of value, which established performance trends in the market. Specifically, the weighting of health care and financial companies was increased, while weightings of energy and technology stocks were decreased. |
Describe portfolio positioning at period end.
| • | Relative to the Russell 2000® Growth Index, the Master Portfolio ended the period with overweight positions in financial, industrial, and health care stocks, and underweights in materials and consumer staples stocks. |
The views expressed reflect the opinions of BlackRock as of the date of this report and are subject to change based on changes in market, economic or other conditions. These views are not intended to be a forecast of future events and are no guarantee of future results.
| 6 | ANNUAL REPORT | MAY 31, 2017 |
| BlackRock Small Cap Growth Fund II |
| Total Return Based on a $10,000 Investment |
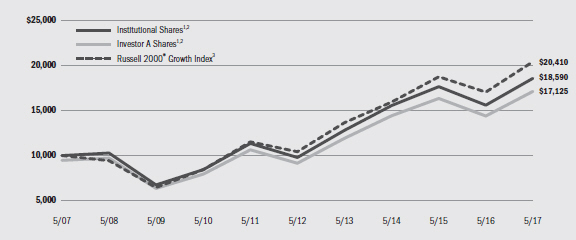
| 1 | Assuming maximum sales charges, if any, transaction costs and other operating expenses, including administration fees, if any. Institutional Shares do not have a sales charge. |
| 2 | The Fund invests all of its assets in the Master Portfolio. The Master Portfolio will, under normal circumstances, invest at least 80% of its net assets (plus any borrowings for investment purposes) in equity securities of small cap companies and at least 80% of its net assets (plus any borrowings for investment purposes) in securities or instruments of issuers located in the United States. |
| 3 | An unmanaged index that measures the performance of the small-cap growth segment of the U.S. equity universe. It includes those Russell 2000® Index companies with higher price-to-value ratios and higher forecasted growth values. |
| Performance Summary for the Period Ended May 31, 2017 |
| Average Annual Total Returns4 | ||||||||||||||||||||||||||||||||
| 1 Year | 5 Years | 10 Years | ||||||||||||||||||||||||||||||
6-Month Total Returns | w/o sales charge | w/ sales charge | w/o sales charge | w/ sales charge | w/o sales charge | w/ sales charge | ||||||||||||||||||||||||||
Institutional | 5.59% | 19.17 | % | N/A | 13.74 | % | N/A | 6.40 | % | N/A | ||||||||||||||||||||||
Investor A | 5.38 | 18.92 | 12.68 | % | 13.38 | 12.17 | % | 6.10 | 5.53 | % | ||||||||||||||||||||||
Investor C | 5.07 | 17.95 | 16.95 | 12.45 | 12.45 | 5.13 | 5.13 | |||||||||||||||||||||||||
Class R | 5.31 | 18.60 | N/A | 13.11 | N/A | 5.75 | N/A | |||||||||||||||||||||||||
Russell 2000® Growth Index | 7.76 | 19.71 | N/A | 14.36 | N/A | 7.39 | N/A | |||||||||||||||||||||||||
| 4 | Assuming maximum sales charges, if any. Average annual total returns with and without sales charges reflect reductions for distribution and service fees. See “About Fund Performance” on page 8 for a detailed description of share classes, including any related sales charges and fees. |
| N/A—Not applicable as share class and index do not have a sales charge. |
| Past performance is not indicative of future results. |
| Performance results may include adjustments made for financial reporting purposes in accordance with U.S. generally accepted accounting principles. |
| Expense Example |
| Actual | Hypothetical6 | |||||||||||||
| Beginning Account Value December 1, 2016 | Ending Account Value May 31, 2017 | Expenses Paid During the Period5 | Beginning Account Value December 1, 2016 | Ending Account Value May 31, 2017 | Expenses Paid During the Period5 | Annualized Ratio | ||||||||
Institutional | $1,000.00 | $1,055.90 | $3.49 | $1,000.00 | $1,021.54 | $3.43 | 0.68% | |||||||
Investor A | $1,000.00 | $1,053.80 | $4.76 | $1,000.00 | $1,020.29 | $4.69 | 0.93% | |||||||
Investor C | $1,000.00 | $1,050.70 | $8.59 | $1,000.00 | $1,016.55 | $8.45 | 1.68% | |||||||
Class R | $1,000.00 | $1,053.10 | $6.04 | $1,000.00 | $1,019.05 | $5.94 | 1.18% | |||||||
| 5 | For each class of the Fund, expenses are equal to the annualized expense ratio for the class, multiplied by the average account value over the period, multiplied by 182/ 365 (to reflect the one-half year period shown). Because the Fund invests all of its assets in the Master Portfolio, the expense example reflects the net expenses of both the Fund and the Master Portfolio in which it invests. |
| 6 | Hypothetical 5% annual return before expenses is calculated by prorating the number of days in the most recent fiscal half year divided by 365. |
| See “Disclosure of Expenses” on page 8 for further information on how expenses were calculated. |
| ANNUAL REPORT | MAY 31, 2017 | 7 |
| About Fund Performance |
| • | Institutional and Class K Shares (Class K Shares available only in BlackRock Advantage Small Cap Core Fund) are not subject to any sales charge. These shares bear no ongoing distribution or service fees and are available only to certain eligible investors. Prior to March 28, 2016 (commencement of operations), Class K Shares performance results are those of Institutional Shares, restated to reflect Class K Shares fees. |
| • | Investor A Shares are subject to a maximum initial sales charge (front-end load) of 5.25% and a service fee of 0.25% per year (but no distribution fee). Certain redemptions of these shares may be subject to a contingent deferred sales charge (“CDSC”) where no initial sales charge was paid at the time of purchase. These shares are generally available through financial intermediaries. |
| On June 23, 2015, all issued and outstanding Investor B Shares, which were previously available only in BlackRock Small Cap Growth Fund II, were converted into Investor A Shares with the same relative aggregate net asset value (“NAV”). |
| • | Investor C Shares are subject to a 1.00% CDSC if redeemed within one year of purchase. In addition, these shares are subject to a distribution fee of 0.75% per year and a service fee of 0.25% per year. These shares are generally available through financial intermediaries. |
| • | Class R Shares (available only in BlackRock Small Cap Growth Fund II) are not subject to any sales charge. These shares are subject to a distribution fee of 0.25% per year and a service fee of 0.25% per year. These shares are available only to certain employer-sponsored retirement plans. |
Performance information reflects past performance and does not guarantee future results. Current performance may be lower or higher than the performance data quoted. Refer to www.blackrock.com/funds to obtain performance data current to the most recent month end. Performance results do not reflect the deduction of taxes that a shareholder would pay on fund distributions or the redemption of fund shares. Figures shown in the performance tables on the previous pages assume reinvestment of all distributions, if any, at NAV on the ex-dividend date. Investment return and principal value of shares will fluctuate so that shares, when redeemed, may be worth more or less than their original cost. Distributions paid to each class of shares will vary because of the different levels of service, distribution and transfer agency fees applicable to each class, which are deducted from the income available to be paid to shareholders.
BlackRock Advisors, LLC, BlackRock Advantage Small Cap Core Fund’s investment adviser and BlackRock Small Cap Growth Fund II’s administrator, has contractually agreed to waive and/or reimburse a portion of each Fund’s expenses. Without such waiver and/or reimbursement, a Fund’s performance would have been lower. BlackRock Advisors, LLC is under no obligation to continue waiving and/or reimbursing its fees after the applicable termination date of such agreement. See Note 6 of the Notes to Financial Statements for additional information on waivers and/or reimbursements.
|
Shareholders of these Funds may incur the following charges: (a) transactional expenses, such as sales charges; and (b) operating expenses, including investment advisory fees, administration fees, service and distribution fees, including 12b-1 fees, acquired fund fees and expenses, and other fund expenses. The expense examples on the previous pages (which are based on a hypothetical investment of $1,000 invested on December 1, 2016 and held through May 31, 2017) are intended to assist shareholders both in calculating expenses based on an investment in each Fund and in comparing these expenses with similar costs of investing in other mutual funds.
The expense examples provide information about actual account values and actual expenses. In order to estimate the expenses a shareholder paid during the period covered by this report, shareholders can divide their account value by $1,000 and then multiply the result by the number corresponding to their Fund and share class under the headings entitled “Expenses Paid During the Period.”
The expense examples also provide information about hypothetical account values and hypothetical expenses based on a Fund’s actual expense ratio and an assumed rate of return of 5% per year before expenses. In order to assist shareholders in comparing the ongoing expenses of investing in these Funds and other funds, compare the 5% hypothetical examples with the 5% hypothetical examples that appear in shareholder reports of other funds.
The expenses shown in the expense examples are intended to highlight shareholders’ ongoing costs only and do not reflect any transactional expenses, such as sales charges, if any. Therefore, the hypothetical examples are useful in comparing ongoing expenses only, and will not help shareholders determine the relative total expenses of owning different funds. If these transactional expenses were included, shareholder expenses would have been higher.
| 8 | ANNUAL REPORT | MAY 31, 2017 |
| Derivative Financial Instruments |
BlackRock Advantage Small Cap Core Fund and the Master Portfolio may invest in various derivative financial instruments. These instruments are used to obtain exposure to a security, commodity, index, market and/or other asset without owning or taking physical custody of securities, commodities and/or other referenced assets or to manage market, equity, credit, interest rate, foreign currency exchange rate, commodity and/or other risks. Derivative financial instruments may give rise to a form of economic leverage and involve risks, including the imperfect correlation between the value of a derivative financial instrument and the underlying asset, possible default of the counterparty to the transaction or illiquidity
of the instrument. BlackRock Advantage Small Cap Core Fund’s and Master Portfolio’s successful use of a derivative financial instrument depends on the investment adviser’s ability to predict pertinent market movements accurately, which cannot be assured. The use of these instruments may result in losses greater than if they had not been used, may limit the amount of appreciation BlackRock Advantage Small Cap Core Fund and the Master Portfolio can realize on an investment and/or may result in lower distributions paid to shareholders. BlackRock Advantage Small Cap Core Fund’s and the Master Portfolio’s investments in these instruments, if any, are discussed in detail in BlackRock Advantage Small Cap Core Fund’s and the Master Portfolio’s Notes to Financial Statements.
| ANNUAL REPORT | MAY 31, 2017 | 9 |
| Schedule of Investments May 31, 2017 | BlackRock Advantage Small Cap Core Fund | |||
| (Percentages shown are based on Net Assets) |
| Common Stocks | Shares | Value | ||||||
Aerospace & Defense — 0.6% | ||||||||
DigitalGlobe, Inc. (a) | 4,110 | $ | 128,027 | |||||
Engility Holdings, Inc. (a) | 9,981 | 262,800 | ||||||
HEICO Corp., Class A | 5,376 | 336,806 | ||||||
|
| |||||||
| 727,633 | ||||||||
Air Freight & Logistics — 0.5% | ||||||||
Hub Group, Inc., Class A (a) | 14,004 | 502,043 | ||||||
Radiant Logistics, Inc. (a) | 22,007 | 129,401 | ||||||
|
| |||||||
| 631,444 | ||||||||
Airlines — 0.8% | ||||||||
Hawaiian Holdings, Inc. (a) | 19,436 | 973,744 | ||||||
Auto Components — 2.0% | ||||||||
Lear Corp. | 1,142 | 170,204 | ||||||
Tenneco, Inc. | 27,615 | 1,569,913 | ||||||
Tower International, Inc. | 31,561 | 732,215 | ||||||
|
| |||||||
| 2,472,332 | ||||||||
Banks — 11.4% | ||||||||
Bank of the Ozarks, Inc. | 28,134 | 1,243,523 | ||||||
Banner Corp. | 4,389 | 235,645 | ||||||
Capital Bank Financial Corp., Class A | 13,238 | 491,130 | ||||||
Carolina Financial Corp. | 5,504 | 164,790 | ||||||
Cathay General Bancorp | 19,764 | 701,622 | ||||||
Central Pacific Financial Corp. | 24,913 | 753,618 | ||||||
Columbia Banking System, Inc. | 7,713 | 283,144 | ||||||
Eagle Bancorp, Inc. (a) | 11,481 | 654,991 | ||||||
Farmers National Banc Corp. | 1,609 | 21,802 | ||||||
First BanCorp (a) | 23,691 | 122,956 | ||||||
First Connecticut Bancorp, Inc. | 1,255 | 31,438 | ||||||
First Financial Northwest, Inc. | 901 | 14,434 | ||||||
First Merchants Corp. | 34,652 | 1,375,338 | ||||||
First Midwest Bancorp, Inc. | 1,000 | 22,160 | ||||||
Glacier Bancorp, Inc. | 30,039 | 969,058 | ||||||
Guaranty Bancshares, Inc. (a) | 918 | 30,064 | ||||||
Home BancShares, Inc. | 22,446 | 525,461 | ||||||
Independent Bank Corp. | 3,075 | 62,576 | ||||||
Lakeland Financial Corp. | 487 | 20,663 | ||||||
Macatawa Bank Corp. | 8,307 | 76,757 | ||||||
Mercantile Bank Corp. | 1,515 | 47,071 | ||||||
National Bank Holdings Corp., Class A | 13,392 | 408,724 | ||||||
QCR Holdings, Inc. | 11,703 | 512,591 | ||||||
Republic Bancorp, Inc., Class A | 3,221 | 111,704 | ||||||
Sandy Spring Bancorp, Inc. | 13,120 | 503,414 | ||||||
Seacoast Banking Corp. (a) | 12,720 | 286,963 | ||||||
ServisFirst Bancshares, Inc. | 554 | 18,969 | ||||||
Union Bankshares Corp. | 11,548 | 388,013 | ||||||
United Community Banks, Inc. | 52,183 | 1,344,756 | ||||||
Webster Financial Corp. | 20,316 | 989,796 | ||||||
Wintrust Financial Corp. | 22,164 | 1,523,997 | ||||||
|
| |||||||
| 13,937,168 | ||||||||
Biotechnology — 4.0% | ||||||||
Acorda Therapeutics, Inc. (a) | 10,858 | 149,840 | ||||||
AnaptysBio, Inc. (a) | 5,024 | 128,564 | ||||||
Applied Genetic Technologies Corp. (a) | 10,132 | 52,686 | ||||||
Aptevo Therapeutics, Inc. (a) | 9,340 | 19,707 | ||||||
Arena Pharmaceuticals, Inc. (a) | 107,591 | 139,868 | ||||||
BioCryst Pharmaceuticals, Inc. (a) | 2,329 | 11,994 | ||||||
| Common Stocks | Shares | Value | ||||||
Biotechnology (continued) | ||||||||
Bluebird Bio, Inc. (a) | 332 | $ | 25,016 | |||||
ChemoCentryx, Inc. (a) | 33,445 | 222,075 | ||||||
Cytokinetics, Inc. (a) | 15,729 | 213,128 | ||||||
CytomX Therapeutics, Inc. (a) | 17,067 | 240,474 | ||||||
Dimension Therapeutics, Inc. (a) | 10,469 | 11,516 | ||||||
Emergent BioSolutions, Inc. (a) | 10,090 | 322,174 | ||||||
Enanta Pharmaceuticals, Inc. (a) | 8,020 | 241,242 | ||||||
Enzon Pharmaceuticals, Inc. | 8,011 | 2,003 | ||||||
Exact Sciences Corp. (a) | 1,325 | 48,323 | ||||||
Exelixis, Inc. (a) | 27,402 | 512,691 | ||||||
FibroGen, Inc. (a) | 12,694 | 333,852 | ||||||
Genomic Health, Inc. (a) | 9,311 | 295,717 | ||||||
Halozyme Therapeutics, Inc. (a) | 10,042 | 118,496 | ||||||
Immune Design Corp. (a) | 6,688 | 49,826 | ||||||
Intellia Therapeutics, Inc. (a) | 12,066 | 138,276 | ||||||
Ironwood Pharmaceuticals, Inc. (a) | 21,558 | 381,792 | ||||||
Jounce Therapeutics, Inc. (a) | 3,685 | 74,621 | ||||||
Kite Pharma, Inc. (a) | 393 | 28,422 | ||||||
Pfenex, Inc. (a) | 43,979 | 178,995 | ||||||
Retrophin, Inc. (a) | 16,690 | 264,536 | ||||||
Seres Therapeutics, Inc. (a) | 5,265 | 48,017 | ||||||
Spectrum Pharmaceuticals, Inc. (a) | 16,679 | 94,403 | ||||||
TESARO, Inc. (a) | 664 | 99,142 | ||||||
Vanda Pharmaceuticals, Inc. (a) | 20,003 | 275,041 | ||||||
Xencor, Inc. (a) | 8,496 | 174,168 | ||||||
|
| |||||||
| 4,896,605 | ||||||||
Building Products — 2.5% | ||||||||
Apogee Enterprises, Inc. | 20,891 | 1,113,072 | ||||||
Ply Gem Holdings, Inc. (a) | 12,433 | 203,280 | ||||||
Universal Forest Products, Inc. | 19,874 | 1,747,521 | ||||||
|
| |||||||
| 3,063,873 | ||||||||
Capital Markets — 2.5% | ||||||||
BGC Partners, Inc., Class A | 16,022 | 188,899 | ||||||
Evercore Partners, Inc., Class A | 16,147 | 1,094,767 | ||||||
GAIN Capital Holdings, Inc. | 1,698 | 9,933 | ||||||
Houlihan Lokey, Inc. | 18,698 | 627,692 | ||||||
Moelis & Co., Class A | 30,718 | 1,078,202 | ||||||
|
| |||||||
| 2,999,493 | ||||||||
Chemicals — 1.6% | ||||||||
Chemours Co. | 6,511 | 260,375 | ||||||
Innospec, Inc. | 5,413 | 346,432 | ||||||
PolyOne Corp. | 25,747 | 961,393 | ||||||
Stepan Co. | 2,378 | 201,226 | ||||||
Trinseo SA | 3,240 | 208,818 | ||||||
|
| |||||||
| 1,978,244 | ||||||||
Commercial Services & Supplies — 1.9% | ||||||||
ACCO Brands Corp. (a) | 16,161 | 183,427 | ||||||
ARC Document Solutions, Inc. (a) | 10,286 | 34,047 | ||||||
Brink’s Co. | 1,515 | 95,597 | ||||||
Casella Waste Systems, Inc., Class A (a) | 10,868 | 152,369 | ||||||
Steelcase, Inc., Class A | 8,640 | 144,720 | ||||||
Tetra Tech, Inc. | 36,910 | 1,696,014 | ||||||
|
| |||||||
| 2,306,174 | ||||||||
| Portfolio Abbreviation | ||
| CVR | Contingent Value Rights | |
See Notes to Financial Statements.
| 10 | ANNUAL REPORT | MAY 31, 2017 |
| Schedule of Investments (continued) | BlackRock Advantage Small Cap Core Fund | |||
| Common Stocks | Shares | Value | ||||||
Communications Equipment — 1.2% | ||||||||
Black Box Corp. | 15,720 | $ | 128,904 | |||||
Calix, Inc. (a) | 5,703 | 37,355 | ||||||
InterDigital, Inc. | 15,989 | 1,295,109 | ||||||
|
| |||||||
| 1,461,368 | ||||||||
Construction & Engineering — 1.6% | ||||||||
Comfort Systems U.S.A., Inc. | 15,052 | 518,541 | ||||||
MasTec, Inc. (a) | 32,417 | 1,374,481 | ||||||
MYR Group, Inc. (a) | 395 | 11,597 | ||||||
|
| |||||||
| 1,904,619 | ||||||||
Construction Materials — 0.0% | ||||||||
US Concrete, Inc. (a) | 564 | 37,280 | ||||||
Consumer Finance — 0.7% | ||||||||
Elevate Credit, Inc. (a) | 30,855 | 215,985 | ||||||
Enova International, Inc. (a) | 45,293 | 602,397 | ||||||
Green Dot Corp., Class A (a) | 435 | 15,982 | ||||||
|
| |||||||
| 834,364 | ||||||||
Diversified Consumer Services — 0.6% | ||||||||
Ascent Capital Group, Inc., Class A (a) | 5,237 | 72,113 | ||||||
Bridgepoint Education, Inc. (a) | 3,466 | 47,969 | ||||||
Capella Education Co. | 4,592 | 397,438 | ||||||
Regis Corp. (a) | 20,263 | 191,485 | ||||||
|
| |||||||
| 709,005 | ||||||||
Diversified Telecommunication Services — 0.2% | ||||||||
FairPoint Communications, Inc. (a) | 1,377 | 19,829 | ||||||
Ooma, Inc. (a) | 21,231 | 179,402 | ||||||
Windstream Holdings, Inc. | — | — | ||||||
|
| |||||||
| 199,231 | ||||||||
Electrical Equipment — 0.0% | ||||||||
Atkore International Group, Inc. (a) | 2,632 | 54,904 | ||||||
Electronic Equipment, Instruments & Components — 4.4% | ||||||||
Insight Enterprises, Inc. (a) | 1,619 | 67,253 | ||||||
KEMET Corp. (a) | 46,039 | 635,338 | ||||||
PC Connection, Inc. | 4,796 | 125,080 | ||||||
PCM, Inc. (a) | 10,379 | 204,466 | ||||||
Sanmina Corp. (a) | 47,159 | 1,726,019 | ||||||
SYNNEX Corp. | 8,334 | 927,241 | ||||||
Tech Data Corp. (a) | 17,343 | 1,681,751 | ||||||
|
| |||||||
| 5,367,148 | ||||||||
Energy Equipment & Services — 0.3% | ||||||||
Archrock, Inc. | 3,873 | 40,667 | ||||||
Mammoth Energy Services, Inc. (a) | 12,494 | 227,016 | ||||||
Pioneer Energy Services Corp. (a) | 27,052 | 66,277 | ||||||
|
| |||||||
| 333,960 | ||||||||
Equity Real Estate Investment Trusts (REITs) — 7.3% | ||||||||
American Assets Trust, Inc. | 239 | 9,333 | ||||||
Armada Hoffler Properties, Inc. | 2,684 | 35,456 | ||||||
Ashford Hospitality Prime, Inc. | 51,758 | 497,912 | ||||||
CatchMark Timber Trust, Inc., Class A | 4,680 | 52,978 | ||||||
Chatham Lodging Trust | 1 | 20 | ||||||
CoreSite Realty Corp. | 1,661 | 174,870 | ||||||
DCT Industrial Trust, Inc. | 10,408 | 548,606 | ||||||
DiamondRock Hospitality Co. | 6,982 | 77,430 | ||||||
DuPont Fabros Technology, Inc. | 712 | 38,897 | ||||||
Easterly Government Properties, Inc. | 1,749 | 34,735 | ||||||
First Industrial Realty Trust, Inc. | 15,345 | 443,164 | ||||||
One Liberty Properties, Inc. | 761 | 16,970 | ||||||
PS Business Parks, Inc. | 10,958 | 1,383,776 | ||||||
Ramco-Gershenson Properties Trust | 86,613 | 1,090,458 | ||||||
Retail Opportunity Investments Corp. | 28,814 | 569,365 | ||||||
| Common Stocks | Shares | Value | ||||||
Equity Real Estate Investment Trusts (REITs) (continued) |
| |||||||
RLJ Lodging Trust | 11,715 | $ | 238,400 | |||||
Ryman Hospitality Properties, Inc. | 22,490 | 1,448,581 | ||||||
Summit Hotel Properties, Inc. | 80,747 | 1,445,371 | ||||||
Terreno Realty Corp. | 23,129 | 755,856 | ||||||
Urban Edge Properties | 622 | 14,828 | ||||||
|
| |||||||
| 8,877,006 | ||||||||
Food & Staples Retailing — 0.1% | ||||||||
Performance Food Group Co. (a) | 5,195 | 147,018 | ||||||
Food Products — 0.4% | ||||||||
Dean Foods Co. | 25,911 | 472,617 | ||||||
Gas Utilities — 1.9% | ||||||||
Southwest Gas Holdings, Inc. | 28,716 | 2,284,932 | ||||||
Health Care Equipment & Supplies — 4.1% | ||||||||
AngioDynamics, Inc. (a) | 12,437 | 187,550 | ||||||
Cantel Medical Corp. | 24,847 | 1,933,594 | ||||||
Cutera, Inc. (a) | 13,287 | 302,944 | ||||||
Inogen, Inc. (a) | 6,600 | 585,024 | ||||||
LeMaitre Vascular, Inc. | 7,772 | 237,512 | ||||||
Masimo Corp. (a) | 19,694 | 1,714,166 | ||||||
|
| |||||||
| 4,960,790 | ||||||||
Health Care Providers & Services — 1.0% | ||||||||
Cross Country Healthcare, Inc. (a) | 8,038 | 92,839 | ||||||
Five Star Senior Living, Inc. (a) | 19,049 | 34,288 | ||||||
LHC Group, Inc. (a) | 12,699 | 764,480 | ||||||
UnitedHealth Group, Inc. | 427 | 74,802 | ||||||
WellCare Health Plans, Inc. (a) | 1,827 | 313,879 | ||||||
|
| |||||||
| 1,280,288 | ||||||||
Health Care Technology — 0.9% | ||||||||
Medidata Solutions, Inc. (a) | 13,344 | 949,826 | ||||||
Vocera Communications, Inc. (a) | 5,336 | 142,631 | ||||||
|
| |||||||
| 1,092,457 | ||||||||
Hotels, Restaurants & Leisure — 2.1% | ||||||||
Bloomin’ Brands, Inc. | 19,744 | 395,472 | ||||||
Caesars Entertainment Corp. (a)(b) | 55,928 | 612,412 | ||||||
Cheesecake Factory, Inc. | 1,669 | 98,438 | ||||||
Monarch Casino & Resort, Inc. (a) | 6,378 | 192,297 | ||||||
Papa John’s International, Inc. | 2,711 | 218,425 | ||||||
Ruth’s Hospitality Group, Inc. | 26,890 | 580,824 | ||||||
Vail Resorts, Inc. | 2,004 | 428,656 | ||||||
|
| |||||||
| 2,526,524 | ||||||||
Household Durables — 2.7% | ||||||||
Century Communities, Inc. (a) | 50,893 | 1,267,236 | ||||||
iRobot Corp. (a) | 15,849 | 1,469,519 | ||||||
Taylor Morrison Home Corp., Class A (a) | 23,048 | 535,866 | ||||||
UCP, Inc., Class A (a) | 2,418 | 26,598 | ||||||
|
| |||||||
| 3,299,219 | ||||||||
Household Products — 0.5% | ||||||||
Central Garden & Pet Co. (a) | 8,458 | 253,063 | ||||||
Central Garden & Pet Co., Class A (a) | 12,440 | 359,640 | ||||||
|
| |||||||
| 612,703 | ||||||||
Industrial Conglomerates — 0.3% | ||||||||
Raven Industries, Inc. | 12,162 | 411,684 | ||||||
Insurance — 1.6% | ||||||||
Argo Group International Holdings Ltd. | 13,096 | 810,642 | ||||||
Baldwin & Lyons, Inc., Class B | 7,226 | 171,979 | ||||||
CNO Financial Group, Inc. | 3,708 | 75,977 | ||||||
Genworth Financial, Inc., Class A (a) | 4,306 | 15,760 | ||||||
Infinity Property & Casualty Corp. | 3,408 | 326,316 | ||||||
James River Group Holdings Ltd. | 5,908 | 234,193 | ||||||
See Notes to Financial Statements.
| ANNUAL REPORT | MAY 31, 2017 | 11 |
| Schedule of Investments (continued) | BlackRock Advantage Small Cap Core Fund | |||
| Common Stocks | Shares | Value | ||||||
Insurance (continued) | ||||||||
Selective Insurance Group, Inc. | 5,413 | $ | 276,604 | |||||
|
| |||||||
| 1,911,471 | ||||||||
Internet & Direct Marketing Retail — 0.3% | ||||||||
EVINE Live, Inc. (a) | 1,772 | 2,233 | ||||||
Overstock.com, Inc. (a) | 20,974 | 294,685 | ||||||
U.S. Auto Parts Network, Inc. (a) | 8,657 | 26,490 | ||||||
|
| |||||||
| 323,408 | ||||||||
Internet Software & Services — 1.4% | ||||||||
Bankrate, Inc. (a) | 24,272 | 253,642 | ||||||
Care.com, Inc. (a) | 7,612 | 116,996 | ||||||
Cornerstone OnDemand, Inc. (a) | 19,876 | 742,567 | ||||||
Five9, Inc. (a) | 2,276 | 51,142 | ||||||
Limelight Networks, Inc. (a) | 4,910 | 14,485 | ||||||
NIC, Inc. | 2,112 | 42,768 | ||||||
Okta, Inc. (a) | 4,430 | 115,623 | ||||||
QuinStreet, Inc. (a) | 6,216 | 24,149 | ||||||
Wix.com Ltd. (a) | 4,154 | 306,150 | ||||||
YuMe, Inc. (a) | 15,808 | 75,088 | ||||||
|
| |||||||
| 1,742,610 | ||||||||
IT Services — 2.9% | ||||||||
Convergys Corp. | 22,913 | 557,015 | ||||||
CSG Systems International, Inc. | 46,085 | 1,838,331 | ||||||
Everi Holdings, Inc. (a) | 4,799 | 32,105 | ||||||
Hackett Group, Inc. | 56,234 | 824,390 | ||||||
Mantech International Corp., Class A | 271 | 10,379 | ||||||
Travelport Worldwide Ltd. | 2,258 | 30,483 | ||||||
Unisys Corp. (a) | 18,469 | 217,934 | ||||||
|
| |||||||
| 3,510,637 | ||||||||
Leisure Products — 0.4% | ||||||||
Brunswick Corp. | 2,878 | 159,038 | ||||||
Malibu Boats, Inc., Class A (a) | 10,856 | 263,258 | ||||||
Marine Products Corp. | 2,028 | 27,601 | ||||||
MCBC Holdings, Inc. | 5,237 | 100,708 | ||||||
|
| |||||||
| 550,605 | ||||||||
Life Sciences Tools & Services — 1.1% | ||||||||
Cambrex Corp. (a) | 6,140 | 330,332 | ||||||
Enzo Biochem, Inc. (a) | 28,652 | 257,868 | ||||||
Harvard Bioscience, Inc. (a) | 16,573 | 38,118 | ||||||
INC Research Holdings, Inc., Class A (a) | 1,194 | 67,879 | ||||||
Luminex Corp. | 9,431 | 191,072 | ||||||
PAREXEL International Corp. (a) | 1,111 | 89,791 | ||||||
PRA Health Sciences, Inc. (a) | 4,936 | 356,626 | ||||||
|
| |||||||
| 1,331,686 | ||||||||
Machinery — 2.7% | ||||||||
Alamo Group, Inc. | 399 | 33,967 | ||||||
Barnes Group, Inc. | 762 | 43,122 | ||||||
Briggs & Stratton Corp. | 34,334 | 816,463 | ||||||
Commercial Vehicle Group, Inc. (a) | 7,393 | 59,735 | ||||||
Global Brass & Copper Holdings, Inc. | 356 | 10,787 | ||||||
Harsco Corp. (a) | 7,060 | 105,194 | ||||||
Miller Industries, Inc. | 810 | 20,736 | ||||||
Mueller Water Products, Inc., Class A | 164,371 | 1,837,668 | ||||||
Woodward, Inc. | 6,025 | 410,423 | ||||||
|
| |||||||
| 3,338,095 | ||||||||
Media — 1.1% | ||||||||
Lee Enterprises, Inc. (a) | 17,366 | 35,600 | ||||||
Meredith Corp. | 20,007 | 1,082,379 | ||||||
New Media Investment Group, Inc. | 14,251 | 184,265 | ||||||
|
| |||||||
| 1,302,244 | ||||||||
| Common Stocks | Shares | Value | ||||||
Metals & Mining — 1.9% | ||||||||
Ryerson Holding Corp. (a) | 6,479 | $ | 54,100 | |||||
Schnitzer Steel Industries, Inc., Class A | 54,602 | 1,053,819 | ||||||
SunCoke Energy, Inc. (a) | 2,683 | 23,449 | ||||||
Worthington Industries, Inc. | 29,675 | 1,245,460 | ||||||
|
| |||||||
| 2,376,828 | ||||||||
Mortgage Real Estate Investment Trusts (REITs) — 0.6% | ||||||||
Arbor Realty Trust, Inc. | 39,490 | 323,818 | ||||||
Ares Commercial Real Estate Corp. | 16,160 | 213,797 | ||||||
Ladder Capital Corp. | 12,285 | 172,850 | ||||||
|
| |||||||
| 710,465 | ||||||||
Multiline Retail — 1.0% | ||||||||
Big Lots, Inc. | 25,073 | 1,224,315 | ||||||
Multi-Utilities — 1.6% | ||||||||
NorthWestern Corp. | 31,943 | 1,979,188 | ||||||
Oil, Gas & Consumable Fuels — 1.8% | ||||||||
Abraxas Petroleum Corp. (a) | 42,194 | 77,637 | ||||||
Bill Barrett Corp. (a) | 45,624 | 157,859 | ||||||
Carrizo Oil & Gas, Inc. (a) | 19,664 | 431,428 | ||||||
Eclipse Resources Corp. (a) | 10,449 | 23,406 | ||||||
EP Energy Corp., Class A (a) | 27,262 | 114,773 | ||||||
Evolution Petroleum Corp. | 13,395 | 97,784 | ||||||
Northern Oil and Gas, Inc. (a) | 32,469 | 53,574 | ||||||
Overseas Shipholding Group, Inc., Class A (a) | 69,150 | 182,556 | ||||||
Pacific Ethanol, Inc. (a) | 47,408 | 279,707 | ||||||
Renewable Energy Group, Inc. (a) | 59,589 | 673,356 | ||||||
REX American Resources Corp. (a) | 1,726 | 164,177 | ||||||
|
| |||||||
| 2,256,257 | ||||||||
Paper & Forest Products — 0.1% | ||||||||
Boise Cascade Co. (a) | 3,699 | 99,688 | ||||||
Domtar Corp. | 94 | 3,420 | ||||||
Verso Corp., Class A (a) | 9,173 | 31,372 | ||||||
|
| |||||||
| 134,480 | ||||||||
Personal Products — 0.2% | ||||||||
Inter Parfums, Inc. | 8,078 | 281,114 | ||||||
Natural Health Trends Corp. (b) | 508 | 14,153 | ||||||
|
| |||||||
| 295,267 | ||||||||
Pharmaceuticals — 2.7% | ||||||||
Catalent, Inc. (a) | 31,191 | 1,108,216 | ||||||
Corcept Therapeutics, Inc. (a) | 54,895 | 620,862 | ||||||
Heska Corp. (a) | 2,540 | 250,596 | ||||||
Innoviva, Inc. (a) | 3,576 | 43,699 | ||||||
Juniper Pharmaceuticals, Inc. (a) | 4,726 | 20,322 | ||||||
Prestige Brands Holdings, Inc. (a) | 23,957 | 1,206,954 | ||||||
Supernus Pharmaceuticals, Inc. (a) | 1,800 | 67,680 | ||||||
|
| |||||||
| 3,318,329 | ||||||||
Professional Services — 1.6% | ||||||||
Insperity, Inc. | 26,605 | 2,007,347 | ||||||
Semiconductors & Semiconductor Equipment — 4.7% | ||||||||
Advanced Energy Industries, Inc. (a) | 1,537 | 118,241 | ||||||
Advanced Micro Devices, Inc. (a) | 13,826 | 154,713 | ||||||
Alpha & Omega Semiconductor Ltd. (a) | 23,480 | 437,198 | ||||||
Brooks Automation, Inc. | 13,315 | 366,828 | ||||||
Entegris, Inc. (a) | 72,827 | 1,798,827 | ||||||
IXYS Corp. | 2,139 | 31,550 | ||||||
Microsemi Corp. (a) | 5,084 | 249,675 | ||||||
Semtech Corp. (a) | 10,102 | 385,896 | ||||||
Synaptics, Inc. (a) | 24,619 | 1,367,832 | ||||||
Ultra Clean Holdings, Inc. (a) | 37,231 | 850,356 | ||||||
|
| |||||||
| 5,761,116 | ||||||||
See Notes to Financial Statements.
| 12 | ANNUAL REPORT | MAY 31, 2017 |
| Schedule of Investments (continued) | BlackRock Advantage Small Cap Core Fund |
| Common Stocks | Shares | Value | ||||||
Software — 3.9% | ||||||||
A10 Networks, Inc. (a) | 35,565 | $ | 290,566 | |||||
American Software, Inc., Class A | 7,563 | 81,227 | ||||||
Bottomline Technologies, Inc. (a) | 11,813 | 295,443 | ||||||
Cloudera, Inc. (a) | 5,979 | 124,064 | ||||||
Imperva, Inc. (a) | 7,222 | 356,767 | ||||||
MicroStrategy, Inc., Class A (a) | 4,984 | 908,882 | ||||||
MobileIron, Inc. (a) | 3,468 | 18,727 | ||||||
Proofpoint, Inc. (a) | 17,313 | 1,488,918 | ||||||
RingCentral, Inc., Class A (a) | 22,953 | 782,697 | ||||||
Take-Two Interactive Software, Inc. (a) | 2,134 | 163,763 | ||||||
Varonis Systems, Inc. (a) | 6,377 | 231,804 | ||||||
|
| |||||||
| 4,742,858 | ||||||||
Specialty Retail — 2.7% | ||||||||
Aaron’s, Inc. | 16,726 | 610,834 | ||||||
Asbury Automotive Group, Inc. (a) | 19,928 | 1,114,972 | ||||||
Big 5 Sporting Goods Corp. | 80,667 | 1,121,271 | ||||||
Cato Corp., Class A | 3,851 | 77,636 | ||||||
Citi Trends, Inc. | 2,753 | 50,242 | ||||||
Haverty Furniture Cos., Inc. | 3,218 | 77,071 | ||||||
West Marine, Inc. | 23,905 | 234,986 | ||||||
|
| |||||||
| 3,287,012 | ||||||||
Textiles, Apparel & Luxury Goods — 0.3% | ||||||||
Perry Ellis International, Inc. (a) | 19,670 | 360,748 | ||||||
Thrifts & Mortgage Finance — 2.3% | ||||||||
Charter Financial Corp. | 6,333 | 113,361 | ||||||
Essent Group Ltd. (a) | 32,078 | 1,163,469 | ||||||
EverBank Financial Corp. | 167 | 3,248 | ||||||
First Defiance Financial Corp. | 12,906 | 672,403 | ||||||
MGIC Investment Corp. (a) | 10,413 | 110,170 | ||||||
Radian Group, Inc. | 6,146 | 98,705 | ||||||
Walker & Dunlop, Inc. (a) | 14,507 | 677,622 | ||||||
|
| |||||||
| 2,838,978 | ||||||||
| Common Stocks | Shares | Value | ||||||
Tobacco — 0.9% | ||||||||
Universal Corp. | 16,125 | $ | 1,070,700 | |||||
Trading Companies & Distributors — 2.5% | ||||||||
Applied Industrial Technologies, Inc. | 35,076 | 2,165,943 | ||||||
GMS, Inc. (a) | 2,874 | 93,865 | ||||||
MRC Global, Inc. (a) | 37,676 | 680,052 | ||||||
Univar, Inc. (a) | 3,312 | 100,751 | ||||||
|
| |||||||
| 3,040,611 | ||||||||
Wireless Telecommunication Services — 0.0% | ||||||||
Boingo Wireless, Inc. (a) | 2,920 | 46,924 | ||||||
Total Common Stocks — 98.4% | 120,316,006 | |||||||
| Rights | ||||||||
Biotechnology — 0.0% | ||||||||
Dyax Corp. — CVR (a)(c) | 835 | 1,912 | ||||||
Total Long-Term Investments (Cost — $118,686,295) — 98.4% | 120,317,918 | |||||||
| Short-Term Securities | ||||||||
BlackRock Liquidity Funds, T-Fund, Institutional | 2,092,686 | 2,092,686 | ||||||
SL Liquidity Series, LLC, Money Market | 621,030 | 621,155 | ||||||
Total Short-Term Securities (Cost — $2,713,838) — 2.2% | 2,713,841 | |||||||
Total Investments (Cost — $121,400,133) — 100.6% | 123,031,759 | |||||||
Liabilities in Excess of Other Assets — (0.6)% | (717,986 | ) | ||||||
|
| |||||||
Net Assets — 100.0% | $ | 122,313,773 | ||||||
|
| |||||||
| Notes to Schedule of Investments |
| (a) | Non-income producing security. |
| (b) | Security, or a portion of the security, is on loan. |
| (c) | Security is valued using significant unobservable inputs and is classified as Level 3 in the fair value hierarchy. |
| (d) | Current yield as of period end. |
| (e) | During the year ended May 31, 2017, investments in issuers considered to be affiliates of the Fund for purposes of Section 2(a)(3) of the Investment Company Act of 1940, as amended, were as follows: |
| Affiliate | Shares Held at May 31, 2016 | Net Activity | Shares Held at May 31, 2017 | Value at May 31, 2017 | Income | Net Realized Gain (Loss)1 | Change in Unrealized Appreciation | |||||||||||||||||||||
BlackRock Liquidity Funds, TempFund, Institutional Class | 164,601 | (164,601 | ) | — | — | $ 548 | — | — | ||||||||||||||||||||
BlackRock Liquidity Funds, T-Fund, Institutional Class | — | 2,092,686 | 2,092,686 | $2,092,686 | 7,286 | $ 7 | — | |||||||||||||||||||||
SL Liquidity Series, LLC, Money Market Series | 153,939 | 467,091 | 621,030 | 621,155 | 21,836 | 2 | (5 | ) | $3 | |||||||||||||||||||
Total | $2,713,841 | $29,670 | $ 2 | $3 | ||||||||||||||||||||||||
|
| |||||||||||||||||||||||||||
| 1 | Includes net capital gain distributions. |
| 2 | Represents securities lending income earned from the reinvestment of cash collateral from loaned securities, net of fees and collateral investment expenses ,and other payments to and from borrowers of securities. |
| (f) | Security was purchased with the cash collateral from loaned securities. |
| • | For Fund compliance purposes, the Fund’s industry classifications refer to one or more of the industry sub-classifications used by one or more widely recognized market indexes or ratings group indexes, and/or as defined by the investment adviser. These definitions may not apply for purposes of this report, which may combine such industry sub-classifications for reporting ease. |
See Notes to Financial Statements.
| ANNUAL REPORT | MAY 31, 2017 | 13 |
| Schedule of Investments (continued) | BlackRock Advantage Small Cap Core Fund |
| Derivative Financial Instruments Outstanding as of Period End |
| Futures Contracts | ||||||||||
| Contracts Long | Issue | Expiration | Notional Value | Unrealized Depreciation | ||||||
| 33 | Russell 2000 Mini Index | June 2017 | $2,259,015 | $(19,775) | ||||||
| Derivative Financial Instruments Categorized by Risk Exposure |
As of period end, fair values of derivative financial instruments located in the Statements of Assets and Liabilities were as follows:
| Commodity Contracts | Credit Contracts | Equity Contracts | Foreign Currency Exchange Contracts | Interest Rate Contracts | Other Contracts | Total | ||||||||||||||||||||||||
Liabilities – Derivative Financial Instruments | ||||||||||||||||||||||||||||||
Futures contracts | Net unrealized depreciation1 | — | — | $19,775 | — | — | — | $19,775 | ||||||||||||||||||||||
| 1 | Includes cumulative appreciation (depreciation) on futures contracts, if any, as reported in the Schedule of Investments. Only current day’s variation margin is reported within the Statements of Assets and Liabilities. |
For the year ended May 31, 2017, the effect of derivative financial instruments in the Statements of Operations was as follows:
| Net Realized Gain from: | Commodity Contracts | Credit Contracts | Equity Contracts | Foreign Currency Exchange Contracts | Interest Rate Contracts | Other Contracts | Total | |||||||||||||||||||||
Futures contracts | — | — | $135,200 | — | — | — | $135,200 | |||||||||||||||||||||
Net Change in Unrealized Depreciation on: | ||||||||||||||||||||||||||||
Futures contracts | — | — | $ (24,979) | — | — | — | $ (24,979) | |||||||||||||||||||||
| Average Quarterly Balances of Outstanding Derivative Financial Instruments |
Futures contracts: | ||||
Average notional value of contract - long | $ | 1,291,956 |
For more information about the Fund’s investment risks regarding derivative financial instruments, refer to the Notes to Financial Statements.
See Notes to Financial Statements.
| 14 | ANNUAL REPORT | MAY 31, 2017 |
| Schedule of Investments (concluded) | BlackRock Advantage Small Cap Core Fund |
| Fair Value Hierarchy as of Period End |
Various inputs are used in determining the fair value of investments and derivative financial instruments. For information about the Fund’s policy regarding valuation of investments and derivative financial instruments, refer to the Notes to Financial Statements.
The following tables summarize the Fund’s investments and derivative financial instruments categorized in the disclosure hierarchy:
| Level 1 | Level 2 | Level 3 | Total | |||||||||||||
Assets: | ||||||||||||||||
Investments: | ||||||||||||||||
Long-Term Investments: | ||||||||||||||||
Common Stocks1 | $ | 120,316,006 | — | — | $ | 120,316,006 | ||||||||||
Rights1 | — | — | $ | 1,912 | 1,912 | |||||||||||
Short-Term Securities | 2,092,686 | — | — | 2,092,686 | ||||||||||||
|
| |||||||||||||||
Subtotal | $ | 122,408,692 | — | $ | 1,912 | $ | 122,410,604 | |||||||||
|
| |||||||||||||||
Investments Valued at NAV2 | 621,155 | |||||||||||||||
|
| |||||||||||||||
Total Investments | $ | 123,031,759 | ||||||||||||||
|
| |||||||||||||||
Derivative Financial Instruments3 | ||||||||||||||||
Liabilities: | ||||||||||||||||
Equity contracts | $ | (19,775 | ) | — | — | $ | (19,775 | ) | ||||||||
| 1 | See above Schedule of Investments for values in each industry. |
| 2 | As of May 31, 2017, certain of the Fund’s investments were valued using NAV per share as no quoted market value is available and therefore have been excluded from the fair value hierarchy. |
| 3 | Derivative financial instruments are futures contracts, which are valued at the unrealized appreciation (depreciation) on the instrument. |
During the year ended May 31, 2017, there were no transfers between levels.
See Notes to Financial Statements.
| ANNUAL REPORT | MAY 31, 2017 | 15 |
| Statements of Assets and Liabilities |
| May 31, 2017 | BlackRock Advantage Small Cap Core Fund | BlackRock Small Cap Growth Fund II | ||||||
| Assets | ||||||||
Investments at value — unaffiliated (including securities loaned at value of $593,612) (cost — $118,686,295) | $ | 120,317,918 | — | |||||
Investments at value — affiliated (cost — $2,713,838) | 2,713,841 | — | ||||||
Investments at value — Master Portfolio (cost — $137,210,651) | — | $ | 154,978,319 | |||||
Cash | 6,624 | — | ||||||
Cash pledged for futures contracts | 109,000 | — | ||||||
Receivables: | ||||||||
Investments sold — unaffiliated | 1,293,312 | — | ||||||
Securities lending income — affiliated | 3,292 | — | ||||||
Capital shares sold | 237,846 | 62,764 | ||||||
Dividends — affiliated | 1,086 | — | ||||||
Dividends — unaffiliated | 99,915 | — | ||||||
From the Manager/Administrator | 2,654 | 204,703 | ||||||
Withdrawals from the Master Portfolio | — | 222,134 | ||||||
Prepaid expenses | 39,430 | 19,621 | ||||||
|
| |||||||
Total assets | 124,824,918 | 155,487,541 | ||||||
|
| |||||||
| Liabilities | ||||||||
Cash collateral on securities loaned at value | 621,166 | — | ||||||
Payables: | ||||||||
Investments purchased — unaffiliated | 1,637,173 | — | ||||||
Administration fees | 561 | — | ||||||
Capital shares redeemed | 116,049 | 284,898 | ||||||
Officer’s and Trustees’/Directors’ fees | 935 | 101 | ||||||
Other accrued expenses | 73,252 | 29,878 | ||||||
Other affiliates | 95 | 1,283 | ||||||
Professional fees | 50,940 | 49,088 | ||||||
Reorganization | — | 129,551 | ||||||
Service and distribution fees | 1,894 | 42,823 | ||||||
Transfer agent fees | 8,003 | 132,645 | ||||||
Variation margin on futures contracts | 1,077 | — | ||||||
|
| |||||||
Total liabilities | 2,511,145 | 670,267 | ||||||
|
| |||||||
Net Assets | $ | 122,313,773 | $ | 154,817,274 | ||||
|
| |||||||
| Net Assets Consist of | ||||||||
Paid-in capital | $ | 118,334,818 | $ | 131,170,063 | ||||
Undistributed (accumulated) net investment income (loss) | 350,291 | (222,112 | ) | |||||
Undistributed net realized gain | 2,016,813 | — | ||||||
Accumulated net realized gain allocated from the Master Portfolio | — | 6,101,655 | ||||||
Net unrealized appreciation | 1,611,851 | — | ||||||
Net unrealized appreciation allocated from the Master Portfolio | — | 17,767,668 | ||||||
|
| |||||||
Net Assets | $ | 122,313,773 | $ | 154,817,274 | ||||
|
| |||||||
See Notes to Financial Statements.
| 16 | ANNUAL REPORT | MAY 31, 2017 |
| Statements of Assets and Liabilities (concluded) |
| May 31, 2017 | BlackRock Advantage Small Cap Core Fund | BlackRock Small Cap Growth Fund II | ||||||
| Net Asset Value | ||||||||
Institutional | ||||||||
Net assets | $ | 56,603,231 | $ | 51,434,691 | ||||
|
| |||||||
Shares outstanding | 4,457,095 | 1 | 3,657,503 | 2 | ||||
|
| |||||||
Net asset value | $ | 12.70 | $ | 14.06 | ||||
|
| |||||||
Investor A | ||||||||
Net assets | $ | 6,389,383 | $ | 66,165,502 | ||||
|
| |||||||
Shares outstanding | 504,800 | 1 | 5,006,945 | 2 | ||||
|
| |||||||
Net asset value | $ | 12.66 | $ | 13.21 | ||||
|
| |||||||
Investor C | ||||||||
Net assets | $ | 764,230 | $ | 17,208,422 | ||||
|
| |||||||
Shares outstanding | 61,421 | 1 | 1,644,923 | 2 | ||||
|
| |||||||
Net asset value | $ | 12.44 | $ | 10.46 | ||||
|
| |||||||
Class K | ||||||||
Net assets | $ | 58,556,929 | — | |||||
|
| |||||||
Shares outstanding | 4,609,292 | 1 | — | |||||
|
| |||||||
Net asset value | $ | 12.70 | — | |||||
|
| |||||||
Class R | ||||||||
Net assets | — | $ | 20,008,659 | |||||
|
| |||||||
Shares outstanding | — | 1,666,883 | 2 | |||||
|
| |||||||
Net asset value | — | $ | 12.00 | |||||
|
| |||||||
| 1 | Unlimited number of shares authorized, $0.001 par value. |
| 2 | 100 million shares authorized, $0.0001 par value. |
See Notes to Financial Statements.
| ANNUAL REPORT | MAY 31, 2017 | 17 |
| Statements of Operations |
| Year Ended May 31, 2017 | BlackRock Advantage Small Cap Core Fund | BlackRock Small Cap Growth Fund II | ||||||
| Investment Income | ||||||||
Dividends — affiliated | $ | 7,834 | — | |||||
Dividends — unaffiliated | 690,153 | — | ||||||
Securities lending — affiliated — net | 21,836 | — | ||||||
Net investment income allocated from the Master Portfolio: | ||||||||
Dividends — affiliated | — | $ | 5,018 | |||||
Dividends — unaffiliated | — | 1,310,429 | ||||||
Securities lending — affiliated — net | — | 140,769 | ||||||
Expenses | — | (1,312,703 | ) | |||||
Fees waived | — | 340,498 | ||||||
|
| |||||||
Total investment income | 719,823 | 484,011 | ||||||
|
| |||||||
| Expenses | ||||||||
Investment advisory | 241,294 | — | ||||||
Offering | 88,027 | — | ||||||
Custodian | 61,830 | — | ||||||
Printing | 58,358 | 48,708 | ||||||
Professional | 57,564 | 66,878 | ||||||
Registration | 49,467 | 65,324 | ||||||
Administration | 22,789 | 323,835 | ||||||
Transfer agent — class specific | 20,349 | 471,268 | ||||||
Service and distribution — class specific | 16,583 | 549,627 | ||||||
Accounting services | 16,221 | — | ||||||
Administration — class specific | 10,599 | — | ||||||
Officer and Trustees/Directors | 9,183 | — | ||||||
Reorganization | — | 129,551 | ||||||
Miscellaneous | 29,289 | 12,112 | ||||||
|
| |||||||
Total expenses | 681,553 | 1,667,303 | ||||||
Less: | ||||||||
Fees waived and/or reimbursed by the Manager/Administrator | (359,534 | ) | (143,487 | ) | ||||
Administration fees waived | (15,375 | ) | (256,898 | ) | ||||
Administration fees waived — class specific | (7,509 | ) | — | |||||
Transfer agent fees waived and/or reimbursed — class specific | (7,354 | ) | (217,330 | ) | ||||
|
| |||||||
Total expenses after fees waived and/or reimbursed | 291,781 | 1,049,588 | ||||||
|
| |||||||
Net investment income (loss) | 428,042 | (565,577 | ) | |||||
|
| |||||||
| Realized and Unrealized Gain (Loss) | ||||||||
Net realized gain (loss) from: | ||||||||
Investments — unaffiliated | 2,631,424 | — | ||||||
Investments — affiliated | (5 | ) | — | |||||
Capital gain distributions from investment companies — affiliated | 7 | — | ||||||
Futures contracts | 135,200 | — | ||||||
Investments and futures contracts allocated from the Master Portfolio | — | 16,739,370 | ||||||
|
| |||||||
| 2,766,626 | 16,739,370 | |||||||
|
| |||||||
Net change in unrealized appreciation (depreciation) on: | ||||||||
Investments — unaffiliated | 740,137 | — | ||||||
Investments — affiliated | 3 | — | ||||||
Futures contracts | (24,979 | ) | — | |||||
Investments and futures contracts allocated from the Master Portfolio | — | 11,999,057 | ||||||
|
| |||||||
| 715,161 | 11,999,057 | |||||||
|
| |||||||
Net realized and unrealized gain | 3,481,787 | 28,738,427 | ||||||
|
| |||||||
Net Increase in Net Assets Resulting from Operations | $ | 3,909,829 | $ | 28,172,850 | ||||
|
| |||||||
See Notes to Financial Statements.
| 18 | ANNUAL REPORT | MAY 31, 2017 |
| Statements of Changes in Net Assets |
| BlackRock Advantage Small Cap Core Fund | BlackRock Small Cap Growth Fund II | |||||||||||||||||||
| Year Ended May 31, | Year Ended May 31, | |||||||||||||||||||
| Increase (Decrease) in Net Assets: | 2017 | 2016 | 2017 | 2016 | ||||||||||||||||
| Operations | ||||||||||||||||||||
Net investment income (loss) | $ | 428,042 | $ | 67,496 | $ | (565,577 | ) | $ | (1,103,486 | ) | ||||||||||
Net realized gain (loss) | 2,766,626 | (331,653 | ) | 16,739,370 | (876,361 | ) | ||||||||||||||
Net change in unrealized appreciation (depreciation) | 715,161 | 4,372 | 11,999,057 | (23,980,229 | ) | |||||||||||||||
|
|
|
| |||||||||||||||||
Net increase (decrease) in net assets resulting from operations | 3,909,829 | (259,785 | ) | 28,172,850 | (25,960,076 | ) | ||||||||||||||
|
|
|
| |||||||||||||||||
| Distributions to Shareholders1 | ||||||||||||||||||||
From net investment income: | ||||||||||||||||||||
Institutional | (147,126 | ) | (52,090 | ) | — | — | ||||||||||||||
Investor A | (10,872 | ) | (22,127 | ) | — | — | ||||||||||||||
Investor C | — | (435 | ) | — | — | |||||||||||||||
Class K | (1,269 | ) | — | — | — | |||||||||||||||
From net realized gain: | ||||||||||||||||||||
Institutional | (84,904 | ) | (258,484 | ) | (97,593 | ) | (6,065,296 | ) | ||||||||||||
Investor A | (11,210 | ) | (143,693 | ) | (119,393 | ) | (6,456,533 | ) | ||||||||||||
Investor C | (1,521 | ) | (16,671 | ) | (77,820 | ) | (3,904,273 | ) | ||||||||||||
Class K | (665 | ) | — | — | — | |||||||||||||||
Class R | — | — | (44,230 | ) | (2,089,789 | ) | ||||||||||||||
|
|
|
| |||||||||||||||||
Decrease in net assets resulting from distributions to shareholders | (257,567 | ) | (493,500 | ) | (339,036 | ) | (18,515,891 | ) | ||||||||||||
|
|
|
| |||||||||||||||||
| Capital Share Transactions | ||||||||||||||||||||
Net increase (decrease) in net assets derived from capital share transactions | 104,531,332 | 5,712,972 | (41,761,680 | ) | (5,832,236 | ) | ||||||||||||||
|
|
|
| |||||||||||||||||
| Net Assets | ||||||||||||||||||||
Total increase (decrease) in net assets | 108,183,594 | 4,959,687 | (13,927,866 | ) | (50,308,203 | ) | ||||||||||||||
Beginning of year | 14,130,179 | 9,170,492 | 168,745,140 | 219,053,343 | ||||||||||||||||
|
|
|
| |||||||||||||||||
End of year | $ | 122,313,773 | $ | 14,130,179 | $ | 154,817,274 | $ | 168,745,140 | ||||||||||||
|
|
|
| |||||||||||||||||
Undistributed (accumulated) net investment income (loss), end of year | $ | 350,291 | $ | 14,744 | $ | (222,112 | ) | $ | (487,498 | ) | ||||||||||
|
|
|
| |||||||||||||||||
| 1 | Distributions for annual periods determined in accordance with U.S. federal income tax regulations. |
See Notes to Financial Statements.
| ANNUAL REPORT | MAY 31, 2017 | 19 |
| Financial Highlights | BlackRock Advantage Small Cap Core Fund |
| Institutional | ||||||||||||||||||||
| Year Ended May 31, | Period March 14, 20131 to May 31, 2013 | |||||||||||||||||||
| 2017 | 2016 | 2015 | 2014 | |||||||||||||||||
| Per Share Operating Performance | ||||||||||||||||||||
Net asset value, beginning of period | $ | 10.59 | $ | 11.74 | $ | 11.80 | $ | 10.37 | $ | 10.00 | ||||||||||
|
| |||||||||||||||||||
Net investment income2 | 0.10 | 0.08 | 0.08 | 0.07 | 0.02 | |||||||||||||||
Net realized and unrealized gain (loss) | 2.10 | (0.64 | ) | 1.02 | 2.06 | 0.35 | ||||||||||||||
|
| |||||||||||||||||||
Net increase (decrease) from investment operations | 2.20 | (0.56 | ) | 1.10 | 2.13 | 0.37 | ||||||||||||||
|
| |||||||||||||||||||
Distributions:3 | ||||||||||||||||||||
From net investment income | (0.06 | ) | (0.10 | ) | (0.04 | ) | (0.15 | ) | — | |||||||||||
From net realized gain | (0.03 | ) | (0.49 | ) | (1.12 | ) | (0.55 | ) | — | |||||||||||
|
| |||||||||||||||||||
Total distributions | (0.09 | ) | (0.59 | ) | (1.16 | ) | (0.70 | ) | — | |||||||||||
|
| |||||||||||||||||||
Net asset value, end of period | $ | 12.70 | $ | 10.59 | $ | 11.74 | $ | 11.80 | $ | 10.37 | ||||||||||
|
| |||||||||||||||||||
| Total Return4 | ||||||||||||||||||||
Based on net asset value | 20.84 | % | (4.80 | )% | 10.24 | % | 20.85 | % | 3.70 | %5 | ||||||||||
|
| |||||||||||||||||||
| Ratios to Average Net Assets | ||||||||||||||||||||
Total expenses | 1.05 | % | 3.15 | % | 3.43 | % | 6.26 | % | 7.68 | %6,7 | ||||||||||
|
| |||||||||||||||||||
Total expenses after fees waived and/or reimbursed | 0.54 | % | 0.69 | % | 0.70 | % | 0.71 | %8 | 0.70 | %6 | ||||||||||
|
| |||||||||||||||||||
Net investment income | 0.78 | % | 0.80 | % | 0.66 | % | 0.61 | % | 0.93 | %6 | ||||||||||
|
| |||||||||||||||||||
| Supplemental Data | ||||||||||||||||||||
Net assets, end of period (000) | $ | 56,603 | $ | 10,302 | $ | 6,122 | $ | 6,095 | $ | 5,181 | ||||||||||
|
| |||||||||||||||||||
Portfolio turnover rate | 127 | % | 171 | % | 148 | % | 145 | % | 67 | % | ||||||||||
|
| |||||||||||||||||||
| 1 | Commencement of operations. |
| 2 | Based on average shares outstanding. |
| 3 | Distributions for annual periods determined in accordance with U.S. federal income tax regulations. |
| 4 | Where applicable, assumes the reinvestment of distributions. |
| 5 | Aggregate total return. |
| 6 | Annualized. |
| 7 | Organization costs were not annualized in the calculation of the expense ratios. If these expenses were annualized, the total expenses would have been 8.75%. |
| 8 | Includes certain tax expenses. Excluding such tax expenses, total expenses after fees waived and/or reimbursed would have been 0.70%. |
See Notes to Financial Statements.
| 20 | ANNUAL REPORT | MAY 31, 2017 |
| Financial Highlights (continued) | BlackRock Advantage Small Cap Core Fund |
| Investor A | ||||||||||||||||||||
| Year Ended May 31, | Period March 14, 20131 to May 31, 2013 | |||||||||||||||||||
| 2017 | 2016 | 2015 | 2014 | |||||||||||||||||
| Per Share Operating Performance | ||||||||||||||||||||
Net asset value, beginning of period | $ | 10.56 | $ | 11.71 | $ | 11.78 | $ | 10.37 | $ | 10.00 | ||||||||||
|
| |||||||||||||||||||
Net investment income (loss)2 | 0.06 | 0.06 | 0.05 | (0.01 | ) | 0.01 | ||||||||||||||
Net realized and unrealized gain (loss) | 2.10 | (0.65 | ) | 1.01 | 2.10 | 0.36 | ||||||||||||||
|
| |||||||||||||||||||
Net increase (decrease) from investment operations | 2.16 | (0.59 | ) | 1.06 | 2.09 | 0.37 | ||||||||||||||
|
| |||||||||||||||||||
Distributions:3 | ||||||||||||||||||||
From net investment income | (0.03 | ) | (0.07 | ) | (0.02 | ) | (0.13 | ) | — | |||||||||||
From net realized gain | (0.03 | ) | (0.49 | ) | (1.11 | ) | (0.55 | ) | — | |||||||||||
|
| |||||||||||||||||||
Total distributions | (0.06 | ) | (0.56 | ) | (1.13 | ) | (0.68 | ) | — | |||||||||||
|
| |||||||||||||||||||
Net asset value, end of period | $ | 12.66 | $ | 10.56 | $ | 11.71 | $ | 11.78 | $ | 10.37 | ||||||||||
|
| |||||||||||||||||||
| Total Return4 | ||||||||||||||||||||
Based on net asset value | 20.51 | % | (5.02 | )% | 9.96 | % | 20.49 | % | 3.70 | %5 | ||||||||||
|
| |||||||||||||||||||
| Ratios to Average Net Assets | ||||||||||||||||||||
Total expenses | 1.39 | % | 3.60 | % | 3.70 | % | 8.25 | % | 8.16 | %6,7 | ||||||||||
|
| |||||||||||||||||||
Total expenses after fees waived and/or reimbursed | 0.83 | % | 0.95 | % | 0.95 | % | 0.95 | % | 0.95 | %7 | ||||||||||
|
| |||||||||||||||||||
Net investment income (loss) | 0.51 | % | 0.58 | % | 0.43 | % | (0.11 | )% | 0.67 | %7 | ||||||||||
|
| |||||||||||||||||||
| Supplemental Data | ||||||||||||||||||||
Net assets, end of period (000) | $ | 6,389 | $ | 3,191 | $ | 2,736 | $ | 899 | $ | 21 | ||||||||||
|
| |||||||||||||||||||
Portfolio turnover rate | 127 | % | 171 | % | 148 | % | 145 | % | 67 | % | ||||||||||
|
| |||||||||||||||||||
| 1 | Commencement of operations. |
| 2 | Based on average shares outstanding. |
| 3 | Distributions for annual periods determined in accordance with U.S. federal income tax regulations. |
| 4 | Where applicable, excludes the effects of any sales charges and assumes the reinvestment of distributions. |
| 5 | Aggregate total return. |
| 6 | Organization costs were not annualized in the calculation of the expense ratios. If these expenses were annualized, the total expenses would have been 9.23%. |
| 7 | Annualized. |
See Notes to Financial Statements.
| ANNUAL REPORT | MAY 31, 2017 | 21 |
| Financial Highlights (continued) | BlackRock Advantage Small Cap Core Fund |
| Investor C | ||||||||||||||||||||
| Year Ended May 31, | Period March 14, 20131 to May 31, 2013 | |||||||||||||||||||
| 2017 | 2016 | 2015 | 2014 | |||||||||||||||||
| Per Share Operating Performance | ||||||||||||||||||||
Net asset value, beginning of period | $ | 10.44 | $ | 11.60 | $ | 11.71 | $ | 10.35 | $ | 10.00 | ||||||||||
|
| |||||||||||||||||||
Net investment loss2 | (0.03 | ) | (0.02 | ) | (0.04 | ) | (0.06 | ) | (0.00 | )3 | ||||||||||
Net realized and unrealized gain (loss) | 2.06 | (0.64 | ) | 1.02 | 2.05 | 0.35 | ||||||||||||||
|
| |||||||||||||||||||
Net increase (decrease) from investment operations | 2.03 | (0.66 | ) | 0.98 | 1.99 | 0.35 | ||||||||||||||
|
| |||||||||||||||||||
Distributions:4 | ||||||||||||||||||||
From net investment income | — | (0.01 | ) | — | (0.08 | ) | — | |||||||||||||
From net realized gain | (0.03 | ) | (0.49 | ) | (1.09 | ) | (0.55 | ) | — | |||||||||||
|
| |||||||||||||||||||
Total distributions | (0.03 | ) | (0.50 | ) | (1.09 | ) | (0.63 | ) | — | |||||||||||
|
| |||||||||||||||||||
Net asset value, end of period | $ | 12.44 | $ | 10.44 | $ | 11.60 | $ | 11.71 | $ | 10.35 | ||||||||||
|
| |||||||||||||||||||
| Total Return5 | ||||||||||||||||||||
Based on net asset value | 19.47 | % | (5.71 | )% | 9.22 | % | 19.53 | % | 3.50 | %6 | ||||||||||
|
| |||||||||||||||||||
| Ratios to Average Net Assets | ||||||||||||||||||||
Total expenses | 2.22 | % | 4.41 | % | 4.56 | % | 7.86 | % | 8.91 | %7,8 | ||||||||||
|
| |||||||||||||||||||
Total expenses after fees waived and/or reimbursed | 1.57 | % | 1.70 | % | 1.70 | % | 1.71 | %9 | 1.70 | %7 | ||||||||||
|
| |||||||||||||||||||
Net investment loss | (0.25 | )% | (0.19 | )% | (0.36 | )% | (0.53 | )% | (0.08 | )%7 | ||||||||||
|
| |||||||||||||||||||
| Supplemental Data | ||||||||||||||||||||
Net assets, end of period (000) | $ | 764 | $ | 423 | $ | 313 | $ | 101 | $ | 21 | ||||||||||
|
| |||||||||||||||||||
Portfolio turnover rate | 127 | % | 171 | % | 148 | % | 145 | % | 67 | % | ||||||||||
|
| |||||||||||||||||||
| 1 | Commencement of operations. |
| 2 | Based on average shares outstanding. |
| 3 | Amount is greater than $(0.005) per share. |
| 4 | Distributions for annual periods determined in accordance with U.S. federal income tax regulations. |
| 5 | Where applicable, excludes the effects of any sales charges and assumes the reinvestment of distributions. |
| 6 | Aggregate total return. |
| 7 | Annualized. |
| 8 | Organization costs were not annualized in the calculation of the expense ratios. If these expenses were annualized, the total expenses would have been 9.98%. |
| 9 | Includes certain tax expenses. Excluding such tax expenses, total expenses after fees waived and/or reimbursed would have been 1.70%. |
See Notes to Financial Statements.
| 22 | ANNUAL REPORT | MAY 31, 2017 |
| Financial Highlights (concluded) | BlackRock Advantage Small Cap Core Fund |
| Class K | ||||||||||||
Year Ended May 31, 2017 | Period March 28, 20161 to May 31, 2016 | |||||||||||
| Per Share Operating Performance | ||||||||||||
Net asset value, beginning of period | $ | 10.60 | $ | 9.88 | ||||||||
|
| |||||||||||
Net investment income2 | 0.12 | 0.02 | ||||||||||
Net realized and unrealized gain | 2.07 | 0.70 | ||||||||||
|
| |||||||||||
Net increase from investment operations | 2.19 | 0.72 | ||||||||||
|
| |||||||||||
Distributions from:3 | ||||||||||||
Net investment income | (0.06 | ) | — | |||||||||
Net realized gain | (0.03 | ) | — | |||||||||
|
| |||||||||||
Total distributions | (0.09 | ) | — | |||||||||
|
| |||||||||||
Net asset value, end of period | $ | 12.70 | $ | 10.60 | ||||||||
|
| |||||||||||
| Total Return4 | ||||||||||||
Based on net asset value | 20.74 | % | 7.29 | %5 | ||||||||
|
| |||||||||||
| Ratios to Average Net Assets | ||||||||||||
Total expenses | 1.62 | % | 3.59 | %6 | ||||||||
|
| |||||||||||
Total expenses after fees waived and/or reimbursed | 0.45 | % | 0.60 | %6 | ||||||||
|
| |||||||||||
Net investment income | 0.95 | % | 0.83 | %6 | ||||||||
|
| |||||||||||
| Supplemental Data | ||||||||||||
Net assets, end of period (000) | $ | 58,557 | $ | 214 | ||||||||
|
| |||||||||||
Portfolio turnover rate | 127 | % | 171 | %7 | ||||||||
|
| |||||||||||
| 1 | Commencement of operations. |
| 2 | Based on average shares outstanding. |
| 3 | Distributions for annual periods determined in accordance with U.S. federal income tax regulations. |
| 4 | Where applicable, assumes the reinvestment of distributions. |
| 5 | Aggregate total return. |
| 6 | Annualized. |
| 7 | Portfolio turnover is representative of the Fund for the entire year. |
See Notes to Financial Statements.
| ANNUAL REPORT | MAY 31, 2017 | 23 |
| Financial Highlights | BlackRock Small Cap Growth Fund II |
| Institutional | ||||||||||||||||||||
| Year Ended May 31, | ||||||||||||||||||||
| 2017 | 2016 | 2015 | 2014 | 2013 | ||||||||||||||||
| Per Share Operating Performance | ||||||||||||||||||||
Net asset value, beginning of year | $ | 11.82 | $ | 14.62 | $ | 14.63 | $ | 15.20 | $ | 13.22 | ||||||||||
|
| |||||||||||||||||||
Net investment loss1 | (0.00 | )2 | (0.03 | ) | (0.04 | ) | (0.06 | ) | (0.01 | ) | ||||||||||
Net realized and unrealized gain (loss) | 2.27 | (1.56 | ) | 1.79 | 3.00 | 3.72 | ||||||||||||||
|
| |||||||||||||||||||
Net increase (decrease) from investment operations | 2.27 | (1.59 | ) | 1.75 | 2.94 | 3.71 | ||||||||||||||
|
| |||||||||||||||||||
Distributions from net realized gain3 | (0.03 | ) | (1.21 | ) | (1.76 | ) | (3.51 | ) | (1.73 | ) | ||||||||||
|
| |||||||||||||||||||
Net asset value, end of year | $ | 14.06 | $ | 11.82 | $ | 14.62 | $ | 14.63 | $ | 15.20 | ||||||||||
|
| |||||||||||||||||||
| Total Return4 | ||||||||||||||||||||
Based on net asset value | 19.17 | % | (11.66 | )% | 13.44 | % | 21.70 | % | 30.95 | % | ||||||||||
|
| |||||||||||||||||||
| Ratios to Average Net Assets5 | ||||||||||||||||||||
Total expenses6,7 | 1.28 | % | 1.23 | % | 1.14 | % | 1.14 | % | 1.26 | % | ||||||||||
|
| |||||||||||||||||||
Total expenses after fees waived6,7 | 0.91 | % | 1.23 | % | 1.14 | % | 1.14 | % | 1.26 | % | ||||||||||
|
| |||||||||||||||||||
Net investment loss6 | (0.01 | )% | (0.23 | )% | (0.28 | )% | (0.41 | )% | (0.04 | )% | ||||||||||
|
| |||||||||||||||||||
| Supplemental Data | ||||||||||||||||||||
Net assets, end of year (000) | $ | 51,435 | $ | 58,948 | $ | 73,608 | $ | 74,962 | $ | 65,186 | ||||||||||
|
| |||||||||||||||||||
Portfolio turnover rate of the Master Portfolio | 105 | % | 115 | % | 140 | % | 152 | % | 165 | % | ||||||||||
|
| |||||||||||||||||||
| 1 | Based on average shares outstanding. |
| 2 | Amount is greater than $(0.005) per share. |
| 3 | Distributions for annual periods determined in accordance with U.S. federal income tax regulations. |
| 4 | Where applicable, assumes the reinvestment of distributions. |
| 5 | Includes the Fund’s share of the Master Portfolio’s allocated expenses and/or net investment loss. |
| 6 | Includes the Fund’s share of the Master Portfolio’s allocated fees waived of: |
| Year Ended May 31, | ||||||||||||||||||||||||||||||||||||||||
2017 | 2016 | 2015 | 2014 | 2013 | ||||||||||||||||||||||||||||||||||||
Master Portfolio fees waived | 0.21 | % | 0.16 | % | 0.16 | % | 0.16 | % | 0.01 | % | ||||||||||||||||||||||||||||||
| 7 | Includes reorganization costs associated with the Fund’s reorganization. Without these costs, total expenses and total expenses after fees waived would have been 1.20% and 0.83%, respectively. |
See Notes to Financial Statements.
| 24 | ANNUAL REPORT | MAY 31, 2017 |
| Financial Highlights (continued) | | BlackRock Small Cap Growth Fund II | |
| Investor A | ||||||||||||||||||||
| Year Ended May 31, | ||||||||||||||||||||
| 2017 | 2016 | 2015 | 2014 | 2013 | ||||||||||||||||
| Per Share Operating Performance | ||||||||||||||||||||
Net asset value, beginning of year | $ | 11.13 | $ | 13.83 | $ | 13.93 | $ | 14.63 | $ | 12.81 | ||||||||||
|
| |||||||||||||||||||
Net investment loss1 | (0.03 | ) | (0.06 | ) | (0.07 | ) | (0.13 | ) | (0.05 | ) | ||||||||||
Net realized and unrealized gain (loss) | 2.14 | (1.48 | ) | 1.70 | 2.88 | 3.57 | ||||||||||||||
|
| |||||||||||||||||||
Net increase (decrease) from investment operations | 2.11 | (1.54 | ) | 1.63 | 2.75 | 3.52 | ||||||||||||||
|
| |||||||||||||||||||
Distributions from net realized gain2 | (0.03 | ) | (1.16 | ) | (1.73 | ) | (3.45 | ) | (1.70 | ) | ||||||||||
|
| |||||||||||||||||||
Net asset value, end of year | $ | 13.21 | $ | 11.13 | $ | 13.83 | $ | 13.93 | $ | 14.63 | ||||||||||
|
| |||||||||||||||||||
| Total Return3 | ||||||||||||||||||||
Based on net asset value | 18.92 | % | (11.91 | )% | 13.24 | % | 21.08 | % | 30.45 | % | ||||||||||
|
| |||||||||||||||||||
| Ratios to Average Net Assets4 | ||||||||||||||||||||
Total expenses5,6 | 1.51 | % | 1.46 | % | 1.36 | % | 1.62 | % | 1.62 | % | ||||||||||
|
| |||||||||||||||||||
Total expenses after fees waived5,6 | 1.14 | % | 1.46 | % | 1.36 | % | 1.62 | % | 1.62 | % | ||||||||||
|
| |||||||||||||||||||
Net investment loss5 | (0.24 | )% | (0.47 | )% | (0.49 | )% | (0.88 | )% | (0.34 | )% | ||||||||||
|
| |||||||||||||||||||
| Supplemental Data | ||||||||||||||||||||
Net assets, end of year (000) | $ | 66,166 | $ | 58,236 | $ | 76,423 | $ | 80,144 | $ | 73,799 | ||||||||||
|
| |||||||||||||||||||
Portfolio turnover rate of the Master Portfolio | 105 | % | 115 | % | 140 | % | 152 | % | 165 | % | ||||||||||
|
| |||||||||||||||||||
| 1 | Based on average shares outstanding. |
| 2 | Distributions for annual periods determined in accordance with U.S. federal income tax regulations. |
| 3 | Where applicable, excludes the effects of any sales charges and assumes the reinvestment of distributions. |
| 4 | Includes the Fund’s share of the Master Portfolio’s allocated expenses and/or net investment loss. |
| 5 | Includes the Fund’s share of the Master Portfolio’s allocated fees waived of: |
| Year Ended May 31, | ||||||||||||||||||||||||||||||||||||||||
2017 | 2016 | 2015 | 2014 | 2013 | ||||||||||||||||||||||||||||||||||||
Master Portfolio fees waived | 0.21 | % | 0.16 | % | 0.16 | % | 0.16 | % | 0.02 | % | ||||||||||||||||||||||||||||||
| 6 | Includes reorganization costs associated with the Fund’s reorganization. Without these costs, total expenses and total expenses after fees waived would have been 1.43% and 1.06%, respectively. |
See Notes to Financial Statements.
| ANNUAL REPORT | MAY 31, 2017 | 25 |
| Financial Highlights (continued) | BlackRock Small Cap Growth Fund II |
| Investor C | ||||||||||||||||||||
| Year Ended May 31, | ||||||||||||||||||||
| 2017 | 2016 | 2015 | 2014 | 2013 | ||||||||||||||||
| Per Share Operating Performance | ||||||||||||||||||||
Net asset value, beginning of year | $ | 8.89 | $ | 11.23 | $ | 11.71 | $ | 12.79 | $ | 11.44 | ||||||||||
|
| |||||||||||||||||||
Net investment loss1 | (0.10 | ) | (0.13 | ) | (0.15 | ) | (0.19 | ) | (0.15 | ) | ||||||||||
Net realized and unrealized gain (loss) | 1.70 | (1.19 | ) | 1.38 | 2.47 | 3.15 | ||||||||||||||
|
| |||||||||||||||||||
Net increase (decrease) from investment operations | 1.60 | (1.32 | ) | 1.23 | 2.28 | 3.00 | ||||||||||||||
|
| |||||||||||||||||||
Distributions from net realized gain2 | (0.03 | ) | (1.02 | ) | (1.71 | ) | (3.36 | ) | (1.65 | ) | ||||||||||
|
| |||||||||||||||||||
Net asset value, end of year | $ | 10.46 | $ | 8.89 | $ | 11.23 | $ | 11.71 | $ | 12.79 | ||||||||||
|
| |||||||||||||||||||
| Total Return3 | ||||||||||||||||||||
Based on net asset value | 17.95 | % | (12.66 | )% | 12.24 | % | 20.24 | % | 29.31 | % | ||||||||||
|
| |||||||||||||||||||
| Ratios to Average Net Assets4 | ||||||||||||||||||||
Total expenses5,6 | 2.41 | % | 2.34 | % | 2.29 | % | 2.30 | % | 2.52 | % | ||||||||||
|
| |||||||||||||||||||
Total expenses after fees waived5,6 | 1.96 | % | 2.34 | % | 2.29 | % | 2.30 | % | 2.52 | % | ||||||||||
|
| |||||||||||||||||||
Net investment loss5 | (1.06 | )% | (1.35 | )% | (1.42 | )% | (1.55 | )% | (1.29 | )% | ||||||||||
|
| |||||||||||||||||||
| Supplemental Data | ||||||||||||||||||||
Net assets, end of year (000) | $ | 17,208 | $ | 32,252 | $ | 44,179 | $ | 45,686 | $ | 43,649 | ||||||||||
|
| |||||||||||||||||||
Portfolio turnover rate of the Master Portfolio | 105 | % | 115 | % | 140 | % | 152 | % | 165 | % | ||||||||||
|
| |||||||||||||||||||
| 1 | Based on average shares outstanding. |
| 2 | Distributions for annual periods determined in accordance with U.S. federal income tax regulations. |
| 3 | Where applicable, excludes the effects of any sales charges and assumes the reinvestment of distributions. |
| 4 | Includes the Fund’s share of the Master Portfolio’s allocated expenses and/or net investment loss. |
| 5 | Includes the Fund’s share of the Master Portfolio’s allocated fees waived of: |
| Year Ended May 31, | ||||||||||||||||||||||||||||||||||||||||
2017 | 2016 | 2015 | 2014 | 2013 | ||||||||||||||||||||||||||||||||||||
Master Portfolio fees waived | 0.21 | % | 0.16 | % | 0.16 | % | 0.16 | % | 0.02 | % | ||||||||||||||||||||||||||||||
| 6 | Includes reorganization costs associated with the Fund’s reorganization. Without these costs, total expenses and total expenses after fees waived would have been 2.33% and 1.88%, respectively. |
See Notes to Financial Statements.
| 26 | ANNUAL REPORT | MAY 31, 2017 |
| Financial Highlights (concluded) | BlackRock Small Cap Growth Fund II |
| Class R | ||||||||||||||||||||
| Year Ended May 31, | ||||||||||||||||||||
| 2017 | 2016 | 2015 | 2014 | 2013 | ||||||||||||||||
| Per Share Operating Performance | ||||||||||||||||||||
Net asset value, beginning of year | $ | 10.14 | $ | 12.67 | $ | 12.95 | $ | 13.80 | $ | 12.19 | ||||||||||
|
| |||||||||||||||||||
Net investment loss1 | (0.06 | ) | (0.08 | ) | (0.10 | ) | (0.12 | ) | (0.08 | ) | ||||||||||
Net realized and unrealized gain (loss) | 1.95 | (1.35 | ) | 1.55 | 2.70 | 3.38 | ||||||||||||||
|
| |||||||||||||||||||
Net increase (decrease) from investment operations | 1.89 | (1.43 | ) | 1.45 | 2.58 | 3.30 | ||||||||||||||
|
| |||||||||||||||||||
Distributions from net realized gain2 | (0.03 | ) | (1.10 | ) | (1.73 | ) | (3.43 | ) | (1.69 | ) | ||||||||||
|
| |||||||||||||||||||
Net asset value, end of year | $ | 12.00 | $ | 10.14 | $ | 12.67 | $ | 12.95 | $ | 13.80 | ||||||||||
|
| |||||||||||||||||||
| Total Return3 | ||||||||||||||||||||
Based on net asset value | 18.60 | % | (12.13 | )% | 12.84 | % | 21.07 | % | 30.05 | % | ||||||||||
|
| |||||||||||||||||||
| Ratios to Average Net Assets4 | ||||||||||||||||||||
Total expenses5,6 | 1.74 | % | 1.72 | % | 1.73 | % | 1.67 | % | 1.89 | % | ||||||||||
|
| |||||||||||||||||||
Total expenses after fees waived5,6 | 1.39 | % | 1.72 | % | 1.73 | % | 1.67 | % | 1.89 | % | ||||||||||
|
| |||||||||||||||||||
Net investment loss5 | (0.49 | )% | (0.72 | )% | (0.86 | )% | (0.92 | )% | (0.60 | )% | ||||||||||
|
| |||||||||||||||||||
| Supplemental Data | ||||||||||||||||||||
Net assets, end of year (000) | $ | 20,009 | $ | 19,308 | $ | 24,581 | $ | 29,585 | $ | 30,932 | ||||||||||
|
| |||||||||||||||||||
Portfolio turnover rate of the Master Portfolio | 105 | % | 115 | % | 140 | % | 152 | % | 165 | % | ||||||||||
|
| |||||||||||||||||||
| 1 | Based on average shares outstanding. |
| 2 | Distributions for annual periods determined in accordance with U.S. federal income tax regulations. |
| 3 | Where applicable, assumes the reinvestment of distributions. |
| 4 | Includes the Fund’s share of the Master Portfolio’s allocated expenses and/or net investment loss. |
| 5 | Includes the Fund’s share of the Master Portfolio’s allocated fees waived of: |
| Year Ended May 31, | ||||||||||||||||||||||||||||||||||||||||
2017 | 2016 | 2015 | 2014 | 2013 | ||||||||||||||||||||||||||||||||||||
Master Portfolio fees waived | 0.21 | % | 0.16 | % | 0.16 | % | 0.16 | % | 0.01 | % | ||||||||||||||||||||||||||||||
| 6 | Includes reorganization costs associated with the Fund’s reorganization. Without these costs, total expenses and total expenses after fees waived would have been 1.66% and 1.31%, respectively. |
See Notes to Financial Statements.
| ANNUAL REPORT | MAY 31, 2017 | 27 |
| Notes to Financial Statements |
1. Organization:
BlackRock FundsSM (the “Trust”) and BlackRock Series, Inc. (the “Corporation”) are each registered under the Investment Company Act of 1940, as amended (the “1940 Act”), as an open end management investment company. The Trust is organized as a Massachusetts business trust. The Corporation is organized as a Maryland corporation. BlackRock Advantage Small Cap Core Fund (“Advantage Small Cap Core Fund”), a series of the Trust, and BlackRock Small Cap Growth Fund II (“Small Cap Growth Fund II”), a series of the Corporation (collectively, the “Funds” or individually, a “Fund”), are each classified as diversified. Small Cap Growth Fund II seeks to achieve its investment objective by investing all of its assets in BlackRock Master Small Cap Growth Portfolio (the “Master Portfolio”), a series of BlackRock Master LLC (the “Master LLC”), an affiliate of Small Cap Growth Fund II, which has the same investment objective and strategies as Small Cap Growth Fund II. The value of Small Cap Growth Fund II’s investment in the Master Portfolio reflects Small Cap Growth Fund II’s proportionate interest in the net assets of the Master Portfolio. The performance of Small Cap Growth Fund II is directly affected by the performance of the Master Portfolio. At May 31, 2017, the percentage of the Master Portfolio owned by Small Cap Growth Fund II was 100%. The financial statements of the Master Portfolio, including the Schedule of Investments, are included elsewhere in this report and should be read in conjunction with Small Cap Growth Fund II’s financial statements.
Each Fund offers multiple classes of shares. All classes of shares have identical voting, dividend, liquidation and other rights and are subject to the same terms and conditions, except that certain classes bear expenses related to the shareholder servicing and distribution of such shares. Institutional and Class K Shares are sold only to certain eligible investors. Class R Shares are available only to certain employer-sponsored retirement plans. Investor A and Investor C Shares are generally available through financial intermediaries. Each class has exclusive voting rights with respect to matters relating to its shareholder servicing and distribution expenditures.
| Share Class | Initial Sales Charge | CDSC | Conversion Privilege | |||
Institutional, Class K and Class R Shares | No | No | None | |||
Investor A Shares | Yes | No1 | None | |||
Investor C Shares | No | Yes | None |
| 1 | Investor A Shares may be subject to a contingent deferred sales charge (“CDSC”) for certain redemptions where no initial sales charge was paid at the time of purchase. |
The Funds, together with certain other registered investment companies advised by BlackRock Advisors, LLC or its affiliates, are included in a complex of open-end funds referred to as the Equity-Liquidity Complex.
2. Significant Accounting Policies:
The financial statements are prepared in conformity with accounting principles generally accepted in the United States of America (“U.S. GAAP”), which may require management to make estimates and assumptions that affect the reported amounts of assets and liabilities in the financial statements, disclosure of contingent assets and liabilities at the date of the financial statements and the reported amounts of increases and decreases in net assets from operations during the reporting period. Actual results could differ from those estimates. Each Fund is considered an investment company under U.S. GAAP and follows the accounting and reporting guidance applicable to investment companies. Below is a summary of significant accounting policies:
Investment Transactions and Income Recognition: For Advantage Small Cap Core Fund, for financial reporting purposes, investment transactions are recorded on the dates the transactions are entered into (the “trade dates”). Realized gains and losses on investment transactions are determined on the identified cost basis. Dividend income is recorded on the ex-dividend date. Upon notification from issuers, some of the dividend income received from a real estate investment trust may be redesignated as a reduction of cost of the related investment and/or realized gain. For Small Cap Growth Fund II, for financial reporting purposes, contributions to and withdrawals from the Master Portfolio are accounted for on a trade date basis. Small Cap Growth Fund II records its proportionate share of the Master Portfolio’s income, expenses and realized and unrealized gains and losses on a daily basis. In addition, Small Cap Growth Fund II accrues its own expenses. Income, expenses and realized and unrealized gains and losses are allocated daily to each class based on its relative net assets.
Segregation and Collateralization: In cases where Advantage Small Cap Core Fund enters into certain investments (e.g., futures contracts) that would be treated as “senior securities” for 1940 Act purposes, Advantage Small Cap Core Fund may segregate or designate on its books and records cash or liquid assets having a market value at least equal to the amount of its future obligations under such investments. Doing so allows the investment to be excluded from treatment as a “senior security.” Furthermore, if required by an exchange or counterparty agreement, Advantage Small Cap Core Fund may be required to deliver/deposit cash and/or securities to/with an exchange, or broker-dealer or custodian as collateral for certain investments or obligations.
Distributions: Distributions paid by the Funds are recorded on the ex-dividend date. The character and timing of distributions are determined in accordance with U.S. federal income tax regulations, which may differ from U.S. GAAP.
Offering Costs: Offering costs are amortized over a 12-month period beginning with the commencement of operations.
| 28 | ANNUAL REPORT | MAY 31, 2017 |
| Notes to Financial Statements (continued) |
Recent Accounting Standards: In April 2015, the Financial Accounting Standards Board issued “Disclosures for Investments in Certain Entities that Calculate net asset value (”NAV“) per Share” which eliminates the requirement to categorize investments within the fair value hierarchy when fair value is based on the NAV per share and no quoted market value is available. As of May 31, 2017, certain investments of Advantage Small Cap Core Fund were valued using NAV per share as no quoted market value was available and therefore have been excluded from the fair value hierarchy.
SEC Reporting Modernization: The U.S. Securities and Exchange Commission (“SEC”) adopted new rules and forms and amended other rules to enhance the reporting and disclosure of information by registered investment companies. As part of these changes, the SEC amended Regulation S-X to standardize and enhance disclosures in investment company financial statements. The compliance date for implementing the new or amended rules is August 1, 2017.
Indemnifications: In the normal course of business, a Fund enters into contracts that contain a variety of representations that provide general indemnification. A Fund’s maximum exposure under these arrangements is unknown because it involves future potential claims against a Fund, which cannot be predicted with any certainty.
Other: Expenses directly related to a Fund or its classes are charged to that Fund or the applicable class. Other operating expenses shared by several funds, including other funds managed by BlackRock Advisors, LLC, are prorated among those funds on the basis of relative net assets or other appropriate methods. Expenses directly related to the Funds and other shared expenses prorated to the Funds are allocated daily to each class based on its relative net assets or other appropriate methods.
Advantage Small Cap Core Fund has an arrangement with its custodian whereby credits are earned on uninvested cash balances, which could be used to reduce custody fees and/or overdraft charges. Advantage Small Cap Core Fund may incur charges on certain uninvested cash balances and overdrafts, subject to certain conditions.
3. Investment Valuation and Fair Value Measurements:
Investment Valuation Policies: Advantage Small Cap Core Fund’s investments are valued at fair value (also referred to as “market value” within the financial statements) as of the close of trading on the New York Stock Exchange (“NYSE”) (generally 4:00 p.m., Eastern time). U.S. GAAP defines fair value as the price Advantage Small Cap Core Fund would receive to sell an asset or pay to transfer a liability in an orderly transaction between market participants at the measurement date. Advantage Small Cap Core Fund determines the fair values of its financial instruments using various independent dealers or pricing services under policies approved by the Board of Trustees of the Trust (the “Board”). The BlackRock Global Valuation Methodologies Committee (the “Global Valuation Committee”) is the committee formed by management to develop global pricing policies and procedures and to oversee the pricing function for all financial instruments.
Small Cap Growth Fund II’s policy is to value its financial instruments at fair value. Small Cap Growth Fund II records its investment in the Master Portfolio at fair value based on Small Cap Growth Fund II’s proportionate interest in the net assets of the Master Portfolio. Valuation of securities held by the Master Portfolio is discussed in Note 3 of the Master Portfolio’s Notes to Financial Statements, which are included elsewhere in this report.
Fair Value Inputs and Methodologies: The following methods and inputs are used to establish the fair value of Advantage Small Cap Core Fund’s assets and liabilities:
| • | Equity investments traded on a recognized securities exchange are valued at the official closing price each day, if available. For equity investments traded on more than one exchange, the official closing price on the exchange where the stock is primarily traded is used. Equity investments traded on a recognized exchange for which there were no sales on that day may be valued at the last available bid (long positions) or ask (short positions) price. |
| • | Investments in open-end U.S. mutual funds are valued at NAV each business day. |
| • | Advantage Small Cap Core Fund values its investment in SL Liquidity Series, LLC, Money Market Series (the “Money Market Series”) at fair value, which is ordinarily based upon its pro rata ownership in the underlying fund’s net assets. The Money Market Series seeks current income consistent with maintaining liquidity and preserving capital. Although the Money Market Series is not registered under the 1940 Act, its investments may follow the parameters of investments by a money market fund that is subject to Rule 2a-7 under the 1940 Act. |
| • | Futures contracts traded on exchanges are valued at their last sale price. |
If events (e.g., a company announcement, market volatility or a natural disaster) occur that are expected to materially affect the value of such investments, or in the event that the application of these methods of valuation results in a price for an investment that is deemed not to be representative of the market value of such investment, or if a price is not available, the investment will be valued by the Global Valuation Committee, or its delegate, in accordance with a policy approved by the Board as reflecting fair value (“Fair Valued Investments”). The fair valuation approaches that may be used by the Global Valuation Committee include Market approach, Income approach and Cost approach. Valuation techniques such as discounted cash flow, use of market comparables and matrix pricing are types of valuation approaches and typically used in determining fair value. When determining the
| ANNUAL REPORT | MAY 31, 2017 | 29 |
| Notes to Financial Statements (continued) |
price for Fair Valued Investments, the Global Valuation Committee, or its delegate, seeks to determine the price that Advantage Small Cap Core Fund might reasonably expect to receive or pay from the current sale or purchase of that asset or liability in an arm’s-length transaction. Fair value determinations shall be based upon all available factors that the Global Valuation Committee, or its delegate, deems relevant and consistent with the principles of fair value measurement.
The Global Valuation Committee, or its delegate, employs various methods for calibrating valuation approaches for investments where an active market does not exist, including regular due diligence of Advantage Small Cap Core Fund’s pricing vendors, regular reviews of key inputs and assumptions, transactional back-testing or disposition analysis to compare unrealized gains and losses to realized gains and losses, reviews of missing or stale prices and large movements in market values and reviews of any market related activity. The pricing of all Fair Valued Investments is subsequently reported to the Board or a committee thereof on a quarterly basis. As a result of the inherent uncertainty in valuation of these investments, the fair values may differ from the values that would have been used had an active market existed.
For investments in equity or debt issued by privately-held companies or funds (“Private Company” or collectively, the “Private Companies”) and other Fair Valued Investments, the fair valuation approaches that are used by third party pricing services utilize one or a combination of, but not limited to, the following inputs.
| Standard Inputs Generally Considered By Third Party Pricing Services | ||||
| Market approach | (i) | recent market transactions, including subsequent rounds of financing, in the underlying investment or comparable issuers; | ||
| (ii) | recapitalizations and other transactions across the capital structure; and | |||
| (iii) | market multiples of comparable issuers.
| |||
| Income approach | (i) | future cash flows discounted to present and adjusted as appropriate for liquidity, credit, and/or market risks; | ||
| (ii) | quoted prices for similar investments or assets in active markets; and | |||
| (iii) | other risk factors, such as interest rates, yield curves, volatilities, prepayment speeds, loss severities, credit risks, recovery rates, liquidation amounts and/or default rates.
| |||
| Cost approach | (i) | audited or unaudited financial statements, investor communications and financial or operational metrics issued by the Private Company; | ||
| (ii) | changes in the valuation of relevant indices or publicly traded companies comparable to the Private Company; | |||
| (iii) | relevant news and other public sources; and | |||
| (iv) | known secondary market transactions in the Private Company’s interests and merger or acquisition activity in companies comparable to the Private Company.
| |||
Investments in series of preferred stock issued by Private Companies are typically valued utilizing Market approach in determining the enterprise value of the company. Such investments often contain rights and preferences that differ from other series of preferred and common stock of the same issuer. Valuation techniques such as an option pricing model (“OPM”), a probability weighted expected return model (“PWERM”) or a hybrid of those techniques are used in allocating enterprise value of the company, as deemed appropriate under the circumstances. The use of OPM and PWERM techniques involve a determination of the exit scenarios of the investment in order to appropriately allocate the enterprise value of the company among the various parts of its capital structure.
The Private Companies are not subject to the public company disclosure, timing, and reporting standards as other investments held by Advantage Small Cap Core Fund. Typically, the most recently available information by a Private Company is as of a date that is earlier than the date Advantage Small Cap Core Fund is calculating its NAV. This factor may result in a difference between the value of the investment and the price Advantage Small Cap Core Fund could receive upon the sale of the investment.
Fair Value Hierarchy: Various inputs are used in determining the fair value of investments and derivative financial instruments. These inputs to valuation techniques are categorized into a fair value hierarchy consisting of three broad levels for financial statement purposes as follows:
| • | Level 1 — Unadjusted price quotations in active markets/exchanges for identical assets or liabilities that Advantage Small Cap Core Fund has the ability to access |
| • | Level 2 — Other observable inputs (including, but not limited to, quoted prices for similar assets or liabilities in markets that are active, quoted prices for identical or similar assets or liabilities in markets that are not active, inputs other than quoted prices that are observable for the assets or liabilities (such as interest rates, yield curves, volatilities, prepayment speeds, loss severities, credit risks and default rates) or other market–corroborated inputs) |
| 30 | ANNUAL REPORT | MAY 31, 2017 |
| Notes to Financial Statements (continued) |
| • | Level 3 — Unobservable inputs based on the best information available in the circumstances, to the extent observable inputs are not available (including Advantage Small Cap Core Fund’s own assumptions used in determining the fair value of investments and derivative financial instruments) |
The hierarchy gives the highest priority to unadjusted quoted prices in active markets for identical assets or liabilities (Level 1 measurements) and the lowest priority to unobservable inputs (Level 3 measurements). Accordingly, the degree of judgment exercised in determining fair value is greatest for instruments categorized in Level 3. The inputs used to measure fair value may fall into different levels of the fair value hierarchy. In such cases, for disclosure purposes, the fair value hierarchy classification is determined based on the lowest level input that is significant to the fair value measurement in its entirety. Investments classified within Level 3 have significant unobservable inputs used by the Global Valuation Committee in determining the price for Fair Valued Investments. Level 3 investments include equity or debt issued by Private Companies. There may not be a secondary market, and/or there are a limited number of investors. Level 3 investments may also be adjusted to reflect illiquidity and/or non-transferability, with the amount of such discount estimated by the Global Valuation Committee in the absence of market information.
Changes in valuation techniques may result in transfers into or out of an assigned level within the hierarchy. In accordance with Advantage Small Cap Core Fund’s policy, transfers between different levels of the fair value hierarchy are deemed to have occurred as of the beginning of the reporting period. The categorization of a value determined for investments and derivative financial instruments is based on the pricing transparency of the investments and derivative financial instruments and is not necessarily an indication of the risks associated with investing in those securities.
4. Securities and Other Investments:
Securities Lending: Advantage Small Cap Core Fund may lend its securities to approved borrowers, such as brokers, dealers and other financial institutions. The borrower pledges and maintains with Advantage Small Cap Core Fund collateral consisting of cash, an irrevocable letter of credit issued by a bank, or securities issued or guaranteed by the U.S. Government. The initial collateral received by Advantage Small Cap Core Fund is required to have a value of at least 102% of the current value of the loaned securities for securities traded on U.S. exchanges and a value of at least 105% for all other securities. The collateral is maintained thereafter at a value equal to at least 100% of the current market value of the securities on loan. The market value of the loaned securities is determined at the close of each business day of Advantage Small Cap Core Fund and any additional required collateral is delivered to Advantage Small Cap Core Fund, or excess collateral returned by Advantage Small Cap Core Fund, on the next business day. During the term of the loan, Advantage Small Cap Core Fund is entitled to all distributions made on or in respect of the loaned securities, but does not receive interest income on securities received as collateral. Loans of securities are terminable at any time and the borrower, after notice, is required to return borrowed securities within the standard time period for settlement of securities transactions.
The market value of any securities on loan, all of which were classified as common stocks in Advantage Small Cap Core Fund’s Schedule of Investments, and the value of any related collateral are shown separately in the Statements of Assets and Liabilities as a component of investments at value — unaffiliated, and collateral on securities loaned at value, respectively. As of period end, any securities on loan were collateralized by cash and/or U.S. Government obligations. Cash collateral invested by the securities lending agent, BlackRock Investment Management, LLC (“BIM”), if any, is disclosed in the Schedule of Investments.
Securities lending transactions are entered into by Advantage Small Cap Core Fund under Master Securities Lending Agreements (each, an “MSLA”), which provide the right, in the event of default (including bankruptcy or insolvency), for the non-defaulting party to liquidate the collateral and calculate a net exposure to the defaulting party or request additional collateral. In the event that a borrower defaults, Advantage Small Cap Core Fund, as lender, would offset the market value of the collateral received against the market value of the securities loaned. When the value of the collateral is greater than that of the market value of the securities loaned, the lender is left with a net amount payable to the defaulting party. However, bankruptcy or insolvency laws of a particular jurisdiction may impose restrictions on or prohibitions against such a right of offset in the event of an MSLA counterparty’s bankruptcy or insolvency. Under the MSLA, absent an event of default, the borrower can resell or re-pledge the loaned securities, and Advantage Small Cap Core Fund can reinvest cash collateral received in connection with loaned securities. Upon an event of default, the parties’ obligations to return the securities or collateral to the other party are extinguished, and the parties can resell or re-pledge the loaned securities or the collateral received in connection with the loaned securities in order to satisfy the defaulting party’s net payment obligation for all transactions under the MSLA. The defaulting party remains liable for any deficiency.
| ANNUAL REPORT | MAY 31, 2017 | 31 |
| Notes to Financial Statements (continued) |
As of period end, the following table is a summary of Advantage Small Cap Core Fund’s securities lending agreements by counterparty, which are subject to offset under an MSLA:
| Counterparty | Securities Loaned at Value | Cash Collateral Received1 | Net Amount | ||||||||||||||||||||||
Citigroup Global Markets, Inc. | $141,091 | $(141,091) | — | ||||||||||||||||||||||
JP Morgan Securities LLC | 440,486 | (440,486) | — | ||||||||||||||||||||||
Morgan Stanley & Co. LLC | 12,035 | (12,035) | — | ||||||||||||||||||||||
Total | $593,612 | $(593,612) | — | ||||||||||||||||||||||
| 1 | Cash collateral with a value of $621,166 has been received in connection with securities lending agreements. Collateral received in excess of the value of securities loaned from the individual counterparty is not shown for financial reporting purposes in the table above. |
The risks of securities lending include the risk that the borrower may not provide additional collateral when required or may not return the securities when due. To mitigate these risks, Advantage Small Cap Core Fund benefits from a borrower default indemnity provided by BIM. BIM’s indemnity allows for full replacement of the securities loaned if the collateral received does not cover the value on the securities loaned in the event of borrower default. Advantage Small Cap Core Fund could incur a loss if the value of an investment purchased with cash collateral falls below the market value of loaned securities or if the value of an investment purchased with cash collateral falls below the value of the original cash collateral received.
5. Derivative Financial Instruments:
Advantage Small Cap Core Fund engages in various portfolio investment strategies using derivative contracts both to increase the returns of Advantage Small Cap Core Fund and/or to manage its exposure to certain risks such as credit risk, equity risk, interest rate risk, foreign currency exchange rate risk, commodity price risk or other risks (e.g., inflation risk). Derivative financial instruments categorized by risk exposure are included in the Schedule of Investments. These contracts may be transacted on an exchange.
Futures Contracts: Advantage Small Cap Core Fund invests in long and/or short positions in futures and options on futures contracts to gain exposure to, or manage exposure to, changes in interest rates (interest rate risk), changes in the value of equity securities (equity risk) or foreign currencies (foreign currency exchange rate risk).
Futures contracts are agreements between Advantage Small Cap Core Fund and a counterparty to buy or sell a specific quantity of an underlying instrument at a specified price and on a specified date. Depending on the terms of a contract, it is settled either through physical delivery of the underlying instrument on the settlement date or by payment of a cash amount on the settlement date. Upon entering into a futures contract, Advantage Small Cap Core Fund is required to deposit initial margin with the broker in the form of cash or securities in an amount that varies depending on a contract’s size and risk profile. The initial margin deposit must then be maintained at an established level over the life of the contract.
Securities deposited as initial margin are designated in the Schedule of Investments and cash deposited, if any, is shown as cash pledged for futures contracts in the Statements of Assets and Liabilities. Pursuant to the contract, Advantage Small Cap Core Fund agrees to receive from or pay to the broker an amount of cash equal to the daily fluctuation in market value of the contract (“variation margin”). Variation margin is recorded as unrealized appreciation (depreciation) and, if any, shown as variation margin receivable (or payable) on futures contracts in the Statements of Assets and Liabilities. When the contract is closed, a realized gain or loss is recorded in the Statements of Operations equal to the difference between the value of the contract at the time it was opened and the value at the time it was closed. The use of futures contracts involves the risk of an imperfect correlation in the movements in the price of futures contracts and interest, foreign currency exchange rates or underlying assets.
6. Investment Advisory Agreement and Other Transactions with Affiliates:
The PNC Financial Services Group, Inc. is the largest stockholder and an affiliate of BlackRock, Inc. (“BlackRock”) for 1940 Act purposes.
Investment Advisory and Administration: The Trust, on behalf of Advantage Small Cap Core Fund, entered into an Investment Advisory Agreement with BlackRock Advisors, LLC (in such capacity, the “Manager”), Advantage Small Cap Core Fund’s investment adviser, an indirect, wholly-owned subsidiary of BlackRock, to provide investment advisory services. The Manager is responsible for the management of Advantage Small Cap Core Fund’s portfolio and provides the personnel, facilities, equipment and certain other services necessary to the operations of Advantage Small Cap Core Fund.
| 32 | ANNUAL REPORT | MAY 31, 2017 |
| Notes to Financial Statements (continued) |
For such services, Advantage Small Cap Core Fund pays the Manager a monthly fee at an annual rate equal to the following percentages of the average daily value of Advantage Small Cap Core Fund’s net assets:
| Average Daily Net Assets | Investment Advisory Fee | |
First $1 Billion | 0.45% | |
$1 Billion - $3 Billion | 0.42% | |
$3 Billion - $5 Billion | 0.41% | |
$5 Billion - $10 Billion | 0.39% | |
Greater than $10 Billion | 0.38% |
The Corporation, on behalf of Small Cap Growth Fund II, entered into an Administration Agreement with BlackRock Advisors, LLC (in such capacity, the “Administrator”), an indirect, wholly-owned subsidiary of BlackRock, to provide administrative services (other than investment advice and related portfolio activities). For such services, Small Cap Growth Fund II pays the Administrator a monthly fee at an annual rate of 0.20% of the average daily net assets of Small Cap Growth Fund II. Small Cap Growth Fund II does not pay an investment advisory fee or investment management fee.
Service and Distribution Fees: The Corporation and the Trust, on behalf of the Funds, entered into a Distribution Agreement and a Distribution and Service Plan with BlackRock Investments, LLC (“BRIL”), an affiliate of the Manager/Administrator. Pursuant to the Distribution and Service Plan and in accordance with Rule 12b-1 under the 1940 Act, each Fund pays BRIL ongoing service and distribution fees. The fees are accrued daily and paid monthly at annual rates based upon the average daily net assets of the relevant share class of each Fund as follows:
| Investor A | Investor C | Class R | ||||||||
Service Fee | 0.25% | 0.25% | 0.25% | |||||||
Distribution Fee | — | 0.75% | 0.25% |
BRIL and broker-dealers, pursuant to sub-agreements with BRIL, provide shareholder servicing and distribution services to the Funds. The ongoing service and/or distribution fee compensates BRIL and each broker-dealer for providing shareholder servicing and/or distribution related services to shareholders.
For the year ended May 31, 2017, the following table shows the class specific service and distribution fees borne directly by each share class of each Fund:
| Investor A | Investor C | Class R | Total | |||||||||||
Advantage Small Cap Core Fund | $ 10,691 | $ 5,892 | — | $ 16,583 | ||||||||||
Small Cap Growth Fund II | $147,616 | $301,861 | $100,150 | $549,627 |
Administration: The Trust, on behalf of Advantage Small Cap Core Fund, entered into an Administration Agreement with the Manager, an indirect, wholly-owned subsidiary of BlackRock, to provide administrative services. For these services, the Manager receives an administration fee computed daily and payable monthly, based on a percentage of the average daily net assets of Advantage Small Cap Core Fund. The administration fee, which is shown as administration in the Statements of Operations, is paid at the annual rates below.
| Average Daily Net Assets | Administration Fee | |
First $500 Million | 0.0425% | |
$500 Million - $1 Billion | 0.0400% | |
$1 Billion - $2 Billion | 0.0375% | |
$2 Billion - $4 Billion | 0.0350% | |
$4 Billion - $13 Billion | 0.0325% | |
Greater than $13 Billion | 0.0300% |
In addition, the Manager charges each of the share classes an administration fee, which is shown as administration — class specific in the Statements of Operations, at an annual rate of 0.02% of the average daily net assets of each respective class.
For the year ended May 31, 2017, the following table shows the class specific administration fees borne directly by each share class of Advantage Small Cap Core Fund:
| Institutional | Investor A | Investor C | Class K | Total | ||||
| $ 6,235 | $ 855 | $ 118 | $3,391 | $10,599 |
| ANNUAL REPORT | MAY 31, 2017 | 33 |
| Notes to Financial Statements (continued) |
Transfer Agent: Pursuant to written agreements, certain financial intermediaries, some of which may be affiliates, provide the Funds with sub-accounting, recordkeeping, sub-transfer agency and other administrative services with respect to sub-accounts they service. For these services, these entities receive an asset based fee or an annual fee per shareholder account, which will vary depending on share class and/or net assets.
The Manager/Administrator maintains a call center that is responsible for providing certain shareholder services to the Funds. Shareholder services include responding to inquiries and processing subscriptions and redemptions based upon instructions from shareholders. For the year ended May 31, 2017, each Fund reimbursed the Manager/Administrator the following amounts for costs incurred in running the call center, which are included in transfer agent — class specific in the Statements of Operations:
| Institutional | Investor A | Investor C | Class R | Total | ||||||||||||||
Advantage Small Cap Core Fund | $ 77 | $ 304 | $116 | — | $ 497 | |||||||||||||
Small Cap Growth Fund II | $232 | $1,019 | $527 | $131 | $1,909 |
For the year ended May 31, 2017, the following table shows the class specific transfer agent fees borne directly by each class of each Fund:
| Institutional | Investor A | Investor C | Class K | Class R | Total | ||||||||||||||||||||||||||||||||||||||||||||||||||
Advantage Small Cap Core Fund | $ 10,429 | $ 8,500 | $ 1,367 | $53 | — | $ 20,349 | |||||||||||||||||||||||||||||||||||||||||||||||||
Small Cap Growth Fund II | $157,063 | $150,458 | $110,777 | — | $52,970 | $471,268 | |||||||||||||||||||||||||||||||||||||||||||||||||
Other Fees: For the year ended May 31, 2017, affiliates earned underwriting discounts, direct commissions and dealer concessions on sales of Advantage Small Cap Core Fund’s Investor A Shares of $994 and Small Cap Growth Fund II’s Investor A Shares of $1,323.
For the year ended May 31, 2017, affiliates received CDSCs in the amount of $247 and $338 for Advantage Small Cap Core Fund’s Investor A and Investor C Shares, respectively, and $62 and $2,297 for Small Cap Growth Fund II’s Investor A Shares and Investor C Shares, respectively.
Expense Limitations, Waivers, Reimbursements and Recoupments: With respect to each Fund, the Manager/Administrator contractually agreed to waive and/or reimburse fees or expenses in order to limit expenses, excluding interest expense, dividend expense, tax expense, acquired fund fees and expenses and certain other fund expenses, which constitute extraordinary expenses not incurred in the ordinary course of each Fund’s business (“expense limitation”). The expense limitations as a percentage of average daily net assets are as follows:
| Institutional | Investor A | Investor C | Class K | Class R | ||||||||||||||
Advantage Small Cap Core Fund | 0.50% | 0.75% | 1.50% | 0.45% | N/A | |||||||||||||
Small Cap Growth Fund II | 0.68% | 0.93% | 1.68% | N/A | 1.18% |
Prior to December 1, 2016 the Small Cap Growth Fund II had no expense limitations and for Advantage Small Cap Core Fund, the expense limitations as a percentage of average daily net assets were as follows:
| Institutional | Investor A | Investor C | Class K | |||
| 0.70% | 0.95% | 1.70% | 0.60% |
The Manager/Administrator has agreed not to reduce or discontinue these contractual expense limitations through September 30, 2018. This contractual agreement may be terminated upon 90 days’ notice by a majority of the trustees/directors of the Trust/Corporation who are not “interested persons” of the applicable Fund, as defined in the 1940 Act (“Independent Trustees” or “Independent Directors”, as applicable), or by a vote of a majority of the outstanding voting securities of a Fund. For the year ended May 31, 2017, the Manager/Administrator reimbursed $358,286 and $143,487 for Advantage Small Cap Core Fund and Small Cap Growth Fund II, respectively, which is included in fees waived and/or reimbursed by the Manager/ Administrator on the Statements of Operations.
These amounts waived and/or reimbursed are included in fees waived and/or reimbursed by the Manager/Administrator, administration fees waived, administration fees waived — class specific and transfer agent fees waived and/or reimbursed — class specific, respectively, in the Statements of Operations. Class specific expense waivers and/or reimbursements are as follows:
| Administration Fees Waived | Institutional | Investor A | Investor C | Class K | Total | |||||||||||||||||||||||||||||||
Advantage Small Cap Core Fund | $ | 3,146 | $ | 855 | $ | 118 | $ | 3,390 | $ | 7,509 | ||||||||||||||||||||||||||
Transfer Agent Fees Waived and/or Reimbursed | Institutional | Investor A | Investor C | Class K | Class R | Total | |||||||||||||||||||||||||||||||||||||||||||||||||
Advantage Small Cap Core Fund | $ 853 | $ 5,480 | $ 970 | $51 | — | $ 7,354 | |||||||||||||||||||||||||||||||||||||||||||||||||
Small Cap Growth Fund II | $73,437 | $69,018 | $49,415 | — | $25,460 | $217,330 | |||||||||||||||||||||||||||||||||||||||||||||||||
| 34 | ANNUAL REPORT | MAY 31, 2017 |
| Notes to Financial Statements (continued) |
With respect to Advantage Small Cap Core Fund, the Manager voluntarily agreed to waive its investment advisory fees by the amount of investment advisory fees Advantage Small Cap Core Fund pays to the Manager indirectly through its investment in affiliated money market funds (the “affiliated money market fund waiver”). This amount is included in fees waived by the Manager in the Statements of Operations. The amount of waivers and/or reimbursements of fees and expenses made pursuant to the expense limitation caps, as applicable, will be reduced by the amount of the affiliated money market fund waiver. For the year ended May 31, 2017, the amount waived was $1,248.
Effective September 1, 2016, the Manager voluntarily agreed to waive its investment advisory fee with respect to any portion of Advantage Small Cap Core Fund’s assets invested in affiliated equity or fixed-income mutual funds and affiliated exchange-traded funds that have a contractual management fee. Prior to September 1, 2016, the Manager did not waive such fees. Effective September 28, 2016, the waiver became contractual through September 30, 2017. The contractual agreement may be terminated upon 90 days’ notice by a majority of the Independent Trustees or by a vote of a majority of the outstanding voting securities of Advantage Small Cap Core Fund. For the year ended May 31, 2017, there were no fees waived by the Manager.
Effective June 15, 2016, the Administrator of Small Cap Growth Fund II contractually agreed to waive a portion of its administration fee equal to the annual rate of 0.14% of Small Cap Growth Fund’s average daily net assets through September 30, 2018. The contractual agreement may be terminated upon 90 days’ notice by a majority of the Independent Directors or by a vote of a majority of the outstanding voting securities of Small Cap Growth Fund II. The amount waived is shown as administration fees waived in the Statements of Operations. For the year ended May 31, 2017, the Fund contractually waived $217,989, which are included in administration fees waived.
With respect to the contractual expense caps, if during a Fund’s fiscal year the operating expenses of a share class, that at any time during the prior two fiscal years received and/or waiver or reimbursement from the Manager/Administrator, are less than the expense cap for that share class, the Manager/Administrator is entitled to be reimbursed by such share class up to the lesser of the following expenses:
| (a) | The amount of fees waived and/or expenses reimbursed during those prior two fiscal years under the agreement. |
| (b) | The amount by which the expense cap for that share class exceeds the operating expenses of the share class for the current fiscal year, provided that: |
| • | Each Fund, of which the share class is a part, has more than $50 million in assets for the fiscal year; and |
| • | The Manager/Administrator or an affiliate continues to serve as a Fund’s investment adviser or administrator. |
In the event the expense cap for a share class is changed subsequent to a fiscal year in which the Manager/Administrator becomes entitled to reimbursement for fees waived and/or reimbursed, the amount available to reimburse the Manager/Administrator shall be calculated by reference to the expense cap for that share class in effect at the time the Manager/Administrator became entitled to receive such reimbursement, rather than the subsequently changed expense cap for that share class.
On May 31, 2017, the fund level and class specific waivers and/or reimbursements subject to possible future recoupment under the expense limitation agreement are as follows:
| Expiring May 31, | ||||||||
| 2018 | 2019 | |||||||
Advantage Small Cap Core Fund | ||||||||
Fund Level | $ | 236,691 | $ | 373,661 | ||||
Institutional | $ | 1,345 | $ | 3,999 | ||||
Investor A | $ | 7,417 | $ | 6,335 | ||||
Investor C | $ | 1,035 | $ | 1,088 | ||||
Class K | $ | 7 | $ | 3,441 | ||||
Small Cap Growth Fund II | ||||||||
Fund Level | — | $ | 182,396 | |||||
Institutional | — | $ | 73,437 | |||||
Investor A | — | $ | 69,018 | |||||
Investor C | — | $ | 49,415 | |||||
Class R | — | $ | 25,460 | |||||
| ANNUAL REPORT | MAY 31, 2017 | 35 |
| Notes to Financial Statements (continued) |
The following Advantage Small Cap Core Fund’s fund level and class specific waivers and/or reimbursements previously recorded by Advantage Small Cap Core Fund, which were subject to recoupment by the Manager, expired on May 31, 2017:
Fund Level | $ | 203,594 | ||
Institutional | $ | 1,660 | ||
Investor A | $ | 2,999 | ||
Investor C | $ | 470 |
Securities Lending: The SEC has issued an exemptive order which permits BIM, an affiliate of the Manager, to serve as securities lending agent for Advantage Small Cap Core Fund, subject to applicable conditions. As securities lending agent, BIM bears all operational costs directly related to securities lending. Advantage Small Cap Core Fund is responsible for expenses in connection with the investment of cash collateral received for securities on loan (the “collateral investment expenses”). The cash collateral is invested in a private investment company managed by the Manager or its affiliates. However, BIM has agreed to cap the collateral investment expenses of the private investment company to an annual rate of 0.04%. The investment adviser to the private investment company will not charge any advisory fees with respect to shares purchased by Advantage Small Cap Core Fund. If the private investment company’s weekly liquid assets fall below 30% of its total assets, BIM, as managing member of the private investment company, is permitted at any time, if it determines it to be in the best interests of the private investment company, to impose a liquidity fee of up to 2% of the value of units withdrawn or impose a redemption gate that temporarily suspends the right of withdrawal out of the private investment company. In addition, if the private investment company’s weekly liquid assets fall below 10% of its total assets at the end of any business day, the private investment company will impose a liquidity fee in the default amount of 1% of the amount withdrawn, generally effective as of the next business day, unless BIM determines that a higher (not to exceed 2%) or lower fee level or not imposing a liquidity fee is in the best interests of the private investment company. The shares of the private investment company purchased by Advantage Small Cap Core Fund would be subject to any such liquidity fee or redemption gate imposed.
Securities lending income is equal to the total of income earned from the reinvestment of cash collateral, net of fees and other payments to and from borrowers of securities, and less the collateral investment expenses. Advantage Small Cap Core Fund retains a portion of securities lending income and remits a remaining portion to BIM as compensation for its services as securities lending agent. Pursuant to a securities lending agreement, BIM may lend securities only when the difference between the borrower rebate rate and the risk free rate exceeds a certain level (such securities, the “specials only securities”).
Pursuant to such agreement, Advantage Small Cap Core Fund retains 80% of securities lending income. In addition, commencing the business day following the date that the aggregate securities lending income earned across certain funds in the Equity-Liquidity Complex in a calendar year exceeds a specified threshold, Advantage Small Cap Core Fund, pursuant to the securities lending agreement, will retain for the remainder of the calendar year securities lending income in an amount equal to 85% of securities lending income.
The share of securities lending income earned by Advantage Small Cap Core Fund is shown as securities lending income — affiliated — net in the Statements of Operations. For the year ended May 31, 2017, Advantage Small Cap Core Fund paid BIM $5,459 for securities lending agent services.
Interfund Lending: In accordance with an exemptive order (the “Order”) from the SEC, each Fund may participate in a joint lending and borrowing facility for temporary purposes (the “Interfund Lending Program”), subject to compliance with the terms and conditions of the Order, and to the extent permitted by each Fund’s investment policies and restrictions. Advantage Small Cap Core Fund is currently permitted to borrow and lend and Small Cap Growth Fund II is currently permitted to borrow under the Interfund Lending Program.
A lending BlackRock fund may lend in aggregate up to 15% of its net assets, but may not lend more than 5% of its net assets to any one borrowing fund through the Interfund Lending Program. A borrowing BlackRock fund may not borrow through the Interfund Lending Program or from any other source more than 33 1/3% of its total assets (or any lower threshold provided for by the fund’s investment restrictions). If a borrowing BlackRock fund’s total outstanding borrowings exceed 10% of its total assets, each of its outstanding interfund loans will be subject to collateralization of at least 102% of the outstanding principal value of the loan. All interfund loans are for temporary or emergency purposes and the interest rate to be charged will be the average of the highest current overnight repurchase agreement rate available to a lending fund and the bank loan rate, as calculated according to a formula established by the Board.
During the year ended May 31, 2017, the Funds did not participate in the Interfund Lending Program.
Officers and Trustees/Directors: Certain officers and/or trustees/directors of the Trust/Corporation are officers and/or trustees/directors of BlackRock or its affiliates. The Funds reimburse the Manager/Administrator for a portion of the compensation paid to the Trust’s/Corporation’s Chief Compliance Officer, which is included in Officer and Trustees/Directors in the Statements of Operations.
| 36 | ANNUAL REPORT | MAY 31, 2017 |
| Notes to Financial Statements (continued) |
7. Purchases and Sales:
For the year ended May 31, 2017, purchases and sales of investments, excluding short-term securities, were $170,953,396 and $67,978,687, respectively, for Advantage Small Cap Core Fund.
8. Income Tax Information:
It is each Fund’s policy to comply with the requirements of the Internal Revenue Code of 1986, as amended, applicable to regulated investment companies, and to distribute substantially all of their taxable income to their shareholders. Therefore, no U.S. federal income tax provision is required.
Each Fund files U.S. federal and various state and local tax returns. No income tax returns are currently under examination. The statute of limitationson the Funds’ U.S. federal tax returns generally remains open for each of the four years ended May 31, 2017. The statutes of limitations on the Funds’ state and local tax returns may remain open for an additional year depending upon the jurisdiction.
Management has analyzed tax laws and regulations and their application to the Funds as of May 31, 2017, inclusive of the open tax return years, and does not believe that there are any uncertain tax positions that require recognition of a tax liability in the Funds’ financial statements.
U.S. GAAP requires that certain components of net assets be adjusted to reflect permanent differences between financial and tax reporting. These reclassifications have no effect on net assets or net asset values per share. As of period end, the following permanent differences attributable to the non-deductible expenses, the timing and recognition of partnership income and net operating losses were reclassified to the following accounts:
| Advantage Small Cap Core Fund | Small Cap Growth Fund II | |||||||||||||
Paid-in capital | $(67,036) | $(830,963) | ||||||||||||
Undistributed (accumulated) net investment income (loss) | $ 66,772 | $ 830,963 | ||||||||||||
Undistributed net realized gain | $ 264 | — | ||||||||||||
The tax character of distributions paid was as follows:
| ||||||||||||||
| Advantage Small Cap Core Fund | Small Cap Growth Fund II | |||||||||||||
Ordinary income | ||||||||||||||
5/31/17 | $159,267 | — | ||||||||||||
5/31/16 | $195,644 | $ | 4,397,306 | |||||||||||
Long-term capital gains | ||||||||||||||
5/31/17 | 98,300 | $ | 339,036 | |||||||||||
5/31/16 | 297,856 | 14,118,585 | ||||||||||||
Total | ||||||||||||||
5/31/17 | $257,567 | $ | 339,036 | |||||||||||
5/31/16 | $493,500 | $ | 18,515,891 | |||||||||||
As of period end, the tax components of accumulated net earnings (losses) were as follows:
|
| |||||||||||||
| Advantage Small Cap Core Fund | Small Cap Growth Fund II | |||||||||||||
Undistributed ordinary income | $ | 2,202,596 | — | |||||||||||
Undistributed long-term capital gains | 484,685 | $ | 6,949,564 | |||||||||||
Net unrealized gains1 | 1,291,674 | 16,923,577 | ||||||||||||
Qualified late-year losses 2 | — | (225,930 | ) | |||||||||||
Total | $ | 3,978,955 | $ | 23,647,211 | ||||||||||
| 1 | The difference between book-basis and tax-basis net unrealized gains was attributable primarily to the tax deferral of losses on wash sales, the timing and recognition of partnership income and the realization for tax purposes of unrealized gains/losses on certain futures contracts. |
| 2 | The Fund has elected to defer certain qualified late-year losses and recognize such losses in the next taxable year. |
| ANNUAL REPORT | MAY 31, 2017 | 37 |
| Notes to Financial Statements (continued) |
As of May 31, 2017, gross unrealized appreciation and depreciation based on cost for U.S. federal income tax purposes for Advantage Small Cap Core Fund were as follows:
Tax cost | $ | 121,741,426 | ||
Gross unrealized appreciation | $ | 6,762,433 | ||
Gross unrealized depreciation | (5,472,100 | ) | ||
Net unrealized appreciation | $ | 1,290,333 |
9. Bank Borrowings:
The Trust, on behalf of Advantage Small Cap Core Fund, along with certain other funds managed by the Manager and its affiliates (“Participating Funds”), is a party to a 364-day, $2.1 billion credit agreement with a group of lenders. Under this agreement, the Fund may borrow to fund shareholder redemptions. Excluding commitments designated for certain individual funds, the Participating Funds, including the Fund, can borrow up to an aggregate commitment amount of $1.6 billion at any time outstanding, subject to asset coverage and other limitations as specified in the agreement. The credit agreement has the following terms: a fee of 0.12% per annum on unused commitment amounts and interest at a rate equal to the higher of (a) one-month LIBOR (but, in any event, not less than 0.00%) on the date the loan is made plus 0.80% per annum or (b) the Fed Funds rate (but, in any event, not less than 0.00%) in effect from time to time plus 0.80% per annum on amounts borrowed. The agreement expires in April 2018 unless extended or renewed. Participating Funds paid administration, legal and arrangement fees, which, if applicable, are included in miscellaneous expenses in the Statements of Operations. These fees were allocated among such funds based upon portions of the aggregate commitment available to them and relative net assets of Participating Funds. During the year ended May 31, 2017, the Advantage Small Cap Core Fund did not borrow under the credit agreement.
10. Principal Risks:
In the normal course of business, Advantage Small Cap Core Fund invests in securities and enters into transactions where risks exist due to fluctuations in the market (market risk) or failure of the issuer to meet all its obligations, including the ability to pay principal and interest when due (issuer credit risk). The value of securities held by Advantage Small Cap Core Fund may decline in response to certain events, including those directly involving the issuers of securities owned by Advantage Small Cap Core Fund. Changes arising from the general economy, the overall market and local, regional or global political and/or social instability, as well as currency, interest rate and price fluctuations, may also affect the securities’ value.
On October 11, 2016, BlackRock implemented certain changes required by amendments to Rule 2a-7 under the 1940 Act, which governs the operations of U.S. money market funds. Advantage Small Cap Core Fund may be exposed to additional risks when reinvesting cash collateral in money market funds that do not seek to maintain a stable NAV per share of $1.00 and which may be subject to redemption gates or liquidity fees under certain circumstances.
Valuation Risk: The market values of equities, such as common stocks and preferred securities or equity related investments, such as futures and options, may decline due to general market conditions which are not specifically related to a particular company. They may also decline due to factors which affect a particular industry or industries. Advantage Small Cap Core Fund may invest in illiquid investments and may experience difficulty in selling those investments in a timely manner at the price that it believes the investments are worth. Prices may fluctuate widely over short or extended periods in response to company, market or economic news. Markets also tend to move in cycles, with periods of rising and falling prices. This volatility may cause Advantage Small Cap Core Fund’s NAV to experience significant increases or decreases over short periods of time. If there is a general decline in the securities and other markets, the NAV of Advantage Small Cap Core Fund may lose value, regardless of the individual results of the securities and other instruments in which Advantage Small Cap Core Fund invests.
The price Advantage Small Cap Core Fund could receive upon the sale of any particular portfolio investment may differ from Advantage Small Cap Core Fund’s valuation of the investment, particularly for securities that trade in thin or volatile markets or that are valued using a fair valuation technique or a price provided by an independent pricing service. Changes to significant unobservable inputs and assumptions (i.e., publicly traded company multiples, growth rate, time to exit) due to the lack of observable inputs may significantly impact the resulting fair value and therefore Advantage Small Cap Core Fund’s results of operations. As a result, the price received upon the sale of an investment may be less than the value ascribed by Advantage Small Cap Core Fund, and Advantage Small Cap Core Fund could realize a greater than expected loss or lesser than expected gain upon the sale of the investment. Advantage Small Cap Core Fund’s ability to value its investments may also be impacted by technological issues and/or errors by pricing services or other third party service providers.
Counterparty Credit Risk: Similar to issuer credit risk, Advantage Small Cap Core Fund may be exposed to counterparty credit risk, or the risk that an entity may fail to or be unable to perform on its commitments related to unsettled or open transactions. Advantage Small Cap Core Fund manages counterparty credit risk by entering into transactions only with counterparties that the Manager believes have the financial resources to honor their obligations and by monitoring the financial stability of those counterparties. Financial assets, which potentially expose Advantage Small Cap Core Fund to market, issuer and counterparty credit risks, consists principally of financial instruments and receivables due from counterparties. The extent
| 38 | ANNUAL REPORT | MAY 31, 2017 |
| Notes to Financial Statements (continued) |
of Advantage Small Cap Core Fund’s exposure to market, issuer and counterparty credit risks with respect to these financial assets is approximately their value recorded in the Statements of Assets and Liabilities, less any collateral held by Advantage Small Cap Core Fund.
A derivative contract may suffer a mark-to-market loss if the value of the contract decreases due to an unfavorable change in the market rates or values of the underlying instrument. Losses can also occur if the counterparty does not perform under the contract.
With exchange-traded futures, there is less counterparty credit risk to Advantage Small Cap Core Fund since the exchange or clearinghouse, as counterparty to such instruments, guarantees against a possible default. The clearinghouse stands between the buyer and the seller of the contract; therefore, credit risk is limited to failure of the clearinghouse. While offset rights may exist under applicable law, Advantage Small Cap Core Fund does not have a contractual right of offset against a clearing broker or clearinghouse in the event of a default (including the bankruptcy or insolvency). Additionally, credit risk exists in exchange-traded futures with respect to initial and variation margin that is held in a clearing broker’s customer accounts. While clearing brokers are required to segregate customer margin from their own assets, in the event that a clearing broker becomes insolvent or goes into bankruptcy and at that time there is a shortfall in the aggregate amount of margin held by the clearing broker for all its clients, typically the shortfall would be allocated on a pro rata basis across all the clearing broker’s customers, potentially resulting in losses to Advantage Small Cap Core Fund.
11. Capital Share Transactions:
Transactions in capital shares for each class were as follows:
| Year Ended May 31, 2017 | Year Ended May 31, 2016 | |||||||||||||||||||
| Advantage Small Cap Core Fund | Shares | Amount | Shares | Amount | ||||||||||||||||
Institutional | ||||||||||||||||||||
Shares sold | 3,696,519 | $ | 44,291,315 | 449,991 | $ | 4,546,708 | ||||||||||||||
Shares issued in reinvestment of distributions | 14,880 | 185,077 | 1,759 | 18,713 | ||||||||||||||||
Shares redeemed | (226,852 | ) | (2,807,568 | ) | (749 | ) | (7,861 | ) | ||||||||||||
|
|
|
| |||||||||||||||||
Net increase | 3,484,547 | $ | 41,668,824 | 451,001 | $ | 4,557,560 | ||||||||||||||
|
|
|
| |||||||||||||||||
Investor A | ||||||||||||||||||||
Shares sold | 342,866 | $ | 4,326,120 | 179,397 | $ | 1,863,594 | ||||||||||||||
Shares issued in reinvestment of distributions | 1,755 | 21,953 | 15,507 | 164,691 | ||||||||||||||||
Shares redeemed | (141,882 | ) | (1,774,754 | ) | (126,477 | ) | (1,219,888 | ) | ||||||||||||
|
|
|
| |||||||||||||||||
Net increase | 202,739 | $ | 2,573,319 | 68,427 | $ | 808,397 | ||||||||||||||
|
|
|
| |||||||||||||||||
Investor C | ||||||||||||||||||||
Shares sold | 52,069 | $ | 633,937 | 14,824 | $ | 160,501 | ||||||||||||||
Shares issued in reinvestment of distributions | 118 | 1,455 | 1,530 | 16,104 | ||||||||||||||||
Shares redeemed | (31,265 | ) | (370,768 | ) | (2,825 | ) | (29,590 | ) | ||||||||||||
|
|
|
| |||||||||||||||||
Net increase | 20,922 | $ | 264,624 | 13,529 | $ | 147,015 | ||||||||||||||
|
|
|
| |||||||||||||||||
| Period March 28, 20161 to May 31, 2016 | ||||||||||||||||||||
| Shares | Amount | |||||||||||||||||||
Class K | ||||||||||||||||||||
Shares sold | 4,589,825 | $ | 60,034,693 | 20,243 | $ | 200,000 | ||||||||||||||
Shares redeemed | (776 | ) | (10,128 | ) | — | — | ||||||||||||||
|
|
|
| |||||||||||||||||
Net increase | 4,589,049 | $ | 60,024,565 | 20,243 | $ | 200,000 | ||||||||||||||
|
|
|
| |||||||||||||||||
Total Net Increase | 8,297,257 | $ | 104,531,332 | 553,200 | $ | 5,712,972 | ||||||||||||||
|
|
|
| |||||||||||||||||
| 1 | Commencement of operations. |
| ANNUAL REPORT | MAY 31, 2017 | 39 |
| Notes to Financial Statements (concluded) |
| Year Ended May 31, 2017 | Year Ended May 31, 2016 | |||||||||||||||||||
| Small Cap Growth Fund II | Shares | Amount | Shares | Amount | ||||||||||||||||
Institutional | ||||||||||||||||||||
Shares sold | 965,539 | $ | 12,840,286 | 1,420,622 | $ | 17,733,067 | ||||||||||||||
Shares issued in reinvestment of distributions | 5,729 | 77,801 | 402,378 | 5,371,450 | ||||||||||||||||
Shares redeemed | (2,301,758 | ) | (29,762,602 | ) | (1,868,344 | ) | (23,256,927 | ) | ||||||||||||
|
|
|
| |||||||||||||||||
Net decrease | (1,330,490 | ) | $ | (16,844,515 | ) | (45,344 | ) | $ | (152,410 | ) | ||||||||||
|
|
|
| |||||||||||||||||
Investor A | ||||||||||||||||||||
Shares received from conversion1 | — | — | 10,222 | $ | 146,887 | |||||||||||||||
Shares sold | 1,405,700 | $ | 18,085,959 | 1,106,703 | 13,319,117 | |||||||||||||||
Shares issued in reinvestment of distributions | 8,855 | 113,073 | 492,795 | 6,190,518 | ||||||||||||||||
Shares redeemed | (1,638,909 | ) | (20,278,807 | ) | (1,903,584 | ) | (22,168,524 | ) | ||||||||||||
|
|
|
| |||||||||||||||||
Net decrease | (224,354 | ) | $ | (2,079,775 | ) | (293,864 | ) | $ | (2,512,002 | ) | ||||||||||
|
|
|
| |||||||||||||||||
Investor B | ||||||||||||||||||||
Shares sold | — | — | 476 | $ | 5,459 | |||||||||||||||
Shares converted1 | — | — | (12,512 | ) | (146,887 | ) | ||||||||||||||
Shares redeemed and automatic conversion of shares | — | — | (11,105 | ) | (129,938 | ) | ||||||||||||||
|
|
|
| |||||||||||||||||
Net decrease | — | — | (23,141 | ) | $ | (271,366 | ) | |||||||||||||
|
|
|
| |||||||||||||||||
Investor C | ||||||||||||||||||||
Shares sold | 237,198 | $ | 2,335,620 | 421,544 | $ | 3,924,237 | ||||||||||||||
Shares issued in reinvestment of distributions | 6,771 | 68,713 | 350,338 | 3,545,995 | ||||||||||||||||
Shares redeemed | (2,226,842 | ) | (22,588,843 | ) | (1,077,568 | ) | (10,066,102 | ) | ||||||||||||
|
|
|
| |||||||||||||||||
Net decrease | (1,982,873 | ) | $ | (20,184,510 | ) | (305,686 | ) | $ | (2,595,870 | ) | ||||||||||
|
|
|
| |||||||||||||||||
Class R | ||||||||||||||||||||
Shares sold | 536,520 | $ | 6,121,837 | 574,655 | $ | 6,181,331 | ||||||||||||||
Shares issued in reinvestment of distributions | 3,806 | 44,226 | 182,433 | 2,089,635 | ||||||||||||||||
Shares redeemed | (777,773 | ) | (8,818,943 | ) | (793,333 | ) | (8,571,554 | ) | ||||||||||||
|
|
|
| |||||||||||||||||
Net decrease | (237,447 | ) | $ | (2,652,880 | ) | (36,245 | ) | $ | (300,588 | ) | ||||||||||
|
|
|
| |||||||||||||||||
Total Net Decrease | (3,775,164 | ) | $ | (41,761,680 | ) | (704,280 | ) | $ | (5,832,236 | ) | ||||||||||
|
|
|
| |||||||||||||||||
| 1 | On June 23, 2015, Investor B Shares converted to Investor A Shares. |
At May 31, 2017, 496,000 Institutional Shares, 2,000 Investor A Shares, 2,000 Investor C Shares and 4,607,399 Class K Shares of Advantage Small Cap Core Fund were owned by BlackRock HoldCo 2, Inc., an affiliate of Advantage Small Cap Core Fund.
12. Subsequent Events:
Management has evaluated the impact of all subsequent events on the Funds through the date the financial statements were issued and has determined that there were no subsequent events requiring adjustment or additional disclosure in the financial statements.
| 40 | ANNUAL REPORT | MAY 31, 2017 |
| Report of Independent Registered Public Accounting Firm |
To the Shareholders of BlackRock Advantage Small Cap Core Fund (formerly BlackRock Disciplined Small Cap Core Fund) and Board of Trustees of BlackRock FundsSM and to the Shareholders of BlackRock Small Cap Growth Fund II and Board of Directors of BlackRock Series, Inc.:
We have audited the accompanying statements of assets and liabilities of BlackRock Advantage Small Cap Core Fund (formerly BlackRock Disciplined Small Cap Core Fund), including the schedule of investments, as of May 31, 2017, and the related statement of operations for the year then ended, the statements of changes in net assets for each of the two years in the period then ended, and the financial highlights for each of the periods presented. We have also audited the accompanying statement of assets and liabilities of BlackRock Small Cap Growth Fund II (collectively, with BlackRock Advantage Small Cap Core Fund (formerly BlackRock Disciplined Small Cap Core Fund), the “Funds”), as of May 31, 2017, and the related statement of operations for the year then ended, the statements of changes in net assets for each of the two years in the period then ended, and the financial highlights for each of the five years in the period then ended. These financial statements and financial highlights are the responsibility of the Funds’ management. Our responsibility is to express an opinion on these financial statements and financial highlights based on our audits.
We conducted our audits in accordance with the standards of the Public Company Accounting Oversight Board (United States). Those standards require that we plan and perform the audit to obtain reasonable assurance about whether the financial statements and financial highlights are free of material misstatement. The Funds are not required to have, nor were we engaged to perform, an audit of their internal control over financial reporting. Our audits included consideration of internal control over financial reporting as a basis for designing audit procedures that are appropriate in the circumstances, but not for the purpose of expressing an opinion on the effectiveness of the Funds’ internal control over financial reporting. Accordingly, we express no such opinion. An audit also includes examining, on a test basis, evidence supporting the amounts and disclosures in the financial statements, assessing the accounting principles used and significant estimates made by management, as well as evaluating the overall financial statement presentation. Our procedures included confirmation of securities owned as of May 31, 2017, by correspondence with the custodian and brokers; where replies were not received from brokers, we performed other auditing procedures. We believe that our audits provide a reasonable basis for our opinion.
In our opinion, the financial statements and financial highlights referred to above present fairly, in all material respects, the respective financial position of BlackRock Advantage Small Cap Core Fund (formerly BlackRock Disciplined Small Cap Core Fund) and BlackRock Small Cap Growth Fund II as of May 31, 2017, and as to BlackRock Advantage Small Cap Core Fund (formerly BlackRock Disciplined Small Cap Core Fund) the results of its operations for the year then ended, and the changes in net assets for each of the two years in the period then ended, and financial highlights for the periods presented, and as to BlackRock Small Cap Growth Fund II the results of its operations for the year then ended, the changes in its net assets for each of the two years in the period then ended, and the financial highlights for each of the five years in the period then ended, in conformity with accounting principles generally accepted in the United States of America.
Deloitte & Touche LLP
Philadelphia, Pennsylvania
July 24, 2017
| Important Tax Information (Unaudited) |
The following information is provided with respect to the ordinary income distributions paid during the fiscal year ended May 31, 2017:
| Payable Date | Qualified Dividend Income for Individuals1 | Dividends Qualifying for the | |||||||||||||
Advantage Small Cap Core Fund | 7/21/16 | 100.00 | % | 100.00 | % | ||||||||||
| 12/07/16 | 96.62 | % | 95.64 | % | |||||||||||
Small Cap Growth Fund II | 12/07/16 | 100.00 | % | 100.00 | % | ||||||||||
| 1 | The Funds hereby designate the percentage indicated above or the maximum amount allowable by law. |
Additionally, BlackRock Advantage Small Cap Core Fund distributed long-term capital gains of $0.032847 per share to shareholders of record on December 5, 2016.
| ANNUAL REPORT | MAY 31, 2017 | 41 |
| Master Portfolio Information | BlackRock Master Small Cap Growth Portfolio |
| As of Period End |
| Ten Largest Holdings | Percent of Net Assets | ||||
Cantel Medical Corp. | 2 | % | |||
PS Business Parks, Inc. | 2 | ||||
Insperity, Inc. | 2 | ||||
Prestige Brands Holdings, Inc. | 2 | ||||
CSG Systems International, Inc. | 2 | ||||
Sanmina Corp. | 2 | ||||
Masimo Corp. | 2 | ||||
Proofpoint, Inc. | 2 | ||||
Tenneco, Inc. | 2 | ||||
Applied Industrial Technologies, Inc. | 2 | ||||
| Sector Allocation | Percent of Net Assets | ||||
Information Technology | 26 | % | |||
Health Care | 22 | ||||
Industrials | 16 | ||||
Consumer Discretionary | 15 | ||||
Financials | 7 | ||||
Real Estate | 5 | ||||
Materials | 4 | ||||
Consumer Staples | 2 | ||||
Utilities | 1 | ||||
Energy | 1 | ||||
Short-Term Securities | 1 | ||||
For Master Portfolio compliance purposes, the Master Portfolio’s sector classifications refer to one or more of the sector sub-classifications used by one or more widely recognized market indexes or ratings group indexes, and/or as defined by the investment adviser. These definitions may not apply for purposes of this report, which may combine such sector sub-classifications for reporting ease.
| 42 | ANNUAL REPORT | MAY 31, 2017 |
| Schedule of Investments May 31, 2017 | BlackRock Master Small Cap Growth Portfolio | |||
| (Percentages shown are based on Net Assets) |
| Common Stocks | Shares | Value | ||||||
Aerospace & Defense — 0.8% | ||||||||
Engility Holdings, Inc. (a) | 10,634 | $ | 279,993 | |||||
HEICO Corp., Class A | 10,780 | 675,367 | ||||||
Vectrus, Inc. (a) | 10,485 | 309,307 | ||||||
|
| |||||||
| 1,264,667 | ||||||||
Air Freight & Logistics — 0.7% | ||||||||
Hub Group, Inc., Class A (a) | 31,747 | 1,138,130 | ||||||
Airlines — 0.9% | ||||||||
Hawaiian Holdings, Inc. (a) | 28,366 | 1,421,137 | ||||||
Auto Components — 2.5% | ||||||||
Cooper-Standard Holdings, Inc. (a) | 4,247 | 458,718 | ||||||
LCI Industries | 3,332 | 296,548 | ||||||
Lear Corp. | 599 | 89,275 | ||||||
Tenneco, Inc. | 43,184 | 2,455,010 | ||||||
Tower International, Inc. | 25,200 | 584,640 | ||||||
|
| |||||||
| 3,884,191 | ||||||||
Banks — 2.4% | ||||||||
Bank of the Ozarks, Inc. | 8,747 | 386,617 | ||||||
Central Pacific Financial Corp. | 43,716 | 1,322,409 | ||||||
First Merchants Corp. | 3,288 | 130,501 | ||||||
Home BancShares, Inc. | 10,874 | 254,560 | ||||||
Wintrust Financial Corp. | 23,354 | 1,605,821 | ||||||
|
| |||||||
| 3,699,908 | ||||||||
Beverages — 0.2% | ||||||||
Primo Water Corp. (a) | 30,631 | 376,455 | ||||||
Biotechnology — 7.1% | ||||||||
Acorda Therapeutics, Inc. (a) | 10,432 | 143,962 | ||||||
Aduro Biotech, Inc. (a) | 9,023 | 90,230 | ||||||
Akebia Therapeutics, Inc. (a) | 3,362 | 45,051 | ||||||
Alder Biopharmaceuticals, Inc. (a) | 13,896 | 213,998 | ||||||
Amicus Therapeutics, Inc. (a) | 7,257 | 58,201 | ||||||
AnaptysBio, Inc. (a) | 6,510 | 166,591 | ||||||
Applied Genetic Technologies Corp. (a) | 17,279 | 89,851 | ||||||
Ardelyx, Inc. (a) | 11,104 | 52,189 | ||||||
Arena Pharmaceuticals, Inc. (a) | 158,400 | 205,920 | ||||||
aTyr Pharma, Inc. (a) | 28,474 | 92,541 | ||||||
BioCryst Pharmaceuticals, Inc. (a) | 7,395 | 38,084 | ||||||
BioSpecifics Technologies Corp. (a) | 3,600 | 186,588 | ||||||
Bluebird Bio, Inc. (a) | 798 | 60,129 | ||||||
Blueprint Medicines Corp. (a) | 1,175 | 42,159 | ||||||
ChemoCentryx, Inc. (a) | 26,077 | 173,151 | ||||||
Clovis Oncology, Inc. (a) | 3,379 | 174,559 | ||||||
Cytokinetics, Inc. (a) | 15,951 | 216,136 | ||||||
CytomX Therapeutics, Inc. (a) | 14,150 | 199,374 | ||||||
Eagle Pharmaceuticals, Inc. (a) | 1,391 | 101,473 | ||||||
Emergent BioSolutions, Inc. (a) | 10,436 | 333,221 | ||||||
Enanta Pharmaceuticals, Inc. (a) | 4,860 | 146,189 | ||||||
Enzon Pharmaceuticals, Inc. | 104,535 | 26,134 | ||||||
EPIRUS Biopharmaceuticals, Inc. (a) | 12,121 | 182 | ||||||
Exact Sciences Corp. (a) | 16,099 | 587,131 | ||||||
Exelixis, Inc. (a) | 31,890 | 596,662 | ||||||
FibroGen, Inc. (a) | 15,574 | 409,596 | ||||||
Five Prime Therapeutics, Inc. (a) | 4,655 | 131,504 | ||||||
Genomic Health, Inc. (a) | 8,056 | 255,859 | ||||||
Halozyme Therapeutics, Inc. (a) | 28,885 | 340,843 | ||||||
Ignyta, Inc. (a) | 9,683 | 68,265 | ||||||
| Common Stocks | Shares | Value | ||||||
Biotechnology (continued) | ||||||||
Immune Design Corp. (a) | 10,534 | $ | 78,478 | |||||
Insmed, Inc. (a) | 1,271 | 19,599 | ||||||
Insys Therapeutics, Inc. (a)(b) | 12,382 | 182,015 | ||||||
Intellia Therapeutics, Inc. (a) | 12,120 | 138,895 | ||||||
Ironwood Pharmaceuticals, Inc. (a) | 30,162 | 534,169 | ||||||
Jounce Therapeutics, Inc. (a) | 7,085 | 143,471 | ||||||
Kite Pharma, Inc. (a) | 5,356 | 387,346 | ||||||
Lexicon Pharmaceuticals, Inc. (a) | 17,625 | 244,106 | ||||||
Ligand Pharmaceuticals, Inc. (a) | 1,960 | 212,229 | ||||||
MiMedx Group, Inc. (a) | 7,195 | 98,428 | ||||||
Myriad Genetics, Inc. (a) | 5,134 | 104,477 | ||||||
Natera, Inc. (a) | 6,825 | 69,888 | ||||||
Peregrine Pharmaceuticals, Inc. (a) | 50,245 | 27,735 | ||||||
Pfenex, Inc. (a) | 17,027 | 69,300 | ||||||
Portola Pharmaceuticals, Inc. (a) | 3,841 | 141,541 | ||||||
Progenics Pharmaceuticals, Inc. (a) | 4,414 | 28,117 | ||||||
Prothena Corp. PLC (a) | 3,875 | 197,664 | ||||||
Puma Biotechnology, Inc. (a) | 2,801 | 214,277 | ||||||
Ra Pharmaceuticals, Inc. (a) | 5,109 | 122,718 | ||||||
Radius Health, Inc. (a) | 1,295 | 44,833 | ||||||
Repligen Corp. (a) | 9,636 | 378,117 | ||||||
Retrophin, Inc. (a) | 9,378 | 148,641 | ||||||
Rigel Pharmaceuticals, Inc. (a) | 54,807 | 125,508 | ||||||
Sage Therapeutics, Inc. (a) | 2,944 | 194,628 | ||||||
Sangamo Therapeutics, Inc. (a) | 25,336 | 172,285 | ||||||
Sarepta Therapeutics, Inc. (a) | 4,058 | 121,091 | ||||||
Seres Therapeutics, Inc. (a) | 4,326 | 39,453 | ||||||
Spark Therapeutics, Inc. (a) | 617 | 31,424 | ||||||
Spectrum Pharmaceuticals, Inc. (a) | 24,848 | 140,640 | ||||||
TESARO, Inc. (a) | 3,840 | 573,350 | ||||||
Ultragenyx Pharmaceutical, Inc. (a) | 4,151 | 223,531 | ||||||
United Therapeutics Corp. (a) | 697 | 84,260 | ||||||
Vanda Pharmaceuticals, Inc. (a) | 17,149 | 235,799 | ||||||
vTv Therapeutics, Inc., Class A (a) | 2,860 | 14,243 | ||||||
Xencor, Inc. (a) | 12,516 | 256,578 | ||||||
ZIOPHARM Oncology, Inc. (a)(b) | 4,705 | 27,524 | ||||||
|
| |||||||
| 11,072,131 | ||||||||
Building Products — 3.0% | ||||||||
Apogee Enterprises, Inc. | 39,257 | 2,091,613 | ||||||
Continental Building Products, Inc. (a) | 8,056 | 196,566 | ||||||
Ply Gem Holdings, Inc. (a) | 6,777 | 110,804 | ||||||
Universal Forest Products, Inc. | 26,028 | 2,288,642 | ||||||
|
| |||||||
| 4,687,625 | ||||||||
Capital Markets — 1.9% | ||||||||
Evercore Partners, Inc., Class A | 24,627 | 1,669,711 | ||||||
Houlihan Lokey, Inc. | 12,894 | 432,852 | ||||||
Moelis & Co., Class A | 25,404 | 891,680 | ||||||
|
| |||||||
| 2,994,243 | ||||||||
Chemicals — 2.6% | ||||||||
Chemours Co. | 22,171 | 886,618 | ||||||
Innospec, Inc. | 1,430 | 91,520 | ||||||
OMNOVA Solutions, Inc. (a) | 20,152 | 174,315 | ||||||
PolyOne Corp. | 55,511 | 2,072,781 | ||||||
Sensient Technologies Corp. | 3,726 | 299,161 | ||||||
Stepan Co. | 4,364 | 369,282 | ||||||
| Portfolio Abbreviation | ||
| CVR | Contingent Value Rights | |
See Notes to Financial Statements.
| ANNUAL REPORT | MAY 31, 2017 | 43 |
| Schedule of Investments (continued) | BlackRock Master Small Cap Growth Portfolio | |||
| Common Stocks | Shares | Value | ||||||
Chemicals (continued) | ||||||||
Trinseo SA | 2,879 | $ | 185,552 | |||||
|
| |||||||
| 4,079,229 | ||||||||
Commercial Services & Supplies — 2.0% | ||||||||
ACCO Brands Corp. (a) | 6,016 | 68,282 | ||||||
ARC Document Solutions, Inc. (a) | 74,069 | 245,168 | ||||||
Brink’s Co. | 3,029 | 191,130 | ||||||
Casella Waste Systems, Inc., Class A (a) | 14,460 | 202,729 | ||||||
InnerWorkings, Inc. (a) | 11,928 | 129,300 | ||||||
Kimball International, Inc., Class B | 3,227 | 55,440 | ||||||
Quad/Graphics, Inc. | 3,021 | 67,278 | ||||||
Steelcase, Inc., Class A | 9,951 | 166,679 | ||||||
Tetra Tech, Inc. | 43,755 | 2,010,542 | ||||||
|
| |||||||
| 3,136,548 | ||||||||
Communications Equipment — 1.6% | ||||||||
Black Box Corp. | 4,663 | 38,237 | ||||||
Calix, Inc. (a) | 15,889 | 104,073 | ||||||
Ciena Corp. (a) | 11,760 | 276,125 | ||||||
InterDigital, Inc. | 19,113 | 1,548,153 | ||||||
NETGEAR, Inc. (a) | 3,311 | 138,896 | ||||||
Ubiquiti Networks, Inc. (a) | 6,914 | 326,064 | ||||||
|
| |||||||
| 2,431,548 | ||||||||
Construction & Engineering — 2.0% | ||||||||
Comfort Systems U.S.A., Inc. | 34,314 | 1,182,117 | ||||||
MasTec, Inc. (a) | 45,785 | 1,941,284 | ||||||
|
| |||||||
| 3,123,401 | ||||||||
Construction Materials — 0.1% | ||||||||
US Concrete, Inc. (a) | 2,322 | 153,484 | ||||||
Consumer Finance — 0.4% | ||||||||
Consumer Portfolio Services, Inc. (a) | 34,136 | 142,688 | ||||||
Enova International, Inc. (a) | 30,702 | 408,337 | ||||||
|
| |||||||
| 551,025 | ||||||||
Diversified Consumer Services — 0.5% | ||||||||
Capella Education Co. | 4,650 | 402,458 | ||||||
Collectors Universe, Inc. | 10,518 | 263,476 | ||||||
K12, Inc. (a) | 5,127 | 96,541 | ||||||
|
| |||||||
| 762,475 | ||||||||
Diversified Telecommunication Services — 0.3% | ||||||||
FairPoint Communications, Inc. (a) | 2,885 | 41,544 | ||||||
Ooma, Inc. (a) | 7,536 | 63,679 | ||||||
Windstream Holdings, Inc. | 80,091 | 340,387 | ||||||
|
| |||||||
| 445,610 | ||||||||
Electronic Equipment, Instruments & Components — 3.8% | ||||||||
Benchmark Electronics, Inc. (a) | 1,265 | 40,860 | ||||||
Insight Enterprises, Inc. (a) | 529 | 21,975 | ||||||
KEMET Corp. (a) | 35,392 | 488,410 | ||||||
PC Connection, Inc. | 3,439 | 89,689 | ||||||
PCM, Inc. (a) | 1,913 | 37,686 | ||||||
Sanmina Corp. (a) | 69,956 | 2,560,390 | ||||||
SYNNEX Corp. | 12,633 | 1,405,548 | ||||||
Tech Data Corp. (a) | 13,260 | 1,285,822 | ||||||
|
| |||||||
| 5,930,380 | ||||||||
Energy Equipment & Services — 0.0% | ||||||||
Aspen Aerogels, Inc. (a) | 16 | 72 | ||||||
Pioneer Energy Services Corp. (a) | 18,005 | 44,112 | ||||||
|
| |||||||
| 44,184 | ||||||||
Equity Real Estate Investment Trusts (REITs) — 5.1% | ||||||||
American Assets Trust, Inc. | 4,041 | 157,801 | ||||||
Ashford Hospitality Prime, Inc. | 1,804 | 17,354 | ||||||
| Common Stocks | Shares | Value | ||||||
Equity Real Estate Investment Trusts (REITs) (continued) | ||||||||
CoreSite Realty Corp. | 537 | $ | 56,535 | |||||
DCT Industrial Trust, Inc. | 5,284 | 278,520 | ||||||
DuPont Fabros Technology, Inc. | 1,343 | 73,368 | ||||||
First Industrial Realty Trust, Inc. | 14,859 | 429,128 | ||||||
PS Business Parks, Inc. | 24,715 | 3,121,010 | ||||||
QTS Realty Trust, Inc., Class A | 5,968 | 311,649 | ||||||
Ramco-Gershenson Properties Trust | 84,433 | 1,063,011 | ||||||
Retail Opportunity Investments Corp. | 60,364 | 1,192,793 | ||||||
Ryman Hospitality Properties, Inc. | 10,443 | 672,634 | ||||||
Summit Hotel Properties, Inc. | 29,775 | 532,972 | ||||||
|
| |||||||
| 7,906,775 | ||||||||
Food & Staples Retailing — 0.4% | ||||||||
Performance Food Group Co. (a) | 12,820 | 362,806 | ||||||
SpartanNash Co. | 6,487 | 193,313 | ||||||
|
| |||||||
| 556,119 | ||||||||
Food Products — 0.9% | ||||||||
Dean Foods Co. | 56,237 | 1,025,763 | ||||||
Fresh Del Monte Produce, Inc. | 3,758 | 190,455 | ||||||
Sanderson Farms, Inc. | 2,009 | 238,468 | ||||||
|
| |||||||
| 1,454,686 | ||||||||
Gas Utilities — 1.0% | ||||||||
Southwest Gas Holdings, Inc. | 20,356 | 1,619,727 | ||||||
Health Care Equipment & Supplies — 5.4% | ||||||||
AngioDynamics, Inc. (a) | 6,710 | 101,187 | ||||||
Cantel Medical Corp. | 41,922 | 3,262,370 | ||||||
Cardiovascular Systems, Inc. (a) | 8,667 | 260,270 | ||||||
Cutera, Inc. (a) | 9,891 | 225,515 | ||||||
Inogen, Inc. (a) | 9,915 | 878,866 | ||||||
LeMaitre Vascular, Inc. | 15,602 | 476,797 | ||||||
Masimo Corp. (a) | 29,160 | 2,538,086 | ||||||
Neogen Corp. (a) | 4,005 | 253,476 | ||||||
RTI Surgical, Inc. (a) | 59,350 | 305,652 | ||||||
SeaSpine Holdings Corp. (a) | 14,073 | 140,589 | ||||||
|
| |||||||
| 8,442,808 | ||||||||
Health Care Providers & Services — 1.4% | ||||||||
Cross Country Healthcare, Inc. (a) | 12,381 | 143,001 | ||||||
Five Star Senior Living, Inc. (a) | 60,109 | 108,196 | ||||||
LHC Group, Inc. (a) | 5,950 | 358,190 | ||||||
National Research Corp., Class A | 128 | 3,072 | ||||||
UnitedHealth Group, Inc. | 2,122 | 371,732 | ||||||
WellCare Health Plans, Inc. (a) | 7,063 | 1,213,423 | ||||||
|
| |||||||
| 2,197,614 | ||||||||
Health Care Technology — 1.4% | ||||||||
Medidata Solutions, Inc. (a) | 19,180 | 1,365,232 | ||||||
Vocera Communications, Inc. (a) | 27,766 | 742,185 | ||||||
|
| |||||||
| 2,107,417 | ||||||||
Hotels, Restaurants & Leisure — 4.2% | ||||||||
Bloomin’ Brands, Inc. | 15,658 | 313,630 | ||||||
Bravo Brio Restaurant Group, Inc. (a) | 11,369 | 53,434 | ||||||
Caesars Entertainment Corp. (a)(b) | 39,146 | 428,649 | ||||||
Carrols Restaurant Group, Inc. (a) | 39,320 | 465,942 | ||||||
Cheesecake Factory, Inc. | 27,633 | 1,629,794 | ||||||
J. Alexander’s Holdings, Inc. (a) | 19,728 | 223,913 | ||||||
Monarch Casino & Resort, Inc. (a) | 666 | 20,080 | ||||||
Papa John’s International, Inc. | 13,170 | 1,061,107 | ||||||
Ruth’s Hospitality Group, Inc. | 12,746 | 275,314 | ||||||
Vail Resorts, Inc. | 9,241 | 1,976,650 | ||||||
|
| |||||||
| 6,448,513 | ||||||||
Household Durables — 2.9% | ||||||||
Century Communities, Inc. (a) | 16,212 | 403,679 | ||||||
See Notes to Financial Statements.
| 44 | ANNUAL REPORT | MAY 31, 2017 |
| Schedule of Investments (continued) | BlackRock Master Small Cap Growth Portfolio | |||
| Common Stocks | Shares | Value | ||||||
Household Durables (continued) | ||||||||
iRobot Corp. (a) | 20,698 | $ | 1,919,119 | |||||
La-Z-Boy, Inc. | 2,666 | 70,649 | ||||||
Taylor Morrison Home Corp., Class A (a) | 55,007 | 1,278,913 | ||||||
TopBuild Corp. (a) | 10,423 | 558,152 | ||||||
ZAGG, Inc. (a) | 30,017 | 250,642 | ||||||
|
| |||||||
| 4,481,154 | ||||||||
Household Products — 0.3% | ||||||||
Central Garden & Pet Co. (a) | 7,600 | 227,392 | ||||||
Central Garden & Pet Co., Class A (a) | 7,843 | 226,741 | ||||||
|
| |||||||
| 454,133 | ||||||||
Industrial Conglomerates — 0.2% | ||||||||
Raven Industries, Inc. | 8,368 | 283,257 | ||||||
Insurance — 0.2% | ||||||||
Argo Group International Holdings Ltd. | 5,272 | 326,337 | ||||||
Selective Insurance Group, Inc. | 332 | 16,965 | ||||||
State National Cos., Inc. | 3 | 53 | ||||||
|
| |||||||
| 343,355 | ||||||||
Internet & Direct Marketing Retail — 0.2% | ||||||||
Nutrisystem, Inc. | 2,105 | 109,565 | ||||||
Overstock.com, Inc. (a) | 9,823 | 138,013 | ||||||
PetMed Express, Inc. | 2,960 | 103,866 | ||||||
|
| |||||||
| 351,444 | ||||||||
Internet Software & Services — 3.6% | ||||||||
Alteryx, Inc., Class A (a) | 5,072 | 95,658 | ||||||
Bankrate, Inc. (a) | 24,168 | 252,556 | ||||||
Box, Inc., Class A (a) | 17,431 | 325,960 | ||||||
Carbonite, Inc. (a) | 2,614 | 48,620 | ||||||
Care.com, Inc. (a) | 2,171 | 33,368 | ||||||
Cornerstone OnDemand, Inc. (a) | 31,303 | 1,169,480 | ||||||
Five9, Inc. (a) | 16,447 | 369,564 | ||||||
Limelight Networks, Inc. (a) | 112,423 | 331,648 | ||||||
MuleSoft, Inc., Class A (a) | 1,738 | 45,223 | ||||||
New Relic, Inc. (a) | 2,119 | 92,537 | ||||||
NIC, Inc. | 7,104 | 143,856 | ||||||
Okta, Inc. (a) | 6,239 | 162,838 | ||||||
QuinStreet, Inc. (a) | 188,588 | 732,664 | ||||||
Shutterstock, Inc. (a) | 922 | 42,928 | ||||||
Support.com, Inc. (a) | 9,373 | 22,776 | ||||||
Trade Desk, Inc., Class A (a) | 1,857 | 102,135 | ||||||
TrueCar, Inc. (a) | 1,826 | 32,101 | ||||||
Web.com Group, Inc. (a) | 19,897 | 452,657 | ||||||
Wix.com Ltd. (a) | 14,144 | 1,042,413 | ||||||
|
| |||||||
| 5,498,982 | ||||||||
IT Services — 3.5% | ||||||||
Acxiom Corp. (a) | 4,158 | 108,940 | ||||||
Convergys Corp. | 55,285 | 1,343,978 | ||||||
CSG Systems International, Inc. | 64,257 | 2,563,212 | ||||||
Everi Holdings, Inc. (a) | 29,321 | 196,157 | ||||||
Hackett Group, Inc. | 41,218 | 604,256 | ||||||
Unisys Corp. (a) | 44,920 | 530,056 | ||||||
|
| |||||||
| 5,346,599 | ||||||||
Leisure Products — 0.5% | ||||||||
Brunswick Corp. | 11,853 | 654,997 | ||||||
Malibu Boats, Inc., Class A (a) | 1,898 | 46,026 | ||||||
MCBC Holdings, Inc. | 3,412 | 65,613 | ||||||
|
| |||||||
| 766,636 | ||||||||
Life Sciences Tools & Services — 2.0% | ||||||||
Cambrex Corp. (a) | 8,079 | 434,650 | ||||||
Enzo Biochem, Inc. (a) | 22,926 | 206,334 | ||||||
Harvard Bioscience, Inc. (a) | 43,539 | 100,140 | ||||||
| Common Stocks | Shares | Value | ||||||
Life Sciences Tools & Services (continued) | ||||||||
INC Research Holdings, Inc., Class A (a) | 9,577 | $ | 544,452 | |||||
Luminex Corp. | 10,193 | 206,510 | ||||||
Medpace Holdings, Inc. (a) | 2,369 | 65,906 | ||||||
NanoString Technologies, Inc. (a) | 11,117 | 203,886 | ||||||
PAREXEL International Corp. (a) | 10,682 | 863,319 | ||||||
PRA Health Sciences, Inc. (a) | 6,336 | 457,776 | ||||||
|
| |||||||
| 3,082,973 | ||||||||
Machinery — 2.0% | ||||||||
Barnes Group, Inc. | 550 | 31,125 | ||||||
Briggs & Stratton Corp. | 16,300 | 387,614 | ||||||
Commercial Vehicle Group, Inc. (a) | 18,240 | 147,379 | ||||||
Mueller Water Products, Inc., Class A | 176,111 | 1,968,921 | ||||||
Supreme Industries, Inc., Class A | 3,850 | 68,222 | ||||||
Woodward, Inc. | 6,549 | 446,118 | ||||||
|
| |||||||
| 3,049,379 | ||||||||
Media — 0.4% | ||||||||
Entercom Communications Corp., Class A | 2,906 | 29,932 | ||||||
Harte-Hanks, Inc. (a) | 40,021 | 51,227 | ||||||
Meredith Corp. | 9,390 | 507,999 | ||||||
New Media Investment Group, Inc. | 1,308 | 16,912 | ||||||
|
| |||||||
| 606,070 | ||||||||
Metals & Mining — 1.2% | ||||||||
Ryerson Holding Corp. (a) | 3,585 | 29,935 | ||||||
Schnitzer Steel Industries, Inc., Class A | 6,116 | 118,039 | ||||||
Worthington Industries, Inc. | 41,832 | 1,755,689 | ||||||
|
| |||||||
| 1,903,663 | ||||||||
Multiline Retail — 1.3% | ||||||||
Big Lots, Inc. | 40,213 | 1,963,601 | ||||||
Oil, Gas & Consumable Fuels — 0.3% | ||||||||
Bill Barrett Corp. (a) | 28,793 | 99,624 | ||||||
Carrizo Oil & Gas, Inc. (a) | 11,248 | 246,781 | ||||||
Eclipse Resources Corp. (a) | 18,506 | 41,453 | ||||||
EP Energy Corp., Class A (a)(b) | 20,236 | 85,194 | ||||||
Evolution Petroleum Corp. | 6,847 | 49,983 | ||||||
Northern Oil and Gas, Inc. (a)(b) | 4,159 | 6,862 | ||||||
|
| |||||||
| 529,897 | ||||||||
Paper & Forest Products — 0.1% | ||||||||
Boise Cascade Co. (a) | 4,522 | 121,868 | ||||||
Louisiana-Pacific Corp. (a) | 4,079 | 90,880 | ||||||
|
| |||||||
| 212,748 | ||||||||
Personal Products — 0.0% | ||||||||
Natural Health Trends Corp. (b) | 1,235 | 34,406 | ||||||
Pharmaceuticals — 4.5% | ||||||||
Aerie Pharmaceuticals, Inc. (a) | 520 | 28,834 | ||||||
Catalent, Inc. (a) | 37,144 | 1,319,726 | ||||||
Corcept Therapeutics, Inc. (a) | 68,081 | 769,996 | ||||||
Heska Corp. (a) | 2,563 | 252,866 | ||||||
Innoviva, Inc. (a) | 40,530 | 495,277 | ||||||
Juniper Pharmaceuticals, Inc. (a) | 19,563 | 84,121 | ||||||
Phibro Animal Health Corp., Class A | 837 | 29,504 | ||||||
Prestige Brands Holdings, Inc. (a) | 51,735 | 2,606,409 | ||||||
SciClone Pharmaceuticals, Inc. (a) | 52,669 | 500,355 | ||||||
Supernus Pharmaceuticals, Inc. (a) | 22,158 | 833,141 | ||||||
|
| |||||||
| 6,920,229 | ||||||||
Professional Services — 2.1% | ||||||||
Insperity, Inc. | 34,892 | 2,632,601 | ||||||
Kforce, Inc. | 13,691 | 246,438 | ||||||
RPX Corp. (a) | 26,890 | 356,024 | ||||||
|
| |||||||
| 3,235,063 | ||||||||
See Notes to Financial Statements.
| ANNUAL REPORT | MAY 31, 2017 | 45 |
| Schedule of Investments (continued) | BlackRock Master Small Cap Growth Portfolio | |||
| Common Stocks | Shares | Value | ||||||
Real Estate Management & Development — 0.1% | ||||||||
RE/MAX Holdings, Inc., Class A | 1,122 | $ | 59,634 | |||||
RMR Group, Inc., Class A | 709 | 34,812 | ||||||
|
| |||||||
| 94,446 | ||||||||
Road & Rail — 0.1% | ||||||||
YRC Worldwide, Inc. (a) | 14,208 | 130,572 | ||||||
Semiconductors & Semiconductor Equipment — 6.1% | ||||||||
Advanced Energy Industries, Inc. (a) | 18,703 | 1,438,822 | ||||||
Advanced Micro Devices, Inc. (a) | 54,328 | 607,930 | ||||||
Alpha & Omega Semiconductor Ltd. (a) | 25,847 | 481,271 | ||||||
Brooks Automation, Inc. | 5,664 | 156,043 | ||||||
Cavium, Inc. (a) | 1,263 | 92,161 | ||||||
Cirrus Logic, Inc. (a) | 8,690 | 573,106 | ||||||
Entegris, Inc. (a) | 43,678 | 1,078,847 | ||||||
IXYS Corp. | 972 | 14,337 | ||||||
Microsemi Corp. (a) | 25,641 | 1,259,230 | ||||||
Power Integrations, Inc. | 5,956 | 398,754 | ||||||
Rudolph Technologies, Inc. (a) | 3 | 72 | ||||||
Semtech Corp. (a) | 35,356 | 1,350,599 | ||||||
Synaptics, Inc. (a) | 24,087 | 1,338,274 | ||||||
Ultra Clean Holdings, Inc. (a) | 27,922 | 637,738 | ||||||
|
| |||||||
| 9,427,184 | ||||||||
Software — 7.7% | ||||||||
A10 Networks, Inc. (a) | 101,444 | 828,797 | ||||||
American Software, Inc., Class A | 7,737 | 83,095 | ||||||
Aspen Technology, Inc. (a) | 19,296 | 1,180,143 | ||||||
Barracuda Networks, Inc. (a) | 9,064 | 198,683 | ||||||
Bottomline Technologies, Inc. (a) | 5,550 | 138,806 | ||||||
Cloudera, Inc. (a) | 8,061 | 167,266 | ||||||
CommVault Systems, Inc. (a) | 2,870 | 161,079 | ||||||
Exa Corp. (a) | 3,787 | 52,601 | ||||||
Imperva, Inc. (a) | 6,829 | 337,353 | ||||||
MicroStrategy, Inc., Class A (a) | 10,733 | 1,957,270 | ||||||
MobileIron, Inc. (a) | 8,357 | 45,128 | ||||||
Paycom Software, Inc. (a) | 3,965 | 259,470 | ||||||
Paylocity Holding Corp. (a) | 1,877 | 87,937 | ||||||
Proofpoint, Inc. (a) | 28,826 | 2,479,036 | ||||||
RingCentral, Inc., Class A (a) | 33,428 | 1,139,895 | ||||||
Take-Two Interactive Software, Inc. (a) | 27,108 | 2,080,268 | ||||||
Varonis Systems, Inc. (a) | 10,766 | 391,344 | ||||||
Zendesk, Inc. (a) | 897 | 23,304 | ||||||
Zix Corp. (a) | 41,959 | 242,103 | ||||||
|
| |||||||
| 11,853,578 | ||||||||
Specialty Retail — 1.9% | ||||||||
Aaron’s, Inc. (a) | 17,593 | 642,496 | ||||||
Asbury Automotive Group, Inc. (a) | 12,858 | 719,405 | ||||||
Big 5 Sporting Goods Corp. | 69,328 | 963,659 | ||||||
Burlington Stores, Inc. (a) | 2,608 | 255,193 | ||||||
Haverty Furniture Cos., Inc. | 9,098 | 217,897 | ||||||
New York & Co., Inc. (a) | 12,449 | 18,425 | ||||||
Select Comfort Corp. (a) | 5,944 | 171,187 | ||||||
|
| |||||||
| 2,988,262 | ||||||||
Technology Hardware, Storage & Peripherals — 0.3% | ||||||||
Quantum Corp. (a) | 41,802 | 354,899 | ||||||
Super Micro Computer, Inc. (a) | 1,947 | 47,896 | ||||||
|
| |||||||
| 402,795 | ||||||||
Textiles, Apparel & Luxury Goods — 0.5% | ||||||||
Culp, Inc. | 19,085 | 612,629 | ||||||
Perry Ellis International, Inc. (a) | 5,538 | 101,567 | ||||||
|
| |||||||
| 714,196 | ||||||||
Thrifts & Mortgage Finance — 1.3% | ||||||||
Essent Group Ltd. (a) | 24,334 | 882,594 | ||||||
| Common Stocks | Shares | Value | ||||||
Thrifts & Mortgage Finance (continued) | ||||||||
EverBank Financial Corp. | 3 | $ | 58 | |||||
First Defiance Financial Corp. | 4,638 | 241,640 | ||||||
Walker & Dunlop, Inc. (a) | 18,732 | 874,972 | ||||||
|
| |||||||
| 1,999,264 | ||||||||
Tobacco — 0.2% | ||||||||
Universal Corp. | 4,651 | 308,826 | ||||||
Trading Companies & Distributors — 2.2% | ||||||||
Applied Industrial Technologies, Inc. | 37,623 | 2,323,220 | ||||||
GMS, Inc. (a) | 14,186 | 463,315 | ||||||
MRC Global, Inc. (a) | 32,541 | 587,365 | ||||||
Neff Corp., Class A (a) | 1,568 | 26,656 | ||||||
Univar, Inc. (a) | 1,007 | 30,633 | ||||||
|
| |||||||
| 3,431,189 | ||||||||
Water Utilities — 0.0% | ||||||||
California Water Service Group | 2 | 69 | ||||||
Total Common Stocks — 98.3% | 152,344,000 | |||||||
| Preferred Stocks | ||||||||
Household Durables — 0.0% | ||||||||
AliphCom: | ||||||||
Series 6 (Acquired 6/03/14, | 2,066 | — | ||||||
Series 8 (Acquired 8/31/15, | 49,410 | — | ||||||
|
| |||||||
| — | ||||||||
Software — 0.9% | ||||||||
Illumio Inc., Series C (Acquired 3/10/15, | 77,790 | 249,706 | ||||||
MongoDB: | ||||||||
Series C (Acquired 12/19/13, | 15,128 | 343,557 | ||||||
Series D (Acquired 12/19/13, | 4,706 | 106,873 | ||||||
Series E (Acquired 12/19/13, | 166 | 3,770 | ||||||
Palantir Technologies, Inc., Series I (Acquired 2/06/14, cost $500,000) (a)(c)(d) | 81,566 | 659,869 | ||||||
|
| |||||||
| 1,363,775 | ||||||||
Total Preferred Stocks — 0.9% | 1,363,775 | |||||||
| Rights | ||||||||
Biotechnology — 0.0% | ||||||||
Dyax Corp. — CVR (a)(c) | 35,077 | 80,326 | ||||||
Pharmaceuticals — 0.0% | ||||||||
Durata Therapeutics, Inc. — CVR (a)(c) | 1,930 | — | ||||||
Total Rights — 0.0% | 80,326 | |||||||
Total Long-Term Investments (Cost — $136,002,248) — 99.2% | 153,788,101 | |||||||
See Notes to Financial Statements.
| 46 | ANNUAL REPORT | MAY 31, 2017 |
| Schedule of Investments (continued) | BlackRock Master Small Cap Growth Portfolio |
| Short-Term Securities | Shares | Value | ||||||
BlackRock Liquidity Funds, T-Fund, Institutional Class, 0.67% (e)(f) | 1,188,100 | $ | 1,188,100 | |||||
SL Liquidity Series, LLC, Money Market | 593,847 | 593,966 | ||||||
Total Short-Term Securities (Cost — $1,782,010) — 1.2% |
| 1,782,066 | ||||||
Total Investments (Cost — $137,784,258) — 100.4% |
| 155,570,167 | ||||||
Liabilities in Excess of Other Assets — (0.4)% |
| (591,848 | ) | |||||
|
| |||||||
Net Assets — 100.0% | $ | 154,978,319 | ||||||
|
| |||||||
| Notes to Schedule of Investments |
| (a) | Non-income producing security. |
| (b) | Security, or a portion of the security, is on loan. |
| (c) | Security is valued using significant unobservable inputs and is classified as Level 3 in the fair value hierarchy. |
| (d) | Restricted security as to resale, excluding 144A securities. The Master Portfolio held restricted securities with a current value of $1,363,775, representing 0.1% of its net assets as of period end, and an original cost of $1,547,037. |
| (e) | Current yield as of period end. |
| (f) | During the year ended May 31, 2017, investments in issuers considered to be affiliates of the Master Portfolio for purposes of Section 2(a)(3) of the Investment Company Act of 1940, as amended, were as follows: |
| Affiliate | Shares Held at May 31, 2016 | Net Activity | Shares Held at May 31, 2017 | Value at 2017 | Income | Net Realized Gain1 | Change in Unrealized Appreciation | |||||||||||||||||||||
BlackRock Liquidity Funds, TempFund, Institutional Class | 1,508,954 | (1,508,954 | ) | — | — | $ | 1,259 | — | — | |||||||||||||||||||
BlackRock Liquidity Funds, T-Fund, Institutional Class | — | 1,188,100 | 1,188,100 | $1,188,100 | 3,759 | $ 5 | — | |||||||||||||||||||||
SL Liquidity Series, LLC, Money Market Series | 1,600,704 | (1,006,857 | ) | 593,847 | 593,966 | 140,769 | 2 | 117 | $56 | |||||||||||||||||||
Total | $1,782,066 | $ | 145,787 | $122 | $56 | |||||||||||||||||||||||
|
| |||||||||||||||||||||||||||
| 1 | Includes net capital gain distributions. |
| 2 | Represents securities lending income earned from the reinvestment of cash collateral from loaned securities, net of fees and collateral investment expenses, and other payments to and from borrowers of securities. |
| (g) | Security was purchased with the cash collateral from loaned securities. |
| • | For Master Portfolio compliance purposes, the Master Portfolio’s industry classifications refer to one or more of the industry sub-classifications used by one or more widely recognized market indexes or ratings group indexes, and/or as defined by the investment adviser. These definitions may not apply for purposes of this report, which may combine such industry sub-classifications for reporting ease. |
| Derivative Financial Instruments Outstanding as of Period End |
| Futures Contracts | ||||||||||||
| Contracts Long | Issue | Expiration | Notional Value | Unrealized Depreciation | ||||||||
| 22 | Russell 2000 Mini Index | June 2017 | $1,506,010 | $(18,241) | ||||||||
| Derivative Financial Instruments Categorized by Risk Exposure |
As of period end, fair values of derivative financial instruments located in the Statement of Assets and Liabilities were as follows:
| Commodity Contracts | Credit Contracts | Equity Contracts | Foreign Currency Exchange Contracts | Interest Rate Contracts | Other Contracts | Total | ||||||||||||||||||||||||
Liabilities – Derivative Financial Instruments | ||||||||||||||||||||||||||||||
Futures contracts | Net unrealized depreciation1 | — | — | $18,241 | — | — | — | $18,241 | ||||||||||||||||||||||
| 1 | Includes cumulative appreciation (depreciation) on futures contracts, if any, as reported in the Schedule of Investments. Only current day’s variation margin is reported within the Statements of Assets and Liabilities. |
See Notes to Financial Statements.
| ANNUAL REPORT | MAY 31, 2017 | 47 |
| Schedule of Investments (concluded) | BlackRock Master Small Cap Growth Portfolio |
For the year ended May 31, 2017, the effect of derivative financial instruments in the Statement of Operations was as follows:
| Net Realized Gain from: | Commodity Contracts | Credit Contracts | Equity Contracts | Foreign Currency Exchange Contracts | Interest Rate Contracts | Other Contracts | Total | |||||||||||||||||
Futures contracts | — | — | $529,289 | — | — | — | $529,289 | |||||||||||||||||
Net Change in Unrealized Depreciation on: | ||||||||||||||||||||||||
Futures contracts | — | — | $(79,000) | — | — | — | $(79,000) | |||||||||||||||||
| Average Quarterly Balances of Outstanding Derivative Financial Instruments: |
Futures contracts: | ||||
Average notional value of contracts - long | $ | 1,614,358 |
For more information about the Master Portfolio’s investment risks regarding derivative financial instruments, refer to the Notes to Financial Statements.
| Fair Value Hierarchy as of Period End |
Various inputs are used in determining the fair value of investments and derivative financial instruments. For information about the Master Portfolio’s policy regarding valuation of investments and derivative financial instruments, refer to the Notes to Financial Statements.
The following tables summarize the Master Portfolio’s investments and derivative financial instruments categorized in the disclosure hierarchy:
| Level 1 | Level 2 | Level 3 | Total | |||||||||||||
Assets: | ||||||||||||||||
Investments: | ||||||||||||||||
Long-Term Investments: | ||||||||||||||||
Common Stocks1 | $ | 152,344,000 | — | — | $ | 152,344,000 | ||||||||||
Preferred Stocks1 | — | — | $ | 1,363,775 | 1,363,775 | |||||||||||
Rights1 | — | — | 80,326 | 80,326 | ||||||||||||
Short-Term Securities | 1,188,100 | — | — | 1,188,100 | ||||||||||||
|
| |||||||||||||||
Subtotal | $ | 153,532,100 | — | $ | 1,444,101 | $ | 154,976,201 | |||||||||
|
| |||||||||||||||
Investments Valued at NAV2 | 593,966 | |||||||||||||||
|
| |||||||||||||||
Total Investments | $ | 155,570,167 | ||||||||||||||
|
| |||||||||||||||
Derivative Financial Instruments3 | ||||||||||||||||
Liabilities: | ||||||||||||||||
Equity contracts | $ | (18,241 | ) | — | — | $ | (18,241 | ) | ||||||||
| 1 | See above Schedule of Investments for values in each industry. |
| 2 | As of May 31, 2017, certain of the Master Portfolio’s investments were valued using NAV per share as no quoted market value is available and therefore have been excluded from the fair value hierarchy. |
| 3 | Derivative financial instruments are futures contracts, which are valued at the unrealized appreciation (depreciation) on the instrument. |
During the year ended May 31, 2017, there were no transfers between levels.
See Notes to Financial Statements.
| 48 | ANNUAL REPORT | MAY 31, 2017 |
| Statement of Assets and Liabilities | BlackRock Master Small Cap Growth Portfolio |
| May 31, 2017 | ||||
| Assets | ||||
Investments at value — unaffiliated (including securities loaned at value of $563,497) (cost — $136,002,248) | $ | 153,788,101 | ||
Investments at value — affiliated (cost — $1,782,010) | 1,782,066 | |||
Cash | 29,031 | |||
Cash pledged for futures contracts | 72,000 | |||
Receivables: | ||||
Investments sold — unaffiliated | 2,218,681 | |||
Securities lending income — affiliated | 7,357 | |||
Dividends — affiliated | 663 | |||
Dividends — unaffiliated | 92,865 | |||
Prepaid expenses | 345 | |||
|
| |||
Total assets | 157,991,109 | |||
|
| |||
| Liabilities | ||||
Cash collateral on securities loaned at value | 593,793 | |||
Payables: | ||||
Investments purchased — unaffiliated | 2,046,038 | |||
Directors’ fees | 2,121 | |||
Investment advisory fees | 58,553 | |||
Other accrued expenses | 86,704 | |||
Other affiliates | 1,389 | |||
Withdrawals to investors | 222,134 | |||
Variation margin on futures contracts | 2,058 | |||
|
| |||
Total liabilities | 3,012,790 | |||
|
| |||
Net Assets | $ | 154,978,319 | ||
|
| |||
| Net Assets Consist of | ||||
Investors’ capital | $ | 137,210,651 | ||
Net unrealized appreciation | 17,767,668 | |||
|
| |||
Net Assets | $ | 154,978,319 | ||
|
| |||
See Notes to Financial Statements.
| ANNUAL REPORT | MAY 31, 2017 | 49 |
| Statement of Operations | BlackRock Master Small Cap Growth Portfolio |
Year Ended May 31, 2017
| ||||
| Investment Income | ||||
Dividends — affiliated | $ | 5,018 | ||
Dividends — unaffiliated | 1,310,429 | |||
Securities lending — affiliated — net | 140,769 | |||
|
| |||
Total investment income | 1,456,216 | |||
|
| |||
| Expenses | ||||
Investment advisory | 1,134,624 | |||
Custodian | 62,490 | |||
Accounting services | 38,866 | |||
Professional | 31,284 | |||
Directors | 12,155 | |||
Printing | 5,265 | |||
Miscellaneous | 28,019 | |||
|
| |||
Total expenses | 1,312,703 | |||
Less fees waived by the Manager | (340,498 | ) | ||
|
| |||
Total expenses after fees waived | 972,205 | �� | ||
|
| |||
Net investment income | 484,011 | |||
|
| |||
| Realized and Unrealized Gain (Loss) | ||||
Net realized gain from: | ||||
Investments — unaffiliated | 16,209,959 | |||
Investments — affiliated | 117 | |||
Capital gain distributions from investment companies — affiliated | 5 | |||
Futures contracts | 529,289 | |||
|
| |||
| 16,739,370 | ||||
|
| |||
Net change in unrealized appreciation (depreciation) on: | ||||
Investments — unaffiliated | 12,078,001 | |||
Investments — affiliated | 56 | |||
Futures contracts | (79,000 | ) | ||
|
| |||
| 11,999,057 | ||||
|
| |||
Net realized and unrealized gain | 28,738,427 | |||
|
| |||
Net Increase in Net Assets Resulting from Operations | $ | 29,222,438 | ||
|
| |||
See Notes to Financial Statements.
| 50 | ANNUAL REPORT | MAY 31, 2017 |
| Statements of Changes in Net Assets | BlackRock Master Small Cap Growth Portfolio |
| Year Ended May 31, | ||||||||
| Decrease in Net Assets: | 2017 | 2016 | ||||||
| Operations | ||||||||
Net investment income | $ | 484,011 | $ | 639,898 | ||||
Net realized gain (loss) | 16,739,370 | (876,361 | ) | |||||
Net change in unrealized appreciation (depreciation) | 11,999,057 | (23,980,229 | ) | |||||
|
| |||||||
Net increase (decrease) in net assets resulting from operations | 29,222,438 | (24,216,692 | ) | |||||
|
| |||||||
| Capital Transactions | ||||||||
Proceeds from contributions | 39,383,702 | 41,163,211 | ||||||
Value of withdrawals | (82,599,696 | ) | (67,318,425 | ) | ||||
|
| |||||||
Net decrease in net assets derived from capital transactions | (43,215,994 | ) | (26,155,214 | ) | ||||
|
| |||||||
| Net Assets | ||||||||
Total decrease in net assets | (13,993,556 | ) | (50,371,906 | ) | ||||
Beginning of year | 168,971,875 | 219,343,781 | ||||||
|
| |||||||
End of year | $ | 154,978,319 | $ | 168,971,875 | ||||
|
| |||||||
| Financial Highlights | BlackRock Master Small Cap Growth Portfolio |
| Year Ended May 31, | ||||||||||||||||||||
| 2017 | 2016 | 2015 | 2014 | 2013 | ||||||||||||||||
| Total Return | ||||||||||||||||||||
Total return | 19.49% | (11.09)% | 14.11% | 22.22% | 31.47% | |||||||||||||||
|
| |||||||||||||||||||
| Ratios to Average Net Assets | ||||||||||||||||||||
Total expenses | 0.81% | 0.81% | 0.79% | 0.80% | 0.79% | |||||||||||||||
|
| |||||||||||||||||||
Total expenses after fees waived | 0.60% | 0.65% | 0.63% | 0.64% | 0.77% | |||||||||||||||
|
| |||||||||||||||||||
Net investment income | 0.30% | 0.34% | 0.23% | 0.10% | 0.47% | |||||||||||||||
|
| |||||||||||||||||||
| Supplemental Data | ||||||||||||||||||||
Net assets, end of year (000) | $ | 154,978 | $ | 168,972 | $ | 219,344 | $ | 231,888 | $ | 216,189 | ||||||||||
|
| |||||||||||||||||||
Portfolio turnover rate | 105% | 115% | 140% | 152% | 165% | |||||||||||||||
|
| |||||||||||||||||||
See Notes to Financial Statements.
| ANNUAL REPORT | MAY 31, 2017 | 51 |
| Notes to Financial Statements | BlackRock Master Small Cap Growth Portfolio |
1. Organization:
BlackRock Master LLC (the “Master LLC”), is registered under the Investment Company Act of 1940, as amended (the “1940 Act”), as an open-end management investment company. The Master LLC is organized as a Delaware limited liability company. BlackRock Master Small Cap Growth Portfolio (the “Master Portfolio”), a series of the Master LLC, is classified as diversified. The Master Portfolio’s Limited Liability Company Agreement of the Master LLC permits the Board of Directors of the Master LLC (the “Board”) to issue non-transferable interests in the Master LLC, subject to certain limitations.
The Master Portfolio, together with certain other registered investment companies advised by BlackRock Advisors, LLC (the “Manager”) or its affiliates, is included in a complex of open-end funds referred to as the Equity-Liquidity Complex.
2. Significant Accounting Policies:
The financial statements are prepared in conformity with accounting principles generally accepted in the United States of America (“U.S. GAAP”), which may require management to make estimates and assumptions that affect the reported amounts of assets and liabilities in the financial statements, disclosure of contingent assets and liabilities at the date of the financial statements and the reported amounts of increases and decreases in net assets from operations during the reporting period. Actual results could differ from those estimates. The Master Portfolio is considered an investment company under U.S. GAAP and follows the accounting and reporting guidance applicable to investment companies. Below is a summary of significant accounting policies:
Investment Transactions and Income Recognition: For financial reporting purposes, investment transactions are recorded on the dates the transactions are entered into (the “trade dates”). Realized gains and losses on investment transactions are determined on the identified cost basis. Dividend income is recorded on the ex-dividend date. Upon notification from issuers, some of the dividend income received from a real estate investment trust may be redesignated as a reduction of cost of the related investment and/or realized gain.
Segregation and Collateralization: In cases where the Master Portfolio enters into certain investments (e.g., futures contracts) that would be treated as “senior securities” for 1940 Act purposes, the Master Portfolio may segregate or designate on its books and records cash or liquid assets having a market value at least equal to the amount of its future obligations under such investments. Doing so allows the investment to be excluded from treatment as a “senior security.” Furthermore, if required by an exchange or counterparty agreement, the Master Portfolio may be required to deliver/deposit cash and/or securities to/with an exchange, or broker-dealer or custodian as collateral for certain investments or obligations.
Recent Accounting Standards: In April 2015, the Financial Accounting Standards Board issued “Disclosures for Investments in Certain Entities that Calculate Net Asset Value (“NAV”) per Share” which eliminates the requirement to categorize investments within the fair value hierarchy when fair value is based on the NAV per share and no quoted market value is available. As of May 31, 2017, certain investments of the Master Portfolio were valued using NAV per share as no quoted market value was available and therefore have been excluded from the fair value hierarchy.
SEC Reporting Modernization: The U.S. Securities and Exchange Commission (“SEC”) adopted new rules and forms and amended other rules to enhance the reporting and disclosure of information by registered investment companies. As part of these changes, the SEC amended Regulation S-X to standardize and enhance disclosures in investment company financial statements. The compliance date for implementing the new or amended rules is August 1, 2017.
Indemnifications: In the normal course of business, the Master Portfolio enters into contracts that contain a variety of representations that provide general indemnification. The Master Portfolio’s maximum exposure under these arrangements is unknown because it involves future potential claims against the Master Portfolio, which cannot be predicted with any certainty.
Other: Expenses directly related to the Master Portfolio are charged to the Master Portfolio. Other operating expenses shared by several funds, including other funds managed by the Manager, are prorated among those funds on the basis of relative net assets or other appropriate methods.
3. Investment Valuation and Fair Value Measurements:
Investment Valuation Policies: The Master Portfolio’s investments are valued at fair value (also referred to as “market value” within the financial statements) as of the close of trading on the New York Stock Exchange (“NYSE”) (generally 4:00 p.m., Eastern time). U.S. GAAP defines fair value as the price the Master Portfolio would receive to sell an asset or pay to transfer a liability in an orderly transaction between market participants at the measurement date. The Master Portfolio determines the fair values of its financial instruments using various independent dealers or pricing services under policies approved by the Board. The BlackRock Global Valuation Methodologies Committee (the “Global Valuation Committee”) is the committee formed by management to develop global pricing policies and procedures and to oversee the pricing function for all financial instruments.
Fair Value Inputs and Methodologies: The following methods and inputs are used to establish the fair value of the Master Portfolio’s assets and liabilities:
| 52 | ANNUAL REPORT | MAY 31, 2017 |
| Notes to Financial Statements (continued) | BlackRock Master Small Cap Growth Portfolio |
| • | Equity investments traded on a recognized securities exchange are valued at the official closing price each day, if available. For equity investments traded on more than one exchange, the official closing price on the exchange where the stock is primarily traded is used. Equity investments traded on a recognized exchange for which there were no sales on that day may be valued at the last available bid (long positions) or ask (short positions) price. |
| • | Investments in open-end U.S. mutual funds are valued at NAV each business day. |
| • | The Master Portfolio values its investment in SL Liquidity Series, LLC, Money Market Series (the “Money Market Series”) at fair value, which is ordinarily based upon its pro rata ownership in the underlying fund’s net assets. The Money Market Series seeks current income consistent with maintaining liquidity and preserving capital. Although the Money Market Series is not registered under the 1940 Act, its investments may follow the parameters of investments by a money market fund that is subject to Rule 2a-7 under the 1940 Act. |
| • | Futures contracts traded on exchanges are valued at their last sale price. |
If events (e.g., a company announcement, market volatility or a natural disaster) occur that are expected to materially affect the value of such investments, or in the event that the application of these methods of valuation results in a price for an investment that is deemed not to be representative of the market value of such investment, or if a price is not available, the investment will be valued by the Global Valuation Committee, or its delegate, in accordance with a policy approved by the Board as reflecting fair value (“Fair Valued Investments”). The fair valuation approaches that may be used by the Global Valuation Committee include Market approach, Income approach and Cost approach. Valuation techniques such as discounted cash flow, use of market comparables and matrix pricing are types of valuation approaches and typically used in determining fair value. When determining the price for Fair Valued Investments, the Global Valuation Committee, or its delegate, seeks to determine the price that the Master Portfolio might reasonably expect to receive or pay from the current sale or purchase of that asset or liability in an arm’s-length transaction. Fair value determinations shall be based upon all available factors that the Global Valuation Committee, or its delegate, deems relevant and consistent with the principles of fair value measurement.
The Global Valuation Committee, or its delegate, employs various methods for calibrating valuation approaches for investments where an active market does not exist, including regular due diligence of the Master Portfolio’s pricing vendors, regular reviews of key inputs and assumptions, transactional back-testing or disposition analysis to compare unrealized gains and losses to realized gains and losses, reviews of missing or stale prices and large movements in market values and reviews of any market related activity. The pricing of all Fair Valued Investments is subsequently reported to the Board or a committee thereof on a quarterly basis. As a result of the inherent uncertainty in valuation of these investments, the fair values may differ from the values that would have been used had an active market existed.
For investments in equity or debt issued by privately-held companies or funds (“Private Company” or collectively, the “Private Companies”) and other Fair Valued Investments, the fair valuation approaches that are used by third party pricing services utilize one or a combination of, but not limited to, the following inputs.
| Standard Inputs Generally Considered By Third Party Pricing Services | ||||
Market approach | (i) | recent market transactions, including subsequent rounds of financing, in the underlying investment or comparable issuers; | ||
| (ii) | recapitalizations and other transactions across the capital structure; and | |||
| (iii) | market multiples of comparable issuers.
| |||
Income approach | (i) | future cash flows discounted to present and adjusted as appropriate for liquidity, credit, and/or market risks; | ||
| (ii) | quoted prices for similar investments or assets in active markets; and | |||
| (iii) | other risk factors, such as interest rates, yield curves, volatilities, prepayment speeds, loss severities, credit risks, recovery rates, liquidation amounts and/or default rates.
| |||
Cost approach | (i) | audited or unaudited financial statements, investor communications and financial or operational metrics issued by the Private Company; | ||
| (ii) | changes in the valuation of relevant indices or publicly traded companies comparable to the Private Company; | |||
| (iii) | relevant news and other public sources; and | |||
| (iv) | known secondary market transactions in the Private Company’s interests and merger or acquisition activity in companies comparable to the Private Company.
| |||
| ANNUAL REPORT | MAY 31, 2017 | 53 |
| Notes to Financial Statements (continued) | BlackRock Master Small Cap Growth Portfolio |
Investments in series of preferred stock issued by Private Companies are typically valued utilizing Market approach in determining the enterprise value of the company. Such investments often contain rights and preferences that differ from other series of preferred and common stock of the same issuer. Valuation techniques such as an option pricing model (“OPM”), a probability weighted expected return model (“PWERM”) or a hybrid of those techniques are used in allocating enterprise value of the company, as deemed appropriate under the circumstances. The use of OPM and PWERM techniques involve a determination of the exit scenarios of the investment in order to appropriately allocate the enterprise value of the company among the various parts of its capital structure.
The Private Companies are not subject to the public company disclosure, timing, and reporting standards as other investments held by the Master Portfolio. Typically, the most recently available information by a Private Company is as of a date that is earlier than the date the Master Portfolio is calculating its NAV. This factor may result in a difference between the value of the investment and the price the Master Portfolio could receive upon the sale of the investment.
Fair Value Hierarchy: Various inputs are used in determining the fair value of investments and derivative financial instruments. These inputs to valuation techniques are categorized into a fair value hierarchy consisting of three broad levels for financial statement purposes as follows:
| • | Level 1 — Unadjusted price quotations in active markets/exchanges for identical assets or liabilities that the Master Portfolio has the ability to access |
| • | Level 2 — Other observable inputs (including, but not limited to, quoted prices for similar assets or liabilities in markets that are active, quoted prices for identical or similar assets or liabilities in markets that are not active, inputs other than quoted prices that are observable for the assets or liabilities (such as interest rates, yield curves, volatilities, prepayment speeds, loss severities, credit risks and default rates) or other market–corroborated inputs) |
| • | Level 3 — Unobservable inputs based on the best information available in the circumstances, to the extent observable inputs are not available (including the Master Portfolio’s own assumptions used in determining the fair value of investments and derivative financial instruments) |
The hierarchy gives the highest priority to unadjusted quoted prices in active markets for identical assets or liabilities (Level 1 measurements) and the lowest priority to unobservable inputs (Level 3 measurements). Accordingly, the degree of judgment exercised in determining fair value is greatest for instruments categorized in Level 3. The inputs used to measure fair value may fall into different levels of the fair value hierarchy. In such cases, for disclosure purposes, the fair value hierarchy classification is determined based on the lowest level input that is significant to the fair value measurement in its entirety. Investments classified within Level 3 have significant unobservable inputs used by the Global Valuation Committee in determining the price for Fair Valued Investments. Level 3 investments include equity or debt issued by Private Companies. There may not be a secondary market, and/or there are a limited number of investors. Level 3 investments may also be adjusted to reflect illiquidity and/or non-transferability, with the amount of such discount estimated by the Global Valuation Committee in the absence of market information.
Changes in valuation techniques may result in transfers into or out of an assigned level within the hierarchy. In accordance with the Master Portfolio’s policy, transfers between different levels of the fair value hierarchy are deemed to have occurred as of the beginning of the reporting period. The categorization of a value determined for investments and derivative financial instruments is based on the pricing transparency of the investments and derivative financial instruments and is not necessarily an indication of the risks associated with investing in those securities.
4. Securities and Other Investments:
Preferred Stocks: Preferred stock has a preference over common stock in liquidation (and generally in receiving dividends as well), but is subordinated to the liabilities of the issuer in all respects. As a general rule, the market value of preferred stock with a fixed dividend rate and no conversion element varies inversely with interest rates and perceived credit risk, while the market price of convertible preferred stock generally also reflects some element of conversion value. Because preferred stock is junior to debt securities and other obligations of the issuer, deterioration in the credit quality of the issuer will cause greater changes in the value of a preferred stock than in a more senior debt security with similar stated yield characteristics. Unlike interest payments on debt securities, preferred stock dividends are payable only if declared by the issuer’s board of directors. Preferred stock also may be subject to optional or mandatory redemption provisions.
Securities Lending: The Master Portfolio may lend its securities to approved borrowers, such as brokers, dealers and other financial institutions. The borrower pledges and maintains with the Master Portfolio collateral consisting of cash, an irrevocable letter of credit issued by a bank, or securities issued or guaranteed by the U.S. Government. The initial collateral received by the Master Portfolio is required to have a value of at least 102% of the current value of the loaned securities for securities traded on U.S. exchanges and a value of at least 105% for all other securities. The collateral is maintained thereafter at a value equal to at least 100% of the current market value of the securities on loan. The market value of the loaned securities is determined at the close of each business day of the Master Portfolio and any additional required collateral is delivered to the Master Portfolio, or
| 54 | ANNUAL REPORT | MAY 31, 2017 |
| Notes to Financial Statements (continued) | BlackRock Master Small Cap Growth Portfolio |
excess collateral returned by the Master Portfolio, on the next business day. During the term of the loan, the Master Portfolio is entitled to all distributions made on or in respect of the loaned securities, but does not receive interest income on securities received as collateral . Loans of securities are terminable at any time and the borrower, after notice, is required to return borrowed securities within the standard time period for settlement of securities transactions.
The market value of any securities on loan, all of which were classified as common stocks in the Master Portfolio’s Schedule of Investments, and the value of any related collateral are shown separately in the Statement of Assets and Liabilities as a component of investments at value — unaffiliated, and collateral on securities loaned at value, respectively. As of period end, any securities on loan were collateralized by cash and/or U.S. Government obligations. Cash collateral invested by the securities lending agent, BlackRock Investment Management, LLC (“BIM”), if any, is disclosed in the Schedule of Investments.
Securities lending transactions are entered into by the Master Portfolio under Master Securities Lending Agreements (each, an “MSLA”), which provide the right, in the event of default (including bankruptcy or insolvency), for the non-defaulting party to liquidate the collateral and calculate a net exposure to the defaulting party or request additional collateral. In the event that a borrower defaults, the Master Portfolio, as lender, would offset the market value of the collateral received against the market value of the securities loaned. When the value of the collateral is greater than that of the market value of the securities loaned, the lender is left with a net amount payable to the defaulting party. However, bankruptcy or insolvency laws of a particular jurisdiction may impose restrictions on or prohibitions against such a right of offset in the event of an MSLA counterparty’s bankruptcy or insolvency. Under the MSLA, absent an event of default, the borrower can resell or re-pledge the loaned securities, and the Master Portfolio can reinvest cash collateral received in connection with loaned securities. Upon an event of default, the parties’ obligations to return the securities or collateral to the other party are extinguished, and the parties can resell or re-pledge the loaned securities or the collateral received in connection with the loaned securities in order to satisfy the defaulting party’s net payment obligation for all transactions under the MSLA. The defaulting party remains liable for any deficiency.
As of period end, the following table is a summary of the Master Portfolio’s securities lending agreements by counterparty, which are subject to offset under an MSLA:
| Counterparty | Securities Loaned at Value | Cash Collateral Received1 | Net Amount | |||||||
Barclays Capital, Inc. | $210,080 | $(210,080) | — | |||||||
Citigroup Global Markets, Inc. | 84,315 | (84,315) | — | |||||||
Deutsche Bank Securities, Inc. | 19,787 | (19,787) | — | |||||||
Goldman Sachs & Co. | 33,432 | (33,432) | — | |||||||
Mizuho Securities USA, Inc. | 50,520 | (50,520) | — | |||||||
Morgan Stanley & Co. LLC | 146,850 | (146,850) | — | |||||||
SG Americas Securities LLC | 4,620 | (4,620) | — | |||||||
UBS Securities LLC | 13,893 | (13,893) | — | |||||||
|
| |||||||||
Total | $563,497 | $(563,497) | — | |||||||
|
| |||||||||
| 1 | Cash collateral with a value of $593,793 has been received in connection with securities lending agreements. Collateral received in excess of the value of securities loaned from the individual counterparty is not shown for financial reporting purposes in the table above. |
The risks of securities lending include the risk that the borrower may not provide additional collateral when required or may not return the securities when due. To mitigate these risks, the Master Portfolio benefits from a borrower default indemnity provided by BIM. BIM’s indemnity allows for full replacement of the securities loaned if the collateral received does not cover the value on the securities loaned in the event of borrower default. The Master Portfolio could incur a loss if the value of an investment purchased with cash collateral falls below the market value of loaned securities or if the value of an investment purchased with cash collateral falls below the value of the original cash collateral received.
5. Derivative Financial Instruments:
The Master Portfolio engages in various portfolio investment strategies using derivative contracts both to increase the returns of the Master Portfolio and/or to manage its exposure to certain risks such as credit risk, equity risk, interest rate risk, foreign currency exchange rate risk, commodity price risk or other risks (e.g., inflation risk). Derivative financial instruments categorized by risk exposure are included in the Schedule of Investments. These contracts may be transacted on an exchange.
Futures Contracts: The Master Portfolio invests in long and/or short positions in futures and options on futures contracts to gain exposure to, or manage exposure to, changes in the value of equity securities (equity risk).
Futures contracts are agreements between the Master Portfolio and a counterparty to buy or sell a specific quantity of an underlying instrument at a specified price and on a specified date. Depending on the terms of a contract, it is settled either through physical delivery of the underlying instrument on the settlement date or by payment of a cash amount on the settlement date. Upon entering into a futures contract, the Master Portfolio is required
| ANNUAL REPORT | MAY 31, 2017 | 55 |
| Notes to Financial Statements (continued) | BlackRock Master Small Cap Growth Portfolio |
to deposit initial margin with the broker in the form of cash or securities in an amount that varies depending on a contract’s size and risk profile. The initial margin deposit must then be maintained at an established level over the life of the contract.
Securities deposited as initial margin are designated in the Schedule of Investments and cash deposited, if any, is shown as cash pledged for futures contracts in the Statement of Assets and Liabilities. Pursuant to the contract, the Master Portfolio agrees to receive from or pay to the broker an amount of cash equal to the daily fluctuation in market value of the contract (“variation margin”). Variation margin is recorded as unrealized appreciation (depreciation) and, if any, shown as variation margin receivable (or payable) on futures contracts in the Statement of Assets and Liabilities. When the contract is closed, a realized gain or loss is recorded in the Statement of Operations equal to the difference between the value of the contract at the time it was opened and the value at the time it was closed. The use of futures contracts involves the risk of an imperfect correlation in the movements in the price of futures contracts and interest, foreign currency exchange rates or underlying assets.
6. Investment Advisory Agreement and Other Transactions with Affiliates:
The PNC Financial Services Group, Inc. is the largest stockholder and an affiliate of BlackRock, Inc. (“BlackRock”) for 1940 Act purposes.
Investment Advisory: The Master LLC, on behalf of the Master Portfolio, entered into an Investment Advisory Agreement with the Manager, the Master Portfolio’s investment adviser, an indirect, wholly-owned subsidiary of BlackRock, to provide investment advisory and administration services. The Manager is responsible for the management of the Master Portfolio’s portfolio and provides the personnel, facilities, equipment and certain other services necessary to the operations of the Master Portfolio.
For such services, the Master Portfolio pays the Manager a monthly fee at an annual rate equal to the following percentages of the average daily value of the Master’s Portfolio’s net assets:
| Average Daily Net Assets | Investment Advisory Fee | |
First $1 Billion | 0.70% | |
$1 Billion - $3 Billion | 0.66% | |
$3 Billion - $5 Billion | 0.63% | |
$5 Billion - $10 Billion | 0.61% | |
Greater than $10 Billion | 0.60% |
Expense Limitations, Waivers and Reimbursements: With respect to the Master Portfolio, the Manager has contractually agreed to waive 0.26% of its investment advisory fees as a percentage of the Master Portfolio’s average daily net assets until September 30, 2018. Prior to December 1, 2016, with respect to the Master Portfolio, the Manager had contractually agreed to waive 0.16% of its investment advisory fees as a percentage of the Master Portfolio’s average daily net assets. The contractual agreement may be terminated upon 90 days’ notice by a majority of the Directors of the Master LLC who are not “interested persons” of the Master LLC, as defined in the 1940 Act (“Independent Directors”), or by a vote of a majority of the outstanding voting securities of the Master Portfolio. For the year ended May 31, 2017, the Manager waived $339,620 of investment advisory fees, which is included in fees waived by the Manager in the Statement of Operations.
With respect to the Master Portfolio, the Manager voluntarily agreed to waive its investment advisory fees by the amount of investment advisory fees the Master Portfolio pays to the Manager indirectly through its investment in affiliated money market funds. This amount is included in fees waived by the Manager in the Statement of Operations. For the year ended May 31, 2017, the amount waived was $878.
Effective September 1, 2016, the Manager voluntarily agreed to waive its investment advisory fee with respect to any portion of Master Portfolio’s assets invested in affiliated equity and fixed-income mutual funds and affiliated exchange-traded funds that have a contractual management fee. Prior to September 1, 2016, the Manager did not waive such fees. Effective September 28, 2016, this waiver became contractual through September 30, 2017. The contractual agreement may be terminated upon 90 days’ notice by a majority of the Independent Directors or by a vote of a majority of the outstanding voting securities of the Master Portfolio. For the year ended May 31, 2017, there were no fees waived by the Manager.
For the year ended May 31, 2017, the Master Portfolio reimbursed the Manager $1,902 for certain accounting services, which is included in accounting services in the Statement of Operations.
Securities Lending: The SEC has issued an exemptive order which permits BIM, an affiliate of the Manager, to serve as securities lending agent for the Master Portfolio, subject to applicable conditions. As securities lending agent, BIM bears all operational costs directly related to securities lending. The Master Portfolio is responsible for expenses in connection with the investment of cash collateral received for securities on loan (the “collateral investment expenses”). The cash collateral is invested in a private investment company managed by the Manager or its affiliates. However, BIM has agreed to cap the collateral investment expenses of the private investment company to an annual rate of 0.04%. The investment adviser to the private investment company will not charge any advisory fees with respect to shares purchased by the Master Portfolio. If the private investment company’s weekly liquid assets fall below 30% of its total assets, BIM, as managing member of the private investment company, is permitted at any time, if it determines
| 56 | ANNUAL REPORT | MAY 31, 2017 |
| Notes to Financial Statements (continued) | BlackRock Master Small Cap Growth Portfolio |
it to be in the best interests of the private investment company, to impose a liquidity fee of up to 2% of the value of units withdrawn or impose a redemption gate that temporarily suspends the right of withdrawal out of the private investment company. In addition, if the private investment company’s weekly liquid assets fall below 10% of its total assets at the end of any business day, the private investment company will impose a liquidity fee in the default amount of 1% of the amount withdrawn, generally effective as of the next business day, unless BIM determines that a higher (not to exceed 2%) or lower fee level or not imposing a liquidity fee is in the best interests of the private investment company. The shares of the private investment company purchased by the Master Portfolio would be subject to any such liquidity fee or redemption gate imposed.
Securities lending income is equal to the total of income earned from the reinvestment of cash collateral, net of fees and other payments to and from borrowers of securities, and less the collateral investment expenses. The Master Portfolio retains a portion of securities lending income and remits a remaining portion to BIM as compensation for its services as securities lending agent. Pursuant to a securities lending agreement, BIM may lend securities only when the difference between the borrower rebate rate and the risk free rate exceeds a certain level (such securities, the “specials only securities”).
Pursuant to such agreement, the Master Portfolio retains 80% of securities lending income. In addition, commencing the business day following the date that the aggregate securities lending income earned across certain funds in the Equity-Liquidity Complex in a calendar year exceeds a specified threshold, the Master Portfolio, pursuant to the securities lending agreement, will retain for the remainder of the calendar year securities lending income in an amount equal to 85% of securities lending income.
The share of securities lending income earned by the Master Portfolio is shown as securities lending income — affiliated — net in the Statement of Operations. For the year ended May 31, 2017, the Master Portfolio paid BIM $35,192 for securities lending agent services.
Officer and Directors: Certain officers and/or directors of the Master LLC are officers and/or directors of BlackRock or its affiliates.
7. Purchases and Sales:
For the year ended May 31, 2017, purchases and sales of investments, excluding short-term securities, were $169,048,997 and $209,514,027, respectively.
8. Income Tax Information:
The Master Portfolio is disregarded as an entity separate from its owner for tax purposes. As such, the owner of the Master Portfolio is treated as the owner of the net assets, income, expenses and realized and unrealized gains and losses of the Master Portfolio. Therefore, no U.S. federal income tax provision is required. It is intended that the Master Portfolio’s assets will be managed so the owner of the Master Portfolio can satisfy the requirements of Subchapter M of the Internal Revenue Code of 1986, as amended.
As of May 31, 2017, gross unrealized appreciation and depreciation based on cost for U.S. federal income tax purposes were as follows:
Tax cost | $138,650,408 | |||
|
| |||
Gross unrealized appreciation | $ 23,615,431 | |||
Gross unrealized depreciation | (6,695,672 | ) | ||
|
| |||
Net unrealized appreciation | $ 16,919,759 | |||
|
|
9. Bank Borrowings:
The Master LLC, on behalf of the Master Portfolio, along with certain other funds managed by the Manager and its affiliates (“Participating Funds”), is a party to a 364-day, $2.1 billion credit agreement with a group of lenders. Under this agreement, the Master Portfolio may borrow to fund shareholder redemptions. Excluding commitments designated for certain individual funds, the Participating Funds, including the Master Portfolio, can borrow up to an aggregate commitment amount of $1.6 billion at any time outstanding, subject to asset coverage and other limitations as specified in the agreement. The credit agreement has the following terms: a fee of 0.12% per annum on unused commitment amounts and interest at a rate equal to the higher of (a) one-month LIBOR (but, in any event, not less than 0.00%) on the date the loan is made plus 0.80% per annum or (b) the Fed Funds rate (but, in any event, not less than 0.00%) in effect from time to time plus 0.80% per annum on amounts borrowed. The agreement expires in April 2018 unless extended or renewed. Participating Funds paid administration, legal and arrangement fees, which, if applicable, are included in miscellaneous expenses in the Statement of Operations. These fees were allocated among such funds based upon portions of the aggregate commitment available to them and relative net assets of Participating Funds. During the year ended May 31, 2017, the Master Portfolio did not borrow under the credit agreement.
10. Principal Risks:
In the normal course of business, the Master Portfolio invests in securities and enters into transactions where risks exist due to fluctuations in the market (market risk) or failure of the issuer to meet all its obligations, including the ability to pay principal and interest when due (issuer credit risk).
| ANNUAL REPORT | MAY 31, 2017 | 57 |
| Notes to Financial Statements (concluded) | BlackRock Master Small Cap Growth Portfolio |
The value of securities held by the Master Portfolio may decline in response to certain events, including those directly involving the issuers of securities owned by the Master Portfolio. Changes arising from the general economy, the overall market and local, regional or global political and/ or social instability, as well as currency, interest rate and price fluctuations, may also affect the securities’ value.
On October 11, 2016, BlackRock implemented certain changes required by amendments to Rule 2a-7 under the 1940 Act, which governs the operations of U.S. money market funds. The Master Portfolio may be exposed to additional risks when reinvesting cash collateral in money market funds that do not seek to maintain a stable NAV per share of $1.00 and which may be subject to redemption gates or liquidity fees under certain circumstances.
Valuation Risk: The market values of equities, such as common stocks and preferred securities or equity related investments, such as futures and options, may decline due to general market conditions which are not specifically related to a particular company. They may also decline due to factors which affect a particular industry or industries. The Master Portfolio may invest in illiquid investments and may experience difficulty in selling those investments in a timely manner at the price that it believes the investments are worth. Prices may fluctuate widely over short or extended periods in response to company, market or economic news. Markets also tend to move in cycles, with periods of rising and falling prices. This volatility may cause the Master Portfolio’s NAV to experience significant increases or decreases over short periods of time. If there is a general decline in the securities and other markets, the NAV of the Master Portfolio may lose value, regardless of the individual results of the securities and other instruments in which the Master Portfolio invests.
The price the Master Portfolio could receive upon the sale of any particular portfolio investment may differ from the Master Portfolio’s valuation of the investment, particularly for securities that trade in thin or volatile markets or that are valued using a fair valuation methodology or a price provided by an independent pricing service. Changes to significant unobservable inputs and assumptions (i.e., publicly traded company multiples, growth rate, time to exit) due to the lack of observable inputs may significantly impact the resulting fair value and therefore the Master Portfolio’s results of operations. As a result, the price received upon the sale of an investment may be less than the value ascribed by the Master Portfolio, and the Master Portfolio could realize a greater than expected loss or lesser than expected gain upon the sale of the investment. The Master Portfolio’s ability to value its investments may also be impacted by technological issues and/or errors by pricing services or other third party service providers.
Counterparty Credit Risk: Similar to issuer credit risk, the Master Portfolio may be exposed to counterparty credit risk, or the risk that an entity may fail to or be unable to perform on its commitments related to unsettled or open transactions. The Master Portfolio manages counterparty credit risk by entering into transactions only with counterparties that the Manager believes have the financial resources to honor their obligations and by monitoring the financial stability of those counterparties. Financial assets, which potentially expose the Master Portfolio to market, issuer and counterparty credit risks, consist principally of financial instruments and receivables due from counterparties. The extent of the Master Portfolio’s exposure to market, issuer and counterparty credit risks with respect to these financial assets is approximately their value recorded in the Statement of Assets and Liabilities, less any collateral held by the Master Portfolio.
A derivative contract may suffer a mark-to-market loss if the value of the contract decreases due to an unfavorable change in the market rates or values of the underlying instrument. Losses can also occur if the counterparty does not perform under the contract.
With exchange-traded futures, there is less counterparty credit risk to the Master Portfolio since the exchange or clearinghouse, as counterparty to such instruments, guarantees against a possible default. The clearinghouse stands between the buyer and the seller of the contract; therefore, credit risk is limited to failure of the clearinghouse. While offset rights may exist under applicable law, the Master Portfolio does not have a contractual right of offset against a clearing broker or clearinghouse in the event of a default (including the bankruptcy or insolvency). Additionally, credit risk exists in exchange-traded futures with respect to initial and variation margin that is held in a clearing broker’s customer accounts. While clearing brokers are required to segregate customer margin from their own assets, in the event that a clearing broker becomes insolvent or goes into bankruptcy and at that time there is a shortfall in the aggregate amount of margin held by the clearing broker for all its clients, typically the shortfall would be allocated on a pro rata basis across all the clearing broker’s customers, potentially resulting in losses to the Master Portfolio.
Concentration Risk: As of period end, the Master Portfolio invested a significant portion of its assets in securities in the information technology sector. Changes in economic conditions affecting such sector would have a greater impact on the Master Portfolio and could affect the value, income and/or liquidity of positions in such securities.
11. Subsequent Events:
Management has evaluated the impact of all subsequent events on the Master Portfolio through the date the financial statements were issued and has determined that there were no subsequent events requiring adjustment or additional disclosure in the financial statements.
| 58 | ANNUAL REPORT | MAY 31, 2017 |
| Report of Independent Registered Public Accounting Firm | BlackRock Master Small Cap Growth Portfolio |
To the Investor of BlackRock Master Small Cap Growth Portfolio and Board of Directors of BlackRock Master LLC:
We have audited the accompanying statement of assets and liabilities, including the schedule of investments, of Master Small Cap Growth Portfolio (the “Master LLC”) as of May 31, 2017, and the related statement of operations for the year then ended, the statements of changes in net assets for each of the two years in the period then ended and the financial highlights for each of the five years in the period then ended. These financial statements and financial highlights are the responsibility of the Master LLC’s management. Our responsibility is to express an opinion on these financial statements and financial highlights based on our audits.
We conducted our audits in accordance with the standards of the Public Company Accounting Oversight Board (United States). Those standards require that we plan and perform the audit to obtain reasonable assurance about whether the financial statements and financial highlights are free of material misstatement. The Master LLC is not required to have, nor were we engaged to perform, an audit of its internal control over financial reporting. Our audits included consideration of internal control over financial reporting as a basis for designing audit procedures that are appropriate in the circumstances, but not for the purpose of expressing an opinion on the effectiveness of the Fund’s internal control over financial reporting. Accordingly, we express no such opinion. An audit also includes examining, on a test basis, evidence supporting the amounts and disclosures in the financial statements, assessing the accounting principles used and significant estimates made by management, as well as evaluating the overall financial statement presentation. Our procedures included confirmation of securities owned as of May 31, 2017, by correspondence with the custodian and brokers; where replies were not received from brokers, we performed other auditing procedures. We believe that our audit provide a reasonable basis for our opinion.
In our opinion, the financial statements and financial highlights referred to above present fairly, in all material respects, the financial position of BlackRock Master Small Cap Growth Portfolio as of May 31, 2017, the results of its operations for the year then ended, the changes in their net assets for each of the two years in the period then ended, and the financial highlights for each of the five years in the period then ended, in conformity with accounting principles generally accepted in the United States of America.
Deloitte & Touche LLP
Philadelphia, Pennsylvania
July 24, 2017
| ANNUAL REPORT | MAY 31, 2017 | 59 |
| Disclosure of Investment Advisory Agreements |
The Board of Trustees of BlackRock FundsSM (the “Trust”) met in person on April 20, 2017 and May 24-25, 2017 to consider the approval of the Trust’s investment advisory agreement (the “Trust Advisory Agreement”) with BlackRock Advisors, LLC (the “Manager” or “BlackRock”), the Trust’s investment advisor, on behalf of BlackRock Advantage Small Cap Core Fund (“Advantage Small Cap Core Fund”), a portfolio of the Trust.
The Board of Directors of BlackRock Master LLC (the “Master LLC”) met in person on April 20, 2017 and May 24-25, 2017 to consider the approval of the Master LLC’s investment advisory agreement (the “Master LLC Advisory Agreement”) with the Manager, the Master LLC’s investment advisor, on behalf of BlackRock Master Small Cap Growth Portfolio (the “Master Portfolio”), a series of the Master LLC. BlackRock Small Cap Growth Fund II (“Small Cap Growth Fund II”), a series of BlackRock Series, Inc. (the “Corporation”), is a “feeder” fund that invests all of its investable assets in the Master Portfolio. Accordingly, the Board of Directors of the Corporation also considered the approval of the Master LLC Advisory Agreement.
Advantage Small Cap Core Fund, Small Cap Growth Fund II, the Master LLC (with respect to the Master Portfolio) and the Corporation (with respect to Small Cap Growth Fund II) are referred to herein, as pertinent, individually as a “Fund” or collectively as the “Funds.” The Trust Advisory Agreement and the Master LLC Advisory Agreement are referred to herein as the “Agreements.” For simplicity: (a) the Board of Trustees of the Trust, the Board of Directors of the Master LLC and the Board of Directors of the Corporation are referred to herein individually as the “Board” and collectively as the “Boards,” and the members are referred to as “Board Members;” (b) the shareholders of Advantage Small Cap Core Fund and Small Cap Growth Fund II and the interest holders of the Master Portfolio are referred to as “shareholders;” and (c) the meetings held on April 20, 2017 are referred to as the “April Meeting” and the meetings held on May 24-25, 2017 are referred to as the “May Meeting.”
Activities and Composition of the Boards
On the date of the May Meeting, each Board consisted of thirteen individuals, eleven of whom were not “interested persons” of the pertinent Fund as defined in the Investment Company Act of 1940, as amended (the “1940 Act”) (the “Independent Board Members”). The Board Members are responsible for the oversight of the operations of the pertinent Fund and perform the various duties imposed on the directors of investment companies by the 1940 Act. The Independent Board Members have retained independent legal counsel to assist them in connection with their duties. The Chair of each Board is an Independent Board Member. Each Board has established five standing committees: an Audit Committee, a Governance and Nominating Committee, a Compliance Committee, a Performance Oversight and Contract Committee and an Executive Committee, each of which is chaired by an Independent Board Member and composed of Independent Board Members (except for the Executive Committee, which also has one interested Board Member).
The Agreements
Pursuant to the 1940 Act, each Board is required to consider the continuation of the pertinent Agreement on an annual basis. The Boards have four quarterly meetings per year, each extending over two days, a fifth one-day meeting to consider specific information surrounding the consideration of renewing the pertinent Agreement, and additional in-person and telephonic meetings as needed. In connection with this year-long deliberative process, the Boards assessed, among other things, the nature, extent and quality of the services provided to the Funds by BlackRock, BlackRock’s personnel and affiliates, including (as applicable) investment management; administrative and shareholder services; the oversight of fund service providers; marketing; risk oversight; compliance; and ability to meet applicable legal and regulatory requirements.
The Boards, acting directly and through their committees, consider at each of their meetings, and from time to time as appropriate, factors that are relevant to their annual consideration of the renewal of the Agreements, including the services and support provided by BlackRock to the Funds and their shareholders. BlackRock also furnished additional information to the Boards in response to specific questions from the Boards. This additional information is discussed further below in the section titled “Board Considerations in Approving the Agreements.” Among the matters the Boards considered, with respect to each Fund, as pertinent, were: (a) investment performance for one-year, three-year, five-year, ten-year and/or since inception periods, as applicable, against peer funds, applicable benchmark, and performance metrics, as applicable, as well as senior management’s and portfolio managers’ analysis of the reasons for any over-performance or underperformance relative to its peers, benchmarks, and other performance metrics, as applicable; (b) fees, including advisory, administration, if applicable, and other amounts paid to BlackRock and its affiliates by the Fund for services; (c) the Fund’s operating expenses and how BlackRock allocates expenses to the Fund; (d) the resources devoted to, risk oversight of, and compliance reports relating to, implementation of the Fund’s investment objective(s), policies and restrictions, and meeting regulatory requirements; (e) the Fund’s adherence to its compliance policies and procedures; (f) the nature, cost and character of non-investment management services provided by BlackRock and its affiliates; (g) BlackRock’s and other service providers’ internal controls and risk and compliance oversight mechanisms; (h) BlackRock’s implementation of the proxy voting policies approved by the Board; (i) the use of brokerage commissions and execution quality of portfolio transactions; (j) BlackRock’s implementation of the Fund’s valuation and liquidity procedures; (k) an analysis of management fees for products with similar investment mandates across the open-end fund, exchange-traded fund (“ETF”), closed-end fund, sub-advised mutual fund, separately managed account, collective investment trust, and institutional separate account product channels, as applicable, and the similarities and differences between these products and the services provided as compared to the Fund; (l) BlackRock’s compensation methodology for its investment professionals and the incentives and accountability it creates, along with investment professionals’ investments in the fund(s) they manage; and (m) periodic updates on BlackRock’s business.
| 60 | ANNUAL REPORT | MAY 31, 2017 |
| Disclosure of Investment Advisory Agreements (continued) |
Board Considerations in Approving the Agreements
The Approval Process: Prior to the April Meeting, the Boards requested and received materials specifically relating to the Agreements. The Boards are continuously engaged in a process with their independent legal counsel and BlackRock to review the nature and scope of the information provided to better assist their deliberations. The materials provided in connection with the April Meeting included (a) information independently compiled and prepared by Broadridge Financial Solutions, Inc. (“Broadridge”) on fees and expenses of each Fund as compared with a peer group of funds as determined by Broadridge (“Expense Peers”) and the investment performance of Advantage Small Cap Core Fund and Small Cap Growth Fund II, as applicable, as compared with a peer group of funds as determined by Broadridge1; (b) information on the profits realized by BlackRock and its affiliates pursuant to the Agreements and a discussion of fall-out benefits to BlackRock and its affiliates; (c) a general analysis provided by BlackRock concerning investment management fees charged to other clients, such as institutional clients, sub-advised mutual funds, ETFs, closed-end funds and separately managed accounts under similar investment mandates, as well as the performance of such other clients, as applicable; (d) review of non-management fees; (e) the existence, impact and sharing of potential economies of scale; (f) a summary of aggregate amounts paid by each Fund to BlackRock; and (g) sales and redemption data regarding the shares of Advantage Small Cap Core Fund and Small Cap Growth Fund II, as applicable.
At the April Meeting, each Board reviewed materials relating to its consideration of the pertinent Agreement. As a result of the discussions that occurred during the April Meeting, and as a culmination of each Board’s year-long deliberative process, the Boards presented BlackRock with questions and requests for additional information. BlackRock responded to these requests with additional written information in advance of the May Meeting.
At the May Meeting, (a) the Board of the Trust, including the Independent Board Members, approved the continuation of the Trust Advisory Agreement between the Manager and the Trust with respect to Advantage Small Cap Core Fund for a one-year term ending June 30, 2018; and (b) the Board of the Master LLC, including the Independent Board Members, approved the continuation of the Master LLC Advisory Agreement between the Manager and the Master LLC with respect to the Master Portfolio for a one-year term ending June 30, 2018. The Board of the Corporation, including the Independent Board Members, also considered the continuation of the Master LLC Advisory Agreement with respect to the Master Portfolio and found the Master LLC Advisory Agreement to be satisfactory. In approving the continuation of the pertinent Agreement, each Board considered, with respect to the applicable Fund: (a) the nature, extent and quality of the services provided by BlackRock; (b) the investment performance of the Fund and BlackRock; (c) the advisory fee and the cost of the services and profits to be realized by BlackRock and its affiliates from their relationship with the Fund; (d) the costs of Advantage Small Cap Core Fund and Small Cap Growth Fund II, as applicable, to investors compared to the costs of the relevant Expense Peers and performance compared to the relevant performance metrics as previously discussed; (e) the sharing of potential economies of scale; (f) fall-out benefits to BlackRock and its affiliates as a result of its relationship with the Fund; and (g) other factors deemed relevant by the Board Members.
Each Board also considered other matters it deemed important to the approval process, such as other payments made to BlackRock or its affiliates, securities lending and cash management, services related to the valuation and pricing of portfolio holdings of the applicable Fund, and advice from independent legal counsel with respect to the review process and materials submitted for the Board’s review. Each Board noted the willingness of BlackRock personnel to engage in open, candid discussions with the Board. The Boards did not identify any particular information as determinative, and each Board Member may have attributed different weights to the various items considered.
A. Nature, Extent and Quality of the Services Provided by BlackRock: Each Board, including the Independent Board Members, reviewed the nature, extent and quality of services provided by BlackRock, including the investment advisory services and the resulting performance of the applicable Fund. Throughout the year, each Board compared Fund performance to the performance of a comparable group of mutual funds, relevant benchmark, and performance metrics, as applicable. The Boards met with BlackRock’s senior management personnel responsible for investment activities, including the senior investment officers. Each Board also reviewed the materials provided by the applicable Fund’s portfolio management team discussing the Fund’s performance and the Fund’s investment objective(s), strategies and outlook.
Each Board considered, among other factors, with respect to BlackRock: the number, education and experience of investment personnel generally and the applicable Fund’s portfolio management team; BlackRock’s research capabilities; investments by portfolio managers in the funds they manage; portfolio trading capabilities; use of technology; commitment to compliance; credit analysis capabilities; risk analysis and oversight capabilities; and the approach to training and retaining portfolio managers and other research, advisory and management personnel. Each Board engaged in a review of BlackRock’s compensation structure with respect to the applicable Fund’s portfolio management team and BlackRock’s ability to attract and retain high-quality talent and create performance incentives.
| 1 | The Funds are ranked by Broadridge in quartiles, ranging from first to fourth, where first is the most desirable quartile position and fourth is the least desirable. |
| ANNUAL REPORT | MAY 31, 2017 | 61 |
| Disclosure of Investment Advisory Agreements (continued) |
In addition to investment advisory services, the Boards considered the quality of the administrative and other non-investment advisory services provided to the Funds. BlackRock and its affiliates provide the Funds with certain administrative, shareholder and other services (in addition to any such services provided to the Funds by third parties) and officers and other personnel as are necessary for the operations of the Funds. In particular, BlackRock and its affiliates provide the Funds with administrative services including, among others: (i) preparing disclosure documents, such as the prospectus, the summary prospectus (as applicable), the statement of additional information and periodic shareholder reports; (ii) oversight of daily accounting and pricing; (iii) preparing periodic filings with regulators; (iv) overseeing and coordinating the activities of other service providers; (v) organizing Board meetings and preparing the materials for such Board meetings; (vi) providing legal and compliance support; (vii) furnishing analytical and other support to assist the Boards in their consideration of strategic issues such as the merger, consolidation or repurposing of certain open-end funds; and (viii) performing other administrative functions necessary for the operation of the Funds, such as tax reporting, fulfilling regulatory filing requirements and call center services. The Boards reviewed the structure and duties of BlackRock’s fund administration, shareholder services, and legal & compliance departments and considered BlackRock’s policies and procedures for assuring compliance with applicable laws and regulations.
B. The Investment Performance of the Funds and BlackRock: The Boards, including the Independent Board Members, also reviewed and considered the performance history of Advantage Small Cap Core Fund and the Master Portfolio and Small Cap Growth Fund II, as applicable. The Boards of each of the Master LLC and the Corporation noted that Small Cap Growth Fund II’s investment results correspond directly to the investment results of the Master Portfolio. In preparation for the April Meeting, the Boards were provided with reports independently prepared by Broadridge, which included a comprehensive analysis of the performance of Advantage Small Cap Core Fund and Small Cap Growth Fund II, as applicable. The Boards also reviewed a narrative and statistical analysis of the Broadridge data that was prepared by BlackRock. In connection with their review, the Boards received and reviewed information regarding the investment performance of Advantage Small Cap Core Fund and Small Cap Growth Fund II as compared to other funds in the Fund’s applicable Broadridge category. The Boards were provided with a description of the methodology used by Broadridge to select peer funds and periodically meet with Broadridge representatives to review its methodology. Each Board was provided with information on the composition of the Broadridge performance universes and expense universes. Each Board and its Performance Oversight and Contract Committee regularly review, and meet with Fund management to discuss, the performance of the pertinent Fund, throughout the year.
In evaluating performance, the Boards recognized that the performance data reflects a snapshot of a period as of a particular date and that selecting a different performance period could produce significantly different results. Further, the Boards recognized that it is possible that long-term performance can be adversely affected by even one period of significant underperformance so that a single investment decision or theme has the ability to affect long-term performance disproportionately.
The Board of the Trust noted that for the one-year, three-year and since-inception periods reported, Advantage Small Cap Core Fund ranked in the second, first and first quartiles, respectively, against its Broadridge Performance Universe.
The Boards of each of the Master LLC and the Corporation noted that for the one-, three- and five-year periods reported, Small Cap Growth Fund II ranked in the second, third and third quartiles, respectively, against its Broadridge Performance Universe. The Boards and BlackRock reviewed Small Cap Growth Fund II’s underperformance during the three- and five-year periods.
C. Consideration of the Advisory/Management Fees and the Cost of the Services and Profits to be Realized by BlackRock and its Affiliates from their Relationship with the Funds: The Boards, including the Independent Board Members, reviewed, as pertinent, the contractual management fee rate of Advantage Small Cap Core Fund and the Master Portfolio/Small Cap Growth Fund II compared with the other funds in the applicable Fund’s Broadridge category. The contractual management fee rate represents a combination of the advisory fee and any administrative fees, before taking into account any reimbursements or fee waivers. The Boards also compared, as pertinent, the total expense ratio of Advantage Small Cap Core Fund and Small Cap Growth Fund II, as well as the actual management fee rate of Advantage Small Cap Core Fund and the Master Portfolio/Small Cap Growth Fund II, to those of other funds in the applicable Fund’s Broadridge category. The total expense ratio represents a fund’s total net operating expenses, including any 12b-1 or non 12b-1 service fees. The total expense ratio gives effect to any expense reimbursements or fee waivers that benefit a fund, and the actual management fee rate gives effect to any management fee reimbursements or waivers that benefit a fund. The Boards considered the services provided and the fees charged by BlackRock and its affiliates to other types of clients with similar investment mandates, as applicable, including institutional accounts and sub-advised mutual funds (including mutual funds sponsored by third parties).
The Boards received and reviewed statements relating to BlackRock’s financial condition. Each Board reviewed BlackRock’s profitability methodology and was also provided with a profitability analysis that detailed the revenues earned and the expenses incurred by BlackRock for services provided to the Funds. The Boards reviewed BlackRock’s profitability with respect to the Funds and other funds the Board currently oversees for the year ended December 31, 2016 compared to available aggregate profitability data provided for the prior two years. The Boards reviewed BlackRock’s profitability with respect to certain other U.S. fund complexes managed by the Manager and/or its affiliates. The Boards reviewed BlackRock’s assumptions and methodology of allocating expenses in the profitability analysis, noting the inherent limitations in allocating costs among various advisory products. The Boards recognized that profitability may be affected by numerous factors including, among other things, fee waivers and expense reimbursements by the Manager, the types of funds managed, precision of expense allocations and business mix. As a result, calculating and comparing profitability at individual fund levels is difficult.
| 62 | ANNUAL REPORT | MAY 31, 2017 |
| Disclosure of Investment Advisory Agreements (continued) |
The Boards noted that, in general, individual fund or product line profitability of other advisors is not publicly available. The Boards reviewed
BlackRock’s overall operating margin, in general, compared to that of certain other publicly-traded asset management firms. The Boards considered the differences between BlackRock and these other firms, including the contribution of technology at BlackRock, BlackRock’s expense management, and the relative product mix.
In addition, each Board considered the cost of the services provided to the applicable Fund by BlackRock, and BlackRock’s and its affiliates’ profits relating to the management and distribution of the applicable Fund and the other funds advised by BlackRock and its affiliates. As part of its analysis, each Board reviewed BlackRock’s methodology in allocating its costs of managing each Fund, to the applicable Fund. The Boards may receive and review information from independent third parties as part of their annual evaluation. Each Board considered whether BlackRock has the financial resources necessary to attract and retain high quality investment management personnel to perform its obligations under the pertinent Agreement and to continue to provide the high quality of services that is expected by that Board. The Boards further considered factors including but not limited to BlackRock’s commitment of time, assumption of risk and liability profile in servicing the Funds in contrast to what is required of BlackRock with respect to other products with similar investment mandates across the open-end fund, ETF, closed-end fund, sub-advised mutual fund, separately managed account, collective investment trust, and institutional separate account product channels, as applicable.
The Board of the Trust noted that Advantage Small Cap Core Fund’s contractual management fee rate ranked in the first quartile, and that the actual management fee rate and total expense ratio each ranked in the first quartile, relative to the Fund’s Expense Peers. The Board also noted that Advantage Small Cap Core Fund has an advisory fee arrangement that includes breakpoints that adjust the fee rate downward as the size of the Fund increases above certain contractually specified levels. The Board further noted that BlackRock has contractually agreed to a cap on the Fund’s total expenses as a percentage of the Fund’s average daily net assets on a class-by-class basis. Additionally, the Board noted that BlackRock proposed, and the Board agreed to, a lower contractual expense cap on a class-by-class basis. This contractual expense cap was implemented on December 1, 2016.
The Boards of each of the Master LLC and the Corporation noted that the Master Portfolio’s/Small Cap Growth Fund II’s contractual management fee rate ranked in the third quartile, and that the actual management fee rate and Small Cap Growth Fund II’s total expense ratio each ranked in the first quartile, relative to the Fund’s Expense Peers. The Boards of each of the Master LLC and the Corporation also noted that the Master Portfolio has an advisory fee arrangement that includes breakpoints that adjust the fee rate downward as the size of the Master Portfolio increases above certain contractually specified levels. The Boards further noted that BlackRock has contractually agreed to waive a portion of the advisory fee for the Master Portfolio. The Boards also noted that BlackRock proposed, and the Boards agreed to, an increase to the contractual advisory fee waiver. This advisory fee waiver increase was implemented on December 1, 2016. In addition, the Boards noted that BlackRock has contractually agreed to waive a portion of the administration fee payable by Small Cap Growth Fund II. This administration fee waiver was implemented on June 15, 2016. After discussion between the Boards, including the Independent Board Members, and BlackRock, the Boards and BlackRock agreed to a continuation of the contractual administration fee waiver. Additionally, the Boards noted that BlackRock proposed, and the Boards agreed to, a contractual expense cap on Small Cap Growth Fund’s total expenses as a percentage of Small Cap Growth Fund’s average daily net assets on a class-by-class basis. This contractual expense cap was implemented on December 1, 2016.
D. Economies of Scale: Each Board, including the Independent Board Members, considered the extent to which economies of scale might be realized as the assets of the applicable Fund increase, as well as the existence of expense caps, as applicable. Each Board also considered the extent to which the applicable Fund benefits from such economies in a variety of ways and whether there should be changes in the advisory fee rate or breakpoint structure in order to enable the Fund to more fully participate in these economies of scale. Each Board considered the applicable Fund’s asset levels and whether the current fee schedule was appropriate. In their consideration, the Board Members took into account the existence of any expense caps and further considered the continuation and/or implementation, as applicable, of such caps.
E. Other Factors Deemed Relevant by the Board Members: Each Board, including the Independent Board Members, also took into account other ancillary or “fall-out” benefits that BlackRock or its affiliates may derive from their respective relationships with the applicable Fund, both tangible and intangible, such as BlackRock’s ability to leverage its investment professionals who manage other portfolios and risk management personnel, an increase in BlackRock’s profile in the investment advisory community, and the engagement of BlackRock’s affiliates as service providers to the Fund, including for administrative, distribution, securities lending and cash management services. The Boards also considered BlackRock’s overall operations and its efforts to expand the scale of, and improve the quality of, its operations. The Boards also noted that BlackRock may use and benefit from third party research obtained by soft dollars generated by certain registered fund transactions to assist in managing all or a number of its other client accounts.
In connection with their consideration of the Agreements, the Boards also received information regarding BlackRock’s brokerage and soft dollar practices. The Boards received reports from BlackRock which included information on brokerage commissions and trade execution practices throughout the year.
| ANNUAL REPORT | MAY 31, 2017 | 63 |
| Disclosure of Investment Advisory Agreements (concluded) |
The Boards noted the competitive nature of the open-end fund marketplace, and that shareholders are able to redeem their Fund shares if they believe that the pertinent Fund’s fees and expenses are too high or if they are dissatisfied with the performance of the Fund.
Conclusion
The Board of the Trust, including the Independent Board Members, approved the continuation of the Trust Advisory Agreement between the Manager and the Trust with respect to Advantage Small Cap Core Fund for a one-year term ending June 30, 2018. The Board of the Master LLC, including the Independent Board Members, approved the continuation of the Master LLC Advisory Agreement between the Manager and the Master LLC with respect to the Master Portfolio for a one-year term ending June 30, 2018.
Based upon its evaluation of all of the aforementioned factors in their totality, as well as other information, each of the Board of the Trust and the Board of the Master LLC, including the Independent Board Members, was satisfied that the terms of the pertinent Agreement were fair and reasonable and in the best interest of the applicable Fund and its shareholders. The Board of the Corporation, including the Independent Board Members, also considered the continuation of the Master LLC Advisory Agreement with respect to the Master Portfolio and found the Master LLC Advisory Agreement to be satisfactory. In arriving at its decision to approve the applicable Agreement, the Board of the Trust and the Board of the Master LLC did not identify any single factor or group of factors as all-important or controlling, but considered all factors together, and different Board Members may have attributed different weights to the various factors considered. The Independent Board Members were also assisted by the advice of independent legal counsel in making this determination. The contractual fee arrangements for the Trust and the Master LLC reflect the results of several years of review by the respective Board Members and predecessor Board Members, and discussions between such Board Members (and predecessor Board Members) and BlackRock. As a result, the Board Members’ conclusions may be based in part on their consideration of these arrangements in prior years.
| 64 | ANNUAL REPORT | MAY 31, 2017 |
| Officers and Directors/Trustees |
Name, Address1 and Year of Birth | Position(s) Held with Trust/ Corporation/ Master LLC | Length of Time | Principal Occupation(s) During Past Five Years | Number of BlackRock- Advised Registered Investment Companies (“RICs”) Consisting of Investment Portfolios (“Portfolios”) Overseen | Public Company and Other Investment Company Directorships Held During Past Five Years | |||||
| Independent Directors/Trustees2 | ||||||||||
Rodney D. Johnson 1941 | Chair of the Board and Director/Trustee | Since 2007 | President, Fairmount Capital Advisors, Inc. from 1987 to 2013; Member of the Archdiocesan Investment Committee of the Archdiocese of Philadelphia from 2004 to 2012; Director, The Committee of Seventy (civic) from 2006 to 2012; Director, Fox Chase Cancer Center from 2004 to 2011; Director, The Mainstay (non-profit) since 2016. | 26 RICs consisting of 144 Portfolios | None | |||||
Susan J. Carter 1956 | Director/Trustee | Since 2016 | Director, Pacific Pension Institute since 2014; Advisory Board Member, Center for Private Equity and Entrepreneurship at Tuck School of Business since 1997; Senior Advisor, Commonfund Capital, Inc. (“CCI”) (investment adviser) in 2015; Chief Executive Officer, CCI from 2013 to 2014; President & Chief Executive Officer, CCI from 1997 to 2013; Advisory Board Member, Girls Who Invest since 2015; Advisory Board Member, Bridges Ventures since 2016; Trustee, Financial Accounting Foundation since 2017. | 26 RICs consisting of 144 Portfolios | None | |||||
Collette Chilton 1958 | Director/Trustee | Since 2015 | Chief Investment Officer, Williams College since 2006; Chief Investment Officer, Lucent Asset Management Corporation from 1998 to 2006. | 26 RICs consisting of 144 Portfolios | None | |||||
Neil A. Cotty 1954 | Director/Trustee | Since 2016 | Bank of America Corporation from 1996 to 2015, serving in various senior finance leadership roles, including Chief Accounting Officer, from 2009 to 2015, Chief Financial Officer of Global Banking, Markets and Wealth Management from 2008 to 2009, Chief Accounting Officer from 2004 to 2008, Chief Financial Officer of Consumer Bank from 2003 to 2004, Chief Financial Officer of Global Corporate Investment Bank from 1999 to 2002. | 26 RICs consisting of 144 Portfolios | None | |||||
Cynthia A. Montgomery 1952 | Director/Trustee | Since 2007 | Professor, Harvard Business School since 1989; Director, McLean Hospital from 2005 to 2012. | 26 RICs consisting of 144 Portfolios | Newell Rubbermaid, Inc. (manufacturing) | |||||
Joseph P. Platt 1947 | Director/Trustee | Since 2007 | General Partner, Thorn Partners, LP (private investments) since 1998; Director, WQED Multi-Media (public broadcasting not-for- profit) since 2001; Chair, Basic Health International (non-profit) since 2015. | 26 RICs consisting of 144 Portfolios | Greenlight Capital Re, Ltd. (reinsurance company); Consol Energy Inc. | |||||
Robert C. Robb, Jr. 1945 | Director/Trustee | Since 2007 | Partner, Lewis, Eckert, Robb and Company (management and financial consulting firm) since 1981 and Principal since 2010. | 26 RICs consisting of 144 Portfolios | None | |||||
Mark Stalnecker 1951 | Director/Trustee | Since 2015 | Chief Investment Officer, University of Delaware from 1999 to 2013; Trustee, Winterthur Museum and Country Estate from 2001 to 2015; Member of the Investment Committee, Delaware Public Employees’ Retirement System since 2002; Member of the Investment Committee, Christiana Care Health System since 2009; Member of the Investment Committee, Delaware Community Foundation from 2013 to 2014; Director, SEI Private Trust Co. from 2001 to 2014. | 26 RICs consisting of 144 Portfolios | None | |||||
Kenneth L. Urish 1951 | Director/Trustee | Since 2007 | Managing Partner, Urish Popeck & Co., LLC (certified public accountants and consultants) since 1976; Past-Chairman of the Professional Ethics Committee of the Pennsylvania Institute of Certified Public Accountants and Committee Member thereof since 2007; Member of External Advisory Board, The Pennsylvania State University Accounting Department since founding in 2001; Principal, UP Strategic Wealth Investment Advisors, LLC since 2013; Trustee, The Holy Family Institute from 2001 to 2010; President and Trustee, Pittsburgh Catholic Publishing Associates from 2003 to 2008; Director, Inter-Tel from 2006 to 2007. | 26 RICs consisting of 144 Portfolios | None | |||||
| ANNUAL REPORT | MAY 31, 2017 | 65 |
| Officers and Directors/Trustees (continued) |
Name, Address1 and Year of Birth | Position(s) Held with Trust/ Corporation/ Master LLC | Length of Time Served3 | Principal Occupation(s) During Past Five Years | Number of BlackRock- Advised Registered Investment Companies (“RICs”) Consisting of Investment Portfolios (“Portfolios”) Overseen | Public Company and Other Investment Company Directorships Held During Past Five Years | |||||
| Independent Directors/Trustees2 (concluded) | ||||||||||
Claire A. Walton 1957 | Director/Trustee | Since 2016 | Chief Operating Officer and Chief Financial Officer of Liberty Square Asset Management, LP from 1998 to 2015; General Partner of Neon Liberty Capital Management, LLC since 2003; Director, Boston Hedge Fund Group since 2009; Director, Woodstock Ski Runners since 2013; Director, Massachusetts Council on Economic Education from 2013 to 2015. | 26 RICs consisting of 144 Portfolios | None | |||||
Frederick W. Winter 1945 | Director/Trustee | Since 2007 | Director, Alkon Corporation since 1992; Dean Emeritus of the Joseph M. Katz School of Business, University of Pittsburgh, Dean and Professor from 1997 to 2005, Professor until 2013. | 26 RICs consisting of 144 Portfolios | None | |||||
| Interested Director/Trustee4 | ||||||||||
Barbara G. Novick 1960 | Director/Trustee | Since 2015 | Vice Chairman of BlackRock, Inc. since 2006; Chair of BlackRock’s Government Relations Steering Committee since 2009; Head of the Global Client Group of BlackRock, Inc. from 1988 to 2008. | 101 RICs consisting of 219 Portfolios | None | |||||
John M. Perlowski 1964 | Director/ Trustee, President and Chief Executive Officer | Since 2015 (Director/ Trustee); Since 2010 (President and Chief Executive Officer) | Managing Director of BlackRock, Inc. since 2009; Head of BlackRock Global Fund & Accounting Services since 2009; Managing Director and Chief Operating Officer of the Global Product Group at Goldman Sachs Asset Management, L.P. from 2003 to 2009; Treasurer of Goldman Sachs Mutual Funds from 2003 to 2009 and Senior Vice President thereof from 2007 to 2009; Director of Goldman Sachs Offshore Funds from 2002 to 2009; Advisory Director of Family Resource Network (charitable foundation) since 2009. | 129 RICs consisting of 318 Portfolios | None | |||||
1 The address of each Director/Trustee is c/o BlackRock, Inc., 55 East 52nd Street, New York, NY 10055.
2 Independent Directors/Trustees serve until their resignation, retirement, removal or death, or until December 31 of the year in which they turn 75. The Board may determine to extend the terms of Independent Directors/Trustees on a case-by-case basis, as appropriate.
3 Following the combination of Merrill Lynch Investment Managers, L.P. (“MLIM”) and BlackRock, Inc. (“BlackRock”) in September 2006, the various legacy MLIM and legacy BlackRock fund boards were realigned and consolidated into three new fund boards in 2007. As a result, although the chart shows certain Independent Directors/Trustees as joining the Board in 2007, those Independent Directors/Trustees first became members of the boards of other legacy MLIM or legacy BlackRock funds as follows: Rodney D. Johnson, 1995; Cynthia A. Montgomery, 1994; Joseph P. Platt, 1999; Robert C. Robb, Jr., 1999; Kenneth L. Urish, 1999; and Frederick W. Winter, 1999.
4 Ms. Novick and Mr. Perlowski are both “interested persons,” as defined in the 1940 Act, of the Trust/Corporation/Master LLC based on their positions with BlackRock and its affiliates. Ms. Novick and Mr. Perlowski are also board members of certain complexes of BlackRock registered open-end and closed-end funds. Ms. Novick is a board member of the BlackRock Closed-End Complex and Mr. Perlowski is also a board member of the BlackRock Equity-Bond Complex and the BlackRock Closed-End Complex. | ||||||||||
| 66 | ANNUAL REPORT | MAY 31, 2017 |
| Officers and Directors/Trustees (concluded) |
Name, Address1 and Year of Birth | Position(s) Held with Trust/ Corporation/ Master LLC | Length of Time | Principal Occupation(s) During Past Five Years | |||
| Officers Who Are Not Directors/Trustees2 | ||||||
Thomas Callahan 1968 | Vice President | Since 2016 | Managing Director of BlackRock, Inc. since 2013; Head of BlackRock’s Global Cash Management Business since 2016; Co-Head of the Global Cash Management Business from 2014 to 2016; Deputy Head of the Global Cash Management Business from 2013 to 2014; Member of the Cash Management Group Executive Committee since 2013; Chief Executive Officer of NYSE Liffe U.S. from 2008 to 2013. | |||
Jennifer McGovern 1977 | Vice President | Since 2014 | Managing Director of BlackRock, Inc. since 2016; Director of BlackRock, Inc. from 2011 to 2015; Head of Product Structure and Oversight for BlackRock’s U.S. Wealth Advisory Group since 2013; Vice President of BlackRock, Inc. from 2008 to 2010. | |||
Neal J. Andrews 1966 | Chief Financial Officer | Since 2007 | Managing Director of BlackRock, Inc. since 2006; Senior Vice President and Line of Business Head of Fund Accounting and Administration at PNC Global Investment Servicing (U.S.) Inc. from 1992 to 2006. | |||
Jay M. Fife 1970 | Treasurer | Since 2007 | Managing Director of BlackRock, Inc. since 2007; Director of BlackRock, Inc. in 2006; Assistant Treasurer of the MLIM and Fund Asset Management, L.P. advised funds from 2005 to 2006; Director of MLIM Fund Services Group from 2001 to 2006. | |||
Charles Park 1967 | Chief Compliance Officer | Since 2014 | Anti-Money Laundering Compliance Officer for the BlackRock-advised Funds in the Equity-Bond Complex, the Equity-Liquidity Complex and the Closed-End Complex from 2014 to 2015; Chief Compliance Officer of BlackRock Advisors, LLC and the BlackRock-advised Funds in the Equity-Bond Complex, the Equity-Liquidity Complex and the Closed-End Complex since 2014; Principal of and Chief Compliance Officer for iShares® Delaware Trust Sponsor LLC since 2012 and BlackRock Fund Advisors (“BFA”) since 2006; Chief Compliance Officer for the BFA-advised iShares® exchange traded funds since 2006; Chief Compliance Officer for BlackRock Asset Management International Inc. since 2012. | |||
Fernanda Piedra 1969 | Anti-Money Laundering Compliance Officer | Since 2015 | Director of BlackRock, Inc. since 2014; Anti-Money Laundering Compliance Officer and Regional Head of Financial Crime for the Americas at BlackRock, Inc. since 2014; Head of Regulatory Changes and Remediation for the Asset Wealth Management Division of Deutsche Bank from 2010 to 2014; Vice President of Goldman Sachs (Anti-Money Laundering/Suspicious Activities Group) from 2004 to 2010. | |||
Benjamin Archibald 1975 | Secretary | Since 2012 | Managing Director of BlackRock, Inc. since 2014; Director of BlackRock, Inc. from 2010 to 2013; Secretary of the iShares® exchange traded funds since 2015; Secretary of the BlackRock-advised mutual funds since 2012. | |||
1 The address of each Officer is c/o BlackRock Inc., 55 East 52nd Street, New York, NY 10055.
2 Officers of the Trust/Corporation/Master LLC serve at the pleasure of the Board. | ||||||
Further information about the Trust’s/Corporation’s/Master LLC’s Officers and Directors/Trustees is available in the Trust’s/Corporation’s/Master LLC’s Statement of Additional Information, which can be obtained without charge by calling 1-800-441-7762. | ||||||
Investment Adviser and Administrator BlackRock Advisors, LLC Wilmington, DE 19809 | Accounting Agent and Transfer Agent BNY Mellon Investment Servicing (US) Inc. Wilmington, DE 19809 | Independent Registered Public Accounting Firm Deloitte & Touche LLP Philadelphia, PA 19103 | Address of the Funds 100 Bellevue Parkway Wilmington, DE 19809 | |||
Custodians Brown Brothers Harriman & Co.1 Boston, MA 02109
The Bank of New York Mellon2 New York, NY 10286 | Distributor BlackRock Investments, LLC New York, NY 10022 | Legal Counsel Sidley Austin LLP New York, NY 10019 |
| 1 | For BlackRock Master Small Cap Growth Portfolio. |
| 2 | For BlackRock Advantage Small Cap Core Fund. |
| ANNUAL REPORT | MAY 31, 2017 | 67 |
| Additional Information |
| General Information |
Householding
The Funds will mail only one copy of shareholder documents, including prospectuses, annual and semi-annual reports and proxy statements, to shareholders with multiple accounts at the same address. This practice is commonly called “householding” and is intended to reduce expenses and eliminate duplicate mailings of shareholder documents. Mailings of your shareholder documents may be householded indefinitely unless you instruct us otherwise. If you do not want the mailing of these documents to be combined with those for other members of your household, please call the Funds at (800) 441-7762.
Availability of Quarterly Schedule of Investments
The Funds/Master Portfolio file their complete schedule of portfolio holdings with the SEC for the first and third quarters of each fiscal year on Form N-Q. The Funds’/Master Portfolio’s Forms N-Q are available on the SEC’s website at http://www.sec.gov and may also be reviewed and copied at the SEC’s Public Reference Room in Washington, D.C. Information on the operation of the Public Reference Room or how to access documents on the SEC’s website without charge may be obtained by calling (800) SEC-0330. The Funds’/Master Portfolio’s Forms N-Q may also be obtained upon request and without charge by calling (800) 441-7762.
Availability of Proxy Voting Policies and Procedures
A description of the policies and procedures that the Funds/Master Portfolio use to determine how to vote proxies relating to portfolio securities is available upon request and without charge (1) by calling (800) 441-7762; (2) at http://www.blackrock.com; and (3) on the SEC’s website at http://www.sec.gov.
Availability of Proxy Voting Record
Information about how the Funds/Master Portfolio voted proxies relating to securities held in the Funds’/Master Portfolio’s portfolios during the most recent 12-month period ended June 30 is available upon request and without charge (1) at http://www.blackrock.com or by calling (800) 441-7762 and (2) on the SEC’s website at http://www.sec.gov.
BlackRock’s Mutual Fund Family
BlackRock offers a diverse lineup of open-end mutual funds crossing all investment styles and managed by experts in equity, fixed income and tax-exempt investing. Visit http://www.blackrock.com for more information.
| Shareholder Privileges |
Account Information
Call us at (800) 441-7762 from 8:00 AM to 6:00 PM EST on any business day to get information about your account balances, recent transactions and share prices. You can also reach us on the Web at http://www.blackrock.com/funds.
Automatic Investment Plans
Investor Class shareholders who want to invest regularly can arrange to have $50 or more automatically deducted from their checking or savings account and invested in any of the BlackRock funds.
Systematic Withdrawal Plans
Investor Class shareholders can establish a systematic withdrawal plan and receive periodic payments of $50 or more from their BlackRock funds, as long as their account balance is at least $10,000.
Retirement Plans
Shareholders may make investments in conjunction with Traditional, Rollover, Roth, Coverdell, Simple IRAs, SEP IRAs and 403(b) Plans.
| 68 | ANNUAL REPORT | MAY 31, 2017 |
| Additional Information (concluded) |
| BlackRock Privacy Principles |
BlackRock is committed to maintaining the privacy of its current and former fund investors and individual clients (collectively, “Clients”) and to safeguarding their non-public personal information. The following information is provided to help you understand what personal information BlackRock collects, how we protect that information and why in certain cases we share such information with select parties.
If you are located in a jurisdiction where specific laws, rules or regulations require BlackRock to provide you with additional or different privacy-related rights beyond what is set forth below, then BlackRock will comply with those specific laws, rules or regulations.
BlackRock obtains or verifies personal non-public information from and about you from different sources, including the following: (i) information we receive from you or, if applicable, your financial intermediary, on applications, forms or other documents; (ii) information about your transactions with us, our affiliates, or others; (iii) information we receive from a consumer reporting agency; and (iv) from visits to our websites.
BlackRock does not sell or disclose to non-affiliated third parties any non-public personal information about its Clients, except as permitted by law or as is necessary to respond to regulatory requests or to service Client accounts. These non-affiliated third parties are required to protect the confidentiality and security of this information and to use it only for its intended purpose.
We may share information with our affiliates to service your account or to provide you with information about other BlackRock products or services that may be of interest to you. In addition, BlackRock restricts access to non-public personal information about its Clients to those BlackRock employees with a legitimate business need for the information. BlackRock maintains physical, electronic and procedural safeguards that are designed to protect the non-public personal information of its Clients, including procedures relating to the proper storage and disposal of such information.
| ANNUAL REPORT | MAY 31, 2017 | 69 |
This report is intended for current holders. It is not authorized for use as an offer of sale or a solicitation of an offer to buy shares of the Funds unless preceded or accompanied by the Funds’ current prospectus. Past performance results shown in this report should not be considered a representation of future performance. Investment returns and principal value of shares will fluctuate so that shares, when redeemed, may be worth more or less than their original cost. Statements and other information herein are as dated and are subject to change.

SC2-5/17-AR |  | |
| Item 2 – | Code of Ethics – Each registrant (or “Fund”) has adopted a code of ethics, as of the end of the period covered by this report, applicable to the registrant’s principal executive officer, principal financial officer, principal accounting officer or controller, or persons performing similar functions. During the period covered by this report, the code of ethics was amended to update certain information and to make other non-material changes. During the period covered by this report, there have been no waivers granted under the code of ethics. Each registrant undertakes to provide a copy of the code of ethics to any person upon request, without charge, by calling 1-800-441-7762. |
| Item 3 – | Audit Committee Financial Expert – Each registrant’s board of directors (the “board of directors”), has determined that (i) the registrant has the following audit committee financial expert serving on its audit committee and (ii) each audit committee financial expert is independent: |
Kenneth L. Urish
Under applicable securities laws, a person determined to be an audit committee financial expert will not be deemed an “expert” for any purpose, including without limitation for the purposes of Section 11 of the Securities Act of 1933, as a result of being designated or identified as an audit committee financial expert. The designation or identification of a person as an audit committee financial expert does not impose on such person any duties, obligations, or liabilities greater than the duties, obligations, and liabilities imposed on such person as a member of the audit committee and board of directors in the absence of such designation or identification.
| Item 4 – | Principal Accountant Fees and Services |
The following table presents fees billed by Deloitte & Touche LLP (“D&T”) in each of the last two fiscal years for the services rendered to the Funds:
| (a) Audit Fees | (b) Audit-Related Fees1 | (c) Tax Fees2 | (d) All Other Fees | |||||||||||||
| Entity Name | Current Fiscal Year End | Previous End | Current End | Previous End | Current End | Previous End | Current End | Previous End | ||||||||
| BlackRock Small Cap Growth Fund II of BlackRock Series, Inc. | $8,058 | $7,408 | $0 | $0 | $13,107 | $13,107 | $0 | $0 | ||||||||
| BlackRock Master Small Cap Growth Portfolio of BlackRock Master LLC | $31,714 | $32,934 | $0 | $0 | $0 | $0 | $0 | $0 | ||||||||
2
The following table presents fees billed by D&T that were required to be approved by each registrant’s audit committee (each a “Committee”) for services that relate directly to the operations or financial reporting of the Fund and that are rendered on behalf of BlackRock Advisors, LLC (“Investment Adviser” or “BlackRock”) and entities controlling, controlled by, or under common control with BlackRock (not including any sub-adviser whose role is primarily portfolio management and is subcontracted with or overseen by another investment adviser) that provide ongoing services to the Fund (“Affiliated Service Providers”):
| Current Fiscal Year End | Previous Fiscal Year End | |||
(b) Audit-Related Fees1 | $0 | $0 | ||
(c) Tax Fees2 | $0 | $0 | ||
(d) All Other Fees3 | $2,129,000 | $2,154,000 |
1 The nature of the services includes assurance and related services reasonably related to the performance of the audit or review of financial statements not included in Audit Fees, including accounting consultations, agreed-upon procedure reports, attestation reports, comfort letters, out-of-pocket expenses and internal control reviews not required by regulators.
2 The nature of the services includes tax compliance and/or tax preparation, including services relating to the filing or amendment of federal, state or local income tax returns, regulated investment company qualification reviews, taxable income and tax distribution calculations.
3 Non-audit fees of $2,129,000 and $2,154,000 for the current fiscal year and previous fiscal year, respectively, were paid to the Fund’s principal accountant in their entirety by BlackRock, in connection with services provided to the Affiliated Service Providers of the Fund and of certain other funds sponsored and advised by BlackRock or its affiliates for a service organization review and an accounting research tool subscription. These amounts represent aggregate fees paid by BlackRock and were not allocated on a per fund basis.
(e)(1) Audit Committee Pre-Approval Policies and Procedures:
Each Committee has adopted policies and procedures with regard to the pre-approval of services. Audit, audit-related and tax compliance services provided to the registrant on an annual basis require specific pre-approval by the registrant’s Committee. The Committee also must approve other non-audit services provided to the registrant and those non-audit services provided to the Investment Adviser and Affiliated Service Providers that relate directly to the operations and the financial reporting of the registrant. Certain of these non-audit services that the Committee believes are (a) consistent with the SEC’s auditor independence rules and (b) routine and recurring services that will not impair the independence of the independent accountants may be approved by the Committee without consideration on a specific case-by-case basis (“general pre-approval”). The term of any general pre-approval is 12 months from the date of the pre-approval, unless the Committee provides for a different period. Tax or other non-audit services provided to the registrants which have a direct impact on the operations or financial reporting of the registrant will only be deemed pre-approved provided that any individual project does not exceed $10,000 attributable to the registrant or $50,000 per project. For this purpose, multiple projects will be aggregated to determine if they exceed the previously mentioned cost levels.
Any proposed services exceeding the pre-approved cost levels will require specific pre-approval by the registrant’s Committee, as will any other services not subject to general pre-approval (e.g., unanticipated but permissible services). The Committee is informed of each service approved subject to general pre-approval at the next regularly scheduled in-person board meeting. At this meeting, an analysis of such services is presented to the Committee for ratification. The Committee may delegate to the Committee Chairman the authority to approve the provision of and fees for any specific engagement of permitted non-audit services, including services exceeding pre-approved cost levels.
(e)(2) None of the services described in each of Items 4(b) through (d) were approved by either Committee pursuant to the de minimus exception in paragraph (c)(7)(i)(C) of Rule 2-01 of Regulation S-X.
(f) Not Applicable
3
(g) The aggregate non-audit fees, defined as the sum of the fees shown under “Audit-Related Fees,” “Tax Fees” and “All Other Fees,” paid to the accountant for services rendered by the accountant to the registrant, the Investment Adviser and the Affiliated Service Providers were:
| Entity Name | Current Fiscal Year End | Previous Fiscal Year End | ||
| BlackRock Small Cap Growth Fund II of BlackRock Series, Inc. | $13,107 | $13,107 | ||
| BlackRock Master Small Cap Growth Portfolio of BlackRock Master LLC | $0 | $0 |
Additionally, the amounts billed by D&T in connection with services provided to the Affiliated Service Providers of the Fund and of other funds sponsored and advised by BlackRock or its affiliates during the current and previous fiscal years for a service organization review and an accounting research tool subscription were:
Current Fiscal Year End | Previous Fiscal Year End | |
$2,129,000 | $2,154,000 |
These amounts represent aggregate fees paid by BlackRock and were not allocated on a per fund basis.
(h) Each Committee has considered and determined that the provision of non-audit services that were rendered to the Investment Adviser and the Affiliated Service Providers that were not pre-approved pursuant to paragraph (c)(7)(ii) of Rule 2-01 of Regulation S-X is compatible with maintaining the principal accountant’s independence.
| Item 5 – | Audit Committee of Listed Registrants – Not Applicable | |
| Item 6 – | Investments | |
| (a) The registrants’ Schedules of Investments are included as part of the Report to Stockholders filed under Item 1 of this Form. | ||
| (b) Not Applicable due to no such divestments during the semi-annual period covered since the previous Form N-CSR filing. | ||
| Item 7 – | Disclosure of Proxy Voting Policies and Procedures for Closed-End Management Investment Companies – Not Applicable | |
| Item 8 – | Portfolio Managers of Closed-End Management Investment Companies – Not Applicable | |
| Item 9 – | Purchases of Equity Securities by Closed-End Management Investment Company and Affiliated Purchasers – Not Applicable | |
| Item 10 – | Submission of Matters to a Vote of Security Holders – There have been no material changes to these procedures. | |
| Item 11 – | Controls and Procedures | |
| (a) – The registrants’ principal executive and principal financial officers, or persons performing similar functions, have concluded that the registrants’ disclosure controls and procedures (as defined in Rule 30a-3(c) under the Investment Company Act of 1940, as amended (the “1940 Act”)) are effective as of a date within 90 days of the filing of this report based on the evaluation of these controls and procedures required by Rule 30a-3(b) under the 1940 Act and Rule 15(d)-15(b) under the Securities Exchange Act of 1934, as amended. | ||
4
| (b) – There were no changes in the registrants’ internal control over financial reporting (as defined in Rule 30a-3(d) under the 1940 Act) that occurred during the second fiscal quarter of the period covered by this report that have materially affected, or are reasonably likely to materially affect, the registrants’ internal control over financial reporting. | ||
| Item 12 – | Exhibits attached hereto | |
| (a)(1) – Code of Ethics – See Item 2 | ||
| (a)(2) – Certifications – Attached hereto | ||
| (a)(3) – Not Applicable | ||
| (b) – Certifications – Attached hereto | ||
5
| Pursuant to the requirements of the Securities Exchange Act of 1934 and the Investment Company Act of 1940, each registrant has duly caused this report to be signed on its behalf by the undersigned, thereunto duly authorized. |
BlackRock Small Cap Growth Fund II of BlackRock Series, Inc. and BlackRock Master Small Cap Growth Portfolio of BlackRock Master LLC
By: /s/ John M. Perlowski
John M. Perlowski
Chief Executive Officer (principal executive officer) of
BlackRock Small Cap Growth Fund II of BlackRock Series, Inc. and BlackRock Master Small Cap
Growth Portfolio of BlackRock Master LLC
Date: August 4, 2017
Pursuant to the requirements of the Securities Exchange Act of 1934 and the Investment Company Act of 1940, this report has been signed below by the following persons on behalf of each registrant and in the capacities and on the dates indicated.
By: /s/ John M. Perlowski
John M. Perlowski
Chief Executive Officer (principal executive officer) of
BlackRock Small Cap Growth Fund II of BlackRock Series, Inc. and BlackRock Master Small Cap
Growth Portfolio of BlackRock Master LLC
Date: August 4, 2017
By: /s/ Neal J. Andrews
Neal J. Andrews
Chief Financial Officer (principal financial officer) of
BlackRock Small Cap Growth Fund II of BlackRock Series, Inc. and BlackRock Master Small Cap
Growth Portfolio of BlackRock Master LLC
Date: August 4, 2017
6