UNITED STATES
SECURITIES AND EXCHANGE COMMISSION
Washington, D.C. 20549
FORM N-CSR
CERTIFIED SHAREHOLDER REPORT OF REGISTERED MANAGEMENT INVESTMENT COMPANIES
Investment Company Act file number: 811-08797
Name of Fund: BlackRock International Fund of BlackRock Series, Inc.
Fund Address: 100 Bellevue Parkway, Wilmington, DE 19809
Name and address of agent for service: John M. Perlowski, Chief Executive Officer, BlackRock International Fund
of BlackRock Series, Inc., 55 East 52nd Street, New York, NY 10055
Registrant’s telephone number, including area code: (800) 441-7762
Date of fiscal year end: 10/31/2017
Date of reporting period: 10/31/2017
Item 1 – Report to Stockholders
OCTOBER 31, 2017
ANNUAL REPORT |  |
BlackRock Series, Inc.
| Ø | BlackRock International Fund |
| Not FDIC Insured • May Lose Value • No Bank Guarantee |
Dear Shareholder,
In the 12 months ended October 31, 2017, risk assets, such as stocks and high-yield bonds, continued to deliver strong performance. These markets showed great resilience during a period with big political surprises, including the aftermath of the U.K.’s vote to leave the European Union and the outcome of the U.S. presidential election, which brought only brief spikes in equity market volatility. In contrast, closely watched elections in France, the Netherlands, and Australia countered the isolationist and nationalist political developments in the U.K. and the United States.
Interest rates rose, which worked against high-quality assets with more interest rate sensitivity. Consequently, longer-term U.S. Treasuries posted negative returns, as rising energy prices, modest wage increases, and steady job growth led to expectations of higher inflation and further interest rate increases by the U.S. Federal Reserve (the “Fed”).
The market’s performance reflected reflationary expectations early in the reporting period, as investors began to sense that a global recovery was afoot. Thereafter, many countries throughout the world experienced sustained and synchronized growth for the first time since the financial crisis. Growth rates and inflation are still relatively low, but they are finally rising together.
The Fed responded to these positive developments by increasing short-term interest rates three times and setting expectations for additional interest rate increases. The Fed also began reducing the vast balance sheet reserves that had accumulated in the wake of the financial crisis. In October 2017, the Fed reduced its $4.5 trillion balance sheet by only $10 billion, while setting expectations for additional modest reductions and rate hikes in 2018.
By contrast, the European Central Bank (“ECB”) and the Bank of Japan (“BoJ”) both continued to expand their balance sheets despite nascent signs of sustained economic growth. The Eurozone and Japan are both approaching the limits of central banks’ ownership share of debt issued by their respective governments, which is a structural pressure point that limits their capacity to deliver additional monetary stimulus. In October 2017, the ECB announced plans to cut the amount of its bond purchases in half for 2018, while the BoJ reiterated its commitment to economic stimulus until the inflation rate rises to its target of 2.0%.
Emerging market growth also stabilized, as accelerating growth in China, the second largest economy in the world and the most influential of all developing economies, improved the outlook for corporate profits and economic growth across most developing nations. Chinese demand for commodities and other raw materials allayed concerns about the country’s banking system, leading to rising equity prices and foreign investment flows.
While escalating tensions between the United States and North Korea and our nation’s divided politics are significant concerns, benign credit conditions, modest inflation, solid corporate earnings, and the positive outlook for growth in the world’s largest economies have kept markets relatively tranquil.
High valuations across most assets have laid the groundwork for muted returns going forward. At current valuation levels, potential equity gains will likely be closely tied to the pace of earnings growth, which has remained solid thus far in 2017, particularly in emerging markets. In this environment, investors need to think globally, extend their scope across a broad array of asset classes, and be nimble as market conditions change. We encourage you to talk with your financial advisor and visit blackrock.com for further insight about investing in today’s markets.
Sincerely,

Rob Kapito
President, BlackRock Advisors, LLC

Rob Kapito
President, BlackRock Advisors, LLC
| Total Returns as of October 31, 2017 | ||||
| 6-month | 12-month | |||
U.S. large cap equities | 9.10% | 23.63% | ||
U.S. small cap equities | 8.01 | 27.85 | ||
International equities | 10.74 | 23.44 | ||
Emerging market equities | 16.14 | 26.45 | ||
3-month Treasury bills | 0.49 | 0.72 | ||
U.S. Treasury securities | 0.15 | (2.98) | ||
U.S. investment grade bonds | 1.58 | 0.90 | ||
Tax-exempt municipal bonds | 2.22 | 1.80 | ||
U.S. high yield bonds | 3.44 | 8.92 | ||
| Past performance is no guarantee of future results. Index performance is shown for illustrative purposes only. You cannot invest directly in an index. | ||||
| 2 | THIS PAGEISNOT PARTOF YOUR FUND REPORT |
Table of Contents
| Page | ||||
| 2 | ||||
| 4 | ||||
| 6 | ||||
| 6 | ||||
| 7 | ||||
| 10 | ||||
| 11 | ||||
| 12 | ||||
| 17 | ||||
| 24 | ||||
| 24 | ||||
Disclosure of Investment Advisory Agreement and Sub-Advisory Agreement | 25 | |||
| 29 | ||||
| 32 | ||||

| 3 |
| Fund Summary as of October 31, 2017 | BlackRock International Fund |
Investment Objective
BlackRock International Fund’s (the “Fund”) investment objective is to seek long-term capital growth through investments primarily in a diversified portfolio of equity securities of companies located outside the United States.
On November 21, 2016, the Board approved the conversion of the Fund, a series of BlackRock Series, Inc., from a “master-feeder” structure into a stand-alone mutual fund effective February 27, 2017.
Portfolio Management Commentary
How did the Fund perform?
For the 12-month period ended October 31, 2017, the Fund’s Institutional and Investor A Shares outperformed its benchmark, the MSCI All Country World Index ex-USA, while its Investor C and Class R Shares underperformed.
What factors influenced performance?
The largest contributors to performance relative to the benchmark were the Fund’s overweight to and stock selection within financials, especially among banks. An overweight and stock selection in information technology (“IT”) also represented a significant driver of positive returns, particularly within the software and IT services industries. Stock selection in industrials and utilities also boosted performance. The top individual performers in the Fund over the period were business network security firm Trend Micro, Inc. and Italian banking group Intesa Sanpaolo SpA. Trend Micro continued to post strong performance, supported by positive earnings results and better-than-expected business trends, which contributed to growth in its cloud computing business. Intesa shares continued to perform well based on strong earnings results and strategic asset acquisitions.
The most significant detractor from performance was stock selection in the consumer discretionary sector, mainly within the specialty retail industry. Stock selection in telecommunication services (“telecom”) also detracted, particularly within diversified telecom. The Fund’s modest cash position also represented a drag on performance, as did unfavorable stock selection in health care, especially among health care equipment and supply companies. The largest individual detractors during the period were U.K. home improvement retailer Kingfisher PLC and British telecom firm BT Group PLC. Shares of Kingfisher declined following the U.K. election, as investors feared the impact on Kingfisher’s business from receding U.K. consumer confidence and a possible “hard Brexit.” Holdings in BT Group declined following the discovery of accounting irregularities in the company’s Italian business, and the lowering of the company’s growth outlook for its Europe services.
Describe recent portfolio activity.
The largest change to the Fund’s active positioning was a significant increase in consumer staples exposure, moving from an underweight stance to a meaningful overweight. This was driven by new positions in Imperial Brands PLC, Reckitt Benckiser Group PLC, and Diageo PLC. In contrast, a modest overweight to industrials was changed to a zero weight, driven by sales of Recruit Holdings Co. Ltd. and Randstad Holding NV. Exposure to consumer discretionary was also reduced following sales of Bridgestone Corp. and TripAdvisor, Inc.
Describe portfolio positioning at period end.
The Fund’s largest overweight exposures were to the consumer staples, financials and energy sectors. The largest underweight exposures were to industrials, materials and real estate. On a regional basis, the Fund’s largest overweight exposures were in the United Kingdom and the United States, while the largest underweight exposures were to Canada and Australia.
The views expressed reflect the opinions of BlackRock as of the date of this report and are subject to change based on changes in market, economic or other conditions. These views are not intended to be a forecast of future events and are no guarantee of future results.
Portfolio Information
| Ten Largest Holdings | Percent of Net Assets | |||
Sony Corp. | 7 | % | ||
Trend Micro, Inc. | 5 | |||
Bank of China Ltd., H Shares | 5 | |||
Banco Bilbao Vizcaya Argentaria SA | 4 | |||
Imperial Brands PLC | 4 | |||
Statoil ASA | 4 | |||
Cie Financiere Richemont SA, Registered Shares | 4 | |||
ICICI Bank Ltd. | 4 | |||
Bayer AG, Registered Shares | 3 | |||
Diageo PLC | 3 | |||
| Geographic Allocation | Percent of Net Assets | |||
Japan | 19 | % | ||
United Kingdom | 17 | |||
China | 9 | |||
Netherlands | 7 | |||
Spain | 6 | |||
Short-Term Securities | 5 | |||
United States | 4 | |||
Norway | 4 | |||
Switzerland | 4 | |||
India | 3 | |||
Germany | 3 | |||
Italy | 3 | |||
France | 3 | |||
Hong Kong | 3 | |||
Brazil | 3 | |||
Portugal | 2 | |||
Indonesia | 2 | |||
Russia | 2 | |||
Australia | 2 | |||
Singapore | 1 | |||
Liabilities in Excess of Other Assets | (2 | ) | ||
| 4 | FUND SUMMARY |
| Fund Summary as of October 31, 2017 | BlackRock International Fund |
TOTAL RETURN BASED ON A $10,000 INVESTMENT
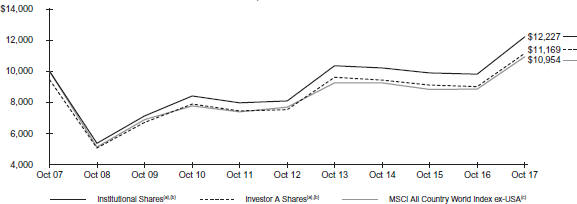
| (a) | Assuming maximum sales charges, if any, transaction costs and other operating expenses, including investment advisory fees and administration fees. Institutional Shares do not have a sales charge. |
| (b) | The Fund invests primarily in stocks of companies located outside the United States. |
| (c) | A free float-adjusted market capitalization index designed to measure the combined equity market performance of developed and emerging market countries, excluding the United States. |
Performance Summary for the Period Ended October 31, 2017
| Average Annual Total Returns (d) | ||||||||||||||||||||||||||||||||||||||||
| 1 Year | 5 Years | 10 Years | ||||||||||||||||||||||||||||||||||||||
| 6-Month Total Returns | w/o sales charge | w/sales charge | w/o sales charge | w/sales charge | w/o sales charge | w/sales charge | ||||||||||||||||||||||||||||||||||
Institutional | 10.92 | % | 24.36 | % | N/A | 8.56 | % | N/A | 2.03 | % | N/A | |||||||||||||||||||||||||||||
Investor A | 10.63 | 23.77 | 17.27 | % | 8.14 | 6.98 | % | 1.66 | 1.11 | % | ||||||||||||||||||||||||||||||
Investor C | 10.23 | 22.69 | 21.69 | 7.08 | 7.08 | 0.76 | 0.76 | |||||||||||||||||||||||||||||||||
Class R | 10.50 | 23.44 | N/A | 7.81 | N/A | 1.39 | N/A | |||||||||||||||||||||||||||||||||
MSCI All Country World Index ex-USA | 12.02 | 23.64 | N/A | 7.29 | N/A | 0.92 | N/A | |||||||||||||||||||||||||||||||||
| (d) | Assuming maximum sales charges, if any. Average annual total returns with and without sales charges reflect reductions for distribution and service fees. See “About Fund Performance” on page 6 for a detailed description of share classes, including any related sales charges and fees. |
N/A — Not applicable as share class and index do not have a sales charge.
Past performance is not indicative of future results.
Performance results may include adjustments made for financial reporting purposes in accordance with U.S. generally accepted accounting principles.
Expense Example
| Actual | Hypothetical (f) | |||||||||||||||||||||||||||||||
| Beginning Account Value 05/01/17 | Ending Account Value | Expenses Paid During the Period (e) | Beginning Account Value | Ending Account Value | Expenses Paid During the Period (e) | Annualized Expense | ||||||||||||||||||||||||||
Institutional | $ | 1,000.00 | $ | 1,109.20 | $ | 5.37 | $ | 1,000.00 | $ | 1,020.11 | $ | 5.15 | 1.01 | % | ||||||||||||||||||
Investor A | $ | 1,000.00 | $ | 1,106.30 | $ | 7.34 | $ | 1,000.00 | $ | 1,018.23 | $ | 7.04 | 1.38 | % | ||||||||||||||||||
Investor C | $ | 1,000.00 | $ | 1,102.30 | $ | 12.05 | $ | 1,000.00 | $ | 1,013.75 | $ | 11.54 | 2.27 | % | ||||||||||||||||||
Class R | $ | 1,000.00 | $ | 1,105.00 | $ | 8.80 | $ | 1,000.00 | $ | 1,016.84 | $ | 8.44 | 1.66 | % | ||||||||||||||||||
| (e) | For each class of the Fund, expenses are equal to the annualized expense ratio for the class, multiplied by the average account value over the period, multiplied by 184/365 (to reflect the one-half year period shown). |
| (f) | Hypothetical 5% annual return before expenses is calculated by prorating the number of days in the most recent fiscal half year divided by 365. |
See “Disclosure of Expenses” on page 6 for further information on how expenses were calculated.
| 2017 BLACKROCK ANNUAL REPORTTO SHAREHOLDERS | 5 |
Institutional Shares are not subject to any sales charge. These shares bear no ongoing distribution or service fees and are available only to certain eligible investors.
Investor A Shares are subject to a maximum initial sales charge (front-end load) of 5.25% and a service fee of 0.25% per year (but no distribution fee). Certain redemptions of these shares may be subject to a contingent deferred sales charge (“CDSC”) where no initial sales charge was paid at the time of purchase. These shares are generally available through financial intermediaries.
Investor C Shares are subject to a 1.00% CDSC if redeemed within one year of purchase. In addition, these shares are subject to a distribution fee of 0.75% per year and a service fee of 0.25% per year. These shares are generally available through financial intermediaries.
Class R Shares are not subject to any sales charge. These shares are subject to a distribution fee of 0.25% per year and a service fee of 0.25% per year. These shares are available only to certain employer-sponsored retirement plans. Prior to August 15, 2011 (commencement of operations), Class R Shares’ performance results are those of Institutional Shares (which have no distribution or service fees) restated to reflect Class R Shares’ fees.
Performance information reflects past performance and does not guarantee future results. Current performance may be lower or higher than the performance data quoted. Refer to www.blackrock.com to obtain performance data current to the most recent month end. Performance results do not reflect the deduction of taxes that a shareholder would pay on fund distributions or the redemption of fund shares. Figures shown in the performance table on the previous page assume reinvestment of all distributions, if any, at net asset value (“NAV”) on the ex-dividend date. Investment return and principal value of shares will fluctuate so that shares, when redeemed, may be worth more or less than their original cost. Distributions paid to each class of shares will vary because of the different levels of service, distribution and transfer agency fees applicable to each class, which are deducted from the income available to be paid to shareholders.
BlackRock Advisors, LLC (the “Manager”), the Fund’s investment adviser, has contractually agreed to waive and/or reimburse a portion of the Fund’s expenses. Without such waiver and/or reimbursement, the Fund’s performance would have been lower. The Manager is under no obligation to continue waiving and/or reimbursing its fees after the applicable termination date of such agreement. See Note 5 of the Notes to Financial Statements for additional information on waivers and/or reimbursements.
Shareholders of the Fund may incur the following charges: (a) transactional expenses, such as sales charges; and (b) operating expenses, including administration fees, service and distribution fees, including 12b-1 fees, acquired fund fees and expenses and other fund expenses. The expense example on the previous page (which is based on a hypothetical investment of $1,000 invested on May 1, 2017 and held through October 31, 2017) is intended to assist shareholders both in calculating expenses based on an investment in the Fund and in comparing these expenses with similar costs of investing in other mutual funds.
The expense example provides information about actual account values and actual expenses. In order to estimate the expenses a shareholder paid during the period covered by this report, shareholders can divide their account value by $1,000 and then multiply the result by the number corresponding to the Fund and share class under the heading entitled “Expenses Paid During the Period.”
The expense example also provides information about hypothetical account values and hypothetical expenses based on the Fund’s actual expense ratio and an assumed rate of return of 5% per year before expenses. In order to assist shareholders in comparing the ongoing expenses of investing in the Fund and other funds, compare the 5% hypothetical example with the 5% hypothetical examples that appear in shareholder reports of other funds.
The expenses shown in the expense example are intended to highlight shareholders’ ongoing costs only and do not reflect transactional expenses, such as sales charges, if any. Therefore, the hypothetical example is useful in comparing ongoing expenses only, and will not help shareholders determine the relative total expenses of owning different funds. If these transactional expenses were included, shareholder expenses would have been higher.
| 6 | ABOUT FUND PERFORMANCE / DISCLOSUREOF EXPENSES |
October 31, 2017 | BlackRock International Fund (Percentages shown are based on Net Assets) |
| Security | Shares | Value | ||||||
Common Stocks — 96.8% |
| |||||||
| Australia — 1.6% | ||||||||
Oil Search Ltd. | 1,718,399 | $ | 9,740,555 | |||||
|
| |||||||
| Brazil — 2.6% | ||||||||
Vale SA — ADR(a) | 1,596,689 | 15,631,585 | ||||||
|
| |||||||
| China — 8.9% | ||||||||
Bank of China Ltd., H Shares | 57,310,000 | 28,641,410 | ||||||
NetEase, Inc. — ADR | 55,399 | 15,618,086 | ||||||
Ping An Insurance Group Co. of China Ltd., H Shares | 1,054,500 | 9,266,889 | ||||||
|
| |||||||
| 53,526,385 | ||||||||
|
| |||||||
| France — 2.9% | ||||||||
Engie SA | 1,030,226 | 17,412,845 | ||||||
|
| |||||||
| Germany — 3.5% | ||||||||
Bayer AG, Registered Shares | 159,376 | 20,731,458 | ||||||
|
| |||||||
| Hong Kong — 2.9% | ||||||||
AIA Group Ltd. | 2,262,600 | 17,049,775 | ||||||
|
| |||||||
| India — 3.5% | ||||||||
ICICI Bank Ltd. | 4,491,854 | 21,057,036 | ||||||
|
| |||||||
| Indonesia — 2.1% | ||||||||
Bank Mandiri Persero Tbk PT | 23,625,700 | 12,271,238 | ||||||
|
| |||||||
| Italy — 3.0% | ||||||||
Intesa Sanpaolo SpA | 5,362,423 | 18,027,962 | ||||||
|
| |||||||
| Japan — 19.4% | ||||||||
Japan Tobacco, Inc. | 441,700 | 14,620,359 | ||||||
Olympus Corp. | 299,500 | 11,145,795 | ||||||
Omron Corp. | 340,400 | 19,074,495 | ||||||
Sony Corp. | 995,300 | 41,638,070 | ||||||
Trend Micro, Inc. | 545,800 | 29,267,777 | ||||||
|
| |||||||
| 115,746,496 | ||||||||
|
| |||||||
| Netherlands — 6.6% | ||||||||
ASML Holding NV | 70,237 | 12,672,820 | ||||||
Heineken NV | 153,380 | 14,944,251 | ||||||
Koninklijke Philips NV | 290,399 | 11,834,609 | ||||||
|
| |||||||
| 39,451,680 | ||||||||
|
| |||||||
| Norway — 4.0% | ||||||||
Statoil ASA | 1,180,448 | 23,983,777 | ||||||
|
| |||||||
| Portugal — 2.4% | ||||||||
Banco Comercial Portugues SA, Class R(a) | 48,871,850 | 14,604,399 | ||||||
|
| |||||||
| Russia — 1.8% | ||||||||
Sberbank of Russia PJSC — ADR | 741,419 | 10,641,003 | ||||||
|
| |||||||
| Singapore — 0.8% | ||||||||
Sea Ltd. — ADR(a) | 301,826 | 4,551,536 | ||||||
|
| |||||||
| Spain — 6.3% | ||||||||
Banco Bilbao Vizcaya Argentaria SA | 3,007,630 | 26,300,146 | ||||||
CaixaBank SA | 2,484,571 | 11,623,803 | ||||||
|
| |||||||
| 37,923,949 | ||||||||
|
| |||||||
| Switzerland — 3.9% | ||||||||
Cie Financiere Richemont SA, Registered Shares | 255,485 | 23,552,211 | ||||||
|
| |||||||
| United Kingdom — 16.5% | ||||||||
British American Tobacco PLC | 188,231 | 12,161,525 | ||||||
BT Group PLC | 5,555,995 | 19,143,282 | ||||||
Diageo PLC | 576,843 | �� | 19,698,439 | |||||
Imperial Brands PLC | 592,348 | 24,150,855 | ||||||
Reckitt Benckiser Group PLC | 135,339 | 12,108,281 | ||||||
| Security | Shares | Value | ||||||
| United Kingdom (continued) | ||||||||
TechnipFMC PLC(a) | 422,285 | $ | 11,566,386 | |||||
|
| |||||||
| 98,828,768 | ||||||||
|
| |||||||
| United States — 4.1% | ||||||||
Alexion Pharmaceuticals, Inc.(a) | 63,290 | 7,573,281 | ||||||
Schlumberger Ltd. | 262,526 | 16,801,664 | ||||||
|
| |||||||
| 24,374,945 | ||||||||
|
| |||||||
Total Long-Term Investments — 96.8% |
| 579,107,603 | ||||||
|
| |||||||
Short-Term Securities — 5.2% | ||||||||
BlackRock Liquidity Funds, T-Fund, Institutional Class, 0.93%(b)(c) | 31,122,581 | 31,122,581 | ||||||
|
| |||||||
Total Short-Term Investments — 5.2% | 31,122,581 | |||||||
|
| |||||||
Total Investments — 102.0% | 610,230,184 | |||||||
|
| |||||||
Liabilities in Excess of Other | ||||||||
Assets — (2.0)% | (12,176,128 | ) | ||||||
|
| |||||||
Net Assets — 100.0% | $ | 598,054,056 | ||||||
|
| |||||||
| 2017 BLACKROCK ANNUAL REPORTTO SHAREHOLDERS | 7 |
Schedule of Investments (continued) October 31, 2017 | BlackRock International Fund |
| (a) | Non-income producing security. |
| (b) | Annualized 7-day yield as of period end. |
| (c) | During the year ended October 31, 2017, investments in issuers considered to be an affiliate of the Fund for purposes of Section 2(a)(3) of the Investment Company Act of 1940, as amended, were as follows: |
| Affiliate | Shares Held at October 31, 2016 | Net Activity | Shares Held at October 31, 2017 | Value at October 31, 2017 | Income | Net Realized Gain(a) | Change in Unrealized Appreciation (Depreciation) | |||||||||||||||||||||
BlackRock Liquidity Funds, T-Fund, Institutional Class | 29,987,371 | 1,135,210 | 31,122,581 | $ | 31,122,581 | $ | 109,094 | $ | 103 | — | ||||||||||||||||||
|
|
|
|
|
|
|
|
|
|
|
|
|
| |||||||||||||||
| (a) | Includes net capital gain distributions, if applicable. |
| Portfolio Abbreviations | ||
| ADR | American Depositary Receipt | |
| AUD | Australian Dollar | |
| GBP | British Pound | |
Derivative Financial Instruments Outstanding as of Period End
Forward Foreign Currency Exchange Contracts
|
| |||||||||||||||||||
| Currency Purchased | Currency Sold | Counterparty | Settlement Date | Unrealized Depreciation | ||||||||||||||||
| AUD | 30,513,593 | GBP | 17,850,000 | Deutsche Bank AG | 12/15/17 | $ | (397,589 | ) | ||||||||||||
|
| |||||||||||||||||||
Derivative Financial Instruments Categorized by Risk Exposure
As of period end, the fair values of derivative financial instruments located in the Statement of Assets and Liabilities were as follows:
| Commodity Contracts | Credit Contracts | Equity Contracts | Foreign Exchange | Interest Rate Contracts | Other Contracts | Total | ||||||||||||||||||||||||
Liabilities — Derivative Financial Instruments |
| |||||||||||||||||||||||||||||
Forward foreign currency exchange contracts | Unrealized depreciation on forward foreign currency exchange contracts | — | — | — | $ | 397,589 | — | — | $ | 397,589 | ||||||||||||||||||||
|
|
|
|
|
|
|
|
|
|
|
|
|
| |||||||||||||||||
For the year ended October 31, 2017, the effect of derivative financial instruments in the Statement of Operations was as follows
| Net Change in Unrealized Appreciation (Depreciation) on: | Commodity Contracts | Credit Contracts | Equity Contracts | Foreign Currency Exchange Contracts | Interest Rate Contracts | Other Contracts | Total | |||||||||||||||||||||
Forward foreign currency exchange contracts | — | — | — | $ | (397,589 | ) | — | — | $ | (397,589 | ) | |||||||||||||||||
|
|
|
|
|
|
|
|
|
|
|
|
|
| |||||||||||||||
Average Quarterly Balances of Outstanding Derivative Financial Instruments
Forward foreign currency exchange contracts: | ||||
Average amounts purchased — in USD | $ | 11,827,706 | ||
Average amounts sold — in USD | $ | 11,827,706 |
For more information about the Fund’s investment risks regarding derivative financial instruments, refer to the Notes to Financial Statements.
Derivative Financial Instruments — Offsetting as of Period End
The Fund’s derivative assets and liabilities (by type) were as follows:
| Assets | Liabilities | |||||||
Derivative Financial Instruments: | ||||||||
Forward foreign currency exchange contracts | — | $ | (397,589 | ) | ||||
|
|
|
| |||||
Total derivative assets and liabilities in the Statements of Assets and Liabilities | — | $ | (397,589 | ) | ||||
|
|
|
| |||||
Derivatives not subject to a Master Netting Agreement or similar agreement (“MNA”) | — | — | ||||||
|
|
|
| |||||
Total derivative assets and liabilities subject to an MNA | — | $ | (397,589 | ) | ||||
|
|
|
| |||||
| 8 | SCHEDULEOF INVESTMENTS |
Schedule of Investments (continued) October 31, 2017 | BlackRock International Fund |
The following tables present the Fund’s derivative assets and liabilities by counterparty net of amounts for offset under an MNA and net of the related collateral received and pledged by the Fund:
| Counterparty | Derivative Liabilities Subject to an MNA by Counterparty | Derivatives Available for Offset | Non-cash Collateral Pledged | Cash Collateral Pledged | Net Amount of Derivative Liabilities1 | |||||||||||||||
Deutsche Bank AG | $ | 397,589 | — | — | — | $ | 397,589 | |||||||||||||
|
|
|
|
|
|
|
|
|
| |||||||||||
| $ | 397,589 | — | — | — | $ | 397,589 | ||||||||||||||
|
|
|
|
|
|
|
|
|
| |||||||||||
| 1 | Net amount represents the net amount payable due to the counterparty in the event of default. |
Fair Value Hierarchy as of Period End
Various inputs are used in determining the fair value of investments. For information about the Fund’s policy regarding valuation of investments, refer to the Notes to Financial Statements. The following table summarizes the Fund’s investments categorized in the disclosure hierarchy:
| Level 1 | Level 2 | Level 3 | Total | |||||||||||||
Investments: | ||||||||||||||||
Assets: | ||||||||||||||||
Long-Term Investments: | ||||||||||||||||
Common Stocks: | ||||||||||||||||
Australia | $ | — | $ | 9,740,555 | — | $ | 9,740,555 | |||||||||
Brazil | 15,631,585 | — | — | 15,631,585 | ||||||||||||
China | 15,618,086 | 37,908,299 | — | 53,526,385 | ||||||||||||
France | 17,412,845 | — | — | 17,412,845 | ||||||||||||
Germany | — | 20,731,458 | — | 20,731,458 | ||||||||||||
Hong Kong | — | 17,049,775 | — | 17,049,775 | ||||||||||||
India | — | 21,057,036 | — | 21,057,036 | ||||||||||||
Indonesia | — | 12,271,238 | — | 12,271,238 | ||||||||||||
Italy | — | 18,027,962 | — | 18,027,962 | ||||||||||||
Japan | — | 115,746,496 | — | 115,746,496 | ||||||||||||
Netherlands | — | 39,451,680 | — | 39,451,680 | ||||||||||||
Norway | — | 23,983,777 | — | 23,983,777 | ||||||||||||
Portugal | — | 14,604,399 | — | 14,604,399 | ||||||||||||
Russia. | — | 10,641,003 | — | 10,641,003 | ||||||||||||
Singapore. | 4,551,536 | — | — | 4,551,536 | ||||||||||||
Spain | — | 37,923,949 | — | 37,923,949 | ||||||||||||
Switzerland | — | 23,552,211 | — | 23,552,211 | ||||||||||||
United Kingdom | 11,566,386 | 87,262,382 | — | 98,828,768 | ||||||||||||
United States | 24,374,945 | — | — | 24,374,945 | ||||||||||||
Short-Term Securities: | ||||||||||||||||
Money Market Fund | 31,122,581 | — | — | 31,122,581 | ||||||||||||
|
|
|
|
|
|
|
| |||||||||
| $ | 120,277,964 | $ | 489,952,220 | — | $ | 610,230,184 | ||||||||||
|
|
|
|
|
|
|
| |||||||||
| Level 1 | Level 2 | Level 3 | Total | |||||||||||||
Derivative Financial Instruments1 | ||||||||||||||||
Liabilities: | ||||||||||||||||
Foreign currency exchange contracts | — | $ | (397,589 | ) | — | $ | (397,589 | ) | ||||||||
|
|
|
|
|
|
|
| |||||||||
| — | $ | (397,589 | ) | — | $ | (397,589 | ) | |||||||||
|
|
|
|
|
|
|
| |||||||||
| 1 | Derivative financial instruments are forward foreign currency exchange contracts. Forward foreign currency exchange contracts are valued at the unrealized appreciation (depreciation) on the instrument. |
During the year ended October 31, 2017, there were no transfers between levels.
See notes to financial statements.
| 2017 BLACKROCK ANNUAL REPORTTO SHAREHOLDERS | 9 |
Statement of Assets and Liabilities
October 31, 2017
BlackRock Fund | ||||
ASSETS | ||||
Investments at value — unaffiliated (cost — $504,494,070) | $ | 579,107,603 | ||
Investments at value — affiliated (cost — $31,122,581) | 31,122,581 | |||
Foreign cash (cost — $49,221) | 49,266 | |||
Receivables: | ||||
Capital shares sold | 2,874,331 | |||
Dividends — unaffiliated | 1,968,169 | |||
Dividends — affiliated | 18,342 | |||
From the Administrator | 13,409 | |||
Prepaid expenses | 34,817 | |||
|
| |||
Total assets | 615,188,518 | |||
|
| |||
LIABILITIES | ||||
Payables: | ||||
Investments purchased | 12,189,115 | |||
Capital shares redeemed | 2,509,791 | |||
Investment advisory fees | 372,935 | |||
Service and distribution fees | 143,913 | |||
Deferred foreign capital gain tax | 556,524 | |||
Other affiliates | 6,243 | |||
Officer’s and Directors’ fees | 1,561 | |||
Other accrued expenses | 956,791 | |||
Unrealized depreciation on forward foreign currency exchange contracts | 397,589 | |||
|
| |||
Total liabilities | 17,134,462 | |||
|
| |||
NET ASSETS | $ | 598,054,056 | ||
|
| |||
NET ASSETS CONSIST OF | ||||
Paid-in capital | $ | 549,862,523 | ||
Undistributed net investment income | 5,650,940 | |||
Accumulated net realized loss | (31,017,465 | ) | ||
Net unrealized appreciation (depreciation) | 73,558,058 | |||
|
| |||
NET ASSETS | $ | 598,054,056 | ||
|
| |||
NET ASSETVALUE | ||||
Institutional — Based on net assets of $166,510,092 and 9,699,785 shares outstanding, 100 million shares authorized, $0.0001 par value | $ | 17.17 | ||
|
| |||
Investor A — Based on net assets of $336,934,202 and 20,109,533 shares outstanding, 100 million shares authorized, $0.0001 par value | $ | 16.75 | ||
|
| |||
Investor C — Based on net assets of $72,477,667 and 4,670,809 shares outstanding, 100 million shares authorized, $0.0001 par value | $ | 15.52 | ||
|
| |||
Class R — Based on net assets of $22,132,095 and 1,322,723 shares outstanding, 100 million shares authorized, | $ | 16.73 | ||
|
| |||
See notes to financial statements.
| 10 | FINANCIAL STATEMENTS |
Year Ended October 31, 2017
BlackRock Fund | ||||
NET INVESTMENT INCOME | ||||
Dividends — unaffiliated | $ | 12,191,363 | ||
Foreign taxes withheld | (1,161,900 | ) | ||
Dividends — affiliated | 92,020 | |||
Net investment income allocated from the Portfolio: | ||||
Dividends — unaffiliated | 3,458,342 | |||
Foreign taxes withheld | (308,824 | ) | ||
Dividends — affiliated | 17,074 | |||
Expenses | (1,396,846 | ) | ||
Fees Waived | 3,295 | |||
|
| |||
Total investment income | 12,894,524 | |||
|
| |||
EXPENSES | ||||
Investment advisory | 2,919,767 | |||
Service and distribution — class specific | 1,818,716 | |||
Transfer agent — class specific | 1,447,264 | |||
Administration | 428,661 | |||
Professional | 282,491 | |||
Accounting services | 95,167 | |||
Custodian | 55,301 | |||
Registration | 68,035 | |||
Printing | 51,164 | |||
Officer and Directors | 10,366 | |||
Miscellaneous | 38,488 | |||
|
| |||
Total expenses | 7,215,420 | |||
Less: | ||||
Fees waived and/or reimbursed by the Manager | (182,126 | ) | ||
Transfer agent fees waived and/or reimbursed — class specific | (257,293 | ) | ||
|
| |||
Total expenses after fees waived and/or reimbursed | 6,776,001 | |||
|
| |||
Net investment income | 6,118,523 | |||
|
| |||
REALIZED AND UNREALIZED GAIN (LOSS) | ||||
Net realized gain (loss) allocated from the Portfolio from: | ||||
Investments — unaffiliated | 6,914,518 | |||
Foreign currency transactions | (120,743 | ) | ||
Capital gain distributions received from affiliated investment companies | 103 | |||
Net realized gain (loss) from: | ||||
Investments — unaffiliated (net of $ 255,356 foreign capital gains tax) | 43,998,164 | |||
Foreign currency transactions | (91,455 | ) | ||
|
| |||
| 50,700,587 | ||||
|
| |||
Net change in unrealized appreciation (depreciation) allocated from the Portfolio on: | ||||
Investments — unaffiliated (net of $ 176,543 foreign capital gains tax) | 15,686,250 | |||
Foreign currency translations | 6,358 | |||
Net change in unrealized appreciation (depreciation) on: | ||||
Investments — unaffiliated (net of $ 379,981 foreign capital gains tax) | 48,256,532 | |||
Forward foreign currency exchange contracts | (397,589 | ) | ||
Foreign currency transactions | (582,245 | ) | ||
|
| |||
| 62,969,306 | ||||
|
| |||
Total realized and unrealized gain | 113,669,893 | |||
|
| |||
NET INCREASE IN NET ASSETS RESULTING FROM OPERATIONS | $ | 119,788,416 | ||
|
| |||
See notes to financial statements.
| 2017 BLACKROCK ANNUAL REPORTTO SHAREHOLDERS | 11 |
Statements of Changes in Net Assets
| BlackRock International Fund | ||||||||
| Year Ended October 31, | ||||||||
| 2017 | 2016 | |||||||
INCREASE (DECREASE) IN NET ASSETS | ||||||||
OPERATIONS | ||||||||
Net investment income | $ | 6,118,523 | $ | 5,493,715 | ||||
Net realized gain (loss) | 50,700,587 | (18,362,829 | ) | |||||
Net change in unrealized appreciation (depreciation) | 62,969,306 | 4,982,268 | ||||||
|
|
|
| |||||
Net increase (decrease) in net assets resulting from operations | 119,788,416 | (7,886,846 | ) | |||||
|
|
|
| |||||
DISTRIBUTIONS TO SHAREHOLDERS(a) | ||||||||
From net investment income: | ||||||||
Institutional | (1,792,904 | ) | (825,087 | ) | ||||
Investor A | (3,866,723 | ) | (750,561 | ) | ||||
Investor C | (164,674 | ) | — | |||||
Class R | (187,984 | ) | — | |||||
|
|
|
| |||||
Decrease in net assets resulting from distributions to shareholders | (6,012,285 | ) | (1,575,648 | ) | ||||
|
|
|
| |||||
CAPITAL SHARE TRANSACTIONS | ||||||||
Net decrease in net assets derived from capital share transactions | (69,922,967 | ) | (9,695,022 | ) | ||||
|
|
|
| |||||
NET ASSETS | ||||||||
Total increase (decrease) in net assets | 43,853,164 | (19,157,516 | ) | |||||
Beginning of year | 554,200,892 | 573,358,408 | ||||||
|
|
|
| |||||
End of year | $ | 598,054,056 | $ | 554,200,892 | ||||
|
|
|
| |||||
Undistributed net investment income, end of year | $ | 5,650,940 | $ | 6,012,256 | ||||
|
|
|
| |||||
| (a) | Distributions for annual periods determined in accordance with U.S. federal income tax regulations. |
See notes to financial statements.
| 12 | FINANCIAL STATEMENTS |
Financial Highlights
| BlackRock International Fund | ||||||||||||||||||||
| Institutional | ||||||||||||||||||||
| Year Ended October 31, | ||||||||||||||||||||
| 2017 | 2016 | 2015 | 2014 | 2013 | ||||||||||||||||
PER SHARE OPERATING PERFORMANCE | ||||||||||||||||||||
Net asset value, beginning of year | $ | 14.03 | $ | 14.23 | $ | 15.03 | $ | 15.51 | $ | 12.30 | ||||||||||
|
|
|
|
|
|
|
|
|
| |||||||||||
Net investment income(a) | 0.24 | 0.22 | 0.16 | 0.21 | 0.25 | |||||||||||||||
Net realized and unrealized gain (loss) | 3.12 | (0.33 | ) | (0.64 | ) | (0.41 | ) | 3.13 | ||||||||||||
|
|
|
|
|
|
|
|
|
| |||||||||||
Net increase (decrease) from investment operations | 3.36 | (0.11 | ) | (0.48 | ) | (0.20 | ) | 3.38 | ||||||||||||
|
|
|
|
|
|
|
|
|
| |||||||||||
Distributions from net investment income(b) | (0.22 | ) | (0.09 | ) | (0.32 | ) | (0.28 | ) | (0.17 | ) | ||||||||||
|
|
|
|
|
|
|
|
|
| |||||||||||
Net asset value, end of year | $ | 17.17 | $ | 14.03 | $ | 14.23 | $ | 15.03 | $ | 15.51 | ||||||||||
|
|
|
|
|
|
|
|
|
| |||||||||||
TOTAL RETURN(c) | ||||||||||||||||||||
Based on net asset value | 24.36 | % | (0.76 | )% | (3.17 | )% | (1.26 | )% | 27.77 | %(d) | ||||||||||
|
|
|
|
|
|
|
|
|
| |||||||||||
RATIOS TO AVERAGE NET ASSETS(e),(f) | ||||||||||||||||||||
Total expenses | 1.10 | %(g) | 1.26 | % | 1.25 | % | 1.23 | % | 1.22 | % | ||||||||||
|
|
|
|
|
|
|
|
|
| |||||||||||
Total expenses after fees waived and/or reimbursed | 1.00 | %(g) | 1.00 | % | 1.00 | % | 1.00 | % | 1.00 | % | ||||||||||
|
|
|
|
|
|
|
|
|
| |||||||||||
Net investment income | 1.53 | %(g) | 1.60 | % | 1.11 | % | 1.39 | % | 1.81 | % | ||||||||||
|
|
|
|
|
|
|
|
|
| |||||||||||
SUPPLEMENTAL DATA | ||||||||||||||||||||
Net assets, end of year (000) | $ | 166,510 | $ | 114,863 | $ | 130,327 | $ | 194,685 | $ | 431,563 | ||||||||||
|
|
|
|
|
|
|
|
|
| |||||||||||
Portfolio turnover rate | 101 | %(h) | 84 | % | 112 | % | 128 | % | 128 | % | ||||||||||
|
|
|
|
|
|
|
|
|
| |||||||||||
| (a) | Based on average shares outstanding. |
| (b) | Distributions for annual periods determined in accordance with U.S. federal income tax regulations. |
| (c) | Where applicable, assumes the reinvestment of distributions. |
| (d) | Includes a payment from an affiliate to compensate for foregone securities lending revenue which impacted the Fund’s total return. Not including this payment, the Fund’s total return would have been 27.68%. |
| (e) | Includes the Fund’s share of the Portfolio’s allocated fees waived of less than 0.01%. |
| (f) | Includes the Fund’s share of the Portfolio’s allocated expenses and/or net investment income. |
| (g) | Ratios do not include expenses incurred indirectly as a result of investments in underlying funds of approximately 0.01%. |
| (h) | Portfolio turnover rate includes transactions from the Portfolio prior to February 27, 2017. |
See notes to financial statements.
| 2017 BLACKROCK ANNUAL REPORTTO SHAREHOLDERS | 13 |
Financial Highlights (continued)
| BlackRock International Fund | ||||||||||||||||||||
| Investor A | ||||||||||||||||||||
| Year Ended October 31, | ||||||||||||||||||||
| 2017 | 2016 | 2015 | 2014 | 2013 | ||||||||||||||||
PER SHARE OPERATING PERFORMANCE | ||||||||||||||||||||
Net asset value, beginning of year | $ | 13.71 | $ | 13.90 | $ | 14.68 | $ | 15.17 | $ | 12.03 | ||||||||||
|
|
|
|
|
|
|
|
|
| |||||||||||
Net investment income(a) | 0.17 | 0.16 | 0.11 | 0.14 | 0.20 | |||||||||||||||
Net realized and unrealized gain (loss) | 3.05 | (0.31 | ) | (0.62 | ) | (0.40 | ) | 3.07 | ||||||||||||
|
|
|
|
|
|
|
|
|
| |||||||||||
Net increase (decrease) from investment operations | 3.22 | (0.15 | ) | (0.51 | ) | (0.26 | ) | 3.27 | ||||||||||||
|
|
|
|
|
|
|
|
|
| |||||||||||
Distributions from net investment income(b) | (0.18 | ) | (0.04 | ) | (0.27 | ) | (0.23 | ) | (0.13 | ) | ||||||||||
|
|
|
|
|
|
|
|
|
| |||||||||||
Net asset value, end of year | $ | 16.75 | $ | 13.71 | $ | 13.90 | $ | 14.68 | $ | 15.17 | ||||||||||
|
|
|
|
|
|
|
|
|
| |||||||||||
TOTAL RETURN(c) | ||||||||||||||||||||
Based on net asset value | 23.77 | % | (1.10 | )% | (3.50 | )% | (1.70 | )% | 27.37 | %(d) | ||||||||||
|
|
|
|
|
|
|
|
|
| |||||||||||
RATIOS TO AVERAGE NET ASSETS(e),(f) | ||||||||||||||||||||
Total expenses | 1.45 | %(g) | 1.64 | % | 1.59 | % | 1.57 | % | 1.56 | % | ||||||||||
|
|
|
|
|
|
|
|
|
| |||||||||||
Total expenses after fees waived and/or reimbursed | 1.37 | %(g) | 1.38 | % | 1.38 | % | 1.38 | % | 1.38 | % | ||||||||||
|
|
|
|
|
|
|
|
|
| |||||||||||
Net investment income | 1.15 | %(g) | 1.21 | % | 0.76 | % | 0.92 | % | 1.53 | % | ||||||||||
|
|
|
|
|
|
|
|
|
| |||||||||||
SUPPLEMENTAL DATA | ||||||||||||||||||||
Net assets, end of year (000) | $ | 336,934 | $ | 307,992 | $ | 285,442 | $ | 285,565 | $ | 280,123 | ||||||||||
|
|
|
|
|
|
|
|
|
| |||||||||||
Portfolio turnover rate | 101 | %(h) | 84 | % | 112 | % | 128 | % | 128 | % | ||||||||||
|
|
|
|
|
|
|
|
|
| |||||||||||
| (a) | Based on average shares outstanding. |
| (b) | Distributions for annual periods determined in accordance with U.S. federal income tax regulations. |
| (c) | Where applicable, excludes the effects of any sales charges and assumes the reinvestment of distributions. |
| (d) | Includes a payment from an affiliate to compensate for foregone securities lending revenue which impacted the Fund’s total return. Not including this payment, the Fund’s total return would have been 27.29%. |
| (e) | Includes the Fund’s share of the Portfolio’s allocated fees waived of less than 0.01%. |
| (f) | Includes the Fund’s share of the Portfolio’s allocated expenses and/or net investment income. |
| (g) | Ratios do not include expenses incurred indirectly as a result of investments in underlying funds of approximately 0.01%. |
| (h) | Portfolio turnover rate includes transactions from the Portfolio prior to February 27, 2017. |
See notes to financial statements.
| 14 | FINANCIAL HIGHLIGHTS |
Financial Highlights (continued)
| BlackRock International Fund | ||||||||||||||||||||
| Investor C | ||||||||||||||||||||
| Year Ended October 31, | ||||||||||||||||||||
| 2017 | 2016 | 2015 | 2014 | 2013 | ||||||||||||||||
PER SHARE OPERATING PERFORMANCE | ||||||||||||||||||||
Net asset value, beginning of year | $ | 12.67 | $ | 12.94 | $ | 13.68 | $ | 14.15 | $ | 11.23 | ||||||||||
|
|
|
|
|
|
|
|
|
| |||||||||||
Net investment income (loss)(a) | 0.04 | 0.02 | (0.03 | ) | (0.01 | ) | 0.06 | |||||||||||||
Net realized and unrealized gain (loss) | 2.83 | (0.29 | ) | (0.58 | ) | (0.36 | ) | 2.86 | ||||||||||||
|
|
|
|
|
|
|
|
|
| |||||||||||
Net increase (decrease) from investment operations | 2.87 | (0.27 | ) | (0.61 | ) | (0.37 | ) | 2.92 | ||||||||||||
|
|
|
|
|
|
|
|
|
| |||||||||||
Distributions from net investment income(b) | (0.02 | ) | — | (0.13 | ) | (0.10 | ) | (0.00 | )(c) | |||||||||||
|
|
|
|
|
|
|
|
|
| |||||||||||
Net asset value, end of year | $ | 15.52 | $ | 12.67 | $ | 12.94 | $ | 13.68 | $ | 14.15 | ||||||||||
|
|
|
|
|
|
|
|
|
| |||||||||||
TOTAL RETURN(d) | ||||||||||||||||||||
Based on net asset value | 22.69 | % | (2.09 | )% | (4.49 | )% | (2.62 | )% | 26.02 | %(e) | ||||||||||
|
|
|
|
|
|
|
|
|
| |||||||||||
RATIOS TO AVERAGE NET ASSETS(f),(g) | ||||||||||||||||||||
Total expenses | 2.35 | %(h) | 2.54 | % | 2.45 | % | 2.43 | % | 2.49 | % | ||||||||||
|
|
|
|
|
|
|
|
|
| |||||||||||
Total expenses after fees waived and/or reimbursed | 2.31 | %(h) | 2.42 | % | 2.37 | % | 2.35 | % | 2.39 | % | ||||||||||
|
|
|
|
|
|
|
|
|
| |||||||||||
Net investment income (loss) | 0.26 | %(h) | 0.19 | % | (0.24 | )% | (0.05 | )% | 0.51 | % | ||||||||||
|
|
|
|
|
|
|
|
|
| |||||||||||
SUPPLEMENTAL DATA | ||||||||||||||||||||
Net assets, end of year (000) | $ | 72,478 | $ | 110,527 | $ | 136,136 | $ | 148,042 | $ | 156,198 | ||||||||||
|
|
|
|
|
|
|
|
|
| |||||||||||
Portfolio turnover rate | 101 | %(i) | 84 | % | 112 | % | 128 | % | 128 | % | ||||||||||
|
|
|
|
|
|
|
|
|
| |||||||||||
| (a) | Based on average shares outstanding. |
| (b) | Distributions for annual periods determined in accordance with U.S. federal income tax regulations. |
| (c) | Amount is greater than $(0.005) per share. |
| (d) | Where applicable, excludes the effects of any sales charges and assumes the reinvestment of distributions. |
| (e) | Includes a payment from an affiliate to compensate for foregone securities lending revenue which impacted the Fund’s total return. Not including this payment, the Fund’s total return would have been 25.93%. |
| (f) | Includes the Fund’s share of the Portfolio’s allocated fees waived of less than 0.01%. |
| (g) | Includes the Fund’s share of the Portfolio’s allocated expenses and/or net investment income. |
| (h) | Ratios do not include expenses incurred indirectly as a result of investments in underlying funds of approximately 0.01%. |
| (i) | Portfolio turnover rate includes transactions from the Portfolio prior to February 27, 2017. |
See notes to financial statements.
| 2017 BLACKROCK ANNUAL REPORTTO SHAREHOLDERS | 15 |
Financial Highlights (continued)
| BlackRock International Fund | ||||||||||||||||||||
| Class R | ||||||||||||||||||||
| Year Ended October 31, | ||||||||||||||||||||
| 2017 | 2016 | 2015 | 2014 | 2013 | ||||||||||||||||
PER SHARE OPERATING PERFORMANCE | ||||||||||||||||||||
Net asset value, beginning of year | $ | 13.68 | $ | 13.88 | $ | 14.64 | $ | 15.12 | $ | 11.98 | ||||||||||
|
|
|
|
|
|
|
|
|
| |||||||||||
Net investment income(a) | 0.13 | 0.12 | 0.06 | 0.09 | 0.16 | |||||||||||||||
Net realized and unrealized gain (loss) | 3.05 | (0.32 | ) | (0.62 | ) | (0.39 | ) | 3.05 | ||||||||||||
|
|
|
|
|
|
|
|
|
| |||||||||||
Net increase (decrease) from investment operations | 3.18 | (0.20 | ) | (0.56 | ) | (0.30 | ) | 3.21 | ||||||||||||
|
|
|
|
|
|
|
|
|
| |||||||||||
Distributions from net investment income(b) | (0.13 | ) | — | (0.20 | ) | (0.18 | ) | (0.07 | ) | |||||||||||
|
|
|
|
|
|
|
|
|
| |||||||||||
Net asset value, end of year | $ | 16.73 | $ | 13.68 | $ | 13.88 | $ | 14.64 | $ | 15.12 | ||||||||||
|
|
|
|
|
|
|
|
|
| |||||||||||
TOTAL RETURN(c) | ||||||||||||||||||||
Based on net asset value | 23.44 | % | (1.44 | )% | (3.81 | )% | (1.98 | )% | 26.95 | %(d) | ||||||||||
|
|
|
|
|
|
|
|
|
| |||||||||||
RATIOS TO AVERAGE NET ASSETS(e),(f) | ||||||||||||||||||||
Total expenses | 1.74 | %(g) | 1.93 | % | 1.85 | % | 1.84 | % | 1.85 | % | ||||||||||
|
|
|
|
|
|
|
|
|
| |||||||||||
Total expenses after fees waived and/or reimbursed | 1.66 | %(g) | 1.70 | % | 1.70 | % | 1.70 | % | 1.70 | % | ||||||||||
|
|
|
|
|
|
|
|
|
| |||||||||||
Net investment income | 0.87 | %(g) | 0.90 | % | 0.42 | % | 0.63 | % | 1.22 | % | ||||||||||
|
|
|
|
|
|
|
|
|
| |||||||||||
SUPPLEMENTAL DATA | ||||||||||||||||||||
Net assets, end of year (000) | $ | 22,132 | $ | 20,819 | $ | 21,453 | $ | 24,318 | $ | 29,711 | ||||||||||
|
|
|
|
|
|
|
|
|
| |||||||||||
Portfolio turnover rate | 101 | %(h) | 84 | % | 112 | % | 128 | % | 128 | % | ||||||||||
|
|
|
|
|
|
|
|
|
| |||||||||||
| (a) | Based on average shares outstanding. |
| (b) | Distributions for annual periods determined in accordance with U.S. federal income tax regulations. |
| (c) | Where applicable, assumes the reinvestment of distributions. |
| (d) | Includes a payment from an affiliate to compensate for foregone securities lending revenue which impacted the Fund’s total return. Not including this payment, the Fund’s total return would have been 26.87%. |
| (e) | Includes the Fund’s share of the Portfolio’s allocated fees waived of less than 0.01%. |
| (f) | Includes the Fund’s share of the Portfolio’s allocated expenses and/or net investment income. |
| (g) | Ratios do not include expenses incurred indirectly as a result of investments in underlying funds of approximately 0.01%. |
| (h) | Portfolio turnover rate includes transactions from the Portfolio prior to February 27, 2017. |
See notes to financial statements.
| 16 | FINANCIAL HIGHLIGHTS |
| 1. | ORGANIZATION: |
BlackRock Series, Inc. (the “Corporation”) is registered under the Investment Company Act of 1940, as amended (the “1940 Act”), as an open-end management investment company. The Corporation is organized as a Maryland corporation. BlackRock International Fund (the “Fund”) is a series of the Corporation and is classified as diversified.
The Fund offers multiple classes of shares. All classes of shares have identical voting, dividend, liquidation and other rights and are subject to the same terms and conditions, except that certain classes bear expenses related to shareholder servicing and distribution of such shares. Institutional Shares are sold only to certain eligible investors. Class R Shares are available only to certain employer-sponsored retirement plans. Investor A and Investor C Shares are generally available through financial intermediaries. Each class has exclusive voting rights with respect to matters relating to its shareholder servicing and distribution expenditures.
| Share Class | Initial Sales Charge | CDSC | Conversion Privilege | |||||
Institutional and Class R Shares | No | No | None | |||||
Investor A Shares | Yes | No | 1 | None | ||||
Investor C Shares | No | Yes | None | |||||
| 1 | Investor A Shares may be subject to a contingent deferred sales charge (“CDSC”) for certain redemptions where no initial sales charge was paid at the time of purchase. |
Prior to February 27, 2017, the Fund invested all of its assets in BlackRock Master International Portfolio (the “Portfolio”), a series of BlackRock Master LLC, an affiliate of the Fund, which had the same investment objective and strategies as the Fund. The value of the Fund’s investment in the Portfolio reflected the Fund’s proportionate interest in the net assets of the Portfolio. The performance of the Fund was directly affected by the performance of the Portfolio. As of February 26, 2017, the Fund owned 100% of the Portfolio. For the period November 1, 2016 to February 26, 2017, the Portfolio allocated $1,773,041, $6,793,878, and $15,692,608 from net investment income, net realized gains and net change in unrealized appreciation (depreciation), respectively, to the Fund.
On February 27, 2017, the Fund ceased to invest in the Portfolio as part of a “master-feeder” structure and began to operate as a stand-alone fund. In connection with this change, the Fund entered into a management agreement with BlackRock Advisors, LLC (the “Manager”), the terms of which are substantially the same as the management agreement between BlackRock Advisors, LLC and the Portfolio, including the management fee rate. The Fund received net assets of $548,927,298 which included net unrealized appreciation of $26,281,360 in exchange for its ownership in the Portfolio. The cost basis for the investments received from the Portfolio was carried forward to align ongoing reporting of the Fund’s realized and unrealized gains and losses with amounts distributable to shareholders for tax purposes. The change into a stand-alone structure did not result to a change in net assets of the Fund and did not create a taxable event for the Fund.
The Fund, together with certain other registered investment companies advised by the Manager or its affiliates, is included in a complex of open-end funds referred to as the Equity-Liquidity Complex.
| 2. | SIGNIFICANT ACCOUNTING POLICIES: |
The financial statements are prepared in conformity with accounting principles generally accepted in the United States of America (“U.S. GAAP”), which may require management to make estimates and assumptions that affect the reported amounts of assets and liabilities in the financial statements, disclosure of contingent assets and liabilities at the date of the financial statements and the reported amounts of increases and decreases in net assets from operations during the reporting period. Actual results could differ from those estimates. The Fund is considered an investment company under U.S. GAAP and follows the accounting and reporting guidance applicable to investment companies. Below is a summary of significant accounting policies:
Investment Transactions and Investment Recognition: For financial reporting purposes, investment transactions are recorded on the dates the transactions are entered into (“trade dates”). Realized gains and losses on investment transactions are determined on the identified cost basis. Dividend income is recorded on the ex-dividend date. Dividends from foreign securities where the ex-dividend date may have passed are subsequently recorded when the Fund is informed of the ex-dividend date. Under the applicable foreign tax laws, a withholding tax at various rates may be imposed on capital gains, dividends and interest. Prior to February 27, 2017, contributions to and withdrawals from the Portfolio were accounted for on a trade date basis. The Fund recorded its proportionate share of the Portfolio’s income, expenses and realized and unrealized gains and losses on a daily basis.
Foreign Currency Translation: The Fund’s books and records are maintained in U.S. dollars. Securities and other assets and liabilities denominated in foreign currencies are translated into U.S. dollars using exchange rates determined as of the close of trading on the New York Stock Exchange (“NYSE”). Purchases and sales of investments are recorded at the rates of exchange prevailing on the respective dates of such transactions. Generally, when the U.S. dollar rises in value against a foreign currency, the investments denominated in that currency will lose value; the opposite effect occurs if the U.S. dollar falls in relative value.
The Fund does not isolate the portion of the results of operations arising as a result of changes in the exchange rates from the changes in the market prices of investments held or sold for financial reporting purposes. Accordingly, the effects of changes in exchange rates on investments are not segregated in the Statement of Operations from the effects of changes in market prices of those investments, but are included as a component of net realized and unrealized gain (loss) from investments. The Fund reports realized currency gains (losses) on foreign currency related transactions as components of net realized gain (loss) for financial reporting purposes, whereas such components are generally treated as ordinary income for U.S. federal income tax purposes.
Distributions: Distributions paid by the Fund are recorded on the ex-dividend date. The character and timing of distributions are determined in accordance with U.S. federal income tax regulations, which may differ from U.S. GAAP.
| 2017 BLACKROCK ANNUAL REPORTTO SHAREHOLDERS | 17 |
Notes to Financial Statements (continued)
Indemnifications: In the normal course of business, the Fund enters into contracts that contain a variety of representations that provide general indemnification. The Fund’s maximum exposure under these arrangements is unknown because it involves future potential claims against the Fund, which cannot be predicted with any certainty.
Other: Expenses directly related to the Fund or its classes are charged to the Fund or the applicable class. Other operating expenses shared by several funds, including other funds managed by the Administrator, are prorated among those funds on the basis of relative net assets or other appropriate methods. Expenses directly related to the Fund and other shared expenses prorated to the Fund are allocated daily to each class based on its relative net assets or other appropriate methods.
The Fund has an arrangement with its custodian whereby credits are earned on uninvested cash balances, which could be used to reduce custody fees and/or overdraft charges. The Fund may incur charges on certain uninvested cash balances and overdrafts, subject to certain conditions.
| 3. | INVESTMENT VALUATION AND FAIR VALUE MEASUREMENTS: |
Investment Valuation Policies: The Fund’s investments are valued at fair value (also referred to as “market value” within the financial statements) as of the close of trading on the NYSE (generally 4:00 p.m., Eastern time). U.S. GAAP defines fair value as the price the Fund would receive to sell an asset or pay to transfer a liability in an orderly transaction between market participants at the measurement date. The Fund determines the fair values of its financial instruments using various independent dealers or pricing services under policies approved by the Board of Directors of the Corporation (the “Board”). The BlackRock Global Valuation Methodologies Committee (the “Global Valuation Committee”) is the committee formed by management to develop global pricing policies and procedures and to oversee the pricing function for all financial instruments.
Fair Value Inputs and Methodologies: The following methods and inputs are used to establish the fair value of the Fund’s assets and liabilities:
| • | Equity investments traded on a recognized securities exchange are valued at the official closing price each day, if available. For equity investments traded on more than one exchange, the official closing price on the exchange where the stock is primarily traded is used. Equity investments traded on a recognized exchange for which there were no sales on that day may be valued at the last available bid (long positions) or ask (short positions) price. |
Generally, trading in foreign instruments is substantially completed each day at various times prior to the close of trading on the NYSE. Occasionally, events affecting the values of such instruments may occur between the foreign market close and the close of trading on the NYSE that may not be reflected in the computation of the Fund’s net assets. Each business day, the Fund uses a pricing service to assist with the valuation of certain foreign exchange-traded equity securities and foreign exchange-traded and over-the-counter (“OTC”) options (the “Systematic Fair Value Price”). Using current market factors, the Systematic Fair Value Price is designed to value such foreign securities and foreign options at fair value as of the close of trading on the NYSE, which follows the close of the local markets.
Investments in open-end U.S. mutual funds are valued at NAV each business day.
Securities and other assets and liabilities denominated in foreign currencies are translated into U.S. dollars using exchange rates determined as of the close of trading on the NYSE. Forward foreign currency exchange contracts are valued at the mean between the bid and ask prices and are determined as of the close of trading on the NYSE. Interpolated values are derived when the settlement date of the contract is an interim date for which quotations are not available.
If events (e.g., a company announcement, market volatility or a natural disaster) occur that are expected to materially affect the value of such investments, or in the event that the application of these methods of valuation results in a price for an investment that is deemed not to be representative of the market value of such investment, or if a price is not available, the investment will be valued by the Global Valuation Committee, or its delegate, in accordance with a policy approved by the Board as reflecting fair value (“Fair Valued Investments”). The fair valuation approaches that may be used by the Global Valuation Committee will include Market approach, Income approach and Cost approach. Valuation techniques such as discounted cash flow, use of market comparables and matrix pricing are types of valuation approaches and are typically used in determining fair value. When determining the price for Fair Valued Investments, the Global Valuation Committee, or its delegate, seeks to determine the price that the Fund might reasonably expect to receive or pay from the current sale or purchase of that asset or liability in an arm’s-length transaction. Fair value determinations shall be based upon all available factors that the Global Valuation Committee, or its delegate, deems relevant and consistent with the principles of fair value measurement. The pricing of all Fair Valued Investments is subsequently reported to the Board or a committee thereof on a quarterly basis.
Fair Value Hierarchy: Various inputs are used in determining the fair value of investments. These inputs to valuation techniques are categorized into a fair value hierarchy consisting of three broad levels for financial statement purposes as follows:
| • | Level 1 — Unadjusted price quotations in active markets/exchanges for identical assets or liabilities that the Fund has the ability to access |
| • | Level 2 — Other observable inputs (including, but not limited to, quoted prices for similar assets or liabilities in markets that are active, quoted prices for identical or similar assets or liabilities in markets that are not active, inputs other than quoted prices that are observable for the assets or liabilities (such as interest rates, yield curves, volatilities, prepayment speeds, loss severities, credit risks and default rates) or other market-corroborated inputs) |
| • | Level 3 — Unobservable inputs based on the best information available in the circumstances, to the extent observable inputs are not available (including the Fund’s own assumptions used in determining the fair value of investments) |
The hierarchy gives the highest priority to unadjusted quoted prices in active markets for identical assets or liabilities (Level 1 measurements) and the lowest priority to unobservable inputs (Level 3 measurements). Accordingly, the degree of judgment exercised in determining fair value is greatest for instruments categorized in Level 3. The inputs used to measure fair value may fall into different levels of the fair value hierarchy. In such cases, for disclosure purposes, the fair value hierarchy classification is determined based on the lowest level input that is significant to the fair value measurement in its entirety. Investments classified within Level 3 have significant unobservable inputs used by the Global Valuation Committee in determining the price for Fair Valued Investments. Level 3 investments include equity or debt issued by Private Companies. There may
| 18 | NOTESTO FINANCIAL STATEMENTS |
Notes to Financial Statements (continued)
not be a secondary market, and/or there are a limited number of investors. Level 3 investments may also be adjusted to reflect illiquidity and/or non-transferability, with the amount of such discount estimated by the Global Valuation Committee in the absence of market information.
Changes in valuation techniques may result in transfers into or out of an assigned level within the hierarchy. In accordance with the Fund’s policy, transfers between different levels of the fair value hierarchy are deemed to have occurred as of the beginning of the reporting period. The categorization of a value determined for investments is based on the pricing transparency of the investments and is not necessarily an indication of the risks associated with investing in those securities.
| 4. | DERIVATIVE FINANCIAL INSTRUMENTS |
Forward Foreign Currency Exchange Contracts: Forward foreign currency exchange contracts are entered into to gain or reduce exposure to foreign currencies (foreign currency exchange rate risk).
A forward foreign currency exchange contract is an agreement between two parties to buy and sell a currency at a set exchange rate on a specified date. These contracts help to manage the overall exposure to the currencies in which some of the investments held by the Fund are denominated and in some cases, may be used to obtain exposure to a particular market.
The contract is marked-to-market daily and the change in market value is recorded as unrealized appreciation (depreciation) in the Statement of Assets and Liabilities. When a contract is closed, a realized gain or loss is recorded in the Statement of Operations equal to the difference between the value at the time it was opened and the value at the time it was closed. Non-deliverable forward foreign currency exchange contracts are settled with the counterparty in cash without the delivery of foreign currency. The use of forward foreign currency exchange contracts involves the risk that the value of a forward foreign currency exchange contract changes unfavorably due to movements in the value of the referenced foreign currencies.
| 5. | INVESTMENT ADVISORY AGREEMENT AND OTHER TRANSACTIONS WITH AFFILIATES: |
The PNC Financial Services Group, Inc. is the largest stockholder and an affiliate of BlackRock, Inc. (“BlackRock”) for 1940 Act purposes.
Investment Advisory: The Corporation, on behalf of the Fund, entered into an Investment Advisory Agreement with the Manager, the Fund’s investment adviser, an indirect, wholly-owned subsidiary of BlackRock, to provide investment advisory and administration services. The Manager is responsible for the management of the Fund’s portfolio and provides the personnel, facilities, equipment and certain other services necessary to the operations of the Fund.
For such services, the Fund pays the Manager a monthly fee at an annual rate equal to the following percentages of the average daily value of the Fund’s net assets:
| Average Daily Net Assets | Investment Advisory Fee | |||
Not exceeding $500 Million | 0.75 | % | ||
In excess of $500 Million | 0.70 | % | ||
With respect to the Fund, the Manager entered into a sub-advisory agreement with BlackRock International Limited (“BIL”), an affiliate of the Manager. The Manager pays BIL, for services it provides, a monthly fee that is a percentage of the investment advisory fees paid by the Fund to the Manager.
Service and Distribution Fees: The Corporation, on behalf of the Fund, entered into a Distribution Agreement and a Distribution and Service Plan with BlackRock Investments, LLC (“BRIL”), an affiliate of the Manager. Pursuant to the Distribution and Service Plan and in accordance with Rule 12b-1 under the 1940 Act, the Fund pays BRIL ongoing service and distribution fees. The fees are accrued daily and paid monthly at annual rates based upon the average daily net assets of the relevant share class of the Fund as follows:
| Investor A | Investor C | Class R | ||||||||||
Distribution Fee | — | 0.75 | % | 0.25 | % | |||||||
Service Fee | 0.25 | % | 0.25 | % | 0.25 | % | ||||||
BRIL and broker-dealers, pursuant to sub-agreements with BRIL, provide shareholder servicing and distribution services to the Fund. The ongoing service and/or distribution fee compensates BRIL and each broker-dealer for providing shareholder servicing and/or distribution related services to shareholders.
For the year ended October 31, 2017, the following table shows the class specific service and distribution fees borne directly by each share class of the Fund:
| Investor A | Investor C | Class R | Total | |||
$796,223 | $916,309 | $106,184 | $1,818,716 |
Transfer Agent: Pursuant to written agreements, certain financial intermediaries, some of which may be affiliates, provide the Fund with sub-accounting, recordkeeping, sub-transfer agency and other administrative services with respect to sub-accounts they service. For these services, these entities receive an asset-based fee or an annual fee per shareholder account, which will vary depending on share class and/or net assets. For the year ended October 31, 2017, the Fund paid $33 to affiliates of BlackRock in return for these services to Institutional Shares, which are included in transfer agent — class specific in the Statement of Operations.
| 2017 BLACKROCK ANNUAL REPORTTO SHAREHOLDERS | 19 |
Notes to Financial Statements (continued)
The Manager maintains a call center that is responsible for providing certain shareholder services to the Fund. Shareholder services include responding to inquiries and processing subscriptions and redemptions based upon instructions from shareholders. For the year ended October 31, 2017, the Fund reimbursed the Manager for the following amounts for costs incurred in running the call center, which are included in transfer agent — class specific in the Statement of Operations:
| Institutional | Investor A | Investor C | Class R | Total | ||||||||||||||
| $ | 3,171 | $ 4,254 | $ | 1,144 | $ 122 | $ | 8,691 | |||||||||||
For the year ended October 31, 2017, the following table shows the class specific transfer agent fees borne directly by each class of the Fund:
| Institutional | Investor A | Investor C | Class R | Total | ||||||||||||||
| $ | 212,307 | $819,001 | $ | 355,589 | $60,367 | $ | 1,447,264 | |||||||||||
Other Fees: For the year ended October 31, 2017, affiliates earned underwriting discounts, direct commissions and dealer concessions on sales of the Fund’s Investor A Shares of $6,315.
For the year ended October 31, 2017, affiliates received CDSCs as follows:
Investor A | $ | 1,068 | ||
Investor C | $ | 8,217 |
Expense Limitations, Waivers and Reimbursements: The Manager contractually agreed to waive and/or reimburse fees or expenses in order to limit expenses, excluding interest expense, dividend expense, tax expense, acquired fund fees and expenses, and certain other fund expenses, which constitute extraordinary expenses not incurred in the ordinary course of the Fund’s business (“expense limitation”). The expense limitations as a percentage of average daily net assets are as follows:
| Institutional | Investor A | Investor C | Class R | |||||||||
| 1.00% | 1.38% | 2.42% | 1.70% | |||||||||
The Manager has agreed not to reduce or discontinue these contractual expense limitations through February 28, 2018, unless approved by the Board, including a majority of the independent directors who are not “interested persons” of the Fund, as defined in the 1940 Act (“Independent Directors”) or by a vote of a majority of the outstanding voting securities of the Fund. For the year ended October 31, 2017, the amount waived was $173,905.
The Manager voluntarily agreed to waive its investment advisory fees by the amount of investment advisory fees the Fund pays to the Manager indirectly through its investment in affiliated money market funds (the “affiliated money market fund waiver”). This amount is included in fees waived by the Manager in the Statement of Operations. The amount of waivers and/or reimbursements of fees and expenses made pursuant to the expense limitation caps, as applicable, will be reduced by the amount of the affiliated money market fund waiver. For the year ended October 31, 2017, the amount waived was $11,516.
The Manager has contractually agreed to waive its investment advisory fee with respect to any portion of the Fund’s assets invested in affiliated equity and fixed-income mutual funds and affiliated exchange-traded funds that have a contractual management fee through February 28, 2018. The contractual agreement may be terminated upon 90 days’ notice by a majority of the Independent Directors or by a vote of a majority of the outstanding voting securities of the Fund. For the year ended October 31, 2017, there were no fees waived by the Manager. Prior to February 28, 2017, this waiver was voluntary.
For the year ended October 31, 2017, the Fund reimbursed the Manager $5,302 for certain accounting services, which is included in accounting services in the Statement of Operations.
These amounts are shown as transfer agent fees waived and/or reimbursed — class specific in the Statement of Operations. Class specific expense waivers and/or reimbursements are as follows:
| Institutional | Investor A | Investor C | Class R | Total | ||||||||||||||
| $ | 93,007 | $153,256 | $ | 3,426 | $7,604 | $ | 257,293 | |||||||||||
Interfund Lending: In accordance with an exemptive order (the “Order”) from the U.S. Securities and Exchange Commission (“SEC”), the Fund may participate in a joint lending and borrowing facility for temporary purposes (the “Interfund Lending Program”), subject to compliance with the terms and conditions of the Order, and to the extent permitted by the Fund’s investment policies and restrictions. The Fund is currently permitted to borrow and lend under the Interfund Lending Program.
A lending BlackRock fund may lend in aggregate up to 15% of its net assets, but may not lend more than 5% of its net assets to any one borrowing fund through the Interfund Lending Program. A borrowing BlackRock fund may not borrow through the Interfund Lending Program or from any other source more than 33 1/3% of its total assets (or any lower threshold provided for by the fund’s investment restrictions). If a borrowing BlackRock fund’s total outstanding borrowings exceed 10% of its total assets, each of its outstanding interfund loans will be subject to collateralization of at least 102% of the outstanding principal value of the loan. All interfund loans are for temporary or emergency
| 20 | NOTESTO FINANCIAL STATEMENTS |
Notes to Financial Statements (continued)
purposes and the interest rate to be charged will be the average of the highest current overnight repurchase agreement rate available to a lending fund and the bank loan rate, as calculated according to a formula established by the Board. During the year ended October 31, 2017, the Fund did not participate in the Interfund Lending Program.
Officers and Directors: Certain officers and/or directors of the Fund are officers and/or directors of BlackRock or its affiliates. The Fund reimburses the Manager for a portion of the compensation paid to the Fund’s Chief Compliance Officer, which is included in Officer and Directors in the Statement of Operations.
| 6. | PURCHASES AND SALES: |
For the year ended October 31, 2017, purchases and sales of investments, excluding short-term securities, were $551,986,005 and $613,257,451, respectively, including purchases and sales of investments of $218,240,629 and $238,001,214, respectively, from the Portfolio prior to February 27, 2017.
| 7. | INCOME TAX INFORMATION: |
It is the Fund’s policy to comply with the requirements of the Internal Revenue Code of 1986, as amended, applicable to regulated investment companies, and to distribute substantially all of its taxable income to its shareholders. Therefore, no U.S. federal income tax provision is required.
The Fund files U.S. federal and various state and local tax returns. No income tax returns are currently under examination. The statute of limitations on the Fund’s U.S. federal tax returns generally remains open for each of the four years ended October 31, 2017. The statutes of limitations on the Fund’s state and local tax returns may remain open for an additional year depending upon the jurisdiction.
Management has analyzed tax laws and regulations and their application to the Fund as of October 31, 2017, inclusive of the open tax return years, and does not believe that there are any uncertain tax positions that require recognition of a tax liability in the Fund’s financial statements.
U.S. GAAP requires that certain components of net assets be adjusted to reflect permanent differences between financial and tax reporting. This reclassification has no effect on net assets or net asset value per share. As of period end, the following permanent differences attributable to foreign currency transactions and the characterization of expenses were reclassified to the following accounts:
Undistributed net investment income | $ | (467,554 | ) | |
Accumulated net realized loss | $ | 467,554 |
The tax character of distributions paid was as follows:
| 10/31/17 | 10/31/16 | |||||||
Ordinary income | $ | 6,012,285 | $ | 1,575,648 | ||||
|
|
|
| |||||
As of period end, the tax components of accumulated net earnings (losses) were as follows:
Undistributed ordinary income | $ | 5,253,351 | ||
Capital loss carryforward | (30,631,331 | ) | ||
Net unrealized gains1 | 73,569,513 | |||
|
| |||
| $ | 48,191,533 | |||
|
|
| 1 | The difference between book-basis and tax-basis net unrealized gains was attributable primarily to the tax deferral of losses on wash sales and the realization for tax purposes of unrealized gains/losses on certain foreign currency contracts. |
As of October 31, 2017, the Fund had capital loss carryforwards of $30,631,331 available to offset future realized capital gains. These losses are subject to expire on October 31, 2019.
During the year ended October 31, 2017, the Fund utilized $50,890,558 of its capital loss carryforward.
As of October 31, 2017, gross unrealized appreciation and depreciation for investments and derivatives based on cost for U.S. federal income tax purposes were as follows:
Tax cost | $ | 536,002,785 | ||
|
| |||
Gross unrealized appreciation | $ | 87,668,803 | ||
Gross unrealized depreciation | (13,441,404 | ) | ||
|
| |||
Net unrealized appreciation | $ | 74,227,399 |
| 8. | BANK BORROWINGS: |
The Corporation, on behalf of the Fund, along with certain other funds managed by the Manager and its affiliates (“Participating Funds”), is a party to a 364-day, $2.1 billion credit agreement with a group of lenders. Under this agreement, the Fund may borrow to fund shareholder redemptions. Excluding commitments designated for certain individual funds, the Participating Funds, including the Fund, can borrow up to an aggregate commitment amount of $1.6 billion at any time outstanding, subject to asset coverage and other limitations as specified in the agreement. The credit agreement has the following terms: a fee of 0.12% per annum on unused commitment amounts and interest at a rate equal to the higher of (a) one-month LIBOR (but, in any event, not less than 0.00%) on the date the loan is made plus 0.80% per annum or (b) the Fed Funds
| 2017 BLACKROCK ANNUAL REPORTTO SHAREHOLDERS | 21 |
Notes to Financial Statements (continued)
rate (but, in any event, not less than 0.00%) in effect from time to time plus 0.80% per annum on amounts borrowed. The agreement expires in April 2018 unless extended or renewed. Participating Funds paid administration, legal and arrangement fees, which, if applicable, are included in miscellaneous expenses in the Statement of Operations. These fees were allocated among such funds based upon portions of the aggregate commitment available to them and relative net assets of Participating Funds. During the year ended October 31, 2017, the Fund did not borrow under the credit agreement.
| 9. | PRINCIPAL RISKS: |
In the normal course of business, the Fund invests in securities or other instruments and may enter into certain transactions, and such activities subject the Fund to various risks, including among others, fluctuations in the market (market risk) or failure of an issuer to meet all of its obligations. The value of securities or other instruments may also be affected by various factors, including, without limitation: (i) general economy; (ii) overall market as well as local, regional or global political and/or social instability; (iii) regulation, taxation or international tax treaties between various countries; or (iv) currency, interest rate and price fluctuations. The Fund’s prospectus provides details of the risks to which the Fund is subject.
On October 11, 2016, BlackRock implemented certain changes required by amendments to Rule 2a-7 under the 1940 Act, which governs the operations of U.S. money market funds. The Fund may be exposed to additional risks when reinvesting cash collateral in money market funds that do not seek to maintain a stable NAV per share of $1.00 and which may be subject to redemption gates or liquidity fees under certain circumstances.
Valuation Risk: The market values of equities, such as common stocks and preferred securities or equity related investments, such as futures and options, may decline due to general market conditions which are not specifically related to a particular company. They may also decline due to factors which affect a particular industry or industries. The Fund may invest in illiquid investments and may experience difficulty in selling those investments in a timely manner at the price that it believes the investments are worth. Prices may fluctuate widely over short or extended periods in response to company, market or economic news. Markets also tend to move in cycles, with periods of rising and falling prices. This volatility may cause the Fund’s NAV to experience significant increases or decreases over short periods of time. If there is a general decline in the securities and other markets, the NAV of the Fund may lose value, regardless of the individual results of the securities and other instruments in which the Fund invests.
Counterparty Credit Risk: Similar to issuer credit risk, the Fund may be exposed to counterparty credit risk, or the risk that an entity may fail to or be unable to perform on its commitments related to unsettled or open transactions. The Fund manages counterparty credit risk by entering into transactions only with counterparties that the Manager believes have the financial resources to honor their obligations and by monitoring the financial stability of those counterparties. Financial assets, which potentially expose the Fund to market, issuer and counterparty credit risks, consist principally of financial instruments and receivables due from counterparties. The extent of the Fund’s exposure to market, issuer and counterparty credit risks with respect to these financial assets is approximately their value recorded in the Statements of Assets and Liabilities, less any collateral held by the Fund.
Concentration Risk: The Fund invests a significant portion of its assets in securities of issuers located in Europe or with significant exposure to European issuers or countries. The European financial markets have recently experienced volatility and adverse trends due to concerns about economic downturns in, or rising government debt levels of, several European countries. These events may spread to other countries in Europe and may affect the value and liquidity of certain of the Fund’s investments.
The United Kingdom voted on June 23, 2016 to withdraw from the European Union, which may introduce significant new uncertainties and instability in the financial markets across Europe.
| 22 | NOTESTO FINANCIAL STATEMENTS |
Notes to Financial Statements (continued)
| 10. | CAPITAL SHARE TRANSACTIONS: |
Transactions in capital shares for each class were as follows:
| Year Ended October 31, | ||||||||||||||||
| 2017 | 2016 | |||||||||||||||
| Shares | Amount | Shares | Amount | |||||||||||||
Institutional | ||||||||||||||||
Shares sold | 4,000,866 | $ | 63,673,873 | 1,830,101 | $ | 24,670,611 | ||||||||||
Shares issued in reinvestment of distributions | 115,087 | 1,578,998 | 54,070 | 738,604 | ||||||||||||
Shares redeemed | (2,600,821 | ) | (40,514,803 | ) | (2,857,470 | ) | (38,581,993 | ) | ||||||||
|
|
|
|
|
|
|
| |||||||||
Net increase (decrease) | 1,515,132 | $ | 24,738,068 | (973,299 | ) | $ | (13,172,778 | ) | ||||||||
|
|
|
|
|
|
|
| |||||||||
Investor A | ||||||||||||||||
Shares sold | 8,503,348 | $ | 132,428,713 | 6,669,646 | $ | 88,109,773 | ||||||||||
Shares issued in reinvestment of distributions | 272,268 | 3,656,571 | 52,698 | 705,103 | ||||||||||||
Shares redeemed | (11,136,346 | ) | (170,846,436 | ) | (4,790,310 | ) | (63,113,055 | ) | ||||||||
|
|
|
|
|
|
|
| |||||||||
Net increase (decrease) | (2,360,730 | ) | $ | (34,761,152 | ) | 1,932,034 | $ | 25,701,821 | ||||||||
|
|
|
|
|
|
|
| |||||||||
Investor C | ||||||||||||||||
Shares sold | 670,274 | $ | 9,367,349 | 1,662,247 | $ | 20,262,263 | ||||||||||
Shares issued in reinvestment of distributions | 11,701 | 146,725 | — | — | ||||||||||||
Shares redeemed | (4,736,442 | ) | (66,419,599 | ) | (3,455,786 | ) | (42,134,487 | ) | ||||||||
|
|
|
|
|
|
|
| |||||||||
Net decrease | (4,054,467 | ) | $ | (56,905,525 | ) | (1,793,539 | ) | $ | (21,872,224 | ) | ||||||
|
|
|
|
|
|
|
| |||||||||
Class R | ||||||||||||||||
Shares sold | 302,471 | $ | 4,478,926 | 507,628 | $ | 6,645,449 | ||||||||||
Shares issued in reinvestment of distributions | 13,921 | 187,242 | — | — | ||||||||||||
Shares redeemed | (515,709 | ) | (7,660,526 | ) | (531,674 | ) | (6,997,290 | ) | ||||||||
|
|
|
|
|
|
|
| |||||||||
Net decrease | (199,317 | ) | $ | (2,994,358 | ) | (24,046 | ) | $ | (351,841 | ) | ||||||
|
|
|
|
|
|
|
| |||||||||
Total Net Decrease | (5,099,382 | ) | $ | (69,922,967 | ) | (858,850 | ) | $ | (9,695,022 | ) | ||||||
|
|
|
|
|
|
|
| |||||||||
| 11. | SUBSEQUENT EVENTS: |
Management has evaluated the impact of all subsequent events on the Fund through the date the financial statements were issued and has determined that there were no subsequent events requiring adjustment or additional disclosure in the financial statements.
| 2017 BLACKROCK ANNUAL REPORTTO SHAREHOLDERS | 23 |
Report of Independent Registered Public Accounting Firm
To the Board of Trustees of BlackRock Series, Inc. and Shareholders of BlackRock International Fund
In our opinion, the accompanying statement of assets and liabilities, including the schedule of investments, and the related statements of operations and of changes in net assets and the financial highlights present fairly, in all material respects, the financial position of BlackRock International Fund (an individual fund of Blackrock Series, Inc., hereafter referred to as the “Fund”) as of October 31, 2017, the results of its operations, the changes in its net assets and the financial highlights for the year then ended, in conformity with accounting principles generally accepted in the United States of America. These financial statements and financial highlights (hereafter referred to as “financial statements”) are the responsibility of the Fund’s management. Our responsibility is to express an opinion on these financial statements based on our audit. We conducted our audit of these financial statements in accordance with the standards of the Public Company Accounting Oversight Board (United States). Those standards require that we plan and perform the audit to obtain reasonable assurance about whether the financial statements are free of material misstatement. An audit includes examining, on a test basis, evidence supporting the amounts and disclosures in the financial statements, assessing the accounting principles used and significant estimates made by management, and evaluating the overall financial statement presentation. We believe that our audit, which included confirmation of securities as of October 31, 2017 by correspondence with the custodian and brokers, provides a reasonable basis for our opinion.
The financial statements as of and for the year ended October 31, 2016 and the financial highlights for each of the periods ended on or prior to October 31, 2016 (not presented herein, other than the statement of changes in net assets and the financial highlights) were audited by other auditors whose report dated December 22, 2016 expressed an unqualified opinion on those financial statements and financial highlights.
PricewaterhouseCoopers LLP
Philadelphia, Pennsylvania
December 22, 2017
Important Tax Information (Unaudited)
During the fiscal year ended October 31, 2017, the following information is provided with respect to the ordinary income distributions paid by the Fund:
| Payable Date | 12/14/16 | |||
Qualified Dividend Income for Individuals1,2 | 100.00 | % | ||
Dividends Qualifying for the Dividend Received Deduction for Corporations1,2 | 3.47 | % | ||
Foreign Source Income2 | 94.59 | % | ||
Foreign Taxes Paid Per Share3 | $ | 0.033171 | ||
| 1 | The Fund hereby designates the percentage indicated above or the maximum amount allowable by law. |
| 2 | Expressed as a percentage of the cash distribution grossed-up for foreign taxes. |
| 3 | The foreign taxes paid represent taxes incurred by the Fund on income received by the Fund from foreign sources. Foreign taxes paid may be included in taxable income with an offsetting deduction from gross income or may be taken as a credit for taxes paid to foreign governments. You should consult your tax advisor regarding the appropriate treatment of foreign taxes paid. |
| 24 | IMPORTANT TAX INFORMATION |
Disclosure of Investment Advisory Agreement and Sub-Advisory Agreement
The Board of Directors (the “Board,” the members of which are referred to as “Board Members”) of BlackRock Series, Inc. (the “Corporation”) met in person on April 20, 2017 (the “April Meeting”) and May 24-25, 2017 (the “May Meeting”) to consider the approval of the investment advisory agreement (the “Advisory Agreement”) between the Corporation, on behalf of BlackRock International Fund (the “Fund”), a series of the Corporation, and BlackRock Advisors, LLC (the “Manager”), the Corporation’s investment advisor. The Board also considered the approval of the sub-advisory agreement (the “Sub-Advisory Agreement”) between the Manager and BlackRock International Limited (the “Sub-Advisor”) with respect to the Fund. The Manager and the Sub-Advisor are referred to herein as “BlackRock.” The Advisory Agreement and the Sub-Advisory Agreement are referred to herein as the “Agreements.”
Activities and Composition of the Board
On the date of the May Meeting, the Board consisted of thirteen individuals, eleven of whom were not “interested persons” of the Corporation or the Fund as defined in the Investment Company Act of 1940, as amended (the “1940 Act”) (the “Independent Board Members”). The Board Members are responsible for the oversight of the operations of the Corporation and the Fund and perform the various duties imposed on the directors of investment companies by the 1940 Act. The Independent Board Members have retained independent legal counsel to assist them in connection with their duties. The Chair of the Board is an Independent Board Member. The Board has established five standing committees: an Audit Committee, a Governance and Nominating Committee, a Compliance Committee, a Performance Oversight and Contract Committee and an Executive Committee, each of which is chaired by an Independent Board Member and composed of Independent Board Members (except for the Executive Committee, which also has one interested Board Member).
The Agreements
Pursuant to the 1940 Act, the Board is required to consider the continuation of the Agreements on an annual basis. The Board has four quarterly meetings per year, each extending over two days, a fifth one-day meeting to consider specific information surrounding the consideration of renewing the Agreements, and additional in-person and telephonic meetings as needed. In connection with this year-long deliberative process, the Board assessed, among other things, the nature, extent and quality of the services provided to the Fund by BlackRock, BlackRock’s personnel and affiliates, including (as applicable): investment management; administrative and shareholder services; the oversight of fund service providers; marketing; risk oversight; compliance; and ability to meet applicable legal and regulatory requirements.
The Board, acting directly and through its committees, considers at each of its meetings, and from time to time as appropriate, factors that are relevant to its annual consideration of the renewal of the Agreements, including the services and support provided by BlackRock to the Fund and its shareholders. BlackRock also furnished additional information to the Board in response to specific questions from the Board. This additional information is discussed further below in the section titled “Board Considerations in Approving the Agreements.” Among the matters the Board considered were: (a) investment performance for one-year, three-year, five-year, ten-year, and/or since inception periods, as applicable, against peer funds, applicable benchmark, and performance metrics, as applicable, as well as senior management’s and portfolio managers’ analysis of the reasons for any over-performance or underperformance relative to its peers, benchmarks, and other performance metrics, as applicable; (b) fees, including advisory, administration, if applicable, and other amounts paid to BlackRock and its affiliates by the Fund for services; (c) Fund operating expenses and how BlackRock allocates expenses to the Fund; (d) the resources devoted to, risk oversight of, and compliance reports relating to, implementation of the Fund’s investment objective(s), policies and restrictions, and meeting regulatory requirements; (e) the Corporation’s adherence to its compliance policies and procedures; (f) the nature, cost and character of non-investment management services provided by BlackRock and its affiliates; (g) BlackRock’s and other service providers’ internal controls and risk and compliance oversight mechanisms; (h) BlackRock’s implementation of the proxy voting policies approved by the Board; (i) the use of brokerage commissions and execution quality of portfolio transactions; (j) BlackRock’s implementation of the Corporation’s valuation and liquidity procedures; (k) an analysis of management fees for products with similar investment mandates across the open-end fund, exchange-traded fund (“ETF”), closed-end fund, sub-advised mutual fund, separately managed account, collective investment trust, and institutional separate account product channels, as applicable, and the similarities and differences between these products and the services provided as compared to the Fund; (l) BlackRock’s compensation methodology for its investment professionals and the incentives and accountability it creates, along with investment professionals’ investments in the fund(s) they manage; and (m) periodic updates on BlackRock’s business.
Board Considerations in Approving the Agreements
The Approval Process: Prior to the April Meeting, the Board requested and received materials specifically relating to the Agreements. The Board is continuously engaged in a process with its independent legal counsel and BlackRock to review the nature and scope of the information provided to better assist its deliberations. The materials provided in connection with the April Meeting included (a) information independently compiled and prepared by Broadridge Financial Solutions, Inc. (“Broadridge”) on Fund fees and expenses as compared with a peer group of funds as determined by Broadridge (“Expense Peers”) and the investment performance of the Fund as comparedwithapeer group of funds as determined by Broadridge(a) and the Morningstar Classification; (b) information on the profits realized by BlackRock and its affiliates pursuant to the Agreements and a discussion of fall-out benefits to BlackRock and its affiliates; (c) a general analysis provided by BlackRock concerning investment management fees charged to other clients, such as institutional clients, sub-advised mutual funds, ETFs, closed-end funds, and separately managed accounts under similar investment mandates, as well as the performance of such other clients, as applicable; (d) review of non-management fees; (e) the existence, impact and sharing of potential economies of scale; (f) a summary of aggregate amounts paid by the Fund to BlackRock; and (g) sales and redemption data regarding the Fund’s shares.
At the April Meeting, the Board reviewed materials relating to its consideration of the Agreements. As a result of the discussions that occurred during the April Meeting, and as a culmination of the Board’s year-long deliberative process, the Board presented BlackRock with questions and requests for additional information. BlackRock responded to these requests with additional written information in advance of the May Meeting.
| (a) | Funds are ranked by Broadridge in quartiles, ranging from first to fourth, where first is the most desirable quartile position and fourth is the least desirable. |
| 2017 BLACKROCK ANNUAL REPORTTO SHAREHOLDERS | 25 |
Disclosure of Investment Advisory Agreement and Sub-Advisory Agreement (continued)
At the May Meeting, the Board, including the Independent Board Members, approved the continuation of the Advisory Agreement between the Manager and the Corporation with respect to the Fund and the Sub-Advisory Agreement between the Manager and the Sub-Advisor with respect to the Fund, each for a one-year term ending June 30, 2018. In approving the continuation of the Agreements, the Board considered: (a) the nature, extent and quality of the services provided by BlackRock; (b) the investment performance of the Fund; (c) the advisory fee and the cost of the services and profits to be realized by BlackRock and its affiliates from their relationship with the Fund; (d) the Fund’s costs to investors compared to the costs of Expense Peers and performance compared to the relevant performance metrics as previously discussed; (e) the sharing of potential economies of scale; (f) fall-out benefits to BlackRock and its affiliates as a result of its relationship with the Fund; and (g) other factors deemed relevant by the Board Members.
The Board also considered other matters it deemed important to the approval process, such as other payments made to BlackRock or its affiliates, securities lending and cash management, services related to the valuation and pricing of Fund portfolio holdings, and advice from independent legal counsel with respect to the review process and materials submitted for the Board’s review. The Board noted the willingness of BlackRock personnel to engage in open, candid discussions with the Board. The Board did not identify any particular information as determinative, and each Board Member may have attributed different weights to the various items considered.
A. Nature, Extent and Quality of the Services Provided by BlackRock: The Board, including the Independent Board Members, reviewed the nature, extent and quality of services provided by BlackRock, including the investment advisory services and the resulting performance of the Fund. Throughout the year, the Board compared Fund performance to the performance of a comparable group of mutual funds, relevant benchmark, and performance metrics, as applicable. The Board met with BlackRock’s senior management personnel responsible for investment activities, including the senior investment officers. The Board also reviewed the materials provided by the Fund’s portfolio management team discussing the Fund’s performance and the Fund’s investment objective(s), strategies and outlook.
The Board considered, among other factors, with respect to BlackRock: the number, education and experience of investment personnel generally and the Fund’s portfolio management team; BlackRock’s research capabilities; investments by portfolio managers in the funds they manage; portfolio trading capabilities; use of technology; commitment to compliance; credit analysis capabilities; risk analysis and oversight capabilities; and the approach to training and retaining portfolio managers and other research, advisory and management personnel. The Board engaged in a review of BlackRock’s compensation structure with respect to the Fund’s portfolio management team and BlackRock’s ability to attract and retain high-quality talent and create performance incentives.
In addition to investment advisory services, the Board considered the quality of the administrative and other non-investment advisory services provided to the Fund. BlackRock and its affiliates provide the Fund with certain administrative, shareholder and other services (in addition to any such services provided to the Fund by third parties) and officers and other personnel as are necessary for the operations of the Fund. In particular, BlackRock and its affiliates provide the Fund with administrative services including, among others: (i) preparing disclosure documents, such as the prospectus, the summary prospectus (as applicable), the statement of additional information and periodic shareholder reports; (ii) oversight of daily accounting and pricing; (iii) preparing periodic filings with regulators; (iv) overseeing and coordinating the activities of other service providers; (v) organizing Board meetings and preparing the materials for such Board meetings; (vi) providing legal and compliance support; (vii) furnishing analytical and other support to assist the Board in its consideration of strategic issues such as the merger, consolidation or repurposing of certain open-end funds; and (viii) performing other administrative functions necessary for the operation of the Fund, such as tax reporting, fulfilling regulatory filing requirements and call center services. The Board reviewed the structure and duties of BlackRock’s fund administration, shareholder services, and legal & compliance departments and considered BlackRock’s policies and procedures for assuring compliance with applicable laws and regulations.
B. The Investment Performance of the Fund and BlackRock: The Board, including the Independent Board Members, also reviewed and considered the performance history of the Fund. In preparation for the April Meeting, the Board was provided with reports independently prepared by Broadridge, which included a comprehensive analysis of the Fund’s performance. The Board also reviewed a narrative and statistical analysis of the Broadridge data that was prepared by BlackRock. In connection with its review, the Board received and reviewed information regarding the investment performance of the Fund as compared to other funds in its applicable Broadridge category and the Morningstar Classification. The Board was provided with a description of the methodology used by Broadridge to select peer funds and periodically meets with Broadridge representatives to review its methodology. The Board was provided with information on the composition of the Broadridge performance universes and expense universes. The Board and its Performance Oversight and Contract Committee regularly review, and meet with Fund management to discuss, the performance of the Fund throughout the year.
In evaluating performance, the Board recognized that the performance data reflects a snapshot of a period as of a particular date and that selecting a different performance period could produce significantly different results. Further, the Board recognized that it is possible that long-term performance can be adversely affected by even one period of significant underperformance so that a single investment decision or theme has the ability to affect long-term performance disproportionately.
The Board noted that for each of the one-, three- and five-year periods reported, the Fund ranked in the third quartile against its Morningstar Performance Universe. BlackRock believes that the Morningstar Performance Universe is an appropriate performance metric for the Fund. The Board and BlackRock reviewed the Fund’s underperformance during these periods. The Board was informed that, among other things, the primary detractor during the one-year period was an overweight position and stock selection in the healthcare sector. Poor stock selection in the financial sector, particularly among banks, drove underperformance over the three-year period.
The Board and BlackRock discussed BlackRock’s strategy for improving the Fund’s investment performance. Discussions covered topics such as: investment risks undertaken by the Fund; performance attribution; the Fund’s investment personnel; and the resources appropriate to support the Fund’s investment processes.
| 26 | DISCLOSUREOF INVESTMENT ADVISORY AGREEMENTAND SUB-ADVISORY AGREEMENT |
Disclosure of Investment Advisory Agreement and Sub-Advisory Agreement (continued)
C. Consideration of the Advisory/Management Fees and the Cost of the Services and Profits to be Realized by BlackRock and its Affiliates from their Relationship with the Fund: The Board, including the Independent Board Members, reviewed the Fund’s contractual management fee rate compared with the other funds in its Broadridge category. The contractual management fee rate represents a combination of the advisory fee and any administrative fees, before taking into account any reimbursements or fee waivers. The Board also compared the Fund’s total expense ratio, as well as its actual management fee rate, to those of other funds in its Broadridge category. The total expense ratio represents a fund’s total net operating expenses, including any 12b-1 or non 12b-1 service fees. The total expense ratio gives effect to any expense reimbursements or fee waivers that benefit a fund, and the actual management fee rate gives effect to any management fee reimbursements or waivers that benefit a fund. The Board considered the services provided and the fees charged by BlackRock and its affiliates to other types of clients with similar investment mandates, as applicable, including institutional accounts and sub-advised mutual funds (including mutual funds sponsored by third parties).
The Board received and reviewed statements relating to BlackRock’s financial condition. The Board reviewed BlackRock’s profitability methodology and was also provided with a profitability analysis that detailed the revenues earned and the expenses incurred by BlackRock for services provided to the Fund. The Board reviewed BlackRock’s profitability with respect to the Fund and other funds the Board currently oversees for the year ended December 31, 2016 compared to available aggregate profitability data provided for the prior two years. The Board reviewed BlackRock’s profitability with respect to certain other U.S. fund complexes managed by the Manager and/or its affiliates. The Board reviewed BlackRock’s assumptions and methodology of allocating expenses in the profitability analysis, noting the inherent limitations in allocating costs among various advisory products. The Board recognized that profitability may be affected by numerous factors including, among other things, fee waivers and expense reimbursements by the Manager, the types of funds managed, precision of expense allocations and business mix. As a result, calculating and comparing profitability at individual fund levels is difficult.
The Board noted that, in general, individual fund or product line profitability of other advisors is not publicly available. The Board reviewed BlackRock’s overall operating margin, in general, compared to that of certain other publicly-traded asset management firms. The Board considered the differences between BlackRock and these other firms, including the contribution of technology at BlackRock, BlackRock’s expense management, and the relative product mix.
In addition, the Board considered the cost of the services provided to the Fund by BlackRock, and BlackRock’s and its affiliates’ profits relating to the management and distribution of the Fund and the other funds advised by BlackRock and its affiliates. As part of its analysis, the Board reviewed BlackRock’s methodology in allocating its costs of managing the Fund, to the Fund. The Board may receive and review information from independent third parties as part of its annual evaluation. The Board considered whether BlackRock has the financial resources necessary to attract and retain high quality investment management personnel to perform its obligations under the Agreements and to continue to provide the high quality of services that is expected by the Board. The Board further considered factors including but not limited to BlackRock’s commitment of time, assumption of risk, and liability profile in servicing the Fund in contrast to what is required of BlackRock with respect to other products with similar investment mandates across the open-end fund, ETF, closed-end fund, sub-advised mutual fund, separately managed account, collective investment trust, and institutional separate account product channels, as applicable.
The Board noted that the Fund’s contractual management fee rate ranked in the second quartile, and that the actual management fee rate and total expense ratio ranked in the third and second quartiles, respectively, relative to the Fund’s Expense Peers. The Board also noted that the Fund has an advisory fee arrangement that includes breakpoints that adjust the fee rate downward as the size of the Fund increases above certain contractually specified levels. The Board further noted that BlackRock has contractually agreed to a cap on the Fund’s total expenses as a percentage of the Fund’s average daily net assets on a class-by-class basis.
D. Economies of Scale: The Board, including the Independent Board Members, considered the extent to which economies of scale might be realized as the assets of the Fund increase, as well as the existence of expense caps, as applicable. The Board also considered the extent to which the Fund benefits from such economies in a variety of ways and whether there should be changes in the advisory fee rate or breakpoint structure in order to enable the Fund to more fully participate in these economies of scale. The Board considered the Fund’s asset levels and whether the current fee schedule was appropriate. In their consideration, the Board Members took into account the existence of any expense caps and further considered the continuation and/or implementation, as applicable, of such caps.
E. Other Factors Deemed Relevant by the Board Members: The Board, including the Independent Board Members, also took into account other ancillary or “fall-out” benefits that BlackRock or its affiliates may derive from their respective relationships with the Fund, both tangible and intangible, such as BlackRock’s ability to leverage its investment professionals who manage other portfolios and risk management personnel, an increase in BlackRock’s profile in the investment advisory community, and the engagement of BlackRock’s affiliates as service providers to the Fund, including for administrative, distribution, securities lending and cash management services. The Board also considered BlackRock’s overall operations and its efforts to expand the scale of, and improve the quality of, its operations. The Board also noted that BlackRock may use and benefit from third party research obtained by soft dollars generated by certain registered fund transactions to assist in managing all or a number of its other client accounts.
In connection with its consideration of the Agreements, the Board also received information regarding BlackRock’s brokerage and soft dollar practices. The Board received reports from BlackRock which included information on brokerage commissions and trade execution practices throughout the year.
The Board noted the competitive nature of the open-end fund marketplace, and that shareholders are able to redeem their Fund shares if they believe that the Fund’s fees and expenses are too high or if they are dissatisfied with the performance of the Fund.
| 2017 BLACKROCK ANNUAL REPORTTO SHAREHOLDERS | 27 |
Disclosure of Investment Advisory Agreement and Sub-Advisory Agreement (continued)
Conclusion
The Board, including the Independent Board Members, approved the continuation of the Advisory Agreement between the Manager and the Corporation with respect to the Fund and the Sub-Advisory Agreement between the Manager and the Sub-Advisor with respect to the Fund, each for a one-year term ending June 30, 2018. Based upon its evaluation of all of the aforementioned factors in their totality, as well as other information, the Board, including the Independent Board Members, was satisfied that the terms of the Agreements were fair and reasonable and in the best interest of the Fund and its shareholders. In arriving at its decision to approve the Agreements, the Board did not identify any single factor or group of factors as all-important or controlling, but considered all factors together, and different Board Members may have attributed different weights to the various factors considered. The Independent Board Members were also assisted by the advice of independent legal counsel in making this determination. The contractual fee arrangements for the Fund reflect the results of several years of review by the Board Members and predecessor Board Members, and discussions between such Board Members (and predecessor Board Members) and BlackRock. As a result, the Board Members’ conclusions may be based in part on their consideration of these arrangements in prior years.
| 28 | DISCLOSUREOF INVESTMENT ADVISORY AGREEMENTAND SUB-ADVISORY AGREEMENT |
Director and Officer Information
| Independent Directors (a) | ||||||||
Name Year of Birth (b) | Position(s) Held (Length of Service) (c) | Principal Occupation(s) During Past Five Years | Number of BlackRock-Advised Registered Investment Companies (“RICs”) Consisting of Investment Portfolios (“Portfolios”) Overseen | Public Directorships | ||||
Rodney D. Johnson 1941 | Chair of the Board and Director (Since 2007) | President, Fairmount Capital Advisors, Inc. from 1987 to 2013; Member of the Archdiocesan Investment Committee of the Archdiocese of Philadelphia from 2004 to 2012; Director, The Committee of Seventy (civic) from 2006 to 2012; Director, Fox Chase Cancer Center from 2004 to 2011; Director, The Mainstay (non-profit) since 2016. | 26 RICs consisting of 144 Portfolios | None | ||||
Susan J. Carter 1956 | Director (Since 2016) | Director, Pacific Pension Institute since 2014; Advisory Board Member, Center for Private Equity and Entrepreneurship at Tuck School of Business since 1997; Senior Advisor, Commonfund Capital, Inc. (“CCI”) (investment adviser) in 2015; Chief Executive Officer, CCI from 2013 to 2014; President & Chief Executive Officer, CCI from 1997 to 2013; Advisory Board Member, Girls Who Invest since 2015; Advisory Board Member, Bridges Ventures since 2016; Trustee, Financial Accounting Foundation since 2017. | 26 RICs consisting of 144 Portfolios | None | ||||
Collette Chilton 1958 | Director (Since 2015) | Chief Investment Officer, Williams College since 2006; Chief Investment Officer, Lucent Asset Management Corporation from 1998 to 2006. | 26 RICs consisting of 144 Portfolios | None | ||||
Neil A. Cotty 1954 | Director (Since 2016) | Bank of America Corporation from 1996 to 2015, serving in various senior finance leadership roles, including Chief Accounting Officer, from 2009 to 2015, Chief Financial Officer of Global Banking, Markets and Wealth Management from 2008 to 2009, Chief Accounting Officer from 2004 to 2008, Chief Financial Officer of Consumer Bank from 2003 to 2004, Chief Financial Officer of Global Corporate Investment Bank from 1999 to 2002. | 26 RICs consisting of 144 Portfolios | None | ||||
Cynthia A. Montgomery 1952 | Director (Since 2007) | Professor, Harvard Business School since 1989; Director, McLean Hospital from 2005 to 2012. | 26 RICs consisting of 144 Portfolios | Newell Rubbermaid, Inc. (manufacturing) | ||||
Joseph P. Platt 1947 | Director (Since 2007) | General Partner, Thorn Partners, LP (private investments) since 1998; Director, WQED Multi-Media (public broadcasting not-for-profit) since 2001; Chair, Basic Health International (non-profit) since 2015. | 26 RICs consisting of 144 Portfolios | Greenlight Capital Re, Ltd. (reinsurance company); Consol Energy Inc. | ||||
Robert C. Robb, Jr. 1945 | Director (Since 2007) | Partner, Lewis, Eckert, Robb and Company (management and financial consulting firm) since 1981 and Principal since 2010. | 26 RICs consisting of 144 Portfolios | None | ||||
Mark Stalnecker 1951 | Director (Since 2015) | Chief Investment Officer, University of Delaware from 1999 to 2013; Trustee, Winterthur Museum and Country Estate from 2001 to 2015; Member of the Investment Committee, Delaware Public Employees’ Retirement System since 2002; Member of the Investment Committee, Christiana Care Health System since 2009; Member of the Investment Committee, Delaware Community Foundation from 2013 to 2014; Director, SEI Private Trust Co. from 2001 to 2014. | 26 RICs consisting of 144 Portfolios | None | ||||
Kenneth L. Urish 1951 | Director (Since 2007) | Managing Partner, Urish Popeck & Co., LLC (certified public accountants and consultants) since 1976; Past-Chairman of the Professional Ethics Committee of the Pennsylvania Institute of Certified Public Accountants and Committee Member thereof since 2007; Member of External Advisory Board, The Pennsylvania State University Accounting Department since founding in 2001; Principal, UP Strategic Wealth Investment Advisors, LLC since 2013; Trustee, The Holy Family Institute from 2001 to 2010; President and Trustee, Pittsburgh Catholic Publishing Associates from 2003 to 2008; Director, Inter-Tel from 2006 to 2007. | 26 RICs consisting of 144 Portfolios | None | ||||
| 2017 BLACKROCK ANNUAL REPORTTO SHAREHOLDERS | 29 |
Director and Officer Information (continued)
| Independent Directors (a) | ||||||||
Name Year of Birth (b) | Position(s) Held (Length of Service) (c) | Principal Occupation(s) During Past | Number of BlackRock-Advised Registered Investment Companies (“RICs”) Consisting of Investment Portfolios (“Portfolios”) Overseen | Public Directorships | ||||
Claire A. Walton 1957 | Director (Since 2016) | Chief Operating Officer and Chief Financial Officer of Liberty Square Asset Management, LP from 1998 to 2015; General Partner of Neon Liberty Capital Management, LLC since 2003; Director, Boston Hedge Fund Group since 2009; Director, Woodstock Ski Runners since 2013; Director, Massachusetts Council on Economic Education from 2013 to 2015. | 26 RICs consisting of 144 Portfolios | None | ||||
Frederick W. Winter 1945 | Director (Since 2007) | Director, Alkon Corporation since 1992; Dean Emeritus of the Joseph M. Katz School of Business, University of Pittsburgh, Dean and Professor from 1997 to 2005, Professor until 2013. | 26 RICs consisting of 144 Portfolios | None | ||||
Interested Directors (d) | ||||||||
Barbara G. Novick 1960 | Director (Since 2015) | Vice Chairman of BlackRock, Inc. since 2006; Chair of BlackRock’s Government Relations Steering Committee since 2009; Head of the Global Client Group of BlackRock, Inc. from 1988 to 2008. | 100 RICs consisting of 218 Portfolios | None | ||||
John M. Perlowski 1964 | Director, (Since 2015) and President and Chief Executive Officer (Since 2010) | Managing Director of BlackRock, Inc. since 2009; Head of BlackRock Global Fund & Accounting Services since 2009; Managing Director and Chief Operating Officer of the Global Product Group at Goldman Sachs Asset Management, L.P. from 2003 to 2009; Treasurer of Goldman Sachs Mutual Funds from 2003 to 2009 and Senior Vice President thereof from 2007 to 2009; Director of Goldman Sachs Offshore Funds from 2002 to 2009; Director of Family Resource Network (charitable foundation) since 2009. | 127 RICs consisting of 316 Portfolios | None | ||||
| (a) | The address of each Director is c/o BlackRock, Inc., 55 East 52nd Street, New York, NY 10055. |
| (b) | Independent Directors serve until their resignation, retirement, removal or death, or until December 31 of the year in which they turn 75. The Board has determined to extend the terms of Independent Directors on a case-by-case basis, as appropriate. |
| (c) | Following the combination of Merrill Lynch Investment Managers, L.P. (“MLIM”) and BlackRock, Inc. (“BlackRock”) in September 2006, the various legacy MLIM and legacy BlackRock fund boards were realigned and consolidated into three new fund boards in 2007. As a result, although the chart shows certain Independent Directors as joining the Board in 2007, those Independent Directors first became members of the boards of other legacy MLIM or legacy BlackRock funds as follows: Rodney D. Johnson, 1995; Cynthia A. Montgomery, 1994; Joseph P. Platt, 1999; Robert C. Robb, Jr., 1999; Kenneth L. Urish, 1999; and Frederick W. Winter, 1999. |
| (d) | Ms. Novick and Mr. Perlowski are both “interested persons,” as defined in the 1940 Act, of the Corporation based on their positions with BlackRock and its affiliates. Ms. Novick and Mr. Perlowski are also board members of certain complexes of BlackRock registered open-end and closed-end funds. Ms. Novick is a board member of the BlackRock Closed-End Complex and Mr. Perlowski is also a board member of the BlackRock Equity-Bond Complex and the BlackRock Closed-End Complex. |
| 30 | DIRECTORAND OFFICER INORMATION |
Director and Officer Information (continued)
| Officers Who Are Not Directors (a) | ||||
Name Year of Birth(b) | Position(s) Held (Length of Service) | Principal Occupation(s) During Past Five Years | ||
Jennifer McGovern 1977 | Vice President (Since 2014) | Managing Director of BlackRock, Inc. since 2016; Director of BlackRock, Inc. from 2011 to 2015; Head of Product Structure and Oversight for BlackRock’s U.S. Wealth Advisory Group since 2013; Vice President of BlackRock, Inc. from 2008 to 2010. | ||
Neal J. Andrews 1966 | Chief Financial Officer (Since 2007) | Managing Director of BlackRock, Inc. since 2006; Senior Vice President and Line of Business Head of Fund Accounting and Administration at PNC Global Investment Servicing (U.S.) Inc. from 1992 to 2006. | ||
Jay M. Fife 1970 | Treasurer (Since 2007) | Managing Director of BlackRock, Inc. since 2007; Director of BlackRock, Inc. in 2006; Assistant Treasurer of the MLIM and Fund Asset Management, L.P. advised funds from 2005 to 2006; Director of MLIM Fund Services Group from 2001 to 2006. | ||
Charles Park 1967 | Chief Compliance Officer (Since 2014) | Anti-Money Laundering Compliance Officer for the BlackRock-advised Funds in the Equity-Bond Complex, the Equity-Liquidity Complex and the Closed-End Complex from 2014 to 2015; Chief Compliance Officer of BlackRock Advisors, LLC and the BlackRock-advised Funds in the Equity-Bond Complex, the Equity-Liquidity Complex and the Closed-End Complex since 2014; Principal of and Chief Compliance Officer for iShares® Delaware Trust Sponsor LLC since 2012 and BlackRock Fund Advisors (“BFA”) since 2006; Chief Compliance Officer for the BFA-advised iShares® exchange traded funds since 2006; Chief Compliance Officer for BlackRock Asset Management International Inc. since 2012. | ||
Fernanda Piedra 1969 | Anti-Money Laundering Compliance Officer (Since 2015) | Director of BlackRock, Inc. since 2014; Anti-Money Laundering Compliance Officer and Regional Head of Financial Crime for the Americas at BlackRock, Inc. since 2014; Head of Regulatory Changes and Remediation for the Asset Wealth Management Division of Deutsche Bank from 2010 to 2014; Vice President of Goldman Sachs (Anti-Money Laundering/Suspicious Activities Group) from 2004 to 2010. | ||
Benjamin Archibald 1975 | Secretary (Since 2012) | Managing Director of BlackRock, Inc. since 2014; Director of BlackRock, Inc. from 2010 to 2013; Secretary of the iShares® exchange traded funds since 2015; Secretary of the BlackRock-advised mutual funds since 2012. | ||
| (b) | Officers of the Corporation serve at the pleasure of the Board. |
| (a) | The address of each Officer is c/o BlackRock, Inc., 55 East 52nd Street, New York, NY 10055. |
Further information about the Corporation’s Directors and Officers is available in the Fund’s Statement of Additional Information, which can be obtained without charge by calling (800) 441-7762.
| Investment Adviser and | Sub-Adviser | |
| Administrator | BlackRock International Limited | |
| BlackRock Advisors, LLC | Edinburgh, EH3 8BL | |
| Wilmington, DE 19809 | United Kingdom | |
| Accounting Agent and Transfer Agent | Custodian | |
| BNY Mellon Investment | Brown Brothers | |
| Servicing (US) Inc. | Harriman & Co. | |
| Wilmington, DE 19809 | Boston, MA 02109 | |
| Independent Registered Public Accounting Firm | Distributor | |
| Pricewaterhouse Coopers LLP | BlackRock Investments, LLC | |
| Philadelphia, PA 19103 | New York, NY 10022 | |
| Address of the Corporation | Legal Counsel | |
| 100 Bellevue Parkway | Sidley Austin LLP | |
| Wilmington, DE 19809 | New York, NY 10019 |
| 2017 BLACKROCK ANNUAL REPORTTO SHAREHOLDERS | 31 |
General Information
Householding
The Fund will mail only one copy of shareholder documents, including prospectuses, annual and semi-annual reports and proxy statements, to shareholders with multiple accounts at the same address. This practice is commonly called “householding” and is intended to reduce expenses and eliminate duplicate mailings of shareholder documents. Mailings of your shareholder documents may be householded indefinitely unless you instruct us otherwise. If you do not want the mailing of these documents to be combined with those for other members of your household, please call the Fund at (800) 441-7762.
Availability of Quarterly Schedule of Investments
The Fund files its complete schedule of portfolio holdings with the SEC for the first and third quarters of each fiscal year on Form N-Q. The Fund’s Forms N-Q are available on the SEC’s website at http://www.sec.gov and may also be reviewed and copied at the SEC’s Public Reference Room in Washington, D.C. Information on the operation of the Public Reference Room or how to access documents on the SEC’s website without charge may be obtained by calling (800) SEC-0330. The Fund’s Forms N-Q may also be obtained upon request and without charge by calling (800) 441-7762.
Availability of Proxy Voting Policies and Procedures
A description of the policies and procedures that the Fund use to determine how to vote proxies relating to portfolio securities is available upon request and without charge (1) by calling (800) 441-7762; (2) at http://www.blackrock.com; and (3) on the SEC’s website at http://www.sec.gov.
Availability of Proxy Voting Record
Information about how the Fund voted proxies relating to securities held in the Fund’s portfolios during the most recent 12-month period ended June 30 is available, upon request and without charge (1) at http://www.blackrock.com or by calling (800) 441-7762 and (2) on the SEC’s website at http://www.sec.gov.
BlackRock’s Mutual Fund Family
BlackRock offers a diverse lineup of open-end mutual funds crossing all investment styles and managed by experts in equity, fixed income and tax-exempt investing. Visit http:// www.blackrock.com for more information.
| 32 | ADDITIONAL INFORMATION |
Additional Information (continued)
Shareholder Privileges
Account Information
Call us at (800) 441-7762 from 8:00 AM to 6:00 PM ET on any business day to get information about your account balances, recent transactions and share prices. You can also reach us on the Web at http://www.blackrock.com.
Automatic Investment Plans
Investor Class shareholders who want to invest regularly can arrange to have $50 or more automatically deducted from their checking or savings account and invested in any of the BlackRock funds.
Systematic Withdrawal Plans
Investor Class shareholders can establish a systematic withdrawal plan and receive periodic payments of $50 or more from their BlackRock funds, as long as their account balance is at least $10,000.
Retirement Plans
Shareholders may make investments in conjunction with Traditional, Rollover, Roth, Coverdell, Simple IRAs, SEP IRAs and 403(b) Plans.
BlackRock Privacy Principles
BlackRock is committed to maintaining the privacy of its current and former fund investors and individual clients (collectively, “Clients”) and to safeguarding their non-public personal information. The following information is provided to help you understand what personal information BlackRock collects, how we protect that information and why in certain cases we share such information with select parties.
If you are located in a jurisdiction where specific laws, rules or regulations require BlackRock to provide you with additional or different privacy-related rights beyond what is set forth below, then BlackRock will comply with those specific laws, rules or regulations.
BlackRock obtains or verifies personal non-public information from and about you from different sources, including the following: (i) information we receive from you or, if applicable, your financial intermediary, on applications, forms or other documents; (ii) information about your transactions with us, our affiliates, or others; (iii) information we receive from a consumer reporting agency; and (iv) from visits to our websites.
BlackRock does not sell or disclose to non-affiliated third parties any non-public personal information about its Clients, except as permitted by law or as is necessary to respond to regulatory requests or to service Client accounts. These non-affiliated third parties are required to protect the confidentiality and security of this information and to use it only for its intended purpose.
We may share information with our affiliates to service your account or to provide you with information about other BlackRock products or services that may be of interest to you. In addition, BlackRock restricts access to non-public personal information about its Clients to those BlackRock employees with a legitimate business need for the information. BlackRock maintains physical, electronic and procedural safeguards that are designed to protect the non-public personal information of its Clients, including procedures relating to the proper storage and disposal of such information.
| 2017 BLACKROCK ANNUAL REPORTTO SHAREHOLDERS | 33 |
This report is intended for current holders. It is not authorized for use as an offer of sale or a solicitation of an offer to buy shares of the Fund unless preceded or accompanied by the Fund’s current prospectus. Past performance results shown in this report should not be considered a representation of future performance. Investment returns and principal value of shares will fluctuate so that shares, when redeemed, may be worth more or less than their original cost. Statements and other information herein are as dated and are subject to change.

| IF-10/17-AR |  |
| Item 2 – | Code of Ethics – The registrant (or the “Fund”) has adopted a code of ethics, as of the end of the period covered by this report, applicable to the registrant’s principal executive officer, principal financial officer, principal accounting officer or controller, or persons performing similar functions. During the period covered by this report, the code of ethics was amended to clarify an inconsistency as to whom persons covered by the code should report suspected violations of the code. The amendment clarifies that such reporting should be made to BlackRock Advisors, LLC’s (“Investment Adviser” or “BlackRock”) General Counsel, and retains the alternative option of anonymous reporting following “whistleblower” policies. Other non-material changes were also made in connection with this amendment. During the period covered by this report, there have been no waivers granted under the code of ethics. The registrant undertake to provide a copy of the code of ethics to any person upon request, without charge, who calls 1-800-441-7762. | |
| Item 3 – | Audit Committee Financial Expert – The registrant’s board of directors (the “board of directors”), has determined that (i) the registrant has the following audit committee financial expert serving on its audit committee and (ii) each audit committee financial expert is independent: | |
| Kenneth L. Urish | ||
| Under applicable securities laws, a person determined to be an audit committee financial expert will not be deemed an “expert” for any purpose, including without limitation for the purposes of Section 11 of the Securities Act of 1933, as a result of being designated or identified as an audit committee financial expert. The designation or identification of a person as an audit committee financial expert does not impose on such person any duties, obligations, or liabilities greater than the duties, obligations, and liabilities imposed on such person as a member of the audit committee and board of directors in the absence of such designation or identification. | ||
| Item 4 – | Principal Accountant Fees and Services | |
| The following table presents fees billed by Pricewaterhouse Coopers (“PwC”) in each of the last two fiscal years for the services rendered to the Fund: | ||
| (a) Audit Fees | (b) Audit-Related Fees1 | (c) Tax Fees2 | (d) All Other Fees | |||||||||||||
Entity Name | Current Fiscal Year End | Previous Fiscal Year End | Current Fiscal Year End | Previous Fiscal Year End | Current Fiscal Year End | Previous Fiscal Year End | Current Fiscal Year End | Previous Fiscal Year End | ||||||||
| BlackRock International Fund of BlackRock Series, Inc. | $29,000 | $7,510 | $0 | $0 | $0 | $0 | $0 | $0 | ||||||||
| The following table presents fees billed by PwC that were required to be approved by the registrant’s audit committee (the “Committee”) for services that relate directly to the operations or financial reporting of the Fund and that are rendered on behalf of BlackRock and entities controlling, controlled by, or under common control with BlackRock (not including any sub-adviser whose role is primarily portfolio management and is subcontracted with or overseen by another investment adviser) that provide ongoing services to the Fund (“Affiliated Service Providers”): |
| Current Fiscal Year End | Previous Fiscal Year End | |||
(b) Audit-Related Fees1 | $0 | $0 | ||
(c) Tax Fees2 | $0 | $0 | ||
(d) All Other Fees3 | $0 | $0 |
| 1 The nature of the services includes assurance and related services reasonably related to the performance of the audit or review of financial statements not included in Audit Fees, including accounting consultations, agreed-upon procedure reports, attestation reports, comfort letters, out-of-pocket expenses and internal control reviews not required by regulators. |
2
2 The nature of the services includes tax compliance and/or tax preparation, including services relating to the filing or amendment of federal, state or local income tax returns, regulated investment company qualification reviews, taxable income and tax distribution calculations.
3 Aggregate fees borne by BlackRock in connection with the review of compliance procedures and attestation thereto performed by PwC with respect to all of the registered closed-end funds and some of the registered open-end funds advised by BlackRock.
(e)(1) Audit Committee Pre-Approval Policies and Procedures:
The Committee has adopted policies and procedures with regard to the pre-approval of services. Audit, audit-related and tax compliance services provided to the registrant on an annual basis require specific pre-approval by the registrant’s Committee. The Committee also must approve other non-audit services provided to the registrant and those non-audit services provided to the Investment Adviser and Affiliated Service Providers that relate directly to the operations and the financial reporting of the registrant. Certain of these non-audit services that the Committee believes are (a) consistent with the SEC’s auditor independence rules and (b) routine and recurring services that will not impair the independence of the independent accountants may be approved by the Committee without consideration on a specific case-by-case basis (“general pre-approval”). The term of any general pre-approval is 12 months from the date of the pre-approval, unless the Committee provides for a different period. Tax or other non-audit services provided to the registrant which have a direct impact on the operations or financial reporting of the registrant will only be deemed pre-approved provided that any individual project does not exceed $10,000 attributable to the registrant or $50,000 per project. For this purpose, multiple projects will be aggregated to determine if they exceed the previously mentioned cost levels.
Any proposed services exceeding the pre-approved cost levels will require specific pre-approval by the registrant’s Committee, as will any other services not subject to general pre-approval (e.g., unanticipated but permissible services). The Committee is informed of each service approved subject to general pre-approval at the next regularly scheduled in-person board meeting. At this meeting, an analysis of such services is presented to the Committee for ratification. The Committee may delegate to the Committee Chairman the authority to approve the provision of and fees for any specific engagement of permitted non-audit services, including services exceeding pre-approved cost levels.
(e)(2) None of the services described in each of Items 4(b) through (d) were approved by either Committee pursuant to the de minimus exception in paragraph (c)(7)(i)(C) of Rule 2-01 of Regulation S-X.
(f) Not Applicable
(g) The aggregate non-audit fees, defined as the sum of the fees shown under “Audit-Related Fees,” “Tax Fees” and “All Other Fees,” paid to the accountant for services rendered by the accountant to the registrant, the Investment Adviser and the Affiliated Service Providers were:
| Entity Name | Current Fiscal Year End | Previous Fiscal Year End | ||||
| BlackRock International Fund of BlackRock Series, Inc. | $0 | $0 |
(h) The Committee has considered and determined that the provision of non-audit services that were rendered to the Investment Adviser and the Affiliated Service Providers that were not pre-approved pursuant to paragraph (c)(7)(ii) of Rule 2-01 of Regulation S-X is compatible with maintaining the principal accountant’s independence.
| Item 5 – | Audit Committee of Listed Registrant – Not Applicable |
| Item 6 – | Investments |
(a) The registrant’s Schedules of Investments are included as part of the Report to Stockholders filed under Item 1 of this Form.
3
(b) Not Applicable due to no such divestments during the semi-annual period covered since the previous Form N-CSR filing.
| Item 7 – | Disclosure of Proxy Voting Policies and Procedures for Closed-End Management Investment Companies – Not Applicable |
| Item 8 – | Portfolio Managers of Closed-End Management Investment Companies – Not Applicable |
| Item 9 – | Purchases of Equity Securities by Closed-End Management Investment Company and Affiliated Purchasers – Not Applicable |
| Item 10 – | Submission of Matters to a Vote of Security Holders – There have been no material changes to these procedures. |
| Item 11 – | Controls and Procedures |
(a) – The registrant’s principal executive and principal financial officers, or persons performing similar functions, have concluded that the registrant’s disclosure controls and procedures (as defined in Rule 30a-3(c) under the Investment Company Act of 1940, as amended (the “1940 Act”)) are effective as of a date within 90 days of the filing of this report based on the evaluation of these controls and procedures required by Rule 30a-3(b) under the 1940 Act and Rule 15(d)-15(b) under the Securities Exchange Act of 1934, as amended.
(b) – There were no changes in the registrant’s internal control over financial reporting (as defined in Rule 30a-3(d) under the 1940 Act) that occurred during the second fiscal quarter of the period covered by this report that have materially affected, or are reasonably likely to materially affect, the registrant’s internal control over financial reporting.
| Item 12 – | Disclosure of Securities Lending Activities for Closed-End Management Investment Companies – Not Applicable to the registrant. |
| Item 13 – | Exhibits attached hereto |
(a)(1) – Code of Ethics – See Item 2
(a)(2) – Certifications – Attached hereto
(a)(3) – Not Applicable
(a)(4) – Not Applicable
(b) – Certifications – Attached hereto
4
Pursuant to the requirements of the Securities Exchange Act of 1934 and the Investment Company Act of 1940, the registrant has duly caused this report to be signed on its behalf by the undersigned, thereunto duly authorized.
BlackRock International Fund of BlackRock Series, Inc.
| By: | /s/ John M. Perlowski | |
| John M. Perlowski | ||
Chief Executive Officer (principal executive officer) of BlackRock International Fund of BlackRock Series, Inc. |
Date: January 5, 2018
Pursuant to the requirements of the Securities Exchange Act of 1934 and the Investment Company Act of 1940, this report has been signed below by the following persons on behalf of the registrant and in the capacities and on the dates indicated.
| By: | /s/ John M. Perlowski | |
| John M. Perlowski | ||
Chief Executive Officer (principal executive officer) of BlackRock International Fund of BlackRock Series, Inc. |
Date: January 5, 2018
| By: | /s/ Neal J. Andrews | |
| Neal J. Andrews | ||
Chief Financial Officer (principal financial officer) of BlackRock International Fund of BlackRock Series, Inc. |
Date: January 5, 2018
5