UNITED STATES
SECURITIES AND EXCHANGE COMMISSION
Washington, D.C. 20549
FORM N-CSR
CERTIFIED SHAREHOLDER REPORT OF REGISTERED MANAGEMENT INVESTMENT COMPANIES
Investment Company Act file number 811- 08821
Rydex Variable Trust
(Exact name of registrant as specified in charter)
805 King Farm Boulevard, Suite 600
Rockville, Maryland 20850
(Address of principal executive offices) (Zip code)
Donald C. Cacciapaglia
Rydex Variable Trust
805 King Farm Boulevard, Suite 600
Rockville, Maryland 20850
(Name and address of agent for service)
Registrant's telephone number, including area code: 1-301-296-5100
Date of fiscal year end: December 31
Date of reporting period: December 31, 2013
Form N-CSR is to be used by management investment companies to file reports with the Commission not later than 10 days after the transmission to stockholders of any report that is required to be transmitted to stockholders under Rule 30e-1 under the Investment Company Act of 1940 (17 CFR 270.30e-1). The Commission may use the information provided on Form N-CSR in its regulatory, disclosure review, inspection, and policymaking roles.
A registrant is required to disclose the information specified by Form N-CSR, and the Commission will make this information public. A registrant is not required to respond to the collection of information contained in Form N-CSR unless the Form displays a currently valid Office of Management and Budget ("OMB") control number. Please direct comments concerning the accuracy of the information collection burden estimate and any suggestions for reducing the burden to Secretary, Securities and Exchange Commission, 450 Fifth Street, NW, Washington, DC 20549-0609. The OMB has reviewed this collection of information under the clearance requirements of 44 U.S.C. § 3507.
Item 1. Reports to Stockholders.

DOMESTIC EQUITY FUNDS
NOVA FUND
INVERSE S&P 500® STRATEGY FUND
NASDAQ-100® FUND
INVERSE NASDAQ-100® STRATEGY FUND
S&P 500® 2x STRATEGY FUND
NASDAQ-100® 2x STRATEGY FUND
MID-CAP 1.5x STRATEGY FUND
INVERSE MID-CAP STRATEGY FUND
RUSSELL 2000® 2x STRATEGY FUND
RUSSELL 2000® 1.5x STRATEGY FUND
INVERSE RUSSELL 2000® STRATEGY FUND
DOW 2x STRATEGY FUND
INVERSE DOW 2x STRATEGY FUND | FIXED INCOME FUNDS
GOVERNMENT LONG BOND 1.2x STRATEGY FUND
INVERSE GOVERNMENT LONG BOND STRATEGY FUND
MONEY MARKET FUND
U.S. GOVERNMENT MONEY MARKET FUND |
RVATB1-ANN-2-1213x1214
This report and the financial statements contained herein are submitted for the general information of our shareholders. The report is not authorized for distribution to prospective investors unless preceded or accompanied by an effective prospectus.
Distributed by Guggenheim Distributors, LLC.
TABLE OF CONTENTS
| THE RYDEX FUNDS ANNUAL REPORT | 1 |
| December 31, 2013 |
Dear Shareholder:
Security Investors, LLC (the “Investment Adviser”) is pleased to present the annual shareholder report for 16 of our Funds that are part of the Rydex Variable Trust. This report covers performance of the Funds for the annual period ended December 31, 2013.
The Investment Adviser is a part of Guggenheim Investments, which represents the investment management businesses of Guggenheim Partners, LLC, a global, diversified financial services firm.
Guggenheim Distributors, LLC is the distributor of the Funds. Guggenheim Distributors, LLC is affiliated with Guggenheim Partners, LLC and Security Investors, LLC.
We encourage you to read the Economic and Market Overview section of the report, which follows this letter, and then the Performance Report and Fund Profile for each Fund.
We are committed to providing innovative investment solutions and appreciate the trust you place in us.
Sincerely,

Donald C. Cacciapaglia
President
January 31, 2014
| 2 | THE RYDEX FUNDS ANNUAL REPORT |
| December 31, 2013 |
Read a prospectus and summary prospectus (if available) carefully before investing. It contains the investment objectives, risks, charges, expenses and other information, which should be considered carefully before investing. Obtain a prospectus and summary prospectus (if available) at guggenheiminvestments.com or call 800.820.0888.
Inverse and leveraged Funds are not suitable for all investors. • These Funds should be utilized only by investors who (a) understand the risks associated with the use of leverage, (b) understand the consequences of seeking daily leveraged investment results, (c) understand the risk of shorting, and (d) intend to actively monitor and manage their investments. • The more a Fund invests in leveraged instruments, the more the leverage will magnify any gains or losses on those investments. • Inverse Funds involve certain risks, which include increased volatility due to the Funds’ possible use of short sales of securities and derivatives, such as options and futures. • The Funds’ use of derivatives, such as futures, options and swap agreements, may expose the Funds’ shareholders to additional risks that they would not be subject to if they invested directly in the securities underlying those derivatives. • Short-selling involves increased risks and costs. You risk paying more for a security than you received from its sale. • Leveraged and inverse Funds seek to provide investment results that match the performance of a specific benchmark, before fees and expenses, on a daily basis. Because the Funds seek to track the performance of their benchmark on a daily basis, mathematical compounding, especially with respect to those Funds that use leverage as part of their investment strategy, may prevent a fund from correlating with the monthly, quarterly, annual or other period performance of its benchmark. Due to the compounding of daily returns, leveraged and inverse Funds’ returns over periods other than one day will likely differ in amount and possibly direction from the benchmark return for the same period. For those Funds that consistently apply leverage, the value of the fund’s shares will tend to increase or decrease more than the value of any increase or decrease in its benchmark index. The Funds rebalance their portfolios on a daily basis, increasing exposure in response to that day’s gains or reducing exposure in response to that day’s losses. Daily rebalancing will impair a fund’s performance if the benchmark experiences volatility. Investors should monitor their leveraged and inverse Funds’ holdings consistent with their strategies, as frequently as daily. • For more on these and other risks, please read the prospectus.
The Nasdaq-100 Fund may not be suitable for all investors. • Investing in Rydex NASDAQ-100® Fund involves certain risks, which may include increased volatility due to the use of futures and the possibility that companies in which the Fund invests may not be commercially successful or may become obsolete more quickly. • There are no assurances that any Rydex Fund will achieve its objective and/or strategy. This Fund is subject to active trading and tracking error risks, which may increase volatility, impact the Fund’s ability to achieve its investment objective and may decrease the Fund’s performance. • This Fund is considered non-diversified and can invest a greater portion of its assets in securities of individual issuers than a diversified fund. As a result, changes in the market value of a single security could cause greater fluctuations in the value of Fund shares than would occur in a more diversified fund. • For more on these and other risks, please read the prospectus.
The Government Long Bond 1.2x Strategy and Inverse Government Long Bond Strategy funds are not suitable for all investors. • These Funds should be utilized only by investors who (a) understand the risks associated with the use of leverage, (b) understand the consequences of seeking daily leveraged investment results, (c) understand the risk of shorting, and (d) intend to actively monitor and manage their investments. • The more a Fund invests in leveraged instruments, the more the leverage will magnify any gains or losses on those investments. • The Funds’ use of derivatives, such as futures, may expose the Funds’ shareholders to additional risks that they would not be subject to if they invested directly in the securities underlying those derivatives. • Leveraged and inverse Funds seek to provide investment results that match the performance of a specific benchmark, before fees and expenses, on a daily basis. Because the Funds seek to track the performance of their benchmark on a daily basis, mathematical compounding, especially with respect to those Funds that use leverage as part of their investment strategy, may prevent a fund from correlating with the monthly, quarterly, annual or other period performance of its benchmark. Due to the compounding of daily returns, leveraged Funds’ returns over periods other than one day will likely differ in amount and possibly direction from the benchmark return for the same period. For those Funds that consistently apply leverage, the value of the fund’s shares will tend to increase or decrease more than the value of any increase or decrease in its benchmark index. The Funds rebalance their portfolios on a daily basis, increasing exposure in response to that day’s gains or reducing exposure in response to that day’s losses. Daily rebalancing will impair a fund’s performance if the benchmark experiences volatility. Investors should monitor their leveraged Funds’ holdings consistent with their strategies, as frequently as daily. • In general, bond prices rise when interest rates fall, and vice versa. Moreover, while securities with longer maturities tend to produce higher yields, the price of longer maturity securities is also subject to greater fluctuations as a result of changes in interest rates. • It is important to note that the funds are not guaranteed by the U.S. government. • There are no assurances that any Guggenheim fund will achieve its objective and/or strategy. These Funds are subject to active trading and tracking error risks, which may increase volatility, impact the fund’s ability to achieve its investment objective, and may decrease the Fund’s performance. • For more on these and other risks, please read the prospectus.
The U.S. Government Money Market Fund may not be suitable for all investors. An investment in the Rydex U.S. Government Money Market Fund is not insured or guaranteed by the Federal Deposit Insurance Corporation or any other government agency. Although the Fund seeks to preserve the value of your investment at $1.00 per share, it is possible to lose money by investing in the Fund.
| THE RYDEX FUNDS ANNUAL REPORT | 3 |
| ECONOMIC AND MARKET OVERVIEW (Unaudited) | December 31, 2013 |
The year ended December 31, 2013 wound down with a series of stronger-than-expected economic data releases. ISM manufacturing data (historically indicative of expansion or contraction) rose to its highest levels in over two years, consumer confidence rebounded following the government shutdown, housing starts surged, and the job market strengthened. Citing improved labor market conditions and a sustainable economic expansion, the U.S. Federal Reserve (the “Fed”) announced in December that it would reduce its monthly bond purchases by $10 billion, to $75 billion, starting in January 2014. Yet, at the same time, the Fed lengthened the time frame before which it will raise rates by promising to keep the Fed funds target rate at 0-0.25% at least as long as the unemployment rate remains above 6.5% and perhaps “well past” the time this target is reached. For the first time, the Fed also added a lower-bound target for inflation of 2%–lengthening the expected time frame before rates rise.
As the U.S. economy slowly strengthens, we may return to an environment where taking credit risk is not just a consequence of staying within duration targets or reaching for yield, but rather a proactive choice driven by a positive outlook on the economy. To sustain optimism, the Fed will need to monitor the unintended consequences of tapering and avoid negative economic repercussions, as happened in the summer of 2013 when a spike in 10-year Treasury yields dampened home sales. For markets, the Fed must convince investors that the economy is strong enough to withstand steady reductions of its asset purchases. These will likely be Janet Yellen’s top priorities as she takes over the helm of the Fed.
Last January, the global economy faced myriad headwinds, choppiness lay ahead, and we expected plenty of volatility in 2013. Nevertheless, we believed at that point that risk assets were the best choice for investors. Now, the headwinds of 2013 have largely dissipated, and the outlook appears benign for risk assets for the first three to six months of 2014, if not longer.
Many pundits may have underestimated the strength of the U.S. economy, with both third quarter and fourth quarter economic growth beating expectations. The final three months of 2013 were exceptionally good for U.S. equities, which produced a wealth effect that probably boosted holiday sales. All of this bodes well for the first quarter of 2014.
Market conditions could be even stronger in Europe. Economic data from the euro area’s periphery is improving faster than from the core, where inflation is also rising at a faster pace, giving the peripheral nations a competitive advantage. In Asia, markets have priced for a more negative scenario that now appears less likely. With the U.S. and Europe now out of recession, they are ready to underpin a recovery in export growth in the Asian region. As a synchronous global expansion gets under way, investors may become more comfortable with taking risk, and this should be reflected in asset prices in many regions around the globe.
For 2014, investors should bear in mind that the Fed will continue injecting liquidity into financial markets even as it tapers its asset purchases. Assuming that the Fed continues the same pace of reductions at each Federal Open Market Committee meeting, it would still purchase more than $500 billion of bonds in 2014–nearly the size of the Fed’s QE2 from November 2010 to June 2011. This should help support credit spreads. An accelerated pace of tapering from the Fed would signal faster-than-expected economic growth and spark higher demand for risk assets. On balance, we expect the impact of tapering to be neutral. Barring economic weakness, we expect relatively benign market conditions with no major spike in volatility.
For the year ended December 31, 2013, the Standard & Poor’s 500® (“S&P 500”) Index* returned 32.39%. Foreign markets were also strong: the Morgan Stanley Capital International (“MSCI”) Europe-Australasia-Far East (“EAFE”) Index* returned 22.78%. The return of the MSCI Emerging Markets Index* was -2.60%.
In the bond market, the Barclays U.S. Aggregate Bond Index* posted a -2.02% return for the period, while the Barclays U.S. Corporate High Yield Index* returned 7.44%. The return of the Bank of America Merrill Lynch 3-Month U.S. Treasury Bill Index* was 0.07% for the 12-month period.
The opinions and forecasts expressed may not actually come to pass. This information is subject to change at any time, based on market and other conditions, and should not be construed as a recommendation of any specific security or strategy.
| 4 | THE RYDEX FUNDS ANNUAL REPORT |
| ECONOMIC AND MARKET OVERVIEW (Unaudited) (concluded) | December 31, 2013 |
*Index Definitions:
The following indices are referenced throughout this report. Indices are unmanaged and not available for direct investment. Index performance does not reflect transaction costs, fees, or expenses.
Barclays U.S. Aggregate Bond Index is a broad-based benchmark that measures the investment grade, U.S. dollar denominated, fixed-rate taxable bond market, including U.S. Treasuries, government-related and corporate securities, MBS (agency fixed-rate and hybrid ARM pass-throughs), ABS, and CMBS.
Barclays U.S. Corporate High Yield Index measures the market of USD-denominated, non-investment grade, fixed-rate, taxable corporate bonds. Securities are classified as high yield if the middle rating of Moody’s, Fitch, and S&P is Ba1/BB+/BB+ or below.
Bank of America Merrill Lynch 3-Month U.S. Treasury Bill Index is an unmanaged market index of U.S. Treasury securities maturing in 90 days that assumes reinvestment of all income.
MSCI EAFE Index is a free float-adjusted market capitalization index that is designed to measure the equity market performance of developed markets, excluding the U.S. & Canada.
MSCI Emerging Markets Index is a free float-adjusted market capitalization weighted index that is designed to measure equity market performance in the global emerging markets.
S&P 500® Index is a capitalization-weighted index of 500 stocks designed to measure the performance of the broad economy, representing all major industries and is considered a representation of the U.S. stock market.
Barclays Long Treasury Bond Index includes all publicly issued, U.S. Treasury securities that have a remaining maturity of 10 or more years, are rated investment grade, and have $250 million or more of outstanding face value. In addition, the securities must be denominated in U.S. dollars and must be fixed rate and non convertible. The Long Treasury Index is market capitalization weighted and the securities in the index are updated on the last business day of each month.
NASDAQ-100® Index includes 100 of the largest domestic and international non-financial securities listed on The Nasdaq Stock Market based on market capitalization. The Index reflects companies across major industry groups including computer hardware and software, telecommunications, retail/wholesale trade and biotechnology. It does not contain securities of financial companies including investment companies.
S&P MidCap 400® Index provides investors with a benchmark for mid-sized companies. The index covers approximately 7% of the U.S. equity market, and seeks to remain an accurate measure of mid-sized companies, reflecting the risk and return characteristics of the broader mid-cap universe on an on-going basis.
Russell 2000® Index measures the performance of the small-cap value segment of the U.S. equity universe.
Dow Jones Industrial AverageSM (“DJIA”) Index is a price-weighted average of 30 significant stocks traded on the New York Stock Exchange and the Nasdaq. The DJIA was invented by Charles Dow back in 1896.
| THE RYDEX FUNDS ANNUAL REPORT | 5 |
| A BRIEF NOTE ON THE COMPOUNDING OF RETURNS (Unaudited) |
Many of the Funds described in this report are benchmarked daily to leveraged and/or inverse leveraged versions of published indices. To properly evaluate the performance of these funds, it is essential to understand the effect of mathematical compounding on their respective returns.
Because of the nonlinear effects of leverage applied over time, it is possible for a fund to perform in line with its benchmark for several individual periods in a row, yet seem to trail the benchmark over the entire period. It is also possible that a fund that performs in-line with its benchmark on a daily basis may seem to outperform its benchmark over longer periods.
An Example of Compounding
For example, consider a hypothetical fund that is designed to produce returns that correspond to 150% of an index. On the first day of a period, the index rises from a level of 100 to a level of 106, producing a 6.0% gain and an expectation that the fund will rise by 9.0%. On the same day, the fund’s net asset value per share (“NAV”) increases from $10.00 to $10.90 for a gain of 9.0%– in line with its benchmark.
On day two, assume the index falls from 106 to 99 for a loss of about 6.6%. The fund, as expected, falls 9.9% to a price of $9.82. On each day, the fund performed exactly in line with its benchmark, but for the two-day period, the fund was down 1.8%, while the index was down only 1.0%. Without taking into account the daily compounding of returns, one would expect the fund to lose 1.5% and would see the fund as trailing by 0.3% when in fact it had performed perfectly. This example is summarized in the table below.
| Index Level | Index Performance | Fund Expectation | Fund NAV | Fund Performance | Assessment | ||||||||||||||||||
| Start | 100 | $10.00 | |||||||||||||||||||||
| Day 1 | 106 | 6.0 | % | 9.0 | % | $10.90 | 9.0 | % | In line | ||||||||||||||
| Day 2 | 99 | -6.6 | % | -9.9 | % | $ 9.82 | -9.9 | % | In line | ||||||||||||||
| Cumulative | -1.0 | % | -1.5 | % | -1.8 | % | -0.3 | % | |||||||||||||||
As illustrated by this simple example, the effect of leverage can make it difficult to form expectations or judgments about fund performance given only the returns of the unleveraged index.
Because certain funds seek to track the performance of their benchmark on a daily basis, mathematical compounding, especially with respect to those funds that use leverage as part of their investment strategy, may prevent a fund from correlating with the monthly, quarterly, annual or other period performance of its benchmark. Due to the compounding of daily returns, leveraged and inverse funds’ returns over periods other than one day will likely differ in amount and possibly direction from the benchmark return for the same period. Investors should monitor their leveraged and inverse funds’ holdings consistent with their strategies, as frequently as daily. For those funds that consistently apply leverage, the value of the fund’s shares will tend to increase or decrease more than the value of any increase or decrease in its benchmark index. For more on correlation, leverage and other risks, please read the prospectus.
In general, any change in direction in an index will produce compounding that seems to work against an investor. Were the index to move in the same direction (either up or down) for two or more periods in a row, the compounding of those returns would work in an investor’s favor, causing the fund to seemingly beat its benchmark.
As a general rule of thumb, more leverage in a fund will magnify the compounding effect, while less leverage will generally produce results that are more in line with expectations. In addition, periods of high volatility in an underlying index will also cause the effects of compounding to be more pronounced, while lower volatility will produce a more muted effect.
| 6 | THE RYDEX FUNDS ANNUAL REPORT |
| ABOUT SHAREHOLDERS’ FUND EXPENSES (Unaudited) |
All mutual funds have operating expenses and it is important for our shareholders to understand the impact of costs on their investments. Shareholders of a Fund incur two types of costs: (i) transaction costs, including sales charges (loads) on purchase payments, reinvested dividends, or other distributions; and exchange fees; and (ii) ongoing costs, including management fees, administrative services, and shareholder reports, among others. These ongoing costs, or operating expenses, are deducted from a fund’s gross income and reduce the investment return of the fund.
A fund’s expenses are expressed as a percentage of its average net assets, which is known as the expense ratio. The following examples are intended to help investors understand the ongoing costs (in dollars) of investing in a Fund and to compare these costs with the ongoing costs of investing in other mutual funds.
The examples are based on an investment of $1,000 made at the beginning of the period and held for the entire six-month period beginning June 30, 2013 and ending December 31, 2013.
The following tables illustrate a Fund’s costs in two ways:
Table 1. Based on actual Fund return. This section helps investors estimate the actual expenses paid over the period. The “Ending Account Value” shown is derived from the Fund’s actual return, and the fourth column shows the dollar amount that would have been paid by an investor who started with $1,000 in the Fund. Investors may use the information here, together with the amount invested, to estimate the expenses paid over the period. Simply divide the Fund’s account value by $1,000 (for example, an $8,600 account value divided by $1,000 = 8.6), then multiply the result by the number provided under the heading “Expenses Paid During Period.”
Table 2. Based on hypothetical 5% return. This section is intended to help investors compare a Fund’s cost with those of other mutual funds. The table provides information about hypothetical account values and hypothetical expenses based on the Fund’s actual expense ratio and an assumed rate of return of 5% per year before expenses, which is not the Fund’s actual return. The hypothetical account values and expenses may not be used to estimate the actual ending account balance or expenses paid during the period. The example is useful in making comparisons because the U.S. Securities and Exchange Commission (the “SEC”) requires all mutual funds to calculate expenses based on the 5% return. Investors can assess a Fund’s costs by comparing this hypothetical example with the hypothetical examples that appear in shareholder reports of other funds.
The calculations illustrated above assume no shares were bought or sold during the period. Actual costs may have been higher or lower, depending on the amount of investment and the timing of any purchases or redemptions.
Please note that the expenses shown in the table are meant to highlight your ongoing costs only and do not reflect any transactional costs, such as sales charges (loads) on purchase payments, and contingent deferred sales charges (“CDSC”) on redemptions, if any. Therefore, the second table is useful in comparing ongoing costs only, and will not help you determine the relative total costs of owning different funds. In addition, if these transactional costs were included, your costs would have been higher.
More information about a Fund’s expenses, including annual expense ratios for the past five years, can be found in the Financial Highlights section of this report. For additional information on operating expenses and other shareholder costs, please refer to the appropriate Fund prospectus.
| THE RYDEX FUNDS ANNUAL REPORT | 7 |
| ABOUT SHAREHOLDERS’ FUND EXPENSES (Unaudited) (concluded) |
| Beginning | Ending | Expenses | ||||||||||||||||||
| Expense | Fund | Account Value | Account Value | Paid During | ||||||||||||||||
| Ratio | 1 | Return | June 30, 2013 | December 31, 2013 | Period | 2 | ||||||||||||||
| Table 1. Based on actual Fund return3 | ||||||||||||||||||||
| Nova Fund | 1.52 | % | 24.22 | % | $1,000.00 | $1,242.20 | $8.59 | |||||||||||||
| Inverse S&P 500® Strategy Fund | 1.67 | % | (15.17 | %) | 1,000.00 | 848.30 | 7.78 | |||||||||||||
| NASDAQ-100® Fund | 1.56 | % | 23.30 | % | 1,000.00 | 1,233.00 | 8.78 | |||||||||||||
| Inverse NASDAQ-100® Strategy Fund | 1.71 | % | (20.80 | %) | 1,000.00 | 792.00 | 7.72 | |||||||||||||
| S&P 500® 2x Strategy Fund | 1.67 | % | 33.09 | % | 1,000.00 | 1,330.90 | 9.81 | |||||||||||||
| NASDAQ-100® 2x Strategy Fund | 1.71 | % | 51.68 | % | 1,000.00 | 1,516.80 | 10.85 | |||||||||||||
| Mid-Cap 1.5x Strategy Fund | 1.67 | % | 24.11 | % | 1,000.00 | 1,241.10 | 9.43 | |||||||||||||
| Inverse Mid-Cap Strategy Fund | 1.67 | % | (15.42 | %) | 1,000.00 | 845.80 | 7.77 | |||||||||||||
| Russell 2000® 2x Strategy Fund | 1.73 | % | 41.37 | % | 1,000.00 | 1,413.70 | 10.53 | |||||||||||||
| Russell 2000® 1.5x Strategy Fund | 1.72 | % | 29.13 | % | 1,000.00 | 1,291.30 | 9.93 | |||||||||||||
| Inverse Russell 2000® Strategy Fund | 1.72 | % | (18.17 | %) | 1,000.00 | 818.30 | 7.88 | |||||||||||||
| Dow 2x Strategy Fund | 1.70 | % | 24.81 | % | 1,000.00 | 1,248.10 | 9.63 | |||||||||||||
| Inverse Dow 2x Strategy Fund | 1.70 | % | (23.10 | %) | 1,000.00 | 769.00 | 7.58 | |||||||||||||
| Government Long Bond | ||||||||||||||||||||
| 1.2x Strategy Fund | 1.23 | % | (8.03 | %) | 1,000.00 | 919.70 | 5.95 | |||||||||||||
| Inverse Government | ||||||||||||||||||||
| Long Bond Strategy Fund | 3.86 | % | 6.08 | % | 1,000.00 | 1,060.80 | 20.05 | |||||||||||||
| U.S. Government Money Market Fund | 0.06 | % | 0.00 | % | 1,000.00 | 1,000.00 | 0.30 | |||||||||||||
| Table 2. Based on hypothetical 5% return (before expenses) | ||||||||||||||||||||
| Nova Fund | 1.52 | % | 5.00 | % | $1,000.00 | $1,017.54 | $7.73 | |||||||||||||
| Inverse S&P 500® Strategy Fund | 1.67 | % | 5.00 | % | 1,000.00 | 1,016.79 | 8.49 | |||||||||||||
| NASDAQ-100® Fund | 1.56 | % | 5.00 | % | 1,000.00 | 1,017.34 | 7.93 | |||||||||||||
| Inverse NASDAQ-100® Strategy Fund | 1.71 | % | 5.00 | % | 1,000.00 | 1,016.59 | 8.69 | |||||||||||||
| S&P 500® 2x Strategy Fund | 1.67 | % | 5.00 | % | 1,000.00 | 1,016.79 | 8.49 | |||||||||||||
| NASDAQ-100® 2x Strategy Fund | 1.71 | % | 5.00 | % | 1,000.00 | 1,016.59 | 8.69 | |||||||||||||
| Mid-Cap 1.5x Strategy Fund | 1.67 | % | 5.00 | % | 1,000.00 | 1,016.79 | 8.49 | |||||||||||||
| Inverse Mid-Cap Strategy Fund | 1.67 | % | 5.00 | % | 1,000.00 | 1,016.79 | 8.49 | |||||||||||||
| Russell 2000® 2x Strategy Fund | 1.73 | % | 5.00 | % | 1,000.00 | 1,016.48 | 8.79 | |||||||||||||
| Russell 2000® 1.5x Strategy Fund | 1.72 | % | 5.00 | % | 1,000.00 | 1,016.53 | 8.74 | |||||||||||||
| Inverse Russell 2000® Strategy Fund | 1.72 | % | 5.00 | % | 1,000.00 | 1,016.53 | 8.74 | |||||||||||||
| Dow 2x Strategy Fund | 1.70 | % | 5.00 | % | 1,000.00 | 1,016.64 | 8.64 | |||||||||||||
| Inverse Dow 2x Strategy Fund | 1.70 | % | 5.00 | % | 1,000.00 | 1,016.64 | 8.64 | |||||||||||||
| Government Long Bond | ||||||||||||||||||||
| 1.2x Strategy Fund | 1.23 | % | 5.00 | % | 1,000.00 | 1,019.00 | 6.26 | |||||||||||||
| Inverse Government Long Bond | ||||||||||||||||||||
| Strategy Fund | 3.86 | % | 5.00 | % | 1,000.00 | 1,005.75 | 19.51 | |||||||||||||
| U.S. Government Money Market Fund | 0.06 | % | 5.00 | % | 1,000.00 | 1,024.90 | 0.31 | |||||||||||||
| 1 | This ratio represents annualized Net Expenses, which include interest expense related to securities sold short. Excluding short interest expense, the operating expense ratio of the Inverse Government Long Bond Strategy Fund would be 1.67%. |
| 2 | Expenses are equal to the Fund’s annualized expense ratio, net of any applicable fee waivers, multiplied by the average account value over the period, multiplied by 184/365 (to reflect the one-half year period). Expenses shown do not include fees charged by insurance companies. |
| 3 | Actual cumulative return at net asset value for the period June 30, 2013 to December 31, 2013. |
| 8 | THE RYDEX FUNDS ANNUAL REPORT |
This page intentionally left blank.
| THE RYDEX FUNDS ANNUAL REPORT | 9 |
| PERFORMANCE REPORT AND FUND PROFILE (Unaudited) | December 31, 2013 |
NOVA FUND
OBJECTIVE: Seeks to provide investment results that match, before fees and expenses, the performance of a specific benchmark on a daily basis. The Fund’s current benchmark is 150% of the performance of the S&P 500® Index (the “underlying index”). The Fund does not seek to achieve its investment objective over a period of time greater than one day.
For the year ended December 31, 2013, Nova Fund maintained a daily correlation of over 99% to its benchmark of 150% of the daily price movement of the S&P 500 Index. Nova Fund returned 48.99%, while the S&P 500 Index gained 32.39% over the same time period.
Sectors contributing most to performance of the underlying index were Financials and Health Care. No sectors detracted from performance, but the sectors contributing least were Telecommunications Services and Utilities.
Google, Inc. — Class A, Microsoft Corp. and General Electric Co. contributed most to performance of the underlying index for 2013. Newmont Mining Corp., Intuitive Surgical, Inc. and CenturyLink, Inc. detracted most from performance of the underlying index for the year.
Derivatives in the Fund were used to help provide exposure to the composition of the benchmark in the highest efficient manner and to provide leverage, not for hedging purposes.
Due to the compounding of daily returns, leveraged and inverse funds’ returns over periods other than one day will likely differ in amount and possibly direction from the benchmark return for the same period. Investors should monitor their leveraged and inverse funds’ holdings to ensure that they are consistent with their strategies, as frequently as daily.
The effects of compounding may cause the longer-term correlation of the fund to its benchmark to diminish. The apparent discrepancy between the leveraged and unleveraged indices is the result of compounding, which is described briefly on page 6 of this report.
Performance displayed represents past performance, which is no guarantee of future results.
Holdings Diversification (Market Exposure as % of Net Assets)
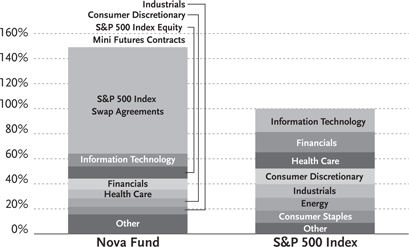
“Holdings Diversification (Market Exposure as % of Net Assets)” excludes any temporary cash investments.
Inception Date: May 7, 1997
| Ten Largest Holdings (% of Total Net Assets) | ||||
| Apple, Inc. | 1.7 | % | ||
| Exxon Mobil Corp. | 1.5 | % | ||
| Google, Inc. — Class A | 1.0 | % | ||
| Microsoft Corp. | 0.9 | % | ||
| General Electric Co. | 0.9 | % | ||
| Johnson & Johnson | 0.9 | % | ||
| Chevron Corp. | 0.8 | % | ||
| Procter & Gamble Co. | 0.7 | % | ||
| JPMorgan Chase & Co. | 0.7 | % | ||
| Wells Fargo & Co. | 0.7 | % | ||
| Top Ten Total | 9.8 | % | ||
“Ten Largest Holdings” exclude any temporary cash or derivative investments.
| 10 | THE RYDEX FUNDS ANNUAL REPORT |
PERFORMANCE REPORT AND FUND PROFILE (Unaudited) (concluded)
Cumulative Fund Performance*,†

Average Annual Returns
| Periods Ended December 31, 2013*,† | ||||||||||||
| 1 Year | 5 Year | 10 Year | ||||||||||
| Nova Fund | 48.99 | % | 23.95 | % | 6.71 | % | ||||||
| S&P 500 Index | 32.39 | % | 17.94 | % | 7.41 | % | ||||||
| * | The performance data above represents past performance that is not predictive of future results. The investment return and principal value of an investment in the Fund will fluctuate so that an investor’s shares, when redeemed, may be worth more or less than their original cost. Returns are historical and include changes in principal and reinvested dividends and capital gains and do not reflect the effect of taxes. The S&P 500 Index is an unmanaged index and, unlike the Fund, has no management fees or operating expenses to reduce its reported return. |
| † | Returns do not reflect the impact of any additional fees charged by insurance companies. |
| THE RYDEX FUNDS ANNUAL REPORT | 11 |
| SCHEDULE OF INVESTMENTS | December 31, 2013 |
NOVA FUND
| Shares | Value | |||||||
| COMMON STOCKS† - 54.4% | ||||||||
| Information Technology - 10.2% | ||||||||
| Apple, Inc. | 1,592 | $ | 893,286 | |||||
| Google, Inc. — Class A* | 497 | 556,992 | ||||||
| Microsoft Corp. | 13,437 | 502,947 | ||||||
| International Business Machines Corp. | 1,806 | 338,751 | ||||||
| Oracle Corp. | 6,209 | 237,556 | ||||||
| Intel Corp. | 8,796 | 228,344 | ||||||
| QUALCOMM, Inc. | 2,989 | 221,933 | ||||||
| Cisco Systems, Inc. | 9,460 | 212,377 | ||||||
| Visa, Inc. — Class A | 901 | 200,634 | ||||||
| Facebook, Inc. — Class A* | 2,910 | 159,061 | ||||||
| MasterCard, Inc. — Class A | 183 | 152,889 | ||||||
| eBay, Inc.* | 2,062 | 113,183 | ||||||
| Hewlett-Packard Co. | 3,400 | 95,132 | ||||||
| Accenture plc — Class A | 1,125 | 92,498 | ||||||
| EMC Corp. | 3,641 | 91,571 | ||||||
| Texas Instruments, Inc. | 1,937 | 85,054 | ||||||
| Automatic Data Processing, Inc. | 852 | 68,850 | ||||||
| Yahoo!, Inc.* | 1,669 | 67,494 | ||||||
| Salesforce.com, Inc.* | 986 | 54,417 | ||||||
| Cognizant Technology Solutions Corp. — | ||||||||
| Class A* | 535 | 54,024 | ||||||
| Adobe Systems, Inc.* | 823 | 49,281 | ||||||
| Corning, Inc. | 2,561 | 45,637 | ||||||
| Micron Technology, Inc.* | 1,860 | 40,474 | ||||||
| TE Connectivity Ltd. | 726 | 40,010 | ||||||
| Intuit, Inc. | 504 | 38,465 | ||||||
| Applied Materials, Inc. | 2,129 | 37,662 | ||||||
| Seagate Technology plc | 581 | 32,629 | ||||||
| Western Digital Corp. | 372 | 31,211 | ||||||
| Symantec Corp. | 1,232 | 29,051 | ||||||
| Broadcom Corp. — Class A | 955 | 28,316 | ||||||
| Analog Devices, Inc. | 550 | 28,012 | ||||||
| SanDisk Corp. | 396 | 27,934 | ||||||
| Fidelity National Information | ||||||||
| Services, Inc. | 515 | 27,645 | ||||||
| Motorola Solutions, Inc. | 407 | 27,473 | ||||||
| Fiserv, Inc.* | 456 | 26,927 | ||||||
| Paychex, Inc. | 575 | 26,180 | ||||||
| Amphenol Corp. — Class A | 280 | 24,970 | ||||||
| Xerox Corp. | 2,048 | 24,924 | ||||||
| NetApp, Inc. | 603 | 24,807 | ||||||
| Alliance Data Systems Corp.* | 90 | 23,664 | ||||||
| Xilinx, Inc. | 470 | 21,582 | ||||||
| Citrix Systems, Inc.* | 330 | 20,873 | ||||||
| Juniper Networks, Inc.* | 894 | 20,178 | ||||||
| Autodesk, Inc.* | 397 | 19,981 | ||||||
| CA, Inc. | 575 | 19,349 | ||||||
| KLA-Tencor Corp. | 295 | 19,016 | ||||||
| Linear Technology Corp. | 414 | 18,858 | ||||||
| Red Hat, Inc.* | 335 | 18,773 | ||||||
| Altera Corp. | 564 | 18,347 | ||||||
| Western Union Co. | 974 | 16,802 | ||||||
| NVIDIA Corp. | 1,024 | 16,404 | ||||||
| Lam Research Corp.* | 287 | 15,627 | ||||||
| Microchip Technology, Inc. | 347 | 15,528 | ||||||
| Akamai Technologies, Inc.* | 314 | 14,815 | ||||||
| Computer Sciences Corp. | 260 | 14,529 | ||||||
| VeriSign, Inc.* | 228 | 13,630 | ||||||
| Teradata Corp.* | 287 | 13,056 | ||||||
| Harris Corp. | 187 | 13,054 | ||||||
| Electronic Arts, Inc.* | 549 | 12,594 | ||||||
| F5 Networks, Inc.* | 137 | 12,448 | ||||||
| LSI Corp. | 964 | 10,623 | ||||||
| Total System Services, Inc. | 296 | 9,851 | ||||||
| FLIR Systems, Inc. | 251 | 7,555 | ||||||
| First Solar, Inc.* | 120 | 6,557 | ||||||
| Jabil Circuit, Inc. | 327 | 5,703 | ||||||
| Total Information Technology | 5,437,998 | |||||||
| Financials - 8.8% | ||||||||
| JPMorgan Chase & Co. | 6,652 | 389,009 | ||||||
| Wells Fargo & Co. | 8,482 | 385,083 | ||||||
| Berkshire Hathaway, Inc. — Class B* | 3,185 | 377,614 | ||||||
| Bank of America Corp. | 18,873 | 293,853 | ||||||
| Citigroup, Inc. | 5,367 | 279,674 | ||||||
| American Express Co. | 1,630 | 147,890 | ||||||
| American International Group, Inc. | 2,605 | 132,985 | ||||||
| Goldman Sachs Group, Inc. | 743 | 131,704 | ||||||
| U.S. Bancorp | 3,231 | 130,532 | ||||||
| MetLife, Inc. | 1,984 | 106,977 | ||||||
| Simon Property Group, Inc. | 549 | 83,535 | ||||||
| Capital One Financial Corp. | 1,020 | 78,142 | ||||||
| Morgan Stanley | 2,451 | 76,863 | ||||||
| Prudential Financial, Inc. | 819 | 75,528 | ||||||
| PNC Financial Services Group, Inc. | 942 | 73,079 | ||||||
| BlackRock, Inc. — Class A | 225 | 71,206 | ||||||
| Bank of New York Mellon Corp. | 2,032 | 70,998 | ||||||
| ACE Ltd. | 598 | 61,911 | ||||||
| Travelers Companies, Inc. | 644 | 58,308 | ||||||
| State Street Corp. | 777 | 57,024 | ||||||
| American Tower Corp. — Class A | 696 | 55,555 | ||||||
| Aflac, Inc. | 820 | 54,776 | ||||||
| Charles Schwab Corp. | 2,054 | 53,404 | ||||||
| Discover Financial Services | 848 | 47,446 | ||||||
| Marsh & McLennan Companies, Inc. | 970 | 46,910 | ||||||
| BB&T Corp. | 1,246 | 46,501 | ||||||
| IntercontinentalExchange Group, Inc. | 204 | 45,884 | ||||||
| Aon plc | 533 | 44,713 | ||||||
| CME Group, Inc. — Class A | 562 | 44,095 | ||||||
| Allstate Corp. | 805 | 43,905 | ||||||
| Chubb Corp. | 445 | 43,000 | ||||||
| Franklin Resources, Inc. | 714 | 41,219 | ||||||
| Ameriprise Financial, Inc. | 344 | 39,577 | ||||||
| T. Rowe Price Group, Inc. | 462 | 38,702 | ||||||
| Public Storage | 255 | 38,383 | ||||||
| McGraw Hill Financial, Inc. | 479 | 37,458 | ||||||
| SunTrust Banks, Inc. | 947 | 34,859 | ||||||
| Fifth Third Bancorp | 1,562 | 32,849 | ||||||
| Prologis, Inc. | 882 | 32,590 | ||||||
| 12 | THE RYDEX FUNDS ANNUAL REPORT | SEE NOTES TO FINANCIAL STATEMENTS. |
| SCHEDULE OF INVESTMENTS (continued) | December 31, 2013 |
| NOVA FUND | |
| Shares | Value | |||||||
| Weyerhaeuser Co. | 1,031 | $ | 32,549 | |||||
| Equity Residential | 592 | 30,707 | ||||||
| Ventas, Inc. | 516 | 29,556 | ||||||
| HCP, Inc. | 806 | 29,274 | ||||||
| Hartford Financial Services Group, Inc. | 791 | 28,658 | ||||||
| Invesco Ltd. | 784 | 28,538 | ||||||
| Health Care REIT, Inc. | 514 | 27,535 | ||||||
| Vornado Realty Trust | 304 | 26,992 | ||||||
| Boston Properties, Inc. | 268 | 26,899 | ||||||
| M&T Bank Corp. | 230 | 26,777 | ||||||
| Progressive Corp. | 975 | 26,588 | ||||||
| Moody’s Corp. | 335 | 26,287 | ||||||
| Loews Corp. | 541 | 26,098 | ||||||
| Host Hotels & Resorts, Inc. | 1,342 | 26,088 | ||||||
| AvalonBay Communities, Inc. | 215 | 25,419 | ||||||
| Northern Trust Corp. | 397 | 24,570 | ||||||
| Regions Financial Corp. | 2,437 | 24,102 | ||||||
| Lincoln National Corp. | 464 | 23,952 | ||||||
| Principal Financial Group, Inc. | 484 | 23,866 | ||||||
| KeyCorp | 1,587 | 21,298 | ||||||
| SLM Corp. | 769 | 20,209 | ||||||
| General Growth Properties, Inc. | 951 | 19,087 | ||||||
| Unum Group | 462 | 16,207 | ||||||
| XL Group plc — Class A | 500 | 15,920 | ||||||
| Leucadia National Corp. | 555 | 15,729 | ||||||
| Comerica, Inc. | 324 | 15,403 | ||||||
| Macerich Co. | 249 | 14,664 | ||||||
| Plum Creek Timber Company, Inc. | 311 | 14,465 | ||||||
| Kimco Realty Corp. | 725 | 14,319 | ||||||
| Huntington Bancshares, Inc. | 1,468 | 14,166 | ||||||
| Cincinnati Financial Corp. | 260 | 13,616 | ||||||
| Genworth Financial, Inc. — Class A* | 874 | 13,573 | ||||||
| CBRE Group, Inc. — Class A* | 493 | 12,966 | ||||||
| Torchmark Corp. | 160 | 12,504 | ||||||
| E*TRADE Financial Corp.* | 505 | 9,918 | ||||||
| Zions Bancorporation | 327 | 9,797 | ||||||
| Assurant, Inc. | 129 | 8,562 | ||||||
| People’s United Financial, Inc. | 562 | 8,497 | ||||||
| Legg Mason, Inc. | 188 | 8,174 | ||||||
| NASDAQ OMX Group, Inc. | 205 | 8,159 | ||||||
| Hudson City Bancorp, Inc. | 839 | 7,912 | ||||||
| Apartment Investment & Management | ||||||||
| Co. — Class A | 256 | 6,633 | ||||||
| Total Financials | 4,719,974 | |||||||
| Health Care - 7.0% | ||||||||
| Johnson & Johnson | 4,987 | 456,758 | ||||||
| Pfizer, Inc. | 11,468 | 351,265 | ||||||
| Merck & Company, Inc. | 5,170 | 258,759 | ||||||
| Gilead Sciences, Inc.* | 2,711 | 203,731 | ||||||
| Bristol-Myers Squibb Co. | 2,911 | 154,720 | ||||||
| Amgen, Inc. | 1,331 | 151,947 | ||||||
| AbbVie, Inc. | 2,819 | 148,871 | ||||||
| UnitedHealth Group, Inc. | 1,781 | 134,109 | ||||||
| Celgene Corp.* | 724 | 122,327 | ||||||
| Biogen Idec, Inc.* | 418 | 116,936 | ||||||
| Abbott Laboratories | 2,736 | 104,871 | ||||||
| Medtronic, Inc. | 1,766 | 101,352 | ||||||
| Express Scripts Holding Co.* | 1,426 | 100,162 | ||||||
| Eli Lilly & Co. | 1,754 | 89,454 | ||||||
| Thermo Fisher Scientific, Inc. | 639 | 71,152 | ||||||
| Baxter International, Inc. | 957 | 66,560 | ||||||
| McKesson Corp. | 406 | 65,528 | ||||||
| Allergan, Inc. | 526 | 58,428 | ||||||
| Covidien plc | 813 | 55,365 | ||||||
| Actavis plc* | 308 | 51,744 | ||||||
| WellPoint, Inc. | 523 | 48,320 | ||||||
| Alexion Pharmaceuticals, Inc.* | 343 | 45,640 | ||||||
| Aetna, Inc. | 650 | 44,584 | ||||||
| Cigna Corp. | 489 | 42,778 | ||||||
| Cardinal Health, Inc. | 602 | 40,220 | ||||||
| Stryker Corp. | 522 | 39,223 | ||||||
| Regeneron Pharmaceuticals, Inc.* | 139 | 38,258 | ||||||
| Becton Dickinson and Co. | 343 | 37,898 | ||||||
| Perrigo Company plc | 235 | 36,063 | ||||||
| Agilent Technologies, Inc. | 585 | 33,456 | ||||||
| St. Jude Medical, Inc. | 513 | 31,780 | ||||||
| Vertex Pharmaceuticals, Inc.* | 410 | 30,463 | ||||||
| Mylan, Inc.* | 672 | 29,165 | ||||||
| Zoetis, Inc. | 885 | 28,931 | ||||||
| Cerner Corp.* | 519 | 28,929 | ||||||
| AmerisourceBergen Corp. — Class A | 407 | 28,616 | ||||||
| Boston Scientific Corp.* | 2,363 | 28,403 | ||||||
| Humana, Inc. | 274 | 28,282 | ||||||
| Zimmer Holdings, Inc. | 300 | 27,957 | ||||||
| Intuitive Surgical, Inc.* | 66 | 25,349 | ||||||
| Forest Laboratories, Inc.* | 419 | 25,153 | ||||||
| Life Technologies Corp.* | 306 | 23,195 | ||||||
| DaVita HealthCare Partners, Inc.* | 308 | 19,518 | ||||||
| C.R. Bard, Inc. | 138 | 18,484 | ||||||
| Waters Corp.* | 151 | 15,100 | ||||||
| CareFusion Corp.* | 374 | 14,893 | ||||||
| Varian Medical Systems, Inc.* | 187 | 14,528 | ||||||
| Laboratory Corporation of America Holdings* | 155 | 14,162 | ||||||
| Quest Diagnostics, Inc. | 257 | 13,760 | ||||||
| Edwards Lifesciences Corp.* | 194 | 12,757 | ||||||
| DENTSPLY International, Inc. | 252 | 12,217 | ||||||
| Hospira, Inc.* | 290 | 11,971 | ||||||
| PerkinElmer, Inc. | 194 | 7,999 | ||||||
| Tenet Healthcare Corp.* | 176 | 7,413 | ||||||
| Patterson Companies, Inc. | 144 | 5,933 | ||||||
| Total Health Care | 3,775,437 | |||||||
| Consumer Discretionary - 6.8% | ||||||||
| Amazon.com, Inc.* | 653 | 260,410 | ||||||
| Comcast Corp. — Class A | 4,611 | 239,611 | ||||||
| Walt Disney Co. | 2,892 | 220,950 | ||||||
| Home Depot, Inc. | 2,492 | 205,191 | ||||||
| McDonald’s Corp. | 1,761 | 170,870 | ||||||
| Twenty-First Century Fox, Inc. — Class A | 3,472 | 122,145 | ||||||
| Time Warner, Inc. | 1,601 | 111,622 | ||||||
| Ford Motor Co. | 6,977 | 107,655 | ||||||
| Priceline.com, Inc.* | 91 | 105,778 | ||||||
| Starbucks Corp. | 1,333 | 104,494 | ||||||
| SEE NOTES TO FINANCIAL STATEMENTS. | THE RYDEX FUNDS ANNUAL REPORT | 13 |
| SCHEDULE OF INVESTMENTS (continued) | December 31, 2013 |
| NOVA FUND | |
| Shares | Value | |||||||
| NIKE, Inc. — Class B | 1,322 | $ | 103,962 | |||||
| Lowe’s Companies, Inc. | 1,850 | 91,668 | ||||||
| General Motors Co.* | 2,010 | 82,149 | ||||||
| TJX Companies, Inc. | 1,258 | 80,172 | ||||||
| Target Corp. | 1,116 | 70,609 | ||||||
| Time Warner Cable, Inc. | 499 | 67,615 | ||||||
| CBS Corp. — Class B | 987 | 62,911 | ||||||
| Viacom, Inc. — Class B | 716 | 62,535 | ||||||
| Johnson Controls, Inc. | 1,207 | 61,919 | ||||||
| DIRECTV* | 865 | 59,763 | ||||||
| Yum! Brands, Inc. | 788 | 59,581 | ||||||
| Netflix, Inc.* | 105 | 38,658 | ||||||
| VF Corp. | 620 | 38,651 | ||||||
| Discovery Communications, Inc. — Class A* | 399 | 36,078 | ||||||
| Macy’s, Inc. | 652 | 34,817 | ||||||
| Omnicom Group, Inc. | 453 | 33,690 | ||||||
| Dollar General Corp.* | 521 | 31,427 | ||||||
| Carnival Corp. | 772 | 31,011 | ||||||
| Bed Bath & Beyond, Inc.* | 380 | 30,514 | ||||||
| Delphi Automotive plc | 495 | 29,764 | ||||||
| Chipotle Mexican Grill, Inc. — Class A* | 55 | 29,303 | ||||||
| Ross Stores, Inc. | 383 | 28,698 | ||||||
| Mattel, Inc. | 599 | 28,500 | ||||||
| AutoZone, Inc.* | 59 | 28,198 | ||||||
| Coach, Inc. | 496 | 27,840 | ||||||
| Wynn Resorts Ltd. | 143 | 27,772 | ||||||
| Harley-Davidson, Inc. | 391 | 27,073 | ||||||
| Starwood Hotels & Resorts Worldwide, Inc. | 339 | 26,934 | ||||||
| L Brands, Inc. | 431 | 26,657 | ||||||
| Michael Kors Holdings Ltd.* | 317 | 25,737 | ||||||
| O’Reilly Automotive, Inc.* | 189 | 24,326 | ||||||
| BorgWarner, Inc. | 402 | 22,476 | ||||||
| Genuine Parts Co. | 270 | 22,461 | ||||||
| Whirlpool Corp. | 139 | 21,804 | ||||||
| Dollar Tree, Inc.* | 366 | 20,650 | ||||||
| Kohl’s Corp. | 356 | 20,203 | ||||||
| Marriott International, Inc. — Class A | 398 | 19,645 | ||||||
| Best Buy Company, Inc. | 481 | 19,182 | ||||||
| PVH Corp. | 141 | 19,179 | ||||||
| CarMax, Inc.* | 395 | 18,573 | ||||||
| Staples, Inc. | 1,168 | 18,560 | ||||||
| Ralph Lauren Corp. — Class A | 105 | 18,540 | ||||||
| The Gap, Inc. | 469 | 18,329 | ||||||
| Tiffany & Co. | 195 | 18,092 | ||||||
| Wyndham Worldwide Corp. | 231 | 17,022 | ||||||
| Scripps Networks Interactive, Inc. — Class A | 193 | 16,677 | ||||||
| Newell Rubbermaid, Inc. | 508 | 16,464 | ||||||
| Mohawk Industries, Inc.* | 110 | 16,379 | ||||||
| TripAdvisor, Inc.* | 196 | 16,235 | ||||||
| News Corp. — Class A* | 881 | 15,876 | ||||||
| Nordstrom, Inc. | 253 | 15,635 | ||||||
| H&R Block, Inc. | 484 | 14,055 | ||||||
| PetSmart, Inc. | 184 | 13,386 | ||||||
| Interpublic Group of Companies, Inc. | 736 | 13,027 | ||||||
| Expedia, Inc. | 182 | 12,678 | ||||||
| Darden Restaurants, Inc. | 231 | 12,559 | ||||||
| PulteGroup, Inc. | 610 | 12,425 | ||||||
| Gannett Company, Inc. | 403 | 11,921 | ||||||
| Lennar Corp. — Class A | 296 | 11,710 | ||||||
| D.R. Horton, Inc. | 503 | 11,227 | ||||||
| Hasbro, Inc. | 204 | 11,222 | ||||||
| Family Dollar Stores, Inc. | 167 | 10,850 | ||||||
| Fossil Group, Inc.* | 87 | 10,435 | ||||||
| Goodyear Tire & Rubber Co. | 437 | 10,422 | ||||||
| GameStop Corp. — Class A | 206 | 10,148 | ||||||
| Garmin Ltd. | 215 | 9,937 | ||||||
| Harman International Industries, Inc. | 120 | 9,822 | ||||||
| International Game Technology | 440 | 7,990 | ||||||
| Leggett & Platt, Inc. | 250 | 7,735 | ||||||
| Urban Outfitters, Inc.* | 190 | 7,049 | ||||||
| Cablevision Systems Corp. — Class A | 379 | 6,795 | ||||||
| AutoNation, Inc.* | 114 | 5,665 | ||||||
| Graham Holdings Co. — Class B | 6 | 3,980 | ||||||
| Total Consumer Discretionary | 3,654,278 | |||||||
| Industrials - 6.0% | ||||||||
| General Electric Co. | 17,902 | 501,792 | ||||||
| United Technologies Corp. | 1,494 | 170,016 | ||||||
| Boeing Co. | 1,223 | 166,927 | ||||||
| 3M Co. | 1,132 | 158,763 | ||||||
| Union Pacific Corp. | 815 | 136,921 | ||||||
| United Parcel Service, Inc. — Class B | 1,265 | 132,927 | ||||||
| Honeywell International, Inc. | 1,388 | 126,822 | ||||||
| Caterpillar, Inc. | 1,123 | 101,980 | ||||||
| Emerson Electric Co. | 1,246 | 87,444 | ||||||
| Danaher Corp. | 1,061 | 81,908 | ||||||
| FedEx Corp. | 525 | 75,479 | ||||||
| Lockheed Martin Corp. | 476 | 70,762 | ||||||
| Precision Castparts Corp. | 254 | 68,402 | ||||||
| Eaton Corporation plc | 840 | 63,941 | ||||||
| Deere & Co. | 674 | 61,556 | ||||||
| Illinois Tool Works, Inc. | 722 | 60,706 | ||||||
| General Dynamics Corp. | 595 | 56,852 | ||||||
| CSX Corp. | 1,794 | 51,613 | ||||||
| Raytheon Co. | 565 | 51,246 | ||||||
| Norfolk Southern Corp. | 547 | 50,778 | ||||||
| Northrop Grumman Corp. | 393 | 45,042 | ||||||
| Cummins, Inc. | 306 | 43,137 | ||||||
| Delta Air Lines, Inc. | 1,514 | 41,589 | ||||||
| PACCAR, Inc. | 623 | 36,863 | ||||||
| Waste Management, Inc. | 769 | 34,504 | ||||||
| Tyco International Ltd. | 826 | 33,899 | ||||||
| Parker Hannifin Corp. | 260 | 33,446 | ||||||
| Ingersoll-Rand plc | 474 | 29,198 | ||||||
| Dover Corp. | 301 | 29,059 | ||||||
| Rockwell Automation, Inc. | 245 | 28,949 | ||||||
| W.W. Grainger, Inc. | 109 | 27,841 | ||||||
| Pentair Ltd. | 353 | 27,418 | ||||||
| Roper Industries, Inc. | 176 | 24,408 | ||||||
| Kansas City Southern | 192 | 23,775 | ||||||
| Southwest Airlines Co. | 1,233 | 23,230 | ||||||
| Fluor Corp. | 289 | 23,203 | ||||||
| 14 | THE RYDEX FUNDS ANNUAL REPORT | SEE NOTES TO FINANCIAL STATEMENTS. |
| SCHEDULE OF INVESTMENTS (continued) | December 31, 2013 |
| NOVA FUND | |
| Shares | Value | |||||||
| Fastenal Co. | 482 | $ | 22,900 | |||||
| AMETEK, Inc. | 430 | 22,648 | ||||||
| Stanley Black & Decker, Inc. | 275 | 22,190 | ||||||
| Nielsen Holdings N.V. | 448 | 20,559 | ||||||
| Flowserve Corp. | 247 | 19,471 | ||||||
| Textron, Inc. | 493 | 18,123 | ||||||
| Rockwell Collins, Inc. | 239 | 17,667 | ||||||
| Stericycle, Inc.* | 152 | 17,658 | ||||||
| Pall Corp. | 196 | 16,729 | ||||||
| L-3 Communications Holdings, Inc. | 156 | 16,670 | ||||||
| Expeditors International of Washington, Inc. | 364 | 16,107 | ||||||
| Republic Services, Inc. — Class A | 478 | 15,870 | ||||||
| C.H. Robinson Worldwide, Inc. | 268 | 15,635 | ||||||
| Equifax, Inc. | 213 | 14,716 | ||||||
| Jacobs Engineering Group, Inc.* | 233 | 14,677 | ||||||
| Masco Corp. | 632 | 14,391 | ||||||
| ADT Corp. | 354 | 14,326 | ||||||
| Quanta Services, Inc.* | 382 | 12,056 | ||||||
| Snap-on, Inc. | 103 | 11,281 | ||||||
| Xylem, Inc. | 326 | 11,280 | ||||||
| Joy Global, Inc. | 186 | 10,879 | ||||||
| Cintas Corp. | 178 | 10,607 | ||||||
| Robert Half International, Inc. | 245 | 10,288 | ||||||
| Iron Mountain, Inc. | 298 | 9,044 | ||||||
| Pitney Bowes, Inc. | 357 | 8,318 | ||||||
| Dun & Bradstreet Corp. | 65 | 7,979 | ||||||
| Allegion plc* | 158 | 6,982 | ||||||
| Ryder System, Inc. | 93 | 6,862 | ||||||
| Total Industrials | 3,188,309 | |||||||
| Energy - 5.6% | ||||||||
| Exxon Mobil Corp. | 7,730 | 782,276 | ||||||
| Chevron Corp. | 3,403 | 425,069 | ||||||
| Schlumberger Ltd. | 2,330 | 209,956 | ||||||
| ConocoPhillips | 2,163 | 152,816 | ||||||
| Occidental Petroleum Corp. | 1,426 | 135,613 | ||||||
| Phillips 66 | 1,061 | 81,834 | ||||||
| EOG Resources, Inc. | 483 | 81,066 | ||||||
| Halliburton Co. | 1,501 | 76,176 | ||||||
| Anadarko Petroleum Corp. | 887 | 70,357 | ||||||
| Apache Corp. | 706 | 60,674 | ||||||
| National Oilwell Varco, Inc. | 757 | 60,204 | ||||||
| Marathon Petroleum Corp. | 533 | 48,892 | ||||||
| Valero Energy Corp. | 955 | 48,132 | ||||||
| Pioneer Natural Resources Co. | 256 | 47,122 | ||||||
| Williams Companies, Inc. | 1,209 | 46,631 | ||||||
| Marathon Oil Corp. | 1,233 | 43,525 | ||||||
| Baker Hughes, Inc. | 784 | 43,324 | ||||||
| Noble Energy, Inc. | 636 | 43,318 | ||||||
| Kinder Morgan, Inc. | 1,190 | 42,840 | ||||||
| Spectra Energy Corp. | 1,186 | 42,245 | ||||||
| Hess Corp. | 503 | 41,749 | ||||||
| Devon Energy Corp. | 673 | 41,639 | ||||||
| Transocean Ltd. | 600 | 29,653 | ||||||
| Cabot Oil & Gas Corp. | 745 | 28,876 | ||||||
| Cameron International Corp.* | 421 | 25,062 | ||||||
| Range Resources Corp. | 289 | 24,366 | ||||||
| Southwestern Energy Co.* | 619 | 24,345 | ||||||
| Chesapeake Energy Corp. | 894 | 24,263 | ||||||
| Ensco plc — Class A | 413 | 23,615 | ||||||
| Equities Corp. | 263 | 23,612 | ||||||
| FMC Technologies, Inc.* | 419 | 21,876 | ||||||
| Murphy Oil Corp. | 309 | 20,048 | ||||||
| Noble Corporation plc | 447 | 16,749 | ||||||
| Helmerich & Payne, Inc. | 186 | 15,639 | ||||||
| CONSOL Energy, Inc. | 405 | 15,406 | ||||||
| Tesoro Corp. | 235 | 13,748 | ||||||
| Denbury Resources, Inc.* | 649 | 10,663 | ||||||
| QEP Resources, Inc. | 317 | 9,716 | ||||||
| Peabody Energy Corp. | 477 | 9,316 | ||||||
| Nabors Industries Ltd. | 460 | 7,815 | ||||||
| Rowan Companies plc — Class A* | 216 | 7,638 | ||||||
| WPX Energy, Inc.* | 355 | 7,235 | ||||||
| Diamond Offshore Drilling, Inc. | 119 | 6,773 | ||||||
| Newfield Exploration Co.* | 239 | 5,887 | ||||||
| Total Energy | 2,997,759 | |||||||
| Consumer Staples - 5.3% | ||||||||
| Procter & Gamble Co. | 4,810 | 391,582 | ||||||
| Coca-Cola Co. | 6,720 | 277,602 | ||||||
| Philip Morris International, Inc. | 2,835 | 247,015 | ||||||
| Wal-Mart Stores, Inc. | 2,863 | 225,289 | ||||||
| PepsiCo, Inc. | 2,714 | 225,099 | ||||||
| CVS Caremark Corp. | 2,106 | 150,726 | ||||||
| Altria Group, Inc. | 3,539 | 135,862 | ||||||
| Mondelez International, Inc. — Class A | 3,103 | 109,537 | ||||||
| Colgate-Palmolive Co. | 1,555 | 101,402 | ||||||
| Costco Wholesale Corp. | 773 | 91,995 | ||||||
| Walgreen Co. | 1,536 | 88,228 | ||||||
| Kimberly-Clark Corp. | 674 | 70,406 | ||||||
| Kraft Foods Group, Inc. | 1,054 | 56,832 | ||||||
| General Mills, Inc. | 1,122 | 55,999 | ||||||
| Archer-Daniels-Midland Co. | 1,164 | 50,518 | ||||||
| Whole Foods Market, Inc. | 658 | 38,052 | ||||||
| Sysco Corp. | 1,029 | 37,147 | ||||||
| Kroger Co. | 917 | 36,249 | ||||||
| Estee Lauder Companies, Inc. — Class A | 453 | 34,120 | ||||||
| Lorillard, Inc. | 652 | 33,043 | ||||||
| Mead Johnson Nutrition Co. — Class A | 357 | 29,902 | ||||||
| Reynolds American, Inc. | 555 | 27,744 | ||||||
| Kellogg Co. | 452 | 27,604 | ||||||
| Hershey Co. | 262 | 25,474 | ||||||
| ConAgra Foods, Inc. | 743 | 25,039 | ||||||
| Brown-Forman Corp. — Class B | 287 | 21,689 | ||||||
| Clorox Co. | 228 | 21,149 | ||||||
| Constellation Brands, Inc. — Class A* | 290 | 20,410 | ||||||
| Beam, Inc. | 289 | 19,669 | ||||||
| J.M. Smucker Co. | 186 | 19,273 | ||||||
| Coca-Cola Enterprises, Inc. | 427 | 18,844 | ||||||
| Dr Pepper Snapple Group, Inc. | 355 | 17,296 | ||||||
| Monster Beverage Corp.* | 240 | 16,265 | ||||||
| McCormick & Company, Inc. | 234 | 16,127 | ||||||
| SEE NOTES TO FINANCIAL STATEMENTS. | THE RYDEX FUNDS ANNUAL REPORT | 15 |
| SCHEDULE OF INVESTMENTS (continued) | December 31, 2013 |
| NOVA FUND | |
| Shares | Value | |||||||
| Tyson Foods, Inc. — Class A | 481 | $ | 16,094 | |||||
| Molson Coors Brewing Co. — Class B | 280 | 15,722 | ||||||
| Safeway, Inc. | 439 | 14,298 | ||||||
| Campbell Soup Co. | 318 | 13,763 | ||||||
| Avon Products, Inc. | 767 | 13,208 | ||||||
| Hormel Foods Corp. | 238 | 10,750 | ||||||
| Total Consumer Staples | 2,847,023 | |||||||
| MATERIALS - 1.9% | ||||||||
| Monsanto Co. | 930 | 108,391 | ||||||
| EI du Pont de Nemours & Co. | 1,638 | 106,421 | ||||||
| Dow Chemical Co. | 2,143 | 95,149 | ||||||
| Freeport-McMoRan Copper & Gold, Inc. | 1,837 | 69,328 | ||||||
| Praxair, Inc. | 518 | 67,355 | ||||||
| LyondellBasell Industries N.V. — Class A | 773 | 62,056 | ||||||
| Ecolab, Inc. | 480 | 50,050 | ||||||
| PPG Industries, Inc. | 251 | 47,605 | ||||||
| Air Products & Chemicals, Inc. | 373 | 41,694 | ||||||
| International Paper Co. | 785 | 38,489 | ||||||
| Nucor Corp. | 562 | 30,000 | ||||||
| Mosaic Co. | 603 | 28,504 | ||||||
| Sherwin-Williams Co. | 151 | 27,709 | ||||||
| CF Industries Holdings, Inc. | 101 | 23,537 | ||||||
| Eastman Chemical Co. | 269 | 21,708 | ||||||
| Newmont Mining Corp. | 881 | 20,289 | ||||||
| Alcoa, Inc. | 1,893 | 20,123 | ||||||
| Sigma-Aldrich Corp. | 212 | 19,930 | ||||||
| FMC Corp. | 236 | 17,809 | ||||||
| Vulcan Materials Co. | 230 | 13,667 | ||||||
| Ball Corp. | 256 | 13,225 | ||||||
| Airgas, Inc. | 114 | 12,751 | ||||||
| International Flavors & Fragrances, Inc. | 144 | 12,381 | ||||||
| Sealed Air Corp. | 347 | 11,815 | ||||||
| MeadWestvaco Corp. | 315 | 11,633 | ||||||
| Owens-Illinois, Inc.* | 292 | 10,448 | ||||||
| Avery Dennison Corp. | 171 | 8,582 | ||||||
| United States Steel Corp. | 256 | 7,552 | ||||||
| Bemis Company, Inc. | 181 | 7,414 | ||||||
| Cliffs Natural Resources, Inc. | 267 | 6,998 | ||||||
| Allegheny Technologies, Inc. | 188 | 6,698 | ||||||
| Total Materials | 1,019,311 | |||||||
| UTILITIES - 1.6% | ||||||||
| Duke Energy Corp. | 1,248 | 86,125 | ||||||
| Dominion Resources, Inc. | 1,031 | 66,695 | ||||||
| Nextera Energy, Inc. | 762 | 65,242 | ||||||
| Southern Co. | 1,555 | 63,926 | ||||||
| Exelon Corp. | 1,516 | 41,523 | ||||||
| American Electric Power Company, Inc. | 862 | 40,290 | ||||||
| Sempra Energy | 400 | 35,904 | ||||||
| PPL Corp. | 1,115 | 33,550 | ||||||
| PG&e Corp. | 794 | 31,982 | ||||||
| Public Service enterprise Group, Inc. | 895 | 28,676 | ||||||
| Consolidated Edison, Inc. | 516 | 28,524 | ||||||
| Edison International | 573 | 26,530 | ||||||
| Xcel Energy, Inc. | 881 | 24,615 | ||||||
| Firstenergy Corp. | 740 | 24,405 | ||||||
| Northeast Utilities | 556 | 23,569 | ||||||
| ONEOK, Inc. | 363 | 22,572 | ||||||
| DTE Energy Co. | 316 | 20,979 | ||||||
| Entergy Corp. | 313 | 19,804 | ||||||
| NiSource, Inc. | 554 | 18,216 | ||||||
| CenterPoint Energy, Inc. | 758 | 17,570 | ||||||
| AES Corp. | 1,164 | 16,889 | ||||||
| Wisconsin Energy Corp. | 401 | 16,577 | ||||||
| NRG Energy, Inc. | 572 | 16,428 | ||||||
| Ameren Corp. | 429 | 15,513 | ||||||
| CMS Energy Corp. | 467 | 12,502 | ||||||
| SCANA Corp. | 249 | 11,686 | ||||||
| Pinnacle West Capital Corp. | 193 | 10,214 | ||||||
| AGL Resources, Inc. | 210 | 9,918 | ||||||
| Pepco Holdings, Inc. | 438 | 8,379 | ||||||
| Integrys Energy Group, Inc. | 137 | 7,454 | ||||||
| TECO Energy, Inc. | 361 | 6,224 | ||||||
| Total Utilities | 852,481 | |||||||
| TELECOMMUNICATION SERVICES - 1.2% | ||||||||
| AT&T, Inc. | 9,321 | 327,727 | ||||||
| Verizon Communications, Inc. | 5,064 | 248,845 | ||||||
| Crown Castle International Corp.* | 594 | 43,617 | ||||||
| CenturyLink, Inc. | 1,046 | 33,315 | ||||||
| Windstream Holdings, Inc. | 1,052 | 8,395 | ||||||
| Frontier Communications Corp. | 1,769 | 8,226 | ||||||
| Total Telecommunication Services | 670,125 | |||||||
| Total Common Stocks | ||||||||
| (Cost $16,280,189) | 29,162,695 | |||||||
| Face | ||||||||
| Amount | ||||||||
| REPURCHASE AGREEMENTS††,1 - 7.4% | ||||||||
| Credit Suisse Group | ||||||||
| issued 12/31/13 at 0.00% | ||||||||
| due 01/02/142 | $ | 2,187,679 | 2,187,679 | |||||
| Deutsche Bank | ||||||||
| issued 12/31/13 at 0.01% | ||||||||
| due 01/02/14 | 583,832 | 583,832 | ||||||
| HSBC Group | ||||||||
| issued 12/31/13 at 0.01% | ||||||||
| due 01/02/14 | 583,832 | 583,832 | ||||||
| Mizuho Financial Group, Inc. | ||||||||
| issued 12/31/13 at 0.01% | ||||||||
| due 01/02/14 | 581,191 | 581,191 | ||||||
| Total Repurchase agreements | ||||||||
| (Cost $3,936,534) | 3,936,534 | |||||||
| Total Investments - 61.8% | ||||||||
| (Cost $20,216,723) | $ | 33,099,229 | ||||||
| Other assets & Liabilities, net - 38.2% | 20,416,181 | |||||||
| Total Net assets - 100.0% | $ | 53,515,410 | ||||||
| 16 | THE RYDEX FUNDS ANNUAL REPORT | SEE NOTES TO FINANCIAL STATEMENTS. |
| SCHEDULE OF INVESTMENTS (concluded) | December 31, 2013 |
| NOVA FUND | |
| Unrealized | ||||||||
| Contracts | Gain | |||||||
| EQUITY FUTURES CONTRACTS PURCHASED† | ||||||||
| March 2014 S&P 500 Index | ||||||||
| Mini Futures Contracts | ||||||||
| (Aggregate Value of | ||||||||
| Contracts $5,163,900) | 56 | $ | 42,791 | |||||
| Units | ||||||||
| EQUITY INDEX SWAP AGREEMENTS†† | ||||||||
| Barclays Bank plc | ||||||||
| January 2014 S&P 500 Index Swap, | ||||||||
| Terminating 01/31/143 | ||||||||
| (Notional Value $18,822,599) | 10,183 | $ | 34,642 | |||||
| Credit Suisse Capital, LLC | ||||||||
| January 2014 S&P 500 Index Swap, | ||||||||
| Terminating 01/28/143 | ||||||||
| (Notional Value $13,458,197) | 7,281 | 28,348 | ||||||
| Goldman Sachs International | �� | |||||||
| January 2014 S&P 500 Index Swap, | ||||||||
| Terminating 01/28/143 | ||||||||
| (Notional Value $13,203,583) | 7,143 | 11,784 | ||||||
| (Total Notional Value | ||||||||
| $45,484,379) | $ | 74,774 | ||||||
| * | Non-income producing security. |
| † | Value determined based on Level 1 inputs — See Note 4. |
| †† | Value determined based on Level 2 inputs — See Note 4. |
| 1 | Repurchase Agreements — See Note 5. |
| 2 | All or a portion of this security is pledged as equity index swap collateral at December 31, 2013. |
| 3 | Total Return based on S&P 500 Index +/- financing at a variable rate. | |
| plc — Public Limited Company | ||
| REIT — Real Estate Investment Trust |
| SEE NOTES TO FINANCIAL STATEMENTS. | THE RYDEX FUNDS ANNUAL REPORT | 17 |
NOVA FUND
STATEMENT OF ASSETS
AND LIABILITIES
December 31, 2013
| Assets: | ||||
| Investments, at value | ||||
| (cost $16,280,189) | $ | 29,162,695 | ||
| Repurchase agreements, at value | ||||
| (cost $3,936,534) | 3,936,534 | |||
| Total investments | ||||
| (cost $20,216,723) | 33,099,229 | |||
| Segregated cash with broker | 2,809,600 | |||
| Unrealized appreciation on swap agreements | 74,774 | |||
| Receivables: | ||||
| Fund shares sold | 17,589,865 | |||
| Dividends | 40,568 | |||
| Variation margin | 26,740 | |||
| Foreign taxes reclaim | 20 | |||
| Swap settlement | 5,421 | |||
| Total assets | 53,646,217 | |||
| Liabilities: | ||||
| Payable for: | ||||
| Fund shares redeemed | 37,033 | |||
| Management fees | 24,580 | |||
| Transfer agent and administrative fees | 8,193 | |||
| Investor service fees | 8,193 | |||
| Portfolio accounting fees | 3,278 | |||
| Swap settlement | 2,580 | |||
| Miscellaneous | 46,950 | |||
| Total liabilities | 130,807 | |||
| Net assets | $ | 53,515,410 | ||
| Net assets consist of: | ||||
| Paid in capital | $ | 59,156,787 | ||
| Undistributed net investment income | 38,416 | |||
| Accumulated net realized loss on investments | (18,679,864 | ) | ||
| Net unrealized appreciation on investments | 13,000,071 | |||
| Net assets | $ | 53,515,410 | ||
| Capital shares outstanding | 406,611 | |||
| Net asset value per share | $ | 131.61 |
STATEMENT OF
OPERATIONS
Year Ended December 31, 2013
| Investment Income: | ||||
| Dividends (net of foreign withholding tax of $128) | $ | 532,804 | ||
| Interest | 2,443 | |||
| Income from securities lending, net | 93 | |||
| Total investment income | 535,340 | |||
| Expenses: | ||||
| Management fees | 240,343 | |||
| Transfer agent and administrative fees | 80,115 | |||
| Investor service fees | 80,115 | |||
| Portfolio accounting fees | 32,045 | |||
| Professional fees | 28,908 | |||
| Custodian fees | 3,529 | |||
| Trustees’ fees* | 3,189 | |||
| Line of credit interest expense | 52 | |||
| Miscellaneous | 25,483 | |||
| Total expenses | 493,779 | |||
| Net investment income | 41,561 | |||
| Net Realized and Unrealized Gain (Loss): | ||||
| Net realized gain (loss) on: | ||||
| Investments | 245,872 | |||
| Swap agreements | 5,121,371 | |||
| Futures contracts | 896,691 | |||
| Net realized gain | 6,263,934 | |||
| Net change in unrealized appreciation (depreciation) on: | ||||
| Investments | 5,578,222 | |||
| Swap agreements | (145,578 | ) | ||
| Futures contracts | 27,199 | |||
| Net change in unrealized appreciation (depreciation) | 5,459,843 | |||
| Net realized and unrealized gain | 11,723,777 | |||
| Net increase in net assets resulting from operations | $ | 11,765,338 |
* Relates to Trustees not deemed “interested persons” within the meaning of Section 2(a)(19) of the 1940 Act.
| 18 | THE RYDEX FUNDS ANNUAL REPORT | SEE NOTES TO FINANCIAL STATEMENTS. |
NOVA FUND
STATEMENTS OF CHANGES IN NET ASSETS
| Year Ended | Year Ended | |||||||
| December 31, | December 31, | |||||||
| 2013 | 2012 | |||||||
| Increase (Decrease) In Net Assets From Operations: | ||||||||
| Net investment income | $ | 41,561 | $ | 32,241 | ||||
| Net realized gain on investments | 6,263,934 | 3,411,099 | ||||||
| Net change in unrealized appreciation (depreciation) on investments | 5,459,843 | 2,096,179 | ||||||
| Net increase in net assets resulting from operations | 11,765,338 | 5,539,519 | ||||||
| Distributions to shareholders from: | ||||||||
| Net investment income | (31,195 | ) | — | |||||
| Total distributions to shareholders | (31,195 | ) | — | |||||
| Capital share transactions: | ||||||||
| Proceeds from sale of shares | 230,535,446 | 136,034,022 | ||||||
| Distributions reinvested | 31,195 | — | ||||||
| Cost of shares redeemed | (213,863,994 | ) | (138,703,270 | ) | ||||
| Net increase (decrease) from capital share transactions | 16,702,647 | (2,669,248 | ) | |||||
| Net increase in net assets | 28,436,790 | 2,870,271 | ||||||
| Net assets: | ||||||||
| Beginning of year | 25,078,620 | 22,208,349 | ||||||
| End of year | $ | 53,515,410 | $ | 25,078,620 | ||||
| Undistributed net investment income at end of year | $ | 38,416 | $ | 32,241 | ||||
| Capital share activity: | ||||||||
| Shares sold | 2,000,045 | 1,621,548 | ||||||
| Shares issued from reinvestment of distributions | 249 | — | ||||||
| Shares redeemed | (1,877,304 | ) | (1,644,937 | ) | ||||
| Net increase (decrease) in shares | 122,990 | (23,389 | ) | |||||
| SEE NOTES TO FINANCIAL STATEMENTS. | THE RYDEX FUNDS ANNUAL REPORT | 19 |
NOVA FUND
FINANCIAL HIGHLIGHTS
This table is presented to show selected data for a share outstanding throughout each period and to assist shareholders in evaluating a Fund’s performance for the periods presented.
| Year Ended | Year Ended | Year Ended | Year Ended | Year Ended | ||||||||||||||||
| December 31, | December 31, | December 31, | December 31, | December 31, | ||||||||||||||||
| 2013 | 2012 | 2011 | 2010 | 2009c | ||||||||||||||||
| Per Share Data | ||||||||||||||||||||
| Net asset value, beginning of period | $ | 88.42 | $ | 72.34 | $ | 73.23 | $ | 61.16 | $ | 45.50 | ||||||||||
| Income (loss) from investment operations: | ||||||||||||||||||||
| Net investment income (loss)a | .14 | .10 | (.09 | ) | .02 | .09 | ||||||||||||||
| Net gain (loss) on investments (realized and unrealized) | 43.17 | 15.98 | (.76 | ) | 12.19 | 16.06 | ||||||||||||||
| Total from investment operations | 43.31 | 16.08 | (.85 | ) | 12.21 | 16.15 | ||||||||||||||
| Less distributions from: | ||||||||||||||||||||
| Net investment income | (.12 | ) | — | (.04 | ) | (.14 | ) | (.49 | ) | |||||||||||
| Total distributions | (.12 | ) | — | (.04 | ) | (.14 | ) | (.49 | ) | |||||||||||
| Net asset value, end of period | $ | 131.61 | $ | 88.42 | $ | 72.34 | $ | 73.23 | $ | 61.16 | ||||||||||
| Total Returnb | 48.99 | % | 22.25 | % | (1.17 | %) | 19.97 | % | 35.51 | % | ||||||||||
| Ratios/Supplemental Data | ||||||||||||||||||||
| Net assets, end of period (in thousands) | $ | 53,515 | $ | 25,079 | $ | 22,208 | $ | 29,644 | $ | 50,561 | ||||||||||
| Ratios to average net assets: | ||||||||||||||||||||
| Net investment income (loss) | 0.13 | % | 0.12 | % | (0.13 | %) | 0.03 | % | 0.19 | % | ||||||||||
| Total expenses | 1.54 | % | 1.58 | % | 1.61 | % | 1.55 | % | 1.55 | % | ||||||||||
| Portfolio turnover rate | 298 | % | 119 | % | 146 | % | 58 | % | 84 | % | ||||||||||
| a | Net investment income (loss) per share was computed using average shares outstanding throughout the period. |
| b | Total return does not reflect the impact of any additional fees charged by insurance companies. |
| c | Reverse share split — Per share amounts for period January 1, 2009 through April 19, 2009 have been restated to reflect a 1:10 reverse share split effective April 20, 2009. |
| 20 | THE RYDEX FUNDS ANNUAL REPORT | SEE NOTES TO FINANCIAL STATEMENTS. |
This page intentionally left blank.
| THE RYDEX FUNDS ANNUAL REPORT | 21 |
| PERFORMANCE REPORT AND FUND PROFILE (Unaudited) | December 31, 2013 |
INVERSE S&P 500® STRATEGY FUND
OBJECTIVE: Seeks to provide investment results that match, before fees and expenses, the performance of a specific benchmark on a daily basis. The Fund’s current benchmark is the inverse (opposite) of the performance of the S&P 500® Index (the “underlying index”). The Fund does not seek to achieve its investment objective over a period of time greater than one day.
For the year ended December 31, 2013, Inverse S&P 500® Strategy Fund maintained a daily correlation of over 99% to its benchmark of -100% of the daily price movement of the S&P 500 Index. Inverse S&P 500® Strategy Fund returned -26.52%, while the S&P 500 Index gained 32.39% over the same time period.
Sectors contributing most to performance of the underlying index were Financials and Health Care. No sectors detracted from performance, but the sectors contributing least were Telecommunications Services and Utilities.
Google, Inc. — Class A, Microsoft Corp. and General Electric Co. contributed most to performance of the underlying index for 2013. Newmont Mining Corp., Intuitive Surgical, Inc. and CenturyLink, Inc. detracted most from performance of the underlying index for the year.
Derivatives in the Fund were used to help provide exposure to the composition of the benchmark in the highest efficient manner and not for hedging purposes.
Due to the compounding of daily returns, leveraged and inverse funds’ returns over periods other than one day will likely differ in amount and possibly direction from the benchmark return for the same period. Investors should monitor their leveraged and inverse funds’ holdings to ensure that they are consistent with their strategies, as frequently as daily.
The effects of compounding may cause the longer-term correlation of the fund to its benchmark to diminish. The apparent discrepancy between the leveraged and unleveraged indices is the result of compounding, which is described briefly on page 6 of this report.
Performance displayed represents past performance, which is no guarantee of future results.
Holdings Diversification (Market Exposure as % of Net Assets)
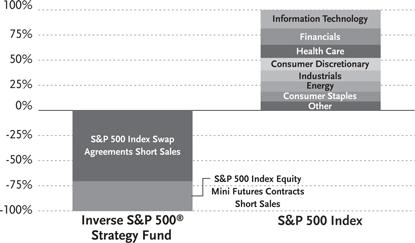
“Holdings Diversification (Market Exposure as % of Net Assets)” excludes any temporary cash investments.
Inception Date: June 9, 1997
The Fund invests principally in derivative investments such as swap agreements and futures contracts.
| 22 | THE RYDEX FUNDS ANNUAL REPORT |
| PERFORMANCE REPORT AND FUND PROFILE (Unaudited) (concluded) |
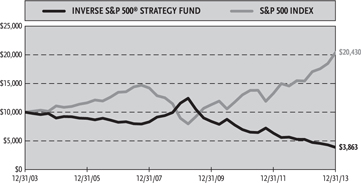
Cumulative Fund Performance*,†
Average Annual Returns
| Periods Ended December 31, 2013*,† | ||||||||||||
| 1 Year | 5 Year | 10 Year | ||||||||||
| Inverse S&P 500® Strategy Fund | -26.52 | % | -19.70 | % | -9.07 | % | ||||||
| S&P 500 Index | 32.39 | % | 17.94 | % | 7.41 | % | ||||||
| * | The performance data above represents past performance that is not predictive of future results. The investment return and principal value of an investment in the Fund will fluctuate so that an investor’s shares, when redeemed, may be worth more or less than their original cost. Returns are historical and include changes in principal and reinvested dividends and capital gains and do not reflect the effect of taxes. The S&P 500 Index is an unmanaged index and, unlike the Fund, has no management fees or operating expenses to reduce its reported return. |
| † | Returns do not reflect the impact of any additional fees charged by insurance companies. |
| THE RYDEX FUNDS ANNUAL REPORT | 23 |
| SCHEDULE OF INVESTMENTS | December 31, 2013 |
| INVERSE S&P 500® STRATEGY FUND |
| Face | ||||||||
| Amount | Value | |||||||
| FEDERAL AGENCY DISCOUNT NOTES†† - 58.8% | ||||||||
| Fannie Mae1 | ||||||||
| 0.08% due 01/02/14 | $ | 1,000,000 | $ | 1,000,000 | ||||
| Farmer Mac2 | ||||||||
| 0.03% due 01/02/14 | 1,000,000 | 999,999 | ||||||
| Federal Farm Credit Bank2 | ||||||||
| 0.03% due 01/15/14 | 1,000,000 | 999,989 | ||||||
| Federal Home Loan Bank2 | ||||||||
| 0.05% due 01/13/14 | 1,000,000 | 999,983 | ||||||
| Total Federal Agency Discount Notes | ||||||||
| (Cost $3,999,969) | 3,999,971 | |||||||
| REPURCHASE AGREEMENTS††,3 - 42.2% | ||||||||
| Credit Suisse Group | ||||||||
| issued 12/31/13 at 0.00% | ||||||||
| due 01/02/144 | 1,087,633 | 1,087,633 | ||||||
| Deutsche Bank | ||||||||
| issued 12/31/13 at 0.01% | ||||||||
| due 01/02/14 | 594,167 | 594,167 | ||||||
| HSBC Group | ||||||||
| issued 12/31/13 at 0.01% | ||||||||
| due 01/02/14 | 594,167 | 594,167 | ||||||
| Mizuho Financial Group, Inc. | ||||||||
| issued 12/31/13 at 0.01% | ||||||||
| due 01/02/14 | 591,480 | 591,480 | ||||||
| Total Repurchase Agreements | ||||||||
| (Cost $2,867,447) | 2,867,447 | |||||||
| Total Investments - 101.0% | ||||||||
| (Cost $6,867,416) | $ | 6,867,418 | ||||||
| Other Assets & Liabilities, net - (1.0)% | (70,744 | ) | ||||||
| Total Net Assets - 100.0% | $ | 6,796,674 | ||||||
| Unrealized | ||||||||
| Contracts | Loss | |||||||
| EQUITY FUTURES CONTRACTS SOLD SHORT† | ||||||||
| March 2014 S&P 500 Index | ||||||||
| Mini Futures Contracts | ||||||||
| (Aggregate Value of | ||||||||
| Contracts $2,028,675) | 22 | $ | (8,608 | ) | ||||
| Units | ||||||||
| EQUITY INDEX SWAP AGREEMENTS SOLD SHORT†† | ||||||||
| Goldman Sachs International | ||||||||
| January 2014 S&P 500 Index Swap, | ||||||||
| Terminating 01/28/145 | ||||||||
| (Notional Value $1,057,687) | 572 | $ | (3,975 | ) | ||||
| Credit Suisse Capital, LLC | ||||||||
| January 2014 S&P 500 Index Swap, | ||||||||
| Terminating 01/28/145 | ||||||||
| (Notional Value $1,424,209) | 771 | (5,662 | ) | |||||
| Barclays Bank plc | ||||||||
| January 2014 S&P 500 Index Swap, | ||||||||
| Terminating 01/31/145 | ||||||||
| (Notional Value $2,301,846) | 1,245 | (9,216 | ) | |||||
| (Total Notional Value | ||||||||
| $4,783,742) | $ | (18,853 | ) | |||||
| † | Value determined based on Level 1 inputs — See Note 4. |
| †† | Value determined based on Level 2 inputs — See Note 4. |
| 1 | On September 7, 2008, the issuer was placed in conservatorship by the Federal Housing Finance Agency (FHFA). As conservator, the FHFA has full powers to control the assets and operations of the firm. |
| 2 | The issuer operates under a Congressional charter; its securities are neither issued nor guaranteed by the U.S. Government. |
| 3 | Repurchase Agreements — See Note 5. |
| 4 | All or a portion of this security is pledged as equity index swap collateral at December 31, 2013. |
| 5 | Total Return based on S&P 500 Index +/- financing at a variable rate. | |
| plc — Public Limited Company |
| 24 | THE RYDEX FUNDS ANNUAL REPORT | SEE NOTES TO FINANCIAL STATEMENTS. |
INVERSE S&P 500® STRATEGY FUND
STATEMENT OF ASSETS
AND LIABILITIES
December 31, 2013
| Assets: | ||||
| Investments, at value | ||||
| (cost $3,999,969) | $ | 3,999,971 | ||
| Repurchase agreements, at value | ||||
| (cost $2,867,447) | 2,867,447 | |||
| Total investments | ||||
| (cost $6,867,416) | 6,867,418 | |||
| Segregated cash with broker | 120,200 | |||
| Receivables: | ||||
| Fund shares sold | 96,722 | |||
| Total assets | 7,084,340 | |||
| Liabilities: | ||||
| Unrealized depreciation on swap agreements | 18,853 | |||
| Payable for: | ||||
| Fund shares redeemed | 230,262 | |||
| Variation margin | 10,505 | |||
| Management fees | 6,257 | |||
| Transfer agent and administrative fees | 1,738 | |||
| Investor service fees | 1,738 | |||
| Portfolio accounting fees | 695 | |||
| Swap settlement | 613 | |||
| Miscellaneous | 17,005 | |||
| Total liabilities | 287,666 | |||
| Net assets | $ | 6,796,674 | ||
| Net assets consist of: | ||||
| Paid in capital | $ | 16,643,634 | ||
| Undistributed net investment income | — | |||
| Accumulated net realized loss on investments | (9,819,501 | ) | ||
| Net unrealized depreciation on investments | (27,459 | ) | ||
| Net assets | $ | 6,796,674 | ||
| Capital shares outstanding | 348,290 | |||
| Net asset value per share | $ | 19.51 |
| STATEMENT OF | ||||
| OPERATIONS | ||||
| Year ended December 31, 2013 | ||||
| Investment Income: | ||||
| Interest | $ | 5,507 | ||
| Total investment income | 5,507 | |||
| Expenses: | ||||
| Management fees | 100,894 | |||
| Transfer agent and administrative fees | 28,026 | |||
| Investor service fees | 28,026 | |||
| Portfolio accounting fees | 11,210 | |||
| Professional fees | 10,401 | |||
| Trustees’ fees* | 1,784 | |||
| Custodian fees | 1,033 | |||
| Miscellaneous | 8,428 | |||
| Total expenses | 189,802 | |||
| Net investment loss | (184,295 | ) | ||
| Net Realized and Unrealized Gain (Loss): | ||||
| Net realized gain (loss) on: | ||||
| Investments | 96 | |||
| Swap agreements | (2,580,630 | ) | ||
| Futures contracts | (780,726 | ) | ||
| Net realized loss | (3,361,260 | ) | ||
| Net change in unrealized appreciation (depreciation) on: | ||||
| Investments | (31 | ) | ||
| Swap agreements | 23,975 | |||
| Futures contracts | (6,642 | ) | ||
| Net change in unrealized appreciation (depreciation) | 17,302 | |||
| Net realized and unrealized loss | (3,343,958 | ) | ||
| Net decrease in net assets resulting from operations | $ | (3,528,253 | ) | |
| * | Relates to Trustees not deemed “interested persons” within the meaning of Section 2(a)(19) of the 1940 Act. |
| SEE NOTES TO FINANCIAL STATEMENTS. | THE RYDEX FUNDS ANNUAL REPORT | 25 |
INVERSE S&P 500® STRATEGY FUND
STATEMENTS OF CHANGES IN NET ASSETS
| Year Ended | Year Ended | |||||||
| December 31, | December 31, | |||||||
| 2013 | 2012 | |||||||
| Increase (Decrease) In Net Assets From Operations: | ||||||||
| Net investment loss | $ | (184,295 | ) | $ | (287,914 | ) | ||
| Net realized loss on investments | (3,361,260 | ) | (2,719,432 | ) | ||||
| Net change in unrealized appreciation (depreciation) on investments | 17,302 | (68,529 | ) | |||||
| Net decrease in net assets resulting from operations | (3,528,253 | ) | (3,075,875 | ) | ||||
| Capital share transactions: | ||||||||
| Proceeds from sale of shares | 158,171,603 | 214,557,640 | ||||||
| Cost of shares redeemed | (158,024,260 | ) | (215,104,613 | ) | ||||
| Net increase (decrease) from capital share transactions | 147,343 | (546,973 | ) | |||||
| Net decrease in net assets | (3,380,910 | ) | (3,622,848 | ) | ||||
| Net assets: | ||||||||
| Beginning of year | 10,177,584 | 13,800,432 | ||||||
| End of year | $ | 6,796,674 | $ | 10,177,584 | ||||
| Undistributed net investment income at end of year | $ | — | $ | — | ||||
| Capital share activity: | ||||||||
| Shares sold | 7,011,981 | 7,549,799 | ||||||
| Shares redeemed | (7,047,080 | ) | (7,597,912 | ) | ||||
| Net decrease in shares | (35,099 | ) | (48,113 | ) | ||||
| 26 | THE RYDEX FUNDS ANNUAL REPORT | SEE NOTES TO FINANCIAL STATEMENTS. |
INVERSE S&P 500® STRATEGY FUND
FINANCIAL HIGHLIGHTS
This table is presented to show selected data for a share outstanding throughout each period and to assist shareholders in evaluating a Fund’s performance for the periods presented.
| Year Ended | Year Ended | Year Ended | Year Ended | Year Ended | ||||||||||||||||
| December 31, | December 31, | December 31, | December 31, | December 31, | ||||||||||||||||
| 2013 | 2012 | 2011 | 2010 | 2009 | ||||||||||||||||
| Per Share Data | ||||||||||||||||||||
| Net asset value, beginning of period | $ | 26.55 | $ | 31.98 | $ | 35.16 | $ | 42.34 | $ | 58.44 | ||||||||||
| Income (loss) from investment operations: | ||||||||||||||||||||
| Net investment lossa | (.37 | ) | (.45 | ) | (.57 | ) | (.63 | ) | (.84 | ) | ||||||||||
| Net loss on investments (realized and unrealized) | (6.67 | ) | (4.98 | ) | (2.61 | ) | (6.55 | ) | (15.26 | ) | ||||||||||
| Total from investment operations | (7.04 | ) | (5.43 | ) | (3.18 | ) | (7.18 | ) | (16.10 | ) | ||||||||||
| Net asset value, end of period | $ | 19.51 | $ | 26.55 | $ | 31.98 | $ | 35.16 | $ | 42.34 | ||||||||||
| Total Returnb | (26.52 | %) | (16.98 | %) | (9.04 | %) | (16.96 | %) | (27.55 | %) | ||||||||||
| Ratios/Supplemental Data | ||||||||||||||||||||
| Net assets, end of period (in thousands) | $ | 6,797 | $ | 10,178 | $ | 13,800 | $ | 17,986 | $ | 22,964 | ||||||||||
| Ratios to average net assets: | ||||||||||||||||||||
| Net investment loss | (1.64 | %) | (1.60 | %) | (1.70 | %) | (1.55 | %) | (1.57 | %) | ||||||||||
| Total expenses | 1.69 | % | 1.72 | % | 1.75 | % | 1.70 | % | 1.72 | % | ||||||||||
| Portfolio turnover rate | — | — | — | — | — | |||||||||||||||
| a | Net investment loss per share was computed using average shares outstanding throughout the period. |
| b | Total return does not reflect the impact of any additional fees charged by insurance companies. |
| SEE NOTES TO FINANCIAL STATEMENTS. | THE RYDEX FUNDS ANNUAL REPORT | 27 |
| PERFORMANCE REPORT AND FUND PROFILE (Unaudited) | December 31, 2013 |
NASDAQ-100® FUND
OBJECTIVE: Seeks to provide investment results that correspond, before fees and expenses, to a benchmark for over-the-counter securities on a daily basis. The Fund’s current benchmark is the NASDAQ-100® Index (the “underlying index”).
For the year ended December 31, 2013, NASDAQ-100® Fund maintained a daily correlation of over 99% to its benchmark of 100% of the daily price movement of the NASDAQ-100 Index. The Fund rose 34.62%, while the NASDAQ-100 Index gained 36.92% over the same time period.
Information Technology and Consumer Discretionary contributed most to performance of the underlying index during the year. No sector detracted, but Materials contributed least to return, followed by Telecommunication Services.
Google, Inc. — Class A, Microsoft Corp. and Amazon.com, Inc. contributed most to performance of the underlying index for the year. The stocks detracting most from performance of the underlying index for the year were Oracle Corp., Intuitive Surgical, Inc. and Nuance Communications, Inc.
Derivatives in the Fund were used to help provide exposure to the composition of the benchmark in the highest efficient manner and not for hedging purposes.
Performance displayed represents past performance, which is no guarantee of future results.
Holdings Diversification (Market Exposure as % of Net Assets)
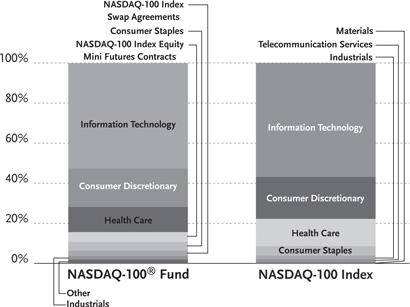
“Holdings Diversification (Market Exposure as % of Net Assets)” excludes any temporary cash investments.
| Inception Date: May 7, 1997 | ||||
| Ten Largest Holdings (% of Total Net Assets) | ||||
| Apple, Inc. | 11.5 | % | ||
| Microsoft Corp. | 7.1 | % | ||
| Google, Inc. — Class A | 7.1 | % | ||
| Amazon.com, Inc. | 4.2 | % | ||
| Intel Corp. | 2.9 | % | ||
| QUALCOMM, Inc. | 2.9 | % | ||
| Cisco Systems, Inc. | 2.7 | % | ||
| Gilead Sciences, Inc. | 2.6 | % | ||
| Comcast Corp. — Class A | 2.5 | % | ||
| Facebook, Inc. — Class A | 2.3 | % | ||
| Top Ten Total | 45.8 | % | ||
“Ten Largest Holdings” exclude any temporary cash or derivative investments.
| 28 | THE RYDEX FUNDS ANNUAL REPORT |
performance report and FUND PROFILE (Unaudited) (concluded)
Cumulative Fund Performance*,†
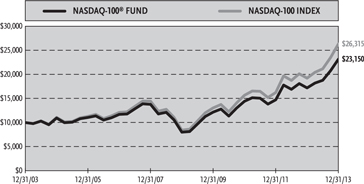
Average Annual Returns
| Periods Ended December 31, 2013*,† | ||||||||||||
| 1 Year | 5 Year | 10 Year | ||||||||||
| NASDAQ-100® Fund | 34.62 | % | 23.67 | % | 8.76 | % | ||||||
| NASDAQ-100 Index | 36.92 | % | 25.56 | % | 10.16 | % | ||||||
| * | The performance data above represents past performance that is not predictive of future results. The investment return and principal value of an investment in the Fund will fluctuate so that an investor’s shares, when redeemed, may be worth more or less than their original cost. Returns are historical and include changes in principal and reinvested dividends and capital gains and do not reflect the effect of taxes. The NASDAQ-100 Index is an unmanaged index and, unlike the Fund, has no management fees or operating expenses to reduce its reported return. |
† Returns do not reflect the impact of any additional fees charged by insurance companies.
| the RYDEX FUNDS ANNUAL REPORT | 29 |
| SCHEDULE OF INVESTMENTS | December 31, 2013 |
| NASDAQ-100® FUND |
| Shares | Value | |||||||
| COMMON STOCKS† - 92.2% | ||||||||
| INFORMATION TECHNOLOGY - 52.5% | ||||||||
| Apple, Inc. | 14,953 | $ | 8,390,278 | |||||
| Microsoft Corp. | 138,742 | 5,193,112 | ||||||
| Google, Inc. — Class A* | 4,597 | 5,151,903 | ||||||
| Intel Corp. | 82,615 | 2,144,685 | ||||||
| QUALCOMM, Inc. | 28,078 | 2,084,792 | ||||||
| Cisco Systems, Inc. | 88,856 | 1,994,817 | ||||||
| Facebook, Inc. — Class A* | 31,144 | 1,702,331 | ||||||
| eBay, Inc.* | 21,518 | 1,181,123 | ||||||
| Baidu, Inc. ADR* | 4,577 | 814,157 | ||||||
| Texas Instruments, Inc. | 18,189 | 798,679 | ||||||
| Yahoo!, Inc.* | 16,860 | 681,818 | ||||||
| Automatic Data Processing, Inc. | 8,000 | 646,480 | ||||||
| Cognizant Technology Solutions | ||||||||
| Corp. — Class A* | 5,031 | 508,030 | ||||||
| Adobe Systems, Inc.* | 8,305 | 497,303 | ||||||
| Micron Technology, Inc.* | 17,480 | 380,365 | ||||||
| Intuit, Inc. | 4,737 | 361,528 | ||||||
| Applied Materials, Inc. | 19,994 | 353,694 | ||||||
| Western Digital Corp. | 3,926 | 329,392 | ||||||
| Seagate Technology plc | 5,421 | 304,443 | ||||||
| Paychex, Inc. | 6,073 | 276,504 | ||||||
| Symantec Corp. | 11,563 | 272,656 | ||||||
| SanDisk Corp. | 3,755 | 264,878 | ||||||
| Analog Devices, Inc. | 5,169 | 263,257 | ||||||
| Broadcom Corp. — Class A | 8,609 | 255,257 | ||||||
| Fiserv, Inc.* | 4,288 | 253,206 | ||||||
| CA, Inc. | 7,495 | 252,207 | ||||||
| NetApp, Inc. | 5,659 | 232,811 | ||||||
| Avago Technologies Ltd. | 4,116 | 217,695 | ||||||
| Check Point Software Technologies Ltd.* | 3,267 | 210,787 | ||||||
| Activision Blizzard, Inc. | 11,559 | 206,097 | ||||||
| Xilinx, Inc. | 4,455 | 204,574 | ||||||
| Citrix Systems, Inc.* | 3,101 | 196,138 | ||||||
| Autodesk, Inc.* | 3,742 | 188,335 | ||||||
| NXP Semiconductor N.V.* | 4,096 | 188,129 | ||||||
| KLA-Tencor Corp. | 2,771 | 178,619 | ||||||
| Linear Technology Corp. | 3,891 | 177,235 | ||||||
| Altera Corp. | 5,335 | 173,548 | ||||||
| NVIDIA Corp. | 9,453 | 151,437 | ||||||
| Equinix, Inc.* | 831 | 147,461 | ||||||
| Akamai Technologies, Inc.* | 2,977 | 140,455 | ||||||
| Maxim Integrated Products, Inc. | 4,699 | 131,149 | ||||||
| F5 Networks, Inc.* | 1,287 | 116,937 | ||||||
| Total Information Technology | 38,218,302 | |||||||
| CONSUMER DISCRETIONARY - 19.3% | ||||||||
| Amazon.com, Inc.* | 7,605 | 3,032,798 | ||||||
| Comcast Corp. — Class A | 35,501 | 1,844,810 | ||||||
| Priceline.com, Inc.* | 854 | 992,690 | ||||||
| Starbucks Corp. | 12,523 | 981,678 | ||||||
| Twenty-First Century Fox, Inc. — Class A | 24,650 | 867,187 | ||||||
| DIRECTV* | 8,729 | 603,087 | ||||||
| Viacom, Inc. — Class B | 6,565 | 573,387 | ||||||
| Netflix, Inc.* | 984 | 362,279 | ||||||
| Sirius XM Holdings, Inc.* | 101,966 | 355,861 | ||||||
| Liberty Global plc — Class A* | 3,678 | 327,305 | ||||||
| Wynn Resorts Ltd. | 1,678 | 325,884 | ||||||
| Tesla Motors, Inc.*,1 | 2,036 | 306,174 | ||||||
| Bed Bath & Beyond, Inc.* | 3,567 | 286,430 | ||||||
| Ross Stores, Inc. | 3,598 | 269,598 | ||||||
| Mattel, Inc. | 5,628 | 267,780 | ||||||
| Liberty Media Corp. — Class A* | 1,730 | 253,358 | ||||||
| Marriott International, Inc. — Class A | 4,982 | 245,912 | ||||||
| Charter Communications, Inc. — Class A* | 1,734 | 237,142 | ||||||
| Liberty Interactive Corp. — Class A* | 7,970 | 233,920 | ||||||
| O’Reilly Automotive, Inc.* | 1,788 | 230,133 | ||||||
| Discovery Communications, Inc. — Class A* | 2,437 | 220,354 | ||||||
| DISH Network Corp. — Class A* | 3,645 | 211,118 | ||||||
| Dollar Tree, Inc.* | 3,460 | 195,213 | ||||||
| Tractor Supply Co. | 2,320 | 179,986 | ||||||
| TripAdvisor, Inc.* | 2,151 | 178,167 | ||||||
| Staples, Inc. | 10,864 | 172,629 | ||||||
| Garmin Ltd.1 | 3,248 | 150,123 | ||||||
| Expedia, Inc. | 1,952 | 135,976 | ||||||
| Total Consumer Discretionary | 14,040,979 | |||||||
| HEALTH CARE - 12.5% | ||||||||
| Gilead Sciences, Inc.* | 25,488 | 1,915,424 | ||||||
| Amgen, Inc. | 12,534 | 1,430,881 | ||||||
| Celgene Corp.* | 6,852 | 1,157,714 | ||||||
| Biogen Idec, Inc.* | 3,921 | 1,096,900 | ||||||
| Express Scripts Holding Co.* | 13,393 | 940,725 | ||||||
| Regeneron Pharmaceuticals, Inc.* | 1,618 | 445,338 | ||||||
| Alexion Pharmaceuticals, Inc.* | 3,255 | 433,110 | ||||||
| Cerner Corp.* | 5,702 | 317,829 | ||||||
| Vertex Pharmaceuticals, Inc.* | 3,887 | 288,804 | ||||||
| Mylan, Inc.* | 6,367 | 276,328 | ||||||
| Intuitive Surgical, Inc.* | 633 | 243,123 | ||||||
| Illumina, Inc.* | 2,099 | 232,191 | ||||||
| Catamaran Corp.* | 3,426 | 162,666 | ||||||
| Henry Schein, Inc.* | 1,422 | 162,478 | ||||||
| Total Health Care | 9,103,511 | |||||||
| CONSUMER STAPLES - 4.3% | ||||||||
| Mondelez International, Inc. — Class A | 29,144 | 1,028,783 | ||||||
| Costco Wholesale Corp. | 7,265 | 864,608 | ||||||
| Kraft Foods Group, Inc. | 9,898 | 533,700 | ||||||
| Whole Foods Market, Inc. | 6,185 | 357,679 | ||||||
| Monster Beverage Corp.* | 2,786 | 188,807 | ||||||
| Green Mountain Coffee Roasters, Inc.*,1 | 2,479 | 187,363 | ||||||
| Total Consumer Staples | 3,160,940 | |||||||
| INDUSTRIALS - 1.7% | ||||||||
| PACCAR, Inc. | 5,887 | 348,333 | ||||||
| Fastenal Co. | 4,928 | 234,129 | ||||||
| Verisk Analytics, Inc. — Class A* | 2,794 | 183,622 | ||||||
| Stericycle, Inc.* | 1,427 | 165,775 | ||||||
| Expeditors International of | ||||||||
| Washington, Inc. | 3,414 | 151,070 | ||||||
| C.H. Robinson Worldwide, Inc. | 2,521 | 147,075 | ||||||
| Total Industrials | 1,230,004 | |||||||
| 30 | the RYDEX FUNDS ANNUAL REPORT | See Notes to Financial Statements. |
| SCHEDULE OF INVESTMENTS (concluded) | December 31, 2013 |
| NASDAQ-100® FUND |
| Shares | Value | |||||||
| TELECOMMUNICATION SERVICES - 1.6% | ||||||||
| Vodafone Group plc ADR | 16,408 | $ | 644,999 | |||||
| VimpelCom Ltd. ADR | 27,460 | 355,332 | ||||||
| SBA Communications Corp. — Class A* | 2,131 | 191,449 | ||||||
| Total Telecommunication Services | 1,191,780 | |||||||
| Materials - 0.3% | ||||||||
| Sigma-Aldrich Corp. | 1,987 | 186,798 | ||||||
| Total Common Stocks | ||||||||
| (Cost $42,487,005) | 67,132,314 | |||||||
| Face | ||||||||
| Amount | ||||||||
| REPURCHASE AGREEMENTS††,2 - 3.6% | ||||||||
| Credit Suisse Group | ||||||||
| issued 12/31/13 at 0.00% | ||||||||
| due 01/02/143 | $ | 789,215 | 789,215 | |||||
| Deutsche Bank | ||||||||
| issued 12/31/13 at 0.01% | ||||||||
| due 01/02/14 | 612,701 | 612,701 | ||||||
| HSBC Group | ||||||||
| issued 12/31/13 at 0.01% | ||||||||
| due 01/02/14 | 612,701 | 612,701 | ||||||
| Mizuho Financial Group, Inc. | ||||||||
| issued 12/31/13 at 0.01% | ||||||||
| due 01/02/14 | 609,929 | 609,929 | ||||||
| Total Repurchase Agreements | ||||||||
| (Cost $2,624,546) | 2,624,546 | |||||||
| SECURITIES LENDING COLLATERAL††,4 - 0.7% | ||||||||
| Repurchase Agreements | ||||||||
| HSBC Securities, Inc. | ||||||||
| issued 12/31/13 at 0.01% | ||||||||
| due 01/02/14 | 414,568 | 414,568 | ||||||
| Deutsche Bank Securities, Inc. | ||||||||
| issued 12/31/13 at 0.02% | ||||||||
| due 01/02/14 | 61,107 | 61,107 | ||||||
| Total Securities Lending Collateral | ||||||||
| (Cost $475,675) | 475,675 | |||||||
| Total Investments - 96.5% | ||||||||
| (Cost $45,587,226) | $ | 70,232,535 | ||||||
| Other Assets & Liabilities, net - 3.5% | 2,577,432 | |||||||
| Total Net Assets - 100.0% | $ | 72,809,967 | ||||||
| Unrealized | ||||||||
| Contracts | Gain | |||||||
| EQUITY FUTURES CONTRACTS PURCHASED† | ||||||||
| March 2014 NASDAQ-100 Index | ||||||||
| Mini Futures Contracts | ||||||||
| (Aggregate Value of | ||||||||
| Contracts $3,589,000) | 50 | $ | 1,247 | |||||
| Units | ||||||||
| EQUITY INDEX SWAP AGREEMENTS†† | ||||||||
| Goldman Sachs International | ||||||||
| January 2014 NASDAQ-100 Index Swap, | ||||||||
| Terminating 01/28/145 | ||||||||
| (Notional Value $1,291,915) | 360 | $ | 5,550 | |||||
| Credit Suisse Capital, LLC | ||||||||
| January 2014 NASDAQ-100 Index Swap, | ||||||||
| Terminating 01/28/145 | ||||||||
| (Notional Value $636,204) | 177 | 1,425 | ||||||
| Barclays Bank plc | ||||||||
| January 2014 NASDAQ-100 Index Swap, | ||||||||
| Terminating 01/31/145 | ||||||||
| (Notional Value $142,964) | 40 | 869 | ||||||
| (Total Notional Value | ||||||||
| $2,071,083) | $ | 7,844 | ||||||
| * | Non-income producing security. |
| † †† | Value determined based on Level 1 inputs — See Note 4. Value determined based on Level 2 inputs — See Note 4. |
| 1 | All or portion of this security is on loan at December 31, 2013 — See Note 10. |
| 2 | Repurchase Agreements — See Note 5. |
| 3 | All or a portion of this security is pledged as equity index swap collateral at December 31, 2013. |
| 4 | Securities lending collateral — See Note 10. |
| 5 | Total Return based on NASDAQ-100 Index +/- financing at a variable rate. | |
| ADR — American Depositary Receipt | ||
| plc — Public Limited Company |
| See Notes to Financial Statements. | THe RYDEX FUNDS ANNUAL REPORT | 31 |
| NASDAQ-100® FUND |
| STATEMENT OF ASSETS |
| AND LIABILITIES |
December 31, 2013
| Assets: | ||||
| Investments, at value - including $462,126 of securities loaned | ||||
| (cost $42,487,005) | $ | 67,132,314 | ||
| Repurchase agreements, at value | ||||
| (cost $3,100,221) | 3,100,221 | |||
| Total investments | ||||
| (cost $45,587,226) | 70,232,535 | |||
| Unrealized appreciation on swap agreements | 7,844 | |||
| Receivable for swap settlement | 1,033 | |||
| Receivables: | ||||
| Securities sold | 5,020,232 | |||
| Fund shares sold | 40,173 | |||
| Dividends | 37,550 | |||
| Variation margin | 1,246 | |||
| Interest and securities lending income | 629 | |||
| Foreign taxes reclaim | 283 | |||
| Total assets | 75,341,525 | |||
| Liabilities: | ||||
| Payable for: | ||||
| Fund shares redeemed | 1,901,556 | |||
| Upon return of securities loaned | 475,675 | |||
| Management fees | 42,945 | |||
| Transfer agent and administrative fees | 14,315 | |||
| Investor service fees | 14,315 | |||
| Portfolio accounting fees | 5,726 | |||
| Miscellaneous | 77,026 | |||
| Total liabilities | 2,531,558 | |||
| Net assets | $ | 72,809,967 | ||
| Net assets consist of: | ||||
| Paid in capital | $ | 46,028,388 | ||
| Undistributed net investment income | 8,145 | |||
| Accumulated net realized gain on investments | 2,119,034 | |||
| Net unrealized appreciation on investments | 24,654,400 | |||
| Net assets | $ | 72,809,967 | ||
| Capital shares outstanding | 2,397,111 | |||
| Net asset value per share | $ | 30.37 |
| STATEMENT OF |
| OPERATIONS |
Year Ended December 31, 2013
| Investment Income: | ||||
| Dividends (net of foreign withholding tax of $284) | $ | 606,801 | ||
| Interest | 2,747 | |||
| Income from securities lending, net | 2,020 | |||
| Total investment income | 611,568 | |||
| Expenses: | ||||
| Management fees | 378,961 | |||
| Transfer agent and administrative fees | 126,321 | |||
| Investor service fees | 126,321 | |||
| Portfolio accounting fees | 50,528 | |||
| Professional fees | 44,513 | |||
| Custodian fees | 5,622 | |||
| Trustees’ fees* | 5,345 | |||
| Line of credit interest expense | 32 | |||
| Miscellaneous | 57,272 | |||
| Total expenses | 794,915 | |||
| Net investment loss | (183,347 | ) | ||
| Net Realized and Unrealized Gain (Loss): | ||||
| Net realized gain (loss) on: | ||||
| Investments | 8,299,825 | |||
| Swap agreements | 2,797,431 | |||
| Futures contracts | 167,418 | |||
| Net realized gain | 11,264,674 | |||
| Net change in unrealized appreciation (depreciation) on: | ||||
| Investments | 4,684,102 | |||
| Swap agreements | (44,832 | ) | ||
| Futures contracts | 1,525 | |||
| Net change in unrealized appreciation (depreciation) | 4,640,795 | |||
| Net realized and unrealized gain | 15,905,469 | |||
| Net increase in net assets resulting from operations | $ | 15,722,122 |
* Relates to Trustees not deemed “interested persons” within the meaning of Section 2(a)(19) of the 1940 Act.
| 32 | the RYDEX FUNDS ANNUAL REPORT | See Notes to Financial Statements. |
| NASDAQ-100® FUND |
STATEMENTS OF CHANGES IN NET ASSETS
| Year Ended | Year Ended | |||||||
| December 31, | December 31, | |||||||
| 2013 | 2012 | |||||||
| Increase (Decrease) In Net Assets From Operations: | ||||||||
| Net investment loss | $ | (183,347 | ) | $ | (182,098 | ) | ||
| Net realized gain on investments | 11,264,674 | 3,462,466 | ||||||
| Net change in unrealized appreciation (depreciation) on investments | 4,640,795 | 4,327,964 | ||||||
| Net increase in net assets resulting from operations | 15,722,122 | 7,608,332 | ||||||
| Capital share transactions: | ||||||||
| Proceeds from sale of shares | 205,795,109 | 199,053,673 | ||||||
| Cost of shares redeemed | (187,753,913 | ) | (211,735,302 | ) | ||||
| Net increase (decrease) from capital share transactions | 18,041,196 | (12,681,629 | ) | |||||
| Net increase (decrease) in net assets | 33,763,318 | (5,073,297 | ) | |||||
| Net assets: | ||||||||
| Beginning of year | 39,046,649 | 44,119,946 | ||||||
| End of year | $ | 72,809,967 | $ | 39,046,649 | ||||
| Undistributed net investment income at end of year | $ | 8,145 | $ | 6,491 | ||||
| Capital share activity: | ||||||||
| Shares sold | 7,838,056 | 8,894,809 | ||||||
| Shares redeemed | (7,171,304 | ) | (9,447,529 | ) | ||||
| Net increase (decrease) in shares | 666,752 | (552,720 | ) | |||||
| See Notes to Financial Statements. | THE RYDEX FUNDS ANNUAL REPORT | 33 |
| NASDAQ-100® FUND |
FINANCIAL HIGHLIGHTS
This table is presented to show selected data for a share outstanding throughout each period and to assist shareholders in evaluating a Fund’s performance for the periods presented.
| Year Ended | Year Ended | Year Ended | Year Ended | Year Ended | ||||||||||||||||
| December 31, | December 31, | December 31, | December 31, | December 31, | ||||||||||||||||
| 2013 | 2012 | 2011 | 2010 | 2009 | ||||||||||||||||
| Per Share Data | ||||||||||||||||||||
| Net asset value, beginning of period | $ | 22.57 | $ | 19.32 | $ | 18.91 | $ | 15.96 | $ | 10.50 | ||||||||||
| Income (loss) from investment operations: | ||||||||||||||||||||
| Net investment lossa | (.09 | ) | (.08 | ) | (.19 | ) | (.14 | ) | (.12 | ) | ||||||||||
| Net gain on investments (realized and unrealized) | 7.89 | 3.33 | .60 | 3.09 | 5.58 | |||||||||||||||
| Total from investment operations | 7.80 | 3.25 | .41 | 2.95 | 5.46 | |||||||||||||||
| Net asset value, end of period | $ | 30.37 | $ | 22.57 | $ | 19.32 | $ | 18.91 | $ | 15.96 | ||||||||||
| Total Returnb | 34.62 | % | 16.77 | % | 2.17 | % | 18.48 | % | 52.00 | % | ||||||||||
| Ratios/Supplemental Data | ||||||||||||||||||||
| Net assets, end of period (in thousands) | $ | 72,810 | $ | 39,047 | $ | 44,120 | $ | 55,295 | $ | 57,542 | ||||||||||
| Ratios to average net assets: | ||||||||||||||||||||
| Net investment loss | (0.36 | %) | (0.34 | %) | (0.98 | %) | (0.85 | %) | (0.94 | %) | ||||||||||
| Total expenses | 1.57 | % | 1.61 | % | 1.64 | % | 1.59 | % | 1.59 | % | ||||||||||
| Portfolio turnover rate | 186 | % | 77 | % | 68 | % | 49 | % | 59 | % | ||||||||||
a Net investment loss per share was computed using average shares outstanding throughout the period.
b Total return does not reflect the impact of any additional fees charged by insurance companies.
| 34 | the RYDEX FUNDS ANNUAL REPORT | See Notes to Financial Statements. |
This page intentionally left blank.
| the RYDEX FUNDS ANNUAL REPORT | 35 |
| PERFORMANCE REPORT AND FUND PROFILE (Unaudited) | December 31, 2013 |
INVERSE NASDAQ-100® STRATEGY FUND
OBJECTIVE: Seeks to provide investment results that match, before fees and expenses, the performance of a specific benchmark on a daily basis. The Fund’s current benchmark is the inverse (opposite) of the performance of the NASDAQ-100® Index (the “underlying index”). The Fund does not seek to achieve its investment objective over a period of time greater than one day.
For the year ended December 31, 2013, with the NASDAQ-100 Index up 36.92%, the Inverse NASDAQ-100® Strategy Fund returned -29.05%. For the year ended December 31, 2013, Inverse NASDAQ-100® Strategy Fund maintained a daily correlation of over 99% to its benchmark of -100% of the daily price movement of the NASDAQ-100 Index.
Information Technology and Consumer Discretionary contributed most to performance of the underlying index during the year. No sector detracted, but Materials contributed least to return, followed by Telecommunication Services.
Google, Inc. — Class A, Microsoft Corp. and Amazon.com, Inc. contributed most to performance of the underlying index for the year. The stocks detracting most from performance of the underlying index for the year were Oracle Corp., Intuitive Surgical, Inc. and Nuance Communications, Inc.
Derivatives in the Fund were used to help provide exposure to the composition of the benchmark in the highest efficient manner and not for hedging purposes.
Due to the compounding of daily returns, leveraged and inverse funds’ returns over periods other than one day will likely differ in amount and possibly direction from the benchmark return for the same period. Investors should monitor their leveraged and inverse funds’ holdings to ensure that they are consistent with their strategies, as frequently as daily.
The effects of compounding may cause the longer-term correlation of the fund to its benchmark to diminish. The apparent discrepancy between the leveraged and unleveraged indices is the result of compounding, which is described briefly on page 6 of this report.
Performance displayed represents past performance, which is no guarantee of future results.
Holdings Diversification (Market Exposure as % of Net Assets)

“Holdings Diversification (Market Exposure as % of Net Assets)” excludes any temporary cash investments.
Inception Date: May 21, 2001
The Fund invests principally in derivative investments such as swap agreements and futures contracts.
| 36 | the RYDEX FUNDS ANNUAL REPORT |
| performance report and FUND PROFILE (Unaudited) (concluded) |
Cumulative Fund Performance*,†

Average Annual Returns
| Periods Ended December 31, 2013*,† | ||||||||||||
| 1 Year | 5 Year | 10 Year | ||||||||||
| Inverse NASDAQ-100® Strategy Fund | -29.05 | % | -24.53 | % | -11.86 | % | ||||||
| NASDAQ-100 Index | 36.92 | % | 25.56 | % | 10.16 | % | ||||||
| * | The performance data above represents past performance that is not predictive of future results. The investment return and principal value of an investment in the Fund will fluctuate so that an investor’s shares, when redeemed, may be worth more or less than their original cost. Returns are historical and include changes in principal and reinvested dividends and capital gains and do not reflect the effect of taxes. The NASDAQ-100 Index is an unmanaged index and, unlike the Fund, has no management fees or operating expenses to reduce its reported return. |
† Returns do not reflect the impact of any additional fees charged by insurance companies.
| the RYDEX FUNDS ANNUAL REPORT | 37 |
| SCHEDULE OF INVESTMENTS | December 31, 2013 |
| INVERSE NASDAQ-100® STRATEGY FUND |
| Face | ||||||||
| Amount | Value | |||||||
| FEDERAL AGENCY DISCOUNT NOTES†† - 40.5% | ||||||||
| Federal Farm Credit Bank1 | ||||||||
| 0.01% due 01/10/14 | $ | 500,000 | $ | 499,999 | ||||
| Federal Home Loan Bank1 | ||||||||
| 0.07% due 02/21/14 | 500,000 | 499,950 | ||||||
| Total Federal Agency Discount Notes | ||||||||
| (Cost $999,949) | 999,949 | |||||||
| REPURCHASE AGREEMENTS††,2 - 51.5% | ||||||||
| Credit Suisse Group | ||||||||
| issued 12/31/13 at 0.00% | ||||||||
| due 01/02/143 | 451,058 | 451,058 | ||||||
| Deutsche Bank | ||||||||
| issued 12/31/13 at 0.01% | ||||||||
| due 01/02/14 | 273,051 | 273,051 | ||||||
| HSBC Group | ||||||||
| issued 12/31/13 at 0.01% | ||||||||
| due 01/02/14 | 273,051 | 273,051 | ||||||
| Mizuho Financial Group, Inc. | ||||||||
| issued 12/31/13 at 0.01% | ||||||||
| due 01/02/14 | 271,816 | 271,816 | ||||||
| Total Repurchase Agreements | ||||||||
| (Cost $1,268,976) | 1,268,976 | |||||||
| Total Investments - 92.0% | ||||||||
| (Cost $2,268,925) | $ | 2,268,925 | ||||||
| Other Assets & Liabilities, net - 8.0% | 197,396 | |||||||
| Total Net Assets - 100.0% | $ | 2,466,321 | ||||||
| Unrealized | ||||||||
| Units | Loss | |||||||
| EQUITY INDEX SWAP AGREEMENTS SOLD SHORT†† | ||||||||
| Credit Suisse Capital, LLC | ||||||||
| January 2014 NASDAQ-100 Index Swap, | ||||||||
| Terminating 01/28/144 | ||||||||
| (Notional Value $225,619) | 63 | $ | (486 | ) | ||||
| Goldman Sachs International | ||||||||
| January 2014 NASDAQ-100 Index Swap, | ||||||||
| Terminating 01/28/144 | ||||||||
| (Notional Value $343,340) | 96 | (768 | ) | |||||
| Barclays Bank plc | ||||||||
| January 2014 NASDAQ-100 Index Swap, | ||||||||
| Terminating 01/31/144 | ||||||||
| (Notional Value $1,904,721) | 530 | (11,613 | ) | |||||
| (Total Notional Value | ||||||||
| $2,473,680) | $ | (12,867 | ) | |||||
| †† | Value determined based on Level 2 inputs — See Note 4. |
| 1 | The issuer operates under a Congressional charter; its securities are neither issued nor guaranteed by the U.S. Government. |
| 2 | Repurchase Agreements — See Note 5. |
| 3 | All or a portion of this security is pledged as equity index swap collateral at December 31, 2013. | |
| 4 | Total Return based on NASDAQ-100 Index +/- financing at a variable rate. | |
| plc — Public Limited Company |
| 38 | the RYDEX FUNDS ANNUAL REPORT | See Notes to Financial Statements. |
| INVERSE NASDAQ-100® STRATEGY FUND |
STATEMENT OF ASSETS
AND LIABILITIES
December 31, 2013
| Assets: | ||||
| Investments, at value | ||||
| (cost $999,949) | $ | 999,949 | ||
| Repurchase agreements, at value | ||||
| (cost $1,268,976) | 1,268,976 | |||
| Total investments | ||||
| (cost $2,268,925) | 2,268,925 | |||
| Segregated cash with broker | 263,143 | |||
| Receivables: | ||||
| Fund shares sold | 11,747 | |||
| Swap settlement | 8,430 | |||
| Total assets | 2,552,245 | |||
| Liabilities: | �� | |||
| Unrealized depreciation on swap agreements | 12,867 | |||
| Payable for: | ||||
| Fund shares redeemed | 61,669 | |||
| Management fees | 2,126 | |||
| Transfer agent and administrative fees | 590 | |||
| Investor service fees | 590 | |||
| Swap settlement | 523 | |||
| Portfolio accounting fees | 236 | |||
| Miscellaneous | 7,323 | |||
| Total liabilities | 85,924 | |||
| Net Assets | $ | 2,466,321 | ||
| Net Assets consist of: | ||||
| Paid in capital | $ | 6,043,779 | ||
| Accumulated net investment loss | (1 | ) | ||
| Accumulated net realized loss on investments | (3,564,590 | ) | ||
| Net unrealized depreciation on investments | (12,867 | ) | ||
| Net assets | $ | 2,466,321 | ||
| Capital shares outstanding† | 80,456 | |||
| Net asset value per share† | $ | 30.65 |
STATEMENT OF
OPERATIONS
Year ended December 31, 2013
| Investment income: | ||||
| Interest | $ | 2,450 | ||
| Total investment income | 2,450 | |||
| Expenses: | ||||
| Management fees | 41,168 | |||
| Transfer agent and administrative fees | 11,435 | |||
| Investor service fees | 11,435 | |||
| Portfolio accounting fees | 4,574 | |||
| Professional fees | 4,297 | |||
| Trustees’ fees* | 697 | |||
| Custodian fees | 503 | |||
| Miscellaneous | 5,079 | |||
| Total expenses | 79,188 | |||
| Net investment loss | (76,738 | ) | ||
| Net Realized And Unrealized Gain (loss): | ||||
| Net realized gain (loss) on: | ||||
| Swap agreements | (1,352,343 | ) | ||
| Futures contracts | (246,602 | ) | ||
| Net realized loss | (1,598,945 | ) | ||
| Net change in unrealized appreciation (depreciation) on: | ||||
| Investments | (24 | ) | ||
| Swap agreements | 81,795 | |||
| Futures contracts | (11,522 | ) | ||
| Net change in unrealized appreciation (depreciation) | 70,249 | |||
| Net realized and unrealized loss | (1,528,696 | ) | ||
| Net decrease in net assets resulting from operations | $ | (1,605,434 | ) |
† Reverse share split — The shares outstanding and net asset value per share have been restated to reflect a 1:5 reverse share split effective January 24, 2014. See Note 13 in Notes to Financial Statements.
* Relates to Trustees not deemed “interested persons” within the meaning of Section 2(a)(19) of the 1940 Act.
| See Notes to Financial Statements. | THE RYDEX FUNDS ANNUAL REPORT | 39 |
| INVERSE NASDAQ-100® STRATEGY FUND |
| STATEMENTS OF CHANGES IN NET ASSETS |
| Year Ended | Year Ended | |||||||
| December 31, | December 31, | |||||||
| 2013 | 2012 | |||||||
| Increase (Decrease) In Net Assets From Operations: | ||||||||
| Net investment loss | $ | (76,738 | ) | $ | (111,886 | ) | ||
| Net realized loss on investments | (1,598,945 | ) | (682,523 | ) | ||||
| Net change in unrealized appreciation (depreciation) on investments | 70,249 | (107,666 | ) | |||||
| Net decrease in net assets resulting from operations | (1,605,434 | ) | (902,075 | ) | ||||
| Capital share transactions: | ||||||||
| Proceeds from sale of shares | 82,085,341 | 129,937,665 | ||||||
| Cost of shares redeemed | (84,819,355 | ) | (129,653,115 | ) | ||||
| Net increase (decrease) from capital share transactions | (2,734,014 | ) | 284,550 | |||||
| Net decrease in net assets | (4,339,448 | ) | (617,525 | ) | ||||
| Net assets: | ||||||||
| Beginning of year | 6,805,769 | 7,423,294 | ||||||
| End of year | $ | 2,466,321 | $ | 6,805,769 | ||||
| Accumulated net investment loss at end of year | $ | (1 | ) | $ | (1 | ) | ||
| Capital share activity:* | ||||||||
| Shares sold | 2,213,686 | 2,908,908 | ||||||
| Shares redeemed | (2,290,743 | ) | (2,891,170 | ) | ||||
| Net increase (decrease) in shares | (77,057 | ) | 17,738 | |||||
| * | Reverse share split — Capital share activity for the years ended December 31, 2013 and 2012 have been restated to reflect a 1:5 reverse share split effective January 24, 2014. See Note 13 in Notes to Financial Statements. |
| 40 | the RYDEX FUNDS ANNUAL REPORT | See Notes to Financial Statements. |
| INVERSE NASDAQ-100® STRATEGY FUND |
| FINANCIAL HIGHLIGHTS |
This table is presented to show selected data for a share outstanding throughout each period and to assist shareholders in evaluating a Fund’s performance for the periods presented.
| Year Ended | Year Ended | Year Ended | Year Ended | Year Ended | ||||||||||||||||
| December 31, | December 31, | December 31, | December 31, | December 31, | ||||||||||||||||
| 2013c | 2012c | 2011c | 2010c | 2009c | ||||||||||||||||
| Per Share Data | ||||||||||||||||||||
| Net asset value, beginning of period | $ | 43.21 | $ | 53.11 | $ | 59.05 | $ | 75.01 | $ | 125.27 | ||||||||||
| Income (loss) from investment operations: | ||||||||||||||||||||
| Net investment lossa | (.65 | ) | (.75 | ) | (.95 | ) | (1.10 | ) | (1.55 | ) | ||||||||||
| Net loss on investments (realized and unrealized) | (11.91 | ) | (9.15 | ) | (4.99 | ) | (14.86 | ) | (48.61 | ) | ||||||||||
| Total from investment operations | (12.56 | ) | (9.90 | ) | (5.94 | ) | (15.96 | ) | (50.16 | ) | ||||||||||
| Less distributions from: | ||||||||||||||||||||
| Net investment income | — | — | — | — | (.10 | ) | ||||||||||||||
| Total distributions | — | — | — | — | (.10 | ) | ||||||||||||||
| Net asset value, end of period | $ | 30.65 | $ | 43.21 | $ | 53.11 | $ | 59.05 | $ | 75.01 | ||||||||||
| Total Returnb | (29.05 | %) | (18.64 | %) | (10.08 | %) | (21.27 | %) | (40.05 | %) | ||||||||||
| Ratios/Supplemental Data | ||||||||||||||||||||
| Net assets, end of period (in thousands) | $ | 2,466 | $ | 6,806 | $ | 7,423 | $ | 7,647 | $ | 14,309 | ||||||||||
| Ratios to average net assets: | ||||||||||||||||||||
| Net investment loss | (1.68 | %) | (1.64 | %) | (1.74 | %) | (1.59 | %) | (1.61 | %) | ||||||||||
| Total expenses | 1.73 | % | 1.76 | % | 1.79 | % | 1.74 | % | 1.75 | % | ||||||||||
| Portfolio turnover rate | — | — | — | — | — | |||||||||||||||
| a | Net investment loss per share was computed using average shares outstanding throughout the period. |
| b | Total return does not reflect the impact of any additional fees charged by insurance companies. |
| c | Reverse share split — Per share amounts for period December 31, 2009 through December 31, 2013 have been restated to reflect a 1:5 reverse share split effective January 24, 2014. See Note 13 in Notes to Financial Statements. |
| See Notes to Financial Statements. | THE RYDEX FUNDS ANNUAL REPORT | 41 |
| PERFORMANCE REPORT AND FUND PROFILE (Unaudited) | December 31, 2013 |
| S&P 500® 2x STRATEGY FUND |
OBJECTIVE: Seeks to provide investment results that match, before fees and expenses, the performance of a specific benchmark on a daily basis. The Fund’s current benchmark is 200% of the performance of the S&P 500® Index (the “underlying index”). The Fund does not seek to achieve its investment objective over a period of time greater than one day.
For the year ended December 31, 2013, S&P 500® 2x Strategy Fund maintained a daily correlation of over 99% to its benchmark of 200% of the daily price movement of the S&P 500 Index. S&P 500® 2x Strategy Fund returned 68.71%, while the S&P 500 Index gained 32.39% over the same time period.
Sectors contributing most to performance of the underlying index were Financials and Health Care. No sectors detracted from performance, but the sectors contributing least were Telecommunications Services and Utilities.
Google, Inc. — Class A, Microsoft Corp. and General Electric Co. contributed most to performance of the underlying index for 2013. Newmont Mining Corp., Intuitive Surgical, Inc. and CenturyLink, Inc. detracted most from performance of the underlying index for the year.
Derivatives in the Fund were used to help provide exposure to the composition of the benchmark in the highest efficient manner and to provide leverage, not for hedging purposes.
Due to the compounding of daily returns, leveraged and inverse funds’ returns over periods other than one day will likely differ in amount and possibly direction from the benchmark return for the same period. Investors should monitor their leveraged and inverse funds’ holdings to ensure that they are consistent with their strategies, as frequently as daily.
The effects of compounding may cause the longer-term correlation of the fund to its benchmark to diminish. The apparent discrepancy between the leveraged and unleveraged indices is the result of compounding, which is described briefly on page 6 of this report.
Performance displayed represents past performance, which is no guarantee of future results.
Holdings Diversification (Market Exposure as % of Net Assets)
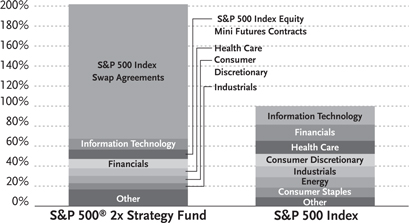
“Holdings Diversification (Market Exposure as % of Net Assets)” excludes any temporary cash investments.
Inception Date: October 1, 2001
| Ten Largest Holdings (% of Total Net Assets) | ||||
| Apple, Inc. | 1.8 | % | ||
| Exxon Mobil Corp. | 1.6 | % | ||
| Google, Inc. — Class A | 1.1 | % | ||
| Microsoft Corp. | 1.0 | % | ||
| General Electric Co. | 1.0 | % | ||
| Johnson & Johnson | 0.9 | % | ||
| Chevron Corp. | 0.8 | % | ||
| Procter & Gamble Co. | 0.8 | % | ||
| JPMorgan Chase & Co. | 0.8 | % | ||
| Wells Fargo & Co. | 0.8 | % | ||
| Top Ten Total | 10.6 | % |
“Ten Largest Holdings” exclude any temporary cash or derivative investments.
| 42 | the RYDEX FUNDS ANNUAL REPORT |
| performance report and FUND PROFILE (Unaudited) (concluded) |
Cumulative Fund Performance*,†
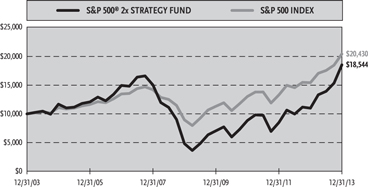
Average Annual Returns
| Periods Ended December 31, 2013*,† | ||||||||||||
| 1 Year | 5 Year | 10 Year | ||||||||||
| S&P 500® 2x Strategy Fund | 68.71 | % | 30.95 | % | 6.37 | % | ||||||
| S&P 500 Index | 32.39 | % | 17.94 | % | 7.41 | % | ||||||
| * | The performance data above represents past performance that is not predictive of future results. The investment return and principal value of an investment in the Fund will fluctuate so that an investor’s shares, when redeemed, may be worth more or less than their original cost. Returns are historical and include changes in principal and reinvested dividends and capital gains and do not reflect the effect of taxes. The S&P 500 Index is an unmanaged index and, unlike the Fund, has no management fees or operating expenses to reduce its reported return. |
† Returns do not reflect the impact of any additional fees charged by insurance companies.
| the RYDEX FUNDS ANNUAL REPORT | 43 |
| SCHEDULE OF INVESTMENTS | December 31, 2013 |
| S&P 500® 2x STRATEGY FUND |
| Shares | Value | |||||||
| COMMON STOCKS† - 57.8% | ||||||||
| Information Technology - 10.7% | ||||||||
| Apple, Inc. | 869 | $ | 487,604 | |||||
| Google, Inc. — Class A* | 266 | 298,109 | ||||||
| Microsoft Corp. | 7,342 | 274,812 | ||||||
| International Business Machines Corp. | 986 | 184,944 | ||||||
| Oracle Corp. | 3,390 | 129,701 | ||||||
| Intel Corp. | 4,802 | 124,660 | ||||||
| QUALCOMM, Inc. | 1,632 | 121,176 | ||||||
| Cisco Systems, Inc. | 5,165 | 115,954 | ||||||
| Visa, Inc. — Class A | 492 | 109,559 | ||||||
| Facebook, Inc. — Class A* | 1,580 | 86,363 | ||||||
| MasterCard, Inc. — Class A | 100 | 83,546 | ||||||
| eBay, Inc.* | 1,126 | 61,806 | ||||||
| Hewlett-Packard Co. | 1,854 | 51,875 | ||||||
| Accenture plc — Class A | 614 | 50,483 | ||||||
| EMC Corp. | 1,988 | 49,997 | ||||||
| Texas Instruments, Inc. | 1,057 | 46,413 | ||||||
| Automatic Data Processing, Inc. | 465 | 37,577 | ||||||
| Yahoo!, Inc.* | 911 | 36,841 | ||||||
| Salesforce.com, Inc.* | 538 | 29,693 | ||||||
| Cognizant Technology Solutions | ||||||||
| Corp. — Class A* | 292 | 29,486 | ||||||
| Adobe Systems, Inc.* | 449 | 26,886 | ||||||
| Corning, Inc. | 1,398 | 24,912 | ||||||
| Micron Technology, Inc.* | 1,017 | 22,130 | ||||||
| TE Connectivity Ltd. | 396 | 21,823 | ||||||
| Intuit, Inc. | 275 | 20,988 | ||||||
| Applied Materials, Inc. | 1,163 | 20,573 | ||||||
| Seagate Technology plc | 311 | 17,466 | ||||||
| Western Digital Corp. | 203 | 17,032 | ||||||
| Symantec Corp. | 672 | 15,846 | ||||||
| Broadcom Corp. — Class A | 521 | 15,448 | ||||||
| SanDisk Corp. | 218 | 15,378 | ||||||
| Analog Devices, Inc. | 298 | 15,177 | ||||||
| Fidelity National Information | ||||||||
| Services, Inc. | 281 | 15,084 | ||||||
| Motorola Solutions, Inc. | 222 | 14,985 | ||||||
| Fiserv, Inc.* | 249 | 14,703 | ||||||
| Paychex, Inc. | 314 | 14,296 | ||||||
| Amphenol Corp. — Class A | 153 | 13,645 | ||||||
| Xerox Corp. | 1,118 | 13,606 | ||||||
| NetApp, Inc. | 329 | 13,535 | ||||||
| Alliance Data Systems Corp.* | 50 | 13,147 | ||||||
| Xilinx, Inc. | 257 | 11,801 | ||||||
| Citrix Systems, Inc.* | 180 | 11,385 | ||||||
| Juniper Networks, Inc.* | 488 | 11,014 | ||||||
| Autodesk, Inc.* | 213 | 10,720 | ||||||
| CA, Inc. | 314 | 10,566 | ||||||
| Linear Technology Corp. | 226 | 10,294 | ||||||
| Red Hat, Inc.* | 183 | 10,255 | ||||||
| KLA-Tencor Corp. | 159 | 10,249 | ||||||
| Altera Corp. | 308 | 10,019 | ||||||
| Western Union Co. | 533 | 9,194 | ||||||
| NVIDIA Corp. | 559 | 8,955 | ||||||
| Lam Research Corp.* | 157 | 8,549 | ||||||
| Microchip Technology, Inc. | 189 | 8,458 | ||||||
| Akamai Technologies, Inc.* | 173 | 8,162 | ||||||
| Computer Sciences Corp. | 142 | 7,935 | ||||||
| VeriSign, Inc.* | 124 | 7,413 | ||||||
| Teradata Corp.* | 157 | 7,142 | ||||||
| Harris Corp. | 102 | 7,121 | ||||||
| Electronic Arts, Inc.* | 295 | 6,767 | ||||||
| F5 Networks, Inc.* | 73 | 6,633 | ||||||
| LSI Corp. | 526 | 5,797 | ||||||
| Total System Services, Inc. | 161 | 5,358 | ||||||
| FLIR Systems, Inc. | 137 | 4,124 | ||||||
| First Solar, Inc.* | 63 | 3,442 | ||||||
| Jabil Circuit, Inc. | 179 | 3,122 | ||||||
| Total Information Technology | 2,961,734 | |||||||
| Financials - 9.4% | ||||||||
| JPMorgan Chase & Co. | 3,631 | 212,340 | ||||||
| Wells Fargo & Co. | 4,631 | 210,246 | ||||||
| Berkshire Hathaway, Inc. — Class B* | 1,739 | 206,176 | ||||||
| Bank of America Corp. | 10,304 | 160,433 | ||||||
| Citigroup, Inc. | 2,930 | 152,682 | ||||||
| American Express Co. | 890 | 80,750 | ||||||
| American International Group, Inc. | 1,422 | 72,593 | ||||||
| Goldman Sachs Group, Inc. | 405 | 71,790 | ||||||
| U.S. Bancorp | 1,764 | 71,266 | ||||||
| MetLife, Inc. | 1,081 | 58,287 | ||||||
| Simon Property Group, Inc. | 300 | 45,648 | ||||||
| Capital One Financial Corp. | 557 | 42,672 | ||||||
| Morgan Stanley | 1,338 | 41,960 | ||||||
| Prudential Financial, Inc. | 447 | 41,222 | ||||||
| PNC Financial Services Group, Inc. | 514 | 39,875 | ||||||
| Bank of New York Mellon Corp. | 1,109 | 38,749 | ||||||
| BlackRock, Inc. — Class A | 118 | 37,344 | ||||||
| ACE Ltd. | 329 | 34,062 | ||||||
| Travelers Companies, Inc. | 352 | 31,870 | ||||||
| State Street Corp. | 424 | 31,117 | ||||||
| American Tower Corp. — Class A | 381 | 30,411 | ||||||
| Aflac, Inc. | 450 | 30,060 | ||||||
| Charles Schwab Corp. | 1,119 | 29,094 | ||||||
| Discover Financial Services | 463 | 25,905 | ||||||
| Marsh & McLennan Companies, Inc. | 530 | 25,631 | ||||||
| BB&T Corp. | 680 | 25,377 | ||||||
| IntercontinentalExchange Group, Inc. | 111 | 24,967 | ||||||
| Aon plc | 291 | 24,412 | ||||||
| Allstate Corp. | 439 | 23,943 | ||||||
| CME Group, Inc. — Class A | 305 | 23,930 | ||||||
| Chubb Corp. | 243 | 23,481 | ||||||
| Franklin Resources, Inc. | 390 | 22,515 | ||||||
| Ameriprise Financial, Inc. | 188 | 21,629 | ||||||
| T. Rowe Price Group, Inc. | 252 | 21,110 | ||||||
| Public Storage | 138 | 20,772 | ||||||
| McGraw Hill Financial, Inc. | 262 | 20,488 | ||||||
| SunTrust Banks, Inc. | 517 | 19,031 | ||||||
| Fifth Third Bancorp | 853 | 17,939 | ||||||
| Prologis, Inc. | 482 | 17,810 | ||||||
| Weyerhaeuser Co. | 562 | 17,742 | ||||||
| Equity Residential | 321 | 16,651 | ||||||
| Ventas, Inc. | 284 | 16,268 | ||||||
| 44 | the RYDEX FUNDS ANNUAL REPORT | See Notes to Financial Statements. |
| SCHEDULE OF INVESTMENTS (continued) | December 31, 2013 |
| S&P 500® 2x STRATEGY FUND |
| Shares | Value | |||||||
| HCP, Inc. | 441 | $ | 16,017 | |||||
| Hartford Financial Services Group, Inc. | 432 | 15,652 | ||||||
| Invesco Ltd. | 424 | 15,434 | ||||||
| Boston Properties, Inc. | 148 | 14,855 | ||||||
| Health Care REIT, Inc. | 277 | 14,839 | ||||||
| M&T Bank Corp. | 126 | 14,669 | ||||||
| Vornado Realty Trust | 164 | 14,562 | ||||||
| Progressive Corp. | 530 | 14,453 | ||||||
| Moody’s Corp. | 183 | 14,360 | ||||||
| Host Hotels & Resorts, Inc. | 733 | 14,250 | ||||||
| Loews Corp. | 295 | 14,231 | ||||||
| AvalonBay Communities, Inc. | 118 | 13,951 | ||||||
| Northern Trust Corp. | 217 | 13,430 | ||||||
| Regions Financial Corp. | 1,331 | 13,164 | ||||||
| Lincoln National Corp. | 253 | 13,060 | ||||||
| Principal Financial Group, Inc. | 263 | 12,969 | ||||||
| KeyCorp | 866 | 11,622 | ||||||
| SLM Corp. | 419 | 11,011 | ||||||
| General Growth Properties, Inc. | 519 | 10,416 | ||||||
| Unum Group | 252 | 8,840 | ||||||
| XL Group plc — Class A | 272 | 8,660 | ||||||
| Leucadia National Corp. | 302 | 8,559 | ||||||
| Comerica, Inc. | 177 | 8,415 | ||||||
| Plum Creek Timber Company, Inc. | 175 | 8,139 | ||||||
| Kimco Realty Corp. | 394 | 7,782 | ||||||
| Macerich Co. | 132 | 7,773 | ||||||
| Huntington Bancshares, Inc. | 802 | 7,739 | ||||||
| Cincinnati Financial Corp. | 142 | 7,437 | ||||||
| Genworth Financial, Inc. — Class A* | 474 | 7,361 | ||||||
| CBRE Group, Inc. — Class A* | 266 | 6,996 | ||||||
| Torchmark Corp. | 87 | 6,799 | ||||||
| E*TRADE Financial Corp.* | 273 | 5,362 | ||||||
| Zions Bancorporation | 178 | 5,333 | ||||||
| People’s United Financial, Inc. | 306 | 4,627 | ||||||
| Assurant, Inc. | 68 | 4,513 | ||||||
| Legg Mason, Inc. | 103 | 4,478 | ||||||
| Hudson City Bancorp, Inc. | 459 | 4,328 | ||||||
| NASDAQ OMX Group, Inc. | 108 | 4,298 | ||||||
| Apartment Investment & | ||||||||
| Management Co. — Class A | 141 | 3,653 | ||||||
| Total Financials | 2,574,285 | |||||||
| Health Care - 7.5% | ||||||||
| Johnson & Johnson | 2,730 | 250,040 | ||||||
| Pfizer, Inc. | 6,261 | 191,773 | ||||||
| Merck & Company, Inc. | 2,823 | 141,291 | ||||||
| Gilead Sciences, Inc.* | 1,481 | 111,296 | ||||||
| Bristol-Myers Squibb Co. | 1,587 | 84,349 | ||||||
| Amgen, Inc. | 729 | 83,223 | ||||||
| AbbVie, Inc. | 1,532 | 80,905 | ||||||
| UnitedHealth Group, Inc. | 973 | 73,268 | ||||||
| Celgene Corp.* | 398 | 67,246 | ||||||
| Biogen Idec, Inc.* | 228 | 63,783 | ||||||
| Abbott Laboratories | 1,494 | 57,264 | ||||||
| Medtronic, Inc. | 964 | 55,324 | ||||||
| Express Scripts Holding Co.* | 778 | 54,647 | ||||||
| Eli Lilly & Co. | 958 | 48,858 | ||||||
| Thermo Fisher Scientific, Inc. | 344 | 38,305 | ||||||
| Baxter International, Inc. | 521 | 36,236 | ||||||
| McKesson Corp. | 221 | 35,670 | ||||||
| Allergan, Inc. | 287 | 31,880 | ||||||
| Covidien plc | 444 | 30,236 | ||||||
| Actavis plc* | 165 | 27,720 | ||||||
| WellPoint, Inc. | 285 | 26,331 | ||||||
| Alexion Pharmaceuticals, Inc.* | 189 | 25,148 | ||||||
| Aetna, Inc. | 355 | 24,349 | ||||||
| Cigna Corp. | 267 | 23,357 | ||||||
| Cardinal Health, Inc. | 330 | 22,047 | ||||||
| Stryker Corp. | 285 | 21,415 | ||||||
| Becton Dickinson and Co. | 187 | 20,662 | ||||||
| Regeneron Pharmaceuticals, Inc.* | 73 | 20,093 | ||||||
| Perrigo Company plc | 129 | 19,796 | ||||||
| Agilent Technologies, Inc. | 317 | 18,129 | ||||||
| St. Jude Medical, Inc. | 283 | 17,532 | ||||||
| Vertex Pharmaceuticals, Inc.* | 223 | 16,569 | ||||||
| Mylan, Inc.* | 370 | 16,058 | ||||||
| Cerner Corp.* | 285 | 15,886 | ||||||
| Zoetis, Inc. | 479 | 15,659 | ||||||
| AmerisourceBergen Corp. — Class A | 222 | 15,609 | ||||||
| Humana, Inc. | 151 | 15,586 | ||||||
| Boston Scientific Corp.* | 1,290 | 15,506 | ||||||
| Zimmer Holdings, Inc. | 162 | 15,097 | ||||||
| Intuitive Surgical, Inc.* | 37 | 14,211 | ||||||
| Forest Laboratories, Inc.* | 224 | 13,447 | ||||||
| Life Technologies Corp.* | 164 | 12,431 | ||||||
| DaVita HealthCare Partners, Inc.* | 168 | 10,646 | ||||||
| C.R. Bard, Inc. | 72 | 9,644 | ||||||
| Waters Corp.* | 82 | 8,200 | ||||||
| CareFusion Corp.* | 204 | 8,123 | ||||||
| Varian Medical Systems, Inc.* | 100 | 7,769 | ||||||
| Laboratory Corporation of America | ||||||||
| Holdings* | 84 | 7,675 | ||||||
| Quest Diagnostics, Inc. | 140 | 7,496 | ||||||
| Edwards Lifesciences Corp.* | 105 | 6,905 | ||||||
| DENTSPLY International, Inc. | 138 | 6,690 | ||||||
| Hospira, Inc.* | 159 | 6,564 | ||||||
| PerkinElmer, Inc. | 104 | 4,288 | ||||||
| Tenet Healthcare Corp.* | 96 | 4,044 | ||||||
| Patterson Companies, Inc. | 81 | 3,337 | ||||||
| Total Health Care | 2,059,613 | |||||||
| Consumer Discretionary - 7.3% | ||||||||
| Amazon.com, Inc.* | 358 | 142,767 | ||||||
| Comcast Corp. — Class A | 2,517 | 130,796 | ||||||
| Walt Disney Co. | 1,579 | 120,636 | ||||||
| Home Depot, Inc. | 1,360 | 111,982 | ||||||
| McDonald’s Corp. | 961 | 93,247 | ||||||
| Twenty-First Century Fox, Inc. — Class A | 1,896 | 66,701 | ||||||
| Time Warner, Inc. | 874 | 60,935 | ||||||
| Ford Motor Co. | 3,814 | 58,850 | ||||||
| Priceline.com, Inc.* | 50 | 58,120 | ||||||
| Starbucks Corp. | 732 | 57,381 | ||||||
| NIKE, Inc. — Class B | 722 | 56,778 | ||||||
| Lowe’s Companies, Inc. | 1,010 | 50,046 | ||||||
| General Motors Co.* | 1,097 | 44,834 | ||||||
| TJX Companies, Inc. | 687 | 43,783 | ||||||
| See Notes to Financial Statements. | THe RYDEX FUNDS ANNUAL REPORT | 45 |
| SCHEDULE OF INVESTMENTS (continued) | December 31, 2013 |
| S&P 500® 2x STRATEGY FUND |
| Shares | Value | |||||||
| Target Corp. | 611 | $ | 38,658 | |||||
| Time Warner Cable, Inc. | 272 | 36,856 | ||||||
| CBS Corp. — Class B | 539 | 34,355 | ||||||
| Viacom, Inc. — Class B | 392 | 34,237 | ||||||
| Johnson Controls, Inc. | 662 | 33,961 | ||||||
| DIRECTV* | 472 | 32,610 | ||||||
| Yum! Brands, Inc. | 430 | 32,512 | ||||||
| Netflix, Inc.* | 57 | 20,986 | ||||||
| VF Corp. | 332 | 20,697 | ||||||
| Discovery Communications, Inc. — | ||||||||
| Class A* | 218 | 19,712 | ||||||
| Macy’s, Inc. | 356 | 19,010 | ||||||
| Omnicom Group, Inc. | 249 | 18,519 | ||||||
| Dollar General Corp.* | 285 | 17,191 | ||||||
| Carnival Corp. | 420 | 16,872 | ||||||
| Bed Bath & Beyond, Inc.* | 207 | 16,622 | ||||||
| Delphi Automotive plc | 269 | 16,175 | ||||||
| Chipotle Mexican Grill, Inc. — Class A* | 30 | 15,983 | ||||||
| AutoZone, Inc.* | 33 | 15,772 | ||||||
| Ross Stores, Inc. | 208 | 15,585 | ||||||
| Mattel, Inc. | 327 | 15,559 | ||||||
| Wynn Resorts Ltd. | 78 | 15,149 | ||||||
| Coach, Inc. | 269 | 15,099 | ||||||
| Harley-Davidson, Inc. | 214 | 14,817 | ||||||
| Starwood Hotels & Resorts | ||||||||
| Worldwide, Inc. | 185 | 14,698 | ||||||
| L Brands, Inc. | 236 | 14,597 | ||||||
| Michael Kors Holdings Ltd.* | 170 | 13,802 | ||||||
| O’Reilly Automotive, Inc.* | 103 | 13,257 | ||||||
| Genuine Parts Co. | 149 | 12,395 | ||||||
| BorgWarner, Inc. | 219 | 12,244 | ||||||
| Whirlpool Corp. | 76 | 11,921 | ||||||
| Dollar Tree, Inc.* | 199 | 11,228 | ||||||
| Kohl’s Corp. | 194 | 11,010 | ||||||
| PVH Corp. | 79 | 10,746 | ||||||
| Marriott International, Inc. — Class A | 217 | 10,711 | ||||||
| Best Buy Company, Inc. | 264 | 10,528 | ||||||
| CarMax, Inc.* | 216 | 10,156 | ||||||
| Staples, Inc. | 638 | 10,138 | ||||||
| The Gap, Inc. | 256 | 10,004 | ||||||
| Ralph Lauren Corp. — Class A | 56 | 9,888 | ||||||
| Tiffany & Co. | 106 | 9,835 | ||||||
| Wyndham Worldwide Corp. | 126 | 9,285 | ||||||
| Scripps Networks Interactive, | ||||||||
| Inc. — Class A | 104 | 8,987 | ||||||
| Mohawk Industries, Inc.* | 60 | 8,934 | ||||||
| Newell Rubbermaid, Inc. | 274 | 8,880 | ||||||
| TripAdvisor, Inc.* | 107 | 8,863 | ||||||
| News Corp. — Class A* | 481 | 8,668 | ||||||
| Nordstrom, Inc. | 138 | 8,528 | ||||||
| H&R Block, Inc. | 262 | 7,608 | ||||||
| PetSmart, Inc. | 100 | 7,275 | ||||||
| Interpublic Group of Companies, Inc. | 402 | 7,115 | ||||||
| Expedia, Inc. | 99 | 6,896 | ||||||
| Darden Restaurants, Inc. | 126 | 6,851 | ||||||
| PulteGroup, Inc. | 333 | 6,783 | ||||||
| Gannett Company, Inc. | 218 | 6,448 | ||||||
| Lennar Corp. — Class A | 162 | 6,409 | ||||||
| Hasbro, Inc. | 112 | 6,161 | ||||||
| D.R. Horton, Inc. | 275 | 6,138 | ||||||
| Family Dollar Stores, Inc. | 93 | 6,042 | ||||||
| Goodyear Tire & Rubber Co. | 239 | 5,700 | ||||||
| Fossil Group, Inc.* | 47 | 5,637 | ||||||
| Garmin Ltd. | 119 | 5,500 | ||||||
| GameStop Corp. — Class A | 111 | 5,468 | ||||||
| Harman International Industries, Inc. | 63 | 5,157 | ||||||
| International Game Technology | 240 | 4,358 | ||||||
| Leggett & Platt, Inc. | 136 | 4,208 | ||||||
| Urban Outfitters, Inc.* | 105 | 3,896 | ||||||
| Cablevision Systems Corp. — Class A | 206 | 3,694 | ||||||
| AutoNation, Inc.* | 62 | 3,081 | ||||||
| Graham Holdings Co. — Class B | 3 | 1,990 | ||||||
| Total Consumer Discretionary | 1,995,511 | |||||||
| Industrials - 6.3% | ||||||||
| General Electric Co. | 9,774 | 273,964 | ||||||
| United Technologies Corp. | 815 | 92,746 | ||||||
| Boeing Co. | 668 | 91,175 | ||||||
| 3M Co. | 618 | 86,675 | ||||||
| Union Pacific Corp. | 445 | 74,760 | ||||||
| United Parcel Service, Inc. — Class B | 691 | 72,610 | ||||||
| Honeywell International, Inc. | 758 | 69,258 | ||||||
| Caterpillar, Inc. | 615 | 55,849 | ||||||
| Emerson Electric Co. | 680 | �� | 47,723 | |||||
| Danaher Corp. | 578 | 44,622 | ||||||
| FedEx Corp. | 287 | 41,262 | ||||||
| Lockheed Martin Corp. | 260 | 38,652 | ||||||
| Precision Castparts Corp. | 140 | 37,702 | ||||||
| Eaton Corporation plc | 456 | 34,711 | ||||||
| Deere & Co. | 368 | 33,609 | ||||||
| Illinois Tool Works, Inc. | 394 | 33,128 | ||||||
| General Dynamics Corp. | 323 | 30,863 | ||||||
| CSX Corp. | 979 | 28,166 | ||||||
| Raytheon Co. | 309 | 28,026 | ||||||
| Norfolk Southern Corp. | 298 | 27,663 | ||||||
| Northrop Grumman Corp. | 214 | 24,527 | ||||||
| Cummins, Inc. | 164 | 23,119 | ||||||
| Delta Air Lines, Inc. | 826 | 22,691 | ||||||
| PACCAR, Inc. | 342 | 20,236 | ||||||
| Waste Management, Inc. | 419 | 18,801 | ||||||
| Parker Hannifin Corp. | 144 | 18,524 | ||||||
| Tyco International Ltd. | 449 | 18,427 | ||||||
| Ingersoll-Rand plc | 259 | 15,954 | ||||||
| Rockwell Automation, Inc. | 134 | 15,833 | ||||||
| Dover Corp. | 163 | 15,736 | ||||||
| Pentair Ltd. | 193 | 14,990 | ||||||
| W.W. Grainger, Inc. | 58 | 14,814 | ||||||
| Roper Industries, Inc. | 96 | 13,313 | ||||||
| Southwest Airlines Co. | 673 | 12,679 | ||||||
| Kansas City Southern | 102 | 12,631 | ||||||
| Fluor Corp. | 157 | 12,605 | ||||||
| Fastenal Co. | 264 | 12,543 | ||||||
| AMETEK, Inc. | 236 | 12,430 | ||||||
| Stanley Black & Decker, Inc. | 150 | 12,104 | ||||||
| Nielsen Holdings N.V. | 244 | 11,197 | ||||||
| 46 | the RYDEX FUNDS ANNUAL REPORT | See Notes to Financial Statements. |
| SCHEDULE OF INVESTMENTS (continued) | December 31, 2013 | |
| S&P 500® 2x STRATEGY FUND |
| Shares | Value | |||||||
| Flowserve Corp. | 135 | $ | 10,642 | |||||
| Textron, Inc. | 272 | 9,999 | ||||||
| Rockwell Collins, Inc. | 131 | 9,684 | ||||||
| Stericycle, Inc.* | 83 | 9,642 | ||||||
| L-3 Communications Holdings, Inc. | 86 | 9,190 | ||||||
| Pall Corp. | 104 | 8,876 | ||||||
| Expeditors International of | ||||||||
| Washington, Inc. | 197 | 8,717 | ||||||
| Republic Services, Inc. — Class A | 261 | 8,665 | ||||||
| C.H. Robinson Worldwide, Inc. | 146 | 8,518 | ||||||
| Jacobs Engineering Group, Inc.* | 127 | 8,000 | ||||||
| Equifax, Inc. | 114 | 7,876 | ||||||
| Masco Corp. | 345 | 7,856 | ||||||
| ADT Corp. | 193 | 7,811 | ||||||
| Quanta Services, Inc.* | 205 | 6,470 | ||||||
| Xylem, Inc. | 178 | 6,159 | ||||||
| Joy Global, Inc. | 103 | 6,024 | ||||||
| Snap-on, Inc. | 55 | 6,024 | ||||||
| Cintas Corp. | 97 | 5,780 | ||||||
| Robert Half International, Inc. | 134 | 5,627 | ||||||
| Iron Mountain, Inc. | 162 | 4,917 | ||||||
| Dun & Bradstreet Corp. | 37 | 4,542 | ||||||
| Pitney Bowes, Inc. | 194 | 4,520 | ||||||
| Allegion plc* | 83 | 3,682 | ||||||
| Ryder System, Inc. | 48 | 3,541 | ||||||
| Total Industrials | 1,739,080 | |||||||
| Energy - 5.9% | ||||||||
| Exxon Mobil Corp. | 4,220 | 427,064 | ||||||
| Chevron Corp. | 1,858 | 232,083 | ||||||
| Schlumberger Ltd. | 1,272 | 114,620 | ||||||
| ConocoPhillips | 1,183 | 83,578 | ||||||
| Occidental Petroleum Corp. | 776 | 73,798 | ||||||
| Phillips 66 | 579 | 44,659 | ||||||
| EOG Resources, Inc. | 262 | 43,974 | ||||||
| Halliburton Co. | 817 | 41,463 | ||||||
| Anadarko Petroleum Corp. | 486 | 38,550 | ||||||
| Apache Corp. | 386 | 33,173 | ||||||
| National Oilwell Varco, Inc. | 409 | 32,528 | ||||||
| Marathon Petroleum Corp. | 291 | 26,693 | ||||||
| Valero Energy Corp. | 521 | 26,258 | ||||||
| Williams Companies, Inc. | 660 | 25,456 | ||||||
| Pioneer Natural Resources Co. | 138 | 25,402 | ||||||
| Marathon Oil Corp. | 673 | 23,757 | ||||||
| Baker Hughes, Inc. | 428 | 23,651 | ||||||
| Noble Energy, Inc. | 346 | 23,566 | ||||||
| Kinder Morgan, Inc. | 650 | 23,400 | ||||||
| Spectra Energy Corp. | 647 | 23,046 | ||||||
| Hess Corp. | 275 | 22,825 | ||||||
| Devon Energy Corp. | 368 | 22,768 | ||||||
| Transocean Ltd. | 323 | 15,963 | ||||||
| Cabot Oil & Gas Corp. | 406 | 15,737 | ||||||
| Cameron International Corp.* | 230 | 13,692 | ||||||
| Southwestern Energy Co.* | 339 | 13,333 | ||||||
| Chesapeake Energy Corp. | 488 | 13,244 | ||||||
| Range Resources Corp. | 157 | 13,237 | ||||||
| Equities Corp. | 146 | 13,108 | ||||||
| Ensco plc — Class A | 226 | 12,923 | ||||||
| FMC Technologies, Inc.* | 229 | 11,956 | ||||||
| Murphy Oil Corp. | 167 | 10,835 | ||||||
| Noble Corporation plc | 245 | 9,180 | ||||||
| Helmerich & Payne, Inc. | 104 | 8,744 | ||||||
| CONSOL Energy, Inc. | 221 | 8,407 | ||||||
| Tesoro Corp. | 128 | 7,488 | ||||||
| Denbury Resources, Inc.* | 354 | 5,816 | ||||||
| QEP Resources, Inc. | 173 | 5,302 | ||||||
| Peabody Energy Corp. | 257 | 5,019 | ||||||
| Nabors Industries Ltd. | 251 | 4,264 | ||||||
| Rowan Companies plc — Class A* | 117 | 4,137 | ||||||
| WPX Energy, Inc.* | 192 | 3,913 | ||||||
| Diamond Offshore Drilling, Inc. | 63 | 3,586 | ||||||
| Newfield Exploration Co.* | 130 | 3,202 | ||||||
| Total Energy | 1,635,398 | |||||||
| Consumer Staples - 5.7% | ||||||||
| Procter & Gamble Co. | 2,626 | 213,784 | ||||||
| Coca-Cola Co. | 3,669 | 151,566 | ||||||
| Philip Morris International, Inc. | 1,548 | 134,878 | ||||||
| Wal-Mart Stores, Inc. | 1,563 | 122,993 | ||||||
| PepsiCo, Inc. | 1,481 | 122,834 | ||||||
| CVS Caremark Corp. | 1,150 | 82,305 | ||||||
| Altria Group, Inc. | 1,932 | 74,169 | ||||||
| Mondelez International, Inc. — Class A | 1,694 | 59,799 | ||||||
| Colgate-Palmolive Co. | 849 | 55,363 | ||||||
| Costco Wholesale Corp. | 422 | 50,222 | ||||||
| Walgreen Co. | 838 | 48,135 | ||||||
| Kimberly-Clark Corp. | 367 | 38,337 | ||||||
| Kraft Foods Group, Inc. | 573 | 30,896 | ||||||
| General Mills, Inc. | 613 | 30,595 | ||||||
| Archer-Daniels-Midland Co. | 636 | 27,602 | ||||||
| Whole Foods Market, Inc. | 359 | 20,760 | ||||||
| Sysco Corp. | 562 | 20,288 | ||||||
| Kroger Co. | 501 | 19,805 | ||||||
| Estee Lauder Companies, Inc. — Class A | 247 | 18,604 | ||||||
| Lorillard, Inc. | 356 | 18,042 | ||||||
| Mead Johnson Nutrition Co. — Class A | 195 | 16,333 | ||||||
| Reynolds American, Inc. | 303 | 15,147 | ||||||
| Kellogg Co. | 248 | 15,145 | ||||||
| ConAgra Foods, Inc. | 408 | 13,750 | ||||||
| Hershey Co. | 141 | 13,709 | ||||||
| Brown-Forman Corp. — Class B | 157 | 11,865 | ||||||
| Clorox Co. | 125 | 11,595 | ||||||
| Constellation Brands, Inc. — Class A* | 159 | 11,190 | ||||||
| Beam, Inc. | 156 | 10,617 | ||||||
| Coca-Cola Enterprises, Inc. | 233 | 10,282 | ||||||
| J.M. Smucker Co. | 99 | 10,258 | ||||||
| Dr Pepper Snapple Group, Inc. | 194 | 9,452 | ||||||
| Monster Beverage Corp.* | 131 | 8,878 | ||||||
| McCormick & Company, Inc. | 128 | 8,822 | ||||||
| Tyson Foods, Inc. — Class A | 262 | 8,767 | ||||||
| Molson Coors Brewing Co. — Class B | 149 | 8,366 | ||||||
| Safeway, Inc. | 238 | 7,752 | ||||||
| Campbell Soup Co. | 173 | 7,487 | ||||||
| Avon Products, Inc. | 416 | 7,164 | ||||||
| Hormel Foods Corp. | 130 | 5,872 | ||||||
| Total Consumer Staples | 1,553,428 | |||||||
| See Notes to Financial Statements. | THe RYDEX FUNDS ANNUAL REPORT | 47 |
| SCHEDULE OF INVESTMENTS (continued) | December 31, 2013 | |
| S&P 500® 2x STRATEGY FUND |
| Shares | Value | |||||||
| MATERIALS - 2.0% | ||||||||
| Monsanto Co. | 508 | $ | 59,207 | |||||
| EI du Pont de Nemours & Co. | 895 | 58,149 | ||||||
| Dow Chemical Co. | 1,170 | 51,949 | ||||||
| Freeport-McMoRan Copper & Gold, Inc. | 1,003 | 37,853 | ||||||
| Praxair, Inc. | 284 | 36,928 | ||||||
| LyondellBasell Industries N.V. Class A | 422 | 33,878 | ||||||
| Ecolab, Inc. | 262 | 27,319 | ||||||
| PPG Industries, Inc. | 137 | 25,983 | ||||||
| Air Products & Chemicals, Inc. | 201 | 22,468 | ||||||
| International Paper Co. | 429 | 21,034 | ||||||
| Nucor Corp. | 306 | 16,334 | ||||||
| Mosaic Co. | 328 | 15,505 | ||||||
| Sherwin-Williams Co. | 83 | 15,231 | ||||||
| CF Industries Holdings, Inc. | 54 | 12,584 | ||||||
| Eastman Chemical Co. | 149 | 12,024 | ||||||
| Newmont Mining Corp. | 477 | 10,985 | ||||||
| Alcoa, Inc. | 1,030 | 10,949 | ||||||
| Sigma-Aldrich Corp. | 113 | 10,623 | ||||||
| FMC Corp. | 129 | 9,734 | ||||||
| Vulcan Materials Co. | 126 | 7,487 | ||||||
| Ball Corp. | 140 | 7,233 | ||||||
| Airgas, Inc. | 61 | 6,823 | ||||||
| International Flavors & Fragrances, Inc. | 79 | 6,792 | ||||||
| Sealed Air Corp. | 190 | 6,469 | ||||||
| MeadWestvaco Corp. | 168 | 6,204 | ||||||
| Owens-Illinois, Inc.* | 158 | 5,653 | ||||||
| Avery Dennison Corp. | 93 | 4,668 | ||||||
| United States Steel Corp. | 140 | 4,130 | ||||||
| Bemis Company, Inc. | 99 | 4,055 | ||||||
| Cliffs Natural Resources, Inc. | 145 | 3,800 | ||||||
| Allegheny Technologies, Inc. | 104 | 3,706 | ||||||
| Total Materials | 555,757 | |||||||
| UTILITIES - 1.7% | ||||||||
| Duke Energy Corp. | 679 | 46,859 | ||||||
| Dominion Resources, Inc. | 560 | 36,226 | ||||||
| Nextera Energy, Inc. | 420 | 35,960 | ||||||
| Southern Co. | 849 | 34,902 | ||||||
| Exelon Corp. | 826 | 22,624 | ||||||
| American Electric Power Company, Inc. | 468 | 21,874 | ||||||
| Sempra Energy | 220 | 19,747 | ||||||
| PPL Corp. | 609 | 18,325 | ||||||
| PG&E Corp. | 433 | 17,441 | ||||||
| Public Service Enterprise Group, Inc. | 489 | 15,668 | ||||||
| Consolidated Edison, Inc. | 283 | 15,644 | ||||||
| Edison International | 313 | 14,492 | ||||||
| Xcel Energy, Inc. | 481 | 13,439 | ||||||
| Firstenergy Corp. | 404 | 13,324 | ||||||
| Northeast Utilities | 304 | 12,887 | ||||||
| ONEOK, Inc. | 199 | 12,374 | ||||||
| DTE Energy Co. | 171 | 11,353 | ||||||
| Entergy Corp. | 172 | 10,882 | ||||||
| NiSource, Inc. | 303 | 9,963 | ||||||
| CenterPoint Energy, Inc. | 414 | 9,597 | ||||||
| AES Corp. | 638 | 9,258 | ||||||
| Wisconsin Energy Corp. | 219 | 9,053 | ||||||
| NRG Energy, Inc. | 309 | 8,874 | ||||||
| Ameren Corp. | 234 | 8,461 | ||||||
| CMS Energy Corp. | 257 | 6,880 | ||||||
| SCANA Corp. | 135 | 6,336 | ||||||
| AGL Resources, Inc. | 115 | 5,431 | ||||||
| Pinnacle West Capital Corp. | 102 | 5,398 | ||||||
| Pepco Holdings, Inc. | 239 | 4,572 | ||||||
| Integrys Energy Group, Inc. | 77 | 4,190 | ||||||
| TECO Energy, Inc. | 197 | 3,396 | ||||||
| Total Utilities | 465,430 | |||||||
| TELECOMMUNICATION SERVICES - 1.3% | ||||||||
| AT&T, Inc. | 5,089 | 178,929 | ||||||
| Verizon Communications, Inc. | 2,764 | 135,823 | ||||||
| Crown Castle International Corp.* | 326 | 23,938 | ||||||
| CenturyLink, Inc. | 571 | 18,186 | ||||||
| Windstream Holdings, Inc. | 571 | 4,557 | ||||||
| Frontier Communications Corp. | 966 | 4,492 | ||||||
| Total Telecommunication Services | 365,925 | |||||||
| Total Common Stocks | ||||||||
| (Cost $9,639,194) | 15,906,161 | |||||||
| Face | ||||||||
| Amount | ||||||||
| Repurchase Agreements††,1 - 43.5% | ||||||||
| Credit Suisse Group | ||||||||
| issued 12/31/13 at 0.00% | ||||||||
| due 01/02/142 | $ | 6,729,428 | 6,729,428 | |||||
| Deutsche Bank | ||||||||
| issued 12/31/13 at 0.01% | ||||||||
| due 01/02/14 | 1,742,300 | 1,742,300 | ||||||
| HSBC Group | ||||||||
| issued 12/31/13 at 0.01% | ||||||||
| due 01/02/14 | 1,742,300 | 1,742,300 | ||||||
| Mizuho Financial Group, Inc. | ||||||||
| issued 12/31/13 at 0.01% | ||||||||
| due 01/02/14 | 1,734,418 | 1,734,418 | ||||||
| Total Repurchase Agreements | ||||||||
| (Cost $11,948,446) | 11,948,446 | |||||||
| Total Investments - 101.3% | ||||||||
| (Cost $21,587,640) | $ | 27,854,607 | ||||||
| Other Assets & Liabilities, Net - (1.3)% | (362,681 | ) | ||||||
| Total Net Assets - 100.0% | $ | 27,491,926 | ||||||
| 48 | the RYDEX FUNDS ANNUAL REPORT | See Notes to Financial Statements. |
| SCHEDULE OF INVESTMENTS (concluded) | December 31, 2013 |
| S&P 500® 2x STRATEGY FUND |
| Unrealized | ||||||||
| Contracts | Gain | |||||||
| EQUITY FUTURES CONTRACTS PURCHASED† | ||||||||
| March 2014 S&P 500 Index | ||||||||
| Mini Futures Contracts | ||||||||
| (Aggregate Value of | ||||||||
| Contracts $2,581,950) | 28 | $ | 61,496 | |||||
| Units | ||||||||
| EQUITY INDEX SWAP AGREEMENTS†† | ||||||||
| Credit Suisse Capital, LLC | ||||||||
| January 2014 S&P 500 Index Swap, | ||||||||
| Terminating 01/28/143 | ||||||||
| (Notional Value $26,297,584) | 14,228 | $ | 96,626 | |||||
| Goldman Sachs International | ||||||||
| January 2014 S&P 500 Index Swap, | ||||||||
| Terminating 01/28/143 | ||||||||
| (Notional Value $7,732,089) | 4,183 | 29,453 | ||||||
| Barclays Bank plc | ||||||||
| January 2014 S&P 500 Index Swap, | ||||||||
| Terminating 01/31/143 | ||||||||
| (Notional Value $2,954,130) | 1,598 | 11,802 | ||||||
| (Total Notional Value | ||||||||
| $36,983,803) | $ | 137,881 | ||||||
| * | Non-income producing security. |
| † | Value determined based on Level 1 inputs — See Note 4. |
| †† | Value determined based on Level 2 inputs — See Note 4. |
| 1 | Repurchase Agreements — See Note 5. |
| 2 | All or a portion of this security is pledged as equity index swap collateral at December 31, 2013. |
| 3 | Total Return based on S&P 500 Index +/- financing at a variable rate. | |
| REIT — Real Estate Investment Trust | ||
| plc — Public Limited Company |
| See Notes to Financial Statements. | THe RYDEX FUNDS ANNUAL REPORT | 49 |
| S&P 500® 2x STRATEGY FUND |
| STATEMENT OF ASSETS |
| AND LIABILITIES |
December 31, 2013
| Assets: | ||||
| Investments, at value | ||||
| (cost $9,639,194) | $ | 15,906,161 | ||
| Repurchase agreements, at value | ||||
| (cost $11,948,446) | 11,948,446 | |||
| Total investments | ||||
| (cost $21,587,640) | 27,854,607 | |||
| Segregated cash with broker | 324,800 | |||
| Unrealized appreciation on swap agreements | 137,881 | |||
| Receivable for swap settlement | 3,505 | |||
| Receivables: | ||||
| Fund shares sold | 940,018 | |||
| Dividends | 22,412 | |||
| Variation margin | 13,370 | |||
| Investment advisor | 3,685 | |||
| Foreign taxes reclaim | 12 | |||
| Swap settlement | 3,677 | |||
| Total assets | 29,303,967 | |||
| Liabilities: | ||||
| Payable for: | ||||
| Fund shares redeemed | 1,746,510 | |||
| Management fees | 18,719 | |||
| Transfer agent and administrative fees | 5,200 | |||
| Investor service fees | 5,200 | |||
| Portfolio accounting fees | 2,080 | |||
| Miscellaneous | 34,332 | |||
| Total liabilities | 1,812,041 | |||
| Net assets | $ | 27,491,926 | ||
| Net assets consist of: | ||||
| Paid in capital | $ | 17,567,113 | ||
| Accumulated net investment loss | (2,075 | ) | ||
| Accumulated net realized gain on investments | 3,460,544 | |||
| Net unrealized appreciation on investments | 6,466,344 | |||
| Net assets | $ | 27,491,926 | ||
| Capital shares outstanding | 116,566 | |||
| Net asset value per share | $ | 235.85 |
| STATEMENT OF |
| OPERATIONS |
| Year ended December 31, 2013 |
| Investment Income: | ||||
| Dividends (net of foreign withholding tax of $65) | $ | 275,494 | ||
| Interest | 3,520 | |||
| Income from securities lending, net | 20 | |||
| Total investment income | 279,034 | |||
| Expenses: | ||||
| Management fees | 209,339 | |||
| Transfer agent and administrative fees | 58,150 | |||
| Investor service fees | 58,150 | |||
| Portfolio accounting fees | 23,260 | |||
| Professional fees | 20,387 | |||
| Custodian fees | 2,664 | |||
| Trustees’ fees* | 2,307 | |||
| Line of credit interest expense | 34 | |||
| Miscellaneous | 19,205 | |||
| Total expenses | 393,496 | |||
| Net investment loss | (114,462 | ) | ||
| Net Realized And Unrealized Gain (Loss): | ||||
| Net realized gain (loss) on: | ||||
| Investments | 218,206 | |||
| Swap agreements | 7,763,679 | |||
| Futures contracts | 942,700 | |||
| Net realized gain | 8,924,585 | |||
| Net change in unrealized appreciation (depreciation) on: | ||||
| Investments | 2,865,769 | |||
| Swap agreements | 81,942 | |||
| Futures contracts | 65,063 | |||
| Net change in unrealized appreciation (depreciation) | 3,012,774 | |||
| Net realized and unrealized gain | 11,937,359 | |||
| Net increase in net assets resulting from operations | $ | 11,822,897 |
* Relates to Trustees not deemed “interested persons” within the meaning of Section 2(a)(19) of the 1940 Act.
| 50 | the RYDEX FUNDS ANNUAL REPORT | See Notes to Financial Statements. |
| S&P 500® 2x STRATEGY FUND |
| STATEMENTS OF CHANGES IN NET ASSETS |
| Year Ended | Year Ended | |||||||
| December 31, | December 31, | |||||||
| 2013 | 2012 | |||||||
| Increase (Decrease) In Net Assets From Operations: | ||||||||
| Net investment loss | $ | (114,462 | ) | $ | (60,385 | ) | ||
| Net realized gain on investments | 8,924,585 | 3,800,052 | ||||||
| Net change in unrealized appreciation (depreciation) on investments | 3,012,774 | 908,935 | ||||||
| Net increase in net assets resulting from operations | 11,822,897 | 4,648,602 | ||||||
| Capital share transactions: | ||||||||
| Proceeds from sale of shares | 259,249,238 | 363,785,066 | ||||||
| Cost of shares redeemed | (256,064,181 | ) | (378,812,200 | ) | ||||
| Net increase (decrease) from capital share transactions | 3,185,057 | (15,027,134 | ) | |||||
| Net increase (decrease) in net assets | 15,007,954 | (10,378,532 | ) | |||||
| Net assets: | ||||||||
| Beginning of year | 12,483,972 | 22,862,504 | ||||||
| End of year | $ | 27,491,926 | $ | 12,483,972 | ||||
| (Accumulated)/Undistributed net investment (loss)/income at end of year | $ | (2,075 | ) | $ | 812 | |||
| Capital share activity: | ||||||||
| Shares sold | 1,423,672 | 2,809,448 | ||||||
| Shares redeemed | (1,396,409 | ) | (2,931,738 | ) | ||||
| Net increase (decrease) in shares | 27,263 | (122,290 | ) | |||||
| See Notes to Financial Statements. | THe RYDEX FUNDS ANNUAL REPORT | 51 |
| S&P 500® 2x STRATEGY FUND |
FINANCIAL HIGHLIGHTS
This table is presented to show selected data for a share outstanding throughout each period and to assist shareholders in evaluating a Fund’s performance for the periods presented.
| Year Ended | Year Ended | Year Ended | Year Ended | Year Ended | ||||||||||||||||
| December 31, | December 31, | December 31, | December 31, | December 31, | ||||||||||||||||
| 2013 | 2012 | 2011 | 2010 | 2009c | ||||||||||||||||
| Per Share Data | ||||||||||||||||||||
| Net asset value, beginning of period | $ | 139.79 | $ | 108.05 | $ | 112.49 | $ | 89.65 | $ | 61.59 | ||||||||||
| Income (loss) from investment operations: | ||||||||||||||||||||
| Net investment lossa | (.91 | ) | (.36 | ) | (.83 | ) | (.55 | ) | (.19 | ) | ||||||||||
| Net gain (loss) on investments (realized and unrealized) | 96.97 | 32.10 | (3.61 | ) | 23.39 | 28.76 | ||||||||||||||
| Total from investment operations | 96.06 | 31.74 | (4.44 | ) | 22.84 | 28.57 | ||||||||||||||
| Less distributions from: | ||||||||||||||||||||
| Net investment income | — | — | — | — | (.51 | ) | ||||||||||||||
| Total distributions | — | — | — | — | (.51 | ) | ||||||||||||||
| Net asset value, end of period | $ | 235.85 | $ | 139.79 | $ | 108.05 | $ | 112.49 | $ | 89.65 | ||||||||||
| Total Returnb | 68.71 | % | 29.39 | % | (3.95 | %) | 25.47 | % | 46.40 | % | ||||||||||
| Ratios/Supplemental Data | ||||||||||||||||||||
| Net assets, end of period (in thousands) | $ | 27,492 | $ | 12,484 | $ | 22,863 | $ | 21,024 | $ | 28,872 | ||||||||||
| Ratios to average net assets: | ||||||||||||||||||||
| Net investment loss | (0.49 | %) | (0.28 | %) | (0.72 | %) | (0.59 | %) | (0.30 | %) | ||||||||||
| Total expenses | 1.69 | % | 1.73 | % | 1.76 | % | 1.71 | % | 1.71 | % | ||||||||||
| Portfolio turnover rate | 225 | % | 301 | % | 232 | % | 68 | % | 204 | % | ||||||||||
| a | Net investment loss per share was computed using average shares outstanding throughout the period. |
| b | Total return does not reflect the impact of any additional fees charged by insurance companies. |
| c | Reverse share split — Per share amounts for period January 1, 2009 through April 19, 2009 have been restated to reflect a 1:10 reverse share split effective April 20, 2009. |
| 52 | the RYDEX FUNDS ANNUAL REPORT | See Notes to Financial Statements. |
This page intentionally left blank.
| the RYDEX FUNDS ANNUAL REPORT | 53 |
| PERFORMANCE REPORT AND FUND PROFILE (Unaudited) | December 31, 2013 |
NASDAQ-100® 2x STRATEGY FUND
OBJECTIVE: Seeks to provide investment results that match, before fees and expenses, the performance of a specific benchmark on a daily basis. The Fund’s current benchmark is 200% of the performance of the NASDAQ-100® Index (the “underlying index”). The Fund does not seek to achieve its investment objective over a period of time greater than one day.
For the year ended December 31, 2013, with the NASDAQ-100 Index up 36.92%, the NASDAQ-100® 2x Strategy Fund returned 80.21%. For the year ended December 31, 2013, the Fund maintained a daily correlation of over 99% to its benchmark of 200% of the daily price movement of the NASDAQ-100 Index.
Information Technology and Consumer Discretionary contributed most to performance of the underlying index during the year. No sector detracted, but Materials contributed least to return, followed by Telecommunication Services.
Google, Inc. — Class A, Microsoft Corp. and Amazon.com, Inc. contributed most to performance of the underlying index for the year. The stocks detracting most from performance of the underlying index for the year were Oracle Corp., Intuitive Surgical, Inc. and Nuance Communications, Inc.
Derivatives in the Fund were used to help provide exposure to the composition of the benchmark in the highest efficient manner and to provide leverage, not for hedging purposes.
Due to the compounding of daily returns, leveraged and inverse funds’ returns over periods other than one day will likely differ in amount and possibly direction from the benchmark return for the same period. Investors should monitor their leveraged and inverse funds’ holdings to ensure that they are consistent with their strategies, as frequently as daily.
The effects of compounding may cause the longer-term correlation of the fund to its benchmark to diminish. The apparent discrepancy between the leveraged and unleveraged indices is the result of compounding, which is described briefly on page 6 of this report.
Performance displayed represents past performance, which is no guarantee of future results.
Holdings Diversification (Market Exposure as % of Net Assets)
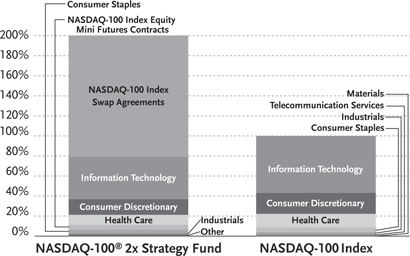
“Holdings Diversification (Market Exposure as % of Net Assets)” excludes any temporary cash investments.
| Inception Date: October 1, 2001 | ||||
| Ten Largest Holdings (% of Total Net Assets) | ||||
| Apple, Inc. | 9.3 | % | ||
| Microsoft Corp. | 5.8 | % | ||
| Google, Inc. — Class A | 5.7 | % | ||
| Amazon.com, Inc. | 3.4 | % | ||
| Intel Corp. | 2.4 | % | ||
| QUALCOMM, Inc. | 2.3 | % | ||
| Cisco Systems, Inc. | 2.2 | % | ||
| Gilead Sciences, Inc. | 2.1 | % | ||
| Comcast Corp. — Class A | 2.0 | % | ||
| Facebook, Inc. — Class A | 1.9 | % | ||
| Top Ten Total | 37.1 | % | ||
“Ten Largest Holdings” exclude any temporary cash or derivative investments.
| 54 | the RYDEX FUNDS ANNUAL REPORT |
| PERFORMANCE REPORT AND FUND PROFILE (Unaudited) (concluded) |
Cumulative Fund Performance*,†
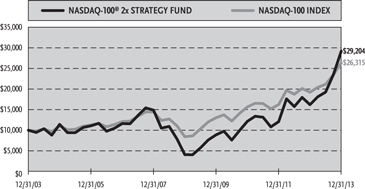
Average Annual Returns
| Periods Ended December 31, 2013*,† | ||||||||||||
| 1 Year | 5 Year | 10 Year | ||||||||||
| NASDAQ-100® 2x Strategy Fund | 80.21 | % | 48.24 | % | 11.31 | % | ||||||
| NASDAQ-100 Index | 36.92 | % | 25.56 | % | 10.16 | % | ||||||
| * | The performance data above represents past performance that is not predictive of future results. The investment return and principal value of an investment in the Fund will fluctuate so that an investor’s shares, when redeemed, may be worth more or less than their original cost. Returns are historical and include changes in principal and reinvested dividends and capital gains and do not reflect the effect of taxes. The NASDAQ-100 Index is an unmanaged index and, unlike the Fund, has no management fees or operating expenses to reduce its reported return. |
† Returns do not reflect the impact of any additional fees charged by insurance companies.
| the RYDEX FUNDS ANNUAL REPORT | 55 |
| SCHEDULE OF INVESTMENTS | December 31, 2013 |
| NASDAQ-100® 2x STRATEGY FUND |
| Shares | Value | |||||||
| COMMON STOCKS† - 74.4% | ||||||||
| Information Technology - 42.3% | ||||||||
| Apple, Inc. | 7,626 | $ | 4,279,025 | |||||
| Microsoft Corp. | 70,735 | 2,647,611 | ||||||
| Google, Inc. — Class A* | 2,342 | 2,624,702 | ||||||
| Intel Corp. | 42,120 | 1,093,436 | ||||||
| QUALCOMM, Inc. | 14,310 | 1,062,517 | ||||||
| Cisco Systems, Inc. | 45,306 | 1,017,120 | ||||||
| Facebook, Inc. — Class A* | 15,880 | 868,000 | ||||||
| eBay, Inc.* | 10,968 | 602,034 | ||||||
| Baidu, Inc. ADR* | 2,333 | 414,994 | ||||||
| Texas Instruments, Inc. | 9,278 | 407,397 | ||||||
| Yahoo!, Inc.* | 8,599 | 347,744 | ||||||
| Automatic Data Processing, Inc. | 4,075 | 329,301 | �� | |||||
| Cognizant Technology Solutions Corp. — | ||||||||
| Class A* | 2,563 | 258,812 | ||||||
| Adobe Systems, Inc.* | 4,240 | 253,890 | ||||||
| Micron Technology, Inc.* | 8,916 | 194,012 | ||||||
| Intuit, Inc. | 2,412 | 184,084 | ||||||
| Applied Materials, Inc. | 10,188 | 180,225 | ||||||
| Western Digital Corp. | 2,001 | 167,883 | ||||||
| Seagate Technology plc | 2,761 | 155,058 | ||||||
| Paychex, Inc. | 3,092 | 140,779 | ||||||
| Symantec Corp. | 5,898 | 139,075 | ||||||
| SanDisk Corp. | 1,916 | 135,155 | ||||||
| Analog Devices, Inc. | 2,640 | 134,455 | ||||||
| Broadcom Corp. — Class A | 4,389 | 130,134 | ||||||
| Fiserv, Inc.* | 2,181 | 128,788 | ||||||
| CA, Inc. | 3,820 | 128,543 | ||||||
| NetApp, Inc. | 2,883 | 118,607 | ||||||
| Avago Technologies Ltd. | 2,096 | 110,857 | ||||||
| Check Point Software Technologies Ltd.* | 1,660 | 107,103 | ||||||
| Activision Blizzard, Inc. | 5,897 | 105,144 | ||||||
| Xilinx, Inc. | 2,276 | 104,514 | ||||||
| Citrix Systems, Inc.* | 1,583 | 100,125 | ||||||
| Autodesk, Inc.* | 1,911 | 96,181 | ||||||
| NXP Semiconductor N.V.* | 2,082 | 95,626 | ||||||
| KLA-Tencor Corp. | 1,406 | 90,631 | ||||||
| Linear Technology Corp. | 1,983 | 90,326 | ||||||
| Altera Corp. | 2,719 | 88,449 | ||||||
| NVIDIA Corp. | 4,814 | 77,120 | ||||||
| Equinix, Inc.* | 419 | 74,352 | ||||||
| Akamai Technologies, Inc.* | 1,519 | 71,666 | ||||||
| Maxim Integrated Products, Inc. | 2,393 | 66,789 | ||||||
| F5 Networks, Inc.* | 657 | 59,695 | ||||||
| Total Information Technology | 19,481,959 | |||||||
| Consumer Discretionary - 15.6% | ||||||||
| Amazon.com, Inc.* | 3,875 | 1,545,311 | ||||||
| Comcast Corp. — Class A | 18,103 | 940,721 | ||||||
| Priceline.com, Inc.* | 437 | 507,969 | ||||||
| Starbucks Corp. | 6,390 | 500,912 | ||||||
| Twenty-First Century Fox, Inc. — Class A | 12,565 | 442,036 | ||||||
| DIRECTV* | 4,450 | 307,450 | ||||||
| Viacom, Inc. — Class B | 3,346 | 292,240 | ||||||
| Netflix, Inc.* | 502 | 184,821 | ||||||
| Sirius XM Holdings, Inc.* | 51,985 | 181,428 | ||||||
| Liberty Global plc — Class A* | 1,882 | 167,479 | ||||||
| Wynn Resorts Ltd. | 860 | 167,021 | ||||||
| Tesla Motors, Inc.* | 1,038 | 156,094 | ||||||
| Bed Bath & Beyond, Inc.* | 1,816 | 145,825 | ||||||
| Ross Stores, Inc. | 1,832 | 137,272 | ||||||
| Mattel, Inc. | 2,863 | 136,222 | ||||||
| Liberty Media Corp. — Class A* | 888 | 130,048 | ||||||
| Marriott International, Inc. — Class A | 2,533 | 125,029 | ||||||
| Charter Communications, Inc. — Class A* | 881 | 120,486 | ||||||
| Liberty Interactive Corp. — Class A* | 4,062 | 119,220 | ||||||
| O’Reilly Automotive, Inc.* | 912 | 117,384 | ||||||
| Discovery Communications, Inc. — | ||||||||
| Class A* | 1,244 | 112,482 | ||||||
| DISH Network Corp. — Class A* | 1,862 | 107,847 | ||||||
| Dollar Tree, Inc.* | 1,761 | 99,356 | ||||||
| Tractor Supply Co. | 1,180 | 91,545 | ||||||
| TripAdvisor, Inc.* | 1,093 | 90,533 | ||||||
| Staples, Inc. | 5,534 | 87,935 | ||||||
| Garmin Ltd. | 1,657 | 76,587 | ||||||
| Expedia, Inc. | 996 | 69,381 | ||||||
| Total Consumer Discretionary | 7,160,634 | |||||||
| Health Care - 10.1% | ||||||||
| Gilead Sciences, Inc.* | 12,993 | 976,423 | ||||||
| Amgen, Inc. | 6,385 | 728,912 | ||||||
| Celgene Corp.* | 3,489 | 589,501 | ||||||
| Biogen Idec, Inc.* | 2,001 | 559,780 | ||||||
| Express Scripts Holding Co.* | 6,825 | 479,388 | ||||||
| Regeneron Pharmaceuticals, Inc.* | 825 | 227,073 | ||||||
| Alexion Pharmaceuticals, Inc.* | 1,664 | 221,412 | ||||||
| Cerner Corp.* | 2,907 | 162,036 | ||||||
| Vertex Pharmaceuticals, Inc.* | 1,981 | 147,188 | ||||||
| Mylan, Inc.* | 3,242 | 140,703 | ||||||
| Intuitive Surgical, Inc.* | 323 | 124,058 | ||||||
| Illumina, Inc.* | 1,072 | 118,585 | ||||||
| Henry Schein, Inc.* | 726 | 82,953 | ||||||
| Catamaran Corp.* | 1,745 | 82,853 | ||||||
| Total Health Care | 4,640,865 | |||||||
| Consumer Staples - 3.5% | ||||||||
| Mondelez International, Inc. — Class A | 14,859 | 524,522 | ||||||
| Costco Wholesale Corp. | 3,700 | 440,337 | ||||||
| Kraft Foods Group, Inc. | 5,051 | 272,350 | ||||||
| Whole Foods Market, Inc. | 3,149 | 182,107 | ||||||
| Monster Beverage Corp.* | 1,415 | 95,895 | ||||||
| Green Mountain Coffee Roasters, Inc.* | 1,265 | 95,609 | ||||||
| Total Consumer Staples | 1,610,820 | |||||||
| Industrials - 1.4% | ||||||||
| PACCAR, Inc. | 2,996 | 177,272 | ||||||
| Fastenal Co. | 2,509 | 119,203 | ||||||
| Verisk Analytics, Inc. — Class A* | 1,429 | 93,914 | ||||||
| Stericycle, Inc.* | 730 | 84,804 | ||||||
| Expeditors International of | ||||||||
| Washington, Inc. | 1,740 | 76,995 | ||||||
| C.H. Robinson Worldwide, Inc. | 1,287 | 75,084 | ||||||
| Total Industrials | 627,272 | |||||||
| 56 | the RYDEX FUNDS ANNUAL REPORT | See Notes to Financial Statements. |
| SCHEDULE OF INVESTMENTS (concluded) | December 31, 2013 |
| NASDAQ-100® 2x STRATEGY FUND |
| Shares | Value | |||||||
| Telecommunication Services - 1.3% | ||||||||
| Vodafone Group plc ADR | 8,369 | $ | 328,986 | |||||
| VimpelCom Ltd. ADR | 14,001 | 181,173 | ||||||
| SBA Communications Corp. — Class A* | 1,091 | 98,015 | ||||||
| Total Telecommunication Services | 608,174 | |||||||
| Materials - 0.2% | ||||||||
| Sigma-Aldrich Corp. | 1,014 | 95,326 | ||||||
| Total Common Stocks | ||||||||
| (Cost $26,410,661) | 34,225,050 | |||||||
| Face | ||||||||
| Amount | ||||||||
| REPURCHASE AGREEMENTS††,1 - 21.1% | ||||||||
| Credit Suisse Group | ||||||||
| issued 12/31/13 at 0.00% | ||||||||
| due 01/02/142 | $ | 7,137,790 | 7,137,790 | |||||
| Deutsche Bank | ||||||||
| issued 12/31/13 at 0.01% | ||||||||
| due 01/02/14 | 864,848 | 864,848 | ||||||
| HSBC Group | ||||||||
| issued 12/31/13 at 0.01% | ||||||||
| due 01/02/14 | 864,848 | 864,848 | ||||||
| Mizuho Financial Group, Inc. | ||||||||
| issued 12/31/13 at 0.01% | ||||||||
| due 01/02/14 | 860,935 | 860,935 | ||||||
| Total Repurchase Agreements | ||||||||
| (Cost $9,728,421) | 9,728,421 | |||||||
| Total Investments - 95.5% | ||||||||
| (Cost $36,139,082) | $ | 43,953,471 | ||||||
| Other Assets & Liabilities, net - 4.5% | 2,064,804 | |||||||
| Total Net Assets - 100.0% | $ | 46,018,275 | ||||||
| Unrealized | ||||||||
| Contracts | Gain | |||||||
| EQUITY FUTURES CONTRACTS PURCHASED† | ||||||||
| March 2014 NASDAQ-100 Index | ||||||||
| Mini Futures Contracts | ||||||||
| (Aggregate Value of | ||||||||
| Contracts $2,153,400) | 30 | $ | 14,481 | |||||
| Units | ||||||||
| EQUITY INDEX SWAP AGREEMENTS†† | ||||||||
| Barclays Bank plc | ||||||||
| January 2014 NASDAQ-100 Index Swap, | ||||||||
| Terminating 01/31/143 | ||||||||
| (Notional Value $12,053,029) | 3,356 | $ | 73,258 | |||||
| Goldman Sachs International | ||||||||
| January 2014 NASDAQ-100 Index Swap, | ||||||||
| Terminating 01/28/143 | ||||||||
| (Notional Value $31,746,096) | 8,838 | 68,537 | ||||||
| Credit Suisse Capital, LLC | ||||||||
| January 2014 NASDAQ-100 Index Swap, | ||||||||
| Terminating 01/28/143 | ||||||||
| (Notional Value $11,936,771) | 3,323 | 19,272 | ||||||
| (Total Notional Value $55,735,896) | $ | 161,067 | ||||||
| * | Non-income producing security. |
| † | Value determined based on Level 1 inputs — See Note 4. |
| †† | Value determined based on Level 2 inputs — See Note 4. |
| 1 | Repurchase Agreements — See Note 5. |
| 2 | All or a portion of this security is pledged as equity index swap collateral at December 31, 2013. |
| 3 | Total Return based on NASDAQ-100 Index +/- financing at a variable rate. | |
| ADR — American Depositary Receipt | ||
| plc — Public Limited Company |
| See Notes to Financial Statements. | THe RYDEX FUNDS ANNUAL REPORT | 57 |
| NASDAQ-100® 2x STRATEGY FUND |
| STATEMENT OF ASSETS |
| AND LIABILITIES |
| December 31, 2013 |
| Assets: | ||||
| Investments, at value | ||||
| (cost $26,410,661) | $ | 34,225,050 | ||
| Repurchase agreements, at value | ||||
| (cost $9,728,421) | 9,728,421 | |||
| Total investments | ||||
| (cost $36,139,082) | 43,953,471 | |||
| Segregated cash with broker | 774,000 | |||
| Unrealized appreciation on swap agreements | 161,067 | |||
| Receivables: | ||||
| Fund shares sold | 1,241,476 | |||
| Dividends | 19,817 | |||
| Variation margin | 13,950 | |||
| Foreign taxes reclaim | 144 | |||
| Total assets | 46,163,925 | |||
| Liabilities: | ||||
| Payable for: | ||||
| Management fees | 32,344 | |||
| Fund shares redeemed | 19,181 | |||
| Swap settlement | 16,464 | |||
| Transfer agent and administrative fees | 8,984 | |||
| Investor service fees | 8,984 | |||
| Portfolio accounting fees | 3,594 | |||
| Miscellaneous | 56,099 | |||
| Total liabilities | 145,650 | |||
| Net assets | $ | 46,018,275 | ||
| Net assets consist of: | ||||
| Paid in capital | $ | 21,929,871 | ||
| Undistributed net investment income | 2,744 | |||
| Accumulated net realized gain on investments | 16,095,723 | |||
| Net unrealized appreciation on investments | 7,989,937 | |||
| Net assets | $ | 46,018,275 | ||
| Capital shares outstanding | 1,013,694 | |||
| Net asset value per share | $ | 45.40 |
STATEMENT OF
OPERATIONS
| Year Ended December 31, 2013 |
| Investment Income: | ||||
| Dividends (net of foreign withholding tax of $158) | $ | 374,193 | ||
| Interest | 2,796 | |||
| Income from securities lending, net | 240 | |||
| Total investment income | 377,229 | |||
| Expenses: | ||||
| Management fees | 333,371 | |||
| Transfer agent and administrative fees | 92,603 | |||
| Investor service fees | 92,603 | |||
| Portfolio accounting fees | 37,041 | |||
| Professional fees | 32,838 | |||
| Custodian fees | 4,090 | |||
| Trustees’ fees* | 3,671 | |||
| Line of credit interest expense | 80 | |||
| Miscellaneous | 41,813 | |||
| Total expenses | 638,110 | |||
| Net investment loss | (260,881 | ) | ||
| Net Realized and Unrealized Gain (Loss): | ||||
| Net realized gain (loss) on: | ||||
| Investments | 6,819,772 | |||
| Swap agreements | 12,467,607 | |||
| Futures contracts | 1,443,844 | |||
| Net realized gain | 20,731,223 | |||
| Net change in unrealized appreciation (depreciation) on: | ||||
| Investments | 222,952 | |||
| Swap agreements | (395,166 | ) | ||
| Futures contracts | (9,715 | ) | ||
| Net change in unrealized appreciation (depreciation) | (181,929 | ) | ||
| Net realized and unrealized gain | 20,549,294 | |||
| Net increase in net assets resulting from operations | $ | 20,288,413 |
* Relates to Trustees not deemed “interested persons” within the meaning of Section 2(a)(19) of the 1940 Act.
| 58 | the RYDEX FUNDS ANNUAL REPORT | See Notes to Financial Statements. |
| NASDAQ-100® 2x STRATEGY FUND |
STATEMENTS OF CHANGES IN NET ASSETS
| Year Ended | Year Ended | |||||||
| December 31, | December 31, | |||||||
| 2013 | 2012 | |||||||
| Increase (Decrease) In Net Assets From Operations: | ||||||||
| Net investment loss | $ | (260,881 | ) | $ | (267,076 | ) | ||
| Net realized gain on investments | 20,731,223 | 6,693,917 | ||||||
| Net change in unrealized appreciation (depreciation) on investments | (181,929 | ) | 3,043,043 | |||||
| Net increase in net assets resulting from operations | 20,288,413 | 9,469,884 | ||||||
| Distributions to shareholders from: | ||||||||
| Net realized gains | (4,062,636 | ) | — | |||||
| Total distributions to shareholders | (4,062,636 | ) | — | |||||
| Capital share transactions: | ||||||||
| Proceeds from sale of shares | 146,349,263 | 177,938,912 | ||||||
| Distributions reinvested | 4,062,636 | — | ||||||
| Cost of shares redeemed | (145,557,504 | ) | (184,810,809 | ) | ||||
| Net increase (decrease) from capital share transactions | 4,854,395 | (6,871,897 | ) | |||||
| Net increase in net assets | 21,080,172 | 2,597,987 | ||||||
| Net assets: | ||||||||
| Beginning of year | 24,938,103 | 22,340,116 | ||||||
| End of year | $ | 46,018,275 | $ | 24,938,103 | ||||
| Undistributed net investment income at end of year | $ | 2,744 | $ | 2,994 | ||||
| Capital share activity: | ||||||||
| Shares sold | 4,133,778 | 6,505,056 | ||||||
| Shares issued from reinvestment of distributions | 100,985 | — | ||||||
| Shares redeemed | (4,119,592 | ) | (6,686,366 | ) | ||||
| Net increase (decrease) in shares | 115,171 | (181,310 | ) | |||||
| SEE NOTES TO FINANCIAL STATEMENTS. | THE RYDEX FUNDS ANNUAL REPORT | 59 |
| NASDAQ-100® 2x STRATEGY FUND |
| FINANCIAL HIGHLIGHTS |
This table is presented to show selected data for a share outstanding throughout each period and to assist shareholders in evaluating a Fund’s performance for the periods presented.
| Year Ended | Year Ended | Year Ended | Year Ended | Year Ended | ||||||||||||||||
| December 31, | December 31, | December 31, | December 31, | December 31, | ||||||||||||||||
| 2013 | 2012 | 2011 | 2010 | 2009 | ||||||||||||||||
| Per Share Data | ||||||||||||||||||||
| Net asset value, beginning of period | $ | 27.75 | $ | 20.69 | $ | 24.45 | $ | 17.86 | $ | 8.20 | ||||||||||
| Income (loss) from investment operations: | ||||||||||||||||||||
| Net investment lossa | (.25 | ) | (.22 | ) | (.33 | ) | (.22 | ) | (.14 | ) | ||||||||||
| Net gain on investments (realized and unrealized) | 21.99 | 7.28 | .39 | 6.81 | 9.80 | |||||||||||||||
| Total from investment operations | 21.74 | 7.06 | .06 | 6.59 | 9.66 | |||||||||||||||
| Less distributions from: | ||||||||||||||||||||
| Net realized gains | (4.09 | ) | — | (3.82 | ) | — | — | |||||||||||||
| Total distributions | (4.09 | ) | — | (3.82 | ) | — | — | |||||||||||||
| Net asset value, end of period | $ | 45.40 | $ | 27.75 | $ | 20.69 | $ | 24.45 | $ | 17.86 | ||||||||||
| Total Returnb | 80.21 | % | 34.12 | % | (0.68 | %) | 36.90 | % | 117.80 | % | ||||||||||
| Ratios/Supplemental Data | ||||||||||||||||||||
| Net assets, end of period (in thousands) | $ | 46,018 | $ | 24,938 | $ | 22,340 | $ | 34,107 | $ | 36,112 | ||||||||||
| Ratios to average net assets: | ||||||||||||||||||||
| Net investment loss | (0.70 | %) | (0.80 | %) | (1.31 | %) | (1.16 | %) | (1.19 | %) | ||||||||||
| Total expenses | 1.72 | % | 1.76 | % | 1.80 | % | 1.74 | % | 1.75 | % | ||||||||||
| Portfolio turnover rate | 174 | % | 120 | % | 22 | % | 92 | % | 80 | % | ||||||||||
| a | Net investment loss per share was computed using average shares outstanding throughout the period. |
| b | Total return does not reflect the impact of any additional fees charged by insurance companies. |
| 60 | THE RYDEX FUNDS ANNUAL REPORT | SEE NOTES TO FINANCIAL STATEMENTS. |
| This page intentionally left blank. |
| THE RYDEX FUNDS ANNUAL REPORT | 61 |
| PERFORMANCE REPORT AND FUND PROFILE (Unaudited) | December 31, 2013 |
MID-CAP 1.5x STRATEGY FUND
OBJECTIVE: Seeks to provide investment results that correlate, before fees and expenses, to the performance of a specific benchmark for mid-cap securities on a daily basis. The Fund’s current benchmark is 150% of the performance of the S&P MidCap 400® Index (the “underlying index”). The Fund does not seek to achieve its investment objective over a period of time greater than one day.
For the year ended December 31, 2013, the Mid-Cap 1.5x Strategy Fund returned 50.23%. Over the year, its benchmark, the S&P MidCap 400 Index, returned 33.50%. The Fund had a correlation of more than 99% to its benchmark of 150% of the daily price movement of the S&P MidCap 400 Index.
Consumer Discretionary and Financials contributed most to performance of the underlying index during the year. No sector detracted, but Telecommunication Services and Utilities contributed least.
Micron Technology, Inc., Netflix, Inc. and Delta Air Lines, Inc. contributed most to performance of the underlying index for the year. Rackspace Hosting, Inc., Edwards Lifesciences Corp. and Teradata Corp. were the largest detractors from performance of the underlying index for the year.
Derivatives in the Fund were used to help provide exposure to the composition of the benchmark in the highest efficient manner and to provide leverage, not for hedging purposes.
Due to the compounding of daily returns, leveraged and inverse funds’ returns over periods other than one day will likely differ in amount and possibly direction from the benchmark return for the same period. Investors should monitor their leveraged and inverse funds’ holdings to ensure that they are consistent with their strategies, as frequently as daily.
The effects of compounding may cause the longer-term correlation of the fund to its benchmark to diminish. The apparent discrepancy between the leveraged and unleveraged indices is the result of compounding, which is described briefly on page 6 of this report.
Performance displayed represents past performance, which is no guarantee of future results.
Holdings Diversification (Market Exposure as % of Net Assets)

“Holdings Diversification (Market Exposure as % of Net Assets)” excludes any temporary cash investments.
Inception Date: October 1, 2001
| Ten Largest Holdings (% of Total Net Assets) | ||||
| Affiliated Managers Group, Inc. | 0.4 | % | ||
| Tractor Supply Co. | 0.4 | % | ||
| Green Mountain Coffee Roasters, Inc. | 0.4 | % | ||
| HollyFrontier Corp. | 0.4 | % | ||
| LKQ Corp. | 0.4 | % | ||
| Henry Schein, Inc. | 0.4 | % | ||
| Polaris Industries, Inc. | 0.4 | % | ||
| Church & Dwight Company, Inc. | 0.4 | % | ||
| Cimarex Energy Co. | 0.4 | % | ||
| Trimble Navigation Ltd. | 0.3 | % | ||
| Top Ten Total | 3.9 | % | ||
“Ten Largest Holdings” exclude any temporary cash or derivative investments.
| 62 | THE RYDEX FUNDS ANNUAL REPORT |
| PERFORMANCE REPORT AND FUND PROFILE (Unaudited) (concluded) |
Cumulative Fund Performance*,†
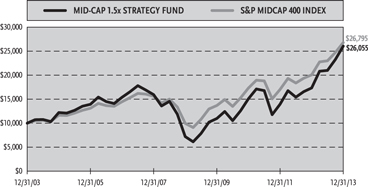
Average Annual Returns
Periods Ended December 31, 2013*,†
| 1 Year | 5 Year | 10 Year | ||||||||||
| Mid-Cap 1.5x Strategy Fund | 50.23 | % | 29.33 | % | 10.05 | % | ||||||
| S&P MidCap 400 Index | 33.50 | % | 21.89 | % | 10.36 | % | ||||||
| * | The performance data above represents past performance that is not predictive of future results. The investment return and principal value of an investment in the Fund will fluctuate so that an investor’s shares, when redeemed, may be worth more or less than their original cost. Returns are historical and include changes in principal and reinvested dividends and capital gains and do not reflect the effect of taxes. The S&P MidCap 400 Index is an unmanaged index and, unlike the Fund, has no management fees or operating expenses to reduce its reported return. |
| † | Returns do not reflect the impact of any additional fees charged by insurance companies. |
| THE RYDEX FUNDS ANNUAL REPORT | 63 |
| SCHEDULE OF INVESTMENTS | December 31, 2013 |
| MID-CAP 1.5x STRATEGY FUND |
| Shares | Value | |||||||
| COMMON STOCKS† - 59.6% | ||||||||
| FINANCIALS - 13.3% | ||||||||
| Affiliated Managers Group, Inc.* | 351 | $ | 76,125 | |||||
| SL Green Realty Corp. | 630 | 58,198 | ||||||
| Fidelity National Financial, Inc. — Class A | 1,658 | 53,803 | ||||||
| Realty Income Corp. | 1,373 | 51,255 | ||||||
| Everest Re Group Ltd. | 319 | 49,722 | ||||||
| New York Community Bancorp, Inc. | 2,924 | 49,269 | ||||||
| Federal Realty Investment Trust | 428 | 43,404 | ||||||
| Alleghany Corp.* | 107 | 42,796 | ||||||
| Raymond James Financial, Inc. | 816 | 42,587 | ||||||
| Arthur J Gallagher & Co. | 871 | 40,876 | ||||||
| UDR, Inc. | 1,669 | 38,971 | ||||||
| Essex Property Trust, Inc. | 257 | 36,882 | ||||||
| Waddell & Reed Financial, Inc. — Class A | 565 | 36,793 | ||||||
| Reinsurance Group of America, Inc. — | ||||||||
| Class A | 471 | 36,460 | ||||||
| Rayonier, Inc. | 838 | 35,281 | ||||||
| Eaton Vance Corp. | 805 | 34,446 | ||||||
| MSCI, Inc. — Class A* | 782 | 34,189 | ||||||
| Signature Bank* | 309 | 33,192 | ||||||
| Liberty Property Trust | 972 | 32,921 | ||||||
| SEI Investments Co. | 947 | 32,889 | ||||||
| Duke Realty Corp. | 2,166 | 32,577 | ||||||
| Camden Property Trust | 564 | 32,080 | ||||||
| East West Bancorp, Inc. | 915 | 31,997 | ||||||
| SVB Financial Group* | 304 | 31,877 | ||||||
| WR Berkley Corp. | 731 | 31,718 | ||||||
| Extra Space Storage, Inc. | 732 | 30,839 | ||||||
| HCC Insurance Holdings, Inc. | 668 | 30,821 | ||||||
| Jones Lang LaSalle, Inc. | 297 | 30,410 | ||||||
| CBOE Holdings, Inc. | 583 | 30,293 | ||||||
| Mid-America Apartment | ||||||||
| Communities, Inc. | 494 | 30,006 | ||||||
| Alexandria Real Estate Equities, Inc. | 471 | 29,965 | ||||||
| Regency Centers Corp. | 608 | 28,150 | ||||||
| Senior Housing Properties Trust | 1,254 | 27,876 | ||||||
| BRE Properties, Inc. | 509 | 27,847 | ||||||
| Old Republic International Corp. | 1,610 | 27,805 | ||||||
| Kilroy Realty Corp. | 548 | 27,499 | ||||||
| American Financial Group, Inc. | 472 | 27,244 | ||||||
| Taubman Centers, Inc. | 420 | 26,846 | ||||||
| Protective Life Corp. | 526 | 26,647 | ||||||
| Hospitality Properties Trust | 983 | 26,570 | ||||||
| Cullen/Frost Bankers, Inc. | 353 | 26,274 | ||||||
| City National Corp. | 317 | 25,113 | ||||||
| First Niagara Financial Group, Inc. | 2,350 | 24,957 | ||||||
| Brown & Brown, Inc. | 792 | 24,861 | ||||||
| Corrections Corporation of America | 772 | 24,758 | ||||||
| National Retail Properties, Inc. | 807 | 24,476 | ||||||
| FirstMerit Corp. | 1,093 | 24,297 | ||||||
| Omega Healthcare Investors, Inc. | 813 | 24,227 | ||||||
| Commerce Bancshares, Inc. | 539 | 24,204 | ||||||
| Prosperity Bancshares, Inc. | 381 | 24,152 | ||||||
| Synovus Financial Corp. | 6,461 | 23,260 | ||||||
| BioMed Realty Trust, Inc. | 1,273 | 23,067 | ||||||
| American Campus Communities, Inc. | 691 | 22,257 | ||||||
| Highwoods Properties, Inc. | 593 | 21,449 | ||||||
| Weingarten Realty Investors | 741 | 20,318 | ||||||
| Home Properties, Inc. | 377 | 20,215 | ||||||
| First American Financial Corp. | 705 | 19,881 | ||||||
| Hancock Holding Co. | 542 | 19,881 | ||||||
| StanCorp Financial Group, Inc. | 288 | 19,080 | ||||||
| Associated Banc-Corp. | 1,079 | 18,775 | ||||||
| Webster Financial Corp. | 598 | 18,646 | ||||||
| First Horizon National Corp. | 1,570 | 18,291 | ||||||
| Federated Investors, Inc. — Class B | 629 | 18,115 | ||||||
| Aspen Insurance Holdings Ltd. | 433 | 17,887 | ||||||
| TCF Financial Corp. | 1,092 | 17,745 | ||||||
| Bank of Hawaii Corp. | 292 | 17,269 | ||||||
| Hanover Insurance Group, Inc. | 288 | 17,196 | ||||||
| Fulton Financial Corp. | 1,281 | 16,755 | ||||||
| Primerica, Inc. | 367 | 15,748 | ||||||
| Washington Federal, Inc. | 671 | 15,628 | ||||||
| BancorpSouth, Inc. | 554 | 14,083 | ||||||
| Kemper Corp. | 340 | 13,899 | ||||||
| Corporate Office Properties Trust | 584 | 13,835 | ||||||
| Valley National Bancorp1 | 1,322 | 13,379 | ||||||
| Cathay General Bancorp | 488 | 13,044 | ||||||
| Apollo Investment Corp. | 1,496 | 12,686 | ||||||
| Mack-Cali Realty Corp. | 583 | 12,523 | ||||||
| Janus Capital Group, Inc. | 991 | 12,259 | ||||||
| Trustmark Corp. | 448 | 12,024 | ||||||
| Mercury General Corp. | 238 | 11,831 | ||||||
| Alexander & Baldwin, Inc. | 280 | 11,684 | ||||||
| Potlatch Corp. | 266 | 11,103 | ||||||
| Westamerica Bancorporation | 179 | 10,106 | ||||||
| International Bancshares Corp. | 380 | 10,028 | ||||||
| Greenhill & Company, Inc. | 170 | 9,850 | ||||||
| Equity One, Inc. | 421 | 9,447 | ||||||
| Astoria Financial Corp. | 555 | 7,676 | ||||||
| Total Financials | 2,277,365 | |||||||
| INDUSTRIALS - 10.2% | ||||||||
| B/E Aerospace, Inc.* | 653 | 56,831 | ||||||
| Towers Watson & Co. — Class A | 430 | 54,872 | ||||||
| Fortune Brands Home & Security, Inc. | 1,105 | 50,498 | ||||||
| United Rentals, Inc.* | 617 | 48,095 | ||||||
| Wabtec Corp. | 644 | 47,829 | ||||||
| J.B. Hunt Transport Services, Inc. | 609 | 47,076 | ||||||
| Manpowergroup, Inc. | 529 | 45,420 | ||||||
| IDEX Corp. | 536 | 39,583 | ||||||
| Donaldson Company, Inc. | 898 | 39,026 | ||||||
| Hubbell, Inc. — Class B | 357 | 38,878 | ||||||
| Lincoln Electric Holdings, Inc. | 540 | 38,523 | ||||||
| Kirby Corp.* | 374 | 37,119 | ||||||
| AGCO Corp. | 603 | 35,692 | ||||||
| Waste Connections, Inc. | 817 | 35,646 | ||||||
| Alaska Air Group, Inc. | 461 | 33,824 | ||||||
| Carlisle Companies, Inc. | 420 | 33,348 | ||||||
| Genesee & Wyoming, Inc. — Class A* | 337 | 32,369 | ||||||
| Graco, Inc. | 405 | 31,639 | ||||||
| KBR, Inc. | 982 | 31,316 | ||||||
| Terex Corp. | 736 | 30,905 | ||||||
| 64 | THE RYDEX FUNDS ANNUAL REPORT | SEE NOTES TO FINANCIAL STATEMENTS. |
| SCHEDULE OF INVESTMENTS (continued) | December 31, 2013 |
| MID-CAP 1.5x STRATEGY FUND |
| Shares | Value | |||||||
| Acuity Brands, Inc. | 280 | $ | 30,610 | |||||
| Nordson Corp. | 402 | 29,869 | ||||||
| Huntington Ingalls Industries, Inc. | 330 | 29,703 | ||||||
| SPX Corp. | 297 | 29,584 | ||||||
| Timken Co. | 523 | 28,802 | ||||||
| Oshkosh Corp. | 570 | 28,717 | ||||||
| Trinity Industries, Inc. | 519 | 28,296 | ||||||
| AO Smith Corp. | 506 | 27,294 | ||||||
| Valmont Industries, Inc. | 182 | 27,140 | ||||||
| Copart, Inc.* | 739 | 27,084 | ||||||
| Kennametal, Inc. | 517 | 26,920 | ||||||
| Triumph Group, Inc. | 349 | 26,548 | ||||||
| ITT Corp. | 606 | 26,313 | ||||||
| URS Corp. | 493 | 26,124 | ||||||
| MSC Industrial Direct Company, Inc. — | ||||||||
| Class A | 322 | 26,040 | ||||||
| Lennox International, Inc. | 304 | 25,858 | ||||||
| Alliant Techsystems, Inc. | 209 | 25,431 | ||||||
| RR Donnelley & Sons Co. | 1,209 | 24,519 | ||||||
| Old Dominion Freight Line, Inc.* | 460 | 24,389 | ||||||
| Exelis, Inc. | 1,255 | 23,920 | ||||||
| Regal-Beloit Corp. | 303 | 22,337 | ||||||
| Clean Harbors, Inc.* | 367 | 22,005 | ||||||
| CLARCOR, Inc. | 337 | 21,686 | ||||||
| Crane Co. | 321 | 21,587 | ||||||
| Esterline Technologies Corp.* | 205 | 20,902 | ||||||
| AECOM Technology Corp.* | 651 | 19,159 | ||||||
| Woodward, Inc. | 403 | 18,381 | ||||||
| Landstar System, Inc. | 308 | 17,695 | ||||||
| Deluxe Corp. | 333 | 17,379 | ||||||
| Watsco, Inc. | 179 | 17,195 | ||||||
| Corporate Executive Board Co. | 222 | 17,189 | ||||||
| GATX Corp. | 310 | 16,173 | ||||||
| Harsco Corp. | 538 | 15,080 | ||||||
| Con-way, Inc. | 377 | 14,971 | ||||||
| Rollins, Inc. | 427 | 12,934 | ||||||
| JetBlue Airways Corp.* | 1,440 | 12,312 | ||||||
| HNI Corp. | 303 | 11,765 | ||||||
| Herman Miller, Inc. | 396 | 11,690 | ||||||
| FTI Consulting, Inc.* | 269 | 11,067 | ||||||
| Brink’s Co. | 318 | 10,857 | ||||||
| Mine Safety Appliances Co. | 208 | 10,652 | ||||||
| UTI Worldwide, Inc. | 605 | 10,624 | ||||||
| General Cable Corp. | 328 | 9,646 | ||||||
| Granite Construction, Inc. | 235 | 8,220 | ||||||
| Matson, Inc. | 289 | 7,546 | ||||||
| Werner Enterprises, Inc. | 302 | 7,468 | ||||||
| Total Industrials | 1,738,170 | |||||||
| INFORMATION TECHNOLOGY - 9.5% | ||||||||
| Trimble Navigation Ltd.* | 1,715 | 59,511 | ||||||
| Equinix, Inc.* | 331 | 58,736 | ||||||
| 3D Systems Corp.* | 632 | 58,732 | ||||||
| ANSYS, Inc.* | 613 | 53,454 | ||||||
| Cree, Inc.* | 798 | 49,930 | ||||||
| Gartner, Inc.* | 615 | 43,695 | ||||||
| Synopsys, Inc.* | 1,028 | 41,706 | ||||||
| Avnet, Inc. | 910 | 40,140 | ||||||
| NCR Corp.* | 1,102 | 37,534 | ||||||
| Arrow Electronics, Inc.* | 669 | 36,293 | ||||||
| Skyworks Solutions, Inc.* | 1,250 | 35,700 | ||||||
| Jack Henry & Associates, Inc. | 566 | 33,513 | ||||||
| Concur Technologies, Inc.* | 316 | 32,605 | ||||||
| Solera Holdings, Inc. | 457 | 32,337 | ||||||
| Global Payments, Inc. | 488 | 31,715 | ||||||
| Broadridge Financial Solutions, Inc. | 788 | 31,142 | ||||||
| Informatica Corp.* | 720 | 29,880 | ||||||
| Rackspace Hosting, Inc.* | 760 | 29,739 | ||||||
| FactSet Research Systems, Inc. | 268 | 29,099 | ||||||
| MICROS Systems, Inc.* | 502 | 28,800 | ||||||
| PTC, Inc.* | 790 | 27,958 | ||||||
| Cadence Design Systems, Inc.* | 1,910 | 26,778 | ||||||
| WEX, Inc.* | 261 | 25,847 | ||||||
| AOL, Inc.* | 521 | 24,289 | ||||||
| Ingram Micro, Inc. — Class A* | 1,019 | 23,906 | ||||||
| TIBCO Software, Inc.* | 1,022 | 22,975 | ||||||
| Leidos Holdings, Inc. | 487 | 22,641 | ||||||
| Teradyne, Inc.* | 1,270 | 22,377 | ||||||
| CoreLogic, Inc.* | 625 | 22,206 | ||||||
| Atmel Corp.* | 2,824 | 22,112 | ||||||
| CommVault Systems, Inc.* | 294 | 22,015 | ||||||
| SunEdison, Inc.* | 1,630 | 21,272 | ||||||
| Lender Processing Services, Inc. | 564 | 21,082 | ||||||
| NeuStar, Inc. — Class A* | 417 | 20,792 | ||||||
| National Instruments Corp. | 648 | 20,748 | ||||||
| JDS Uniphase Corp.* | 1,550 | 20,119 | ||||||
| VeriFone Systems, Inc.* | 728 | 19,525 | ||||||
| Riverbed Technology, Inc.* | 1,075 | 19,436 | ||||||
| Acxiom Corp.* | 503 | 18,601 | ||||||
| Zebra Technologies Corp. — Class A* | 334 | 18,063 | ||||||
| DST Systems, Inc. | 195 | 17,694 | ||||||
| ACI Worldwide, Inc.* | 256 | 16,640 | ||||||
| SolarWinds, Inc.* | 436 | 16,494 | ||||||
| Ciena Corp.* | 686 | 16,416 | ||||||
| Compuware Corp. | 1,440 | 16,142 | ||||||
| Advanced Micro Devices, Inc.* | 4,090 | 15,828 | ||||||
| Mentor Graphics Corp. | 648 | 15,597 | ||||||
| Lexmark International, Inc. — Class A | 416 | 14,776 | ||||||
| Convergys Corp. | 674 | 14,188 | ||||||
| Fair Isaac Corp. | 225 | 14,139 | ||||||
| Diebold, Inc. | 419 | 13,831 | ||||||
| Plantronics, Inc. | 289 | 13,424 | ||||||
| Rovi Corp.* | 674 | 13,271 | ||||||
| Tech Data Corp.* | 246 | 12,694 | ||||||
| International Rectifier Corp.* | 470 | 12,253 | ||||||
| Vishay Intertechnology, Inc.* | 901 | 11,947 | ||||||
| Semtech Corp.* | 457 | 11,553 | ||||||
| Silicon Laboratories, Inc.* | 265 | 11,477 | ||||||
| Fairchild Semiconductor International, Inc. — | ||||||||
| Class A* | 839 | 11,201 | ||||||
| Itron, Inc.* | 264 | 10,938 | ||||||
| Polycom, Inc.* | 951 | 10,680 | ||||||
| ADTRAN, Inc. | 384 | 10,372 | ||||||
| Intersil Corp. — Class A | 848 | 9,727 | ||||||
| Cypress Semiconductor Corp. | 925 | 9,713 | ||||||
| SEE NOTES TO FINANCIAL STATEMENTS. | THE RYDEX FUNDS ANNUAL REPORT | 65 |
| SCHEDULE OF INVESTMENTS (continued) | December 31, 2013 |
| MID-CAP 1.5x STRATEGY FUND |
| Shares | Value | |||||||
| ValueClick, Inc.* | 414 | $ | 9,675 | |||||
| RF Micro Devices, Inc.* | 1,873 | 9,665 | ||||||
| Advent Software, Inc. | 266 | 9,307 | ||||||
| Integrated Device Technology, Inc.* | 912 | 9,293 | ||||||
| Science Applications International Corp. | 272 | 8,995 | ||||||
| InterDigital, Inc. | 270 | 7,962 | ||||||
| ManTech International Corp. — Class A | 158 | 4,729 | ||||||
| Total Information Technology | 1,617,624 | |||||||
| CONSUMER DISCRETIONARY - 8.4% | ||||||||
| Tractor Supply Co. | 924 | 71,683 | ||||||
| LKQ Corp.* | 1,995 | 65,636 | ||||||
| Polaris Industries, Inc. | 431 | 62,771 | ||||||
| Advance Auto Parts, Inc. | 479 | 53,016 | ||||||
| Jarden Corp.* | 798 | 48,958 | ||||||
| Hanesbrands, Inc. | 660 | 46,378 | ||||||
| Under Armour, Inc. — Class A* | 530 | 46,269 | ||||||
| Signet Jewelers Ltd. | 529 | 41,632 | ||||||
| Foot Locker, Inc. | 988 | 40,942 | ||||||
| Dick’s Sporting Goods, Inc. | 680 | 39,508 | ||||||
| Toll Brothers, Inc.* | 1,059 | 39,183 | ||||||
| Williams-Sonoma, Inc. | 594 | 34,618 | ||||||
| Panera Bread Co. — Class A* | 182 | 32,158 | ||||||
| Tupperware Brands Corp. | 340 | 32,140 | ||||||
| Gentex Corp. | 962 | 31,736 | ||||||
| Brunswick Corp. | 600 | 27,636 | ||||||
| AMC Networks, Inc. — Class A* | 389 | 26,495 | ||||||
| Carter’s, Inc. | 364 | 26,132 | ||||||
| Domino’s Pizza, Inc. | 371 | 25,840 | ||||||
| NVR, Inc.* | 25 | 25,650 | ||||||
| Service Corporation International | 1,403 | 25,437 | ||||||
| Sotheby’s | 454 | 24,153 | ||||||
| Cinemark Holdings, Inc. | 687 | 22,898 | ||||||
| Lamar Advertising Co. — Class A* | 438 | 22,886 | ||||||
| Tempur Sealy International, Inc.* | 406 | 21,908 | ||||||
| Cabela’s, Inc.* | 310 | 20,665 | ||||||
| Brinker International, Inc. | 444 | 20,575 | ||||||
| Bally Technologies, Inc.* | 259 | 20,318 | ||||||
| Chico’s FAS, Inc. | 1,050 | 19,782 | ||||||
| Deckers Outdoor Corp.* | 227 | 19,172 | ||||||
| JC Penney Company, Inc.*,1 | 2,019 | 18,474 | ||||||
| CST Brands, Inc. | 502 | 18,433 | ||||||
| Apollo Education Group, Inc. — Class A* | 666 | 18,195 | ||||||
| Ascena Retail Group, Inc.* | 859 | 18,176 | ||||||
| John Wiley & Sons, Inc. — Class A | 310 | 17,111 | ||||||
| Abercrombie & Fitch Co. — Class A | 510 | 16,784 | ||||||
| Office Depot, Inc.* | 3,168 | 16,759 | ||||||
| DreamWorks Animation SKG, Inc. — | ||||||||
| Class A* | 468 | 16,614 | ||||||
| Thor Industries, Inc. | 297 | 16,403 | ||||||
| Wendy’s Co. | 1,875 | 16,350 | ||||||
| American Eagle Outfitters, Inc. | 1,124 | 16,186 | ||||||
| Cheesecake Factory, Inc. | 316 | 15,253 | ||||||
| Aaron’s, Inc. | 502 | 14,759 | ||||||
| HSN, Inc. | 223 | 13,893 | ||||||
| DeVry Education Group, Inc. | 382 | 13,561 | ||||||
| New York Times Co. — Class A | 840 | 13,331 | ||||||
| Meredith Corp. | 247 | 12,795 | ||||||
| Big Lots, Inc.* | 382 | 12,335 | ||||||
| Life Time Fitness, Inc.* | 262 | 12,314 | ||||||
| Guess?, Inc. | 396 | 12,304 | ||||||
| Murphy USA, Inc.* | 293 | 12,177 | ||||||
| Rent-A-Center, Inc. — Class A | 355 | 11,836 | ||||||
| ANN, Inc.* | 309 | 11,297 | ||||||
| KB Home | 554 | 10,127 | ||||||
| Bob Evans Farms, Inc. | 180 | 9,106 | ||||||
| Valassis Communications, Inc. | 259 | 8,871 | ||||||
| MDC Holdings, Inc. | 263 | 8,479 | ||||||
| Matthews International Corp. — Class A | 181 | 7,712 | ||||||
| International Speedway Corp. — Class A | 183 | 6,495 | ||||||
| Scientific Games Corp. — Class A* | 319 | 5,401 | ||||||
| Total Consumer Discretionary | 1,437,706 | |||||||
| HEALTH CARE - 5.3% | ||||||||
| Henry Schein, Inc.* | 570 | 65,128 | ||||||
| Endo Health Solutions, Inc.* | 761 | 51,337 | ||||||
| Universal Health Services, Inc. — Class B | 592 | 48,105 | ||||||
| Mettler-Toledo International, Inc.* | 194 | 47,062 | ||||||
| ResMed, Inc.1 | 948 | 44,632 | ||||||
| Omnicare, Inc. | 681 | 41,105 | ||||||
| Hologic, Inc.* | 1,810 | 40,454 | ||||||
| Cooper Companies, Inc. | 320 | 39,629 | ||||||
| Salix Pharmaceuticals Ltd.* | 420 | 37,775 | ||||||
| IDEXX Laboratories, Inc.* | 343 | 36,485 | ||||||
| MEDNAX, Inc.* | 664 | 35,444 | ||||||
| United Therapeutics Corp.* | 309 | 34,942 | ||||||
| Cubist Pharmaceuticals, Inc.* | 492 | 33,884 | ||||||
| Covance, Inc.* | 372 | 32,758 | ||||||
| Teleflex, Inc. | 269 | 25,248 | ||||||
| Community Health Systems, Inc.* | 633 | 24,858 | ||||||
| Health Management Associates, Inc. — | ||||||||
| Class A* | 1,758 | 23,030 | ||||||
| Techne Corp. | 222 | 21,017 | ||||||
| WellCare Health Plans, Inc.* | 292 | 20,562 | ||||||
| Mallinckrodt plc* | 378 | 19,754 | ||||||
| STERIS Corp. | 392 | 18,836 | ||||||
| VCA Antech, Inc.* | 586 | 18,377 | ||||||
| Charles River Laboratories | ||||||||
| International, Inc.* | 320 | 16,973 | ||||||
| LifePoint Hospitals, Inc.* | 315 | 16,645 | ||||||
| Bio-Rad Laboratories, Inc. — Class A* | 134 | 16,564 | ||||||
| Allscripts Healthcare Solutions, Inc.* | 1,053 | 16,280 | ||||||
| Hill-Rom Holdings, Inc. | 386 | 15,957 | ||||||
| Health Net, Inc.* | 531 | 15,755 | ||||||
| Owens & Minor, Inc. | 416 | 15,209 | ||||||
| Thoratec Corp.* | 377 | 13,798 | ||||||
| HMS Holdings Corp.* | 588 | 13,365 | ||||||
| Masimo Corp.* | 346 | 10,114 | ||||||
| Total Health Care | 911,082 | |||||||
| MATERIALS - 4.2% | ||||||||
| Rock Tenn Co. — Class A | 481 | 50,510 | ||||||
| Ashland, Inc. | 479 | 46,483 | ||||||
| Packaging Corporation of America | 648 | 41,005 | ||||||
| 66 | THE RYDEX FUNDS ANNUAL REPORT | SEE NOTES TO FINANCIAL STATEMENTS. |
| SCHEDULE OF INVESTMENTS (continued) | December 31, 2013 |
| MID-CAP 1.5x STRATEGY FUND |
| Shares | Value | |||||||
| Reliance Steel & Aluminum Co. | 517 | $ | 39,209 | |||||
| Valspar Corp. | 533 | 37,999 | ||||||
| RPM International, Inc. | 883 | 36,653 | ||||||
| Albemarle Corp. | 538 | 34,104 | ||||||
| Martin Marietta Materials, Inc. | 308 | 30,781 | ||||||
| Aptargroup, Inc. | 434 | 29,430 | ||||||
| Steel Dynamics, Inc. | 1,470 | 28,724 | ||||||
| Sonoco Products Co. | 680 | 28,370 | ||||||
| NewMarket Corp. | 80 | 26,732 | ||||||
| eagle Materials, Inc. | 330 | 25,552 | ||||||
| Cytec Industries, Inc. | 240 | 22,358 | ||||||
| Carpenter Technology Corp. | 349 | 21,708 | ||||||
| Cabot Corp. | 391 | 20,097 | ||||||
| Domtar Corp. | 210 | 19,811 | ||||||
| Royal Gold, Inc. | 429 | 19,764 | ||||||
| Scotts Miracle-Gro Co. — Class A | 287 | 17,857 | ||||||
| Compass Minerals International, Inc. | 223 | 17,851 | ||||||
| Louisiana-Pacific Corp.* | 939 | 17,381 | ||||||
| Sensient Technologies Corp. | 329 | 15,963 | ||||||
| Commercial Metals Co. | 775 | 15,756 | ||||||
| Olin Corp. | 526 | 15,175 | ||||||
| Worthington Industries, Inc. | 355 | 14,938 | ||||||
| Silgan Holdings, Inc. | 291 | 13,974 | ||||||
| Minerals Technologies, Inc. | 231 | 13,876 | ||||||
| Greif, Inc. — Class A | 206 | 10,794 | ||||||
| Intrepid Potash, Inc.* | 368 | 5,829 | ||||||
| Total Materials | 718,684 | |||||||
| ENERGY - 3.4% | ||||||||
| HollyFrontier Corp. | 1,323 | 65,740 | ||||||
| Cimarex energy Co. | 575 | 60,323 | ||||||
| Oceaneering International, Inc. | 720 | 56,794 | ||||||
| Oil States International, Inc.* | 365 | 37,128 | ||||||
| SM energy Co. | 443 | 36,818 | ||||||
| Gulfport energy Corp.* | 554 | 34,985 | ||||||
| energen Corp. | 484 | 34,243 | ||||||
| Dresser-Rand Group, Inc.* | 503 | 29,994 | ||||||
| Dril-Quip, Inc.* | 269 | 29,571 | ||||||
| Superior energy Services, Inc.* | 1,057 | 28,127 | ||||||
| Patterson-UTI energy, Inc. | 958 | 24,257 | ||||||
| Atwood Oceanics, Inc.* | 387 | 20,662 | ||||||
| World Fuel Services Corp. | 476 | 20,544 | ||||||
| Rosetta Resources, Inc.* | 405 | 19,456 | ||||||
| Tidewater, Inc. | 326 | 19,322 | ||||||
| CARBO Ceramics, Inc. | 131 | 15,265 | ||||||
| Helix energy Solutions Group, Inc.* | 650 | 15,067 | ||||||
| Unit Corp.* | 286 | 14,763 | ||||||
| Alpha Natural Resources, Inc.* | 1,467 | 10,474 | ||||||
| Bill Barrett Corp.* | 320 | 8,570 | ||||||
| Total Energy | 582,103 | |||||||
| UTILITIES - 2.6% | ||||||||
| OGe energy Corp. | 1,316 | 44,612 | ||||||
| National Fuel Gas Co. | 553 | 39,484 | ||||||
| MDU Resources Group, Inc. | 1,258 | 38,432 | ||||||
| Alliant energy Corp. | 735 | 37,926 | ||||||
| UGI Corp. | 760 | 31,510 | ||||||
| Aqua America, Inc. | 1,178 | 27,789 | ||||||
| Atmos energy Corp. | 608 | 27,615 | ||||||
| Westar energy, Inc. | 847 | 27,248 | ||||||
| Questar Corp. | 1,167 | 26,829 | ||||||
| Great Plains energy, Inc. | 1,016 | 24,628 | ||||||
| Vectren Corp. | 546 | 19,383 | ||||||
| Cleco Corp. | 403 | 18,788 | ||||||
| Hawaiian electric Industries, Inc. | 660 | 17,200 | ||||||
| IDACORP, Inc. | 330 | 17,107 | ||||||
| Black Hills Corp. | 298 | 15,648 | ||||||
| WGL Holdings, Inc. | 348 | 13,941 | ||||||
| PNM Resources, Inc. | 533 | 12,856 | ||||||
| Total Utilities | 440,996 | |||||||
| CONSUMER STAPLES - 2.4% | ||||||||
| Green Mountain Coffee Roasters, Inc.* ,1 | 871 | 65,829 | ||||||
| Church & Dwight Company, Inc. | 926 | 61,375 | ||||||
| Energizer Holdings, Inc. | 412 | 44,595 | ||||||
| Ingredion, Inc. | 507 | 34,709 | ||||||
| Hain Celestial Group, Inc.* | 317 | 28,777 | ||||||
| Hillshire Brands Co. | 818 | 27,354 | ||||||
| WhiteWave Foods Co. — Class A* | 1,152 | 26,427 | ||||||
| Flowers Foods, Inc. | 1,161 | 24,927 | ||||||
| United Natural Foods, Inc.* | 325 | 24,502 | ||||||
| Harris Teeter Supermarkets, Inc. | 332 | 16,384 | ||||||
| Lancaster Colony Corp. | 130 | 11,460 | ||||||
| Dean Foods Co.* | 626 | 10,761 | ||||||
| Post Holdings, Inc.* | 217 | 10,692 | ||||||
| SUPERVALU, Inc.* | 1,313 | 9,572 | ||||||
| Universal Corp. | 151 | 8,245 | ||||||
| Tootsie Roll Industries, Inc. | 135 | 4,393 | ||||||
| Total Consumer Staples | 410,002 | |||||||
| TELECOMMUNICATION SERVICES - 0.3% | ||||||||
| tw telecom, Inc. — Class A* | 956 | 29,130 | ||||||
| Telephone & Data Systems, Inc. | 653 | 16,834 | ||||||
| Total Telecommunication Services | 45,964 | |||||||
| Total Common Stocks | ||||||||
| (Cost $7,054,679) | 10,179,696 | |||||||
| Face | ||||||||
| Amount | ||||||||
| REPURCHASE AGREEMENTS††,2 - 18.2% | ||||||||
| Credit Suisse Group | ||||||||
| issued 12/31/13 at 0.00% | ||||||||
| due 01/02/143 | $ | 1,335,675 | 1,335,675 | |||||
| Deutsche Bank | ||||||||
| issued 12/31/13 at 0.01% | ||||||||
| due 01/02/14 | 593,597 | 593,597 | ||||||
| HSBC Group | ||||||||
| issued 12/31/13 at 0.01% | ||||||||
| due 01/02/14 | 593,597 | 593,597 | ||||||
| Mizuho Financial Group, Inc. | ||||||||
| issued 12/31/13 at 0.01% | ||||||||
| due 01/02/14 | 590,912 | 590,912 | ||||||
| Total Repurchase Agreements | ||||||||
| (Cost $3,113,781) | 3,113,781 | |||||||
| SEE NOTES TO FINANCIAL STATEMENTS. | THE RYDEX FUNDS ANNUAL REPORT | 67 |
| SCHEDULE OF INVESTMENTS (concluded) | December 31, 2013 |
| MID-CAP 1.5x STRATEGY FUND |
| Face | ||||||||
| Amount | Value | |||||||
| SECURITIES LENDING COLLATERAL††,4 - 0.9% | ||||||||
| Repurchase Agreements | ||||||||
| HSBC Securities, Inc. | ||||||||
| issued 12/31/13 at 0.01% | ||||||||
| due 01/02/14 | $ | 131,842 | $ | 131,842 | ||||
| Deutsche Bank Securities, Inc. | ||||||||
| issued 12/31/13 at 0.02% | ||||||||
| due 01/02/14 | 19,433 | 19,433 | ||||||
| Total Securities Lending Collateral | ||||||||
| (Cost $151,275) | 151,275 | |||||||
| Total Investments - 78.7% | ||||||||
| (Cost $10,319,735) | $ | 13,444,752 | ||||||
| Other Assets & Liabilities, net - 21.3% | 3,630,909 | |||||||
| Total Net Assets - 100.0% | $ | 17,075,661 | ||||||
| Unrealized | ||||||||
| Contracts | Gain | |||||||
| EQUITY FUTURES CONTRACTS PURCHASED† | ||||||||
| March 2014 S&P MidCap 400 Index | ||||||||
| Mini Futures Contracts | ||||||||
| (Aggregate Value of | ||||||||
| Contracts $3,620,430) | 27 | $ | 129,370 | |||||
| Units | ||||||||
| EQUITY INDEX SWAP AGREEMENTS†† | ||||||||
| Credit Suisse Capital, LLC | ||||||||
| January 2014 S&P MidCap 400 Index Swap, | ||||||||
| Terminating 01/28/145 | ||||||||
| (Notional Value $5,386,567) | 4,012 | $ | 30,712 | |||||
| Barclays Bank plc | ||||||||
| January 2014 S&P MidCap 400 Index Swap, | ||||||||
| Terminating 01/31/145 | ||||||||
| (Notional Value $5,714,610) | 4,257 | 18,438 | ||||||
| Goldman Sachs International | ||||||||
| January 2014 S&P MidCap 400 Index Swap, | ||||||||
| Terminating 01/28/145 | ||||||||
| (Notional Value $838,718) | 625 | 4,799 | ||||||
| (Total Notional Value | ||||||||
| $11,939,895) | $ | 53,949 | ||||||
| * | Non-income producing security. |
| † | Value determined based on Level 1 inputs — See Note 4. |
| †† | Value determined based on Level 2 inputs — See Note 4. |
| 1 | All or portion of this security is on loan at December 31, 2013 — See Note 10. |
| 2 | Repurchase Agreements — See Note 5. |
| 3 | All or a portion of this security is pledged as equity index swap collateral at December 31, 2013. |
| 4 | Securities lending collateral — See Note 10. |
| 5 | Total Return based on S&P MidCap 400 Index +/- financing at a variable rate. |
plc — Public Limited Company
| 68 | THE RYDEX FUNDS ANNUAL REPORT | SEE NOTES TO FINANCIAL STATEMENTS. |
| MID-CAP 1.5x STRATEGY FUND |
| STATEMENT OF ASSETS |
| AND LIABILITIES |
| December 31, 2013 |
| Assets: | ||||
| Investments, at value - including $148,091 of securities loaned | ||||
| (cost $7,054,679) | $ | 10,179,696 | ||
| Repurchase agreements, at value | ||||
| (cost $3,265,056) | 3,265,056 | |||
| Total investments | ||||
| (cost $10,319,735) | 13,444,752 | |||
| Segregated cash with broker | 588,500 | |||
| Unrealized appreciation on swap agreements | 53,949 | |||
| Receivables: | ||||
| Securities sold | 10,003,715 | |||
| Fund shares sold | 108,809 | |||
| Dividends | 17,135 | |||
| Variation margin | 13,500 | |||
| Interest and securities lending income | 65 | |||
| Total assets | 24,230,425 | |||
| Liabilities: | ||||
| Payable for: | ||||
| Fund shares redeemed | 6,956,044 | |||
| Upon return of securities loaned | 151,275 | |||
| Management fees | 16,327 | |||
| Transfer agent and administrative fees | 4,535 | |||
| Investor service fees | 4,535 | |||
| Portfolio accounting fees | 1,814 | |||
| Miscellaneous | 20,234 | |||
| Total liabilities | 7,154,764 | |||
| Net assets | $ | 17,075,661 | ||
| Net assets consist of: | ||||
| Paid in capital | $ | 14,525,260 | ||
| Undistributed net investment income | 10,667 | |||
| Accumulated net realized loss on investments | (768,602 | ) | ||
| Net unrealized appreciation on investments | 3,308,336 | |||
| Net assets | $ | 17,075,661 | ||
| Capital shares outstanding | 481,404 | |||
| Net asset value per share | $ | 35.47 |
| STATEMENT OF |
| OPERATIONS |
| Year ended December 31, 2013 |
| Investment Income: | ||||
| Dividends | $ | 151,372 | ||
| Interest | 1,617 | |||
| Income from securities lending, net | 458 | |||
| Total investment income | 153,447 | |||
| Expenses: | ||||
| Management fees | 122,153 | |||
| Transfer agent and administrative fees | 33,931 | |||
| Investor service fees | 33,931 | |||
| Portfolio accounting fees | 13,572 | |||
| Professional fees | 12,216 | |||
| Custodian fees | 1,557 | |||
| Trustees’ fees* | 1,315 | |||
| Line of credit interest expense | 48 | |||
| Miscellaneous | 10,976 | |||
| Total expenses | 229,699 | |||
| Net investment loss | (76,252 | ) | ||
| Net Realized and Unrealized Gain (Loss): | ||||
| Net realized gain (loss) on: | ||||
| Investments | 1,646,009 | |||
| Swap agreements | 1,844,276 | |||
| Futures contracts | 478,607 | |||
| Net realized gain | 3,968,892 | |||
| Net change in unrealized appreciation (depreciation) on: | ||||
| Investments | 744,080 | |||
| Swap agreements | 3,515 | |||
| Futures contracts | 8,951 | |||
| Net change in unrealized appreciation (depreciation) | 756,546 | |||
| Net realized and unrealized gain | 4,725,438 | |||
| Net increase in net assets resulting from operations | $ | 4,649,186 |
* Relates to Trustees not deemed “interested persons” within the meaning of Section 2(a)(19) of the 1940 Act.
| SEE NOTES TO FINANCIAL STATEMENTS. | THE RYDEX FUNDS ANNUAL REPORT | 69 |
| MID-CAP 1.5x STRATEGY FUND |
STATEMENTS OF CHANGES IN NET ASSETS
| Year Ended | Year Ended | |||||||
| December 31, | December 31, | |||||||
| 2013 | 2012 | |||||||
| Increase (Decrease) In Net Assets From Operations: | ||||||||
| Net investment loss | $ | (76,252 | ) | $ | (62,481 | ) | ||
| Net realized gain on investments | 3,968,892 | 1,562,283 | ||||||
| Net change in unrealized appreciation (depreciation) on investments | 756,546 | 992,963 | ||||||
| Net increase in net assets resulting from operations | 4,649,186 | 2,492,765 | ||||||
| Capital share transactions: | ||||||||
| Proceeds from sale of shares | 73,594,799 | 62,572,349 | ||||||
| Cost of shares redeemed | (75,218,974 | ) | (63,382,856 | ) | ||||
| Net decrease from capital share transactions | (1,624,175 | ) | (810,507 | ) | ||||
| Net increase in net assets | 3,025,011 | 1,682,258 | ||||||
| Net assets: | ||||||||
| Beginning of year | 14,050,650 | 12,368,392 | ||||||
| End of year | $ | 17,075,661 | $ | 14,050,650 | ||||
| Undistributed net investment income at end of year | $ | 10,667 | $ | 1 | ||||
| Capital share activity: | ||||||||
| Shares sold | 2,441,572 | 2,837,744 | ||||||
| Shares redeemed | (2,555,162 | ) | (2,894,014 | ) | ||||
| Net decrease in shares | (113,590 | ) | (56,270 | ) | ||||
| 70 | THE RYDEX FUNDS ANNUAL REPORT | SEE NOTES TO FINANCIAL STATEMENTS. |
| MID-CAP 1.5x STRATEGY FUND |
| FINANCIAL HIGHLIGHTS |
This table is presented to show selected data for a share outstanding throughout each period and to assist shareholders in evaluating a Fund’s performance for the periods presented.
| Year Ended | Year Ended | Year Ended | Year Ended | Year Ended | ||||||||||||||||
| December 31, | December 31, | December 31, | December 31, | December 31, | ||||||||||||||||
| 2013 | 2012 | 2011 | 2010 | 2009 | ||||||||||||||||
| Per Share Data | ||||||||||||||||||||
| Net asset value, beginning of period | $ | 23.61 | $ | 18.99 | $ | 20.56 | $ | 14.95 | $ | 9.81 | ||||||||||
| Income (loss) from investment operations: | ||||||||||||||||||||
| Net investment lossa | (.17 | ) | (.12 | ) | (.19 | ) | (.13 | ) | (.07 | ) | ||||||||||
| Net gain (loss) on investments (realized and unrealized) | 12.03 | 4.74 | (1.38 | ) | 5.74 | 5.22 | ||||||||||||||
| Total from investment operations | 11.86 | 4.62 | (1.57 | ) | 5.61 | 5.15 | ||||||||||||||
| Less distributions from: | ||||||||||||||||||||
| Net investment income | — | — | — | — | (.01 | ) | ||||||||||||||
| Total distributions | — | — | — | — | (.01 | ) | ||||||||||||||
| Net asset value, end of period | $ | 35.47 | $ | 23.61 | $ | 18.99 | $ | 20.56 | $ | 14.95 | ||||||||||
| Total Returnb | 50.23 | % | 24.33 | % | (7.59 | %) | 37.55 | % | 52.40 | % | ||||||||||
| Ratios/Supplemental Data | ||||||||||||||||||||
| Net assets, end of period (in thousands) | $ | 17,076 | $ | 14,051 | $ | 12,368 | $ | 20,560 | $ | 14,376 | ||||||||||
| Ratios to average net assets: | ||||||||||||||||||||
| Net investment loss | (0.56 | %) | (0.54 | %) | (0.89 | %) | (0.78 | %) | (0.58 | %) | ||||||||||
| Total expenses | 1.69 | % | 1.72 | % | 1.77 | % | 1.71 | % | 1.71 | % | ||||||||||
| Portfolio turnover rate | 279 | % | 247 | % | 222 | % | 176 | % | 61 | % | ||||||||||
| a | Net investment loss per share was computed using average shares outstanding throughout the period. |
| b | Total return does not reflect the impact of any additional fees charged by insurance companies. |
| SEE NOTES TO FINANCIAL STATEMENTS. | THE RYDEX FUNDS ANNUAL REPORT | 71 |
| PERFORMANCE REPORT AND FUND PROFILE (Unaudited) | December 31, 2013 |
INVERSE MID-CAP STRATEGY FUND
OBJECTIVE: Seeks to provide investment results that match, before fees and expenses, the performance of a specific benchmark on a daily basis. The Fund’s current benchmark is the inverse (opposite) of the performance of the S&P MidCap 400® Index (the “underlying index”). The Fund does not seek to achieve its investment objective over a period of time greater than one day.
For the year ended December 31, 2013, Inverse Mid-Cap Strategy Fund returned -27.57%. Over the year, its benchmark, the S&P MidCap 400 Index, returned 33.50%. Inverse Mid-Cap Strategy Fund achieved a daily correlation of 99% to its benchmark of -100% of the daily price movement of the S&P MidCap 400 Index.
Consumer Discretionary and Financials contributed most to performance of the underlying index during the year. No sector detracted, but Telecommunication Services and Utilities contributed least.
Micron Technology, Inc., Netflix, Inc. and Delta Air Lines, Inc. contributed most to performance of the underlying index for the year. Rackspace Hosting, Inc., Edwards Lifesciences Corp. and Teradata Corp. were the largest detractors from performance of the underlying index for the year.
Derivatives in the Fund were used to help provide exposure to the composition of the benchmark in the highest efficient manner and not for hedging purposes.
Due to the compounding of daily returns, leveraged and inverse funds’ returns over periods other than one day will likely differ in amount and possibly direction from the benchmark return for the same period. Investors should monitor their leveraged and inverse funds’ holdings to ensure that they are consistent with their strategies, as frequently as daily.
The effects of compounding may cause the longer-term correlation of the fund to its benchmark to diminish. The apparent discrepancy between the leveraged and unleveraged indices is the result of compounding, which is described briefly on page 6 of this report.
Performance displayed represents past performance, which is no guarantee of future results.
Holdings Diversification (Market Exposure as % of Net Assets)
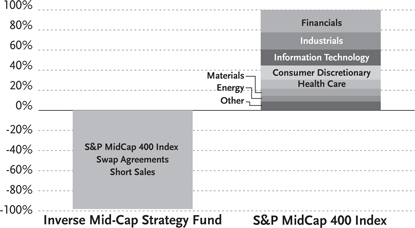
“Holdings Diversification (Market Exposure as % of Net Assets)” excludes any temporary cash investments.
Inception Date: May 3, 2004
The Fund invests principally in derivative investments such as swap agreements and futures contracts.
| 72 | THE RYDEX FUNDS ANNUAL REPORT |
| PERFORMANCE REPORT AND FUND PROFILE (Unaudited) (concluded) |
Cumulative Fund Performance*,†

Average Annual Returns
Periods Ended December 31, 2013*,†
| Since | ||||||||||||
| Inception | ||||||||||||
| 1 Year | 5 Year | (05/03/04) | ||||||||||
| Inverse Mid-Cap Strategy Fund | -27.57 | % | -23.33 | % | -12.62 | % | ||||||
| S&P MidCap 400 Index | 33.50 | % | 21.89 | % | 10.45 | % | ||||||
| * | The performance data above represents past performance that is not predictive of future results. The investment return and principal value of an investment in the Fund will fluctuate so that an investor’s shares, when redeemed, may be worth more or less than their original cost. Returns are historical and include changes in principal and reinvested dividends and capital gains and do not reflect the effect of taxes. The S&P MidCap 400 Index is an unmanaged index and, unlike the Fund, has no management fees or operating expenses to reduce its reported return. |
| † | Returns do not reflect the impact of any additional fees charged by insurance companies. |
| THE RYDEX FUNDS ANNUAL REPORT | 73 |
| SCHEDULE OF INVESTMENTS | December 31, 2013 |
| INVERSE MID-CAP STRATEGY FUND |
| Face | ||||||||
| Amount | Value | |||||||
| FEDERAL AGENCY DISCOUNT NOTES†† - 32.9% | ||||||||
| Farmer Mac1 | ||||||||
| 0.02% due 02/18/14 | $ | 200,000 | $ | 199,994 | ||||
| Federal Farm Credit Bank1 | ||||||||
| 0.01% due 01/10/14 | 100,000 | 100,000 | ||||||
| Total Federal Agency Discount Notes | ||||||||
| (Cost $299,994) | 299,994 | |||||||
| REPURCHASE AGREEMENTS††,2 - 88.0% | ||||||||
| Credit Suisse Group | ||||||||
| issued 12/31/13 at 0.00% | ||||||||
| due 01/02/143 | 442,960 | 442,960 | ||||||
| Deutsche Bank | ||||||||
| issued 12/31/13 at 0.01% | ||||||||
| due 01/02/14 | 119,744 | 119,744 | ||||||
| HSBC Group | ||||||||
| issued 12/31/13 at 0.01% | ||||||||
| due 01/02/14 | 119,744 | 119,744 | ||||||
| Mizuho Financial Group, Inc. | ||||||||
| issued 12/31/13 at 0.01% | ||||||||
| due 01/02/14 | 119,202 | 119,202 | ||||||
| Total Repurchase Agreements | ||||||||
| (Cost $801,650) | 801,650 | |||||||
| Total Investments - 120.9% | ||||||||
| (Cost $1,101,644) | $ | 1,101,644 | ||||||
| Other Assets & Liabilities, net - (20.9)% | (190,582 | ) | ||||||
| Total Net Assets - 100.0% | $ | 911,062 | ||||||
| Unrealized | ||||||||
| Units | Loss | |||||||
| EQUITY INDEX SWAP AGREEMENTS SOLD SHORT†† | ||||||||
| Barclays Bank plc | ||||||||
| January 2014 S&P MidCap 400 Index Swap, | ||||||||
| Terminating 01/31/144 | ||||||||
| (Notional Value $211,275) | 157 | $ | (685 | ) | ||||
| Goldman Sachs International | ||||||||
| January 2014 S&P MidCap 400 Index Swap, | ||||||||
| Terminating 01/28/144 | ||||||||
| (Notional Value $179,280) | 134 | (1,117 | ) | |||||
| Credit Suisse Capital, LLC | ||||||||
| January 2014 S&P MidCap 400 Index Swap, | ||||||||
| Terminating 01/28/144 | ||||||||
| (Notional Value $503,741) | 375 | (2,872 | ) | |||||
| (Total Notional Value | ||||||||
| $894,296) | $ | (4,674 | ) | |||||
| †† | Value determined based on Level 2 inputs — See Note 4. |
| 1 | The issuer operates under a Congressional charter; its securities are neither issued nor guaranteed by the U.S. Government. |
| 2 | Repurchase Agreements — See Note 5. |
| 3 | All or a portion of this security is pledged as equity index swap collateral at December 31, 2013. |
| 4 | Total Return based on S&P MidCap 400 Index +/- financing at a variable rate. |
| 74 | THE RYDEX FUNDS ANNUAL REPORT | SEE NOTES TO FINANCIAL STATEMENTS. |
| INVERSE MID-CAP STRATEGY FUND |
| STATEMENT OF ASSETS |
| AND LIABILITIES |
| December 31, 2013 |
| Assets: | ||||
| Investments, at value | ||||
| (cost $299,994) | $ | 299,994 | ||
| Repurchase agreements, at value | ||||
| (cost $801,650) | 801,650 | |||
| Total investments | ||||
| (cost $1,101,644) | 1,101,644 | |||
| Total Assets | 1,101,644 | |||
| Liabilities: | ||||
| Unrealized depreciation on swap agreements | 4,674 | |||
| Payable for: | ||||
| Fund shares redeemed | 180,165 | |||
| Management fees | 1,636 | |||
| Swap settlement | 1,080 | |||
| Transfer agent and administrative fees | 454 | |||
| Investor service fees | 454 | |||
| Portfolio accounting fees | 182 | |||
| Miscellaneous | 1,937 | |||
| Total Liabilities | 190,582 | |||
| Net assets | $ | 911,062 | ||
| Net assets consist of: | ||||
| Paid in capital | $ | 2,192,916 | ||
| Undistributed net investment income | — | |||
| Accumulated net realized loss on investments | (1,277,180 | ) | ||
| Net unrealized depreciation on investments | (4,674 | ) | ||
| Net assets | $ | 911,062 | ||
| Capital shares outstanding† | 24,481 | |||
| Net asset value per share† | $ | 37.22 |
| STATEMENT OF |
| OPERATIONS |
| Year Ended December 31, 2013 |
| Investment Income: | ||||
| Interest | $ | 482 | ||
| Total investment income | 482 | |||
| Expenses: | ||||
| Management fees | 13,001 | |||
| Transfer agent and administrative fees | 3,611 | |||
| Investor service fees | 3,611 | |||
| Portfolio accounting fees | 1,445 | |||
| Professional fees | 1,246 | |||
| Custodian fees | 167 | |||
| Trustees’ fees* | 140 | |||
| Miscellaneous | 1,109 | |||
| Total expenses | 24,330 | |||
| Net investment loss | (23,848 | ) | ||
| Net Realized and Unrealized Gain (Loss): | ||||
| Net realized gain (loss) on: | ||||
| Investments | 18 | |||
| Swap agreements | (334,308 | ) | ||
| Futures contracts | (75,166 | ) | ||
| Net realized loss | (409,456 | ) | ||
| Net change in unrealized appreciation (depreciation) on: | ||||
| Investments | (85 | ) | ||
| Swap agreements | 25,402 | |||
| Futures contracts | 4,655 | |||
| Net change in unrealized appreciation (depreciation) | 29,972 | |||
| Net realized and unrealized loss | (379,484 | ) | ||
| Net decrease in net assets resulting from operations | $ | (403,332 | ) |
| † | Reverse share split — The shares outstanding and net asset value per share have been restated to reflect a 1:3 reverse share split effective January 24, 2014. See Note 13 in Notes to Financial Statements. |
| * | Relates to Trustees not deemed “interested persons” within the meaning of Section 2(a)(19) of the 1940 Act. |
| SEE NOTES TO FINANCIAL STATEMENTS. | THE RYDEX FUNDS ANNUAL REPORT | 75 |
| INVERSE MID-CAP STRATEGY FUND |
| STATEMENTS OF CHANGES IN NET ASSETS |
| Year Ended | Year Ended | |||||||
| December 31, | December 31, | |||||||
| 2013 | 2012 | |||||||
| Increase (Decrease) In Net Assets From Operations: | ||||||||
| Net investment loss | $ | (23,848 | ) | $ | (23,004 | ) | ||
| Net realized loss on investments | (409,456 | ) | (234,436 | ) | ||||
| Net change in unrealized appreciation (depreciation) on investments | 29,972 | (44,002 | ) | |||||
| Net decrease in net assets resulting from operations | (403,332 | ) | (301,442 | ) | ||||
| Capital share transactions: | ||||||||
| Proceeds from sale of shares | 18,038,894 | 17,082,699 | ||||||
| Cost of shares redeemed | (19,053,517 | ) | (15,593,464 | ) | ||||
| Net increase (decrease) from capital share transactions | (1,014,623 | ) | 1,489,235 | |||||
| Net increase (decrease) in net assets | (1,417,955 | ) | 1,187,793 | |||||
| Net assets: | ||||||||
| Beginning of year | 2,329,017 | 1,141,224 | ||||||
| End of year | $ | 911,062 | $ | 2,329,017 | ||||
| Undistributed net investment income at end of year | $ | — | $ | — | ||||
| Capital share activity:* | ||||||||
| Shares sold | 434,691 | 300,388 | ||||||
| Shares redeemed | (455,558 | ) | (273,178 | ) | ||||
| Net increase (decrease) in shares | (20,867 | ) | 27,210 | |||||
| * | Reverse share split — Capital share activity for the years ended December 31, 2013 and 2012 have been restated to reflect a 1:3 reverse share split effective January 24, 2014. See Note 13 in Notes to Financial Statements. |
| 76 | THE RYDEX FUNDS ANNUAL REPORT | SEE NOTES TO FINANCIAL STATEMENTS. |
| INVERSE MID-CAP STRATEGY FUND |
| FINANCIAL HIGHLIGHTS |
This table is presented to show selected data for a share outstanding throughout each period and to assist shareholders in evaluating a Fund’s performance for the periods presented.
| Year Ended | Year Ended | Year Ended | Year Ended | Year Ended | ||||||||||||||||
| December 31, | December 31, | December 31, | December 31, | December 31, | ||||||||||||||||
| 2013c | 2012c | 2011c | 2010c | 2009c | ||||||||||||||||
| Per Share Data | ||||||||||||||||||||
| Net asset value, beginning of period | $ | 51.36 | $ | 62.92 | $ | 67.90 | $ | 90.88 | $ | 140.41 | ||||||||||
| Income (loss) from investment operations: | ||||||||||||||||||||
| Net investment lossa | (0.69 | ) | (0.90 | ) | (1.11 | ) | (1.26 | ) | (1.83 | ) | ||||||||||
| Net gain (loss) on investments (realized and unrealized) | (13.45 | ) | (10.66 | ) | (3.87 | ) | (21.72 | ) | (47.70 | ) | ||||||||||
| Total from investment operations | (14.14 | ) | (11.56 | ) | (4.98 | ) | (22.98 | ) | (49.53 | ) | ||||||||||
| Net asset value, end of period | $ | 37.22 | $ | 51.36 | $ | 62.92 | $ | 67.90 | $ | 90.88 | ||||||||||
| Total Returnb | (27.57 | %) | (18.36 | %) | (7.34 | %) | (25.29 | %) | (35.28 | %) | ||||||||||
| Ratios/Supplemental Data | ||||||||||||||||||||
| Net assets, end of period (in thousands) | $ | 911 | $ | 2,329 | $ | 1,141 | $ | 2,977 | $ | 4,677 | ||||||||||
| Ratios to average net assets: | ||||||||||||||||||||
| Net investment loss | (1.65 | %) | (1.62 | %) | (1.71 | %) | (1.56 | %) | (1.58 | %) | ||||||||||
| Total expenses | 1.68 | % | 1.73 | % | 1.75 | % | 1.71 | % | 1.71 | % | ||||||||||
| Portfolio turnover rate | — | — | — | — | — | |||||||||||||||
| a | Net investment loss per share was computed using average shares outstanding throughout the period. |
| b | Total return does not reflect the impact of any additional fees charged by insurance companies. |
| c | Reverse share split — Per share amounts for period December 31, 2009 through December 31, 2013 have been restated to reflect a 1:3 reverse share split effective January 24, 2014. See Note 13 in Notes to Financial Statements. |
| SEE NOTES TO FINANCIAL STATEMENTS. | THE RYDEX FUNDS ANNUAL REPORT | 77 |
| PERFORMANCE REPORT AND FUND PROFILE (Unaudited) | December 31, 2013 |
RUSSELL 2000® 2x STRATEGY FUND
OBJECTIVE: Seeks to provide investment results that match, before fees and expenses, the performance of a specific benchmark on a daily basis. The Fund’s current benchmark is 200% of the performance of the Russell 2000® Index (the “underlying index”). The Fund does not seek to achieve its investment objective over a period of time greater than one day.
For the year ended December 31, 2013, Russell 2000® 2x Strategy Fund maintained a daily correlation of over 99% to its benchmark of 200% of the daily price movement of the Russell 2000 Index. Russell 2000® 2x Strategy Fund returned 85.72%, while the Russell 2000 Index returned 38.82% over the same time period.
Among sectors, the biggest performance contributors to the underlying index during the period were Financials and Information Technology. No sector detracted from performance, but Telecommunications Services and Utilities contributed least.
Isis Pharmaceuticals, Inc., CoStar Group, Inc. and Alnylam Pharmaceuticals, Inc. were the largest contributors to performance of the underlying index for the year. Coeur Mining, Inc., Atlantic Power Corp. and Hecla Mining Co. were the leading detractors from performance of the underlying index for the year.
Derivatives in the Fund were used to help provide exposure to the composition of the benchmark in the highest efficient manner and to provide leverage, not for hedging purposes.
Due to the compounding of daily returns, leveraged and inverse funds’ returns over periods other than one day will likely differ in amount and possibly direction from the benchmark return for the same period. Investors should monitor their leveraged and inverse funds’ holdings to ensure that they are consistent with their strategies, as frequently as daily.
The effects of compounding may cause the longer-term correlation of the fund to its benchmark to diminish. The apparent discrepancy between the leveraged and unleveraged indices is the result of compounding, which is described briefly on page 6 of this report.
Performance displayed represents past performance, which is no guarantee of future results.
Holdings Diversification (Market Exposure as % of Net Assets)
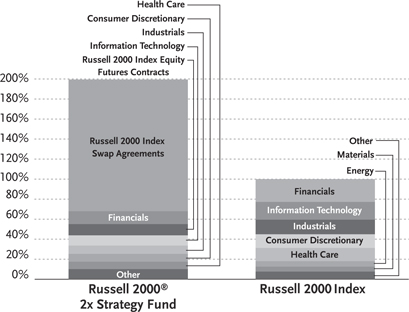
“Holdings Diversification (Market Exposure as % of Net Assets)” excludes any temporary cash investments.
Inception Date: October 27, 2006
| Ten Largest Holdings (% of Total Net Assets) | ||||
| athenahealth, Inc. | 0.2 | % | ||
| CoStar Group, Inc. | 0.2 | % | ||
| Acuity Brands, Inc. | 0.2 | % | ||
| Middleby Corp. | 0.2 | % | ||
| Isis Pharmaceuticals, Inc. | 0.2 | % | ||
| Ultimate Software Group, Inc. | 0.1 | % | ||
| Align Technology, Inc. | 0.1 | % | ||
| PTC, Inc. | 0.1 | % | ||
| Brunswick Corp. | 0.1 | % | ||
| WEX, Inc. | 0.1 | % | ||
| Top Ten Total | 1.5 | % | ||
“Ten Largest Holdings” exclude any temporary cash or derivative investments.
| 78 | THE RYDEX FUNDS ANNUAL REPORT |
| PERFORMANCE REPORT AND FUND PROFILE (Unaudited) (concluded) |
Cumulative Fund Performance*,†

Average Annual Returns
Periods Ended December 31, 2013*,†
| Since | ||||||||||||
| Inception | ||||||||||||
| 1 Year | 5 Year | (10/27/06) | ||||||||||
| Russell 2000® 2x Strategy Fund | 85.72 | % | 31.25 | % | 2.55 | % | ||||||
| Russell 2000 Index | 38.82 | % | 20.08 | % | 7.48 | % | ||||||
| * | The performance data above represents past performance that is not predictive of future results. The investment return and principal value of an investment in the Fund will fluctuate so that an investor’s shares, when redeemed, may be worth more or less than their original cost. Returns are historical and include changes in principal and reinvested dividends and capital gains and do not reflect the effect of taxes. The Russell 2000 Index is an unmanaged index and, unlike the Fund, has no management fees or operating expenses to reduce its reported return. |
| † | Returns do not reflect the impact of any additional fees charged by insurance companies. |
| THE RYDEX FUNDS ANNUAL REPORT | 79 |
| SCHEDULE OF INVESTMENTS | December 31, 2013 |
| RUSSELL 2000® 2x STRATEGY FUND |
| Shares | Value | |||||||
| COMMON STOCKS† - 56.7% | ||||||||
| FINANCIALS - 12.9% | ||||||||
| CNO Financial Group, Inc. | 401 | $ | 7,094 | |||||
| Prosperity Bancshares, Inc. | 104 | 6,592 | ||||||
| FirstMerit Corp. | 295 | 6,557 | ||||||
| Highwoods Properties, Inc. | 164 | 5,931 | ||||||
| Financial Engines, Inc. | 85 | 5,906 | ||||||
| NorthStar Realty Finance Corp. | 420 | 5,648 | ||||||
| LaSalle Hotel Properties | 183 | 5,648 | ||||||
| Stifel Financial Corp.* | 117 | 5,606 | ||||||
| Hancock Holding Co. | 151 | 5,538 | ||||||
| Prospect Capital Corp. | 488 | 5,475 | ||||||
| RLJ Lodging Trust | 222 | 5,399 | ||||||
| First American Financial Corp. | 189 | 5,329 | ||||||
| Webster Financial Corp. | 165 | 5,144 | ||||||
| MGIC Investment Corp.* | 577 | 4,871 | ||||||
| Portfolio Recovery Associates, Inc.* | 90 | 4,755 | ||||||
| EPR Properties | 95 | 4,670 | ||||||
| MarketAxess Holdings, Inc. | 68 | 4,548 | ||||||
| Texas Capital Bancshares, Inc.* | 73 | 4,540 | ||||||
| Primerica, Inc. | 105 | 4,506 | ||||||
| Radian Group, Inc. | 306 | 4,321 | ||||||
| Susquehanna Bancshares, Inc. | 334 | 4,288 | ||||||
| BancorpSouth, Inc. | 165 | 4,193 | ||||||
| Geo Group, Inc. | 127 | 4,092 | ||||||
| DiamondRock Hospitality Co. | 346 | 3,996 | ||||||
| Sunstone Hotel Investors, Inc. | 294 | 3,940 | ||||||
| Glacier Bancorp, Inc. | 131 | 3,902 | ||||||
| Cathay General Bancorp | 145 | 3,876 | ||||||
| RLI Corp. | 39 | 3,797 | ||||||
| UMB Financial Corp. | 59 | 3,793 | ||||||
| First Financial Bankshares, Inc. | 57 | 3,780 | ||||||
| CubeSmart | 236 | 3,762 | ||||||
| Umpqua Holdings Corp. | 196 | 3,751 | ||||||
| Sovran Self Storage, Inc. | 57 | 3,715 | ||||||
| DCT Industrial Trust, Inc. | 516 | 3,680 | ||||||
| Healthcare Realty Trust, Inc. | 172 | 3,665 | ||||||
| American Realty Capital Properties, Inc. | 280 | 3,601 | ||||||
| Invesco Mortgage Capital, Inc. | 242 | 3,552 | ||||||
| Medical Properties Trust, Inc. | 284 | 3,470 | ||||||
| Pebblebrook Hotel Trust | 112 | 3,445 | ||||||
| Apollo Investment Corp. | 404 | 3,426 | ||||||
| PrivateBancorp, Inc. | 118 | 3,414 | ||||||
| FNB Corp. | 270 | 3,407 | ||||||
| First Industrial Realty Trust, Inc. | 193 | 3,368 | ||||||
| IBERIABANK Corp. | 53 | 3,331 | ||||||
| Janus Capital Group, Inc. | 269 | 3,328 | ||||||
| Lexington Realty Trust | 323 | 3,298 | ||||||
| First Cash Financial Services, Inc.* | 53 | 3,278 | ||||||
| Trustmark Corp. | 122 | 3,274 | ||||||
| Capitol Federal Financial, Inc. | 270 | 3,270 | ||||||
| Ryman Hospitality Properties, Inc. | 78 | 3,259 | ||||||
| Alexander & Baldwin, Inc. | 78 | 3,255 | ||||||
| Western Alliance Bancorporation* | 135 | 3,221 | ||||||
| Chambers Street Properties | 420 | 3,213 | ||||||
| EastGroup Properties, Inc. | 55 | 3,186 | ||||||
| Evercore Partners, Inc. — Class A | 53 | 3,168 | ||||||
| Wintrust Financial Corp. | 68 | 3,136 | ||||||
| WisdomTree Investments, Inc.* | 176 | 3,117 | ||||||
| American Equity Investment | ||||||||
| Life Holding Co. | 118 | 3,113 | ||||||
| Bank of the Ozarks, Inc. | 55 | 3,112 | ||||||
| Potlatch Corp. | 74 | 3,089 | ||||||
| MB Financial, Inc. | 96 | 3,081 | ||||||
| Strategic Hotels & Resorts, Inc.* | 324 | 3,062 | ||||||
| New Residential Investment Corp. | 450 | 3,005 | ||||||
| Platinum Underwriters Holdings Ltd. | 49 | 3,002 | ||||||
| Cousins Properties, Inc. | 286 | 2,946 | ||||||
| PennyMac Mortgage Investment Trust | 127 | 2,916 | ||||||
| Greenhill & Company, Inc. | 50 | 2,897 | ||||||
| Washington Real Estate Investment Trust | 123 | 2,873 | ||||||
| Home Loan Servicing Solutions Ltd. | 125 | 2,871 | ||||||
| PacWest Bancorp | 68 | 2,871 | ||||||
| United Bankshares, Inc. | 91 | 2,862 | ||||||
| DuPont Fabros Technology, Inc. | 115 | 2,841 | ||||||
| Home BancShares, Inc. | 76 | 2,839 | ||||||
| Old National Bancorp | 184 | 2,828 | ||||||
| Westamerica Bancorporation | 50 | 2,823 | ||||||
| Community Bank System, Inc. | 71 | 2,817 | ||||||
| Redwood Trust, Inc. | 144 | 2,789 | ||||||
| CVB Financial Corp. | 161 | 2,748 | ||||||
| Selective Insurance Group, Inc. | 101 | 2,733 | ||||||
| ARMOUR Residential REIT, Inc. | 672 | 2,695 | ||||||
| Symetra Financial Corp. | 141 | 2,673 | ||||||
| EverBank Financial Corp. | 144 | 2,641 | ||||||
| Sun Communities, Inc. | 61 | 2,601 | ||||||
| Columbia Banking System, Inc. | 94 | 2,586 | ||||||
| International Bancshares Corp. | 96 | 2,533 | ||||||
| First Financial Holdings, Inc. | 38 | 2,527 | ||||||
| Hilltop Holdings, Inc.* | 109 | 2,521 | ||||||
| Equity One, Inc. | 112 | 2,513 | ||||||
| PHH Corp.* | 102 | 2,484 | ||||||
| Acadia Realty Trust | 100 | 2,483 | ||||||
| National Health Investors, Inc. | 44 | 2,468 | ||||||
| Colony Financial, Inc. | 119 | 2,415 | ||||||
| Government Properties Income Trust | 97 | 2,410 | ||||||
| Northwest Bancshares, Inc. | 163 | 2,409 | ||||||
| BBCN Bancorp, Inc. | 145 | 2,406 | ||||||
| First Midwest Bancorp, Inc. | 137 | 2,402 | ||||||
| Glimcher Realty Trust | 256 | 2,396 | ||||||
| Investors Bancorp, Inc. | 92 | 2,353 | ||||||
| Pennsylvania Real Estate Investment Trust | 123 | 2,335 | ||||||
| Argo Group International Holdings Ltd. | 50 | 2,325 | ||||||
| National Penn Bancshares, Inc. | 205 | 2,323 | ||||||
| Main Street Capital Corp. | 71 | 2,321 | ||||||
| CYS Investments, Inc. | 311 | 2,305 | ||||||
| Horace Mann Educators Corp. | 73 | 2,302 | ||||||
| Walter Investment Management Corp.* | 65 | 2,298 | ||||||
| PS Business Parks, Inc. | 30 | 2,293 | ||||||
| Altisource Residential Corp. | 76 | 2,288 | ||||||
| Fifth Street Finance Corp. | 245 | 2,266 | ||||||
| Kennedy-Wilson Holdings, Inc. | 100 | 2,225 | ||||||
| Enstar Group Ltd.* | 16 | 2,222 | ||||||
| 80 | THE RYDEX FUNDS ANNUAL REPORT | SEE NOTES TO FINANCIAL STATEMENTS. |
| SCHEDULE OF INVESTMENTS (continued) | December 31, 2013 |
| RUSSELL 2000® 2x STRATEGY FUND |
| Shares | Value | |||||||
| Virtus Investment Partners, Inc.* | 11 | $ | 2,201 | |||||
| Montpelier Re Holdings Ltd. | 75 | 2,183 | ||||||
| Chesapeake Lodging Trust | 86 | 2,175 | ||||||
| Encore Capital Group, Inc.* | 43 | 2,161 | ||||||
| Provident Financial Services, Inc. | 110 | 2,125 | ||||||
| Astoria Financial Corp. | 153 | 2,116 | ||||||
| iStar Financial, Inc.* | 147 | 2,098 | ||||||
| LTC Properties, Inc. | 59 | 2,088 | ||||||
| Pinnacle Financial Partners, Inc. | 64 | 2,082 | ||||||
| NBT Bancorp, Inc. | 80 | 2,072 | ||||||
| Sterling Financial Corp. | 60 | 2,045 | ||||||
| ViewPoint Financial Group, Inc. | 74 | 2,031 | ||||||
| Hersha Hospitality Trust | 364 | 2,027 | ||||||
| Capstead Mortgage Corp. | 165 | 1,993 | ||||||
| Cash America International, Inc. | 52 | 1,992 | ||||||
| Franklin Street Properties Corp. | 164 | 1,960 | ||||||
| Retail Opportunity Investments Corp. | 133 | 1,958 | ||||||
| Ambac Financial Group, Inc.* | 79 | 1,940 | ||||||
| National Bank Holdings Corp. — Class A | 90 | 1,926 | ||||||
| Sterling Bancorp | 141 | 1,885 | ||||||
| Parkway Properties, Inc. | 96 | 1,860 | ||||||
| First Financial Bancorp | 106 | 1,848 | ||||||
| Boston Private Financial Holdings, Inc. | 146 | 1,843 | ||||||
| American Capital Mortgage | ||||||||
| Investment Corp. | 105 | 1,833 | ||||||
| American Assets Trust, Inc. | 58 | 1,823 | ||||||
| Solar Capital Ltd. | 80 | 1,804 | ||||||
| Hercules Technology Growth Capital, Inc. | 110 | 1,804 | ||||||
| Sabra Health Care REIT, Inc. | 69 | 1,804 | ||||||
| FelCor Lodging Trust, Inc.* | 219 | 1,787 | ||||||
| Park National Corp. | 21 | 1,786 | ||||||
| Employers Holdings, Inc. | 56 | 1,772 | ||||||
| Nelnet, Inc. — Class A | 42 | 1,770 | ||||||
| Education Realty Trust, Inc. | 200 | 1,764 | ||||||
| Greenlight Capital Re Ltd. — Class A* | 52 | 1,753 | ||||||
| Hudson Pacific Properties, Inc. | 80 | 1,750 | ||||||
| Amtrust Financial Services, Inc. | 53 | 1,733 | ||||||
| Credit Acceptance Corp.* | 13 | 1,690 | ||||||
| Ramco-Gershenson Properties Trust | 107 | 1,684 | ||||||
| eHealth, Inc.* | 35 | 1,628 | ||||||
| Associated Estates Realty Corp. | 101 | 1,621 | ||||||
| Banner Corp. | 36 | 1,614 | ||||||
| HFF, Inc. — Class A* | 60 | 1,611 | ||||||
| Inland Real Estate Corp. | 153 | 1,610 | ||||||
| Renasant Corp. | 50 | 1,573 | ||||||
| Independent Bank Corp. | 40 | 1,568 | ||||||
| WesBanco, Inc. | 48 | 1,536 | ||||||
| Investors Real Estate Trust | 179 | 1,536 | ||||||
| Chemical Financial Corp. | 48 | 1,520 | ||||||
| Infinity Property & Casualty Corp. | 21 | 1,507 | ||||||
| First Commonwealth Financial Corp. | 170 | 1,499 | ||||||
| BofI Holding, Inc.* | 19 | 1,490 | ||||||
| STAG Industrial, Inc. | 73 | 1,488 | ||||||
| World Acceptance Corp.* | 17 | 1,488 | ||||||
| KCG Holdings, Inc. — Class A* | 122 | 1,459 | ||||||
| OFG Bancorp | 84 | 1,457 | ||||||
| Banco Latinoamericano de Comercio | ||||||||
| Exterior S.A. — Class E | 51 | 1,429 | ||||||
| Investment Technology Group, Inc.* | 69 | 1,419 | ||||||
| PennantPark Investment Corp. | 122 | 1,415 | ||||||
| Cohen & Steers, Inc. | 35 | 1,402 | ||||||
| Northfield Bancorp, Inc. | 106 | 1,399 | ||||||
| United Community Banks, Inc.* | 78 | 1,385 | ||||||
| First Merchants Corp. | 60 | 1,366 | ||||||
| Forestar Group, Inc.* | 64 | 1,361 | ||||||
| Resource Capital Corp. | 229 | 1,358 | ||||||
| AMERISAFE, Inc. | 32 | 1,352 | ||||||
| BGC Partners, Inc. — Class A | 223 | 1,351 | ||||||
| Safety Insurance Group, Inc. | 24 | 1,351 | ||||||
| Oritani Financial Corp. | 84 | 1,348 | ||||||
| Alexander’s, Inc. | 4 | 1,320 | ||||||
| S&T Bancorp, Inc. | 52 | 1,316 | ||||||
| Summit Hotel Properties, Inc. | 145 | 1,305 | ||||||
| ICG Group, Inc.* | 70 | 1,304 | ||||||
| Triangle Capital Corp. | 47 | 1,300 | ||||||
| City Holding Co. | 28 | 1,297 | ||||||
| BlackRock Kelso Capital Corp. | 137 | 1,278 | ||||||
| Piper Jaffray Cos.* | 32 | 1,266 | ||||||
| Wilshire Bancorp, Inc. | 114 | 1,246 | ||||||
| First Potomac Realty Trust | 107 | 1,244 | ||||||
| Sandy Spring Bancorp, Inc. | 44 | 1,240 | ||||||
| FXCM, Inc. — Class A | 69 | 1,231 | ||||||
| Eagle Bancorp, Inc.* | 40 | 1,225 | ||||||
| Brookline Bancorp, Inc. | 128 | 1,225 | ||||||
| Hanmi Financial Corp. | 55 | 1,204 | ||||||
| Navigators Group, Inc.* | 19 | 1,200 | ||||||
| Stewart Information Services Corp. | 37 | 1,194 | ||||||
| CoreSite Realty Corp. | 37 | 1,191 | ||||||
| Golub Capital BDC, Inc. | 62 | 1,185 | ||||||
| Tompkins Financial Corp. | 23 | 1,182 | ||||||
| TrustCo Bank Corp. NY | 164 | 1,178 | ||||||
| Community Trust Bancorp, Inc. | 26 | 1,174 | ||||||
| Flushing Financial Corp. | 56 | 1,159 | ||||||
| RAIT Financial Trust | 128 | 1,148 | ||||||
| Apollo Commercial Real Estate | ||||||||
| Finance, Inc. | 70 | 1,138 | ||||||
| Lakeland Financial Corp. | 29 | 1,131 | ||||||
| Campus Crest Communities, Inc. | 120 | 1,129 | ||||||
| New Mountain Finance Corp. | 75 | 1,128 | ||||||
| Berkshire Hills Bancorp, Inc. | 41 | 1,118 | ||||||
| Bancorp, Inc.* | 61 | 1,093 | ||||||
| WSFS Financial Corp. | 14 | 1,085 | ||||||
| Anworth Mortgage Asset Corp. | 257 | 1,082 | ||||||
| Green Dot Corp. — Class A* | 43 | 1,081 | ||||||
| Simmons First National Corp. — Class A | 29 | 1,077 | ||||||
| Kite Realty Group Trust | 160 | 1,051 | ||||||
| Select Income REIT | 39 | 1,043 | ||||||
| State Bank Financial Corp. | 57 | 1,037 | ||||||
| Capital Bank Financial Corp. — Class A* | 45 | 1,024 | ||||||
| United Fire Group, Inc. | 35 | 1,003 | ||||||
| Maiden Holdings Ltd. | 91 | 995 | ||||||
| EZCORP, Inc. — Class A* | 85 | 994 | ||||||
| TICC Capital Corp. | 96 | 993 | ||||||
| StellarOne Corp. | 41 | 987 | ||||||
| Medley Capital Corp. | 71 | 983 | ||||||
| Chatham Lodging Trust | 48 | 982 | ||||||
| SEE NOTES TO FINANCIAL STATEMENTS. | THE RYDEX FUNDS ANNUAL REPORT | 81 |
| SCHEDULE OF INVESTMENTS (continued) | December 31, 2013 |
| RUSSELL 2000® 2x STRATEGY FUND |
| Shares | Value | |||||||
| Dime Community Bancshares, Inc. | 58 | $ | 981 | |||||
| Excel Trust, Inc. | 86 | 980 | ||||||
| GAMCO Investors, Inc. — Class A | 11 | 957 | ||||||
| Cardinal Financial Corp. | 53 | 954 | ||||||
| PICO Holdings, Inc.* | 41 | 948 | ||||||
| THL Credit, Inc. | 57 | 940 | ||||||
| Washington Trust Bancorp, Inc. | 25 | 931 | ||||||
| Ameris Bancorp* | 44 | 929 | ||||||
| Tejon Ranch Co.* | 25 | 919 | ||||||
| HCI Group, Inc. | 17 | 910 | ||||||
| Southside Bancshares, Inc. | 33 | 902 | ||||||
| Rouse Properties, Inc. | 40 | 888 | ||||||
| Universal Health Realty Income Trust | 22 | 881 | ||||||
| First Interstate Bancsystem, Inc. — Class A | 31 | 879 | ||||||
| Arlington Asset Investment Corp. — Class A | 33 | 871 | ||||||
| Ashford Hospitality Trust, Inc. | 105 | 869 | ||||||
| Getty Realty Corp. | 47 | 863 | ||||||
| DFC Global Corp.* | 74 | 847 | ||||||
| Union First Market Bankshares Corp. | 34 | 844 | ||||||
| TCP Capital Corp. | 50 | 839 | ||||||
| Capital Southwest Corp. | 24 | 837 | ||||||
| NewStar Financial, Inc.* | 47 | 835 | ||||||
| 1st Source Corp. | 26 | 830 | ||||||
| Taylor Capital Group, Inc.* | 31 | 824 | ||||||
| Dynex Capital, Inc. | 101 | 808 | ||||||
| Westwood Holdings Group, Inc. | 13 | 805 | ||||||
| First BanCorp* | 130 | 805 | ||||||
| Cedar Realty Trust, Inc. | 128 | 801 | ||||||
| Apollo Residential Mortgage, Inc. | 54 | 798 | ||||||
| SY Bancorp, Inc. | 25 | 798 | ||||||
| Customers Bancorp, Inc.* | 39 | 798 | ||||||
| AG Mortgage Investment Trust, Inc. | 51 | 798 | ||||||
| Trico Bancshares | 28 | 794 | ||||||
| CoBiz Financial, Inc. | 65 | 777 | ||||||
| Heartland Financial USA, Inc. | 27 | 777 | ||||||
| Urstadt Biddle Properties, Inc. — Class A | 42 | 775 | ||||||
| First Busey Corp. | 133 | 771 | ||||||
| New York Mortgage Trust, Inc. | 110 | 769 | ||||||
| First Financial Corp. | 21 | 768 | ||||||
| Flagstar Bancorp, Inc.* | 39 | 765 | ||||||
| Virginia Commerce Bancorp, Inc.* | 45 | 765 | ||||||
| Lakeland Bancorp, Inc. | 61 | 755 | ||||||
| Bryn Mawr Bank Corp. | 25 | 755 | ||||||
| Terreno Realty Corp. | 42 | 743 | ||||||
| BancFirst Corp. | 13 | 729 | ||||||
| Safeguard Scientifics, Inc.* | 36 | 723 | ||||||
| FBL Financial Group, Inc. — Class A | 16 | 717 | ||||||
| Rockville Financial, Inc. | 50 | 711 | ||||||
| Universal Insurance Holdings, Inc. | 49 | 710 | ||||||
| Central Pacific Financial Corp. | 35 | 703 | ||||||
| Monmouth Real Estate | ||||||||
| Investment Corp. — Class A | 77 | 700 | ||||||
| Agree Realty Corp. | 24 | 696 | ||||||
| TowneBank | 45 | 693 | ||||||
| United Financial Bancorp, Inc. | 36 | 680 | ||||||
| Phoenix Companies, Inc.* | 11 | 675 | ||||||
| Cowen Group, Inc. — Class A* | 172 | 673 | ||||||
| CyrusOne, Inc. | 30 | 670 | ||||||
| Saul Centers, Inc. | 14 | 668 | ||||||
| Winthrop Realty Trust | 60 | 663 | ||||||
| German American Bancorp, Inc. | 23 | 656 | ||||||
| Federal Agricultural Mortgage Corp. — | ||||||||
| Class C | 19 | 651 | ||||||
| OneBeacon Insurance Group Ltd. — | ||||||||
| Class A | 41 | 649 | ||||||
| Citizens, Inc.* | 74 | 648 | ||||||
| First of Long Island Corp. | 15 | 643 | ||||||
| Meadowbrook Insurance Group, Inc. | 92 | 640 | ||||||
| Western Asset Mortgage Capital Corp. | 43 | 640 | ||||||
| Beneficial Mutual Bancorp, Inc.* | 58 | 633 | ||||||
| Enterprise Financial Services Corp. | 31 | 633 | ||||||
| MainSource Financial Group, Inc. | 35 | 631 | ||||||
| Third Point Reinsurance Ltd.* | 34 | 630 | ||||||
| Financial Institutions, Inc. | 25 | 618 | ||||||
| Bank Mutual Corp. | 86 | 603 | ||||||
| State Auto Financial Corp. | 28 | 595 | ||||||
| MVC Capital, Inc. | 44 | 594 | ||||||
| Diamond Hill Investment Group, Inc. | 5 | 592 | ||||||
| HomeTrust Bancshares, Inc.* | 37 | 592 | ||||||
| Camden National Corp. | 14 | 591 | ||||||
| Gramercy Property Trust, Inc.* | 102 | 587 | ||||||
| Great Southern Bancorp, Inc. | 19 | 578 | ||||||
| MCG Capital Corp. | 131 | 576 | ||||||
| Hudson Valley Holding Corp. | 28 | 570 | ||||||
| Ladenburg Thalmann Financial | ||||||||
| Services, Inc.* | 180 | 563 | ||||||
| Metro Bancorp, Inc.* | 26 | 560 | ||||||
| Univest Corporation of Pennsylvania | 27 | 558 | ||||||
| Southwest Bancorp, Inc.* | 35 | 557 | ||||||
| Park Sterling Corp. | 78 | 557 | ||||||
| First Bancorp | 33 | 548 | ||||||
| HomeStreet, Inc. | 27 | 540 | ||||||
| First Community Bancshares, Inc. | 32 | 534 | ||||||
| Centerstate Banks, Inc. | 52 | 528 | ||||||
| BNC Bancorp | 30 | 514 | ||||||
| Pacific Continental Corp. | 32 | 510 | ||||||
| Arrow Financial Corp. | 19 | 505 | ||||||
| AmREIT, Inc. — Class B | 30 | 504 | ||||||
| Independent Bank Group, Inc. | 10 | 497 | ||||||
| GFI Group, Inc. | 127 | 497 | ||||||
| Yadkin Financial Corp.* | 29 | 494 | ||||||
| International. FCStone, Inc.* | 26 | 482 | ||||||
| Fidelity Southern Corp. | 29 | 482 | ||||||
| National Bankshares, Inc. | 13 | 480 | ||||||
| Citizens & Northern Corp. | 23 | 474 | ||||||
| Aviv REIT, Inc. | 20 | 474 | ||||||
| Medallion Financial Corp. | 33 | 474 | ||||||
| Whitestone REIT — Class B | 35 | 468 | ||||||
| First Connecticut Bancorp, Inc. | 29 | 467 | ||||||
| First Defiance Financial Corp. | 18 | 467 | ||||||
| Baldwin & Lyons, Inc. — Class B | 17 | 464 | ||||||
| Territorial Bancorp, Inc. | 20 | 464 | ||||||
| Heritage Financial Corp. | 27 | 462 | ||||||
| Washington Banking Co. | 26 | 461 | ||||||
| 82 | THE RYDEX FUNDS ANNUAL REPORT | SEE NOTES TO FINANCIAL STATEMENTS. |
| SCHEDULE OF INVESTMENTS (continued) | December 31, 2013 |
| RUSSELL 2000® 2x STRATEGY FUND |
| Shares | Value | |||||||
| Fidus Investment Corp. | 21 | $ | 457 | |||||
| Peoples Bancorp, Inc. | 20 | 450 | ||||||
| OmniAmerican Bancorp, Inc.* | 21 | 449 | ||||||
| National Western Life Insurance Co. — | ||||||||
| Class A | 2 | 447 | ||||||
| Oppenheimer Holdings, Inc. — Class A | 18 | 446 | ||||||
| West Bancorporation, Inc. | 28 | 443 | ||||||
| One Liberty Properties, Inc. | 22 | 443 | ||||||
| Bridge Bancorp, Inc. | 17 | 442 | ||||||
| Republic Bancorp, Inc. — Class A | 18 | 442 | ||||||
| Manning & Napier, Inc. — Class A | 25 | 441 | ||||||
| Pacific Premier Bancorp, Inc.* | 28 | 441 | ||||||
| CNB Financial Corp. | 23 | 437 | ||||||
| Ashford Hospitality Prime, Inc. | 24 | 437 | ||||||
| Suffolk Bancorp* | 21 | 437 | ||||||
| GSV Capital Corp.* | 36 | 435 | ||||||
| Crawford & Co. — Class B | 47 | 434 | ||||||
| Bank of Marin Bancorp | 10 | 434 | ||||||
| Ares Commercial Real Estate Corp. | 33 | 432 | ||||||
| Silver Bay Realty Trust Corp. | 27 | 432 | ||||||
| Global Indemnity plc — Class A* | 17 | 430 | ||||||
| OceanFirst Financial Corp. | 25 | 428 | ||||||
| FBR & Co.* | 16 | 422 | ||||||
| MetroCorp Bancshares, Inc. | 28 | 422 | ||||||
| Hannon Armstrong Sustainable | ||||||||
| Infrastructure Capital, Inc. | 30 | 419 | ||||||
| Calamos Asset Management, Inc. — | ||||||||
| Class A | 35 | 414 | ||||||
| Gladstone Commercial Corp. | 23 | 413 | ||||||
| Center Bancorp, Inc. | 22 | 413 | ||||||
| PennantPark Floating Rate Capital Ltd. | 30 | 412 | ||||||
| 1st United Bancorp, Inc. | 54 | 411 | ||||||
| Charter Financial Corp. | 38 | 409 | ||||||
| Bank of Kentucky Financial Corp. | 11 | 406 | ||||||
| Meta Financial Group, Inc. | 10 | 403 | ||||||
| Franklin Financial Corp.* | 20 | 396 | ||||||
| Gladstone Investment Corp. | 49 | 395 | ||||||
| Tree.com, Inc.* | 12 | 394 | ||||||
| Walker & Dunlop, Inc.* | 24 | 388 | ||||||
| Home Federal Bancorp, Inc. | 26 | 387 | ||||||
| Solar Senior Capital Ltd. | 21 | 383 | ||||||
| Fox Chase Bancorp, Inc. | 22 | 382 | ||||||
| Ames National Corp. | 17 | 381 | ||||||
| Guaranty Bancorp | 27 | 379 | ||||||
| KCAP Financial, Inc. | 47 | 379 | ||||||
| Marlin Business Services Corp. | 15 | 378 | ||||||
| Banc of California, Inc. | 28 | 375 | ||||||
| Firsthand Technology Value Fund, Inc. | 16 | 371 | ||||||
| Bridge Capital Holdings* | 18 | 370 | ||||||
| American National Bankshares, Inc. | 14 | 368 | ||||||
| Tower Group International Ltd. | 107 | 362 | ||||||
| Preferred Bank/Los Angeles CA* | 18 | 361 | ||||||
| Penns Woods Bancorp, Inc. | 7 | 357 | ||||||
| Gladstone Capital Corp. | 37 | 355 | ||||||
| Horizon Bancorp | 14 | 355 | ||||||
| Sierra Bancorp | 22 | 354 | ||||||
| PennyMac Financial Services, Inc. — | ||||||||
| Class A* | 20 | 351 | ||||||
| Mercantile Bank Corp. | 16 | 345 | ||||||
| American Residential Properties, Inc.* | 20 | 343 | ||||||
| Chemung Financial Corp. | 10 | 342 | ||||||
| ESB Financial Corp. | 24 | 341 | ||||||
| Regional Management Corp.* | 10 | 339 | ||||||
| Meridian Interstate Bancorp, Inc.* | 15 | 339 | ||||||
| Merchants Bancshares, Inc. | 10 | 335 | ||||||
| Kansas City Life Insurance Co. | 7 | 334 | ||||||
| BankFinancial Corp. | 36 | 330 | ||||||
| Seacoast Banking Corporation of Florida* | 27 | 329 | ||||||
| Consolidated-Tomoka Land Co. | 9 | 327 | ||||||
| MidWestOne Financial Group, Inc. | 12 | 326 | ||||||
| Peapack Gladstone Financial Corp. | 17 | 325 | ||||||
| First NBC Bank Holding Co.* | 10 | 323 | ||||||
| United Community Financial Corp.* | 90 | 321 | ||||||
| SWS Group, Inc.* | 52 | 316 | ||||||
| Northrim BanCorp, Inc. | 12 | 315 | ||||||
| First Bancorp, Inc. | 18 | 314 | ||||||
| AV Homes, Inc.* | 17 | 309 | ||||||
| Kearny Financial Corp.* | 26 | 302 | ||||||
| First Financial Northwest, Inc. | 29 | 301 | ||||||
| NewBridge Bancorp* | 40 | 300 | ||||||
| Nicholas Financial, Inc. | 19 | 299 | ||||||
| Stellus Capital Investment Corp. | 20 | 299 | ||||||
| CU Bancorp* | 17 | 297 | ||||||
| Heritage Commerce Corp. | 36 | 297 | ||||||
| Eastern Insurance Holdings, Inc. | 12 | 294 | ||||||
| Consumer Portfolio Services, Inc.* | 30 | 282 | ||||||
| Bar Harbor Bankshares | 7 | 280 | ||||||
| JAVELIN Mortgage Investment Corp. | 20 | 279 | ||||||
| Armada Hoffler Properties, Inc. | 30 | 278 | ||||||
| National Interstate Corp. | 12 | 276 | ||||||
| Enterprise Bancorp, Inc. | 13 | 275 | ||||||
| C&F Financial Corp. | 6 | 274 | ||||||
| Capital City Bank Group, Inc.* | 23 | 271 | ||||||
| NGP Capital Resources Co. | 36 | 269 | ||||||
| MidSouth Bancorp, Inc. | 15 | 268 | ||||||
| Rexford Industrial Realty, Inc. | 20 | 264 | ||||||
| Heritage Oaks Bancorp* | 35 | 263 | ||||||
| Sun Bancorp, Inc.* | 73 | 257 | ||||||
| Provident Financial Holdings, Inc. | 17 | 255 | ||||||
| Westfield Financial, Inc. | 34 | 254 | ||||||
| First Security Group, Inc.* | 109 | 251 | ||||||
| EMC Insurance Group, Inc. | 8 | 245 | ||||||
| UMH Properties, Inc. | 26 | 245 | ||||||
| CommunityOne Bancorp* | 19 | 242 | ||||||
| NASB Financial, Inc. | 8 | 242 | ||||||
| Pzena Investment Management, Inc. — | ||||||||
| Class A | 20 | 235 | ||||||
| Hallmark Financial Services, Inc.* | 26 | 231 | ||||||
| Physicians Realty Trust | 18 | 229 | ||||||
| Intervest Bancshares Corp. — Class A* | 30 | 225 | ||||||
| Donegal Group, Inc. — Class A | 14 | 223 | ||||||
| Farmers Capital Bank Corp.* | 10 | 218 | ||||||
| Horizon Technology Finance Corp. | 15 | 213 | ||||||
| Home Bancorp, Inc.* | 11 | 207 | ||||||
| JMP Group, Inc. | 28 | 207 | ||||||
| Clifton Savings Bancorp, Inc. | 16 | 205 | ||||||
| SEE NOTES TO FINANCIAL STATEMENTS. | THE RYDEX FUNDS ANNUAL REPORT | 83 |
| SCHEDULE OF INVESTMENTS (continued) | December 31, 2013 |
| RUSSELL 2000® 2x STRATEGY FUND |
| Shares | Value | |||||||
| Independence Holding Co. | 15 | $ | 202 | |||||
| Macatawa Bank Corp.* | 40 | 200 | ||||||
| Century Bancorp, Inc. — Class A | 6 | 200 | ||||||
| ESSA Bancorp, Inc. | 17 | 197 | ||||||
| Imperial Holdings, Inc.* | 30 | 196 | ||||||
| Access National Corp. | 13 | 194 | ||||||
| Resource America, Inc. — Class A | 20 | 187 | ||||||
| Middleburg Financial Corp. | 10 | 180 | ||||||
| LCNB Corp. | 10 | 179 | ||||||
| ZAIS Financial Corp. | 10 | 160 | ||||||
| Hingham Institution for Savings | 2 | 157 | ||||||
| BBX Capital Corp. — Class A* | 10 | 156 | ||||||
| Waterstone Financial, Inc.* | 14 | 155 | ||||||
| Ellington Residential Mortgage REIT | 10 | 154 | ||||||
| WhiteHorse Finance, Inc. | 10 | 151 | ||||||
| Gain Capital Holdings, Inc. | 20 | 150 | ||||||
| Doral Financial Corp.* | 9 | 141 | ||||||
| Garrison Capital, Inc. | 10 | 139 | ||||||
| Palmetto Bancshares, Inc.* | 10 | 130 | ||||||
| Tristate Capital Holdings, Inc.* | 10 | 119 | ||||||
| Hampton Roads Bankshares, Inc.* | 60 | 105 | ||||||
| Silvercrest Asset Management Group, | ||||||||
| Inc. — Class A | 6 | 102 | ||||||
| CIFC Corp. | 13 | 101 | ||||||
| Health Insurance Innovations, | ||||||||
| Inc. — Class A* | 10 | 101 | ||||||
| VantageSouth Bancshares, Inc.* | 19 | 100 | ||||||
| Fortegra Financial Corp.* | 12 | 99 | ||||||
| First Marblehead Corp.* | 13 | 96 | ||||||
| California First National Bancorp | 4 | 60 | ||||||
| Cascade Bancorp* | 11 | 58 | ||||||
| First Federal Bancshares of | ||||||||
| Arkansas, Inc.* | 5 | 44 | ||||||
| Total Financials | 665,484 | |||||||
| INFORMATION TECHNOLOGY - 10.2% | ||||||||
| CoStar Group, Inc.* | 48 | 8,861 | ||||||
| Ultimate Software Group, Inc.* | 50 | 7,662 | ||||||
| PTC, Inc.* | 211 | 7,467 | ||||||
| WEX, Inc.* | 72 | 7,129 | ||||||
| Aspen Technology, Inc.* | 163 | 6,813 | ||||||
| FEI Co. | 71 | 6,344 | ||||||
| CommVault Systems, Inc.* | 83 | 6,214 | ||||||
| SunEdison, Inc.* | 474 | 6,187 | ||||||
| Cognex Corp. | 159 | 6,071 | ||||||
| Tyler Technologies, Inc.* | 57 | 5,821 | ||||||
| Belden, Inc. | 80 | 5,636 | ||||||
| MAXIMUS, Inc. | 126 | 5,543 | ||||||
| ARRIS Group, Inc.* | 211 | 5,142 | ||||||
| Acxiom Corp.* | 136 | 5,030 | ||||||
| ACI Worldwide, Inc.* | 73 | 4,745 | ||||||
| Anixter International, Inc. | 50 | 4,492 | ||||||
| SS&C Technologies Holdings, Inc.* | 101 | 4,470 | ||||||
| Ciena Corp.* | 186 | 4,451 | ||||||
| Euronet Worldwide, Inc.* | 90 | 4,307 | ||||||
| ViaSat, Inc.* | 68 | 4,260 | ||||||
| Qlik Technologies, Inc.* | 159 | 4,234 | ||||||
| Microsemi Corp.* | 169 | 4,216 | ||||||
| j2 Global, Inc. | 84 | 4,202 | ||||||
| Verint Systems, Inc.* | 97 | 4,165 | ||||||
| Fair Isaac Corp. | 66 | 4,147 | ||||||
| Manhattan Associates, Inc.* | 35 | 4,112 | ||||||
| Finisar Corp.* | 169 | 4,042 | ||||||
| Cornerstone OnDemand, Inc.* | 75 | 4,002 | ||||||
| Mentor Graphics Corp. | 166 | 3,996 | ||||||
| Guidewire Software, Inc.* | 81 | 3,975 | ||||||
| Convergys Corp. | 184 | 3,873 | ||||||
| Dealertrack Technologies, Inc.* | 80 | 3,847 | ||||||
| Plantronics, Inc. | 79 | 3,670 | ||||||
| Aruba Networks, Inc.* | 204 | 3,652 | ||||||
| Littelfuse, Inc. | 39 | 3,624 | ||||||
| VistaPrint N.V.* | 60 | 3,411 | ||||||
| Yelp, Inc. — Class A* | 49 | 3,379 | ||||||
| Sapient Corp.* | 193 | 3,350 | ||||||
| Cardtronics, Inc.* | 77 | 3,346 | ||||||
| Heartland Payment Systems, Inc. | 67 | 3,339 | ||||||
| International Rectifier Corp.* | 128 | 3,336 | ||||||
| Hittite Microwave Corp.* | 54 | 3,332 | ||||||
| Coherent, Inc.* | 44 | 3,273 | ||||||
| Cavium, Inc.* | 94 | 3,243 | ||||||
| SYNNEX Corp.* | 48 | 3,235 | ||||||
| Electronics for Imaging, Inc.* | 83 | 3,215 | ||||||
| CACI International, Inc. — Class A* | 43 | 3,148 | ||||||
| Synaptics, Inc.* | 60 | 3,109 | ||||||
| OpenTable, Inc.* | 39 | 3,095 | ||||||
| ValueClick, Inc.* | 131 | 3,061 | ||||||
| Semtech Corp.* | 121 | 3,059 | ||||||
| TiVo, Inc.* | 230 | 3,018 | ||||||
| Blackbaud, Inc. | 79 | 2,974 | ||||||
| NIC, Inc. | 119 | 2,960 | ||||||
| ADTRAN, Inc. | 109 | 2,944 | ||||||
| Zillow, Inc. — Class A* | 36 | 2,942 | ||||||
| Entegris, Inc.* | 252 | 2,923 | ||||||
| Itron, Inc.* | 70 | 2,900 | ||||||
| MKS Instruments, Inc. | 96 | 2,874 | ||||||
| Infoblox, Inc.* | 87 | 2,873 | ||||||
| Power Integrations, Inc. | 51 | 2,847 | ||||||
| Cypress Semiconductor Corp. | 260 | 2,730 | ||||||
| Unisys Corp.* | 80 | 2,686 | ||||||
| Plexus Corp.* | 62 | 2,683 | ||||||
| RF Micro Devices, Inc.* | 499 | 2,575 | ||||||
| Intersil Corp. — Class A | 224 | 2,569 | ||||||
| Universal Display Corp.* | 74 | 2,543 | ||||||
| iGATE Corp.* | 63 | 2,530 | ||||||
| Sanmina Corp.* | 151 | 2,521 | ||||||
| Take-Two Interactive Software, Inc.* | 144 | 2,501 | ||||||
| Syntel, Inc. | 27 | 2,456 | ||||||
| Web.com Group, Inc.* | 77 | 2,448 | ||||||
| TriQuint Semiconductor, Inc.* | 290 | 2,419 | ||||||
| Cirrus Logic, Inc.* | 117 | 2,390 | ||||||
| Bottomline Technologies de, Inc.* | 66 | 2,387 | ||||||
| Progress Software Corp.* | 92 | 2,376 | ||||||
| Integrated Device Technology, Inc.* | 233 | 2,374 | ||||||
| Veeco Instruments, Inc.* | 71 | 2,337 | ||||||
| Methode Electronics, Inc. | 68 | 2,325 | ||||||
| PMC - Sierra, Inc.* | 360 | 2,315 | ||||||
| 84 | THE RYDEX FUNDS ANNUAL REPORT | SEE NOTES TO FINANCIAL STATEMENTS. |
| SCHEDULE OF INVESTMENTS (continued) | December 31, 2013 |
| RUSSELL 2000® 2x STRATEGY FUND |
| Shares | Value | |||||||
| NETGEAR, Inc.* | 70 | $ | 2,306 | |||||
| Monolithic Power Systems, Inc.* | 66 | 2,288 | ||||||
| Benchmark Electronics, Inc.* | 99 | 2,285 | ||||||
| SunPower Corp. — Class A* | 76 | 2,266 | ||||||
| InterDigital, Inc. | 76 | 2,241 | ||||||
| Monotype Imaging Holdings, Inc. | 70 | 2,230 | ||||||
| Blucora, Inc.* | 75 | 2,187 | ||||||
| WebMD Health Corp. — Class A* | 55 | 2,173 | ||||||
| MicroStrategy, Inc. — Class A* | 17 | 2,112 | ||||||
| ScanSource, Inc.* | 49 | 2,079 | ||||||
| MTS Systems Corp. | 29 | 2,066 | ||||||
| Advent Software, Inc. | 58 | 2,029 | ||||||
| Infinera Corp.* | 207 | 2,024 | ||||||
| InvenSense, Inc. — Class A* | 97 | 2,016 | ||||||
| NetScout Systems, Inc.* | 67 | 1,983 | ||||||
| Cabot Microelectronics Corp.* | 43 | 1,965 | ||||||
| Interactive Intelligence Group, Inc.* | 29 | 1,953 | ||||||
| Cray, Inc.* | 71 | 1,949 | ||||||
| Rambus, Inc.* | 203 | 1,922 | ||||||
| comScore, Inc.* | 66 | 1,888 | ||||||
| Imperva, Inc.* | 39 | 1,877 | ||||||
| Tessera Technologies, Inc. | 95 | 1,872 | ||||||
| OSI Systems, Inc.* | 35 | 1,859 | ||||||
| Rogers Corp.* | 30 | 1,845 | ||||||
| Responsys, Inc.* | 67 | 1,836 | ||||||
| GT Advanced Technologies, Inc.* | 210 | 1,831 | ||||||
| QLogic Corp.* | 154 | 1,822 | ||||||
| Insight Enterprises, Inc.* | 80 | 1,817 | ||||||
| RealPage, Inc.* | 77 | 1,800 | ||||||
| CSG Systems International, Inc. | 61 | 1,793 | ||||||
| Applied Micro Circuits Corp.* | 134 | 1,793 | ||||||
| Constant Contact, Inc.* | 57 | 1,771 | ||||||
| Measurement Specialties, Inc.* | 28 | 1,699 | ||||||
| SPS Commerce, Inc.* | 26 | 1,698 | ||||||
| FARO Technologies, Inc.* | 29 | 1,691 | ||||||
| CalAmp Corp.* | 60 | 1,678 | ||||||
| ATMI, Inc.* | 55 | 1,662 | ||||||
| ExlService Holdings, Inc.* | 59 | 1,630 | ||||||
| Advanced Energy Industries, Inc.* | 71 | 1,623 | ||||||
| Trulia, Inc.* | 46 | 1,622 | ||||||
| OmniVision Technologies, Inc.* | 93 | 1,600 | ||||||
| Sykes Enterprises, Inc.* | 72 | 1,570 | ||||||
| PROS Holdings, Inc.* | 39 | 1,556 | ||||||
| Diodes, Inc.* | 66 | 1,555 | ||||||
| Synchronoss Technologies, Inc.* | 50 | 1,554 | ||||||
| Demandware, Inc.* | 24 | 1,539 | ||||||
| Pegasystems, Inc. | 31 | 1,525 | ||||||
| LivePerson, Inc.* | 102 | 1,512 | ||||||
| Envestnet, Inc.* | 37 | 1,491 | ||||||
| Bankrate, Inc.* | 83 | 1,489 | ||||||
| VirnetX Holding Corp.* | 76 | 1,475 | ||||||
| Monster Worldwide, Inc.* | 205 | 1,462 | ||||||
| Ultratech, Inc.* | 50 | 1,450 | ||||||
| Badger Meter, Inc. | 26 | 1,417 | ||||||
| Virtusa Corp.* | 37 | 1,409 | ||||||
| Comverse, Inc.* | 36 | 1,397 | ||||||
| BroadSoft, Inc.* | 51 | 1,394 | ||||||
| EPAM Systems, Inc.* | 39 | 1,363 | ||||||
| LogMeIn, Inc.* | 40 | 1,342 | ||||||
| Ixia* | 100 | 1,331 | ||||||
| Harmonic, Inc.* | 179 | 1,321 | ||||||
| Perficient, Inc.* | 56 | 1,312 | ||||||
| Newport Corp.* | 72 | 1,301 | ||||||
| FleetMatics Group plc* | 30 | 1,298 | ||||||
| Rofin-Sinar Technologies, Inc.* | 48 | 1,297 | ||||||
| Brooks Automation, Inc. | 123 | 1,290 | ||||||
| ManTech International Corp. — Class A | 43 | 1,287 | ||||||
| Cass Information Systems, Inc. | 19 | 1,280 | ||||||
| Fusion-io, Inc.* | 139 | 1,238 | ||||||
| EVERTEC, Inc. | 50 | 1,233 | ||||||
| CTS Corp. | 61 | 1,215 | ||||||
| Sonus Networks, Inc.* | 384 | 1,210 | ||||||
| Digital River, Inc.* | 65 | 1,203 | ||||||
| Proofpoint, Inc.* | 36 | 1,194 | ||||||
| Extreme Networks, Inc.* | 170 | 1,190 | ||||||
| Move, Inc.* | 74 | 1,183 | ||||||
| Checkpoint Systems, Inc.* | 75 | 1,183 | ||||||
| Spansion, Inc. — Class A* | 85 | 1,181 | ||||||
| Global Cash Access Holdings, Inc.* | 117 | 1,169 | ||||||
| Angie’s List, Inc.* | 76 | 1,151 | ||||||
| Emulex Corp.* | 159 | 1,138 | ||||||
| Ruckus Wireless, Inc.* | 80 | 1,136 | ||||||
| Ellie Mae, Inc.* | 42 | 1,129 | ||||||
| PDF Solutions, Inc.* | 44 | 1,127 | ||||||
| Lattice Semiconductor Corp.* | 203 | 1,119 | ||||||
| Park Electrochemical Corp. | 37 | 1,063 | ||||||
| SciQuest, Inc.* | 37 | 1,054 | ||||||
| Daktronics, Inc. | 67 | 1,051 | ||||||
| Fabrinet* | 51 | 1,049 | ||||||
| Super Micro Computer, Inc.* | 61 | 1,047 | ||||||
| Ambarella, Inc.* | 30 | 1,018 | ||||||
| Photronics, Inc.* | 112 | 1,011 | ||||||
| Ubiquiti Networks, Inc.* | 22 | 1,011 | ||||||
| Stamps.com, Inc.* | 24 | 1,010 | ||||||
| Tangoe, Inc.* | 56 | 1,009 | ||||||
| ShoreTel, Inc.* | 105 | 974 | ||||||
| Accelrys, Inc.* | 101 | 964 | ||||||
| Callidus Software, Inc.* | 69 | 947 | ||||||
| Liquidity Services, Inc.* | 41 | 929 | ||||||
| Epiq Systems, Inc. | 57 | 924 | ||||||
| Comtech Telecommunications Corp. | 29 | 914 | ||||||
| EarthLink Holdings Corp.* | 180 | 913 | ||||||
| Black Box Corp. | 30 | 894 | ||||||
| Forrester Research, Inc. | 23 | 880 | ||||||
| Silicon Image, Inc.* | 142 | 873 | ||||||
| ServiceSource International, Inc.* | 104 | 872 | ||||||
| TeleTech Holdings, Inc.* | 36 | 862 | ||||||
| Micrel, Inc. | 85 | 839 | ||||||
| Exar Corp.* | 71 | 837 | ||||||
| Shutterstock, Inc.* | 10 | 836 | ||||||
| TTM Technologies, Inc.* | 97 | 832 | ||||||
| Jive Software, Inc.* | 73 | 821 | ||||||
| IntraLinks Holdings, Inc.* | 67 | 811 | ||||||
| MoneyGram International, Inc.* | 39 | 810 | ||||||
| AVG Technologies N.V.* | 47 | 809 | ||||||
| Nanometrics, Inc.* | 41 | 781 | ||||||
| SEE NOTES TO FINANCIAL STATEMENTS. | THE RYDEX FUNDS ANNUAL REPORT | 85 |
| SCHEDULE OF INVESTMENTS (continued) | December 31, 2013 |
| RUSSELL 2000® 2x STRATEGY FUND |
| Shares | Value | |||||||
| Ebix, Inc. | 53 | $ | 780 | |||||
| Amkor Technology, Inc.* | 126 | 772 | ||||||
| DTS, Inc.* | 32 | 767 | ||||||
| Silicon Graphics International Corp.* | 57 | 764 | ||||||
| Brightcove, Inc.* | 52 | 735 | ||||||
| Entropic Communications, Inc.* | 155 | 730 | ||||||
| Internap Network Services Corp.* | 97 | 729 | ||||||
| Parkervision, Inc.* | 160 | 728 | ||||||
| Seachange International, Inc.* | 59 | 717 | ||||||
| Calix, Inc.* | 74 | 713 | ||||||
| LTX-Credence Corp.* | 88 | 703 | ||||||
| XO Group, Inc.* | 47 | 698 | ||||||
| E2open, Inc.* | 29 | 693 | ||||||
| Qualys, Inc.* | 30 | 693 | ||||||
| Rudolph Technologies, Inc.* | 59 | 693 | ||||||
| Actuate Corp.* | 87 | 671 | ||||||
| Bazaarvoice, Inc.* | 82 | 649 | ||||||
| Electro Rent Corp. | 35 | 648 | ||||||
| Inphi Corp.* | 50 | 645 | ||||||
| RealD, Inc.* | 75 | 641 | ||||||
| Oplink Communications, Inc.* | 34 | 632 | ||||||
| Lionbridge Technologies, Inc.* | 106 | 632 | ||||||
| GSI Group, Inc.* | 56 | 629 | ||||||
| Mercury Systems, Inc.* | 57 | 624 | ||||||
| Integrated Silicon Solution, Inc.* | 51 | 617 | ||||||
| Ceva, Inc.* | 39 | 594 | ||||||
| Anaren, Inc.* | 21 | 588 | ||||||
| Global Eagle Entertainment, Inc.* | 39 | 580 | ||||||
| FormFactor, Inc.* | 95 | 572 | ||||||
| CIBER, Inc.* | 138 | 571 | ||||||
| Higher One Holdings, Inc.* | 58 | 566 | ||||||
| IXYS Corp. | 43 | 558 | ||||||
| Digi International, Inc.* | 46 | 558 | ||||||
| Procera Networks, Inc.* | 37 | 556 | ||||||
| Dice Holdings, Inc.* | 75 | 544 | ||||||
| NVE Corp.* | 9 | 525 | ||||||
| PLX Technology, Inc.* | 79 | 520 | ||||||
| Immersion Corp.* | 50 | 519 | ||||||
| Kopin Corp.* | 122 | 515 | ||||||
| Computer Task Group, Inc. | 27 | 510 | ||||||
| Blackhawk Network Holdings, Inc.* | 20 | 505 | ||||||
| Zix Corp.* | 109 | 497 | ||||||
| QuinStreet, Inc.* | 57 | 495 | ||||||
| Millennial Media, Inc.* | 64 | 465 | ||||||
| Avid Technology, Inc.* | 57 | 465 | ||||||
| Axcelis Technologies, Inc.* | 190 | 464 | ||||||
| Cohu, Inc. | 44 | 462 | ||||||
| Quantum Corp.* | 381 | 457 | ||||||
| MoSys, Inc.* | 82 | 453 | ||||||
| KEMET Corp.* | 80 | 451 | ||||||
| Supertex, Inc.* | 18 | 451 | ||||||
| Glu Mobile, Inc.* | 111 | 432 | ||||||
| Ultra Clean Holdings, Inc.* | 43 | 431 | ||||||
| Zygo Corp.* | 29 | 429 | ||||||
| PC Connection, Inc. | 17 | 422 | ||||||
| Electro Scientific Industries, Inc. | 40 | 418 | ||||||
| ChannelAdvisor Corp.* | 10 | 417 | ||||||
| Maxwell Technologies, Inc.* | 53 | 412 | ||||||
| MaxLinear, Inc. — Class A* | 39 | 407 | ||||||
| Tessco Technologies, Inc. | 10 | 403 | ||||||
| ePlus, Inc.* | 7 | 398 | ||||||
| American Software, Inc. — Class A | 40 | 395 | ||||||
| Mesa Laboratories, Inc. | 5 | 393 | ||||||
| ModusLink Global Solutions, Inc.* | 68 | 390 | ||||||
| Vocus, Inc.* | 34 | 387 | ||||||
| Bel Fuse, Inc. — Class B | 18 | 384 | ||||||
| Demand Media, Inc.* | 66 | 381 | ||||||
| Speed Commerce, Inc.* | 80 | 374 | ||||||
| Pericom Semiconductor Corp.* | 42 | 372 | ||||||
| VASCO Data Security International, Inc.* | 48 | 371 | ||||||
| Marketo, Inc.* | 10 | 371 | ||||||
| Peregrine Semiconductor Corp.* | 49 | 363 | ||||||
| Agilysys, Inc.* | 26 | 362 | ||||||
| M/A-COM Technology Solutions | ||||||||
| Holdings, Inc.* | 21 | 357 | ||||||
| Vringo, Inc.* | 119 | 352 | ||||||
| PRGX Global, Inc.* | 52 | 349 | ||||||
| support.com, Inc.* | 92 | 349 | ||||||
| Gogo, Inc.* | 14 | 347 | ||||||
| Vishay Precision Group, Inc.* | 23 | 342 | ||||||
| DSP Group, Inc.* | 35 | 340 | ||||||
| KVH Industries, Inc.* | 26 | 339 | ||||||
| Marchex, Inc. — Class B | 39 | 337 | ||||||
| Neonode, Inc.* | 52 | 329 | ||||||
| Westell Technologies, Inc. — Class A* | 81 | 328 | ||||||
| Rubicon Technology, Inc.* | 31 | 308 | ||||||
| PC-Telephone, Inc. | 32 | 306 | ||||||
| Luxoft Holding, Inc.* | 8 | 304 | ||||||
| Guidance Software, Inc.* | 30 | 303 | ||||||
| RealNetworks, Inc.* | 40 | 302 | ||||||
| Alliance Fiber Optic Products, Inc. | 20 | 301 | ||||||
| Travelzoo, Inc.* | 14 | 298 | ||||||
| Datalink Corp.* | 27 | 294 | ||||||
| Cvent, Inc.* | 8 | 291 | ||||||
| Imation Corp.* | 62 | 290 | ||||||
| Gigamon, Inc.* | 10 | 281 | ||||||
| United Online, Inc. | 20 | 275 | ||||||
| ANADIGICS, Inc.* | 149 | 274 | ||||||
| Xoom Corp.* | 10 | 274 | ||||||
| Numerex Corp. — Class A* | 21 | 272 | ||||||
| Hackett Group, Inc. | 43 | 267 | ||||||
| Sigma Designs, Inc.* | 56 | 264 | ||||||
| Carbonite, Inc.* | 22 | 260 | ||||||
| Rosetta Stone, Inc.* | 21 | 257 | ||||||
| NeoPhotonics Corp.* | 36 | 254 | ||||||
| Aviat Networks, Inc.* | 112 | 253 | ||||||
| Unwired Planet, Inc.* | 180 | 248 | ||||||
| Alpha & Omega Semiconductor Ltd.* | 31 | 239 | ||||||
| GSI Technology, Inc.* | 35 | 232 | ||||||
| Mitek Systems, Inc.* | 39 | 232 | ||||||
| Sapiens International Corporation N.V. | 30 | 231 | ||||||
| Digimarc Corp. | 12 | 231 | ||||||
| Aeroflex Holding Corp.* | 35 | 228 | ||||||
| Richardson Electronics Ltd. | 20 | 227 | ||||||
| Multi-Fineline Electronix, Inc.* | 16 | 222 | ||||||
| Audience, Inc.* | 19 | 221 | ||||||
| 86 | THE RYDEX FUNDS ANNUAL REPORT | SEE NOTES TO FINANCIAL STATEMENTS. |
| SCHEDULE OF INVESTMENTS (continued) | December 31, 2013 |
| RUSSELL 2000® 2x STRATEGY FUND |
| Shares | Value | |||||||
| Planet Payment, Inc.* | 79 | $ | 220 | |||||
| Telenav, Inc.* | 32 | 211 | ||||||
| Silver Spring Networks, Inc.* | 10 | 210 | ||||||
| eGain Corp.* | 20 | 205 | ||||||
| Uni-Pixel, Inc.* | 20 | 200 | ||||||
| Rally Software Development Corp.* | 10 | 195 | ||||||
| QAD, Inc. — Class A | 11 | 194 | ||||||
| Limelight Networks, Inc.* | 98 | 194 | ||||||
| Reis, Inc.* | 10 | 192 | ||||||
| TeleCommunication Systems, Inc. — | ||||||||
| Class A* | 80 | 186 | ||||||
| Textura Corp.* | 6 | 180 | ||||||
| TechTarget, Inc.* | 26 | 178 | ||||||
| Marin Software, Inc.* | 17 | 174 | ||||||
| Spark Networks, Inc.* | 26 | 160 | ||||||
| Intermolecular, Inc.* | 31 | 153 | ||||||
| Hutchinson Technology, Inc.* | 39 | 125 | ||||||
| Control4 Corp.* | 7 | 124 | ||||||
| Model N, Inc.* | 10 | 118 | ||||||
| Viasystems Group, Inc.* | 7 | 96 | ||||||
| Radisys Corp.* | 40 | 92 | ||||||
| YuMe, Inc.* | 8 | 60 | ||||||
| Cyan, Inc.* | 10 | 53 | ||||||
| Tremor Video, Inc.* | 8 | 46 | ||||||
| Total Information Technology | 525,425 | |||||||
| INDUSTRIALS - 8.3% | ||||||||
| Acuity Brands, Inc. | 79 | 8,637 | ||||||
| Middleby Corp.* | 34 | 8,158 | ||||||
| HEICO Corp. | 121 | 7,012 | ||||||
| Teledyne Technologies, Inc.* | 69 | 6,338 | ||||||
| EnerSys, Inc. | 89 | 6,238 | ||||||
| CLARCOR, Inc. | 91 | 5,856 | ||||||
| Esterline Technologies Corp.* | 57 | 5,812 | ||||||
| Woodward, Inc. | 126 | 5,747 | ||||||
| Moog, Inc. — Class A* | 84 | 5,707 | ||||||
| Chart Industries, Inc.* | 56 | 5,356 | ||||||
| DigitalGlobe, Inc.* | 130 | 5,350 | ||||||
| Curtiss-Wright Corp. | 85 | 5,290 | ||||||
| EMCOR Group, Inc. | 124 | 5,262 | ||||||
| Spirit Airlines, Inc.* | 112 | 5,087 | ||||||
| Generac Holdings, Inc. | 88 | 4,984 | ||||||
| Actuant Corp. — Class A | 134 | 4,910 | ||||||
| Deluxe Corp. | 94 | 4,905 | ||||||
| Corporate Executive Board Co. | 61 | 4,723 | ||||||
| Watsco, Inc. | 46 | 4,418 | ||||||
| Advisory Board Co.* | 63 | 4,011 | ||||||
| USG Corp.* | 138 | 3,916 | ||||||
| Franklin Electric Company, Inc. | 87 | 3,884 | ||||||
| Applied Industrial Technologies, Inc. | 77 | 3,779 | ||||||
| Barnes Group, Inc. | 95 | 3,639 | ||||||
| JetBlue Airways Corp.* | 419 | 3,582 | ||||||
| Healthcare Services Group, Inc. | 126 | 3,574 | ||||||
| United Stationers, Inc. | 75 | 3,441 | ||||||
| Beacon Roofing Supply, Inc.* | 85 | 3,424 | ||||||
| MasTec, Inc.* | 102 | 3,336 | ||||||
| Swift Transportation Co. — Class A* | 148 | 3,286 | ||||||
| HNI Corp. | 84 | 3,262 | ||||||
| Watts Water Technologies, Inc. — Class A | 52 | 3,217 | ||||||
| TAL International Group, Inc. | 56 | 3,212 | ||||||
| Herman Miller, Inc. | 108 | 3,188 | ||||||
| Tetra Tech, Inc.* | 113 | 3,161 | ||||||
| Trimas Corp.* | 78 | 3,111 | ||||||
| Polypore International, Inc.* | 79 | 3,073 | ||||||
| FTI Consulting, Inc.* | 74 | 3,044 | ||||||
| Mueller Industries, Inc. | 48 | 3,024 | ||||||
| Brink’s Co. | 88 | 3,004 | ||||||
| UniFirst Corp. | 27 | 2,889 | ||||||
| ABM Industries, Inc. | 101 | 2,888 | ||||||
| Mobile Mini, Inc.* | 70 | 2,883 | ||||||
| UTI Worldwide, Inc. | 159 | 2,792 | ||||||
| Raven Industries, Inc. | 67 | 2,756 | ||||||
| Simpson Manufacturing Company, Inc. | 75 | 2,755 | ||||||
| Allegiant Travel Co. — Class A | 26 | 2,741 | ||||||
| Hub Group, Inc. — Class A* | 68 | 2,712 | ||||||
| Huron Consulting Group, Inc.* | 43 | 2,697 | ||||||
| On Assignment, Inc.* | 77 | 2,688 | ||||||
| RBC Bearings, Inc.* | 38 | 2,689 | ||||||
| WageWorks, Inc.* | 45 | 2,675 | ||||||
| Mueller Water Products, Inc. — Class A | 280 | 2,624 | ||||||
| General Cable Corp. | 89 | 2,617 | ||||||
| Mine Safety Appliances Co. | 51 | 2,612 | ||||||
| Brady Corp. — Class A | 84 | 2,598 | ||||||
| Orbital Sciences Corp.* | 109 | 2,540 | ||||||
| Granite Construction, Inc. | 72 | 2,519 | ||||||
| Trex Company, Inc.* | 31 | 2,465 | ||||||
| CIRCOR International, Inc. | 30 | 2,423 | ||||||
| Steelcase, Inc. — Class A | 150 | 2,379 | ||||||
| Interface, Inc. — Class A | 108 | 2,372 | ||||||
| GrafTech International Ltd.* | 210 | 2,358 | ||||||
| Aircastle Ltd. | 123 | 2,357 | ||||||
| Forward Air Corp. | 53 | 2,327 | ||||||
| Korn/Ferry International* | 89 | 2,325 | ||||||
| Tennant Co. | 33 | 2,238 | ||||||
| Proto Labs, Inc.* | 30 | 2,135 | ||||||
| EnPro Industries, Inc.* | 36 | 2,075 | ||||||
| Werner Enterprises, Inc. | 83 | 2,053 | ||||||
| AZZ, Inc. | 42 | 2,051 | ||||||
| AAR Corp. | 73 | 2,045 | ||||||
| Matson, Inc. | 78 | 2,036 | ||||||
| GenCorp, Inc.* | 112 | 2,018 | ||||||
| Lindsay Corp. | 24 | 1,985 | ||||||
| Knight Transportation, Inc. | 108 | 1,981 | ||||||
| DXP Enterprises, Inc.* | 17 | 1,958 | ||||||
| Kaman Corp. | 49 | 1,947 | ||||||
| TrueBlue, Inc.* | 75 | 1,934 | ||||||
| G&K Services, Inc. — Class A | 31 | 1,929 | ||||||
| Briggs & Stratton Corp. | 88 | 1,915 | ||||||
| Apogee Enterprises, Inc. | 53 | 1,903 | ||||||
| Rush Enterprises, Inc. — Class A* | 64 | 1,898 | ||||||
| Encore Wire Corp. | 35 | 1,897 | ||||||
| Atlas Air Worldwide Holdings, Inc.* | 46 | 1,893 | ||||||
| Exponent, Inc. | 24 | 1,859 | ||||||
| Primoris Services Corp. | 59 | 1,837 | ||||||
| Cubic Corp. | 34 | 1,790 | ||||||
| Tutor Perini Corp.* | 68 | 1,788 | ||||||
| SEE NOTES TO FINANCIAL STATEMENTS. | THE RYDEX FUNDS ANNUAL REPORT | 87 |
| SCHEDULE OF INVESTMENTS (continued) | December 31, 2013 |
| RUSSELL 2000® 2x STRATEGY FUND |
| Shares | Value | |||||||
| Hyster-Yale Materials Handling, Inc. | 19 | $ | 1,770 | |||||
| Meritor, Inc.* | 169 | 1,763 | ||||||
| Titan International, Inc. | 98 | 1,762 | ||||||
| Navigant Consulting, Inc.* | 91 | 1,747 | ||||||
| Albany International Corp. — Class A | 48 | 1,725 | ||||||
| Universal Forest Products, Inc. | 33 | 1,721 | ||||||
| Altra Industrial Motion Corp. | 50 | 1,711 | ||||||
| Dycom Industries, Inc.* | 61 | 1,695 | ||||||
| McGrath RentCorp | 42 | 1,672 | ||||||
| Federal Signal Corp.* | 114 | 1,670 | ||||||
| Heartland Express, Inc. | 85 | 1,668 | ||||||
| ESCO Technologies, Inc. | 48 | 1,644 | ||||||
| II-VI, Inc.* | 93 | 1,637 | ||||||
| Knoll, Inc. | 87 | 1,593 | ||||||
| Wesco Aircraft Holdings, Inc.* | 72 | 1,578 | ||||||
| Textainer Group Holdings Ltd. | 39 | 1,569 | ||||||
| Team, Inc.* | 37 | 1,567 | ||||||
| Aegion Corp. — Class A* | 71 | 1,554 | ||||||
| Wabash National Corp.* | 125 | 1,544 | ||||||
| H&E Equipment Services, Inc.* | 52 | 1,541 | ||||||
| John Bean Technologies Corp. | 52 | 1,525 | ||||||
| Arkansas Best Corp. | 45 | 1,516 | ||||||
| Sun Hydraulics Corp. | 37 | 1,511 | ||||||
| Taser International, Inc.* | 93 | 1,477 | ||||||
| AAON, Inc. | 46 | 1,470 | ||||||
| Thermon Group Holdings, Inc.* | 53 | 1,448 | ||||||
| Standex International Corp. | 23 | 1,446 | ||||||
| Astec Industries, Inc. | 37 | 1,429 | ||||||
| Insperity, Inc. | 39 | 1,409 | ||||||
| SkyWest, Inc. | 94 | 1,394 | ||||||
| Quanex Building Products Corp. | 68 | 1,355 | ||||||
| Rexnord Corp.* | 50 | 1,351 | ||||||
| Greenbrier Companies, Inc.* | 41 | 1,346 | ||||||
| XPO Logistics, Inc.* | 51 | 1,341 | ||||||
| Comfort Systems USA, Inc. | 69 | 1,338 | ||||||
| ACCO Brands Corp.* | 199 | 1,337 | ||||||
| Acacia Research Corp. | 91 | 1,323 | ||||||
| Saia, Inc.* | 41 | 1,314 | ||||||
| Nortek, Inc.* | 17 | 1,268 | ||||||
| Blount International, Inc.* | 87 | 1,259 | ||||||
| Quad/Graphics, Inc. | 46 | 1,253 | ||||||
| ICF International, Inc.* | 36 | 1,250 | ||||||
| Aceto Corp. | 49 | 1,225 | ||||||
| Barrett Business Services, Inc. | 13 | 1,206 | ||||||
| US Ecology, Inc. | 32 | 1,190 | ||||||
| Astronics Corp.* | 23 | 1,173 | ||||||
| Kelly Services, Inc. — Class A | 47 | 1,172 | ||||||
| Powell Industries, Inc. | 17 | 1,139 | ||||||
| Gorman-Rupp Co. | 33 | 1,086 | ||||||
| American Science & Engineering, Inc. | 15 | 1,079 | ||||||
| Resources Connection, Inc. | 75 | 1,075 | ||||||
| Gibraltar Industries, Inc.* | 57 | 1,060 | ||||||
| Griffon Corp. | 79 | 1,044 | ||||||
| Kforce, Inc. | 50 | 1,023 | ||||||
| Engility Holdings, Inc.* | 30 | 1,002 | ||||||
| Viad Corp. | 36 | 1,000 | ||||||
| Great Lakes Dredge & Dock Corp.* | 108 | 994 | ||||||
| Aerovironment, Inc.* | 34 | 990 | ||||||
| RPX Corp.* | 58 | 980 | ||||||
| Columbus McKinnon Corp.* | 36 | 977 | ||||||
| West Corp. | 38 | 977 | ||||||
| MYR Group, Inc.* | 38 | 953 | ||||||
| Republic Airways Holdings, Inc.* | 89 | 951 | ||||||
| Hawaiian Holdings, Inc.* | 94 | 905 | ||||||
| Kimball International, Inc. — Class B | 60 | 902 | ||||||
| LB Foster Co. — Class A | 19 | 899 | ||||||
| Consolidated Graphics, Inc.* | 13 | 877 | ||||||
| Multi-Color Corp. | 23 | 868 | ||||||
| Roadrunner Transportation Systems, Inc.* | 32 | 862 | ||||||
| Kadant, Inc. | 21 | 851 | ||||||
| Park-Ohio Holdings Corp.* | 16 | 838 | ||||||
| Ennis, Inc. | 47 | 832 | ||||||
| EnerNOC, Inc.* | 48 | 826 | ||||||
| Marten Transport Ltd. | 40 | 808 | ||||||
| GP Strategies Corp.* | 27 | 804 | ||||||
| Alamo Group, Inc. | 13 | 789 | ||||||
| American Railcar Industries, Inc. | 17 | 778 | ||||||
| Air Transport Services Group, Inc.* | 95 | 769 | ||||||
| Furmanite Corp.* | 69 | 733 | ||||||
| Echo Global Logistics, Inc.* | 34 | 730 | ||||||
| SP Plus Corp.* | 28 | 729 | ||||||
| Insteel Industries, Inc. | 32 | 727 | ||||||
| KEYW Holding Corp.* | 54 | 726 | ||||||
| National Presto Industries, Inc. | 9 | 725 | ||||||
| American Woodmark Corp.* | 18 | 712 | ||||||
| Capstone Turbine Corp.* | 544 | 702 | ||||||
| Celadon Group, Inc. | 36 | 701 | ||||||
| PowerSecure International, Inc.* | 39 | 670 | ||||||
| Graham Corp. | 18 | 653 | ||||||
| Northwest Pipe Co.* | 17 | 642 | ||||||
| CAI International, Inc.* | 27 | 636 | ||||||
| Argan, Inc. | 23 | 634 | ||||||
| CBIZ, Inc.* | 69 | 629 | ||||||
| Heidrick & Struggles International, Inc. | 31 | 624 | ||||||
| PGT, Inc.* | 61 | 617 | ||||||
| Kratos Defense & Security Solutions, Inc.* | 80 | 614 | ||||||
| Mistras Group, Inc.* | 29 | 606 | ||||||
| Douglas Dynamics, Inc. | 36 | 606 | ||||||
| ExOne Co.* | 10 | 605 | ||||||
| Orion Marine Group, Inc.* | 50 | 602 | ||||||
| Ducommun, Inc.* | 20 | 596 | ||||||
| InnerWorkings, Inc.* | 76 | 592 | ||||||
| FreightCar America, Inc. | 22 | 586 | ||||||
| NN, Inc. | 29 | 586 | ||||||
| Builders FirstSource, Inc.* | 82 | 585 | ||||||
| Pendrell Corp.* | 288 | 579 | ||||||
| NCI Building Systems, Inc.* | 33 | 579 | ||||||
| Layne Christensen Co.* | 33 | 564 | ||||||
| Sparton Corp.* | 20 | 559 | ||||||
| ARC Document Solutions, Inc.* | 68 | 559 | ||||||
| Global Power Equipment Group, Inc. | 28 | 548 | ||||||
| Dynamic Materials Corp. | 25 | 544 | ||||||
| Pacer International, Inc.* | 65 | 537 | ||||||
| Titan Machinery, Inc.* | 30 | 535 | ||||||
| 88 | THE RYDEX FUNDS ANNUAL REPORT | SEE NOTES TO FINANCIAL STATEMENTS. |
| SCHEDULE OF INVESTMENTS (continued) | December 31, 2013 |
| RUSSELL 2000® 2x STRATEGY FUND |
| Shares | Value | |||||||
| Ply Gem Holdings, Inc.* | 29 | $ | 523 | |||||
| Lydall, Inc.* | 29 | 511 | ||||||
| Patriot Transportation Holding, Inc.* | 12 | 498 | ||||||
| Pike Corp.* | 46 | 486 | ||||||
| CDI Corp. | 26 | 482 | ||||||
| Quality Distribution, Inc.* | 37 | 475 | ||||||
| CECO Environmental Corp. | 28 | 453 | ||||||
| Houston Wire & Cable Co. | 33 | 442 | ||||||
| Energy Recovery, Inc.* | 76 | 423 | ||||||
| Coleman Cable, Inc. | 16 | 420 | ||||||
| Vicor Corp.* | 31 | 416 | ||||||
| Performant Financial Corp.* | 39 | 402 | ||||||
| Casella Waste Systems, Inc. — Class A* | 69 | 400 | ||||||
| FuelCell Energy, Inc.* | 280 | 395 | ||||||
| Miller Industries, Inc. | 21 | 391 | ||||||
| Twin Disc, Inc. | 15 | 388 | ||||||
| VSE Corp. | 8 | 384 | ||||||
| Courier Corp. | 21 | 380 | ||||||
| CRA International, Inc.* | 19 | 376 | ||||||
| Schawk, Inc. — Class A | 25 | 372 | ||||||
| Preformed Line Products Co. | 5 | 366 | ||||||
| Flow International Corp.* | 88 | 356 | ||||||
| Ameresco, Inc. — Class A* | 36 | 348 | ||||||
| PMFG, Inc.* | 38 | 344 | ||||||
| Franklin Covey Co.* | 17 | 338 | ||||||
| Cenveo, Inc.* | 98 | 337 | ||||||
| Xerium Technologies, Inc.* | 20 | 330 | ||||||
| Commercial Vehicle Group, Inc.* | 44 | 320 | ||||||
| Hardinge, Inc. | 22 | 318 | ||||||
| Manitex International, Inc.* | 20 | 318 | ||||||
| YRC Worldwide, Inc.* | 18 | 313 | ||||||
| Ampco-Pittsburgh Corp. | 16 | 311 | ||||||
| Heritage-Crystal Clean, Inc.* | 15 | 307 | ||||||
| Universal Truckload Services, Inc. | 10 | 305 | ||||||
| Sterling Construction Company, Inc.* | 26 | 305 | ||||||
| LSI Industries, Inc. | 35 | 303 | ||||||
| Hurco Companies, Inc. | 12 | 300 | ||||||
| International Shipholding Corp. | 10 | 295 | ||||||
| Patrick Industries, Inc.* | 10 | 289 | ||||||
| Odyssey Marine Exploration, Inc.* | 142 | 287 | ||||||
| LMI Aerospace, Inc.* | 19 | 280 | ||||||
| Accuride Corp.* | 74 | 276 | ||||||
| Tecumseh Products Co. — Class A* | 30 | 272 | ||||||
| Erickson Air-Crane, Inc.* | 10 | 208 | ||||||
| TRC Companies, Inc.* | 29 | 207 | ||||||
| API Technologies Corp.* | 60 | 205 | ||||||
| Astronics Corp. — Class B* | 4 | 203 | ||||||
| Enphase Energy, Inc.* | 29 | 184 | ||||||
| Revolution Lighting Technologies, Inc.* | 50 | 171 | ||||||
| Global Brass & Copper Holdings, Inc. | 10 | 166 | ||||||
| Acorn Energy, Inc. | 38 | 155 | ||||||
| Ultrapetrol Bahamas Ltd.* | 39 | 146 | ||||||
| Innovative Solutions & Support, Inc.* | 20 | 146 | ||||||
| Stock Building Supply Holdings, Inc.* | 8 | 146 | ||||||
| American Superconductor Corp.* | 88 | 144 | ||||||
| NL Industries, Inc. | 12 | 134 | ||||||
| Intersections, Inc. | 17 | 132 | ||||||
| BlueLinx Holdings, Inc.* | 59 | 115 | ||||||
| Swisher Hygiene, Inc.* | 206 | 106 | ||||||
| Omega Flex, Inc. | 5 | 102 | ||||||
| Compx International, Inc. | 2 | 28 | ||||||
| Total Industrials | 433,304 | |||||||
| CONSUMER DISCRETIONARY - 7.8% | ||||||||
| Brunswick Corp. | 157 | 7,231 | ||||||
| Fifth & Pacific Companies, Inc.* | 210 | 6,736 | ||||||
| Sotheby’s | 125 | 6,649 | ||||||
| Tenneco, Inc.* | 111 | 6,279 | ||||||
| Wolverine World Wide, Inc. | 184 | 6,249 | ||||||
| Lumber Liquidators Holdings, Inc.* | 50 | 5,145 | ||||||
| Dana Holding Corp. | 261 | 5,121 | ||||||
| Vail Resorts, Inc. | 66 | 4,965 | ||||||
| Pool Corp. | 85 | 4,942 | ||||||
| Live Nation Entertainment, Inc.* | 249 | 4,920 | ||||||
| Men’s Wearhouse, Inc. | 93 | 4,751 | ||||||
| Cheesecake Factory, Inc. | 96 | 4,634 | ||||||
| Office Depot, Inc.* | 860 | 4,550 | ||||||
| Sinclair Broadcast Group, Inc. — Class A | 124 | 4,430 | ||||||
| Buffalo Wild Wings, Inc.* | 30 | 4,416 | ||||||
| Iconix Brand Group, Inc.* | 105 | 4,169 | ||||||
| Jack in the Box, Inc.* | 81 | 4,052 | ||||||
| HSN, Inc. | 62 | 3,863 | ||||||
| Steven Madden Ltd.* | 105 | 3,842 | ||||||
| Pier 1 Imports, Inc. | 165 | 3,808 | ||||||
| Life Time Fitness, Inc.* | 79 | 3,713 | ||||||
| Ryland Group, Inc. | 84 | 3,646 | ||||||
| New York Times Co. — Class A | 228 | 3,618 | ||||||
| Penske Automotive Group, Inc. | 75 | 3,537 | ||||||
| Cracker Barrel Old Country Store, Inc. | 32 | 3,522 | ||||||
| Outerwall, Inc.* | 52 | 3,498 | ||||||
| Shutterfly, Inc.* | 68 | 3,464 | ||||||
| Meredith Corp. | 66 | 3,419 | ||||||
| Grand Canyon Education, Inc.* | 76 | 3,313 | ||||||
| Meritage Homes Corp.* | 68 | 3,263 | ||||||
| Rent-A-Center, Inc. — Class A | 97 | 3,235 | ||||||
| Genesco, Inc.* | 44 | 3,215 | ||||||
| ANN, Inc.* | 87 | 3,181 | ||||||
| Texas Roadhouse, Inc. — Class A | 114 | 3,169 | ||||||
| Hibbett Sports, Inc.* | 47 | 3,159 | ||||||
| Nexstar Broadcasting Group, Inc. — | ||||||||
| Class A | 54 | 3,009 | ||||||
| Monro Muffler Brake, Inc. | 53 | 2,987 | ||||||
| Hillenbrand, Inc. | 100 | 2,942 | ||||||
| Helen of Troy Ltd.* | 59 | 2,921 | ||||||
| La-Z-Boy, Inc. | 94 | 2,913 | ||||||
| Express, Inc.* | 156 | 2,913 | ||||||
| Jos. A. Bank Clothiers, Inc.* | 52 | 2,846 | ||||||
| Conn’s, Inc.* | 36 | 2,836 | ||||||
| Cooper Tire & Rubber Co. | 117 | 2,813 | ||||||
| Marriott Vacations Worldwide Corp.* | 53 | 2,796 | ||||||
| Asbury Automotive Group, Inc.* | 52 | 2,794 | ||||||
| Pinnacle Entertainment, Inc.* | 107 | 2,781 | ||||||
| KB Home | 152 | 2,779 | ||||||
| Papa John’s International, Inc. | 60 | 2,724 | ||||||
| Group 1 Automotive, Inc. | 38 | 2,699 | ||||||
| SEE NOTES TO FINANCIAL STATEMENTS. | THE RYDEX FUNDS ANNUAL REPORT | 89 |
| SCHEDULE OF INVESTMENTS (continued) | December 31, 2013 |
| RUSSELL 2000® 2x STRATEGY FUND |
| Shares | Value | |||||||
| Vitamin Shoppe, Inc.* | 51 | $ | 2,653 | |||||
| Orient-Express Hotels Ltd. — Class A* | 175 | 2,644 | ||||||
| Five Below, Inc.* | 60 | 2,592 | ||||||
| Bob Evans Farms, Inc. | 51 | 2,580 | ||||||
| Crocs, Inc.* | 162 | 2,579 | ||||||
| Sturm Ruger & Company, Inc. | 35 | 2,558 | ||||||
| American Axle & Manufacturing | ||||||||
| Holdings, Inc.* | 124 | 2,536 | ||||||
| Finish Line, Inc. — Class A | 90 | 2,535 | ||||||
| Dorman Products, Inc.* | 45 | 2,523 | ||||||
| Buckle, Inc. | 48 | 2,523 | ||||||
| DineEquity, Inc. | 30 | 2,507 | ||||||
| Lithia Motors, Inc. — Class A | 36 | 2,499 | ||||||
| Valassis Communications, Inc. | 72 | 2,466 | ||||||
| Children’s Place Retail Stores, Inc.* | 43 | 2,450 | ||||||
| Bloomin’ Brands, Inc.* | 102 | 2,449 | ||||||
| Standard Pacific Corp.* | 265 | 2,398 | ||||||
| Skechers U.S.A., Inc. — Class A* | 71 | 2,352 | ||||||
| MDC Holdings, Inc. | 72 | 2,321 | ||||||
| Krispy Kreme Doughnuts, Inc.* | 118 | 2,276 | ||||||
| Interval Leisure Group, Inc. | 73 | 2,256 | ||||||
| Churchill Downs, Inc. | 25 | 2,241 | ||||||
| Ascent Capital Group, Inc. — Class A* | 26 | 2,225 | ||||||
| Brown Shoe Company, Inc. | 79 | 2,223 | ||||||
| Select Comfort Corp.* | 102 | 2,151 | ||||||
| Matthews International Corp. — Class A | 50 | 2,131 | ||||||
| National CineMedia, Inc. | 105 | 2,096 | ||||||
| Sonic Corp.* | 103 | 2,080 | ||||||
| G-III Apparel Group Ltd.* | 28 | 2,066 | ||||||
| Jones Group, Inc. | 138 | 2,064 | ||||||
| Quiksilver, Inc.* | 234 | 2,052 | ||||||
| Drew Industries, Inc. | 40 | 2,048 | ||||||
| Restoration Hardware Holdings, Inc.* | 30 | 2,019 | ||||||
| Oxford Industries, Inc. | 25 | 2,017 | ||||||
| Fiesta Restaurant Group, Inc.* | 38 | 1,985 | ||||||
| Tumi Holdings, Inc.* | 88 | 1,984 | ||||||
| Columbia Sportswear Co. | 24 | 1,890 | ||||||
| Loral Space & Communications, Inc.* | 23 | 1,863 | ||||||
| International Speedway Corp. — Class A | 51 | 1,810 | ||||||
| LifeLock, Inc.* | 110 | 1,805 | ||||||
| iRobot Corp.* | 51 | 1,773 | ||||||
| Red Robin Gourmet Burgers, Inc.* | 24 | 1,765 | ||||||
| Sonic Automotive, Inc. — Class A | 72 | 1,763 | ||||||
| MDC Partners, Inc. — Class A | 65 | 1,658 | ||||||
| AFC Enterprises, Inc.* | 43 | 1,656 | ||||||
| Multimedia Games Holding | ||||||||
| Company, Inc.* | 51 | 1,599 | ||||||
| Core-Mark Holding Company, Inc. | 21 | 1,595 | ||||||
| Cato Corp. — Class A | 50 | 1,590 | ||||||
| Scholastic Corp. | 46 | 1,564 | ||||||
| Gentherm, Inc.* | 57 | 1,528 | ||||||
| Scientific Games Corp. — Class A* | 88 | 1,490 | ||||||
| Caesars Entertainment Corp.* | 68 | 1,465 | ||||||
| Winnebago Industries, Inc.* | 52 | 1,427 | ||||||
| Francesca’s Holdings Corp.* | 77 | 1,418 | ||||||
| CEC Entertainment, Inc. | 32 | 1,417 | ||||||
| Boyd Gaming Corp.* | 123 | 1,385 | ||||||
| Arctic Cat, Inc. | 24 | 1,368 | ||||||
| Gray Television, Inc.* | 90 | 1,339 | ||||||
| BJ’s Restaurants, Inc.* | 43 | 1,336 | ||||||
| Hovnanian Enterprises, Inc. — Class A* | 201 | 1,331 | ||||||
| Capella Education Co. | 20 | 1,328 | ||||||
| Steiner Leisure Ltd.* | 27 | 1,328 | ||||||
| Smith & Wesson Holding Corp.* | 98 | 1,322 | ||||||
| Movado Group, Inc. | 30 | 1,320 | ||||||
| ITT Educational Services, Inc.* | 39 | 1,310 | ||||||
| Ethan Allen Interiors, Inc. | 43 | 1,308 | ||||||
| American Public Education, Inc.* | 30 | 1,304 | ||||||
| Standard Motor Products, Inc. | 35 | 1,288 | ||||||
| Regis Corp. | 88 | 1,277 | ||||||
| Fred’s, Inc. — Class A | 68 | 1,259 | ||||||
| Stage Stores, Inc. | 56 | 1,244 | ||||||
| EW Scripps Co. — Class A* | 57 | 1,238 | ||||||
| Aeropostale, Inc.* | 135 | 1,227 | ||||||
| Cumulus Media, Inc. — Class A* | 156 | 1,206 | ||||||
| Chuy’s Holdings, Inc.* | 33 | 1,189 | ||||||
| Tuesday Morning Corp.* | 74 | 1,181 | ||||||
| Pep Boys-Manny Moe & Jack* | 97 | 1,178 | ||||||
| Denny’s Corp.* | 159 | 1,143 | ||||||
| Carmike Cinemas, Inc.* | 41 | 1,141 | ||||||
| M/I Homes, Inc.* | 44 | 1,120 | ||||||
| Modine Manufacturing Co.* | 87 | 1,115 | ||||||
| Blue Nile, Inc.* | 23 | 1,083 | ||||||
| Callaway Golf Co. | 128 | 1,079 | ||||||
| Beazer Homes USA, Inc.* | 43 | 1,050 | ||||||
| K12, Inc.* | 48 | 1,044 | ||||||
| Haverty Furniture Companies, Inc. | 33 | 1,033 | ||||||
| Barnes & Noble, Inc.* | 69 | 1,032 | ||||||
| Biglari Holdings, Inc.* | 2 | 1,013 | ||||||
| Mattress Firm Holding Corp.* | 23 | 990 | ||||||
| Zumiez, Inc.* | 37 | 962 | ||||||
| Zale Corp.* | 60 | 946 | ||||||
| Ruth’s Hospitality Group, Inc. | 66 | 938 | ||||||
| FTD Companies, Inc.* | 28 | 912 | ||||||
| Cavco Industries, Inc.* | 13 | 893 | ||||||
| Vera Bradley, Inc.* | 37 | 889 | ||||||
| LeapFrog Enterprises, Inc. — Class A* | 112 | 889 | ||||||
| Universal Electronics, Inc.* | 23 | 876 | ||||||
| Superior Industries International, Inc. | 42 | 866 | ||||||
| NutriSystem, Inc. | 50 | 822 | ||||||
| World Wrestling Entertainment, Inc. — | ||||||||
| Class A | 48 | 796 | ||||||
| Ruby Tuesday, Inc.* | 111 | 769 | ||||||
| Shoe Carnival, Inc. | 26 | 754 | ||||||
| Destination Maternity Corp. | 25 | 747 | ||||||
| Libbey, Inc.* | 35 | 734 | ||||||
| Bright Horizons Family Solutions, Inc.* | 20 | 735 | ||||||
| Rentrak Corp.* | 19 | 720 | ||||||
| Unifi, Inc.* | 26 | 708 | ||||||
| Journal Communications, Inc. — Class A* | 76 | 708 | ||||||
| Strayer Education, Inc. | 20 | 689 | ||||||
| Media General, Inc. — Class A* | 30 | 678 | ||||||
| Overstock.com, Inc.* | 21 | 647 | ||||||
| Stoneridge, Inc.* | 50 | 638 | ||||||
| 90 | THE RYDEX FUNDS ANNUAL REPORT | SEE NOTES TO FINANCIAL STATEMENTS. |
| SCHEDULE OF INVESTMENTS (continued) | December 31, 2013 |
| RUSSELL 2000® 2x STRATEGY FUND |
| Shares | Value | |||||||
| America’s Car-Mart, Inc.* | 15 | $ | 633 | |||||
| Stein Mart, Inc. | 47 | 632 | ||||||
| Federal-Mogul Corp.* | 32 | 630 | ||||||
| Town Sports International Holdings, Inc. | 42 | 620 | ||||||
| Harte-Hanks, Inc. | 79 | 618 | ||||||
| Entravision Communications Corp. — | ||||||||
| Class A | 101 | 615 | ||||||
| MarineMax, Inc.* | 37 | 595 | ||||||
| Kirkland’s, Inc.* | 25 | 592 | ||||||
| PetMed Express, Inc. | 35 | 582 | ||||||
| TRI Pointe Homes, Inc.* | 29 | 578 | ||||||
| Career Education Corp.* | 101 | 576 | ||||||
| Digital Generation, Inc.* | 45 | 574 | ||||||
| NACCO Industries, Inc. — Class A | 9 | 560 | ||||||
| Big 5 Sporting Goods Corp. | 28 | 555 | ||||||
| Bravo Brio Restaurant Group, Inc.* | 34 | 553 | ||||||
| Bridgepoint Education, Inc.* | 31 | 549 | ||||||
| Carriage Services, Inc. — Class A | 28 | 547 | ||||||
| Tile Shop Holdings, Inc.* | 30 | 542 | ||||||
| VOXX International Corp. — Class A* | 32 | 534 | ||||||
| Central European Media Enterprises Ltd. — | ||||||||
| Class A* | 138 | 530 | ||||||
| Universal Technical Institute, Inc. | 37 | 515 | ||||||
| Christopher & Banks Corp.* | 60 | 512 | ||||||
| Destination XL Group, Inc.* | 77 | 506 | ||||||
| Nautilus, Inc.* | 59 | 497 | ||||||
| ValueVision Media, Inc. — Class A* | 69 | 482 | ||||||
| Black Diamond, Inc.* | 36 | 480 | ||||||
| Del Frisco’s Restaurant Group, Inc.* | 20 | 471 | ||||||
| Mac-Gray Corp. | 22 | 467 | ||||||
| Remy International, Inc. | 20 | 466 | ||||||
| CSS Industries, Inc. | 16 | 459 | ||||||
| Saga Communications, Inc. — Class A | 9 | 453 | ||||||
| RadioShack Corp.* | 174 | 452 | ||||||
| Diamond Resorts International, Inc.* | 24 | 443 | ||||||
| William Lyon Homes — Class A* | 20 | 443 | ||||||
| West Marine, Inc.* | 31 | 441 | ||||||
| Education Management Corp.* | 43 | 434 | ||||||
| Entercom Communications Corp. — | ||||||||
| Class A* | 41 | 431 | ||||||
| Marcus Corp. | 32 | 430 | ||||||
| Wet Seal, Inc. — Class A* | 154 | 420 | ||||||
| Speedway Motorsports, Inc. | 21 | 417 | ||||||
| Morgans Hotel Group Co.* | 51 | 415 | ||||||
| Spartan Motors, Inc. | 61 | 409 | ||||||
| Bon-Ton Stores, Inc. | 25 | 407 | ||||||
| Costa, Inc.* | 18 | 391 | ||||||
| Citi Trends, Inc.* | 23 | 391 | ||||||
| McClatchy Co. — Class A* | 112 | 381 | ||||||
| RetailMeNot, Inc.* | 13 | 374 | ||||||
| Winmark Corp. | 4 | 370 | ||||||
| Daily Journal Corp.* | 2 | 370 | ||||||
| Perry Ellis International, Inc.* | 23 | 363 | ||||||
| Fuel Systems Solutions, Inc.* | 26 | 361 | ||||||
| Jamba, Inc.* | 29 | 360 | ||||||
| Weyco Group, Inc. | 12 | 353 | ||||||
| RG Barry Corp. | 18 | 347 | ||||||
| bebe stores, Inc. | 64 | 340 | ||||||
| hhgregg, Inc.* | 24 | 335 | ||||||
| Hooker Furniture Corp. | 20 | 334 | ||||||
| Isle of Capri Casinos, Inc.* | 36 | 324 | ||||||
| Monarch Casino & Resort, Inc.* | 16 | 321 | ||||||
| Culp, Inc. | 15 | 307 | ||||||
| Bassett Furniture Industries, Inc. | 20 | 306 | ||||||
| Lifetime Brands, Inc. | 19 | 299 | ||||||
| Noodles & Co.* | 8 | 287 | ||||||
| Global Sources Ltd.* | 35 | 285 | ||||||
| Orbitz Worldwide, Inc.* | 39 | 280 | ||||||
| Luby’s, Inc.* | 36 | 278 | ||||||
| Carrols Restaurant Group, Inc.* | 42 | 278 | ||||||
| Flexsteel Industries, Inc. | 9 | 277 | ||||||
| Pacific Sunwear of California, Inc.* | 80 | 267 | ||||||
| Sears Hometown and Outlet Stores, Inc.* | 10 | 255 | ||||||
| Corinthian Colleges, Inc.* | 143 | 255 | ||||||
| Nathan’s Famous, Inc.* | 5 | 252 | ||||||
| Zagg, Inc.* | 56 | 244 | ||||||
| JTH Holding, Inc. — Class A* | 10 | 243 | ||||||
| Johnson Outdoors, Inc. — Class A | 9 | 243 | ||||||
| ReachLocal, Inc.* | 19 | 241 | ||||||
| 1-800-Flowers.com, Inc. — Class A* | 44 | 238 | ||||||
| Vitacost.com, Inc.* | 41 | 237 | ||||||
| JAKKS Pacific, Inc. | 35 | 236 | ||||||
| Tower International, Inc.* | 11 | 235 | ||||||
| Fox Factory Holding Corp.* | 13 | 229 | ||||||
| Crown Media Holdings, Inc. — Class A* | 64 | 226 | ||||||
| Systemax, Inc.* | 20 | 225 | ||||||
| Reading International, Inc. — Class A* | 30 | 225 | ||||||
| AH Belo Corp. — Class A | 30 | 224 | ||||||
| Shiloh Industries, Inc.* | 11 | 215 | ||||||
| New York & Company, Inc.* | 48 | 210 | ||||||
| Skullcandy, Inc.* | 29 | 209 | ||||||
| Tilly’s, Inc. — Class A* | 18 | 206 | ||||||
| Lincoln Educational Services Corp. | 41 | 204 | ||||||
| Dex Media, Inc.* | 30 | 203 | ||||||
| Martha Stewart Living Omnimedia, Inc. — | ||||||||
| Class A* | 48 | 202 | ||||||
| Marine Products Corp. | 19 | 191 | ||||||
| Blyth, Inc. | 17 | 185 | ||||||
| Einstein Noah Restaurant Group, Inc. | 12 | 174 | ||||||
| EveryWare Global, Inc.* | 20 | 166 | ||||||
| Salem Communications Corp. — Class A | 19 | 165 | ||||||
| Ignite Restaurant Group, Inc.* | 13 | 163 | ||||||
| WCI Communities, Inc.* | 8 | 153 | ||||||
| UCP, Inc. — Class A* | 10 | 146 | ||||||
| American Apparel, Inc.* | 100 | 123 | ||||||
| Gordmans Stores, Inc. | 16 | 123 | ||||||
| Hemisphere Media Group, Inc.* | 10 | 119 | ||||||
| Body Central Corp.* | 29 | 114 | ||||||
| Diversified Restaurant Holdings, Inc.* | 20 | 95 | ||||||
| Trans World Entertainment Corp.* | 20 | 88 | ||||||
| Beasley Broadcasting Group, Inc. — | ||||||||
| Class A | 8 | 70 | ||||||
| Total Consumer Discretionary | 404,013 | |||||||
| SEE NOTES TO FINANCIAL STATEMENTS. | THE RYDEX FUNDS ANNUAL REPORT | 91 |
| SCHEDULE OF INVESTMENTS (continued) | December 31, 2013 |
| RUSSELL 2000® 2x STRATEGY FUND |
| Shares | Value | |||||||
| HEALTH CARE - 7.4% | ||||||||
| athenahealth, Inc.* | 68 | $ | 9,147 | |||||
| Isis Pharmaceuticals, Inc.* | 197 | 7,847 | ||||||
| Align Technology, Inc.* | 133 | 7,601 | ||||||
| Alnylam Pharmaceuticals, Inc.* | 100 | 6,432 | ||||||
| West Pharmaceutical Services, Inc. | 124 | 6,083 | ||||||
| ViroPharma, Inc.* | 120 | 5,983 | ||||||
| WellCare Health Plans, Inc.* | 80 | 5,634 | ||||||
| Centene Corp.* | 95 | 5,600 | ||||||
| Medidata Solutions, Inc.* | 92 | 5,572 | ||||||
| Cepheid, Inc.* | 118 | 5,512 | ||||||
| NPS Pharmaceuticals, Inc.* | 181 | 5,495 | ||||||
| Team Health Holdings, Inc.* | 120 | 5,466 | ||||||
| Questcor Pharmaceuticals, Inc. | 96 | 5,227 | ||||||
| STERIS Corp. | 108 | 5,189 | ||||||
| HealthSouth Corp. | 151 | 5,032 | ||||||
| PAREXEL International Corp.* | 105 | 4,744 | ||||||
| DexCom, Inc.* | 126 | 4,462 | ||||||
| Medicines Co.* | 111 | 4,287 | ||||||
| Owens & Minor, Inc. | 117 | 4,278 | ||||||
| Air Methods Corp.* | 72 | 4,200 | ||||||
| MWI Veterinary Supply, Inc.* | 24 | 4,094 | ||||||
| Puma Biotechnology, Inc.* | 39 | 4,038 | ||||||
| Haemonetics Corp.* | 94 | 3,960 | ||||||
| Aegerion Pharmaceuticals, Inc.* | 52 | 3,690 | ||||||
| Insulet Corp.* | 99 | 3,673 | ||||||
| Thoratec Corp.* | 100 | 3,660 | ||||||
| Celldex Therapeutics, Inc.* | 143 | 3,462 | ||||||
| HMS Holdings Corp.* | 152 | 3,455 | ||||||
| Prestige Brands Holdings, Inc.* | 94 | 3,365 | ||||||
| Santarus, Inc.* | 101 | 3,228 | ||||||
| Cyberonics, Inc.* | 48 | 3,144 | ||||||
| Impax Laboratories, Inc.* | 125 | 3,143 | ||||||
| Neogen Corp.* | 66 | 3,016 | ||||||
| ACADIA Pharmaceuticals, Inc.* | 120 | 2,999 | ||||||
| Magellan Health Services, Inc.* | 50 | 2,996 | ||||||
| Acadia Healthcare Company, Inc.* | 60 | 2,841 | ||||||
| Opko Health, Inc.* | 333 | 2,811 | ||||||
| Pacira Pharmaceuticals, Inc.* | 48 | 2,760 | ||||||
| HeartWare International, Inc.* | 29 | 2,725 | ||||||
| Amsurg Corp. — Class A* | 58 | 2,664 | ||||||
| Akorn, Inc.* | 107 | 2,635 | ||||||
| Masimo Corp.* | 90 | 2,631 | ||||||
| NuVasive, Inc.* | 80 | 2,586 | ||||||
| Chemed Corp. | 33 | 2,528 | ||||||
| Hanger, Inc.* | 63 | 2,478 | ||||||
| Halozyme Therapeutics, Inc.* | 154 | 2,308 | ||||||
| Nektar Therapeutics* | 203 | 2,304 | ||||||
| Arena Pharmaceuticals, Inc.* | 391 | 2,287 | ||||||
| Wright Medical Group, Inc.* | 74 | 2,273 | ||||||
| ImmunoGen, Inc.* | 154 | 2,259 | ||||||
| MedAssets, Inc.* | 111 | 2,201 | ||||||
| InterMune, Inc.* | 149 | 2,195 | ||||||
| Acorda Therapeutics, Inc.* | 75 | 2,190 | ||||||
| Volcano Corp.* | 100 | 2,185 | ||||||
| PDL BioPharma, Inc. | 255 | 2,152 | ||||||
| Cantel Medical Corp. | 62 | 2,102 | ||||||
| CONMED Corp. | 48 | 2,040 | ||||||
| Analogic Corp. | 23 | 2,037 | ||||||
| Globus Medical, Inc. — Class A* | 100 | 2,018 | ||||||
| Exelixis, Inc.* | 329 | 2,017 | ||||||
| Meridian Bioscience, Inc. | 75 | 1,990 | ||||||
| Ironwood Pharmaceuticals, Inc. — | ||||||||
| Class A* | 170 | 1,974 | ||||||
| Kindred Healthcare, Inc. | 99 | 1,954 | ||||||
| Endologix, Inc.* | 112 | 1,953 | ||||||
| Keryx Biopharmaceuticals, Inc.* | 150 | 1,943 | ||||||
| Synageva BioPharma Corp.* | 30 | 1,942 | ||||||
| Greatbatch, Inc.* | 43 | 1,902 | ||||||
| ABIOMED, Inc.* | 71 | 1,899 | ||||||
| Auxilium Pharmaceuticals, Inc.* | 91 | 1,887 | ||||||
| Spectranetics Corp.* | 75 | 1,875 | ||||||
| ArthroCare Corp.* | 46 | 1,851 | ||||||
| Molina Healthcare, Inc.* | 52 | 1,807 | ||||||
| Fluidigm Corp.* | 47 | 1,801 | ||||||
| IPC The Hospitalist Company, Inc.* | 28 | 1,663 | ||||||
| Novavax, Inc.* | 324 | 1,659 | ||||||
| Vivus, Inc.*,1 | 182 | 1,653 | ||||||
| Dyax Corp.* | 217 | 1,634 | ||||||
| Ligand Pharmaceuticals, Inc. — Class B* | 31 | 1,631 | ||||||
| Quidel Corp.* | 52 | 1,606 | ||||||
| ExamWorks Group, Inc.* | 53 | 1,583 | ||||||
| Omnicell, Inc.* | 62 | 1,583 | ||||||
| Integra LifeSciences Holdings Corp.* | 33 | 1,574 | ||||||
| Quality Systems, Inc. | 74 | 1,558 | ||||||
| ICU Medical, Inc.* | 24 | 1,529 | ||||||
| Momenta Pharmaceuticals, Inc.* | 86 | 1,520 | ||||||
| Ensign Group, Inc. | 34 | 1,505 | ||||||
| Abaxis, Inc.* | 37 | 1,481 | ||||||
| Emeritus Corp.* | 67 | 1,449 | ||||||
| Clovis Oncology, Inc.* | 24 | 1,446 | ||||||
| Exact Sciences Corp.* | 123 | 1,438 | ||||||
| Sangamo Biosciences, Inc.* | 103 | 1,431 | ||||||
| MannKind Corp.* | 268 | 1,396 | ||||||
| Raptor Pharmaceutical Corp.* | 107 | 1,393 | ||||||
| Invacare Corp. | 58 | 1,346 | ||||||
| Luminex Corp.* | 69 | 1,339 | ||||||
| MiMedx Group, Inc.* | 150 | 1,311 | ||||||
| Cardiovascular Systems, Inc.* | 38 | 1,303 | ||||||
| Capital Senior Living Corp.* | 53 | 1,271 | ||||||
| Infinity Pharmaceuticals, Inc.* | 90 | 1,243 | ||||||
| Natus Medical, Inc.* | 55 | 1,238 | ||||||
| Computer Programs & Systems, Inc. | 20 | 1,236 | ||||||
| Merit Medical Systems, Inc.* | 78 | 1,228 | ||||||
| Sarepta Therapeutics, Inc.* | 60 | 1,222 | ||||||
| Accuray, Inc.* | 136 | 1,185 | ||||||
| HealthStream, Inc.* | 36 | 1,180 | ||||||
| PharMerica Corp.* | 54 | 1,161 | ||||||
| Neurocrine Biosciences, Inc.* | 123 | 1,149 | ||||||
| AMN Healthcare Services, Inc.* | 78 | 1,147 | ||||||
| Bio-Reference Labs, Inc.* | 44 | 1,124 | ||||||
| Affymetrix, Inc.* | 129 | 1,106 | ||||||
| Staar Surgical Co.* | 68 | 1,101 | ||||||
| Geron Corp.* | 230 | 1,090 | ||||||
| Emergent Biosolutions, Inc.* | 47 | 1,081 | ||||||
| NxStage Medical, Inc.* | 108 | 1,080 | ||||||
| 92 | THE RYDEX FUNDS ANNUAL REPORT | SEE NOTES TO FINANCIAL STATEMENTS. |
| SCHEDULE OF INVESTMENTS (continued) | December 31, 2013 |
| RUSSELL 2000® 2x STRATEGY FUND |
| Shares | Value | |||||||
| National Healthcare Corp. | 20 | $ | 1,078 | |||||
| Depomed, Inc.* | 101 | 1,069 | ||||||
| Idenix Pharmaceuticals, Inc.* | 174 | 1,041 | ||||||
| Cadence Pharmaceuticals, Inc.* | 114 | 1,032 | ||||||
| Corvel Corp.* | 22 | 1,027 | ||||||
| Array BioPharma, Inc.* | 205 | 1,027 | ||||||
| Insmed, Inc.* | 59 | 1,004 | ||||||
| Select Medical Holdings Corp. | 86 | 998 | ||||||
| Accretive Health, Inc.* | 107 | 980 | ||||||
| Healthways, Inc.* | 63 | 967 | ||||||
| Cambrex Corp.* | 54 | 963 | ||||||
| Tornier N.V.* | 51 | 958 | ||||||
| Spectrum Pharmaceuticals, Inc.* | 108 | 956 | ||||||
| Orexigen Therapeutics, Inc.* | 169 | 951 | ||||||
| Landauer, Inc. | 18 | 947 | ||||||
| Lannett Company, Inc.* | 28 | 927 | ||||||
| AMAG Pharmaceuticals, Inc.* | 38 | 922 | ||||||
| Merrimack Pharmaceuticals, Inc.* | 172 | 918 | ||||||
| Hi-Tech Pharmacal Company, Inc.* | 21 | 911 | ||||||
| Cynosure, Inc. — Class A* | 34 | 907 | ||||||
| Antares Pharma, Inc.* | 201 | 900 | ||||||
| Galena Biopharma, Inc.* | 178 | 883 | ||||||
| AVANIR Pharmaceuticals, Inc. — Class A* | 262 | 880 | ||||||
| Genomic Health, Inc.* | 30 | 878 | ||||||
| Dendreon Corp.* | 284 | 849 | ||||||
| XOMA Corp.* | 125 | 841 | ||||||
| Anika Therapeutics, Inc.* | 22 | 840 | ||||||
| Cerus Corp.* | 129 | 832 | ||||||
| Triple-S Management Corp. — Class B* | 42 | 816 | ||||||
| Repros Therapeutics, Inc.* | 44 | 805 | ||||||
| Amedisys, Inc.* | 55 | 805 | ||||||
| Synergy Pharmaceuticals, Inc.* | 140 | 788 | ||||||
| GenMark Diagnostics, Inc.* | 59 | 785 | ||||||
| TherapeuticsMD, Inc.* | 150 | 782 | ||||||
| Orthofix International N.V.* | 34 | 776 | ||||||
| US Physical Therapy, Inc. | 22 | 776 | ||||||
| Unilife Corp.*,1 | 176 | 774 | ||||||
| Rockwell Medical, Inc.* | 74 | 773 | ||||||
| Vanda Pharmaceuticals, Inc.* | 62 | 769 | ||||||
| BioScrip, Inc.* | 103 | 762 | ||||||
| Sagent Pharmaceuticals, Inc.* | 30 | 761 | ||||||
| AngioDynamics, Inc.* | 44 | 756 | ||||||
| KYTHERA Biopharmaceuticals, Inc.* | 20 | 745 | ||||||
| Lexicon Pharmaceuticals, Inc.* | 404 | 727 | ||||||
| Repligen Corp.* | 53 | 723 | ||||||
| Gentiva Health Services, Inc.* | 58 | 720 | ||||||
| Symmetry Medical, Inc.* | 69 | 696 | ||||||
| Vascular Solutions, Inc.* | 30 | 695 | ||||||
| Horizon Pharma, Inc.* | 91 | 693 | ||||||
| Anacor Pharmaceuticals, Inc.* | 41 | 688 | ||||||
| Intercept Pharmaceuticals, Inc.* | 10 | 683 | ||||||
| OraSure Technologies, Inc.* | 102 | 642 | ||||||
| Dynavax Technologies Corp.* | 325 | 637 | ||||||
| SurModics, Inc.* | 26 | 634 | ||||||
| Omeros Corp.* | 56 | 632 | ||||||
| Immunomedics, Inc.* | 135 | 621 | ||||||
| AtriCure, Inc.* | 32 | 598 | ||||||
| Achillion Pharmaceuticals, Inc.* | 174 | 578 | ||||||
| Vocera Communications, Inc.* | 37 | 578 | ||||||
| Endocyte, Inc.* | 54 | 577 | ||||||
| NewLink Genetics Corp.* | 26 | 572 | ||||||
| Zeltiq Aesthetics, Inc.* | 30 | 567 | ||||||
| Progenics Pharmaceuticals, Inc.* | 106 | 565 | ||||||
| TESARO, Inc.* | 20 | 565 | ||||||
| CryoLife, Inc. | 48 | 532 | ||||||
| Prothena Corporation plc* | 20 | 530 | ||||||
| LHC Group, Inc.* | 22 | 529 | ||||||
| Chelsea Therapeutics International Ltd.* | 119 | 527 | ||||||
| ZIOPHARM Oncology, Inc.* | 121 | 525 | ||||||
| Universal American Corp. | 71 | 518 | ||||||
| Providence Service Corp.* | 20 | 514 | ||||||
| Furiex Pharmaceuticals, Inc.* | 12 | 504 | ||||||
| SciClone Pharmaceuticals, Inc.* | 99 | 499 | ||||||
| Cross Country Healthcare, Inc.* | 49 | 489 | ||||||
| Almost Family, Inc.* | 15 | 485 | ||||||
| Sequenom, Inc.* | 202 | 473 | ||||||
| TearLab Corp.* | 50 | 467 | ||||||
| Portola Pharmaceuticals, Inc.* | 18 | 464 | ||||||
| Pacific Biosciences of California, Inc.* | 88 | 460 | ||||||
| XenoPort, Inc.* | 80 | 460 | ||||||
| AcelRx Pharmaceuticals, Inc.* | 40 | 452 | ||||||
| Zogenix, Inc.* | 130 | 447 | ||||||
| Rigel Pharmaceuticals, Inc.* | 156 | 445 | ||||||
| Navidea Biopharmaceuticals, Inc.* | 213 | 441 | ||||||
| Five Star Quality Care, Inc.* | 79 | 434 | ||||||
| Intrexon Corp.* | 18 | 428 | ||||||
| Osiris Therapeutics, Inc.* | 26 | 418 | ||||||
| Curis, Inc.* | 148 | 417 | ||||||
| Exactech, Inc.* | 17 | 404 | ||||||
| Albany Molecular Research, Inc.* | 40 | 403 | ||||||
| Threshold Pharmaceuticals, Inc.* | 85 | 397 | ||||||
| Synta Pharmaceuticals Corp.* | 74 | 388 | ||||||
| Insys Therapeutics, Inc.* | 10 | 387 | ||||||
| Pozen, Inc. | 48 | 386 | ||||||
| Cell Therapeutics, Inc.* | 200 | 384 | ||||||
| Chindex International, Inc.* | 22 | 383 | ||||||
| Ampio Pharmaceuticals, Inc.* | 53 | 378 | ||||||
| Peregrine Pharmaceuticals, Inc.* | 269 | 374 | ||||||
| Solta Medical, Inc.* | 126 | 372 | ||||||
| Verastem, Inc.* | 32 | 365 | ||||||
| RTI Surgical, Inc.* | 103 | 365 | ||||||
| Cempra, Inc.* | 29 | 359 | ||||||
| Stemline Therapeutics, Inc.* | 18 | 353 | ||||||
| Utah Medical Products, Inc. | 6 | 343 | ||||||
| PhotoMedex, Inc.* | 26 | 337 | ||||||
| Cytokinetics, Inc.* | 49 | 319 | ||||||
| BioDelivery Sciences International, Inc.* | 52 | 306 | ||||||
| Corcept Therapeutics, Inc.* | 95 | 306 | ||||||
| Atrion Corp. | 1 | 296 | ||||||
| Cytori Therapeutics, Inc.* | 115 | 296 | ||||||
| Cutera, Inc.* | 29 | 295 | ||||||
| Receptos, Inc.* | 10 | 290 | ||||||
| Sunesis Pharmaceuticals, Inc.* | 60 | 284 | ||||||
| National Research Corp. — Class A* | 15 | 282 | ||||||
| Merge Healthcare, Inc.* | 120 | 278 | ||||||
| Enanta Pharmaceuticals, Inc.* | 10 | 273 | ||||||
| SEE NOTES TO FINANCIAL STATEMENTS. | THE RYDEX FUNDS ANNUAL REPORT | 93 |
| SCHEDULE OF INVESTMENTS (continued) | December 31, 2013 |
| RUSSELL 2000® 2x STRATEGY FUND |
| Shares | Value | |||||||
| Tetraphase Pharmaceuticals, Inc.* | 20 | $ | 270 | |||||
| Durata Therapeutics, Inc.* | 20 | 256 | ||||||
| PTC Therapeutics, Inc.* | 15 | 255 | ||||||
| Alliance HealthCare Services, Inc.* | 10 | 247 | ||||||
| Accelerate Diagnostics, Inc.* | 20 | 244 | ||||||
| ChemoCentryx, Inc.* | 42 | 243 | ||||||
| Medical Action Industries, Inc.* | 28 | 240 | ||||||
| Biotime, Inc.* | 66 | 238 | ||||||
| OncoMed Pharmaceuticals, Inc.* | 8 | 236 | ||||||
| Arqule, Inc.* | 108 | 232 | ||||||
| Nanosphere, Inc.* | 99 | 227 | ||||||
| OncoGenex Pharmaceutical, Inc.* | 27 | 225 | ||||||
| Addus HomeCare Corp.* | 10 | 225 | ||||||
| SIGA Technologies, Inc.* | 67 | 219 | ||||||
| Supernus Pharmaceuticals, Inc.* | 29 | 219 | ||||||
| NeoGenomics, Inc.* | 60 | 217 | ||||||
| Alphatec Holdings, Inc.* | 108 | 217 | ||||||
| Derma Sciences, Inc.* | 20 | 216 | ||||||
| Sucampo Pharmaceuticals, Inc. — | ||||||||
| Class A* | 23 | 216 | ||||||
| Harvard Bioscience, Inc.* | 46 | 216 | ||||||
| Epizyme, Inc.* | 10 | 208 | ||||||
| Targacept, Inc.* | 50 | 208 | ||||||
| Hyperion Therapeutics, Inc.* | 10 | 202 | ||||||
| Agios Pharmaceuticals, Inc.* | 8 | 192 | ||||||
| Aratana Therapeutics, Inc.* | 10 | 191 | ||||||
| Biolase, Inc.* | 61 | 173 | ||||||
| Skilled Healthcare Group, Inc. — Class A* | 36 | 173 | ||||||
| Bluebird Bio, Inc.* | 8 | 168 | ||||||
| AVEO Pharmaceuticals, Inc.* | 91 | 167 | ||||||
| Vical, Inc.* | 140 | 165 | ||||||
| OvaScience, Inc.* | 18 | 165 | ||||||
| Fibrocell Science, Inc.* | 39 | 158 | ||||||
| Cornerstone Therapeutics, Inc.* | 16 | 152 | ||||||
| Chimerix, Inc.* | 10 | 151 | ||||||
| Alimera Sciences, Inc.* | 30 | 141 | ||||||
| Amicus Therapeutics, Inc.* | 55 | 129 | ||||||
| MEI Pharma, Inc.* | 16 | 128 | ||||||
| Coronado Biosciences, Inc.* | 47 | 124 | ||||||
| Regulus Therapeutics, Inc.* | 16 | 118 | ||||||
| Cellular Dynamics International, Inc.* | 7 | 116 | ||||||
| TG Therapeutics, Inc.* | 28 | 109 | ||||||
| Esperion Therapeutics, Inc.* | 7 | 96 | ||||||
| KaloBios Pharmaceuticals, Inc.* | 18 | 80 | ||||||
| Enzon Pharmaceuticals, Inc. | 68 | 79 | ||||||
| GTx, Inc.* | 47 | 78 | ||||||
| Pernix Therapeutics Holdings* | 29 | 73 | ||||||
| Onconova Therapeutics, Inc.* | 6 | 69 | ||||||
| Harvard Apparatus Regenerative | ||||||||
| Technology, Inc.* | 9 | 43 | ||||||
| Conatus Pharmaceuticals, Inc.* | 6 | 39 | ||||||
| Total Health Care | 386,756 | |||||||
| ENERGY - 3.1% | ||||||||
| Rosetta Resources, Inc.* | 110 | 5,285 | ||||||
| Kodiak Oil & Gas Corp.* | 469 | 5,258 | ||||||
| Bristow Group, Inc. | 67 | 5,030 | ||||||
| SemGroup Corp. — Class A | 77 | 5,024 | ||||||
| Targa Resources Corp. | 53 | 4,672 | ||||||
| Helix Energy Solutions Group, Inc.* | 185 | 4,288 | ||||||
| Western Refining, Inc. | 99 | 4,198 | ||||||
| Energy XXI Bermuda Ltd. | 146 | 3,951 | ||||||
| Scorpio Tankers, Inc. | 325 | 3,832 | ||||||
| SEACOR Holdings, Inc.* | 40 | 3,648 | ||||||
| Exterran Holdings, Inc.* | 105 | 3,591 | ||||||
| CARBO Ceramics, Inc. | 30 | 3,496 | ||||||
| Carrizo Oil & Gas, Inc.* | 74 | 3,313 | ||||||
| PDC Energy, Inc.* | 62 | 3,300 | ||||||
| Hornbeck Offshore Services, Inc.* | 65 | 3,200 | ||||||
| Stone Energy Corp.* | 92 | 3,182 | ||||||
| Crosstex Energy, Inc. | 81 | 2,929 | ||||||
| Alpha Natural Resources, Inc.* | 390 | 2,785 | ||||||
| Bill Barrett Corp.* | 89 | 2,383 | ||||||
| Gulfmark Offshore, Inc. — Class A | 48 | 2,262 | ||||||
| Bonanza Creek Energy, Inc.* | 52 | 2,260 | ||||||
| Magnum Hunter Resources Corp.* | 303 | 2,215 | ||||||
| Delek US Holdings, Inc. | 63 | 2,168 | ||||||
| Key Energy Services, Inc.* | 268 | 2,117 | ||||||
| Geospace Technologies Corp.* | 22 | 2,086 | ||||||
| Cloud Peak Energy, Inc.* | 110 | 1,980 | ||||||
| Forum Energy Technologies, Inc.* | 70 | 1,978 | ||||||
| Matador Resources Co.* | 103 | 1,920 | ||||||
| C&J Energy Services, Inc.* | 82 | 1,894 | ||||||
| Hercules Offshore, Inc.* | 284 | 1,855 | ||||||
| Newpark Resources, Inc.* | 149 | 1,831 | ||||||
| TETRA Technologies, Inc.* | 142 | 1,755 | ||||||
| Northern Oil and Gas, Inc.* | 113 | 1,703 | ||||||
| Parker Drilling Co.* | 209 | 1,699 | ||||||
| Arch Coal, Inc. | 381 | 1,695 | ||||||
| Ship Finance International Ltd. | 103 | 1,687 | ||||||
| Rex Energy Corp.* | 82 | 1,616 | ||||||
| Comstock Resources, Inc. | 88 | 1,610 | ||||||
| Clean Energy Fuels Corp.* | 124 | 1,597 | ||||||
| Halcon Resources Corp.* | 413 | 1,594 | ||||||
| Diamondback Energy, Inc.* | 30 | 1,586 | ||||||
| Sanchez Energy Corp.* | 62 | 1,520 | ||||||
| EPL Oil & Gas, Inc.* | 51 | 1,454 | ||||||
| EXCO Resources, Inc. | 240 | 1,274 | ||||||
| Era Group, Inc.* | 40 | 1,234 | ||||||
| Contango Oil & Gas Co.* | 26 | 1,229 | ||||||
| Nordic American Tankers Ltd. | 120 | 1,164 | ||||||
| Approach Resources, Inc.* | 60 | 1,157 | ||||||
| Resolute Energy Corp.* | 121 | 1,093 | ||||||
| Tesco Corp.* | 55 | 1,088 | ||||||
| Matrix Service Co.* | 44 | 1,077 | ||||||
| RigNet, Inc.* | 22 | 1,054 | ||||||
| Swift Energy Co.* | 78 | 1,053 | ||||||
| W&T Offshore, Inc. | 64 | 1,024 | ||||||
| Triangle Petroleum Corp.* | 120 | 998 | ||||||
| PHI, Inc.* | 23 | 998 | ||||||
| Penn Virginia Corp.* | 99 | 934 | ||||||
| Solazyme, Inc.* | 85 | 926 | ||||||
| Goodrich Petroleum Corp.* | 54 | 919 | ||||||
| Green Plains Renewable Energy, Inc. | 47 | 911 | ||||||
| Clayton Williams Energy, Inc.* | 11 | 901 | ||||||
| Pioneer Energy Services Corp.* | 111 | 889 | ||||||
| 94 | THE RYDEX FUNDS ANNUAL REPORT | SEE NOTES TO FINANCIAL STATEMENTS. |
| SCHEDULE OF INVESTMENTS (continued) | December 31, 2013 |
| RUSSELL 2000® 2x STRATEGY FUND |
| Shares | Value | |||||||
| Synergy Resources Corp.* | 95 | $ | 880 | |||||
| GasLog Ltd. | 50 | 855 | ||||||
| Basic Energy Services, Inc.* | 54 | 852 | ||||||
| ION Geophysical Corp.* | 235 | 776 | ||||||
| Emerald Oil, Inc.* | 100 | 766 | ||||||
| Forest Oil Corp.* | 210 | 758 | ||||||
| Vaalco Energy, Inc.* | 106 | 730 | ||||||
| Rentech, Inc.* | 406 | 711 | ||||||
| Willbros Group, Inc.* | 74 | 697 | ||||||
| Quicksilver Resources, Inc.* | 224 | 688 | ||||||
| Athlon Energy, Inc.* | 22 | 666 | ||||||
| Gastar Exploration, Inc.* | 96 | 664 | ||||||
| Vantage Drilling Co.* | 355 | 653 | ||||||
| Alon USA Energy, Inc. | 39 | 645 | ||||||
| Natural Gas Services Group, Inc.* | 23 | 634 | ||||||
| Gulf Island Fabrication, Inc. | 27 | 627 | ||||||
| Dawson Geophysical Co.* | 15 | 507 | ||||||
| Abraxas Petroleum Corp.* | 151 | 495 | ||||||
| Knightsbridge Tankers Ltd. | 52 | 478 | ||||||
| Callon Petroleum Co.* | 73 | 477 | ||||||
| PetroQuest Energy, Inc.* | 104 | 449 | ||||||
| Teekay Tankers Ltd. — Class A | 114 | 448 | ||||||
| REX American Resources Corp.* | 10 | 447 | ||||||
| Endeavour International Corp.* | 83 | 436 | ||||||
| Panhandle Oil and Gas, Inc. — Class A | 13 | 434 | ||||||
| Mitcham Industries, Inc.* | 24 | 425 | ||||||
| Westmoreland Coal Co.* | 22 | 424 | ||||||
| Renewable Energy Group, Inc.* | 36 | 413 | ||||||
| Warren Resources, Inc.* | 131 | 411 | ||||||
| Midstates Petroleum Company, Inc.* | 62 | 410 | ||||||
| Miller Energy Resources, Inc.* | 56 | 394 | ||||||
| BPZ Resources, Inc.* | 210 | 382 | ||||||
| FX Energy, Inc.* | 98 | 359 | ||||||
| Nuverra Environmental Solutions, Inc.* | 21 | 354 | ||||||
| Bolt Technology Corp. | 16 | 352 | ||||||
| Frontline Ltd.* | 93 | 348 | ||||||
| Evolution Petroleum Corp. | 28 | 346 | ||||||
| Cal Dive International, Inc.* | 171 | 344 | ||||||
| Equal Energy Ltd. | 60 | 320 | ||||||
| Ur-Energy, Inc.* | 219 | 302 | ||||||
| Uranium Energy Corp.* | 148 | 296 | ||||||
| Adams Resources & Energy, Inc. | 4 | 274 | ||||||
| Apco Oil and Gas International, Inc.* | 17 | 265 | ||||||
| Isramco, Inc.* | 2 | 254 | ||||||
| Amyris, Inc.* | 47 | 249 | ||||||
| Jones Energy, Inc. — Class A* | 15 | 217 | ||||||
| TGC Industries, Inc. | 26 | 190 | ||||||
| KiOR, Inc. — Class A* | 75 | 126 | ||||||
| Hallador Energy Co. | 14 | 113 | ||||||
| L&L Energy, Inc.*,†† | 40 | 67 | ||||||
| Global Geophysical Services, Inc.* | 39 | 63 | ||||||
| ZaZa Energy Corp.* | 64 | 61 | ||||||
| Total Energy | 160,902 | |||||||
| MATERIALS - 2.8% | ||||||||
| PolyOne Corp. | 173 | 6,115 | ||||||
| Axiall Corp. | 124 | 5,883 | ||||||
| Chemtura Corp.* | 171 | 4,774 | ||||||
| HB Fuller Co. | 90 | 4,684 | ||||||
| Louisiana-Pacific Corp.* | 247 | 4,571 | ||||||
| Sensient Technologies Corp. | 92 | 4,464 | ||||||
| Commercial Metals Co. | 210 | 4,268 | ||||||
| Olin Corp. | 146 | 4,211 | ||||||
| KapStone Paper and Packaging Corp.* | 75 | 4,189 | ||||||
| Worthington Industries, Inc. | 96 | 4,040 | ||||||
| Minerals Technologies, Inc. | 63 | 3,784 | ||||||
| Graphic Packaging Holding Co.* | 373 | 3,581 | ||||||
| Balchem Corp. | 55 | 3,229 | ||||||
| Schweitzer-Mauduit International, Inc. | 57 | 2,934 | ||||||
| SunCoke Energy, Inc.* | 127 | 2,897 | ||||||
| Texas Industries, Inc.* | 38 | 2,613 | ||||||
| Stillwater Mining Co.* | 207 | 2,555 | ||||||
| Berry Plastics Group, Inc.* | 99 | 2,355 | ||||||
| Kaiser Aluminum Corp. | 33 | 2,318 | ||||||
| Stepan Co. | 34 | 2,231 | ||||||
| PH Glatfelter Co. | 76 | 2,101 | ||||||
| Clearwater Paper Corp.* | 40 | 2,100 | ||||||
| OM Group, Inc.* | 56 | 2,039 | ||||||
| Calgon Carbon Corp.* | 99 | 2,036 | ||||||
| Resolute Forest Products, Inc.* | 127 | 2,035 | ||||||
| Globe Specialty Metals, Inc. | 110 | 1,981 | ||||||
| AK Steel Holding Corp.* | 240 | 1,968 | ||||||
| Innospec, Inc. | 42 | 1,941 | ||||||
| Coeur Mining, Inc.* | 177 | 1,920 | ||||||
| RTI International Metals, Inc.* | 56 | 1,916 | ||||||
| A. Schulman, Inc. | 54 | 1,904 | ||||||
| Quaker Chemical Corp. | 24 | 1,850 | ||||||
| Hecla Mining Co. | 594 | 1,830 | ||||||
| Walter Energy, Inc. | 109 | 1,813 | ||||||
| Innophos Holdings, Inc. | 36 | 1,750 | ||||||
| Flotek Industries, Inc.* | 86 | 1,726 | ||||||
| Ferro Corp.* | 133 | 1,706 | ||||||
| Koppers Holdings, Inc. | 37 | 1,693 | ||||||
| Intrepid Potash, Inc.* | 100 | 1,584 | ||||||
| AMCOL International Corp. | 46 | 1,563 | ||||||
| Molycorp, Inc.* | 257 | 1,444 | ||||||
| Deltic Timber Corp. | 21 | 1,427 | ||||||
| Schnitzer Steel Industries, Inc. — Class A | 42 | 1,372 | ||||||
| LSB Industries, Inc.* | 33 | 1,354 | ||||||
| Kraton Performance Polymers, Inc.* | 58 | 1,337 | ||||||
| Headwaters, Inc.* | 133 | 1,302 | ||||||
| Horsehead Holding Corp.* | 80 | 1,297 | ||||||
| Haynes International, Inc. | 23 | 1,271 | ||||||
| Tredegar Corp. | 42 | 1,210 | ||||||
| Neenah Paper, Inc. | 28 | 1,198 | ||||||
| US Silica Holdings, Inc. | 35 | 1,194 | ||||||
| American Vanguard Corp. | 49 | 1,190 | ||||||
| Materion Corp. | 37 | 1,141 | ||||||
| Myers Industries, Inc. | 52 | 1,098 | ||||||
| Wausau Paper Corp. | 86 | 1,090 | ||||||
| Advanced Emissions Solutions, Inc.* | 19 | 1,030 | ||||||
| Century Aluminum Co.* | 94 | 983 | ||||||
| Zoltek Companies, Inc.* | 50 | 838 | ||||||
| OMNOVA Solutions, Inc.* | 84 | 765 | ||||||
| Zep, Inc. | 42 | 763 | ||||||
| Allied Nevada Gold Corp.* | 190 | 674 | ||||||
| SEE NOTES TO FINANCIAL STATEMENTS. | THE RYDEX FUNDS ANNUAL REPORT | 95 |
| SCHEDULE OF INVESTMENTS (continued) | December 31, 2013 |
| RUSSELL 2000® 2x STRATEGY FUND |
| Shares | Value | |||||||
| Hawkins, Inc. | 17 | $ | 632 | |||||
| FutureFuel Corp. | 40 | 632 | ||||||
| Boise Cascade Co.* | 20 | 590 | ||||||
| Taminco Corp.* | 29 | 586 | ||||||
| Landec Corp.* | 46 | 558 | ||||||
| Olympic Steel, Inc. | 17 | 493 | ||||||
| Universal Stainless & Alloy Products, Inc.* | 13 | 469 | ||||||
| US Concrete, Inc.* | 20 | �� | 453 | |||||
| AM Castle & Co.* | 30 | 443 | ||||||
| Arabian American Development Co.* | 35 | 439 | ||||||
| Chase Corp. | 12 | 424 | ||||||
| AEP Industries, Inc.* | 8 | 423 | ||||||
| American Pacific Corp.* | 10 | 373 | ||||||
| KMG Chemicals, Inc. | 15 | 253 | ||||||
| UFP Technologies, Inc.* | 10 | 252 | ||||||
| Gold Resource Corp. | 55 | 249 | ||||||
| United States Lime & Minerals, Inc.* | 4 | 245 | ||||||
| Handy & Harman Ltd.* | 10 | 242 | ||||||
| Paramount Gold and Silver Corp.* | 245 | 228 | ||||||
| Penford Corp.* | 16 | 206 | ||||||
| Noranda Aluminum Holding Corp. | 62 | 204 | ||||||
| Midway Gold Corp.* | 196 | 159 | ||||||
| General Moly, Inc.* | 105 | 141 | ||||||
| Marrone Bio Innovations, Inc.* | 6 | 107 | ||||||
| GSE Holding, Inc.* | 15 | 31 | ||||||
| Total Materials | 145,962 | |||||||
| CONSUMER STAPLES - 2.1% | ||||||||
| United Natural Foods, Inc.* | 91 | 6,861 | ||||||
| Rite Aid Corp.* | 1,306 | 6,608 | ||||||
| Hain Celestial Group, Inc.* | 69 | 6,264 | ||||||
| Casey’s General Stores, Inc. | 71 | 4,988 | ||||||
| TreeHouse Foods, Inc.* | 67 | 4,618 | ||||||
| Darling International, Inc.* | 208 | 4,343 | ||||||
| Harris Teeter Supermarkets, Inc. | 87 | 4,293 | ||||||
| PriceSmart, Inc. | 32 | 3,697 | ||||||
| Boston Beer Company, Inc. — Class A* | 15 | 3,627 | ||||||
| B&G Foods, Inc. — Class A | 96 | 3,255 | ||||||
| Andersons, Inc. | 34 | 3,032 | ||||||
| Post Holdings, Inc.* | 59 | 2,907 | ||||||
| Sanderson Farms, Inc. | 40 | 2,893 | ||||||
| Spectrum Brands Holdings, Inc. | 40 | 2,821 | ||||||
| Lancaster Colony Corp. | 32 | 2,821 | ||||||
| SUPERVALU, Inc.* | 364 | 2,654 | ||||||
| Snyders-Lance, Inc. | 88 | 2,527 | ||||||
| J&J Snack Foods Corp. | 27 | 2,392 | ||||||
| Universal Corp. | 41 | 2,239 | ||||||
| Susser Holdings Corp.* | 33 | 2,161 | ||||||
| WD-40 Co. | 28 | 2,091 | ||||||
| Fresh Del Monte Produce, Inc. | 70 | 1,981 | ||||||
| Pilgrim’s Pride Corp.* | 112 | 1,820 | ||||||
| Vector Group Ltd. | 111 | 1,817 | ||||||
| Boulder Brands, Inc.* | 109 | 1,729 | ||||||
| Elizabeth Arden, Inc.* | 47 | 1,667 | ||||||
| Cal-Maine Foods, Inc. | 27 | 1,626 | ||||||
| Spartan Stores, Inc. | 65 | 1,568 | ||||||
| Tootsie Roll Industries, Inc. | 35 | 1,139 | ||||||
| Weis Markets, Inc. | 20 | 1,051 | ||||||
| Chefs’ Warehouse, Inc.* | 33 | 962 | ||||||
| Chiquita Brands International, Inc.* | 81 | 948 | ||||||
| Inter Parfums, Inc. | 26 | 932 | ||||||
| Diamond Foods, Inc.* | 36 | 930 | ||||||
| Annie’s, Inc.* | 20 | 861 | ||||||
| USANA Health Sciences, Inc.* | 11 | 831 | ||||||
| Harbinger Group, Inc.* | 61 | 723 | ||||||
| Pantry, Inc.* | 43 | 722 | ||||||
| Calavo Growers, Inc. | 23 | 696 | ||||||
| Coca-Cola Bottling Company Consolidated | 9 | 659 | ||||||
| Medifast, Inc.* | 25 | 653 | ||||||
| Ingles Markets, Inc. — Class A | 23 | 623 | ||||||
| Natural Grocers by Vitamin Cottage, Inc.* | 13 | 552 | ||||||
| Fairway Group Holdings Corp.* | 29 | 525 | ||||||
| Revlon, Inc. — Class A* | 21 | 524 | ||||||
| Central Garden and Pet Co. — Class A* | 74 | 500 | ||||||
| Alliance One International, Inc.* | 158 | 482 | ||||||
| Seneca Foods Corp. — Class A* | 15 | 478 | ||||||
| Roundy’s, Inc. | 47 | 463 | ||||||
| Omega Protein Corp.* | 37 | 455 | ||||||
| Limoneira Co. | 17 | 452 | ||||||
| Nutraceutical International Corp.* | 16 | 428 | ||||||
| National Beverage Corp.* | 21 | 423 | ||||||
| Village Super Market, Inc. — Class A | 12 | 372 | ||||||
| John B Sanfilippo & Son, Inc. | 15 | 370 | ||||||
| Female Health Co. | 41 | 349 | ||||||
| Nature’s Sunshine Products, Inc. | 20 | 346 | ||||||
| Inventure Foods, Inc.* | 26 | 345 | ||||||
| Star Scientific, Inc.* | 296 | 343 | ||||||
| Oil-Dri Corporation of America | 9 | 341 | ||||||
| Lifevantage Corp.* | 200 | 330 | ||||||
| Orchids Paper Products Co. | 10 | 328 | ||||||
| Craft Brew Alliance, Inc.* | 19 | 312 | ||||||
| Synutra International, Inc.* | 32 | 284 | ||||||
| Farmer Bros Co.* | 11 | 256 | ||||||
| Alico, Inc. | 5 | 194 | ||||||
| Griffin Land & Nurseries, Inc. | 5 | 167 | ||||||
| Lifeway Foods, Inc. | 8 | 128 | ||||||
| Arden Group, Inc. — Class A | 1 | 127 | ||||||
| Total Consumer Staples | 110,904 | |||||||
| UTILITIES - 1.7% | ||||||||
| Cleco Corp. | 110 | 5,129 | ||||||
| Southwest Gas Corp. | 85 | 4,753 | ||||||
| IDACORP, Inc. | 91 | 4,717 | ||||||
| Piedmont Natural Gas Company, Inc. | 138 | 4,576 | ||||||
| UNS Energy Corp. | 76 | 4,549 | ||||||
| Black Hills Corp. | 82 | 4,306 | ||||||
| Portland General Electric Co. | 140 | 4,228 | ||||||
| UIL Holdings Corp. | 102 | 3,953 | ||||||
| Dynegy, Inc.* | 180 | 3,873 | ||||||
| WGL Holdings, Inc. | 94 | 3,766 | ||||||
| ALLETE, Inc. | 72 | 3,591 | ||||||
| PNM Resources, Inc. | 146 | 3,522 | ||||||
| New Jersey Resources Corp. | 75 | 3,468 | ||||||
| South Jersey Industries, Inc. | 58 | 3,246 | ||||||
| Avista Corp. | 110 | 3,101 | ||||||
| NorthWestern Corp. | 70 | 3,032 | ||||||
| 96 | THE RYDEX FUNDS ANNUAL REPORT | SEE NOTES TO FINANCIAL STATEMENTS. |
| SCHEDULE OF INVESTMENTS (continued) | December 31, 2013 |
| RUSSELL 2000® 2x STRATEGY FUND |
| Shares | Value | |||||||
| Laclede Group, Inc. | 62 | $ | 2,823 | |||||
| El Paso Electric Co. | 74 | 2,598 | ||||||
| MGE Energy, Inc. | 41 | 2,374 | ||||||
| Northwest Natural Gas Co. | 48 | 2,055 | ||||||
| California Water Service Group | 88 | 2,030 | ||||||
| Otter Tail Corp. | 67 | 1,961 | ||||||
| American States Water Co. | 67 | 1,925 | ||||||
| Empire District Electric Co. | 78 | 1,770 | ||||||
| NRG Yield, Inc. — Class A | 32 | 1,280 | ||||||
| Chesapeake Utilities Corp. | 18 | 1,080 | ||||||
| Ormat Technologies, Inc. | 31 | 844 | ||||||
| SJW Corp. | 28 | 834 | ||||||
| Unitil Corp. | 25 | 762 | ||||||
| Atlantic Power Corp. | 218 | 759 | ||||||
| Connecticut Water Service, Inc. | 17 | 604 | ||||||
| Middlesex Water Co. | 27 | 565 | ||||||
| York Water Co. | 24 | 502 | ||||||
| Consolidated Water Company Ltd. | 27 | 381 | ||||||
| Artesian Resources Corp. — Class A | 14 | 321 | ||||||
| Delta Natural Gas Company, Inc. | 11 | 246 | ||||||
| Genie Energy Ltd. — Class B* | 24 | 245 | ||||||
| Pure Cycle Corp.* | 30 | 190 | ||||||
| Total Utilities | 89,959 | |||||||
| TELECOMMUNICATION SERVICES - 0.4% | ||||||||
| Cogent Communications Group, Inc. | 84 | 3,393 | ||||||
| Leap Wireless International, Inc.* | 98 | 1,705 | ||||||
| Consolidated Communications | ||||||||
| Holdings, Inc. | 74 | 1,453 | ||||||
| Cincinnati Bell, Inc.* | 375 | 1,335 | ||||||
| 8x8, Inc.* | 127 | 1,290 | ||||||
| Shenandoah Telecommunications Co. | 43 | 1,104 | ||||||
| Premiere Global Services, Inc.* | 89 | 1,032 | ||||||
| Atlantic Tele-Network, Inc. | 17 | 962 | ||||||
| Vonage Holdings Corp.* | 275 | 916 | ||||||
| NII Holdings, Inc.* | 310 | 853 | ||||||
| inContact, Inc.* | 97 | 758 | ||||||
| Iridium Communications, Inc.* | 115 | 720 | ||||||
| Inteliquent, Inc. | 60 | 685 | ||||||
| General Communication, Inc. — Class A* | 58 | 647 | ||||||
| Lumos Networks Corp. | 28 | 588 | ||||||
| Hawaiian Telcom Holdco, Inc.* | 19 | 558 | ||||||
| NTELOS Holdings Corp. | 27 | 546 | ||||||
| USA Mobility, Inc. | 37 | 528 | ||||||
| IDT Corp. — Class B | 28 | 500 | ||||||
| ORBCOMM, Inc.* | 67 | 425 | ||||||
| Fairpoint Communications, Inc.* | 37 | 418 | ||||||
| Towerstream Corp.* | 121 | 358 | ||||||
| magicJack VocalTec Ltd.* | 30 | 358 | ||||||
| Cbeyond, Inc.* | 48 | 331 | ||||||
| HickoryTech Corp. | 25 | 321 | ||||||
| Boingo Wireless, Inc.* | 31 | 199 | ||||||
| Straight Path Communications, Inc. — | ||||||||
| Class B* | 14 | 115 | ||||||
| Total Telecommunication Services | 22,098 | |||||||
| Total Common Stocks | ||||||||
| (Cost $1,826,917) | 2,944,807 | |||||||
| WARRANTS†† - 0.0% | ||||||||
| Tejon Ranch Co. | ||||||||
| $10.50, 08/31/16*,† | 4 | 21 | ||||||
| Magnum Hunter Resources Corp. | ||||||||
| $8.50, 04/15/16* | 25 | — | ||||||
| Total Warrants | ||||||||
| (Cost $19) | 21 | |||||||
| RIGHTS†† - 0.0% | ||||||||
| Cubist Pharmaceuticals, Inc. | ||||||||
| Expires 10/15/15*,† | 72 | 97 | ||||||
| EXCO Resources Inc. | ||||||||
| Expires 01/09/14*,† | 60 | 10 | ||||||
| Omthera Pharmaceuticals, Inc. | ||||||||
| Expires 12/31/20* | 10 | 6 | ||||||
| Total Rights | ||||||||
| (Cost $128) | 113 | |||||||
| Face | ||||||||
| Amount | ||||||||
| REPURCHASE AGREEMENTS††,2 - 22.3% | ||||||||
| Credit Suisse Group | ||||||||
| issued 12/31/13 at 0.00% | ||||||||
| due 01/02/143 | $ | 717,211 | 717,211 | |||||
| Deutsche Bank | ||||||||
| issued 12/31/13 at 0.01% | ||||||||
| due 01/02/14 | 147,002 | 147,002 | ||||||
| HSBC Group | ||||||||
| issued 12/31/13 at 0.01% | ||||||||
| due 01/02/14 | 147,002 | 147,002 | ||||||
| Mizuho Financial Group, Inc. | ||||||||
| issued 12/31/13 at 0.01% | ||||||||
| due 01/02/14 | 146,337 | 146,337 | ||||||
| Total Repurchase Agreements | ||||||||
| (Cost $1,157,552) | 1,157,552 | |||||||
| SECURITIES LENDING COLLATERAL††,4 - 0.0% | ||||||||
| Repurchase Agreements | ||||||||
| HSBC Securities, Inc. | ||||||||
| issued 12/31/13 at 0.01% | ||||||||
| due 01/02/14 | 771 | 771 | ||||||
| Deutsche Bank Securities, Inc. | ||||||||
| issued 12/31/13 at 0.02% | ||||||||
| due 01/02/14 | 114 | 114 | ||||||
| Total Securities Lending Collateral | ||||||||
| (Cost $885) | 885 | |||||||
| Total Investments - 79.0% | ||||||||
| (Cost $2,985,501) | $ | 4,103,378 | ||||||
| Other Assets & Liabilities, net - 21.0% | 1,093,057 | |||||||
| Total Net Assets - 100.0% | $ | 5,196,435 | ||||||
| SEE NOTES TO FINANCIAL STATEMENTS. | THE RYDEX FUNDS ANNUAL REPORT | 97 |
| SCHEDULE OF INVESTMENTS (concluded) | December 31, 2013 |
| RUSSELL 2000® 2x STRATEGY FUND |
| Unrealized | ||||||||
| Contracts | Gain | |||||||
| EQUITY FUTURES CONTRACTS PURCHASED† | ||||||||
| March 2014 Russell 2000 Index | ||||||||
| Mini Futures Contracts | ||||||||
| (Aggregate Value of | ||||||||
| Contracts $580,300) | 5 | $ | 3,458 | |||||
| Units | ||||||||
| EQUITY INDEX SWAP AGREEMENTS†† | ||||||||
| Credit Suisse Capital, LLC | ||||||||
| January 2014 Russell 2000 Index Swap, | ||||||||
| Terminating 01/28/145 | ||||||||
| (Notional Value $2,892,285) | 2,486 | $ | 3,557 | |||||
| Barclays Bank plc | ||||||||
| January 2014 Russell 2000 Index Swap, | ||||||||
| Terminating 01/31/145 | ||||||||
| (Notional Value $2,926,779) | 2,515 | 2,282 | ||||||
| Goldman Sachs International | ||||||||
| January 2014 Russell 2000 Index Swap, | ||||||||
| Terminating 01/28/145 | ||||||||
| (Notional Value $1,019,268) | 876 | 1,369 | ||||||
| (Total Notional Value | ||||||||
| $6,838,332) | $ | 7,208 | ||||||
| * | Non-income producing security. |
| † | Value determined based on Level 1 inputs, unless otherwise noted — See Note 4. |
| †† | Value determined based on Level 2 inputs, unless otherwise noted — See Note 4. |
| 1 | All or a portion of this security is on loan at December 31, 2013 — See Note 10. |
| 2 | Repurchase Agreements — See Note 5. |
| 3 | All or a portion of this security is pledged as equity index swap collateral at December 31, 2013. |
| 4 | Securities lending collateral — See Note 10. |
| 5 | Total Return based on Russell 2000 Index +/- financing at a variable rate. |
plc — Public Limited Company
REIT — Real Estate Investment Trust
| 98 | THE RYDEX FUNDS ANNUAL REPORT | SEE NOTES TO FINANCIAL STATEMENTS. |
| RUSSELL 2000® 2x STRATEGY FUND |
| STATEMENT OF ASSETS |
| AND LIABILITIES |
December 31, 2013
| Assets: | ||||
| Investments, at value - including $853 of securities loaned | ||||
| (cost $1,827,064) | $ | 2,944,941 | ||
| Repurchase agreements, at value | ||||
| (cost $1,158,437) | 1,158,437 | |||
| Total investments | ||||
| (cost $2,985,501) | 4,103,378 | |||
| Segregated cash with broker | 21,500 | |||
| Unrealized appreciation on swap agreements | 7,208 | |||
| Receivables: | ||||
| Fund shares sold | 1,069,949 | |||
| Dividends | 3,537 | |||
| Variation margin | 2,000 | |||
| Securities sold | 1,289 | |||
| Interest and securities lending income | 9 | |||
| Total assets | 5,208,870 | |||
| Liabilities: | ||||
| Payable for: | ||||
| Management fees | 2,804 | |||
| Upon return of securities loaned | 885 | |||
| Transfer agent and administrative fees | 779 | |||
| Investor service fees | 779 | |||
| Portfolio accounting fees | 311 | |||
| Fund shares redeemed | 166 | |||
| Miscellaneous | 6,711 | |||
| Total liabilities | 12,435 | |||
| Net assets | $ | 5,196,435 | ||
| Net assets consist of: | ||||
| Paid in capital | $ | 3,485,856 | ||
| Accumulated net investment loss | (579 | ) | ||
| Accumulated net realized gain on investments | 582,615 | |||
| Net unrealized appreciation on investments | 1,128,543 | |||
| Net assets | $ | 5,196,435 | ||
| Capital shares outstanding | 19,775 | |||
| Net asset value per share | $ | 262.78 |
| STATEMENT OF |
| OPERATIONS |
Year Ended December 31, 2013
| Investment Income: | ||||
| Dividends (net of foreign withholding tax of $30) | $ | 38,363 | ||
| Interest | 518 | |||
| Income from securities lending, net | 292 | |||
| Total investment income | 39,173 | |||
| Expenses: | ||||
| Management fees | 39,662 | |||
| Transfer agent and administrative fees | 11,017 | |||
| Investor service fees | 11,017 | |||
| Portfolio accounting fees | 4,407 | |||
| Professional fees | 4,067 | |||
| Trustees’ fees* | 522 | |||
| Custodian fees | 507 | |||
| Line of credit interest expense | 6 | |||
| Miscellaneous | 5,728 | |||
| Total expenses | 76,933 | |||
| Net investment loss | (37,760 | ) | ||
| Net Realized and Unrealized Gain (Loss): | ||||
| Net realized gain (loss) on: | ||||
| Investments | 278,377 | |||
| Swap agreements | 1,426,549 | |||
| Futures contracts | 137,423 | |||
| Net realized gain | 1,842,349 | |||
| Net change in unrealized appreciation (depreciation) on: | ||||
| Investments | 527,559 | |||
| Swap agreements | (53,213 | ) | ||
| Futures contracts | 2,174 | |||
| Net change in unrealized appreciation (depreciation) | 476,520 | |||
| Net realized and unrealized gain | 2,318,869 | |||
| Net increase in net assets resulting from operations | $ | 2,281,109 |
| * | Relates to Trustees not deemed “interested persons” within the meaning of Section 2(a)(19) of the 1940 Act. |
| SEE NOTES TO FINANCIAL STATEMENTS. | THE RYDEX FUNDS ANNUAL REPORT | 99 |
| RUSSELL 2000® 2x STRATEGY FUND |
| STATEMENTS OF CHANGES IN NET ASSETS |
| Year Ended | Year Ended | |||||||
| December 31, | December 31, | |||||||
| 2013 | 2012 | |||||||
| Increase (Decrease) In Net Assets From Operations: | ||||||||
| Net investment loss | $ | (37,760 | ) | $ | (36,250 | ) | ||
| Net realized gain on investments | 1,842,349 | 841,991 | ||||||
| Net change in unrealized appreciation (depreciation) on investments | 476,520 | 458,892 | ||||||
| Net increase in net assets resulting from operations | 2,281,109 | 1,264,633 | ||||||
| Capital share transactions: | ||||||||
| Proceeds from sale of shares | 19,955,763 | 39,304,465 | ||||||
| Cost of shares redeemed | (20,195,945 | ) | (43,991,735 | ) | ||||
| Net decrease from capital share transactions | (240,182 | ) | (4,687,270 | ) | ||||
| Net increase (decrease) in net assets | 2,040,927 | (3,422,637 | ) | |||||
| Net assets: | ||||||||
| Beginning of year | 3,155,508 | 6,578,145 | ||||||
| End of year | $ | 5,196,435 | $ | 3,155,508 | ||||
| Accumulated net investment loss at end of year | $ | (579 | ) | $ | (64 | ) | ||
| Capital share activity: | ||||||||
| Shares sold | 104,190 | 307,650 | ||||||
| Shares redeemed | (106,715 | ) | (345,408 | ) | ||||
| Net decrease in shares | (2,525 | ) | (37,758 | ) | ||||
| 100 | THE RYDEX FUNDS ANNUAL REPORT | SEE NOTES TO FINANCIAL STATEMENTS. |
| RUSSELL 2000® 2x STRATEGY FUND |
| FINANCIAL HIGHLIGHTS |
This table is presented to show selected data for a share outstanding throughout each period and to assist shareholders in evaluating a Fund’s performance for the periods presented.
| Year Ended | Year Ended | Year Ended | Year Ended | Year Ended | ||||||||||||||||
| December 31, | December 31, | December 31, | December 31, | December 31, | ||||||||||||||||
| 2013 | 2012 | 2011 | 2010 | 2009c | ||||||||||||||||
| Per Share Data | ||||||||||||||||||||
| Net asset value, beginning of period | $ | 141.50 | $ | 109.53 | $ | 148.42 | $ | 100.07 | $ | 73.67 | ||||||||||
| Income (loss) from investment operations: | ||||||||||||||||||||
| Net investment lossa | (1.63 | ) | (.96 | ) | (2.04 | ) | (1.25 | ) | (.67 | ) | ||||||||||
| Net gain (loss) on investments (realized and unrealized) | 122.91 | 32.93 | (26.77 | ) | 49.60 | 27.08 | ||||||||||||||
| Total from investment operations | 121.28 | 31.97 | (28.81 | ) | 48.35 | 26.41 | ||||||||||||||
| Less distributions from: | ||||||||||||||||||||
| Net investment income | — | — | — | — | (.01 | ) | ||||||||||||||
| Net realized gains | — | — | (10.08 | ) | — | — | ||||||||||||||
| Total distributions | — | — | (10.08 | ) | — | (.01 | ) | |||||||||||||
| Net asset value, end of period | $ | 262.78 | $ | 141.50 | $ | 109.53 | $ | 148.42 | $ | 100.07 | ||||||||||
| Total Returnb | 85.72 | % | 29.19 | % | (19.38 | %) | 48.30 | % | 35.85 | % | ||||||||||
| Ratios/Supplemental Data | ||||||||||||||||||||
| Net assets, end of period (in thousands) | $ | 5,196 | $ | 3,156 | $ | 6,578 | $ | 5,074 | $ | 3,651 | ||||||||||
| Ratios to average net assets: | ||||||||||||||||||||
| Net investment loss | (0.86 | %) | (0.76 | %) | (1.50 | %) | (1.11 | %) | (0.97 | %) | ||||||||||
| Total expenses | 1.75 | % | 1.77 | % | 1.82 | % | 1.74 | % | 1.75 | % | ||||||||||
| Portfolio turnover rate | 80 | % | 325 | % | 15 | % | 100 | % | 493 | % | ||||||||||
| a | Net investment loss per share was computed using average shares outstanding throughout the period. |
| b | Total return does not reflect the impact of any additional fees charged by insurance companies. |
| c | Reverse share split — Per share amounts for the period January 1, 2009 through April 19, 2009 have been restated to reflect a 1:10 reverse share split effective April 20, 2009. |
| SEE NOTES TO FINANCIAL STATEMENTS. | THE RYDEX FUNDS ANNUAL REPORT | 101 |
| PERFORMANCE REPORT AND FUND PROFILE (Unaudited) | December 31, 2013 |
RUSSELL 2000® 1.5x STRATEGY Fund
OBJECTIVE: Seeks to provide investment results that correlate, before fees and expenses, to the performance of a specific benchmark for small-cap securities on a daily basis. The Fund’s current benchmark is 150% of the performance of the Russell 2000® Index (the “underlying index”). The Fund does not seek to achieve its investment objective over a period of time greater than one day.
For the year ended December 31, 2013, Russell 2000® 1.5x Strategy Fund maintained a daily correlation of over 99% to its benchmark of 150% of the daily price movement of the Russell 2000 Index. Russell 2000® 1.5x Strategy Fund returned 58.56%, while the Russell 2000 Index returned 38.82% over the same time period.
Among sectors, the biggest performance contributors to the underlying index during the period were Financials and Information Technology. No sector detracted from performance, but Telecommunications Services and Utilities contributed least.
Isis Pharmaceuticals, Inc., CoStar Group, Inc. and Alnylam Pharmaceuticals, Inc. were the largest contributors to performance of the underlying index for the year. Coeur Mining, Inc., Atlantic Power Corp. and Hecla Mining Co. were the leading detractors from performance of the underlying index for the year.
Derivatives in the Fund were used to help provide exposure to the composition of the benchmark in the highest efficient manner and to provide leverage, not for hedging purposes.
Due to the compounding of daily returns, leveraged and inverse funds’ returns over periods other than one day will likely differ in amount and possibly direction from the benchmark return for the same period. Investors should monitor their leveraged and inverse funds’ holdings to ensure that they are consistent with their strategies, as frequently as daily.
The effects of compounding may cause the longer-term correlation of the fund to its benchmark to diminish. The apparent discrepancy between the leveraged and unleveraged indices is the result of compounding, which is described briefly on page 6 of this report.
Performance displayed represents past performance, which is no guarantee of future results.
Holdings Diversification (Market Exposure as % of Net Assets)

“Holdings Diversification (Market Exposure as % of Net Assets)” excludes any temporary cash investments.
| Inception Date: October 1, 2001 | ||||
| Ten Largest Holdings (% of Total Net Assets) | ||||
| CoStar Group, Inc. | 0.2 | % | ||
| athenahealth, Inc. | 0.2 | % | ||
| Acuity Brands, Inc. | 0.2 | % | ||
| Isis Pharmaceuticals, Inc. | 0.2 | % | ||
| Middleby Corp. | 0.2 | % | ||
| PTC, Inc. | 0.2 | % | ||
| Ultimate Software Group, Inc. | 0.2 | % | ||
| Align Technology, Inc. | 0.2 | % | ||
| Brunswick Corp. | 0.2 | % | ||
| Aspen Technology, Inc. | 0.2 | % | ||
| Top Ten Total | 2.0 | % | ||
“Ten Largest Holdings” exclude any temporary cash or derivative investments.
| 102 | THE RYDEX FUNDS ANNUAL REPORT |
| PERFORMANCE REPORT AND FUND PROFILE (Unaudited) (concluded) |
Cumulative Fund Performance*,†
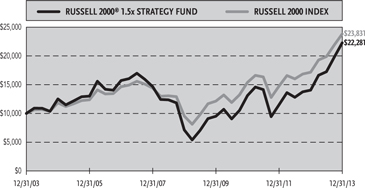
Average Annual Returns
Periods Ended December 31, 2013*,†
| 1 Year | 5 Year | 10 Year | ||||||||||
| Russell 2000® 1.5x Strategy Fund | 58.56 | % | 25.59 | % | 8.34 | % | ||||||
| Russell 2000 Index | 38.82 | % | 20.08 | % | 9.07 | % | ||||||
| * | The performance data above represents past performance that is not predictive of future results. The investment return and principal value of an investment in the Fund will fluctuate so that an investor’s shares, when redeemed, may be worth more or less than their original cost. Returns are historical and include changes in principal and reinvested dividends and capital gains and do not reflect the effect of taxes. The Russell 2000 Index is an unmanaged index and, unlike the Fund, has no management fees or operating expenses to reduce its reported return. |
| † | Returns do not reflect the impact of any additional fees charged by insurance companies. |
| THE RYDEX FUNDS ANNUAL REPORT | 103 |
| SCHEDULE OF INVESTMENTS | December 31, 2013 |
| RUSSELL 2000® 1.5x STRATEGY FUND |
| Shares | Value | |||||||
| COMMON STOCKS† - 68.5% | ||||||||
| FINANCIALS - 15.5% | ||||||||
| CNO Financial Group, Inc. | 1,142 | $ | 20,201 | |||||
| Prosperity Bancshares, Inc. | 308 | 19,523 | ||||||
| FirstMerit Corp. | 861 | 19,139 | ||||||
| Financial Engines, Inc. | 252 | 17,508 | ||||||
| Highwoods Properties, Inc. | 465 | 16,819 | ||||||
| LaSalle Hotel Properties | 537 | 16,571 | ||||||
| NorthStar Realty Finance Corp. | 1,229 | 16,531 | ||||||
| Hancock Holding Co. | 439 | 16,103 | ||||||
| Prospect Capital Corp. | 1,425 | 15,989 | ||||||
| Stifel Financial Corp.* | 329 | 15,766 | ||||||
| First American Financial Corp. | 557 | 15,706 | ||||||
| RLJ Lodging Trust | 631 | 15,346 | ||||||
| Webster Financial Corp. | 465 | 14,499 | ||||||
| MGIC Investment Corp.* | 1,668 | 14,078 | ||||||
| Portfolio Recovery Associates, Inc.* | 264 | 13,949 | ||||||
| Texas Capital Bancshares, Inc.* | 213 | 13,249 | ||||||
| MarketAxess Holdings, Inc. | 198 | 13,240 | ||||||
| EPR Properties | 269 | 13,224 | ||||||
| BancorpSouth, Inc. | 500 | 12,710 | ||||||
| Radian Group, Inc. | 890 | 12,567 | ||||||
| Primerica, Inc. | 291 | 12,486 | ||||||
| Susquehanna Bancshares, Inc. | 957 | 12,288 | ||||||
| Geo Group, Inc. | 372 | 11,986 | ||||||
| UMB Financial Corp. | 186 | 11,956 | ||||||
| DiamondRock Hospitality Co. | 1,006 | 11,619 | ||||||
| RLI Corp. | 117 | 11,393 | ||||||
| Sunstone Hotel Investors, Inc. | 844 | 11,310 | ||||||
| Glacier Bancorp, Inc. | 379 | 11,290 | ||||||
| Umpqua Holdings Corp. | 582 | 11,139 | ||||||
| CubeSmart | 685 | 10,919 | ||||||
| Cathay General Bancorp | 406 | 10,852 | ||||||
| DCT Industrial Trust, Inc. | 1,496 | 10,667 | ||||||
| First Financial Bankshares, Inc. | 158 | 10,479 | ||||||
| Healthcare Realty Trust, Inc. | 488 | 10,399 | ||||||
| Invesco Mortgage Capital, Inc. | 700 | 10,277 | ||||||
| Sovran Self Storage, Inc. | 157 | 10,232 | ||||||
| Medical Properties Trust, Inc. | 833 | 10,179 | ||||||
| American Realty Capital Properties, Inc. | 789 | 10,146 | ||||||
| Pebblebrook Hotel Trust | 321 | 9,874 | ||||||
| Apollo Investment Corp. | 1,163 | 9,862 | ||||||
| FNB Corp. | 774 | 9,768 | ||||||
| Ryman Hospitality Properties, Inc. | 233 | 9,735 | ||||||
| First Industrial Realty Trust, Inc. | 553 | 9,650 | ||||||
| PrivateBancorp, Inc. | 333 | 9,634 | ||||||
| Evercore Partners, Inc. — Class A | 160 | 9,565 | ||||||
| IBERIABANK Corp. | 152 | 9,553 | ||||||
| Janus Capital Group, Inc. | 770 | 9,525 | ||||||
| Lexington Realty Trust | 924 | 9,434 | ||||||
| Chambers Street Properties | 1,226 | 9,379 | ||||||
| Western Alliance Bancorporation* | 393 | 9,377 | ||||||
| Platinum Underwriters Holdings Ltd. | 153 | 9,376 | ||||||
| Capitol Federal Financial, Inc. | 773 | 9,361 | ||||||
| First Cash Financial Services, Inc.* | 150 | 9,276 | ||||||
| Trustmark Corp. | 345 | 9,260 | ||||||
| WisdomTree Investments, Inc.* | 518 | 9,174 | ||||||
| Alexander & Baldwin, Inc. | 218 | 9,097 | ||||||
| EastGroup Properties, Inc. | 157 | 9,095 | ||||||
| MB Financial, Inc. | 283 | 9,081 | ||||||
| American Equity Investment | ||||||||
| Life Holding Co. | 339 | 8,943 | ||||||
| Bank of the Ozarks, Inc. | 158 | 8,941 | ||||||
| Cousins Properties, Inc. | 868 | 8,940 | ||||||
| Wintrust Financial Corp. | 192 | 8,855 | ||||||
| Home BancShares, Inc. | 237 | 8,852 | ||||||
| Strategic Hotels & Resorts, Inc.* | 933 | 8,817 | ||||||
| New Residential Investment Corp. | 1,305 | 8,718 | ||||||
| Potlatch Corp. | 207 | 8,640 | ||||||
| Greenhill & Company, Inc. | 149 | 8,633 | ||||||
| PacWest Bancorp | 200 | 8,444 | ||||||
| PennyMac Mortgage Investment Trust | 365 | 8,380 | ||||||
| Home Loan Servicing Solutions Ltd. | 363 | 8,338 | ||||||
| Redwood Trust, Inc. | 429 | 8,310 | ||||||
| First Financial Holdings, Inc. | 123 | 8,181 | ||||||
| Symetra Financial Corp. | 429 | 8,134 | ||||||
| CVB Financial Corp. | 474 | 8,091 | ||||||
| Community Bank System, Inc. | 203 | 8,055 | ||||||
| Old National Bancorp | 524 | 8,054 | ||||||
| Westamerica Bancorporation | 142 | 8,017 | ||||||
| United Bankshares, Inc.1 | 254 | 7,988 | ||||||
| DuPont Fabros Technology, Inc. | 321 | 7,932 | ||||||
| Washington Real Estate Investment Trust | 337 | 7,872 | ||||||
| Sun Communities, Inc. | 183 | 7,803 | ||||||
| ARMOUR Residential REIT, Inc. | 1,925 | 7,719 | ||||||
| Selective Insurance Group, Inc. | 285 | 7,712 | ||||||
| Hilltop Holdings, Inc.* | 327 | 7,564 | ||||||
| EverBank Financial Corp. | 411 | 7,538 | ||||||
| Columbia Banking System, Inc. | 265 | 7,290 | ||||||
| Northwest Bancshares, Inc. | 490 | 7,242 | ||||||
| Enstar Group Ltd.* | 52 | 7,223 | ||||||
| PHH Corp.* | 294 | 7,159 | ||||||
| International Bancshares Corp. | 271 | 7,152 | ||||||
| National Health Investors, Inc. | 127 | 7,125 | ||||||
| Equity One, Inc. | 315 | 7,068 | ||||||
| Government Properties Income Trust | 282 | 7,008 | ||||||
| Walter Investment Management Corp.* | 198 | 7,001 | ||||||
| Glimcher Realty Trust | 747 | 6,992 | ||||||
| Acadia Realty Trust | 281 | 6,977 | ||||||
| PS Business Parks, Inc. | 91 | 6,954 | ||||||
| Investors Bancorp, Inc. | 268 | 6,855 | ||||||
| National Penn Bancshares, Inc. | 603 | 6,832 | ||||||
| Montpelier Re Holdings Ltd. | 232 | 6,751 | ||||||
| Main Street Capital Corp. | 205 | 6,701 | ||||||
| First Midwest Bancorp, Inc. | 382 | 6,696 | ||||||
| CYS Investments, Inc. | 901 | 6,676 | ||||||
| Colony Financial, Inc. | 329 | 6,675 | ||||||
| BBCN Bancorp, Inc. | 401 | 6,653 | ||||||
| Altisource Residential Corp. | 220 | 6,624 | ||||||
| Pennsylvania Real Estate Investment Trust | 345 | 6,548 | ||||||
| Kennedy-Wilson Holdings, Inc. | 293 | 6,519 | ||||||
| Encore Capital Group, Inc.* | 129 | 6,484 | ||||||
| Argo Group International Holdings Ltd. | 139 | 6,462 | ||||||
| 104 | THE RYDEX FUNDS ANNUAL REPORT | SEE NOTES TO FINANCIAL STATEMENTS. |
| SCHEDULE OF INVESTMENTS (continued) | December 31, 2013 |
| RUSSELL 2000® 1.5x STRATEGY FUND |
| Shares | Value | |||||||
| Fifth Street Finance Corp. | 698 | $ | 6,457 | |||||
| Horace Mann Educators Corp. | 204 | 6,434 | ||||||
| LTC Properties, Inc. | 180 | 6,370 | ||||||
| Astoria Financial Corp. | 459 | 6,348 | ||||||
| Chesapeake Lodging Trust | 251 | 6,348 | ||||||
| iStar Financial, Inc.* | 443 | 6,322 | ||||||
| Alexander’s, Inc. | 19 | 6,270 | ||||||
| Virtus Investment Partners, Inc.* | 31 | 6,202 | ||||||
| Sterling Financial Corp. | 177 | 6,032 | ||||||
| Provident Financial Services, Inc. | 311 | 6,009 | ||||||
| Capstead Mortgage Corp. | 492 | 5,943 | ||||||
| Hersha Hospitality Trust | 1,049 | 5,843 | ||||||
| Pinnacle Financial Partners, Inc. | 179 | 5,823 | ||||||
| National Bank Holdings Corp. — Class A | 272 | 5,821 | ||||||
| NBT Bancorp, Inc. | 224 | 5,802 | ||||||
| Sterling Bancorp | 431 | 5,762 | ||||||
| ViewPoint Financial Group, Inc. | 209 | 5,737 | ||||||
| Ambac Financial Group, Inc.* | 230 | 5,649 | ||||||
| Franklin Street Properties Corp. | 466 | 5,569 | ||||||
| BofI Holding, Inc.* | 71 | 5,569 | ||||||
| Parkway Properties, Inc. | 288 | 5,556 | ||||||
| American Assets Trust, Inc. | 176 | 5,532 | ||||||
| Retail Opportunity Investments Corp. | 371 | 5,461 | ||||||
| Cash America International, Inc. | 142 | 5,439 | ||||||
| Solar Capital Ltd. | 236 | 5,322 | ||||||
| Hercules Technology Growth Capital, Inc. | 323 | 5,297 | ||||||
| Boston Private Financial Holdings, Inc. | 418 | 5,275 | ||||||
| American Capital Mortgage | ||||||||
| Investment Corp. | 300 | 5,238 | ||||||
| First Financial Bancorp | 300 | 5,229 | ||||||
| FelCor Lodging Trust, Inc.* | 639 | 5,214 | ||||||
| Education Realty Trust, Inc. | 590 | 5,204 | ||||||
| Employers Holdings, Inc. | 163 | 5,159 | ||||||
| Nelnet, Inc. — Class A | 122 | 5,141 | ||||||
| Amtrust Financial Services, Inc. | 157 | 5,132 | ||||||
| Greenlight Capital Re Ltd. — Class A* | 149 | 5,023 | ||||||
| Sabra Health Care REIT, Inc. | 192 | 5,019 | ||||||
| Chemical Financial Corp. | 157 | 4,972 | ||||||
| Renasant Corp. | 157 | 4,939 | ||||||
| Ramco-Gershenson Properties Trust | 312 | 4,911 | ||||||
| Hudson Pacific Properties, Inc. | 222 | 4,855 | ||||||
| Park National Corp. | 56 | 4,764 | ||||||
| Associated Estates Realty Corp. | 294 | 4,719 | ||||||
| Independent Bank Corp. | 119 | 4,664 | ||||||
| Inland Real Estate Corp. | 436 | 4,587 | ||||||
| Banner Corp. | 102 | 4,572 | ||||||
| eHealth, Inc.* | 98 | 4,556 | ||||||
| HFF, Inc. — Class A* | 167 | 4,484 | ||||||
| Investors Real Estate Trust | 522 | 4,479 | ||||||
| Infinity Property & Casualty Corp. | 62 | 4,449 | ||||||
| First Commonwealth Financial Corp. | 504 | 4,445 | ||||||
| STAG Industrial, Inc. | 213 | 4,343 | ||||||
| KCG Holdings, Inc. — Class A* | 361 | 4,318 | ||||||
| Credit Acceptance Corp.* | 33 | 4,290 | ||||||
| Banco Latinoamericano de Comercio | ||||||||
| Exterior S.A. — Class E | 153 | 4,287 | ||||||
| World Acceptance Corp.* | 48 | 4,201 | ||||||
| OFG Bancorp | 242 | 4,196 | ||||||
| First Merchants Corp. | 184 | 4,188 | ||||||
| WesBanco, Inc. | 129 | 4,128 | ||||||
| PennantPark Investment Corp. | 344 | 3,990 | ||||||
| BGC Partners, Inc. — Class A | 658 | 3,987 | ||||||
| Tompkins Financial Corp. | 77 | 3,957 | ||||||
| Triangle Capital Corp. | 143 | 3,954 | ||||||
| Investment Technology Group, Inc.* | 191 | 3,927 | ||||||
| Northfield Bancorp, Inc. | 297 | 3,920 | ||||||
| Forestar Group, Inc.* | 184 | 3,914 | ||||||
| United Community Banks, Inc.* | 220 | 3,905 | ||||||
| AMERISAFE, Inc. | 92 | 3,886 | ||||||
| Resource Capital Corp. | 652 | 3,866 | ||||||
| Navigators Group, Inc.* | 61 | 3,853 | ||||||
| S&T Bancorp, Inc. | 152 | 3,847 | ||||||
| Cohen & Steers, Inc. | 96 | 3,846 | ||||||
| Community Trust Bancorp, Inc. | 84 | 3,793 | ||||||
| ICG Group, Inc.* | 202 | 3,763 | ||||||
| Summit Hotel Properties, Inc. | 411 | 3,699 | ||||||
| Oritani Financial Corp. | 230 | 3,692 | ||||||
| Sandy Spring Bancorp, Inc. | 130 | 3,665 | ||||||
| CoreSite Realty Corp. | 113 | 3,637 | ||||||
| BlackRock Kelso Capital Corp. | 389 | 3,629 | ||||||
| Golub Capital BDC, Inc. | 188 | 3,593 | ||||||
| Eagle Bancorp, Inc.* | 117 | 3,584 | ||||||
| Berkshire Hills Bancorp, Inc. | 131 | 3,572 | ||||||
| First Potomac Realty Trust | 307 | 3,570 | ||||||
| Wilshire Bancorp, Inc. | 324 | 3,541 | ||||||
| TrustCo Bank Corp. NY | 491 | 3,525 | ||||||
| Brookline Bancorp, Inc. | 368 | 3,522 | ||||||
| City Holding Co. | 76 | 3,521 | ||||||
| Safety Insurance Group, Inc. | 62 | 3,491 | ||||||
| Stewart Information Services Corp. | 108 | 3,485 | ||||||
| Hanmi Financial Corp. | 159 | 3,481 | ||||||
| Green Dot Corp. — Class A* | 136 | 3,420 | ||||||
| FXCM, Inc. — Class A | 189 | 3,372 | ||||||
| Flushing Financial Corp. | 162 | 3,353 | ||||||
| Lakeland Financial Corp. | 85 | 3,315 | ||||||
| Piper Jaffray Cos.* | 82 | 3,243 | ||||||
| New Mountain Finance Corp. | 213 | 3,204 | ||||||
| Apollo Commercial Real Estate | ||||||||
| Finance, Inc. | 197 | 3,201 | ||||||
| Simmons First National Corp. — Class A | 86 | 3,195 | ||||||
| RAIT Financial Trust | 356 | 3,193 | ||||||
| Anworth Mortgage Asset Corp. | 747 | 3,145 | ||||||
| Kite Realty Group Trust | 473 | 3,108 | ||||||
| Campus Crest Communities, Inc. | 330 | 3,105 | ||||||
| Select Income REIT | 115 | 3,075 | ||||||
| EZCORP, Inc. — Class A* | 262 | 3,063 | ||||||
| Bancorp, Inc.* | 170 | 3,045 | ||||||
| Capital Bank Financial Corp. — Class A* | 130 | 2,958 | ||||||
| State Bank Financial Corp. | 162 | 2,947 | ||||||
| United Fire Group, Inc. | 102 | 2,923 | ||||||
| PICO Holdings, Inc.* | 126 | 2,912 | ||||||
| Washington Trust Bancorp, Inc. | 78 | 2,903 | ||||||
| StellarOne Corp. | 120 | 2,888 | ||||||
| GAMCO Investors, Inc. — Class A | 33 | 2,870 | ||||||
| SEE NOTES TO FINANCIAL STATEMENTS. | THE RYDEX FUNDS ANNUAL REPORT | 105 |
| SCHEDULE OF INVESTMENTS (continued) | December 31, 2013 |
| RUSSELL 2000® 1.5x STRATEGY FUND |
| Shares | Value | |||||||
| RPX Corp.* | 169 | $ | 2,856 | |||||
| Maiden Holdings Ltd. | 260 | 2,842 | ||||||
| HCI Group, Inc. | 53 | 2,836 | ||||||
| Cardinal Financial Corp. | 157 | 2,826 | ||||||
| Medley Capital Corp. | 204 | 2,825 | ||||||
| THL Credit, Inc. | 170 | 2,803 | ||||||
| WSFS Financial Corp. | 36 | 2,791 | ||||||
| TICC Capital Corp. | 269 | 2,781 | ||||||
| Universal Health Realty Income Trust | 69 | 2,764 | ||||||
| Chatham Lodging Trust | 135 | 2,761 | ||||||
| Excel Trust, Inc. | 242 | 2,756 | ||||||
| Dime Community Bancshares, Inc. | 161 | 2,724 | ||||||
| TCP Capital Corp. | 160 | 2,685 | ||||||
| Union First Market Bankshares Corp. | 108 | 2,679 | ||||||
| Southside Bancshares, Inc. | 97 | 2,652 | ||||||
| Ashford Hospitality Trust, Inc. | 320 | 2,650 | ||||||
| Tejon Ranch Co.* | 72 | 2,647 | ||||||
| 1st Source Corp. | 81 | 2,587 | ||||||
| SY Bancorp, Inc. | 81 | 2,586 | ||||||
| Capital Southwest Corp. | 74 | 2,580 | ||||||
| Ameris Bancorp* | 120 | 2,533 | ||||||
| Getty Realty Corp. | 136 | 2,498 | ||||||
| First Interstate Bancsystem, Inc. — | ||||||||
| Class A | 88 | 2,497 | ||||||
| Rouse Properties, Inc. | 112 | 2,485 | ||||||
| Central Pacific Financial Corp. | 123 | 2,470 | ||||||
| First Financial Corp. | 66 | 2,413 | ||||||
| Trico Bancshares | 85 | 2,411 | ||||||
| Apollo Residential Mortgage, Inc. | 163 | 2,409 | ||||||
| Third Point Reinsurance Ltd.* | 130 | 2,409 | ||||||
| Urstadt Biddle Properties, Inc. — Class A | 130 | 2,399 | ||||||
| DFC Global Corp.* | 205 | 2,347 | ||||||
| First BanCorp* | 379 | 2,346 | ||||||
| NewStar Financial, Inc.* | 132 | 2,346 | ||||||
| Cedar Realty Trust, Inc. | 372 | 2,329 | ||||||
| Virginia Commerce Bancorp, Inc.* | 137 | 2,328 | ||||||
| Terreno Realty Corp. | 130 | 2,301 | ||||||
| New York Mortgage Trust, Inc. | 329 | 2,300 | ||||||
| BancFirst Corp. | 41 | 2,298 | ||||||
| AG Mortgage Investment Trust, Inc. | 146 | 2,283 | ||||||
| Heartland Financial USA, Inc. | 79 | 2,274 | ||||||
| Lakeland Bancorp, Inc. | 183 | 2,264 | ||||||
| Taylor Capital Group, Inc.* | 85 | 2,259 | ||||||
| Dynex Capital, Inc. | 280 | 2,240 | ||||||
| CyrusOne, Inc. | 100 | 2,233 | ||||||
| German American Bancorp, Inc. | 78 | 2,223 | ||||||
| Bryn Mawr Bank Corp. | 73 | 2,203 | ||||||
| CoBiz Financial, Inc. | 183 | 2,189 | ||||||
| First Busey Corp. | 374 | 2,169 | ||||||
| Arlington Asset Investment Corp. — | ||||||||
| Class A | 81 | 2,138 | ||||||
| Safeguard Scientifics, Inc.* | 105 | 2,109 | ||||||
| Saul Centers, Inc. | 44 | 2,100 | ||||||
| Phoenix Companies, Inc.* | 34 | 2,088 | ||||||
| Flagstar Bancorp, Inc.* | 105 | 2,060 | ||||||
| Customers Bancorp, Inc.* | 100 | 2,046 | ||||||
| TowneBank | 132 | 2,031 | ||||||
| Monmouth Real Estate Investment Corp. — | ||||||||
| Class A | 222 | 2,018 | ||||||
| Rockville Financial, Inc. | 142 | 2,018 | ||||||
| FBL Financial Group, Inc. — Class A | 45 | 2,016 | ||||||
| Citizens, Inc.* | 230 | 2,013 | ||||||
| National Western Life Insurance Co. — | ||||||||
| Class A | 9 | 2,012 | ||||||
| MainSource Financial Group, Inc. | 110 | 1,983 | ||||||
| Westwood Holdings Group, Inc. | 32 | 1,981 | ||||||
| Agree Realty Corp. | 68 | 1,973 | ||||||
| Cowen Group, Inc. — Class A* | 504 | 1,971 | ||||||
| United Financial Bancorp, Inc. | 104 | 1,965 | ||||||
| Universal Insurance Holdings, Inc. | 132 | 1,911 | ||||||
| OneBeacon Insurance Group Ltd. — | ||||||||
| Class A | 120 | 1,898 | ||||||
| First of Long Island Corp. | 44 | 1,886 | ||||||
| Federal Agricultural Mortgage Corp. — | ||||||||
| Class C | 55 | 1,884 | ||||||
| Camden National Corp. | 44 | 1,858 | ||||||
| Western Asset Mortgage Capital Corp. | 124 | 1,845 | ||||||
| Enterprise Financial Services Corp. | 90 | 1,838 | ||||||
| Financial Institutions, Inc. | 73 | 1,804 | ||||||
| Meadowbrook Insurance Group, Inc. | 259 | 1,803 | ||||||
| Univest Corporation of Pennsylvania | 87 | 1,799 | ||||||
| Hudson Valley Holding Corp. | 88 | 1,791 | ||||||
| First Bancorp | 107 | 1,778 | ||||||
| Diamond Hill Investment Group, Inc. | 15 | 1,775 | ||||||
| Beneficial Mutual Bancorp, Inc.* | 162 | 1,769 | ||||||
| Winthrop Realty Trust | 160 | 1,768 | ||||||
| State Auto Financial Corp. | 82 | 1,742 | ||||||
| Gramercy Property Trust, Inc.* | 302 | 1,737 | ||||||
| AmREIT, Inc. — Class B | 100 | 1,680 | ||||||
| Park Sterling Corp. | 234 | 1,671 | ||||||
| Ladenburg Thalmann Financial | ||||||||
| Services, Inc.* | 533 | 1,668 | ||||||
| HomeTrust Bancshares, Inc.* | 104 | 1,663 | ||||||
| Southwest Bancorp, Inc.* | 104 | 1,656 | ||||||
| Bank Mutual Corp. | 234 | 1,640 | ||||||
| Bridge Bancorp, Inc. | 63 | 1,638 | ||||||
| Arrow Financial Corp. | 61 | 1,620 | ||||||
| MCG Capital Corp. | 368 | 1,619 | ||||||
| Metro Bancorp, Inc.* | 75 | 1,616 | ||||||
| Meta Financial Group, Inc. | 40 | 1,613 | ||||||
| BNC Bancorp | 94 | 1,611 | ||||||
| Centerstate Banks, Inc. | 156 | 1,583 | ||||||
| Great Southern Bancorp, Inc. | 51 | 1,551 | ||||||
| MVC Capital, Inc. | 114 | 1,539 | ||||||
| Aviv REIT, Inc. | 64 | 1,517 | ||||||
| National Bankshares, Inc. | 41 | 1,512 | ||||||
| Fidus Investment Corp. | 69 | 1,500 | ||||||
| Ares Commercial Real Estate Corp. | 113 | 1,480 | ||||||
| Whitestone REIT — Class B | 110 | 1,471 | ||||||
| First Community Bancshares, Inc. | 88 | 1,470 | ||||||
| First Defiance Financial Corp. | 56 | 1,454 | ||||||
| First Connecticut Bancorp, Inc. | 90 | 1,451 | ||||||
| Washington Banking Co. | 81 | 1,436 | ||||||
| Walker & Dunlop, Inc.* | 88 | 1,423 | ||||||
| 106 | THE RYDEX FUNDS ANNUAL REPORT | SEE NOTES TO FINANCIAL STATEMENTS. |
| SCHEDULE OF INVESTMENTS (continued) | December 31, 2013 |
| RUSSELL 2000® 1.5x STRATEGY FUND |
| Shares | Value | |||||||
| HomeStreet, Inc. | 71 | $ | 1,420 | |||||
| GFI Group, Inc. | 363 | 1,419 | ||||||
| Pacific Premier Bancorp, Inc.* | 90 | 1,417 | ||||||
| Oppenheimer Holdings, Inc. — Class A | 57 | 1,412 | ||||||
| Citizens & Northern Corp. | 68 | 1,403 | ||||||
| Pacific Continental Corp. | 88 | 1,403 | ||||||
| CNB Financial Corp. | 73 | 1,387 | ||||||
| International. FCStone, Inc.* | 74 | 1,372 | ||||||
| Gladstone Commercial Corp. | 76 | 1,366 | ||||||
| Suffolk Bancorp* | 65 | 1,352 | ||||||
| Medallion Financial Corp. | 94 | 1,349 | ||||||
| OmniAmerican Bancorp, Inc.* | 63 | 1,347 | ||||||
| Baldwin & Lyons, Inc. — Class B | 49 | 1,339 | ||||||
| Republic Bancorp, Inc. — Class A | 54 | 1,325 | ||||||
| Horizon Bancorp | 52 | 1,317 | ||||||
| Heritage Financial Corp. | 76 | 1,300 | ||||||
| PennyMac Financial Services, Inc. — | ||||||||
| Class A* | 74 | 1,299 | ||||||
| Fidelity Southern Corp. | 77 | 1,279 | ||||||
| Yadkin Financial Corp.* | 75 | 1,278 | ||||||
| Preferred Bank/Los Angeles CA* | 63 | 1,263 | ||||||
| Peoples Bancorp, Inc. | 56 | 1,261 | ||||||
| Charter Financial Corp. | 117 | 1,260 | ||||||
| Bank of Kentucky Financial Corp. | 34 | 1,255 | ||||||
| American Residential Properties, Inc.* | 73 | 1,253 | ||||||
| GSV Capital Corp.* | 103 | 1,245 | ||||||
| Calamos Asset Management, Inc. — | ||||||||
| Class A | 105 | 1,243 | ||||||
| Manning & Napier, Inc. — Class A | 70 | 1,236 | ||||||
| West Bancorporation, Inc. | 78 | 1,234 | ||||||
| OceanFirst Financial Corp. | 72 | 1,233 | ||||||
| Penns Woods Bancorp, Inc. | 24 | 1,224 | ||||||
| MetroCorp Bancshares, Inc. | 81 | 1,221 | ||||||
| Crawford & Co. — Class B | 132 | �� | 1,220 | |||||
| KCAP Financial, Inc. | 150 | 1,211 | ||||||
| Territorial Bancorp, Inc. | 52 | 1,206 | ||||||
| Global Indemnity plc — Class A* | 47 | 1,189 | ||||||
| Rexford Industrial Realty, Inc. | 90 | 1,188 | ||||||
| Silver Bay Realty Trust Corp. | 74 | 1,183 | ||||||
| Bank of Marin Bancorp | 27 | 1,172 | ||||||
| One Liberty Properties, Inc. | 58 | 1,168 | ||||||
| Ashford Hospitality Prime, Inc. | 64 | 1,165 | ||||||
| 1st United Bancorp, Inc. | 153 | 1,164 | ||||||
| Home Federal Bancorp, Inc. | 78 | 1,162 | ||||||
| FBR & Co.* | 44 | 1,161 | ||||||
| Merchants Bancshares, Inc. | 34 | 1,139 | ||||||
| Banc of California, Inc. | 84 | 1,126 | ||||||
| Hannon Armstrong Sustainable | ||||||||
| Infrastructure Capital, Inc. | 80 | 1,117 | ||||||
| Tree.com, Inc.* | 34 | 1,117 | ||||||
| PennantPark Floating Rate Capital Ltd. | 80 | 1,098 | ||||||
| Guaranty Bancorp | 78 | 1,096 | ||||||
| Center Bancorp, Inc. | 58 | 1,088 | ||||||
| MidWestOne Financial Group, Inc. | 40 | 1,088 | ||||||
| Franklin Financial Corp.* | 55 | 1,088 | ||||||
| Marlin Business Services Corp. | 43 | 1,084 | ||||||
| Gladstone Investment Corp. | 134 | 1,080 | ||||||
| Mercantile Bank Corp. | 50 | 1,079 | ||||||
| Sierra Bancorp | 67 | 1,078 | ||||||
| Ames National Corp. | 48 | 1,075 | ||||||
| Fox Chase Bancorp, Inc. | 61 | 1,060 | ||||||
| Firsthand Technology Value Fund, Inc. | 45 | 1,043 | ||||||
| EMC Insurance Group, Inc. | 34 | 1,041 | ||||||
| Bridge Capital Holdings* | 50 | 1,027 | ||||||
| Solar Senior Capital Ltd. | 56 | 1,020 | ||||||
| ESB Financial Corp. | 71 | 1,008 | ||||||
| Gladstone Capital Corp. | 105 | 1,008 | ||||||
| Bar Harbor Bankshares | 25 | 1,000 | ||||||
| Tower Group International Ltd. | 294 | 994 | ||||||
| Meridian Interstate Bancorp, Inc.* | 44 | 994 | ||||||
| Independent Bank Group, Inc. | 20 | 993 | ||||||
| JAVELIN Mortgage Investment Corp. | 71 | 989 | ||||||
| Consolidated-Tomoka Land Co. | 27 | 980 | ||||||
| NewBridge Bancorp* | 130 | 975 | ||||||
| Investors Title Co. | 12 | 972 | ||||||
| BankFinancial Corp. | 106 | 971 | ||||||
| First NBC Bank Holding Co.* | 30 | 969 | ||||||
| Armada Hoffler Properties, Inc. | 104 | 965 | ||||||
| AV Homes, Inc.* | 53 | 963 | ||||||
| Stellus Capital Investment Corp. | 64 | 957 | ||||||
| American National Bankshares, Inc. | 36 | 945 | ||||||
| SWS Group, Inc.* | 154 | 936 | ||||||
| Seacoast Banking Corporation of Florida* | 75 | 920 | ||||||
| Regional Management Corp.* | 27 | 916 | ||||||
| Eastern Insurance Holdings, Inc. | 37 | 906 | ||||||
| First Bancorp, Inc. | 52 | 906 | ||||||
| United Community Financial Corp.* | 253 | 903 | ||||||
| Kearny Financial Corp.* | 77 | 896 | ||||||
| Peapack Gladstone Financial Corp. | 46 | 879 | ||||||
| CU Bancorp* | 50 | 874 | ||||||
| Farmers Capital Bank Corp.* | 40 | 870 | ||||||
| C&F Financial Corp. | 19 | 868 | ||||||
| Hingham Institution for Savings | 11 | 863 | ||||||
| Heritage Commerce Corp. | 104 | 857 | ||||||
| Consumer Portfolio Services, Inc.* | 90 | 845 | ||||||
| NASB Financial, Inc. | 27 | 815 | ||||||
| Northrim BanCorp, Inc. | 31 | 813 | ||||||
| Kansas City Life Insurance Co. | 17 | 812 | ||||||
| Provident Financial Holdings, Inc. | 54 | 810 | ||||||
| Heritage Oaks Bancorp* | 108 | 810 | ||||||
| National Interstate Corp. | 35 | 805 | ||||||
| Nicholas Financial, Inc. | 51 | 803 | ||||||
| First Financial Northwest, Inc. | 76 | 788 | ||||||
| NGP Capital Resources Co. | 105 | 784 | ||||||
| Physicians Realty Trust | 60 | 764 | ||||||
| Capital City Bank Group, Inc.* | 63 | 742 | ||||||
| Westfield Financial, Inc. | 99 | 739 | ||||||
| First Security Group, Inc.* | 320 | 736 | ||||||
| Intervest Bancshares Corp. — Class A* | 98 | 736 | ||||||
| Sun Bancorp, Inc.* | 207 | 729 | ||||||
| Independence Holding Co. | 54 | 728 | ||||||
| CommunityOne Bancorp* | 57 | 727 | ||||||
| UMH Properties, Inc. | 77 | 725 | ||||||
| Enterprise Bancorp, Inc. | 34 | 720 | ||||||
| SEE NOTES TO FINANCIAL STATEMENTS. | THE RYDEX FUNDS ANNUAL REPORT | 107 |
| SCHEDULE OF INVESTMENTS (continued) | December 31, 2013 |
| RUSSELL 2000® 1.5x STRATEGY FUND |
| Shares | Value | |||||||
| Home Bancorp, Inc.* | 37 | $ | 697 | |||||
| Chemung Financial Corp. | 20 | 683 | ||||||
| MidSouth Bancorp, Inc. | 38 | 679 | ||||||
| Donegal Group, Inc. — Class A | 42 | 668 | ||||||
| Hallmark Financial Services, Inc.* | 75 | 666 | ||||||
| Clifton Savings Bancorp, Inc. | 52 | 666 | ||||||
| Century Bancorp, Inc. — Class A | 20 | 665 | ||||||
| Pzena Investment Management, Inc. — | ||||||||
| Class A | 56 | 659 | ||||||
| Macatawa Bank Corp.* | 128 | 640 | ||||||
| BBX Capital Corp. — Class A* | 40 | 624 | ||||||
| Ellington Residential Mortgage REIT | 40 | 615 | ||||||
| JMP Group, Inc. | 83 | 614 | ||||||
| Horizon Technology Finance Corp. | 43 | 611 | ||||||
| Access National Corp. | 39 | 583 | ||||||
| Imperial Holdings, Inc.* | 88 | 576 | ||||||
| Resource America, Inc. — Class A | 59 | 552 | ||||||
| Middleburg Financial Corp. | 30 | 541 | ||||||
| Doral Financial Corp.* | 34 | 532 | ||||||
| ESSA Bancorp, Inc. | 46 | 532 | ||||||
| WhiteHorse Finance, Inc. | 34 | 514 | ||||||
| Silvercrest Asset Management | ||||||||
| Group, Inc. — Class A | 30 | 512 | ||||||
| Waterstone Financial, Inc.* | 45 | 500 | ||||||
| Garrison Capital, Inc. | 35 | 486 | ||||||
| LCNB Corp. | 27 | 482 | ||||||
| ZAIS Financial Corp. | 30 | 481 | ||||||
| Gain Capital Holdings, Inc. | 57 | 428 | ||||||
| VantageSouth Bancshares, Inc.* | 70 | 369 | ||||||
| Tristate Capital Holdings, Inc.* | 30 | 356 | ||||||
| First Marblehead Corp.* | 47 | 347 | ||||||
| Fortegra Financial Corp.* | 41 | 339 | ||||||
| CIFC Corp. | 41 | 319 | ||||||
| Hampton Roads Bankshares, Inc.* | 177 | 310 | ||||||
| California First National Bancorp | 20 | 302 | ||||||
| Palmetto Bancshares, Inc.* | 20 | 259 | ||||||
| Health Insurance Innovations, Inc. — | ||||||||
| Class A* | 20 | 202 | ||||||
| ConnectOne Bancorp, Inc.* | 5 | 198 | ||||||
| RCS Capital Corp. — Class A | 10 | 184 | ||||||
| Cascade Bancorp* | 34 | 178 | ||||||
| First Federal Bancshares of | ||||||||
| Arkansas, Inc.* | 20 | 174 | ||||||
| Total Financials | 1,945,973 | |||||||
| INFORMATION TECHNOLOGY - 12.2% | ||||||||
| CoStar Group, Inc.* | 142 | 26,210 | ||||||
| PTC, Inc.* | 625 | 22,118 | ||||||
| Ultimate Software Group, Inc.* | 144 | 22,063 | ||||||
| Aspen Technology, Inc.* | 489 | 20,439 | ||||||
| WEX, Inc.* | 199 | 19,706 | ||||||
| FEI Co. | 218 | 19,481 | ||||||
| CommVault Systems, Inc.* | 244 | 18,272 | ||||||
| SunEdison, Inc.* | 1,368 | 17,853 | ||||||
| Cognex Corp. | 451 | 17,219 | ||||||
| Tyler Technologies, Inc.* | 158 | 16,137 | ||||||
| Belden, Inc. | 222 | 15,640 | ||||||
| MAXIMUS, Inc. | 354 | 15,571 | ||||||
| ARRIS Group, Inc.* | 602 | 14,667 | ||||||
| Acxiom Corp.* | 382 | 14,126 | ||||||
| ACI Worldwide, Inc.* | 206 | 13,390 | ||||||
| SS&C Technologies Holdings, Inc.* | 302 | 13,367 | ||||||
| ViaSat, Inc.* | 212 | 13,281 | ||||||
| Ciena Corp.* | 521 | 12,468 | ||||||
| Euronet Worldwide, Inc.* | 260 | 12,441 | ||||||
| Guidewire Software, Inc.* | 251 | 12,317 | ||||||
| Anixter International, Inc. | 136 | 12,218 | ||||||
| Manhattan Associates, Inc.* | 102 | 11,983 | ||||||
| Qlik Technologies, Inc.* | 448 | 11,930 | ||||||
| Mentor Graphics Corp. | 494 | 11,891 | ||||||
| j2 Global, Inc. | 237 | 11,851 | ||||||
| Microsemi Corp.* | 475 | 11,851 | ||||||
| Verint Systems, Inc.* | 275 | 11,809 | ||||||
| Fair Isaac Corp. | 187 | 11,751 | ||||||
| Finisar Corp.* | 484 | 11,577 | ||||||
| Convergys Corp. | 541 | 11,388 | ||||||
| Yelp, Inc. — Class A* | 162 | 11,169 | ||||||
| Cornerstone OnDemand, Inc.* | 206 | 10,988 | ||||||
| Dealertrack Technologies, Inc.* | 228 | 10,962 | ||||||
| Littelfuse, Inc. | 115 | 10,686 | ||||||
| Plantronics, Inc. | 227 | 10,544 | ||||||
| Aruba Networks, Inc.* | 589 | 10,543 | ||||||
| Cardtronics, Inc.* | 230 | 9,994 | ||||||
| Sapient Corp.* | 574 | 9,965 | ||||||
| Zillow, Inc. — Class A* | 121 | 9,889 | ||||||
| Hittite Microwave Corp.* | 158 | 9,753 | ||||||
| OpenTable, Inc.* | 121 | 9,604 | ||||||
| VistaPrint N.V.* | 168 | 9,551 | ||||||
| Heartland Payment Systems, Inc. | 189 | 9,420 | ||||||
| Coherent, Inc.* | 125 | 9,299 | ||||||
| Blackbaud, Inc. | 246 | 9,262 | ||||||
| ValueClick, Inc.* | 396 | 9,255 | ||||||
| Cavium, Inc.* | 268 | 9,249 | ||||||
| International Rectifier Corp.* | 353 | 9,203 | ||||||
| Electronics for Imaging, Inc.* | 237 | 9,180 | ||||||
| SYNNEX Corp.* | 133 | 8,964 | ||||||
| Semtech Corp.* | 348 | 8,797 | ||||||
| Itron, Inc.* | 212 | 8,783 | ||||||
| Synaptics, Inc.* | 167 | 8,653 | ||||||
| TiVo, Inc.* | 651 | 8,541 | ||||||
| Infoblox, Inc.* | 257 | 8,486 | ||||||
| CACI International, Inc. — Class A* | 114 | 8,347 | ||||||
| ADTRAN, Inc. | 307 | 8,292 | ||||||
| Entegris, Inc.* | 714 | 8,282 | ||||||
| NIC, Inc. | 332 | 8,257 | ||||||
| Power Integrations, Inc. | 146 | 8,150 | ||||||
| MKS Instruments, Inc. | 268 | 8,024 | ||||||
| Cypress Semiconductor Corp. | 753 | 7,907 | ||||||
| Plexus Corp.* | 181 | 7,835 | ||||||
| Unisys Corp.* | 233 | 7,822 | ||||||
| Syntel, Inc. | 83 | 7,549 | ||||||
| RF Micro Devices, Inc.* | 1,454 | 7,503 | ||||||
| Intersil Corp. — Class A | 652 | 7,478 | ||||||
| Take-Two Interactive Software, Inc.* | 429 | 7,452 | ||||||
| Universal Display Corp.* | 215 | 7,387 | ||||||
| 108 | THE RYDEX FUNDS ANNUAL REPORT | SEE NOTES TO FINANCIAL STATEMENTS. |
| SCHEDULE OF INVESTMENTS (continued) | December 31, 2013 |
| RUSSELL 2000® 1.5x STRATEGY FUND |
| Shares | Value | |||||||
| iGATE Corp.* | 183 | $ | 7,349 | |||||
| Sanmina Corp.* | 424 | 7,081 | ||||||
| TriQuint Semiconductor, Inc.* | 839 | 6,997 | ||||||
| Progress Software Corp.* | 270 | 6,974 | ||||||
| Integrated Device Technology, Inc.* | 683 | 6,960 | ||||||
| Web.com Group, Inc.* | 218 | 6,930 | ||||||
| Bottomline Technologies de, Inc.* | 191 | 6,907 | ||||||
| PMC - Sierra, Inc.* | 1,048 | 6,739 | ||||||
| Veeco Instruments, Inc.* | 203 | 6,681 | ||||||
| Cirrus Logic, Inc.* | 327 | 6,681 | ||||||
| Methode Electronics, Inc. | 195 | 6,667 | ||||||
| NETGEAR, Inc.* | 200 | 6,588 | ||||||
| Monolithic Power Systems, Inc.* | 190 | 6,585 | ||||||
| WebMD Health Corp. — Class A* | 164 | 6,478 | ||||||
| Blucora, Inc.* | 222 | 6,474 | ||||||
| SunPower Corp. — Class A* | 217 | 6,469 | ||||||
| Benchmark Electronics, Inc.* | 280 | 6,462 | ||||||
| Monotype Imaging Holdings, Inc. | 198 | 6,308 | ||||||
| InterDigital, Inc. | 213 | 6,281 | ||||||
| ScanSource, Inc.* | 146 | 6,195 | ||||||
| InvenSense, Inc. — Class A* | 297 | 6,172 | ||||||
| Advent Software, Inc. | 168 | 5,878 | ||||||
| Interactive Intelligence Group, Inc.* | 87 | 5,860 | ||||||
| Infinera Corp.* | 597 | 5,839 | ||||||
| SPS Commerce, Inc.* | 88 | 5,746 | ||||||
| MicroStrategy, Inc. — Class A* | 46 | 5,715 | ||||||
| RealPage, Inc.* | 242 | 5,658 | ||||||
| OSI Systems, Inc.* | 106 | 5,630 | ||||||
| MTS Systems Corp. | 79 | 5,629 | ||||||
| Cray, Inc.* | 202 | 5,546 | ||||||
| NetScout Systems, Inc.* | 187 | 5,533 | ||||||
| Rogers Corp.* | 89 | 5,474 | ||||||
| Tessera Technologies, Inc. | 275 | 5,420 | ||||||
| comScore, Inc.* | 189 | 5,407 | ||||||
| GT Advanced Technologies, Inc.* | 620 | 5,406 | ||||||
| QLogic Corp.* | 456 | 5,394 | ||||||
| Rambus, Inc.* | 569 | 5,388 | ||||||
| Responsys, Inc.* | 195 | 5,345 | ||||||
| Demandware, Inc.* | 83 | 5,322 | ||||||
| FARO Technologies, Inc.* | 91 | 5,305 | ||||||
| Cabot Microelectronics Corp.* | 115 | 5,256 | ||||||
| CSG Systems International, Inc. | 174 | 5,116 | ||||||
| Insight Enterprises, Inc.* | 224 | 5,087 | ||||||
| Applied Micro Circuits Corp.* | 377 | 5,044 | ||||||
| Trulia, Inc.* | 142 | 5,008 | ||||||
| CalAmp Corp.* | 179 | 5,007 | ||||||
| OmniVision Technologies, Inc.* | 286 | 4,919 | ||||||
| ATMI, Inc.* | 162 | 4,894 | ||||||
| Envestnet, Inc.* | 121 | 4,876 | ||||||
| Measurement Specialties, Inc.* | 80 | 4,855 | ||||||
| Constant Contact, Inc.* | 155 | 4,816 | ||||||
| Imperva, Inc.* | 100 | 4,813 | ||||||
| ExlService Holdings, Inc.* | 171 | 4,723 | ||||||
| PROS Holdings, Inc.* | 118 | 4,708 | ||||||
| Synchronoss Technologies, Inc.* | 151 | 4,692 | ||||||
| Advanced Energy Industries, Inc.* | 204 | 4,663 | ||||||
| Pegasystems, Inc. | 93 | 4,574 | ||||||
| Sykes Enterprises, Inc.* | 207 | 4,515 | ||||||
| Comverse, Inc.* | 116 | 4,501 | ||||||
| Diodes, Inc.* | 187 | 4,406 | ||||||
| Monster Worldwide, Inc.* | 602 | 4,292 | ||||||
| VirnetX Holding Corp.* | 220 | 4,270 | ||||||
| Bankrate, Inc.* | 238 | 4,270 | ||||||
| Ultratech, Inc.* | 145 | 4,205 | ||||||
| LogMeIn, Inc.* | 125 | 4,194 | ||||||
| LivePerson, Inc.* | 279 | 4,135 | ||||||
| Perficient, Inc.* | 175 | 4,099 | ||||||
| EPAM Systems, Inc.* | 117 | 4,088 | ||||||
| Rofin-Sinar Technologies, Inc.* | 149 | 4,026 | ||||||
| Virtusa Corp.* | 103 | 3,923 | ||||||
| BroadSoft, Inc.* | 142 | 3,882 | ||||||
| Harmonic, Inc.* | 526 | 3,882 | ||||||
| Badger Meter, Inc. | 71 | 3,870 | ||||||
| Ixia* | 288 | 3,833 | ||||||
| Ellie Mae, Inc.* | 141 | 3,789 | ||||||
| Cass Information Systems, Inc. | 55 | 3,704 | ||||||
| EVERTEC, Inc. | 150 | 3,699 | ||||||
| Newport Corp.* | 203 | 3,668 | ||||||
| Proofpoint, Inc.* | 110 | 3,649 | ||||||
| ManTech International Corp. — Class A | 119 | 3,562 | ||||||
| Brooks Automation, Inc. | 337 | 3,535 | ||||||
| CTS Corp. | 176 | 3,504 | ||||||
| Sonus Networks, Inc.* | 1,103 | 3,474 | ||||||
| Fusion-io, Inc.* | 389 | 3,466 | ||||||
| FleetMatics Group plc* | 80 | 3,460 | ||||||
| SciQuest, Inc.* | 120 | 3,418 | ||||||
| Global Cash Access Holdings, Inc.* | 341 | 3,407 | ||||||
| Ambarella, Inc.* | 100 | 3,393 | ||||||
| PDF Solutions, Inc.* | 132 | 3,382 | ||||||
| Spansion, Inc. — Class A* | 242 | 3,361 | ||||||
| Extreme Networks, Inc.* | 480 | 3,360 | ||||||
| Digital River, Inc.* | 181 | 3,349 | ||||||
| Shutterstock, Inc.* | 40 | 3,345 | ||||||
| Emulex Corp.* | 467 | 3,344 | ||||||
| Checkpoint Systems, Inc.* | 212 | 3,343 | ||||||
| Ubiquiti Networks, Inc.* | 72 | 3,309 | ||||||
| Move, Inc.* | 206 | 3,294 | ||||||
| Lattice Semiconductor Corp.* | 596 | 3,284 | ||||||
| Angie’s List, Inc.* | 215 | 3,257 | ||||||
| Stamps.com, Inc.* | 75 | 3,158 | ||||||
| Ruckus Wireless, Inc.* | 220 | 3,124 | ||||||
| Park Electrochemical Corp. | 104 | 2,987 | ||||||
| Daktronics, Inc. | 190 | 2,979 | ||||||
| Fabrinet* | 144 | 2,961 | ||||||
| Liquidity Services, Inc.* | 129 | 2,923 | ||||||
| Tangoe, Inc.* | 158 | 2,846 | ||||||
| Photronics, Inc.* | 308 | 2,781 | ||||||
| ShoreTel, Inc.* | 299 | 2,775 | ||||||
| Comtech Telecommunications Corp. | 88 | 2,774 | ||||||
| Super Micro Computer, Inc.* | 161 | 2,763 | ||||||
| Forrester Research, Inc. | 72 | 2,755 | ||||||
| Accelrys, Inc.* | 288 | 2,748 | ||||||
| Callidus Software, Inc.* | 198 | 2,719 | ||||||
| ServiceSource International, Inc.* | 319 | 2,673 | ||||||
| SEE NOTES TO FINANCIAL STATEMENTS. | THE RYDEX FUNDS ANNUAL REPORT | 109 |
| SCHEDULE OF INVESTMENTS (continued) | December 31, 2013 |
| RUSSELL 2000® 1.5x STRATEGY FUND |
| Shares | Value | |||||||
| EarthLink Holdings Corp.* | 527 | $ | 2,672 | |||||
| Epiq Systems, Inc. | 157 | 2,545 | ||||||
| TeleTech Holdings, Inc.* | 106 | 2,538 | ||||||
| Silicon Image, Inc.* | 400 | 2,460 | ||||||
| Black Box Corp. | 82 | 2,444 | ||||||
| IntraLinks Holdings, Inc.* | 197 | 2,386 | ||||||
| Micrel, Inc. | 241 | 2,379 | ||||||
| TTM Technologies, Inc.* | 277 | 2,377 | ||||||
| Silicon Graphics International Corp.* | 177 | 2,374 | ||||||
| Nanometrics, Inc.* | 124 | 2,362 | ||||||
| Exar Corp.* | 196 | 2,311 | ||||||
| Jive Software, Inc.* | 205 | 2,306 | ||||||
| Ebix, Inc. | 156 | 2,296 | ||||||
| MoneyGram International, Inc.* | 109 | 2,265 | ||||||
| Amkor Technology, Inc.* | 364 | 2,231 | ||||||
| DTS, Inc.* | 91 | 2,182 | ||||||
| Entropic Communications, Inc.* | 462 | 2,176 | ||||||
| AVG Technologies N.V.* | 126 | 2,168 | ||||||
| Seachange International, Inc.* | 174 | 2,116 | ||||||
| Brightcove, Inc.* | 146 | 2,064 | ||||||
| Parkervision, Inc.* | 452 | 2,057 | ||||||
| Internap Network Services Corp.* | 273 | 2,053 | ||||||
| XO Group, Inc.* | 136 | 2,021 | ||||||
| Rudolph Technologies, Inc.* | 168 | 1,972 | ||||||
| Bazaarvoice, Inc.* | 248 | 1,964 | ||||||
| Calix, Inc.* | 201 | 1,938 | ||||||
| NVE Corp.* | 33 | 1,923 | ||||||
| LTX-Credence Corp.* | 240 | 1,918 | ||||||
| Electro Rent Corp. | 101 | 1,871 | ||||||
| Actuate Corp.* | 242 | 1,866 | ||||||
| RealD, Inc.* | 215 | 1,836 | ||||||
| E2open, Inc.* | 76 | 1,817 | ||||||
| Lionbridge Technologies, Inc.* | 304 | 1,812 | ||||||
| Mercury Systems, Inc.* | 165 | 1,807 | ||||||
| Integrated Silicon Solution, Inc.* | 148 | 1,789 | ||||||
| GSI Group, Inc.* | 158 | 1,776 | ||||||
| Ceva, Inc.* | 115 | 1,750 | ||||||
| Oplink Communications, Inc.* | 94 | 1,748 | ||||||
| Anaren, Inc.* | 62 | 1,735 | ||||||
| Qualys, Inc.* | 74 | 1,710 | ||||||
| Inphi Corp.* | 131 | 1,690 | ||||||
| FormFactor, Inc.* | 280 | 1,686 | ||||||
| Digi International, Inc.* | 138 | 1,673 | ||||||
| Global Eagle Entertainment, Inc.* | 110 | 1,636 | ||||||
| CIBER, Inc.* | 392 | 1,623 | ||||||
| Blackhawk Network Holdings, Inc.* | 64 | 1,617 | ||||||
| IXYS Corp. | 123 | 1,595 | ||||||
| PLX Technology, Inc.* | 242 | 1,592 | ||||||
| Higher One Holdings, Inc.* | 160 | 1,562 | ||||||
| Tessco Technologies, Inc. | 38 | 1,532 | ||||||
| Computer Task Group, Inc. | 81 | 1,531 | ||||||
| Procera Networks, Inc.* | 101 | 1,517 | ||||||
| Immersion Corp.* | 146 | 1,515 | ||||||
| Dice Holdings, Inc.* | 206 | 1,494 | ||||||
| Gogo, Inc.* | 60 | 1,489 | ||||||
| Zix Corp.* | 321 | 1,464 | ||||||
| ChannelAdvisor Corp.* | 35 | 1,460 | ||||||
| Kopin Corp.* | 344 | 1,452 | ||||||
| Gigamon, Inc.* | 50 | 1,404 | ||||||
| Marketo, Inc.* | 37 | 1,372 | ||||||
| Axcelis Technologies, Inc.* | 560 | 1,366 | ||||||
| QuinStreet, Inc.* | 157 | 1,364 | ||||||
| Cohu, Inc. | 128 | 1,344 | ||||||
| Avid Technology, Inc.* | 164 | 1,337 | ||||||
| Millennial Media, Inc.* | 182 | 1,323 | ||||||
| MoSys, Inc.* | 239 | 1,319 | ||||||
| Quantum Corp.* | 1,092 | 1,310 | ||||||
| KEMET Corp.* | 231 | 1,303 | ||||||
| PC Connection, Inc. | 52 | 1,292 | ||||||
| Zygo Corp.* | 87 | 1,286 | ||||||
| Glu Mobile, Inc.* | 325 | 1,264 | ||||||
| Electro Scientific Industries, Inc. | 120 | 1,255 | ||||||
| Supertex, Inc.* | 50 | 1,253 | ||||||
| MaxLinear, Inc. — Class A* | 117 | 1,220 | ||||||
| Ultra Clean Holdings, Inc.* | 121 | 1,214 | ||||||
| Xoom Corp.* | 44 | 1,204 | ||||||
| American Software, Inc. — Class A | 121 | 1,194 | ||||||
| Vocus, Inc.* | 101 | 1,150 | ||||||
| Maxwell Technologies, Inc.* | 147 | 1,142 | ||||||
| VASCO Data Security International, Inc.* | 145 | 1,121 | ||||||
| ModusLink Global Solutions, Inc.* | 194 | 1,112 | ||||||
| Cvent, Inc.* | 30 | 1,092 | ||||||
| Pericom Semiconductor Corp.* | 122 | 1,081 | ||||||
| Demand Media, Inc.* | 185 | 1,067 | ||||||
| Bel Fuse, Inc. — Class B | 50 | 1,066 | ||||||
| KVH Industries, Inc.* | 81 | 1,055 | ||||||
| Peregrine Semiconductor Corp.* | 141 | 1,045 | ||||||
| Agilysys, Inc.* | 75 | 1,044 | ||||||
| Vringo, Inc.* | 350 | 1,036 | ||||||
| Datalink Corp.* | 94 | 1,025 | ||||||
| Mesa Laboratories, Inc. | 13 | 1,022 | ||||||
| DSP Group, Inc.* | 104 | 1,010 | ||||||
| PRGX Global, Inc.* | 149 | 1,001 | ||||||
| support.com, Inc.* | 258 | 978 | ||||||
| Marchex, Inc. — Class B | 113 | 977 | ||||||
| ePlus, Inc.* | 17 | 966 | ||||||
| Alliance Fiber Optic Products, Inc. | 64 | 963 | ||||||
| Rubicon Technology, Inc.* | 96 | 955 | ||||||
| United Online, Inc. | 69 | 949 | ||||||
| Westell Technologies, Inc. — Class A* | 232 | 940 | ||||||
| Vishay Precision Group, Inc.* | 62 | 923 | ||||||
| Neonode, Inc.* | 146 | 923 | ||||||
| Guidance Software, Inc.* | 90 | 909 | ||||||
| Numerex Corp. — Class A* | 70 | 907 | ||||||
| Textura Corp.* | 30 | 898 | ||||||
| RealNetworks, Inc.* | 118 | 891 | ||||||
| PC-Telephone, Inc. | 93 | 890 | ||||||
| M/A-COM Technology Solutions | ||||||||
| Holdings, Inc.* | 52 | 883 | ||||||
| Hackett Group, Inc. | 141 | 876 | ||||||
| Travelzoo, Inc.* | 39 | 831 | ||||||
| Imation Corp.* | 174 | 814 | ||||||
| ANADIGICS, Inc.* | 426 | 784 | ||||||
| Mitek Systems, Inc.* | 130 | 772 | ||||||
| 110 | THE RYDEX FUNDS ANNUAL REPORT | SEE NOTES TO FINANCIAL STATEMENTS. |
| SCHEDULE OF INVESTMENTS (continued) | December 31, 2013 |
| RUSSELL 2000® 1.5x STRATEGY FUND |
| Shares | Value | |||||||
| Reis, Inc.* | 40 | $ | 769 | |||||
| NeoPhotonics Corp.* | 108 | 762 | ||||||
| Luxoft Holding, Inc.* | 20 | 760 | ||||||
| QAD, Inc. — Class A | 42 | 742 | ||||||
| Carbonite, Inc.* | 62 | 733 | ||||||
| Rosetta Stone, Inc.* | 60 | 733 | ||||||
| Digimarc Corp. | 38 | 732 | ||||||
| Sigma Designs, Inc.* | 154 | 727 | ||||||
| Aviat Networks, Inc.* | 320 | 723 | ||||||
| Alpha & Omega Semiconductor Ltd.* | 93 | 717 | ||||||
| Multi-Fineline Electronix, Inc.* | 51 | 708 | ||||||
| Sapiens International Corporation N.V. | 91 | 702 | ||||||
| Unwired Planet, Inc.* | 506 | 698 | ||||||
| GSI Technology, Inc.* | 104 | 691 | ||||||
| eGain Corp.* | 66 | 676 | ||||||
| Aeroflex Holding Corp.* | 103 | 670 | ||||||
| Rally Software Development Corp.* | 34 | 661 | ||||||
| Richardson Electronics Ltd. | 58 | 659 | ||||||
| Spark Networks, Inc.* | 101 | 622 | ||||||
| Silver Spring Networks, Inc.* | 29 | 609 | ||||||
| Planet Payment, Inc.* | 218 | 606 | ||||||
| Audience, Inc.* | 52 | 605 | ||||||
| Telenav, Inc.* | 87 | 573 | ||||||
| TeleCommunication Systems, Inc. — | ||||||||
| Class A* | 247 | 573 | ||||||
| Limelight Networks, Inc.* | 281 | 556 | ||||||
| Model N, Inc.* | 47 | 554 | ||||||
| Uni-Pixel, Inc.* | 54 | 541 | ||||||
| TechTarget, Inc.* | 75 | 515 | ||||||
| Marin Software, Inc.* | 47 | 481 | ||||||
| Intermolecular, Inc.* | 89 | 438 | ||||||
| Hutchinson Technology, Inc.* | 120 | 384 | ||||||
| Control4 Corp.* | 20 | 354 | ||||||
| Viasystems Group, Inc.* | 22 | 301 | ||||||
| Radisys Corp.* | 124 | 284 | ||||||
| Cyan, Inc.* | 45 | 238 | ||||||
| Tremor Video, Inc.* | 40 | 232 | ||||||
| YuMe, Inc.* | 30 | 224 | ||||||
| Net Element, Inc.* | 10 | 44 | ||||||
| Total Information Technology | 1,527,739 | |||||||
| INDUSTRIALS - 10.1% | ||||||||
| Acuity Brands, Inc. | 222 | 24,268 | ||||||
| Middleby Corp.* | 96 | 23,036 | ||||||
| HEICO Corp. | 345 | 19,992 | ||||||
| EnerSys, Inc. | 255 | 17,872 | ||||||
| Teledyne Technologies, Inc.* | 188 | 17,270 | ||||||
| Esterline Technologies Corp.* | 166 | 16,925 | ||||||
| CLARCOR, Inc. | 258 | 16,601 | ||||||
| Woodward, Inc. | 357 | 16,283 | ||||||
| Moog, Inc. — Class A* | 238 | 16,170 | ||||||
| DigitalGlobe, Inc.* | 391 | 16,090 | ||||||
| Chart Industries, Inc.* | 159 | 15,207 | ||||||
| Curtiss-Wright Corp. | 243 | 15,122 | ||||||
| Generac Holdings, Inc. | 265 | 15,010 | ||||||
| EMCOR Group, Inc. | 350 | 14,854 | ||||||
| Spirit Airlines, Inc.* | 314 | 14,259 | ||||||
| Deluxe Corp. | 264 | 13,777 | ||||||
| Actuant Corp. — Class A | 376 | 13,777 | ||||||
| Corporate Executive Board Co. | 172 | 13,319 | ||||||
| Watsco, Inc. | 137 | 13,160 | ||||||
| Advisory Board Co.* | 187 | 11,906 | ||||||
| USG Corp.* | 396 | 11,237 | ||||||
| Franklin Electric Company, Inc. | 248 | 11,071 | ||||||
| Applied Industrial Technologies, Inc. | 219 | 10,751 | ||||||
| Barnes Group, Inc. | 274 | 10,497 | ||||||
| JetBlue Airways Corp.* | 1,199 | 10,251 | ||||||
| MasTec, Inc.* | 308 | 10,078 | ||||||
| Beacon Roofing Supply, Inc.* | 250 | 10,070 | ||||||
| Healthcare Services Group, Inc. | 354 | 10,043 | ||||||
| TAL International Group, Inc. | 173 | 9,922 | ||||||
| Swift Transportation Co. — Class A* | 431 | 9,574 | ||||||
| Trimas Corp.* | 238 | 9,494 | ||||||
| United Stationers, Inc. | 206 | 9,453 | ||||||
| Mueller Industries, Inc. | 149 | 9,388 | ||||||
| Polypore International, Inc.* | 240 | 9,336 | ||||||
| Tetra Tech, Inc.* | 331 | 9,260 | ||||||
| Hornbeck Offshore Services, Inc.* | 188 | 9,255 | ||||||
| HNI Corp. | 235 | 9,125 | ||||||
| Watts Water Technologies, Inc. — Class A | 142 | 8,786 | ||||||
| Herman Miller, Inc. | 297 | 8,767 | ||||||
| FTI Consulting, Inc.* | 210 | 8,639 | ||||||
| UniFirst Corp. | 80 | 8,560 | ||||||
| Allegiant Travel Co. — Class A | 80 | 8,435 | ||||||
| Brink’s Co. | 243 | 8,296 | ||||||
| UTI Worldwide, Inc. | 470 | 8,253 | ||||||
| RBC Bearings, Inc.* | 116 | 8,207 | ||||||
| Mobile Mini, Inc.* | 196 | 8,071 | ||||||
| On Assignment, Inc.* | 231 | 8,066 | ||||||
| ABM Industries, Inc. | 281 | 8,034 | ||||||
| Hub Group, Inc. — Class A* | 199 | 7,936 | ||||||
| Raven Industries, Inc. | 189 | 7,776 | ||||||
| WageWorks, Inc.* | 130 | 7,727 | ||||||
| Mine Safety Appliances Co. | 150 | 7,682 | ||||||
| CIRCOR International, Inc. | 95 | 7,674 | ||||||
| Huron Consulting Group, Inc.* | 122 | 7,652 | ||||||
| General Cable Corp. | 260 | 7,647 | ||||||
| Simpson Manufacturing Company, Inc. | 208 | 7,640 | ||||||
| Mueller Water Products, Inc. — Class A | 813 | 7,618 | ||||||
| Trex Company, Inc.* | 93 | 7,396 | ||||||
| Brady Corp. — Class A | 238 | 7,361 | ||||||
| Orbital Sciences Corp.* | 309 | 7,200 | ||||||
| Granite Construction, Inc. | 199 | 6,961 | ||||||
| Forward Air Corp. | 156 | 6,850 | ||||||
| Steelcase, Inc. — Class A | 430 | 6,820 | ||||||
| Aircastle Ltd. | 355 | 6,802 | ||||||
| GrafTech International Ltd.* | 603 | 6,772 | ||||||
| G&K Services, Inc. — Class A | 108 | 6,721 | ||||||
| Interface, Inc. — Class A | 303 | 6,654 | ||||||
| Tennant Co. | 98 | 6,645 | ||||||
| Proto Labs, Inc.* | 93 | 6,620 | ||||||
| AZZ, Inc. | 134 | 6,547 | ||||||
| Korn/Ferry International* | 250 | 6,530 | ||||||
| EnPro Industries, Inc.* | 104 | 5,996 | ||||||
| Werner Enterprises, Inc. | 233 | 5,763 | ||||||
| SEE NOTES TO FINANCIAL STATEMENTS. | THE RYDEX FUNDS ANNUAL REPORT | 111 |
| SCHEDULE OF INVESTMENTS (continued) | December 31, 2013 |
| RUSSELL 2000® 1.5x STRATEGY FUND |
| Shares | Value | |||||||
| Matson, Inc. | 220 | $ | 5,745 | |||||
| Exponent, Inc. | 74 | 5,731 | ||||||
| Kaman Corp. | 144 | 5,721 | ||||||
| Atlas Air Worldwide Holdings, Inc.* | 138 | 5,679 | ||||||
| GenCorp, Inc.* | 314 | 5,658 | ||||||
| AAR Corp. | 201 | 5,630 | ||||||
| Primoris Services Corp. | 179 | 5,572 | ||||||
| Briggs & Stratton Corp. | 255 | 5,549 | ||||||
| DXP Enterprises, Inc.* | 48 | 5,530 | ||||||
| Encore Wire Corp. | 102 | 5,528 | ||||||
| Universal Forest Products, Inc. | 105 | 5,475 | ||||||
| Knight Transportation, Inc. | 298 | 5,465 | ||||||
| TrueBlue, Inc.* | 211 | 5,440 | ||||||
| Lindsay Corp. | 65 | 5,379 | ||||||
| Meritor, Inc.* | 510 | 5,319 | ||||||
| Hyster-Yale Materials Handling, Inc. | 57 | 5,310 | ||||||
| Albany International Corp. — Class A | 147 | 5,282 | ||||||
| Cubic Corp. | 100 | 5,266 | ||||||
| McGrath RentCorp | 132 | 5,254 | ||||||
| Rush Enterprises, Inc. — Class A* | 176 | 5,218 | ||||||
| Tutor Perini Corp.* | 197 | 5,181 | ||||||
| Apogee Enterprises, Inc. | 144 | 5,171 | ||||||
| Navigant Consulting, Inc.* | 255 | 4,896 | ||||||
| Titan International, Inc. | 272 | 4,891 | ||||||
| Altra Industrial Motion Corp. | 142 | 4,859 | ||||||
| Dycom Industries, Inc.* | 172 | 4,780 | ||||||
| ESCO Technologies, Inc. | 138 | 4,728 | ||||||
| Federal Signal Corp.* | 319 | 4,673 | ||||||
| Knoll, Inc. | 255 | 4,669 | ||||||
| II-VI, Inc.* | 265 | 4,664 | ||||||
| Standex International Corp. | 74 | 4,653 | ||||||
| Heartland Express, Inc. | 236 | 4,630 | ||||||
| Arkansas Best Corp. | 137 | 4,614 | ||||||
| Wesco Aircraft Holdings, Inc.* | 209 | 4,581 | ||||||
| AAON, Inc. | 142 | 4,537 | ||||||
| H&E Equipment Services, Inc.* | 152 | 4,504 | ||||||
| Aegion Corp. — Class A* | 203 | 4,444 | ||||||
| Sun Hydraulics Corp. | 108 | 4,410 | ||||||
| Wabash National Corp.* | 354 | 4,372 | ||||||
| Textainer Group Holdings Ltd. | 108 | 4,344 | ||||||
| Team, Inc.* | 102 | 4,319 | ||||||
| Insperity, Inc. | 118 | 4,263 | ||||||
| John Bean Technologies Corp. | 145 | 4,253 | ||||||
| Astec Industries, Inc. | 110 | 4,249 | ||||||
| Taser International, Inc.* | 267 | 4,240 | ||||||
| Rexnord Corp.* | 156 | 4,214 | ||||||
| Greenbrier Companies, Inc.* | 127 | 4,171 | ||||||
| XPO Logistics, Inc.* | 154 | 4,049 | ||||||
| Saia, Inc.* | 124 | 3,974 | ||||||
| SkyWest, Inc. | 267 | 3,960 | ||||||
| ACCO Brands Corp.* | 589 | 3,958 | ||||||
| Quanex Building Products Corp. | 195 | 3,884 | ||||||
| Comfort Systems USA, Inc. | 196 | 3,800 | ||||||
| Astronics Corp.* | 74 | 3,774 | ||||||
| Blount International, Inc.* | 258 | 3,733 | ||||||
| Thermon Group Holdings, Inc.* | 136 | 3,717 | ||||||
| Acacia Research Corp. | 254 | 3,693 | ||||||
| ICF International, Inc.* | 104 | 3,610 | ||||||
| US Ecology, Inc. | 97 | 3,607 | ||||||
| Aceto Corp. | 142 | 3,551 | ||||||
| Kelly Services, Inc. — Class A | 141 | 3,517 | ||||||
| Barrett Business Services, Inc. | 37 | 3,431 | ||||||
| Quad/Graphics, Inc. | 125 | 3,404 | ||||||
| Powell Industries, Inc. | 49 | 3,283 | ||||||
| Gorman-Rupp Co. | 98 | 3,259 | ||||||
| Nortek, Inc.* | 43 | 3,208 | ||||||
| Griffon Corp. | 234 | 3,091 | ||||||
| Viad Corp. | 109 | 3,028 | ||||||
| Resources Connection, Inc. | 211 | 3,024 | ||||||
| American Science & Engineering, Inc. | 42 | 3,020 | ||||||
| Engility Holdings, Inc.* | 90 | 3,006 | ||||||
| Kforce, Inc. | 146 | 2,987 | ||||||
| Aerovironment, Inc.* | 102 | 2,971 | ||||||
| Gibraltar Industries, Inc.* | 158 | 2,937 | ||||||
| West Corp. | 110 | 2,828 | ||||||
| Great Lakes Dredge & Dock Corp.* | 304 | 2,797 | ||||||
| Columbus McKinnon Corp.* | 102 | 2,768 | ||||||
| Park-Ohio Holdings Corp.* | 52 | 2,725 | ||||||
| Republic Airways Holdings, Inc.* | 254 | 2,715 | ||||||
| MYR Group, Inc.* | 105 | 2,633 | ||||||
| Roadrunner Transportation Systems, Inc.* | 96 | 2,587 | ||||||
| Kadant, Inc. | 63 | 2,553 | ||||||
| Hawaiian Holdings, Inc.* | 263 | 2,533 | ||||||
| Ennis, Inc. | 141 | 2,496 | ||||||
| Kimball International, Inc. — Class B | 166 | 2,495 | ||||||
| Alamo Group, Inc. | 39 | 2,367 | ||||||
| Marten Transport Ltd. | 117 | 2,362 | ||||||
| Multi-Color Corp. | 62 | 2,340 | ||||||
| GP Strategies Corp.* | 78 | 2,324 | ||||||
| LB Foster Co. — Class A | 49 | 2,317 | ||||||
| Consolidated Graphics, Inc.* | 34 | 2,293 | ||||||
| American Woodmark Corp.* | 58 | 2,293 | ||||||
| EnerNOC, Inc.* | 132 | 2,272 | ||||||
| Air Transport Services Group, Inc.* | 268 | 2,168 | ||||||
| KEYW Holding Corp.* | 161 | 2,164 | ||||||
| CAI International, Inc.* | 91 | 2,145 | ||||||
| Echo Global Logistics, Inc.* | 99 | 2,127 | ||||||
| SP Plus Corp.* | 81 | 2,109 | ||||||
| Graham Corp. | 58 | 2,105 | ||||||
| American Railcar Industries, Inc. | 46 | 2,105 | ||||||
| Argan, Inc. | 76 | 2,095 | ||||||
| National Presto Industries, Inc. | 26 | 2,093 | ||||||
| Celadon Group, Inc. | 107 | 2,084 | ||||||
| Furmanite Corp.* | 193 | 2,050 | ||||||
| Insteel Industries, Inc. | 89 | 2,023 | ||||||
| Capstone Turbine Corp.* | 1,565 | 2,019 | ||||||
| Northwest Pipe Co.* | 53 | 2,001 | ||||||
| Heidrick & Struggles International, Inc. | 99 | 1,994 | ||||||
| NCI Building Systems, Inc.* | 111 | 1,947 | ||||||
| ExOne Co.* | 32 | 1,935 | ||||||
| Douglas Dynamics, Inc. | 115 | 1,934 | ||||||
| PowerSecure International, Inc.* | 108 | 1,854 | ||||||
| NN, Inc. | 91 | 1,837 | ||||||
| Layne Christensen Co.* | 105 | 1,793 | ||||||
| 112 | THE RYDEX FUNDS ANNUAL REPORT | SEE NOTES TO FINANCIAL STATEMENTS. |
| SCHEDULE OF INVESTMENTS (continued) | December 31, 2013 |
| RUSSELL 2000® 1.5x STRATEGY FUND |
| Shares | Value | |||||||
| Ducommun, Inc.* | 60 | $ | 1,789 | |||||
| Kratos Defense & Security Solutions, Inc.* | 232 | 1,782 | ||||||
| InnerWorkings, Inc.* | 228 | 1,776 | ||||||
| PGT, Inc.* | 175 | 1,771 | ||||||
| CBIZ, Inc.* | 194 | 1,769 | ||||||
| Global Power Equipment Group, Inc. | 90 | 1,761 | ||||||
| Orion Marine Group, Inc.* | 145 | 1,744 | ||||||
| Pendrell Corp.* | 841 | 1,690 | ||||||
| Builders FirstSource, Inc.* | 234 | 1,671 | ||||||
| Mistras Group, Inc.* | 80 | 1,670 | ||||||
| ARC Document Solutions, Inc.* | 202 | 1,660 | ||||||
| Titan Machinery, Inc.* | 92 | 1,639 | ||||||
| FreightCar America, Inc. | 60 | 1,597 | ||||||
| Lydall, Inc.* | 90 | 1,586 | ||||||
| CDI Corp. | 84 | 1,557 | ||||||
| Ply Gem Holdings, Inc.* | 84 | 1,515 | ||||||
| Pacer International, Inc.* | 182 | 1,503 | ||||||
| Dynamic Materials Corp. | 69 | 1,500 | ||||||
| CECO Environmental Corp. | 92 | 1,488 | ||||||
| Sparton Corp.* | 51 | 1,425 | ||||||
| Pike Corp.* | 133 | 1,406 | ||||||
| Quality Distribution, Inc.* | 106 | 1,360 | ||||||
| Patriot Transportation Holding, Inc.* | 32 | 1,328 | ||||||
| Energy Recovery, Inc.* | 232 | 1,290 | ||||||
| Vicor Corp.* | 96 | 1,288 | ||||||
| Coleman Cable, Inc. | 49 | 1,285 | ||||||
| Houston Wire & Cable Co. | 94 | 1,258 | ||||||
| VSE Corp. | 26 | 1,248 | ||||||
| Manitex International, Inc.* | 76 | 1,207 | ||||||
| Casella Waste Systems, Inc. — Class A* | 205 | 1,189 | ||||||
| Performant Financial Corp.* | 115 | 1,185 | ||||||
| FuelCell Energy, Inc.*,1 | 820 | 1,156 | ||||||
| Courier Corp. | 63 | 1,140 | ||||||
| Miller Industries, Inc. | 61 | 1,136 | ||||||
| Power Solutions International, Inc.* | 15 | 1,127 | ||||||
| Twin Disc, Inc. | 43 | 1,113 | ||||||
| CRA International, Inc.* | 54 | 1,069 | ||||||
| YRC Worldwide, Inc.* | 60 | 1,042 | ||||||
| Xerium Technologies, Inc.* | 63 | 1,039 | ||||||
| Sterling Construction Company, Inc.* | 87 | 1,021 | ||||||
| Heritage-Crystal Clean, Inc.* | 49 | 1,004 | ||||||
| Costa, Inc.* | 46 | 1,000 | ||||||
| Flow International Corp.* | 247 | 998 | ||||||
| Ameresco, Inc. — Class A* | 103 | 995 | ||||||
| Schawk, Inc. — Class A | 66 | 981 | ||||||
| LSI Industries, Inc. | 110 | 954 | ||||||
| Ampco-Pittsburgh Corp. | 49 | 953 | ||||||
| Preformed Line Products Co. | 13 | 951 | ||||||
| PMFG, Inc.* | 105 | 950 | ||||||
| Cenveo, Inc.* | 275 | 946 | ||||||
| International Shipholding Corp. | 32 | 944 | ||||||
| Franklin Covey Co.* | 47 | 934 | ||||||
| Patrick Industries, Inc.* | 32 | 926 | ||||||
| Hurco Companies, Inc. | 37 | 925 | ||||||
| Tecumseh Products Co. — Class A* | 100 | 905 | ||||||
| Commercial Vehicle Group, Inc.* | 121 | 880 | ||||||
| Astronics Corp. — Class B* | 17 | 863 | ||||||
| Universal Truckload Services, Inc. | 28 | 854 | ||||||
| Hardinge, Inc. | 59 | 854 | ||||||
| Odyssey Marine Exploration, Inc.* | 406 | 820 | ||||||
| Accuride Corp.* | 208 | 776 | ||||||
| LMI Aerospace, Inc.* | 52 | 766 | ||||||
| Global Brass & Copper Holdings, Inc. | 45 | 745 | ||||||
| Stock Building Supply Holdings, Inc.* | 40 | 729 | ||||||
| TRC Companies, Inc.* | 83 | 593 | ||||||
| API Technologies Corp.* | 165 | 563 | ||||||
| Enphase Energy, Inc.* | 84 | 533 | ||||||
| Revolution Lighting Technologies, Inc.* | 150 | 514 | ||||||
| Innovative Solutions & Support, Inc.* | 65 | 474 | ||||||
| Acorn Energy, Inc. | 110 | 448 | ||||||
| NL Industries, Inc. | 40 | 447 | ||||||
| Erickson Air-Crane, Inc.* | 20 | 416 | ||||||
| Ultrapetrol Bahamas Ltd.* | 110 | 411 | ||||||
| American Superconductor Corp.* | 249 | 408 | ||||||
| Intersections, Inc. | 51 | 397 | ||||||
| BlueLinx Holdings, Inc.* | 178 | 347 | ||||||
| Swisher Hygiene, Inc.* | 583 | 300 | ||||||
| Omega Flex, Inc. | 11 | 225 | ||||||
| Compx International, Inc. | 10 | 141 | ||||||
| Total Industrials | 1,264,274 | |||||||
| CONSUMER DISCRETIONARY - 9.4% | ||||||||
| Brunswick Corp. | 471 | 21,693 | ||||||
| Fifth & Pacific Companies, Inc.* | 622 | 19,948 | ||||||
| Sotheby’s | 359 | 19,098 | ||||||
| Tenneco, Inc.* | 317 | 17,932 | ||||||
| Wolverine World Wide, Inc. | 511 | 17,354 | ||||||
| Dana Holding Corp. | 756 | 14,832 | ||||||
| Lumber Liquidators Holdings, Inc.* | 142 | 14,610 | ||||||
| Live Nation Entertainment, Inc.* | 729 | 14,405 | ||||||
| Vail Resorts, Inc. | 189 | 14,218 | ||||||
| Pool Corp. | 241 | 14,012 | ||||||
| Buffalo Wild Wings, Inc.* | 95 | 13,983 | ||||||
| Office Depot, Inc.* | 2,464 | 13,034 | ||||||
| Cheesecake Factory, Inc. | 270 | 13,032 | ||||||
| Men’s Wearhouse, Inc. | 254 | 12,974 | ||||||
| Sinclair Broadcast Group, Inc. — Class A | 354 | 12,647 | ||||||
| Iconix Brand Group, Inc.* | 293 | 11,632 | ||||||
| Steven Madden Ltd.* | 313 | 11,453 | ||||||
| Jack in the Box, Inc.* | 227 | 11,355 | ||||||
| Cracker Barrel Old Country Store, Inc. | 103 | 11,337 | ||||||
| HSN, Inc. | 181 | 11,276 | ||||||
| Pier 1 Imports, Inc. | 485 | 11,194 | ||||||
| Life Time Fitness, Inc.* | 225 | 10,575 | ||||||
| New York Times Co. — Class A | 660 | 10,475 | ||||||
| Penske Automotive Group, Inc. | 221 | 10,422 | ||||||
| Ryland Group, Inc. | 237 | 10,287 | ||||||
| Shutterfly, Inc.* | 200 | 10,185 | ||||||
| Grand Canyon Education, Inc.* | 229 | 9,985 | ||||||
| Outerwall, Inc.* | 148 | 9,956 | ||||||
| Meredith Corp. | 183 | 9,479 | ||||||
| Rent-A-Center, Inc. — Class A | 283 | 9,436 | ||||||
| Hibbett Sports, Inc.* | 139 | 9,342 | ||||||
| Conn’s, Inc.* | 117 | 9,218 | ||||||
| ANN, Inc.* | 250 | 9,140 | ||||||
| SEE NOTES TO FINANCIAL STATEMENTS. | THE RYDEX FUNDS ANNUAL REPORT | 113 |
| SCHEDULE OF INVESTMENTS (continued) | December 31, 2013 |
| RUSSELL 2000® 1.5x STRATEGY FUND |
| Shares | Value | |||||||
| Texas Roadhouse, Inc. — Class A | 326 | $ | 9,063 | |||||
| Meritage Homes Corp.* | 187 | 8,973 | ||||||
| Genesco, Inc.* | 122 | 8,913 | ||||||
| Monro Muffler Brake, Inc. | 156 | 8,792 | ||||||
| Asbury Automotive Group, Inc.* | 163 | 8,760 | ||||||
| La-Z-Boy, Inc. | 272 | 8,433 | ||||||
| Lithia Motors, Inc. — Class A | 121 | 8,400 | ||||||
| Hillenbrand, Inc. | 285 | 8,385 | ||||||
| Nexstar Broadcasting Group, Inc. — | ||||||||
| Class A | 150 | 8,360 | ||||||
| Group 1 Automotive, Inc. | 117 | 8,309 | ||||||
| Express, Inc.* | 443 | 8,271 | ||||||
| Vitamin Shoppe, Inc.* | 157 | 8,166 | ||||||
| Jos. A. Bank Clothiers, Inc.* | 147 | 8,045 | ||||||
| Helen of Troy Ltd.* | 161 | 7,971 | ||||||
| KB Home | 434 | 7,934 | ||||||
| Pinnacle Entertainment, Inc.* | 305 | 7,928 | ||||||
| Marriott Vacations Worldwide Corp.* | 148 | 7,809 | ||||||
| Buckle, Inc. | 147 | 7,726 | ||||||
| Papa John’s International, Inc. | 170 | 7,718 | ||||||
| Cooper Tire & Rubber Co. | 321 | 7,717 | ||||||
| Five Below, Inc.* | 173 | 7,474 | ||||||
| Dorman Products, Inc.* | 133 | 7,457 | ||||||
| Orient-Express Hotels Ltd. — Class A* | 493 | 7,449 | ||||||
| Bob Evans Farms, Inc. | 146 | 7,386 | ||||||
| Sturm Ruger & Company, Inc. | 100 | 7,309 | ||||||
| Crocs, Inc.* | 456 | 7,260 | ||||||
| Churchill Downs, Inc. | 80 | 7,172 | ||||||
| American Axle & Manufacturing | ||||||||
| Holdings, Inc.* | 350 | 7,158 | ||||||
| Finish Line, Inc. — Class A | 254 | 7,155 | ||||||
| DineEquity, Inc. | 85 | 7,102 | ||||||
| Children’s Place Retail Stores, Inc.* | 124 | 7,064 | ||||||
| Standard Pacific Corp.* | 761 | 6,887 | ||||||
| Valassis Communications, Inc. | 197 | 6,747 | ||||||
| Bloomin’ Brands, Inc.* | 280 | 6,723 | ||||||
| MDC Holdings, Inc. | 203 | 6,545 | ||||||
| G-III Apparel Group Ltd.* | 88 | 6,494 | ||||||
| Krispy Kreme Doughnuts, Inc.* | 336 | 6,481 | ||||||
| Brown Shoe Company, Inc. | 230 | 6,472 | ||||||
| Skechers U.S.A., Inc. — Class A* | 195 | 6,460 | ||||||
| Jones Group, Inc. | 414 | 6,193 | ||||||
| Interval Leisure Group, Inc. | 199 | 6,149 | ||||||
| Select Comfort Corp.* | 291 | 6,137 | ||||||
| Matthews International Corp. — Class A | 144 | 6,136 | ||||||
| Drew Industries, Inc. | 118 | 6,042 | ||||||
| Quiksilver, Inc.* | 687 | 6,025 | ||||||
| Restoration Hardware Holdings, Inc.* | 88 | 5,922 | ||||||
| Ascent Capital Group, Inc. — Class A* | 69 | 5,904 | ||||||
| National CineMedia, Inc. | 292 | 5,828 | ||||||
| Sonic Corp.* | 285 | 5,754 | ||||||
| Columbia Sportswear Co. | 72 | 5,670 | ||||||
| Biglari Holdings, Inc.* | 11 | 5,573 | ||||||
| Oxford Industries, Inc. | 69 | 5,566 | ||||||
| Tumi Holdings, Inc.* | 246 | 5,547 | ||||||
| Fiesta Restaurant Group, Inc.* | 106 | 5,537 | ||||||
| Red Robin Gourmet Burgers, Inc.* | 75 | 5,516 | ||||||
| Loral Space & Communications, Inc.* | 66 | 5,345 | ||||||
| International Speedway Corp. — Class A | 146 | 5,182 | ||||||
| iRobot Corp.* | 149 | 5,181 | ||||||
| LifeLock, Inc.* | 310 | 5,087 | ||||||
| MDC Partners, Inc. — Class A | 191 | 4,872 | ||||||
| Sonic Automotive, Inc. — Class A | 198 | 4,847 | ||||||
| Core-Mark Holding Company, Inc. | 63 | 4,783 | ||||||
| AFC Enterprises, Inc.* | 121 | 4,659 | ||||||
| Gentherm, Inc.* | 171 | 4,585 | ||||||
| Cato Corp. — Class A | 143 | 4,547 | ||||||
| Multimedia Games Holding | ||||||||
| Company, Inc.* | 145 | 4,547 | ||||||
| Scholastic Corp. | 133 | 4,523 | ||||||
| Caesars Entertainment Corp.* | 206 | 4,437 | ||||||
| CEC Entertainment, Inc. | 97 | 4,295 | ||||||
| Francesca’s Holdings Corp.* | 231 | 4,253 | ||||||
| Movado Group, Inc. | 96 | 4,225 | ||||||
| American Public Education, Inc.* | 95 | 4,130 | ||||||
| Scientific Games Corp. — Class A* | 241 | 4,080 | ||||||
| Winnebago Industries, Inc.* | 148 | 4,063 | ||||||
| Boyd Gaming Corp.* | 359 | 4,042 | ||||||
| ITT Educational Services, Inc.* | 120 | 4,030 | ||||||
| BJ’s Restaurants, Inc.* | 128 | 3,976 | ||||||
| Smith & Wesson Holding Corp.* | 292 | 3,939 | ||||||
| Ethan Allen Interiors, Inc. | 129 | 3,924 | ||||||
| Standard Motor Products, Inc. | 105 | 3,864 | ||||||
| Capella Education Co. | 58 | 3,854 | ||||||
| Hovnanian Enterprises, Inc. — Class A* | 581 | 3,846 | ||||||
| Gray Television, Inc.* | 255 | 3,794 | ||||||
| Steiner Leisure Ltd.* | 77 | 3,788 | ||||||
| Arctic Cat, Inc. | 66 | 3,761 | ||||||
| Stage Stores, Inc. | 169 | 3,755 | ||||||
| Aeropostale, Inc.* | 406 | 3,691 | ||||||
| Regis Corp. | 249 | 3,613 | ||||||
| EW Scripps Co. — Class A* | 166 | 3,606 | ||||||
| Tuesday Morning Corp.* | 225 | 3,591 | ||||||
| Cumulus Media, Inc. — Class A* | 446 | 3,448 | ||||||
| Denny’s Corp.* | 475 | 3,415 | ||||||
| Fred’s, Inc. — Class A | 184 | 3,408 | ||||||
| Pep Boys-Manny Moe & Jack* | 279 | 3,387 | ||||||
| M/I Homes, Inc.* | 133 | 3,385 | ||||||
| FTD Companies, Inc.* | 101 | 3,291 | ||||||
| Carmike Cinemas, Inc.* | 117 | 3,257 | ||||||
| Haverty Furniture Companies, Inc. | 104 | 3,255 | ||||||
| Beazer Homes USA, Inc.* | 131 | 3,199 | ||||||
| Modine Manufacturing Co.* | 247 | 3,167 | ||||||
| Callaway Golf Co. | 364 | 3,069 | ||||||
| Barnes & Noble, Inc.* | 204 | 3,050 | ||||||
| Universal Electronics, Inc.* | 80 | 3,049 | ||||||
| K12, Inc.* | 140 | 3,045 | ||||||
| Mattress Firm Holding Corp.* | 70 | 3,013 | ||||||
| Blue Nile, Inc.* | 62 | 2,920 | ||||||
| Chuy’s Holdings, Inc.* | 80 | 2,882 | ||||||
| Zumiez, Inc.* | 106 | 2,756 | ||||||
| Zale Corp.* | 170 | 2,681 | ||||||
| Vera Bradley, Inc.* | 110 | 2,644 | ||||||
| Ruth’s Hospitality Group, Inc. | 186 | 2,643 | ||||||
| 114 | THE RYDEX FUNDS ANNUAL REPORT | SEE NOTES TO FINANCIAL STATEMENTS. |
| SCHEDULE OF INVESTMENTS (continued) | December 31, 2013 |
| RUSSELL 2000® 1.5x STRATEGY FUND |
| Shares | Value | |||||||
| LeapFrog Enterprises, Inc. — Class A* | 331 | $ | 2,628 | |||||
| Cavco Industries, Inc.* | 38 | 2,611 | ||||||
| Superior Industries International, Inc. | 124 | 2,558 | ||||||
| World Wrestling Entertainment, Inc. — | ||||||||
| Class A | 144 | 2,388 | ||||||
| NutriSystem, Inc. | 143 | 2,351 | ||||||
| Media General, Inc. — Class A* | 104 | 2,350 | ||||||
| Shoe Carnival, Inc. | 77 | 2,234 | ||||||
| Unifi, Inc.* | 82 | 2,234 | ||||||
| Libbey, Inc.* | 105 | 2,204 | ||||||
| Bright Horizons Family Solutions, Inc.* | 60 | 2,204 | ||||||
| Ruby Tuesday, Inc.* | 318 | 2,204 | ||||||
| Journal Communications, Inc. — Class A* | 232 | 2,160 | ||||||
| Rentrak Corp.* | 56 | 2,122 | ||||||
| Destination Maternity Corp. | 69 | 2,062 | ||||||
| Federal-Mogul Corp.* | 103 | 2,027 | ||||||
| Strayer Education, Inc. | 58 | 1,999 | ||||||
| Overstock.com, Inc.* | 64 | 1,971 | ||||||
| Stein Mart, Inc. | 144 | 1,937 | ||||||
| Stoneridge, Inc.* | 151 | 1,925 | ||||||
| MarineMax, Inc.* | 119 | 1,914 | ||||||
| Tile Shop Holdings, Inc.* | 100 | 1,807 | ||||||
| Town Sports International Holdings, Inc. | 122 | 1,801 | ||||||
| PetMed Express, Inc. | 107 | 1,779 | ||||||
| Big 5 Sporting Goods Corp. | 88 | 1,744 | ||||||
| Entravision Communications Corp. — | ||||||||
| Class A | 284 | 1,730 | ||||||
| Kirkland’s, Inc.* | 73 | 1,728 | ||||||
| Harte-Hanks, Inc. | 219 | 1,713 | ||||||
| Remy International, Inc. | 73 | 1,702 | ||||||
| NACCO Industries, Inc. — Class A | 27 | 1,679 | ||||||
| Bravo Brio Restaurant Group, Inc.* | 103 | 1,676 | ||||||
| Diamond Resorts International, Inc.* | 90 | 1,661 | ||||||
| Digital Generation, Inc.* | 128 | 1,632 | ||||||
| Bridgepoint Education, Inc.* | 92 | 1,629 | ||||||
| Carriage Services, Inc. — Class A | 83 | 1,621 | ||||||
| Career Education Corp.* | 284 | 1,619 | ||||||
| America’s Car-Mart, Inc.* | 38 | 1,605 | ||||||
| VOXX International Corp. — Class A* | 95 | 1,587 | ||||||
| Black Diamond, Inc.* | 118 | 1,573 | ||||||
| Christopher & Banks Corp.* | 183 | 1,563 | ||||||
| TRI Pointe Homes, Inc.* | 78 | 1,555 | ||||||
| William Lyon Homes — Class A* | 70 | 1,550 | ||||||
| Central European Media Enterprises Ltd. — | ||||||||
| Class A* | 398 | 1,528 | ||||||
| Universal Technical Institute, Inc. | 107 | 1,488 | ||||||
| Daily Journal Corp.* | 8 | 1,480 | ||||||
| RetailMeNot, Inc.* | 50 | 1,440 | ||||||
| Destination XL Group, Inc.* | 218 | �� | 1,432 | |||||
| Del Frisco’s Restaurant Group, Inc.* | 60 | 1,414 | ||||||
| ValueVision Media, Inc. — Class A* | 200 | 1,398 | ||||||
| Mac-Gray Corp. | 65 | 1,380 | ||||||
| Citi Trends, Inc.* | 81 | 1,377 | ||||||
| Nautilus, Inc.* | 158 | 1,332 | ||||||
| RadioShack Corp.* | 510 | 1,326 | ||||||
| Marcus Corp. | 98 | 1,317 | ||||||
| Saga Communications, Inc. — Class A | 26 | 1,308 | ||||||
| CSS Industries, Inc. | 45 | 1,291 | ||||||
| Wet Seal, Inc. — Class A* | 468 | 1,278 | ||||||
| Entercom Communications Corp. — | ||||||||
| Class A* | 121 | 1,272 | ||||||
| West Marine, Inc.* | 89 | 1,266 | ||||||
| Education Management Corp.* | 123 | 1,241 | ||||||
| Spartan Motors, Inc. | 176 | 1,179 | ||||||
| Morgans Hotel Group Co.* | 144 | 1,171 | ||||||
| Fuel Systems Solutions, Inc.* | 84 | 1,165 | ||||||
| Speedway Motorsports, Inc. | 58 | 1,151 | ||||||
| Speed Commerce, Inc.* | 239 | 1,116 | ||||||
| Jamba, Inc.* | 87 | 1,081 | ||||||
| Noodles & Co.* | 30 | 1,078 | ||||||
| Bon-Ton Stores, Inc. | 66 | 1,074 | ||||||
| McClatchy Co. — Class A* | 316 | 1,074 | ||||||
| Perry Ellis International, Inc.* | 66 | 1,042 | ||||||
| Sears Hometown and Outlet Stores, Inc.* | 40 | 1,020 | ||||||
| hhgregg, Inc.* | 71 | 992 | ||||||
| Monarch Casino & Resort, Inc.* | 49 | 984 | ||||||
| Isle of Capri Casinos, Inc.* | 107 | 963 | ||||||
| Lifetime Brands, Inc. | 60 | 944 | ||||||
| bebe stores, Inc. | 175 | 931 | ||||||
| RG Barry Corp. | 48 | 926 | ||||||
| Winmark Corp. | 10 | 926 | ||||||
| Weyco Group, Inc. | 31 | 912 | ||||||
| Bassett Furniture Industries, Inc. | 59 | 902 | ||||||
| Hooker Furniture Corp. | 53 | 884 | ||||||
| Fox Factory Holding Corp.* | 50 | 881 | ||||||
| Orbitz Worldwide, Inc.* | 121 | 869 | ||||||
| Culp, Inc. | 42 | 859 | ||||||
| Luby’s, Inc.* | 106 | 818 | ||||||
| Carrols Restaurant Group, Inc.* | 123 | 813 | ||||||
| Global Sources Ltd.* | 97 | 789 | ||||||
| Pacific Sunwear of California, Inc.* | 234 | 782 | ||||||
| AH Belo Corp. — Class A | 103 | 769 | ||||||
| WCI Communities, Inc.* | 40 | 764 | ||||||
| Tower International, Inc.* | 35 | 749 | ||||||
| 1-800-Flowers.com, Inc. — Class A* | 137 | 741 | ||||||
| Johnson Outdoors, Inc. — Class A | 27 | 728 | ||||||
| Corinthian Colleges, Inc.* | 408 | 726 | ||||||
| Reading International, Inc. — Class A* | 94 | 704 | ||||||
| Zagg, Inc.* | 160 | 696 | ||||||
| Skullcandy, Inc.* | 96 | 692 | ||||||
| JAKKS Pacific, Inc. | 100 | 673 | ||||||
| Shiloh Industries, Inc.* | 34 | 663 | ||||||
| ReachLocal, Inc.* | 52 | 661 | ||||||
| Crown Media Holdings, Inc. — Class A* | 184 | 650 | ||||||
| Flexsteel Industries, Inc. | 21 | 645 | ||||||
| Systemax, Inc.* | 57 | 641 | ||||||
| Vitacost.com, Inc.* | 109 | 631 | ||||||
| New York & Company, Inc.* | 144 | 629 | ||||||
| Lincoln Educational Services Corp. | 126 | 627 | ||||||
| Dex Media, Inc.* | 92 | 624 | ||||||
| Martha Stewart Living Omnimedia, Inc. — | ||||||||
| Class A* | 145 | 609 | ||||||
| Tilly’s, Inc. — Class A* | 52 | 595 | ||||||
| UCP, Inc. — Class A* | 40 | 586 | ||||||
| SEE NOTES TO FINANCIAL STATEMENTS. | THE RYDEX FUNDS ANNUAL REPORT | 115 |
| SCHEDULE OF INVESTMENTS (continued) | December 31, 2013 |
| RUSSELL 2000® 1.5x STRATEGY FUND |
| Shares | Value | |||||||
| Marine Products Corp. | 57 | $ | 573 | |||||
| Blyth, Inc. | 52 | 566 | ||||||
| Nathan’s Famous, Inc.* | 11 | 555 | ||||||
| Hemisphere Media Group, Inc.* | 45 | 534 | ||||||
| Einstein Noah Restaurant Group, Inc. | 34 | 493 | ||||||
| Salem Communications Corp. — Class A | 56 | 487 | ||||||
| JTH Holding, Inc. — Class A* | 20 | 486 | ||||||
| Ignite Restaurant Group, Inc.* | 38 | 475 | ||||||
| EveryWare Global, Inc.* | 56 | 464 | ||||||
| American Apparel, Inc.* | 300 | 369 | ||||||
| Gordmans Stores, Inc. | 46 | 353 | ||||||
| Body Central Corp.* | 86 | 339 | ||||||
| Diversified Restaurant Holdings, Inc.* | 60 | 286 | ||||||
| Trans World Entertainment Corp.* | 50 | 221 | ||||||
| Beasley Broadcasting Group, Inc. — | ||||||||
| Class A | 19 | 166 | ||||||
| Total Consumer Discretionary | 1,178,266 | |||||||
| HEALTH CARE - 9.0% | ||||||||
| athenahealth, Inc.* | 194 | 26,093 | ||||||
| Isis Pharmaceuticals, Inc.* | 583 | 23,226 | ||||||
| Align Technology, Inc.* | 380 | 21,716 | ||||||
| Alnylam Pharmaceuticals, Inc.* | 306 | 19,684 | ||||||
| West Pharmaceutical Services, Inc. | 358 | 17,563 | ||||||
| ViroPharma, Inc.* | 336 | 16,749 | ||||||
| Centene Corp.* | 280 | 16,505 | ||||||
| Cepheid, Inc.* | 350 | 16,351 | ||||||
| Team Health Holdings, Inc.* | 358 | 16,307 | ||||||
| Medidata Solutions, Inc.* | 266 | 16,112 | ||||||
| WellCare Health Plans, Inc.* | 223 | 15,703 | ||||||
| NPS Pharmaceuticals, Inc.* | 512 | 15,543 | ||||||
| HealthSouth Corp. | 444 | 14,793 | ||||||
| Questcor Pharmaceuticals, Inc. | 268 | 14,592 | ||||||
| STERIS Corp. | 300 | 14,416 | ||||||
| PAREXEL International Corp.* | 292 | 13,192 | ||||||
| DexCom, Inc.* | 368 | 13,031 | ||||||
| Medicines Co.* | 324 | 12,513 | ||||||
| Owens & Minor, Inc. | 326 | 11,918 | ||||||
| Air Methods Corp.* | 197 | 11,491 | ||||||
| Puma Biotechnology, Inc.* | 110 | 11,387 | ||||||
| Haemonetics Corp.* | 266 | 11,207 | ||||||
| Aegerion Pharmaceuticals, Inc.* | 154 | 10,928 | ||||||
| Thoratec Corp.* | 294 | 10,760 | ||||||
| MWI Veterinary Supply, Inc.* | 63 | 10,747 | ||||||
| Insulet Corp.* | 280 | 10,388 | ||||||
| HMS Holdings Corp.* | 451 | 10,251 | ||||||
| Celldex Therapeutics, Inc.* | 418 | 10,120 | ||||||
| Cyberonics, Inc.* | 144 | 9,433 | ||||||
| Prestige Brands Holdings, Inc.* | 261 | 9,344 | ||||||
| Santarus, Inc.* | 289 | 9,236 | ||||||
| ACADIA Pharmaceuticals, Inc.* | 364 | 9,096 | ||||||
| Impax Laboratories, Inc.* | 353 | 8,874 | ||||||
| Magellan Health Services, Inc.* | 146 | 8,747 | ||||||
| Neogen Corp.* | 190 | 8,683 | ||||||
| Acadia Healthcare Company, Inc.* | 179 | 8,471 | ||||||
| Opko Health, Inc.* | 972 | 8,204 | ||||||
| Pacira Pharmaceuticals, Inc.* | 138 | 7,934 | ||||||
| HeartWare International, Inc.* | 84 | 7,893 | ||||||
| Chemed Corp. | 101 | 7,739 | ||||||
| Akorn, Inc.* | 304 | 7,488 | ||||||
| Amsurg Corp. — Class A* | 162 | 7,439 | ||||||
| Masimo Corp.* | 250 | 7,308 | ||||||
| NuVasive, Inc.* | 225 | 7,274 | ||||||
| Hanger, Inc.* | 184 | 7,239 | ||||||
| Halozyme Therapeutics, Inc.* | 463 | 6,940 | ||||||
| Nektar Therapeutics* | 598 | 6,787 | ||||||
| Arena Pharmaceuticals, Inc.* | 1,126 | 6,587 | ||||||
| Wright Medical Group, Inc.* | 210 | 6,449 | ||||||
| ImmunoGen, Inc.* | �� | 436 | 6,396 | |||||
| MedAssets, Inc.* | 317 | 6,286 | ||||||
| Synageva BioPharma Corp.* | 97 | 6,278 | ||||||
| InterMune, Inc.* | 420 | 6,187 | ||||||
| CONMED Corp. | 145 | 6,163 | ||||||
| Acorda Therapeutics, Inc.* | 209 | 6,103 | ||||||
| PDL BioPharma, Inc. | 719 | 6,068 | ||||||
| Volcano Corp.* | 276 | 6,031 | ||||||
| Analogic Corp. | 68 | 6,022 | ||||||
| ArthroCare Corp.* | 149 | 5,996 | ||||||
| Globus Medical, Inc. — Class A* | 290 | 5,852 | ||||||
| Exelixis, Inc.* | 947 | 5,805 | ||||||
| Endologix, Inc.* | 329 | 5,738 | ||||||
| Meridian Bioscience, Inc. | 214 | 5,677 | ||||||
| Cantel Medical Corp. | 164 | 5,561 | ||||||
| Ironwood Pharmaceuticals, Inc. — | ||||||||
| Class A* | 478 | 5,550 | ||||||
| Keryx Biopharmaceuticals, Inc.* | 426 | 5,517 | ||||||
| Kindred Healthcare, Inc. | 277 | 5,468 | ||||||
| ABIOMED, Inc.* | 202 | 5,401 | ||||||
| Greatbatch, Inc.* | 120 | 5,309 | ||||||
| Auxilium Pharmaceuticals, Inc.* | 255 | 5,289 | ||||||
| IPC The Hospitalist Company, Inc.* | 88 | 5,226 | ||||||
| Molina Healthcare, Inc.* | 150 | 5,213 | ||||||
| Ligand Pharmaceuticals, Inc. — Class B* | 97 | 5,102 | ||||||
| Spectranetics Corp.* | 204 | 5,100 | ||||||
| Fluidigm Corp.* | 133 | 5,096 | ||||||
| Integra LifeSciences Holdings Corp.* | 106 | 5,057 | ||||||
| Clovis Oncology, Inc.* | 83 | 5,002 | ||||||
| Novavax, Inc.* | 951 | 4,869 | ||||||
| Vivus, Inc.*,1 | 526 | 4,776 | ||||||
| ExamWorks Group, Inc.* | 157 | 4,690 | ||||||
| Dyax Corp.* | 622 | 4,684 | ||||||
| Abaxis, Inc.* | 115 | 4,602 | ||||||
| Omnicell, Inc.* | 178 | 4,544 | ||||||
| Emeritus Corp.* | 206 | 4,456 | ||||||
| Quidel Corp.* | 143 | 4,417 | ||||||
| Sangamo Biosciences, Inc.* | 318 | 4,417 | ||||||
| Momenta Pharmaceuticals, Inc.* | 247 | 4,367 | ||||||
| Quality Systems, Inc. | 206 | 4,338 | ||||||
| Ensign Group, Inc. | 96 | 4,250 | ||||||
| Exact Sciences Corp.* | 361 | 4,220 | ||||||
| Atrion Corp. | 14 | 4,148 | ||||||
| ICU Medical, Inc.* | 64 | 4,077 | ||||||
| MannKind Corp.* | 765 | 3,986 | ||||||
| Raptor Pharmaceutical Corp.* | 304 | 3,958 | ||||||
| Computer Programs & Systems, Inc. | 62 | 3,832 | ||||||
| 116 | THE RYDEX FUNDS ANNUAL REPORT | SEE NOTES TO FINANCIAL STATEMENTS. |
| SCHEDULE OF INVESTMENTS (continued) | December 31, 2013 |
| RUSSELL 2000® 1.5x STRATEGY FUND |
| Shares | Value | |||||||
| Luminex Corp.* | 195 | $ | 3,783 | |||||
| Cardiovascular Systems, Inc.* | 110 | 3,772 | ||||||
| Invacare Corp. | 162 | 3,760 | ||||||
| MiMedx Group, Inc.* | 430 | 3,758 | ||||||
| HealthStream, Inc.* | 108 | 3,539 | ||||||
| Natus Medical, Inc.* | 157 | 3,533 | ||||||
| AMN Healthcare Services, Inc.* | 236 | 3,469 | ||||||
| Sarepta Therapeutics, Inc.* | 170 | 3,463 | ||||||
| Infinity Pharmaceuticals, Inc.* | 249 | 3,439 | ||||||
| Capital Senior Living Corp.* | 143 | 3,431 | ||||||
| Merit Medical Systems, Inc.* | 215 | 3,384 | ||||||
| Emergent Biosolutions, Inc.* | 147 | 3,380 | ||||||
| Lannett Company, Inc.* | 100 | 3,310 | ||||||
| Accuray, Inc.* | 378 | 3,292 | ||||||
| PharMerica Corp.* | 152 | 3,268 | ||||||
| Bio-Reference Labs, Inc.* | 126 | 3,218 | ||||||
| Neurocrine Biosciences, Inc.* | 342 | 3,194 | ||||||
| Geron Corp.* | 671 | 3,181 | ||||||
| Idenix Pharmaceuticals, Inc.* | 520 | 3,110 | ||||||
| Affymetrix, Inc.* | 362 | 3,102 | ||||||
| NxStage Medical, Inc.* | 309 | 3,090 | ||||||
| Insmed, Inc.* | 180 | 3,062 | ||||||
| Depomed, Inc.* | 288 | 3,047 | ||||||
| Array BioPharma, Inc.* | 607 | 3,041 | ||||||
| National Healthcare Corp. | 56 | 3,019 | ||||||
| Staar Surgical Co.* | 185 | 2,995 | ||||||
| Spectrum Pharmaceuticals, Inc.* | 330 | 2,921 | ||||||
| Select Medical Holdings Corp. | 250 | 2,903 | ||||||
| Corvel Corp.* | 62 | 2,895 | ||||||
| Cadence Pharmaceuticals, Inc.* | 314 | 2,842 | ||||||
| Landauer, Inc. | 54 | 2,841 | ||||||
| Hi-Tech Pharmacal Company, Inc.* | 65 | 2,820 | ||||||
| Healthways, Inc.* | 182 | 2,794 | ||||||
| Accretive Health, Inc.* | 303 | 2,775 | ||||||
| Cambrex Corp.* | 155 | 2,764 | ||||||
| Orexigen Therapeutics, Inc.* | 485 | 2,731 | ||||||
| Cynosure, Inc. — Class A* | 101 | 2,695 | ||||||
| AMAG Pharmaceuticals, Inc.* | 110 | 2,670 | ||||||
| Merrimack Pharmaceuticals, Inc.* | 494 | 2,638 | ||||||
| Antares Pharma, Inc.* | 584 | 2,616 | ||||||
| Galena Biopharma, Inc.* | 527 | 2,614 | ||||||
| Tornier N.V.* | 139 | 2,612 | ||||||
| AVANIR Pharmaceuticals, Inc. — Class A* | 753 | 2,530 | ||||||
| Genomic Health, Inc.* | 86 | 2,517 | ||||||
| Triple-S Management Corp. — Class B* | 129 | 2,508 | ||||||
| Sagent Pharmaceuticals, Inc.* | 97 | 2,462 | ||||||
| Dendreon Corp.*,1 | 811 | 2,425 | ||||||
| GenMark Diagnostics, Inc.* | 180 | 2,396 | ||||||
| Intercept Pharmaceuticals, Inc.* | 35 | 2,390 | ||||||
| XOMA Corp.* | 355 | 2,389 | ||||||
| Cerus Corp.* | 365 | 2,354 | ||||||
| Synergy Pharmaceuticals, Inc.* | 418 | 2,353 | ||||||
| Orthofix International N.V.* | 102 | 2,328 | ||||||
| Amedisys, Inc.* | 158 | 2,312 | ||||||
| TherapeuticsMD, Inc.* | 440 | 2,292 | ||||||
| Anika Therapeutics, Inc.* | 60 | 2,290 | ||||||
| Anacor Pharmaceuticals, Inc.* | 136 | 2,282 | ||||||
| BioScrip, Inc.* | 304 | 2,250 | ||||||
| Unilife Corp.* | 502 | 2,209 | ||||||
| AngioDynamics, Inc.* | 127 | 2,183 | ||||||
| Repros Therapeutics, Inc.* | 119 | 2,178 | ||||||
| KYTHERA Biopharmaceuticals, Inc.* | 58 | 2,161 | ||||||
| Repligen Corp.* | 157 | 2,141 | ||||||
| US Physical Therapy, Inc. | 60 | 2,116 | ||||||
| Vanda Pharmaceuticals, Inc.* | 170 | 2,110 | ||||||
| Lexicon Pharmaceuticals, Inc.* | 1,168 | 2,102 | ||||||
| Rockwell Medical, Inc.* | 201 | 2,098 | ||||||
| Horizon Pharma, Inc.* | 273 | 2,080 | ||||||
| TESARO, Inc.* | 73 | 2,062 | ||||||
| Gentiva Health Services, Inc.* | 166 | 2,060 | ||||||
| NewLink Genetics Corp.* | 92 | 2,025 | ||||||
| AtriCure, Inc.* | 106 | 1,980 | ||||||
| Vascular Solutions, Inc.* | 84 | 1,945 | ||||||
| Prothena Corporation plc* | 73 | 1,936 | ||||||
| Symmetry Medical, Inc.* | 192 | 1,935 | ||||||
| Dynavax Technologies Corp.* | 942 | 1,846 | ||||||
| Zeltiq Aesthetics, Inc.* | 96 | 1,815 | ||||||
| OraSure Technologies, Inc.* | 285 | 1,793 | ||||||
| Omeros Corp.* | 155 | 1,750 | ||||||
| Immunomedics, Inc.* | 377 | 1,734 | ||||||
| SurModics, Inc.* | 71 | 1,732 | ||||||
| Achillion Pharmaceuticals, Inc.* | 499 | 1,657 | ||||||
| Vocera Communications, Inc.* | 106 | 1,655 | ||||||
| Furiex Pharmaceuticals, Inc.* | 39 | 1,638 | ||||||
| Endocyte, Inc.* | 153 | 1,636 | ||||||
| Progenics Pharmaceuticals, Inc.* | 304 | 1,620 | ||||||
| CryoLife, Inc. | 142 | 1,575 | ||||||
| Chelsea Therapeutics International Ltd.* | 350 | 1,551 | ||||||
| Portola Pharmaceuticals, Inc.* | 60 | 1,545 | ||||||
| ZIOPHARM Oncology, Inc.* | 350 | 1,519 | ||||||
| Providence Service Corp.* | 58 | 1,492 | ||||||
| AcelRx Pharmaceuticals, Inc.* | 130 | 1,470 | ||||||
| Universal American Corp. | 199 | 1,453 | ||||||
| LHC Group, Inc.* | 60 | 1,442 | ||||||
| Intrexon Corp.* | 60 | 1,428 | ||||||
| TearLab Corp.* | 150 | 1,401 | ||||||
| SciClone Pharmaceuticals, Inc.* | 277 | 1,396 | ||||||
| Almost Family, Inc.* | 43 | 1,390 | ||||||
| Sequenom, Inc.* | 593 | 1,388 | ||||||
| Osiris Therapeutics, Inc.* | 86 | 1,383 | ||||||
| Cross Country Healthcare, Inc.* | 136 | 1,357 | ||||||
| XenoPort, Inc.* | 227 | 1,305 | ||||||
| Rigel Pharmaceuticals, Inc.* | 449 | 1,280 | ||||||
| Pacific Biosciences of California, Inc.* | 244 | 1,276 | ||||||
| Navidea Biopharmaceuticals, Inc.* | 615 | 1,273 | ||||||
| Zogenix, Inc.* | 368 | 1,266 | ||||||
| Cempra, Inc.* | 100 | 1,239 | ||||||
| Five Star Quality Care, Inc.* | 222 | 1,219 | ||||||
| Albany Molecular Research, Inc.* | 120 | 1,210 | ||||||
| Exactech, Inc.* | 50 | 1,188 | ||||||
| Curis, Inc.* | 414 | 1,167 | ||||||
| Insys Therapeutics, Inc.* | 30 | 1,161 | ||||||
| Receptos, Inc.* | 40 | 1,160 | ||||||
| Threshold Pharmaceuticals, Inc.* | 245 | 1,144 | ||||||
| SEE NOTES TO FINANCIAL STATEMENTS. | THE RYDEX FUNDS ANNUAL REPORT | 117 |
| SCHEDULE OF INVESTMENTS (continued) | December 31, 2013 |
| RUSSELL 2000® 1.5x STRATEGY FUND |
| Shares | Value | |||||||
| Pozen, Inc. | 142 | $ | 1,142 | |||||
| Ampio Pharmaceuticals, Inc.* | 159 | 1,134 | ||||||
| Cell Therapeutics, Inc.* | 578 | 1,110 | ||||||
| Utah Medical Products, Inc. | 19 | 1,086 | ||||||
| Peregrine Pharmaceuticals, Inc.* | 780 | 1,084 | ||||||
| Synta Pharmaceuticals Corp.* | 205 | 1,074 | ||||||
| Verastem, Inc.* | 94 | 1,072 | ||||||
| Solta Medical, Inc.* | 361 | 1,065 | ||||||
| RTI Surgical, Inc.* | 286 | 1,012 | ||||||
| Chindex International, Inc.* | 57 | 994 | ||||||
| National Research Corp. — Class A* | 52 | 979 | ||||||
| Hyperion Therapeutics, Inc.* | 48 | 971 | ||||||
| PhotoMedex, Inc.* | 74 | 958 | ||||||
| Agios Pharmaceuticals, Inc.* | 40 | 958 | ||||||
| Stemline Therapeutics, Inc.* | 47 | 921 | ||||||
| Durata Therapeutics, Inc.* | 72 | 921 | ||||||
| BioDelivery Sciences International, Inc.* | 156 | 919 | ||||||
| Cytokinetics, Inc.* | 140 | 910 | ||||||
| Corcept Therapeutics, Inc.* | 280 | 902 | ||||||
| Tetraphase Pharmaceuticals, Inc.* | 64 | 865 | ||||||
| PTC Therapeutics, Inc.* | 50 | 849 | ||||||
| Bluebird Bio, Inc.* | 40 | 839 | ||||||
| Cytori Therapeutics, Inc.* | 322 | 828 | ||||||
| Cutera, Inc.* | 78 | 794 | ||||||
| Derma Sciences, Inc.* | 73 | 790 | ||||||
| Sunesis Pharmaceuticals, Inc.* | 165 | 782 | ||||||
| Merge Healthcare, Inc.* | 334 | 775 | ||||||
| ChemoCentryx, Inc.* | 129 | 747 | ||||||
| Alliance HealthCare Services, Inc.* | 30 | 742 | ||||||
| Addus HomeCare Corp.* | 33 | 741 | ||||||
| Accelerate Diagnostics, Inc.* | 58 | 708 | ||||||
| Biotime, Inc.* | 194 | 698 | ||||||
| Medical Action Industries, Inc.* | 80 | 685 | ||||||
| Sucampo Pharmaceuticals, Inc. — | ||||||||
| Class A* | 72 | 677 | ||||||
| Epizyme, Inc.* | 32 | �� | 666 | |||||
| Alphatec Holdings, Inc.* | 326 | 655 | ||||||
| Arqule, Inc.* | 304 | 654 | ||||||
| Nanosphere, Inc.* | 285 | 653 | ||||||
| OncoGenex Pharmaceutical, Inc.* | 77 | 642 | ||||||
| SIGA Technologies, Inc.* | 195 | 638 | ||||||
| Harvard Bioscience, Inc.* | 135 | 635 | ||||||
| NeoGenomics, Inc.* | 173 | 626 | ||||||
| Targacept, Inc.* | 146 | 606 | ||||||
| Chimerix, Inc.* | 40 | 604 | ||||||
| OncoMed Pharmaceuticals, Inc.* | 20 | 590 | ||||||
| Aratana Therapeutics, Inc.* | 30 | 573 | ||||||
| Supernus Pharmaceuticals, Inc.* | 74 | 558 | ||||||
| Enanta Pharmaceuticals, Inc.* | 20 | 546 | ||||||
| Biolase, Inc.* | 182 | 515 | ||||||
| AVEO Pharmaceuticals, Inc.* | 270 | 497 | ||||||
| Fibrocell Science, Inc.* | 120 | 487 | ||||||
| Skilled Healthcare Group, Inc. — Class A* | 99 | 476 | ||||||
| Vical, Inc.* | 394 | 465 | ||||||
| Cornerstone Therapeutics, Inc.* | 48 | 456 | ||||||
| OvaScience, Inc.* | 48 | 439 | ||||||
| Alimera Sciences, Inc.* | 90 | 424 | ||||||
| MEI Pharma, Inc.* | 50 | 401 | ||||||
| Regulus Therapeutics, Inc.* | 53 | 392 | ||||||
| Amicus Therapeutics, Inc.* | 158 | 371 | ||||||
| Coronado Biosciences, Inc.* | 139 | 366 | ||||||
| Onconova Therapeutics, Inc.* | 30 | 344 | ||||||
| Cellular Dynamics International, Inc.* | 20 | 330 | ||||||
| TG Therapeutics, Inc.* | 80 | 312 | ||||||
| Esperion Therapeutics, Inc.* | 20 | 275 | ||||||
| KaloBios Pharmaceuticals, Inc.* | 60 | 265 | ||||||
| GTx, Inc.* | 141 | 233 | ||||||
| Pernix Therapeutics Holdings* | 91 | 229 | ||||||
| Enzon Pharmaceuticals, Inc. | 189 | 219 | ||||||
| USMD Holdings, Inc.* | 10 | 201 | ||||||
| Conatus Pharmaceuticals, Inc.* | 30 | 194 | ||||||
| Harvard Apparatus Regenerative | ||||||||
| Technology, Inc.* | 33 | 157 | ||||||
| Total Health Care | 1,125,725 | |||||||
| ENERGY - 3.7% | ||||||||
| Kodiak Oil & Gas Corp.* | 1,371 | 15,368 | ||||||
| Rosetta Resources, Inc.* | 319 | 15,324 | ||||||
| Targa Resources Corp. | 169 | 14,900 | ||||||
| SemGroup Corp. — Class A | 221 | 14,416 | ||||||
| Bristow Group, Inc. | 186 | 13,960 | ||||||
| Helix Energy Solutions Group, Inc.* | 549 | 12,725 | ||||||
| CARBO Ceramics, Inc. | 105 | 12,236 | ||||||
| Western Refining, Inc. | 278 | 11,791 | ||||||
| Energy XXI Bermuda Ltd. | 415 | 11,229 | ||||||
| Scorpio Tankers, Inc. | 951 | 11,212 | ||||||
| Exterran Holdings, Inc.* | 298 | 10,192 | ||||||
| PDC Energy, Inc.* | 188 | 10,005 | ||||||
| SEACOR Holdings, Inc.* | 108 | 9,850 | ||||||
| Carrizo Oil & Gas, Inc.* | 206 | 9,223 | ||||||
| Stone Energy Corp.* | 260 | 8,993 | ||||||
| Crosstex Energy, Inc. | 246 | 8,895 | ||||||
| Alpha Natural Resources, Inc.* | 1,139 | 8,132 | ||||||
| Bonanza Creek Energy, Inc.* | 155 | 6,738 | ||||||
| Bill Barrett Corp.* | 249 | 6,668 | ||||||
| Delek US Holdings, Inc. | 190 | 6,538 | ||||||
| Magnum Hunter Resources Corp.* | 882 | 6,447 | ||||||
| Gulfmark Offshore, Inc. — Class A | 136 | 6,410 | ||||||
| Key Energy Services, Inc.* | 788 | 6,225 | ||||||
| Geospace Technologies Corp.* | 64 | 6,069 | ||||||
| Forum Energy Technologies, Inc.* | 209 | 5,906 | ||||||
| Diamondback Energy, Inc.* | 111 | 5,867 | ||||||
| Cloud Peak Energy, Inc.* | 317 | 5,706 | ||||||
| Matador Resources Co.* | 297 | 5,536 | ||||||
| C&J Energy Services, Inc.* | 237 | 5,475 | ||||||
| Newpark Resources, Inc.* | 440 | 5,408 | ||||||
| Hercules Offshore, Inc.* | 828 | 5,408 | ||||||
| Parker Drilling Co.* | 617 | 5,016 | ||||||
| TETRA Technologies, Inc.* | 401 | 4,956 | ||||||
| Arch Coal, Inc. | 1,097 | 4,882 | ||||||
| Northern Oil and Gas, Inc.* | 323 | 4,868 | ||||||
| Ship Finance International Ltd. | 291 | 4,767 | ||||||
| Sanchez Energy Corp.* | 192 | 4,706 | ||||||
| Rex Energy Corp.* | 237 | 4,671 | ||||||
| Halcon Resources Corp.*,1 | 1,194 | 4,609 | ||||||
| 118 | THE RYDEX FUNDS ANNUAL REPORT | SEE NOTES TO FINANCIAL STATEMENTS. |
| SCHEDULE OF INVESTMENTS (continued) | December 31, 2013 |
| RUSSELL 2000® 1.5x STRATEGY FUND |
| Shares | Value | |||||||
| Comstock Resources, Inc. | 251 | $ | 4,591 | |||||
| Clean Energy Fuels Corp.* | 351 | 4,521 | ||||||
| EPL Oil & Gas, Inc.* | 157 | 4,475 | ||||||
| EXCO Resources, Inc. | 698 | 3,706 | ||||||
| Contango Oil & Gas Co.* | 77 | 3,639 | ||||||
| Clayton Williams Energy, Inc.* | 42 | 3,442 | ||||||
| Matrix Service Co.* | 140 | 3,426 | ||||||
| Approach Resources, Inc.* | 177 | 3,414 | ||||||
| Era Group, Inc.* | 108 | 3,333 | ||||||
| Nordic American Tankers Ltd. | 343 | 3,327 | ||||||
| RigNet, Inc.* | 68 | 3,259 | ||||||
| Resolute Energy Corp.* | 353 | 3,188 | ||||||
| PHI, Inc.* | 72 | 3,125 | ||||||
| Swift Energy Co.* | 231 | 3,119 | ||||||
| Tesco Corp.* | 151 | 2,987 | ||||||
| Triangle Petroleum Corp.* | 346 | 2,879 | ||||||
| W&T Offshore, Inc. | 178 | 2,848 | ||||||
| Goodrich Petroleum Corp.* | 163 | 2,774 | ||||||
| Athlon Energy, Inc.* | 90 | 2,723 | ||||||
| Solazyme, Inc.* | 243 | 2,646 | ||||||
| Penn Virginia Corp.* | 280 | 2,640 | ||||||
| Pioneer Energy Services Corp.* | 324 | 2,595 | ||||||
| Green Plains Renewable Energy, Inc. | 132 | 2,559 | ||||||
| Basic Energy Services, Inc.* | 154 | 2,430 | ||||||
| Synergy Resources Corp.* | 257 | 2,380 | ||||||
| ION Geophysical Corp.* | 685 | 2,261 | ||||||
| GasLog Ltd. | 131 | 2,239 | ||||||
| Emerald Oil, Inc.* | 292 | 2,237 | ||||||
| Forest Oil Corp.* | 612 | 2,209 | ||||||
| Vaalco Energy, Inc.* | 300 | 2,067 | ||||||
| Rentech, Inc.* | 1,167 | 2,042 | ||||||
| Quicksilver Resources, Inc.* | 644 | 1,977 | ||||||
| Alon USA Energy, Inc. | 119 | 1,968 | ||||||
| Gastar Exploration, Inc.* | 284 | 1,965 | ||||||
| Willbros Group, Inc.* | 203 | 1,912 | ||||||
| Vantage Drilling Co.* | 1,036 | 1,906 | ||||||
| Gulf Island Fabrication, Inc. | 78 | 1,811 | ||||||
| Natural Gas Services Group, Inc.* | 61 | 1,682 | ||||||
| Knightsbridge Tankers Ltd. | 156 | 1,434 | ||||||
| Abraxas Petroleum Corp.* | 425 | 1,394 | ||||||
| Callon Petroleum Co.* | 210 | 1,371 | ||||||
| Renewable Energy Group, Inc.* | 118 | 1,352 | ||||||
| Dawson Geophysical Co.* | 39 | 1,319 | ||||||
| Endeavour International Corp.* | 246 | 1,292 | ||||||
| PetroQuest Energy, Inc.* | 293 | 1,266 | ||||||
| Mitcham Industries, Inc.* | 71 | 1,257 | ||||||
| Westmoreland Coal Co.* | 65 | 1,254 | ||||||
| REX American Resources Corp.* | 28 | 1,252 | ||||||
| Teekay Tankers Ltd. — Class A | 317 | 1,246 | ||||||
| Warren Resources, Inc.* | 375 | 1,178 | ||||||
| Bolt Technology Corp. | 52 | 1,145 | ||||||
| Midstates Petroleum Company, Inc.* | 170 | 1,125 | ||||||
| Miller Energy Resources, Inc.* | 159 | 1,119 | ||||||
| Evolution Petroleum Corp. | 90 | 1,111 | ||||||
| BPZ Resources, Inc.* | 608 | 1,107 | ||||||
| Panhandle Oil and Gas, Inc. — Class A | 32 | 1,069 | ||||||
| FX Energy, Inc.* | 280 | 1,025 | ||||||
| Cal Dive International, Inc.* | 507 | 1,019 | ||||||
| Equal Energy Ltd. | 190 | 1,015 | ||||||
| Frontline Ltd.* | 270 | 1,010 | ||||||
| Adams Resources & Energy, Inc. | 14 | 959 | ||||||
| Uranium Energy Corp.* | 446 | 892 | ||||||
| Jones Energy, Inc. — Class A* | 60 | 869 | ||||||
| Ur-Energy, Inc.* | 620 | 856 | ||||||
| Apco Oil and Gas International, Inc.* | 54 | 842 | ||||||
| Amyris, Inc.* | 131 | 693 | ||||||
| TGC Industries, Inc. | 83 | 606 | ||||||
| Isramco, Inc.* | 4 | 508 | ||||||
| KiOR, Inc. — Class A* | 231 | 388 | ||||||
| Hallador Energy Co. | 42 | 339 | ||||||
| L&L Energy, Inc.*,†† | 158 | 265 | ||||||
| Global Geophysical Services, Inc.* | 125 | 201 | ||||||
| ZaZa Energy Corp.* | 191 | 183 | ||||||
| Total Energy | 461,590 | |||||||
| MATERIALS - 3.4% | ||||||||
| PolyOne Corp. | 515 | 18,206 | ||||||
| Axiall Corp. | 356 | 16,889 | ||||||
| Chemtura Corp.* | 507 | 14,156 | ||||||
| HB Fuller Co. | 264 | 13,739 | ||||||
| Louisiana-Pacific Corp.* | 725 | 13,420 | ||||||
| Sensient Technologies Corp. | 261 | 12,664 | ||||||
| Commercial Metals Co. | 603 | 12,259 | ||||||
| Olin Corp. | 413 | 11,914 | ||||||
| KapStone Paper and Packaging Corp.* | 210 | 11,732 | ||||||
| Worthington Industries, Inc. | 271 | 11,404 | ||||||
| Minerals Technologies, Inc. | 177 | 10,632 | ||||||
| Graphic Packaging Holding Co.* | 1,089 | 10,455 | ||||||
| Balchem Corp. | 152 | 8,922 | ||||||
| SunCoke Energy, Inc.* | 356 | 8,120 | ||||||
| Schweitzer-Mauduit International, Inc. | 157 | 8,081 | ||||||
| Texas Industries, Inc.* | 112 | 7,704 | ||||||
| Stillwater Mining Co.* | 616 | 7,602 | ||||||
| Kaiser Aluminum Corp. | 102 | 7,165 | ||||||
| Berry Plastics Group, Inc.* | 285 | 6,780 | ||||||
| Stepan Co. | 102 | 6,694 | ||||||
| PH Glatfelter Co. | 227 | 6,274 | ||||||
| Clearwater Paper Corp.* | 116 | 6,090 | ||||||
| Globe Specialty Metals, Inc. | 331 | 5,961 | ||||||
| OM Group, Inc.* | 162 | 5,898 | ||||||
| AK Steel Holding Corp.* | 708 | 5,806 | ||||||
| Calgon Carbon Corp.* | 277 | 5,698 | ||||||
| Resolute Forest Products, Inc.* | 355 | 5,687 | ||||||
| Innophos Holdings, Inc. | 117 | 5,686 | ||||||
| Coeur Mining, Inc.* | 524 | 5,685 | ||||||
| Innospec, Inc. | 122 | 5,639 | ||||||
| A. Schulman, Inc. | 159 | 5,606 | ||||||
| RTI International Metals, Inc.* | 160 | 5,474 | ||||||
| Walter Energy, Inc. | 320 | 5,322 | ||||||
| Hecla Mining Co. | 1,713 | 5,276 | ||||||
| AMCOL International Corp. | 147 | 4,995 | ||||||
| Flotek Industries, Inc.* | 246 | 4,937 | ||||||
| Quaker Chemical Corp. | 64 | 4,932 | ||||||
| Ferro Corp.* | 374 | 4,798 | ||||||
| Koppers Holdings, Inc. | 103 | 4,712 | ||||||
| Schnitzer Steel Industries, Inc. — Class A | 137 | 4,476 | ||||||
| SEE NOTES TO FINANCIAL STATEMENTS. | THE RYDEX FUNDS ANNUAL REPORT | 119 |
| SCHEDULE OF INVESTMENTS (continued) | December 31, 2013 |
| RUSSELL 2000® 1.5x STRATEGY FUND |
| Shares | Value | |||||||
| Intrepid Potash, Inc.* | 280 | $ | 4,436 | |||||
| Molycorp, Inc.* | 760 | 4,271 | ||||||
| Deltic Timber Corp. | 62 | 4,212 | ||||||
| LSB Industries, Inc.* | 94 | 3,856 | ||||||
| Kraton Performance Polymers, Inc.* | 167 | 3,849 | ||||||
| US Silica Holdings, Inc. | 111 | 3,786 | ||||||
| Headwaters, Inc.* | 380 | 3,720 | ||||||
| Horsehead Holding Corp.* | 229 | 3,712 | ||||||
| Tredegar Corp. | 127 | 3,659 | ||||||
| Haynes International, Inc. | 63 | 3,480 | ||||||
| American Vanguard Corp. | 143 | 3,473 | ||||||
| Neenah Paper, Inc. | 81 | 3,464 | ||||||
| Wausau Paper Corp. | 258 | 3,271 | ||||||
| Myers Industries, Inc. | 149 | 3,147 | ||||||
| Materion Corp. | 101 | 3,116 | ||||||
| Advanced Emissions Solutions, Inc.* | 53 | 2,874 | ||||||
| Century Aluminum Co.* | 264 | 2,761 | ||||||
| Zoltek Companies, Inc.* | 143 | 2,395 | ||||||
| OMNOVA Solutions, Inc.* | 242 | 2,205 | ||||||
| Zep, Inc. | 120 | 2,179 | ||||||
| Hawkins, Inc. | 53 | 1,971 | ||||||
| Allied Nevada Gold Corp.* | 530 | 1,881 | ||||||
| FutureFuel Corp. | 115 | 1,817 | ||||||
| Boise Cascade Co.* | 60 | 1,769 | ||||||
| Taminco Corp.* | 84 | 1,698 | ||||||
| US Concrete, Inc.* | 75 | 1,697 | ||||||
| Landec Corp.* | 139 | 1,685 | ||||||
| Universal Stainless & Alloy Products, Inc.* | 41 | 1,478 | ||||||
| AM Castle & Co.* | 94 | 1,388 | ||||||
| Olympic Steel, Inc. | 47 | 1,362 | ||||||
| Arabian American Development Co.* | 105 | 1,318 | ||||||
| American Pacific Corp.* | 32 | 1,192 | ||||||
| Chase Corp. | 32 | 1,130 | ||||||
| AEP Industries, Inc.* | 18 | 951 | ||||||
| KMG Chemicals, Inc. | 48 | 811 | ||||||
| Gold Resource Corp. | 171 | 775 | ||||||
| UFP Technologies, Inc.* | 29 | 731 | ||||||
| Handy & Harman Ltd.* | 28 | 678 | ||||||
| Paramount Gold and Silver Corp.* | 717 | 668 | ||||||
| Penford Corp.* | 50 | 643 | ||||||
| Noranda Aluminum Holding Corp. | 177 | 582 | ||||||
| Marrone Bio Innovations, Inc.* | 30 | 533 | ||||||
| Midway Gold Corp.* | 575 | 466 | ||||||
| United States Lime & Minerals, Inc.* | 7 | 428 | ||||||
| General Moly, Inc.* | 297 | 398 | ||||||
| GSE Holding, Inc.* | 44 | 91 | ||||||
| Total Materials | 423,497 | |||||||
| CONSUMER STAPLES - 2.6% | ||||||||
| United Natural Foods, Inc.* | 255 | 19,224 | ||||||
| Rite Aid Corp.* | 3,770 | 19,076 | ||||||
| Hain Celestial Group, Inc.* | 198 | 17,975 | ||||||
| Casey’s General Stores, Inc. | 196 | 13,769 | ||||||
| Darling International, Inc.* | 613 | 12,799 | ||||||
| Harris Teeter Supermarkets, Inc. | 256 | 12,634 | ||||||
| TreeHouse Foods, Inc.* | 183 | 12,613 | ||||||
| PriceSmart, Inc. | 102 | 11,785 | ||||||
| Boston Beer Company, Inc. — Class A* | 44 | 10,638 | ||||||
| B&G Foods, Inc. — Class A | 271 | 9,190 | ||||||
| Andersons, Inc. | 100 | 8,917 | ||||||
| Sanderson Farms, Inc. | 116 | 8,390 | ||||||
| Post Holdings, Inc.* | 167 | 8,228 | ||||||
| Lancaster Colony Corp. | 93 | 8,198 | ||||||
| Spectrum Brands Holdings, Inc. | 110 | 7,760 | ||||||
| SUPERVALU, Inc.* | 1,041 | 7,589 | ||||||
| Snyders-Lance, Inc. | 246 | 7,065 | ||||||
| J&J Snack Foods Corp. | 77 | 6,821 | ||||||
| Universal Corp. | 121 | 6,606 | ||||||
| Susser Holdings Corp.* | 98 | 6,418 | ||||||
| WD-40 Co. | 81 | 6,049 | ||||||
| Fresh Del Monte Produce, Inc. | 192 | 5,434 | ||||||
| Vector Group Ltd. | 324 | 5,304 | ||||||
| Pilgrim’s Pride Corp.* | 318 | 5,168 | ||||||
| Boulder Brands, Inc.* | 304 | 4,821 | ||||||
| Elizabeth Arden, Inc.* | 135 | 4,786 | ||||||
| Cal-Maine Foods, Inc. | 79 | 4,758 | ||||||
| Spartan Stores, Inc. | 193 | 4,696 | ||||||
| Tootsie Roll Industries, Inc. | 103 | 3,352 | ||||||
| Annie’s, Inc.* | 74 | 3,185 | ||||||
| Inter Parfums, Inc. | 85 | 3,044 | ||||||
| Weis Markets, Inc. | 57 | 2,996 | ||||||
| Diamond Foods, Inc.* | 115 | 2,972 | ||||||
| Chiquita Brands International, Inc.* | 237 | 2,773 | ||||||
| Chefs’ Warehouse, Inc.* | 87 | 2,537 | ||||||
| USANA Health Sciences, Inc.* | 33 | 2,494 | ||||||
| Coca-Cola Bottling Company Consolidated | 31 | 2,268 | ||||||
| Harbinger Group, Inc.* | 171 | 2,026 | ||||||
| Calavo Growers, Inc. | 66 | 1,997 | ||||||
| Pantry, Inc.* | 118 | 1,980 | ||||||
| Natural Grocers by Vitamin Cottage, Inc.* | 46 | 1,953 | ||||||
| Medifast, Inc.* | 72 | 1,881 | ||||||
| Ingles Markets, Inc. — Class A | 65 | 1,762 | ||||||
| Fairway Group Holdings Corp.* | 84 | 1,522 | ||||||
| Limoneira Co. | 56 | 1,489 | ||||||
| Central Garden and Pet Co. — Class A* | 218 | 1,472 | ||||||
| Alliance One International, Inc.* | 453 | 1,382 | ||||||
| Revlon, Inc. — Class A* | 54 | 1,348 | ||||||
| Seneca Foods Corp. — Class A* | 42 | 1,339 | ||||||
| Omega Protein Corp.* | 106 | 1,303 | ||||||
| Roundy’s, Inc. | 129 | 1,272 | ||||||
| Arden Group, Inc. — Class A | 10 | 1,265 | ||||||
| Nuverra Environmental Solutions, Inc.* | 75 | 1,258 | ||||||
| National Beverage Corp.* | 62 | 1,250 | ||||||
| Nutraceutical International Corp.* | 44 | 1,178 | ||||||
| Orchids Paper Products Co. | 33 | 1,084 | ||||||
| John B Sanfilippo & Son, Inc. | 43 | 1,061 | ||||||
| Nature’s Sunshine Products, Inc. | 60 | 1,039 | ||||||
| Inventure Foods, Inc.* | 77 | 1,021 | ||||||
| Craft Brew Alliance, Inc.* | 61 | 1,002 | ||||||
| Star Scientific, Inc.*,1 | 857 | 994 | ||||||
| Oil-Dri Corporation of America | 26 | 984 | ||||||
| Farmer Bros Co.* | 42 | 977 | ||||||
| Lifevantage Corp.* | 586 | 967 | ||||||
| Female Health Co. | 110 | 935 | ||||||
| Village Super Market, Inc. — Class A | 30 | 930 | ||||||
| Synutra International, Inc.* | 89 | 790 | ||||||
| 120 | THE RYDEX FUNDS ANNUAL REPORT | SEE NOTES TO FINANCIAL STATEMENTS. |
| SCHEDULE OF INVESTMENTS (continued) | December 31, 2013 |
| RUSSELL 2000® 1.5x STRATEGY FUND |
| Shares | Value | |||||||
| Alico, Inc. | 19 | $ | 739 | |||||
| Griffin Land & Nurseries, Inc. | 17 | 567 | ||||||
| Lifeway Foods, Inc. | 24 | 384 | ||||||
| Total Consumer Staples | 323,483 | |||||||
| UTILITIES - 2.1% | ||||||||
| Cleco Corp. | 313 | 14,592 | ||||||
| IDACORP, Inc. | 263 | 13,634 | ||||||
| Southwest Gas Corp. | 243 | 13,586 | ||||||
| UNS Energy Corp. | 216 | 12,928 | ||||||
| Piedmont Natural Gas Company, Inc. | 386 | 12,800 | ||||||
| Black Hills Corp. | 232 | 12,182 | ||||||
| Portland General Electric Co. | 387 | 11,687 | ||||||
| UIL Holdings Corp. | 295 | 11,431 | ||||||
| Dynegy, Inc.* | 514 | 11,062 | ||||||
| WGL Holdings, Inc. | 265 | 10,616 | ||||||
| ALLETE, Inc. | 210 | 10,475 | ||||||
| New Jersey Resources Corp. | 219 | 10,127 | ||||||
| PNM Resources, Inc. | 408 | 9,841 | ||||||
| South Jersey Industries, Inc. | 162 | 9,066 | ||||||
| Avista Corp. | 314 | 8,852 | ||||||
| NorthWestern Corp. | 197 | 8,534 | ||||||
| Laclede Group, Inc. | 173 | 7,878 | ||||||
| El Paso Electric Co. | 209 | 7,338 | ||||||
| MGE Energy, Inc. | 124 | 7,180 | ||||||
| Northwest Natural Gas Co. | 142 | 6,080 | ||||||
| American States Water Co. | 200 | 5,745 | ||||||
| California Water Service Group | 241 | 5,559 | ||||||
| Otter Tail Corp. | 188 | 5,503 | ||||||
| Empire District Electric Co. | 216 | 4,901 | ||||||
| NRG Yield, Inc. — Class A | 120 | 4,801 | ||||||
| Chesapeake Utilities Corp. | 48 | 2,881 | ||||||
| Ormat Technologies, Inc. | 96 | 2,612 | ||||||
| SJW Corp. | 82 | 2,443 | ||||||
| Atlantic Power Corp. | 617 | 2,147 | ||||||
| Unitil Corp. | 70 | 2,134 | ||||||
| Connecticut Water Service, Inc. | 56 | 1,989 | ||||||
| Middlesex Water Co. | 80 | 1,675 | ||||||
| York Water Co. | 64 | 1,340 | ||||||
| Consolidated Water Company Ltd. | 77 | 1,086 | ||||||
| Artesian Resources Corp. — Class A | 41 | 941 | ||||||
| Delta Natural Gas Company, Inc. | 40 | 895 | ||||||
| Genie Energy Ltd. — Class B* | 68 | 694 | ||||||
| Pure Cycle Corp.* | 90 | 570 | ||||||
| Total Utilities | 257,805 | |||||||
| TELECOMMUNICATION SERVICES - 0.5% | ||||||||
| Cogent Communications Group, Inc. | 242 | 9,779 | ||||||
| Leap Wireless International, Inc.* | 276 | 4,802 | ||||||
| Consolidated Communications | ||||||||
| Holdings, Inc. | 206 | 4,045 | ||||||
| Cincinnati Bell, Inc.* | 1,072 | 3,816 | ||||||
| 8x8, Inc.* | 366 | 3,719 | ||||||
| Shenandoah Telecommunications Co. | 122 | 3,132 | ||||||
| Premiere Global Services, Inc.* | 254 | 2,944 | ||||||
| Vonage Holdings Corp.* | 800 | 2,664 | ||||||
| Atlantic Tele-Network, Inc. | 43 | 2,433 | ||||||
| NII Holdings, Inc.* | 884 | 2,431 | ||||||
| inContact, Inc.* | 272 | 2,124 | ||||||
| Iridium Communications, Inc.* | 334 | 2,091 | ||||||
| Inteliquent, Inc. | 164 | 1,873 | ||||||
| General Communication, Inc. — Class A* | 158 | 1,762 | ||||||
| Lumos Networks Corp. | 83 | 1,743 | ||||||
| NTELOS Holdings Corp. | 80 | 1,618 | ||||||
| Hawaiian Telcom Holdco, Inc.* | 55 | 1,615 | ||||||
| USA Mobility, Inc. | 111 | 1,585 | ||||||
| IDT Corp. — Class B | 81 | 1,447 | ||||||
| Fairpoint Communications, Inc.* | 113 | 1,278 | ||||||
| ORBCOMM, Inc.* | 188 | 1,192 | ||||||
| magicJack VocalTec Ltd.* | 95 | 1,132 | ||||||
| Towerstream Corp.* | 341 | 1,009 | ||||||
| HickoryTech Corp. | 78 | 1,001 | ||||||
| Cbeyond, Inc.* | 137 | 945 | ||||||
| Boingo Wireless, Inc.* | 94 | 603 | ||||||
| Straight Path Communications, | ||||||||
| Inc. — Class B* | 41 | 336 | ||||||
| Total Telecommunication Services | 63,119 | |||||||
| Total Common Stocks | ||||||||
| (Cost $5,329,839) | 8,571,471 | |||||||
| WARRANTS†† - 0.0% | ||||||||
| Tejon Ranch Co. | ||||||||
| $10.50, 08/31/16*,† | 17 | 91 | ||||||
| Magnum Hunter Resources Corp. | ||||||||
| $8.50, 04/15/16* | 113 | — | ||||||
| Total Warrants | ||||||||
| (Cost $95) | 91 | |||||||
| RIGHTS†† - 0.0% | ||||||||
| Cubist Pharmaceuticals, Inc. | ||||||||
| Expires 10/15/15*,† | 319 | 431 | ||||||
| EXCO Resources Inc. | ||||||||
| Expires 01/09/14*,† | 173 | 28 | ||||||
| Omthera Pharmaceuticals, Inc. | ||||||||
| Expires 12/31/20* | 37 | 22 | ||||||
| Total Rights | ||||||||
| (Cost $608) | 481 | |||||||
| Face | ||||||||
| Amount | ||||||||
| REPURCHASE AGREEMENTS††,2 - 57.0% | ||||||||
| Credit Suisse Group | ||||||||
| issued 12/31/13 at 0.00% | ||||||||
| due 01/02/143 | $ | 2,691,574 | 2,691,574 | |||||
| Deutsche Bank | ||||||||
| issued 12/31/13 at 0.01% | ||||||||
| due 01/02/14 | 1,485,806 | 1,485,806 | ||||||
| HSBC Group | ||||||||
| issued 12/31/13 at 0.01% | ||||||||
| due 01/02/14 | 1,485,806 | 1,485,806 | ||||||
| Mizuho Financial Group, Inc. | ||||||||
| issued 12/31/13 at 0.01% | ||||||||
| due 01/02/14 | 1,479,085 | 1,479,085 | ||||||
| Total Repurchase Agreements | ||||||||
| (Cost $7,142,271) | 7,142,271 | |||||||
| SEE NOTES TO FINANCIAL STATEMENTS. | THE RYDEX FUNDS ANNUAL REPORT | 121 |
| SCHEDULE OF INVESTMENTS (concluded) | December 31, 2013 |
| RUSSELL 2000® 1.5x STRATEGY FUND |
| Face | ||||||||
| Amount | Value | |||||||
| SECURITIES LENDING COLLATERAL††,4 - 0.1% | ||||||||
| Repurchase Agreements | ||||||||
| HSBC Securities, Inc. | ||||||||
| issued 12/31/13 at 0.01% | ||||||||
| due 01/02/14 | $ | 7,792 | $ | 7,792 | ||||
| Deutsche Bank Securities, Inc. | ||||||||
| issued 12/31/13 at 0.02% | ||||||||
| due 01/02/14 | 1,148 | 1,148 | ||||||
| Total Securities Lending Collateral | ||||||||
| (Cost $8,940) | 8,940 | |||||||
| Total Investments - 125.6% | ||||||||
| (Cost $12,481,753) | $ | 15,723,254 | ||||||
| Other Assets & Liabilities, net - (25.6)% | (3,202,401 | ) | ||||||
| Total Net Assets - 100.0% | $ | 12,520,853 | ||||||
| Unrealized | ||||||||
| Contracts | Gain | |||||||
| EQUITY FUTURES CONTRACTS PURCHASED† | ||||||||
| March 2014 Russell 2000 Index | ||||||||
| Mini Futures Contracts | ||||||||
| (Aggregate Value of | ||||||||
| Contracts $232,120) | 2 | $ | 6,927 | |||||
| Units | ||||||||
| EQUITY INDEX SWAP AGREEMENTS†† | ||||||||
| Barclays Bank plc | ||||||||
| January 2014 Russell 2000 Index Swap, | ||||||||
| Terminating 01/31/145 | ||||||||
| (Notional Value $4,919,724) | 4,228 | $ | 13,389 | |||||
| Credit Suisse Capital, LLC | ||||||||
| January 2014 Russell 2000 Index Swap, | ||||||||
| Terminating 01/28/145 | ||||||||
| (Notional Value $3,900,485) | 3,352 | 4,780 | ||||||
| Goldman Sachs International | ||||||||
| January 2014 Russell 2000 Index Swap, | ||||||||
| Terminating 01/28/145 | ||||||||
| (Notional Value $1,154,146) | 992 | 2,534 | ||||||
| (Total Notional Value | ||||||||
| $9,974,355) | $ | 20,703 | ||||||
| * | Non-income producing security. |
| † | Value determined based on Level 1 inputs, unless otherwise noted — See Note 4. |
| †† | Value determined based on Level 2 inputs, unless otherwise noted — See Note 4. |
| 1 | All or portion of this security is on loan at December 31, 2013 — See Note 10. |
| 2 | Repurchase Agreements — See Note 5. |
| 3 | All or a portion of this security is pledged as equity index swap collateral at December 31, 2013. |
| 4 | Securities lending collateral — See Note 10. |
| 5 | Total Return based on Russell 2000 Index +/- financing at a variable rate. plc — Public Limited Company |
REIT — Real Estate Investment Trust
| 122 | THE RYDEX FUNDS ANNUAL REPORT | SEE NOTES TO FINANCIAL STATEMENTS. |
| RUSSELL 2000® 1.5x STRATEGY FUND |
| STATEMENT OF ASSETS |
| AND LIABILITIES |
| December 31, 2013 |
| Assets: | ||||
| Investments, at value - including $8,099 of securities loaned | ||||
| (cost $5,330,542) | $ | 8,572,043 | ||
| Repurchase agreements, at value | ||||
| (cost $7,151,211) | 7,151,211 | |||
| Total investments | ||||
| (cost $12,481,753) | 15,723,254 | |||
| Segregated cash with broker | 533,100 | |||
| Unrealized appreciation on swap agreements | 20,703 | |||
| Receivable for swap settlement | 6,175 | |||
| Receivables: | ||||
| Fund shares sold | 115,773 | |||
| Dividends | 10,600 | |||
| Securities sold | 7,438 | |||
| Variation margin | 7,435 | |||
| Interest and securities lending income | 210 | |||
| Total assets | 16,424,688 | |||
| Liabilities: | ||||
| Payable for: | ||||
| Fund shares redeemed | 3,853,936 | |||
| Management fees | 11,343 | |||
| Upon return of securities loaned | 8,940 | |||
| Transfer agent and administrative fees | 3,151 | |||
| Investor service fees | 3,151 | |||
| Portfolio accounting fees | 1,260 | |||
| Miscellaneous | 22,054 | |||
| Total liabilities | 3,903,835 | |||
| Net assets | $ | 12,520,853 | ||
| Net assets consist of: | ||||
| Paid in capital | $ | 15,011,846 | ||
| Accumulated net investment loss | (5,518 | ) | ||
| Accumulated net realized loss on investments | (5,754,606 | ) | ||
| Net unrealized appreciation on investments | 3,269,131 | |||
| Net assets | $ | 12,520,853 | ||
| Capital shares outstanding | 241,862 | |||
| Net asset value per share | $ | 51.77 |
| STATEMENT OF |
| OPERATIONS |
Year Ended December 31, 2013
| Investment Income: | ||||
| Dividends (net of foreign withholding tax of $126) | $ | 126,652 | ||
| Income from securities lending, net | 2,087 | |||
| Interest | 1,686 | |||
| Total investment income | 130,425 | |||
| Expenses: | ||||
| Management fees | 126,019 | |||
| Transfer agent and administrative fees | 35,005 | |||
| Investor service fees | 35,005 | |||
| Portfolio accounting fees | 14,002 | |||
| Professional fees | 12,502 | |||
| Custodian fees | 1,604 | |||
| Trustees’ fees* | 1,318 | |||
| Line of credit interest expense | 24 | |||
| Miscellaneous | 17,523 | |||
| Total expenses | 243,002 | |||
| Net investment loss | (112,577 | ) | ||
| Net Realized and Unrealized Gain (Loss): | ||||
| Net realized gain (loss) on: | ||||
| Investments | 507,702 | |||
| Swap agreements | 2,854,788 | |||
| Futures contracts | 288,382 | |||
| Foreign currency | 4 | |||
| Net realized gain | 3,650,876 | |||
| Net change in unrealized appreciation (depreciation) on: | ||||
| Investments | 2,183,197 | |||
| Swap agreements | (80,472 | ) | ||
| Futures contracts | 488 | |||
| Net change in unrealized appreciation (depreciation) | 2,103,213 | |||
| Net realized and unrealized gain | 5,754,089 | |||
| Net increase in net assets resulting from operations | $ | 5,641,512 |
| * | Relates to Trustees not deemed “interested persons” within the meaning of Section 2(a)(19) of the 1940 Act. |
| SEE NOTES TO FINANCIAL STATEMENTS. | THE RYDEX FUNDS ANNUAL REPORT | 123 |
| RUSSELL 2000® 1.5x STRATEGY FUND |
| STATEMENTS OF CHANGES IN NET ASSETS |
| Year ended | Year ended | |||||||
| December 31, | December 31, | |||||||
| 2013 | 2012 | |||||||
| Increase (Decrease) In Net Assets From Operations: | ||||||||
| Net investment loss | $ | (112,577 | ) | $ | (59,176 | ) | ||
| Net realized gain on investments | 3,650,876 | 360,240 | ||||||
| Net change in unrealized appreciation (depreciation) on investments | 2,103,213 | 1,134,798 | ||||||
| Net increase in net assets resulting from operations | 5,641,512 | 1,435,862 | ||||||
| Capital share transactions: | ||||||||
| Proceeds from sale of shares | 115,103,447 | 82,816,129 | ||||||
| Cost of shares redeemed | (117,544,076 | ) | (85,953,713 | ) | ||||
| Net decrease from capital share transactions | (2,440,629 | ) | (3,137,584 | ) | ||||
| Net increase (decrease) in net assets | 3,200,883 | (1,701,722 | ) | |||||
| Net assets: | ||||||||
| Beginning of year | 9,319,970 | 11,021,692 | ||||||
| End of year | $ | 12,520,853 | $ | 9,319,970 | ||||
| (Accumulated)/Undistributed net investment (loss)/gain at end of year | $ | (5,518 | ) | $ | 387 | |||
| Capital share activity: | ||||||||
| Shares sold | 2,723,884 | 2,721,601 | ||||||
| Shares redeemed | (2,767,517 | ) | (2,848,206 | ) | ||||
| Net decrease in shares | (43,633 | ) | (126,605 | ) | ||||
| 124 | THE RYDEX FUNDS ANNUAL REPORT | SEE NOTES TO FINANCIAL STATEMENTS. |
| RUSSELL 2000® 1.5x STRATEGY FUND |
| FINANCIAL HIGHLIGHTS |
This table is presented to show selected data for a share outstanding throughout each period and to assist shareholders in evaluating a Fund’s performance for the periods presented.
| Year Ended | Year Ended | Year Ended | Year Ended | Year Ended | ||||||||||||||||
| December 31, | December 31, | December 31, | December 31, | December 31, | ||||||||||||||||
| 2013 | 2012 | 2011 | 2010 | 2009 | ||||||||||||||||
| Per Share Data | ||||||||||||||||||||
| Net asset value, beginning of period | $ | 32.64 | $ | 26.75 | $ | 30.45 | $ | 22.08 | $ | 16.57 | ||||||||||
| Income (loss) from investment operations: | ||||||||||||||||||||
| Net investment lossa | (.34 | ) | (.16 | ) | (.45 | ) | (.27 | ) | (.14 | ) | ||||||||||
| Net gain (loss) on investments (realized and unrealized) | 19.47 | 6.05 | (3.25 | ) | 8.64 | 5.65 | ||||||||||||||
| Total from investment operations | 19.13 | 5.89 | (3.70 | ) | 8.37 | 5.51 | ||||||||||||||
| Net asset value, end of period | $ | 51.77 | $ | 32.64 | $ | 26.75 | $ | 30.45 | $ | 22.08 | ||||||||||
| Total Returnb | 58.56 | % | 22.10 | % | (12.18 | %) | 37.85 | % | 33.31 | % | ||||||||||
| Ratios/Supplemental Data | ||||||||||||||||||||
| Net assets, end of period (in thousands) | $ | 12,521 | $ | 9,320 | $ | 11,022 | $ | 17,286 | $ | 10,587 | ||||||||||
| Ratios to average net assets: | ||||||||||||||||||||
| Net investment loss | (0.80 | %) | (0.53 | %) | (1.49 | %) | (1.11 | %) | (0.83 | %) | ||||||||||
| Total expenses | 1.74 | % | 1.81 | % | 1.81 | % | 1.74 | % | 1.74 | % | ||||||||||
| Portfolio turnover rate | 352 | % | 361 | % | 65 | % | 249 | % | 376 | % | ||||||||||
| a | Net investment loss per share was computed using average shares outstanding throughout the period. |
| b | Total return does not reflect the impact of any additional fees charged by insurance companies. |
| SEE NOTES TO FINANCIAL STATEMENTS. | THE RYDEX FUNDS ANNUAL REPORT | 125 |
| PERFORMANCE REPORT AND FUND PROFILE (Unaudited) | December 31, 2013 |
INVERSE RUSSELL 2000® STRATEGY FUND
OBJECTIVE: Seeks to provide investment results that match, before fees and expenses, the performance of a specific benchmark on a daily basis. The Fund’s current benchmark is the inverse (opposite) of the performance of the Russell 2000® Index (the “underlying index”). The Fund does not seek to achieve its investment objective over a period of time greater than one day.
For the year ended December 31, 2013, Inverse Russell 2000® Strategy Fund maintained a daily correlation of over 99% to its benchmark of -100% of the daily price movement of the Russell 2000 Index. Inverse Russell 2000® Strategy Fund returned -30.85% while the Russell 2000 Index returned 38.82% over the same time period.
Among sectors, the biggest performance contributors to the underlying index during the period were Financials and Information Technology. No sector detracted from performance, but Telecommunications Services and Utilities contributed least.
Isis Pharmaceuticals, Inc., CoStar Group, Inc. and Alnylam Pharmaceuticals, Inc. were the largest contributors to performance of the underlying index for the year. Coeur Mining, Inc., Atlantic Power Corp. and Hecla Mining Co. were the leading detractors from performance of the underlying index for the year.
Derivatives in the Fund were used to help provide exposure to the composition of the benchmark in the highest efficient manner and not for hedging purposes.
Due to the compounding of daily returns, leveraged and inverse funds’ returns over periods other than one day will likely differ in amount and possibly direction from the benchmark return for the same period. Investors should monitor their leveraged and inverse funds’ holdings to ensure that they are consistent with their strategies, as frequently as daily.
The effects of compounding may cause the longer-term correlation of the fund to its benchmark to diminish. The apparent discrepancy between the leveraged and unleveraged indices is the result of compounding, which is described briefly on page 6 of this report.
Performance displayed represents past performance, which is no guarantee of future results.
Holdings Diversification (Market Exposure as % of Net Assets)
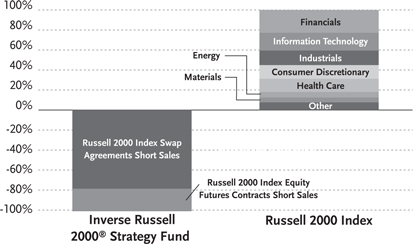
“Holdings Diversification (Market Exposure as % of Net Assets)” excludes any temporary cash investments.
Inception Date: May 3, 2004
The Fund invests principally in derivative investments such as swap agreements and futures contracts.
| 126 | THE RYDEX FUNDS ANNUAL REPORT |
| PERFORMANCE REPORT AND FUND PROFILE (Unaudited) (concluded) |
Cumulative Fund Performance*,†

Average Annual Returns
Periods Ended December 31, 2013*,†
| Since | ||||||||||||
| Inception | ||||||||||||
| 1 Year | 5 Year | (05/03/04) | ||||||||||
| Inverse Russell 2000® Strategy Fund | -30.85 | % | -23.97 | % | -13.58 | % | ||||||
| Russell 2000 Index | 38.82 | % | 20.08 | % | 9.19 | % | ||||||
| * | The performance data above represents past performance that is not predictive of future results. The investment return and principal value of an investment in the Fund will fluctuate so that an investor’s shares, when redeemed, may be worth more or less than their original cost. Returns are historical and include changes in principal and reinvested dividends and capital gains and do not reflect the effect of taxes. The Russell 2000 Index is an unmanaged index and, unlike the Fund, has no management fees or operating expenses to reduce its reported return. |
| † | Returns do not reflect the impact of any additional fees charged by insurance companies. |
| THE RYDEX FUNDS ANNUAL REPORT | 127 |
| SCHEDULE OF INVESTMENTS | December 31, 2013 |
| INVERSE RUSSELL 2000® STRATEGY FUND |
| Face | ||||||||
| Amount | Value | |||||||
| FEDERAL AGENCY DISCOUNT NOTES†† - 48.4% | ||||||||
| Federal Farm Credit Bank1 | ||||||||
| 0.03% due 01/10/14 | $ | 500,000 | $ | 499,996 | ||||
| Federal Home Loan Bank1 | ||||||||
| 0.07% due 02/21/14 | 500,000 | 499,950 | ||||||
| Total Federal Agency Discount Notes | ||||||||
| (Cost $999,946) | 999,946 | |||||||
| REPURCHASE AGREEMENTS††,2 - 45.8% | ||||||||
| Credit Suisse Group | ||||||||
| issued 12/31/13 at 0.00% | ||||||||
| due 01/02/143 | 447,252 | 447,252 | ||||||
| Deutsche Bank | ||||||||
| issued 12/31/13 at 0.01% | ||||||||
| due 01/02/14 | 166,546 | 166,546 | ||||||
| HSBC Group | ||||||||
| issued 12/31/13 at 0.01% | ||||||||
| due 01/02/14 | 166,546 | 166,546 | ||||||
| Mizuho Financial Group, Inc. | ||||||||
| issued 12/31/13 at 0.01% | ||||||||
| due 01/02/14 | 165,793 | 165,793 | ||||||
| Total Repurchase Agreements | ||||||||
| (Cost $946,137) | 946,137 | |||||||
| Total Investments - 94.2% | ||||||||
| (Cost $1,946,083) | $ | 1,946,083 | ||||||
| Other Assets & Liabilities, net - 5.8% | 119,897 | |||||||
| Total Net Assets - 100.0% | $ | 2,065,980 | ||||||
| Unrealized | ||||||||
| Contracts | Loss | |||||||
| EQUITY FUTURES CONTRACTS SOLD SHORT† | ||||||||
| March 2014 Russell 2000 Index | ||||||||
| Mini Futures Contracts | ||||||||
| (Aggregate Value of | ||||||||
| Contracts $464,240) | 4 | $ | (2,348 | ) | ||||
| Units | ||||||||
| EQUITY INDEX SWAP AGREEMENTS SOLD SHORT†† | ||||||||
| Goldman Sachs International | ||||||||
| January 2014 Russell 2000 Index Swap, | ||||||||
| Terminating 01/28/144 | ||||||||
| (Notional Value $245,318) | 211 | $ | (320 | ) | ||||
| Credit Suisse Capital, LLC | ||||||||
| January 2014 Russell 2000 Index Swap, | ||||||||
| Terminating 01/28/144 | ||||||||
| (Notional Value $777,560) | 668 | (926 | ) | |||||
| Barclays Bank plc | ||||||||
| January 2014 Russell 2000 Index Swap, | ||||||||
| Terminating 01/31/144 | ||||||||
| (Notional Value $600,156) | 516 | (1,612 | ) | |||||
| (Total Notional Value | ||||||||
| $1,623,034) | $ | (2,858 | ) | |||||
| † | Value determined based on Level 1 inputs — See Note 4. |
| †† | Value determined based on Level 2 inputs — See Note 4. |
| 1 | The issuer operates under a Congressional charter; its securities are neither issued nor guaranteed by the U.S. Government. |
| 2 | Repurchase Agreements — See Note 5. |
| 3 | All or a portion of this security is pledged as equity index swap collateral at December 31, 2013. |
| 4 | Total Return based on Russell 2000 Index +/- financing at a variable rate. plc — Public Limited Company |
| 128 | THE RYDEX FUNDS ANNUAL REPORT | SEE NOTES TO FINANCIAL STATEMENTS. |
| INVERSE RUSSELL 2000® STRATEGY FUND |
| STATEMENT OF ASSETS |
| AND LIABILITIES |
December 31, 2013
| Assets: | ||||
| Investments, at value | ||||
| (cost $999,946) | $ | 999,946 | ||
| Repurchase agreements, at value | ||||
| (cost $946,137) | 946,137 | |||
| Total investments | ||||
| (cost $1,946,083) | 1,946,083 | |||
| Segregated cash with broker | 57,200 | |||
| Receivable for swap settlement | 888 | |||
| Receivables: | ||||
| Fund shares sold | 86,901 | |||
| Total assets | 2,091,072 | |||
| Liabilities: | ||||
| Unrealized depreciation on swap agreements | 2,858 | |||
| Payable for: | ||||
| Fund shares redeemed | 12,165 | |||
| Management fees | 2,071 | |||
| Variation margin | 1,600 | |||
| Transfer agent and administrative fees | 575 | |||
| Investor service fees | 575 | |||
| Portfolio accounting fees | 230 | |||
| Miscellaneous | 5,018 | |||
| Total liabilities | 25,092 | |||
| Net assets | $ | 2,065,980 | ||
| Net assets consist of: | ||||
| Paid in capital | $ | 5,008,817 | ||
| Undistributed net investment income | — | |||
| Accumulated net realized loss on investments | (2,937,631 | ) | ||
| Net unrealized depreciation on investments | (5,206 | ) | ||
| Net assets | $ | 2,065,980 | ||
| Capital shares outstanding† | 63,495 | |||
| Net asset value per share† | $ | 32.54 |
| STATEMENT OF |
| OPERATIONS |
Year Ended December 31, 2013
| Investment Income: | ||||
| Interest | $ | 1,357 | ||
| Total investment income | 1,357 | |||
| Expenses: | ||||
| Management fees | 28,083 | |||
| Transfer agent and administrative fees | 7,801 | |||
| Investor service fees | 7,801 | |||
| Portfolio accounting fees | 3,120 | |||
| Trustees’ fees* | 373 | |||
| Custodian fees | 365 | |||
| Miscellaneous | 6,653 | |||
| Total expenses | 54,196 | |||
| Net investment loss | (52,839 | ) | ||
| Net Realized and Unrealized Gain (Loss): | ||||
| Net realized gain (loss) on: | ||||
| Swap agreements | (1,000,569 | ) | ||
| Futures contracts | (298,059 | ) | ||
| Net realized loss | (1,298,628 | ) | ||
| Net change in unrealized appreciation (depreciation) on: | ||||
| Swap agreements | 38,924 | |||
| Futures contracts | 927 | |||
| Net change in unrealized appreciation (depreciation) | 39,851 | |||
| Net realized and unrealized loss | (1,258,777 | ) | ||
| Net decrease in net assets resulting from operations | $ | (1,311,616 | ) |
| † | Reverse share split — The shares outstanding and net asset value per share have been restated to reflect a 1:3 reverse share split effective January 24, 2014. See Note 13 in Notes to Financial Statements. |
| * | Relates to Trustees not deemed “interested persons” within the meaning of Section 2(a)(19) of the 1940 Act. |
| SEE NOTES TO FINANCIAL STATEMENTS. | THE RYDEX FUNDS ANNUAL REPORT | 129 |
| INVERSE RUSSELL 2000® STRATEGY FUND |
| STATEMENTS OF CHANGES IN NET ASSETS |
| Year Ended | Year Ended | |||||||
| December 31, | December 31, | |||||||
| 2013 | 2012 | |||||||
| Increase (Decrease) In Net Assets From Operations: | ||||||||
| Net investment loss | $ | (52,839 | ) | $ | (70,428 | ) | ||
| Net realized loss on investments | (1,298,628 | ) | (982,242 | ) | ||||
| Net change in unrealized appreciation (depreciation) on investments | 39,851 | (68,900 | ) | |||||
| Net decrease in net assets resulting from operations | (1,311,616 | ) | (1,121,570 | ) | ||||
| Capital share transactions: | ||||||||
| Proceeds from sale of shares | 78,340,122 | 114,252,491 | ||||||
| Cost of shares redeemed | (78,708,662 | ) | (114,219,887 | ) | ||||
| Net increase (decrease) from capital share transactions | (368,540 | ) | 32,604 | |||||
| Net decrease in net assets | (1,680,156 | ) | (1,088,966 | ) | ||||
| Net assets: | ||||||||
| Beginning of year | 3,746,136 | 4,835,102 | ||||||
| End of year | $ | 2,065,980 | $ | 3,746,136 | ||||
| Undistributed net investment income at end of year | $ | — | $ | — | ||||
| Capital share activity:* | ||||||||
| Shares sold | 2,034,518 | 2,226,851 | ||||||
| Shares redeemed | (2,050,618 | ) | (2,231,319 | ) | ||||
| Net decrease in shares | (16,100 | ) | (4,468 | ) | ||||
| * | Reverse share split — Capital share activity for the years ended December 31, 2013 and 2012 has been restated to reflect a 1:3 reverse share split effective January 24, 2014. See Note 13 in Notes to Financial Statements. |
| 130 | THE RYDEX FUNDS ANNUAL REPORT | SEE NOTES TO FINANCIAL STATEMENTS. |
| INVERSE RUSSELL 2000® STRATEGY FUND |
| FINANCIAL HIGHLIGHTS |
This table is presented to show selected data for a share outstanding throughout each period and to assist shareholders in evaluating a Fund’s performance for the periods presented.
| Year Ended | Year Ended | Year Ended | Year Ended | Year Ended | ||||||||||||||||
| December 31, | December 31, | December 31, | December 31, | December 31, | ||||||||||||||||
| 2013c | 2012c | 2011c | 2010c | 2009c | ||||||||||||||||
| Per Share Data | ||||||||||||||||||||
| Net asset value, beginning of period | $ | 47.06 | $ | 57.52 | $ | 62.25 | $ | 86.02 | $ | 128.10 | ||||||||||
| Income (loss) from investment operations: | ||||||||||||||||||||
| Net investment lossa | (.66 | ) | (.90 | ) | (1.08 | ) | (1.23 | ) | (1.68 | ) | ||||||||||
| Net loss on investments (realized and unrealized) | (13.86 | ) | (9.56 | ) | (3.65 | ) | (22.54 | ) | (40.40 | ) | ||||||||||
| Total from investment operations | (14.52 | ) | (10.46 | ) | (4.73 | ) | (23.77 | ) | (42.08 | ) | ||||||||||
| Net asset value, end of period | $ | 32.54 | $ | 47.06 | $ | 57.52 | $ | 62.25 | $ | 86.02 | ||||||||||
| Total Returnb | (30.85 | %) | (18.15 | %) | (7.61 | %) | (27.62 | %) | (32.86 | %) | ||||||||||
| Ratios/Supplemental Data | ||||||||||||||||||||
| Net assets, end of period (in thousands) | $ | 2,066 | $ | 3,746 | $ | 4,835 | $ | 5,647 | $ | 11,433 | ||||||||||
| Ratios to average net assets: | ||||||||||||||||||||
| Net investment loss | (1.69 | %) | (1.77 | %) | (1.77 | %) | (1.58 | %) | (1.60 | %) | ||||||||||
| Total expenses | 1.74 | % | 1.88 | % | 1.82 | % | 1.73 | % | 1.73 | % | ||||||||||
| Portfolio turnover rate | — | — | — | — | — | |||||||||||||||
| a | Net investment loss per share was computed using average shares outstanding throughout the period. |
| b | Total return does not reflect the impact of any additional fees charged by insurance companies. |
| c | Reverse share split — Per share amounts for the period December 31, 2009 through December 31, 2013 have been restated to reflect a 1:3 reverse share split effective January 24, 2014. |
| SEE NOTES TO FINANCIAL STATEMENTS. | THE RYDEX FUNDS ANNUAL REPORT | 131 |
| PERFORMANCE REPORT AND FUND PROFILE (Unaudited) | December 31, 2013 |
DOW 2x STRATEGY FUND
OBJECTIVE: Seeks to provide investment results that match, before fees and expenses, the performance of a specific benchmark on a daily basis. The Fund’s current benchmark is 200% of the performance of the Dow Jones Industrial AverageSM (the “underlying index”). The Fund does not seek to achieve its investment objective over a period of time greater than one day.
For the year ended December 31, 2013, Dow 2x Strategy Fund maintained a daily correlation of over 99% to its benchmark of 200% of the daily price movement of the Dow Jones Industrial Average Index. Dow 2x Strategy Fund gained 62.70% while the Dow Jones Industrial Average Index rose 29.65% over the same time period.
Financials and Industrials contributed most to performance of the underlying index during the year. No sector detracted from return, but Telecommunications Services and Materials contributed least to performance for the year.
Visa, Inc. Class A, The Boeing Co. and Goldman Sachs Group, Inc. contributed most to performance of the underlying index for the year. None detracted from performance, but International Business Machines Corp., Caterpillar, Inc. and Cisco Systems, Inc. contributed least to performance of the underlying index for the year.
Derivatives in the Fund were used to help provide exposure to the composition of the benchmark in the highest efficient manner and to provide leverage, not for hedging purposes.
Due to the compounding of daily returns, leveraged and inverse funds’ returns over periods other than one day will likely differ in amount and possibly direction from the benchmark return for the same period. Investors should monitor their leveraged and inverse funds’ holdings to ensure that they are consistent with their strategies, as frequently as daily.
The effects of compounding may cause the longer-term correlation of the fund to its benchmark to diminish. The apparent discrepancy between the leveraged and unleveraged indices is the result of compounding, which is described briefly on page 6 of this report.
Performance displayed represents past performance, which is no guarantee of future results.
Holdings Diversification (Market Exposure as % of Net Assets)
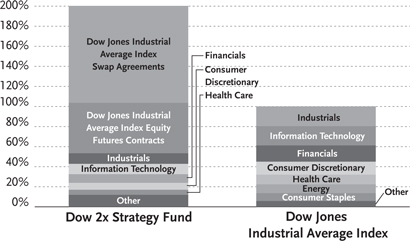
“Holdings Diversification (Market Exposure as % of Net Assets)” excludes any temporary cash investments.
Inception Date: May 3, 2004
| Ten Largest Holdings (% of Total Net Assets) | ||||
| Visa, Inc. — Class A | 4.6 | % | ||
| International Business Machines Corp. | 3.9 | % | ||
| Goldman Sachs Group, Inc. | 3.7 | % | ||
| 3M Co. | 2.9 | % | ||
| Boeing Co. | 2.8 | % | ||
| Chevron Corp. | 2.6 | % | ||
| United Technologies Corp. | 2.4 | % | ||
| Exxon Mobil Corp. | 2.1 | % | ||
| McDonald’s Corp. | 2.0 | % | ||
| Johnson & Johnson | 1.9 | % | ||
| Top Ten Total | 28.9 | % |
“Ten Largest Holdings” exclude any temporary cash or derivative investments.
| 132 | THE RYDEX FUNDS ANNUAL REPORT |
| PERFORMANCE REPORT AND FUND PROFILE (Unaudited) (concluded) |
Cumulative Fund Performance*,†
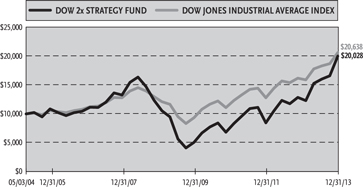
Average Annual Returns
Periods Ended December 31, 2013*,†
| Since | ||||||||||||
| Inception | ||||||||||||
| 1 Year | 5 Year | (05/03/04) | ||||||||||
| Dow 2x Strategy Fund | 62.70 | % | 28.80 | % | 7.45 | % | ||||||
| Dow Jones Industrial Average Index | 29.65 | % | 16.74 | % | 7.79 | % | ||||||
| * | The performance data above represents past performance that is not predictive of future results. The investment return and principal value of an investment in the Fund will fluctuate so that an investor’s shares, when redeemed, may be worth more or less than their original cost. Returns are historical and include changes in principal and reinvested dividends and capital gains and do not reflect the effect of taxes. The Dow Jones Industrial Average Index is an unmanaged index and, unlike the Fund, has no management fees or operating expenses to reduce its reported return. |
| † | Returns do not reflect the impact of any additional fees charged by insurance companies. |
| THE RYDEX FUNDS ANNUAL REPORT | 133 |
| SCHEDULE OF INVESTMENTS | December 31, 2013 |
| DOW 2x STRATEGY FUND |
| Shares | Value | |||||||
| COMMON STOCKS† - 53.4% | ||||||||
| INDUSTRIALS - 10.6% | ||||||||
| 3M Co. | 4,911 | $ | 688,768 | |||||
| Boeing Co. | 4,911 | 670,302 | ||||||
| United Technologies Corp. | 4,911 | 558,872 | ||||||
| Caterpillar, Inc. | 4,911 | 445,968 | ||||||
| General Electric Co. | 4,911 | 137,655 | ||||||
| Total Industrials | 2,501,565 | |||||||
| INFORMATION TECHNOLOGY - 10.3% | ||||||||
| Visa, Inc. — Class A | 4,910 | 1,093,358 | ||||||
| International Business Machines Corp. | 4,911 | 921,156 | ||||||
| Microsoft Corp. | 4,911 | 183,819 | ||||||
| Intel Corp. | 4,911 | 127,490 | ||||||
| Cisco Systems, Inc. | 4,911 | 110,252 | ||||||
| Total Information Technology | 2,436,075 | |||||||
| FINANCIALS - 8.6% | ||||||||
| Goldman Sachs Group, Inc. | 4,910 | 870,347 | ||||||
| American Express Co. | 4,911 | 445,575 | ||||||
| Travelers Companies, Inc. | 4,911 | 444,642 | ||||||
| JPMorgan Chase & Co. | 4,911 | 287,195 | ||||||
| Total Financials | 2,047,759 | |||||||
| CONSUMER DISCRETIONARY - 6.9% | ||||||||
| McDonald’s Corp. | 4,911 | 476,515 | ||||||
| Home Depot, Inc. | 4,911 | 404,372 | ||||||
| NIKE, Inc. — Class B | 4,910 | 386,122 | ||||||
| Walt Disney Co. | 4,911 | 375,200 | ||||||
| Total Consumer Discretionary | 1,642,209 | |||||||
| HEALTH CARE - 5.1% | ||||||||
| Johnson & Johnson | 4,911 | 449,798 | ||||||
| UnitedHealth Group, Inc. | 4,911 | 369,798 | ||||||
| Merck & Company, Inc. | 4,911 | 245,796 | ||||||
| Pfizer, Inc. | 4,911 | 150,424 | ||||||
| Total Health Care | 1,215,816 | |||||||
| ENERGY - 4.7% | ||||||||
| Chevron Corp. | 4,911 | 613,433 | ||||||
| Exxon Mobil Corp. | 4,911 | 496,993 | ||||||
| Total Energy | 1,110,426 | |||||||
| CONSUMER STAPLES - 4.2% | ||||||||
| Procter & Gamble Co. | 4,911 | 399,805 | ||||||
| Wal-Mart Stores, Inc. | 4,911 | 386,447 | ||||||
| Coca-Cola Co. | 4,911 | 202,873 | ||||||
| Total Consumer Staples | 989,125 | |||||||
| TELECOMMUNICATION SERVICES - 1.7% | ||||||||
| Verizon Communications, Inc. | 4,911 | 241,326 | ||||||
| AT&T, Inc. | 4,911 | 172,671 | ||||||
| Total Telecommunication Services | 413,997 | |||||||
| MATERIALS - 1.3% | ||||||||
| EI du Pont de Nemours & Co. | 4,911 | 319,068 | ||||||
| Total Common Stocks | ||||||||
| (Cost $11,086,259) | 12,676,040 | |||||||
| Face | ||||||||
| Amount | ||||||||
| REPURCHASE AGREEMENTS††,1 - 30.9% | ||||||||
| Credit Suisse Group | ||||||||
| issued 12/31/13 at 0.00% | ||||||||
| due 01/02/142 | $ | 2,820,718 | 2,820,718 | |||||
| Deutsche Bank | ||||||||
| issued 12/31/13 at 0.01% | ||||||||
| due 01/02/14 | 1,506,588 | 1,506,588 | ||||||
| HSBC Group | ||||||||
| issued 12/31/13 at 0.01% | ||||||||
| due 01/02/14 | 1,506,588 | 1,506,588 | ||||||
| Mizuho Financial Group, Inc. | ||||||||
| issued 12/31/13 at 0.01% | ||||||||
| due 01/02/14 | 1,499,772 | 1,499,772 | ||||||
| Total Repurchase Agreements | ||||||||
| (Cost $7,333,666) | 7,333,666 | |||||||
| Total Investments - 84.3% | ||||||||
| (Cost $18,419,925) | $ | 20,009,706 | ||||||
| Other Assets & Liabilities, net - 15.7% | 3,717,280 | |||||||
| Total Net Assets - 100.0% | $ | 23,726,986 | ||||||
| 134 | THE RYDEX FUNDS ANNUAL REPORT | SEE NOTES TO FINANCIAL STATEMENTS. |
| SCHEDULE OF INVESTMENTS (concluded) | December 31, 2013 |
| DOW 2x STRATEGY FUND |
| Unrealized | ||||||||
| Contracts | Gain | |||||||
| EQUITY FUTURES CONTRACTS PURCHASED† | ||||||||
| March 2014 Dow Jones | ||||||||
| Industrial Average Index | ||||||||
| Mini Futures Contracts | ||||||||
| (Aggregate Value of | ||||||||
| Contracts $11,898,000) | 144 | $ | 321,755 | |||||
| Units | ||||||||
| EQUITY INDEX SWAP AGREEMENTS†† | ||||||||
| Barclays Bank plc | ||||||||
| January 2014 Dow Jones Industrial | ||||||||
| Average Index Swap, | ||||||||
| Terminating 01/31/143 | ||||||||
| (Notional Value $15,118,172) | 912 | $ | 65,608 | |||||
| Credit Suisse Capital, LLC | ||||||||
| January 2014 Dow Jones Industrial | ||||||||
| Average Index Swap, | ||||||||
| Terminating 01/28/143 | ||||||||
| (Notional Value $7,835,514) | 473 | 45,919 | ||||||
| (Total Notional Value | ||||||||
| $22,953,686) | $ | 111,527 | ||||||
| † | Value determined based on Level 1 inputs — See Note 4. |
| †† | Value determined based on Level 2 inputs — See Note 4. |
| 1 | Repurchase Agreements — See Note 5. |
| 2 | All or a portion of this security is pledged as equity index swap collateral at December 31, 2013. |
| 3 | Total Return based on Dow Jones Industrial Average Index +/- financing at a variable rate. |
plc — Public Limited Company
| SEE NOTES TO FINANCIAL STATEMENTS. | THE RYDEX FUNDS ANNUAL REPORT | 135 |
| DOW 2x STRATEGY FUND |
| STATEMENT OF ASSETS |
| AND LIABILITIES |
December 31, 2013
| Assets: | ||||
| Investments, at value | ||||
| (cost $11,086,259) | $ | 12,676,040 | ||
| Repurchase agreements, at value | ||||
| (cost $7,333,666) | 7,333,666 | |||
| Total investments | ||||
| (cost $18,419,925) | 20,009,706 | |||
| Segregated cash with broker | 1,315,000 | |||
| Unrealized appreciation on swap agreements | 111,527 | |||
| Receivables: | ||||
| Fund shares sold | 2,299,203 | |||
| Variation margin | 37,571 | |||
| Dividends | 10,952 | |||
| Total assets | 23,783,959 | |||
| Liabilities: | ||||
| Payable for: | ||||
| Management fees | 15,290 | |||
| Fund shares redeemed | 5,042 | |||
| Transfer agent and administrative fees | 4,247 | |||
| Investor service fees | 4,247 | |||
| Portfolio accounting fees | 1,699 | |||
| Swap settlement | 98 | |||
| Miscellaneous | 26,350 | |||
| Total liabilities | 56,973 | |||
| Net assets | $ | 23,726,986 | ||
| Net assets consist of: | ||||
| Paid in capital | $ | 19,839,662 | ||
| Undistributed net investment income | — | |||
| Accumulated net realized gain on investments | 1,864,261 | |||
| Net unrealized appreciation on investments | 2,023,063 | |||
| Net assets | $ | 23,726,986 | ||
| Capital shares outstanding | 139,591 | |||
| Net asset value per share | $ | 169.97 |
| STATEMENT OF |
| OPERATIONS |
Year Ended December 31, 2013
| Investment Income: | |||
| Dividends | $ | 268,420 | |
| Interest | 2,387 | ||
| Total investment income | 270,807 | ||
| Expenses: | |||
| Management fees | 171,368 | ||
| Transfer agent and administrative fees | 47,602 | ||
| Investor service fees | 47,602 | ||
| Portfolio accounting fees | 19,040 | ||
| Professional fees | 17,098 | ||
| Custodian fees | 2,185 | ||
| Trustees’ fees* | 1,763 | ||
| Line of credit interest expense | 125 | ||
| Miscellaneous | 19,969 | ||
| Total expenses | 326,752 | ||
| Net investment loss | (55,945 | ) | |
| Net Realized and Unrealized Gain (Loss): | |||
| Net realized gain (loss) on: | |||
| Investments | 1,642,743 | ||
| Swap agreements | 5,401,728 | ||
| Futures contracts | 937,248 | ||
| Net realized gain | 7,981,719 | ||
| Net change in unrealized appreciation (depreciation) on: | |||
| Investments | 1,111,710 | ||
| Swap agreements | (134,114 | ) | |
| Futures contracts | 350,563 | ||
| Net change in unrealized appreciation (depreciation) | 1,328,159 | ||
| Net realized and unrealized gain | 9,309,878 | ||
| Net increase in net assets resulting from operations | $ | 9,253,933 |
* Relates to Trustees not deemed “interested persons” within the meaning of Section 2(a)(19) of the 1940 Act.
| 136 | THE RYDEX FUNDS ANNUAL REPORT | SEE NOTES TO FINANCIAL STATEMENTS. |
| DOW 2x STRATEGY FUND |
| STATEMENTS OF CHANGES IN NET ASSETS |
| Year Ended | Year Ended | |||||||
| December 31, | December 31, | |||||||
| 2013 | 2012 | |||||||
| Increase (Decrease) In Net Assets From Operations: | ||||||||
| Net investment loss | $ | (55,945 | ) | $ | (40,785 | ) | ||
| Net realized gain on investments | 7,981,719 | 2,941,748 | ||||||
| Net change in unrealized appreciation (depreciation) on investments | 1,328,159 | (162,995 | ) | |||||
| Net increase in net assets resulting from operations | 9,253,933 | 2,737,968 | ||||||
| Capital share transactions: | ||||||||
| Proceeds from sale of shares | 153,608,422 | 117,052,187 | ||||||
| Cost of shares redeemed | (165,753,214 | ) | (112,296,112 | ) | ||||
| Net increase (decrease) from capital share transactions | (12,144,792 | ) | 4,756,075 | |||||
| Net increase (decrease) in net assets | (2,890,859 | ) | 7,494,043 | |||||
| Net assets: | ||||||||
| Beginning of year | 26,617,845 | 19,123,802 | ||||||
| End of year | $ | 23,726,986 | $ | 26,617,845 | ||||
| Undistributed net investment income at end of year | $ | — | $ | — | ||||
| Capital share activity: | ||||||||
| Shares sold | 1,147,993 | 1,155,001 | ||||||
| Shares redeemed | (1,263,178 | ) | (1,114,651 | ) | ||||
| Net increase (decrease) in shares | (115,185 | ) | 40,350 | |||||
| SEE NOTES TO FINANCIAL STATEMENTS. | THE RYDEX FUNDS ANNUAL REPORT | 137 |
| DOW 2x STRATEGY FUND |
| FINANCIAL HIGHLIGHTS |
This table is presented to show selected data for a share outstanding throughout each period and to assist shareholders in evaluating a Fund’s performance for the periods presented.
| Year Ended | Year Ended | Year Ended | Year Ended | Year Ended | ||||||||||||||||
| December 31, | December 31, | December 31, | December 31, | December 31, | ||||||||||||||||
| 2013 | 2012 | 2011 | 2010 | 2009c | ||||||||||||||||
| Per Share Data | ||||||||||||||||||||
| Net asset value, beginning of period | $ | 104.48 | $ | 89.19 | $ | 81.76 | $ | 66.04 | $ | 48.25 | ||||||||||
| Income (loss) from investment operations: | ||||||||||||||||||||
| Net investment income (loss)a | (.40 | ) | (.29 | ) | (.14 | ) | (.04 | ) | .22 | |||||||||||
| Net gain on investments (realized and unrealized) | 65.89 | 15.58 | 7.57 | 16.25 | 17.57 | |||||||||||||||
| Total from investment operations | 65.49 | 15.29 | 7.43 | 16.21 | 17.79 | |||||||||||||||
| Less distributions from: | ||||||||||||||||||||
| Net investment income | — | — | — | (.49 | ) | — | ||||||||||||||
| Total distributions | — | — | — | (.49 | ) | — | ||||||||||||||
| Net asset value, end of period | $ | 169.97 | $ | 104.48 | $ | 89.19 | $ | 81.76 | $ | 66.04 | ||||||||||
| Total Returnb | 62.70 | % | 17.15 | % | 9.09 | % | 24.58 | % | 36.90 | % | ||||||||||
| Ratios/Supplemental Data | ||||||||||||||||||||
| Net assets, end of period (in thousands) | $ | 23,727 | $ | 26,618 | $ | 19,124 | $ | 14,642 | $ | 19,859 | ||||||||||
| Ratios to average net assets: | ||||||||||||||||||||
| Net investment income (loss) | (0.29 | %) | (0.29 | %) | (0.16 | %) | (0.05 | %) | 0.48 | % | ||||||||||
| Total expenses | 1.72 | % | 1.75 | % | 1.78 | % | 1.73 | % | 1.75 | % | ||||||||||
| Portfolio turnover rate | 518 | % | 999 | % | 587 | % | 129 | % | 80 | % | ||||||||||
| a | Net investment income (loss) per share was computed using average shares outstanding throughout the period. |
| b | Total return does not reflect the impact of any additional fees charged by insurance companies. |
| c | Reverse share split — Per share amounts for the period January 1, 2009 through April 19, 2009 have been restated to reflect a 1:5 reverse share split effective April 20, 2009. |
| 138 | THE RYDEX FUNDS ANNUAL REPORT | SEE NOTES TO FINANCIAL STATEMENTS. |
This page intentionally left blank.
| THE RYDEX FUNDS ANNUAL REPORT | 139 |
| PERFORMANCE REPORT AND FUND PROFILE (Unaudited) | December 31, 2013 |
INVERSE DOW 2x STRATEGY FUND
OBJECTIVE: Seeks to provide investment results that match, before fees and expenses, the performance of a specific benchmark on a daily basis. The Fund’s current benchmark is 200% of the inverse (opposite) of the performance of the Dow Jones Industrial AverageSM (the “underlying index”). The Fund does not seek to achieve its investment objective over a period of time greater than one day.
For the year ended December 31, 2013, Inverse Dow 2x Strategy Fund maintained a daily correlation of over 99% to its benchmark of -200% of the daily price movement of the Dow Jones Industrial Average Index. Inverse Dow 2x Strategy Fund returned -43.89% while the Dow Jones Industrial Average Index rose 29.65% over the same time period.
Financials and Industrials contributed most to performance of the underlying index during the year. No sector detracted from return, but Telecommunications Services and Materials contributed least to performance for the year.
Visa, Inc. Class A, The Boeing Co. and Goldman Sachs Group, Inc. contributed most to performance of the underlying index for the year. None detracted from performance, but International Business Machines Corp., Caterpillar, Inc. and Cisco Systems, Inc. contributed least to performance of the underlying index for the year.
Derivatives in the Fund were used to help provide exposure to the composition of the benchmark in the highest efficient manner and to provide leverage, not for hedging purposes.
Due to the compounding of daily returns, leveraged and inverse funds’ returns over periods other than one day will likely differ in amount and possibly direction from the benchmark return for the same period. Investors should monitor their leveraged and inverse funds’ holdings to ensure that they are consistent with their strategies, as frequently as daily.
The effects of compounding may cause the longer-term correlation of the fund to its benchmark to diminish. The apparent discrepancy between the leveraged and unleveraged indices is the result of compounding, which is described briefly on page 6 of this report.
Performance displayed represents past performance, which is no guarantee of future results.
Holdings Diversification (Market Exposure as % of Net Assets)

“Holdings Diversification (Market Exposure as % of Net Assets)” excludes any temporary cash investments.
Inception Date: May 3, 2004
The Fund invests principally in derivative investments such as swap agreements and futures contracts.
| 140 | THE RYDEX FUNDS ANNUAL REPORT |
| PERFORMANCE REPORT AND FUND PROFILE (Unaudited) (concluded) |
Cumulative Fund Performance*,†

Average Annual Returns
Periods Ended December 31, 2013*,†
| Since | ||||||||||||
| Inception | ||||||||||||
| 1 Year | 5 Year | (05/03/04) | ||||||||||
| Inverse Dow 2x Strategy Fund | -43.89 | % | -34.30 | % | -19.28 | % | ||||||
| Dow Jones Industrial Average Index | 29.65 | % | 16.74 | % | 7.79 | % | ||||||
| * | The performance data above represents past performance that is not predictive of future results. The investment return and principal value of an investment in the Fund will fluctuate so that an investor’s shares, when redeemed, may be worth more or less than their original cost. Returns are historical and include changes in principal and reinvested dividends and capital gains and do not reflect the effect of taxes. The Dow Jones Industrial Average Index is an unmanaged index and, unlike the Fund, has no management fees or operating expenses to reduce its reported return. |
| † | Returns do not reflect the impact of any additional fees charged by insurance companies. |
| THE RYDEX FUNDS ANNUAL REPORT | 141 |
| SCHEDULE OF INVESTMENTS | December 31, 2013 |
| INVERSE DOW 2x STRATEGY FUND |
| Face | ||||||||||||
| Amount | Value | |||||||||||
| FEDERAL AGENCY DISCOUNT NOTES†† - 58.2% | ||||||||||||
| Fannie Mae1 | ||||||||||||
| 0.07% due 01/03/14 | $ | 1,000,000 | $ | 999,999 | ||||||||
| Federal Farm Credit Bank2 | ||||||||||||
| 0.03% due 01/15/14 | 500,000 | 499,994 | ||||||||||
| Total Federal Agency Discount Notes | ||||||||||||
| (Cost $1,499,990) | 1,499,993 | |||||||||||
| REPURCHASE AGREEMENTS††,3 - 43.5% | ||||||||||||
| Credit Suisse Group | ||||||||||||
| issued 12/31/13 at 0.00% | ||||||||||||
| due 01/02/144 | 897,360 | 897,360 | ||||||||||
| Deutsche Bank | ||||||||||||
| issued 12/31/13 at 0.01% | ||||||||||||
| due 01/02/14 | 74,822 | 74,822 | ||||||||||
| HSBC Group | ||||||||||||
| issued 12/31/13 at 0.01% | ||||||||||||
| due 01/02/14 | 74,822 | 74,822 | ||||||||||
| Mizuho Financial Group, Inc. | ||||||||||||
| issued 12/31/13 at 0.01% | ||||||||||||
| due 01/02/14 | 74,483 | 74,483 | ||||||||||
| Total Repurchase Agreements | ||||||||||||
| (Cost $1,121,487) | 1,121,487 | |||||||||||
| Total Investments - 101.7% | ||||||||||||
| (Cost $2,621,477) | $ | 2,621,480 | ||||||||||
| Other Assets & Liabilities, net - (1.7)% | (44,006 | ) | ||||||||||
| Total Net Assets - 100.0% | $ | 2,577,474 | ||||||||||
| Unrealized | ||||||||
| Contracts | Loss | |||||||
| EQUITY FUTURES CONTRACTS SOLD SHORT† | ||||||||
| March 2014 Dow Jones | ||||||||
| Industrial Average Index | ||||||||
| Mini Futures Contracts | ||||||||
| (Aggregate Value of | ||||||||
| Contracts $330,500) | 4 | $ | (1,906 | ) | ||||
| Units | ||||||||||||
| EQUITY INDEX SWAP AGREEMENTS SOLD SHORT†† | ||||||||||||
| Barclays Bank plc | ||||||||||||
| January 2014 Dow Jones | ||||||||||||
| Industrial Average Index Swap, | ||||||||||||
| Terminating 01/31/145 | ||||||||||||
| (Notional Value $463,405) | 28 | $ | (2,021 | ) | ||||||||
| Credit Suisse Capital, LLC | ||||||||||||
| January 2014 Dow Jones | ||||||||||||
| Industrial Average Index Swap, | ||||||||||||
| Terminating 01/28/145 | ||||||||||||
| (Notional Value $4,389,167) | 265 | (25,722 | ) | |||||||||
| (Total Notional Value | ||||||||||||
| $4,852,572) | $ | (27,743 | ) | |||||||||
| † | Value determined based on Level 1 inputs — See Note 4. |
| †† | Value determined based on Level 2 inputs — See Note 4. |
| 1 | On September 7, 2008, the issuer was placed in conservatorship by the Federal Housing Finance Agency (FHFA). As conservator, the FHFA has full powers to control the assets and operations of the firm. |
| 2 | The issuer operates under a Congressional charter; its securities are neither issued nor guaranteed by the U.S. Government. |
| 3 | Repurchase Agreements — See Note 5. |
| 4 | All or a portion of this security is pledged as equity index swap collateral at December 31, 2013. |
| 5 | Total Return based on Dow Jones Industrial Average Index +/- financing at a variable rate. plc — Public Limited Company |
| 142 | THE RYDEX FUNDS ANNUAL REPORT | SEE NOTES TO FINANCIAL STATEMENTS. |
| INVERSE DOW 2x STRATEGY FUND |
| STATEMENT OF ASSETS |
| AND LIABILITIES |
| December 31, 2013 | ||||
| Assets: | ||||
| Investments, at value | ||||
| (cost $1,499,990) | $ | 1,499,993 | ||
| Repurchase agreements, at value | ||||
| (cost $1,121,487) | 1,121,487 | |||
| Total investments | ||||
| (cost $2,621,477) | 2,621,480 | |||
| Segregated cash with broker | 230,000 | |||
| Receivable for swap settlement | 98 | |||
| Receivables: | ||||
| Fund shares sold | 39,153 | |||
| Swap settlement | 1,112 | |||
| Total assets | 2,891,843 | |||
| Liabilities: | ||||
| Unrealized depreciation on swap agreements | 27,743 | |||
| Payable for: | ||||
| Fund shares redeemed | 267,985 | |||
| Variation margin | 4,196 | |||
| Management fees | 3,132 | |||
| Transfer agent and administrative fees | 870 | |||
| Investor service fees | 870 | |||
| Portfolio accounting fees | 348 | |||
| Miscellaneous | 9,225 | |||
| Total liabilities | 314,369 | |||
| Net assets | $ | 2,577,474 | ||
| Net assets consist of: | ||||
| Paid in capital | $ | 14,352,081 | ||
| Undistributed net investment income | — | |||
| Accumulated net realized loss on investments | (11,744,961 | ) | ||
| Net unrealized depreciation on investments | (29,646 | ) | ||
| Net assets | $ | 2,577,474 | ||
| Capital shares outstanding† | 59,173 | |||
| Net asset value per share† | $ | 43.56 |
| STATEMENT OF |
| OPERATIONS |
| Year Ended December 31, 2013 | ||||
| Investment Income: | ||||
| Interest | $ | 2,733 | ||
| Total investment income | 2,733 | |||
| Expenses: | ||||
| Management fees | 56,818 | |||
| Transfer agent and administrative fees | 15,783 | |||
| Investor service fees | 15,783 | |||
| Portfolio accounting fees | 6,313 | |||
| Professional fees | 5,611 | |||
| Trustees’ fees* | 833 | |||
| Custodian fees | 692 | |||
| Miscellaneous | 6,509 | |||
| Total expenses | 108,342 | |||
| Net investment loss | (105,609 | ) | ||
| Net Realized and Unrealized Gain (Loss): | ||||
| Net realized gain (loss) on: | ||||
| Swap agreements | (2,944,841 | ) | ||
| Futures contracts | (567,011 | ) | ||
| Net realized loss | (3,511,852 | ) | ||
| Net change in unrealized appreciation (depreciation) on: | ||||
| Investments | (189 | ) | ||
| Swap agreements | 80,630 | |||
| Futures contracts | (1,663 | ) | ||
| Net change in unrealized appreciation (depreciation) | 78,778 | |||
| Net realized and unrealized loss | (3,433,074 | ) | ||
| Net decrease in net assets resulting from operations | $ | (3,538,683 | ) | |
| † | Reverse share split — The shares outstanding and net asset value per share have been restated to reflect a 1:10 reverse share split effective January 24, 2014. See Note 13 in Notes to Financial Statements. |
| * | Relates to Trustees not deemed “interested persons” within the meaning of Section 2(a)(19) of the 1940 Act. |
| SEE NOTES TO FINANCIAL STATEMENTS. | THE RYDEX FUNDS ANNUAL REPORT | 143 |
| INVERSE DOW 2x STRATEGY FUND |
| STATEMENTS OF CHANGES IN NET ASSETS |
| Year Ended | Year Ended | |||||||||||
| December 31, | December 31, | |||||||||||
| 2013 | 2012 | |||||||||||
| Increase (Decrease) In Net Assets From Operations: | ||||||||||||
| Net investment loss | $ | (105,609 | ) | $ | (138,523 | ) | ||||||
| Net realized loss on investments | (3,511,852 | ) | (2,541,359 | ) | ||||||||
| Net change in unrealized appreciation (depreciation) on investments | 78,778 | (180,677 | ) | |||||||||
| Net decrease in net assets resulting from operations | (3,538,683 | ) | (2,860,559 | ) | ||||||||
| Capital share transactions: | ||||||||||||
| Proceeds from sale of shares | 197,472,063 | 195,117,187 | ||||||||||
| Cost of shares redeemed | (196,503,619 | ) | (194,080,487 | ) | ||||||||
| Net increase from capital share transactions | 968,444 | 1,036,700 | ||||||||||
| Net decrease in net assets | (2,570,239 | ) | (1,823,859 | ) | ||||||||
| Net assets: | ||||||||||||
| Beginning of year | 5,147,713 | 6,971,572 | ||||||||||
| End of year | $ | 2,577,474 | $ | 5,147,713 | ||||||||
| Undistributed net investment income at end of year | $ | — | $ | — | ||||||||
| Capital share activity:* | ||||||||||||
| Shares sold | 3,523,713 | 2,317,948 | ||||||||||
| Shares redeemed | (3,530,803 | ) | (2,321,276 | ) | ||||||||
| Net decrease in shares | (7,090 | ) | (3,328 | ) | ||||||||
| * | Reverse share split — Capital share activity for the years ended December 31, 2013 and 2012 has been restated to reflect a 1:10 reverse share split effective January 24, 2014. See Note 13 in Notes to Financial Statements. |
| 144 | THE RYDEX FUNDS ANNUAL REPORT | SEE NOTES TO FINANCIAL STATEMENTS. |
| INVERSE DOW 2x STRATEGY FUND |
| FINANCIAL HIGHLIGHTS |
This table is presented to show selected data for a share outstanding throughout each period and to assist shareholders in evaluating a Fund’s performance for the periods presented.
| Year Ended | Year Ended | Year Ended | Year Ended | Year Ended | ||||||||||||||||
| December 31, | December 31, | December 31, | December 31, | December 31, | ||||||||||||||||
| 2013c | 2012c | 2011c | 2010c | 2009c | ||||||||||||||||
| Per Share Data | ||||||||||||||||||||
| Net asset value, beginning of period | $ | 77.69 | $ | 100.18 | $ | 137.41 | $ | 197.08 | $ | 356.13 | ||||||||||
| Income (loss) from investment operations: | ||||||||||||||||||||
| Net investment lossa | (.94 | ) | (1.38 | ) | (2.07 | ) | (2.74 | ) | (4.68 | ) | ||||||||||
| Net loss on investments (realized and unrealized) | (33.19 | ) | (21.11 | ) | (35.16 | ) | (56.93 | ) | (154.37 | ) | ||||||||||
| Total from investment operations | (34.13 | ) | (22.49 | ) | (37.23 | ) | (59.67 | ) | (159.05 | ) | ||||||||||
| Net asset value, end of period | $ | 43.56 | $ | 77.69 | $ | 100.18 | $ | 137.41 | $ | 197.08 | ||||||||||
| Total Returnb | (43.89 | %) | (22.46 | %) | (27.07 | %) | (30.29 | %) | (44.65 | %) | ||||||||||
| Ratios/Supplemental Data | ||||||||||||||||||||
| Net assets, end of period (in thousands) | $ | 2,577 | $ | 5,148 | $ | 6,972 | $ | 15,045 | $ | 18,021 | ||||||||||
| Ratios to average net assets: | ||||||||||||||||||||
| Net investment loss | (1.67 | %) | (1.64 | %) | (1.73 | %) | (1.59 | %) | (1.61 | %) | ||||||||||
| Total expenses | 1.72 | % | 1.75 | % | 1.78 | % | 1.74 | % | 1.74 | % | ||||||||||
| Portfolio turnover rate | — | — | — | — | — | |||||||||||||||
| a | Net investment loss per share was computed using average shares outstanding throughout the period. |
| b | Total return does not reflect the impact of any additional fees charged by insurance companies. |
| c | Reverse share split — Per share amounts for the period December 31, 2009 through December 31, 2013 have been restated to reflect a 1:10 reverse share split effective January 24, 2014. |
| SEE NOTES TO FINANCIAL STATEMENTS. | THE RYDEX FUNDS ANNUAL REPORT | 145 |
| PERFORMANCE REPORT AND FUND PROFILE (Unaudited) | December 31, 2013 |
GOVERNMENT LONG BOND 1.2x STRATEGY FUND
OBJECTIVE: Seeks to provide investment results that correspond, before fees and expenses, to a benchmark for U.S. Government securities on a daily basis. The Fund’s current benchmark is 120% of the daily price movement of the Long Treasury Bond. The Long Treasury Bond is the U.S. Treasury bond with the longest maturity, which is currently 30 years. The price movement of the Long Treasury Bond is based on the daily price change of the most recently issued Long Treasury Bond. The Fund does not seek to achieve its investment objective over a period of time greater than one day.
For the year ended December 31, 2013, the Government Long Bond 1.2x Strategy Fund returned -18.25%. The daily price movement of the Long Treasury Bond was 0.46% for 2013.
The return of a comparison index, the Barclays Long U.S. treasury Index, was -12.66%.
The year 2013 will be remembered as a difficult year for long Treasury bonds.
In January, the 30-year bond opened at a yield of 3.04%. Even as warnings suggested that long interest rates would rise, yields remained range-bound for the first four months of the year, supported by Federal Reserve policy, strong demand and low inflation.
The market changed abruptly in May, however, when Federal Reserve chairman Ben Bernanke announced that the Fed may soon taper its quantitative easing policy. Investors rushed immediately to take profits and the long bond yield began to climb. Signs of a strengthening economy and recovery in the housing market pushed the 30-year yield higher during the summer until September, when the Fed did an about face and stated that it would not cut its stimulus policy for the time being.
Lower yields prevailed, through September and October, but were short-lived. Signs of improving growth made the taper program more likely and the market pushed the 30-year bond yield higher in November and December. As anticipated, the Fed finally came through with a certain plan to begin its taper program. The combination of Fed news and increasingly strong economic reports drove yields higher. On December 31, the 30-year bond closed at a high of 3.97%.
Derivatives in the Fund are used to provide additional exposure to composition of the benchmark in the highest efficient manner and to provide leverage, not for hedging purposes.
Due to the compounding of daily returns, leveraged and inverse funds’ returns over periods other than one day will likely differ in amount and possibly direction from the benchmark return for the same period. Investors should monitor their leveraged and inverse funds’ holdings to ensure that they are consistent with their strategies, as frequently as daily.
The effects of compounding may cause the longer-term correlation of the fund to its benchmark to diminish. The apparent discrepancy between the leveraged and unleveraged indices is the result of compounding, which is described briefly on page 6 of this report.
Performance displayed represents past performance, which is no guarantee of future results.
| 146 | THE RYDEX FUNDS ANNUAL REPORT |
| PERFORMANCE REPORT AND FUND PROFILE (Unaudited) (concluded) |
Holdings Diversification (Market Exposure as % of Net Assets)
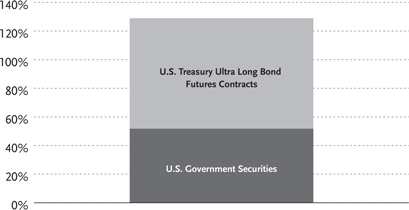
“Holdings Diversification (Market Exposure as % of Net Assets)” excludes any temporary cash investments.
Inception Date: August 18, 1997
The Fund invests principally in U.S. Government securities and derivative investments such as futures contracts.
Cumulative Fund Performance*,†
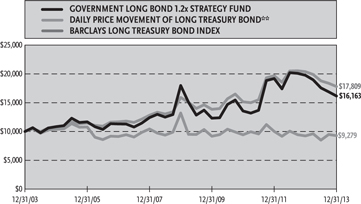
Average Annual Returns
Periods Ended December 31, 2013*,†
| 1 Year | 5 Year | 10 Year | ||||||||||
| Government Long Bond 1.2x Strategy Fund | -18.25 | % | -2.12 | % | 4.92 | % | ||||||
| Daily Price Movement of Long Treasury Bond** | 0.46 | % | -6.83 | % | -0.75 | % | ||||||
| Barclays Long Treasury Bond Index | -12.66 | % | 2.28 | % | 5.94 | % | ||||||
| * | The performance data above represents past performance that is not predictive of future results. The investment return and principal value of an investment in the Fund will fluctuate so that an investor’s shares, when redeemed, may be worth more or less than their original cost. Returns are historical and include changes in principal and reinvested dividends and capital gains and do not reflect the effect of taxes. The Barclays Long Treasury Bond Index and Daily Price Movement of Long Treasury Bond are unmanaged indices and, unlike the Fund, have no management fees or operating expenses to reduce their reported returns. |
| ** | Does not reflect any interest. |
| † | Returns do not reflect the impact of any additional fees charged by insurance companies. |
| THE RYDEX FUNDS ANNUAL REPORT | 147 |
| SCHEDULE OF INVESTMENTS | December 31, 2013 |
| GOVERNMENT LONG BOND 1.2x STRATEGY FUND |
| Face | ||||||||
| Amount | Value | |||||||
| U.S. GOVERNMENT SECURITIES† - 51.7% | ||||||||
| U.S. Treasury Bond | ||||||||
| 3.75% due 11/15/43 | $ | 5,336,000 | $ | 5,162,580 | ||||
| Total U.S. Government Securities | ||||||||
| (Cost $5,195,547) | 5,162,580 | |||||||
| FEDERAL AGENCY DISCOUNT NOTES†† - 23.0% | ||||||||
| Farmer Mac1 | ||||||||
| 0.03% due 01/02/14 | 1,000,000 | 999,999 | ||||||
| Federal Home Loan Bank1 | ||||||||
| 0.05% due 01/13/14 | 800,000 | 799,987 | ||||||
| Fannie Mae2 | ||||||||
| 0.08% due 01/02/14 | 500,000 | 500,000 | ||||||
| Total Federal Agency Discount Notes | ||||||||
| (Cost $2,299,985) | 2,299,986 | |||||||
| REPURCHASE AGREEMENTS††,3 - 24.0% | ||||||||
| Deutsche Bank | ||||||||
| issued 12/31/13 at 0.01% | ||||||||
| due 01/02/14 | 601,337 | 601,337 | ||||||
| HSBC Group | ||||||||
| issued 12/31/13 at 0.01% | ||||||||
| due 01/02/14 | 601,337 | 601,337 | ||||||
| Credit Suisse Group | ||||||||
| issued 12/31/13 at 0.00% | ||||||||
| due 01/02/14 | 601,337 | 601,337 | ||||||
| Mizuho Financial Group, Inc. | ||||||||
| issued 12/31/13 at 0.01% | ||||||||
| due 01/02/14 | 598,617 | 598,617 | ||||||
| Total Repurchase Agreements | ||||||||
| (Cost $2,402,628) | 2,402,628 | |||||||
| Total Investments - 98.7% | ||||||||
| (Cost $9,898,160) | $ | 9,865,194 | ||||||
| Other Assets & Liabilities, net - 1.3% | 128,536 | |||||||
| Total Net Assets - 100.0% | $ | 9,993,730 | ||||||
| Unrealized | ||||||||
| Contracts | Loss | |||||||
| INTEREST RATE FUTURES CONTRACTS PURCHASED† | ||||||||
| March 2014 U.S. Treasury Ultra Long Bond | ||||||||
| Futures Contracts | ||||||||
| (Aggregate Value of | ||||||||
| Contracts $7,626,500) | 56 | $ | (60,882 | ) | ||||
| † | Value determined based on Level 1 inputs — See Note 4. |
| †† | Value determined based on Level 2 inputs — See Note 4. |
| 1 | The issuer operates under a Congressional charter; its securities are neither issued nor guaranteed by the U.S. Government. |
| 2 | On September 7, 2008, the issuer was placed in conservatorship by the Federal Housing Finance Agency (FHFA). As conservator, the FHFA has full powers to control the assets and operations of the firm. |
| 3 | Repurchase Agreements — See Note 5. |
| 148 | THE RYDEX FUNDS ANNUAL REPORT | SEE NOTES TO FINANCIAL STATEMENTS. |
| GOVERNMENT LONG BOND 1.2x STRATEGY FUND |
| STATEMENT OF ASSETS |
| AND LIABILITIES |
December 31, 2013
| Assets: | ||||
| Investments, at value | ||||
| (cost $7,495,532) | $ | 7,462,566 | ||
| Repurchase agreements, at value | ||||
| (cost $2,402,628) | 2,402,628 | |||
| Total investments | ||||
| (cost $9,898,160) | 9,865,194 | |||
| Segregated cash with broker | 214,200 | |||
| Cash | 120 | |||
| Receivables: | ||||
| Interest | 25,980 | |||
| Fund shares sold | 350 | |||
| Total assets | 10,105,844 | |||
| Liabilities: | ||||
| Payable for: | ||||
| Variation margin | 49,000 | |||
| Management fees | 4,409 | |||
| Fund shares redeemed | 3,938 | |||
| Investor service fees | 2,205 | |||
| Transfer agent and administrative fees | 1,764 | |||
| Portfolio accounting fees | 881 | |||
| Miscellaneous | 49,917 | |||
| Total liabilities | 112,114 | |||
| Net assets | $ | 9,993,730 | ||
| Net assets consist of: | ||||
| Paid in capital | $ | 26,028,550 | ||
| Undistributed net investment income | 62 | |||
| Accumulated net realized loss on investments | (15,941,034 | ) | ||
| Net unrealized depreciation on investments | (93,848 | ) | ||
| Net assets | $ | 9,993,730 | ||
| Capital shares outstanding† | 294,989 | |||
| Net asset value per share† | $ | 33.88 |
| STATEMENT OF |
| OPERATIONS |
Year Ended December 31, 2013
| Investment Income: | ||||
| Interest | $ | 698,351 | ||
| Total investment income | 698,351 | |||
| Expenses: | ||||
| Management fees | 172,995 | |||
| Transfer agent and administrative fees | 69,199 | |||
| Investor service fees | 86,498 | |||
| Portfolio accounting fees | 34,599 | |||
| Professional fees | 32,654 | |||
| Trustees’ fees* | 4,814 | |||
| Custodian fees | 4,125 | |||
| Line of credit interest expense | 259 | |||
| Miscellaneous | 24,413 | |||
| Total expenses | 429,556 | |||
| Net investment income | 268,795 | |||
| Net Realized and Unrealized Gain (Loss): | ||||
| Net realized gain (loss) on: | ||||
| Investments | (7,427,389 | ) | ||
| Futures contracts | (7,150,864 | ) | ||
| Net realized loss | (14,578,253 | ) | ||
| Net change in unrealized appreciation (depreciation) on: | ||||
| Investments | (22,248 | ) | ||
| Futures contracts | (39,361 | ) | ||
| Net change in unrealized appreciation (depreciation) | (61,609 | ) | ||
| Net realized and unrealized loss | (14,639,862 | ) | ||
| Net decrease in net assets resulting from operations | $ | (14,371,067 | ) |
| † | Reverse share split — The shares outstanding and net asset value per share have been restated to reflect a 1:3 reverse share split effective January 24, 2014. See Note 13 in Notes to Financial Statements. |
| * | Relates to Trustees not deemed “interested persons” within the meaning of Section 2(a)(19) of the 1940 Act. |
| SEE NOTES TO FINANCIAL STATEMENTS. | THE RYDEX FUNDS ANNUAL REPORT | 149 |
| GOVERNMENT LONG BOND 1.2x STRATEGY FUND |
| STATEMENTS OF CHANGES IN NET ASSETS |
| Year Ended | Year Ended | |||||||
| December 31, | December 31, | |||||||
| 2013 | 2012 | |||||||
| Increase (Decrease) In Net Assets From Operations: | ||||||||
| Net investment income | $ | 268,795 | $ | 346,172 | ||||
| Net realized gain (loss) on investments | (14,578,253 | ) | 1,128,460 | |||||
| Net change in unrealized appreciation (depreciation) on investments | �� | (61,609 | ) | (925,419 | ) | |||
| Net increase (decrease) in net assets resulting from operations | (14,371,067 | ) | 549,213 | |||||
| Distributions to shareholders from: | ||||||||
| Net investment income | (269,007 | ) | (345,898 | ) | ||||
| Net realized gains | (1,912,921 | ) | (9,881,240 | ) | ||||
| Total distributions to shareholders | (2,181,928 | ) | (10,227,138 | ) | ||||
| Capital share transactions: | ||||||||
| Proceeds from sale of shares | 901,609,638 | 939,628,714 | ||||||
| Distributions reinvested | 2,181,928 | 10,227,138 | ||||||
| Cost of shares redeemed | (898,394,307 | ) | (960,286,630 | ) | ||||
| Net increase (decrease) from capital share transactions | 5,397,259 | (10,430,778 | ) | |||||
| Net decrease in net assets | (11,155,736 | ) | (20,108,703 | ) | ||||
| Net assets: | ||||||||
| Beginning of year | 21,149,466 | 41,258,169 | ||||||
| End of year | $ | 9,993,730 | $ | 21,149,466 | ||||
| Undistributed net investment income at end of year | $ | 62 | $ | 274 | ||||
| Capital share activity:* | ||||||||
| Shares sold | 21,723,277 | 15,641,152 | ||||||
| Shares issued from reinvestment of distributions | 61,521 | 214,142 | ||||||
| Shares redeemed | (21,953,493 | ) | (16,089,051 | ) | ||||
| Net decrease in shares | (168,695 | ) | (233,757 | ) | ||||
| * | Reverse share split — Capital share activity for the years ended December 31, 2013 and 2012 has been restated to reflect a 1:3 reverse share split effective January 24, 2014. See Note 13 in Notes to Financial Statements. |
| 150 | THE RYDEX FUNDS ANNUAL REPORT | SEE NOTES TO FINANCIAL STATEMENTS. |
| GOVERNMENT LONG BOND 1.2x STRATEGY FUND |
| FINANCIAL HIGHLIGHTS |
This table is presented to show selected data for a share outstanding throughout each period and to assist shareholders in evaluating a Fund’s performance for the periods presented.
| Year Ended | Year Ended | Year Ended | Year Ended | Year Ended | ||||||||||||||||
| December 31, | December 31, | December 31, | December 31, | December 31, | ||||||||||||||||
| 2013d | 2012d | 2011c,d | 2010c,d | 2009c,d | ||||||||||||||||
| Per Share Data | ||||||||||||||||||||
| Net asset value, beginning of period | $ | 45.61 | $ | 59.16 | $ | 42.61 | $ | 39.55 | $ | 103.47 | ||||||||||
| Income (loss) from investment operations: | ||||||||||||||||||||
| Net investment incomea | .33 | .42 | .87 | 1.02 | 1.68 | |||||||||||||||
| Net gain (loss) on investments | ||||||||||||||||||||
| (realized and unrealized) | (8.52 | ) | 1.96 | 16.55 | 3.00 | (32.00 | ) | |||||||||||||
| Total from investments operations | (8.19 | ) | 2.38 | 17.42 | 4.02 | (30.32 | ) | |||||||||||||
| Less distributions from: | ||||||||||||||||||||
| Net investment income | (.33 | ) | (.42 | ) | (.87 | ) | (.96 | ) | (1.68 | ) | ||||||||||
| Net realized gains | (3.21 | ) | (15.51 | ) | — | — | (31.92 | ) | ||||||||||||
| Total distributions | (3.54 | ) | (15.93 | ) | (.87 | ) | (.96 | ) | (33.60 | ) | ||||||||||
| Net asset value, end of period | $ | 33.88 | $ | 45.61 | $ | 59.16 | $ | 42.61 | $ | 39.55 | ||||||||||
| Total Returnb | (18.25 | %) | 3.01 | % | 41.52 | % | 10.14 | % | (31.54 | %) | ||||||||||
| Ratios/Supplemental Data | ||||||||||||||||||||
| Net assets, end of period (in thousands) | $ | 9,994 | $ | 21,149 | $ | 41,258 | $ | 16,833 | $ | 24,092 | ||||||||||
| Ratios to average net assets: | ||||||||||||||||||||
| Net investment income | 0.78 | % | 0.71 | % | 1.81 | % | 2.39 | % | 2.29 | % | ||||||||||
| Total expenses | 1.24 | % | 1.28 | % | 1.29 | % | 1.25 | % | 1.26 | % | ||||||||||
| Portfolio turnover rate | 3,661 | % | 3,230 | % | 2,585 | % | 2,452 | % | 1,694 | % | ||||||||||
| a | Net investment income per share was computed using average shares outstanding throughout the period. |
| b | Total return does not reflect the impact of any additional fees charged by insurance companies. |
| c | Reverse share split — Per share amounts for the period December 31, 2009 through December 1, 2011 have been restated to reflect a 1:2 reverse share split effective December 2, 2011. |
| d | Reverse share split — Per share amounts for the period December 31, 2009 through December 31, 2013 have been restated to reflect a 1:3 reverse share split effective January 24, 2014. |
| SEE NOTES TO FINANCIAL STATEMENTS. | THE RYDEX FUNDS ANNUAL REPORT | 151 |
| PERFORMANCE REPORT AND FUND PROFILE (Unaudited) | December 31, 2013 |
INVERSE GOVERNMENT LONG BOND STRATEGY FUND
OBJECTIVE: Seeks to provide total returns that inversely correlate, before fees and expenses, to the price movements of a benchmark for U.S. Treasury debt instruments or futures contracts on a specified debt instrument on a daily basis. The Fund’s current benchmark is the inverse (opposite) of the daily price movement of the Long Treasury Bond. The Long Treasury Bond is the U.S. Treasury bond with the longest maturity, which is currently 30 years. The price movement of the Long Treasury Bond is based on the daily price change of the most recently issued Long Treasury Bond. The Fund does not seek to achieve its investment objective over a period of time greater than one day.
For the year ended December 31, 2013, the Inverse Government Long Bond Strategy Fund returned 15.26%. The daily price movement of the Long Treasury Bond was 0.46% for 2013.
The return of a comparison index, the Barclays Long U.S. Treasury Index, was -12.66%.
The year 2013 will be remembered as a difficult year for long Treasury bonds.
In January, the 30-year bond opened at a yield of 3.04%. Even as warnings suggested that long interest rates would rise, yields remained range-bound for the first four months of the year, supported by Federal Reserve policy, strong demand and low inflation.
The market changed abruptly in May, however, when Federal Reserve chairman Ben Bernanke announced that the Fed may soon taper its quantitative easing policy. Investors rushed immediately to take profits and the long bond yield began to climb. Signs of a strengthening economy and recovery in the housing market pushed the 30-year yield higher during the summer until September, when the Fed did an about face and stated that it would not cut its stimulus policy for the time being.
Lower yields prevailed, through September and October, but were short-lived. Signs of improving growth made the taper program more likely and the market pushed the 30-year bond yield higher in November and December. As anticipated, the Fed finally came through with a certain plan to begin its taper program. The combination of Fed news and increasingly strong economic reports drove yields higher. On December 31, the 30-year bond closed at a high of 3.97%.
Derivatives in the Fund are used to help provide exposure to the composition of the benchmark in the highest efficient manner not for hedging purposes.
Due to the compounding of daily returns, leveraged and inverse funds’ returns over periods other than one day will likely differ in amount and possibly direction from the benchmark return for the same period. Investors should monitor their leveraged and inverse funds’ holdings to ensure that they are consistent with their strategies, as frequently as daily.
The effects of compounding may cause the longer-term correlation of the fund to its benchmark to diminish. The apparent discrepancy between the leveraged and unleveraged indices is the result of compounding, which is described briefly on page 6 of this report.
Performance displayed represents past performance, which is no guarantee of future results.
| 152 | THE RYDEX FUNDS ANNUAL REPORT |
| PERFORMANCE REPORT AND FUND PROFILE (Unaudited) (concluded) |
Holdings Diversification (Market Exposure as % of Net Assets)
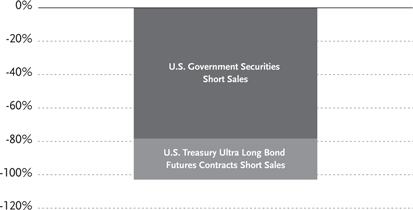
“Holdings Diversification (Market Exposure as % of Net Assets)” excludes any temporary cash investments.
Inception Date: May 1, 2003
The Fund invests principally in short sales and derivative investments such as futures contracts.
Cumulative Fund Performance*,†

Average Annual Returns
Periods Ended December 31, 2013*,†
| 1 Year | 5 Year | 10 Year | ||||||||||
| Inverse Government Long Bond Strategy Fund | 15.26 | % | -4.77 | % | -7.12 | % | ||||||
| Daily Price Movement of Long Treasury Bond** | 0.46 | % | -6.83 | % | -0.75 | % | ||||||
| Barclays Long Treasury Bond Index | -12.66 | % | 2.28 | % | 5.94 | % | ||||||
| * | The performance data above represents past performance that is not predictive of future results. The investment return and principal value of an investment in the Fund will fluctuate so that an investor’s shares, when redeemed, may be worth more or less than their original cost. Returns are historical and include changes in principal and reinvested dividends and capital gains and do not reflect the effect of taxes. The Barclays Long Treasury Bond Index and Daily Price Movement of Long Treasury Bond are unmanaged indices and, unlike the Fund, have no management fees or operating expenses to reduce their reported returns. |
| ** | Does not reflect any interest. |
| † | Returns do not reflect the impact of any additional fees charged by insurance companies. |
| THE RYDEX FUNDS ANNUAL REPORT | 153 |
| SCHEDULE OF INVESTMENTS | December 31, 2013 |
| INVERSE GOVERNMENT LONG BOND STRATEGY FUND | |
| Face | ||||||||
| Amount | Value | |||||||
| FEDERAL AGENCY DISCOUNT NOTES†† - 35.7% | ||||||||
| Fannie Mae1 | ||||||||
| 0.08% due 01/02/14 | $ | 1,000,000 | $ | 1,000,000 | ||||
| 0.07% due 01/03/14 | 1,000,000 | 999,999 | ||||||
| Total Fannie Mae | 1,999,999 | |||||||
| Farmer Mac2 | ||||||||
| 0.03% due 01/02/14 | 2,000,000 | 1,999,998 | ||||||
| Federal Farm Credit Bank2 | ||||||||
| 0.03% due 01/10/14 | 1,000,000 | 999,993 | ||||||
| 0.03% due 01/15/14 | 1,000,000 | 999,988 | ||||||
| Total Federal Farm Credit Bank | 1,999,981 | |||||||
| Federal Home Loan Bank2 | ||||||||
| 0.05% due 01/13/14 | 1,000,000 | 999,983 | ||||||
| Total Federal Agency Discount Notes | ||||||||
| (Cost $6,999,956) | 6,999,961 | |||||||
| REPURCHASE AGREEMENTS††,3 - 152.0% | ||||||||
| Individual Repurchase Agreement4 | ||||||||
| Barclays Capital | ||||||||
| issued 12/31/13 at (0.10)% | ||||||||
| due 01/02/14 (secured by a | ||||||||
| U.S. Treasury Bond, at a rate of | ||||||||
| 3.75% and maturing 11/15/43 | ||||||||
| as collateral, with a value of | ||||||||
| $16,340,025) to be repurchased | ||||||||
| at $16,019,543 | 16,019,632 | 16,019,632 | ||||||
| Joint Repurchase Agreements3 | ||||||||
| Deutsche Bank | ||||||||
| issued 12/31/13 at 0.01% | ||||||||
| due 01/02/14 | 3,447,308 | 3,447,308 | ||||||
| HSBC Group | ||||||||
| issued 12/31/13 at 0.01% | ||||||||
| due 01/02/14 | 3,447,308 | 3,447,308 | ||||||
| Credit Suisse Group | ||||||||
| issued 12/31/13 at 0.00% | ||||||||
| due 01/02/14 | 3,447,308 | 3,447,308 | ||||||
| Mizuho Financial Group, Inc. | ||||||||
| issued 12/31/13 at 0.01% | ||||||||
| due 01/02/14 | 3,431,713 | 3,431,713 | ||||||
| Total Repurchase Agreements | ||||||||
| (Cost $29,793,269) | 29,793,269 | |||||||
| Total Investments - 187.7% | ||||||||
| (Cost $36,793,225) | $ | 36,793,230 | ||||||
| U.S. GOVERNMENT SECURITIES SOLD SHORT† - (78.3)% | ||||||||
| U.S. Treasury Bond | ||||||||
| 3.75% due 11/15/43 | 15,859,000 | (15,343,582 | ) | |||||
| Total U.S. Government Securities Sold Short | ||||||||
| (Proceeds $15,604,656) | (15,343,582 | ) | ||||||
| Other Assets & Liabilities, net - (9.4)% | (1,851,660 | ) | ||||||
| Total Net Assets - 100.0% | $ | 19,597,988 | ||||||
| Unrealized | ||||||||
| Contracts | Gain | |||||||
| INTEREST RATE FUTURES CONTRACTS SOLD SHORT† | ||||||||
| March 2014 U.S. Treasury Ultra Long Bond | ||||||||
| Futures Contracts | ||||||||
| (Aggregate Value of | ||||||||
| Contracts $4,766,563) | 35 | $ | 68,059 | |||||
| † | Value determined based on Level 1 inputs — See Note 4. | |
| †† | Value determined based on Level 2 inputs — See Note 4. |
| 1 | On September 7, 2008, the issuer was placed in conservatorship by the Federal Housing Finance Agency (FHFA). As conservator, the FHFA has full powers to control the assets and operations of the firm. |
| 2 | The issuer operates under a Congressional charter; its securities are neither issued nor guaranteed by the U.S. Government. |
| 3 | Repurchase Agreements — See Note 5. |
| 4 | All or portion of this security is pledged as short collateral at December 31, 2013. |
| 154 | THE RYDEX FUNDS ANNUAL REPORT | SEE NOTES TO FINANCIAL STATEMENTS. |
| INVERSE GOVERNMENT LONG BOND STRATEGY FUND |
| STATEMENT OF ASSETS |
| AND LIABILITIES |
December 31, 2013
| Assets: | ||||
| Investments, at value | ||||
| (cost $6,999,956) | $ | 6,999,961 | ||
| Repurchase agreements, at value | ||||
| (cost $29,793,269) | 29,793,269 | |||
| Total investments | ||||
| (cost $36,793,225) | 36,793,230 | |||
| Segregated cash with broker | 133,875 | |||
| Receivables: | ||||
| Variation margin | 30,625 | |||
| Interest | 4,432 | |||
| Fund shares sold | 2,586 | |||
| Total assets | 36,964,748 | |||
| Liabilities: | ||||
| Securities sold short, at value | ||||
| (proceeds $15,604,656) | 15,343,582 | |||
| Payable for: | ||||
| Fund shares redeemed | 1,019,115 | |||
| Securities purchased | 870,750 | |||
| Management fees | 14,742 | |||
| Transfer agent and administrative fees | 4,095 | |||
| Investor service fees | 4,095 | |||
| Portfolio accounting fees | 1,638 | |||
| Miscellaneous | 108,743 | |||
| Total liabilities | 17,366,760 | |||
| Net assets | $ | 19,597,988 | ||
| Net assets consist of: | ||||
| Paid in capital | $ | 22,520,844 | ||
| Undistributed net investment income | — | |||
| Accumulated net realized loss on investments | (3,251,994 | ) | ||
| Net unrealized appreciation on investments | 329,138 | |||
| Net assets | $ | 19,597,988 | ||
| Capital shares outstanding† | 367,918 | |||
| Net asset value per share† | $ | 53.27 |
| STATEMENT OF |
| OPERATIONS |
| Year Ended December 31, 2013 |
| Investment Income: | ||||
| Interest | $ | 5,006 | ||
| Total investment income | 5,006 | |||
| Expenses: | ||||
| Management fees | 147,012 | |||
| Transfer agent and administrative fees | 40,837 | |||
| Investor service fees | 40,837 | |||
| Portfolio accounting fees | 16,334 | |||
| Short interest expense | 311,235 | |||
| Trustees’ fees* | 1,869 | |||
| Custodian fees | 1,747 | |||
| Line of credit interest expense | 34 | |||
| Miscellaneous | 26,622 | |||
| Total expenses | 586,527 | |||
| Net investment loss | (581,521 | ) | ||
| Net Realized and Unrealized Gain (Loss): | ||||
| Net realized gain (loss) on: | ||||
| Investments | (335 | ) | ||
| Futures contracts | 1,294,701 | |||
| Securities sold short | 812,952 | |||
| Net realized gain | 2,107,318 | |||
| Net change in unrealized appreciation (depreciation) on: | ||||
| Investments | (10 | ) | ||
| Securities sold short | 132,331 | |||
| Futures contracts | (18,406 | ) | ||
| Net change in unrealized appreciation (depreciation) | 113,915 | |||
| Net realized and unrealized gain | 2,221,233 | |||
| Net increase in net assets resulting from operations | $ | 1,639,712 | ||
| † | Reverse share split — The shares outstanding and net asset value per share have been restated to reflect a 1:5 reverse share split effective January 24, 2014. See Note 13 in Notes to Financial Statements. |
| * | Relates to Trustees not deemed “interested persons” within the meaning of Section 2(a)(19) of the 1940 Act. |
| SEE NOTES TO FINANCIAL STATEMENTS. | THE RYDEX FUNDS ANNUAL REPORT | 155 |
| INVERSE GOVERNMENT LONG BOND STRATEGY FUND |
| STATEMENTS OF CHANGES IN NET ASSETS |
| Year Ended | Year Ended | |||||||
| December 31, | December 31, | |||||||
| 2013 | 2012 | |||||||
| Increase (Decrease) In Net Assets From Operations: | ||||||||
| Net investment loss | $ | (581,521 | ) | $ | (590,322 | ) | ||
| Net realized gain (loss) on investments | 2,107,318 | (1,052,200 | ) | |||||
| Net change in unrealized appreciation (depreciation) on investments | 113,915 | 185,485 | ||||||
| Net increase (decrease) in net assets resulting from operations | 1,639,712 | (1,457,037 | ) | |||||
| Capital share transactions: | ||||||||
| Proceeds from sale of shares | 800,447,943 | 687,777,979 | ||||||
| Cost of shares redeemed | (790,859,270 | ) | (684,773,574 | ) | ||||
| Net increase from capital share transactions | 9,588,673 | 3,004,405 | ||||||
| Net increase in net assets | 11,228,385 | 1,547,368 | ||||||
| Net assets: | ||||||||
| Beginning of year | 8,369,603 | 6,822,235 | ||||||
| End of year | $ | 19,597,988 | $ | 8,369,603 | ||||
| Undistributed net investment income at end of year | $ | — | $ | — | ||||
| Capital share activity:* | ||||||||
| Shares sold | 16,383,173 | 14,645,074 | ||||||
| Shares redeemed | (16,196,401 | ) | (14,602,396 | ) | ||||
| Net increase in shares | 186,772 | 42,678 | ||||||
| * | Reverse share split — Capital share activity for the years ended December 31, 2013 and 2012 has been restated to reflect a 1:5 reverse share split effective January 24, 2014. See Note 13 in Notes to Financial Statements. |
| 156 | THE RYDEX FUNDS ANNUAL REPORT | SEE NOTES TO FINANCIAL STATEMENTS. |
| INVERSE GOVERNMENT LONG BOND STRATEGY FUND |
| FINANCIAL HIGHLIGHTS |
This table is presented to show selected data for a share outstanding throughout each period and to assist shareholders in evaluating a Fund’s performance for the periods presented.
| Year Ended | Year Ended | Year Ended | Year Ended | Year Ended | ||||||||||||||||
| December 31, | December 31, | December 31, | December 31, | December 31, | ||||||||||||||||
| 2013c | 2012c | 2011c | 2010c | 2009c | ||||||||||||||||
| Per Share Data | ||||||||||||||||||||
| Net asset value, beginning of period | $ | 46.20 | $ | 49.27 | $ | 70.80 | $ | 81.19 | $ | 67.99 | ||||||||||
| Income (loss) from investment operations: | ||||||||||||||||||||
| Net investment lossa | (1.80 | ) | (1.70 | ) | (3.15 | ) | (3.65 | ) | (1.65 | ) | ||||||||||
| Net gain (loss) on investments | ||||||||||||||||||||
| (realized and unrealized) | 8.87 | (1.37 | ) | (18.38 | ) | (6.74 | ) | 14.85 | ||||||||||||
| Total from investment operations | 7.07 | (3.07 | ) | (21.53 | ) | (10.39 | ) | 13.20 | ||||||||||||
| Net asset value, end of period | $ | 53.27 | $ | 46.20 | $ | 49.27 | $ | 70.80 | $ | 81.19 | ||||||||||
| Total Returnb | 15.26 | % | (6.19 | %) | (30.44 | %) | (12.81 | %) | 19.41 | % | ||||||||||
| Ratios/Supplemental Data | ||||||||||||||||||||
| Net assets, end of period (in thousands) | $ | 19,598 | $ | 8,370 | $ | 6,822 | $ | 17,181 | $ | 27,940 | ||||||||||
| Ratios to average net assets: | ||||||||||||||||||||
| Net investment loss | (3.56 | %) | (3.53 | %) | (4.83 | %) | (5.12 | %) | (2.09 | %) | ||||||||||
| Total expensesd | 3.59 | % | 3.70 | % | 4.89 | % | 5.31 | % | 2.23 | % | ||||||||||
| Portfolio turnover rate | 5,999 | % | 6,326 | % | 2,031 | % | 3,555 | % | — | |||||||||||
| a | Net investment loss per share was computed using average shares outstanding throughout the period. |
| b | Total return does not reflect the impact of any additional fees charged by insurance companies. |
| c | Reverse share split — Per share amounts for the period December 31, 2009 through December 31, 2013 have been restated to reflect a 1:5 reverse share split effective January 24, 2014. |
| d | Total expenses may include interest expense related to short sales. Excluding interest expense, the operating expense ratios for the years ended December 31 would be: |
| 2013 | 2012 | 2011 | 2010 | 2009 | ||||||||||||||
| 1.69 | % | 1.72 | % | 1.76 | % | 1.70 | % | 1.71 | % | |||||||||
| SEE NOTES TO FINANCIAL STATEMENTS. | THE RYDEX FUNDS ANNUAL REPORT | 157 |
| PERFORMANCE REPORT AND FUND PROFILE (Unaudited) | December 31, 2013 |
U.S. GOVERNMENT MONEY MARKET FUND
OBJECTIVE: Seeks to provide security of principal, high current income, and liquidity.
For the year ended December 31, 2013, U.S. Government Money Market Fund returned 0.00%.
Continued low short-term interest rates during 2013 meant another difficult year for money market funds, since the Federal Reserve reduced its interest rate target to near zero in 2008. Money market funds continued to waive fees, which were the highest going back to 2000.
On a positive note, investors are sticking with money market funds despite very low yields. There was only a slight decline in assets under management during the year. In June, the Securities and Exchange Commission issued a proposal for further regulation of money market mutual funds. This is just a proposal, which is expected to take months, if not years, before new rules are determined and actually take effect.
Money market rates moved lower during the last quarter, as cash investment needs remained high. Relief will come only when the Federal Reserve raises short-term rates.
Performance displayed represents past performance, which is no guarantee of future results.
An investment in the Fund is not insured or guaranteed by the Federal Deposit Insurance Corporation or any other government agency.
Although the Fund seeks to preserve the value of your investment at $1.00 per share, it is possible to lose money by investing in the Fund.
Holdings Diversification (Market Exposure as % of Net Assets)
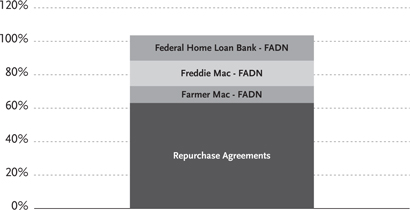
“Holdings Diversification (Market Exposure as % of Net Assets)” excludes any temporary cash investments.
FADN — Federal Agency Discount Notes
Inception Date: May 7, 1997
The Fund invests principally in money market instruments issued or guaranteed as to principal and interest by the U.S. Government, its agencies or instrumentalities and enters into repurchase agreements fully collateralized by U.S. government securities.
| 158 | THE RYDEX FUNDS ANNUAL REPORT |
| PERFORMANCE REPORT AND FUND PROFILE (Unaudited) (concluded) |
Average Annual Returns
Periods Ended December 31, 2013*,†
| 1 Year | 5 Year | 10 Year | ||||||||||
| U.S. Government Money Market Fund | 0.00 | % | 0.01 | % | 1.11 | % | ||||||
| * | The performance data above represents past performance that is not predictive of future results. The investment return and principal value of an investment in the Fund will fluctuate so that an investor’s shares, when redeemed, may be worth more or less than their original cost. Returns are historical and include changes in principal and reinvested dividends and capital gains and do not reflect the effect of taxes. |
| † | Returns do not reflect the impact of any additional fees charged by insurance companies. |
| THE RYDEX FUNDS ANNUAL REPORT | 159 |
| SCHEDULE OF INVESTMENTS | December 31, 2013 |
| U.S. GOVERNMENT MONEY MARKET FUND | |
| Face | ||||||||
| Amount | Value | |||||||
| FEDERAL AGENCY DISCOUNT NOTES†† - 40.5% | ||||||||
| Federal Home Loan Bank1 | ||||||||
| 0.08% due 02/21/14 | $ | 10,000,000 | $ | 9,998,867 | ||||
| 0.08% due 04/08/14 | 5,000,000 | 4,998,922 | ||||||
| Total Federal Home Loan Bank | 14,997,789 | |||||||
| Freddie Mac2 | ||||||||
| 0.11% due 06/10/14 | 10,000,000 | 9,994,888 | ||||||
| 0.09% due 06/17/14 | 5,000,000 | 4,997,913 | ||||||
| Total Freddie Mac | 14,992,801 | |||||||
| Farmer Mac1 | ||||||||
| 0.10% due 04/08/14 | 10,000,000 | 9,997,306 | ||||||
| Total Federal Agency Discount Notes | ||||||||
| (Cost $39,987,896) | 39,987,896 | |||||||
| REPURCHASE AGREEMENTS††,3 - 63.1% | ||||||||
| Deutsche Bank | ||||||||
| issued 12/31/13 at 0.01% | ||||||||
| due 01/02/14 | 15,566,878 | 15,566,878 | ||||||
| HSBC Group | ||||||||
| issued 12/31/13 at 0.01% | ||||||||
| due 01/02/14 | 15,566,878 | 15,566,878 | ||||||
| Credit Suisse Group | ||||||||
| issued 12/31/13 at 0.00% | ||||||||
| due 01/02/14 | 15,566,878 | 15,566,878 | ||||||
| Mizuho Financial Group, Inc. | ||||||||
| issued 12/31/13 at 0.01% | ||||||||
| due 01/02/14 | 15,496,458 | 15,496,458 | ||||||
| Total Repurchase Agreements | ||||||||
| (Cost $62,197,092) | 62,197,092 | |||||||
| Total Investments - 103.6% | ||||||||
| (Cost $102,184,988) | $ | 102,184,988 | ||||||
| Other Assets & Liabilities, net - (3.6)% | (3,529,648 | ) | ||||||
| Total Net Assets - 100.0% | $ | 98,655,340 | ||||||
| †† | Value determined based on Level 2 inputs — See Note 4. |
| 1 | The issuer operates under a Congressional charter; its securities are neither issued nor guaranteed by the U.S. Government. |
| 2 | On September 7, 2008, the issuer was placed in conservatorship by the Federal Housing Finance Agency (FHFA). As conservator, the FHFA has full powers to control the assets and operations of the firm. |
| 3 | Repurchase Agreements — See Note 5. |
| 160 | THE RYDEX FUNDS ANNUAL REPORT | SEE NOTES TO FINANCIAL STATEMENTS. |
| U.S. GOVERNMENT MONEY MARKET FUND |
| STATEMENT OF ASSETS |
| AND LIABILITIES |
December 31, 2013
| Assets: | ||||
| Investments, at value | ||||
| (cost $39,987,896) | $ | 39,987,896 | ||
| Repurchase agreements, at value | ||||
| (cost $62,197,092) | 62,197,092 | |||
| Total investments | ||||
| (cost $102,184,988) | 102,184,988 | |||
| Cash | 9,760 | |||
| Receivables: | ||||
| Fund shares sold | 22,630 | |||
| Interest | 7 | |||
| Total assets | 102,217,385 | |||
| Liabilities: | ||||
| Payable for: | ||||
| Fund shares redeemed | 3,391,736 | |||
| Miscellaneous | 170,309 | |||
| Total liabilities | 3,562,045 | |||
| Net assets | $ | 98,655,340 | ||
| Net assets consist of: | ||||
| Paid in capital | $ | 98,655,333 | ||
| Undistributed net investment income | 7 | |||
| Accumulated net realized gain on investments | — | |||
| Net unrealized appreciation on investments | — | |||
| Net assets | $ | 98,655,340 | ||
| Capital shares outstanding | 98,674,935 | |||
| Net asset value per share | $ | 1.00 |
| STATEMENT OF |
| OPERATIONS |
Year Ended December 31, 2013
| Investment Income: | ||||
| Interest | $ | 87,489 | ||
| Total investment income | 87,489 | |||
| Expenses: | ||||
| Management fees | 597,367 | |||
| Transfer agent and administrative fees | 238,949 | |||
| Investor service fees | 298,684 | |||
| Portfolio accounting fees | 119,473 | |||
| Professional fees | 104,364 | |||
| Trustees’ fees* | 14,171 | |||
| Custodian fees | 13,829 | |||
| Miscellaneous | 88,391 | |||
| Total expenses | 1,475,228 | |||
| Less: | ||||
| Expenses waived by service company | (358,427 | ) | ||
| Expenses waived by distributor | (298,506 | ) | ||
| Expenses waived/reimbursed by advisor | (730,857 | ) | ||
| Total waived expenses | (1,387,790 | ) | ||
| Net expenses | 87,438 | |||
| Net investment income | 51 | |||
| Net increase in net assets resulting from operations | $ | 51 | ||
* Relates to Trustees not deemed “interested persons” within the meaning of Section 2(a)(19) of the 1940 Act.
| SEE NOTES TO FINANCIAL STATEMENTS. | THE RYDEX FUNDS ANNUAL REPORT | 161 |
| U.S. GOVERNMENT MONEY MARKET FUND |
| STATEMENTS OF CHANGES IN NET ASSETS |
| Year Ended | Year Ended | |||||||
| December 31, | December 31, | |||||||
| 2013 | 2012 | |||||||
| Increase (Decrease) In Net Assets From Operations: | ||||||||
| Net investment income | $ | 51 | $ | 52 | ||||
| Net realized gain on investments | — | 1,332 | ||||||
| Net increase in net assets resulting from operations | 51 | 1,384 | ||||||
| Distributions to shareholders from: | ||||||||
| Net investment income | (44 | ) | (3,536 | ) | ||||
| Net realized gains | (981 | ) | (633 | ) | ||||
| Total distributions to shareholders | (1,025 | ) | (4,169 | ) | ||||
| Capital share transactions: | ||||||||
| Proceeds from sale of shares | 745,584,831 | 1,010,595,837 | ||||||
| Distributions reinvested | 1,025 | 4,169 | ||||||
| Cost of shares redeemed | (777,910,560 | ) | (1,076,255,948 | ) | ||||
| Net decrease from capital share transactions | (32,324,704 | ) | (65,655,942 | ) | ||||
| Net decrease in net assets | (32,325,678 | ) | (65,658,727 | ) | ||||
| Net assets: | ||||||||
| Beginning of year | 130,981,018 | 196,639,745 | ||||||
| End of year | $ | 98,655,340 | $ | 130,981,018 | ||||
| Undistributed net investment income at end of year | $ | 7 | $ | — | ||||
| Capital share activity: | ||||||||
| Shares sold | 745,584,830 | 1,010,595,839 | ||||||
| Shares issued from reinvestment of distributions | 1,025 | 4,167 | ||||||
| Shares redeemed | (777,910,560 | ) | (1,076,255,948 | ) | ||||
| Net decrease in shares | (32,324,705 | ) | (65,655,942 | ) | ||||
| 162 | the RYDEX FUNDS ANNUAL REPORT | SEE NOTES TO FINANCIAL STATEMENTS. |
| U.S. GOVERNMENT MONEY MARKET FUND |
| FINANCIAL HIGHLIGHTS |
This table is presented to show selected data for a share outstanding throughout each period and to assist shareholders in evaluating a Fund’s performance for the periods presented.
| Year Ended | Year Ended | Year Ended | Year Ended | Year Ended | ||||||||||||||||
| December 31, | December 31, | December 31, | December 31, | December 31, | ||||||||||||||||
| 2013 | 2012 | 2011 | 2010 | 2009 | ||||||||||||||||
| Per Share Data | ||||||||||||||||||||
| Net asset value,beginning of period | $ | 1.00 | $ | 1.00 | $ | 1.00 | $ | 1.00 | $ | 1.00 | ||||||||||
| Income (loss) from investment operations: | ||||||||||||||||||||
| Net investment income | — | a | — | a | — | a | — | a | — | a | ||||||||||
| Total from investment operations | — | a | — | a | — | a | — | a | — | a | ||||||||||
| Less distributions from: | ||||||||||||||||||||
| Net investment income | (— | )a | (— | )a | (— | )a | (— | )a | (— | ) | ||||||||||
| Net realized gains | (— | )a | (— | )a | — | — | — | |||||||||||||
| Total distributions | (— | )a | (— | )a | (— | )a | (— | )a | (— | )a | ||||||||||
| Net asset value, end of period | $ | 1.00 | $ | 1.00 | $ | 1.00 | $ | 1.00 | $ | 1.00 | ||||||||||
| Total Returnb | 0.00 | % | 0.00 | % | 0.00 | % | 0.01 | % | 0.06 | % | ||||||||||
| Ratios/Supplemental Data | ||||||||||||||||||||
| Net assets, end of period (in thousands) | $ | 98,655 | $ | 130,981 | $ | 196,640 | $ | 207,782 | $ | 231,451 | ||||||||||
| Ratios to average net assets: | ||||||||||||||||||||
| Net investment income | — | d | — | d | — | d | 0.01 | % | 0.02 | % | ||||||||||
| Total expenses | 1.23 | % | 1.27 | % | 1.29 | % | 1.25 | % | 1.28 | % | ||||||||||
| Net expensesc | 0.07 | % | 0.13 | % | 0.09 | % | 0.18 | % | 0.54 | % | ||||||||||
| Portfolio turnover rate | — | — | — | — | — | |||||||||||||||
| a | Less than $0.01 per share. |
| b | Total return does not reflect the impact of any additional fees charged by insurance companies. |
| c | Net expense information reflects the expense ratios after expense waivers. |
| d | Less than 0.01% |
| SEE NOTES TO FINANCIAL STATEMENTS. | THE RYDEX FUNDS ANNUAL REPORT | 163 |
| NOTES TO FINANCIAL STATEMENTS |
1. Organization and Significant Accounting Policies
Organization
The Rydex Variable Trust (the “Trust”), a Delaware business trust, is registered with the SEC under the Investment Company Act of 1940 (“1940 Act”) as a non-diversified, open-ended investment company and is authorized to issue an unlimited number of no par value shares. The Trust offers shares of the funds to insurance companies for their variable annuity and variable life insurance contracts.
At December 31, 2013, the Trust consisted of fifty-one separate funds. This report covers certain Target Beta and Money Market Funds (the “Funds”), while the other funds are contained in separate reports.
Guggenheim Investments (“GI”) provides advisory services and Rydex Fund Services, LLC (“RFS”) provides transfer agent, administrative and accounting services to the Trust. Guggenheim Distributors, LLC (“GDL”) acts as principal underwriter for the Trust. GI, RFS and GDL are affiliated entities.
The Funds are designed and operated to accommodate frequent trading by shareholders and, unlike most mutual funds, offer unlimited exchange privileges with no minimum holding periods or transactions fees, which may cause the Funds to experience high portfolio turnover.
Significant Accounting Policies
The following significant accounting policies are in conformity with U.S. generally accepted accounting principles (“U.S. GAAP”) and are consistently followed by the Trust. This requires management to make estimates and assumptions that affect the reported amount of assets and liabilities and disclosure of contingent assets and liabilities at the date of the financial statements and the reported amounts of revenues and expenses during the reporting period. Actual results could differ from these estimates. All time references are based on Eastern Time.
A. Equity securities listed on an exchange (New York Stock Exchange (“NYSE”) or American Stock Exchange) are valued at the last quoted sales price as of the close of business on the NYSE, usually 4:00 p.m. on the valuation date. Equity securities listed on the NASDAQ market system are valued at the NASDAQ Official Closing Price on the valuation date, which may not necessarily represent the last sale price. If there has been no sale on such exchange or NASDAQ on such day, the security is valued at the closing bid price on such day.
The value of futures contracts is accounted for using the unrealized gain or loss on the contracts that is determined by marking the contracts to their current realized settlement prices. Financial futures contracts are valued at the 4:00 p.m. price on the valuation date. In the event that the exchange for a specific futures contract closes earlier than 4:00 p.m., the futures contract is valued at the Official Settlement Price of the exchange. However, the underlying securities from which the futures contract value is derived are monitored until 4:00 p.m. to determine if fair valuation would provide a more accurate valuation.
The U.S. Government Money Market Fund values debt securities at amortized cost pursuant to Rule 2a-7 of the 1940 Act, which approximates market value.
With the exception of the U.S. Government Money Market Fund, U.S. government securities are valued by either independent pricing services, the last traded fill price, or at the reported bid price at the close of business. Other debt securities with a maturity of greater than 60 days at acquisition are valued at prices that reflect broker/ dealer-supplied valuations or are obtained from independent pricing services, which may consider the trade activity, treasury spreads, yields or price of bonds of comparable quality, coupon, maturity, and type, as well as prices quoted by dealers who make markets in such securities. Short-term debt securities with a maturity of 60 days or less at acquisition and repurchase agreements are valued at amortized cost, which approximates market value.
Open-end investment companies (“Mutual Funds”) are valued at their net asset value per share (“NAV”) as of the close of business on the valuation date. Exchange Traded Funds (“ETF”) and closed-end investment companies are valued at the last quoted sales price.
The value of swap agreements entered into by a Fund is accounted for using the unrealized gain or loss on the agreements that is determined using the last quoted value of the index that the swap pertains to at the close of the NYSE, adjusted to include dividends accrued, and financing charges and/or interest associated with the swap agreements.
Investments for which market quotations are not readily available are fair valued as determined in good faith by GI under the direction of the Board of Trustees using methods established or ratified by the Board of Trustees. These methods include, but are not limited to: (i) obtaining general information as to how these securities and assets trade; (ii) in connection with futures contracts thereupon, and other derivative investments, obtaining information as to how (a) these contracts and other derivative investments trade in the futures or other derivative markets, respectively, and (b) the securities underlying these contracts and other derivative investments trade in the cash market; and (iii) obtaining other information and considerations, including current values in related markets.
B. Security transactions are recorded on the trade date for financial reporting purposes. Realized gains and losses from securities transactions are recorded using the identified cost basis. Proceeds from lawsuits related to investment holdings are recorded as realized gains in the respective Fund. Dividend income is recorded on the ex-dividend date, net of applicable taxes withheld by foreign countries. Taxable non-cash dividends are recorded as dividend income. Interest income, including amortization of premiums and accretion of discounts, is accrued on a daily basis. Distributions received from investments in REITs are recorded as dividend income on the ex-dividend date, subject to reclassification upon notice of the character of such distribution by the issuer.
| 164 | THE RYDEX FUNDS ANNUAL REPORT |
| NOTES TO FINANCIAL STATEMENTS (continued) |
C. Dividends from net investment income are declared daily in the Government Long Bond 1.2x Strategy Fund and the U.S. Government Money Market Fund. Dividends are reinvested in additional shares unless shareholders request payment in cash. Distributions of net investment income in the remaining Funds and distributions of net realized gains, if any, in all Funds are declared at least annually and recorded on the ex-dividend date and are determined in accordance with income tax regulations which may differ from U.S. GAAP.
D. When a Fund engages in a short sale of a security, an amount equal to the proceeds is reflected as an asset and an equivalent liability. The amount of the liability is subsequently marked-to-market to reflect the market value of the short sale. The Fund maintains a segregated account of cash and/or securities as collateral for short sales. The Fund is exposed to market risk based on the amount, if any, that the market value of the security exceeds the market value of the securities in the segregated account.
Fees, if any, paid to brokers to borrow securities in connection with short sales are recorded as interest expense. In addition, the Fund must pay out the dividend rate of the equity or coupon rate of the treasury obligation to the lender and record this as an expense. Short dividend or interest expense is a cost associated with the investment objective of short sales transactions, rather than an operational cost associated with the day-to-day management of any mutual fund. The Funds may also receive rebate income from the broker resulting from the investment of the proceeds from securities sold short.
E. Upon entering into a futures contract, a Fund deposits and maintains as collateral such initial margin as required by the exchange on which the transaction is affected. Pursuant to the contract, the Fund agrees to receive from or pay to the broker an amount of cash equal to the daily fluctuation in value of the contract. Such receipts or payments are known as variation margin and are recorded by the Fund as unrealized gains or losses. When the contract is closed, the Fund records a realized gain or loss equal to the difference between the value of the contract at the time it was opened and the value at the time it was closed.
F. Swap agreements are marked-to-market daily and the change, if any, is recorded as unrealized gain or loss. Payments received or made as a result of an agreement or termination of the agreement are recognized as realized gains or losses.
G. Investment securities and other assets and liabilities denominated in foreign currencies are translated into U.S. dollar amounts at the date of valuation. Purchases and sales of investment securities and income and expense items denominated in foreign currencies are translated into U.S. dollar amounts on the respective dates of such transactions. The Funds do not isolate that portion of the results of operations resulting from changes in foreign exchange rates on investments from the fluctuations arising from changes in market prices of securities held. Such fluctuations are included with the net realized and unrealized gain and loss from investments.
Reported net realized foreign exchange gains or losses arise from sales of foreign currencies and currency gains or losses realized between the trade and settlement dates on investment transactions. Net unrealized exchange gains and losses arise from changes in the fair values of assets and liabilities other than investments in securities at the fiscal period end, resulting from changes in exchange rates.
H. Certain U.S. Government and Agency Obligations are traded on a discount basis; the interest rates shown on the Schedules of Investments reflect the effective rates paid at the time of purchase by the Funds. Other securities bear interest at the rates shown, payable at fixed dates through maturity.
I. The Funds may leave cash overnight in their cash account with the custodian, U.S. Bank. Periodically, a Fund may have cash due to the custodian bank as an overdraft balance. A fee is incurred on this overdraft, calculated by multiplying the overdraft by a rate based on the federal funds rate.
Segregated cash with the broker is held as collateral for investments in derivative instruments such as futures contracts or swap agreements.
J. Throughout the normal course of business, the Funds enter into contracts that contain a variety of representations and warranties which provide general indemnifications. The Funds’ maximum exposure under these arrangements is unknown, as this would involve future claims that may be made against the Funds and/or their affiliates that have not yet occurred. However, based on experience, the Funds expect the risk of loss to be remote.
2. Financial Instruments
As part of their investment strategy, the Funds utilize short sales and a variety of derivative instruments including futures and swap agreements. These investments involve, to varying degrees, elements of market risk and risks in excess of the amounts recognized in the Statements of Assets and Liabilities.
| THE RYDEX FUNDS ANNUAL REPORT | 165 |
| NOTES TO FINANCIAL STATEMENTS (continued) |
A short sale is a transaction in which a Fund sells a security it does not own. If the security sold short decreases in price between the time the Fund sells the security and closes its short position, that Fund will realize a gain on the transaction. Conversely, if the security increases in price during the period, that Fund will realize a loss on the transaction. The risk of such price increases is the principal risk of engaging in short sales.
A futures contract is an agreement to purchase (long) or sell (short) an agreed amount of securities or other instruments at a set price for delivery at a future date. There are significant risks associated with a Fund’s use of futures contracts and related options, including (i) there may be an imperfect or no correlation between the changes in market value of the underlying asset and the prices of futures contracts; (ii) there may not be a liquid secondary market for a futures contract; (iii) trading restrictions or limitations may be imposed by an exchange; and (iv) government regulations may restrict trading in futures contracts. When investing in futures, there is minimal counterparty credit risk to the Fund because futures are exchange-traded and the exchange’s clearinghouse, as counterparty to all exchange-traded futures, guarantees against default. Cash deposits are shown as restricted cash on the Statement of Assets and Liabilities; securities held as collateral are noted on the Schedule of Investments.
A swap is an agreement that obligates two parties to exchange a series of cash flows at specified intervals based upon or calculated by reference to changes in specified prices or rates for a specified amount of an underlying asset. A Fund bears the risk of loss of the amount expected to be received under a swap agreement in the event of the default or bankruptcy of a swap agreement counterparty. Additionally, there is no guarantee that a Fund or an underlying fund could eliminate its exposure under an outstanding swap agreement by entering into an offsetting swap agreement with the same or another party.
The use of derivative instruments by a Fund to achieve leveraged exposure to the underlying index creates leveraging risk. The more a Fund invests in leveraged instruments, the more this leverage will magnify any losses on those investments. A Fund’s investment in these instruments generally requires a small investment relative to the amount of investment exposure assumed. As a result, such investments may give rise to losses that exceed the amount invested in those instruments. Since a Fund’s investment strategy involves consistently applied leverage, the value of the Fund’s shares will tend to increase or decrease more than the value of any increase or decrease in the underlying index. Leverage also will have the effect of magnifying tracking error.
In conjunction with the use of short sales, futures and swap agreements, the Funds are required to maintain collateral in various forms. The Funds use, where appropriate, depending on the financial instrument utilized and the broker involved, margin deposits at the broker, cash and/or securities segregated at the custodian bank, discount notes, or the repurchase agreements allocated to each Fund.
The Trust has established counterparty credit guidelines and enters into transactions only with financial institutions of investment grade or better. The Trust monitors the counterparty credit risk.
3. Fees and Other Transactions with Affiliates
Under the terms of an investment advisory contract, the Funds pay GI investment advisory fees calculated at the annualized rates below, based on the average daily net assets of the Funds:
| Management Fees | ||||
| Fund | (as a % of Net Assets) | |||
| Nova Fund | 0.75 | % | ||
| Inverse S&P 500® Strategy Fund | 0.90 | % | ||
| Nasdaq-100® Fund | 0.75 | % | ||
| Inverse Nasdaq-100® Strategy Fund | 0.90 | % | ||
| S&P 500® 2x Strategy Fund | 0.90 | % | ||
| Nasdaq-100® 2x Strategy Fund | 0.90 | % | ||
| Mid-Cap 1.5x Strategy Fund | 0.90 | % | ||
| Inverse Mid-Cap Strategy Fund | 0.90 | % | ||
| Russell 2000® 2x Strategy Fund | 0.90 | % | ||
| Russell 2000® 1.5x Strategy Fund | 0.90 | % | ||
| Inverse Russell 2000® Strategy Fund | 0.90 | % | ||
| Dow 2x Strategy Fund | 0.90 | % | ||
| Inverse Dow 2x Strategy Fund | 0.90 | % | ||
| Government Long Bond 1.2x Strategy Fund | 0.50 | % | ||
| Inverse Government Long Bond Strategy Fund | 0.90 | % | ||
| U.S. Government Money Market Fund | 0.50 | % | ||
RFS provides transfer agent and administrative services to the Trust for fees calculated at the annualized rates below, based on the average daily net assets of the Funds. For these services, RFS receives the following:
| Transfer Agent and | ||||
| Administrative Fees | ||||
| Fund | (as a % of Net Assets) | |||
| Government Long Bond 1.2x Strategy Fund | 0.20 | % | ||
| U.S. Government Money Market Fund | 0.20 | % | ||
| Remaining Funds | 0.25 | % | ||
RFS also provides accounting services to the Funds for fees calculated at annualized rates below, based on the average daily net assets of each Fund.
| Fund Accounting Fees | (as a % of Net Assets) | |||
| On the first $250 million | 0.10 | % | ||
| On the next $250 million | 0.075 | % | ||
| On the next $250 million | 0.05 | % | ||
| Over $750 million | 0.03 | % | ||
| 166 | THE RYDEX FUNDS ANNUAL REPORT |
| NOTES TO FINANCIAL STATEMENTS (continued) |
RFS engages external service providers to perform other necessary services for the Trust, such as audit and accounting related services, legal services, custody, printing and mailing, etc., on a pass-through basis. Such expenses are allocated to various Funds within the complex based on relative net assets.
The Trust has adopted an Investor Services Plan for which GDL and other firms that provide investor services (“Service Providers”) may receive compensation. The Funds will pay investor service fees to GDL at an annual rate not to exceed 0.25% of average daily net assets. GDL, in turn, will compensate Service Providers for providing such services, while retaining a portion of such payments to compensate itself for investor services it performs.
GI and its affiliates have voluntarily agreed to waive their fees and/or reimburse expenses, including but not limited to accounting, shareholder investor services and investment advisory fees, in an attempt to maintain a positive net yield for the U.S. Government Money Market Fund. GI or its affiliates may terminate this voluntary waiver at any time upon notice to the Fund. When shareholder investor services fees are waived, dealer compensation will be reduced to the extent of such waiver.
Certain officers and trustees of the Trust are also officers of GI, RFS and GDL.
4. Fair Value Measurement
In accordance with U.S. GAAP, fair value is defined as the price that the Fund would receive to sell an investment or pay to transfer a liability in an orderly transaction with an independent buyer in the principal market, or in the absence of a principal market the most advantageous market for the investment or liability. A three-tier hierarchy is utilized to distinguish between (1) inputs that reflect the assumptions market participants would use in pricing an asset or liability developed based on market data obtained from sources independent of the reporting entity (observable inputs) and (2) inputs that reflect the reporting entity’s own assumptions about the assumptions market participants would use in pricing an asset or liability developed based on the best information available in the circumstances (unobservable inputs) and to establish classification of fair value measurements for disclosure purposes. Various inputs are used in determining the value of the Funds’ investments. The inputs are summarized in the three broad levels listed below:
Level 1 — quoted prices in active markets for identical securities.
Level 2 — other significant observable inputs (including quoted prices for similar securities, interest rates, prepayment speeds, credit risk, etc.).
Level 3 — significant unobservable inputs (including the fund’s own assumptions used to determine the fair value of investments).
The inputs or methodologies used for valuing securities are not necessarily an indication of the risk associated with investing in those securities.
The following table summarizes the inputs used to value the Funds’ net assets at December 31, 2013:
| Level 1 | Level 1 | Level 2 | Level 2 | Level 3 | ||||||||||||||||||||
| Investments | Other Financial | Investments | Other Financial | Investments | ||||||||||||||||||||
| In Securities | Instruments* | In Securities | Instruments* | In Securities | Total | |||||||||||||||||||
| Assets | ||||||||||||||||||||||||
| Nova Fund | $ | 29,162,695 | $ | 42,791 | $ | 3,936,534 | $ | 74,774 | $ | — | $ | 33,216,794 | ||||||||||||
| Inverse S&P 500® Strategy Fund | — | — | 6,867,418 | — | — | 6,867,418 | ||||||||||||||||||
| NASDAQ-100® Fund | 67,132,314 | 1,247 | 3,100,221 | 7,844 | — | 70,241,626 | ||||||||||||||||||
| Inverse NASDAQ-100® Strategy Fund | — | — | 2,268,925 | — | — | 2,268,925 | ||||||||||||||||||
| S&P 500® 2x Strategy Fund | 15,906,161 | 61,496 | 11,948,446 | 137,881 | — | 28,053,984 | ||||||||||||||||||
| NASDAQ-100® 2x Strategy Fund | 34,225,050 | 14,481 | 9,728,421 | 161,067 | — | 44,129,019 | ||||||||||||||||||
| Mid-Cap 1.5x Strategy Fund | 10,179,696 | 129,370 | 3,265,056 | 53,949 | — | 13,628,071 | ||||||||||||||||||
| Inverse Mid-Cap Strategy Fund | — | — | 1,101,644 | — | — | 1,101,644 | ||||||||||||||||||
| Russell 2000® 2x Strategy Fund | 2,944,868 | 3,458 | 1,158,510 | 7,208 | — | 4,114,044 | ||||||||||||||||||
| Russell 2000® 1.5x Strategy Fund | 8,571,756 | 6,927 | 7,151,498 | 20,703 | — | 15,750,884 | ||||||||||||||||||
| Inverse Russell 2000® Strategy Fund | — | — | 1,946,083 | — | — | 1,946,083 | ||||||||||||||||||
| Dow 2x Strategy Fund | 12,676,040 | 321,755 | 7,333,666 | 111,527 | — | 20,442,988 | ||||||||||||||||||
| Inverse Dow 2x Strategy Fund | — | — | 2,621,480 | — | — | 2,621,480 | ||||||||||||||||||
| Government Long Bond 1.2x Strategy Fund | 5,162,580 | — | 4,702,614 | — | — | 9,865,194 | ||||||||||||||||||
| Inverse Government Long Bond Strategy Fund | — | 68,059 | 36,793,230 | — | — | 36,861,289 | ||||||||||||||||||
| U.S. Government Money Market Fund | — | — | 102,184,988 | — | — | 102,184,988 | ||||||||||||||||||
| THE RYDEX FUNDS ANNUAL REPORT | 167 |
| NOTES TO FINANCIAL STATEMENTS (continued) |
| Level 1 | Level 1 | Level 2 | Level 2 | Level 3 | ||||||||||||||||||||
| Investments | Other Financial | Investments | Other Financial | Investments | ||||||||||||||||||||
| In Securities | Instruments* | In Securities | Instruments* | In Securities | Total | |||||||||||||||||||
| Liabilities | ||||||||||||||||||||||||
| Inverse S&P 500® Strategy Fund | $ | — | $ | 8,608 | $ | — | $ | 18,853 | $ | — | $ | 27,461 | ||||||||||||
| Inverse NASDAQ-100® Strategy Fund | — | — | — | 12,867 | — | 12,867 | ||||||||||||||||||
| Inverse Mid-Cap Strategy Fund | — | — | — | 4,674 | — | 4,674 | ||||||||||||||||||
| Inverse Russell 2000® Strategy Fund | — | 2,348 | — | 2,858 | — | 5,206 | ||||||||||||||||||
| Inverse Dow 2x Strategy Fund | — | 1,906 | — | 27,743 | — | 29,649 | ||||||||||||||||||
| Government Long Bond 1.2x Strategy Fund | — | 60,882 | — | — | — | 60,882 | ||||||||||||||||||
| Inverse Government Long Bond Strategy Fund | 15,343,582 | — | — | — | — | 15,343,582 | ||||||||||||||||||
* Other financial instruments may include futures contracts and/or swaps, which are reported as unrealized gain/loss at period end.
Transfers between investment levels may occur as the markets fluctuate and/or the availability of data used in the investment’s valuation changes. The Funds recognize transfers between the levels as of the beginning of the period. As of December 31, 2013, Russell 2000® 2x Strategy Fund and Russell 2000® 1.5x Strategy Fund had a security with a total value of $67 and $265 transfer from Level 1 to Level 2, respectively due to a change in the securities valuation method. There were no other securities that transferred between levels.
5. Repurchase Agreements
The Funds transfer uninvested cash balances into a single joint account, the daily aggregate balance of which is invested in one or more repurchase agreements collateralized by obligations of the U.S. Treasury and U.S. Government Agencies. The collateral is in the possession of the Funds’ custodian and is evaluated to ensure that its market value exceeds, at a minimum, 102% of the original face amount of the repurchase agreements. Each Fund holds a pro rata share of the collateral based on the dollar amount of the repurchase agreement entered into by each Fund.
At December 31, 2013, the repurchase agreements in the joint account were as follows:
| Counterparty and Terms of Agreement | Face Value | Repurchase Price | Collateral | Par Value | Fair Value | |||||||||||||
| HSBC Group | U.S. Treasury Strips | |||||||||||||||||
| 0.01% | 0.00% | |||||||||||||||||
| Due 01/02/14 | $34,100,000 | $34,100,009 | 02/15/43 | $116,737,200 | $34,411,867 | |||||||||||||
| Freddie Mac | ||||||||||||||||||
| 2.00% | ||||||||||||||||||
| 04/01/23 | 370,745 | 370,158 | ||||||||||||||||
| Credit Suisse Group | U.S. Treasury Note | |||||||||||||||||
| 0.00% | 2.13% | |||||||||||||||||
| Due 01/02/14 | 53,363,689 | 53,363,689 | 12/31/15 | 52,623,500 | 54,431,049 | |||||||||||||
| Deutsche Bank | U.S. Treasury Note | |||||||||||||||||
| 0.01% | 0.25% | |||||||||||||||||
| Due 01/02/14 | 34,100,000 | 34,100,009 | 04/15/16 | 34,954,600 | 34,782,068 | |||||||||||||
| Mizuho Financial Group, Inc. | U.S. Treasury Strips | |||||||||||||||||
| 0.01% | 0.00% | |||||||||||||||||
| Due 01/02/14 | 33,945,739 | 33,945,748 | 08/15/22 - 02/15/36 | 27,125,000 | 16,169,404 | |||||||||||||
| U.S. Treasury Notes | ||||||||||||||||||
| 1.50% - 8.00% | ||||||||||||||||||
| 12/31/18 - 05/15/22 | 15,109,500 | 18,455,296 | ||||||||||||||||
In the event of counterparty default, the Funds have the right to collect the collateral to offset losses incurred. There is potential loss to the Funds in the event the Funds are delayed or prevented from exercising their rights to dispose of the collateral securities, including the risk of a possible decline in the value of the underlying securities during the period while the Funds seek to assert their rights. The Funds’ investment advisor, acting under the supervision of the Board of Trustees, reviews the value of the collateral and the creditworthiness of those banks and dealers with which the Funds enter into repurchase agreements to evaluate potential risks.
6. Derivative Investment Holdings Categorized by Risk Exposure
U.S. GAAP requires disclosures to enable investors to better understand how and why the Funds use derivative instruments, how these derivative instruments are accounted for and their effects on the Funds’ financial position and results of operations.
| 168 | THE RYDEX FUNDS ANNUAL REPORT |
| NOTES TO FINANCIAL STATEMENTS (continued) |
The following Funds utilized derivatives for the following purposes:
| Futures | Swaps | |||
| Fund | Index Exposure | Liquidity | Index Exposure | Liquidity |
| Nova Fund | x | x | x | x |
| Inverse S&P 500® Strategy Fund | x | x | x | x |
| NASDAQ-100® Fund | x | x | x | x |
| Inverse NASDAQ-100® Strategy Fund | x | x | x | x |
| S&P 500® 2x Strategy Fund | x | x | x | x |
| NASDAQ-100® 2x Strategy Fund | x | x | x | x |
| Mid-Cap 1.5x Strategy Fund | x | x | x | x |
| Inverse Mid-Cap Strategy Fund | x | x | x | x |
| Russell 2000® 2x Strategy Fund | x | x | x | x |
| Russell 2000® 1.5x Strategy Fund | x | x | x | x |
| Inverse Russell 2000® Strategy Fund | x | x | x | x |
| Dow 2x Strategy Fund | x | x | x | x |
| Inverse Dow 2x Strategy Fund | x | x | x | x |
| Government Long Bond 1.2x Strategy Fund | x | x | ||
| Inverse Government Long Bond Strategy Fund | x | x | ||
The following table represents the notional amount of derivative instruments outstanding, as an approximate percentage of the Funds’ net assets on a daily basis.
| Approximate percentage of Fund’s | ||||||||
| net assets on a daily basis | ||||||||
| Fund | Long | Short | ||||||
| Nova Fund | 95 | % | — | |||||
| Inverse S&P 500® Strategy Fund | — | 100 | % | |||||
| NASDAQ-100® Fund | 10 | % | — | |||||
| Inverse NASDAQ-100® Strategy Fund | — | 100 | % | |||||
| S&P 500® 2x Strategy Fund | 145 | % | — | |||||
| NASDAQ-100® 2x Strategy Fund | 125 | % | — | |||||
| Mid-Cap 1.5x Strategy Fund | 90 | % | — | |||||
| Inverse Mid-Cap Strategy Fund | — | 100 | % | |||||
| Russell 2000® 2x Strategy Fund | 145 | % | — | |||||
| Russell 2000® 1.5x Strategy Fund | 80 | % | — | |||||
| Inverse Russell 2000® Strategy Fund | — | 100 | % | |||||
| Dow 2x Strategy Fund | 145 | % | — | |||||
| Inverse Dow 2x Strategy Fund | — | 200 | % | |||||
| Government Long Bond 1.2x Strategy Fund | 75 | % | — | |||||
| Inverse Government Long Bond Strategy Fund | — | 25 | % | |||||
The following is a summary of the location of derivative investments on the Funds’ Statements of Assets and Liabilities as of December 31, 2013:
| Derivative Investment Type | Asset Derivatives | Liability Derivatives |
| Equity/Interest Rate contracts | Variation margin | Variation margin |
| Unrealized appreciation on swap agreements | Unrealized depreciation on swap agreements |
The following table sets forth the fair value of the Funds’ derivative investments categorized by primary risk exposure at December 31, 2013:
Asset Derivative Investments Value
| Futures | Swaps | Futures | ||||||||||||||
| Equity | Equity | Interest Rate | Total Value at | |||||||||||||
| Fund | Contracts* | Contracts | Contracts* | December 31, 2013 | ||||||||||||
| Nova Fund | $ | 42,791 | $ | 74,774 | $ | — | $ | 117,565 | ||||||||
| NASDAQ-100® Fund | 1,247 | 7,844 | — | 9,091 | ||||||||||||
| S&P 500® 2x Strategy Fund | 61,496 | 137,881 | — | 199,377 | ||||||||||||
| NASDAQ-100® 2x Strategy Fund | 14,481 | 161,067 | — | 175,548 | ||||||||||||
| Mid-Cap 1.5x Strategy Fund | 129,370 | 53,949 | — | 183,319 | ||||||||||||
| Russell 2000® 2x Strategy Fund | 3,458 | 7,208 | — | 10,666 | ||||||||||||
| Russell 2000® 1.5x Strategy Fund | 6,927 | 20,703 | — | 27,630 | ||||||||||||
| Dow 2x Strategy Fund | 321,755 | 111,527 | — | 433,282 | ||||||||||||
| Inverse Government Long Bond Strategy Fund | — | — | 68,059 | 68,059 | ||||||||||||
| THE RYDEX FUNDS ANNUAL REPORT | 169 |
NOTES TO FINANCIAL STATEMENTS (continued)
| Liability Derivative Investments Value |
| Futures | Swaps | Futures | ||||||||||||||
| Equity | Equity | Interest Rate | Total Value at | |||||||||||||
| Fund | Contracts* | Contracts | Contracts* | December 31, 2013 | ||||||||||||
| Inverse S&P 500® Strategy Fund | $ | 8,608 | $ | 18,853 | $ | — | $ | 27,461 | ||||||||
| Inverse NASDAQ-100® Strategy Fund | — | 12,867 | — | 12,867 | ||||||||||||
| Inverse Mid-Cap Strategy Fund | — | 4,674 | — | 4,674 | ||||||||||||
| Inverse Russell 2000® Strategy Fund | 2,348 | 2,858 | — | 5,206 | ||||||||||||
| Inverse Dow 2x Strategy Fund | 1,906 | 27,743 | — | 29,649 | ||||||||||||
| Government Long Bond 1.2x Strategy Fund | — | — | 60,882 | 60,882 | ||||||||||||
* Includes cumulative appreciation (depreciation) of futures contracts as reported on the Schedules of Investments. Only current day’s variation margin is reported within the Statements of Assets and Liabilities.
The following is a summary of the location of derivative investments on the Funds’ Statements of Operations for the year ended December 31, 2013:
| Derivative Investment Type | Location of Gain (Loss) on Derivatives |
| Equity/Interest Rate contracts | Net realized gain (loss) on swap agreements |
| Net realized gain (loss) on futures contracts | |
| Net change in unrealized appreciation (depreciation) on swap agreements | |
| Net change in unrealized appreciation (depreciation) on futures contracts |
The following is a summary of the Funds’ realized gain (loss) and change in unrealized appreciation (depreciation) on derivative investments recognized on the Statements of Operations categorized by primary risk exposure for the year ended December 31, 2013:
| Realized Gain (Loss) on Derivative Investments Recognized on the Statements of Operations | ||||||||||||||||
| Futures | Swaps | Futures | ||||||||||||||
| Equity | Equity | Interest Rate | ||||||||||||||
| Fund | Contracts | Contracts | Contracts | Total | ||||||||||||
| Nova Fund | $ | 896,691 | $ | 5,121,371 | $ | — | $ | 6,018,062 | ||||||||
| Inverse S&P 500® Strategy Fund | (780,726 | ) | (2,580,630 | ) | — | (3,361,356 | ) | |||||||||
| NASDAQ-100® Fund | 167,418 | 2,797,431 | — | 2,964,849 | ||||||||||||
| Inverse NASDAQ-100® Strategy Fund | (246,602 | ) | (1,352,343 | ) | — | (1,598,945 | ) | |||||||||
| S&P 500® 2x Strategy Fund | 942,700 | 7,763,679 | — | 8,706,379 | ||||||||||||
| NASDAQ-100® 2x Strategy Fund | 1,443,844 | 12,467,607 | — | 13,911,451 | ||||||||||||
| Mid-Cap 1.5x Strategy Fund | 478,607 | 1,844,276 | — | 2,322,883 | ||||||||||||
| Inverse Mid-Cap Strategy Fund | (75,166 | ) | (334,308 | ) | — | (409,474 | ) | |||||||||
| Russell 2000® 2x Strategy Fund | 137,423 | 1,426,549 | — | 1,563,972 | ||||||||||||
| Russell 2000® 1.5x Strategy Fund | 288,382 | 2,854,788 | — | 3,143,170 | ||||||||||||
| Inverse Russell 2000® Strategy Fund | (298,059 | ) | (1,000,569 | ) | — | (1,298,628 | ) | |||||||||
| Dow 2x Strategy Fund | 937,248 | 5,401,728 | — | 6,338,976 | ||||||||||||
| Inverse Dow 2x Strategy Fund | (567,011 | ) | (2,944,841 | ) | — | (3,511,852 | ) | |||||||||
| Government Long Bond 1.2x Strategy Fund | — | — | (7,150,864 | ) | (7,150,864 | ) | ||||||||||
| Inverse Government Long Bond Strategy Fund | — | — | 1,294,701 | 1,294,701 | ||||||||||||
| Change in Unrealized Appreciation (Depreciation) on Derivative Investments Recognized on the Statements of Operations | ||||||||||||||||
| Futures | Swaps | Futures | ||||||||||||||
| Equity | Equity | Interest Rate | ||||||||||||||
| Fund | Contracts | Contracts | Contracts | Total | ||||||||||||
| Nova Fund | $ | 27,199 | $ | (145,578 | ) | $ | — | $ | (118,379 | ) | ||||||
| Inverse S&P 500® Strategy Fund | (6,642 | ) | 23,975 | — | 17,333 | |||||||||||
| NASDAQ-100® Fund | 1,525 | (44,832 | ) | — | (43,307 | ) | ||||||||||
| Inverse NASDAQ-100® Strategy Fund | (11,522 | ) | 81,795 | — | 70,273 | |||||||||||
| S&P 500® 2x Strategy Fund | 65,063 | 81,942 | — | 147,005 | ||||||||||||
| NASDAQ-100® 2x Strategy Fund | (9,715 | ) | (395,166 | ) | — | (404,881 | ) | |||||||||
| Mid-Cap 1.5x Strategy Fund | 8,951 | 3,515 | — | 12,466 | ||||||||||||
| Inverse Mid-Cap Strategy Fund | 4,655 | 25,402 | — | 30,057 | ||||||||||||
| Russell 2000® 2x Strategy Fund | 2,174 | (53,213 | ) | — | (51,039 | ) | ||||||||||
| Russell 2000® 1.5x Strategy Fund | 488 | (80,472 | ) | — | (79,984 | ) | ||||||||||
| Inverse Russell 2000® Strategy Fund | 927 | 38,924 | — | 39,851 | ||||||||||||
| Dow 2x Strategy Fund | 350,563 | (134,114 | ) | — | 216,449 | |||||||||||
| Inverse Dow 2x Strategy Fund | (1,663 | ) | 80,630 | — | 78,967 | |||||||||||
| Government Long Bond 1.2x Strategy Fund | — | — | (39,361 | ) | (39,361 | ) | ||||||||||
| Inverse Government Long Bond Strategy Fund | — | — | (18,406 | ) | (18,406 | ) | ||||||||||
| 170 | THE RYDEX FUNDS ANNUAL REPORT |
| NOTES TO FINANCIAL STATEMENTS (continued) |
7. Federal Income Tax Information
The Funds intend to comply with the provisions of Subchapter M of the Internal Revenue Code applicable to regulated investment companies and will distribute substantially all taxable net investment income and capital gains sufficient to relieve the Funds from all, or substantially all, federal income, excise and state income taxes. Therefore, no provision for federal or state income tax is required.
Tax positions taken or expected to be taken in the course of preparing the Funds’ tax returns are evaluated to determine whether the tax positions are “more-likely-than-not” of being sustained by the applicable tax authority. Tax positions not deemed to meet the more-likely-than-not threshold would be recorded as a tax benefit or expense in the current year. Management has analyzed the Funds’ tax positions taken, or to be taken, on Federal income tax returns for all open tax years, and has concluded that no provision for income tax is required in the Funds’ financial statements. A Fund’s federal tax returns are subject to examination by the Internal Revenue Service for a period of three fiscal years after they are filed.
The RIC Modernization Act of 2010 was signed into law on December 22, 2010, and seeks to simplify some of the tax provisions applicable to regulated investment companies, the tax reporting to their shareholders and improved the tax efficiency of certain fund structures. The greatest impact to the disclosure in the financial reports for the Funds was on the treatment of net capital losses, effective for tax years beginning after December 22, 2010.
One of the more prominent changes addresses capital loss carryforwards. Funds are permitted to carry forward capital losses incurred in taxable years beginning after December 22, 2010 for an unlimited period. However, any losses incurred during those future taxable years will be required to be utilized prior to the losses incurred in pre-enactment taxable years. Under pre-enactment law, capital losses could be carried forward for eight years, and carried forward as short-term capital, irrespective of the character of the original loss. As a result of this ordering rule, pre-enactment capital carryforwards may potentially expire unused. Additionally, post-enactment capital losses that are carried forward will retain their character as either short-term or long-term capital losses rather than being considered all short-term as under previous law.
Tax basis capital losses in excess of capital gains are carried forward to offset future net capital gains. For the year ended December 31, 2013, the following capital loss carryforward amounts expired, were used, or were permanently lost due to loss limitation rules in Section 382 of the Internal Revenue Code:
| Fund | Amount | |||
| Nova Fund | $ | 6,442,510 | ||
| Inverse S&P 500® Strategy Fund | 9,844,255 | |||
| NASDAQ-100® Fund | 7,862,182 | |||
| Inverse NASDAQ-100® Strategy Fund | 22,405,239 | |||
| S&P 500® 2x Strategy Fund | 2,013,641 | |||
| NASDAQ-100® 2x Strategy Fund | 778,442 | |||
| Mid-Cap 1.5x Strategy Fund | 1,616,601 | |||
| Inverse Mid-Cap Strategy Fund | 2,347,556 | |||
| Russell 2000® 2x Strategy Fund | 425,778 | |||
| Russell 2000® 1.5x Strategy Fund | 3,713,959 | |||
| Inverse Russell 2000® Strategy Fund | 14,367,289 | |||
| Dow 2x Strategy Fund | 17,760,631 | |||
| Inverse Dow 2x Strategy Fund | 20,787,715 | |||
| Inverse Government Long Bond Strategy Fund | 11,897,730 | |||
| THE RYDEX FUNDS ANNUAL REPORT | 171 |
| NOTES TO FINANCIAL STATEMENTS (continued) |
The tax character of distributions paid during the year ended December 31, 2013 was as follows:
| Ordinary | Long-Term | Total | ||||||||||
| Fund | Income | Capital Gain | Distributions | |||||||||
| Nova Fund | $ | 31,195 | $ | — | $ | 31,195 | ||||||
| NASDAQ-100® 2x Strategy Fund | 3,543,395 | 519,241 | 4,062,636 | |||||||||
| Government Long Bond 1.2x Strategy Fund | 2,086,252 | 95,676 | 2,181,928 | |||||||||
| U.S. Government Money Market Fund | 1,025 | — | 1,025 | |||||||||
The tax character of distributions paid during the year ended December 31, 2012 was as follows:
| Ordinary | Long-Term | Total | ||||||||||
| Fund | Income | Capital Gain | Distributions | |||||||||
| Government Long Bond 1.2x Strategy Fund | $ | 7,427,667 | $ | 2,799,471 | $ | 10,227,138 | ||||||
| U.S. Government Money Market Fund | 4,169 | — | 4,169 | |||||||||
Note: For federal income tax purposes, short-term capital gain distributions are treated as ordinary income distributions.
The tax character of distributable earnings/(accumulated losses) at December 31, 2013 was as follows:
| Undistributed | Undistributed | Net Unrealized | ||||||||||||||
| Ordinary | Long-Term | Appreciation/ | Capital Loss | |||||||||||||
| Fund | Income | Capital Gain | (Depreciation) | Carryforward1 | ||||||||||||
| Nova Fund | $ | 31,897 | $ | — | $ | 9,533,826 | $ | (15,207,100 | ) | |||||||
| Inverse S&P 500® Strategy Fund | — | — | (18,851 | ) | (9,828,109 | ) | ||||||||||
| NASDAQ-100® Fund | — | 3,732,524 | 23,049,055 | — | ||||||||||||
| Inverse NASDAQ-100® Strategy Fund | — | — | (12,868 | ) | (3,564,590 | ) | ||||||||||
| S&P 500® 2x Strategy Fund | 6,353,526 | 586,853 | 4,639,815 | (1,655,381 | ) | |||||||||||
| NASDAQ-100® 2x Strategy Fund | 12,919,105 | 6,529,179 | 6,975,446 | (2,335,326 | ) | |||||||||||
| Mid-Cap 1.5x Strategy Fund | 731,333 | 1,196,342 | 2,651,474 | (2,028,748 | ) | |||||||||||
| Inverse Mid-Cap Strategy Fund | — | — | (4,674 | ) | (1,277,180 | ) | ||||||||||
| Russell 2000® 2x Strategy Fund | 1,056,656 | 218,120 | 976,228 | (540,425 | ) | |||||||||||
| Russell 2000® 1.5x Strategy Fund | — | — | 2,458,453 | (4,949,446 | ) | |||||||||||
| Inverse Russell 2000® Strategy Fund | — | — | (2,858 | ) | (2,939,979 | ) | ||||||||||
| Dow 2x Strategy Fund | 4,945,594 | 916,874 | 1,500,204 | (3,475,348 | ) | |||||||||||
| Inverse Dow 2x Strategy Fund | — | — | (27,740 | ) | (11,746,867 | ) | ||||||||||
| Government Long Bond 1.2x Strategy Fund | 62 | — | (202,908 | ) | (15,831,974 | ) | ||||||||||
| Inverse Government Long Bond Strategy Fund | 122,585 | 554,052 | 178,502 | (3,777,995 | ) | |||||||||||
| U.S. Government Money Market Fund | 7 | — | — | — | ||||||||||||
| 172 | THE RYDEX FUNDS ANNUAL REPORT |
| NOTES TO FINANCIAL STATEMENTS (continued) |
1 A summary of the expiration of the aforementioned Capital Loss Carryforward is as follows:
| Total | ||||||||||||||||||||||||
| Expires in | Expires in | Expires in | Unlimited | Unlimited | Capital Loss | |||||||||||||||||||
| Fund | 2016 | 2017 | 2018 | Short-Term | Long-Term | Carryforward | ||||||||||||||||||
| Nova Fund | $ | (15,207,100 | ) | $ | — | $ | — | $ | — | $ | — | $ | (15,207,100 | ) | ||||||||||
| Inverse S&P 500® Strategy Fund | — | — | — | (8,214,061 | ) | (1,614,048 | ) | (9,828,109 | )* | |||||||||||||||
| Inverse NASDAQ-100® Strategy Fund | — | — | — | (2,856,468 | ) | (708,122 | ) | (3,564,590 | )* | |||||||||||||||
| S&P 500® 2x Strategy Fund | (1,564,932 | ) | (90,449 | ) | — | — | — | (1,655,381 | )* | |||||||||||||||
| NASDAQ-100® 2x Strategy Fund | (2,335,326 | ) | — | — | — | — | (2,335,326 | )* | ||||||||||||||||
| Mid-Cap 1.5x Strategy Fund | (1,521,561 | ) | (507,187 | ) | — | — | — | (2,028,748 | )* | |||||||||||||||
| Inverse Mid-Cap Strategy Fund | — | — | — | (1,178,198 | ) | (98,982 | ) | (1,277,180 | )* | |||||||||||||||
| Russell 2000® 2x Strategy Fund | (405,318 | ) | (135,107 | ) | — | — | — | (540,425 | )* | |||||||||||||||
| Russell 2000® 1.5x Strategy Fund | (4,949,446 | ) | — | — | — | — | (4,949,446 | ) | ||||||||||||||||
| Inverse Russell 2000® Strategy Fund | — | — | — | (2,542,044 | ) | (397,935 | ) | (2,939,979 | )* | |||||||||||||||
| Dow 2x Strategy Fund | (2,606,511 | ) | (868,837 | ) | — | — | — | (3,475,348 | ) | |||||||||||||||
| Inverse Dow 2x Strategy Fund | — | — | — | (10,111,423 | ) | (1,635,444 | ) | (11,746,867 | )* | |||||||||||||||
| Government Long Bond 1.2x Strategy Fund | — | — | — | (11,517,839 | ) | (4,314,135 | ) | (15,831,974 | ) | |||||||||||||||
| Inverse Government Long Bond Strategy Fund | — | — | — | (2,713,266 | ) | (1,064,729 | ) | (3,777,995 | )* | |||||||||||||||
*In accordance with section 382 of the Internal Revenue Code, a portion of certain fund losses are subject to an annual limitation. Note, this annual limitation is generally applicable to all of the capital loss carryforwards shown with respect to each Fund.
Net investment income and net realized gains (losses) may differ for financial statement and tax purposes because of temporary or permanent book/tax differences. These differences are primarily due to wash sales, “mark-to-market” of passive foreign investment companies and foreign currency gains and losses. Additional differences may result from the tax treatment of net investment losses and expired capital loss carryforwards. To the extent these differences are permanent, reclassifications are made to the appropriate equity accounts in the period that the differences arise. These reclassifications have no effect on net assets or NAV per share.
On the Statements of Assets and Liabilities the following adjustments were made for permanent book/tax differences:
| Undistributed | Accumulated | |||||||||||
| Paid In | Net Investment | Net Realized | ||||||||||
| Fund | Capital | Income (Loss) | Gain (Loss) | |||||||||
| Nova Fund | $ | (1,921 | ) | $ | (4,191 | ) | $ | 6,112 | ||||
| Inverse S&P 500® Strategy Fund | (10,028,550 | ) | 184,295 | 9,844,255 | ||||||||
| NASDAQ-100® Fund | (196,334 | ) | 185,001 | 11,333 | ||||||||
| Inverse NASDAQ-100® Strategy Fund | (22,481,977 | ) | 76,738 | 22,405,239 | ||||||||
| S&P 500® 2x Strategy Fund | (499 | ) | 111,575 | (111,076 | ) | |||||||
| NASDAQ-100® 2x Strategy Fund | — | 260,631 | (260,631 | ) | ||||||||
| Mid-Cap 1.5x Strategy Fund | (6,660 | ) | 86,918 | (80,258 | ) | |||||||
| Inverse Mid-Cap Strategy Fund | (2,371,404 | ) | 23,848 | 2,347,556 | ||||||||
| Russell 2000® 2x Strategy Fund | (1,036 | ) | 37,245 | (36,209 | ) | |||||||
| Russell 2000® 1.5x Strategy Fund | (116,418 | ) | 106,672 | 9,746 | ||||||||
| Inverse Russell 2000® Strategy Fund | (14,420,128 | ) | 52,839 | 14,367,289 | ||||||||
| Dow 2x Strategy Fund | (15,796,504 | ) | 55,945 | 15,740,559 | ||||||||
| Inverse Dow 2x Strategy Fund | (20,893,324 | ) | 105,609 | 20,787,715 | ||||||||
| Government Long Bond 1.2x Strategy Fund | — | — | — | |||||||||
| Inverse Government Long Bond Strategy Fund | (11,205,273 | ) | 581,521 | 10,623,752 | ||||||||
| U.S. Government Money Market Fund | — | — | — | |||||||||
| THE RYDEX FUNDS ANNUAL REPORT | 173 |
| NOTES TO FINANCIAL STATEMENTS (continued) |
At December 31, 2013, the cost of securities for Federal income tax purposes, the aggregate gross unrealized gain for all securities for which there was an excess of value over tax cost and the aggregate gross unrealized loss for all securities for which there was an excess of tax cost over value, were as follows:
| Tax | Tax | Net | ||||||||||||||
| Tax | Unrealized | Unrealized | Unrealized | |||||||||||||
| Fund | Cost | Gain | Loss | Gain (Loss) | ||||||||||||
| Nova Fund | $ | 23,640,177 | $ | 9,486,015 | $ | (26,963 | ) | $ | 9,459,052 | |||||||
| Inverse S&P 500® Strategy Fund | 6,867,416 | 2 | — | 2 | ||||||||||||
| NASDAQ-100® Fund | 47,191,324 | 23,126,317 | (85,106 | ) | 23,041,211 | |||||||||||
| Inverse NASDAQ-100® Strategy Fund | 2,268,925 | — | — | — | ||||||||||||
| S&P 500® 2x Strategy Fund | 23,352,674 | 4,517,609 | (15,676 | ) | 4,501,933 | |||||||||||
| NASDAQ-100® 2x Strategy Fund | 37,139,092 | 6,950,954 | (136,575 | ) | 6,814,379 | |||||||||||
| Mid-Cap 1.5x Strategy Fund | 10,847,227 | 2,606,662 | (9,137 | ) | 2,597,525 | |||||||||||
| Inverse Mid-Cap Strategy Fund | 1,101,644 | — | — | — | ||||||||||||
| Russell 2000® 2x Strategy Fund | 3,134,358 | 1,016,832 | (47,812 | ) | 969,020 | |||||||||||
| Russell 2000® 1.5x Strategy Fund | 13,285,504 | 2,470,594 | (32,844 | ) | 2,437,750 | |||||||||||
| Inverse Russell 2000® Strategy Fund | 1,946,083 | — | — | — | ||||||||||||
| Dow 2x Strategy Fund | 18,621,029 | 1,441,503 | (52,826 | ) | 1,388,677 | |||||||||||
| Inverse Dow 2x Strategy Fund | 2,621,477 | 3 | — | 3 | ||||||||||||
| Government Long Bond 1.2x Strategy Fund | 10,068,102 | — | (202,908 | ) | (202,908 | ) | ||||||||||
| Inverse Government Long Bond Strategy Fund | 36,875,802 | — | (82,572 | ) | (82,572 | ) | ||||||||||
| U.S. Government Money Market Fund | 102,184,988 | — | — | — | ||||||||||||
8. Securities Transactions
For the year ended December 31, 2013, the cost of purchases and proceeds from sales of investment securities, excluding government securities and short-term investments, were as follows:
| Fund | Purchases | Sales | ||||||
| Nova Fund | $ | 74,166,283 | $ | 70,326,340 | ||||
| Inverse S&P 500® Strategy Fund | — | — | ||||||
| NASDAQ-100® Fund | 100,253,381 | 80,445,172 | ||||||
| Inverse NASDAQ-100® Strategy Fund | — | — | ||||||
| S&P 500® 2x Strategy Fund | 33,257,760 | 29,088,488 | ||||||
| NASDAQ-100® 2x Strategy Fund | 56,118,723 | 44,311,126 | ||||||
| Mid-Cap 1.5x Strategy Fund | 27,105,782 | 27,955,539 | ||||||
| Inverse Mid-Cap Strategy Fund | — | — | ||||||
| Russell 2000® 2x Strategy Fund | 2,281,444 | 2,634,515 | ||||||
| Russell 2000® 1.5x Strategy Fund | 34,494,568 | 35,309,255 | ||||||
| Inverse Russell 2000® Strategy Fund | — | — | ||||||
| Dow 2x Strategy Fund | 73,623,958 | 82,744,906 | ||||||
| Inverse Dow 2x Strategy Fund | — | — | ||||||
| Government Long Bond 1.2x Strategy Fund | — | — | ||||||
| Inverse Government Long Bond Strategy Fund | — | — | ||||||
| U.S. Government Money Market Fund | — | — | ||||||
For the year ended December 31, 2013, the cost of purchases and proceeds from sales of government securities were:
| Fund | Purchases | Sales | ||||||
| Government Long Bond 1.2x Strategy Fund | $ | 681,844,036 | $ | 679,000,156 | ||||
| Inverse Government Long Bond Strategy Fund | 469,829,073 | 458,316,344 | ||||||
| 174 | THE RYDEX FUNDS ANNUAL REPORT |
NOTES TO FINANCIAL STATEMENTS (continued)
9. Line of Credit
The Trust, along with other affiliated trusts, secured an uncommitted, $75,000,000 line of credit from U.S. Bank, N.A., which expires June 15, 2014. This line of credit is reserved for emergency or temporary purposes. Borrowings, if any, under this arrangement bear interest equal to the Prime Rate, minus 2%, which shall be paid monthly, averaging 1.25% for the year ended December 31, 2013. The Funds did not have any borrowings under this agreement at December 31, 2013.
The average daily balances borrowed for the year ended December 31, 2013, were as follows:
| Fund | Average Daily Balance | |||
| Nova Fund | $ 4,096 | |||
| NASDAQ-100® Fund | 2,515 | |||
| S&P 500® 2x Strategy Fund | 2,704 | |||
| NASDAQ-100® 2x Strategy Fund | 6,329 | |||
| Mid-Cap 1.5x Strategy Fund | 3,773 | |||
| Russell 2000® 2x Strategy Fund | 436 | |||
| Russell 2000® 1.5x Strategy Fund | 1,841 | |||
| Dow 2x Strategy Fund | 9,838 | |||
| Government Long Bond 1.2x Strategy Fund | 20,474 | |||
| Inverse Government Long Bond Strategy Fund | 2,688 | |||
10. Portfolio Securities Loaned
The Funds may lend their securities to approved brokers to earn additional income. Security lending income shown on the Statements of Operations is shown net of rebates paid to the borrowers and earnings on cash collateral investments shared with the lending agent. Within this arrangement, the Funds act as the lender, Credit Suisse acts as the lending agent, and other approved registered broker dealers act as the borrowers. The Funds receive cash collateral, valued at 102% of the value of the securities on loan. Under the terms of the Funds’ securities lending agreement with Credit Suisse, cash collateral is invested in one or more joint repurchase agreements collateralized by obligations of the U.S. Treasury or Government Agencies and cash. The Funds bear the risk of loss on cash collateral investments. Collateral is maintained over the life of the loan in an amount not less than the value of loaned securities, as determined at the close of fund business each day; any additional collateral required due to changes in security values is delivered to the Funds the next business day. Although the collateral mitigates the risk, the Funds could experience a delay in recovering its securities and a possible loss of income or value if the borrower fails to return the securities. The Funds have the right under the securities lending agreement to recover the securities from the borrower on demand.
At December 31, 2013, the Funds participated in securities lending as follows:
| Fund | Value of Securities Loaned | Cash Collateral Received | ||||||
| NASDAQ-100® Fund | $462,126 | $475,675 | ||||||
| Mid-Cap 1.5x Strategy Fund | 148,091 | 151,275 | ||||||
| Russell 2000® 2x Strategy Fund | 853 | 885 | ||||||
| Russell 2000® 1.5x Strategy Fund | 8,099 | 8,940 | ||||||
Cash collateral received was invested in the following joint repurchase agreements at December 31, 2013:
| Counterparty and Terms of Agreement | Face Value | Repurchase Price | Collateral | Par Value | Fair Value | |||||||||||||
| HSBC Securities, Inc. | Freddie Mac | |||||||||||||||||
| 0.01% | 0.00% | |||||||||||||||||
| Due 01/02/14 | $554,973 | $554,973 | 01/15/14 - 07/15/32 | $940,471 | $566,137 | |||||||||||||
| Deutsche Bank Securities, Inc. | Fannie Mae | |||||||||||||||||
| 0.02% | 0.00% - 1.38% | |||||||||||||||||
| Due 01/02/14 | 81,803 | 81,803 | 11/15/16 - 05/15/30 | 125,232 | 83,178 | |||||||||||||
| Federal Home Loan Bank | ||||||||||||||||||
| 0.38% | ||||||||||||||||||
| 06/24/16 | 139 | 138 | ||||||||||||||||
| Freddie Mac | ||||||||||||||||||
| 3.00% | ||||||||||||||||||
| 07/28/14 | 83 | 84 | ||||||||||||||||
| THE RYDEX FUNDS ANNUAL REPORT | 175 |
| NOTES TO FINANCIAL STATEMENTS (continued) |
11. Offsetting
In the normal course of business, the Funds enter into transactions subject to enforceable master netting arrangements or other similar arrangements. Generally, the right to offset in those agreements allows the Funds to counteract the exposure to a specific counterparty with collateral received or delivered to that counterparty based on the terms of the arrangements. These arrangements provide for the right to liquidate upon the occurrence of an event of default, credit event upon merger or additional termination event.
In order to better define their contractual rights and to secure rights that will help the Funds mitigate their counterparty risk, the Funds may enter into an International Swaps and Derivatives Association, Inc. Master Agreement (“ISDA Master Agreement”) or similar agreement with their derivative contract counterparties. An ISDA Master Agreement is a bilateral agreement between a Fund and a counterparty that governs OTC derivatives, including foreign exchange contracts, and typically contains, among other things, collateral posting terms and netting provisions in the event of a default and/or termination event. The provisions of the ISDA Master Agreement typically permit a single net payment in the event of a default (close-out netting) or similar event, including the bankruptcy or insolvency of the counterparty.
For derivatives traded under an ISDA Master Agreement, the collateral requirements are typically calculated by netting the mark to market amount for each transaction under such agreement and comparing that amount to the value of any collateral currently pledged by the Funds and the counterparty. For financial reporting purposes, cash collateral that has been pledged to cover obligations of the Funds and cash collateral received from the counterparty, if any, is reported separately on the Statement of Assets and Liabilities as segregated cash with broker/ receivable for variation margin, or payable for swap settlement/variation margin. Generally, the amount of collateral due from or to a counterparty must exceed a minimum transfer amount threshold (e.g., $300,000) before a transfer is required to be made. To the extent amounts due to the Funds from their counterparties are not fully collateralized, contractually or otherwise, the Funds bear the risk of loss from counterparty nonperformance. The Funds attempt to mitigate counterparty risk by only entering into agreements with counterparties that they believe to be of good standing and by monitoring the financial stability of those counterparties.
For financial reporting purposes, the Funds do not offset derivative assets and derivative liabilities that are subject to netting arrangements in the Statement of Assets and Liabilities.
The following tables present derivative financial instruments and secured financing transactions that are subject to enforceable netting arrangements and offset in the Statements of Assets and Liabilities in conformity with U.S. GAAP.
| Gross Amounts Not Offset | ||||||||||||||||||||||||||
| in the Statements of Assets | ||||||||||||||||||||||||||
| and Liabilities | ||||||||||||||||||||||||||
| Fund | Instrument | Gross Amounts of Recognized Assets1 | Gross Amounts Offset in the Statements of Assets and Liabilities | Net Amount of Assets Presented on the Statements of Assets and Liabilities | Financial Instruments | Cash Collateral Received2 | Net Amount | |||||||||||||||||||
| Nova Fund | Swap equity contracts | $ | 74,774 | $ | — | $ | 74,774 | $ | — | $ | — | $ | 74,774 | |||||||||||||
| NASDAQ-100® Fund | Swap equity contracts | 7,844 | — | 7,844 | — | — | 7,844 | |||||||||||||||||||
| S&P 500® 2x Strategy Fund | Swap equity contracts | 137,881 | — | 137,881 | — | — | 137,881 | |||||||||||||||||||
| NASDAQ-100® 2x Strategy Fund | Swap equity contracts | 161,067 | — | 161,067 | — | — | 161,067 | |||||||||||||||||||
| Mid-Cap 1.5x Strategy Fund | Swap equity contracts | 53,949 | — | 53,949 | — | — | 53,949 | |||||||||||||||||||
| Russell 2000® 2x Strategy Fund | Swap equity contracts | 7,208 | — | 7,208 | — | — | 7,208 | |||||||||||||||||||
| Russell 2000® 1.5x Strategy Fund | Swap equity contracts | 20,703 | — | 20,703 | — | — | 20,703 | |||||||||||||||||||
| Dow 2x Strategy Fund | Swap equity contracts | 111,527 | — | 111,527 | — | — | 111,527 | |||||||||||||||||||
| 176 | THE RYDEX FUNDS ANNUAL REPORT |
| NOTES TO FINANCIAL STATEMENTS (continued) |
| Gross Amounts Not Offset | ||||||||||||||||||||||||||
| in the Statements of Assets | ||||||||||||||||||||||||||
| and Liabilities | ||||||||||||||||||||||||||
| Fund | Instrument | Gross Amounts of Recognized Liabilities1 | Gross Amounts Offset in the Statements of Assets and Liabilities | Net Amount of Liabilities Presented on the Statements of Assets and Liabilities | Financial Instruments | Cash Collateral Pledged2 | Net Amount | |||||||||||||||||||
| Inverse S&P 500® Strategy Fund | Swap equity contracts | $ | 18,853 | $ | — | $ | 18,853 | $ | — | $ | — | $ | 18,853 | |||||||||||||
| Inverse NASDAQ-100® Strategy Fund | Swap equity contracts | 12,867 | — | 12,867 | — | — | 12,867 | |||||||||||||||||||
| Inverse Mid-Cap Strategy Fund | Swap equity contracts | 4,674 | — | 4,674 | — | — | 4,674 | |||||||||||||||||||
| Inverse Russell 2000® Strategy Fund | Swap equity contracts | 2,858 | — | 2,858 | — | — | 2,858 | |||||||||||||||||||
| Inverse Dow 2x Strategy Fund | Swap equity contracts | 27,743 | — | 27,743 | — | — | 27,743 | |||||||||||||||||||
| 1 | Exchange traded futures are excluded from these reported amounts. |
| 2 | Excludes maintenance margin deposits held at the broker related to derivatives. These amounts are reflected as Segregated cash with broker on the Statements of Assets and Liabilities. |
12. Legal Proceedings
Tribune Company
Rydex Variable Trust has been named as a defendant in the case entitled Marc S. Kirscher, as Litigation Trustee for the Tribune Litigation Trust v. FitzSimons, No. 12-2652 (S.D.N.Y.) (formerly Official Committee of Unsecured Creditors of Tribune Co. v. FitzSimons, Adv. Pro. No. 10-54010 (Bankr. D. Del.)) (the “FitzSimons” Action), as a result of the ownership of shares in the Tribune Company (“Tribune”) in 2007 by certain series of the Rydex Variable Trust when Tribune effected a leveraged buyout transaction (“LBO”) by which Tribune converted to a privately-held company. The plaintiff has alleged that, in connection with the LBO, insiders and shareholders were paid for their Tribune stock using financing that the insiders knew would, and ultimately did, leave the Tribune insolvent. The plaintiff has asserted claims against certain insiders, shareholders, professional advisers, and others involved in the LBO, and is attempting to obtain from these individuals and entities the proceeds paid out in connection with the LBO.
Rydex Variable Trust also has been named as a defendant in one or more of a group of lawsuits filed by a group of Tribune creditors that allege state law constructive fraudulent conveyance claims against former Tribune shareholders (the “SLCFC actions”).
The FitzSimons action and the SLCFC actions have been consolidated with the majority of the other Tribune LBO-related lawsuits in a multidistrict litigation proceeding captioned In re Tribune Company Fraudulent Conveyance Litig., No. 11-md-2696 (S.D.N.Y.) (the “MDL Proceeding”). On September 23, 2013, the District Court granted the defendants’ omnibus motion to dismiss the SLCFC actions, on the basis that the creditors lacked standing. On September 30, 2013, the creditors filed a notice of appeal of the September 23 order. On October 28, 2013, the defendants filed a joint notice of cross-appeal of that same order.
On November 20, 2013, the District Court ordered the parties in the FitzSimons action to meet and confer regarding a potential protocol for the briefing and argument of motions to dismiss to be filed in that action. On January 24, 2014, the Court extended the time for service of summonses and complaints in the FitzSimons action to February 28, 2014.
None of these lawsuits allege any wrongdoing on the part of Rydex Variable Trust. The following series of Rydex Variable Trust held shares of Tribune and tendered these shares as part of Tribune’s LBO: Nova Fund, S&P 500® 2x Strategy Fund, Multi-Cap Core Equity Fund, S&P 500® Pure Value Fund, Hedged Equity Fund and Multi-Hedge Strategies Fund (the “Funds”). The value of the proceeds received by the foregoing Funds was $12,580, $2,380, $1,360, $148,376, $2,720, and $119,034, respectively. At this stage of the proceedings, Rydex Variable Trust is not able to make a reliable predication as to the outcome of these lawsuits or the effect, if any, on a Fund’s net asset value.
| THE RYDEX FUNDS ANNUAL REPORT | 177 |
| NOTES TO FINANCIAL STATEMENTS (concluded) |
Lyondell Chemical Company
In December 2011, Rydex Variable Trust was named as a defendant in Weisfelner, as Trustee of the LB Creditor Trust, v. Fund 1 (In re Lyondell Chemical Co.), Adv. Pro. No. 10-4609 (Bankr. S.D.N.Y.).
Similar to the claims made in the Tribune matter, the Weisfelner complaint seeks to have set aside and recovered as fraudulent transfers from former Lyondell Chemical Company (“Lyondell”) shareholders the consideration paid to them pursuant to the cash out merger of Lyondell shareholders in connection with the combination of Lyondell and Basell AF in 2007. Lyondell filed for bankruptcy in 2008.
On January 14, 2014, the Court granted in part and denied in part the defendants’ motion to dismiss the Creditor Trust action. In particular, the Court dismissed all defendants who were conduits for the proceeds from the merger transaction, and also ruled that the plaintiff could not bring any claims on behalf of certain entities who had ratified the merger transaction. The Court also dismissed without prejudice the plaintiff’s claims for intentional fraudulent transfer against the remaining defendants, and gave the Credit Trustee leave to replead these claims. Finally, the Court denied the motion to dismiss with respect to the plaintiff’s claims for constructive fraudulent transfer against the remaining defendants.
This lawsuit does not allege any wrongdoing on the part of Rydex Variable Trust. The following series of Rydex Variable Trust received cash proceeds from the cash out merger in the following amounts: Basic Materials Fund - $1,235,952; U.S. Long Short Momentum Fund - $523,200; Multi-Cap Core Equity Fund - $5,760; Hedged Equity Fund - $480; and Multi-Hedge Strategies Fund - $112,848. At this stage of the proceedings, Rydex Variable Trust is not able to make a reliable predication as to the outcome of these lawsuits or the effect, if any, on a Fund’s net asset value.
13. Subsequent Event
Effective January 24, 2014, a reverse share split occurred for the following Funds:
| Fund | Split Type |
| Inverse Nasdaq-100® Strategy Fund | One–for-five reverse split |
| Inverse Mid-Cap Strategy Fund | One–for-three reverse split |
| Inverse Russell 2000® Strategy Fund | One–for-three reverse split |
| Inverse Dow 2x Strategy Fund | One–for-ten reverse split |
| Government Long Bond 1.2x Strategy Fund | One–for-three reverse split |
| Inverse Government Long Bond Strategy Fund | One–for-five reverse split |
The effect of the transaction was to divide the number of outstanding shares of the Fund by the respective split ratio, resulting in a corresponding increase in the net asset value per share. The shares outstanding and the net asset value per share on the statement of assets and liabilities as of December 31, 2013, the share transaction presented in the statements of changes in net assets for each of the two years ended and the per share data in the financial highlights for each of the years in the five year period then ended, have been given retroactive effect to reflect the reverse share split. There were no changes in net assets, results of operations or total return as a result of the transactions.
| 178 | THE RYDEX FUNDS ANNUAL REPORT |
| REPORT OF INDEPENDENT REGISTERED PUBLIC ACCOUNTING FIRM |
To the Board of Trustees and Shareholders
of Rydex Variable Trust:
We have audited the accompanying statements of assets and liabilities, including the schedules of investments, of Nova Fund, Inverse S&P 500® Strategy Fund, NASDAQ-100® Fund, Inverse NASDAQ-100® Strategy Fund, S&P 500® 2x Strategy Fund, NASDAQ-100® 2x Strategy Fund, Mid-Cap 1.5x Strategy Fund, Inverse Mid-Cap Strategy Fund, Russell 2000® 2x Strategy Fund, Russell 2000® 1.5x Strategy Fund, Inverse Russell 2000® Strategy Fund, Dow 2x Strategy Fund, Inverse Dow 2x Strategy Fund, Government Long Bond 1.2x Strategy Fund, Inverse Government Long Bond Strategy Fund and U.S. Government Money Market Fund (sixteen of the series constituting the Rydex Variable Trust) (the “Funds”) as of December 31, 2013, and the related statements of operations for the year then ended, the statements of changes in net assets for each of the two years in the period then ended, and the financial highlights for each of the five years in the period then ended. These financial statements and financial highlights are the responsibility of the Funds’ management. Our responsibility is to express an opinion on these financial statements and financial highlights based on our audits.
We conducted our audits in accordance with the standards of the Public Company Accounting Oversight Board (United States). Those standards require that we plan and perform the audit to obtain reasonable assurance about whether the financial statements and financial highlights are free of material misstatement. We were not engaged to perform an audit of the Funds’ internal control over financial reporting. Our audits included consideration of internal control over financial reporting as a basis for designing audit procedures that are appropriate in the circumstances, but not for the purpose of expressing an opinion on the effectiveness of the Funds’ internal control over financial reporting. Accordingly, we express no such opinion. An audit also includes examining, on a test basis, evidence supporting the amounts and disclosures in the financial statements and financial highlights, assessing the accounting principles used and significant estimates made by management, and evaluating the overall financial statement presentation. Our procedures included confirmation of securities owned as of December 31, 2013, by correspondence with the custodian and brokers or by other appropriate auditing procedures where replies from brokers were not received. We believe that our audits provide a reasonable basis for our opinion.
In our opinion, the financial statements and financial highlights referred to above present fairly, in all material respects, the financial position of the above listed Funds at December 31, 2013, the results of their operations for the year then ended, the changes in their net assets for each of the two years in the period then ended, and their financial highlights for each of the five years in the period then ended, in conformity with U.S. generally accepted accounting principles.
 |
McLean, Virginia
February 27, 2014
| THE RYDEX FUNDS ANNUAL REPORT | 179 |
| OTHER INFORMATION (Unaudited) |
Tax Information
This information is being provided as required by the Internal Revenue Code. Amounts shown may differ from those elsewhere in the report because of differences in tax and financial reporting practice.
Of the taxable ordinary income distributions paid during the year, the following funds had the corresponding percentages qualify for the dividends received deduction for corporations:
| Fund | % Qualifying | |||
| Nova Fund | 100.00 | % | ||
| NASDAQ-100® 2x Strategy Fund | 7.84 | % | ||
With respect to the taxable year ended December 31, 2013, the Funds hereby designate as capital gain dividends the amounts listed below, or, if subsequently determined to be different, the net capital gain of such year:
| NASDAQ-100® | Government | |||||||
| 2x Strategy | Long Bond 1.2x | |||||||
| Fund | Strategy Fund | |||||||
| From long-term capital gains, subject to the 15% rate gains category: | $ | 519,241 | $ | 95,676 | ||||
Proxy Voting Information
A description of the policies and procedures that the Trust uses to determine how to vote proxies relating to securities held in the Funds’ portfolios is available, without charge and upon request, by calling 1.800.820.0888. This information is also available from the EDGAR database on the SEC’s website at http://www.sec.gov.
Information regarding how the Funds voted proxies relating to portfolio securities during the most recent 12-month period ended June 30 is available without charge, upon request, by calling 1.800.820.0888. This information is also available from the EDGAR database on the SEC’s website at http://www.sec.gov.
Quarterly Portfolio Schedules Information
The Trust files its complete schedule of portfolio holdings with the SEC for the first and third quarters of each fiscal year on Form N-Q; which are available on the SEC’s website at http://www.sec.gov. The Funds’ Forms N-Q may be reviewed and copied at the SEC’s Public Reference Room in Washington, DC, and that information on the operation of the Public Reference Room may be obtained by calling 1-800-SEC-0330. Copies of the portfolio holdings are also available to shareholders, without charge and upon request, by calling 1.800.820.0888.
Office Locations
The offices of Guggenheim Investments can be found in the following locations:
330 Madison Avenue
10th Floor
New York, NY 10017
(Headquarters)
Four Irvington Centre
805 King Farm Boulevard
Suite 600
Rockville, MD 20850
9401 Indian Creek Parkway
40 Corporate Woods
Suite 850
Overland Park, KS 66210
| 180 | the RYDEX FUNDS ANNUAL REPORT |
| INFORMATION ON BOARD OF TRUSTEES AND OFFICERS (Unaudited) |
A Board of Trustees oversees the Trust, as well as other trusts of GI, in which its members have no stated term of service, and continue to serve after election until resignation. The Statement of Additional Information includes further information about Fund Trustees and Officers, and can be obtained without charge by calling 800.820.0888.
All Trustees and Officers may be reached c/o Guggenheim Investments, 805 King Farm Boulevard, Suite 600, Rockville, MD 20850.
| TRUSTEE AND OFFICER | ||||
| Name and | Length of Service as Trustee | Number of Funds | ||
| Year of Birth | (Year Began) | Overseen | ||
| Donald C. Cacciapaglia* | Rydex Series Funds – 2012 | 213 | ||
| (1951) | Rydex Variable Trust – 2012 | |||
| Rydex Dynamic Funds – 2012 | ||||
| Rydex ETF Trust – 2012 |
Principal Occupations During Past Five Years: Current: Security Investors, LLC: President and CEO from April 2012 to present; Guggenheim Investments: President and Chief Administrative Officer from February 2010 to present; Previous: Channel Capital Group, Inc.: Chairman and CEO from April 2002 to February 2010
Positions held within the Trust: Trustee from 2012 to present; President from 2012 to present
| INDEPENDENT TRUSTEES | ||||
| Name and | Length of Service as Trustee | Number of Funds | ||
| Year of Birth | (Year Began) | Overseen | ||
| Corey A. Colehour | Rydex Series Funds – 1993 | 132 | ||
| (1945) | Rydex Variable Trust – 1998 | |||
| Rydex Dynamic Funds – 1999 | ||||
| Rydex ETF Trust – 2003 |
Principal Occupations During Past Five Years: Current: Retired; Previous: President and Senior Vice President of Schield Management Company (registered investment adviser) from 2003 to 2006
Positions held within the Trust: Trustee from 1993 to present; Member of the Audit and Governance and Nominating Committees from 1995 to present
| J. Kenneth Dalton | Rydex Series Funds – 1995 | 132 | ||
| (1941) | Rydex Variable Trust – 1998 | |||
| Rydex Dynamic Funds – 1999 | ||||
| Rydex ETF Trust – 2003 |
Principal Occupations During Past Five Years: Current: Retired
Positions held within the Trust: Trustee from 1995 to present; Member and Chairman of the Audit Committee from 1997 to present; Member of the Governance and Nominating Committees from 1995 to present; and Member of the Risk Oversight Committee from 2010 to present
| John O. Demaret | Rydex Series Funds – 1997 | 132 | ||
| (1940) | Rydex Variable Trust – 1998 | |||
| Rydex Dynamic Funds – 1999 | ||||
| Rydex ETF Trust – 2003 |
Principal Occupations During Past Five Years: Current: Retired
Positions held within the Trust: Trustee from 1997 to present; Chairman of the Board from 2006 to present; Member of the Audit Committee from 1997 to present; and Member of the Risk Oversight Committee from 2010 to present
| THE RYDEX FUNDS ANNUAL REPORT | 181 |
| INFORMATION ON BOARD OF TRUSTEES AND OFFICERS (Unaudited) (continued) |
INDEPENDENT TRUSTEES – concluded
| Name and | Length of Service as Trustee | Number of Funds | ||
| Year of Birth | (Year Began) | Overseen | ||
| Werner E. Keller | Rydex Series Funds – 2005 | 132 | ||
| (1940) | Rydex Variable Trust – 2005 | |||
| Rydex Dynamic Funds – 2005 | ||||
| Rydex ETF Trust – 2005 |
Principal Occupations During Past Five Years: Current: Founder and President of Keller Partners, LLC (investment research firm) from 2005 to present; Previous: Retired from 2001 to 2005
Positions held within the Trust: Vice Chairman of the Board of Trustees from 2010 to present; Trustee and Member of the Audit and Governance and Nominating Committees from 2005 to present; and Chairman and Member of the Risk Oversight Committee from 2010 to present
| Thomas F. Lydon, Jr. | Rydex Series Funds – 2005 | 132 | ||
| (1960) | Rydex Variable Trust – 2005 | |||
| Rydex Dynamic Funds – 2005 | ||||
| Rydex ETF Trust – 2005 |
Principal Occupations During Past Five Years: Current: President of Global Trends Investments (registered investment adviser) from 1996 to present
Positions held within the Trust: Trustee and Member of the Audit and Governance and Nominating Committees from 2005 to present
| Patrick T. McCarville | Rydex Series Funds – 1997 | 132 | ||
| (1942) | Rydex Variable Trust – 1998 | |||
| Rydex Dynamic Funds – 1999 | ||||
| Rydex ETF Trust – 2003 |
Principal Occupations During Past Five Years: Current: Retired; Previous: Chief Executive Officer of Par Industries, Inc., d/b/a Par Leasing from 1977 to 2010
Positions held within the Trust: Trustee from 1997 to present; Member of the Audit Committee from 1997 to present; and Chairman of the Governance and Nominating Committees from 1997 to present
| Roger Somers | Rydex Series Funds – 1993 | 132 | ||
| (1944) | Rydex Variable Trust – 1998 | |||
| Rydex Dynamic Funds – 1999 | ||||
| Rydex ETF Trust – 2003 |
Principal Occupations During Past Five Years: Current: Founder and Chief Executive Officer of Arrow Limousine from 1965 to present
Positions held within the Trust: Trustee from 1993 to present; Member of the Audit and Governance and Nominating Committees from 1995 to present
EXECUTIVE OFFICERS
Name, Position and Year of Birth | Principal Occupations During Past Five Years | |||
Michael P. Byrum* Vice President (1970) | Current: President, Security Benefit Asset Management Holdings, LLC; Senior Vice President, Security Investors, LLC; President & Chief Investment Officer, Rydex Holdings, LLC; Director & Chairman of the Board, Advisor Research Center, Inc.; and Manager, Rydex Specialized Products, LLC | |||
| Previous: Guggenheim Distributors, LLC (f/k/a Rydex Distributors, LLC), Vice President (2009); Rydex Fund Services, LLC, Director (2009–2010), Secretary (2002–2010); Rydex Advisors, LLC (f/k/a PADCO Advisors, Inc.), Director (2008–2010), Chief Investment Officer (2006–2010), President (2004–2010), Secretary (2002–2010); Rydex Advisors II, LLC (f/k/a PADCO Advisors II, Inc.), Director (2008–2010), Chief Investment Officer (2006–2010), President (2004–2010), Secretary (2002–2010); Advisor Research Center, Inc., Secretary (2006–2009), and Executive Vice President (2006) | ||||
| 182 | THE RYDEX FUNDS ANNUAL REPORT |
INFORMATION ON BOARD OF TRUSTEES AND OFFICERS (Unaudited) (concluded)
EXECUTIVE OFFICERS – concluded
| Name, Position | Principal Occupations | |||
| and Year of Birth | During Past Five Years | |||
Nikolaos Bonos* Vice President and Treasurer (1963) | Current: Senior Vice President, Security Investors, LLC; Chief Executive Officer & Manager, Rydex Specialized Products, LLC; Chief Executive Officer & President, Rydex Fund Services, LLC; Vice President, Rydex Holdings, LLC; Treasurer, SBL Fund; Security Equity Fund; Security Income Fund; Security Large Cap Value Fund & Security Mid Cap Growth Fund; and Vice President, Security Benefit Asset Management Holdings, LLC | |||
| Previous: Security Global Investors, LLC, Senior Vice President (2010–2011); Rydex Advisors, LLC (f/k/a PADCO Advisors, Inc.) Senior Vice President (2006–2011); Rydex Fund Services, LLC (f/k/a Rydex Fund Services, Inc.), Director (2009); and Rydex Specialized Products, LLC, Chief Financial Officer (2005–2009) | ||||
Elisabeth Miller* Chief Compliance Officer (1968) | Current: Chief Compliance Officer, Rydex Series Funds, Rydex Dynamic Funds, Rydex Variable Trust, Rydex ETF Trust, Security Equity Fund, Security Income Fund, Security Large Cap Value Fund, Security Mid Cap Growth Fund, SBL Fund, Security Investors, LLC, and Guggenheim Distributors, LLC | |||
| Previous: Senior Manager, Security Investors, LLC and Guggenheim Distributors, LLC (2004–2009) | ||||
Amy J. Lee* Vice President and | Current: Secretary and Senior Vice President, Security Investors, LLC (2004–present) | |||
| Secretary (1961) | Previous: Vice President, Associate General Counsel and Assistant Secretary, Security Benefit Life Insurance Company and Security Benefit Corporation (2004–2012) | |||
Joseph M. Arruda* Assistant Treasurer (1966) | Current: Assistant Treasurer, SBL Fund, Security Equity Fund, Security Income Fund, Security Large Cap Value Fund & Security Mid Cap Growth Fund; Vice President, Security Investors, LLC; and Chief Financial Officer & Manager, Rydex Specialized Products, LLC | |||
| Previous: Security Global Investors, LLC, Vice President (2010–2011); and Rydex Advisors, LLC (f/k/a PADCO Advisors, Inc.) & Rydex Advisors II, LLC (f/k/a PADCO Advisors II, Inc.), Vice President (2004–2011) | ||||
| * | Officers of the Funds are deemed to be “interested persons” of the Trust, within the meaning of Section 2(a)(19) of the 1940 Act, inasmuch as this person is affiliated with Guggenheim Investments. |
| THE RYDEX FUNDS ANNUAL REPORT | 183 |
| GUGGENHEIM INVESTMENTS PRIVACY POLICIES (Unaudited) |
Rydex Funds, Guggenheim Funds, Rydex Investments, Guggenheim Distributors, LLC, Security Investors, LLC, Security Distributors, Inc. and Rydex Advisory Services (Collectively “Guggenheim Investments”).
Our Commitment to You
When you become a Guggenheim Investments investor, you entrust us with not only your hard-earned money but also with personal and financial information about you. We recognize that your relationship with us is based on trust and that you expect us to act responsibly and in your best interests. Because we have access to this private information about you, we hold ourselves to the highest standards in its safekeeping and use. This means, most importantly, that we do not sell client information to anyone—whether it is your personal information or if you are a current or former Guggenheim Investments client.
The Information We Collect About You
In the course of doing business with shareholders and investors, we collect nonpublic personal information about you. You typically provide personal information when you complete a Guggenheim Investments account application or when you request a transaction that involves Rydex and Guggenheim Investments funds or one of the Guggenheim Investments affiliated companies. “Nonpublic personal information” is personally identifiable private information about you. For example, it includes information regarding your name and address, Social Security or taxpayer identification number, assets, income, account balance, bank account information and investment activity (e.g., purchase and redemption history).
How We Handle Your Personal Information
As emphasized above, we do not sell information about current or former clients or their accounts to third parties. Nor do we share such information, except when necessary to complete transactions at your request or to make you aware of related investment products and services that we offer. Additional details about how we handle your personal information are provided below. To complete certain transactions or account changes that you direct, it may be necessary to provide identifying information to companies, individuals or groups that are not affiliated with Guggenheim Investments. For example, if you ask to transfer assets from another financial institution to Guggenheim Investments, we will need to provide certain information about you to that company to complete the transaction. To alert you to other Guggenheim Investments investment products and services, we may share your information within the Guggenheim Investments family of affiliated companies. This would include, for example, sharing your information within Guggenheim Investments so we can make you aware of new Rydex and Guggenheim Investments funds or the services offered through another Guggenheim Investments affiliated company. In certain instances, we may contract with nonaffiliated companies to perform services for us. Where necessary, we will disclose information we have about you to these third parties. In all such cases, we provide the third party with only the information necessary to carry out its assigned responsibilities and only for that purpose. And we require these third parties to treat your private information with the same high degree of confidentiality that we do. In certain instances, we may share information with other financial institutions regarding individuals and entities in response to the U.S.A. Patriot Act. Finally, we will release information about you if you direct us to do so, if we are compelled by law to do so or in other circumstances permitted by law.
Opt Out Provisions
We do not sell your personal information to anyone. The law allows you to “opt out” of only certain kinds of information sharing with third parties. The firm does not share personal information about you with any third parties that triggers this opt-out right. This means YOU ARE ALREADY OPTED OUT.
How We Protect Privacy Online
Our concern for the privacy of our shareholders also extends to those who use our web site, guggenheiminvestments.com. Our web site uses some of the most secure forms of online communication available, including encryption technology, Secure Socket Layer (SSL) protocol, firewalls and user names and passwords. These technologies provide a high level of security and privacy when you access your account information or initiate online transactions. The Guggenheim Investments web site offers customized features that require our use of “http cookies”—tiny pieces of information that we ask your browser to store. However, we make very limited use of these cookies. We only use cookies for session management and security features on the Guggenheim Investments web site. We do not use them to pull data from your hard drive, to learn your email address, or to view data in cookies created by other web sites. We will not share the information in our cookies or give others access to it. See the legal information area on our web site for more details about web site security and privacy features.
| 184 | THE RYDEX FUNDS ANNUAL REPORT |
| GUGGENHEIM INVESTMENTS PRIVACY POLICIES (Unaudited) (concluded) |
How We Safeguard Your Personal Information
We restrict access to nonpublic personal information about shareholders to our employees and in some cases to third parties (for example, the service providers described above) as permitted by law. We maintain strict physical, electronic and procedural safeguards that comply with federal standards to guard your nonpublic personal information.
We’ll Keep You Informed
As required by federal law, we will notify shareholders of our privacy policy annually. We reserve the right to modify this policy at any time, but rest assured that if we do change it, we will tell you promptly. You will also be able to access our privacy policy from our web site at guggenheiminvestments.com. Should you have any questions regarding our privacy policy, contact us at 800.820.0888 or 301.296.5100.
| THE RYDEX FUNDS ANNUAL REPORT | 185 |
This page intentionally left blank.
This page intentionally left blank.
This page intentionally left blank.
This page intentionally left blank.

DOMESTIC EQUITY FUNDS S&P 500® PURE GROWTH FUND S&P 500® PURE VALUE FUND S&P MIDCAP 400® PURE GROWTH FUND S&P MIDCAP 400® PURE VALUE FUND S&P SMALLCAP 600® PURE GROWTH FUND S&P SMALLCAP 600® PURE VALUE FUND | INTERNATIONAL EQUITY FUNDS EUROPE 1.25x STRATEGY FUND JAPAN 2x STRATEGY FUND
SPECIALTY FUNDS STRENGTHENING DOLLAR 2x STRATEGY FUND WEAKENING DOLLAR 2x STRATEGY FUND |
RVATB2-ANN-2-1213x1214
This report and the financial statements contained herein are submitted for the general information of our shareholders. The report is not authorized for distribution to prospective investors unless preceded or accompanied by an effective prospectus.
Distributed by Guggenheim Distributors, LLC.
| the RYDEX FUNDS ANNUAL REPORT | 1 |
| December 31, 2013 |
Security Investors, LLC (the “Investment Adviser”) is pleased to present the annual shareholder report for 10 of our Funds that are part of the Rydex Variable Trust. This report covers performance of the Funds for the annual period ended December 31, 2013.
The Investment Adviser is a part of Guggenheim Investments, which represents the investment management businesses of Guggenheim Partners, LLC, a global, diversified financial services firm.
Guggenheim Distributors, LLC, is the distributor of the Funds. Guggenheim Distributors, LLC is affiliated with Guggenheim Partners, LLC and Security Investors, LLC.
We encourage you to read the Economic and Market Overview section of the report, which follows this letter, and then the Performance Report and Fund Profile for each Fund.
We are committed to providing innovative investment solutions and appreciate the trust you place in us.
Sincerely,

Donald C. Cacciapaglia
President
January 31, 2014
| 2 | the RYDEX FUNDS ANNUAL REPORT |
| December 31, 2013 |
Read a prospectus and summary prospectus (if available) carefully before investing. It contains the investment objectives, risks, charges, expenses and other information, which should be considered carefully before investing. Obtain a prospectus and summary prospectus (if available) at guggenheiminvestments.com or call 800.820.0888.
Funds’ returns over periods other than one day will likely differ in amount and possibly direction from the benchmark return for the same period. For those Funds that consistently apply leverage, the value of the fund’s shares will tend to increase or decrease more than the value of any increase or decrease in its benchmark index. The Funds rebalance their portfolios on a daily basis, increasing exposure in response to that day’s gains or reducing exposure in response to that day’s losses. Daily rebalancing will impair a fund’s performance if the benchmark experiences volatility. Investors should monitor their leveraged and inverse Funds’ holdings consistent with their strategies, as frequently as daily. • For more on these and other risks, please read the prospectus.
Pure Style Funds may not be suitable for all investors. • The funds are subject to the risk that large, medium and small-capitalization stocks may under-perform other segments of the equity market or the equity market as a whole • Value stocks are subject to the risk that the intrinsic value of the stock may never be realized by the market or that the price goes down. Growth stocks typically invest a high portion of their earnings back into their business and may lack the dividend yield that could cushion their decline in a market downturn. Growth stocks may be more volatile than other stocks because they are more sensitive to investor perceptions regarding the growth potential of the issuing company. • The funds are subject to the risk that unanticipated early closings of securities exchanges and other financial markets may result in the funds’ inability to buy or sell securities or other financial instruments on that day. In certain circumstances, it may be difficult for the funds to purchase and sell particular investments within a reasonable time at a fair price. • Unlike many investment companies, the funds are not actively “managed.” This means that based on market and economic conditions, the funds’ performance could be lower than other types of funds that may actively shift their portfolio assets to take advantage of market opportunities. • The funds are subject to active trading and tracking error risks, which may increase volatility, impact the funds’ ability to achieve its investment objective and may decrease the fund’s performance. • These funds are considered non-diversified and can invest a greater portion of its assets in securities of individual issuers than a diversified fund. As a result, changes in the market value of a single security could cause greater fluctuations in the value of fund shares than would occur in a more diversified fund. • Securities are not deposits or obligations of any bank, are not guaranteed by any bank, are not insured by the FDIC or any other agency, and involve investment risks, including the possible loss of the principal amount invested. • Please read the prospectus for more detailed information regarding these and other risks.
Strengthening Dollar 2x Strategy Fund is subject to a number of risks and may not be suitable for all investors. • The Fund’s use of derivatives such as futures and swap agreements may expose the fund to additional risks that it would not be subject to if it invested directly in the securities underlying those derivatives. • The Fund’s exposure to foreign currencies subjects the fund to the risk that those currencies will appreciate in value relative to the U.S. dollar. • The more the Fund invests in leveraged instruments, the more the leverage will magnify any gains or losses on those investments. These risks may cause the Fund to experience higher losses and/or volatility than a Fund that does not invest in derivatives, use leverage or have exposure to foreign currencies. • Also, the Fund is subject to active trading and tracking error risks that may increase volatility, decrease performance and impact the Fund’s ability to achieve its investment objective. See the prospectus for more details.
Weakening Dollar 2x Strategy Fund is subject to a number of risks and may not be suitable for all investors. • The Fund’s use of derivatives such as futures and swap agreements may expose the fund to additional risks that it would not be subject to if it invested directly in the securities underlying those derivatives. • The Fund’s exposure to foreign currencies subjects the Fund to the risk that those currencies will decline in value relative to the U.S. dollar, or, in the case of short positions, that the US dollar will decline in value relative to the currency being hedged. • The more the Fund invests in leveraged instruments, the more the leverage will magnify any gains or losses on those investments. These risks may cause the Fund to experience higher losses and/or volatility than a fund that does not invest in derivatives, use leverage or have exposure to foreign currencies. • Also, the Fund is subject to active trading and tracking error risks that may increase volatility, decrease performance and impact the Fund’s ability to achieve its investment objective. See the prospectus for more details.
| the RYDEX FUNDS ANNUAL REPORT | 3 |
| Economic and Market overview (Unaudited) | December 31, 2013 |
The year ended December 31, 2013 wound down with a series of stronger-than-expected economic data releases. ISM manufacturing data (historically indicative of expansion or contraction) rose to its highest levels in over two years, consumer confidence rebounded following the government shutdown, housing starts surged, and the job market strengthened. Citing improved labor market conditions and a sustainable economic expansion, the U.S. Federal Reserve (the “Fed”) announced in December that it would reduce its monthly bond purchases by $10 billion, to $75 billion, starting in January 2014. Yet, at the same time, the Fed lengthened the time frame before which it will raise rates by promising to keep the Fed funds target rate at 0-0.25% at least as long as the unemployment rate remains above 6.5% and perhaps “well past” the time this target is reached. For the first time, the Fed also added a lower-bound target for inflation of 2% lengthening the expected time frame before rates rise.
As the U.S. economy slowly strengthens, we may return to an environment where taking credit risk is not just a consequence of staying within duration targets or reaching for yield, but rather a proactive choice driven by a positive outlook on the economy. To sustain optimism, the Fed will need to monitor the unintended consequences of tapering and avoid negative economic repercussions, as happened in the summer of 2013 when a spike in 10-year Treasury yields dampened home sales. For markets, the Fed must convince investors that the economy is strong enough to withstand steady reductions of its asset purchases. These will likely be Janet Yellen’s top priorities as she takes over the helm of the Fed.
Last January, the global economy faced myriad headwinds, choppiness lay ahead, and we expected plenty of volatility in 2013. Nevertheless, we believed at that point that risk assets were the best choice for investors. Now, the headwinds of 2013 have largely dissipated, and the outlook appears benign for risk assets for the first three to six months of 2014, if not longer.
Many pundits may have underestimated the strength of the U.S. economy, with both third quarter and fourth quarter economic growth beating expectations. The final three months of 2013 were exceptionally good for U.S. equities, which produced a wealth effect that probably boosted holiday sales. All of this bodes well for the first quarter of 2014.
Market conditions could be even stronger in Europe. Economic data from the euro area’s periphery is improving faster than from the core, where inflation is also rising at a faster pace, giving the peripheral nations a competitive advantage. In Asia, markets have priced for a more negative scenario that now appears less likely. With the U.S. and Europe now out of recession, they are ready to underpin a recovery in export growth in the Asian region. As a synchronous global expansion gets under way, investors may become more comfortable with taking risk, and this should be reflected in asset prices in many regions around the globe.
For 2014, investors should bear in mind that the Fed will continue injecting liquidity into financial markets even as it tapers its asset purchases. Assuming that the Fed continues the same pace of reductions at each Federal Open Market Committee meeting, it would still purchase more than $500 billion of bonds in 2014–nearly the size of the Fed’s QE2 from November 2010 to June 2011. This should help support credit spreads. An accelerated pace of tapering from the Fed would signal faster-than-expected economic growth and spark higher demand for risk assets. On balance, we expect the impact of tapering to be neutral. Barring economic weakness, we expect relatively benign market conditions with no major spike in volatility.
For the year ended December 31, 2013, the Standard & Poor’s 500® (“S&P 500”) Index* returned 32.39%. Foreign markets were also strong: the Morgan Stanley Capital International (“MSCI”) Europe-Australasia-Far East (“EAFE”) Index* returned 22.78%. The return of the MSCI Emerging Markets Index* was -2.60%.
In the bond market, the Barclays U.S. Aggregate Bond Index* posted a -2.02% return for the period, while the Barclays U.S. Corporate High Yield Index* returned 7.44%. The return of the Bank of America Merrill Lynch 3-Month U.S. Treasury Bill Index* was 0.07% for the 12-month period.
The opinions and forecasts expressed may not actually come to pass. This information is subject to change at any time, based on market and other conditions, and should not be construed as a recommendation of any specific security or strategy.
| 4 | the RYDEX FUNDS ANNUAL REPORT |
| Economic and Market overview (Unaudited) (concluded) | December 31, 2013 |
*Index Definitions:
The following indices are referenced throughout this report. Indices are unmanaged and not available for direct investment. Index performance does not reflect transaction costs, fees, or expenses.
Barclays U.S. Aggregate Bond Index is a broad-based benchmark that measures the investment grade, U.S. dollar denominated, fixed-rate taxable bond market, including U.S. Treasuries, government-related and corporate securities, MBS (agency fixed-rate and hybrid ARM pass-throughs), ABS, and CMBS.
Barclays U.S. Corporate High Yield Index measures the market of USD-denominated, non-investment grade, fixed-rate, taxable corporate bonds. Securities are classified as high yield if the middle rating of Moody’s, Fitch, and S&P is Ba1/BB+/BB+ or below.
Bank of America Merrill Lynch 3-Month U.S. Treasury Bill Index is an unmanaged market index of U.S. Treasury securities maturing in 90 days that assumes reinvestment of all income.
MSCI EAFE Index is a free float-adjusted market capitalization index that is designed to measure the equity market performance of developed markets, excluding the U.S. & Canada.
MSCI Emerging Markets Index is a free float-adjusted market capitalization weighted index that is designed to measure equity market performance in the global emerging markets.
S&P 500® Index a capitalization-weighted index of 500 stocks designed to measure the performance of the broad economy, representing all major industries and is considered a representation of the U.S. stock market.
S&P 500® Pure Growth Index is narrow in focus, containing only those S&P 500 Index companies with strong growth characteristics as selected by S&P. The S&P 500 Index is a capitalization-weighted index covering 500 industrial, utility, transportation and financial companies of the U.S. markets (mostly NYSE Euronext issues).
S&P 500® Pure Value Index is narrow in focus, containing only those S&P 500 Index companies with strong value characteristics as selected by S&P. The S&P 500 Index is a capitalization-weighted index covering 500 industrial, utility, transportation and financial companies of the U.S. markets (mostly NYSE Euronext issues).
S&P MidCap 400® Pure Growth Index is narrow in focus, containing only those S&P MidCap 400 Index companies with strong growth characteristics as selected by S&P. The S&P MidCap 400 Index measures the performance of the mid-capitalization sector of the U.S. equity market.
S&P MidCap 400® Pure Value Index is narrow in focus, containing only those S&P MidCap 400 Index companies with strong value characteristics as selected by S&P. The S&P MidCap 400 Index measures the performance of the mid-capitalization sector of the U.S. equity market.
S&P SmallCap 600® Pure Growth Index is narrow in focus, containing only those S&P SmallCap 600 Index companies with strong growth characteristics as selected by S&P. The S&P SmallCap 600 Index measures the performance of the small-capitalization sector of the U.S. equity market.
S&P SmallCap 600® Pure Value Index is narrow in focus, containing only those S&P SmallCap 600 Index companies with strong value characteristics as selected by S&P. The S&P SmallCap 600 Index measures the performance of the small-capitalization sector of the U.S. equity market.
STOXX 50® Index provides a blue-chip representation of supersector leaders in the eurozone. The index covers 50 stocks from 12 eurozone countries: Austria, Belgium, Finland, France, Germany, Greece, Ireland, Italy, Luxembourg, the Netherlands, Portugal and Spain.
Nikkei-225 Stock Average Index is a price-weighted index comprised of Japan’s top 225 blue-chip companies on the Tokyo Stock Exchange.
USD or U.S. Dollar Index® (USDX) is an index that determines the relative value of the United States dollar to a basket of foreign currencies. This formulated “basket” of currencies comprises the weighting of six other currencies as follows: Euro (EUR), 57.6% + Japanese Yen (JPY), 13.6% + Pound Sterling (GBP), 11.9% + Canadian Dollar (CAD), 9.1% + Swedish Krona (SEK), 4.2% + Swiss Franc (CHF) 3.6%.
| the RYDEX FUNDS ANNUAL REPORT | 5 |
| A BRIEF NOTE ON THE COMPOUNDING OF RETURNS (Unaudited) |
Certain Funds described in this report are benchmarked daily to leveraged and/or inverse leveraged versions of published indices. To properly evaluate the performance of these funds, it is essential to understand the effect of mathematical compounding on their respective returns.
Because of the nonlinear effects of leverage applied over time, it is possible for a fund to perform in line with its benchmark for several individual periods in a row, yet seem to trail the benchmark over the entire period. It is also possible that a fund that performs in-line with its benchmark on a daily basis may seem to outperform its benchmark over longer periods.
An Example of Compounding
For example, consider a hypothetical fund that is designed to produce returns that correspond to 150% of an index. On the first day of a period, the index rises from a level of 100 to a level of 106, producing a 6.0% gain and an expectation that the fund will rise by 9.0%. On the same day, the fund’s net asset value per share (“NAV”) increases from $10.00 to $10.90 for a gain of 9.0% — in line with its benchmark.
On day two, assume the index falls from 106 to 99 for a loss of about 6.6%. The fund, as expected, falls 9.9% to a price of $9.82. On each day, the fund performed exactly in line with its benchmark, but for the two-day period, the fund was down 1.8%, while the index was down only 1.0%. Without taking into account the daily compounding of returns, one would expect the fund to lose 1.5% and would see the fund as trailing by 0.3% when in fact it had performed perfectly. This example is summarized in the table below.
| Index | Index | Fund | Fund | |||||||||||||||||||||
| Level | Performance | Expectation | Fund NAV | Performance | Assessment | |||||||||||||||||||
| Start | 100 | $10.00 | ||||||||||||||||||||||
| Day 1 | 106 | 6.0% | 9.0% | $10.90 | 9.0% | In line | ||||||||||||||||||
| Day 2 | 99 | -6.6% | -9.9% | $ 9.82 | -9.9% | In line | ||||||||||||||||||
| Cumulative | -1.0% | -1.5% | -1.8% | -0.3% | ||||||||||||||||||||
As illustrated by this simple example, the effect of leverage can make it difficult to form expectations or judgments about fund performance given only the returns of the unleveraged index.
Because certain funds seek to track the performance of their benchmark on a daily basis, mathematical compounding, especially with respect to those funds that use leverage as part of their investment strategy, may prevent a fund from correlating with the monthly, quarterly, annual or other period performance of its benchmark. Due to the compounding of daily returns, leveraged and inverse funds’ returns over periods other than one day will likely differ in amount and possibly direction from the benchmark return for the same period. Investors should monitor their leveraged and inverse funds’ holdings consistent with their strategies, as frequently as daily. For those funds that consistently apply leverage, the value of the fund’s shares will tend to increase or decrease more than the value of any increase or decrease in its benchmark index. For more on correlation, leverage and other risks, please read the prospectus.
In general, any change in direction in an index will produce compounding that seems to work against an investor. Were the index to move in the same direction (either up or down) for two or more periods in a row, the compounding of those returns would work in an investor’s favor, causing the fund to seemingly beat its benchmark.
As a general rule of thumb, more leverage in a fund will magnify the compounding effect, while less leverage will generally produce results that are more in line with expectations. In addition, periods of high volatility in an underlying index will also cause the effects of compounding to be more pronounced, while lower volatility will produce a more muted effect.
| 6 | the RYDEX FUNDS ANNUAL REPORT |
| ABOUT SHAREHOLDERS’ FUND EXPENSES (Unaudited) |
All mutual funds have operating expenses and it is important for our shareholders to understand the impact of costs on their investments. Shareholders of a Fund incur two types of costs: (i) transaction costs, including sales charges (loads) on purchase payments, reinvested dividends, or other distributions; and exchange fees; and (ii) ongoing costs, including management fees, administrative services, and shareholder reports, among others. These ongoing costs, or operating expenses, are deducted from a fund’s gross income and reduce the investment return of the fund.
A fund’s expenses are expressed as a percentage of its average net assets, which is known as the expense ratio. The following examples are intended to help investors understand the ongoing costs (in dollars) of investing in a Fund and to compare these costs with the ongoing costs of investing in other mutual funds.
The examples are based on an investment of $1,000 made at the beginning of the period and held for the entire six-month period beginning June 30, 2013 and ending December 31, 2013.
The following tables illustrate a Fund’s costs in two ways:
Table 1. Based on actual Fund return. This section helps investors estimate the actual expenses paid over the period. The “Ending Account Value” shown is derived from the Fund’s actual return, and the fourth column shows the dollar amount that would have been paid by an investor who started with $1,000 in the Fund. Investors may use the information here, together with the amount invested, to estimate the expenses paid over the period. Simply divide the Fund’s account value by $1,000 (for example, an $8,600 account value divided by $1,000 = 8.6), then multiply the result by the number provided under the heading “Expenses Paid During Period.”
Table 2. Based on hypothetical 5% return. This section is intended to help investors compare a Fund’s cost with those of other mutual funds. The table provides information about hypothetical account values and hypothetical expenses based on the Fund’s actual expense ratio and an assumed rate of return of 5% per year before expenses, which is not the Fund’s actual return. The hypothetical account values and expenses may not be used to estimate the actual ending account balance or expenses paid during the period. The example is useful in making comparisons because the U.S. Securities and Exchange Commission (the “SEC”) requires all mutual funds to calculate expenses based on the 5% return. Investors can assess a Fund’s costs by comparing this hypothetical example with the hypothetical examples that appear in shareholder reports of other funds.
The calculations illustrated above assume no shares were bought or sold during the period. Actual costs may have been higher or lower, depending on the amount of investment and the timing of any purchases or redemptions.
Please note that the expenses shown in the table are meant to highlight your ongoing costs only and do not reflect any transactional costs, such as sales charges (loads) on purchase payments, and contingent deferred sales charges (“CDSC”) on redemptions, if any. Therefore, the second table is useful in comparing ongoing costs only, and will not help you determine the relative total costs of owning different funds. In addition, if these transactional costs were included, your costs would have been higher.
More information about a Fund’s expenses, including annual expense ratios for the past five years, can be found in the Financial Highlights section of this report. For additional information on operating expenses and other shareholder costs, please refer to the appropriate Fund prospectus.
| the RYDEX FUNDS ANNUAL REPORT | 7 |
ABOUT SHAREHOLDERS’ FUND EXPENSES (Unaudited) (concluded)
| Beginning | Ending | Expenses | ||||||||||||||||||
| Expense | Fund | Account Value | Account Value | Paid During | ||||||||||||||||
| Ratio1 | Return | June 30, 2013 | December 31, 2013 | Period2 | ||||||||||||||||
| Table 1. Based on actual Fund return3 | ||||||||||||||||||||
| S&P 500® Pure Growth Fund | 1.52 | % | 20.93 | % | $1,000.00 | $1,209.30 | $8.46 | |||||||||||||
| S&P 500® Pure Value Fund | 1.52 | % | 22.08 | % | 1,000.00 | 1,220.80 | 8.51 | |||||||||||||
| S&P MidCap 400® Pure Growth Fund | 1.52 | % | 20.77 | % | 1,000.00 | 1,207.70 | 8.46 | |||||||||||||
| S&P MidCap 400® Pure Value Fund | 1.52 | % | 16.87 | % | 1,000.00 | 1,168.70 | 8.31 | |||||||||||||
| S&P SmallCap 600® Pure Growth Fund | 1.52 | % | 24.20 | % | 1,000.00 | 1,242.00 | 8.59 | |||||||||||||
| S&P SmallCap 600® Pure Value Fund | 1.52 | % | 22.35 | % | 1,000.00 | 1,223.50 | 8.52 | |||||||||||||
| Europe 1.25x Strategy Fund | 1.71 | % | 23.40 | % | 1,000.00 | 1,234.00 | 9.63 | |||||||||||||
| Japan 2x Strategy Fund | 1.52 | % | 21.38 | % | 1,000.00 | 1,213.80 | 8.48 | |||||||||||||
| Strengthening Dollar 2x Strategy Fund | 1.72 | % | (9.21 | %) | 1,000.00 | 907.90 | 8.27 | |||||||||||||
| Weakening Dollar 2x Strategy Fund | 1.72 | % | 7.20 | % | 1,000.00 | 1,072.00 | 8.98 | |||||||||||||
| Table 2. Based on hypothetical 5% return (before expenses) | ||||||||||||||||||||
| S&P 500® Pure Growth Fund | 1.52 | % | 5.00 | % | $1,000.00 | $1,017.54 | $7.73 | |||||||||||||
| S&P 500® Pure Value Fund | 1.52 | % | 5.00 | % | 1,000.00 | 1,017.54 | 7.73 | |||||||||||||
| S&P MidCap 400® Pure Growth Fund | 1.52 | % | 5.00 | % | 1,000.00 | 1,017.54 | 7.73 | |||||||||||||
| S&P MidCap 400® Pure Value Fund | 1.52 | % | 5.00 | % | 1,000.00 | 1,017.54 | 7.73 | |||||||||||||
| S&P SmallCap 600® Pure Growth Fund | 1.52 | % | 5.00 | % | 1,000.00 | 1,017.54 | 7.73 | |||||||||||||
| S&P SmallCap 600® Pure Value Fund | 1.52 | % | 5.00 | % | 1,000.00 | 1,017.54 | 7.73 | |||||||||||||
| Europe 1.25x Strategy Fund | 1.71 | % | 5.00 | % | 1,000.00 | 1,016.59 | 8.69 | |||||||||||||
| Japan 2x Strategy Fund | 1.52 | % | 5.00 | % | 1,000.00 | 1,017.54 | 7.73 | |||||||||||||
| Strengthening Dollar 2x Strategy Fund | 1.72 | % | 5.00 | % | 1,000.00 | 1,016.53 | 8.74 | |||||||||||||
| Weakening Dollar 2x Strategy Fund | 1.72 | % | 5.00 | % | 1,000.00 | 1,016.53 | 8.74 | |||||||||||||
| 1 | Annualized. |
| 2 | Expenses are equal to the Fund’s annualized expense ratio, net of any applicable fee waivers, multiplied by the average account value over the period, multiplied by 184/365 (to reflect the one-half year period). Expenses shown do not include fees charged by insurance companies. |
| 3 | Actual cumulative return at net asset value for the period June 30, 2013 to December 31, 2013. |
| 8 | the RYDEX FUNDS ANNUAL REPORT |
This page intentionally left blank.
| the RYDEX FUNDS ANNUAL REPORT | 9 |
| PERFORMANCE REPORT AND FUND PROFILE (Unaudited) | December 31, 2013 |
S&P 500® PURE GROWTH FUND
OBJECTIVE: Seeks to provide investment results that match, before fees and expenses, the performance of a benchmark for large-cap growth securities on a daily basis. The Fund’s current benchmark is the S&P 500® Pure Growth Index (the “underlying index”).
For the year ended December 31, 2013, S&P 500® Pure Growth Fund returned 41.32%, compared with a gain of 43.88% for the underlying index.
Consumer Discretionary was the sector contributing most to performance, followed by Health Care. No sector detracted, but the Telecommunications Services sector contributed least, followed by the Consumer Staples sector.
Stocks contributing the most to return of the underlying index were Netflix, Inc., Seagate Technology plc and Southwest Airlines Co.
Intuitive Surgical, Inc., Edwards Lifesciences Corp. and Mosaic Co. were the largest detractors from performance of the underlying index.
Performance displayed represents past performance, which is no guarantee of future results.
Holdings Diversification (Market Exposure as % of Net Assets)
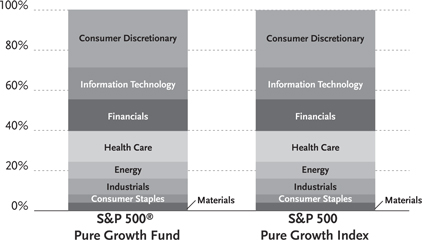
“Holdings Diversification (Market Exposure as % of Net Assets)” excludes any temporary cash investments.
| Inception Date: May 3, 2004 | ||||
| Ten Largest Holdings (% of Total Net Assets) | ||||
| Huntington Bancshares, Inc. | 2.2 | % | ||
| TripAdvisor, Inc. | 1.9 | % | ||
| Celgene Corp. | 1.9 | % | ||
| Netflix, Inc. | 1.8 | % | ||
| Chipotle Mexican Grill, Inc. — Class A | 1.8 | % | ||
| Safeway, Inc. | 1.8 | % | ||
| Facebook, Inc. — Class A | 1.7 | % | ||
| Vertex Pharmaceuticals, Inc. | 1.7 | % | ||
| Michael Kors Holdings Ltd. | 1.7 | % | ||
| Seagate Technology plc | 1.7 | % | ||
| Top Ten Total | 18.2 | % | ||
“Ten Largest Holdings” exclude any temporary cash investments.
| 10 | the RYDEX FUNDS ANNUAL REPORT |
| performance report and FUND PROFILE (Unaudited) (concluded) |
Cumulative Fund Performance*,†
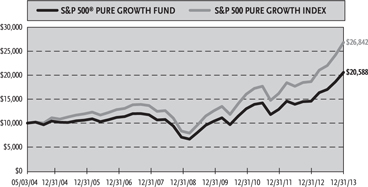
Average Annual Returns
Periods Ended December 31, 2013*,†
| Since | |||||||||
| Inception | |||||||||
| 1 Year | 5 Year | (05/03/04) | |||||||
| S&P 500® Pure Growth Fund | 41.32% | 23.87% | 7.76% | ||||||
| S&P 500 Pure Growth Index | 43.88% | 26.36% | 10.76% | ||||||
| * | The performance data above represents past performance that is not predictive of future results. The investment return and principal value of an investment in the Fund will fluctuate so that an investor’s shares, when redeemed, may be worth more or less than their original cost. Returns are historical and include changes in principal and reinvested dividends and capital gains and do not reflect the effect of taxes. The S&P 500 Pure Growth Index is an unmanaged index and, unlike the Fund, has no management fees or operating expenses to reduce its reported return. |
| † | Returns do not reflect the impact of any additional fees charged by insurance companies. |
| the RYDEX FUNDS ANNUAL REPORT | 11 |
| SCHEDULE OF INVESTMENTS | December 31, 2013 |
| S&P 500® PURE GROWTH FUND |
| Shares | Value | |||||||
| COMMON STOCKS† - 100.1% | ||||||||
| CONSUMER DISCRETIONARY - 28.7% | ||||||||
| TripAdvisor, Inc.* | 14,047 | $ | 1,163,513 | |||||
| Netflix, Inc.* | 3,104 | 1,142,800 | ||||||
| Chipotle Mexican Grill, Inc. — Class A* | 2,100 | 1,118,838 | ||||||
| Michael Kors Holdings Ltd.* | 12,900 | 1,047,352 | ||||||
| News Corp. — Class A* | 56,800 | 1,023,536 | ||||||
| Priceline.com, Inc.* | 867 | 1,007,801 | ||||||
| Wynn Resorts Ltd. | 4,528 | 879,383 | ||||||
| Goodyear Tire & Rubber Co. | 32,800 | 782,280 | ||||||
| Amazon.com, Inc.* | 1,934 | 771,260 | ||||||
| Harman International Industries, Inc. | 8,400 | 687,540 | ||||||
| Fossil Group, Inc.* | 5,560 | 666,866 | ||||||
| DIRECTV* | 9,024 | 623,468 | ||||||
| Comcast Corp. — Class A | 10,940 | 568,497 | ||||||
| Wyndham Worldwide Corp. | 7,280 | 536,463 | ||||||
| Discovery Communications, Inc. — | ||||||||
| Class A* | 5,326 | 481,577 | ||||||
| Johnson Controls, Inc. | 8,300 | 425,790 | ||||||
| Interpublic Group of Companies, Inc. | 23,900 | 423,030 | ||||||
| NIKE, Inc. — Class B | 5,100 | 401,064 | ||||||
| BorgWarner, Inc. | 6,988 | 390,699 | ||||||
| CBS Corp. — Class B | 6,010 | 383,077 | ||||||
| Viacom, Inc. — Class B | 4,100 | 358,094 | ||||||
| VF Corp. | 5,500 | 342,870 | ||||||
| Graham Holdings Co. — Class B | 500 | 331,660 | ||||||
| Dollar Tree, Inc.* | 5,700 | 321,594 | ||||||
| Bed Bath & Beyond, Inc.* | 3,900 | 313,170 | ||||||
| Starbucks Corp. | 3,700 | 290,043 | ||||||
| Time Warner Cable, Inc. | 2,120 | 287,260 | ||||||
| Mohawk Industries, Inc.* | 1,900 | 282,910 | ||||||
| Harley-Davidson, Inc. | 4,000 | 276,960 | ||||||
| O’Reilly Automotive, Inc.* | 2,000 | 257,420 | ||||||
| TJX Companies, Inc. | 4,006 | 255,302 | ||||||
| Total Consumer Discretionary | 17,842,117 | |||||||
| INFORMATION TECHNOLOGY - 15.9% | ||||||||
| Facebook, Inc. — Class A* | 19,800 | 1,082,268 | ||||||
| Seagate Technology plc | 18,618 | 1,045,587 | ||||||
| VeriSign, Inc.* | 14,600 | 872,788 | ||||||
| Western Digital Corp. | 9,600 | 805,440 | ||||||
| Alliance Data Systems Corp.* | 3,000 | 788,790 | ||||||
| Google, Inc. — Class A* | 627 | 702,685 | ||||||
| Cognizant Technology Solutions Corp. — | ||||||||
| Class A* | 6,473 | 653,644 | ||||||
| First Solar, Inc.* | 11,400 | 622,896 | ||||||
| MasterCard, Inc. — Class A | 680 | 568,113 | ||||||
| Salesforce.com, Inc.* | 7,442 | 410,724 | ||||||
| QUALCOMM, Inc. | 5,321 | 395,084 | ||||||
| SanDisk Corp. | 4,800 | 338,592 | ||||||
| Yahoo!, Inc.* | 8,282 | 334,924 | ||||||
| Electronic Arts, Inc.* | 14,500 | 332,630 | ||||||
| Visa, Inc. — Class A | 1,449 | 322,663 | ||||||
| Fidelity National Information | ||||||||
| Services, Inc. | 6,000 | 322,080 | ||||||
| Micron Technology, Inc.* | 11,600 | 252,416 | ||||||
| Total Information Technology | 9,851,324 | |||||||
| FINANCIALS - 15.8% | ||||||||
| Huntington Bancshares, Inc. | 142,082 | 1,371,091 | ||||||
| KeyCorp | 74,200 | 995,764 | ||||||
| Fifth Third Bancorp | 41,800 | 879,054 | ||||||
| Comerica, Inc. | 18,400 | 874,736 | ||||||
| Prudential Financial, Inc. | 9,400 | 866,868 | ||||||
| Ameriprise Financial, Inc. | 5,710 | 656,936 | ||||||
| Discover Financial Services | 11,500 | 643,424 | ||||||
| SLM Corp. | 23,884 | 627,672 | ||||||
| Moody’s Corp. | 6,847 | 537,284 | ||||||
| Charles Schwab Corp. | 19,000 | 494,000 | ||||||
| Torchmark Corp. | 4,500 | 351,675 | ||||||
| BlackRock, Inc. — Class A | 1,000 | 316,470 | ||||||
| American Express Co. | 3,320 | 301,224 | ||||||
| Invesco Ltd. | 8,100 | 294,840 | ||||||
| Macerich Co. | 4,800 | 282,672 | ||||||
| IntercontinentalExchange Group, Inc. | 1,200 | 269,904 | ||||||
| Total Financials | 9,763,614 | |||||||
| HEALTH CARE - 15.3% | ||||||||
| Celgene Corp.* | 6,856 | 1,158,390 | ||||||
| Vertex Pharmaceuticals, Inc.* | 14,177 | 1,053,351 | ||||||
| Actavis plc* | 5,895 | 990,360 | ||||||
| Regeneron Pharmaceuticals, Inc.* | 3,254 | 895,631 | ||||||
| Gilead Sciences, Inc.* | 11,912 | 895,187 | ||||||
| Biogen Idec, Inc.* | 2,924 | 817,989 | ||||||
| Boston Scientific Corp.* | 52,900 | 635,858 | ||||||
| Cigna Corp. | 6,200 | 542,376 | ||||||
| Alexion Pharmaceuticals, Inc.* | 4,020 | 534,901 | ||||||
| Allergan, Inc. | 4,500 | 499,860 | ||||||
| Perrigo Company plc | 2,500 | 383,650 | ||||||
| Cerner Corp.* | 6,600 | 367,884 | ||||||
| Thermo Fisher Scientific, Inc. | 3,200 | 356,320 | ||||||
| St. Jude Medical, Inc. | 5,100 | 315,945 | ||||||
| Total Health Care | 9,447,702 | |||||||
| ENERGY - 8.4% | ||||||||
| Cabot Oil & Gas Corp. | 20,400 | 790,704 | ||||||
| Pioneer Natural Resources Co. | 3,846 | 707,933 | ||||||
| Helmerich & Payne, Inc. | 8,000 | 672,640 | ||||||
| Halliburton Co. | 13,100 | 664,825 | ||||||
| EOG Resources, Inc. | 3,870 | 649,541 | ||||||
| Range Resources Corp. | 5,500 | 463,705 | ||||||
| Noble Energy, Inc. | 5,430 | 369,837 | ||||||
| Schlumberger Ltd. | 3,300 | 297,363 | ||||||
| Equities Corp. | 3,200 | 287,296 | ||||||
| Kinder Morgan, Inc. | 7,800 | 280,800 | ||||||
| Total Energy | 5,184,644 | |||||||
| 12 | the RYDEX FUNDS ANNUAL REPORT | See Notes to Financial Statements. |
| SCHEDULE OF INVESTMENTS (concluded) | December 31, 2013 |
| S&P 500® PURE GROWTH FUND |
| Shares | Value | |||||||
| INDUSTRIALS - 7.9% | ||||||||
| Southwest Airlines Co. | 47,955 | $ | 903,473 | |||||
| Delta Air Lines, Inc. | 28,100 | 771,907 | ||||||
| Textron, Inc. | 19,900 | 731,524 | ||||||
| PACCAR, Inc. | 9,360 | 553,831 | ||||||
| Robert Half International, Inc. | 11,000 | 461,890 | ||||||
| Boeing Co. | 3,170 | 432,673 | ||||||
| Precision Castparts Corp. | 1,300 | 350,090 | ||||||
| Flowserve Corp. | 4,300 | 338,969 | ||||||
| Pitney Bowes, Inc. | 13,800 | 321,540 | ||||||
| Total Industrials | 4,865,897 | |||||||
| CONSUMER STAPLES - 4.1% | ||||||||
| Safeway, Inc. | 34,100 | 1,110,636 | ||||||
| Constellation Brands, Inc. — Class A* | 11,712 | 824,291 | ||||||
| Monster Beverage Corp.* | 4,879 | 330,650 | ||||||
| Coca-Cola Enterprises, Inc. | 6,000 | 264,780 | ||||||
| Total Consumer Staples | 2,530,357 | |||||||
| MATERIALS - 4.0% | ||||||||
| LyondellBasell Industries N.V. — Class A | 9,500 | 762,661 | ||||||
| Sealed Air Corp. | 16,500 | 561,825 | ||||||
| Ecolab, Inc. | 4,596 | 479,225 | ||||||
| Eastman Chemical Co. | 4,672 | 377,030 | ||||||
| PPG Industries, Inc. | 1,440 | 273,110 | ||||||
| Total Materials | 2,453,851 | |||||||
| Total Common Stocks | ||||||||
| (Cost $50,283,184) | 61,939,506 | |||||||
| Face | ||||||||
| Amount | ||||||||
| REPURCHASE AGREEMENT††,1 - 0.3% | ||||||||
| Credit Suisse Group | ||||||||
| issued 12/31/13 at 0.00% | ||||||||
| due 01/02/14 | $ | 171,746 | 171,746 | |||||
| Total Repurchase Agreement | ||||||||
| (Cost $171,746) | 171,746 | |||||||
| Total Investments - 100.4% | ||||||||
| (Cost $50,454,930) | $ | 62,111,252 | ||||||
| Other Assets & Liabilities, net - (0.4)% | (224,168 | ) | ||||||
| Total Net Assets - 100.0% | $ | 61,887,084 | ||||||
| * | Non-income producing security. |
| † | Value determined based on Level 1 inputs — See Note 4. |
| †† | Value determined based on Level 2 inputs — See Note 4. |
| 1 | Repurchase Agreement — See Note 5. |
plc – Public Limited Company
| See Notes to Financial Statements. | The RYDEX FUNDS ANNUAL REPORT | 13 |
| S&P 500® PURE GROWTH FUND |
| STATEMENT OF ASSETS |
| AND LIABILITIES |
December 31, 2013
| Assets: | ||||
| Investments, at value | ||||
| (cost $50,283,184) | $ | 61,939,506 | ||
| Repurchase agreements, at value | ||||
| (cost $171,746) | 171,746 | |||
| Total investments | ||||
| (cost $50,454,930) | 62,111,252 | |||
| Receivables: | ||||
| Securities sold | 5,184,683 | |||
| Dividends | 41,245 | |||
| Fund shares sold | 15,768 | |||
| Total assets | 67,352,948 | |||
| Liabilities: | ||||
| Payable for: | ||||
| Fund shares redeemed | 5,326,416 | |||
| Management fees | 38,734 | |||
| Transfer agent and administrative fees | 12,911 | |||
| Investor service fees | 12,911 | |||
| Portfolio accounting fees | 5,165 | |||
| Miscellaneous | 69,727 | |||
| Total liabilities | 5,465,864 | |||
| Net assets | $ | 61,887,084 | ||
| Net assets consist of: | ||||
| Paid in capital | $ | 41,077,474 | ||
| Undistributed net investment income | — | |||
| Accumulated net realized gain on investments | 9,153,288 | |||
| Net unrealized appreciation on investments | 11,656,322 | |||
| Net assets | $ | 61,887,084 | ||
| Capital shares outstanding | 1,299,964 | |||
| Net asset value per share | $ | 47.61 |
| STATEMENT OF |
| OPERATIONS |
Year Ended December 31, 2013
| Investment Income: | ||||
| Dividends | $ | 520,868 | ||
| Income from securities lending, net | 4,801 | |||
| Interest | 66 | |||
| Total investment income | 525,735 | |||
| Expenses: | ||||
| Management fees | 359,540 | |||
| Transfer agent and administrative fees | 119,846 | |||
| Investor service fees | 119,846 | |||
| Portfolio accounting fees | 47,938 | |||
| Professional fees | 42,592 | |||
| Custodian fees | 5,477 | |||
| Trustees’ fees* | 4,175 | |||
| Line of credit interest expense | 153 | |||
| Miscellaneous | 38,818 | |||
| Total expenses | 738,385 | |||
| Net investment loss | (212,650 | ) | ||
| Net Realized and Unrealized Gain (Loss): | ||||
| Net realized gain (loss) on: | ||||
| Investments | 8,780,876 | |||
| Net realized gain | 8,780,876 | |||
| Net change in unrealized appreciation (depreciation) on: | ||||
| Investments | 6,834,434 | |||
| Net change in unrealized appreciation (depreciation) | 6,834,434 | |||
| Net realized and unrealized gain | 15,615,310 | |||
| Net increase in net assets resulting from operations | $ | 15,402,660 |
| * | Relates to Trustees not deemed “interested persons” within the meaning of Section 2(a)(19) of the 1940 Act. |
| 14 | the RYDEX FUNDS ANNUAL REPORT | See Notes to Financial Statements. |
| S&P 500® PURE GROWTH FUND |
| STATEMENTS OF CHANGES IN NET ASSETS |
| Year Ended | Year Ended | |||||||
| December 31, | December 31, | |||||||
| 2013 | 2012 | |||||||
| Increase (Decrease) In Net Assets From Operations: | ||||||||
| Net investment loss | $ | (212,650 | ) | $ | (155,205 | ) | ||
| Net realized gain on investments | 8,780,876 | 6,184,686 | ||||||
| Net change in unrealized appreciation (depreciation) on investments | 6,834,434 | (1,685,662 | ) | |||||
| Net increase in net assets resulting from operations | 15,402,660 | 4,343,819 | ||||||
| Distributions to shareholders from: | ||||||||
| Net realized gains | — | (245,728 | ) | |||||
| Total distributions to shareholders | — | (245,728 | ) | |||||
| Capital share transactions: | ||||||||
| Proceeds from sale of shares | 151,388,703 | 128,493,607 | ||||||
| Distributions reinvested | — | 245,728 | ||||||
| Cost of shares redeemed | (134,229,835 | ) | (141,577,701 | ) | ||||
| Net increase (decrease) from capital share transactions | 17,158,868 | (12,838,366 | ) | |||||
| Net increase (decrease) in net assets | 32,561,528 | (8,740,275 | ) | |||||
| Net assets: | ||||||||
| Beginning of year | 29,325,556 | 38,065,831 | ||||||
| End of year | $ | 61,887,084 | $ | 29,325,556 | ||||
| Undistributed net investment income at end of year | $ | — | $ | — | ||||
| Capital share activity: | ||||||||
| Shares sold | 3,796,994 | 3,926,086 | ||||||
| Shares issued from reinvestment of distributions | — | 7,542 | ||||||
| Shares redeemed | (3,367,422 | ) | (4,332,514 | ) | ||||
| Net increase (decrease) in shares | 429,572 | (398,886 | ) | |||||
| See Notes to Financial Statements. | The RYDEX FUNDS ANNUAL REPORT | 15 |
| S&P 500® PURE GROWTH FUND |
| FINANCIAL HIGHLIGHTS |
This table is presented to show selected data for a share outstanding throughout each period and to assist shareholders in evaluating a Fund’s performance for the periods presented.
| Year Ended | Year Ended | Year Ended | Year Ended | Year Ended | ||||||||||||||||
| December 31, | December 31, | December 31, | December 31, | December 31, | ||||||||||||||||
| 2013 | 2012 | 2011 | 2010 | 2009 | ||||||||||||||||
| Per Share Data | ||||||||||||||||||||
| Net asset value, beginning of period | $ | 33.69 | $ | 29.99 | $ | 30.33 | $ | 24.25 | $ | 16.47 | ||||||||||
| Income (loss) from investment operations: | ||||||||||||||||||||
| Net investment lossa | (.18 | ) | (.15 | ) | (.25 | ) | (.20 | ) | (.10 | ) | ||||||||||
| Net gain (loss) on investments (realized and unrealized) | 14.10 | 4.13 | (.09 | ) | 6.28 | 7.88 | ||||||||||||||
| Total from investment operations | 13.92 | 3.98 | (.34 | ) | 6.08 | 7.78 | ||||||||||||||
| Less distributions from: | ||||||||||||||||||||
| Net realized gains | — | (.28 | ) | — | — | — | ||||||||||||||
| Total distributions | — | (.28 | ) | — | — | — | ||||||||||||||
| Net asset value, end of period | $ | 47.61 | $ | 33.69 | $ | 29.99 | $ | 30.33 | $ | 24.25 | ||||||||||
| Total Returnb | 41.32 | % | 13.31 | % | (1.09 | %) | 25.03 | % | 47.24 | % | ||||||||||
| Ratios/Supplemental Data | ||||||||||||||||||||
| Net assets, end of period (in thousands) | $ | 61,887 | $ | 29,326 | $ | 38,066 | $ | 49,301 | $ | 34,481 | ||||||||||
| Ratios to average net assets: | ||||||||||||||||||||
| Net investment loss | (0.44 | %) | (0.46 | %) | (0.81 | %) | (0.77 | %) | (0.53 | %) | ||||||||||
| Total expenses | 1.54 | % | 1.58 | % | 1.64 | % | 1.57 | % | 1.55 | % | ||||||||||
| Net expensesc | 1.54 | % | 1.58 | % | 1.61 | % | 1.57 | % | 1.55 | % | ||||||||||
| Portfolio turnover rate | 324 | % | 391 | % | 423 | % | 356 | % | 497 | % | ||||||||||
| a | Net investment loss per share was computed using average shares outstanding throughout the period. |
| b | Total return does not reflect the impact of any additional fees charged by insurance companies. |
| c | Net expense information reflects the expense ratios after expense waivers. |
| 16 | the RYDEX FUNDS ANNUAL REPORT | See Notes to Financial Statements. |
This page intentionally left blank.
| the RYDEX FUNDS ANNUAL REPORT | 17 |
| PERFORMANCE REPORT AND FUND PROFILE (Unaudited) | December 31, 2013 |
S&P 500® PURE VALUE FUND
OBJECTIVE: Seeks to provide investment results that match, before fees and expenses, the performance of a benchmark for large-cap value securities on a daily basis. The Fund’s current benchmark is the S&P 500® Pure Value Index (the “underlying index”).
For the year ended December 31, 2013, S&P 500® Pure Value Fund returned 45.26%, compared with a gain of 48.07% for the underlying index.
The Financials sector was the leading contributor to performance, followed by the Health Care sector. All sectors contributed to return, but the weakest-performing sectors were Telecommunications Services and Materials.
The strongest contributors to performance of the underlying index for the year included Genworth Financial, Inc. — Class A, Assurant, Inc. and Xerox Corp.
The stocks detracting most from performance of the underlying index were Cliffs Natural Resources, Inc., J.C. Penney Company, Inc. and Peabody Energy Corp.
Performance displayed represents past performance, which is no guarantee of future results.
Holdings Diversification (Market Exposure as % of Net Assets)

“Holdings Diversification (Market Exposure as % of Net Assets)” excludes any temporary cash investments.
| Inception Date: May 3, 2004 | ||||
| Ten Largest Holdings (% of Total Net Assets) | ||||
| Berkshire Hathaway, Inc. — Class B | 2.1 | % | ||
| Alcoa, Inc. | 2.0 | % | ||
| WellPoint, Inc. | 1.9 | % | ||
| Valero Energy Corp. | 1.8 | % | ||
| Assurant, Inc. | 1.7 | % | ||
| Murphy Oil Corp. | 1.7 | % | ||
| Archer-Daniels-Midland Co. | 1.6 | % | ||
| Genworth Financial, Inc. — Class A | 1.5 | % | ||
| Phillips 66 | 1.5 | % | ||
| Xerox Corp. | 1.5 | % | ||
| Top Ten Total | 17.3 | % | ||
“Ten Largest Holdings” exclude any temporary cash investments.
| 18 | the RYDEX FUNDS ANNUAL REPORT |
| performance report and FUND PROFILE (Unaudited) (concluded) |
Cumulative Fund Performance*,†
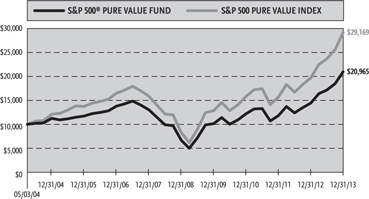
Average Annual Returns
Periods Ended December 31, 2013*,†
| Since | |||||||||
| Inception | |||||||||
| 1 Year | 5 Year | (05/03/04) | |||||||
| S&P 500® Pure Value Fund | 45.26% | 25.63% | 7.96% | ||||||
| S&P 500 Pure Value Index | 48.07% | 28.65% | 11.72% | ||||||
| * | The performance data above represents past performance that is not predictive of future results. The investment return and principal value of an investment in the Fund will fluctuate so that an investor’s shares, when redeemed, may be worth more or less than their original cost. Returns are historical and include changes in principal and reinvested dividends and capital gains and do not reflect the effect of taxes. The S&P 500 Pure Value Index is an unmanaged index and, unlike the Fund, has no management fees or operating expenses to reduce its reported return. |
| † | Returns do not reflect the impact of any additional fees charged by insurance companies. |
| the RYDEX FUNDS ANNUAL REPORT | 19 |
| SCHEDULE OF INVESTMENTS | December 31, 2013 |
| S&P 500® PURE VALUE FUND | |
| Shares | Value | |||||||
| COMMON STOCKS† - 99.4% | ||||||||
| FINANCIALS - 25.9% | ||||||||
| Berkshire Hathaway, Inc. — Class B* | 13,340 | $ | 1,581,590 | |||||
| Assurant, Inc. | 18,817 | 1,248,884 | ||||||
| Genworth Financial, Inc. — Class A* | 71,393 | 1,108,733 | ||||||
| Unum Group | 27,793 | 974,978 | ||||||
| Hartford Financial Services Group, Inc. | 26,885 | 974,044 | ||||||
| American International Group, Inc. | 18,356 | 937,074 | ||||||
| MetLife, Inc. | 17,053 | 919,498 | ||||||
| XL Group plc — Class A | 28,836 | 918,138 | ||||||
| Allstate Corp. | 15,496 | 845,152 | ||||||
| Loews Corp. | 15,344 | 740,195 | ||||||
| Capital One Financial Corp. | 9,077 | 695,389 | ||||||
| Morgan Stanley | 20,622 | 646,706 | ||||||
| SunTrust Banks, Inc. | 17,406 | 640,715 | ||||||
| Bank of America Corp. | 38,400 | 597,888 | ||||||
| Goldman Sachs Group, Inc. | 3,337 | 591,517 | ||||||
| JPMorgan Chase & Co. | 9,850 | 576,028 | ||||||
| Travelers Companies, Inc. | 6,170 | 558,632 | ||||||
| PNC Financial Services Group, Inc. | 7,038 | 546,008 | ||||||
| ACE Ltd. | 4,974 | 514,958 | ||||||
| NASDAQ OMX Group, Inc. | 12,487 | 496,983 | ||||||
| Bank of New York Mellon Corp. | 13,800 | 482,172 | ||||||
| Hudson City Bancorp, Inc. | 41,600 | 392,288 | ||||||
| BB&T Corp. | 10,253 | 382,642 | ||||||
| Chubb Corp. | 3,610 | 348,834 | ||||||
| Cincinnati Financial Corp. | 6,300 | 329,931 | ||||||
| Aflac, Inc. | 4,455 | 297,594 | ||||||
| Progressive Corp. | 10,800 | 294,516 | ||||||
| Wells Fargo & Co. | 6,379 | 289,607 | ||||||
| M&T Bank Corp. | 2,300 | 267,766 | ||||||
| Total Financials | 19,198,460 | |||||||
| ENERGY - 16.4% | ||||||||
| Valero Energy Corp. | 26,511 | 1,336,155 | ||||||
| Murphy Oil Corp. | 18,850 | 1,222,987 | ||||||
| Phillips 66 | 14,268 | 1,100,491 | ||||||
| Tesoro Corp. | 17,000 | 994,500 | ||||||
| Nabors Industries Ltd. | 58,452 | 993,099 | ||||||
| Hess Corp. | 11,620 | 964,460 | ||||||
| Rowan Companies plc — Class A* | 18,416 | 651,190 | ||||||
| Transocean Ltd. | 12,100 | 597,982 | ||||||
| Apache Corp. | 6,120 | 525,953 | ||||||
| Ensco plc — Class A | 9,020 | 515,764 | ||||||
| Chevron Corp. | 3,977 | 496,767 | ||||||
| Denbury Resources, Inc.* | 28,900 | 474,827 | ||||||
| Noble Corporation plc | 12,500 | 468,375 | ||||||
| Marathon Oil Corp. | 12,242 | 432,143 | ||||||
| Baker Hughes, Inc. | 7,767 | 429,204 | ||||||
| ConocoPhillips | 4,839 | 341,875 | ||||||
| Exxon Mobil Corp. | 3,200 | 323,840 | ||||||
| WPX Energy, Inc.* | 13,615 | 277,474 | ||||||
| Total Energy | 12,147,086 | |||||||
| UTILITIES - 15.3% | ||||||||
| NRG Energy, Inc. | 35,397 | 1,016,602 | ||||||
| Exelon Corp. | 29,891 | 818,714 | ||||||
| Entergy Corp. | 12,280 | 776,956 | ||||||
| Integrys Energy Group, Inc. | 12,738 | 693,074 | ||||||
| Pepco Holdings, Inc. | 35,882 | 686,423 | ||||||
| FirstEnergy Corp. | 17,688 | 583,350 | ||||||
| AES Corp. | 38,000 | 551,380 | ||||||
| Consolidated Edison, Inc. | 9,000 | 497,520 | ||||||
| Edison International | 10,500 | 486,150 | ||||||
| PG&E Corp. | 11,700 | 471,276 | ||||||
| Xcel Energy, Inc. | 16,000 | 447,040 | ||||||
| SCANA Corp. | 9,500 | 445,835 | ||||||
| DTE Energy Co. | 6,300 | 418,257 | ||||||
| Pinnacle West Capital Corp. | 7,900 | 418,068 | ||||||
| AGL Resources, Inc. | 8,700 | 410,901 | ||||||
| PPL Corp. | 13,602 | 409,284 | ||||||
| Public Service Enterprise Group, Inc. | 12,713 | 407,325 | ||||||
| Duke Energy Corp. | 5,600 | 386,456 | ||||||
| Northeast Utilities | 9,000 | 381,510 | ||||||
| TECO Energy, Inc. | 20,300 | 349,972 | ||||||
| American Electric Power Company, Inc. | 7,300 | 341,202 | ||||||
| CMS Energy Corp. | 10,800 | 289,116 | ||||||
| Total Utilities | 11,286,411 | |||||||
| CONSUMER DISCRETIONARY - 9.5% | ||||||||
| General Motors Co.* | 24,400 | 997,228 | ||||||
| Staples, Inc. | 62,426 | 991,949 | ||||||
| AutoNation, Inc.* | 15,100 | 750,319 | ||||||
| Ford Motor Co. | 44,333 | 684,058 | ||||||
| Kohl’s Corp. | 11,570 | 656,598 | ||||||
| DR Horton, Inc. | 26,100 | 582,552 | ||||||
| Target Corp. | 9,190 | 581,451 | ||||||
| Whirlpool Corp. | 3,151 | 494,266 | ||||||
| PulteGroup, Inc. | 23,800 | 484,806 | ||||||
| Carnival Corp. | 11,800 | 474,006 | ||||||
| Macy’s, Inc. | 5,950 | 317,730 | ||||||
| Total Consumer Discretionary | 7,014,963 | |||||||
| CONSUMER STAPLES - 7.5% | ||||||||
| Archer-Daniels-Midland Co. | 27,063 | 1,174,534 | ||||||
| Tyson Foods, Inc. — Class A | 30,676 | 1,026,418 | ||||||
| Kroger Co. | 17,479 | 690,945 | ||||||
| Sysco Corp. | 16,666 | 601,643 | ||||||
| CVS Caremark Corp. | 7,545 | 539,996 | ||||||
| Wal-Mart Stores, Inc. | 6,000 | 472,140 | ||||||
| Molson Coors Brewing Co. — Class B | 7,450 | 418,318 | ||||||
| Costco Wholesale Corp. | 3,000 | 357,030 | ||||||
| ConAgra Foods, Inc. | 8,100 | 272,970 | ||||||
| Total Consumer Staples | 5,553,994 | |||||||
| HEALTH CARE - 7.2% | ||||||||
| WellPoint, Inc. | 15,407 | 1,423,452 | ||||||
| Humana, Inc. | 10,580 | 1,092,068 | ||||||
| Aetna, Inc. | 11,698 | 802,366 | ||||||
| 20 | the RYDEX FUNDS ANNUAL REPORT | See Notes to Financial Statements. |
| SCHEDULE OF INVESTMENTS (concluded) | December 31, 2013 |
| S&P 500® PURE VALUE FUND | |
| Shares | Value | |||||||
| Express Scripts Holding Co.* | 8,500 | $ | 597,040 | |||||
| Unitedhealth Group, Inc. | 7,780 | 585,834 | ||||||
| Cardinal health, Inc. | 8,388 | 560,402 | ||||||
| Quest Diagnostics, Inc. | 4,300 | 230,222 | ||||||
| Total Health Care | 5,291,384 | |||||||
| MATERIALS - 5.7% | ||||||||
| Alcoa, Inc. | 139,982 | 1,488,009 | ||||||
| Allegheny Technologies, Inc. | 13,302 | 473,950 | ||||||
| Dow Chemical Co. | 8,588 | 381,307 | ||||||
| Mosaic Co. | 7,600 | 359,252 | ||||||
| International Paper Co. | 7,300 | 357,919 | ||||||
| Bemis Company, Inc. | 8,300 | 339,968 | ||||||
| Freeport-McMoRan Copper & Gold, Inc. | 8,200 | 309,468 | ||||||
| Avery Dennison Corp. | 5,210 | 261,490 | ||||||
| Nucor Corp. | 4,800 | 256,224 | ||||||
| Total Materials | 4,227,587 | |||||||
| INFORMATION TECHNOLOGY - 5.6% | ||||||||
| Xerox Corp. | 90,006 | 1,095,373 | ||||||
| Jabil Circuit, Inc. | 54,453 | 949,660 | ||||||
| Hewlett-Packard Co. | 33,600 | 940,128 | ||||||
| Computer Sciences Corp. | 12,700 | 709,676 | ||||||
| Corning, Inc. | 26,573 | 473,531 | ||||||
| Total Information Technology | 4,168,368 | |||||||
| INDUSTRIALS - 5.0% | ||||||||
| L-3 Communications holdings, Inc. | 6,783 | 724,831 | ||||||
| Ryder System, Inc. | 9,484 | 699,730 | ||||||
| Jacobs engineering Group, Inc.* | 9,975 | 628,325 | ||||||
| Fluor Corp. | 7,650 | 614,219 | ||||||
| Joy Global, Inc. | 6,900 | 403,581 | ||||||
| Deere & Co. | 3,600 | 328,788 | ||||||
| Stanley Black & Decker, Inc. | 3,300 | 266,277 | ||||||
| Total Industrials | 3,665,751 | |||||||
| TELECOMMUNICATION SERVICES - 1.3% | ||||||||
| Frontier Communications Corp.1 | 111,756 | 519,665 | ||||||
| CenturyLink, Inc. | 14,900 | 474,565 | ||||||
| Total Telecommunication Services | 994,230 | |||||||
| Total Common Stocks | ||||||||
| (Cost $60,974,351) | 73,548,234 | |||||||
| Face | ||||||||
| Amount | ||||||||
| REPURCHASE AGREEMENT††,2 - 0.6% | ||||||||
| Credit Suisse Group | ||||||||
| issued 12/31/13 at 0.00% | ||||||||
| due 01/02/14 | $ | 422,691 | 422,691 | |||||
| Total Repurchase Agreement | ||||||||
| (Cost $422,691) | 422,691 | |||||||
| SECURITIES LENDING COLLATERAL††,3 - 0.1% | ||||||||
| Repurchase Agreements | ||||||||
| HSBC Securities, Inc. | ||||||||
| issued 12/31/13 at 0.01% | ||||||||
| due 01/02/14 | 74,081 | 74,081 | ||||||
| Deutsche Bank Securities, Inc. | ||||||||
| issued 12/31/13 at 0.02% | ||||||||
| due 01/02/14 | 10,919 | 10,919 | ||||||
| Total Securities Lending Collateral | ||||||||
| (Cost $85,000) | 85,000 | |||||||
| Total Investments - 100.1% | ||||||||
| (Cost $61,482,042) | $ | 74,055,925 | ||||||
| Other Assets & Liabilities, net - (0.1)% | (54,890 | ) | ||||||
| Total Net Assets - 100.0% | $ | 74,001,035 | ||||||
| * | Non-income producing security. |
| † | Value determined based on Level 1 inputs — See Note 4. |
| †† | Value determined based on Level 2 inputs — See Note 4. |
| 1 | All or portion of this security is on loan at December 31, 2013 — See Note 10. |
| 2 | Repurchase Agreement — See Note 5. |
| 3 | Securities lending collateral — See Note 10. |
plc — Public Limited Company
| See Notes to Financial Statements. | The RYDEX FUNDS ANNUAL REPORT | 21 |
| S&P 500® PURE VALUE FUND |
| STATEMENT OF ASSETS |
| AND LIABILITIES |
December 31, 2013
| Assets: | ||||
| Investments, at value - including $79,050 of securities loaned | ||||
| (cost $60,974,351) | $ | 73,548,234 | ||
| Repurchase agreements, at value | ||||
| (cost $507,691) | 507,691 | |||
| Total investments | ||||
| (cost $61,482,042) | 74,055,925 | |||
| Receivables: | ||||
| Securities sold | 732,169 | |||
| Fund shares sold | 158,192 | |||
| Dividends | 79,387 | |||
| Interest and securities lending income | 429 | |||
| Total assets | 75,026,102 | |||
| Liabilities: | ||||
| Payable for: | ||||
| Fund shares redeemed | 787,578 | |||
| Upon return of securities loaned | 85,000 | |||
| Management fees | 44,986 | |||
| Transfer agent and administrative fees | 14,995 | |||
| Investor service fees | 14,995 | |||
| Portfolio accounting fees | 5,999 | |||
| Miscellaneous | 71,514 | |||
| Total liabilities | 1,025,067 | |||
| Net assets | $ | 74,001,035 | ||
| Net assets consist of: | ||||
| Paid in capital | $ | 60,136,497 | ||
| Undistributed net investment income | 266,085 | |||
| Accumulated net realized gain on investments | 1,024,570 | |||
| Net unrealized appreciation on investments | 12,573,883 | |||
| Net assets | $ | 74,001,035 | ||
| Capital shares outstanding | 531,618 | |||
| Net asset value per share | $ | 139.20 |
| STATEMENT OF |
| OPERATIONS |
Year Ended December 31, 2013
| Investment Income: | ||||
| Dividends (net of foreign withholding tax of $371) | $ | 932,135 | ||
| Income from securities lending, net | 12,449 | |||
| Interest | 66 | |||
| Total investment income | 944,650 | |||
| Expenses: | ||||
| Management fees | 374,960 | |||
| Transfer agent and administrative fees | 124,987 | |||
| Investor service fees | 124,987 | |||
| Portfolio accounting fees | 49,994 | |||
| Professional fees | 44,429 | |||
| Custodian fees | 5,751 | |||
| Trustees’ fees* | 3,694 | |||
| Line of credit interest expense | 127 | |||
| Miscellaneous | 40,752 | |||
| Total expenses | 769,681 | |||
| Net investment income | 174,969 | |||
| Net Realized and Unrealized Gain (Loss): | ||||
| Net realized gain (loss) on: | ||||
| Investments | 7,281,492 | |||
| Net realized gain | 7,281,492 | |||
| Net change in unrealized appreciation (depreciation) on: | ||||
| Investments | 8,924,491 | |||
| Net change in unrealized appreciation (depreciation) | 8,924,491 | |||
| Net realized and unrealized gain | 16,205,983 | |||
| Net increase in net assets resulting from operations | $ | 16,380,952 |
| * | Relates to Trustees not deemed “interested persons” within the meaning of Section 2(a)(19) of the 1940 Act. |
| 22 | the RYDEX FUNDS ANNUAL REPORT | See Notes to Financial Statements. |
| S&P 500® PURE VALUE FUND |
| STATEMENTS OF CHANGES IN NET ASSETS |
| Year Ended | Year Ended | |||||||
| December 31, | December 31, | |||||||
| 2013 | 2012 | |||||||
| Increase (Decrease) In Net Assets From Operations: | ||||||||
| Net investment income | $ | 174,969 | $ | 101,618 | ||||
| Net realized gain on investments | 7,281,492 | 2,821,072 | ||||||
| Net change in unrealized appreciation (depreciation) on investments | 8,924,491 | 1,594,160 | ||||||
| Net increase in net assets resulting from operations | 16,380,952 | 4,516,850 | ||||||
| Distributions to shareholders from: | ||||||||
| Net investment income | — | (111,576 | ) | |||||
| Total distributions to shareholders | — | (111,576 | ) | |||||
| Capital share transactions: | ||||||||
| Proceeds from sale of shares | 202,720,977 | 142,596,560 | ||||||
| Distributions reinvested | — | 111,576 | ||||||
| Cost of shares redeemed | (173,978,316 | ) | (149,782,746 | ) | ||||
| Net increase (decrease) from capital share transactions | 28,742,661 | (7,074,610 | ) | |||||
| Net increase (decrease) in net assets | 45,123,613 | (2,669,336 | ) | |||||
| Net assets: | ||||||||
| Beginning of year | 28,877,422 | 31,546,758 | ||||||
| End of year | $ | 74,001,035 | $ | 28,877,422 | ||||
| Undistributed net investment income at end of year | $ | 266,085 | $ | 99,948 | ||||
| Capital share activity: | ||||||||
| Shares sold | 1,757,975 | 1,632,941 | ||||||
| Shares issued from reinvestment of distributions | — | 1,243 | ||||||
| Shares redeemed | (1,527,730 | ) | (1,733,240 | ) | ||||
| Net increase (decrease) in shares | 230,245 | (99,056 | ) | |||||
| See Notes to Financial Statements. | The RYDEX FUNDS ANNUAL REPORT | 23 |
| S&P 500® PURE VALUE FUND |
| FINANCIAL HIGHLIGHTS |
This table is presented to show selected data for a share outstanding throughout each period and to assist shareholders in evaluating a Fund’s performance for the periods presented.
| Year Ended | Year Ended | Year Ended | Year Ended | Year Ended | ||||||||||||||||
| December 31, | December 31, | December 31, | December 31, | December 31, | ||||||||||||||||
| 2013 | 2012 | 2011 | 2010 | 2009c | ||||||||||||||||
| Per Share Data | ||||||||||||||||||||
| Net asset value, beginning of period | $ | 95.82 | $ | 78.78 | $ | 81.39 | $ | 68.16 | $ | 45.81 | ||||||||||
| Income (loss) from investment operations: | ||||||||||||||||||||
| Net investment incomea | .41 | .35 | .29 | .02 | .65 | |||||||||||||||
| Net gain (loss) on investments (realized and unrealized) | 42.97 | 17.13 | (2.88 | ) | 13.79 | 22.78 | ||||||||||||||
| Total from investment operations | 43.38 | 17.48 | (2.59 | ) | 13.81 | 23.43 | ||||||||||||||
| Less distributions from: | ||||||||||||||||||||
| Net investment income | — | (.44 | ) | (.02 | ) | (.58 | ) | (1.08 | ) | |||||||||||
| Total distributions | — | (.44 | ) | (.02 | ) | (.58 | ) | (1.08 | ) | |||||||||||
| Net asset value, end of period | $ | 139.20 | $ | 95.82 | $ | 78.78 | $ | 81.39 | $ | 68.16 | ||||||||||
| Total Returnb | 45.26 | % | 22.23 | % | (3.17 | %) | 20.32 | % | 51.22 | % | ||||||||||
| Ratios/Supplemental Data | ||||||||||||||||||||
| Net assets, end of period (in thousands) | $ | 74,001 | $ | 28,877 | $ | 31,547 | $ | 29,243 | $ | 27,851 | ||||||||||
| Ratios to average net assets: | ||||||||||||||||||||
| Net investment income | 0.35 | % | 0.40 | % | 0.35 | % | 0.03 | % | 1.18 | % | ||||||||||
| Total expenses | 1.54 | % | 1.58 | % | 1.61 | % | 1.55 | % | 1.54 | % | ||||||||||
| Portfolio turnover rate | 371 | % | 523 | % | 724 | % | 425 | % | 421 | % | ||||||||||
| a | Net investment income per share was computed using average shares outstanding throughout the period. |
| b | Total return does not reflect the impact of any additional fees charged by insurance companies. |
| c | Per share amounts for the period January 1, 2009 through April 19, 2009 have been restated to reflect a 1:5 reverse share split effective April 20, 2009. |
| 24 | the RYDEX FUNDS ANNUAL REPORT | See Notes to Financial Statements. |
This page intentionally left blank.
| the RYDEX FUNDS ANNUAL REPORT | 25 |
| PERFORMANCE REPORT AND FUND PROFILE (Unaudited) | December 31, 2013 |
S&P MIDCAP 400® PURE GROWTH FUND
OBJECTIVE: Seeks to provide investment results that match, before fees and expenses, the performance of a benchmark for mid-cap growth securities on a daily basis. The Fund’s current benchmark is the S&P MidCap 400® Pure Growth Index (the “underlying index”).
For the year ended December 31, 2013, S&P MidCap 400® Pure Growth Fund returned 34.05%, compared with a gain of 36.14% for the underlying index.
The Consumer Discretionary sector contributed most to return, followed by the Financials sector. The Energy sector was the only sector detracting from return.
3D Systems Corp., United Therapeutics Corp. and Vertex Pharmaceuticals, Inc. added the most to return of the underlying index for the year.
Rackspace Hosting, Inc., Northern Oil and Gas, Inc. and Royal Gold, Inc. detracted the most from performance of the underlying index for the year.
Performance displayed represents past performance, which is no guarantee of future results.
Holdings Diversification (Market Exposure as % of Net Assets)

“Holdings Diversification (Market Exposure as % of Net Assets)” excludes any temporary cash investments.
Inception Date: May 3, 2004
| Ten Largest Holdings (% of Total Net Assets) | ||||
| 3D Systems Corp. | 2.4 | % | ||
| Synovus Financial Corp. | 2.4 | % | ||
| Salix Pharmaceuticals Ltd. | 2.2 | % | ||
| United Therapeutics Corp. | 2.1 | % | ||
| Green Mountain Coffee Roasters, Inc. | 2.1 | % | ||
| BancorpSouth, Inc. | 2.0 | % | ||
| AO Smith Corp. | 1.9 | % | ||
| Tempur Sealy International, Inc. | 1.9 | % | ||
| Trinity Industries, Inc. | 1.8 | % | ||
| Endo Health Solutions, Inc. | 1.8 | % | ||
| Top Ten Total | 20.6 | % | ||
“Ten Largest Holdings” exclude any temporary cash investments.
| 26 | the RYDEX FUNDS ANNUAL REPORT |
| performance report and FUND PROFILE (Unaudited) (concluded) |
Cumulative Fund Performance*,†
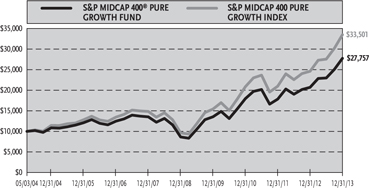
Average Annual Returns
Periods Ended December 31, 2013*,†
| Since | |||||||||
| Inception | |||||||||
| 1 Year | 5 Year | (05/03/04) | |||||||
| S&P MidCap 400® Pure Growth Fund | 34.05% | 26.29% | 11.14 | ||||||
| S&P MidCap 400 Pure Growth Index | 36.14% | 28.34% | 13.33 | ||||||
| * | The performance data above represents past performance that is not predictive of future results. The investment return and principal value of an investment in the Fund will fluctuate so that an investor’s shares, when redeemed, may be worth more or less than their original cost. Returns are historical and include changes in principal and reinvested dividends and capital gains and do not reflect the effect of taxes. The S&P MidCap 400 Pure Growth Index is an unmanaged index and, unlike the Fund, has no management fees or operating expenses to reduce its reported return. |
| † | Returns do not reflect the impact of any additional fees charged by insurance companies. |
| the RYDEX FUNDS ANNUAL REPORT | 27 |
| SCHEDULE OF INVESTMENTS | December 31, 2013 |
| S&P MIDCAP 400® PURE GROWTH FUND |
| Shares | Value | |||||||
| COMMON STOCKS† - 99.5% | ||||||||
| INDUSTRIALS - 21.3% | ||||||||
| AO Smith Corp. | 17,890 | $ | 964,986 | |||||
| Trinity Industries, Inc. | 16,800 | 915,935 | ||||||
| Corporate Executive Board Co. | 10,430 | 807,595 | ||||||
| Kirby Corp.* | 7,770 | 771,173 | ||||||
| B/E Aerospace, Inc.* | 8,710 | 758,031 | ||||||
| United Rentals, Inc.* | 8,690 | 677,386 | ||||||
| Wabtec Corp. | 8,692 | 645,555 | ||||||
| Terex Corp. | 14,120 | 592,899 | ||||||
| Towers Watson & Co. — Class A | 4,190 | 534,686 | ||||||
| Old Dominion Freight Line, Inc.* | 9,680 | 513,234 | ||||||
| Alaska Air Group, Inc. | 6,357 | 466,413 | ||||||
| Graco, Inc. | 5,610 | 438,253 | ||||||
| Fortune Brands Home & Security, Inc. | 8,560 | 391,192 | ||||||
| HNI Corp. | 9,660 | 375,098 | ||||||
| Genesee & Wyoming, Inc. — Class A* | 3,880 | 372,674 | ||||||
| Lincoln Electric Holdings, Inc. | 4,710 | 336,011 | ||||||
| Copart, Inc.* | 8,422 | 308,666 | ||||||
| IDEX Corp. | 3,530 | 260,691 | ||||||
| Deluxe Corp. | 4,570 | 238,508 | ||||||
| J.B. Hunt Transport Services, Inc. | 2,960 | 228,808 | ||||||
| Total Industrials | 10,597,794 | |||||||
| CONSUMER DISCRETIONARY - 20.2% | ||||||||
| Tempur Sealy International, Inc.* | 17,640 | 951,854 | ||||||
| Deckers Outdoor Corp.* | 10,220 | 863,181 | ||||||
| Wendy’s Co. | 94,800 | 826,655 | ||||||
| Toll Brothers, Inc.* | 21,440 | 793,280 | ||||||
| Bally Technologies, Inc.* | 9,290 | 728,801 | ||||||
| Polaris Industries, Inc. | 4,839 | 704,752 | ||||||
| Under Armour, Inc. — Class A* | 7,808 | 681,638 | ||||||
| LKQ Corp.* | 19,182 | 631,088 | ||||||
| Jarden Corp.* | 8,275 | 507,671 | ||||||
| Tractor Supply Co. | 6,202 | 481,151 | ||||||
| Gentex Corp. | 13,439 | 443,353 | ||||||
| Brinker International, Inc. | 8,600 | 398,524 | ||||||
| Scientific Games Corp. — Class A* | 22,240 | 376,523 | ||||||
| Hanesbrands, Inc. | 5,170 | 363,296 | ||||||
| Brunswick Corp. | 7,850 | 361,571 | ||||||
| Sotheby’s | 5,150 | 273,980 | ||||||
| Domino’s Pizza, Inc. | 3,370 | 234,721 | ||||||
| DreamWorks Animation SKG, Inc. — | ||||||||
| Class A* | 6,380 | 226,490 | ||||||
| Carter’s, Inc. | 2,913 | 209,124 | ||||||
| Total Consumer Discretionary | 10,057,653 | |||||||
| FINANCIALS - 18.6% | ||||||||
| Synovus Financial Corp. | 330,060 | 1,188,216 | ||||||
| BancorpSouth, Inc. | 38,340 | 974,603 | ||||||
| Cathay General Bancorp | 32,645 | 872,601 | ||||||
| SVB Financial Group* | 8,180 | 857,755 | ||||||
| Old Republic International Corp. | 49,090 | 847,784 | ||||||
| Associated Banc-Corp. | 40,720 | 708,528 | ||||||
| Waddell & Reed Financial, Inc. — Class A | 8,620 | 561,334 | ||||||
| Washington Federal, Inc. | 20,287 | 472,484 | ||||||
| Signature Bank* | 4,276 | 459,328 | ||||||
| CBOE Holdings, Inc. | 8,470 | 440,101 | ||||||
| Affiliated Managers Group, Inc.* | 1,850 | 401,228 | ||||||
| City National Corp. | 4,448 | 352,371 | ||||||
| MSCI, Inc. — Class A* | 7,840 | 342,765 | ||||||
| East West Bancorp, Inc. | 8,410 | 294,098 | ||||||
| Alexander & Baldwin, Inc. | 6,110 | 254,970 | ||||||
| Omega Healthcare Investors, Inc. | 6,920 | 206,216 | ||||||
| Total Financials | 9,234,382 | |||||||
| INFORMATION TECHNOLOGY - 15.4% | ||||||||
| 3D Systems Corp.*,1 | 12,880 | 1,196,938 | ||||||
| PTC, Inc.* | 16,190 | 572,964 | ||||||
| Mentor Graphics Corp. | 23,360 | 562,275 | ||||||
| ACI Worldwide, Inc.* | 8,200 | 533,000 | ||||||
| WEX, Inc.* | 5,240 | 518,917 | ||||||
| Concur Technologies, Inc.* | 4,007 | 413,442 | ||||||
| Cree, Inc.* | 6,440 | 402,951 | ||||||
| NeuStar, Inc. — Class A* | 7,963 | 397,035 | ||||||
| CoreLogic, Inc.* | 10,660 | 378,750 | ||||||
| Ciena Corp.* | 14,619 | 349,833 | ||||||
| ValueClick, Inc.* | 14,840 | 346,811 | ||||||
| Advent Software, Inc. | 9,190 | 321,558 | ||||||
| Fair Isaac Corp. | 5,010 | 314,828 | ||||||
| Acxiom Corp.* | 8,010 | 296,210 | ||||||
| CommVault Systems, Inc.* | 3,600 | 269,568 | ||||||
| Trimble Navigation Ltd.* | 7,658 | 265,733 | ||||||
| Global Payments, Inc. | 4,050 | 263,210 | ||||||
| Broadridge Financial Solutions, Inc. | 6,020 | 237,910 | ||||||
| Total Information Technology | 7,641,933 | |||||||
| HEALTH CARE - 9.3% | ||||||||
| Salix Pharmaceuticals Ltd.* | 12,280 | 1,104,464 | ||||||
| United Therapeutics Corp.* | 9,252 | 1,046,216 | ||||||
| Endo Health Solutions, Inc.* | 13,470 | 908,686 | ||||||
| Universal Health Services, Inc. — Class B | 7,280 | 591,573 | ||||||
| Cubist Pharmaceuticals, Inc.* | 5,600 | 385,672 | ||||||
| Charles River Laboratories | ||||||||
| International, Inc.* | 5,570 | 295,433 | ||||||
| Covance, Inc.* | 3,240 | 285,314 | ||||||
| Total Health Care | 4,617,358 | |||||||
| 28 | the RYDEX FUNDS ANNUAL REPORT | See Notes to Financial Statements. |
| SCHEDULE OF INVESTMENTS (concluded) | December 31, 2013 |
| S&P MIDCAP 400® PURE GROWTH FUND |
| Shares | Value | |||||||
| ENERGY - 8.4% | ||||||||
| Patterson-UTI Energy, Inc. | 35,140 | $ | 889,745 | |||||
| SM Energy Co. | 9,660 | 802,842 | ||||||
| Rosetta Resources, Inc.* | 10,880 | 522,675 | ||||||
| Oil States International, Inc.* | 5,100 | 518,772 | ||||||
| Oceaneering International, Inc. | 6,010 | 474,069 | ||||||
| CARBO Ceramics, Inc. | 3,130 | 364,739 | ||||||
| Dril-Quip, Inc.* | 2,790 | 306,705 | ||||||
| Gulfport Energy Corp.* | 4,610 | 291,122 | ||||||
| Total Energy | 4,170,669 | |||||||
| CONSUMER STAPLES - 3.6% | ||||||||
| Green Mountain Coffee Roasters, Inc.* | 13,540 | 1,023,353 | ||||||
| Hain Celestial Group, Inc.* | 4,410 | 400,340 | ||||||
| SUPERVALU, Inc.* | 52,190 | 380,465 | ||||||
| Total Consumer Staples | 1,804,158 | |||||||
| MATERIALS - 2.7% | ||||||||
| Worthington Industries, Inc. | 12,117 | 509,883 | ||||||
| Packaging Corporation of America | 6,570 | 415,750 | ||||||
| Eagle Materials, Inc. | 5,190 | 401,862 | ||||||
| Total Materials | 1,327,495 | |||||||
| Total Common Stocks | ||||||||
| (Cost $41,291,918) | 49,451,442 | |||||||
| Face | ||||||||
| Amount | ||||||||
| REPURCHASE AGREEMENT††,2 - 0.7% | ||||||||
| Credit Suisse Group | ||||||||
| issued 12/31/13 at 0.00% | ||||||||
| due 01/02/14 | $ | 335,323 | 335,323 | |||||
| Total Repurchase Agreement | ||||||||
| (Cost $335,323) | 335,323 | |||||||
| SECURITIES LENDING COLLATERAL††,3 - 1.7% | ||||||||
| Repurchase Agreements | ||||||||
| HSBC Securities, Inc. | ||||||||
| issued 12/31/13 at 0.01% | ||||||||
| due 01/02/14 | 753,704 | 753,704 | ||||||
| Deutsche Bank Securities, Inc. | ||||||||
| issued 12/31/13 at 0.02% | ||||||||
| due 01/02/14 | 111,096 | 111,096 | ||||||
| Total Securities Lending Collateral | ||||||||
| (Cost $864,800) | 864,800 | |||||||
| Total Investments - 101.9% | ||||||||
| (Cost $42,492,041) | $ | 50,651,565 | ||||||
| Other Assets & Liabilities, net - (1.9)% | (950,981 | ) | ||||||
| Total Net Assets - 100.0% | $ | 49,700,584 | ||||||
| * | Non-income producing security. |
| † | Value determined based on Level 1 inputs — See Note 4. |
| †† | Value determined based on Level 2 inputs — See Note 4. |
| 1 | All or portion of this security is on loan at December 31, 2013 — See Note 10. |
| 2 | Repurchase Agreement — See Note 5. |
| 3 | Securities lending collateral — See Note 10. |
| See Notes to Financial Statements. | The RYDEX FUNDS ANNUAL REPORT | 29 |
| S&P MIDCAP 400® PURE GROWTH FUND |
| STATEMENT OF ASSETS |
| AND LIABILITIES |
December 31, 2013
| Assets: | ||||
| Investments, at value - including $854,956 of securities loaned | ||||
| (cost $41,291,918) | $ | 49,451,442 | ||
| Repurchase agreements, at value | ||||
| (cost $1,200,123) | 1,200,123 | |||
| Total investments | ||||
| (cost $42,492,041) | 50,651,565 | |||
| Receivables: | ||||
| Fund shares sold | 514,578 | |||
| Dividends | 14,628 | |||
| Interest and securities lending income | 1,468 | |||
| Total assets | 51,182,239 | |||
| Liabilities: | ||||
| Payable for: | ||||
| Upon return of securities loaned | 864,800 | |||
| Securities purchased | 500,576 | |||
| Management fees | 27,917 | |||
| Fund shares redeemed | 9,704 | |||
| Transfer agent and administrative fees | 9,306 | |||
| Investor service fees | 9,306 | |||
| Portfolio accounting fees | 3,722 | |||
| Miscellaneous | 56,324 | |||
| Total liabilities | 1,481,655 | |||
| Net assets | $ | 49,700,584 | ||
| Net assets consist of: | ||||
| Paid in capital | $ | 36,583,352 | ||
| Undistributed net investment income | — | |||
| Accumulated net realized gain on investments | 4,957,708 | |||
| Net unrealized appreciation on investments | 8,159,524 | |||
| Net assets | $ | 49,700,584 | ||
| Capital shares outstanding | 1,155,176 | |||
| Net asset value per share | $ | 43.02 |
| STATEMENT OF |
| OPERATIONS |
Year Ended December 31, 2013
| Investment Income: | ||||
| Dividends | $ | 392,784 | ||
| Income from securities lending, net | 32,570 | |||
| Interest | 59 | |||
| Total investment income | 425,413 | |||
| Expenses: | ||||
| Management fees | 286,938 | |||
| Transfer agent and administrative fees | 95,646 | |||
| Investor service fees | 95,646 | |||
| Portfolio accounting fees | 38,258 | |||
| Professional fees | 34,559 | |||
| Custodian fees | 4,351 | |||
| Trustees’ fees* | 3,387 | |||
| Line of credit interest expense | 76 | |||
| Miscellaneous | 30,696 | |||
| Total expenses | 589,557 | |||
| Net investment loss | (164,144 | ) | ||
| Net Realized and Unrealized Gain (Loss): | ||||
| Net realized gain (loss) on: | ||||
| Investments | 5,721,441 | |||
| Net realized gain | 5,721,441 | |||
| Net change in unrealized appreciation (depreciation) on: | ||||
| Investments | 4,411,625 | |||
| Net change in unrealized appreciation (depreciation) | 4,411,625 | |||
| Net realized and unrealized gain | 10,133,066 | |||
| Net increase in net assets resulting from operations | $ | 9,968,922 |
| * | Relates to Trustees not deemed “interested persons” within the meaning of Section 2(a)(19) of the 1940 Act. |
| 30 | the RYDEX FUNDS ANNUAL REPORT | See Notes to Financial Statements. |
| S&P MIDCAP 400® PURE GROWTH FUND |
| STATEMENTS OF CHANGES IN NET ASSETS |
| Year Ended | Year Ended | |||||||
| December 31, | December 31, | |||||||
| 2013 | 2012 | |||||||
| Increase (Decrease) In Net Assets From Operations: | ||||||||
| Net investment loss | $ | (164,144 | ) | $ | (151,894 | ) | ||
| Net realized gain on investments | 5,721,441 | 4,796,822 | ||||||
| Net change in unrealized appreciation (depreciation) on investments | 4,411,625 | (1,218,689 | ) | |||||
| Net increase in net assets resulting from operations | 9,968,922 | 3,426,239 | ||||||
| Distributions to shareholders from: | ||||||||
| Net realized gains | (3,465,958 | ) | (4,252,045 | ) | ||||
| Total distributions to shareholders | (3,465,958 | ) | (4,252,045 | ) | ||||
| Capital share transactions: | ||||||||
| Proceeds from sale of shares | 114,968,409 | 47,178,312 | ||||||
| Distributions reinvested | 3,465,958 | 4,252,045 | ||||||
| Cost of shares redeemed | (107,579,809 | ) | (45,640,576 | ) | ||||
| Net increase from capital share transactions | 10,854,558 | 5,789,781 | ||||||
| Net increase in net assets | 17,357,522 | 4,963,975 | ||||||
| Net assets: | ||||||||
| Beginning of year | 32,343,062 | 27,379,087 | ||||||
| End of year | $ | 49,700,584 | $ | 32,343,062 | ||||
| Undistributed net investment income at end of year | $ | — | $ | — | ||||
| Capital share activity: | ||||||||
| Shares sold | 2,895,355 | 1,219,241 | ||||||
| Shares issued from reinvestment of distributions | 84,971 | 127,536 | ||||||
| Shares redeemed | (2,758,198 | ) | (1,163,637 | ) | ||||
| Net increase in shares | 222,128 | 183,140 | ||||||
| SEE NOTES TO FINANCIAL STATEMENTS. | THE RYDEX FUNDS ANNUAL REPORT | 31 |
| S&P MIDCAP 400® PURE GROWTH FUND |
| FINANCIAL HIGHLIGHTS |
This table is presented to show selected data for a share outstanding throughout each period and to assist shareholders in evaluating a Fund’s performance for the periods presented.
| Year Ended | Year Ended | Year Ended | Year Ended | Year Ended | ||||||||||||||||
| December 31, | December 31, | December 31, | December 31, | December 31, | ||||||||||||||||
| 2013 | 2012 | 2011 | 2010 | 2009 | ||||||||||||||||
| Per Share Data | ||||||||||||||||||||
| Net asset value, beginning of period | $ | 34.66 | $ | 36.51 | $ | 39.19 | $ | 29.56 | $ | 18.85 | ||||||||||
| Income (loss) from investment operations: | ||||||||||||||||||||
| Net investment lossa | (.17 | ) | (.23 | ) | (.52 | ) | (.35 | ) | (.25 | ) | ||||||||||
| Net gain on investments (realized and unrealized) | 11.79 | 5.80 | .34 | 9.98 | 10.96 | |||||||||||||||
| Total from investment operations | 11.62 | 5.57 | (.18 | ) | 9.63 | 10.71 | ||||||||||||||
| Less distributions from: | ||||||||||||||||||||
| Net realized gains | (3.26 | ) | (7.42 | ) | (2.50 | ) | — | — | ||||||||||||
| Total distributions | (3.26 | ) | (7.42 | ) | (2.50 | ) | — | — | ||||||||||||
| Net asset value, end of period | $ | 43.02 | $ | 34.66 | $ | 36.51 | $ | 39.19 | $ | 29.56 | ||||||||||
| Total Returnb | 34.05 | % | 16.05 | % | (0.66 | %) | 32.58 | % | 56.82 | % | ||||||||||
| Ratios/Supplemental Data | ||||||||||||||||||||
| Net assets, end of period (in thousands) | $ | 49,701 | $ | 32,343 | $ | 27,379 | $ | 62,178 | $ | 44,918 | ||||||||||
| Ratios to average net assets: | ||||||||||||||||||||
| Net investment loss | (0.43 | %) | (0.58 | %) | (1.26 | %) | (1.06 | %) | (1.01 | %) | ||||||||||
| Total expenses | 1.54 | % | 1.58 | % | 1.61 | % | 1.56 | % | 1.55 | % | ||||||||||
| Portfolio turnover rate | 335 | % | 234 | % | 202 | % | 304 | % | 244 | % | ||||||||||
| a | Net investment loss per share was computed using average shares outstanding throughout the period. |
| b | Total return does not reflect the impact of any additional fees charged by insurance companies. |
| 32 | the RYDEX FUNDS ANNUAL REPORT | See Notes to Financial Statements. |
This page intentionally left blank.
| the RYDEX FUNDS ANNUAL REPORT | 33 |
| PERFORMANCE REPORT AND FUND PROFILE (Unaudited) | December 31, 2013 |
S&P MIDCAP 400® PURE VALUE FUND
OBJECTIVE: Seeks to provide investment results that match, before fees and expenses, the performance of a benchmark for mid-cap value securities on a daily basis. The Fund’s current benchmark is the S&P MidCap 400® Pure Value Index (the “underlying index”).
For the year ended December 31, 2013, S&P MidCap 400® Pure Value Fund returned 35.80%, compared with a return of 38.83% for the underlying index.
The Industrials and Financials sectors contributed most to return. No sector detracted, but the Telecommunications Services sector contributed least, followed by the Utilities sector.
Manpower, Inc., StanCorp Financial Group, Inc. and Protective Life Corp. added the most to return of the underlying index for the year.
Arch Coal, Inc., Monster Worldwide, Inc. and Alpha Natural Resources, Inc. detracted the most from performance of the underlying index for the year.
Performance displayed represents past performance, which is no guarantee of future results.
Holdings Diversification (Market Exposure as % of Net Assets)

“Holdings Diversification (Market Exposure as % of Net Assets)” excludes any temporary cash investments.
Inception Date: May 3, 2004
| Ten Largest Holdings (% of Total Net Assets) | ||||
| URS Corp. | 2.3 | % | ||
| ManTech International Corp. — Class A | 2.3 | % | ||
| Ingram Micro, Inc. — Class A | 2.2 | % | ||
| Tech Data Corp. | 2.2 | % | ||
| Avnet, Inc. | 2.0 | % | ||
| Reinsurance Group of America, Inc. — Class A | 2.0 | % | ||
| Universal Corp. | 1.9 | % | ||
| Arrow Electronics, Inc. | 1.9 | % | ||
| AECOM Technology Corp. | 1.8 | % | ||
| Community Health Systems, Inc. | 1.6 | % | ||
| Top Ten Total | 20.2 | % | ||
“Ten Largest Holdings” exclude any temporary cash investments.
| 34 | the RYDEX FUNDS ANNUAL REPORT |
PERFORMANCE REPORT AND FUND PROFILE (Unaudited) (concluded)
Cumulative Fund Performance*,†
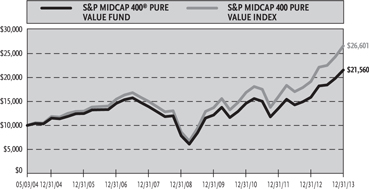
Average Annual Returns
Periods Ended December 31, 2013*,†
| Since | ||||||||||||
| Inception | ||||||||||||
| 1 Year | 5 Year | (05/03/04) | ||||||||||
| S&P MidCap 400® Pure Value Fund | 35.80 | % | 22.43 | % | 8.27 | % | ||||||
| S&P MidCap 400 Pure Value Index | 38.83 | % | 25.32 | % | 10.66 | % | ||||||
| * | The performance data above represents past performance that is not predictive of future results. The investment return and principal value of an investment in the Fund will fluctuate so that an investor’s shares, when redeemed, may be worth more or less than their original cost. Returns are historical and include changes in principal and reinvested dividends and capital gains and do not reflect the effect of taxes. The S&P MidCap 400 Pure Value Index is an unmanaged index and, unlike the Fund, has no management fees or operating expenses to reduce its reported return. |
| † | Returns do not reflect the impact of any additional fees charged by insurance companies. |
| the RYDEX FUNDS ANNUAL REPORT | 35 |
| SCHEDULE OF INVESTMENTS | December 31, 2013 |
| S&P MIDCAP 400® PURE VALUE FUND |
| Shares | Value | |||||||
| COMMON STOCKS† - 99.5% | ||||||||
| FINANCIALS - 20.3% | ||||||||
| Reinsurance Group of America, | ||||||||
| Inc. — Class A | 7,176 | $ | 555,495 | |||||
| First American Financial Corp. | 15,800 | 445,561 | ||||||
| Hanover Insurance Group, Inc. | 7,234 | 431,942 | ||||||
| Kemper Corp. | 8,708 | 355,983 | ||||||
| Protective Life Corp. | 7,023 | 355,785 | ||||||
| Aspen Insurance Holdings Ltd. | 8,400 | 347,004 | ||||||
| Fidelity National Financial, Inc. — Class A | 9,230 | 299,514 | ||||||
| American Financial Group, Inc. | 5,074 | 292,872 | ||||||
| Alleghany Corp.* | 670 | 267,973 | ||||||
| Everest Re Group Ltd. | 1,693 | 263,888 | ||||||
| WR Berkley Corp. | 6,075 | 263,594 | ||||||
| StanCorp Financial Group, Inc. | 3,721 | 246,516 | ||||||
| First Niagara Financial Group, Inc. | 21,864 | 232,197 | ||||||
| HCC Insurance Holdings, Inc. | 4,196 | 193,603 | ||||||
| Mercury General Corp. | 3,440 | 171,002 | ||||||
| Astoria Financial Corp. | 11,786 | 163,000 | ||||||
| Apollo Investment Corp. | 18,855 | 159,890 | ||||||
| Hancock Holding Co. | 3,530 | 129,480 | ||||||
| International Bancshares Corp. | 4,596 | 121,288 | ||||||
| Janus Capital Group, Inc. | 9,670 | 119,618 | ||||||
| Fulton Financial Corp. | 9,140 | 119,551 | ||||||
| New York Community Bancorp, Inc. | 6,020 | 101,437 | ||||||
| Valley National Bancorp | 10,020 | 101,402 | ||||||
| Total Financials | 5,738,595 | |||||||
| INFORMATION TECHNOLOGY - 17.0% | ||||||||
| ManTech International Corp. — Class A | 21,260 | 636,312 | ||||||
| Ingram Micro, Inc. — Class A* | 26,543 | 622,698 | ||||||
| Tech Data Corp.* | 11,961 | 617,187 | ||||||
| Avnet, Inc. | 12,690 | 559,756 | ||||||
| Arrow Electronics, Inc.* | 9,778 | 530,457 | ||||||
| Leidos Holdings, Inc. | 9,013 | 419,014 | ||||||
| Vishay Intertechnology, Inc.* | 27,610 | 366,109 | ||||||
| Science Applications International Corp. | 9,310 | 307,882 | ||||||
| Lexmark International, Inc. — Class A | 8,450 | 300,144 | ||||||
| Convergys Corp. | 7,720 | 162,506 | ||||||
| Fairchild Semiconductor International, | ||||||||
| Inc. — Class A* | 10,760 | 143,646 | ||||||
| Itron, Inc.* | 3,100 | 128,433 | ||||||
| Total Information Technology | 4,794,144 | |||||||
| INDUSTRIALS - 15.8% | ||||||||
| URS Corp. | 12,058 | 638,953 | ||||||
| AECOM Technology Corp.* | 17,442 | 513,318 | ||||||
| JetBlue Airways Corp.* | 50,634 | 432,921 | ||||||
| AGCO Corp. | 6,390 | 378,224 | ||||||
| Manpowergroup, Inc. | 3,809 | 327,041 | ||||||
| Oshkosh Corp. | 5,800 | 292,204 | ||||||
| Brink’s Co. | 8,392 | 286,503 | ||||||
| Granite Construction, Inc. | 8,090 | 282,988 | ||||||
| Exelis, Inc. | 11,370 | 216,712 | ||||||
| KBR, Inc. | 6,471 | 206,360 | ||||||
| Triumph Group, Inc. | 2,350 | 178,765 | ||||||
| Regal-Beloit Corp. | 2,200 | 162,184 | ||||||
| Esterline Technologies Corp.* | 1,570 | 160,077 | ||||||
| Matson, Inc. | 5,400 | 140,994 | ||||||
| UTI Worldwide, Inc. | 6,460 | 113,438 | ||||||
| Werner Enterprises, Inc. | 4,470 | 110,543 | ||||||
| Total Industrials | 4,441,225 | |||||||
| CONSUMER DISCRETIONARY - 11.4% | ||||||||
| Rent-A-Center, Inc. — Class A | 10,570 | 352,404 | ||||||
| Big Lots, Inc.* | 10,650 | 343,889 | ||||||
| Valassis Communications, Inc. | 9,780 | 334,965 | ||||||
| MDC Holdings, Inc. | 10,120 | 326,269 | ||||||
| CST Brands, Inc. | 7,980 | 293,025 | ||||||
| Murphy USA, Inc.* | 6,760 | 280,946 | ||||||
| Abercrombie & Fitch Co. — Class A | 8,310 | 273,482 | ||||||
| Ascena Retail Group, Inc.* | 8,330 | 176,263 | ||||||
| Aaron’s, Inc. | 5,510 | 161,994 | ||||||
| Apollo Education Group, Inc. — Class A* | 5,770 | 157,636 | ||||||
| Foot Locker, Inc. | 3,230 | 133,851 | ||||||
| JC Penney Company, Inc.*,1 | 14,400 | 131,760 | ||||||
| ANN, Inc.* | 3,400 | 124,304 | ||||||
| DeVry Education Group, Inc. | 3,280 | 116,440 | ||||||
| Total Consumer Discretionary | 3,207,228 | |||||||
| MATERIALS - 8.2% | ||||||||
| Domtar Corp. | 4,490 | 423,586 | ||||||
| Commercial Metals Co. | 17,787 | 361,609 | ||||||
| Steel Dynamics, Inc. | 15,686 | 306,504 | ||||||
| Reliance Steel & Aluminum Co. | 4,040 | 306,394 | ||||||
| Greif, Inc. — Class A | 4,800 | 251,520 | ||||||
| Ashland, Inc. | 2,470 | 239,689 | ||||||
| Olin Corp. | 8,110 | 233,974 | ||||||
| Cabot Corp. | 3,557 | 182,830 | ||||||
| Total Materials | 2,306,106 | |||||||
| HEALTH CARE - 6.9% | ||||||||
| Community Health Systems, Inc.* | 11,415 | 448,268 | ||||||
| Health Net, Inc.* | 15,021 | 445,673 | ||||||
| LifePoint Hospitals, Inc.* | 7,268 | 384,041 | ||||||
| WellCare Health Plans, Inc.* | 4,940 | 347,875 | ||||||
| Owens & Minor, Inc. | 8,408 | 307,396 | ||||||
| Total Health Care | 1,933,253 | |||||||
| ENERGY - 6.7% | ||||||||
| HollyFrontier Corp. | 8,900 | 442,241 | ||||||
| World Fuel Services Corp. | 10,000 | 431,600 | ||||||
| Superior Energy Services, Inc.* | 15,438 | 410,805 | ||||||
| Alpha Natural Resources, Inc.* | 30,030 | 214,414 | ||||||
| Tidewater, Inc. | 3,508 | 207,919 | ||||||
| Unit Corp.* | 3,256 | 168,075 | ||||||
| Total Energy | 1,875,054 | |||||||
| 36 | the RYDEX FUNDS ANNUAL REPORT | See Notes to Financial Statements. |
| SCHEDULE OF INVESTMENTS (concluded) | December 31, 2013 |
| S&P MIDCAP 400® PURE VALUE FUND | |
| Shares | Value | |||||||
| UTILITIES - 5.8% | ||||||||
| Great Plains energy, Inc. | 10,573 | $ | 256,291 | |||||
| UGI Corp. | 6,056 | 251,082 | ||||||
| PNM Resources, Inc. | 9,960 | 240,235 | ||||||
| Hawaiian Electric Industries, Inc. | 9,200 | 239,752 | ||||||
| Westar energy, Inc. | 5,520 | 177,578 | ||||||
| WGL holdings, Inc. | 4,420 | 177,065 | ||||||
| Atmos energy Corp. | 3,794 | 172,323 | ||||||
| IDACORP, Inc. | 2,350 | 121,824 | ||||||
| Total Utilities | 1,636,150 | |||||||
| CONSUMER STAPLES - 5.8% | ||||||||
| Universal Corp. | 9,787 | 534,370 | ||||||
| Dean Foods Co.* | 20,620 | 354,458 | ||||||
| Harris Teeter Supermarkets, Inc. | 5,110 | 252,179 | ||||||
| United Natural Foods, Inc.* | 2,390 | 180,182 | ||||||
| Ingredion, Inc. | 2,490 | 170,465 | ||||||
| Post holdings, Inc.* | 2,840 | 139,927 | ||||||
| Total Consumer Staples | 1,631,581 | |||||||
| TELECOMMUNICATION SERVICES - 1.6% | ||||||||
| Telephone & Data Systems, Inc. | 17,358 | 447,489 | ||||||
| Total Common Stocks | ||||||||
| (Cost $23,104,475) | 28,010,825 | |||||||
| Face | ||||||||
| Amount | ||||||||
| rePurChaSe aGreeMeNT††,2 - 0.6% | ||||||||
| Credit Suisse Group | ||||||||
| issued 12/31/13 at 0.00% | ||||||||
| due 01/02/14 | $ | 172,272 | 172,272 | |||||
| Total Repurchase Agreement | ||||||||
| (Cost $172,272) | 172,272 | |||||||
| SeCuriTieS leNdiNG COllaTeral††,3 - 0.4% | ||||||||
| Repurchase Agreements | ||||||||
| HSBC Securities, Inc. | ||||||||
| issued 12/31/13 at 0.01% | ||||||||
| due 01/02/14 | 89,768 | 89,768 | ||||||
| Deutsche Bank Securities, Inc. | ||||||||
| issued 12/31/13 at 0.02% | ||||||||
| due 01/02/14 | 13,232 | 13,232 | ||||||
| Total Securities Lending Collateral | ||||||||
| (Cost $103,000) | 103,000 | |||||||
| Total Investments - 100.5% | ||||||||
| (Cost $23,379,747) | $ | 28,286,097 | ||||||
| Other Assets & Liabilities, net - (0.5)% | (129,647 | ) | ||||||
| Total Net Assets - 100.0% | $ | 28,156,450 | ||||||
| * | Non-income producing security. |
| † | Value determined based on Level 1 inputs — See Note 4. |
| †† | Value determined based on Level 2 inputs — See Note 4. |
| 1 | All or portion of this security is on loan at December 31, 2013 — See Note 10. |
| 2 | Repurchase Agreement — See Note 5. |
| 3 | Securities lending collateral — See Note 10. |
| See Notes to Financial Statements. | The RYDEX FUNDS ANNUAL REPORT | 37 |
| S&P MIDCAP 400® PURE VALUE FUND |
| STATEMENT OF ASSETS |
| AND LIABILITIES |
December 31, 2013
| Assets: | ||||
| Investments, at value - including $94,245 of securities loaned | ||||
| (cost $23,104,475) | $ | 28,010,825 | ||
| Repurchase agreements, at value | ||||
| (cost $275,272) | 275,272 | |||
| Total investments | ||||
| (cost $23,379,747) | 28,286,097 | |||
| Receivables: | ||||
| Fund shares sold | 520,599 | |||
| Dividends | 22,894 | |||
| Interest and securities lending income | 142 | |||
| Total assets | 28,829,732 | |||
| Liabilities: | ||||
| Payable for: | ||||
| Securities purchased | 505,651 | |||
| Upon return of securities loaned | 103,000 | |||
| Management fees | 14,413 | |||
| Transfer agent and administrative fees | 4,804 | |||
| Investor service fees | 4,804 | |||
| Portfolio accounting fees | 1,922 | |||
| Fund shares redeemed | 127 | |||
| Miscellaneous | 38,561 | |||
| Total liabilities | 673,282 | |||
| Net assets | $ | 28,156,450 | ||
| Net assets consist of: | ||||
| Paid in capital | $ | 22,681,743 | ||
| Undistributed net investment income | 11,771 | |||
| Accumulated net realized gain on investments | 556,586 | |||
| Net unrealized appreciation on investments | 4,906,350 | |||
| Net assets | $ | 28,156,450 | ||
| Capital shares outstanding | 240,456 | |||
| Net asset value per share | $ | 117.10 |
| STATEMENT OF |
| OPERATIONS |
Year Ended December 31, 2013
| Investment Income: | ||||
| Dividends | $ | 417,336 | ||
| Income from securities lending, net | 5,286 | |||
| Interest | 63 | |||
| Total investment income | 422,685 | |||
| Expenses: | ||||
| Management fees | 199,653 | |||
| Transfer agent and administrative fees | 66,551 | |||
| Investor service fees | 66,551 | |||
| Portfolio accounting fees | 26,620 | |||
| Professional fees | 23,525 | |||
| Custodian fees | 3,098 | |||
| Trustees’ fees* | 2,114 | |||
| Line of credit interest expense | 49 | |||
| Miscellaneous | 22,753 | |||
| Total expenses | 410,914 | |||
| Net investment income | 11,771 | |||
| Net Realized and Unrealized Gain (Loss): | ||||
| Net realized gain (loss) on: | ||||
| Investments | 2,975,222 | |||
| Net realized gain | 2,975,222 | |||
| Net change in unrealized appreciation (depreciation) on: | ||||
| Investments | 3,275,418 | |||
| Net change in unrealized appreciation (depreciation) | 3,275,418 | |||
| Net realized and unrealized gain | 6,250,640 | |||
| Net increase in net assets resulting from operations | $ | 6,262,411 |
| * | Relates to Trustees not deemed “interested persons” within the meaning of Section 2(a)(19) of the 1940 Act. |
| 38 | the RYDEX FUNDS ANNUAL REPORT | See Notes to Financial Statements. |
| S&P MIDCAP 400® PURE VALUE FUND |
| STATEMENTS OF CHANGES IN NET ASSETS |
| Year Ended | Year Ended | |||||||
| December 31, | December 31, | |||||||
| 2013 | 2012 | |||||||
| Increase (Decrease) In Net Assets From Operations: | ||||||||
| Net investment income | $ | 11,771 | $ | 21,268 | ||||
| Net realized gain on investments | 2,975,222 | 2,529,506 | ||||||
| Net change in unrealized appreciation (depreciation) on investments | 3,275,418 | 268,575 | ||||||
| Net increase in net assets resulting from operations | 6,262,411 | 2,819,349 | ||||||
| Distributions to shareholders from: | ||||||||
| Net investment income | (21,268 | ) | — | |||||
| Total distributions to shareholders | (21,268 | ) | — | |||||
| Capital share transactions: | ||||||||
| Proceeds from sale of shares | 145,525,501 | 45,273,539 | ||||||
| Distributions reinvested | 21,268 | — | ||||||
| Cost of shares redeemed | (137,803,041 | ) | (56,820,860 | ) | ||||
| Net increase (decrease) from capital share transactions | 7,743,728 | (11,547,321 | ) | |||||
| Net increase (decrease) in net assets | 13,984,871 | (8,727,972 | ) | |||||
| Net assets: | ||||||||
| Beginning of year | 14,171,579 | 22,899,551 | ||||||
| End of year | $ | 28,156,450 | $ | 14,171,579 | ||||
| Undistributed net investment income at end of year | $ | 11,771 | $ | 21,268 | ||||
| Capital share activity: | ||||||||
| Shares sold | 1,414,891 | 554,487 | ||||||
| Shares issued from reinvestment of distributions | 188 | — | ||||||
| Shares redeemed | (1,338,851 | ) | (700,682 | ) | ||||
| Net increase (decrease) in shares | 76,228 | (146,195 | ) | |||||
| See Notes to Financial Statements. | The RYDEX FUNDS ANNUAL REPORT | 39 |
| S&P MIDCAP 400® PURE VALUE FUND |
| FINANCIAL HIGHLIGHTS |
This table is presented to show selected data for a share outstanding throughout each period and to assist shareholders in evaluating a Fund’s performance for the periods presented.
| Year Ended | Year Ended | Year Ended | Year Ended | Year Ended | ||||||||||||||||
| December 31, | December 31, | December 31, | December 31, | December 31, | ||||||||||||||||
| 2013 | 2012 | 2011 | 2010 | 2009c | ||||||||||||||||
| Per Share Data | ||||||||||||||||||||
| Net asset value, beginning of period | $ | 86.29 | $ | 73.77 | $ | 79.45 | $ | 66.83 | $ | 43.46 | ||||||||||
| Income (loss) from investment operations: | ||||||||||||||||||||
| Net investment income (loss)a | .05 | .11 | (.01 | ) | (.03 | ) | .50 | |||||||||||||
| Net gain (loss) on investments (realized and unrealized) | 30.85 | 12.41 | (5.67 | ) | 13.44 | 23.46 | ||||||||||||||
| Total from investment operations | 30.90 | 12.52 | (5.68 | ) | 13.41 | 23.96 | ||||||||||||||
| Less distributions from: | ||||||||||||||||||||
| Net investment income | (.09 | ) | — | — | (.79 | ) | (.59 | ) | ||||||||||||
| Total distributions | (.09 | ) | — | — | (.79 | ) | (.59 | ) | ||||||||||||
| Net asset value, end of period | $ | 117.10 | $ | 86.29 | $ | 73.77 | $ | 79.45 | $ | 66.83 | ||||||||||
| Total Returnb | 35.80 | % | 16.99 | % | (7.15 | %) | 20.13 | % | 55.22 | % | ||||||||||
| Ratios/Supplemental Data | ||||||||||||||||||||
| Net assets, end of period (in thousands) | $ | 28,156 | $ | 14,172 | $ | 22,900 | $ | 15,875 | $ | 29,506 | ||||||||||
| Ratios to average net assets: | ||||||||||||||||||||
| Net investment income (loss) | 0.04 | % | 0.14 | % | (0.01 | %) | (0.05 | %) | 0.90 | % | ||||||||||
| Total expenses | 1.54 | % | 1.58 | % | 1.61 | % | 1.54 | % | 1.54 | % | ||||||||||
| Portfolio turnover rate | 499 | % | 290 | % | 334 | % | 250 | % | 321 | % | ||||||||||
| a | Net investment income (loss) per share was computed using average shares outstanding throughout the period. |
| b | Total return does not reflect the impact of any additional fees charged by insurance companies. |
| c | Per share amounts for the period January 1, 2009 through April 19, 2009 have been restated to reflect a 1:5 reverse share split effective April 20, 2009. |
| 40 | the RYDEX FUNDS ANNUAL REPORT | See Notes to Financial Statements. |
This page intentionally left blank.
| the RYDEX FUNDS ANNUAL REPORT | 41 |
| PERFORMANCE REPORT AND FUND PROFILE (Unaudited) | December 31, 2013 |
S&P SMALLCAP 600® PURE GROWTH FUND
OBJECTIVE: Seeks to provide investment results that match, before fees and expenses, the performance of a benchmark for small-cap growth securities on a daily basis. The Fund’s current benchmark is the S&P SmallCap 600® Pure Growth Index (the “underlying index”).
For the year ended December 31, 2013, S&P SmallCap 600® Pure Growth Fund rose 41.30%, compared with a gain of 43.75% for the underlying index.
The Information Technology sector and the Financials sector added the most to return to the underlying index for the year. The Telecommunications
Services sector contributed least, followed by the Energy sector.
The best-performing stocks of the underlying index were Tuesday Morning Corp., Blucora, Inc. and Home BancShares, Inc.
The weakest performers of the underlying index were Francesca’s Holdings Corp., Cirrus Logic, Inc. and Ultratech, Inc.
Performance displayed represents past performance, which is no guarantee of future results.
Holdings Diversification (Market Exposure as % of Net Assets)
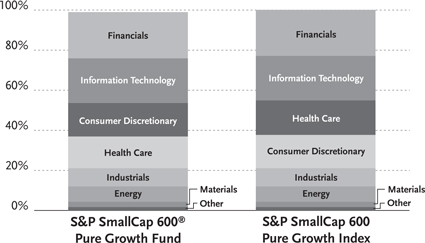
“Holdings Diversification (Market Exposure as % of Net Assets)” excludes any temporary cash investments.
| Inception Date: May 3, 2004 | ||||
| Ten Largest Holdings (% of Total Net Assets) | ||||
| Matrix Service Co. | 1.4 | % | ||
| Akorn, Inc. | 1.4 | % | ||
| HCI Group, Inc. | 1.4 | % | ||
| XO Group, Inc. | 1.3 | % | ||
| CalAmp Corp. | 1.3 | % | ||
| MB Financial, Inc. | 1.3 | % | ||
| Multimedia Games Holding Company, Inc. | 1.2 | % | ||
| On Assignment, Inc. | 1.2 | % | ||
| Lithia Motors, Inc. — Class A | 1.2 | % | ||
| Questcor Pharmaceuticals, Inc. | 1.2 | % | ||
| Top Ten Total | 12.9 | % | ||
“Ten Largest Holdings” exclude any temporary cash investments.
| 42 | the RYDEX FUNDS ANNUAL REPORT |
| performance report and FUND PROFILE (Unaudited) (concluded) |
Cumulative Fund Performance*,†
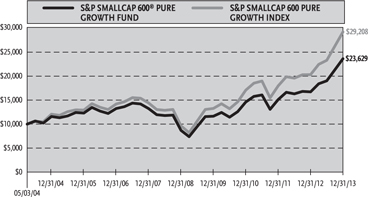
Average Annual Returns
Periods Ended December 31, 2013*,†
| Since | ||||||||||||
| Inception | ||||||||||||
| 1 Year | 5 Year | (05/03/04) | ||||||||||
| S&P SmallCap 600® Pure Growth Fund | 41.30 | % | 22.14 | % | 9.31 | % | ||||||
| S&P SmallCap 600 Pure Growth Index | 43.75 | % | 24.83 | % | 11.73 | % | ||||||
| * | The performance data above represents past performance that is not predictive of future results. The investment return and principal value of an investment in the Fund will fluctuate so that an investor’s shares, when redeemed, may be worth more or less than their original cost. Returns are historical and include changes in principal and reinvested dividends and capital gains and do not reflect the effect of taxes. The S&P SmallCap 600 Pure Growth Index is an unmanaged index and, unlike the Fund, has no management fees or operating expenses to reduce its reported return. |
| † | Returns do not reflect the impact of any additional fees charged by insurance companies. |
| the RYDEX FUNDS ANNUAL REPORT | 43 |
| SCHEDULE OF INVESTMENTS | December 31, 2013 |
| S&P SMALLCAP 600® PURE GROWTH FUND | |
| Shares | Value | |||||||
| COMMON STOCKS† - 99.0% | ||||||||
| FINANCIALS - 23.1% | ||||||||
| HCI Group, Inc. | 12,360 | $ | 661,260 | |||||
| MB Financial, Inc. | 19,020 | 610,351 | ||||||
| Umpqua Holdings Corp. | 26,800 | 512,952 | ||||||
| United Community Banks, Inc.* | 28,880 | 512,620 | ||||||
| Forestar Group, Inc.* | 23,810 | 506,439 | ||||||
| Virtus Investment Partners, Inc.* | 2,278 | 455,714 | ||||||
| BBCN Bancorp, Inc. | 27,380 | 454,234 | ||||||
| PrivateBancorp, Inc. — Class A | 15,389 | 445,204 | ||||||
| Employers Holdings, Inc. | 13,370 | 423,161 | ||||||
| Home BancShares, Inc. | 11,197 | 418,208 | ||||||
| Encore Capital Group, Inc.* | 7,751 | 389,565 | ||||||
| Portfolio Recovery Associates, Inc.* | 7,240 | 382,562 | ||||||
| First Midwest Bancorp, Inc. | 21,460 | 376,194 | ||||||
| Pinnacle Financial Partners, Inc. | 11,486 | 373,640 | ||||||
| HFF, Inc. — Class A* | 13,853 | 371,953 | ||||||
| CoreSite Realty Corp. | 11,291 | 363,457 | ||||||
| PacWest Bancorp1 | 8,469 | 357,561 | ||||||
| Oritani Financial Corp. | 21,584 | 346,424 | ||||||
| MarketAxess Holdings, Inc. | 5,110 | 341,706 | ||||||
| BofI Holding, Inc.* | 4,310 | 338,033 | ||||||
| Sabra Health Care REIT, Inc. | 12,408 | 324,345 | ||||||
| Wilshire Bancorp, Inc. | 28,290 | 309,210 | ||||||
| Bank of the Ozarks, Inc. | 5,155 | 291,721 | ||||||
| Boston Private Financial Holdings, Inc. | 22,235 | 280,606 | ||||||
| Evercore Partners, Inc. — Class A | 4,640 | 277,379 | ||||||
| Glacier Bancorp, Inc. | 8,300 | 247,257 | ||||||
| Texas Capital Bancshares, Inc.* | 3,363 | 209,179 | ||||||
| Financial Engines, Inc. | 2,880 | 200,102 | ||||||
| eHealth, Inc.* | 3,786 | 176,011 | ||||||
| First Financial Bankshares, Inc. | 1,990 | 131,977 | ||||||
| First Cash Financial Services, Inc.* | 2,045 | 126,463 | ||||||
| Total Financials | 11,215,488 | |||||||
| INFORMATION TECHNOLOGY - 22.3% | ||||||||
| XO Group, Inc.* | 43,572 | 647,479 | ||||||
| CalAmp Corp.* | 23,132 | 647,002 | ||||||
| Electronics for Imaging, Inc.* | 14,530 | 562,747 | ||||||
| Blucora, Inc.* | 18,862 | 550,016 | ||||||
| iGATE Corp.* | 12,680 | 509,229 | ||||||
| Virtusa Corp.* | 12,180 | 463,936 | ||||||
| Perficient, Inc.* | 18,386 | 430,600 | ||||||
| Dealertrack Technologies, Inc.* | 8,927 | 429,210 | ||||||
| Interactive Intelligence Group, Inc.* | 6,032 | 406,315 | ||||||
| Methode Electronics, Inc. | 11,700 | 400,023 | ||||||
| OpenTable, Inc.* | 5,034 | 399,549 | ||||||
| Harmonic, Inc.* | 47,440 | 350,107 | ||||||
| Monotype Imaging Holdings, Inc. | 10,960 | 349,186 | ||||||
| Manhattan Associates, Inc.* | 2,886 | 339,047 | ||||||
| j2 Global, Inc. | 6,580 | 329,066 | ||||||
| Daktronics, Inc. | 20,620 | 323,321 | ||||||
| Tyler Technologies, Inc.* | 3,116 | 318,237 | ||||||
| Synchronoss Technologies, Inc.* | 9,790 | 304,175 | ||||||
| Stamps.com, Inc.* | 6,666 | 280,639 | ||||||
| Synaptics, Inc.* | 5,250 | 272,003 | ||||||
| Measurement Specialties, Inc.* | 4,073 | 247,190 | ||||||
| NIC, Inc. | 9,675 | 240,617 | ||||||
| Belden, Inc. | 3,350 | 236,008 | ||||||
| Cardtronics, Inc.* | 5,320 | 231,154 | ||||||
| Advanced Energy Industries, Inc.* | 9,770 | 223,342 | ||||||
| FARO Technologies, Inc.* | 3,380 | 197,054 | ||||||
| LogMeIn, Inc.* | 5,460 | 183,183 | ||||||
| Cognex Corp. | 4,715 | 180,019 | ||||||
| FEI Co. | 1,915 | 171,124 | ||||||
| MTS Systems Corp. | 2,390 | 170,288 | ||||||
| MAXIMUS, Inc. | 3,586 | 157,748 | ||||||
| Blackbaud, Inc. | 4,170 | 157,001 | ||||||
| comScore, Inc.* | 3,870 | 110,721 | ||||||
| Global Payments, Inc. | 1 | 65 | ||||||
| Total Information Technology | 10,817,401 | |||||||
| CONSUMER DISCRETIONARY - 16.7% | ||||||||
| Multimedia Games Holding | ||||||||
| Company, Inc.* | 19,075 | 598,192 | ||||||
| Lithia Motors, Inc. — Class A | 8,450 | 586,599 | ||||||
| MarineMax, Inc.* | 29,020 | 466,642 | ||||||
| Buffalo Wild Wings, Inc.* | 3,057 | 449,989 | ||||||
| Arctic Cat, Inc. | 7,298 | 415,840 | ||||||
| Winnebago Industries, Inc.* | 13,090 | 359,321 | ||||||
| Iconix Brand Group, Inc.* | 8,620 | 342,214 | ||||||
| Lumber Liquidators Holdings, Inc.* | 3,265 | 335,936 | ||||||
| EW Scripps Co. — Class A* | 15,290 | 332,099 | ||||||
| Monarch Casino & Resort, Inc.* | 15,450 | 310,236 | ||||||
| Universal Electronics, Inc.* | 8,050 | 306,786 | ||||||
| Red Robin Gourmet Burgers, Inc.* | 3,950 | 290,483 | ||||||
| Ruth’s Hospitality Group, Inc. | 20,060 | 285,053 | ||||||
| Wolverine World Wide, Inc. | 7,990 | 271,341 | ||||||
| Capella Education Co. | 3,970 | 263,767 | ||||||
| Pinnacle Entertainment, Inc.* | 9,490 | 246,645 | ||||||
| Drew Industries, Inc. | 4,716 | 241,459 | ||||||
| Movado Group, Inc. | 5,222 | 229,820 | ||||||
| La-Z-Boy, Inc. | 7,400 | 229,400 | ||||||
| Sturm Ruger & Company, Inc.1 | 3,037 | 221,974 | ||||||
| Kirkland’s, Inc.* | 8,720 | 206,402 | ||||||
| Steven Madden Ltd.* | 5,529 | 202,306 | ||||||
| Papa John’s International, Inc. | 4,122 | 187,139 | ||||||
| American Public Education, Inc.* | 4,211 | 183,052 | ||||||
| Sonic Corp.* | 9,060 | 182,921 | ||||||
| Hillenbrand, Inc. | 6,110 | 179,756 | ||||||
| Texas Roadhouse, Inc. — Class A | 5,890 | 163,742 | ||||||
| Total Consumer Discretionary | 8,089,114 | |||||||
| HEALTH CARE - 15.8% | ||||||||
| Akorn, Inc.* | 27,670 | 681,512 | ||||||
| Questcor Pharmaceuticals, Inc.1 | 10,658 | 580,328 | ||||||
| ABIOMED, Inc.* | 16,710 | 446,825 | ||||||
| Anika Therapeutics, Inc.* | 10,830 | 413,273 | ||||||
| Cambrex Corp.* | 22,180 | 395,469 | ||||||
| Natus Medical, Inc.* | 16,580 | 373,050 | ||||||
| Omnicell, Inc.* | 14,500 | 370,185 | ||||||
| Prestige Brands Holdings, Inc.* | 9,520 | 340,816 | ||||||
| Acorda Therapeutics, Inc.* | 11,567 | 337,756 | ||||||
| 44 | the RYDEX FUNDS ANNUAL REPORT | See Notes to Financial Statements. |
| SCHEDULE OF INVESTMENTS (concluded) | December 31, 2013 |
| S&P SMALLCAP 600® PURE GROWTH FUND | |
| Shares | Value | |||||||
| Medidata Solutions, Inc.* | 5,390 | $ | 326,472 | |||||
| Cantel Medical Corp. | 9,440 | 320,110 | ||||||
| Align Technology, Inc.* | 5,490 | 313,754 | ||||||
| CryoLife, Inc. | 27,290 | 302,646 | ||||||
| MWI Veterinary Supply, Inc.* | 1,740 | 296,827 | ||||||
| Ligand Pharmaceuticals, Inc. — Class B* | 5,510 | 289,826 | ||||||
| Corvel Corp.* | 6,060 | 283,002 | ||||||
| Medicines Co.* | 6,976 | 269,413 | ||||||
| IPC The Hospitalist Company, Inc.* | 3,920 | 232,809 | ||||||
| NuVasive, Inc.* | 6,050 | 195,597 | ||||||
| Air Methods Corp.* | 3,260 | 190,156 | ||||||
| SurModics, Inc.* | 7,610 | 185,608 | ||||||
| ViroPharma, Inc.* | 3,607 | 179,809 | ||||||
| West Pharmaceutical Services, Inc. | 2,770 | 135,896 | ||||||
| HealthStream, Inc.* | 3,283 | 107,584 | ||||||
| Neogen Corp.* | 2,270 | 103,739 | ||||||
| Total Health Care | 7,672,462 | |||||||
| INDUSTRIALS - 9.1% | ||||||||
| On Assignment, Inc.* | 17,024 | 594,478 | ||||||
| GenCorp, Inc.* | 31,220 | 562,584 | ||||||
| DXP Enterprises, Inc.* | 4,420 | 509,184 | ||||||
| Saia, Inc.* | 14,550 | 466,328 | ||||||
| Dycom Industries, Inc.* | 15,920 | 442,417 | ||||||
| Federal Signal Corp.* | 27,610 | 404,487 | ||||||
| AAON, Inc. | 10,590 | 338,350 | ||||||
| CIRCOR International, Inc. | 3,560 | 287,577 | ||||||
| EnerSys, Inc. | 3,580 | 250,922 | ||||||
| AZZ, Inc. | 3,140 | 153,420 | ||||||
| Allegiant Travel Co. — Class A | 1,452 | 153,099 | ||||||
| Apogee Enterprises, Inc. | 3,680 | 132,149 | ||||||
| Mobile Mini, Inc.* | 2,960 | 121,893 | ||||||
| Total Industrials | 4,416,888 | |||||||
| ENERGY - 7.7% | ||||||||
| Matrix Service Co.* | 27,990 | 684,915 | ||||||
| Carrizo Oil & Gas, Inc.* | 12,050 | 539,478 | ||||||
| Tesco Corp.* | 23,700 | 468,786 | ||||||
| Stone Energy Corp.* | 12,320 | 426,149 | ||||||
| Era Group, Inc.* | 12,972 | 400,316 | ||||||
| C&J Energy Services, Inc.* | 16,890 | 390,159 | ||||||
| Newpark Resources, Inc.* | 30,120 | 370,175 | ||||||
| Northern Oil and Gas, Inc.* | 18,828 | 283,738 | ||||||
| Geospace Technologies Corp.* | 1,819 | 172,496 | ||||||
| Total Energy | 3,736,212 | |||||||
| MATERIALS - 2.6% | ||||||||
| KapStone Paper and Packaging Corp.* | 8,410 | 469,783 | ||||||
| Flotek Industries, Inc.* | 12,870 | 258,300 | ||||||
| American Vanguard Corp. | 9,565 | 232,334 | ||||||
| HB Fuller Co. | 3,440 | 179,018 | ||||||
| Balchem Corp. | 1,920 | 112,704 | ||||||
| Total Materials | 1,252,139 | |||||||
| CONSUMER STAPLES - 1.4% | ||||||||
| Boston Beer Company, Inc. — Class A* | 1,550 | 374,774 | ||||||
| Inter Parfums, Inc. | 9,064 | 324,582 | ||||||
| Total Consumer Staples | 699,356 | |||||||
| TELECOMMUNICATION SERVICES - 0.3% | ||||||||
| Lumos Networks Corp. | 6,170 | 129,570 | ||||||
| Total Common Stocks | ||||||||
| (Cost $40,147,250) | 48,028,630 | |||||||
| Face | ||||||||
| Amount | ||||||||
| REPURCHASE AGREEMENT††,2 - 0.6% | ||||||||
| Credit Suisse Group | ||||||||
| issued 12/31/13 at 0.00% | ||||||||
| due 01/02/14 | $ | 280,953 | 280,953 | |||||
| Total Repurchase Agreement | ||||||||
| (Cost $280,953) | 280,953 | |||||||
| SECURITIES LENDING COLLATERAL††,3 - 1.2% | ||||||||
| Repurchase Agreements | ||||||||
| HSBC Securities, Inc. | ||||||||
| issued 12/31/13 at 0.01% | ||||||||
| due 01/02/14 | 515,797 | 515,797 | ||||||
| Deutsche Bank Securities, Inc. | ||||||||
| issued 12/31/13 at 0.02% | ||||||||
| due 01/02/14 | 76,028 | 76,028 | ||||||
| Total Securities Lending Collateral | ||||||||
| (Cost $591,825) | 591,825 | |||||||
| Total Investments - 100.8% | ||||||||
| (Cost $41,020,028) | $ | 48,901,408 | ||||||
| Other Assets & Liabilities, net - (0.8)% | (409,257 | ) | ||||||
| Total Net Assets - 100.0% | $ | 48,492,151 | ||||||
| * | Non-income producing security. |
| † | Value determined based on Level 1 inputs — See Note 4. |
| †† | Value determined based on Level 2 inputs — See Note 4. |
| 1 | All or portion of this security is on loan at December 31, 2013 — See Note 10. |
| 2 | Repurchase Agreement — See Note 5. |
| 3 | Securities lending collateral — See Note 10. |
REIT — Real Estate Investment Trust
| See Notes to Financial Statements. | The RYDEX FUNDS ANNUAL REPORT | 45 |
| S&P SMALLCAP 600® PURE GROWTH FUND |
| STATEMENT OF ASSETS |
| AND LIABILITIES |
December 31, 2013
| Assets: | ||||
| Investments, at value - including $582,010 of securities loaned | ||||
| (cost $40,147,250) | $ | 48,028,630 | ||
| Repurchase agreements, at value | ||||
| (cost $872,778) | 872,778 | |||
| Total investments | ||||
| (cost $41,020,028) | 48,901,408 | |||
| Receivables: | ||||
| Securities sold | 690,390 | |||
| Fund shares sold | 292,206 | |||
| Dividends | 40,035 | |||
| Interest and securities lending income | 6,046 | |||
| Total assets | 49,930,085 | |||
| Liabilities: | ||||
| Payable for: | ||||
| Securities purchased | 749,007 | |||
| Upon return of securities loaned | 591,825 | |||
| Management fees | 28,299 | |||
| Transfer agent and administrative fees | 9,433 | |||
| Investor service fees | 9,433 | |||
| Portfolio accounting fees | 3,773 | |||
| Fund shares redeemed | 827 | |||
| Miscellaneous | 45,337 | |||
| Total liabilities | 1,437,934 | |||
| Net assets | $ | 48,492,151 | ||
| Net assets consist of: | ||||
| Paid in capital | $ | 41,324,116 | ||
| Accumulated net investment loss | (6,293 | ) | ||
| Accumulated net realized loss on investments | (707,052 | ) | ||
| Net unrealized appreciation on investments | 7,881,380 | |||
| Net assets | $ | 48,492,151 | ||
| Capital shares outstanding | 1,061,905 | |||
| Net asset value per share | $ | 45.67 |
| STATEMENT OF |
| OPERATIONS |
Year Ended December 31, 2013
| Investment Income: | ||||
| Dividends | $ | 199,872 | ||
| Income from securities lending, net | 40,224 | |||
| Interest | 42 | |||
| Total investment income | 240,138 | |||
| Expenses: | ||||
| Management fees | 237,742 | |||
| Transfer agent and administrative fees | 79,248 | |||
| Investor service fees | 79,248 | |||
| Portfolio accounting fees | 31,699 | |||
| Professional fees | 27,751 | |||
| Custodian fees | 3,618 | |||
| Trustees’ fees* | 2,253 | |||
| Line of credit interest expense | 162 | |||
| Miscellaneous | 25,475 | |||
| Total expenses | 487,196 | |||
| Net investment loss | (247,058 | ) | ||
| Net Realized and Unrealized Gain (Loss): | ||||
| Net realized gain (loss) on: | ||||
| Investments | 4,732,382 | |||
| Net realized gain | 4,732,382 | |||
| Net change in unrealized appreciation (depreciation) on: | ||||
| Investments | 5,876,200 | |||
| Net change in unrealized appreciation (depreciation) | 5,876,200 | |||
| Net realized and unrealized gain | 10,608,582 | |||
| Net increase in net assets resulting from operations | $ | 10,361,524 |
| * | Relates to Trustees not deemed “interested persons” within the meaning of Section 2(a)(19) of the 1940 Act. |
| 46 | the RYDEX FUNDS ANNUAL REPORT | See Notes to Financial Statements. |
| S&P SMALLCAP 600® PURE GROWTH FUND |
| STATEMENTS OF CHANGES IN NET ASSETS |
| Year Ended | Year Ended | |||||||
| December 31, | December 31, | |||||||
| 2013 | 2012 | |||||||
| Increase (Decrease) In Net Assets From Operations: | ||||||||
| Net investment loss | $ | (247,058 | ) | $ | (22,502 | ) | ||
| Net realized gain on investments | 4,732,382 | 1,887,196 | ||||||
| Net change in unrealized appreciation (depreciation) on investments | 5,876,200 | (647,152 | ) | |||||
| Net increase in net assets resulting from operations | 10,361,524 | 1,217,542 | ||||||
| Distributions to shareholders from: | ||||||||
| Net investment income | (2,459,263 | ) | — | |||||
| Total distributions to shareholders | (2,459,263 | ) | — | |||||
| Capital share transactions: | ||||||||
| Proceeds from sale of shares | 118,899,624 | 40,591,553 | ||||||
| Distributions reinvested | 2,459,263 | — | ||||||
| Cost of shares redeemed | (98,576,545 | ) | (47,087,730 | ) | ||||
| Net increase (decrease) from capital share transactions | 22,782,342 | (6,496,177 | ) | |||||
| Net increase (decrease) in net assets | 30,684,603 | (5,278,635 | ) | |||||
| Net assets: | ||||||||
| Beginning of year | 17,807,548 | 23,086,183 | ||||||
| End of year | $ | 48,492,151 | $ | 17,807,548 | ||||
| (Accumulated)/Undistributed net investment (loss)/income at end of year | $ | (6,293 | ) | $ | 1,750 | |||
| Capital share activity: | ||||||||
| Shares sold | 2,882,063 | 1,211,944 | ||||||
| Shares issued from reinvestment of distributions | 56,315 | — | ||||||
| Shares redeemed | (2,397,157 | ) | (1,437,914 | ) | ||||
| Net increase (decrease) in shares | 541,221 | (225,970 | ) | |||||
| See Notes to Financial Statements. | The RYDEX FUNDS ANNUAL REPORT | 47 |
| S&P SMALLCAP 600® PURE GROWTH FUND |
FINANCIAL HIGHLIGHTS
This table is presented to show selected data for a share outstanding throughout each period and to assist shareholders in evaluating a Fund’s performance for the periods presented.
| Year Ended | Year Ended | Year Ended | Year Ended | Year Ended | ||||||||||||||||
| December 31, | December 31, | December 31, | December 31, | December 31, | ||||||||||||||||
| 2013 | 2012 | 2011 | 2010 | 2009 | ||||||||||||||||
| Per Share Data | ||||||||||||||||||||
| Net asset value, beginning of period | $ | 34.20 | $ | 30.92 | $ | 29.87 | $ | 23.82 | $ | 17.78 | ||||||||||
| Income (loss) from investment operations: | ||||||||||||||||||||
| Net investment lossa | (.32 | ) | (.04 | ) | (.40 | ) | (.25 | ) | (.23 | ) | ||||||||||
| Net gain on investments (realized and unrealized) | 14.34 | 3.32 | 1.45 | 6.30 | 6.27 | |||||||||||||||
| Total from investment operations | 14.02 | 3.28 | 1.05 | 6.05 | 6.04 | |||||||||||||||
| Less distributions from: | ||||||||||||||||||||
| Net investment income | (2.55 | ) | — | — | — | |||||||||||||||
| Total distributions | (2.55 | ) | — | — | — | |||||||||||||||
| Net asset value, end of period | $ | 45.67 | $ | 34.20 | $ | 30.92 | $ | 29.87 | $ | 23.82 | ||||||||||
| Total Returnb | 41.30 | % | 10.61 | % | 3.52 | % | 25.40 | % | 33.97 | % | ||||||||||
| Ratios/Supplemental Data | ||||||||||||||||||||
| Net assets, end of period (in thousands) | $ | 48,492 | $ | 17,808 | $ | 23,086 | $ | 27,919 | $ | 13,556 | ||||||||||
| Ratios to average net assets: | ||||||||||||||||||||
| Net investment loss | (0.78 | %) | (0.13 | %) | (1.28 | %) | (0.96 | %) | (1.13 | %) | ||||||||||
| Total expenses | 1.54 | % | 1.58 | % | 1.61 | % | 1.57 | % | 1.56 | % | ||||||||||
| Portfolio turnover rate | 350 | % | 291 | % | 358 | % | 529 | % | 633 | % | ||||||||||
| a | Net investment loss per share was computed using average shares outstanding throughout the period. |
| b | Total return does not reflect the impact of any additional fees charged by insurance companies. |
| 48 | the RYDEX FUNDS ANNUAL REPORT | See Notes to Financial Statements. |
This page intentionally left blank.
| the RYDEX FUNDS ANNUAL REPORT | 49 |
| PERFORMANCE REPORT AND FUND PROFILE (Unaudited) | December 31, 2013 |
S&P SMALLCAP 600® PURE VALUE FUND
OBJECTIVE: Seeks to provide investment results that match, before fees and expenses, the performance of a benchmark for small-cap value securities on a daily basis. The Fund’s current benchmark is the S&P SmallCap 600® Pure Value Index (the “underlying index”).
For the year ended December 31, 2013, S&P SmallCap 600® Pure Value Fund returned 42.83%, compared with a return of 45.49% for the underlying index.
The sectors contributing the most to return were the Consumer Discretionary sector and the Information Technology sector. No sector detracted, but those contributing least were the Utilities and Telecommunications Services sectors.
The stocks contributing the most to return of the underlying index were Arkansas Best Corp., United Online, Inc. and VOXX International Corp.—Class A.
Those detracting the most from return of the underlying index were Tower Group International, Inc., Corinthian Colleges, Inc. and Central Garden & Pet Co.—Class A.
Performance displayed represents past performance, which is no guarantee of future results.
Holdings Diversification (Market Exposure as % of Net Assets)
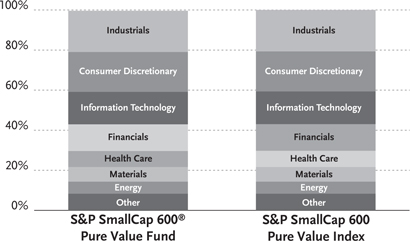
“Holdings Diversification (Market Exposure as % of Net Assets)” excludes any temporary cash investments.
| Inception Date: May 3, 2004 | ||||
| Ten Largest Holdings (% of Total Net Assets) | ||||
| Black Box Corp. | 1.5 | % | ||
| Seneca Foods Corp. — Class A | 1.4 | % | ||
| Green Plains Renewable Energy, Inc. | 1.4 | % | ||
| Perry Ellis International, Inc. | 1.4 | % | ||
| CDI Corp. | 1.4 | % | ||
| SkyWest, Inc. | 1.4 | % | ||
| Stewart Information Services Corp. | 1.3 | % | ||
| Kelly Services, Inc. — Class A | 1.3 | % | ||
| EZCORP, Inc. — Class A | 1.3 | % | ||
| Atlas Air Worldwide Holdings, Inc. | 1.2 | % | ||
| Top Ten Total | 13.6 | % | ||
“Ten Largest Holdings” exclude any temporary cash investments.
| 50 | the RYDEX FUNDS ANNUAL REPORT |
| performance report and FUND PROFILE (Unaudited) (concluded) |
Cumulative Fund Performance*,†
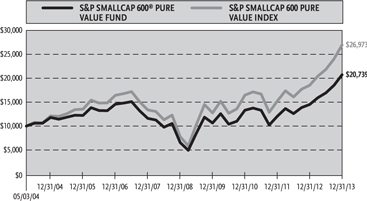
Average Annual Returns
Periods Ended December 31, 2013*,†
| Since | ||||||||||||
| Inception | ||||||||||||
| 1 Year | 5 Year | (05/03/04) | ||||||||||
| S&P SmallCap 600® Pure Value Fund | 42.83 | % | 25.88 | % | 7.84 | % | ||||||
| S&P SmallCap 600 Pure Value Index | 45.49 | % | 28.17 | % | 10.81 | % | ||||||
| * | The performance data above represents past performance that is not predictive of future results. The investment return and principal value of an investment in the Fund will fluctuate so that an investor’s shares, when redeemed, may be worth more or less than their original cost. Returns are historical and include changes in principal and reinvested dividends and capital gains and do not reflect the effect of taxes. The S&P SmallCap 600 Pure Value Index is an unmanaged index and, unlike the Fund, has no management fees or operating expenses to reduce its reported return. |
| † | Returns do not reflect the impact of any additional fees charged by insurance companies. |
| the RYDEX FUNDS ANNUAL REPORT | 51 |
| SCHEDULE OF INVESTMENTS | December 31, 2013 |
| S&P SMALLCAP 600® PURE VALUE FUND |
| Shares | Value | |||||||
| COMMON STOCKS† - 99.4% | ||||||||
| INDUSTRIALS - 20.6% | ||||||||
| CDI Corp. | 22,074 | $ | 409,031 | |||||
| SkyWest, Inc. | 27,014 | 400,618 | ||||||
| Kelly Services, Inc. — Class A | 15,541 | 387,593 | ||||||
| Atlas Air Worldwide Holdings, Inc.* | 8,930 | 367,470 | ||||||
| Engility Holdings, Inc.* | 10,510 | 351,034 | ||||||
| Griffon Corp. | 24,097 | 318,322 | ||||||
| Titan International, Inc. | 17,640 | 317,168 | ||||||
| ABM Industries, Inc. | 9,388 | 268,403 | ||||||
| Universal Forest Products, Inc. | 4,929 | 256,998 | ||||||
| EMCOR Group, Inc. | 5,911 | 250,862 | ||||||
| United Stationers, Inc. | 5,443 | 249,779 | ||||||
| Hub Group, Inc. — Class A* | 5,480 | 218,542 | ||||||
| Aegion Corp. — Class A* | 9,910 | 216,930 | ||||||
| AAR Corp. | 7,729 | 216,489 | ||||||
| Viad Corp. | 7,078 | 196,627 | ||||||
| Insperity, Inc. | 4,799 | 173,388 | ||||||
| Heidrick & Struggles International, Inc. | 8,133 | 163,799 | ||||||
| Gibraltar Industries, Inc.* | 8,433 | 156,769 | ||||||
| Briggs & Stratton Corp. | 6,595 | 143,507 | ||||||
| Consolidated Graphics, Inc.* | 2,116 | 142,703 | ||||||
| Astec Industries, Inc. | 3,423 | 132,230 | ||||||
| Kaman Corp. | 3,060 | 121,574 | ||||||
| Mueller Industries, Inc. | 1,620 | 102,076 | ||||||
| Curtiss-Wright Corp. | 1,590 | 98,946 | ||||||
| Quanex Building Products Corp. | 4,560 | 90,835 | ||||||
| National Presto Industries, Inc. | 1,120 | 90,160 | ||||||
| Resources Connection, Inc. | 5,810 | 83,257 | ||||||
| Orion Marine Group, Inc.* | 6,420 | 77,233 | ||||||
| Korn/Ferry International* | 2,885 | 75,356 | ||||||
| Total Industrials | 6,077,699 | |||||||
| CONSUMER DISCRETIONARY - 19.9% | ||||||||
| Perry Ellis International, Inc.* | 26,204 | 413,761 | ||||||
| VOXX International Corp. — Class A* | 21,594 | 360,620 | ||||||
| M/I Homes, Inc.* | 12,750 | 324,488 | ||||||
| Fred’s, Inc. — Class A | 16,668 | 308,691 | ||||||
| Scholastic Corp. | 8,810 | 299,628 | ||||||
| Group 1 Automotive, Inc. | 4,157 | 295,230 | ||||||
| Stage Stores, Inc. | 12,210 | 271,306 | ||||||
| Big 5 Sporting Goods Corp. | 13,304 | 263,685 | ||||||
| Sonic Automotive, Inc. — Class A | 9,944 | 243,429 | ||||||
| Superior Industries International, Inc. | 11,500 | 237,245 | ||||||
| Regis Corp. | 16,220 | 235,352 | ||||||
| Pep Boys-Manny Moe & Jack* | 19,382 | 235,297 | ||||||
| Brown Shoe Company, Inc. | 7,860 | 221,180 | ||||||
| Ruby Tuesday, Inc.* | 31,477 | 218,136 | ||||||
| Spartan Motors, Inc. | 27,531 | 184,458 | ||||||
| Biglari Holdings, Inc.* | 350 | 177,324 | ||||||
| Career Education Corp.* | 28,794 | 164,126 | ||||||
| Stein Mart, Inc. | 11,656 | 156,773 | ||||||
| Marcus Corp. | 11,422 | 153,512 | ||||||
| Christopher & Banks Corp.* | 16,900 | 144,326 | ||||||
| JAKKS Pacific, Inc. | 21,433 | 144,244 | ||||||
| Standard Pacific Corp.* | 14,480 | 131,044 | ||||||
| Genesco, Inc.* | 1,755 | 128,220 | ||||||
| Children’s Place Retail Stores, Inc.* | 2,050 | 116,789 | ||||||
| Meritage Homes Corp.* | 2,390 | 114,696 | ||||||
| Crocs, Inc.* | 6,980 | 111,122 | ||||||
| Digital Generation, Inc.* | 7,060 | 90,015 | ||||||
| Finish Line, Inc. — Class A | 2,690 | 75,777 | ||||||
| Aeropostale, Inc.* | 7,830 | 71,175 | ||||||
| Total Consumer Discretionary | 5,891,649 | |||||||
| INFORMATION TECHNOLOGY - 16.2% | ||||||||
| Black Box Corp. | 14,530 | 432,994 | ||||||
| Sanmina Corp.* | 21,850 | 364,894 | ||||||
| CIBER, Inc.* | 75,318 | 311,817 | ||||||
| CACI International, Inc. — Class A* | 4,252 | 311,331 | ||||||
| Benchmark Electronics, Inc.* | 13,295 | 306,849 | ||||||
| Monster Worldwide, Inc.* | 42,620 | 303,881 | ||||||
| Insight Enterprises, Inc.* | 12,635 | 286,941 | ||||||
| SYNNEX Corp.* | 3,985 | 268,589 | ||||||
| ScanSource, Inc.* | 5,856 | 248,470 | ||||||
| TTM Technologies, Inc.* | 25,920 | 222,394 | ||||||
| Anixter International, Inc. | 1,992 | 178,961 | ||||||
| Bel Fuse, Inc. — Class B | 8,252 | 175,850 | ||||||
| Super Micro Computer, Inc.* | 10,199 | 175,015 | ||||||
| Plexus Corp.* | 3,765 | 162,987 | ||||||
| Oplink Communications, Inc.* | 7,170 | 133,362 | ||||||
| NETGEAR, Inc.* | 3,720 | 122,537 | ||||||
| Digi International, Inc.* | 9,420 | 114,170 | ||||||
| Rudolph Technologies, Inc.* | 9,290 | 109,064 | ||||||
| Rofin-Sinar Technologies, Inc.* | 4,020 | 108,620 | ||||||
| Ebix, Inc.1 | 6,790 | 99,949 | ||||||
| Kulicke & Soffa Industries, Inc.* | 7,460 | 99,218 | ||||||
| Diodes, Inc.* | 3,910 | 92,120 | ||||||
| Brooks Automation, Inc. | 8,520 | 89,375 | ||||||
| Mercury Systems, Inc.* | 7,060 | 77,307 | ||||||
| Total Information Technology | 4,796,695 | |||||||
| FINANCIALS - 13.2% | ||||||||
| Stewart Information Services Corp. | 12,326 | 397,760 | ||||||
| EZCORP, Inc. — Class A* | 31,979 | 373,835 | ||||||
| Cash America International, Inc. | 8,790 | 336,657 | ||||||
| United Fire Group, Inc. | 8,264 | 236,846 | ||||||
| Calamos Asset Management, | ||||||||
| Inc. — Class A | 19,686 | 233,082 | ||||||
| Infinity Property & Casualty Corp. | 3,200 | 229,600 | ||||||
| Navigators Group, Inc.* | 3,515 | 222,007 | ||||||
| Piper Jaffray Cos.* | 5,520 | 218,316 | ||||||
| Horace Mann Educators Corp. | 5,991 | 188,956 | ||||||
| Susquehanna Bancshares, Inc. | 12,990 | 166,792 | ||||||
| Safety Insurance Group, Inc. | 2,771 | 156,007 | ||||||
| Meadowbrook Insurance Group, Inc. | 22,329 | 155,410 | ||||||
| Selective Insurance Group, Inc. | 5,681 | 153,728 | ||||||
| Wintrust Financial Corp. | 3,170 | 146,200 | ||||||
| Capstead Mortgage Corp. | 10,590 | 127,927 | ||||||
| Prospect Capital Corp. | 10,980 | 123,196 | ||||||
| Brookline Bancorp, Inc. | 12,650 | 121,061 | ||||||
| 52 | the RYDEX FUNDS ANNUAL REPORT | See Notes to Financial Statements. |
| SCHEDULE OF INVESTMENTS (concluded) | December 31, 2013 |
| S&P SMALLCAP 600® PURE VALUE FUND | |
| Shares | Value | |||||||
| Provident Financial Services, Inc. | 4,820 | $ | 93,122 | |||||
| ProAssurance Corp. | 1,790 | 86,779 | ||||||
| FNB Corp. | 6,230 | 78,623 | ||||||
| SWS Group, Inc.* | 11,792 | 71,695 | ||||||
| Total Financials | 3,917,599 | |||||||
| HEALTH CARE - 8.0% | ||||||||
| Cross Country Healthcare, Inc.* | 29,098 | 290,398 | ||||||
| PharMerica Corp.* | 12,754 | 274,211 | ||||||
| Magellan Health Services, Inc.* | 4,530 | 271,392 | ||||||
| Molina Healthcare, Inc.* | 7,777 | 270,251 | ||||||
| Kindred Healthcare, Inc. | 13,271 | 261,970 | ||||||
| Almost Family, Inc.* | 6,543 | 211,535 | ||||||
| LHC Group, Inc.* | 8,634 | 207,561 | ||||||
| Invacare Corp. | 8,611 | 199,861 | ||||||
| Centene Corp.* | 3,210 | 189,230 | ||||||
| AMN Healthcare Services, Inc.* | 6,600 | 97,020 | ||||||
| Healthways, Inc.* | 6,320 | 97,012 | ||||||
| Total Health Care | 2,370,441 | |||||||
| MATERIALS - 7.2% | ||||||||
| Olympic Steel, Inc. | 11,335 | 328,488 | ||||||
| Materion Corp. | 9,254 | 285,486 | ||||||
| AM Castle & Co.* | 16,578 | 244,857 | ||||||
| Century Aluminum Co.* | 23,059 | 241,197 | ||||||
| A. Schulman, Inc. | 5,592 | 197,174 | ||||||
| Kaiser Aluminum Corp. | 2,790 | 195,970 | ||||||
| PH Glatfelter Co. | 4,120 | 113,876 | ||||||
| Zep, Inc. | 5,957 | 108,179 | ||||||
| Clearwater Paper Corp.* | 1,990 | 104,475 | ||||||
| Kraton Performance Polymers, Inc.* | 4,170 | 96,119 | ||||||
| OM Group, Inc.* | 2,196 | 79,956 | ||||||
| Neenah Paper, Inc. | 1,750 | 74,848 | ||||||
| Stepan Co. | 1,100 | 72,193 | ||||||
| Total Materials | 2,142,818 | |||||||
| ENERGY - 6.0% | ||||||||
| Green Plains Renewable Energy, Inc. | 21,750 | 421,733 | ||||||
| Pioneer Energy Services Corp.* | 33,039 | 264,642 | ||||||
| Cloud Peak Energy, Inc.* | 14,520 | 261,360 | ||||||
| Swift Energy Co.*,1 | 19,171 | 258,809 | ||||||
| Exterran Holdings, Inc.* | 5,670 | 193,913 | ||||||
| Gulf Island Fabrication, Inc. | 6,883 | 159,823 | ||||||
| Arch Coal, Inc.1 | 30,730 | 136,749 | ||||||
| SEACOR Holdings, Inc.* | 820 | 74,784 | ||||||
| Total Energy | 1,771,813 | |||||||
| CONSUMER STAPLES - 4.6% | ||||||||
| Seneca Foods Corp. — Class A* | 13,363 | 426,145 | ||||||
| Central Garden and Pet Co. — Class A* | 53,798 | 363,137 | ||||||
| Spartan Stores, Inc. | 12,353 | 299,936 | ||||||
| Sanderson Farms, Inc. | 1,960 | 141,767 | ||||||
| Alliance One International, Inc.* | 43,547 | 132,818 | ||||||
| Total Consumer Staples | 1,363,803 | |||||||
| UTILITIES - 1.9% | ||||||||
| New Jersey Resources Corp. | 3,370 | 155,828 | ||||||
| Avista Corp. | 5,495 | 154,904 | ||||||
| Laclede Group, Inc. | 2,090 | 95,179 | ||||||
| NorthWestern Corp. | 1,830 | 79,276 | ||||||
| UIL Holdings Corp. | 1,990 | 77,113 | ||||||
| Total Utilities | 562,300 | |||||||
| TELECOMMUNICATION SERVICES - 1.8% | ||||||||
| Cbeyond, Inc.* | 37,228 | 256,873 | ||||||
| USA Mobility, Inc. | 10,200 | 145,656 | ||||||
| Atlantic Tele-Network, Inc. | 2,050 | 115,969 | ||||||
| Total Telecommunication Services | 518,498 | |||||||
| Total Common Stocks | ||||||||
| (Cost $24,712,218) | 29,413,315 | |||||||
| Face | ||||||||
| Amount | ||||||||
| REPURCHASE AGREEMENT††,2 - 0.6% | ||||||||
| Credit Suisse Group | ||||||||
| issued 12/31/13 at 0.00% | ||||||||
| due 01/02/14 | $ | 170,328 | 170,328 | |||||
| Total Repurchase Agreement | ||||||||
| (Cost $170,328) | 170,328 | |||||||
| SECURITIES LENDING COLLATERAL††,3 - 1.2% | ||||||||
| Repurchase Agreements | ||||||||
| HSBC Securities, Inc. | ||||||||
| issued 12/31/13 at 0.01% | ||||||||
| due 01/02/14 | 305,212 | 305,212 | ||||||
| Deutsche Bank Securities, Inc. | ||||||||
| issued 12/31/13 at 0.02% | ||||||||
| due 01/02/14 | 44,988 | 44,988 | ||||||
| Total Securities Lending Collateral | ||||||||
| (Cost $350,200) | 350,200 | |||||||
| Total Investments - 101.2% | ||||||||
| (Cost $25,232,746) | $ | 29,933,843 | ||||||
| Other Assets & Liabilities, net - (1.2)% | (358,431 | ) | ||||||
| Total Net Assets - 100.0% | $ | 29,575,412 | ||||||
| * | Non-income producing security. |
| † | Value determined based on Level 1 inputs — See Note 4. |
| †† | Value determined based on Level 2 inputs — See Note 4. |
| 1 | All or portion of this security is on loan at December 31, 2013 — See Note 10. |
| 2 | Repurchase Agreement — See Note 5. |
| 3 | Securities lending collateral — See Note 10. |
| See Notes to Financial Statements. | The RYDEX FUNDS ANNUAL REPORT | 53 |
| S&P SMALLCAP 600® PURE VALUE FUND |
| STATEMENT OF ASSETS |
| AND LIABILITIES |
December 31, 2013
| Assets: | ||||
| Investments, at value - including $331,722 of securities loaned | ||||
| (cost $24,712,218) | $ | 29,413,315 | ||
| Repurchase agreements, at value | ||||
| (cost $520,528) | 520,528 | |||
| Total investments | ||||
| (cost $25,232,746) | 29,933,843 | |||
| Receivables: | ||||
| Fund shares sold | 1,735,066 | |||
| Dividends | 21,725 | |||
| Interest and securities lending income | 942 | |||
| Total assets | 31,691,576 | |||
| Liabilities: | ||||
| Payable for: | ||||
| Securities purchased | 1,688,411 | |||
| Upon return of securities loaned | 350,200 | |||
| Fund shares redeemed | 18,227 | |||
| Management fees | 16,166 | |||
| Transfer agent and administrative fees | 5,389 | |||
| Investor service fees | 5,389 | |||
| Portfolio accounting fees | 2,155 | |||
| Miscellaneous | 30,227 | |||
| Total liabilities | 2,116,164 | |||
| Net assets | $ | 29,575,412 | ||
| Net assets consist of: | ||||
| Paid in capital | $ | 26,218,155 | ||
| Undistributed net investment income | — | |||
| Accumulated net realized loss on investments | (1,343,840 | ) | ||
| Net unrealized appreciation on investments | 4,701,097 | |||
| Net assets | $ | 29,575,412 | ||
| Capital shares outstanding | 186,932 | |||
| Net asset value per share | $ | 158.21 |
| STATEMENT OF |
| OPERATIONS |
Year Ended December 31, 2013
| Investment Income: | ||||
| Dividends | $ | 224,353 | ||
| Income from securities lending, net | 9,171 | |||
| Interest | 28 | |||
| Total investment income | 233,552 | |||
| Expenses: | ||||
| Management fees | 158,335 | |||
| Transfer agent and administrative fees | 52,778 | |||
| Investor service fees | 52,778 | |||
| Portfolio accounting fees | 21,111 | |||
| Professional fees | 18,896 | |||
| Custodian fees | 2,416 | |||
| Trustees’ fees* | 1,574 | |||
| Line of credit interest expense | 195 | |||
| Miscellaneous | 17,001 | |||
| Total expenses | 325,084 | |||
| Net investment loss | (91,532 | ) | ||
| Net Realized and Unrealized Gain (Loss): | ||||
| Net realized gain (loss) on: | ||||
| Investments | 3,675,693 | |||
| Net realized gain | 3,675,693 | |||
| Net change in unrealized appreciation (depreciation) on: | ||||
| Investments | 3,160,696 | |||
| Net change in unrealized appreciation (depreciation) | 3,160,696 | |||
| Net realized and unrealized gain | 6,836,389 | |||
| Net increase in net assets resulting from operations | $ | 6,744,857 |
| * | Relates to Trustees not deemed “interested persons” within the meaning of Section 2(a)(19) of the 1940 Act. |
| 54 | the RYDEX FUNDS ANNUAL REPORT | See Notes to Financial Statements. |
| S&P SMALLCAP 600® PURE VALUE FUND |
| STATEMENTS OF CHANGES IN NET ASSETS |
| Year Ended | Year Ended | |||||||
| December 31, | December 31, | |||||||
| 2013 | 2012 | |||||||
| Increase (Decrease) In Net Assets From Operations: | ||||||||
| Net investment loss | $ | (91,532 | ) | $ | (24,134 | ) | ||
| Net realized gain on investments | 3,675,693 | 750,954 | ||||||
| Net change in unrealized appreciation (depreciation) on investments | 3,160,696 | 462,131 | ||||||
| Net increase in net assets resulting from operations | 6,744,857 | 1,188,951 | ||||||
| Distributions to shareholders from: | ||||||||
| Net realized gains | (94,498 | ) | — | |||||
| Total distributions to shareholders | (94,498 | ) | — | |||||
| Capital share transactions: | ||||||||
| Proceeds from sale of shares | 62,330,569 | 38,587,341 | ||||||
| Distributions reinvested | 94,498 | — | ||||||
| Cost of shares redeemed | (55,677,571 | ) | (36,355,312 | ) | ||||
| Net increase from capital share transactions | 6,747,496 | 2,232,029 | ||||||
| Net increase in net assets | 13,397,855 | 3,420,980 | ||||||
| Net assets: | ||||||||
| Beginning of year | 16,177,557 | 12,756,577 | ||||||
| End of year | $ | 29,575,412 | $ | 16,177,557 | ||||
| Undistributed/(Accumulated) net investment income/(loss) at end of year | $ | — | $ | (1 | ) | |||
| Capital share activity: | ||||||||
| Shares sold | 462,980 | 369,529 | ||||||
| Shares issued from reinvestment of distributions | 634 | — | ||||||
| Shares redeemed | (422,196 | ) | (362,131 | ) | ||||
| Net increase in shares | 41,418 | 7,398 | ||||||
| See Notes to Financial Statements. | The RYDEX FUNDS ANNUAL REPORT | 55 |
| S&P SMALLCAP 600® PURE VALUE FUND |
| FINANCIAL HIGHLIGHTS |
This table is presented to show selected data for a share outstanding throughout each period and to assist shareholders in evaluating a Fund’s performance for the periods presented.
| Year Ended | Year Ended | Year Ended | Year Ended | Year Ended | ||||||||||||||||
| December 31, | December 31, | December 31, | December 31, | December 31, | ||||||||||||||||
| 2013 | 2012 | 2011 | 2010 | 2009c | ||||||||||||||||
| Per Share Data | ||||||||||||||||||||
| Net asset value, beginning of period | $ | 111.18 | $ | 92.36 | $ | 101.98 | $ | 81.52 | $ | 50.83 | ||||||||||
| Income (loss) from investment operations: | ||||||||||||||||||||
| Net investment lossa | (.58 | ) | (.22 | ) | (.73 | ) | (.56 | ) | (.26 | ) | ||||||||||
| Net gain (loss) on investments (realized and unrealized) | 48.15 | 19.04 | (8.89 | ) | 21.02 | 31.93 | ||||||||||||||
| Total from investment operations | 47.57 | 18.82 | (9.62 | ) | 20.46 | 31.67 | ||||||||||||||
| Less distributions from: | ||||||||||||||||||||
| Net investment income | — | — | — | — | (.98 | ) | ||||||||||||||
| Net realized gains | (.54 | ) | — | — | — | — | ||||||||||||||
| Total distributions | (.54 | ) | — | — | — | (.98 | ) | |||||||||||||
| Net asset value, end of period | $ | 158.21 | $ | 111.18 | $ | 92.36 | $ | 101.98 | $ | 81.52 | ||||||||||
| Total Returnb | 42.83 | % | 20.38 | % | (9.44 | %) | 25.10 | % | 62.33 | % | ||||||||||
| Ratios/Supplemental Data | ||||||||||||||||||||
| Net assets, end of period (in thousands) | $ | 29,575 | $ | 16,178 | $ | 12,757 | $ | 17,228 | $ | 13,562 | ||||||||||
| Ratios to average net assets: | ||||||||||||||||||||
| Net investment loss | (0.43 | %) | (0.22 | %) | (0.75 | %) | (0.61 | %) | (0.37 | %) | ||||||||||
| Total expenses | 1.54 | % | 1.58 | % | 1.62 | % | 1.55 | % | 1.55 | % | ||||||||||
| Portfolio turnover rate | 260 | % | 318 | % | 404 | % | 526 | % | 380 | % | ||||||||||
| a | Net investment loss per share was computed using average shares outstanding throughout the period. |
| b | Total return does not reflect the impact of any additional fees charged by insurance companies. |
| c | Per share for the period January 1, 2009 through April 19,2009 have been restated to reflect a 1:5 reverse share split effective April 20, 2009. |
| 56 | the RYDEX FUNDS ANNUAL REPORT | See Notes to Financial Statements. |
|
This page intentionally left blank.
| the RYDEX FUNDS ANNUAL REPORT | 57 |
| PERFORMANCE REPORT AND FUND PROFILE (Unaudited) | December 31, 2013 |
EUROPE 1.25x STRATEGY FUND
OBJECTIVE: Seeks to provide investment results that correlate, before fees and expenses, to the performance of a specific benchmark. The Fund’s current benchmark is 125% of the fair value of the STOXX 50® Index (the “underlying index”).
For the year ended December 31, 2013, Europe 1.25x Strategy Fund maintained a daily correlation of over 95% to its benchmark of 125% of the daily price movement of the underlying index. Europe 1.25x Strategy Fund returned 23.89% while the underlying index returned 22.36% over the same period.
The sectors contributing the most to return of the underlying index were Financials and Health Care. The sectors detracting most were Telecommunications Services and Utilities.
The stocks contributing most to performance of the underlying index were HSBC Holdings plc, Nestle S.A. and Sanofi.
Those detracting the most from return of the underlying index were BG Group plc, Telefonica S.A. and Anglo American plc.
Derivatives in the Fund were used to help provide exposure to the composition of the benchmark in the highest efficient manner and to provide leverage, not for hedging purposes.
Due to the compounding of daily returns, leveraged and inverse funds’ returns over periods other than one day will likely differ in amount and possibly direction from the benchmark return for the same period. Investors should monitor their leveraged and inverse funds’ holdings to ensure that they are consistent with their strategies, as frequently as daily.
The effects of compounding may cause the longer-term correlation of the fund to its benchmark to diminish. The apparent discrepancy between the leveraged and unleveraged indices is the result of compounding, which is described briefly on page 6 of this report.
Performance displayed represents past performance, which is no guarantee of future results.
Holdings Diversification (Market Exposure as % of Net Assets)

“Holdings Diversification (Market Exposure as % of Net Assets)” excludes any temporary cash investments.
| Inception Date: October 1, 2001 | ||||
| Ten Largest Holdings (% of Total Net Assets) | ||||
| Nestle S.A. ADR | 4.5 | % | ||
| Novartis AG ADR | 4.1 | % | ||
| Vodafone Group plc ADR | 3.8 | % | ||
| HSBC Holdings plc ADR | 3.8 | % | ||
| Roche Holding AG ADR | 3.5 | % | ||
| BP plc ADR | 2.8 | % | ||
| Total S.A. ADR | 2.8 | % | ||
| Royal Dutch Shell plc ADR | 2.6 | % | ||
| GlaxoSmithKline plc ADR | 2.5 | % | ||
| Sanofi ADR | 2.4 | % | ||
| Top Ten Total | 32.8 | % | ||
“Ten Largest Holdings” exclude any temporary cash or derivative investments.
| 58 | the RYDEX FUNDS ANNUAL REPORT |
| performance report and FUND PROFILE (Unaudited) (concluded) |
Cumulative Fund Performance*,†
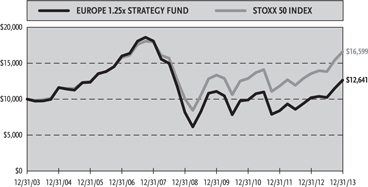
Average Annual Returns
Periods Ended December 31, 2013*,†
| 1 Year | 5 Year | 10 Year | ||||||||||
| Europe 1.25x Strategy Fund | 23.89 | % | 9.14 | % | 2.37 | % | ||||||
| STOXX 50 Index | 22.36 | % | 10.57 | % | 5.20 | % | ||||||
INVESTMENT CONCENTRATION
At December 31, 2013, the investment diversification of the Fund by country was as follows:
| Country | % of Common Stocks | Value | ||||||
| Britain | 34.1 | % | $ | 3,467,337 | ||||
| Switzerland | 20.9 | % | 2,124,143 | |||||
| Germany | 16.2 | % | 1,649,538 | |||||
| France | 10.6 | % | 1,075,647 | |||||
| Netherlands | 6.2 | % | 625,415 | |||||
| Spain | 6.0 | % | 606,846 | |||||
| Australia | 1.8 | % | 182,260 | |||||
| Belgium | 1.7 | % | 171,728 | |||||
| Other | 2.5 | % | 252,539 | |||||
| Total Common Stocks | 100.0 | % | $ | 10,155,453 | ||||
| * | The performance data above represents past performance that is not predictive of future results. The investment return and principal value of an investment in the Fund will fluctuate so that an investor’s shares, when redeemed, may be worth more or less than their original cost. Returns are historical and include changes in principal and reinvested dividends and capital gains and do not reflect the effect of taxes. The STOXX 50 Index is an unmanaged index and, unlike the Fund, has no management fees or operating expenses to reduce its reported return. |
| † | Returns do not reflect the impact of any additional fees charged by insurance companies. |
| the RYDEX FUNDS ANNUAL REPORT | 59 |
| SCHEDULE OF INVESTMENTS | December 31, 2013 |
| EUROPE 1.25x STRATEGY FUND | |
| Shares | Value | |||||||
| COMMON STOCKS† - 83.9% | ||||||||
| FINANCIALS - 19.1% | ||||||||
| HSBC Holdings plc ADR | 8,309 | $ | 458,075 | |||||
| Banco Santander S.A. ADR | 28,889 | 262,023 | ||||||
| BNP Paribas S.A. ADR | 5,332 | 209,014 | ||||||
| Allianz SE ADR | 10,825 | 196,257 | ||||||
| Banco Bilbao Vizcaya Argentaria S.A. ADR | 14,768 | 182,976 | ||||||
| Lloyds Banking Group plc ADR* | 33,160 | 176,411 | ||||||
| ING Groep N.V. ADR* | 12,052 | 168,849 | ||||||
| UBS AG | 8,583 | 165,223 | ||||||
| Barclays plc ADR | 8,336 | 151,132 | ||||||
| Credit Suisse Group AG ADR | 3,985 | 123,694 | ||||||
| Deutsche Bank AG | 2,382 | 114,908 | ||||||
| Zurich Insurance Group AG ADR | 3,581 | 104,458 | ||||||
| Total Financials | 2,313,020 | |||||||
| HEALTH CARE - 16.7% | ||||||||
| Novartis AG ADR | 6,164 | 495,462 | ||||||
| Roche Holding AG ADR | 6,124 | 429,905 | ||||||
| GlaxoSmithKline plc ADR | 5,634 | 300,799 | ||||||
| Sanofi ADR | 5,531 | 296,628 | ||||||
| Bayer AG ADR | 1,945 | 276,190 | ||||||
| AstraZeneca plc ADR | 3,783 | 224,597 | ||||||
| Total Health Care | 2,023,581 | |||||||
| CONSUMER STAPLES - 14.1% | ||||||||
| Nestle S.A. ADR | 7,379 | 543,021 | ||||||
| British American Tobacco plc ADR | 2,371 | 254,693 | ||||||
| Diageo plc ADR | 1,595 | 211,210 | ||||||
| Anheuser-Busch InBev N.V. ADR | 1,712 | 182,260 | ||||||
| Unilever N.V. — Class Y | 3,593 | 144,546 | ||||||
| Reckitt Benckiser Group plc ADR | 8,316 | 133,804 | ||||||
| Unilever plc ADR | 3,070 | 126,484 | ||||||
| Tesco plc ADR | 6,954 | 117,105 | ||||||
| Total Consumer Staples | 1,713,123 | |||||||
| ENERGY - 11.0% | ||||||||
| BP plc ADR | 7,097 | 344,985 | ||||||
| Total S.A. ADR | 5,573 | 341,458 | ||||||
| Royal Dutch Shell plc ADR | 4,378 | 312,020 | ||||||
| BG Group plc ADR | 7,780 | 168,748 | ||||||
| Eni SpA ADR | 3,378 | 163,799 | ||||||
| Total Energy | 1,331,010 | |||||||
| TELECOMMUNICATION SERVICES - 6.3% | ||||||||
| Vodafone Group plc ADR | 11,678 | 459,062 | ||||||
| Telefonica S.A. ADR | 9,905 | 161,848 | ||||||
| Deutsche Telekom AG ADR | 8,035 | 138,684 | ||||||
| Total Telecommunication Services | 759,594 | |||||||
| MATERIALS - 6.1% | ||||||||
| BASF SE ADR | 2,153 | 232,072 | ||||||
| Rio Tinto plc ADR | 3,970 | 224,027 | ||||||
| BHP Billiton Ltd. ADR | 2,518 | 171,728 | ||||||
| Air Liquide S.A. ADR | 3,803 | 107,891 | ||||||
| Total Materials | 735,718 | |||||||
| INDUSTRIALS - 4.4% | ||||||||
| Siemens AG ADR | 1,996 | 276,466 | ||||||
| ABB Ltd. ADR | 5,189 | 137,820 | ||||||
| Schneider Electric S.A. ADR | 6,875 | 120,656 | ||||||
| Total Industrials | 534,942 | |||||||
| CONSUMER DISCRETIONARY - 2.9% | ||||||||
| Daimler AG ADR | 2,614 | 228,307 | ||||||
| Cie Financiere Richemont S.A. ADR | 12,456 | 124,560 | ||||||
| Total Consumer Discretionary | 352,867 | |||||||
| INFORMATION TECHNOLOGY - 2.3% | ||||||||
| SAP AG ADR | 2,142 | 186,654 | ||||||
| Telefonaktiebolaget LM Ericsson ADR | 7,250 | 88,740 | ||||||
| Total Information Technology | 275,394 | |||||||
| UTILITIES - 1.0% | ||||||||
| National Grid plc ADR | 1,779 | 116,204 | ||||||
| Total Common Stocks | ||||||||
| (Cost $8,991,175) | 10,155,453 | |||||||
| Face | ||||||||
| Amount | ||||||||
| REPURCHASE AGREEMENTS††,1 - 20.2% | ||||||||
| Deutsche Bank | ||||||||
| issued 12/31/13 at 0.01% | ||||||||
| due 01/02/14 | $ | 613,702 | 613,702 | |||||
| HSBC Group | ||||||||
| issued 12/31/13 at 0.01% | ||||||||
| due 01/02/14 | 613,702 | 613,702 | ||||||
| Credit Suisse Group | ||||||||
| issued 12/31/13 at 0.00% | ||||||||
| due 01/02/14 | 613,702 | 613,702 | ||||||
| Mizuho Financial Group, Inc. | ||||||||
| issued 12/31/13 at 0.01% | ||||||||
| due 01/02/14 | 610,925 | 610,925 | ||||||
| Total Repurchase Agreements | ||||||||
| (Cost $2,452,031) | 2,452,031 | |||||||
| Total Investments - 104.1% | ||||||||
| (Cost $11,443,206) | $ | 12,607,484 | ||||||
| Other Assets & Liabilities, net - (4.1)% | (491,277 | ) | ||||||
| Total Net Assets - 100.0% | $ | 12,116,207 | ||||||
| 60 | the RYDEX FUNDS ANNUAL REPORT | See Notes to Financial Statements. |
| SCHEDULE OF INVESTMENTS (concluded) | December 31, 2013 |
| EUROPE 1.25x STRATEGY FUND | |
| Unrealized | ||||||||
| Contracts | Gain | |||||||
| EQUITY FUTURES CONTRACTS PURCHASED† | ||||||||
| March 2014 STOXX 50 Index | ||||||||
| Futures Contracts | ||||||||
| (Aggregate Value of | ||||||||
| Contracts $4,881,628) | 122 | $ | 247,741 | |||||
| CURRENCY FUTURES CONTRACTS PURCHASED† | ||||||||
| March 2014 Euro FX | ||||||||
| Futures Contracts | ||||||||
| (Aggregate Value of | ||||||||
| Contracts $4,815,300) | 28 | $ | 10,648 | |||||
| * | Non-income producing security. |
| † | Value determined based on Level 1 inputs — See Note 4. |
| †† | Value determined based on Level 2 inputs — See Note 4. |
| 1 | Repurchase Agreements — See Note 5. |
ADR — American Depositary Receipt
plc — Public Limited Company
| See Notes to Financial Statements. | The RYDEX FUNDS ANNUAL REPORT | 61 |
| EUROPE 1.25x STRATEGY FUND |
| STATEMENT OF ASSETS |
| AND LIABILITIES |
December 31, 2013
| Assets: | ||||
| Investments, at value | ||||
| (cost $8,991,175) | $ | 10,155,453 | ||
| Repurchase agreements, at value | ||||
| (cost $2,452,031) | 2,452,031 | |||
| Total investments | ||||
| (cost $11,443,206) | 12,607,484 | |||
| Segregated cash with broker | 428,725 | |||
| Receivables: | ||||
| Fund shares sold | 4,082,987 | |||
| Dividends | 12,438 | |||
| Variation margin | 10,398 | |||
| Foreign taxes reclaim | 5,696 | |||
| Other assets | 16,636 | |||
| Total assets | 17,164,364 | |||
| Liabilities: | ||||
| Overdraft due to custodian bank | 514 | |||
| Payable for: | ||||
| Securities purchased | 5,011,127 | |||
| Fund shares redeemed | 13,128 | |||
| Management fees | 5,626 | |||
| Transfer agent and administrative fees | 1,563 | |||
| Investor service fees | 1,563 | |||
| Portfolio accounting fees | 625 | |||
| Miscellaneous | 14,011 | |||
| Total liabilities | 5,048,157 | |||
| Net assets | $ | 12,116,207 | ||
| Net assets consist of: | ||||
| Paid in capital | $ | 16,672,313 | ||
| Undistributed net investment income | 70,484 | |||
| Accumulated net realized loss on investments | (6,049,459 | ) | ||
| Net unrealized appreciation on investments | 1,422,869 | |||
| Net assets | $ | 12,116,207 | ||
| Capital shares outstanding | 647,222 | |||
| Net asset value per share | $ | 18.72 |
| STATEMENT OF |
| OPERATIONS |
Year Ended December 31, 2013
| Investment Income: | ||||
| Dividends (net of foreign withholding tax of $15,974) | $ | 209,147 | ||
| Interest | 1,049 | |||
| Income from securities lending, net | 261 | |||
| Total investment income | 210,457 | |||
| Expenses: | ||||
| Management fees | 75,694 | |||
| Transfer agent and administrative fees | 21,026 | |||
| Investor service fees | 21,026 | |||
| Portfolio accounting fees | 8,411 | |||
| Professional fees | 8,200 | |||
| Trustees’ fees* | 947 | |||
| Custodian fees | 883 | |||
| Miscellaneous | 7,882 | |||
| Total expenses | 144,069 | |||
| Net investment income | 66,388 | |||
| Net Realized and Unrealized Gain (Loss): | ||||
| Net realized gain (loss) on: | ||||
| Investments | 735,190 | |||
| Swap agreements | 20,377 | |||
| Futures contracts | 446,288 | |||
| Foreign currency | 1,125 | |||
| Net realized gain | 1,202,980 | |||
| Net change in unrealized appreciation (depreciation) on: | ||||
| Investments | (64,045 | ) | ||
| Futures contracts | 137,249 | |||
| Foreign currency | 29 | |||
| Net change in unrealized appreciation (depreciation) | 73,233 | |||
| Net realized and unrealized gain | 1,276,213 | |||
| Net increase in net assets resulting from operations | $ | 1,342,601 |
| * | Relates to Trustees not deemed “interested persons” within the meaning of Section 2(a)(19) of the 1940 Act. |
| 62 | the RYDEX FUNDS ANNUAL REPORT | See Notes to Financial Statements. |
| EUROPE 1.25x STRATEGY FUND |
| STATEMENTS OF CHANGES IN NET ASSETS |
| Year Ended | Year Ended | |||||||
| December 31, | December 31, | |||||||
| 2013 | 2012 | |||||||
| Increase (Decrease) In Net Assets From Operations: | ||||||||
| Net investment income | $ | 66,388 | $ | 28,409 | ||||
| Net realized gain on investments | 1,202,980 | 248,563 | ||||||
| Net change in unrealized appreciation (depreciation) on investments | 73,233 | 1,055,018 | ||||||
| Net increase in net assets resulting from operations | 1,342,601 | 1,331,990 | ||||||
| Distributions to shareholders from: | ||||||||
| Net investment income | (15,300 | ) | (80,826 | ) | ||||
| Total distributions to shareholders | (15,300 | ) | (80,826 | ) | ||||
| Capital share transactions: | ||||||||
| Proceeds from sale of shares | 42,651,167 | 48,805,758 | ||||||
| Distributions reinvested | 15,300 | 80,826 | ||||||
| Cost of shares redeemed | (44,687,246 | ) | (41,390,740 | ) | ||||
| Net increase (decrease) from capital share transactions | (2,020,779 | ) | 7,495,844 | |||||
| Net increase (decrease) in net assets | (693,478 | ) | 8,747,008 | |||||
| Net assets: | ||||||||
| Beginning of year | 12,809,685 | 4,062,677 | ||||||
| End of year | $ | 12,116,207 | $ | 12,809,685 | ||||
| Undistributed net investment income at end of year | $ | 70,484 | $ | 15,300 | ||||
| Capital share activity: | ||||||||
| Shares sold | 2,539,230 | 3,631,912 | ||||||
| Shares issued from reinvestment of distributions | 851 | 5,840 | ||||||
| Shares redeemed | (2,739,378 | ) | (3,114,783 | ) | ||||
| Net increase (decrease) in shares | (199,297 | ) | 522,969 | |||||
| See Notes to Financial Statements. | The RYDEX FUNDS ANNUAL REPORT | 63 |
| EUROPE 1.25x STRATEGY FUND |
| FINANCIAL HIGHLIGHTS |
This table is presented to show selected data for a share outstanding throughout each period and to assist shareholders in evaluating a Fund’s performance for the periods presented.
| Year Ended | Year Ended | Year Ended | Year Ended | Year Ended | ||||||||||||||||
| December 31, | December 31, | December 31, | December 31, | December 31, | ||||||||||||||||
| 2013 | �� | 2012 | 2011 | 2010 | 2009 | |||||||||||||||
| Per Share Data | ||||||||||||||||||||
| Net asset value, beginning of period | $ | 15.13 | $ | 12.56 | $ | 14.80 | $ | 16.73 | $ | 12.65 | ||||||||||
| Income (loss) from investment operations: | ||||||||||||||||||||
| Net investment incomea | .13 | .05 | .17 | .12 | .13 | |||||||||||||||
| Net gain (loss) on investments (realized and unrealized) | 3.48 | 2.66 | (2.41 | ) | (1.85 | ) | 4.31 | |||||||||||||
| Total from investment operations | 3.61 | 2.71 | (2.24 | ) | (1.73 | ) | 4.44 | |||||||||||||
| Less distributions from: | ||||||||||||||||||||
| Net investment income | (.02 | ) | (.14 | ) | — | (.20 | ) | (.36 | ) | |||||||||||
| Total distributions | (.02 | ) | (.14 | ) | — | (.20 | ) | (.36 | ) | |||||||||||
| Net asset value, end of period | $ | 18.72 | $ | 15.13 | $ | 12.56 | $ | 14.80 | $ | 16.73 | ||||||||||
| Total Returnb | 23.89 | % | 21.66 | % | (15.14 | %) | (10.35 | %) | 35.01 | % | ||||||||||
| Ratios/Supplemental Data | ||||||||||||||||||||
| Net assets, end of period (in thousands) | $ | 12,116 | $ | 12,810 | $ | 4,063 | $ | 9,063 | $ | 22,358 | ||||||||||
| Ratios to average net assets: | ||||||||||||||||||||
| Net investment income | 0.79 | % | 0.40 | % | 1.13 | % | 0.82 | % | 0.90 | % | ||||||||||
| Total expenses | 1.71 | % | 1.72 | % | 1.78 | % | 1.71 | % | 1.71 | % | ||||||||||
| Portfolio turnover rate | 455 | % | 489 | % | 446 | % | 461 | % | 321 | % | ||||||||||
| a | Net investment income per share was computed using average shares outstanding throughout the period. |
| b | Total return does not reflect the impact of any additional fees charged by insurance companies. |
| 64 | the RYDEX FUNDS ANNUAL REPORT | See Notes to Financial Statements. |
|
This page intentionally left blank.
| the RYDEX FUNDS ANNUAL REPORT | 65 |
| PERFORMANCE REPORT AND FUND PROFILE (Unaudited) | December 31, 2013 |
JAPAN 2x STRATEGY FUND
OBJECTIVE: Seeks to provide investment results that correlate, before fees and expenses, to the performance of a specific benchmark. The Fund’s current benchmark is 200% of the fair value of the Nikkei 225 Stock Average (the “underlying index”).
For the one-year period ended December 31, 2013, Japan 2x Strategy Fund maintained a daily correlation of over 99% to its benchmark of 200% of the daily price movement of the fair value of the underlying index. Japan 2x Strategy Fund returned 56.00%, while the underlying index returned 28.39% over the same time period.
The sectors contributing most to performance of the underlying index were Consumer Discretionary and Telecommunications Services. No sector detracted, but those contributing least to performance of the underlying index were Utilities and Energy.
Stocks contributing most to return of the underlying index were Fast Retailing Company Ltd, SoftBank Corp. and KDDI Corp.
Those detracting most from performance of the underlying index were Nikon Corp., Fanuc Corp. and Canon, Inc.
Derivatives in the Fund were used to help provide exposure to the composition of the benchmark in the highest efficient manner and to provide leverage, not for hedging purposes.
Due to the compounding of daily returns, leveraged and inverse funds’ returns over periods other than one day will likely differ in amount and possibly direction from the benchmark return for the same period. Investors should monitor their leveraged and inverse funds’ holdings to ensure that they are consistent with their strategies, as frequently as daily.
The effects of compounding may cause the longer-term correlation of the fund to its benchmark to diminish. The apparent discrepancy between the leveraged and unleveraged indices is the result of compounding, which is described briefly on page 6 of this report.
Performance displayed represents past performance, which is no guarantee of future results.
Holdings Diversification (Market Exposure as % of Net Assets)

“Holdings Diversification (Market Exposure as % of Net Assets)” excludes any temporary cash investments.
Inception Date: October 1, 2001
The Fund invests principally in derivative investments such as futures contracts.
| 66 | the RYDEX FUNDS ANNUAL REPORT |
| performance report and FUND PROFILE (Unaudited) (concluded) |
Cumulative Fund Performance*,†
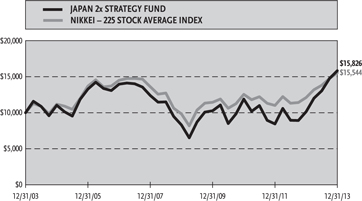
Average Annual Returns
Periods Ended December 31, 2013*,†
| 1 Year | 5 Year | 10 Year | ||||||||||
| Japan 2x Strategy Fund | 56.00 | % | 13.76 | % | 4.70 | % | ||||||
| Nikkei-225 Stock Average Index | 28.39 | % | 9.59 | % | 4.51 | % | ||||||
| * | The performance data above represents past performance that is not predictive of future results. The investment return and principal value of an investment in the Fund will fluctuate so that an investor’s shares, when redeemed, may be worth more or less than their original cost. Returns are historical and include changes in principal and reinvested dividends and capital gains and do not reflect the effect of taxes. The Nikkei-225 Stock Average Index is an unmanaged index and, unlike the Fund, has no management fees or operating expenses to reduce its reported return. |
| † | Returns do not reflect the impact of any additional fees charged by insurance companies. |
| the RYDEX FUNDS ANNUAL REPORT | 67 |
| SCHEDULE OF INVESTMENTS | December 31, 2013 |
| JAPAN 2x STRATEGY FUND | |
| Face | ||||||||
| Amount | Value | |||||||
| FEDERAL AGENCY DISCOUNT NOTES†† - 50.9% | ||||||||
| Federal Farm Credit Bank1 | ||||||||
| 0.03% due 01/10/14 | $ | 1,000,000 | $ | 999,993 | ||||
| 0.03% due 01/15/14 | 500,000 | 499,994 | ||||||
| Total Federal Farm Credit Bank | 1,499,987 | |||||||
| Fannie Mae2 | ||||||||
| 0.08% due 01/02/14 | 1,000,000 | 999,999 | ||||||
| Total Federal Agency Discount Notes | ||||||||
| (Cost $2,499,984) | 2,499,986 | |||||||
| REPURCHASE AGREEMENTS††,3 - 32.0% | ||||||||
| Deutsche Bank | ||||||||
| issued 12/31/13 at 0.01% | ||||||||
| due 01/02/14 | 392,587 | 392,587 | ||||||
| HSBC Group | ||||||||
| issued 12/31/13 at 0.01% | ||||||||
| due 01/02/14 | 392,587 | 392,587 | ||||||
| Credit Suisse Group | ||||||||
| issued 12/31/13 at 0.00% | ||||||||
| due 01/02/14 | 392,587 | 392,587 | ||||||
| Mizuho Financial Group, Inc. | ||||||||
| issued 12/31/13 at 0.01% | ||||||||
| due 01/02/14 | 390,810 | 390,810 | ||||||
| Total Repurchase Agreements | ||||||||
| (Cost $1,568,571) | 1,568,571 | |||||||
| Total Investments - 82.9% | ||||||||
| (Cost $4,068,555) | $ | 4,068,557 | ||||||
| Other Assets & Liabilities, net - 17.1% | 840,620 | |||||||
| Total Net Assets - 100.0% | $ | 4,909,177 | ||||||
| Unrealized | ||||||||
| Contracts | Gain (Loss) | |||||||
| EQUITY FUTURES CONTRACTS PURCHASED† | ||||||||
| March 2014 Nikkei 225 (CME) Index | ||||||||
| Futures Contracts | ||||||||
| (Aggregate Value of | ||||||||
| Contracts $9,843,000) | 120 | $ | 322,361 | |||||
| CURRENCY FUTURES CONTRACTS PURCHASED† | ||||||||
| March 2014 Japanese Yen | ||||||||
| Futures Contracts | ||||||||
| (Aggregate Value of | ||||||||
| Contracts $9,858,325) | 83 | $ | (166,933 | ) | ||||
| † | Value determined based on Level 1 inputs — See Note 4. |
| †† | Value determined based on Level 2 inputs — See Note 4. |
| 1 | The issuer operates under a Congressional charter; its securities are neither issued nor guaranteed by the U.S. Government. |
| 2 | On September 7, 2008, the issuer was placed in conservatorship by the Federal Housing Finance Agency (FHFA). As conservator, the FHFA has full powers to control the assets and operations of the firm. |
| 3 | Repurchase Agreements — See Note 5. |
| 68 | the RYDEX FUNDS ANNUAL REPORT | See Notes to Financial Statements. |
| JAPAN 2x STRATEGY FUND |
| STATEMENT OF ASSETS |
| AND LIABILITIES |
December 31, 2013
| Assets: | ||||
| Investments, at value | $ | 2,499,986 | ||
| (cost $2,499,984) | ||||
| Repurchase agreements, at value | ||||
| (cost $1,568,571) | 1,568,571 | |||
| Total investments | ||||
| (cost $4,068,555) | 4,068,557 | |||
| Segregated cash with broker | 710,500 | |||
| Receivables: | ||||
| Variation margin | 16,297 | |||
| Fund shares sold | 9,416 | |||
| Swap settlement | 118,624 | |||
| Total assets | 4,923,394 | |||
| Liabilities: | ||||
| Payable for: | ||||
| Management fees | 3,203 | |||
| Transfer agent and administrative fees | 1,067 | |||
| Investor service fees | 1,067 | |||
| Portfolio accounting fees | 427 | |||
| Fund shares redeemed | 189 | |||
| Miscellaneous | 8,264 | |||
| Total liabilities | 14,217 | |||
| Net assets | $ | 4,909,177 | ||
| Net assets consist of: | ||||
| Paid in capital | $ | 4,867,212 | ||
| Undistributed net investment income | – | |||
| Accumulated net realized loss on investments | (113,465 | ) | ||
| Net unrealized appreciation on investments | 155,430 | |||
| Net assets | $ | 4,909,177 | ||
| Capital shares outstanding | 171,568 | |||
| Net asset value per share | $ | 28.61 |
| STATEMENT OF |
| OPERATIONS |
Year Ended December 31, 2013
| Investment Income: | ||||
| Interest | $ | 2,597 | ||
| Total investment income | 2,597 | |||
| Expenses: | ||||
| Management fees | 45,018 | |||
| Transfer agent and administrative fees | 15,006 | |||
| Investor service fees | 15,006 | |||
| Portfolio accounting fees | 6,002 | |||
| Professional fees | 5,583 | |||
| Custodian fees | 695 | |||
| Trustees’ fees* | 475 | |||
| Miscellaneous | 4,586 | |||
| Total expenses | 92,371 | |||
| Net investment loss | (89,774 | ) | ||
| Net Realized and Unrealized Gain (Loss): | ||||
| Net realized gain (loss) on: | ||||
| Swap agreements | 145,416 | |||
| Futures contracts | 1,748,498 | |||
| Net realized gain | 1,893,914 | |||
| Net change in unrealized appreciation (depreciation) on: | ||||
| Investments | 2 | |||
| Futures contracts | (228,046 | ) | ||
| Net change in unrealized appreciation (depreciation) | (228,044 | ) | ||
| Net realized and unrealized gain | 1,665,870 | |||
| Net increase in net assets resulting from operations | $ | 1,576,096 |
| * | Relates to Trustees not deemed “interested persons” within the meaning of Section 2(a)(19) of the 1940 Act. |
| See Notes to Financial Statements. | The RYDEX FUNDS ANNUAL REPORT | 69 |
| JAPAN 2x STRATEGY FUND |
| STATEMENTS OF CHANGES IN NET ASSETS |
| Year Ended | Year Ended | |||||||
| December 31, | December 31, | |||||||
| 2013 | 2012 | |||||||
| Increase (Decrease) In Net Assets From Operations: | ||||||||
| Net investment loss | $ | (89,774 | ) | $ | (36,816 | ) | ||
| Net realized gain (loss) on investments | 1,893,914 | (52,129 | ) | |||||
| Net change in unrealized appreciation (depreciation) on investments | (228,044 | ) | 431,422 | |||||
| Net increase in net assets resulting from operations | 1,576,096 | 342,477 | ||||||
| Capital share transactions: | ||||||||
| Proceeds from sale of shares | 49,133,415 | 28,879,850 | ||||||
| Cost of shares redeemed | (49,581,629 | ) | (27,617,993 | ) | ||||
| Net increase (decrease) from capital share transactions | (448,214 | ) | 1,261,857 | |||||
| Net increase in net assets | 1,127,882 | 1,604,334 | ||||||
| Net assets: | ||||||||
| Beginning of year | 3,781,295 | 2,176,961 | ||||||
| End of year | $ | 4,909,177 | $ | 3,781,295 | ||||
| Undistributed net investment income at end of year | $ | — | $ | — | ||||
| Capital share activity: | ||||||||
| Shares sold | 2,036,699 | 1,768,750 | ||||||
| Shares redeemed | (2,071,265 | ) | (1,705,122 | ) | ||||
| Net increase (decrease) in shares | (34,566 | ) | 63,628 | |||||
| 70 | the RYDEX FUNDS ANNUAL REPORT | See Notes to Financial Statements. |
| JAPAN 2x STRATEGY FUND |
| FINANCIAL HIGHLIGHTS |
This table is presented to show selected data for a share outstanding throughout each period and to assist shareholders in evaluating a Fund’s performance for the periods presented.
| Year Ended | Year Ended | Year Ended | Year Ended | Year Ended | ||||||||||||||||
| December 31, | December 31, | December 31, | December 31, | December 31, | ||||||||||||||||
| 2013 | 2012 | 2011 | 2010 | 2009 | ||||||||||||||||
| Per Share Data | ||||||||||||||||||||
| Net asset value, beginning of period | $ | 18.34 | $ | 15.28 | $ | 21.49 | $ | 18.57 | $ | 15.08 | ||||||||||
| Income (loss) from investment operations: | ||||||||||||||||||||
| Net investment lossa | (.36 | ) | (.24 | ) | (.30 | ) | (.26 | ) | (.23 | ) | ||||||||||
| Net gain (loss) on investments (realized and unrealized) | 10.63 | 3.30 | (5.91 | ) | 3.18 | 3.79 | ||||||||||||||
| Total from investment operations | 10.27 | 3.06 | (6.21 | ) | 2.92 | 3.56 | ||||||||||||||
| Less distributions from: | ||||||||||||||||||||
| Net investment income | — | — | — | — | (.07 | ) | ||||||||||||||
| Total distributions | — | — | — | — | (.07 | ) | ||||||||||||||
| Net asset value, end of period | $ | 28.61 | $ | 18.34 | $ | 15.28 | $ | 21.49 | $ | 18.57 | ||||||||||
| Total Returnb | 56.00 | % | 20.10 | % | (28.94 | %) | 15.72 | % | 23.68 | % | ||||||||||
| Ratios/Supplemental Data | ||||||||||||||||||||
| Net assets, end of period (in thousands) | $ | 4,909 | $ | 3,781 | $ | 2,177 | $ | 8,618 | $ | 8,410 | ||||||||||
| Ratios to average net assets: | ||||||||||||||||||||
| Net investment loss | (1.50 | %) | (1.47 | %) | (1.57 | %) | (1.44 | %) | (1.49 | %) | ||||||||||
| Total expenses | 1.54 | % | 1.57 | % | 1.61 | % | 1.55 | % | 1.60 | % | ||||||||||
| Portfolio turnover rate | — | — | — | — | — | |||||||||||||||
| a | Net investment loss per share was computed using average shares outstanding throughout the period. |
| b | Total return does not reflect the impact of any additional fees charged by insurance companies. |
| See Notes to Financial Statements. | The RYDEX FUNDS ANNUAL REPORT | 71 |
| PERFORMANCE REPORT AND FUND PROFILE (Unaudited) | December 31, 2013 |
STRENGTHENING DOLLAR 2x STRATEGY FUND
OBJECTIVE: Seeks to provide investment results that match the performance of a specific benchmark, before fees and expenses, on a daily basis. The Fund’s current benchmark is 200% of the performance of the U.S. Dollar Index® (the “underlying index”). The Fund does not seek to achieve its investment objective over a period of time greater than one day.
For the year ended December 31, 2013, Strengthening Dollar 2x Strategy Fund maintained a daily correlation of over 99% to its benchmark of 200% of the daily price movement of the underlying index. Strengthening Dollar 2x Strategy Fund returned -2.97%, compared with a return of 0.34% for its benchmark, the underlying index.
Contributing most to performance of the underlying index for the year were the euro, British pound and Swiss franc. The Japanese yen, Canadian dollar and Swedish krona detracted most from the DXY during the year.
Derivatives in the Fund were used to help provide exposure to the composition of the benchmark in the highest efficient manner and to provide leverage, not for hedging purposes.
Due to the compounding of daily returns, leveraged and inverse funds’ returns over periods other than one day will likely differ in amount and possibly direction from the benchmark return for the same period. Investors should monitor their leveraged and inverse funds’ holdings to ensure that they are consistent with their strategies, as frequently as daily.
The effects of compounding may cause the longer-term correlation of the fund to its benchmark to diminish. The apparent discrepancy between the leveraged and unleveraged indices is the result of compounding, which is described briefly on page 6 of this report.
Performance displayed represents past performance, which is no guarantee of future results.
Holdings Diversification (Market Exposure as % of Net Assets)
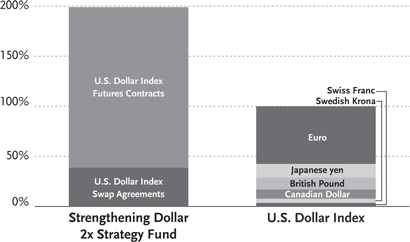
“Holdings Diversification (Market Exposure as % of Net Assets)” excludes any temporary cash investments.
Inception Date: September 30, 2005
The Fund invests principally in derivative investments such as swap agreements and futures contracts.
| 72 | the RYDEX FUNDS ANNUAL REPORT |
| performance report and FUND PROFILE (Unaudited) (concluded) |
Cumulative Fund Performance*,†
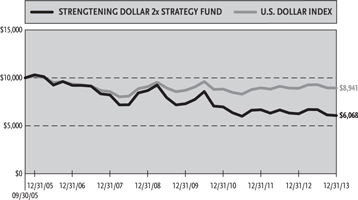
Average Annual Returns
Periods Ended December 31, 2013*,†
| Since | ||||||||||||
| Inception | ||||||||||||
| 1 Year | 5 Year | (09/30/05) | ||||||||||
| Strengthening Dollar | ||||||||||||
| 2x Strategy Fund | -2.97 | % | -6.89 | % | -5.87 | % | ||||||
| U.S. Dollar Index | 0.34 | % | -0.31 | % | -1.35 | % | ||||||
| * | The performance data above represents past performance that is not predictive of future results. The investment return and principal value of an investment in the Fund will fluctuate so that an investor’s shares, when redeemed, may be worth more or less than their original cost. Returns are historical and include changes in principal and reinvested dividends and capital gains and do not reflect the effect of taxes. The U.S. Dollar Index is an unmanaged index and, unlike the Fund, has no management fees or operating expenses to reduce its reported return. |
| † | Returns do not reflect the impact of any additional fees charged by insurance companies. |
| the RYDEX FUNDS ANNUAL REPORT | 73 |
| SCHEDULE OF INVESTMENTS | December 31, 2013 |
| STRENGTHENING DOLLAR 2x STRATEGY FUND | |
| Face | ||||||||
| Amount | Value | |||||||
| FEDERAL AGENCY DISCOUNT NOTES†† - 35.7% | ||||||||
| Federal Home Loan Bank1 | ||||||||
| 0.05% due 01/13/14 | $ | 1,000,000 | $ | 999,983 | ||||
| Total Federal Agency Discount Notes | ||||||||
| (Cost $999,983) | 999,983 | |||||||
| REPURCHASE AGREEMENTS††,2 - 58.7% | ||||||||
| Credit Suisse Group | ||||||||
| issued 12/31/13 at 0.00% | ||||||||
| due 01/02/143 | 562,283 | 562,283 | ||||||
| Deutsche Bank | ||||||||
| issued 12/31/13 at 0.01% | ||||||||
| due 01/02/14 | 362,131 | 362,131 | ||||||
| HSBC Group | ||||||||
| issued 12/31/13 at 0.01% | ||||||||
| due 01/02/14 | 362,131 | 362,131 | ||||||
| Mizuho Financial Group, Inc. | ||||||||
| issued 12/31/13 at 0.01% | ||||||||
| due 01/02/14 | 360,492 | 360,492 | ||||||
| Total Repurchase Agreements | ||||||||
| (Cost $1,647,037) | 1,647,037 | |||||||
| Total Investments - 94.4% | ||||||||
| (Cost $2,647,020) | $ | 2,647,020 | ||||||
| Other Assets & Liabilities, net - 5.6% | 155,792 | |||||||
| Total Net Assets - 100.0% | $ | 2,802,812 | ||||||
| Unrealized | ||||||||
| Contracts | Loss | |||||||
| CURRENCY FUTURES CONTRACTS PURCHASED† | ||||||||
| March 2014 U.S. Dollar Index | ||||||||
| Futures Contracts | ||||||||
| (Aggregate Value of | ||||||||
| Contracts $4,496,520) | 56 | $ | (993 | ) | ||||
| Units | ||||||||
| CURRENCY INDEX SWAP AGREEMENTS†† | ||||||||
| Goldman Sachs International | ||||||||
| February 2014 U.S. Dollar Index Swap, | ||||||||
| Terminating 02/27/144 | ||||||||
| (Notional Value $1,081,035) | 13,472 | $ | (4,199 | ) | ||||
| † | Value determined based on Level 1 inputs — See Note 4. |
| †† | Value determined based on Level 2 inputs — See Note 4. |
| 1 | The issuer operates under a Congressional charter; its securities are neither issued nor guaranteed by the U.S. Government. |
| 2 | Repurchase Agreements — See Note 5. |
| 3 | All or a portion of this security is pledged as currency index swap collateral at December 31, 2013. |
| 4 | Total Return based on U.S. Dollar Index +/- financing at a variable rate. |
| 74 | the RYDEX FUNDS ANNUAL REPORT | See Notes to Financial Statements. |
| STRENGTHENING DOLLAR 2x STRATEGY FUND |
| STATEMENT OF ASSETS |
| AND LIABILITIES |
December 31, 2013
| Assets: | ||||
| Investments, at value | ||||
| (cost $999,983) | $ | 999,983 | ||
| Repurchase agreements, at value | ||||
| (cost $1,647,037) | 1,647,037 | |||
| Total investments | ||||
| (cost $2,647,020) | 2,647,020 | |||
| Segregated cash with broker | 50,400 | |||
| Receivables: | ||||
| Fund shares sold | 117,301 | |||
| Variation margin | 9,688 | |||
| Total assets | 2,824,409 | |||
| Liabilities: | ||||
| Unrealized depreciation on swap agreements | 4,199 | |||
| Payable for: | ||||
| Swap settlement | 5,657 | |||
| Licensing fees | 2,742 | |||
| Management fees | 2,011 | |||
| Fund shares redeemed | 698 | |||
| Transfer agent and administrative fees | 559 | |||
| Investor service fees | 559 | |||
| Portfolio accounting fees | 223 | |||
| Miscellaneous | 4,949 | |||
| Total liabilities | 21,597 | |||
| Net assets | $ | 2,802,812 | ||
| Net assets consist of: | ||||
| Paid in capital | $ | 4,163,492 | ||
| Undistributed net investment income | — | |||
| Accumulated net realized loss on investments | (1,355,488 | ) | ||
| Net unrealized depreciation on investments | (5,192 | ) | ||
| Net assets | $ | 2,802,812 | ||
| Capital shares outstanding* | 81,667 | |||
| Net asset value per share* | $ | 34.32 |
| STATEMENT OF |
| OPERATIONS |
Year Ended December 31, 2013
| Investment Income: | ||||
| Interest | $ | 1,454 | ||
| Total investment income | 1,454 | |||
| Expenses: | ||||
| Management fees | 29,592 | |||
| Transfer agent and administrative fees | 8,220 | |||
| Investor service fees | 8,220 | |||
| Portfolio accounting fees | 3,288 | |||
| Professional fees | 2,854 | |||
| Trustees’ fees** | 443 | |||
| Custodian fees | 354 | |||
| Line of credit interest expense | 1 | |||
| Miscellaneous | 4,033 | |||
| Total expenses | 57,005 | |||
| Net investment loss | (55,551 | ) | ||
| Net Realized and Unrealized Gain (Loss): | ||||
| Net realized gain (loss) on: | ||||
| Swap agreements | 5,169 | |||
| Futures contracts | (254,615 | ) | ||
| Net realized loss | (249,446 | ) | ||
| Net change in unrealized appreciation (depreciation) on: | ||||
| Investments | (170 | ) | ||
| Swap agreements | (23,211 | ) | ||
| Futures contracts | (27,601 | ) | ||
| Net change in unrealized appreciation (depreciation) | (50,982 | ) | ||
| Net realized and unrealized loss | (300,428 | ) | ||
| Net decrease in net assets resulting from operations | $ | (355,979 | ) |
| * | The shares outstanding and net asset value have been restated to reflect a 1:3 reverse share split effective January 24, 2014. See Note 13 in Notes to Financial Statements. |
| ** | Relates to Trustees not deemed “interested persons” within the meaning of Section 2(a)(19) of the 1940 Act. |
| See Notes to Financial Statements. | The RYDEX FUNDS ANNUAL REPORT | 75 |
| STRENGTHENING DOLLAR 2x STRATEGY FUND |
| STATEMENTS OF CHANGES IN NET ASSETS |
| Year Ended | Year Ended | |||||||
| December 31, | December 31, | |||||||
| 2013 | 2012 | |||||||
| Increase (Decrease) In Net Assets From Operations: | ||||||||
| Net investment loss | $ | (55,551 | ) | $ | (74,983 | ) | ||
| Net realized loss on investments | (249,446 | ) | (586,836 | ) | ||||
| Net change in unrealized appreciation (depreciation) on investments | (50,982 | ) | (111,400 | ) | ||||
| Net decrease in net assets resulting from operations | (355,979 | ) | (773,219 | ) | ||||
| Capital share transactions: | ||||||||
| Proceeds from sale of shares | 33,773,935 | 61,680,944 | ||||||
| Cost of shares redeemed | (34,559,456 | ) | (64,671,168 | ) | ||||
| Net decrease from capital share transactions | (785,521 | ) | (2,990,224 | ) | ||||
| Net decrease in net assets | (1,141,500 | ) | (3,763,443 | ) | ||||
| Net assets: | ||||||||
| Beginning of year | 3,944,312 | 7,707,755 | ||||||
| End of year | $ | 2,802,812 | $ | 3,944,312 | ||||
| Undistributed net investment income at end of year | $ | — | $ | — | ||||
| Capital share activity:* | ||||||||
| Shares sold | 933,380 | 1,680,345 | ||||||
| Shares redeemed | (963,214 | ) | (1,773,084 | ) | ||||
| Net decrease in shares | (29,834 | ) | (92,739 | ) | ||||
| * | Capital share activity for the years ended December 31, 2013 and 2012 has been restated to reflect a 1:3 reverse share split effective January 24, 2014. See Note 13 in Notes to Financial Statements. |
| 76 | the RYDEX FUNDS ANNUAL REPORT | See Notes to Financial Statements. |
| STRENGTHENING DOLLAR 2x STRATEGY FUND |
| FINANCIAL HIGHLIGHTS |
This table is presented to show selected data for a share outstanding throughout each period and to assist shareholders in evaluating a Fund’s performance for the periods presented.
| Year Ended | Year Ended | Year Ended | Year Ended | Year Ended | ||||||||||||||||
| December 31, | December 31, | December 31, | December 31, | December 31, | ||||||||||||||||
| 2013c | 2012c | 2011c,d | 2010c,d | 2009c,d | ||||||||||||||||
| Per Share Data | ||||||||||||||||||||
| Net asset value, beginning of period | $ | 35.37 | $ | 37.74 | $ | 39.45 | $ | 41.30 | $ | 127.51 | ||||||||||
| Income (loss) from investment operations: | ||||||||||||||||||||
| Net investment lossa | (.60 | ) | (.60 | ) | (.60 | ) | (.66 | ) | (1.62 | ) | ||||||||||
| Net loss on investments (realized and unrealized) | (.45 | ) | (1.77 | ) | (1.11 | ) | (1.19 | ) | (22.91 | ) | ||||||||||
| Total from investment operations | (1.05 | ) | (2.37 | ) | (1.71 | ) | (1.85 | ) | (24.53 | ) | ||||||||||
| Less distributions from: | ||||||||||||||||||||
| Net realized gains | — | — | — | — | (61.68 | ) | ||||||||||||||
| Total distributions | — | — | — | — | (61.68 | ) | ||||||||||||||
| Net asset value, end of period | $ | 34.32 | $ | 35.37 | $ | 37.74 | $ | 39.45 | $ | 41.30 | ||||||||||
| Total Returnb | (2.97 | %) | (6.28 | %) | (4.26 | %) | (4.51 | %) | (15.84 | %) | ||||||||||
| Ratios/Supplemental Data | ||||||||||||||||||||
| Net assets, end of period (in thousands) | $ | 2,803 | $ | 3,944 | $ | 7,708 | $ | 6,871 | $ | 7,525 | ||||||||||
| Ratios to average net assets: | ||||||||||||||||||||
| Net investment loss | (1.69 | %) | (1.64 | %) | (1.72 | %) | (1.55 | %) | (1.57 | %) | ||||||||||
| Total expenses | 1.73 | % | 1.76 | % | 1.77 | % | 1.69 | % | 1.72 | % | ||||||||||
| Portfolio turnover rate | — | — | — | — | — | |||||||||||||||
| a | Net investment loss per share was computed using average shares outstanding throughout the period. |
| b | Total return does not reflect the impact of any additional fees charged by insurance companies. |
| c | Per share amounts for the years ended December 31, 2013, 2012, 2011, 2010 and 2009 have been restated to reflect a 1:3 reverse share split effective January 24, 2014. See Note 13 in Notes to Financial Statements. |
| d | Per share amounts for the years December 31, 2009 - December 31, 2010 and the period January 1, 2011 through December 1, 2011 have been restated to reflect a 1:2 reverse share split effective December 2, 2011. |
| See Notes to Financial Statements. | The RYDEX FUNDS ANNUAL REPORT | 77 |
| PERFORMANCE REPORT AND FUND PROFILE (Unaudited) | December 31, 2013 |
WEAKENING DOLLAR 2x STRATEGY FUND
OBJECTIVE: Seeks to provide investment results that match, before fees and expenses, the performance of a specific benchmark on a daily basis. The Fund’s current benchmark is 200% of the inverse (opposite) of the performance of the U.S. Dollar Index® (the “underlying index”). The Fund does not seek to achieve its investment objective over a period of time greater than one day.
For the year ended December 31, 2013, Weakening Dollar 2x Strategy Fund maintained a daily correlation of over 99% to its benchmark of -200% of the daily price movement of the underlying index. Weakening Dollar 2x Strategy Fund returned -2.82%, compared with a return of 0.34% for its benchmark, the underlying index.
Contributing most to performance of the underlying index for the year were the euro, British pound and Swiss franc. The Japanese yen, Canadian dollar and Swedish krona detracted most from the DXY during the year.
Derivatives in the Fund were used to help provide exposure to the composition of the benchmark in the highest efficient manner and to provide leverage, not for hedging purposes.
Due to the compounding of daily returns, leveraged and inverse funds’ returns over periods other than one day will likely differ in amount and possibly direction from the benchmark return for the same period. Investors should monitor their leveraged and inverse funds’ holdings to ensure that they are consistent with their strategies, as frequently as daily.
The effects of compounding may cause the longer-term correlation of the fund to its benchmark to diminish. The apparent discrepancy between the leveraged and unleveraged indices is the result of compounding, which is described briefly on page 6 of this report.
Performance displayed represents past performance, which is no guarantee of future results.
Holdings Diversification (Market Exposure as % of Net Assets)
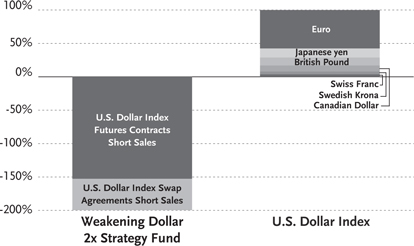
“Holdings Diversification (Market Exposure as % of Net Assets)” excludes any temporary cash investments.
Inception Date: September 30, 2005
The Fund invests principally in derivative investments such as swap agreements and futures contracts.
| 78 | the RYDEX FUNDS ANNUAL REPORT |
| performance report and FUND PROFILE (Unaudited) (concluded) |
Cumulative Fund Performance*,†
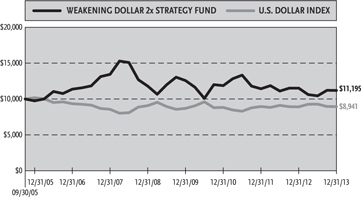
Average Annual Returns
Periods Ended December 31, 2013*,†
| Since | ||||||||||||
| Inception | ||||||||||||
| 1 Year | 5 Year | (09/30/05) | ||||||||||
| Weakening Dollar 2x | ||||||||||||
| Strategy Fund | -2.82 | % | -1.04 | % | 1.38 | % | ||||||
| U.S. Dollar Index | 0.34 | % | -0.31 | % | -1.35 | % | ||||||
| * | The performance data above represents past performance that is not predictive of future results. The investment return and principal value of an investment in the Fund will fluctuate so that an investor’s shares, when redeemed, may be worth more or less than their original cost. Returns are historical and include changes in principal and reinvested dividends and capital gains and do not reflect the effect of taxes. The U.S. Dollar Index is an unmanaged index and, unlike the Fund, has no management fees or perating expenses to reduce its reported return. |
| † | Returns do not reflect the impact of any additional fees charged by insurance companies. |
| the RYDEX FUNDS ANNUAL REPORT | 79 |
| SCHEDULE OF INVESTMENTS | December 31, 2013 |
| WEAKENING DOLLAR 2x STRATEGY FUND | |
| Face | ||||||||
| Amount | Value | |||||||
| FEDERAL AGENCY DISCOUNT NOTES†† - 21.1% | ||||||||
| Federal Farm Credit Bank1 | ||||||||
| 0.01% due 01/10/14 | $ | 200,000 | $ | 199,999 | ||||
| Farmer Mac1 | ||||||||
| 0.02% due 02/18/14 | 200,000 | 199,995 | ||||||
| Total Federal Agency Discount Notes | ||||||||
| (Cost $399,994) | 399,994 | |||||||
| REPURCHASE AGREEMENTS††,2 - 52.6% | ||||||||
| Credit Suisse Group | ||||||||
| issued 12/31/13 at 0.00% | ||||||||
| due 01/02/143 | 319,446 | 319,446 | ||||||
| Deutsche Bank | ||||||||
| issued 12/31/13 at 0.01% | ||||||||
| due 01/02/14 | 226,460 | 226,460 | ||||||
| HSBC Group | ||||||||
| issued 12/31/13 at 0.01% | ||||||||
| due 01/02/14 | 226,460 | 226,460 | ||||||
| Mizuho Financial Group, Inc. | ||||||||
| issued 12/31/13 at 0.01% | ||||||||
| due 01/02/14 | 225,436 | 225,436 | ||||||
| Total Repurchase Agreements | ||||||||
| (Cost $997,802) | 997,802 | |||||||
| Total Investments - 73.7% | ||||||||
| (Cost $1,397,796) | $ | 1,397,796 | ||||||
| Other Assets & Liabilities, net - 26.3% | 498,278 | |||||||
| Total Net Assets - 100.0% | $ | 1,896,074 | ||||||
| Unrealized | ||||||||
| Contracts | Gain | |||||||
| CURRENCY FUTURES CONTRACTS SOLD SHORT† | ||||||||
| March 2014 U.S. Dollar Index | ||||||||
| Futures Contracts | ||||||||
| (Aggregate Value of | ||||||||
| Contracts $2,890,620) | 36 | $ | 762 | |||||
| Units | ||||||||
| CURRENCY INDEX SWAP AGREEMENTS SOLD SHORT†† | ||||||||
| Goldman Sachs International | ||||||||
| February 2014 U.S. Dollar Index Swap, | ||||||||
| Terminating 02/27/144 | ||||||||
| (Notional Value $893,627) | 11,137 | $ | 306 | |||||
| † | Value determined based on Level 1 inputs — See Note 4. |
| †† | Value determined based on Level 2 inputs — See Note 4. |
| 1 | The issuer operates under a Congressional charter; its securities are neither issued nor guaranteed by the U.S. Government. |
| 2 | Repurchase Agreements — See Note 5. |
| 3 | All or a portion of this security is pledged as currency index swap collateral at December 31, 2013. |
| 4 | Total Return based on U.S. Dollar Index +/- financing at a variable rate. |
| 80 | the RYDEX FUNDS ANNUAL REPORT | See Notes to Financial Statements. |
| WEAKENING DOLLAR 2x STRATEGY FUND |
| STATEMENT OF ASSETS |
| AND LIABILITIES |
December 31, 2013
| Assets: | ||||
| Investments, at value | ||||
| (cost $399,994) | $ | 399,994 | ||
| Repurchase agreements, at value | ||||
| (cost $997,802) | 997,802 | |||
| Total investments | ||||
| (cost $1,397,796) | 1,397,796 | |||
| Segregated cash with broker | 24,300 | |||
| Unrealized appreciation on swap agreements | 306 | |||
| Receivables: | ||||
| Fund shares sold | 484,049 | |||
| Total assets | 1,906,451 | |||
| Liabilities: | ||||
| Payable for: | ||||
| Variation margin | 4,832 | |||
| Licensing fees | 1,152 | |||
| Management fees | 913 | |||
| Swap settlement | 666 | |||
| Transfer agent and administrative fees | 254 | |||
| Investor service fees | 254 | |||
| Portfolio accounting fees | 101 | |||
| Fund shares redeemed | 27 | |||
| Miscellaneous | 2,178 | |||
| Total liabilities | 10,377 | |||
| Net assets | $ | 1,896,074 | ||
| Net assets consist of: | ||||
| Paid in capital | $ | 2,858,591 | ||
| Undistributed net investment income | - | |||
| Accumulated net realized loss on investments | (963,585 | ) | ||
| Net unrealized appreciation on investments | 1,068 | |||
| Net assets | $ | 1,896,074 | ||
| Capital shares outstanding | 79,586 | |||
| Net asset value per share | $ | 23.82 |
| STATEMENT OF |
| OPERATIONS |
Year Ended December 31, 2013
| Investment Income: | ||||
| Interest | $ | 642 | ||
| Total investment income | 642 | |||
| Expenses: | ||||
| Management fees | 13,284 | |||
| Transfer agent and administrative fees | 3,690 | |||
| Investor service fees | 3,690 | |||
| Portfolio accounting fees | 1,476 | |||
| Professional fees | 1,287 | |||
| Trustees’ fees* | 196 | |||
| Custodian fees | 165 | |||
| Miscellaneous | 1,855 | |||
| Total expenses | 25,643 | |||
| Net investment loss | (25,001 | ) | ||
| Net Realized and Unrealized Gain (Loss): | ||||
| Net realized gain (loss) on: | ||||
| Investments | (4 | ) | ||
| Swap agreements | (54,270 | ) | ||
| Futures contracts | (4,499 | ) | ||
| Net realized loss | (58,773 | ) | ||
| Net change in unrealized appreciation (depreciation) on: | ||||
| Swap agreements | (1,774 | ) | ||
| Futures contracts | (2,240 | ) | ||
| Net change in unrealized appreciation (depreciation) | (4,014 | ) | ||
| Net realized and unrealized loss | (62,787 | ) | ||
| Net decrease in net assets resulting from operations | $ | (87,788 | ) |
| * | Relates to Trustees not deemed “interested persons” within the meaning of Section 2(a)(19) of the 1940 Act. |
| See Notes to Financial Statements. | The RYDEX FUNDS ANNUAL REPORT | 81 |
| WEAKENING DOLLAR 2x STRATEGY FUND |
| STATEMENTS OF CHANGES IN NET ASSETS |
| Year Ended | Year Ended | |||||||
| December 31, | December 31, | |||||||
| 2013 | 2012 | |||||||
| Increase (Decrease) In Net Assets From Operations: | ||||||||
| Net investment loss | $ | (25,001 | ) | $ | (34,595 | ) | ||
| Net realized loss on investments | (58,773 | ) | (145,706 | ) | ||||
| Net change in unrealized appreciation (depreciation) on investments | (4,014 | ) | 74,916 | |||||
| Net decrease in net assets resulting from operations | (87,788 | ) | (105,385 | ) | ||||
| Capital share transactions: | ||||||||
| Proceeds from sale of shares | 12,116,227 | 20,698,423 | ||||||
| Cost of shares redeemed | (12,054,881 | ) | (20,754,172 | ) | ||||
| Net increase (decrease) from capital share transactions | 61,346 | (55,749 | ) | |||||
| Net decrease in net assets | (26,442 | ) | (161,134 | ) | ||||
| Net assets: | ||||||||
| Beginning of year | 1,922,516 | 2,083,650 | ||||||
| End of year | $ | 1,896,074 | $ | 1,922,516 | ||||
| Undistributed net investment income at end of year | $ | — | $ | 1 | ||||
| Capital share activity: | ||||||||
| Shares sold | 519,978 | 837,258 | ||||||
| Shares redeemed | (518,832 | ) | (844,487 | ) | ||||
| Net increase (decrease) in shares | 1,146 | (7,229 | ) | |||||
| 82 | the RYDEX FUNDS ANNUAL REPORT | See Notes to Financial Statements. |
| WEAKENING DOLLAR 2x STRATEGY FUND |
| FINANCIAL HIGHLIGHTS |
This table is presented to show selected data for a share outstanding throughout each period and to assist shareholders in evaluating a Fund’s performance for the periods presented.
| Year Ended | Year Ended | Year Ended | Year Ended | Year Ended | ||||||||||||||||
| December 31, | December 31, | December 31, | December 31, | December 31, | ||||||||||||||||
| 2013 | 2012 | 2011 | 2010 | 2009 | ||||||||||||||||
| Per Share Data | ||||||||||||||||||||
| Net asset value, beginning of period | $ | 24.51 | $ | 24.32 | $ | 25.26 | $ | 26.75 | $ | 25.10 | ||||||||||
| Income (loss) from investment operations: | ||||||||||||||||||||
| Net investment lossa | (.40 | ) | (.40 | ) | (.47 | ) | (.38 | ) | (.40 | ) | ||||||||||
| Net gain (loss) on investments (realized and unrealized) | (.29 | ) | .59 | (.47 | ) | (1.11 | ) | 2.06 | ||||||||||||
| Total from investment operations | (.69 | ) | .19 | (.94 | ) | (1.49 | ) | 1.66 | ||||||||||||
| Less distributions from: | ||||||||||||||||||||
| Net investment income | — | — | — | — | (.01 | ) | ||||||||||||||
| Total distributions | — | — | — | — | (.01 | ) | ||||||||||||||
| Net asset value, end of period | $ | 23.82 | $ | 24.51 | $ | 24.32 | $ | 25.26 | $ | 26.75 | ||||||||||
| Total Returnb | (2.82 | %) | 0.78 | % | (3.68 | %) | (5.61 | %) | 6.61 | % | ||||||||||
| Ratios/Supplemental Data | ||||||||||||||||||||
| Net assets, end of period (in thousands) | $ | 1,896 | $ | 1,923 | $ | 2,084 | $ | 3,302 | $ | 4,908 | ||||||||||
| Ratios to average net assets: | ||||||||||||||||||||
| Net investment loss | (1.69 | %) | (1.66 | %) | (1.72 | %) | (1.55 | %) | (1.58 | %) | ||||||||||
| Total expenses | 1.74 | % | 1.77 | % | 1.77 | % | 1.70 | % | 1.71 | % | ||||||||||
| Portfolio turnover rate | — | — | — | — | — | |||||||||||||||
| a | Net investment loss per share was computed using average shares outstanding throughout the period. |
| b | Total return does not reflect the impact of any additional fees charged by insurance companies. |
| See Notes to Financial Statements. | The RYDEX FUNDS ANNUAL REPORT | 83 |
| NOTES TO FINANCIAL STATEMENTS |
1. Organization and Significant Accounting Policies
Organization
The Rydex Variable Trust (the “Trust”), a Delaware business trust, is registered with the SEC under the Investment Company Act of 1940 (“1940 Act”) as a non-diversified, open-ended investment company and is authorized to issue an unlimited number of no par value shares. The Trust offers shares of the funds to insurance companies for their variable annuity and variable life insurance contracts.
At December 31, 2013, the Trust consisted of fifty-one separate funds. This report covers certain Target Beta Funds (the “Funds”), while the other funds are contained in separate reports.
Guggenheim Investments (“GI”) provides advisory services and Rydex Fund Services, LLC (“RFS”) provides transfer agent, administrative and accounting services to the Trust. Guggenheim Distributors, LLC (“GDL”) acts as principal underwriter for the Trust. GI, RFS and GDL are affiliated entities.
The Funds are designed and operated to accommodate frequent trading by shareholders and, unlike most mutual funds, offer unlimited exchange privileges with no minimum holding periods or transactions fees, which may cause the Funds to experience high portfolio turnover.
Significant Accounting Policies
The following significant accounting policies are in conformity with U.S. generally accepted accounting principles (“U.S. GAAP”) and are consistently followed by the Trust. This requires management to make estimates and assumptions that affect the reported amount of assets and liabilities and disclosure of contingent assets and liabilities at the date of the financial statements and the reported amounts of revenues and expenses during the reporting period. Actual results could differ from these estimates. All time references are based on Eastern Time.
A. Equity securities listed on an exchange (New York Stock Exchange (“NYSE”) or American Stock Exchange) are valued at the last quoted sales price as of the close of business on the NYSE, usually 4:00 p.m. on the valuation date. Equity securities listed on the NASDAQ market system are valued at the NASDAQ Official Closing Price on the valuation date which may not necessarily represent the last sale price. If there has been no sale on such exchange or NASDAQ on such day, the security is valued at the closing bid price on such day.
The value of futures contracts is accounted for using the unrealized gain or loss on the contracts that is determined by marking the contracts to their current realized settlement prices. Financial futures contracts are valued at the 4:00 p.m. price on the valuation date. In the event that the exchange for a specific futures contract closes earlier than 4:00 p.m., the futures contract is valued at the Official Settlement Price of the exchange. However, the underlying securities from which the futures contract value is derived are monitored until 4:00 p.m. to determine if fair valuation would provide a more accurate valuation.
Debt securities with a maturity of greater than 60 days at acquisition are valued at prices that reflect broker/dealer-supplied valuations or are obtained from independent pricing services, which may consider the trade activity, treasury spreads, yields or price of bonds of comparable quality, coupon, maturity, and type, as well as prices quoted by dealers who make markets in such securities. Short-term debt securities with a maturity of 60 days or less at acquisition and repurchase agreements are valued at amortized cost, which approximates market value.
The value of currency index swap agreements entered into by a Fund is accounted for using the unrealized gain or loss on the agreements that is determined using a broker quote.
Investments for which market quotations are not readily available are fair valued as determined in good faith by GI under the direction of the Board of Trustees using methods established or ratified by the Board of Trustees. These methods include, but are not limited to: (i) obtaining general information as to how these securities and assets trade; (ii) in connection with futures contracts and other derivative investments, obtaining information as to how (a) these contracts and other derivative investments trade in the futures or other derivative markets, respectively, and (b) the securities underlying these contracts and other derivative investments trade in the cash market; and (iii) obtaining other information and considerations, including current values in related markets.
B. Security transactions are recorded on the trade date for financial reporting purposes. Realized gains and losses from securities transactions are recorded using the identified cost basis. Proceeds from lawsuits related to investment holdings are recorded as realized gains in the respective Fund. Dividend income is recorded on the ex-dividend date, net of applicable taxes withheld by foreign countries. Taxable non-cash dividends are recorded as dividend income. Interest income, including amortization of premiums and accretion of discounts, is accrued on a daily basis. Distributions received from investments in REITs are recorded as dividend income on the ex-dividend date, subject to reclassification upon notice of the character of such distribution by the issuer.
| 84 | the RYDEX FUNDS ANNUAL REPORT |
| NOTES TO FINANCIAL STATEMENTS (continued) |
C. Upon entering into a futures contract, a Fund deposits and maintains as collateral such initial margin as required by the exchange on which the transaction is affected. Pursuant to the contract, the Fund agrees to receive from or pay to the broker an amount of cash equal to the daily fluctuation in value of the contract. Such receipts or payments are known as variation margin and are recorded by the Fund as unrealized gains or losses. When the contract is closed, the Fund records a realized gain or loss equal to the difference between the value of the contract at the time it was opened and the value at the time it was closed.
D. Swap agreements are marked-to-market daily and the change, if any, is recorded as unrealized gain or loss. Payments received or made as a result of an agreement or termination of the agreement are recognized as realized gains or losses.
E. Investment securities and other assets and liabilities denominated in foreign currencies are translated into U.S. dollar amounts at the date of valuation. Purchases and sales of investment securities and income and expense items denominated in foreign currencies are translated into U.S. dollar amounts on the respective dates of such transactions. The Funds do not isolate that portion of the results of operations resulting from changes in foreign exchange rates on investments from the fluctuations arising from changes in market prices of securities held. Such fluctuations are included with the net realized and unrealized gain and loss from investments.
Reported net realized foreign exchange gains or losses arise from sales of foreign currencies and currency gains or losses realized between the trade and settlement dates on investment transactions. Net unrealized exchange gains and losses arise from changes in the fair values of assets and liabilities other than investments in securities at the fiscal period end, resulting from changes in exchange rates.
F. Certain U.S. Government and Agency Obligations are traded on a discount basis; the interest rates shown on the Schedules of Investments reflect the effective rates paid at the time of purchase by the Funds. Other securities bear interest at the rates shown, payable at fixed dates through maturity.
G. The Funds may leave cash overnight in their cash account with the custodian, U.S. Bank. Periodically, a Fund may have cash due to the custodian bank as an overdraft balance. A fee is incurred on this overdraft, calculated by multiplying the overdraft by a rate based on the federal funds rate.
Segregated cash with the broker is held as collateral for investments in derivative instruments such as futures contracts or swap agreements.
H. Throughout the normal course of business, the Funds enter into contracts that contain a variety of representations and warranties which provide general indemnifications. The Funds’ maximum exposure under these arrangements is unknown, as this would involve future claims that may be made against the Funds and/or their affiliates that have not yet occurred. However, based on experience, the Funds expect the risk of loss to be remote.
2. Financial Instruments
As part of their investment strategy, the Funds utilize a variety of derivative instruments including futures and swap agreements. These investments involve, to varying degrees, elements of market risk and risks in excess of the amounts recognized in the Statements of Assets and Liabilities.
A futures contract is an agreement to purchase (long) or sell (short) an agreed amount of securities or other instruments at a set price for delivery at a future date. There are significant risks associated with a Fund’s use of futures contracts including (i) there may be an imperfect or no correlation between the changes in market value of the underlying asset and the prices of futures contracts; (ii) there may not be a liquid secondary market for a futures contract; (iii) trading restrictions or limitations may be imposed by an exchange; and (iv) government regulations may restrict trading in futures contracts. When investing in futures, there is minimal counterparty credit risk to the Fund because futures are exchange-traded and the exchange’s clearinghouse, as counterparty to all exchange-traded futures, guarantees against default.
A swap is an agreement that obligates two parties to exchange a series of cash flows at specified intervals based upon or calculated by reference to changes in specified prices or rates for a specified amount of an underlying asset. A Fund bears the risk of loss of the amount expected to be received under a swap agreement in the event of the default or bankruptcy of a swap agreement counterparty. Additionally, there is no guarantee that a Fund or an underlying fund could eliminate its exposure under an outstanding swap agreement by entering into an offsetting swap agreement with the same or another party.
The use of derivative instruments by a Fund to achieve leveraged exposure to the underlying index creates leveraging risk. The more a Fund invests in leveraged instruments, the more this leverage will magnify any losses on those investments. A Fund’s investment
| the RYDEX FUNDS ANNUAL REPORT | 85 |
| NOTES TO FINANCIAL STATEMENTS (continued) |
in these instruments generally requires a small investment relative to the amount of investment exposure assumed. As a result, such investments may give rise to losses that exceed the amount invested in those instruments. Since a Fund’s investment strategy involves consistently applied leverage, the value of the Fund’s shares will tend to increase or decrease more than the value of any increase or decrease in the underlying index. Leverage also will have the effect of magnifying tracking error.
In conjunction with the use of futures and swap agreements, the Funds are required to maintain collateral in various forms. The Funds use, where appropriate, depending on the financial instrument utilized and the broker involved, margin deposits at the broker, cash and/or securities segregated at the custodian bank, discount notes, or the repurchase agreements allocated to each Fund.
The Trust has established counterparty credit guidelines and enters into transactions only with financial institutions of investment grade or better. The Trust monitors the counterparty credit risk.
3. Fees and Other Transactions with Affiliates
Under the terms of an investment advisory contract, the Funds pay GI investment advisory fees calculated at the annualized rates below, based on the average daily net assets of the Funds:
| Management Fees | ||||
| Fund | (as a % of Net Assets) | |||
| S&P 500® Pure Growth Fund | 0.75 | % | ||
| S&P 500® Pure Value Fund | 0.75 | % | ||
| S&P MidCap 400® Pure Growth Fund | 0.75 | % | ||
| S&P MidCap 400® Pure Value Fund | 0.75 | % | ||
| S&P SmallCap 600® Pure Growth Fund | 0.75 | % | ||
| S&P SmallCap 600® Pure Value Fund | 0.75 | % | ||
| Europe 1.25x Strategy Fund | 0.90 | % | ||
| Japan 2x Strategy Fund | 0.75 | % | ||
| Strengthening Dollar 2x Strategy Fund | 0.90 | % | ||
| Weakening Dollar 2x Strategy Fund | 0.90 | % | ||
RFS provides transfer agent and administrative services to the Trust for fees calculated at the annualized rates below, based on the average daily net assets of the Funds. For these services, RFS receives the following:
| Transfer Agent and | ||||
| Administrative Fees | ||||
| Fund | (as a % of Net Assets) | |||
| All Funds | 0.25 | % | ||
RFS also provides accounting services to the Funds for fees calculated at annualized rates below, based on the average daily net assets of each Fund.
| Fund Accounting Fees | (as a % of net assets) | |||
| On the first $250 million | 0.10 | % | ||
| On the next $250 million | 0.075 | % | ||
| On the next $250 million | 0.05 | % | ||
| Over $750 million | 0.03 | % | ||
RFS engages external service providers to perform other necessary services for the Trust, such as audit and accounting related services, legal services, custody, printing and mailing, etc., on a pass-through basis. Such expenses are allocated to various Funds within the complex based on relative net assets.
The Trust has adopted an Investor Services Plan for which GDL and other firms that provide investor services (“Service Providers”) may receive compensation. The Funds will pay investor service fees to GDL at an annual rate not to exceed 0.25% of average daily net assets. GDL, in turn, will compensate Service Providers for providing such services, while retaining a portion of such payments to compensate itself for investor services it performs.
Certain officers and trustees of the Trust are also officers of GI, RFS and GDL.
4. Fair Value Measurement
In accordance with U.S. GAAP, fair value is defined as the price that the Fund would receive to sell an investment or pay to transfer a liability in an orderly transaction with an independent buyer in the principal market, or in the absence of a principal market the most advantageous market for the investment or liability. A three-tier hierarchy is utilized to distinguish between (1) inputs that reflect the assumptions market participants would use in pricing an asset or liability developed based on market data obtained from sources independent of the reporting entity (observable inputs) and (2) inputs that reflect the reporting entity’s own assumptions about the assumptions market participants would use in pricing an asset or liability developed based on the best information available in the circumstances (unobservable inputs) and to establish classification of fair value measurements for disclosure purposes. Various inputs are used in determining the value of the Funds’ investments. The inputs are summarized in the three broad levels listed below:
Level 1 — quoted prices in active markets for identical securities.
Level 2 — other significant observable inputs (including quoted prices for similar securities, interest rates, prepayment speeds, credit risk, etc.).
| 86 | the RYDEX FUNDS ANNUAL REPORT |
| NOTES TO FINANCIAL STATEMENTS (continued) |
Level 3 — significant unobservable inputs (including the fund’s own assumptions used to determine the fair value of investments).
The inputs or methodologies used for valuing securities are not necessarily an indication of the risk associated with investing in those securities.
The following table summarizes the inputs used to value the Funds’ net assets at December 31, 2013:
| Level 1 | Level 1 | Level 2 | Level 2 | Level 3 | ||||||||||||||||||||
| Investments | Other Financial | Investments | Other Financial | Investments | ||||||||||||||||||||
| In Securities | Instruments* | In Securities | Instruments* | In Securities | Total | |||||||||||||||||||
| Assets | ||||||||||||||||||||||||
| S&P 500® Pure Growth Fund | $ | 61,939,506 | $ | — | $ | 171,746 | $ | — | $ | — | $ | 62,111,252 | ||||||||||||
| S&P 500® Pure Value Fund | 73,548,234 | — | 507,691 | — | — | 74,055,925 | ||||||||||||||||||
| S&P MidCap 400® Pure Growth Fund | 49,451,442 | — | 1,200,123 | — | — | 50,651,565 | ||||||||||||||||||
| S&P MidCap 400® Pure Value Fund | 28,010,825 | — | 275,272 | — | — | 28,286,097 | ||||||||||||||||||
| S&P SmallCap 600® Pure Growth Fund | 48,028,630 | — | 872,778 | — | — | 48,901,408 | ||||||||||||||||||
| S&P SmallCap 600® Pure Value Fund | 29,413,315 | — | 520,528 | — | — | 29,933,843 | ||||||||||||||||||
| Europe 1.25x Strategy Fund | 10,155,453 | 258,389 | 2,452,031 | — | — | 12,865,873 | ||||||||||||||||||
| Japan 2x Strategy Fund | — | 322,361 | 4,068,557 | — | — | 4,390,918 | ||||||||||||||||||
| Strengthening Dollar 2x Strategy Fund | — | — | 2,647,020 | — | — | 2,647,020 | ||||||||||||||||||
| Weakening Dollar 2x Strategy Fund | — | 762 | 1,397,796 | 306 | — | 1,398,864 | ||||||||||||||||||
| Liabilities | ||||||||||||||||||||||||
| Japan 2x Strategy Fund | $ | — | $ | 166,933 | $ | — | $ | — | $ | — | $ | 166,933 | ||||||||||||
| Strengthening Dollar 2x Strategy Fund | — | 993 | — | 4,199 | — | 5,192 | ||||||||||||||||||
| * | Other financial instruments may include futures contracts and/or swaps, which are reported as unrealized gain/loss at period end. |
For the year ended December 31, 2013, there were no transfers between levels.
5. Repurchase Agreements
The Funds transfer uninvested cash balances into a single joint account, the daily aggregate balance of which is invested in one or more repurchase agreements collateralized by obligations of the U.S. Treasury and U.S. Government Agencies. The collateral is in the possession of the Funds’ custodian and is evaluated to ensure that its market value exceeds, at a minimum, 102% of the original face amount of the repurchase agreements. Each Fund holds a pro rata share of the collateral based on the dollar amount of the repurchase agreement entered into by each Fund.
At December 31, 2013, the repurchase agreements in the joint account were as follows:
| Counterparty and Terms of Agreement | Face Value | Repurchase Price | Collateral | Par Value | Fair Value | |||||||||||||
| HSBC Group | U.S. Treasury Strips | |||||||||||||||||
| 0.01% | 0.00% | |||||||||||||||||
| Due 01/02/14 | $ | 34,100,000 | $ | 34,100,009 | 02/15/43 | $ | 116,737,200 | $ | 34,411,867 | |||||||||
| Freddie Mac | ||||||||||||||||||
| 2.00% | ||||||||||||||||||
| 04/01/23 | 370,745 | 370,158 | ||||||||||||||||
| Credit Suisse Group | U.S. Treasury Note | |||||||||||||||||
| 0.00% | 2.13% | |||||||||||||||||
| Due 01/02/14 | 72,978,168 | 72,978,168 | 12/31/15 | 71,965,900 | 74,437,835 | |||||||||||||
| Deutsche Bank | U.S. Treasury Note | |||||||||||||||||
| 0.01% | 0.25% | |||||||||||||||||
| Due 01/02/14 | 34,100,000 | 34,100,009 | 04/15/16 | 34,954,600 | 34,782,068 | |||||||||||||
| Mizuho Financial Group, Inc. | U.S. Treasury Strips | |||||||||||||||||
| 0.01% | 0.00% | |||||||||||||||||
| Due 01/02/14 | 33,945,739 | 33,945,748 | 08/15/22 - 02/15/36 | 27,125,000 | 16,169,404 | |||||||||||||
| U.S. Treasury Notes | ||||||||||||||||||
| 1.50% - 8.00% | ||||||||||||||||||
| 12/31/18 - 05/15/22 | 15,109,500 | 18,455,296 | ||||||||||||||||
| the RYDEX FUNDS ANNUAL REPORT | 87 |
| NOTES TO FINANCIAL STATEMENTS (continued) |
In the event of counterparty default, the Funds have the right to collect the collateral to offset losses incurred. There is potential loss to the Funds in the event the Funds are delayed or prevented from exercising their rights to dispose of the collateral securities, including the risk of a possible decline in the value of the underlying securities during the period while the Funds seek to assert their rights. The Funds’ investment advisor, acting under the supervision of the Board of Trustees, reviews the value of the collateral and the creditworthiness of those banks and dealers with which the Funds enter into repurchase agreements to evaluate potential risks.
6. Derivative Investment Holdings Categorized by Risk Exposure
U.S. GAAP requires disclosures to enable investors to better understand how and why the Funds use derivative instruments, how these derivative instruments are accounted for and their effects on the Funds’ financial position and results of operations.
The following Funds utilized derivatives for the following purposes:
| Futures | Swaps | |||||||
| Fund Name | Index Exposure | Liquidity | Index Exposure | Liquidity | ||||
| Europe 1.25x Strategy Fund | x | x | ||||||
| Japan 2x Strategy Fund | x | x | ||||||
| Strengthening Dollar 2x Strategy Fund | x | x | x | x | ||||
| Weakening Dollar 2x Strategy Fund | x | x | x | x | ||||
The following table represents the notional amount of derivative instruments outstanding, as an approximate percentage of the Funds’ net assets on a daily basis.
| Approximate percentage of Fund’s | ||||||||
| net assets on a daily basis | ||||||||
| Fund | Long | Short | ||||||
| Europe 1.25x Strategy Fund | 40 | %* | — | |||||
| Japan 2x Strategy Fund | 200 | %* | — | |||||
| Strengthening Dollar 2x Strategy Fund | 200 | % | — | |||||
| Weakening Dollar 2x Strategy Fund | — | 200 | % | |||||
*These funds utilize a combination of currency and financial-linked derivatives to obtain exposure to their benchmarks. The combined derivative instrument exposure is approximately 80% and 400% for the Europe 1.25x Strategy Fund and Japan 2x Strategy Fund, respectively.
The following is a summary of the location of derivative investments on the Funds’ Statements of Assets and Liabilities as of December 31, 2013:
| Derivative Investment Type | Asset Derivatives | Liability Derivatives |
| Equity/Currency contracts | Variation margin | Variation margin |
| Unrealized appreciation on swap agreements | Unrealized depreciation on swap agreements |
The following table sets forth the fair value of the Funds’ derivative investments categorized by primary risk exposure at December 31, 2013:
| Asset Derivative Investments Value | ||||||||||||||||
| Futures | Futures | Swaps | ||||||||||||||
| Equity | Currency | Currency | Total Value at | |||||||||||||
| Fund | Contracts* | Contracts* | Contracts | December 31, 2013 | ||||||||||||
| Europe 1.25x Strategy Fund | $ | 247,741 | $ 710,648 | $ | — | $ | 258,389 | |||||||||
| Japan 2x Strategy Fund | 322,361 | — | — | 322,361 | ||||||||||||
| Weakening Dollar 2x Strategy Fund | — | 762 | 306 | 1,068 | ||||||||||||
| Liability Derivative Investments Value | ||||||||||||||||
| Futures | Futures | Swaps | ||||||||||||||
| Equity | Currency | Currency | Total Value at | |||||||||||||
| Fund | Contracts* | Contracts* | Contracts | December 31, 2013 | ||||||||||||
| Japan 2x Strategy Fund | $ | — | $ | 166,933 | $ | — | $ | 166,933 | ||||||||
| Strengthening Dollar 2x Strategy Fund | — | 993 | 4,199 | 5,192 | ||||||||||||
* Includes cumulative appreciation (depreciation) of futures contracts as reported on the Schedules of Investments. Only current day’s variation margin is reported within the Statements of Assets and Liabilities.
| 88 | the RYDEX FUNDS ANNUAL REPORT |
| NOTES TO FINANCIAL STATEMENTS (continued) |
The following is a summary of the location of derivative investments on the Funds’ Statements of Operations for the year ended December 31, 2013:
| Derivative Investment Type | Location of Gain (Loss) on Derivatives | |
| Equity/Currency contracts | Net realized gain (loss) on swap agreements | |
| Net realized gain (loss) on futures contracts | ||
| Net change in unrealized appreciation (depreciation) on swap agreements | ||
| Net change in unrealized appreciation (depreciation) on futures contracts |
The following is a summary of the Funds’ realized gain (loss) and change in unrealized appreciation (depreciation) on derivative investments recognized on the Statements of Operations categorized by primary risk exposure for the year ended December 31, 2013:
| Realized Gain (Loss) on Derivative Investments Recognized on the Statements of Operations | ||||||||||||||||||||
| Futures | Swaps | Futures | Swaps | |||||||||||||||||
| Equity | Equity | Currency | Currency | |||||||||||||||||
| Fund | Contracts | Contracts | Contracts | Contracts | Total | |||||||||||||||
| Europe 1.25x Strategy Fund | $ | 284,278 | $ | 20,377 | $ | 162,010 | $ | — | $ | 466,665 | ||||||||||
| Japan 2x Strategy Fund | 3,351,706 | 145,416 | (1,603,208 | ) | — | 1,893,914 | ||||||||||||||
| Strengthening Dollar 2x Strategy Fund | — | — | (254,615 | ) | 5,169 | (249,446 | ) | |||||||||||||
| Weakening Dollar 2x Strategy Fund | — | — | (4,499 | ) | (54,270 | ) | (58,769 | ) | ||||||||||||
| Change in Unrealized Appreciation (Depreciation) on Derivative Investments Recognized on the Statements of Operations | ||||||||||||||||||||
| Futures | Swaps | Futures | Swaps | |||||||||||||||||
| Equity | Equity | Currency | Currency | |||||||||||||||||
| Fund | Contracts | Contracts | Contracts | Contracts | Total | |||||||||||||||
| Europe 1.25x Strategy Fund | $ | 171,126 | $ | — | $ | (33,877 | ) | $ | — | $ | 137,249 | |||||||||
| Japan 2x Strategy Fund | (222,611 | ) | — | (5,435 | ) | — | (228,046 | ) | ||||||||||||
| Strengthening Dollar 2x Strategy Fund | — | — | (27,601 | ) | (23,211 | ) | (50,812 | ) | ||||||||||||
| Weakening Dollar 2x Strategy Fund | — | — | (2,240 | ) | (1,774 | ) | (4,014 | ) | ||||||||||||
7. Federal Income Tax Information
The Funds intend to comply with the provisions of Subchapter M of the Internal Revenue Code applicable to regulated investment companies and distribute substantially all taxable net investment income and capital gains sufficient to relieve the Funds from all, or substantially all, federal income, excise and state income taxes. Therefore, no provision for federal or state income tax is required.
Tax positions taken or expected to be taken in the course of preparing the Funds’ tax returns are evaluated to determine whether the tax positions are “more-likely-than-not” of being sustained by the applicable tax authority. Tax positions not deemed to meet the more-likely-than-not threshold would be recorded as a tax benefit or expense in the current year. Management has analyzed the Funds’ tax positions taken, or to be taken, on Federal income tax returns for all open tax years, and has concluded that no provision for income tax is required in the Funds’ financial statements. The Fund’s federal tax returns are subject to examination by the Internal Revenue Service for a period of three fiscal years after they are filed.
The RIC Modernization Act of 2010 was signed into law on December 22, 2010 and seeks to simplify some of the tax provisions applicable to regulated investment companies, the tax reporting to their shareholders and to improve the tax efficiency of certain fund structures. The changes were generally effective for taxable years beginning after the date of enactment.
One of the more prominent changes addresses capital loss carryforwards. Funds are permitted to carry forward capital losses incurred in taxable years beginning after December 22, 2010 for an unlimited period. However, any losses incurred during those future taxable years will be required to be utilized prior to the losses incurred in pre-enactment taxable years. Under pre-enactment law, capital losses could be carried forward for eight years, and carried forward as short-term capital, irrespective of the character of the original loss. As a result of this ordering rule, pre-enactment capital carryforwards may potentially expire unused. Additionally, post-enactment capital losses that are carried forward will retain their character as either short-term or long-term capital losses rather than being considered all short-term as under previous law.
| the RYDEX FUNDS ANNUAL REPORT | 89 |
| NOTES TO FINANCIAL STATEMENTS (continued) |
Tax basis capital losses in excess of capital gains are carried forward to offset future net capital gains. For the year ended December 31, 2013, the following capital loss carryforward amounts expired, were used, or were permanently lost due to loss limitation rules in Section 382 of the Internal Revenue Code:
| Fund | Amount | |||
| S&P 500® Pure Value Fund | $ | 2,628,098 | ||
| S&P MidCap 400® Pure Value Fund | 1,212,567 | |||
| S&P SmallCap 600® Pure Growth Fund | 4,693,296 | |||
| S&P SmallCap 600® Pure Value Fund | 1,484,942 | |||
| Europe 1.25x Strategy Fund | 866,239 | |||
| Japan 2x Strategy Fund | 6,804,267 | |||
| Strengthening Dollar 2x Strategy Fund | 3,450,472 | |||
The tax character of distributions paid during the year ended December 31, 2013 was as follows:
| Ordinary | Return of | Long-Term | Total | |||||||||||||
| Fund | Income | Capital | Capital Gain | Distributions | ||||||||||||
| S&P MidCap 400® Pure Growth Fund | $ | 261,004 | $ | — | $ | 3,204,954 | $ | 3,465,958 | ||||||||
| S&P MidCap 400® Pure Value Fund | 21,268 | — | — | 21,268 | ||||||||||||
| S&P SmallCap 600® Pure Growth Fund | 2,459,263 | — | — | 2,459,263 | ||||||||||||
| S&P SmallCap 600® Pure Value Fund | 94,498 | — | — | 94,498 | ||||||||||||
| Europe 1.25x Strategy Fund | 15,300 | — | — | 15,300 | ||||||||||||
The tax character of distributions paid during the year ended December 31, 2012 was as follows:
| Ordinary | Long-Term | Total | ||||||||||
| Fund | Income | Capital Gain | Distributions | |||||||||
| S&P 500® Pure Growth Fund | $ | — | $ | 245,728 | $ | 245,728 | ||||||
| S&P 500® Pure Value Fund | 111,576 | — | 111,576 | |||||||||
| S&P MidCap 400® Pure Growth Fund | — | 4,252,045 | 4,252,045 | |||||||||
| Europe 1.25x Strategy Fund | 80,826 | — | 80,826 | |||||||||
Note: For federal income tax purposes, short-term capital gain distributions are treated as ordinary income distributions.
The tax character of distributable earnings/(accumulated losses) at December 31, 2013 was as follows:
| Undistributed | Undistributed | Net Unrealized | ||||||||||||||
| Ordinary | Long-Term | Appreciation/ | Capital Loss | |||||||||||||
| Fund | Income | Capital Gain | Depreciation | Carryforward1 | ||||||||||||
| S&P 500® Pure Growth Fund | $ | 5,091,780 | $ | 5,234,290 | $ | 10,483,540 | $ | — | ||||||||
| S&P 500® Pure Value Fund | 1,668,089 | 2,943,813 | 9,252,636 | — | ||||||||||||
| S&P MidCap 400® Pure Growth Fund | 2,668,153 | 2,916,523 | 7,532,556 | — | ||||||||||||
| S&P MidCap 400® Pure Value Fund | 1,480,246 | 649,134 | 3,345,327 | — | ||||||||||||
| S&P SmallCap 600® Pure Growth Fund | — | — | 7,193,074 | (25,039 | ) | |||||||||||
| S&P SmallCap 600® Pure Value Fund | 994,599 | 1,532,574 | 3,113,048 | (2,282,964 | ) | |||||||||||
| Europe 1.25x Strategy Fund | 70,484 | — | 539,758 | (5,166,348 | ) | |||||||||||
| Japan 2x Strategy Fund | 719,846 | 1,051,528 | 2 | (1,729,411 | ) | |||||||||||
| Strengthening Dollar 2x Strategy Fund | — | — | — | (1,360,680 | ) | |||||||||||
| Weakening Dollar 2x Strategy Fund | — | — | — | (962,517 | ) | |||||||||||
1 A summary of the expiration of the aforementioned Capital Loss Carryforward is as follows:
| 90 | the RYDEX FUNDS ANNUAL REPORT |
| NOTES TO FINANCIAL STATEMENTS (continued) |
| Total | ||||||||||||||||||||||||
| Expires in | Expires in | Expires in | Unlimited | Unlimited | Capital Loss | |||||||||||||||||||
| Fund | 2016 | 2017 | 2018 | Short-Term | Long-Term | Carryforward | ||||||||||||||||||
| S&P SmallCap 600® Pure Growth Fund | $ | — | $ | (25,039 | ) | $ | — | $ | — | $ | — | $ | (25,039 | ) | ||||||||||
| S&P SmallCap 600® Pure Value Fund | — | (2,282,964 | ) | — | — | — | (2,282,964 | ) | ||||||||||||||||
| Europe 1.25x Strategy Fund | (3,431,446 | ) | — | (1,734,902 | ) | — | — | (5,166,348 | )* | |||||||||||||||
| Japan 2x Strategy Fund | — | — | — | (691,764 | ) | (1,037,647 | ) | (1,729,411 | )* | |||||||||||||||
| Strengthening Dollar 2x Strategy Fund | — | — | — | (544,272 | ) | (816,408 | ) | (1,360,680 | )* | |||||||||||||||
| Weakening Dollar 2x Strategy Fund | (196,851 | ) | — | (196,737 | ) | (227,573 | ) | (341,356 | ) | (962,517 | )* | |||||||||||||
*In accordance with section 382 of the Internal Revenue Code, a portion of certain fund losses are subject to an annual limitation. Note, this annual limitation is generally applicable to all of the capital loss carryforwards shown with respect to each Fund.
Net investment income and net realized gains (losses) may differ for financial statement and tax purposes because of temporary or permanent book/tax differences. These differences are primarily due to wash sales, mark-to-market of passive foreign investment companies and foreign currency gains and losses. Additional differences may result from the tax treatment of net investment losses and expired capital loss carryforwards. To the extent these differences are permanent, reclassifications are made to the appropriate equity accounts in the period that the differences arise. These reclassifications have no effect on net assets or NAV per share.
On the Statements of Assets and Liabilities, the following adjustments were made for permanent book/tax differences:
| Undistributed | Accumulated | |||||||||||
| Paid In | Net Investment | Net Realized | ||||||||||
| Fund | Capital | Income | Gain (Loss) | |||||||||
| S&P 500® Pure Growth Fund | $ | (456 | ) | $ | 212,650 | $ | (212,194 | ) | ||||
| S&P 500® Pure Value Fund | — | (8,832 | ) | 8,832 | ||||||||
| S&P MidCap 400® Pure Growth Fund | 3,724 | 164,144 | (167,868 | ) | ||||||||
| S&P MidCap 400® Pure Value Fund | — | — | — | |||||||||
| S&P SmallCap 600® Pure Growth Fund | (2,706,193 | ) | 2,698,278 | 7,915 | ||||||||
| S&P SmallCap 600® Pure Value Fund | (303,327 | ) | 186,031 | 117,296 | ||||||||
| Europe 1.25x Strategy Fund | — | 4,096 | (4,096 | ) | ||||||||
| Japan 2x Strategy Fund | (6,701,121 | ) | 89,774 | 6,611,347 | ||||||||
| Strengthening Dollar 2x Strategy Fund | (3,506,023 | ) | 55,551 | 3,450,472 | ||||||||
| Weakening Dollar 2x Strategy Fund | (25,000 | ) | 25,000 | — | ||||||||
At December 31, 2013, the cost of securities for Federal income tax purposes, the aggregate gross unrealized gain for all securities for which there was an excess of value over tax cost and the aggregate gross unrealized loss for all securities for which there was an excess of tax cost over value, were as follows:
| Tax | Tax | Net | ||||||||||||||
| Tax | Unrealized | Unrealized | Unrealized | |||||||||||||
| Fund | Cost | Gain | Loss | Gain (Loss) | ||||||||||||
| S&P 500® Pure Growth Fund | $ | 51,627,712 | $ | 10,623,520 | $ | (139,980 | ) | $ | 10,483,540 | |||||||
| S&P 500® Pure Value Fund | 64,803,289 | 9,413,173 | (160,537 | ) | 9,252,636 | |||||||||||
| S&P MidCap 400® Pure Growth Fund | 43,119,009 | 7,589,199 | (56,643 | ) | 7,532,556 | |||||||||||
| S&P MidCap 400® Pure Value Fund | 24,940,770 | 3,373,359 | (28,032 | ) | 3,345,327 | |||||||||||
| S&P SmallCap 600® Pure Growth Fund | 41,708,334 | 7,326,664 | (133,590 | ) | 7,193,074 | |||||||||||
| S&P SmallCap 600® Pure Value Fund | 26,820,795 | 3,205,459 | (92,411 | ) | 3,113,048 | |||||||||||
| Europe 1.25x Strategy Fund | 12,067,927 | 556,068 | (16,511 | ) | 539,557 | |||||||||||
| Japan 2x Strategy Fund | 4,068,555 | 2 | — | 2 | ||||||||||||
| Strengthening Dollar 2x Strategy Fund | 2,647,020 | — | — | — | ||||||||||||
| Weakening Dollar 2x Strategy Fund | 1,397,796 | — | — | — | ||||||||||||
| the RYDEX FUNDS ANNUAL REPORT | 91 |
| NOTES TO FINANCIAL STATEMENTS (continued) |
8. Securities Transactions
For the year ended December 31, 2013, the cost of purchases and proceeds from sales of investment securities, excluding government securities and short-term investments, were as follows:
| Fund | Purchases | Sales | ||||||
| S&P 500® Pure Growth Fund | $ | 166,420,900 | $ | 149,396,283 | ||||
| S&P 500® Pure Value Fund | 211,594,935 | 182,701,439 | ||||||
| S&P MidCap 400® Pure Growth Fund | 135,497,697 | 128,346,356 | ||||||
| S&P MidCap 400® Pure Value Fund | 146,052,993 | 138,365,667 | ||||||
| S&P SmallCap 600® Pure Growth Fund | 129,878,614 | 110,170,794 | ||||||
| S&P SmallCap 600® Pure Value Fund | 62,220,963 | 55,559,207 | ||||||
| Europe 1.25x Strategy Fund | 31,586,238 | 29,940,897 | ||||||
| Japan 2x Strategy Fund | — | — | ||||||
| Strengthening Dollar 2x Strategy Fund | — | — | ||||||
| Weakening Dollar 2x Strategy Fund | — | — | ||||||
9. Line of Credit
The Trust, along with other affiliated trusts, secured an uncommitted, $75,000,000 line of credit from U.S. Bank, N.A., which expires June 15, 2014. This line of credit is reserved for emergency or temporary purposes. Borrowings, if any, under this arrangement bear interest equal to the Prime Rate, minus 2%, which shall be paid monthly, averaging 1.25% for the year ended December 31, 2013. The Funds did not have any borrowings under this agreement at December 31, 2013.
The average daily balances borrowed for the year ended December 31, 2013 were as follows:
| Funds | Average Daily Balance | |||
| S&P 500® Pure Growth Fund | $ | 12,057 | ||
| S&P 500® Pure Value Fund | 10,019 | |||
| S&P MidCap 400® Pure Growth Fund | 5,962 | |||
| S&P MidCap 400® Pure Value Fund | 3,822 | |||
| S&P SmallCap 600® Pure Growth Fund | 12,800 | |||
| S&P SmallCap 600® Pure Value Fund | 15,405 | |||
| Strengthening Dollar 2x Strategy Fund | 85 | |||
10. Portfolio Securities Loaned
The Funds may lend their securities to approved brokers to earn additional income. Security lending income shown on the Statements of Operations is shown net of rebates paid to the borrowers and earnings on cash collateral investments shared with the lending agent. Within this arrangement, the Funds act as the lender, Credit Suisse acts as the lending agent, and other approved registered broker dealers act as the borrowers. The Funds receive cash collateral, valued at 102% of the value of the securities on loan. Under the terms of the Funds’ securities lending agreement with Credit Suisse, cash collateral is invested in one or more joint repurchase agreements collateralized by obligations of the U.S. Treasury or Government Agencies and cash. The Funds bear the risk of loss on cash collateral investments. Collateral is maintained over the life of the loan in an amount not less than the value of loaned securities, as determined at the close of fund business each day; any additional collateral required due to changes in security values is delivered to the Funds the next business day. Although the collateral mitigates the risk, the Funds could experience a delay in recovering its securities and a possible loss of income or value if the borrower fails to return the securities. The Funds have the right under the securities lending agreement to recover the securities from the borrower on demand.
At December 31, 2013, the Funds participated in securities lending as follows:
| Fund | Value of Securities Loaned | Cash Collateral Received | ||||||
| S&P 500® Pure Value Fund | $ | 79,050 | $ | 85,000 | ||||
| S&P MidCap 400® Pure Growth Fund | 854,956 | 864,800 | ||||||
| S&P MidCap 400® Pure Value Fund | 94,245 | 103,000 | ||||||
| S&P SmallCap 600® Pure Growth Fund | 582,010 | 591,825 | ||||||
| S&P SmallCap 600® Pure Value Fund | 331,722 | 350,200 | ||||||
| 92 | the RYDEX FUNDS ANNUAL REPORT |
| NOTES TO FINANCIAL STATEMENTS (continued) |
Cash collateral received was invested in the following joint repurchase agreements at December 31, 2013:
| Counterparty and Terms of Agreement | Face Value | Repurchase Price | Collateral | Par Value | Fair Value | |||||||||||||
| HSBC Securities, Inc. | Freddie Mac | |||||||||||||||||
| 0.01% | 0.00% | |||||||||||||||||
| Due 01/02/14 | $ | 1,738,562 | $ | 1,738,562 | 01/15/14 - 07/15/32 | $ | 2,946,213 | $ | 1,773,537 | |||||||||
| Deutsche Bank Securities, Inc. | Fannie Mae | |||||||||||||||||
| 0.02% | 0.00% - 1.38% | |||||||||||||||||
| Due 01/02/14 | 256,264 | 256,265 | 11/15/16 - 05/15/30 | 392,313 | 260,569 | |||||||||||||
| Federal Home Loan Bank | ||||||||||||||||||
| 0.38% | ||||||||||||||||||
| 06/24/16 | 434 | 433 | ||||||||||||||||
| Freddie Mac | ||||||||||||||||||
| 3.00% | ||||||||||||||||||
| 07/28/14 | 260 | 266 | ||||||||||||||||
11. Offsetting
In the normal course of business, the Funds enter into transactions subject to enforceable master netting arrangements or other similar arrangements. Generally, the right to offset in those agreements allows the Funds to counteract the exposure to a specific counterparty with collateral received or delivered to that counterparty based on the terms of the arrangements. These arrangements provide for the right to liquidate upon the occurrence of an event of default, credit event upon merger or additional termination event.
In order to better define their contractual rights and to secure rights that will help the Funds mitigate their counterparty risk, the Funds may enter into an International Swaps and Derivatives Association, Inc. Master Agreement (“ISDA Master Agreement”) or similar agreement with their derivative contract counterparties. An ISDA Master Agreement is a bilateral agreement between a Fund and a counterparty that governs OTC derivatives, including foreign exchange contracts, and typically contains, among other things, collateral posting terms and netting provisions in the event of a default and/or termination event. The provisions of the ISDA Master Agreement typically permit a single net payment in the event of a default (close-out netting) or similar event, including the bankruptcy or insolvency of the counterparty.
For derivatives traded under an ISDA Master Agreement, the collateral requirements are typically calculated by netting the mark to market amount for each transaction under such agreement and comparing that amount to the value of any collateral currently pledged by the Funds and the counterparty. For financial reporting purposes, cash collateral that has been pledged to cover obligations of the Funds and cash collateral received from the counterparty, if any, is reported separately on the Statement of Assets and Liabilities as segregated cash with broker/ receivable for variation margin, or payable for swap settlement/variation margin. Generally, the amount of collateral due from or to a counterparty must exceed a minimum transfer amount threshold (e.g., $300,000) before a transfer is required to be made. To the extent amounts due to the Funds from their counterparties are not fully collateralized, contractually or otherwise, the Funds bear the risk of loss from counterparty nonperformance. The Funds attempt to mitigate counterparty risk by only entering into agreements with counterparties that they believe to be of good standing and by monitoring the financial stability of those counterparties.
For financial reporting purposes, the Funds do not offset derivative assets and derivative liabilities that are subject to netting arrangements in the Statement of Assets and Liabilities.
| the RYDEX FUNDS ANNUAL REPORT | 93 |
| NOTES TO FINANCIAL STATEMENTS (continued) |
The following tables present derivative financial instruments and secured financing transactions that are subject to enforceable netting arrangements and offset in the Statements of Assets and Liabilities in conformity with U.S. GAAP.
| Gross Amounts Not Offset | ||||||||||||||||||||||||||
| in the Statements of Assets | ||||||||||||||||||||||||||
| and Liabilities | ||||||||||||||||||||||||||
| Net Amount of | ||||||||||||||||||||||||||
| Gross Amounts Offset | Assets Presented | Cash | ||||||||||||||||||||||||
| Gross Amounts of | in the Statements of | on the Statements of | Financial | Collateral | Net | |||||||||||||||||||||
| Fund | Instrument | Recognized Assets | Assets and Liabilities | Assets and Liabilities | Instruments | Received1 | Amount | |||||||||||||||||||
| Weakening Dollar 2x Strategy Fund | Swap currency contracts | $ | 306 | $ | — | $ | 306 | $ | — | $ | — | $ | 306 | |||||||||||||
| Gross Amounts Not Offset | ||||||||||||||||||||||||||
| in the Statements of Assets | ||||||||||||||||||||||||||
| and Liabilities | ||||||||||||||||||||||||||
| Net Amount of | ||||||||||||||||||||||||||
| Gross Amounts | Gross Amounts Offset | Liabilities Presented | Cash | |||||||||||||||||||||||
| of Recognized | in the Statements of | on the Statements of | Financial | Collateral | Net | |||||||||||||||||||||
| Fund | Instrument | Liabilities | Assets and Liabilities | Assets and Liabilities | Instruments | Pledged1 | Amount | |||||||||||||||||||
| Strengthening Dollar 2x Strategy Fund | Swap currency contracts | $ | 4,199 | $ | — | $ | 4,199 | $ | — | $ | — | $ | 4,199 | |||||||||||||
| 1 | Excludes maintenance margin deposits held at the broker related to derivatives. These amounts are reflected as Segregated cash with broker on the Statements of Assets and Liabilities. |
12. Legal Proceedings
Tribune Company
Rydex Variable Trust has been named as a defendant in the case entitled Marc S. Kirscher, as Litigation Trustee for the Tribune Litigation Trust v. FitzSimons, No. 12-2652 (S.D.N.Y.) (formerly Official Committee of Unsecured Creditors of Tribune Co. v. FitzSimons, Adv. Pro. No. 10-54010 (Bankr. D. Del.)) (the “FitzSimons” Action), as a result of the ownership of shares in the Tribune Company (“Tribune”) in 2007 by certain series of the Rydex Variable Trust when Tribune effected a leveraged buyout transaction (“LBO”) by which Tribune converted to a privately-held company. The plaintiff has alleged that, in connection with the LBO, insiders and shareholders were paid for their Tribune stock using financing that the insiders knew would, and ultimately did, leave the Tribune insolvent. The plaintiff has asserted claims against certain insiders, shareholders, professional advisers, and others involved in the LBO, and is attempting to obtain from these individuals and entities the proceeds paid out in connection with the LBO.
Rydex Variable Trust also has been named as a defendant in one or more of a group of lawsuits filed by a group of Tribune creditors that allege state law constructive fraudulent conveyance claims against former Tribune shareholders (the “SLCFC actions”).
The FitzSimons action and the SLCFC actions have been consolidated with the majority of the other Tribune LBO-related lawsuits in a multidistrict litigation proceeding captioned In re Tribune Company Fraudulent Conveyance Litig., No. 11-md-2696 (S.D.N.Y.) (the “MDL Proceeding”). On September 23, 2013, the District Court granted the defendants’ omnibus motion to dismiss the SLCFC actions, on the basis that the creditors lacked standing. On September 30, 2013, the creditors filed a notice of appeal of the September 23 order. On October 28, 2013, the defendants filed a joint notice of cross-appeal of that same order.
On November 20, 2013, the District Court ordered the parties in the FitzSimons action to meet and confer regarding a potential protocol for the briefing and argument of motions to dismiss to be filed in that action. On January 24, 2014, the Court extended the time for service of summonses and complaints in the FitzSimons action to February 28, 2014.
None of these lawsuits allege any wrongdoing on the part of Rydex Variable Trust. The following series of Rydex Variable Trust held shares of Tribune and tendered these shares as part of Tribune’s LBO: Nova Fund, S&P 500 2x Strategy Fund, Multi-Cap Core Equity Fund, S&P 500 Pure Value Fund, Hedged Equity Fund and Multi-Hedge Strategies Fund (the “Funds”). The value of the proceeds received by the foregoing Funds was $12,580, $2,380, $1,360, $148,376, $2,720, and $119,034, respectively. At this stage of the proceedings, Rydex Variable Trust is not able to make a reliable predication as to the outcome of these lawsuits or the effect, if any, on a Fund’s net asset value.
| 94 | the RYDEX FUNDS ANNUAL REPORT |
| NOTES TO FINANCIAL STATEMENTS (concluded) |
Lyondell Chemical Company
In December 2011, Rydex Variable Trust was named as a defendant in Weisfelner, as Trustee of the LB Creditor Trust, v. Fund 1 (In re Lyondell Chemical Co.), Adv. Pro. No. 10-4609 (Bankr. S.D.N.Y.).
Similar to the claims made in the Tribune matter, the Weisfelner complaint seeks to have set aside and recovered as fraudulent transfers from former Lyondell Chemical Company (“Lyondell”) shareholders the consideration paid to them pursuant to the cash out merger of Lyondell shareholders in connection with the combination of Lyondell and Basell AF in 2007. Lyondell filed for bankruptcy in 2008.
On January 14, 2014, the Court granted in part and denied in part the defendants’ motion to dismiss the Creditor Trust action. In particular, the Court dismissed all defendants who were conduits for the proceeds from the merger transaction, and also ruled that the plaintiff could not bring any claims on behalf of certain entities who had ratified the merger transaction. The Court also dismissed without prejudice the plaintiff’s claims for intentional fraudulent transfer against the remaining defendants, and gave the Credit Trustee leave to replead these claims. Finally, the Court denied the motion to dismiss with respect to the plaintiff’s claims for constructive fraudulent transfer against the remaining defendants.
This lawsuit does not allege any wrongdoing on the part of Rydex Variable Trust. The following series of Rydex Variable Trust received cash proceeds from the cash out merger in the following amounts: Basic Materials Fund - $1,235,952; U.S. Long Short Momentum Fund - $523,200; Multi-Cap Core Equity Fund - $5,760; Hedged Equity Fund - $480; and Multi-Hedge Strategies Fund - $112,848. At this stage of the proceedings, Rydex Variable Trust is not able to make a reliable predication as to the outcome of these lawsuits or the effect, if any, on a Fund’s net asset value.
13. Subsequent Event
Effective January 24, 2014, the Strengthening Dollar 2x Strategy Fund underwent a one-for-three reverse share split. The effect of the transaction was to divide the number of outstanding shares of the Fund by three, resulting in a corresponding increase in the net asset value per share. The shares outstanding and the net asset value per share on the statement of assets and liabilities as of December 31, 2013, the share transactions presented in the statement of changes in net assets for each of the two years in the period then ended, and the per share data in the financial highlights for each of the years in the five-year period then ended have been given retroactive effect to reflect this reverse share split. There were no changes in net assets, results of operations or total return as a result of this transaction.
| the RYDEX FUNDS ANNUAL REPORT | 95 |
| REPORT OF INDEPENDENT REGISTERED PUBLIC ACCOUNTING FIRM |
To the Board of Trustees and Shareholders
of Rydex Variable Trust:
We have audited the accompanying statements of assets and liabilities, including the schedules of investments, of S&P 500® Pure Growth Fund, S&P 500® Pure Value Fund, S&P MidCap 400® Pure Growth Fund, S&P MidCap 400® Pure Value Fund, S&P SmallCap 600® Pure Growth Fund, S&P SmallCap 600® Pure Value Fund, Europe 1.25x Strategy Fund, Japan 2x Strategy Fund, Strengthening Dollar 2x Strategy Fund, and Weakening Dollar 2x Strategy Fund (ten of the series constituting the Rydex Variable Trust) (the “Funds”) as of December 31, 2013, and the related statements of operations for the year then ended, the statements of changes in net assets for each of the two years in the period then ended, and the financial highlights for each of the five years in the period then ended. These financial statements and financial highlights are the responsibility of the Funds’ management. Our responsibility is to express an opinion on these financial statements and financial highlights based on our audits.
We conducted our audits in accordance with the standards of the Public Company Accounting Oversight Board (United States). Those standards require that we plan and perform the audit to obtain reasonable assurance about whether the financial statements and financial highlights are free of material misstatement. We were not engaged to perform an audit of the Funds’ internal control over financial reporting. Our audits included consideration of internal control over financial reporting as a basis for designing audit procedures that are appropriate in the circumstances, but not for the purpose of expressing an opinion on the effectiveness of the Funds’ internal control over financial reporting. Accordingly, we express no such opinion. An audit also includes examining, on a test basis, evidence supporting the amounts and disclosures in the financial statements and financial highlights, assessing the accounting principles used and significant estimates made by management, and evaluating the overall financial statement presentation. Our procedures included confirmation of securities owned as of December 31, 2013, by correspondence with the custodian and brokers or by other appropriate auditing procedures where replies from brokers were not received. We believe that our audits provide a reasonable basis for our opinion.
In our opinion, the financial statements and financial highlights referred to above present fairly, in all material respects, the financial position of the above listed Funds at December 31, 2013, the results of their operations for the year then ended, the changes in their net assets for each of the two years in the period then ended, and their financial highlights for each of the five years in the period then ended, in conformity with U.S. generally accepted accounting principles.

McLean, Virginia
February 27, 2014
| 96 | the RYDEX FUNDS ANNUAL REPORT |
| OTHER INFORMATION (Unaudited) |
Tax Information
This information is being provided as required by the Internal Revenue Code. Amounts shown may differ from those elsewhere in the report because of differences in tax and financial reporting practice.
Of the ordinary income distributions paid during the year, the following funds had the corresponding percentages qualify for the dividends received deduction for corporations:
| Fund | % Qualifying | |||
| S&P MidCap 400® Pure Growth Fund | 78.89 | % | ||
| S&P MidCap 400® Pure Value Fund | 100.00 | % | ||
| S&P SmallCap 600® Pure Growth Fund | 7.90 | % | ||
| S&P SmallCap 600® Pure Value Fund | 100.00 | % | ||
With respect to the taxable year ended December 31, 2013, the Funds hereby designate as capital gain dividends the amounts listed below, or, if subsequently determined to be different, the net capital gain of such year:
| S&P MidCap 400® | ||||
| Pure Growth | ||||
| Fund | ||||
| From long-term capital gains, | ||||
| subject to the 15% rate gains category: | $ | 3,204,954 | ||
Proxy Voting Information
A description of the policies and procedures that the Trust uses to determine how to vote proxies relating to securities held in the Funds’ portfolios is available, without charge and upon request, by calling 1.800.820.0888. This information is also available from the EDGAR database on the SEC’s website at http://www.sec.gov.
Information regarding how the Funds voted proxies relating to portfolio securities during the most recent 12-month period ended June 30 is available without charge, upon request, by calling 1.800.820.0888. This information is also available from the EDGAR database on the SEC’s website at http://www.sec.gov.
Quarterly Portfolio Schedules Information
The Trust files its complete schedule of portfolio holdings with the SEC for the first and third quarters of each fiscal year on Form N-Q; which are available on the SEC’s website at http://www.sec.gov. The Funds’ Forms N-Q may be reviewed and copied at the SEC’s Public Reference Room in Washington, DC, and that information on the operation of the Public Reference Room may be obtained by calling 1-800-SEC-0330. Copies of the portfolio holdings are also available to shareholders, without charge and upon request, by calling 1.800.820.0888.
Office Locations
The offices of Guggenheim Investments can be found in the following locations:
330 Madison Avenue
10th Floor
New York, NY 10017
(Headquarters)
Four Irvington Centre
805 King Farm Boulevard
Suite 600
Rockville, MD 20850
9401 Indian Creek Parkway
40 Corporate Woods
Suite 850
Overland Park, KS 66210
| the RYDEX FUNDS ANNUAL REPORT | 97 |
| INFORMATION ON BOARD OF TRUSTEES AND OFFICERS (Unaudited) |
A Board of Trustees oversees the Trust, as well as other trusts of GI, in which its members have no stated term of service, and continue to serve after election until resignation. The Statement of Additional Information includes further information about Fund Trustees and Officers, and can be obtained without charge by calling 800.820.0888.
All Trustees and Officers may be reached c/o Guggenheim Investments, 805 King Farm Boulevard, Suite 600, Rockville, MD 20850.
| TRUSTEE AND OFFICER | ||||
| Name and | Length of Service as Trustee | Number of | ||
| Year of Birth | (Year Began) | Funds Overseen | ||
| Donald C. Cacciapaglia* | Rydex Series Funds – 2012 | 213 | ||
| (1951) | Rydex Variable Trust – 2012 | |||
| Rydex Dynamic Funds – 2012 | ||||
| Rydex ETF Trust – 2012 |
Principal Occupations During Past Five Years: Current: Security Investors, LLC: President and CEO from April 2012 to present; Guggenheim Investments: President and Chief Administrative Officer from February 2010 to present; Previous: Channel Capital Group, Inc.: Chairman and CEO from April 2002 to February 2010
Positions held within the Trust: Trustee from 2012 to present; President from 2012 to present
| INDEPENDENT TRUSTEES | ||||
| Name and | Length of Service as Trustee | Number of | ||
| Year of Birth | (Year Began) | Funds Overseen | ||
| Corey A. Colehour | Rydex Series Funds – 1993 | 132 | ||
| (1945) | Rydex Variable Trust – 1998 | |||
| Rydex Dynamic Funds – 1999 | ||||
| Rydex ETF Trust – 2003 |
Principal Occupations During Past Five Years: Current: Retired; Previous: President and Senior Vice President of Schield Management Company (registered investment adviser) from 2003 to 2006
Positions held within the Trust: Trustee from 1993 to present; Member of the Audit and Governance and Nominating Committees from 1995 to present
| J. Kenneth Dalton | Rydex Series Funds – 1995 | 132 | ||
| (1941) | Rydex Variable Trust – 1998 | |||
| Rydex Dynamic Funds – 1999 | ||||
| Rydex ETF Trust – 2003 |
Principal Occupations During Past Five Years: Current: Retired
Positions held within the Trust: Trustee from 1995 to present; Member and Chairman of the Audit Committee from 1997 to present; Member of the Governance and Nominating Committees from 1995 to present; and Member of the Risk Oversight Committee from 2010 to present
| John O. Demaret | Rydex Series Funds – 1997 | 132 | ||
| (1940) | Rydex Variable Trust – 1998 | |||
| Rydex Dynamic Funds – 1999 | ||||
| Rydex ETF Trust – 2003 |
Principal Occupations During Past Five Years: Current: Retired
Positions held within the Trust: Trustee from 1997 to present; Chairman of the Board from 2006 to present; Member of the Audit Committee from 1997 to present; and Member of the Risk Oversight Committee from 2010 to present
| 98 | the RYDEX FUNDS ANNUAL REPORT |
| INFORMATION ON BOARD OF TRUSTEES AND OFFICERS (Unaudited) (continued) |
| INDEPENDENT TRUSTEES – concluded | ||||
| Name and | Length of Service as Trustee | Number of | ||
| Year of Birth | (Year Began) | Funds Overseen | ||
| Werner E. Keller | Rydex Series Funds – 2005 | 132 | ||
| (1940) | Rydex Variable Trust – 2005 | |||
| Rydex Dynamic Funds – 2005 | ||||
| Rydex ETF Trust – 2005 | ||||
Principal Occupations During Past Five Years: Current: Founder and President of Keller Partners, LLC (investment research firm) from 2005 to present; Previous: Retired from 2001 to 2005
Positions held within the Trust: Vice Chairman of the Board of Trustees from 2010 to present; Trustee and Member of the Audit and Governance and Nominating Committees from 2005 to present; and Chairman and Member of the Risk Oversight Committee from 2010 to present
| Thomas F. Lydon, Jr. | Rydex Series Funds – 2005 | 132 | ||
| (1960) | Rydex Variable Trust – 2005 | |||
| Rydex Dynamic Funds – 2005 | ||||
| Rydex ETF Trust – 2005 |
Principal Occupations During Past Five Years: Current: President of Global Trends Investments (registered investment adviser) from 1996 to present
Positions held within the Trust: Trustee and Member of the Audit and Governance and Nominating Committees from 2005 to present
| Patrick T. McCarville | Rydex Series Funds – 1997 | 132 | ||
| (1942) | Rydex Variable Trust – 1998 | |||
| Rydex Dynamic Funds – 1999 | ||||
| Rydex ETF Trust – 2003 |
Principal Occupations During Past Five Years: Current: Retired; Previous: Chief Executive Officer of Par Industries, Inc., d/b/a Par Leasing from 1977 to 2010
Positions held within the Trust: Trustee from 1997 to present; Member of the Audit Committee from 1997 to present; and Chairman of the Governance and Nominating Committees from 1997 to present
| Roger Somers | Rydex Series Funds – 1993 | 132 | ||
| (1944) | Rydex Variable Trust – 1998 | |||
| Rydex Dynamic Funds – 1999 | ||||
| Rydex ETF Trust – 2003 |
Principal Occupations During Past Five Years: Current: Founder and Chief Executive Officer of Arrow Limousine from 1965 to present
| Positions held within the Trust: Trustee from 1993 to present; Member of the Audit and Governance and Nominating Committees from 1995 to present |
EXECUTIVE OFFICERS
| Name, Position | Principal Occupations | |||||
| and Year of Birth | During Past Five Years | |||||
| Michael P. Byrum* Vice President (1970) | Current: President, Security Benefit Asset Management Holdings, LLC; Senior Vice President, Security Investors, LLC; President & Chief Investment Officer, Rydex Holdings, LLC; Director & Chairman of the Board, Advisor Research Center, Inc.; and Manager, Rydex Specialized Products, LLC | |||||
| Previous: Guggenheim Distributors, LLC (f/k/a Rydex Distributors, LLC), Vice President (2009); Rydex Fund Services, LLC, Director (2009–2010), Secretary (2002–2010); Rydex Advisors, LLC (f/k/a PADCO Advisors, Inc.), Director (2008–2010), Chief Investment Officer (2006–2010), President (2004–2010), Secretary (2002–2010); Rydex Advisors II, LLC (f/k/a PADCO Advisors II, Inc.), Director (2008–2010), Chief Investment Officer (2006–2010), President (2004–2010), Secretary (2002–2010); Advisor Research Center, Inc., Secretary (2006–2009), and Executive Vice President (2006) | ||||||
| the RYDEX FUNDS ANNUAL REPORT | 99 |
| INFORMATION ON BOARD OF TRUSTEES AND OFFICERS (Unaudited) (concluded) |
EXECUTIVE OFFICERS – concluded
| Name, Position | Principal Occupations | |||||
| and Year of Birth | During Past Five Years | |||||
| Nikolaos Bonos* Vice President and Treasurer (1963) | Current: Senior Vice President, Security Investors, LLC; Chief Executive Officer & Manager, Rydex Specialized Products, LLC; Chief Executive Officer & President, Rydex Fund Services, LLC; Vice President, Rydex Holdings, LLC; Treasurer, SBL Fund; Security Equity Fund; Security Income Fund; Security Large Cap Value Fund & Security Mid Cap Growth Fund; and Vice President, Security Benefit Asset Management Holdings, LLC | |||||
| Previous: Security Global Investors, LLC, Senior Vice President (2010–2011); Rydex Advisors, LLC (f/k/a PADCO Advisors, Inc.) Senior Vice President (2006–2011); Rydex Fund Services, LLC (f/k/a Rydex Fund Services, Inc.), Director (2009); and Rydex Specialized Products, LLC, Chief Financial Officer (2005–2009) | ||||||
| Elisabeth Miller* Chief Compliance Officer (1968) | Current: Chief Compliance Officer, Rydex Series Funds, Rydex Dynamic Funds, Rydex Variable Trust, Rydex ETF Trust, Security Equity Fund, Security Income Fund, Security Large Cap Value Fund, Security Mid Cap Growth Fund, SBL Fund, Security Investors, LLC, and Guggenheim Distributors, LLC | |||||
| Previous: Senior Manager, Security Investors, LLC and Guggenheim Distributors, LLC (2004–2009) | ||||||
| Amy J. Lee* Vice President and Secretary (1961) | Current: Secretary and Senior Vice President, Security Investors, LLC (2004–present) | |||||
| Previous: Vice President, Associate General Counsel and Assistant Secretary, Security Benefit Life Insurance Company and Security Benefit Corporation (2004–2012) | ||||||
| Joseph M. Arruda* Assistant Treasurer (1966) | Current: Assistant Treasurer, SBL Fund, Security Equity Fund, Security Income Fund, Security Large Cap Value Fund & Security Mid Cap Growth Fund; Vice President, Security Investors, LLC; and Chief Financial Officer & Manager, Rydex Specialized Products, LLC | |||||
| Previous: Security Global Investors, LLC, Vice President (2010–2011); and Rydex Advisors, LLC (f/k/a PADCO Advisors, Inc.) & Rydex Advisors II, LLC (f/k/a PADCO Advisors II, Inc.), Vice President (2004–2011) | ||||||
| * | Officers of the Funds are deemed to be “interested persons” of the Trust, within the meaning of Section 2(a)(19) of the 1940 Act, inasmuch as this person is affiliated with Guggenheim Investments. |
| 100 | the RYDEX FUNDS ANNUAL REPORT |
| GUGGENHEIM INVESTMENTS PRIVACY POLICIES (Unaudited) |
Rydex Funds, Guggenheim Funds, Rydex Investments, Guggenheim Distributors, LLC, Security Investors, LLC, Security Distributors, Inc. and Rydex Advisory Services (Collectively “Guggenheim Investments”).
Our Commitment to You
When you become a Guggenheim Investments investor, you entrust us with not only your hard-earned money but also with personal and financial information about you. We recognize that your relationship with us is based on trust and that you expect us to act responsibly and in your best interests. Because we have access to this private information about you, we hold ourselves to the highest standards in its safekeeping and use. This means, most importantly, that we do not sell client information to anyone—whether it is your personal information or if you are a current or former Guggenheim Investments client.
The Information We Collect About You
In the course of doing business with shareholders and investors, we collect nonpublic personal information about you. You typically provide personal information when you complete a Guggenheim Investments account application or when you request a transaction that involves Rydex and Guggenheim Investments funds or one of the Guggenheim Investments affiliated companies. “Nonpublic personal information” is personally identifiable private information about you. For example, it includes information regarding your name and address, Social Security or taxpayer identification number, assets, income, account balance, bank account information and investment activity (e.g., purchase and redemption history).
How We Handle Your Personal Information
As emphasized above, we do not sell information about current or former clients or their accounts to third parties. Nor do we share such information, except when necessary to complete transactions at your request or to make you aware of related investment products and services that we offer. Additional details about how we handle your personal information are provided below. To complete certain transactions or account changes that you direct, it may be necessary to provide identifying information to companies, individuals or groups that are not affiliated with Guggenheim Investments. For example, if you ask to transfer assets from another financial institution to Guggenheim Investments, we will need to provide certain information about you to that company to complete the transaction. To alert you to other Guggenheim Investments investment products and services, we may share your information within the Guggenheim Investments family of affiliated companies. This would include, for example, sharing your information within Guggenheim Investments so we can make you aware of new Rydex and Guggenheim Investments funds or the services offered through another Guggenheim Investments affiliated company. In certain instances, we may contract with nonaffiliated companies to perform services for us. Where necessary, we will disclose information we have about you to these third parties. In all such cases, we provide the third party with only the information necessary to carry out its assigned responsibilities and only for that purpose. And we require these third parties to treat your private information with the same high degree of confidentiality that we do. In certain instances, we may share information with other financial institutions regarding individuals and entities in response to the U.S.A. Patriot Act. Finally, we will release information about you if you direct us to do so, if we are compelled by law to do so or in other circumstances permitted by law.
Opt Out Provisions
We do not sell your personal information to anyone. The law allows you to “opt out” of only certain kinds of information sharing with third parties. The firm does not share personal information about you with any third parties that triggers this opt-out right. This means YOU ARE ALREADY OPTED OUT.
How We Protect Privacy Online
Our concern for the privacy of our shareholders also extends to those who use our web site, guggenheiminvestments.com. Our web site uses some of the most secure forms of online communication available, including encryption technology, Secure Socket Layer (SSL) protocol, firewalls and user names and passwords. These technologies provide a high level of security and privacy when you access your account information or initiate online transactions. The Guggenheim Investments web site offers customized features that require our use of “http cookies”—tiny pieces of information that we ask your browser to store. However, we make very limited use of these cookies. We only use cookies for session management and security features on the Guggenheim Investments web site. We do not use them to pull data from your hard drive, to learn your email address, or to view data in cookies created by other web sites. We will not share the information in our cookies or give others access to it. See the legal information area on our web site for more details about web site security and privacy features.
| the RYDEX FUNDS ANNUAL REPORT | 101 |
| GUGGENHEIM INVESTMENTS PRIVACY POLICIES (Unaudited) (concluded) |
How We Safeguard Your Personal Information
We restrict access to nonpublic personal information about shareholders to our employees and in some cases to third parties (for example, the service providers described above) as permitted by law. We maintain strict physical, electronic and procedural safeguards that comply with federal standards to guard your nonpublic personal information.
We’ll Keep You Informed
As required by federal law, we will notify shareholders of our privacy policy annually. We reserve the right to modify this policy at any time, but rest assured that if we do change it, we will tell you promptly. You will also be able to access our privacy policy from our web site at guggenheiminvestments.com. Should you have any questions regarding our privacy policy, contact us at 800.820.0888 or 301.296.5100.
| 102 | the RYDEX FUNDS ANNUAL REPORT |
This page intentionally left blank.
This page intentionally left blank.
This page intentionally left blank.
This page intentionally left blank.
This page intentionally left blank.
This page intentionally left blank.
This page intentionally left blank.
SECTOR FUNDS
BANKING FUND
BASIC MATERIALS FUND
BIOTECHNOLOGY FUND
CONSUMER PRODUCTS FUND
ELECTRONICS FUND
ENERGY FUND
ENERGY SERVICES FUND
FINANCIAL SERVICES FUND
HEALTH CARE FUND
INTERNET FUND
LEISURE FUND
PRECIOUS METALS FUND
REAL ESTATE FUND
RETAILING FUND
TECHNOLOGY FUND
TELECOMMUNICATIONS FUND
TRANSPORTATION FUND
UTILITIES FUND
RVASECF-ANN2-1213x1214
This report and the financial statements contained herein are submitted for the general information of our shareholders. The report is not authorized for distribution to prospective investors unless preceded or accompanied by an effective prospectus.
Distributed by Guggenheim Distributors, LLC.
| TABLE OF CONTENTS |
| THE RYDEX FUNDS ANNUAL REPORT | 1 |
| December 31, 2013 |
Security Investors, LLC (the “Investment Adviser”) is pleased to present the annual shareholder report for 18 of our Funds that are part of the Rydex Variable Trust. This report covers performance of the Funds for the annual period ended December 31, 2013.
The Investment Adviser is a part of Guggenheim Investments, which represents the investment management businesses of Guggenheim Partners, LLC, a global, diversified financial services firm.
Guggenheim Distributors, LLC is the distributor of the Funds. Guggenheim Distributors is affiliated with Guggenheim Partners and Security Investors, LLC.
We encourage you to read the Economic and Market Overview section of the report, which follows this letter, and then the Performance Report and Fund Profile for each Fund.
We are committed to providing innovative investment solutions and appreciate the trust you place in us.
Sincerely,

Donald C. Cacciapaglia
President
January 31, 2014
Read a prospectus and summary prospectus (if available) carefully before investing. It contains the investment objectives, risks, charges, expenses and other information, which should be considered carefully before investing. Obtain a prospectus and summary prospectus (if available) at guggenheiminvestments.com or call 800.820.0888.
Sector funds may not be suitable for all investors. Investing in sector funds is more volatile than investing in broadly diversified funds, as there is a greater risk due to the concentration of the Fund’s holdings in issuers of the same or similar offerings. These Funds are considered non-diversified and can invest a greater portion of their assets in securities of individual issuers than a diversified fund. As a result, changes in the market value of a single security could cause greater fluctuations in the value of fund shares than would occur in a more diversified fund.
| 2 | THE RYDEX FUNDS ANNUAL REPORT |
| ECONOMIC AND MARKET OVERVIEW (Unaudited) | December 31, 2013 |
The year ended December 31, 2013 wound down with a series of stronger-than-expected economic data releases. ISM manufacturing data (historically indicative of expansion or contraction) rose to its highest levels in over two years, consumer confidence rebounded following the government shutdown, housing starts surged, and the job market strengthened. Citing improved labor market conditions and a sustainable economic expansion, the U.S. Federal Reserve (the “Fed”) announced in December that it would reduce its monthly bond purchases by $10 billion, to $75 billion, starting in January 2014. Yet, at the same time, the Fed lengthened the time frame before which it will raise rates by promising to keep the Fed funds target rate at 0-0.25% at least as long as the unemployment rate remains above 6.5% and perhaps “well past” the time this target is reached. For the first time, the Fed also added a lower-bound target for inflation of 2%–lengthening the expected time frame before rates rise.
As the U.S. economy slowly strengthens, we may return to an environment where taking credit risk is not just a consequence of staying within duration targets or reaching for yield, but rather a proactive choice driven by a positive outlook on the economy. To sustain optimism, the Fed will need to monitor the unintended consequences of tapering and avoid negative economic repercussions, as happened in the summer of 2013 when a spike in 10-year Treasury yields dampened home sales. For markets, the Fed must convince investors that the economy is strong enough to withstand steady reductions of its asset purchases. These will likely be Janet Yellen’s top priorities as she takes over the helm of the Fed.
Last January, the global economy faced myriad headwinds, choppiness lay ahead, and we expected plenty of volatility in 2013. Nevertheless, we believed at that point that risk assets were the best choice for investors. Now, the headwinds of 2013 have largely dissipated, and the outlook appears benign for risk assets for the first three to six months of 2014, if not longer.
Many pundits may have underestimated the strength of the U.S. economy, with both third quarter and fourth quarter economic growth beating expectations. The final three months of 2013 were exceptionally good for U.S. equities, which produced a wealth effect that probably boosted holiday sales. All of this bodes well for the first quarter of 2014.
Market conditions could be even stronger in Europe. Economic data from the euro area’s periphery is improving faster than from the core, where inflation is also rising at a faster pace, giving the peripheral nations a competitive advantage. In Asia, markets have priced for a more negative scenario that now appears less likely. With the U.S. and Europe now out of recession, they are ready to underpin a recovery in export growth in the Asian region. As a synchronous global expansion gets under way, investors may become more comfortable with taking risk, and this should be reflected in asset prices in many regions around the globe.
For 2014, investors should bear in mind that the Fed will continue injecting liquidity into financial markets even as it tapers its asset purchases. Assuming that the Fed continues the same pace of reductions at each Federal Open Market Committee meeting, it would still purchase more than $500 billion of bonds in 2014–nearly the size of the Fed’s QE2 from November 2010 to June 2011. This should help support credit spreads. An accelerated pace of tapering from the Fed would signal faster-than-expected economic growth and spark higher demand for risk assets. On balance, we expect the impact of tapering to be neutral. Barring economic weakness, we expect relatively benign market conditions with no major spike in volatility.
For the year ended December 31, 2013, the Standard & Poor’s 500® (“S&P 500”) Index* returned 32.39%. Foreign markets were also strong: the Morgan Stanley Capital International (“MSCI”) Europe-Australasia-Far East (“EAFE”) Index* returned 22.78%. The return of the MSCI Emerging Markets Index* was -2.60%.
In the bond market, the Barclays U.S. Aggregate Bond Index* posted a -2.02% return for the period, while the Barclays U.S. High Yield Index* returned 7.44%. The return of the Bank of America Merrill Lynch 3-Month U.S. Treasury Bill Index* was 0.07% for the 12-month period.
The opinions and forecasts expressed may not actually come to pass. This information is subject to change at any time, based on market and other conditions, and should not be construed as a recommendation of any specific security or strategy.
| THE RYDEX FUNDS ANNUAL REPORT | 3 |
| ECONOMIC AND MARKET OVERVIEW (Unaudited) (continued) | December 31, 2013 |
*Index Definitions:
The following indices are referenced throughout this report. Indices are unmanaged and not available for direct investment. Index performance does not reflect transaction costs, fees, or expenses.
Barclays U.S. Aggregate Bond Index is a broad-based benchmark that measures the investment grade, U.S. dollar denominated, fixed-rate taxable bond market, including U.S. Treasuries, government-related and corporate securities, MBS (agency fixed-rate and hybrid ARM pass-throughs), ABS, and CMBS.
Barclays U.S. High Yield Index measures the market of USD-denominated, non-investment grade, fixed-rate, taxable corporate bonds. Securities are classified as high yield if the middle rating of Moody’s, Fitch, and S&P is Ba1/BB +/BB + or below.
Bank of America Merrill Lynch 3-Month U.S. Treasury Bill Index is an unmanaged market index of U.S. Treasury securities maturing in 90 days that assumes reinvestment of all income.
MSCI EAFE Index is a free float-adjusted market capitalization index that is designed to measure the equity market performance of developed markets, excluding the U.S. & Canada.
MSCI Emerging Markets Index is a free float-adjusted market capitalization weighted index that is designed to measure equity market performance in the global emerging markets.
MSCI U.S. REIT Index is a free float market capitalization weighted index that is comprised of equity real estate investment trust (“REIT”) securities that belong to the MSCI U.S. Investable Market 2500 Index. The MSCI U.S. REIT Index includes only REIT securities that are of reasonable size in terms of full and free float-adjusted market capitalization to ensure that the performance of the equity REIT universe can be captured and replicated in actual institutional and retail portfolios of different sizes.
S&P 500® Index is a capitalization-weighted index of 500 stocks designed to measure the performance of the broad economy, representing all major industries and is considered a representation of the U.S. stock market.
S&P 500® Consumer Discretionary Index is a sub-index of the S&P 500® Index, a capitalization-weighted index covering 500 industrial, utility, transportation and financial companies of the U.S. markets (mostly NYSE Euronext issues). The Consumer Discretionary index includes companies in the following industries: automobiles and components, consumer durables, apparel, hotels, restaurants, leisure, media and retailing.
S&P 500® Consumer Staples Index is a sub-index of the S&P 500® Index, a capitalization-weighted index covering 500 industrial, utility, transportation and financial companies of the U.S. markets (mostly NYSE Euronext issues). The Consumer Staples index comprises companies whose businesses are less sensitive to economic cycles. It includes manufacturers and distributors of food, beverages and tobacco and producers of non-durable household goods and personal products. It also includes food & drug retailing companies as well as hypermarkets and consumer super centers.
S&P 500® Energy Index is a sub-index of the S&P 500® Index, a capitalization-weighted index covering 500 industrial, utility, transportation and financial companies of the U.S. markets (mostly NYSE Euronext issues). The Energy index comprises companies whose businesses are dominated by either of the following activities: The construction or provision of oil rigs, drilling equipment and other energy-related equipment and services, including seismic data collection; companies engaged in the exploration, production, marketing, refining and/or transportation of oil and gas products, coal and other consumable fuels.
S&P 500® Financials Index is a sub-index of the S&P 500® Index, a capitalization-weighted index covering 500 industrial, utility, transportation and financial companies of the U.S. markets (mostly NYSE Euronext issues). The Financials index contains companies involved in activities such as banking, mortgage finance, consumer finance, specialized finance, investment banking and brokerage, asset management and custody, corporate lending, insurance, and financial investment, and real estate, including REITs.
S&P 500® Health Care Index is a sub-index of the S&P 500® Index, a capitalization-weighted index covering 500 industrial, utility, transportation and financial companies of the U.S. markets (mostly NYSE Euronext issues). The Health Care index encompasses two main industry groups. The first includes companies who manufacture health care equipment and supplies or provide health care related services, including distributors of health care products, providers of basic health-care services, and owners and operators of health care facilities and organizations. The first group also includes companies operating in the health care technology industry. The second group includes companies primarily involved in the research, development, production and marketing of pharmaceuticals, biotechnology and life sciences products.
S&P 500® Industrials Index is a sub-index of the S&P 500® Index, a capitalization-weighted index covering 500 industrial, utility, transportation and financial companies of the U.S. markets (mostly NYSE Euronext issues). The Industrials index includes companies whose businesses are dominated by one of the following activities: the manufacture and distribution of capital goods, including aerospace & defense, construction, engineering & building products, electrical equipment and industrial machinery; the provision of commercial services and supplies, including printing, environmental, office and security services; the provision of professional services, including employment and research & consulting services; or the provision of transportation services, including airlines, couriers, marine, road & rail and transportation infrastructure.
S&P 500® Materials Index is a sub-index of the S&P 500® Index, a capitalization-weighted index covering 500 industrial, utility, transportation and financial companies of the U.S. markets (mostly NYSE Euronext issues). The Materials index encompasses a wide range of commodity-related manufacturing industries. Included in this sector are companies that manufacture chemicals, construction materials, glass, paper, forest products and related packaging products, and metals, minerals and mining companies, including producers of steel.
S&P 500® Information Technology Index is a sub-index of the S&P 500® Index, a capitalization-weighted index covering 500 industrial, utility, transportation and financial companies of the U.S. markets (mostly NYSE Euronext issues). The Information Technology index covers the following general areas: Technology software & services, including companies that primarily develop software in various fields such as the Internet, applications, systems, databases management and/or home entertainment, and companies that provide information technology consulting and services, as well as data processing and outsourced services; secondly, Technology Hardware & Equipment, including manufacturers and distributors of communications equipment, computers & peripherals, electronic equipment and related instruments; and thirdly, Semiconductors & Semiconductor Equipment Manufacturers.
| 4 | THE RYDEX FUNDS ANNUAL REPORT |
| ECONOMIC AND MARKET OVERVIEW (Unaudited) (concluded) | December 31, 2013 |
S&P 500® Telecommunications Services Index is a sub-index of the S&P 500® Index, a capitalization-weighted index covering 500 industrial, utility, transportation and financial companies of the U.S. markets (mostly NYSE Euronext issues). The Telecommunications Services index contains companies that provide communications services primarily through a fixed-line, cellular, wireless, high bandwidth and/or fiber optic cable network.
S&P 500® Utilities Index is a sub-index of the S&P 500® Index, a capitalization-weighted index covering 500 industrial, utility, transportation and financial companies of the U.S. markets (mostly NYSE Euronext issues). The Utilities index encompasses those companies considered electric, gas or water utilities, or companies that operate as independent producers and/or distributors of power.
| THE RYDEX FUNDS ANNUAL REPORT | 5 |
| ABOUT SHAREHOLDERS’ FUND EXPENSES (Unaudited) |
All mutual funds have operating expenses and it is important for our shareholders to understand the impact of costs on their investments. Shareholders of a Fund incur two types of costs: (i) transaction costs, including sales charges (loads) on purchase payments, reinvested dividends, or other distributions; and exchange fees; and (ii) ongoing costs, including management fees, administrative services, and shareholder reports, among others. These ongoing costs, or operating expenses, are deducted from a fund’s gross income and reduce the investment return of the fund.
A fund’s expenses are expressed as a percentage of its average net assets, which is known as the expense ratio. The following examples are intended to help investors understand the ongoing costs (in dollars) of investing in a Fund and to compare these costs with the ongoing costs of investing in other mutual funds.
The examples are based on an investment of $1,000 made at the beginning of the period and held for the entire six-month period beginning June 30, 2013 and ending December 31, 2013.
The following tables illustrate a Fund’s costs in two ways:
Table 1. Based on actual Fund return. This section helps investors estimate the actual expenses paid over the period. The “Ending Account Value” shown is derived from the Fund’s actual return, and the fourth column shows the dollar amount that would have been paid by an investor who started with $1,000 in the Fund. Investors may use the information here, together with the amount invested, to estimate the expenses paid over the period. Simply divide the Fund’s account value by $1,000 (for example, an $8,600 account value divided by $1,000 = 8.6), then multiply the result by the number provided under the heading “Expenses Paid During Period.”
Table 2. Based on hypothetical 5% return. This section is intended to help investors compare a Fund’s cost with those of other mutual funds. The table provides information about hypothetical account values and hypothetical expenses based on the Fund’s actual expense ratio and an assumed rate of return of 5% per year before expenses, which is not the Fund’s actual return. The hypothetical account values and expenses may not be used to estimate the actual ending account balance or expenses paid during the period. The example is useful in making comparisons because the U.S. Securities and Exchange Commission (the “SEC”) requires all mutual funds to calculate expenses based on the 5% return. Investors can assess a Fund’s costs by comparing this hypothetical example with the hypothetical examples that appear in shareholder reports of other funds.
The calculations illustrated above assume no shares were bought or sold during the period. Actual costs may have been higher or lower, depending on the amount of investment and the timing of any purchases or redemptions.
Please note that the expenses shown in the table are meant to highlight your ongoing costs only and do not reflect any transactional costs, such as sales charges (loads) on purchase payments, and contingent deferred sales charges (“CDSC”) on redemptions, if any. Therefore, the second table is useful in comparing ongoing costs only, and will not help you determine the relative total costs of owning different funds. In addition, if these transactional costs were included, your costs would have been higher.
More information about a Fund’s expenses, including annual expense ratios for the past five years, can be found in the Financial Highlights section of this report. For additional information on operating expenses and other shareholder costs, please refer to the appropriate Fund prospectus.
| 6 | THE RYDEX FUNDS ANNUAL REPORT |
| ABOUT SHAREHOLDERS’ FUND EXPENSES (Unaudited) (concluded) |
| Beginning | Ending | Expenses | ||||||||||||||||||
| Expense | Fund | Account Value | Account Value | Paid During | ||||||||||||||||
| Ratio1 | Return | June 30, 2013 | December 31, 2013 | Period2 | ||||||||||||||||
| Table 1. Based on actual Fund return3 | ||||||||||||||||||||
| Banking Fund | 1.62 | % | 14.87 | % | $ | 1,000.00 | $ | 1,148.70 | $ | 8.77 | ||||||||||
| Basic Materials Fund | 1.62 | % | 15.36 | % | 1,000.00 | 1,153.60 | 8.79 | |||||||||||||
| Biotechnology Fund | 1.62 | % | 23.84 | % | 1,000.00 | 1,238.40 | 9.14 | |||||||||||||
| Consumer Products Fund | 1.62 | % | 10.02 | % | 1,000.00 | 1,100.20 | 8.58 | |||||||||||||
| Electronics Fund | 1.62 | % | 16.31 | % | 1,000.00 | 1,163.10 | 8.83 | |||||||||||||
| Energy Fund | 1.62 | % | 14.12 | % | 1,000.00 | 1,141.20 | 8.74 | |||||||||||||
| Energy Services Fund | 1.62 | % | 11.48 | % | 1,000.00 | 1,114.80 | 8.64 | |||||||||||||
| Financial Services Fund | 1.62 | % | 10.93 | % | 1,000.00 | 1,109.30 | 8.61 | |||||||||||||
| Health Care Fund | 1.62 | % | 18.57 | % | 1,000.00 | 1,185.70 | 8.92 | |||||||||||||
| Internet Fund | 1.61 | % | 31.06 | % | 1,000.00 | 1,310.60 | 9.38 | |||||||||||||
| Leisure Fund | 1.62 | % | 20.35 | % | 1,000.00 | 1,203.50 | 9.00 | |||||||||||||
| Precious Metals Fund | 1.52 | % | (4.58 | %) | 1,000.00 | 954.20 | 7.49 | |||||||||||||
| Real Estate Fund | 1.62 | % | (1.54 | %) | 1,000.00 | 984.60 | 8.10 | |||||||||||||
| Retailing Fund | 1.62 | % | 15.24 | % | 1,000.00 | 1,152.40 | 8.79 | |||||||||||||
| Technology Fund | 1.62 | % | 23.85 | % | 1,000.00 | 1,238.50 | 9.14 | |||||||||||||
| Telecommunications Fund | 1.62 | % | 12.33 | % | 1,000.00 | 1,123.30 | 8.67 | |||||||||||||
| Transportation Fund | 1.62 | % | 22.98 | % | 1,000.00 | 1,229.80 | 9.10 | |||||||||||||
| Utilities Fund | 1.62 | % | 2.92 | % | 1,000.00 | 1,029.20 | 8.29 | |||||||||||||
| Table 2. Based on hypothetical 5% return (before expenses) | ||||||||||||||||||||
| Banking Fund | 1.62 | % | 5.00 | % | $ | 1,000.00 | $ | 1,017.04 | $ | 8.24 | ||||||||||
| Basic Materials Fund | 1.62 | % | 5.00 | % | 1,000.00 | 1,017.04 | 8.24 | |||||||||||||
| Biotechnology Fund | 1.62 | % | 5.00 | % | 1,000.00 | 1,017.04 | 8.24 | |||||||||||||
| Consumer Products Fund | 1.62 | % | 5.00 | % | 1,000.00 | 1,017.04 | 8.24 | |||||||||||||
| Electronics Fund | 1.62 | % | 5.00 | % | 1,000.00 | 1,017.04 | 8.24 | |||||||||||||
| Energy Fund | 1.62 | % | 5.00 | % | 1,000.00 | 1,017.04 | 8.24 | |||||||||||||
| Energy Services Fund | 1.62 | % | 5.00 | % | 1,000.00 | 1,017.04 | 8.24 | |||||||||||||
| Financial Services Fund | 1.62 | % | 5.00 | % | 1,000.00 | 1,017.04 | 8.24 | |||||||||||||
| Health Care Fund | 1.62 | % | 5.00 | % | 1,000.00 | 1,017.04 | 8.24 | |||||||||||||
| Internet Fund | 1.61 | % | 5.00 | % | 1,000.00 | 1,017.09 | 8.19 | |||||||||||||
| Leisure Fund | 1.62 | % | 5.00 | % | 1,000.00 | 1,017.04 | 8.24 | |||||||||||||
| Precious Metals Fund | 1.52 | % | 5.00 | % | 1,000.00 | 1,017.54 | 7.73 | |||||||||||||
| Real Estate Fund | 1.62 | % | 5.00 | % | 1,000.00 | 1,017.04 | 8.24 | |||||||||||||
| Retailing Fund | 1.62 | % | 5.00 | % | 1,000.00 | 1,017.04 | 8.24 | |||||||||||||
| Technology Fund | 1.62 | % | 5.00 | % | 1,000.00 | 1,017.04 | 8.24 | |||||||||||||
| Telecommunications Fund | 1.62 | % | 5.00 | % | 1,000.00 | 1,017.04 | 8.24 | |||||||||||||
| Transportation Fund | 1.62 | % | 5.00 | % | 1,000.00 | 1,017.04 | 8.24 | |||||||||||||
| Utilities Fund | 1.62 | % | 5.00 | % | 1,000.00 | 1,017.04 | 8.24 | |||||||||||||
| 1 | Annualized. |
| 2 | Expenses are equal to the Fund’s annualized expense ratio, net of any applicable fee waivers, multiplied by the average account value over the period, multiplied by 184/365 (to reflect the one-half year period). Expenses shown do not include fees charged by insurance companies. |
| 3 | Actual cumulative return at net asset value for the period June 30, 2013 to December 31, 2013. |
| THE RYDEX FUNDS ANNUAL REPORT | 7 |
| PERFORMANCE REPORT AND FUND PROFILE (Unaudited) | December 31, 2013 |
OBJECTIVE: Seeks to provide capital appreciation by investing in companies that are involved in the banking sector, including commercial banks (and their holding companies) and savings and loan institutions (“Banking Companies”).
For the year ended December 31, 2013, Banking Fund returned 29.18% compared with the S&P 500 Index, which gained 32.39%. The S&P 500 Financials Index returned 35.63%.
Within the sector, all industries contributed to return. The largest component of the Fund, commercial banks, accounted for most of the positive performance, followed by diversified financial services. The consumer finance group contributed least to return.
JP Morgan Chase & Co., Wells Fargo & Co. and Citigroup, Inc. were the best-performing holdings in the Fund for the year. The worst-performing holdings for the period were Bancolombia S.A., Banco Bradesco S.A. and Banco Santander S.A.
Performance displayed represents past performance, which is no guarantee of future results.
Holdings Diversification (Market Exposure as % of Net Assets)
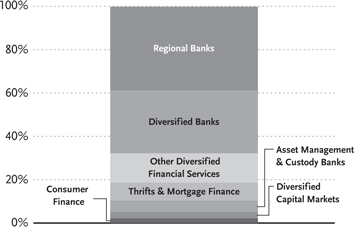
“Holdings Diversification (Market Exposure as % of Net Assets)” excludes any temporary cash investments.
Inception Date: May 2, 2001
| Ten Largest Holdings (% of Total Net Assets) | ||||
| JPMorgan Chase & Co. | 4.0 | % | ||
| Wells Fargo & Co. | 3.9 | % | ||
| Citigroup, Inc. | 3.9 | % | ||
| Bank of America Corp. | 3.9 | % | ||
| U.S. Bancorp | 2.8 | % | ||
| Capital One Financial Corp. | 2.2 | % | ||
| PNC Financial Services Group, Inc. | 2.1 | % | ||
| Bank of New York Mellon Corp. | 2.1 | % | ||
| State Street Corp. | 1.9 | % | ||
| BB&T Corp. | 1.7 | % | ||
| Top Ten Total | 28.5 | % | ||
“Ten Largest Holdings” exclude any temporary cash or derivative investments.
| 8 | THE RYDEX FUNDS ANNUAL REPORT |
| PERFORMANCE REPORT AND FUND PROFILE (Unaudited) (concluded) |
Cumulative Fund Performance*,†

Average Annual Returns
Periods Ended December 31, 2013*,†
| 1 Year | 5 Year | 10 Year | ||||||||||
| Banking Fund | 29.18 | % | 6.38 | % | -3.16 | % | ||||||
| S&P 500 Financials Index | 35.63 | % | 13.75 | % | -0.26 | % | ||||||
| S&P 500 Index | 32.39 | % | 17.94 | % | 7.41 | % | ||||||
| * | The performance data above represents past performance that is not predictive of future results. The investment return and principal value of an investment in the Fund will fluctuate so that an investor’s shares, when redeemed, may be worth more or less than their original cost. Returns are historical and include changes in principal and reinvested dividends and capital gains and do not reflect the effect of taxes. The S&P 500 Index and the S&P 500 Financials Index are unmanaged indices and, unlike the Fund, have no management fees or operating expenses to reduce their reported returns. |
| † | Returns do not reflect the impact of any additional fees charged by insurance companies. |
| THE RYDEX FUNDS ANNUAL REPORT | 9 |
| SCHEDULE OF INVESTMENTS | December 31, 2013 |
| BANKING FUND | |
| Shares | Value | |||||||
| COMMON STOCKS† - 99.8% | ||||||||
| REGIONAL BANKS - 38.6% | ||||||||
| PNC Financial Services Group, Inc. | 1,642 | $ | 127,385 | |||||
| BB&T Corp. | 2,696 | 100,614 | ||||||
| SunTrust Banks, Inc. | 2,360 | 86,871 | ||||||
| Fifth Third Bancorp | 3,995 | 84,015 | ||||||
| M&T Bank Corp. | 665 | 77,419 | ||||||
| Regions Financial Corp. | 7,420 | 73,384 | ||||||
| KeyCorp | 5,043 | 67,677 | ||||||
| CIT Group, Inc. | 1,223 | 63,755 | ||||||
| Huntington Bancshares, Inc. | 5,728 | 55,275 | ||||||
| Popular, Inc.* | 1,899 | 54,558 | ||||||
| First Republic Bank | 984 | 51,512 | ||||||
| Zions Bancorporation | 1,555 | 46,588 | ||||||
| Signature Bank* | 411 | 44,150 | ||||||
| East West Bancorp, Inc. | 1,238 | 43,293 | ||||||
| SVB Financial Group* | 405 | 42,468 | ||||||
| Cullen/Frost Bankers, Inc. | 562 | 41,830 | ||||||
| Commerce Bancshares, Inc. | 914 | 41,041 | ||||||
| City National Corp. | 515 | 40,798 | ||||||
| Prosperity Bancshares, Inc. | 630 | 39,936 | ||||||
| First Niagara Financial Group, Inc. | 3,646 | 38,721 | ||||||
| FirstMerit Corp. | 1,712 | 38,058 | ||||||
| BankUnited, Inc. | 1,090 | 35,883 | ||||||
| Hancock Holding Co. | 929 | 34,076 | ||||||
| Webster Financial Corp. | 1,070 | 33,363 | ||||||
| Associated Banc-Corp. | 1,898 | 33,025 | ||||||
| UMB Financial Corp. | 510 | 32,783 | ||||||
| CapitalSource, Inc. | 2,281 | 32,778 | ||||||
| First Horizon National Corp. | 2,800 | 32,620 | ||||||
| TCF Financial Corp. | 1,982 | 32,208 | ||||||
| Bank of Hawaii Corp. | 541 | 31,995 | ||||||
| Fulton Financial Corp. | 2,378 | 31,104 | ||||||
| Texas Capital Bancshares, Inc.* | 497 | 30,913 | ||||||
| Susquehanna Bancshares, Inc. | 2,390 | 30,688 | ||||||
| BancorpSouth, Inc. | 1,184 | 30,097 | ||||||
| PrivateBancorp, Inc. | 1,029 | 29,769 | ||||||
| Home BancShares, Inc. | 790 | 29,507 | ||||||
| Wintrust Financial Corp. | 634 | 29,240 | ||||||
| Glacier Bancorp, Inc. | 980 | 29,194 | ||||||
| Bank of the Ozarks, Inc. | 510 | 28,861 | ||||||
| Umpqua Holdings Corp. | 1,500 | 28,710 | ||||||
| Sterling Financial Corp. | 840 | 28,627 | ||||||
| Cathay General Bancorp | 1,070 | 28,601 | ||||||
| First Financial Bankshares, Inc. | 430 | 28,518 | ||||||
| Valley National Bancorp1 | 2,791 | 28,245 | ||||||
| Western Alliance Bancorporation* | 1,180 | 28,155 | ||||||
| FNB Corp. | 2,229 | 28,130 | ||||||
| National Penn Bancshares, Inc. | 2,436 | 27,600 | ||||||
| IBERIABANK Corp. | 428 | 26,900 | ||||||
| MB Financial, Inc. | 830 | 26,635 | ||||||
| PacWest Bancorp | 630 | 26,599 | ||||||
| Trustmark Corp. | 970 | 26,035 | ||||||
| CVB Financial Corp. | 1,520 | 25,946 | ||||||
| United Bankshares, Inc. | 780 | 24,531 | ||||||
| Old National Bancorp | 1,580 | 24,285 | ||||||
| Westamerica Bancorporation | 430 | 24,278 | ||||||
| Columbia Banking System, Inc. | 840 | 23,108 | ||||||
| BBCN Bancorp, Inc. | 1,360 | 22,562 | ||||||
| Total Regional Banks | 2,304,917 | |||||||
| DIVERSIFIED BANKS - 29.0% | ||||||||
| Wells Fargo & Co. | 5,146 | 233,627 | ||||||
| U.S. Bancorp | 4,143 | 167,377 | ||||||
| Itau Unibanco Holding S.A. ADR | 5,200 | 70,564 | ||||||
| Banco Bradesco S.A. ADR | 5,010 | 62,775 | ||||||
| ICICI Bank Ltd. ADR | 1,669 | 62,037 | ||||||
| Barclays plc ADR | 3,248 | 58,886 | ||||||
| HSBC Holdings plc ADR | 1,063 | 58,603 | ||||||
| Comerica, Inc. | 1,215 | 57,761 | ||||||
| Credicorp Ltd. | 435 | 57,738 | ||||||
| Banco Santander S.A. ADR | 6,243 | 56,624 | ||||||
| HDFC Bank Ltd. ADR | 1,625 | 55,965 | ||||||
| Bank of Nova Scotia | 890 | 55,670 | ||||||
| Toronto-Dominion Bank | 584 | 55,036 | ||||||
| Royal Bank of Canada | 813 | 54,658 | ||||||
| Banco Santander Brasil S.A. ADR | 8,720 | 53,192 | ||||||
| Royal Bank of Scotland Group plc ADR* | 4,660 | 52,798 | ||||||
| Mitsubishi UFJ Financial Group, Inc. ADR | 7,877 | 52,618 | ||||||
| Bank of Montreal | 789 | 52,595 | ||||||
| Banco Bilbao Vizcaya Argentaria S.A. ADR | 4,243 | 52,571 | ||||||
| Lloyds Banking Group plc ADR* | 9,830 | 52,296 | ||||||
| Sumitomo Mitsui Financial Group, | ||||||||
| Inc. ADR | 4,950 | 51,926 | ||||||
| Bancolombia S.A. ADR | 1,055 | 51,716 | ||||||
| Canadian Imperial Bank of Commerce | 604 | 51,588 | ||||||
| Banco Santander Chile ADR | 2,175 | 51,265 | ||||||
| National Bank of Greece S.A. ADR1 | 8,800 | 49,280 | ||||||
| Grupo Financiero Santander Mexico | ||||||||
| SAB de CV ADR | 3,610 | 49,240 | ||||||
| Total Diversified Banks | 1,728,406 | |||||||
| OTHER DIVERSIFIED FINANCIAL SERVICES - 13.6% | ||||||||
| JPMorgan Chase & Co. | 4,048 | 236,727 | ||||||
| Citigroup, Inc. | 4,480 | 233,453 | ||||||
| Bank of America Corp. | 14,800 | 230,436 | ||||||
| ING US, Inc. | 1,640 | 57,646 | ||||||
| ING Groep N.V. ADR* | 3,867 | 54,177 | ||||||
| Total Other Diversified Financial Services | 812,439 | |||||||
| 10 | THE RYDEX FUNDS ANNUAL REPORT | SEE NOTES TO FINANCIAL STATEMENTS. |
| SCHEDULE OF INVESTMENTS (concluded) | December 31, 2013 |
| BANKING FUND | |
| Shares | Value | |||||||
| THRIFTS & MORTGAGE FINANCE - 8.3% | ||||||||
| New York Community Bancorp, Inc. | 3,216 | $ | 54,189 | |||||
| Ocwen Financial Corp.* | 960 | 53,231 | ||||||
| Home Loan Servicing Solutions Ltd. | 2,146 | 49,294 | ||||||
| Hudson City Bancorp, Inc. | 4,718 | 44,491 | ||||||
| People’s United Financial, Inc. | 2,884 | 43,606 | ||||||
| Nationstar Mortgage Holdings, Inc.* | 925 | 34,188 | ||||||
| MGIC Investment Corp.* | 3,920 | 33,085 | ||||||
| Radian Group, Inc. | 2,210 | 31,205 | ||||||
| Washington Federal, Inc. | 1,290 | 30,044 | ||||||
| EverBank Financial Corp. | 1,600 | 29,344 | ||||||
| Capitol Federal Financial, Inc. | 2,132 | 25,819 | ||||||
| Astoria Financial Corp. | 1,671 | 23,110 | ||||||
| Northwest Bancshares, Inc. | 1,560 | 23,057 | ||||||
| BofI Holding, Inc.* | 260 | 20,392 | ||||||
| Total Thrifts & Mortgage Finance | 495,055 | |||||||
| ASSET MANAGEMENT & CUSTODY BANKS - 5.3% | ||||||||
| Bank of New York Mellon Corp. | 3,587 | 125,329 | ||||||
| State Street Corp. | 1,530 | 112,287 | ||||||
| Northern Trust Corp. | 1,230 | 76,125 | ||||||
| Total Asset Management & Custody Banks | 313,741 | |||||||
| DIVERSIFIED CAPITAL MARKETS - 2.8% | ||||||||
| Deutsche Bank AG | 1,175 | 56,682 | ||||||
| UBS AG | 2,888 | 55,594 | ||||||
| Credit Suisse Group AG ADR | 1,751 | 54,351 | ||||||
| Total Diversified Capital Markets | 166,627 | |||||||
| CONSUMER FINANCE - 2.2% | ||||||||
| Capital One Financial Corp. | 1,730 | 132,535 | ||||||
| Total Common Stocks | ||||||||
| (Cost $3,854,236) | 5,953,720 | |||||||
| Face Amount | Value | |||||||
| REPURCHASE AGREEMENT††,2 - 0.3% | ||||||||
| Credit Suisse Group | ||||||||
| issued 12/31/13 at 0.00% | ||||||||
| due 01/02/14 | $ | 17,108 | $ | 17,108 | ||||
| Total Repurchase Agreement | ||||||||
| (Cost $17,108) | 17,108 | |||||||
| SECURITIES LENDING COLLATERAL††,3 - 0.6% | ||||||||
| Repurchase Agreements | ||||||||
| HSBC Securities, Inc. | ||||||||
| issued 12/31/13 at 0.01% | ||||||||
| due 01/02/14 | 29,807 | 29,807 | ||||||
| Deutsche Bank Securities, Inc. | ||||||||
| issued 12/31/13 at 0.02% | ||||||||
| due 01/02/14 | 4,393 | 4,393 | ||||||
| Total Securities Lending Collateral | ||||||||
| (Cost $34,200) | 34,200 | |||||||
| Total Investments - 100.7% | ||||||||
| (Cost $3,905,544) | $ | 6,005,028 | ||||||
| Other Assets & Liabilities, net - (0.7)% | (38,978 | ) | ||||||
| Total Net Assets - 100.0% | $ | 5,966,050 | ||||||
| * | Non-income producing security. |
| † | Value determined based on Level 1 inputs — See Note 4. |
| †† | Value determined based on Level 2 inputs — See Note 4. |
| 1 | All or portion of this security is on loan at December 31, 2013 — See Note 8. |
| 2 | Repurchase Agreement — See Note 5. |
| 3 | Securities lending collateral — See Note 8. |
ADR — American Depository Receipt
plc — Public Limited Company
| SEE NOTES TO FINANCIAL STATEMENTS. | THE RYDEX FUNDS ANNUAL REPORT | 11 |
| BANKING FUND |
| STATEMENT OF ASSETS |
| AND LIABILITIES |
December 31, 2013
| Assets: | ||||
| Investments, at value - including $50,568 of securities loaned | ||||
| (cost $3,854,236) | $ | 5,953,720 | ||
| Repurchase agreements, at value | ||||
| (cost $51,308) | 51,308 | |||
| Total investments | ||||
| (cost $3,905,544) | 6,005,028 | |||
| Receivables: | ||||
| Dividends | 11,526 | |||
| Fund shares sold | 1,941 | |||
| Foreign taxes reclaim | 45 | |||
| Interest and securities lending income | 3 | |||
| Total assets | 6,018,543 | |||
| Liabilities: | ||||
| Payable for: | ||||
| Upon return of securities loaned | 34,200 | |||
| Management fees | 4,206 | |||
| Transfer agent and administrative fees | 1,237 | |||
| Investor service fees | 1,237 | |||
| Portfolio accounting fees | 495 | |||
| Fund shares redeemed | 300 | |||
| Miscellaneous | 10,818 | |||
| Total liabilities | 52,493 | |||
| Net assets | $ | 5,966,050 | ||
| Net assets consist of: | ||||
| Paid in capital | $ | 5,880,478 | ||
| Undistributed net investment income | 55,167 | |||
| Accumulated net realized loss on investments | (2,069,079 | ) | ||
| Net unrealized appreciation on investments | 2,099,484 | |||
| Net assets | $ | 5,966,050 | ||
| Capital shares outstanding | 412,327 | |||
| Net asset value per share | $ | 14.47 |
| STATEMENT OF |
| OPERATIONS |
Year Ended December 31, 2013
| Investment Income: | ||||
| Dividends (net of foreign withholding tax of $3,767) | $ | 156,422 | ||
| Income from securities lending, net | 203 | |||
| Interest | 14 | |||
| Total investment income | 156,639 | |||
| Expenses: | ||||
| Management fees | 61,690 | |||
| Transfer agent and administrative fees | 18,144 | |||
| Investor service fees | 18,144 | |||
| Portfolio accounting fees | 7,258 | |||
| Professional fees | 6,994 | |||
| Trustees’ fees* | 864 | |||
| Custodian fees | 802 | |||
| Line of credit interest expense | 83 | |||
| Miscellaneous | 5,250 | |||
| Total expenses | 119,229 | |||
| Net investment income | 37,410 | |||
| Net Realized and Unrealized Gain (Loss): | ||||
| Net realized gain (loss) on: | ||||
| Investments | 1,168,912 | |||
| Net realized gain | 1,168,912 | |||
| Net change in unrealized appreciation (depreciation) on: | ||||
| Investments | 488,365 | |||
| Net change in unrealized appreciation (depreciation) | 488,365 | |||
| Net realized and unrealized gain | 1,657,277 | |||
| Net increase in net assets resulting from operations | $ | 1,694,687 |
* Relates to Trustees not deemed “interested persons” within the meaning of Section 2(a)(19) of the 1940 Act.
12 | the RYDEX FUNDS ANNUAL REPORT | See Notes to Financial Statements. |
| BANKING FUND |
| STATEMENTS OF CHANGES IN NET ASSETS |
| Year Ended | Year Ended | |||||||
| December 31, | December 31, | |||||||
| 2013 | 2012 | |||||||
| Increase (Decrease) In Net Assets From Operations: | ||||||||
| Net investment income | $ | 37,410 | $ | 62,968 | ||||
| Net realized gain (loss) on investments | 1,168,912 | (297,522 | ) | |||||
| Net change in unrealized appreciation (depreciation) on investments | 488,365 | 1,126,167 | ||||||
| Net increase in net assets resulting from operations | 1,694,687 | 891,613 | ||||||
| Distributions to shareholders from: | ||||||||
| Net investment income | (62,968 | ) | (18,625 | ) | ||||
| Net realized gains | (817,462 | ) | (11,241 | ) | ||||
| Total distributions to shareholders | (880,430 | ) | (29,866 | ) | ||||
| Capital share transactions: | ||||||||
| Proceeds from sale of shares | 32,022,110 | 46,027,046 | ||||||
| Distributions reinvested | 880,430 | 29,866 | ||||||
| Cost of shares redeemed | (38,470,692 | ) | (38,793,749 | ) | ||||
| Net increase (decrease) from capital share transactions | (5,568,152 | ) | 7,263,163 | |||||
| Net increase (decrease) in net assets | (4,753,895 | ) | 8,124,910 | |||||
| Net assets: | ||||||||
| Beginning of year | 10,719,945 | 2,595,035 | ||||||
| End of year | $ | 5,966,050 | $ | 10,719,945 | ||||
| Undistributed net investment income at end of year | $ | 55,167 | $ | 62,945 | ||||
| Capital share activity: | ||||||||
| Shares sold | 2,107,380 | 3,725,488 | ||||||
| Shares issued from reinvestment of distributions | 63,295 | 2,359 | ||||||
| Shares redeemed | (2,558,223 | ) | (3,167,788 | ) | ||||
| Net increase (decrease) in shares | (387,548 | ) | 560,059 | |||||
SEE NOTES TO FINANCIAL STATEMENTS. | THE RYDEX FUNDS ANNUAL REPORT | 13 |
| BANKING FUND |
| FINANCIAL HIGHLIGHTS |
This table is presented to show selected data for a share outstanding throughout each period and to assist shareholders in evaluating a Fund’s performance for the periods presented.
| Year Ended | Year Ended | Year Ended | Year Ended | Year Ended | ||||||||||||||||
| December 31, | December 31, | December 31, | December 31, | December 31, | ||||||||||||||||
| 2013 | 2012 | 2011 | 2010 | 2009 | ||||||||||||||||
| Per Share Data | ||||||||||||||||||||
| Net asset value, beginning of period | $ | 13.40 | $ | 10.82 | $ | 13.98 | $ | 12.52 | $ | 13.40 | ||||||||||
| Income (loss) from investment operations: | ||||||||||||||||||||
| Net investment incomea | .08 | .11 | .07 | .02 | .08 | |||||||||||||||
| Net gain (loss) on investments (realized and unrealized) | 3.73 | 2.50 | (3.18 | ) | 1.60 | (.54 | ) | |||||||||||||
| Total from investment operations | 3.81 | 2.61 | (3.11 | ) | 1.62 | (.46 | ) | |||||||||||||
| Less distributions from: | ||||||||||||||||||||
| Net investment income | (.20 | ) | (.02 | ) | (.05 | ) | (.16 | ) | (.42 | ) | ||||||||||
| Net realized gains | (2.54 | ) | (.01 | ) | — | — | — | |||||||||||||
| Total distributions | (2.74 | ) | (.03 | ) | (.05 | ) | (.16 | ) | (.42 | ) | ||||||||||
| Net asset value, end of period | $ | 14.47 | $ | 13.40 | $ | 10.82 | $ | 13.98 | $ | 12.52 | ||||||||||
| Total Returnb | 29.18 | % | 24.22 | % | (22.23 | %) | 13.04 | % | (3.43 | %) | ||||||||||
| Ratios/Supplemental Data | ||||||||||||||||||||
| Net assets, end of period (in thousands) | $ | 5,966 | $ | 10,720 | $ | 2,595 | $ | 5,463 | $ | 4,639 | ||||||||||
| Ratios to average net assets: | ||||||||||||||||||||
| Net investment income | 0.52 | % | 0.89 | % | 0.59 | % | 0.12 | % | 0.70 | % | ||||||||||
| Total expenses | 1.64 | % | 1.67 | % | 1.71 | % | 1.64 | % | 1.66 | % | ||||||||||
| Portfolio turnover rate | 438 | % | 512 | % | 1,518 | % | 1,119 | % | 731 | % | ||||||||||
| a | Net investment income per share was computed using average shares outstanding throughout the period. |
| b | Total return does not reflect the impact of any additional fees charged by insurance companies. |
| 14 | the RYDEX FUNDS ANNUAL REPORT | See Notes to Financial Statements. |
This page intentionally left blank.
| THE RYDEX FUNDS ANNUAL REPORT | 15 |
| PERFORMANCE REPORT AND FUND PROFILE (Unaudited) | December 31, 2013 |
OBJECTIVE: Seeks to provide capital appreciation by investing in companies engaged in the mining, manufacture, or sale of basic materials, such as lumber, steel, iron, aluminum, concrete, chemicals and other basic building and manufacturing materials (“Basic Materials Companies”).
For the year ended December 31, 2013, Basic Materials Fund returned 1.25% compared with a gain of 32.39% for the S&P 500 Index. The S&P 500 Materials Index returned 25.60%.
The chemicals group was the main contributor to return, followed by the lightly weighted containers & packaging industry. The metals & mining industry was the only detractor from return.
The top-performing holdings were E.I. du Pont de Nemours and Co., Dow Chemical Co. and LyondellBasell Industries N.V.
The worst-performing holdings included Newmont Mining Corp., Barrick Gold Corp. and Allied Nevada Gold Corp.
Performance displayed represents past performance, which is no guarantee of future results.
Holdings Diversification (Market Exposure as % of Net Assets)

“Holdings Diversification (Market Exposure as % of Net Assets)” excludes any temporary cash investments.
| Inception Date: May 2, 2001 | ||||
| Ten Largest Holdings (% of Total Net Assets) | ||||
| Monsanto Co. | 3.0 | % | ||
| EI du Pont de Nemours & Co. | 3.0 | % | ||
| Dow Chemical Co. | 2.7 | % | ||
| LyondellBasell Industries N.V. — Class A | 2.6 | % | ||
| Freeport-McMoRan Copper & Gold, Inc. | 2.4 | % | ||
| Praxair, Inc. | 2.4 | % | ||
| Barrick Gold Corp. | 2.2 | % | ||
| Ecolab, Inc. | 2.1 | % | ||
| PPG Industries, Inc. | 2.0 | % | ||
| Air Products & Chemicals, Inc. | 1.9 | % | ||
| Top Ten Total | 24.3 | % | ||
“Ten Largest Holdings” exclude any temporary cash or derivative investments.
| 16 | the RYDEX FUNDS ANNUAL REPORT |
| PERFORMANCE REPORT AND FUND PROFILE (Unaudited) (concluded) |
Cumulative Fund Performance*,†

Average Annual Returns
Periods Ended December 31, 2013*,†
| 1 Year | 5 Year | 10 Year | ||||||||||
| Basic Materials Fund | 1.25 | % | 13.02 | % | 7.57 | % | ||||||
| S&P 500 Materials Index | 25.60 | % | 18.80 | % | 8.25 | % | ||||||
| S&P 500 Index | 32.39 | % | 17.94 | % | 7.41 | % | ||||||
| * | The performance data above represents past performance that is not predictive of future results. The investment return and principal value of an investment in the Fund will fluctuate so that an investor’s shares, when redeemed, may be worth more or less than their original cost. Returns are historical and include changes in principal and reinvested dividends and capital gains and do not reflect the effect of taxes. The S&P 500 Index and the S&P 500 Materials Index are unmanaged indices and, unlike the Fund, have no management fees or operating expenses to reduce their reported returns. |
| † | Returns do not reflect the impact of any additional fees charged by insurance companies. |
| THE RYDEX FUNDS ANNUAL REPORT | 17 |
| SCHEDULE OF INVESTMENTS | December 31, 2013 |
| BASIC MATERIALS FUND | |
| Shares | Value | |||||||
| COMMON STOCKS† - 99.5% | ||||||||
| SPECIALTY CHEMICALS - 17.1% | ||||||||
| Ecolab, Inc. | 2,377 | $ | 247,849 | |||||
| PPG Industries, Inc. | 1,223 | 231,953 | ||||||
| Sherwin-Williams Co. | 1,051 | 192,859 | ||||||
| Sigma-Aldrich Corp. | 1,611 | 151,450 | ||||||
| Celanese Corp. — Series A | 2,390 | 132,191 | ||||||
| Ashland, Inc. | 1,267 | 122,950 | ||||||
| WR Grace & Co.* | 1,241 | 122,698 | ||||||
| International Flavors & Fragrances, Inc. | 1,364 | 117,277 | ||||||
| Valspar Corp. | 1,545 | 110,143 | ||||||
| RPM International, Inc. | 2,528 | 104,937 | ||||||
| Albemarle Corp. | 1,652 | 104,720 | ||||||
| Rockwood Holdings, Inc. | 1,419 | 102,054 | ||||||
| PolyOne Corp. | 2,350 | 83,073 | ||||||
| Cytec Industries, Inc. | 885 | 82,447 | ||||||
| Chemtura Corp.* | 2,660 | 74,267 | ||||||
| Total Specialty Chemicals | 1,980,868 | |||||||
| GOLD - 11.6% | ||||||||
| Barrick Gold Corp. | 14,325 | 252,549 | ||||||
| Goldcorp, Inc. | 8,045 | 174,335 | ||||||
| Newmont Mining Corp. | 6,685 | 153,956 | ||||||
| AngloGold Ashanti Ltd. ADR | 7,907 | 92,670 | ||||||
| Agnico Eagle Mines Ltd. | 3,491 | 92,093 | ||||||
| Yamana Gold, Inc. | 10,249 | 88,346 | ||||||
| Randgold Resources Ltd. ADR | 1,403 | 88,122 | ||||||
| Kinross Gold Corp. | 19,840 | 86,899 | ||||||
| Eldorado Gold Corp. | 14,157 | 80,553 | ||||||
| Royal Gold, Inc. | 1,726 | 79,517 | ||||||
| Cia de Minas Buenaventura SAA ADR | 6,966 | 78,159 | ||||||
| Franco-Nevada Corp. | 1,907 | 77,691 | ||||||
| Total Gold | 1,344,890 | |||||||
| STEEL - 11.1% | ||||||||
| Vale S.A. ADR | 12,519 | 190,915 | ||||||
| Nucor Corp. | 3,412 | 182,133 | ||||||
| Reliance Steel & Aluminum Co. | 1,410 | 106,934 | ||||||
| ArcelorMittal | 5,460 | 97,406 | ||||||
| Steel Dynamics, Inc. | 4,825 | 94,281 | ||||||
| United States Steel Corp. | 3,100 | 91,450 | ||||||
| Cliffs Natural Resources, Inc.1 | 3,390 | 88,852 | ||||||
| Allegheny Technologies, Inc. | 2,462 | 87,721 | ||||||
| Carpenter Technology Corp. | 1,304 | 81,109 | ||||||
| Cia Siderurgica Nacional | ||||||||
| S.A. ADR | 13,060 | 80,972 | ||||||
| Gerdau S.A. ADR | 9,170 | 71,893 | ||||||
| Commercial Metals Co. | 3,380 | 68,715 | ||||||
| AK Steel Holding Corp.* | 5,720 | 46,904 | ||||||
| Total Steel | 1,289,285 | |||||||
| DIVERSIFIED CHEMICALS - 9.8% | ||||||||
| EI du Pont de Nemours & Co. | 5,310 | 344,991 | ||||||
| Dow Chemical Co. | 7,132 | 316,661 | ||||||
| Eastman Chemical Co. | 1,978 | 159,625 | ||||||
| FMC Corp. | 1,907 | 143,902 | ||||||
| Huntsman Corp. | 4,404 | 108,338 | ||||||
| Olin Corp. | 2,220 | 64,047 | ||||||
| Total Diversified Chemicals | 1,137,564 | |||||||
| FERTILIZERS & AGRICULTURAL CHEMICALS - 9.4% | ||||||||
| Monsanto Co. | 2,979 | 347,202 | ||||||
| Mosaic Co. | 4,297 | 203,119 | ||||||
| Potash Corporation of Saskatchewan, Inc. | 5,660 | 186,554 | ||||||
| CF Industries Holdings, Inc. | 701 | 163,361 | ||||||
| Agrium, Inc. | 1,100 | 100,628 | ||||||
| Scotts Miracle-Gro Co. — Class A | 1,390 | 86,486 | ||||||
| Total Fertilizers & Agricultural Chemicals | 1,087,350 | |||||||
| DIVERSIFIED METALS & MINING - 9.3% | ||||||||
| Freeport-McMoRan Copper & Gold, Inc. | 7,512 | 283,504 | ||||||
| Southern Copper Corp. | 7,562 | 217,106 | ||||||
| Rio Tinto plc ADR | 2,390 | 134,868 | ||||||
| BHP Billiton Ltd. ADR | 1,702 | 116,076 | ||||||
| Teck Resources Ltd. — Class B | 3,617 | 94,078 | ||||||
| BHP Billiton plc ADR | 1,185 | 73,612 | ||||||
| US Silica Holdings, Inc. | 1,803 | 61,500 | ||||||
| Molycorp, Inc.*,1 | 9,470 | 53,221 | ||||||
| Walter Energy, Inc. | 2,734 | 45,466 | ||||||
| Total Diversified Metals & Mining | 1,079,431 | |||||||
| PAPER PACKAGING - 6.3% | ||||||||
| Rock Tenn Co. — Class A | 1,175 | 123,386 | ||||||
| Sealed Air Corp. | 3,417 | 116,349 | ||||||
| MeadWestvaco Corp. | 3,027 | 111,787 | ||||||
| Packaging Corporation of America | 1,763 | 111,563 | ||||||
| Avery Dennison Corp. | 1,940 | 97,369 | ||||||
| Bemis Company, Inc. | 2,232 | 91,423 | ||||||
| Graphic Packaging Holding Co.* | 8,240 | 79,104 | ||||||
| Total Paper Packaging | 730,981 | |||||||
| INDUSTRIAL GASES - 5.4% | ||||||||
| Praxair, Inc. | 2,124 | 276,183 | ||||||
| Air Products & Chemicals, Inc. | 1,947 | 217,636 | ||||||
| Airgas, Inc. | 1,141 | 127,621 | ||||||
| Total Industrial Gases | 621,440 | |||||||
| COMMODITY CHEMICALS - 5.2% | ||||||||
| LyondellBasell Industries N.V. — Class A | 3,700 | 297,035 | ||||||
| Westlake Chemical Corp. | 1,065 | 130,005 | ||||||
| Methanex Corp. | 1,500 | 88,860 | ||||||
| Axiall Corp. | 1,704 | 80,838 | ||||||
| Total Commodity Chemicals | 596,738 | |||||||
| CONSTRUCTION MATERIALS - 4.0% | ||||||||
| Cemex SAB de CV ADR* | 12,629 | 149,401 | ||||||
| Vulcan Materials Co. | 2,099 | 124,723 | ||||||
| Martin Marietta Materials, Inc. | 977 | 97,641 | ||||||
| Eagle Materials, Inc. | 1,146 | 88,735 | ||||||
| Total Construction Materials | 460,500 | |||||||
| METAL & GLASS CONTAINERS - 2.9% | ||||||||
| Ball Corp. | 2,345 | 121,142 | ||||||
| Crown Holdings, Inc.* | 2,503 | 111,559 | ||||||
| Owens-Illinois, Inc.* | 3,019 | 108,020 | ||||||
| Total Metal & Glass Containers | 340,721 | |||||||
| 18 | the RYDEX FUNDS ANNUAL REPORT | See Notes to Financial Statements. |
| SCHEDULE OF INVESTMENTS (concluded) | December 31, 2013 |
| Basic materials FUND | |
| Shares | Value | |||||||
| PRECIOUS METALS & MINERALS - 2.5% | ||||||||
| Silver Wheaton Corp. | 5,773 | $ | 116,556 | |||||
| Pan American Silver Corp. | 6,275 | 73,418 | ||||||
| Stillwater Mining Co.* | 4,452 | 54,938 | ||||||
| Coeur Mining, Inc.* | 4,542 | 49,281 | ||||||
| Total Precious Metals & Minerals | 294,193 | |||||||
| PAPER PRODUCTS - 2.5% | ||||||||
| International Paper Co. | 4,171 | 204,504 | ||||||
| Domtar Corp. | 880 | 83,019 | ||||||
| Total Paper Products | 287,523 | |||||||
| ALUMINUM - 1.8% | ||||||||
| Alcoa, Inc. | 14,267 | 151,658 | ||||||
| Kaiser Aluminum Corp. | 720 | 50,573 | ||||||
| Total Aluminum | 202,231 | |||||||
| FOREST PRODUCTS - 0.6% | ||||||||
| Louisiana-Pacific Corp.* | 3,823 | 70,764 | ||||||
| Total Common Stocks | ||||||||
| (Cost $6,073,614) | 11,524,479 | |||||||
| Face | ||||||||
| Amount | Value | |||||||
| REPURCHASE AGREEMENT††,2 - 1.3% | ||||||||
| Credit Suisse Group | ||||||||
| issued 12/31/13 at 0.00% | ||||||||
| due 01/02/14 | $ | 149,184 | $ | 149,184 | ||||
| Total Repurchase Agreement | ||||||||
| (Cost $149,184) | 149,184 | |||||||
| SECURITIES LENDING COLLATERAL††,3 - 0.8% | ||||||||
| Repurchase Agreements | ||||||||
| HSBC Securities, Inc. | ||||||||
| issued 12/31/13 at 0.01% | ||||||||
| due 01/02/14 | 84,713 | 84,713 | ||||||
| Deutsche Bank Securities, Inc. | ||||||||
| issued 12/31/13 at 0.02% | ||||||||
| due 01/02/14 | 12,487 | 12,487 | ||||||
| Total Securities Lending Collateral | ||||||||
| (Cost $97,200) | 97,200 | |||||||
| Total Investments - 101.6% | ||||||||
| (Cost $6,319,998) | $ | 11,770,863 | ||||||
| Other Assets & Liabilities, net - (1.6)% | (183,382 | ) | ||||||
| Total Net Assets - 100.0% | $ | 11,587,481 | ||||||
| * | Non-income producing security. |
| † | Value determined based on Level 1 inputs — See Note 4. |
| †† | Value determined based on Level 2 inputs — See Note 4. |
| 1 | All or portion of this security is on loan at December 31, 2013 — See Note 8. |
| 2 | Repurchase Agreement — See Note 5. |
| 3 | Securities lending collateral — See Note 8. |
ADR — American Depository Receipt
plc — Public Limited Company
| SEE NOTES TO FINANCIAL STATEMENTS. | THE RYDEX FUNDS ANNUAL REPORT | 19 |
| BASIC MATERIALS FUND |
| STATEMENT OF ASSETS |
| AND LIABILITIES |
| December 31, 2013 | ||||
| Assets: | ||||
| Investments, at value - including $92,690 of securities loaned | ||||
| (cost $6,073,614) | $ | 11,524,479 | ||
| Repurchase agreements, at value | ||||
| (cost $246,384) | 246,384 | |||
| Total investments | ||||
| (cost $6,319,998) | 11,770,863 | |||
| Receivables: | ||||
| Dividends | 12,585 | |||
| Interest and securities lending income | 179 | |||
| Total assets | 11,783,627 | |||
| Liabilities: | ||||
| Payable for: | ||||
| Upon return of securities loaned | 97,200 | |||
| Fund shares redeemed | 66,400 | |||
| Management fees | 7,741 | |||
| Transfer agent and administrative fees | 2,277 | |||
| Investor service fees | 2,277 | |||
| Portfolio accounting fees | 910 | |||
| Miscellaneous | 19,341 | |||
| Total liabilities | 196,146 | |||
| Net assets | $ | 11,587,481 | ||
| Net assets consist of: | ||||
| Paid in capital | $ | 8,071,905 | ||
| Undistributed net investment income | 52,773 | |||
| Accumulated net realized loss on investments | (1,988,062 | ) | ||
| Net unrealized appreciation on investments | 5,450,865 | |||
| Net assets | $ | 11,587,481 | ||
| Capital shares outstanding | 466,928 | |||
| Net asset value per share | $ | 24.82 | ||
| STATEMENT OF |
| OPERATIONS |
| Year Ended December 31, 2013 | ||||
| Investment Income: | ||||
| Dividends (net of foreign withholding tax of $6,643) | $ | 255,096 | ||
| Income from securities lending, net | 8,458 | |||
| Interest | 22 | |||
| Total investment income | 263,576 | |||
| Expenses: | ||||
| Management fees | 111,693 | |||
| Transfer agent and administrative fees | 32,851 | |||
| Investor service fees | 32,851 | |||
| Portfolio accounting fees | 13,140 | |||
| Professional fees | 12,129 | |||
| Trustees’ fees* | 1,636 | |||
| Custodian fees | 1,479 | |||
| Line of credit interest expense | 120 | |||
| Miscellaneous | 9,672 | |||
| Total expenses | 215,571 | |||
| Net investment income | 48,005 | |||
| Net Realized and Unrealized Gain (Loss): | ||||
| Net realized gain (loss) on: | ||||
| Investments | 1,531,106 | |||
| Net realized gain | 1,531,106 | |||
| Net change in unrealized appreciation (depreciation) on: | ||||
| Investments | (2,038,768 | ) | ||
| Net change in unrealized appreciation (depreciation) | (2,038,768 | ) | ||
| Net realized and unrealized loss | (507,662 | ) | ||
| Net decrease in net assets resulting from operations | $ | (459,657 | ) | |
* Relates to Trustees not deemed “interested persons” within the meaning of Section 2(a)(19) of the 1940 Act.
| 20 | the RYDEX FUNDS ANNUAL REPORT | See Notes to Financial Statements. |
| BASIC MATERIALS FUND |
| STATEMENTS OF CHANGES IN NET ASSETS |
| Year Ended | Year Ended | |||||||
| December 31, | December 31, | |||||||
| 2013 | 2012 | |||||||
| Increase (Decrease) In Net Assets From Operations: | ||||||||
| Net investment income | $ | 48,005 | $ | 94,690 | ||||
| Net realized gain on investments | 1,531,106 | 853,237 | ||||||
| Net change in unrealized appreciation (depreciation) on investments | (2,038,768 | ) | 560,133 | |||||
| Net increase (decrease) in net assets resulting from operations | (459,657 | ) | 1,508,060 | |||||
| Distributions to shareholders from: | ||||||||
| Net investment income | (88,114 | ) | — | |||||
| Net realized gains | (628,130 | ) | (1,353,298 | ) | ||||
| Total distributions to shareholders | (716,244 | ) | (1,353,298 | ) | ||||
| Capital share transactions: | ||||||||
| Proceeds from sale of shares | 43,599,866 | 50,350,880 | ||||||
| Distributions reinvested | 716,244 | 1,353,298 | ||||||
| Cost of shares redeemed | (48,072,003 | ) | (51,233,191 | ) | ||||
| Net increase (decrease) from capital share transactions | (3,755,893 | ) | 470,987 | |||||
| Net increase (decrease) in net assets | (4,931,794 | ) | 625,749 | |||||
| Net assets: | ||||||||
| Beginning of year | 16,519,275 | 15,893,526 | ||||||
| End of year | $ | 11,587,481 | $ | 16,519,275 | ||||
| Undistributed net investment income at end of year | $ | 52,773 | $ | 94,690 | ||||
| Capital share activity: | ||||||||
| Shares sold | 1,715,254 | 1,885,247 | ||||||
| Shares issued from reinvestment of distributions | 29,463 | 55,079 | ||||||
| Shares redeemed | (1,911,154 | ) | (1,919,537 | ) | ||||
| Net increase (decrease) in shares | (166,437 | ) | 20,789 | |||||
| See Notes to Financial Statements. | The RYDEX FUNDS ANNUAL REPORT | 21 |
| BASIC MATERIALS FUND |
| FINANCIAL HIGHLIGHTS |
This table is presented to show selected data for a share outstanding throughout each period and to assist shareholders in evaluating a Fund’s performance for the periods presented.
| Year Ended | Year Ended | Year Ended | Year Ended | Year Ended | ||||||||||||||||
| December 31, | December 31, | December 31, | December 31, | December 31, | ||||||||||||||||
| 2013 | 2012 | 2011 | 2010 | 2009 | ||||||||||||||||
| Per Share Data | ||||||||||||||||||||
| Net asset value, beginning of period | $ | 26.08 | $ | 25.95 | $ | 36.83 | $ | 29.22 | $ | 19.38 | ||||||||||
| Income (loss) from investment operations: | ||||||||||||||||||||
| Net investment income (loss)a | .09 | .17 | (.02 | ) | (.07 | ) | .17 | |||||||||||||
| Net gain (loss) on investments (realized and unrealized) | .20 | 2.45 | (5.69 | ) | 7.86 | 10.58 | ||||||||||||||
| Total from investment operations | .29 | 2.62 | (5.71 | ) | 7.79 | 10.75 | ||||||||||||||
| Less distributions from: | ||||||||||||||||||||
| Net investment income | (.19 | ) | — | — | (.18 | ) | (.06 | ) | ||||||||||||
| Net realized gains | (1.36 | ) | (2.49 | ) | (5.17 | ) | — | (.85 | ) | |||||||||||
| Total distributions | (1.55 | ) | (2.49 | ) | (5.17 | ) | (.18 | ) | (.91 | ) | ||||||||||
| Net asset value, end of period | $ | 24.82 | $ | 26.08 | $ | 25.95 | $ | 36.83 | $ | 29.22 | ||||||||||
| Total Returnb | 1.25 | % | 10.72 | % | (16.46 | %) | 26.67 | % | 55.46 | % | ||||||||||
| Ratios/Supplemental Data | ||||||||||||||||||||
| Net assets, end of period (in thousands) | $ | 11,587 | $ | 16,519 | $ | 15,894 | $ | 49,131 | $ | 46,522 | ||||||||||
| Ratios to average net assets: | ||||||||||||||||||||
| Net investment income (loss) | 0.37 | % | 0.62 | % | (0.06 | %) | (0.22 | %) | 0.69 | % | ||||||||||
| Total expenses | 1.64 | % | 1.67 | % | 1.71 | % | 1.66 | % | 1.65 | % | ||||||||||
| Portfolio turnover rate | 350 | % | 339 | % | 193 | % | 418 | % | 377 | % | ||||||||||
| a | Net investment income (loss) per share was computed using average shares outstanding throughout the period. |
| b | Total return does not reflect the impact of any additional fees charged by insurance companies. |
| 22 | the RYDEX FUNDS ANNUAL REPORT | See Notes to Financial Statements. |
This page intentionally left blank.
| THE RYDEX FUNDS ANNUAL REPORT | 23 |
| PERFORMANCE REPORT AND FUND PROFILE (Unaudited) | December 31, 2013 |
OBJECTIVE: Seeks to provide capital appreciation by investing in companies that are involved in the biotechnology industry, including companies involved in research and development, genetic or other biological engineering, and in the design, manufacture, or sale of related biotechnology products or services (“Biotechnology Companies”).
For the year ended December 31, 2013, Biotechnology Fund gained 54.20% compared with the S&P 500 Index, which rose 32.39%. The S&P 500 Health Care Index returned 41.46%.
Companies in the biotechnology industry compose most of the weight of the Fund. For the year, the group contributed the most to return, followed by the life sciences tools & services segment. No industry detracted from return.
The best-performing holdings in the Fund were Gilead Sciences, Inc., Celgene Corp. and Biogen Idec, Inc.
The worst-performing holdings in the Fund included Amarin Corp. plc, ARIAD Pharmaceuticals, Inc. and Affymax, Inc.
Performance displayed represents past performance, which is no guarantee of future results.
Holdings Diversification (Market Exposure as % of Net Assets)

“Holdings Diversification (Market Exposure as % of Net Assets)” excludes any temporary cash investments.
Inception Date: May 2, 2001
| Ten Largest Holdings (% of Total Net Assets) | ||||
| Gilead Sciences, Inc. | 7.4 | % | ||
| Amgen, Inc. | 6.5 | % | ||
| Celgene Corp. | 5.9 | % | ||
| Biogen Idec, Inc. | 5.6 | % | ||
| Regeneron Pharmaceuticals, Inc. | 3.7 | % | ||
| Alexion Pharmaceuticals, Inc. | 3.6 | % | ||
| Vertex Pharmaceuticals, Inc. | 2.9 | % | ||
| Illumina, Inc. | 2.6 | % | ||
| Life Technologies Corp. | 2.5 | % | ||
| BioMarin Pharmaceutical, Inc. | 2.2 | % | ||
| Top Ten Total | 42.9 | % | ||
“Ten Largest Holdings” exclude any temporary cash or derivative investments.
24 | THE RYDEX FUNDS ANNUAL REPORT
PERFORMANCE REPORT AND FUND PROFILE (Unaudited) (concluded)
Cumulative Fund Performance*,†
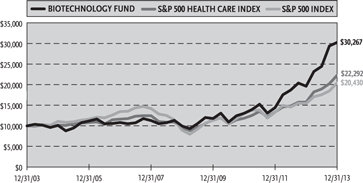
Average Annual Returns
Periods Ended December 31, 2013*,†
| 1 Year | 5 Year | 10 Year | ||||||||||
| Biotechnology Fund | 54.20 | % | 24.89 | % | 11.71 | % | ||||||
| S&P 500 Health Care Index | 41.46 | % | 18.29 | % | 8.35 | % | ||||||
| S&P 500 Index | 32.39 | % | 17.94 | % | 7.41 | % | ||||||
| * | The performance data above represents past performance that is not predictive of future results. The investment return and principal value of an investment in the Fund will fluctuate so that an investor’s shares, when redeemed, may be worth more or less than their original cost. Returns are historical and include changes in principal and reinvested dividends and capital gains and do not reflect the effect of taxes. The S&P 500 Index and the S&P 500 Health Care Index are unmanaged indices and, unlike the Fund, have no management fees or operating expenses to reduce their reported returns. |
| † | Returns do not reflect the impact of any additional fees charged by insurance companies. |
THE RYDEX FUNDS ANNUAL REPORT | 25
| SCHEDULE OF INVESTMENTS | December 31, 2013 |
| BIOTECHNOLOGY FUND |
| Shares | Value | |||||||
| COMMON STOCKS† - 100.6% | ||||||||
| BIOTECHNOLOGY - 84.7% | ||||||||
| Gilead Sciences, Inc.* | 26,016 | $ | 1,955,103 | |||||
| Amgen, Inc. | 15,115 | 1,725,529 | ||||||
| Celgene Corp.* | 9,256 | 1,563,894 | ||||||
| Biogen Idec, Inc.* | 5,351 | 1,496,942 | ||||||
| Regeneron Pharmaceuticals, Inc.* | 3,565 | 981,231 | ||||||
| Alexion Pharmaceuticals, Inc.* | 7,137 | 949,649 | ||||||
| Vertex Pharmaceuticals, Inc.* | 10,240 | 760,832 | ||||||
| BioMarin Pharmaceutical, Inc.* | 8,419 | 591,603 | ||||||
| Pharmacyclics, Inc.* | 5,130 | 542,651 | ||||||
| Incyte Corporation Ltd.* | 10,495 | 531,362 | ||||||
| United Therapeutics Corp.* | 4,446 | 502,754 | ||||||
| Seattle Genetics, Inc.* | 10,535 | 420,241 | ||||||
| Cubist Pharmaceuticals, Inc.* | 6,056 | 417,077 | ||||||
| Medivation, Inc.* | 6,303 | 402,257 | ||||||
| Isis Pharmaceuticals, Inc.* | 9,850 | 392,424 | ||||||
| Alkermes plc* | 9,407 | 382,489 | ||||||
| Theravance, Inc.* | 10,300 | 367,195 | ||||||
| Alnylam Pharmaceuticals, Inc.* | 5,663 | 364,301 | ||||||
| Opko Health, Inc.*,1 | 39,295 | 331,650 | ||||||
| NPS Pharmaceuticals, Inc.* | 10,777 | 327,190 | ||||||
| Cepheid, Inc.* | 6,913 | 322,975 | ||||||
| Grifols S.A. ADR | 8,870 | 320,384 | ||||||
| Puma Biotechnology, Inc.* | 3,040 | 314,731 | ||||||
| ACADIA Pharmaceuticals, Inc.* | 11,367 | 284,061 | ||||||
| Aegerion Pharmaceuticals, Inc.* | 3,990 | 283,130 | ||||||
| Clovis Oncology, Inc.* | 4,520 | 272,420 | ||||||
| Celldex Therapeutics, Inc.* | 11,100 | 268,731 | ||||||
| MannKind Corp.*,1 | 49,340 | 257,061 | ||||||
| Synageva BioPharma Corp.* | 3,958 | 256,162 | ||||||
| Intercept Pharmaceuticals, Inc.* | 3,569 | 243,691 | ||||||
| Halozyme Therapeutics, Inc.* | 15,164 | 227,308 | ||||||
| InterMune, Inc.* | 15,316 | 225,605 | ||||||
| Ironwood Pharmaceuticals, Inc.* | 18,853 | 218,883 | ||||||
| Arena Pharmaceuticals, Inc.*,1 | 36,390 | 212,882 | ||||||
| Myriad Genetics, Inc.*,1 | 10,110 | 212,108 | ||||||
| Organovo Holdings, Inc.*,1 | 18,832 | 208,470 | ||||||
| Acorda Therapeutics, Inc.* | 7,078 | 206,678 | ||||||
| Ariad Pharmaceuticals, Inc.*,1 | 30,170 | 205,759 | ||||||
| ImmunoGen, Inc.*,1 | 13,799 | 202,431 | ||||||
| Exelixis, Inc.*,1 | 33,000 | 202,290 | ||||||
| PDL BioPharma, Inc.1 | 23,597 | 199,159 | ||||||
| Ligand Pharmaceuticals, Inc. — Class B* | 3,681 | 193,621 | ||||||
| Dyax Corp.* | 24,400 | 183,732 | ||||||
| Momenta Pharmaceuticals, Inc.* | 10,054 | 177,755 | ||||||
| Keryx Biopharmaceuticals, Inc.* | 13,670 | 177,027 | ||||||
| Sarepta Therapeutics, Inc.*,1 | 8,584 | 174,856 | ||||||
| Sangamo Biosciences, Inc.* | 12,570 | 174,597 | ||||||
| Exact Sciences Corp.* | 14,426 | 168,640 | ||||||
| Raptor Pharmaceutical Corp.* | 12,861 | 167,450 | ||||||
| Infinity Pharmaceuticals, Inc.* | 11,410 | 157,572 | ||||||
| TESARO, Inc.* | 5,330 | 150,519 | ||||||
| Neurocrine Biosciences, Inc.* | 16,080 | 150,187 | ||||||
| Array BioPharma, Inc.* | 29,940 | 149,999 | ||||||
| Spectrum Pharmaceuticals, Inc.* | 16,885 | 149,432 | ||||||
| Vanda Pharmaceuticals, Inc.* | 10,070 | 124,969 | ||||||
| Total Biotechnology | 22,451,649 | |||||||
| LIFE SCIENCES TOOLS & SERVICES - 12.4% | ||||||||
| Illumina, Inc.* | 6,335 | 700,778 | ||||||
| Life Technologies Corp.* | 8,786 | 665,979 | ||||||
| Quintiles Transnational Holdings, Inc.* | 9,753 | 451,954 | ||||||
| Bio-Rad Laboratories, Inc. — Class A* | 2,881 | 356,120 | ||||||
| Techne Corp. | 3,597 | 340,528 | ||||||
| QIAGEN N.V.* | 14,249 | 339,269 | ||||||
| Charles River Laboratories International, Inc.* | 5,580 | 295,963 | ||||||
| Affymetrix, Inc.* | 16,991 | 145,613 | ||||||
| Total Life Sciences Tools & Services | 3,296,204 | |||||||
| PHARMACEUTICALS - 3.5% | ||||||||
| Perrigo Company plc | 2,585 | 396,755 | ||||||
| Medicines Co.* | 7,760 | 299,691 | ||||||
| Nektar Therapeutics* | 19,030 | 215,991 | ||||||
| Total Pharmaceuticals | 912,437 | |||||||
| Total Common Stocks | ||||||||
| (Cost $12,331,447) | 26,660,290 | |||||||
| RIGHTS††† - 0.0% | ||||||||
| Clinical Data, Inc. | ||||||||
| Expires 12/31/20*,2 | 4,730 | — | ||||||
| Total Rights | ||||||||
| (Cost $—) | — | |||||||
| Face | ||||||||
| Amount | ||||||||
| SECURITIES LENDING COLLATERAL††,3 - 5.7% | ||||||||
| Repurchase Agreements | ||||||||
| HSBC Securities, Inc. | ||||||||
| issued 12/31/13 at 0.01% | ||||||||
| due 01/02/14 | $ | 1,312,053 | 1,312,053 | |||||
| Deutsche Bank Securities, Inc. | ||||||||
| issued 12/31/13 at 0.02% | ||||||||
| due 01/02/14 | 193,397 | 193,397 | ||||||
| Total Securities Lending Collateral | ||||||||
| (Cost $1,505,450) | 1,505,450 | |||||||
| Total Investments - 106.3% | ||||||||
| (Cost $13,836,897) | $ | 28,165,740 | ||||||
| Other Assets & Liabilities, net - (6.3)% | (1,666,288 | ) | ||||||
| Total Net Assets - 100.0% | $ | 26,499,452 | ||||||
| * | Non-income producing security. |
| † | Value determined based on Level 1 inputs — See Note 4. |
| †† | Value determined based on Level 2 inputs — See Note 4. |
| ††† | Value determined based on Level 3 inputs — See Note 4. |
| 1 | All or portion of this security is on loan at December 31, 2013 — See Note 8. |
| 2 | Illiquid security. |
| 3 | Securities lending collateral — See Note 8. |
| ADR — American Depository Receipt | |
| plc — Public Limited Company |
| 26 | THE RYDEX FUNDS ANNUAL REPORT | SEE NOTES TO FINANCIAL STATEMENTS. |
| BIOTECHNOLOGY FUND |
STATEMENT OF ASSETS AND LIABILITIES
December 31, 2013
| Assets: | ||||
| Investments, at value - including $1,473,528 of securities loaned | ||||
| (cost $12,331,447) | $ | 26,660,290 | ||
| Repurchase agreements, at value | ||||
| (cost $1,505,450) | 1,505,450 | |||
| Total investments | ||||
| (cost $13,836,897) | 28,165,740 | |||
| Cash | 324 | |||
| Receivables: | ||||
| Fund shares sold | 130,369 | |||
| Interest and securities lending income | 3,962 | |||
| Total assets | 28,300,395 | |||
| Liabilities: | ||||
| Line of credit | 205,000 | |||
| Payable for: | ||||
| Upon return of securities loaned | 1,505,450 | |||
| Fund shares redeemed | 20,417 | |||
| Management fees | 19,543 | |||
| Transfer agent and administrative fees | 5,748 | |||
| Investor service fees | 5,748 | |||
| Portfolio accounting fees | 2,299 | |||
| Miscellaneous | 36,738 | |||
| Total liabilities | 1,800,943 | |||
| Net assets | $ | 26,499,452 | ||
| Net assets consist of: | ||||
| Paid in capital | $ | 19,166,059 | ||
| Accumulated net investment loss | — | |||
| Accumulated net realized loss on investments | (6,995,450 | ) | ||
| Net unrealized appreciation on investments | 14,328,843 | |||
| Net assets | $ | 26,499,452 | ||
| Capital shares outstanding | 458,394 | |||
| Net asset value per share | $ | 57.81 |
STATEMENT OF OPERATIONS
Year Ended December 31, 2013
| Investment Income: | ||||
| Income from securities lending, net | $ | 67,665 | ||
| Dividends | 59,033 | |||
| Interest | 41 | |||
| Total investment income | 126,739 | |||
| Expenses: | ||||
| Management fees | 220,651 | |||
| Transfer agent and administrative fees | 64,897 | |||
| Investor service fees | 64,897 | |||
| Portfolio accounting fees | 25,959 | |||
| Professional fees | 23,801 | |||
| Custodian fees | 2,811 | |||
| Trustees’ fees* | 2,723 | |||
| Line of credit interest expense | 228 | |||
| Miscellaneous | 18,334 | |||
| Total expenses | 424,301 | |||
| Net investment loss | (297,562 | ) | ||
| Net Realized and Unrealized Gain (Loss): | ||||
| Net realized gain (loss) on: | ||||
| Investments | 4,190,274 | |||
| Net realized gain | 4,190,274 | |||
| Net change in unrealized appreciation (depreciation) on: | ||||
| Investments | 6,045,333 | |||
| Net change in unrealized appreciation (depreciation) | 6,045,333 | |||
| Net realized and unrealized gain | 10,235,607 | |||
| Net increase in net assets resulting from operations | $ | 9,938,045 |
* Relates to Trustees not deemed “interested persons” within the meaning of Section 2(a)(19) of the 1940 Act.
| SEE NOTES TO FINANCIAL STATEMENTS. | THE RYDEX FUNDS ANNUAL REPORT | 27 |
| BIOTECHNOLOGY FUND |
STATEMENTS OF CHANGES IN NET ASSETS
| Year Ended | Year Ended | |||||||
| December 31, | December 31, | |||||||
| 2013 | 2012 | |||||||
| Increase (Decrease) In Net Assets From Operations: | ||||||||
| Net investment loss | $ | (297,562 | ) | $ | (309,626 | ) | ||
| Net realized gain on investments | 4,190,274 | 2,058,392 | ||||||
| Net change in unrealized appreciation (depreciation) on investments | 6,045,333 | 3,811,340 | ||||||
| Net increase in net assets resulting from operations | 9,938,045 | 5,560,106 | ||||||
| Capital share transactions: | ||||||||
| Proceeds from sale of shares | 72,966,371 | 71,809,325 | ||||||
| Cost of shares redeemed | (75,485,335 | ) | (70,134,629 | ) | ||||
| Net increase (decrease) from capital share transactions | (2,518,964 | ) | 1,674,696 | |||||
| Net increase in net assets | 7,419,081 | 7,234,802 | ||||||
| Net assets: | ||||||||
| Beginning of year | 19,080,371 | 11,845,569 | ||||||
| End of year | $ | 26,499,452 | $ | 19,080,371 | ||||
| Accumulated net investment loss at end of year | $ | — | $ | (29,284 | ) | |||
| Capital share activity: | ||||||||
| Shares sold | 1,490,314 | 2,066,760 | ||||||
| Shares redeemed | (1,540,866 | ) | (1,987,377 | ) | ||||
| Net increase (decrease) in shares | (50,552 | ) | 79,383 | |||||
| 28 | THE RYDEX FUNDS ANNUAL REPORT | SEE NOTES TO FINANCIAL STATEMENTS. |
| BIOTECHNOLOGY FUND |
FINANCIAL HIGHLIGHTS
This table is presented to show selected data for a share outstanding throughout each period and to assist shareholders in evaluating a Fund’s performance for the periods presented.
| Year Ended | Year Ended | Year Ended | Year Ended | Year Ended | ||||||||||||||||
| December 31, | December 31, | December 31, | December 31, | December 31, | ||||||||||||||||
| 2013 | 2012 | 2011 | 2010 | 2009 | ||||||||||||||||
| Per Share Data | ||||||||||||||||||||
| Net asset value, beginning of period | $ | 37.49 | $ | 27.58 | $ | 24.93 | $ | 22.52 | $ | 19.03 | ||||||||||
| Income (loss) from investment operations: | ||||||||||||||||||||
| Net investment lossa | (.56 | ) | (.47 | ) | (.41 | ) | (.33 | ) | (.25 | ) | ||||||||||
| Net gain on investments (realized and unrealized) | 20.88 | 10.38 | 3.06 | 2.74 | 3.74 | |||||||||||||||
| Total from investment operations | 20.32 | 9.91 | 2.65 | 2.41 | 3.49 | |||||||||||||||
| Net asset value, end of period | $ | 57.81 | $ | 37.49 | $ | 27.58 | $ | 24.93 | $ | 22.52 | ||||||||||
| Total Returnb | 54.20 | % | 35.98 | % | 10.59 | % | 10.70 | % | 18.34 | % | ||||||||||
| Ratios/Supplemental Data | ||||||||||||||||||||
| Net assets, end of period (in thousands) | $ | 26,499 | $ | 19,080 | $ | 11,846 | $ | 13,843 | $ | 13,144 | ||||||||||
| Ratios to average net assets: | ||||||||||||||||||||
| Net investment loss | (1.15 | %) | (1.33 | %) | (1.51 | %) | (1.40 | %) | (1.25 | %) | ||||||||||
| Total expenses | 1.63 | % | 1.68 | % | 1.71 | % | 1.65 | % | 1.68 | % | ||||||||||
| Portfolio turnover rate | 277 | % | 294 | % | 502 | % | 509 | % | 388 | % | ||||||||||
| a | Net investment loss per share was computed using average shares outstanding throughout the period. |
| b | Total return does not reflect the impact of any additional fees charged by insurance companies. |
| SEE NOTES TO FINANCIAL STATEMENTS. | THE RYDEX FUNDS ANNUAL REPORT | 29 |
| PERFORMANCE REPORT AND FUND PROFILE (Unaudited) | December 31, 2013 |
OBJECTIVE: Seeks to provide capital appreciation by investing in companies engaged in manufacturing finished goods and services both domestically and internationally (“Consumer Products Companies”).
For the year ended December 31, 2013, Consumer Products Fund rose 28.25%, compared with a gain of 32.39% for the S&P 500 Index. The S&P 500 Consumer Staples Index returned 26.14%.
The food products industry was the largest contributor to Fund performance, followed by the beverages industry. No industry detracted from return, but the tobacco industry contributed least to return.
Fund performance for the year got the biggest boost from Procter & Gamble Co., Herbalife Ltd. and Nu Skin Enterprises, Inc. Class A.
Fresh Market, Inc., Ambev S.A. and Pilgrim’s Pride Corp. were the Fund’s weakest performers during the year.
Performance displayed represents past performance, which is no guarantee of future results.
Holdings Diversification (Market Exposure as % of Net Assets)

“Holdings Diversification (Market Exposure as % of Net Assets)” excludes any temporary cash investments.
Inception Date: May 29, 2001
| Ten Largest Holdings (% of Total Net Assets) | ||||
| Procter & Gamble Co. | 5.6 | % | ||
| Coca-Cola Co. | 5.1 | % | ||
| Philip Morris International, Inc. | 4.5 | % | ||
| PepsiCo, Inc. | 4.3 | % | ||
| Altria Group, Inc. | 3.3 | % | ||
| Mondelez International, Inc. — Class A | 3.0 | % | ||
| Colgate-Palmolive Co. | 2.9 | % | ||
| Kimberly-Clark Corp. | 2.4 | % | ||
| General Mills, Inc. | 2.2 | % | ||
| Kraft Foods Group, Inc. | 2.1 | % | ||
| Top Ten Total | 35.4 | % | ||
“Ten Largest Holdings” exclude any temporary cash or derivative investments.
30 | THE RYDEX FUNDS ANNUAL REPORT
PERFORMANCE REPORT AND FUND PROFILE (Unaudited) (concluded)
Cumulative Fund Performance*,†
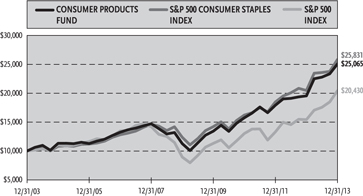
Average Annual Returns
Periods Ended December 31, 2013*,†
| 1 Year | 5 Year | 10 Year | ||||||||||
| Consumer Products Fund | 28.25 | % | 17.32 | % | 9.62 | % | ||||||
| S&P 500 Consumer Staples Index | 26.14 | % | 15.86 | % | 9.95 | % | ||||||
| S&P 500 Index | 32.39 | % | 17.94 | % | 7.41 | % | ||||||
| * | The performance data above represents past performance that is not predictive of future results. The investment return and principal value of an investment in the Fund will fluctuate so that an investor’s shares, when redeemed, may be worth more or less than their original cost. Returns are historical and include changes in principal and reinvested dividends and capital gains and do not reflect the effect of taxes. The S&P 500 Index and the S&P 500 Consumer Staples Index are unmanaged indices and, unlike the Fund, have no management fees or operating expenses to reduce their reported returns. |
| † | Returns do not reflect the impact of any additional fees charged by insurance companies. |
THE RYDEX FUNDS ANNUAL REPORT | 31
| SCHEDULE OF INVESTMENTS | December 31, 2013 |
| CONSUMER PRODUCTS FUND |
| Shares | Value | |||||||
| COMMON STOCKS† - 100.1% | ||||||||
| PACKAGED FOODS & MEATS - 29.6% | ||||||||
| Mondelez International, Inc. — Class A | 13,090 | $ | 462,077 | |||||
| General Mills, Inc. | 6,679 | 333,349 | ||||||
| Kraft Foods Group, Inc. | 6,110 | 329,451 | ||||||
| Kellogg Co. | 4,497 | 274,632 | ||||||
| Hershey Co. | 2,784 | 270,688 | ||||||
| Mead Johnson Nutrition Co. | 2,859 | 239,470 | ||||||
| ConAgra Foods, Inc. | 6,263 | 211,063 | ||||||
| Campbell Soup Co. | 4,800 | 207,744 | ||||||
| Hormel Foods Corp. | 4,426 | 199,922 | ||||||
| Tyson Foods, Inc. — Class A | 5,813 | 194,503 | ||||||
| JM Smucker Co. | 1,863 | 193,044 | ||||||
| Green Mountain Coffee Roasters, Inc.* | 2,512 | 189,857 | ||||||
| McCormick & Company, Inc. | 2,542 | 175,195 | ||||||
| Unilever N.V. | 3,843 | 154,604 | ||||||
| BRF S.A. ADR | 6,770 | 141,290 | ||||||
| Hain Celestial Group, Inc.* | 1,358 | 123,279 | ||||||
| Flowers Foods, Inc. | 5,621 | 120,683 | ||||||
| Hillshire Brands Co. | 3,560 | 119,046 | ||||||
| WhiteWave Foods Co. — Class A* | 5,180 | 118,829 | ||||||
| Pilgrim’s Pride Corp.* | 7,290 | 118,463 | ||||||
| TreeHouse Foods, Inc.* | 1,338 | 92,215 | ||||||
| B&G Foods, Inc. | 2,240 | 75,958 | ||||||
| Dean Foods Co.* | 4,370 | 75,120 | ||||||
| Sanderson Farms, Inc. | 1,030 | 74,500 | ||||||
| Post Holdings, Inc.* | 1,500 | 73,905 | ||||||
| Total Packaged Foods & Meats | 4,568,887 | |||||||
| HOUSEHOLD PRODUCTS - 15.0% | ||||||||
| Procter & Gamble Co. | 10,589 | 862,051 | ||||||
| Colgate-Palmolive Co. | 6,938 | 452,427 | ||||||
| Kimberly-Clark Corp. | 3,503 | 365,923 | ||||||
| Clorox Co. | 2,169 | 201,196 | ||||||
| Church & Dwight Company, Inc. | 2,656 | 176,040 | ||||||
| Energizer Holdings, Inc. | 1,410 | 152,618 | ||||||
| Spectrum Brands Holdings, Inc. | 1,560 | 110,058 | ||||||
| Total Household Products | 2,320,313 | |||||||
| SOFT DRINKS - 14.2% | ||||||||
| Coca-Cola Co. | 19,187 | 792,614 | ||||||
| PepsiCo, Inc. | 7,943 | 658,792 | ||||||
| Coca-Cola Enterprises, Inc. | 4,427 | 195,364 | ||||||
| Monster Beverage Corp.* | 2,806 | 190,163 | ||||||
| Dr Pepper Snapple Group, Inc. | 3,748 | 182,603 | ||||||
| Fomento Economico Mexicano | ||||||||
| SAB de CV ADR | 1,741 | 170,392 | ||||||
| Total Soft Drinks | 2,189,928 | |||||||
| TOBACCO - 11.8% | ||||||||
| Philip Morris International, Inc. | 7,921 | 690,157 | ||||||
| Altria Group, Inc. | 13,130 | 504,061 | ||||||
| Reynolds American, Inc. | 6,111 | 305,489 | ||||||
| Lorillard, Inc. | 5,008 | 253,805 | ||||||
| Universal Corp. | 1,190 | 64,974 | ||||||
| Total Tobacco | 1,818,486 | |||||||
| FOOD RETAIL - 8.1% | ||||||||
| Whole Foods Market, Inc. | 4,592 | 265,556 | ||||||
| Kroger Co. | 6,651 | 262,914 | ||||||
| Safeway, Inc. | 5,017 | 163,404 | ||||||
| Sprouts Farmers Market, Inc.* | 3,580 | 137,579 | ||||||
| Casey’s General Stores, Inc. | 1,347 | 94,627 | ||||||
| Harris Teeter Supermarkets, Inc. | 1,844 | 91,001 | ||||||
| Fresh Market, Inc.* | 2,010 | 81,405 | ||||||
| SUPERVALU, Inc.* | 11,048 | 80,540 | ||||||
| Susser Holdings Corp.* | 1,080 | 70,729 | ||||||
| Total Food Retail | 1,247,755 | |||||||
| PERSONAL PRODUCTS - 5.5% | ||||||||
| Estee Lauder Companies, Inc. — Class A | 4,158 | 313,180 | ||||||
| Herbalife Ltd.1 | 2,951 | 232,244 | ||||||
| Nu Skin Enterprises, Inc. — Class A | 1,208 | 166,970 | ||||||
| Avon Products, Inc. | 8,394 | 144,545 | ||||||
| Total Personal Products | 856,939 | |||||||
| DISTILLERS & VINTNERS - 5.1% | ||||||||
| Brown-Forman Corp. — Class B | 3,069 | 231,925 | ||||||
| Constellation Brands, Inc. — Class A* | 3,023 | 212,759 | ||||||
| Beam, Inc. | 2,840 | 193,290 | ||||||
| Diageo plc ADR | 1,120 | 148,310 | ||||||
| Total Distillers & Vintners | 786,284 | |||||||
| AGRICULTURAL PRODUCTS - 4.8% | ||||||||
| Archer-Daniels-Midland Co. | 6,885 | 298,809 | ||||||
| Bunge Ltd. | 2,469 | 202,730 | ||||||
| Ingredion, Inc. | 1,954 | 133,771 | ||||||
| Darling International, Inc.* | 5,064 | 105,736 | ||||||
| Total Agricultural Products | 741,046 | |||||||
| BREWERS - 3.6% | ||||||||
| Anheuser-Busch InBev N.V. ADR | 1,812 | 192,905 | ||||||
| Molson Coors Brewing Co. — | ||||||||
| Class B | 3,311 | 185,913 | ||||||
| AMBEV S.A. ADR | 25,125 | 184,669 | ||||||
| Total Brewers | 563,487 | |||||||
| FOOD DISTRIBUTORS - 2.4% | ||||||||
| Sysco Corp. | 7,375 | 266,238 | ||||||
| United Natural Foods, Inc.* | 1,475 | 111,200 | ||||||
| Total Food Distributors | 377,438 | |||||||
| Total Common Stocks | ||||||||
| (Cost $8,724,258) | 15,470,563 | |||||||
| 32 | THE RYDEX FUNDS ANNUAL REPORT | SEE NOTES TO FINANCIAL STATEMENTS. |
| SCHEDULE OF INVESTMENTS (concluded) | December 31, 2013 |
| CONSUMER PRODUCTS FUND |
| Face | ||||||||
| Amount | Value | |||||||
| REPURCHASE AGREEMENT††,2 - 0.4% | ||||||||
| Credit Suisse Group | ||||||||
| issued 12/31/13 at 0.00% | ||||||||
| due 01/02/14 | $ | 62,074 | $ | 62,074 | ||||
| Total Repurchase Agreement | ||||||||
| (Cost $62,074) | 62,074 | |||||||
| SECURITIES LENDING COLLATERAL††,3 - 0.4% | ||||||||
| Repurchase Agreements | ||||||||
| HSBC Securities, Inc. | ||||||||
| issued 12/31/13 at 0.01% | ||||||||
| due 01/02/14 | 58,894 | 58,894 | ||||||
| Deutsche Bank Securities, Inc. | ||||||||
| issued 12/31/13 at 0.02% | ||||||||
| due 01/02/14 | 8,681 | 8,681 | ||||||
| Total Securities Lending Collateral | ||||||||
| (Cost $67,575) | 67,575 | |||||||
| Total Investments - 100.9% | ||||||||
| (Cost $8,853,907) | $ | 15,600,212 | ||||||
| Other Assets & Liabilities, net - (0.9)% | (151,885 | ) | ||||||
| Total Net Assets - 100.0% | $ | 15,448,327 | ||||||
| * | Non-income producing security. |
| † | Value determined based on Level 1 inputs — See Note 4. |
| †† | Value determined based on Level 2 inputs — See Note 4. |
| 1 | All or portion of this security is on loan at December 31, 2013 — See Note 8. |
| 2 | Repurchase Agreement — See Note 5. |
| 3 | Securities lending collateral — See Note 8. |
| ADR — American Deposit Receipt | |
| plc — Public Limited Company |
| SEE NOTES TO FINANCIAL STATEMENTS. | THE RYDEX FUNDS ANNUAL REPORT | 33 |
| CONSUMER PRODUCTS FUND |
STATEMENT OF ASSETS AND LIABILITIES
December 31, 2013
| Assets: | ||||
| Investments, at value - including $66,895 of securities loaned | ||||
| (cost $8,724,258) | $ | 15,470,563 | ||
| Repurchase agreements, at value | ||||
| (cost $129,649) | 129,649 | |||
| Total investments | ||||
| (cost $8,853,907) | 15,600,212 | |||
| Receivables: | ||||
| Dividends | 39,275 | |||
| Foreign taxes reclaim | 874 | |||
| Interest and securities lending income | 133 | |||
| Total assets | 15,640,494 | |||
| Liabilities: | ||||
| Payable for: | ||||
| Fund shares redeemed | 81,423 | |||
| Upon return of securities loaned | 67,575 | |||
| Management fees | 10,668 | |||
| Transfer agent and administrative fees | 3,138 | |||
| Investor service fees | 3,138 | |||
| Portfolio accounting fees | 1,255 | |||
| Miscellaneous | 24,970 | |||
| Total liabilities | 192,167 | |||
| Net assets | $ | 15,448,327 | ||
| Net assets consist of: | ||||
| Paid in capital | $ | 8,618,198 | ||
| Undistributed net investment income | 123,887 | |||
| Accumulated net realized loss on investments | (40,063 | ) | ||
| Net unrealized appreciation on investments | 6,746,305 | |||
| Net assets | $ | 15,448,327 | ||
| Capital shares outstanding | 271,291 | |||
| Net asset value per share | $ | 56.94 |
STATEMENT OF OPERATIONS
Year Ended December 31, 2013
| Investment Income: | ||||
| Dividends (net of foreign withholding tax of $4,357) | $ | 404,205 | ||
| Income from securities lending, net | 3,550 | |||
| Interest | 27 | |||
| Total investment income | 407,782 | |||
| Expenses: | ||||
| Management fees | 147,196 | |||
| Transfer agent and administrative fees | 43,293 | |||
| Investor service fees | 43,293 | |||
| Portfolio accounting fees | 17,317 | |||
| Professional fees | 15,428 | |||
| Trustees’ fees* | 2,004 | |||
| Custodian fees | 1,978 | |||
| Line of credit interest expense | 129 | |||
| Miscellaneous | 13,257 | |||
| Total expenses | 283,895 | |||
| Net investment income | 123,887 | |||
| Net Realized and Unrealized Gain (Loss): | ||||
| Net realized gain (loss) on: | ||||
| Investments | 2,673,527 | |||
| Net realized gain | 2,673,527 | |||
| Net change in unrealized appreciation (depreciation) on: | ||||
| Investments | 1,185,365 | |||
| Net change in unrealized appreciation (depreciation) | 1,185,365 | |||
| Net realized and unrealized gain | 3,858,892 | |||
| Net increase in net assets resulting from operations | $ | 3,982,779 |
* Relates to Trustees not deemed “interested persons” within the meaning of Section 2(a)(19) of the 1940 Act.
| 34 | THE RYDEX FUNDS ANNUAL REPORT | SEE NOTES TO FINANCIAL STATEMENTS. |
| CONSUMER PRODUCTS FUND |
STATEMENTS OF CHANGES IN NET ASSETS
| Year Ended | Year Ended | |||||||
| December 31, | December 31, | |||||||
| 2013 | 2012 | |||||||
| Increase (Decrease) In Net Assets From Operations: | ||||||||
| Net investment income | $ | 123,887 | $ | 200,311 | ||||
| Net realized gain on investments | 2,673,527 | 2,189,282 | ||||||
| Net change in unrealized appreciation (depreciation) on investments | 1,185,365 | (976,524 | ) | |||||
| Net increase in net assets resulting from operations | 3,982,779 | 1,413,069 | ||||||
| Distributions to shareholders from: | ||||||||
| Net investment income | (200,161 | ) | (186,253 | ) | ||||
| Total distributions to shareholders | (200,161 | ) | (186,253 | ) | ||||
| Capital share transactions: | ||||||||
| Proceeds from sale of shares | 71,829,690 | 139,193,807 | ||||||
| Distributions reinvested | 200,161 | 186,253 | ||||||
| Cost of shares redeemed | (75,968,634 | ) | (148,093,902 | ) | ||||
| Net decrease from capital share transactions | (3,938,783 | ) | (8,713,842 | ) | ||||
| Net decrease in net assets | (156,165 | ) | (7,487,026 | ) | ||||
| Net assets: | ||||||||
| Beginning of year | 15,604,492 | 23,091,518 | ||||||
| End of year | $ | 15,448,327 | $ | 15,604,492 | ||||
| Undistributed net investment income at end of year | $ | 123,887 | $ | 200,165 | ||||
| Capital share activity: | ||||||||
| Shares sold | 1,372,479 | 3,138,218 | ||||||
| Shares issued from reinvestment of distributions | 3,581 | 4,195 | ||||||
| Shares redeemed | (1,451,404 | ) | (3,347,912 | ) | ||||
| Net decrease in shares | (75,344 | ) | (205,499 | ) | ||||
| SEE NOTES TO FINANCIAL STATEMENTS. | THE RYDEX FUNDS ANNUAL REPORT | 35 |
| CONSUMER PRODUCTS FUND |
FINANCIAL HIGHLIGHTS
This table is presented to show selected data for a share outstanding throughout each period and to assist shareholders in evaluating a Fund’s performance for the periods presented.
| Year Ended | Year Ended | Year Ended | Year Ended | Year Ended | ||||||||||||||||
| December 31, | December 31, | December 31, | December 31, | December 31, | ||||||||||||||||
| 2013 | 2012 | 2011 | 2010 | 2009 | ||||||||||||||||
| Per Share Data | ||||||||||||||||||||
| Net asset value, beginning of period | $ | 45.02 | $ | 41.82 | $ | 37.33 | $ | 32.25 | $ | 27.51 | ||||||||||
| Income (loss) from investment operations: | ||||||||||||||||||||
| Net investment incomea | .38 | .46 | .41 | .60 | .41 | |||||||||||||||
| Net gain on investments | ||||||||||||||||||||
| (realized and unrealized) | 12.31 | 3.33 | 4.70 | 4.96 | 4.85 | |||||||||||||||
| Total from investment operations | 12.69 | 3.79 | 5.11 | 5.56 | 5.26 | |||||||||||||||
| Less distributions from: | ||||||||||||||||||||
| Net investment income | (.77 | ) | (.59 | ) | (.62 | ) | (.48 | ) | (.52 | ) | ||||||||||
| Total distributions | (.77 | ) | (.59 | ) | (.62 | ) | (.48 | ) | (.52 | ) | ||||||||||
| Net asset value, end of period | $ | 56.94 | $ | 45.02 | $ | 41.82 | $ | 37.33 | $ | 32.25 | ||||||||||
| Total Returnb | 28.25 | % | 9.05 | % | 13.76 | % | 17.28 | % | 19.12 | % | ||||||||||
| Ratios/Supplemental Data | ||||||||||||||||||||
| Net assets, end of period (in thousands) | $ | 15,448 | $ | 15,604 | $ | 23,092 | $ | 15,259 | $ | 21,252 | ||||||||||
| Ratios to average net assets: | ||||||||||||||||||||
| Net investment income | 0.72 | % | 1.06 | % | 1.02 | % | 1.76 | % | 1.43 | % | ||||||||||
| Total expenses | 1.64 | % | 1.67 | % | 1.69 | % | 1.65 | % | 1.66 | % | ||||||||||
| Portfolio turnover rate | 438 | % | 636 | % | 368 | % | 442 | % | 259 | % | ||||||||||
| a | Net investment income per share was computed using average shares outstanding throughout the period. |
| b | Total return does not reflect the impact of any additional fees charged by insurance companies. |
| 36 | THE RYDEX FUNDS ANNUAL REPORT | SEE NOTES TO FINANCIAL STATEMENTS. |
| This page intentionally left blank. |
| THE RYDEX FUNDS ANNUAL REPORT | 37 |
| PERFORMANCE REPORT AND FUND PROFILE (Unaudited) | December 31, 2013 |
OBJECTIVE: Seeks to provide capital appreciation by investing in companies that are involved in the electronics sector, including semiconductor manufacturers and distributors, and makers and vendors of other electronic components and devices (“Electronics Companies”).
For the year ended December 31, 2013, Electronics Fund returned 35.05%, compared with a gain of 32.39% for the S&P 500 Index. The S&P 500 Information Technology Index returned 28.43%.
The semiconductors and semiconductor equipment holdings that make up most of the Fund contributed all of the Fund’s performance.
For the year, Fund performance got the biggest boost from Micron Technology, Inc., Intel Corp. and Texas Instruments, Inc.
Holdings providing the least to Fund performance for the period were Mellanox Technologies Ltd., Cirrus Logic, Inc. and Broadcom Corp. Class A.
Performance displayed represents past performance, which is no guarantee of future results.
Holdings Diversification (Market Exposure as % of Net Assets)
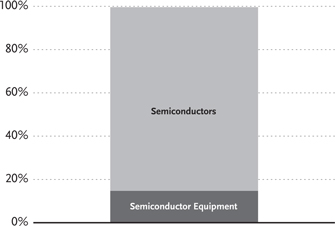
“Holdings Diversification (Market Exposure as % of Net Assets)” excludes any temporary cash investments.
Inception Date: August 3, 2001
| Ten Largest Holdings (% of Total Net Assets) | ||||
| Intel Corp. | 8.8 | % | ||
| Texas Instruments, Inc. | 5.4 | % | ||
| Micron Technology, Inc. | 3.8 | % | ||
| Applied Materials, Inc. | 3.6 | % | ||
| Broadcom Corp. — Class A | 3.2 | % | ||
| Analog Devices, Inc. | 3.1 | % | ||
| Xilinx, Inc. | 2.8 | % | ||
| Taiwan Semiconductor Manufacturing Company Ltd. ADR | 2.6 | % | ||
| KLA-Tencor Corp. | 2.6 | % | ||
| Linear Technology Corp. | 2.5 | % | ||
| Top Ten Total | 38.4 | % | ||
“Ten Largest Holdings” exclude any temporary cash or derivative investments.
| 38 | THE RYDEX FUNDS ANNUAL REPORT |
| PERFORMANCE REPORT AND FUND PROFILE (Unaudited) (concluded) |
Cumulative Fund Performance*,†
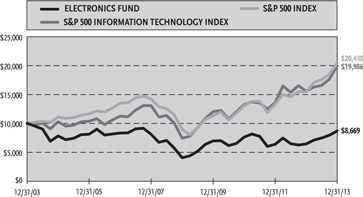
Average Annual Returns
Periods Ended December 31, 2013*,†
| 1 Year | 5 Year | 10 Year | ||||||||||
| Electronics Fund | 35.05 | % | 16.50 | % | -1.42 | % | ||||||
| S&P 500 Information Technology Index | 28.43 | % | 21.90 | % | 7.17 | % | ||||||
| S&P 500 Index | 32.39 | % | 17.94 | % | 7.41 | % | ||||||
| * | The performance data above represents past performance that is not predictive of future results. The investment return and principal value of an investment in the Fund will fluctuate so that an investor’s shares, when redeemed, may be worth more or less than their original cost. Returns are historical and include changes in principal and reinvested dividends and capital gains and do not reflect the effect of taxes. The S&P 500 Index and the S&P 500 Information Technology index are unmanaged indices and, unlike the Fund, have no management fees or operating expenses to reduce their reported returns. |
| † | Returns do not reflect the impact of any additional fees charged by insurance companies. |
| THE RYDEX FUNDS ANNUAL REPORT | 39 |
| SCHEDULE OF INVESTMENTS | December 31, 2013 |
| ELECTRONICS FUND | |
| Shares | Value | |||||||
| COMMON STOCKS† - 99.6% | ||||||||
| SEMICONDUCTORS – 84.9% | ||||||||
| Intel Corp. | 11,109 | $ | 288,389 | |||||
| Texas Instruments, Inc. | 4,045 | 177,615 | ||||||
| Micron Technology, Inc.* | 5,710 | 124,250 | ||||||
| Broadcom Corp. — Class A | 3,512 | 104,131 | ||||||
| Analog Devices, Inc. | 1,996 | 101,656 | ||||||
| Xilinx, Inc. | 1,958 | 89,911 | ||||||
| Taiwan Semiconductor | ||||||||
| Manufacturing Company Ltd. ADR | 4,920 | 85,805 | ||||||
| Linear Technology Corp. | 1,819 | 82,855 | ||||||
| Altera Corp. | 2,547 | 82,854 | ||||||
| NVIDIA Corp. | 4,853 | 77,745 | ||||||
| Microchip Technology, Inc. | 1,702 | 76,165 | ||||||
| Cree, Inc.* | 1,143 | 71,518 | ||||||
| Maxim Integrated Products, Inc. | 2,557 | 71,366 | ||||||
| Avago Technologies Ltd. | 1,203 | 63,627 | ||||||
| Marvell Technology Group Ltd. | 4,210 | 60,540 | ||||||
| Skyworks Solutions, Inc.* | 2,078 | 59,348 | ||||||
| NXP Semiconductor N.V.* | 1,291 | 59,296 | ||||||
| First Solar, Inc.* | 1,033 | 56,443 | ||||||
| LSI Corp. | 4,815 | 53,061 | ||||||
| Freescale Semiconductor Ltd.* | 3,148 | 50,525 | ||||||
| Atmel Corp.* | 6,211 | 48,632 | ||||||
| Himax Technologies, Inc. ADR | 3,297 | 48,499 | ||||||
| ON Semiconductor Corp.* | 5,833 | 48,064 | ||||||
| ARM Holdings plc ADR | 875 | 47,898 | ||||||
| SunPower Corp.* | 1,561 | 46,533 | ||||||
| Trina Solar Ltd. ADR* | 3,373 | 46,109 | ||||||
| Canadian Solar, Inc.* | 1,439 | 42,911 | ||||||
| Mellanox Technologies Ltd.* | 1,011 | 40,410 | ||||||
| Microsemi Corp.* | 1,575 | 39,296 | ||||||
| JinkoSolar Holding Company Ltd. ADR* | 1,265 | 37,065 | ||||||
| Yingli Green Energy Holding Company Ltd. | ||||||||
| ADR*,1 | 7,248 | 36,602 | ||||||
| Semtech Corp.* | 1,447 | 36,580 | ||||||
| International Rectifier Corp.* | 1,329 | 34,647 | ||||||
| JA Solar Holdings Company Ltd. ADR* | 3,756 | 34,443 | ||||||
| Synaptics, Inc.* | 660 | 34,195 | ||||||
| Fairchild Semiconductor | ||||||||
| International, Inc.* | 2,529 | 33,762 | ||||||
| RF Micro Devices, Inc.* | 6,338 | 32,704 | ||||||
| Cavium, Inc.* | 936 | 32,301 | ||||||
| Integrated Device Technology, Inc.* | 3,157 | 32,170 | ||||||
| Cypress Semiconductor Corp. | 3,009 | 31,595 | ||||||
| Intersil Corp. — Class A | 2,686 | 30,808 | ||||||
| TriQuint Semiconductor, Inc.* | 3,669 | 30,599 | ||||||
| Monolithic Power Systems, Inc.* | 867 | 30,050 | ||||||
| Cirrus Logic, Inc.* | 1,444 | 29,501 | ||||||
| OmniVision Technologies, Inc.* | 1,451 | 24,957 | ||||||
| Total Semiconductors | 2,767,431 | |||||||
| SEMICONDUCTOR EQUIPMENT - 14.7% | ||||||||
| Applied Materials, Inc. | 6,713 | 118,752 | ||||||
| KLA-Tencor Corp. | 1,299 | 83,734 | ||||||
| Lam Research Corp.* | 1,394 | 75,903 | ||||||
| ASML Holding N.V. | 555 | 52,004 | ||||||
| SunEdison, Inc.* | 3,664 | 47,815 | ||||||
| Teradyne, Inc.* | 2,680 | 47,222 | ||||||
| Veeco Instruments, Inc.* | 878 | 28,895 | ||||||
| GT Advanced Technologies, Inc.* | 3,045 | 26,552 | ||||||
| Total Semiconductor Equipment | 480,877 | |||||||
| Total Common Stocks | ||||||||
| (Cost $1,717,753) | 3,248,308 | |||||||
| Face | ||||||||
| Amount | ||||||||
| REPURCHASE AGREEMENT††,2 - 0.8% | ||||||||
| Credit Suisse Group | ||||||||
| issued 12/31/13 at 0.00% | ||||||||
| due 01/02/14 | $ | 25,030 | 25,030 | |||||
| Total Repurchase Agreement | ||||||||
| (Cost $25,030) | 25,030 | |||||||
| SECURITIES LENDING COLLATERAL††,3 - 0.9% | ||||||||
| Repurchase Agreements | ||||||||
| HSBC Securities, Inc. | ||||||||
| issued 12/31/13 at 0.01% | ||||||||
| due 01/02/14 | 25,100 | 25,100 | ||||||
| Deutsche Bank Securities, Inc. | ||||||||
| issued 12/31/13 at 0.02% | ||||||||
| due 01/02/14 | 3,700 | 3,700 | ||||||
| Total Securities Lending Collateral | ||||||||
| (Cost $28,800) | 28,800 | |||||||
| Total Investments - 101.3% | ||||||||
| (Cost $1,771,583) | $ | 3,302,138 | ||||||
| Other Assets & Liabilities, net - (1.3)% | (41,518 | ) | ||||||
| Total Net Assets - 100.0% | $ | 3,260,620 | ||||||
| * | Non-income producing security. |
| † | Value determined based on Level 1 inputs — See Note 4. |
| †† | Value determined based on Level 2 inputs — See Note 4. |
| 1 | All or portion of this security is on loan at December 31, 2013 — See Note 8. |
| 2 | Repurchase Agreement — See Note 5. |
| 3 | Securities lending collateral — See Note 8. |
ADR — American Deposit Receipt
plc — Public Limited Company
| 40 | THE RYDEX FUNDS ANNUAL REPORT | SEE NOTES TO FINANCIAL STATEMENTS. |
ELECTRONICS FUND
STATEMENT OF ASSETS
AND LIABILITIES
December 31, 2013
| Assets: | ||||
| Investments, at value - including $24,240 of securities loaned | ||||
| (cost $1,717,753) | $ | 3,248,308 | ||
| Repurchase agreements, at value | ||||
| (cost $53,830) | 53,830 | |||
| Total investments (cost $1,771,583) | 3,302,138 | |||
| Receivables: | ||||
| Securities sold | 88,590 | |||
| Dividends | 657 | |||
| Interest and securities lending income | 58 | |||
| Foreign taxes reclaim | 44 | |||
| Total assets | 3,391,487 | |||
| Liabilities: | ||||
| Payable for: | ||||
| Fund shares redeemed | 93,340 | |||
| Upon return of securities loaned | 28,800 | |||
| Management fees | 2,155 | |||
| Transfer agent and administrative fees | 634 | |||
| Investor service fees | 634 | |||
| Portfolio accounting fees | 254 | |||
| Miscellaneous | 5,050 | |||
| Total liabilities | 130,867 | |||
| Net assets | $ | 3,260,620 | ||
| Net assets consist of: | ||||
| Paid in capital | $ | 4,769,595 | ||
| Undistributed net investment income | 108 | |||
| Accumulated net realized loss on investments | (3,039,638 | ) | ||
| Net unrealized appreciation on investments | 1,530,555 | |||
| Net assets | $ | 3,260,620 | ||
| Capital shares outstanding | 84,022 | |||
| Net asset value per share | $ | 38.81 |
STATEMENT OF
OPERATIONS
Year Ended December 31, 2013
| Investment Income: | ||||
| Dividends (net of foreign withholding tax of $48) | $ | 56,968 | ||
| Income from securities lending, net | 736 | |||
| Interest | 7 | |||
| Total investment income | 57,711 | |||
| Expenses: | ||||
| Management fees | 29,664 | |||
| Transfer agent and administrative fees | 8,725 | |||
| Investor service fees | 8,725 | |||
| Portfolio accounting fees | 3,490 | |||
| Professional fees | 3,112 | |||
| Trustees’ fees* | 424 | |||
| Custodian fees | 386 | |||
| Line of credit interest expense | 28 | |||
| Miscellaneous | 2,633 | |||
| Total expenses | 57,187 | |||
| Net investment income | 524 | |||
| Net Realized and Unrealized Gain (Loss): | ||||
| Net realized gain (loss) on: | ||||
| Investments | 875,640 | |||
| Net realized gain | 875,640 | |||
| Net change in unrealized appreciation (depreciation) on: | ||||
| Investments | 135,208 | |||
| Net change in unrealized appreciation (depreciation) | 135,208 | |||
| Net realized and unrealized gain | 1,010,848 | |||
| Net increase in net assets resulting from operations | $ | 1,011,372 |
* Relates to Trustees not deemed “interested persons” within the meaning of Section 2(a)(19) of the 1940 Act.
| SEE NOTES TO FINANCIAL STATEMENTS. | THE RYDEX FUNDS ANNUAL REPORT | 41 |
ELECTRONICS FUND
STATEMENTS OF CHANGES IN NET ASSETS
| Year Ended | Year Ended | |||||||
| December 31, | December 31, | |||||||
| 2013 | 2012 | |||||||
| Increase (Decrease) In Net Assets From Operations: | ||||||||
| Net investment income | $ | 524 | $ | 7,977 | ||||
| Net realized gain (loss) on investments | 875,640 | (93,552 | ) | |||||
| Net change in unrealized appreciation (depreciation) on investments | 135,208 | 86,975 | ||||||
| Net increase in net assets resulting from operations | 1,011,372 | 1,400 | ||||||
| Distributions to shareholders from: | ||||||||
| Net investment income | (7,978 | ) | — | |||||
| Total distributions to shareholders | (7,978 | ) | — | |||||
| Capital share transactions: | ||||||||
| Proceeds from sale of shares | 24,329,919 | 37,822,269 | ||||||
| Distributions reinvested | 7,978 | — | ||||||
| Cost of shares redeemed | (25,940,355 | ) | (37,017,188 | ) | ||||
| Net increase (decrease) from capital share transactions | (1,602,458 | ) | 805,081 | |||||
| Net increase (decrease) in net assets | (599,064 | ) | 806,481 | |||||
| Net assets: | ||||||||
| Beginning of year | 3,859,684 | 3,053,203 | ||||||
| End of year | $ | 3,260,620 | $ | 3,859,684 | ||||
| Undistributed net investment income at end of year | $ | 108 | $ | 7,978 | ||||
| Capital share activity:* | ||||||||
| Shares sold | 724,354 | 1,270,621 | ||||||
| Shares issued from reinvestment of distributions | 220 | — | ||||||
| Shares redeemed | (774,647 | ) | (1,243,573 | ) | ||||
| Net increase (decrease) in shares | (50,073 | ) | 27,048 | |||||
| * | Capital share activity for the year ended December 31, 2012 and the period January 1, 2013 through April 5, 2013 has been restated to reflect a 1:10 reverse share split effective April 5, 2013. See Note 9 in Notes to Financial Statements. |
| 42 | THE RYDEX FUNDS ANNUAL REPORT | SEE NOTES TO FINANCIAL STATEMENTS. |
ELECTRONICS FUND
FINANCIAL HIGHLIGHTS
This table is presented to show selected data for a share outstanding throughout each period and to assist shareholders in evaluating a Fund’s performance for the periods presented.
| Year Ended | Year Ended | Year Ended | Year Ended | Year Ended | ||||||||||||||||
| December 31, | December 31, | December 31, | December 31, | December 31, | ||||||||||||||||
| 2013c | 2012c | 2011c | 2010c | 2009c | ||||||||||||||||
| Per Share Data | ||||||||||||||||||||
| Net asset value, beginning of period | $ | 28.78 | $ | 28.52 | $ | 94.34 | $ | 117.22 | $ | 68.21 | ||||||||||
| Income (loss) from investment operations: | ||||||||||||||||||||
| Net investment income (loss)a | — | d | .06 | (.58 | ) | (.51 | ) | (.20 | ) | |||||||||||
| Net gain (loss) on investments (realized and unrealized) | 10.12 | .20 | (11.64 | ) | 9.27 | 49.21 | ||||||||||||||
| Total from investment operations | 10.12 | .26 | (12.22 | ) | 8.76 | 49.01 | ||||||||||||||
| Less distributions from: | ||||||||||||||||||||
| Net investment income | (.09 | ) | — | — | — | — | ||||||||||||||
| Net realized gains | — | — | (53.60 | ) | (31.64 | ) | — | |||||||||||||
| Total distributions | (.09 | ) | — | (53.60 | ) | (31.64 | ) | — | ||||||||||||
| Net asset value, end of period | $ | 38.81 | $ | 28.78 | $ | 28.52 | $ | 94.34 | $ | 117.22 | ||||||||||
| Total Returnb | 35.05 | % | 1.05 | % | (16.49 | %) | 9.55 | % | 71.85 | % | ||||||||||
| Ratios/Supplemental Data | ||||||||||||||||||||
| Net assets, end of period (in thousands) | $ | 3,261 | $ | 3,860 | $ | 3,053 | $ | 9,238 | $ | 25,029 | ||||||||||
| Ratios to average net assets: | ||||||||||||||||||||
| Net investment income (loss) | 0.02 | % | 0.19 | % | (0.68 | %) | (0.46 | %) | (0.19 | %) | ||||||||||
| Total expenses | 1.64 | % | 1.67 | % | 1.72 | % | 1.64 | % | 1.64 | % | ||||||||||
| Portfolio turnover rate | 745 | % | 910 | % | 859 | % | 958 | % | 445 | % | ||||||||||
| a | Net investment income (loss) per share was computed using average shares outstanding throughout the period. |
| b | Total return does not reflect the impact of any additional fees charged by insurance companies. |
| c | Reverse share split — Per share amounts for the years ended December 31, 2009, 2010, 2011, 2012 and the period January 1, 2013 through April 5, 2013 have been restated to reflect a 1:10 reverse share split effective April 5, 2013. See Note 9 in Notes to Financial Statements. |
| d | Net investment income is less than $0.01 per share. |
| SEE NOTES TO FINANCIAL STATEMENTS. | THE RYDEX FUNDS ANNUAL REPORT | 43 |
| PERFORMANCE REPORT AND FUND PROFILE (Unaudited) | December 31, 2013 |
OBJECTIVE: Seeks to provide capital appreciation by investing in companies involved in the energy field, including the exploration, production, and development of oil, gas, coal and alternative sources of energy (“Energy Companies”).
For the year ended December 31, 2013, Energy Fund returned 23.47%, compared with the 32.39% increase in the S&P 500 Index. The S&P 500 Energy Index returned 25.07%.
Within the sector, the oil, gas & consumable fuels group contributed the most to return, followed by energy equipment & services. The lightly weighted industrial conglomerates group was the only detractor from return.
Exxon Mobil Corp., Schlumberger N.V. and Chevron Corp. were the most significant positive contributors to Fund performance for the year.
Holdings detracting most from performance were Petroleo Brasileiro, S.A., Cobalt International Energy, Inc. and Peabody Energy Corp.
Performance displayed represents past performance, which is no guarantee of future results.
Holdings Diversification (Market Exposure as % of Net Assets)
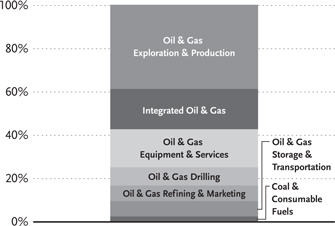
“Holdings Diversification (Market Exposure as % of Net Assets)” excludes any temporary cash investments.
Inception Date: May 29, 2001
| Ten Largest Holdings (% of Total Net Assets) | ||||
| Exxon Mobil Corp. | 5.9 | % | ||
| Chevron Corp. | 4.4 | % | ||
| Schlumberger Ltd. | 3.2 | % | ||
| ConocoPhillips | 2.7 | % | ||
| Occidental Petroleum Corp. | 2.5 | % | ||
| Phillips 66 | 1.9 | % | ||
| EOG Resources, Inc. | 1.9 | % | ||
| Halliburton Co. | 1.9 | % | ||
| Anadarko Petroleum Corp. | 1.8 | % | ||
| Kinder Morgan, Inc. | 1.7 | % | ||
| Top Ten Total | 27.9 | % |
“Ten Largest Holdings” exclude any temporary cash or derivative investments.
44 | THE RYDEX FUNDS ANNUAL REPORT
PERFORMANCE REPORT AND FUND PROFILE (Unaudited) (concluded)
Cumulative Fund Performance*,†
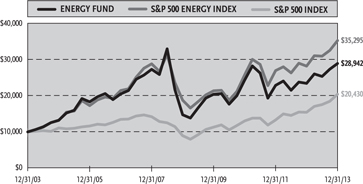
Average Annual Returns
Periods Ended December 31, 2013*,†
| 1 Year | 5 Year | 10 Year | ||||||||||
| Energy Fund | 23.47 | % | 14.44 | % | 11.21 | % | ||||||
| S&P 500 Energy Index | 25.07 | % | 13.44 | % | 13.44 | % | ||||||
| S&P 500 Index | 32.39 | % | 17.94 | % | 7.41 | % | ||||||
| * | The performance data above represents past performance that is not predictive of future results. The investment return and principal value of an investment in the Fund will fluctuate so that an investor’s shares, when redeemed, may be worth more or less than their original cost. Returns are historical and include changes in principal and reinvested dividends and capital gains and do not reflect the effect of taxes. The S&P 500 Index and the S&P 500 Energy Index are unmanaged indices and, unlike the Fund, have no management fees or operating expenses to reduce their reported returns. |
| † | Returns do not reflect the impact of any additional fees charged by insurance companies. |
THE RYDEX FUNDS ANNUAL REPORT | 45
| SCHEDULE OF INVESTMENTS | December 31, 2013 |
ENERGY FUND
| Shares | Value | |||||||
| COMMON STOCKS† - 100.1% | ||||||||
| OIL & GAS EXPLORATION & PRODUCTION - 39.3% | ||||||||
| ConocoPhillips | 8,311 | $ | 587,173 | |||||
| EOG Resources, Inc. | 2,513 | 421,782 | ||||||
| Anadarko Petroleum Corp. | 4,933 | 391,286 | ||||||
| Apache Corp. | 4,247 | 364,987 | ||||||
| Marathon Oil Corp. | 8,989 | 317,312 | ||||||
| Devon Energy Corp. | 5,070 | 313,681 | ||||||
| Noble Energy, Inc. | 4,570 | 311,263 | ||||||
| Pioneer Natural Resources Co. | 1,659 | 305,372 | ||||||
| Continental Resources, Inc.* | 2,524 | 284,000 | ||||||
| Chesapeake Energy Corp. | 9,761 | 264,914 | ||||||
| Antero Resources Corp.* | 4,000 | 253,760 | ||||||
| Cabot Oil & Gas Corp. | 6,442 | 249,692 | ||||||
| Equities Corp. | 2,616 | 234,864 | ||||||
| Southwestern Energy Co.* | 5,858 | 230,395 | ||||||
| Range Resources Corp. | 2,731 | 230,251 | ||||||
| Murphy Oil Corp. | 3,333 | 216,245 | ||||||
| Concho Resources, Inc.* | 1,934 | 208,872 | ||||||
| Cimarex Energy Co. | 1,804 | 189,258 | ||||||
| Cobalt International Energy, Inc.* | 11,210 | 184,405 | ||||||
| Encana Corp. | 9,828 | 177,395 | ||||||
| Canadian Natural Resources Ltd. | 5,094 | 172,381 | ||||||
| Whiting Petroleum Corp.* | 2,716 | 168,039 | ||||||
| Talisman Energy, Inc. | 13,128 | 152,941 | ||||||
| Gulfport Energy Corp.* | 2,420 | 152,823 | ||||||
| Denbury Resources, Inc.* | 9,260 | 152,142 | ||||||
| SM Energy Co. | 1,794 | 149,099 | ||||||
| Energy XXI Bermuda Ltd. | 5,500 | 148,830 | ||||||
| QEP Resources, Inc. | 4,824 | 147,856 | ||||||
| Energen Corp. | 2,020 | 142,915 | ||||||
| Oasis Petroleum, Inc.* | 2,834 | 133,113 | ||||||
| WPX Energy, Inc.* | 6,337 | 129,148 | ||||||
| Laredo Petroleum, Inc.* | 4,560 | 126,266 | ||||||
| Ultra Petroleum Corp.*,1 | 5,451 | 118,014 | ||||||
| Newfield Exploration Co.* | 4,675 | 115,145 | ||||||
| Rosetta Resources, Inc.* | 2,300 | 110,492 | ||||||
| Kodiak Oil & Gas Corp.* | 9,511 | 106,618 | ||||||
| Diamondback Energy, Inc.* | 1,930 | 102,020 | ||||||
| Carrizo Oil & Gas, Inc.* | 2,030 | 90,883 | ||||||
| PDC Energy, Inc.* | 1,660 | 88,345 | ||||||
| SandRidge Energy, Inc.*,1 | 14,479 | 87,888 | ||||||
| Stone Energy Corp.* | 2,370 | 81,978 | ||||||
| Magnum Hunter Resources Corp.* | 9,760 | 71,346 | ||||||
| Bill Barrett Corp.* | 2,590 | 69,360 | ||||||
| Goodrich Petroleum Corp.* | 3,220 | 54,804 | ||||||
| Total Oil & Gas Exploration & Production | 8,609,353 | |||||||
| INTEGRATED OIL & GAS - 18.2% | ||||||||
| Exxon Mobil Corp. | 12,781 | 1,293,438 | ||||||
| Chevron Corp. | 7,697 | 961,433 | ||||||
| Occidental Petroleum Corp. | 5,758 | 547,586 | ||||||
| Hess Corp. | 3,987 | 330,921 | ||||||
| BP plc ADR | 5,205 | 253,015 | ||||||
| Petroleo Brasileiro S.A. ADR | 14,504 | 199,865 | ||||||
| Royal Dutch Shell plc ADR | 2,798 | 199,413 | ||||||
| Suncor Energy, Inc. | 5,500 | 192,775 | ||||||
| Total Integrated Oil & Gas | 3,978,446 | |||||||
| OIL & GAS EQUIPMENT & SERVICES - 17.6% | ||||||||
| Schlumberger Ltd. | 7,694 | 693,305 | ||||||
| Halliburton Co. | 8,233 | 417,825 | ||||||
| National Oilwell Varco, Inc. | 4,658 | 370,451 | ||||||
| Baker Hughes, Inc. | 5,698 | 314,871 | ||||||
| Cameron International Corp.* | 3,949 | 235,084 | ||||||
| FMC Technologies, Inc.* | 4,222 | 220,431 | ||||||
| Weatherford International Ltd.* | 13,297 | 205,971 | ||||||
| Oceaneering International, Inc. | 2,348 | 185,210 | ||||||
| Oil States International, Inc.* | 1,493 | 151,868 | ||||||
| Core Laboratories N.V. | 788 | 150,469 | ||||||
| Dresser-Rand Group, Inc.* | 2,260 | 134,764 | ||||||
| Tenaris S.A. ADR | 3,026 | 132,206 | ||||||
| Superior Energy Services, Inc.* | 4,965 | 132,119 | ||||||
| Dril-Quip, Inc.* | 1,200 | 131,916 | ||||||
| CARBO Ceramics, Inc. | 900 | 104,877 | ||||||
| Helix Energy Solutions Group, Inc.* | 4,250 | 98,515 | ||||||
| McDermott International, Inc.* | 10,465 | 95,859 | ||||||
| Hornbeck Offshore Services, Inc.* | 1,740 | 85,660 | ||||||
| Total Oil & Gas Equipment & Services | 3,861,401 | |||||||
| OIL & GAS DRILLING - 8.4% | ||||||||
| Transocean Ltd. | 5,594 | 276,455 | ||||||
| Noble Corporation plc | 6,304 | 236,211 | ||||||
| Ensco plc — Class A | 3,979 | 227,519 | ||||||
| Helmerich & Payne, Inc. | 2,254 | 189,516 | ||||||
| Nabors Industries Ltd. | 10,617 | 180,383 | ||||||
| Diamond Offshore Drilling, Inc. | 3,165 | 180,152 | ||||||
| Seadrill Ltd. | 4,310 | 177,055 | ||||||
| Rowan Companies plc — Class A* | 3,830 | 135,429 | ||||||
| Atwood Oceanics, Inc.* | 2,230 | 119,060 | ||||||
| Patterson-UTI Energy, Inc. | 4,639 | 117,459 | ||||||
| Total Oil & Gas Drilling | 1,839,239 | |||||||
| OIL & GAS REFINING & MARKETING - 7.1% | ||||||||
| Phillips 66 | 5,528 | 426,375 | ||||||
| Marathon Petroleum Corp. | 3,604 | 330,595 | ||||||
| Valero Energy Corp. | 6,463 | 325,735 | ||||||
| HollyFrontier Corp. | 3,909 | 194,238 | ||||||
| Tesoro Corp. | 2,972 | 173,862 | ||||||
| Western Refining, Inc. | 2,730 | 115,779 | ||||||
| Total Oil & Gas Refining & Marketing | 1,566,584 | |||||||
| 46 | THE RYDEX FUNDS ANNUAL REPORT | SEE NOTES TO FINANCIAL STATEMENTS. |
| SCHEDULE OF INVESTMENTS (concluded) | December 31, 2013 | ||
| ENERGY FUND | |||
| Shares | Value | |||||||
| OIL & GAS STORAGE & TRANSPORTATION - 7.0% | ||||||||
| Kinder Morgan, Inc. | 10,526 | $ | 378,937 | |||||
| Williams Companies, Inc. | 8,206 | 316,505 | ||||||
| Spectra Energy Corp. | 8,684 | 309,324 | ||||||
| Cheniere Energy, Inc.* | 4,769 | 205,639 | ||||||
| Kinder Morgan Management LLC* | 2,553 | 193,160 | ||||||
| Enbridge, Inc. | 3,230 | 141,086 | ||||||
| Total Oil & Gas Storage & Transportation | 1,544,651 | |||||||
| COAL & CONSUMABLE FUELS - 2.5% | ||||||||
| CONSOL Energy, Inc. | 4,776 | 181,679 | ||||||
| Peabody Energy Corp. | 7,317 | 142,901 | ||||||
| Cameco Corp. | 6,430 | 133,551 | ||||||
| Alpha Natural Resources, Inc.* | 11,195 | 79,932 | ||||||
| Total Coal & Consumable Fuels | 538,063 | |||||||
| Total Common Stocks | ||||||||
| (Cost $10,461,347) | 21,937,737 | |||||||
| Face | ||||||||
| Amount | ||||||||
| REPURCHASE AGREEMENT††,2 - 0.8% | ||||||||
| Credit Suisse Group | ||||||||
| issued 12/31/13 at 0.00% | ||||||||
| due 01/02/14 | $ | 183,950 | 183,950 | |||||
| Total Repurchase Agreement | ||||||||
| (Cost $183,950) | 183,950 | |||||||
| SECURITIES LENDING COLLATERAL††,3 - 0.6% | ||||||||
| Repurchase Agreements | ||||||||
| HSBC Securities, Inc. | ||||||||
| issued 12/31/13 at 0.01% | ||||||||
| due 01/02/14 | 115,696 | 115,696 | ||||||
| Deutsche Bank Securities, Inc. | ||||||||
| issued 12/31/13 at 0.02% | ||||||||
| due 01/02/14 | 17,054 | 17,054 | ||||||
| Total Securities Lending Collateral | ||||||||
| (Cost $132,750) | 132,750 | |||||||
| Total Investments - 101.5% | ||||||||
| (Cost $10,778,047) | $ | 22,254,437 | ||||||
| Other Assets & Liabilities, net - (1.5)% | (341,414 | ) | ||||||
| Total Net Assets - 100.0% | $ | 21,913,023 | ||||||
| * | Non-income producing security. |
| † | Value determined based on Level 1 inputs — See Note 4. |
| †† | Value determined based on Level 2 inputs — See Note 4. |
| 1 | All or portion of this security is on loan at December 31, 2013 — See Note 8. |
| 2 | Repurchase Agreement — See Note 5. |
| 3 | Securities lending collateral — See Note 8. |
ADR — American Depository Receipt
plc — Public Limited Company
| SEE NOTES TO FINANCIAL STATEMENTS. | THE RYDEX FUNDS ANNUAL REPORT | 47 |
ENERGY FUND
STATEMENT OF ASSETS
AND LIABILITIES
December 31, 2013
| Assets: | ||||
| Investments, at value - including $129,090 of securities loaned | ||||
| (cost $10,461,347) | $ | 21,937,737 | ||
| Repurchase agreements, at value | ||||
| (cost $316,700) | 316,700 | |||
| Total investments | ||||
| (cost $10,778,047) | 22,254,437 | |||
| Cash | 21 | |||
| Receivables: | ||||
| Dividends | 9,962 | |||
| Interest and securities lending income | 121 | |||
| Total assets | 22,264,541 | |||
| Liabilities: | ||||
| Payable for: | ||||
| Fund shares redeemed | 159,873 | |||
| Upon return of securities loaned | 132,750 | |||
| Management fees | 15,258 | |||
| Transfer agent and administrative fees | 4,488 | |||
| Investor service fees | 4,488 | |||
| Portfolio accounting fees | 1,795 | |||
| Miscellaneous | 32,866 | |||
| Total liabilities | 351,518 | |||
| Net assets | $ | 21,913,023 | ||
| Net assets consist of: | ||||
| Paid in capital | $ | 9,787,969 | ||
| Undistributed net investment income | 41,547 | |||
| Accumulated net realized gain on investments | 607,117 | |||
| Net unrealized appreciation on investments | 11,476,390 | |||
| Net assets | $ | 21,913,023 | ||
| Capital shares outstanding | 706,964 | |||
| Net asset value per share | $ | 31.00 |
STATEMENT OF
OPERATIONS
Year Ended December 31, 2013
| Investment Income: | ||||
| Dividends (net of foreign withholding tax of $6,968) | $ | 407,977 | ||
| Income from securities lending, net | 8,639 | |||
| Interest | 32 | |||
| Total investment income | 416,648 | |||
| Expenses: | ||||
| Management fees | 194,496 | |||
| Transfer agent and administrative fees | 57,204 | |||
| Investor service fees | 57,204 | |||
| Portfolio accounting fees | 22,882 | |||
| Professional fees | 20,081 | |||
| Trustees’ fees* | 2,709 | |||
| Custodian fees | 2,571 | |||
| Line of credit interest expense | 143 | |||
| Miscellaneous | 17,361 | |||
| Total expenses | 374,651 | |||
| Net investment income | 41,997 | |||
| Net Realized and Unrealized Gain (Loss): | ||||
| Net realized gain (loss) on: | ||||
| Investments | 4,028,903 | |||
| Net realized gain | 4,028,903 | |||
| Net change in unrealized appreciation (depreciation) on: | ||||
| Investments | 626,981 | |||
| Net change in unrealized appreciation (depreciation) | 626,981 | |||
| Net realized and unrealized gain | 4,655,884 | |||
| Net increase in net assets resulting from operations | $ | 4,697,881 |
* Relates to Trustees not deemed “interested persons” within the meaning of Section 2(a)(19) of the 1940 Act.
| 48 | THE RYDEX FUNDS ANNUAL REPORT | SEE NOTES TO FINANCIAL STATEMENTS. |
ENERGY FUND
| STATEMENTS OF CHANGES IN NET ASSETS |
| Year Ended | Year Ended | |||||||
| December 31, | December 31, | |||||||
| 2013 | 2012 | |||||||
| Increase (decrease) in net assets from operations: | ||||||||
| Net investment income | $ | 41,997 | $ | 53,344 | ||||
| Net realized gain on investments | 4,028,903 | 1,409,717 | ||||||
| Net change in unrealized appreciation (depreciation) on investments | 626,981 | (1,060,264 | ) | |||||
| Net increase in net assets resulting from operations | 4,697,881 | 402,797 | ||||||
| Distributions to shareholders from: | ||||||||
| Net investment income | (45,288 | ) | — | |||||
| Net realized gains | (322,147 | ) | (3,408,847 | ) | ||||
| Total distributions to shareholders | (367,435 | ) | (3,408,847 | ) | ||||
| Capital share transactions: | ||||||||
| Proceeds from sale of shares | 42,493,841 | 46,443,885 | ||||||
| Distributions reinvested | 367,435 | 3,408,847 | ||||||
| Cost of shares redeemed | (47,175,094 | ) | (54,035,521 | ) | ||||
| Net decrease from capital share transactions | (4,313,818 | ) | (4,182,789 | ) | ||||
| Net increase (decrease) in net assets | 16,628 | (7,188,839 | ) | |||||
| Net assets: | ||||||||
| Beginning of year | 21,896,395 | 29,085,234 | ||||||
| End of year | $ | 21,913,023 | $ | 21,896,395 | ||||
| Undistributed net investment income at end of year | $ | 41,547 | $ | 52,814 | ||||
| Capital share activity: | ||||||||
| Shares sold | 1,485,631 | 1,602,288 | ||||||
| Shares issued from reinvestment of distributions | 11,988 | 136,792 | ||||||
| Shares redeemed | (1,648,785 | ) | (1,875,649 | ) | ||||
| Net decrease in shares | (151,166 | ) | (136,569 | ) | ||||
| See Notes to Financial Statements. | The RYDEX FUNDS ANNUAL REPORT | 49 |
Energy Fund
| FINANCIAL HIGHLIGHTS |
This table is presented to show selected data for a share outstanding throughout each period and to assist shareholders in evaluating a Fund’s performance for the periods presented.
| Year Ended | Year Ended | Year Ended | Year Ended | Year Ended | ||||||||||||||||
| December 31, | December 31, | December 31, | December 31, | December 31, | ||||||||||||||||
| 2013 | 2012 | 2011 | 2010 | 2009 | ||||||||||||||||
| Per Share Data | ||||||||||||||||||||
| Net asset value, beginning of period | $ | 25.52 | $ | 29.24 | $ | 31.24 | $ | 26.37 | $ | 20.49 | ||||||||||
| Income (loss) from investment operations: | ||||||||||||||||||||
| Net investment income (loss)a | .05 | .06 | (.10 | ) | (.05 | ) | .11 | |||||||||||||
| Net gain (loss) on investments | ||||||||||||||||||||
| (realized and unrealized) | 5.94 | .54 | (1.72 | ) | 5.06 | 7.73 | ||||||||||||||
| Total from investment operations | 5.99 | .60 | (1.82 | ) | 5.01 | 7.84 | ||||||||||||||
| Less distributions from: | ||||||||||||||||||||
| Net investment income | (.06 | ) | — | — | (.14 | ) | — | |||||||||||||
| Net realized gains | (.45 | ) | (4.32 | ) | (.18 | ) | — | (1.96 | ) | |||||||||||
| Total distributions | (.51 | ) | (4.32 | ) | (.18 | ) | (.14 | ) | (1.96 | ) | ||||||||||
| Net asset value, end of period | $ | 31.00 | $ | 25.52 | $ | 29.24 | $ | 31.24 | $ | 26.37 | ||||||||||
| Total Returnb | 23.47 | % | 2.40 | % | (5.85 | %) | 19.05 | % | 38.50 | % | ||||||||||
| Ratios/Supplemental Data | ||||||||||||||||||||
| Net assets, end of period (in thousands) | $ | 21,913 | $ | 21,896 | $ | 29,085 | $ | 42,413 | $ | 39,353 | ||||||||||
| Ratios to average net assets: | ||||||||||||||||||||
| Net investment income (loss) | 0.18 | % | 0.20 | % | (0.32 | %) | (0.20 | %) | 0.48 | % | ||||||||||
| Total expenses | 1.64 | % | 1.67 | % | 1.71 | % | 1.65 | % | 1.65 | % | ||||||||||
| Portfolio turnover rate | 190 | % | 155 | % | 197 | % | 224 | % | 206 | % | ||||||||||
| a | Net investment income (loss) per share was computed using average shares outstanding throughout the period. |
| b | Total return does not reflect the impact of any additional fees charged by insurance companies. |
| 50 | THE RYDEX FUNDS ANNUAL REPORT | SEE NOTES TO FINANCIAL STATEMENTS. |
| This page intentionally left blank. |
| the RYDEX FUNDS ANNUAL REPORT | 51 |
| PERFORMANCE REPORT AND FUND PROFILE (Unaudited) | December 31, 2013 |
OBJECTIVE: Seeks to provide capital appreciation by investing in companies that are involved in the energy services field, including those that provide services and equipment in the areas of oil, coal, and gas exploration and production (“Energy Services Companies”).
For the year ended December 31, 2013, Energy Services Fund returned 23.89%, compared with the S&P 500 Index, which gained 32.39%. The S&P 500 Energy Index returned 25.07%.
The energy equipment & services holdings in this Fund, which composed almost all the portfolio, accounted for the Fund’s return for the period. The industrial conglomerates industry detracted slightly from return.
Schlumberger N.V., Haliburton Co. and Baker Hughes, Inc. were the Fund’s best-performing holdings for the year.
The Fund’s worst-performing holdings included Diamond Offshore Drilling, Inc., McDermott International, Inc. and C&J Energy Services, Inc.
Performance displayed represents past performance, which is no guarantee of future results.
Holdings Diversification (Market Exposure as % of Net Assets)
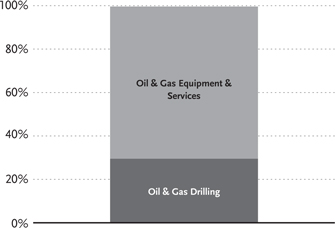
“Holdings Diversification (Market Exposure as % of Net Assets)” excludes any temporary cash investments.
Inception Date: May 2, 2001
| Ten Largest Holdings (% of Total Net Assets) | ||||
| Schlumberger Ltd. | 11.3 | % | ||
| Halliburton Co. | 6.8 | % | ||
| National Oilwell Varco, Inc. | 6.0 | % | ||
| Baker Hughes, Inc. | 5.1 | % | ||
| Transocean Ltd. | 4.0 | % | ||
| Cameron International Corp. | 3.8 | % | ||
| FMC Technologies, Inc. | 3.6 | % | ||
| Noble Corporation plc | 3.3 | % | ||
| Ensco plc — Class A | 3.1 | % | ||
| Helmerich & Payne, Inc. | 3.1 | % | ||
| Top Ten Total | 50.1 | % | ||
“Ten Largest Holdings” exclude any temporary cash or derivative investments.
| 52 | THE RYDEX FUNDS ANNUAL REPORT |
| PERFORMANCE REPORT AND FUND PROFILE (Unaudited) (concluded) |
Cumulative Fund Performance*,†

Average Annual Returns
Periods Ended December 31, 2013*,†
| 1 Year | 5 Year | 10 Year | ||||||||||
| Energy Services Fund | 23.89 | % | 18.23 | % | 11.45 | % | ||||||
| S&P 500 Energy Index | 25.07 | % | 13.44 | % | 13.44 | % | ||||||
| S&P 500 Index | 32.39 | % | 17.94 | % | 7.41 | % | ||||||
| * | The performance data above represents past performance that is not predictive of future results. The investment return and principal value of an investment in the Fund will fluctuate so that an investor’s shares, when redeemed, may be worth more or less than their original cost. Returns are historical and include changes in principal and reinvested dividends and capital gains and do not reflect the effect of taxes. The S&P 500 Index and the S&P 500 Energy Index are unmanaged indices and, unlike the Fund, have no management fees or operating expenses to reduce their reported returns. |
| † | Returns do not reflect the impact of any additional fees charged by insurance companies. |
| the RYDEX FUNDS ANNUAL REPORT | 53 |
| SCHEDULE OF INVESTMENTS | December 31, 2013 |
| ENERGY SERVICES FUND |
| Shares | Value | |||||||
| COMMON STOCKS† - 99.6% | ||||||||
| OIL & GAS EQUIPMENT & SERVICES - 70.1% | ||||||||
| Schlumberger Ltd. | 20,186 | $ | 1,818,960 | |||||
| Halliburton Co. | 21,586 | 1,095,490 | ||||||
| National Oilwell Varco, Inc. | 12,206 | 970,743 | ||||||
| Baker Hughes, Inc. | 14,928 | 824,921 | ||||||
| Cameron International Corp.* | 10,351 | 616,195 | ||||||
| FMC Technologies, Inc.* | 11,067 | 577,808 | ||||||
| Oceaneering International, Inc. | 6,148 | 484,954 | ||||||
| Weatherford International Ltd.* | 27,732 | 429,569 | ||||||
| Oil States International, Inc.* | 3,906 | 397,318 | ||||||
| Dresser-Rand Group, Inc.* | 5,931 | 353,666 | ||||||
| Superior Energy Services, Inc.* | 13,026 | 346,622 | ||||||
| Dril-Quip, Inc.* | 3,151 | 346,389 | ||||||
| Tidewater, Inc. | 4,991 | 295,817 | ||||||
| CARBO Ceramics, Inc. | 2,355 | 274,428 | ||||||
| Bristow Group, Inc. | 3,655 | 274,344 | ||||||
| Core Laboratories N.V. | 1,426 | 272,295 | ||||||
| Helix Energy Solutions Group, Inc.* | 11,141 | 258,248 | ||||||
| McDermott International, Inc.* | 27,456 | 251,497 | ||||||
| Exterran Holdings, Inc.* | 7,133 | 243,949 | ||||||
| Hornbeck Offshore Services, Inc.* | 4,556 | 224,292 | ||||||
| SEACOR Holdings, Inc.* | 2,450 | 223,440 | ||||||
| Tenaris S.A. ADR | 4,911 | 214,562 | ||||||
| Key Energy Services, Inc.* | 22,986 | 181,589 | ||||||
| Geospace Technologies Corp.* | 1,840 | 174,487 | ||||||
| Basic Energy Services, Inc.* | 8,560 | 135,077 | ||||||
| Total Oil & Gas Equipment & Services | 11,286,660 | |||||||
| OIL & GAS DRILLING - 29.5% | ||||||||
| Transocean Ltd. | 13,105 | 647,648 | ||||||
| Noble Corporation plc | 14,082 | 527,653 | ||||||
| Ensco plc — Class A | 8,753 | 500,497 | ||||||
| Helmerich & Payne, Inc. | 5,901 | 496,156 | ||||||
| Diamond Offshore Drilling, Inc. | 8,296 | 472,208 | ||||||
| Rowan Companies plc — Class A* | 10,046 | 355,227 | ||||||
| Nabors Industries Ltd. | 20,583 | 349,705 | ||||||
| Seadrill Ltd. | 8,271 | 339,773 | ||||||
| Atwood Oceanics, Inc.* | 5,852 | 312,438 | ||||||
| Patterson-UTI Energy, Inc. | 12,156 | 307,790 | ||||||
| Unit Corp.* | 5,064 | 261,404 | ||||||
| Hercules Offshore, Inc.* | 26,704 | 174,377 | ||||||
| Total Oil & Gas Drilling | 4,744,876 | |||||||
| Total Common Stocks | ||||||||
| (Cost $7,112,432) | 16,031,536 | |||||||
| Face | ||||||||
| Amount | ||||||||
| REPURCHASE AGREEMENT††,1 - 0.7% | ||||||||
| Credit Suisse Group | ||||||||
| issued 12/31/13 at 0.00% | ||||||||
| due 01/02/14 | $ | 114,566 | 114,566 | |||||
| Total Repurchase Agreement | ||||||||
| (Cost $114,566) | 114,566 | |||||||
| Total Investments - 100.3% | ||||||||
| (Cost $7,226,998) | $ | 16,146,102 | ||||||
| Other Assets & Liabilities, net - (0.3)% | (44,620 | ) | ||||||
| Total Net Assets - 100.0% | $ | 16,101,482 | ||||||
| * | Non-income producing security. |
| † | Value determined based on Level 1 inputs — See Note 4. |
| †† | Value determined based on Level 2 inputs — See Note 4. |
| 1 | Repurchase Agreement — See Note 5. ADR — American Deposit Receipt plc — Public Limited Company |
| 54 | THE RYDEX FUNDS ANNUAL REPORT | SEE NOTES TO FINANCIAL STATEMENTS. |
ENERGY SERVICES FUND
| STATEMENT OF ASSETS AND LIABILITIES |
December 31, 2013
| Assets: | ||||
| Investments, at value | ||||
| (cost $7,112,432) | $ | 16,031,536 | ||
| Repurchase agreements, at value | ||||
| (cost $114,566) | 114,566 | |||
| Total investments | ||||
| (cost $7,226,998) | 16,146,102 | |||
| Receivables: | ||||
| Fund shares sold | 272,362 | |||
| Dividends | 7,151 | |||
| Interest and securities lending income | 41 | |||
| Total assets | 16,425,656 | |||
| Liabilities: | ||||
| Payable for: | ||||
| Securities purchased | 273,963 | |||
| Management fees | 10,869 | |||
| Fund shares redeemed | 9,626 | |||
| Transfer agent and administrative fees | 3,197 | |||
| Investor service fees | 3,197 | |||
| Portfolio accounting fees | 1,279 | |||
| Miscellaneous | 22,043 | |||
| Total liabilities | 324,174 | |||
| Net assets | $ | 16,101,482 | ||
| Net assets consist of: | ||||
| Paid in capital | $ | 7,155,548 | ||
| Accumulated net investment loss | (1,446 | ) | ||
| Accumulated net realized gain on investments | 28,276 | |||
| Net unrealized appreciation on investments | 8,919,104 | |||
| Net assets | $ | 16,101,482 | ||
| Capital shares outstanding | 730,518 | |||
| Net asset value per share | $ | 22.04 | ||
| STATEMENT OF OPERATIONS |
Year Ended December 31, 2013
| Investment income: | ||||
| Dividends (net of foreign withholding tax of $324) | $ | 183,707 | ||
| Income from securities lending, net | 3,557 | |||
| Interest | 27 | |||
| Total investment income | 187,291 | |||
| Expenses: | ||||
| Management fees | 130,662 | |||
| Transfer agent and administrative fees | 38,430 | |||
| Investor service fees | 38,430 | |||
| Portfolio accounting fees | 15,372 | |||
| Professional fees | 13,433 | |||
| Trustees’ fees* | 1,829 | |||
| Custodian fees | 1,736 | |||
| Line of credit interest expense | 155 | |||
| Miscellaneous | 11,784 | |||
| Total expenses | 251,831 | |||
| Net investment loss | (64,540 | ) | ||
| Net realized and unrealized gain (Loss): | ||||
| Net realized gain (loss) on: | ||||
| Investments | 2,331,460 | |||
| Net realized gain | 2,331,460 | |||
| Net change in unrealized appreciation (depreciation) on: | ||||
| Investments | 753,906 | |||
| Net change in unrealized appreciation (depreciation) | 753,906 | |||
| Net realized and unrealized gain | 3,085,366 | |||
| Net increase in net assets resulting from operations | $ | 3,020,826 |
| * | Relates to Trustees not deemed “interested persons” within the meaning of Section 2(a)(19) of the 1940 Act. |
| SEE NOTES TO FINANCIAL STATEMENTS. | THE RYDEX FUNDS ANNUAL REPORT | 55 |
| Energy Services Fund |
| STATEMENTS OF CHANGES IN NET ASSETS |
| Year Ended | Year Ended | |||||||
| December 31, | December 31, | |||||||
| 2013 | 2012 | |||||||
| Increase (Decrease) In Net Assets From Operations: | ||||||||
| Net investment loss | $ | (64,540 | ) | $ | (58,244 | ) | ||
| Net realized gain on investments | 2,331,460 | 1,925,830 | ||||||
| Net change in unrealized appreciation (depreciation) on investments | 753,906 | (1,924,271 | ) | |||||
| Net increase (decrease) in net assets resulting from operations | 3,020,826 | (56,685 | ) | |||||
| Distributions to shareholders from: | ||||||||
| Net realized gains | (611,941 | ) | (2,616,022 | ) | ||||
| Total distributions to shareholders | (611,941 | ) | (2,616,022 | ) | ||||
| Capital share transactions: | ||||||||
| Proceeds from sale of shares | 41,715,003 | 49,322,795 | ||||||
| Distributions reinvested | 611,941 | 2,616,022 | ||||||
| Cost of shares redeemed | (42,860,631 | ) | (55,666,650 | ) | ||||
| Net decrease from capital share transactions | (533,687 | ) | (3,727,833 | ) | ||||
| Net increase (decrease) in net assets | 1,875,198 | (6,400,540 | ) | |||||
| Net assets: | ||||||||
| Beginning of year | 14,226,284 | 20,626,824 | ||||||
| End of year | $ | 16,101,482 | $ | 14,226,284 | ||||
| Accumulated net investment loss at end of year | $ | (1,446 | ) | $ | — | |||
| Capital share activity: | ||||||||
| Shares sold | 1,972,955 | 2,215,092 | ||||||
| Shares issued from reinvestment of distributions | 27,392 | 146,146 | ||||||
| Shares redeemed | (2,038,728 | ) | (2,520,252 | ) | ||||
| Net decrease in shares | (38,381 | ) | (159,014 | ) | ||||
| 56 | THE RYDEX FUNDS ANNUAL REPORT | SEE NOTES TO FINANCIAL STATEMENTS. |
| Energy Services Fund |
| FINANCIAL HIGHLIGHTS |
This table is presented to show selected data for a share outstanding throughout each period and to assist shareholders in evaluating a Fund’s performance for the periods presented.
| Year Ended | Year Ended | Year Ended | Year Ended | Year Ended | ||||||||||||||||
| December 31, | December 31, | December 31, | December 31, | December 31, | ||||||||||||||||
| 2013 | 2012 | 2011 | 2010 | 2009 | ||||||||||||||||
| Per Share Data | ||||||||||||||||||||
| Net asset value, beginning of period | $ | 18.50 | $ | 22.23 | $ | 27.68 | $ | 21.96 | $ | 14.18 | ||||||||||
| Income (loss) from investment operations: | ||||||||||||||||||||
| Net investment lossa | (.09 | ) | (.07 | ) | (.20 | ) | (.15 | ) | (.06 | ) | ||||||||||
| Net gain (loss) on investments (realized and unrealized) | 4.52 | .04 | (2.18 | ) | 5.87 | 8.89 | ||||||||||||||
| Total from investment operations | 4.43 | (.03 | ) | (2.38 | ) | 5.72 | 8.83 | |||||||||||||
| Less distributions from: | ||||||||||||||||||||
| Net realized gains | (.89 | ) | (3.70 | ) | (3.07 | ) | — | (1.05 | ) | |||||||||||
| Total distributions | (.89 | ) | (3.70 | ) | (3.07 | ) | — | (1.05 | ) | |||||||||||
| Net asset value, end of period | $ | 22.04 | $ | 18.50 | $ | 22.23 | $ | 27.68 | $ | 21.96 | ||||||||||
| Total Returnb | 23.89 | % | 0.40 | % | (9.29 | %) | 26.05 | % | 62.42 | % | ||||||||||
| Ratios/Supplemental Data | ||||||||||||||||||||
| Net assets, end of period (in thousands) | $ | 16,101 | $ | 14,226 | $ | 20,627 | $ | 41,470 | $ | 41,500 | ||||||||||
| Ratios to average net assets: | ||||||||||||||||||||
| Net investment loss | (0.42 | %) | (0.31 | %) | (0.71 | %) | (0.66 | %) | (0.30 | %) | ||||||||||
| Total expenses | 1.64 | % | 1.67 | % | 1.72 | % | 1.65 | % | 1.65 | % | ||||||||||
| Portfolio turnover rate | 261 | % | 240 | % | 199 | % | 307 | % | 247 | % | ||||||||||
| a | Net investment loss per share was computed using average shares outstanding throughout the period. |
| b | Total return does not reflect the impact of any additional fees charged by insurance companies. |
| SEE NOTES TO FINANCIAL STATEMENTS. | THE RYDEX FUNDS ANNUAL REPORT | 57 |
| PERFORMANCE REPORT AND FUND PROFILE (Unaudited) | December 31, 2013 |
OBJECTIVE: Seeks to provide capital appreciation by investing in companies that are involved in the financial services sector (“Financial Services Companies”).
For the year ended December 31, 2013, Financial Services Fund returned 27.55%, while the S&P 500 Index gained 32.39% over the same period. The S&P 500 Financials Index returned 35.63%.
All groups in the sector contributed to return, led by the insurance industry, followed by the capital markets industry. The lightly weighted real estate management industry contributed least to return.
Berkshire Hathaway, Inc. Class B, JP Morgan Chase & Co. and Wells Fargo & Co. were the best-performing holdings in the Fund for the year.
The worst-performing holdings for the period were Banco Bradesco S.A., Digital Realty Trust, Inc. and American Campus Communities, Inc.
Performance displayed represents past performance, which is no guarantee of future results.
Holdings Diversification (Market Exposure as % of Net Assets)

“Holdings Diversification (Market Exposure as % of Net Assets)” excludes any temporary cash investments.
Inception Date: July 20, 2001
| Ten Largest Holdings (% of Total Net Assets) | ||||
| Berkshire Hathaway, Inc. — Class B | 2.9 | % | ||
| Wells Fargo & Co. | 2.6 | % | ||
| JPMorgan Chase & Co. | 2.5 | % | ||
| Bank of America Corp. | 2.1 | % | ||
| Citigroup, Inc. | 2.1 | % | ||
| American Express Co. | 1.7 | % | ||
| Goldman Sachs Group, Inc. | 1.5 | % | ||
| American International Group, Inc. | 1.5 | % | ||
| U.S. Bancorp | 1.4 | % | ||
| Morgan Stanley | 1.3 | % | ||
| Top Ten Total | 19.6 | % | ||
“Ten Largest Holdings” exclude any temporary cash or derivative investments.
| 58 | THE RYDEX FUNDS ANNUAL REPORT |
| performance report and FUND PROFILE (Unaudited) (concluded) |
Cumulative Fund Performance*,†
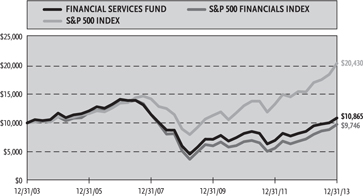
Average Annual Returns
Periods Ended December 31, 2013*,†
| 1 Year | 5 Year | 10 Year | ||||||||||
| Financial Services Fund | 27.55 | % | 12.75 | % | 0.83 | % | ||||||
| S&P 500 Financials Index | 35.63 | % | 13.75 | % | -0.26 | % | ||||||
| S&P 500 Index | 32.39 | % | 17.94 | % | 7.41 | % | ||||||
| * | The performance data above represents past performance that is not predictive of future results. The investment return and principal value of an investment in the Fund will fluctuate so that an investor’s shares, when redeemed, may be worth more or less than their original cost. Returns are historical and include changes in principal and reinvested dividends and capital gains and do not reflect the effect of taxes. The S&P 500 Index and the S&P 500 Financials Index are unmanaged indices and, unlike the Fund, have no management fees or operating expenses to reduce its reported returns. |
| † | Returns do not reflect the impact of any additional fees charged by insurance companies. |
| the RYDEX FUNDS ANNUAL REPORT | 59 |
| SCHEDULE OF INVESTMENTS | December 31, 2013 |
Financial Services Fund
| Shares | Value | |||||||
| COMMON STOCKS† - 99.5% | ||||||||
| ASSET MANAGEMENT & CUSTODY BANKS - 9.2% | ||||||||
| BlackRock, Inc. | 346 | $ | 109,500 | |||||
| Bank of New York Mellon Corp. | 2,743 | 95,841 | ||||||
| Franklin Resources, Inc. | 1,576 | 90,982 | ||||||
| State Street Corp. | 1,165 | 85,499 | ||||||
| Ameriprise Financial, Inc. | 621 | 71,446 | ||||||
| T. Rowe Price Group, Inc. | 819 | 68,608 | ||||||
| Invesco Ltd. | 1,659 | 60,388 | ||||||
| Northern Trust Corp. | 943 | 58,362 | ||||||
| Affiliated Managers Group, Inc.* | 230 | 49,882 | ||||||
| Waddell & Reed Financial, Inc. — Class A | 540 | 35,165 | ||||||
| Legg Mason, Inc. | 780 | 33,914 | ||||||
| Eaton Vance Corp. | 790 | 33,804 | ||||||
| American Capital Ltd.* | 2,070 | 32,375 | ||||||
| Total Asset Management & Custody Banks | 825,766 | |||||||
| SPECIALIZED REITs - 8.3% | ||||||||
| American Tower Corp. | 1,060 | 84,610 | ||||||
| Public Storage | 506 | 76,163 | ||||||
| Weyerhaeuser Co. | 2,006 | 63,329 | ||||||
| Ventas, Inc. | 1,090 | 62,435 | ||||||
| HCP, Inc. | 1,694 | 61,526 | ||||||
| Health Care REIT, Inc. | 1,128 | 60,427 | ||||||
| Host Hotels & Resorts, Inc. | 2,957 | 57,484 | ||||||
| Plum Creek Timber Company, Inc. | 911 | 42,371 | ||||||
| Rayonier, Inc. | 826 | 34,775 | ||||||
| Extra Space Storage, Inc. | 780 | 32,861 | ||||||
| Senior Housing Properties Trust | 1,380 | 30,677 | ||||||
| Hospitality Properties Trust | 1,090 | 29,463 | ||||||
| Corrections Corporation of America | 914 | 29,312 | ||||||
| Omega Healthcare Investors, Inc. | 960 | 28,608 | ||||||
| LaSalle Hotel Properties | 850 | 26,231 | ||||||
| CubeSmart | 1,400 | 22,316 | ||||||
| Total Specialized REITs | 742,588 | |||||||
| DIVERSIFIED BANKS - 8.3% | ||||||||
| Wells Fargo & Co. | 5,060 | 229,724 | ||||||
| U.S. Bancorp | 3,183 | 128,593 | ||||||
| Itau Unibanco Holding S.A. ADR | 4,813 | 65,312 | ||||||
| Banco Bradesco S.A. ADR | 4,638 | 58,114 | ||||||
| ICICI Bank Ltd. ADR | 1,541 | 57,279 | ||||||
| HSBC Holdings plc ADR | 983 | 54,193 | ||||||
| Credicorp Ltd. | 390 | 51,765 | ||||||
| Toronto-Dominion Bank | 540 | 50,890 | ||||||
| Comerica, Inc. | 930 | 44,212 | ||||||
| Total Diversified Banks | 740,082 | |||||||
| REGIONAL BANKS - 7.4% | ||||||||
| PNC Financial Services Group, Inc. | 1,259 | 97,672 | ||||||
| BB&T Corp. | 2,066 | 77,103 | ||||||
| SunTrust Banks, Inc. | 1,811 | 66,663 | ||||||
| Fifth Third Bancorp | 3,069 | 64,541 | ||||||
| M&T Bank Corp. | 508 | 59,141 | ||||||
| Regions Financial Corp. | 5,699 | 56,363 | ||||||
| KeyCorp | 3,875 | 52,003 | ||||||
| CIT Group, Inc. | 935 | 48,742 | ||||||
| Huntington Bancshares, Inc. | 4,400 | 42,460 | ||||||
| First Republic Bank | 760 | 39,786 | ||||||
| Zions Bancorporation | 1,186 | 35,533 | ||||||
| First Horizon National Corp. | 2,150 | 25,048 | ||||||
| Total Regional Banks | 665,055 | |||||||
| PROPERTY & CASUALTY INSURANCE - 7.4% | ||||||||
| Allstate Corp. | 1,657 | 90,373 | ||||||
| Travelers Companies, Inc. | 954 | 86,375 | ||||||
| Chubb Corp. | 780 | 75,371 | ||||||
| ACE Ltd. | 704 | 72,885 | ||||||
| Progressive Corp. | 2,236 | 60,976 | ||||||
| XL Group plc | 1,862 | 59,286 | ||||||
| Assured Guaranty Ltd. | 2,320 | 54,729 | ||||||
| Axis Capital Holdings Ltd. | 1,130 | 53,754 | ||||||
| Cincinnati Financial Corp. | 849 | 44,462 | ||||||
| Fidelity National Financial, Inc. — Class A | 1,310 | 42,510 | ||||||
| MBIA, Inc.* | 1,960 | 23,402 | ||||||
| Total Property & Casualty Insurance | 664,123 | |||||||
| OTHER DIVERSIFIED FINANCIAL SERVICES - 6.7% | ||||||||
| JPMorgan Chase & Co. | 3,810 | 222,809 | ||||||
| Bank of America Corp. | 12,189 | 189,783 | ||||||
| Citigroup, Inc. | 3,604 | 187,804 | ||||||
| Total Other Diversified Financial Services | 600,396 | |||||||
| RETAIL REITs - 5.8% | ||||||||
| Simon Property Group, Inc. | 672 | 102,251 | ||||||
| General Growth Properties, Inc. | 3,213 | 64,485 | ||||||
| Macerich Co. | 732 | 43,107 | ||||||
| Kimco Realty Corp. | 2,128 | 42,028 | ||||||
| Realty Income Corp. | 1,095 | 40,876 | ||||||
| Cole Real Estate Investment, Inc. | 2,790 | 39,172 | ||||||
| Federal Realty Investment Trust | 379 | 38,434 | ||||||
| DDR Corp. | 2,320 | 35,658 | ||||||
| Regency Centers Corp. | 680 | 31,484 | ||||||
| Taubman Centers, Inc. | 480 | 30,682 | ||||||
| National Retail Properties, Inc. | 950 | 28,814 | ||||||
| CBL & Associates Properties, Inc. | 1,460 | 26,222 | ||||||
| Total Retail REITs | 523,213 | |||||||
| 60 | THE RYDEX FUNDS ANNUAL REPORT | SEE NOTES TO FINANCIAL STATEMENTS. |
| SCHEDULE OF INVESTMENTS (continued) | December 31, 2013 |
Financial Services Fund
| Shares | Value | |||||||
| LIFE & HEALTH INSURANCE - 5.6% | ||||||||
| MetLife, Inc. | 2,182 | $ | 117,652 | |||||
| Prudential Financial, Inc. | 1,064 | 98,122 | ||||||
| Aflac, Inc. | 1,262 | 84,302 | ||||||
| Principal Financial Group, Inc. | 1,169 | 57,643 | ||||||
| Lincoln National Corp. | 1,069 | 55,182 | ||||||
| Unum Group | 1,295 | 45,429 | ||||||
| Torchmark Corp. | 510 | 39,857 | ||||||
| Total Life & Health Insurance | 498,187 | |||||||
| INVESTMENT BANKING & BROKERAGE - 5.3% | ||||||||
| Goldman Sachs Group, Inc. | 759 | 134,540 | ||||||
| Morgan Stanley | 3,775 | 118,384 | ||||||
| Charles Schwab Corp. | 3,299 | 85,774 | ||||||
| TD Ameritrade Holding Corp. | 1,993 | 61,066 | ||||||
| Raymond James Financial, Inc. | 780 | 40,708 | ||||||
| E*TRADE Financial Corp.* | 1,810 | 35,548 | ||||||
| Total Investment Banking & Brokerage | 476,020 | |||||||
| CONSUMER FINANCE - 4.3% | ||||||||
| American Express Co. | 1,646 | 149,341 | ||||||
| Capital One Financial Corp. | 1,324 | 101,432 | ||||||
| Discover Financial Services | 1,406 | 78,666 | ||||||
| SLM Corp. | 1,942 | 51,036 | ||||||
| Total Consumer Finance | 380,475 | |||||||
| RESIDENTIAL REITs - 3.9% | ||||||||
| Equity Residential | 1,255 | 65,096 | ||||||
| AvalonBay Communities, Inc. | 498 | 58,879 | ||||||
| UDR, Inc. | 1,580 | 36,893 | ||||||
| Essex Property Trust, Inc. | 236 | 33,868 | ||||||
| Camden Property Trust | 585 | 33,275 | ||||||
| Mid-America Apartment Communities, Inc. | 540 | 32,800 | ||||||
| BRE Properties, Inc. | 570 | 31,185 | ||||||
| Apartment Investment & | ||||||||
| Management Co. — Class A | 1,130 | 29,278 | ||||||
| American Campus Communities, Inc. | 847 | 27,282 | ||||||
| Total Residential REITs | 348,556 | |||||||
| SPECIALIZED FINANCE - 3.6% | ||||||||
| IntercontinentalExchange Group, Inc. | 336 | 75,573 | ||||||
| CME Group, Inc. | 930 | 72,968 | ||||||
| McGraw Hill Financial, Inc. | 900 | 70,380 | ||||||
| Moody’s Corp. | 795 | 62,384 | ||||||
| NASDAQ OMX Group, Inc. | 970 | 38,606 | ||||||
| Total Specialized Finance | 319,911 | |||||||
| MULTI-SECTOR HOLDINGS - 3.4% | ||||||||
| Berkshire Hathaway, Inc. — Class B* | 2,171 | 257,394 | ||||||
| Leucadia National Corp. | 1,716 | 48,631 | ||||||
| Total Multi-Sector Holdings | 306,025 | |||||||
| OFFICE REITs - 3.2% | ||||||||
| Boston Properties, Inc. | 572 | 57,411 | ||||||
| SL Green Realty Corp. | 482 | 44,527 | ||||||
| Digital Realty Trust, Inc. | 789 | 38,756 | ||||||
| Alexandria Real Estate Equities, Inc. | 500 | 31,810 | ||||||
| Kilroy Realty Corp. | 600 | 30,108 | ||||||
| BioMed Realty Trust, Inc. | 1,540 | 27,905 | ||||||
| Douglas Emmett, Inc. | 1,160 | 27,016 | ||||||
| Highwoods Properties, Inc. | 740 | 26,766 | ||||||
| Total Office REITs | 284,299 | |||||||
| THRIFTS & MORTGAGE FINANCE - 2.5% | ||||||||
| New York Community Bancorp, Inc. | 2,465 | 41,535 | ||||||
| Ocwen Financial Corp.* | 740 | 41,033 | ||||||
| Hudson City Bancorp, Inc. | 3,620 | 34,137 | ||||||
| People’s United Financial, Inc. | 2,212 | 33,445 | ||||||
| Nationstar Mortgage Holdings, Inc.* | 710 | 26,242 | ||||||
| MGIC Investment Corp.* | 3,010 | 25,404 | ||||||
| Radian Group, Inc. | 1,700 | 24,004 | ||||||
| Total Thrifts & Mortgage Finance | 225,800 | |||||||
| REINSURANCE - 2.5% | ||||||||
| PartnerRe Ltd. | 530 | 55,879 | ||||||
| Everest Re Group Ltd. | 358 | 55,801 | ||||||
| RenaissanceRe Holdings Ltd. | 560 | 54,510 | ||||||
| Validus Holdings Ltd. | 1,320 | 53,183 | ||||||
| Total Reinsurance | 219,373 | |||||||
| MULTI-LINE INSURANCE - 2.2% | ||||||||
| Loews Corp. | 1,349 | 65,075 | ||||||
| Hartford Financial Services Group, Inc. | 1,660 | 60,142 | ||||||
| Genworth Financial, Inc. — Class A* | 2,671 | 41,481 | ||||||
| Assurant, Inc. | 500 | 33,185 | ||||||
| Total Multi-Line Insurance | 199,883 | |||||||
| INSURANCE BROKERS - 2.1% | ||||||||
| Marsh & McLennan Companies, Inc. | 1,602 | 77,473 | ||||||
| Aon plc | 874 | 73,320 | ||||||
| Arthur J Gallagher & Co. | 800 | 37,544 | ||||||
| Total Insurance Brokers | 188,337 | |||||||
| DIVERSIFIED REITs - 2.0% | ||||||||
| Vornado Realty Trust | 685 | 60,820 | ||||||
| Duke Realty Corp. | 2,213 | 33,284 | ||||||
| Liberty Property Trust | 972 | 32,922 | ||||||
| Spirit Realty Capital, Inc. | 2,910 | 28,605 | ||||||
| American Realty Capital Properties, Inc. | 1,830 | 23,534 | ||||||
| Total Diversified REITs | 179,165 | |||||||
| MORTGAGE REITs - 1.7% | ||||||||
| Annaly Capital Management, Inc. | 4,602 | 45,882 | ||||||
| American Capital Agency Corp. | 2,118 | 40,856 | ||||||
| Starwood Property Trust, Inc. | 1,250 | 34,625 | ||||||
| Two Harbors Investment Corp. | 2,850 | 26,448 | ||||||
| Total Mortgage REITs | 147,811 | |||||||
| SEE NOTES TO FINANCIAL STATEMENTS. | THE RYDEX FUNDS ANNUAL REPORT | 61 |
| SCHEDULE OF INVESTMENTS (concluded) | December 31, 2013 |
FINANCIAL SERVICES FUND
| Shares | Value | |||||||
| MULTI-LINE INSURANCE - 1.5% | ||||||||
| American International Group, Inc. | 2,550 | $ | 130,178 | |||||
| REAL ESTATE SERVICES - 1.3% | ||||||||
| CBRE Group, Inc. — Class A* | 1,690 | 44,447 | ||||||
| Realogy Holdings Corp.* | 820 | 40,565 | ||||||
| Jones Lang LaSalle, Inc. | 310 | 31,741 | ||||||
| Total Real Estate Services | 116,753 | |||||||
| INDUSTRIAL REITs - 0.7% | ||||||||
| Prologis, Inc. | 1,741 | 64,330 | ||||||
| DIVERSIFIED CAPITAL MARKETS - 0.6% | ||||||||
| Deutsche Bank AG | 1,085 | 52,340 | ||||||
| Total Common Stocks | ||||||||
| (Cost $5,684,493) | 8,898,666 | |||||||
| Face | ||||||||
| Amount | ||||||||
| REPURCHASE AGREEMENT††,1 - 0.2% | ||||||||
| Credit Suisse Group | ||||||||
| issued 12/31/13 at 0.00% | ||||||||
| due 01/02/14 | $ | 21,816 | 21,816 | |||||
| Total Repurchase Agreement | ||||||||
| (Cost $21,816) | 21,816 | |||||||
| Total Investments - 99.7% | ||||||||
| (Cost $5,706,309) | $ | 8,920,482 | ||||||
| Other Assets & Liabilities, net - 0.3% | 22,250 | |||||||
| Total Net Assets - 100.0% | $ | 8,942,732 | ||||||
| * | Non-income producing security. |
| † | Value determined based on Level 1 inputs — See Note 4. |
| †† | Value determined based on Level 2 inputs — See Note 4. |
| 1 | Repurchase Agreement — See Note 5. |
ADR — American Depository Receipt
plc — Public Limited Company
REIT — Real Estate Investment Trust
| 62 | THE RYDEX FUNDS ANNUAL REPORT | SEE NOTES TO FINANCIAL STATEMENTS. |
Financial Services Fund
| STATEMENT OF ASSETS AND LIABILITIES |
December 31, 2013
| Assets: | ||||
| Investments, at value | ||||
| (cost $5,684,493) | $ | 8,898,666 | ||
| Repurchase agreements, at value | ||||
| (cost $21,816) | 21,816 | |||
| Total investments | ||||
| (cost $5,706,309) | 8,920,482 | |||
| Receivables: | ||||
| Fund shares sold | 351,145 | |||
| Dividends | 21,938 | |||
| Total assets | 9,293,565 | |||
| Liabilities: | ||||
| Payable for: | ||||
| Securities purchased | 322,352 | |||
| Management fees | 6,508 | |||
| Transfer agent and administrative fees | 1,914 | |||
| Investor service fees | 1,914 | |||
| Fund shares redeemed | 971 | |||
| Portfolio accounting fees | 766 | |||
| Miscellaneous | 16,408 | |||
| Total liabilities | 350,833 | |||
| Net assets | $ | 8,942,732 | ||
| Net assets consist of: | ||||
| Paid in capital | $ | 12,891,774 | ||
| Undistributed net investment income | 50,044 | |||
| Accumulated net realized loss on investments | (7,213,259 | ) | ||
| Net unrealized appreciation on investments | 3,214,173 | |||
| Net assets | $ | 8,942,732 | ||
| Capital shares outstanding | 446,054 | |||
| Net asset value per share | $ | 20.05 |
| STATEMENT OF OPERATIONS |
Year Ended December 31, 2013
| Investment Income: | ||||
| Dividends (net of foreign withholding tax of $1,504) | $ | 252,215 | ||
| Interest | 17 | |||
| Income from securities lending, net | 3 | |||
| Total investment income | 252,235 | |||
| Expenses: | ||||
| Management fees | 97,903 | |||
| Transfer agent and administrative fees | 28,795 | |||
| Investor service fees | 28,795 | |||
| Portfolio accounting fees | 11,518 | |||
| Professional fees | 10,990 | |||
| Custodian fees | 1,291 | |||
| Trustees’ fees* | 1,109 | |||
| Line of credit interest expense | 122 | |||
| Miscellaneous | 8,473 | |||
| Total expenses | 188,996 | |||
| Net investment income | 63,239 | |||
| Net Realized and Unrealized Gain (Loss): | ||||
| Net realized gain (loss) on: | ||||
| Investments | 1,299,810 | |||
| Net realized gain | 1,299,810 | |||
| Net change in unrealized appreciation (depreciation) on: | ||||
| Investments | 1,109,648 | |||
| Net change in unrealized appreciation (depreciation) | 1,109,648 | |||
| Net realized and unrealized gain | 2,409,458 | |||
| Net increase in net assets resulting from operations | $ | 2,472,697 |
* Relates to Trustees not deemed “interested persons” within the meaning of Section 2(a)(19) of the 1940 Act.
| SEE NOTES TO FINANCIAL STATEMENTS. | THE RYDEX FUNDS ANNUAL REPORT | 63 |
Financial Services Fund
| STATEMENTS OF CHANGES IN NET ASSETS |
| Year Ended | Year Ended | |||||||
| December 31, | December 31, | |||||||
| 2013 | 2012 | |||||||
| Increase (Decrease) In Net Assets From Operations: | ||||||||
| Net investment income | $ | 63,239 | $ | 57,590 | ||||
| Net realized gain on investments | 1,299,810 | 49,830 | ||||||
| Net change in unrealized appreciation (depreciation) on investments | 1,109,648 | 1,086,902 | ||||||
| Net increase in net assets resulting from operations | 2,472,697 | 1,194,322 | ||||||
| Distributions to shareholders from: | ||||||||
| Net investment income | (56,822 | ) | (18,017 | ) | ||||
| Total distributions to shareholders | (56,822 | ) | (18,017 | ) | ||||
| Capital share transactions: | ||||||||
| Proceeds from sale of shares | 43,353,290 | 33,037,250 | ||||||
| Distributions reinvested | 56,822 | 18,017 | ||||||
| Cost of shares redeemed | (47,326,580 | ) | (29,256,993 | ) | ||||
| Net increase (decrease) from capital share transactions | (3,916,468 | ) | 3,798,274 | |||||
| Net increase (decrease) in net assets | (1,500,593 | ) | 4,974,579 | |||||
| Net assets: | ||||||||
| Beginning of year | 10,443,325 | 5,468,746 | ||||||
| End of year | $ | 8,942,732 | $ | 10,443,325 | ||||
| Undistributed net investment income at end of year | $ | 50,044 | $ | 57,507 | ||||
| Capital share activity: | ||||||||
| Shares sold | 2,401,275 | 2,237,668 | ||||||
| Shares issued from reinvestment of distributions | 2,920 | 1,200 | ||||||
| Shares redeemed | (2,618,690 | ) | (2,001,910 | ) | ||||
| Net increase (decrease) in shares | (214,495 | ) | 236,958 | |||||
| 64 | THE RYDEX FUNDS ANNUAL REPORT | SEE NOTES TO FINANCIAL STATEMENTS. |
FINANCIAL SERVICES FUND
| FINANCIAL HIGHLIGHTS |
This table is presented to show selected data for a share outstanding throughout each period and to assist shareholders in evaluating a Fund’s performance for the periods presented.
| Year Ended | Year Ended | Year Ended | Year Ended | Year Ended | ||||||||||||||||
| December 31, | December 31, | December 31, | December 31, | December 31, | ||||||||||||||||
| 2013 | 2012 | 2011 | 2010 | 2009 | ||||||||||||||||
| Per Share Data | ||||||||||||||||||||
| Net asset value, beginning of period | $ | 15.81 | $ | 12.91 | $ | 15.19 | $ | 13.44 | $ | 11.41 | ||||||||||
| Income (loss) from investment operations: | ||||||||||||||||||||
| Net investment incomea | .10 | .12 | .04 | .01 | .06 | |||||||||||||||
| Net gain (loss) on investments (realized and unrealized) | 4.25 | 2.81 | (2.31 | ) | 1.91 | 2.19 | ||||||||||||||
| Total from investment operations | 4.35 | 2.93 | (2.27 | ) | 1.92 | 2.25 | ||||||||||||||
| Less distributions from: | ||||||||||||||||||||
| Net investment income | (.11 | ) | (.03 | ) | (.01 | ) | (.17 | ) | (.22 | ) | ||||||||||
| Total distributions | (.11 | ) | (.03 | ) | (.01 | ) | (.17 | ) | (.22 | ) | ||||||||||
| Net asset value, end of period | $ | 20.05 | $ | 15.81 | $ | 12.91 | $ | 15.19 | $ | 13.44 | ||||||||||
| Total Returnb | 27.55 | % | 22.68 | % | (14.92 | %) | 14.36 | % | 19.68 | % | ||||||||||
| Ratios/Supplemental Data | ||||||||||||||||||||
| Net assets, end of period (in thousands) | $ | 8,943 | $ | 10,443 | $ | 5,469 | $ | 7,896 | $ | 17,163 | ||||||||||
| Ratios to average net assets: | ||||||||||||||||||||
| Net investment income | 0.55 | % | 0.79 | % | 0.26 | % | 0.09 | % | 0.54 | % | ||||||||||
| Total expenses | 1.64 | % | 1.67 | % | 1.71 | % | 1.64 | % | 1.64 | % | ||||||||||
| Portfolio turnover rate | 409 | % | 396 | % | 528 | % | 617 | % | 357 | % | ||||||||||
| a | Net investment income per share was computed using average shares outstanding throughout the period. |
| b | Total return does not reflect the impact of any additional fees charged by insurance companies. |
| SEE NOTES TO FINANCIAL STATEMENTS. | THE RYDEX FUNDS ANNUAL REPORT | 65 |
| PERFORMANCE REPORT AND FUND PROFILE (Unaudited) | December 31, 2013 |
OBJECTIVE: Seeks to provide capital appreciation by investing in companies that are involved in the health care industry (“Health Care Companies”).
For the year ended December 31, 2013, Health Care Fund rose 41.81%, compared with a 32.39% gain for the S&P 500 Index. The S&P 500 Health Care Index returned 41.46%.
The biggest positive contributors to Fund performance were the pharmaceuticals industry and the biotechnology industry. No sector detracted from return, but lightly weighted health care technology contributed least.
The year’s top-performing holdings were Gilead Sciences, Inc., Celgene Corp. and Johnson & Johnson.
The worst-performing holdings in the Fund included ARIAD Pharmaceuticals, Inc., Edwards Lifesciences Corp. and Intuitive Surgical, Inc.
Performance displayed represents past performance, which is no guarantee of future results.
Holdings Diversification (Market Exposure as % of Net Assets)
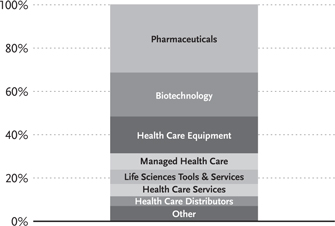
“Holdings Diversification (Market Exposure as % of Net Assets)” excludes any temporary cash investments.
Inception Date: June 19, 2001
| Ten Largest Holdings (% of Total Net Assets) | ||||
| Johnson & Johnson | 3.7 | % | ||
| Pfizer, Inc. | 3.2 | % | ||
| Merck & Company, Inc. | 2.8 | % | ||
| Gilead Sciences, Inc. | 2.4 | % | ||
| Amgen, Inc. | 2.1 | % | ||
| AbbVie, Inc. | 2.1 | % | ||
| Bristol-Myers Squibb Co. | 2.1 | % | ||
| UnitedHealth Group, Inc. | 2.0 | % | ||
| Celgene Corp. | 1.9 | % | ||
| Biogen Idec, Inc. | 1.8 | % | ||
| Top Ten Total | 24.1 | % | ||
“Ten Largest Holdings” exclude any temporary cash or derivative investments.
| 66 | THE RYDEX FUNDS ANNUAL REPORT |
| performance report and FUND PROFILE (Unaudited) (concluded) |
Cumulative Fund Performance*,†

Average Annual Returns
Periods Ended December 31, 2013*,†
| 1 Year | 5 Year | 10 Year | ||||||||||
| Health Care Fund | 41.81 | % | 18.28 | % | 8.58 | % | ||||||
| S&P 500 Health Care Index | 41.46 | % | 18.29 | % | 8.35 | % | ||||||
| S&P 500 Index | 32.39 | % | 17.94 | % | 7.41 | % | ||||||
| * | The performance data above represents past performance that is not predictive of future results. The investment return and principal value of an investment in the Fund will fluctuate so that an investor’s shares, when redeemed, may be worth more or less than their original cost. Returns are historical and include changes in principal and reinvested dividends and capital gains and do not reflect the effect of taxes. The S&P 500 Index and the S&P 500 Health Care Index are unmanaged indices and, unlike the Fund, have no management fees or operating expenses to reduce their reported returns. |
| † | Returns do not reflect the impact of any additional fees charged by insurance companies. |
| THE RYDEX FUNDS ANNUAL REPORT | 67 |
| SCHEDULE OF INVESTMENTS | December 31, 2013 |
HEALTH CARE FUND
| Shares | Value | |||||||
| COMMON STOCKS† - 100.1% | ||||||||
| PHARMACEUTICALS - 31.4% | ||||||||
| Johnson & Johnson | 12,080 | $ | 1,106,406 | |||||
| Pfizer, Inc. | 31,821 | 974,676 | ||||||
| Merck & Company, Inc. | 16,804 | 841,040 | ||||||
| AbbVie, Inc. | 11,978 | 632,558 | ||||||
| Bristol-Myers Squibb Co. | 11,747 | 624,353 | ||||||
| Eli Lilly & Co. | 10,213 | 520,863 | ||||||
| Valeant Pharmaceuticals International, Inc.* | 3,674 | 431,328 | ||||||
| Allergan, Inc. | 3,629 | 403,109 | ||||||
| Perrigo Company plc | 2,497 | 383,171 | ||||||
| Actavis plc* | 2,089 | 350,952 | ||||||
| Teva Pharmaceutical Industries Ltd. ADR | 7,982 | 319,919 | ||||||
| Mylan, Inc.* | 6,468 | 280,711 | ||||||
| Forest Laboratories, Inc.* | 4,657 | 279,560 | ||||||
| Zoetis, Inc. | 8,530 | 278,846 | ||||||
| Jazz Pharmaceuticals plc* | 1,850 | 234,136 | ||||||
| GlaxoSmithKline plc ADR | 4,305 | 229,844 | ||||||
| Novartis AG ADR | 2,742 | 220,402 | ||||||
| AstraZeneca plc ADR | 3,559 | 211,298 | ||||||
| Shire plc ADR | 1,430 | 202,045 | ||||||
| Endo Health Solutions, Inc.* | 2,675 | 180,456 | ||||||
| Hospira, Inc.* | 4,296 | 177,339 | ||||||
| Salix Pharmaceuticals Ltd.* | 1,770 | 159,194 | ||||||
| Questcor Pharmaceuticals, Inc.1 | 2,200 | 119,790 | ||||||
| ViroPharma, Inc.* | 2,380 | 118,643 | ||||||
| Medicines Co.* | 2,840 | 109,681 | ||||||
| Santarus, Inc.* | 3,140 | 100,354 | ||||||
| Total Pharmaceuticals | 9,490,674 | |||||||
| BIOTECHNOLOGY - 20.3% | ||||||||
| Gilead Sciences, Inc.* | 9,754 | 733,014 | ||||||
| Amgen, Inc. | 5,634 | 643,177 | ||||||
| Celgene Corp.* | 3,448 | 582,574 | ||||||
| Biogen Idec, Inc.* | 1,911 | 534,602 | ||||||
| Regeneron Pharmaceuticals, Inc.* | 1,349 | 371,299 | ||||||
| Alexion Pharmaceuticals, Inc.* | 2,513 | 334,380 | ||||||
| Vertex Pharmaceuticals, Inc.* | 3,821 | 283,900 | ||||||
| BioMarin Pharmaceutical, Inc.* | 3,140 | 220,648 | ||||||
| Alkermes plc* | 4,920 | 200,047 | ||||||
| Incyte Corporation Ltd.* | 3,910 | 197,963 | ||||||
| Pharmacyclics, Inc.* | 1,830 | 193,577 | ||||||
| United Therapeutics Corp.* | 1,590 | 179,797 | ||||||
| Seattle Genetics, Inc.* | 3,930 | 156,768 | ||||||
| Cubist Pharmaceuticals, Inc.* | 2,162 | 148,897 | ||||||
| Isis Pharmaceuticals, Inc.* | 3,670 | 146,213 | ||||||
| Medivation, Inc.* | 2,255 | 143,914 | ||||||
| Theravance, Inc.* | 3,840 | 136,896 | ||||||
| Alnylam Pharmaceuticals, Inc.* | 2,030 | 130,590 | ||||||
| Opko Health, Inc.*,1 | 14,740 | 124,406 | ||||||
| NPS Pharmaceuticals, Inc.* | 4,020 | 122,047 | ||||||
| ACADIA Pharmaceuticals, Inc.* | 4,240 | 105,958 | ||||||
| Aegerion Pharmaceuticals, Inc.* | 1,420 | 100,763 | ||||||
| Celldex Therapeutics, Inc.* | 4,140 | 100,229 | ||||||
| Myriad Genetics, Inc.*,1 | 3,770 | 79,095 | ||||||
| Ariad Pharmaceuticals, Inc.*,1 | 11,321 | 77,209 | ||||||
| Sarepta Therapeutics, Inc.*,1 | 3,200 | 65,184 | ||||||
| Total Biotechnology | 6,113,147 | |||||||
| HEALTH CARE EQUIPMENT - 17.0% | ||||||||
| Abbott Laboratories | 13,581 | 520,561 | ||||||
| Medtronic, Inc. | 8,977 | 515,190 | ||||||
| Baxter International, Inc. | 6,162 | 428,567 | ||||||
| Stryker Corp. | 4,852 | 364,579 | ||||||
| Covidien plc | 4,671 | 318,095 | ||||||
| Becton Dickinson and Co. | 2,878 | 317,990 | ||||||
| St. Jude Medical, Inc. | 4,660 | 288,687 | ||||||
| Boston Scientific Corp.* | 23,660 | 284,393 | ||||||
| Zimmer Holdings, Inc. | 2,922 | 272,301 | ||||||
| Intuitive Surgical, Inc.* | 629 | 241,586 | ||||||
| CR Bard, Inc. | 1,609 | 215,509 | ||||||
| CareFusion Corp.* | 4,970 | 197,905 | ||||||
| Varian Medical Systems, Inc.* | 2,420 | 188,010 | ||||||
| Edwards Lifesciences Corp.* | 2,801 | 184,194 | ||||||
| Mindray Medical International Ltd. ADR | 5,050 | 183,618 | ||||||
| ResMed, Inc.1 | 3,878 | 182,576 | ||||||
| Hologic, Inc.* | 7,570 | 169,190 | ||||||
| IDEXX Laboratories, Inc.* | 1,456 | 154,875 | ||||||
| Thoratec Corp.* | 2,610 | 95,526 | ||||||
| Total Health Care Equipment | 5,123,352 | |||||||
| MANAGED HEALTH CARE - 7.6% | ||||||||
| UnitedHealth Group, Inc. | 8,042 | 605,562 | ||||||
| WellPoint, Inc. | 3,946 | 364,571 | ||||||
| Aetna, Inc. | 5,040 | 345,694 | ||||||
| Cigna Corp. | 3,891 | 340,385 | ||||||
| Humana, Inc. | 2,579 | 266,204 | ||||||
| Centene Corp.* | 2,060 | 121,437 | ||||||
| WellCare Health Plans, Inc.* | 1,700 | 119,714 | ||||||
| Health Net, Inc.* | 3,700 | 109,779 | ||||||
| Total Managed Health Care | 2,273,346 | |||||||
| LIFE SCIENCES TOOLS & SERVICES - 6.6% | ||||||||
| Thermo Fisher Scientific, Inc. | 3,874 | 431,371 | ||||||
| Agilent Technologies, Inc. | 5,110 | 292,241 | ||||||
| Illumina, Inc.* | 2,257 | 249,669 | ||||||
| Life Technologies Corp.* | 3,280 | 248,624 | ||||||
| Waters Corp.* | 1,896 | 189,600 | ||||||
| Mettler-Toledo International, Inc.* | 670 | 162,535 | ||||||
| Covance, Inc.* | 1,690 | 148,821 | ||||||
| PerkinElmer, Inc. | 3,560 | 146,779 | ||||||
| PAREXEL International Corp.* | 2,400 | 108,432 | ||||||
| Total Life Sciences Tools & Services | 1,978,072 | |||||||
| HEALTH CARE SERVICES - 5.7% | ||||||||
| Express Scripts Holding Co.* | 7,479 | 525,324 | ||||||
| DaVita HealthCare Partners, Inc.* | 3,992 | 252,973 | ||||||
| Catamaran Corp.* | 4,510 | 214,135 | ||||||
| Quest Diagnostics, Inc. | 3,592 | 192,316 | ||||||
| Laboratory Corporation of America Holdings* | 2,041 | 186,486 | ||||||
| Omnicare, Inc. | 2,863 | 172,811 | ||||||
| MEDNAX, Inc.* | 3,050 | 162,809 | ||||||
| Total Health Care Services | 1,706,854 | |||||||
| 68 | THE RYDEX FUNDS ANNUAL REPORT | SEE NOTES TO FINANCIAL STATEMENTS. |
| SCHEDULE OF INVESTMENTS (concluded) | December 31, 2013 |
HEALTH CARE FUND
| Shares | Value | |||||||
| HEALTH CARE DISTRIBUTORS - 4.5% | ||||||||
| McKesson Corp. | 2,456 | $ | 396,399 | |||||
| Cardinal Health, Inc. | 4,874 | 325,632 | ||||||
| AmerisourceBergen Corp. | 3,913 | 275,123 | ||||||
| Henry Schein, Inc.* | 1,809 | 206,696 | ||||||
| Patterson Companies, Inc. | 3,500 | 144,200 | ||||||
| Total Health Care Distributors | 1,348,050 | |||||||
| HEALTH CARE FACILITIES - 3.9% | ||||||||
| HCA Holdings, Inc.* | 6,823 | 325,526 | ||||||
| Universal Health Services, Inc. — Class B | 2,336 | 189,823 | ||||||
| Tenet Healthcare Corp.* | 3,410 | 143,629 | ||||||
| Community Health Systems, Inc.* | 3,570 | 140,194 | ||||||
| Health Management Associates, Inc. — Class A* | 9,900 | 129,690 | ||||||
| Brookdale Senior Living, Inc.* | 4,620 | 125,572 | ||||||
| VCA Antech, Inc.* | 3,670 | 115,091 | ||||||
| Total Health Care Facilities | 1,169,525 | |||||||
| HEALTH CARE SUPPLIES - 1.6% | ||||||||
| DENTSPLY International, Inc. | 3,712 | 179,957 | ||||||
| Cooper Companies, Inc. | 1,390 | 172,138 | ||||||
| Align Technology, Inc.* | 2,390 | 136,589 | ||||||
| Total Health Care Supplies | 488,684 | |||||||
| HEALTH CARE TECHNOLOGY - 1.5% | ||||||||
| Cerner Corp.* | 5,392 | 300,550 | ||||||
| athenahealth, Inc.* | 1,180 | 158,710 | ||||||
| Total Health Care Technology | 459,260 | |||||||
| Total Common Stocks | ||||||||
| (Cost $18,402,457) | 30,150,964 | |||||||
| Face | ||||||||
| Amount | ||||||||
| REPURCHASE AGREEMENT††,2 - 0.6% | ||||||||
| Credit Suisse Group | ||||||||
| issued 12/31/13 at 0.00% | ||||||||
| due 01/02/14 | $ | 181,059 | 181,059 | |||||
| Total Repurchase Agreement | ||||||||
| (Cost $181,059) | 181,059 | |||||||
| SECURITIES LENDING COLLATERAL††,3 - 1.4% | ||||||||
| Repurchase Agreements | ||||||||
| HSBC Securities, Inc. | ||||||||
| issued 12/31/13 at 0.01% | ||||||||
| due 01/02/14 | 356,611 | 356,611 | ||||||
| Deutsche Bank Securities, Inc. | ||||||||
| issued 12/31/13 at 0.02% | ||||||||
| due 01/02/14 | 52,564 | 52,564 | ||||||
| Total Securities Lending Collateral | ||||||||
| (Cost $409,175) | 409,175 | |||||||
| Total Investments - 102.1% | ||||||||
| (Cost $18,992,691) | $ | 30,741,198 | ||||||
| Other Assets & Liabilities, net - (2.1)% | (636,615 | ) | ||||||
| Total Net Assets - 100.0% | $ | 30,104,583 | ||||||
| * | Non-income producing security. |
| † | Value determined based on Level 1 inputs — See Note 4. |
| †† | Value determined based on Level 2 inputs — See Note 4. |
| 1 | All or portion of this security is on loan at December 31, 2013 — See Note 8. |
| 2 | Repurchase Agreement — See Note 5. |
| 3 | Securities lending collateral — See Note 8. ADR — American Deposit Receipt plc — Public Limited Company |
| SEE NOTES TO FINANCIAL STATEMENTS. | THE RYDEX FUNDS ANNUAL REPORT | 69 |
Health care Fund
| STATEMENT OF ASSETS AND LIABILITIES |
December 31, 2013
| Assets: | ||||
| Investments, at value - including $394,414 of securities loaned | ||||
| (cost $18,402,457) | $ | 30,150,964 | ||
| Repurchase agreements, at value | ||||
| (cost $590,234) | 590,234 | |||
| Total investments | ||||
| (cost $18,992,691) | 30,741,198 | |||
| Receivables: | ||||
| Dividends | 26,329 | |||
| Fund shares sold | 4,700 | |||
| Interest and securities lending income | 502 | |||
| Total assets | 30,772,729 | |||
| Liabilities: | ||||
| Payable for: | ||||
| Upon return of securities loaned | 409,175 | |||
| Fund shares redeemed | 193,167 | |||
| Management fees | 18,976 | |||
| Transfer agent and administrative fees | 5,581 | |||
| Investor service fees | 5,581 | |||
| Portfolio accounting fees | 2,233 | |||
| Miscellaneous | 33,433 | |||
| Total liabilities | 668,146 | |||
| Net assets | $ | 30,104,583 | ||
| Net assets consist of: | ||||
| Paid in capital | $ | 22,184,561 | ||
| Undistributed net investment income | — | |||
| Accumulated net realized loss on investments | (3,828,485 | ) | ||
| Net unrealized appreciation on investments | 11,748,507 | |||
| Net assets | $ | 30,104,583 | ||
| Capital shares outstanding | 615,560 | |||
| Net asset value per share | $ | 48.91 |
| STATEMENT OF OPERATIONS |
Year Ended December 31, 2013
| Investment Income: | ||||
| Dividends (net of foreign withholding tax of $866) | $ | 300,608 | ||
| Income from securities lending, net | 7,177 | |||
| Interest | 29 | |||
| Total investment income | 307,814 | |||
| Expenses: | ||||
| Management fees | 201,472 | |||
| Transfer agent and administrative fees | 59,257 | |||
| Investor service fees | 59,257 | |||
| Portfolio accounting fees | 23,703 | |||
| Professional fees | 21,350 | |||
| Custodian fees | 2,648 | |||
| Trustees’ fees* | 2,227 | |||
| Line of credit interest expense | 111 | |||
| Miscellaneous | 17,297 | |||
| Total expenses | 387,322 | |||
| Net investment loss | (79,508 | ) | ||
| Net Realized and Unrealized Gain (Loss): | ||||
| Net realized gain (loss) on: | ||||
| Investments | 2,969,994 | |||
| Net realized gain | 2,969,994 | |||
| Net change in unrealized appreciation (depreciation) on: | ||||
| Investments | 5,019,875 | |||
| Net change in unrealized appreciation (depreciation) | 5,019,875 | |||
| Net realized and unrealized gain | 7,989,869 | |||
| Net increase in net assets resulting from operations | $ | 7,910,361 |
| * | Relates to Trustees not deemed “interested persons” within the meaning of Section 2(a)(19) of the 1940 Act. |
| 70 | THE RYDEX FUNDS ANNUAL REPORT | SEE NOTES TO FINANCIAL STATEMENTS. |
| HEALTH CARE FUND |
| STATEMENTS OF CHANGES IN NET ASSETS |
| Year Ended | Year Ended | |||||||
| December 31, | December 31, | |||||||
| 2013 | 2012 | |||||||
| Increase (Decrease) In Net Assets From Operations: | ||||||||
| Net investment income (loss) | $ | (79,508 | ) | $ | 43,524 | |||
| Net realized gain on investments | 2,969,994 | 619,678 | ||||||
| Net change in unrealized appreciation (depreciation) on investments | 5,019,875 | 1,963,621 | ||||||
| Net increase in net assets resulting from operations | 7,910,361 | 2,626,823 | ||||||
| Distributions to shareholders from: | ||||||||
| Net investment income | (44,395 | ) | — | |||||
| Total distributions to shareholders | (44,395 | ) | — | |||||
| Capital share transactions: | ||||||||
| Proceeds from sale of shares | 62,242,398 | 64,648,767 | ||||||
| Distributions reinvested | 44,395 | — | ||||||
| Cost of shares redeemed | (57,984,354 | ) | (65,240,826 | ) | ||||
| Net increase (decrease) from capital share transactions | 4,302,439 | (592,059 | ) | |||||
| Net increase in net assets | 12,168,405 | 2,034,764 | ||||||
| Net assets: | ||||||||
| Beginning of year | 17,936,178 | 15,901,414 | ||||||
| End of year | $ | 30,104,583 | $ | 17,936,178 | ||||
| Undistributed net investment income at end of year | $ | — | $ | 43,605 | ||||
| Capital share activity: | ||||||||
| Shares sold | 1,485,781 | 1,948,024 | ||||||
| Shares issued from reinvestment of distributions | 940 | — | ||||||
| Shares redeemed | (1,390,442 | ) | (1,968,045 | ) | ||||
| Net increase (decrease) in shares | 96,279 | (20,021 | ) | |||||
| SEE NOTES TO FINANCIAL STATEMENTS. | THE RYDEX FUNDS ANNUAL REPORT | 71 |
HEALTH CARE FUND
| FINANCIAL HIGHLIGHTS |
This table is presented to show selected data for a share outstanding throughout each period and to assist shareholders in evaluating a Fund’s performance for the periods presented.
| Year Ended | Year Ended | Year Ended | Year Ended | Year Ended | ||||||||||||||||
| December 31, | December 31, | December 31, | December 31, | December 31, | ||||||||||||||||
| 2013 | 2012 | 2011 | 2010 | 2009 | ||||||||||||||||
| Per Share Data | ||||||||||||||||||||
| Net asset value, beginning of period | $ | 34.54 | $ | 29.49 | $ | 28.16 | $ | 26.45 | $ | 21.22 | ||||||||||
| Income (loss) from investment operations: | ||||||||||||||||||||
| Net investment income (loss)a | (.14 | ) | .08 | (.11 | ) | (.04 | ) | .04 | ||||||||||||
| Net gain on investments (realized and unrealized) | 14.59 | 4.97 | 1.44 | 1.83 | 5.19 | |||||||||||||||
| Total from investment operations | 14.45 | 5.05 | 1.33 | 1.79 | 5.23 | |||||||||||||||
| Less distributions from: | ||||||||||||||||||||
| Net investment income | (.08 | ) | — | — | (.08 | ) | — | |||||||||||||
| Total distributions | (.08 | ) | — | — | (.08 | ) | — | |||||||||||||
| Net asset value, end of period | $ | 48.91 | $ | 34.54 | $ | 29.49 | $ | 28.16 | $ | 26.45 | ||||||||||
| Total Returnb | 41.81 | % | 17.16 | % | 4.69 | % | 6.77 | % | 24.65 | % | ||||||||||
| Ratios/Supplemental Data | ||||||||||||||||||||
| Net assets, end of period (in thousands) | $ | 30,105 | $ | 17,936 | $ | 15,901 | $ | 11,328 | $ | 26,896 | ||||||||||
| Ratios to average net assets: | ||||||||||||||||||||
| Net investment income (loss) | (0.34 | %) | 0.24 | % | (0.37 | %) | (0.15 | %) | 0.17 | % | ||||||||||
| Total expenses | 1.63 | % | 1.67 | % | 1.70 | % | 1.64 | % | 1.67 | % | ||||||||||
| Portfolio turnover rate | 277 | % | 350 | % | 358 | % | 455 | % | 301 | % | ||||||||||
| a | Net investment income (loss) per share was computed using average shares outstanding throughout the period. |
| b | Total return does not reflect the impact of any additional fees charged by insurance companies. |
| 72 | THE RYDEX FUNDS ANNUAL REPORT | SEE NOTES TO FINANCIAL STATEMENTS. |
| This page intentionally left blank. |
| THE RYDEX FUNDS ANNUAL REPORT | 73 |
| PERFORMANCE REPORT AND FUND PROFILE (Unaudited) | December 31, 2013 |
OBJECTIVE: Seeks to provide capital appreciation by investing in companies that provide products or services designed for or related to the Internet (“Internet Companies”).
For the year ended December 31, 2013, Internet Fund returned 51.23%, compared with a gain of 32.39% for the S&P 500 Index. The S&P 500 Information Technology Index returned 28.43%.
Within the sector, internet software and services industry contributed most to Fund performance, followed by the internet & catalog retail segment. The semiconductors & semiconductor equipment industry was the only detractor from return.
Google, Inc. Class A, Facebook, Inc. Class A and Netflix, Inc. added the most to Fund performance for the year.
Rackspace Hosting, Inc., BlackBerry Ltd. and Liquidity Services, Inc. detracted most from Fund performance for the year.
Performance displayed represents past performance, which is no guarantee of future results.
Holdings Diversification (Market Exposure as % of Net Assets)
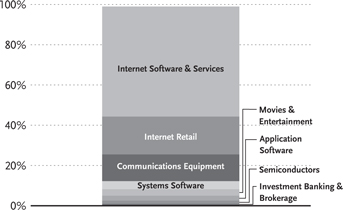
“Holdings Diversification (Market Exposure as % of Net Assets)” excludes any temporary cash investments.
Inception Date: May 24, 2001
| Ten Largest Holdings (% of Total Net Assets) | ||||
| Google, Inc. — Class A | 7.6 | % | ||
| Amazon.com, Inc. | 5.3 | % | ||
| Facebook, Inc. — Class A | 4.5 | % | ||
| QUALCOMM, Inc. | 4.5 | % | ||
| Cisco Systems, Inc. | 4.4 | % | ||
| eBay, Inc. | 3.4 | % | ||
| Time Warner, Inc. | 3.2 | % | ||
| Priceline.com, Inc. | 3.0 | % | ||
| Twitter, Inc. | 2.6 | % | ||
| Yahoo!, Inc. | 2.5 | % | ||
| Top Ten Total | 41.0 | % | ||
“Ten Largest Holdings” exclude any temporary cash or derivative investments.
| 74 | THE RYDEX FUNDS ANNUAL REPORT |
| PERFORMANCE REPORT AND FUND PROFILE (Unaudited) (concluded) |
Cumulative Fund Performance*,†

Average Annual Returns
Periods Ended December 31, 2013*,†
| 1 Year | 5 Year | 10 Year | ||||||||||
| Internet Fund | 51.23 | % | 26.06 | % | 9.28 | % | ||||||
| S&P 500 Information Technology Index | 28.43 | % | 21.90 | % | 7.17 | % | ||||||
| S&P 500 Index | 32.39 | % | 17.94 | % | 7.41 | % | ||||||
| * | The performance data above represents past performance that is not predictive of future results. The investment return and principal value of an investment in the Fund will fluctuate so that an investor’s shares, when redeemed, may be worth more or less than their original cost. Returns are historical and include changes in principal and reinvested dividends and capital gains and do not reflect the effect of taxes. The S&P 500 Index and the S&P 500 Information Technology Index are unmanaged indices and, unlike the Fund, have no management fees or operating expenses to reduce their reported returns. |
| † | Returns do not reflect the impact of any additional fees charged by insurance companies. |
| THE RYDEX FUNDS ANNUAL REPORT | 75 |
| SCHEDULE OF INVESTMENTS | December 31, 2013 |
| INTERNET FUND |
| Shares | Value | |||||||
| COMMON STOCKS† - 99.0% | ||||||||
| INTERNET SOFTWARE & SERVICES - 54.8% | ||||||||
| Google, Inc. — Class A* | 1,058 | $ | 1,185,710 | |||||
| Facebook, Inc. — Class A* | 12,877 | 703,856 | ||||||
| eBay, Inc.* | 9,538 | 523,541 | ||||||
| Twitter, Inc.*,1 | 6,380 | 406,087 | ||||||
| Yahoo!, Inc.* | 9,741 | 393,926 | ||||||
| Baidu, Inc. ADR* | 1,968 | 350,068 | ||||||
| LinkedIn Corp. — Class A* | 1,479 | 320,692 | ||||||
| SINA Corp.* | 2,504 | 210,962 | ||||||
| Qihoo 360 Technology Company Ltd. ADR* | 2,289 | 187,812 | ||||||
| Equinix, Inc.* | 1,048 | 185,968 | ||||||
| Akamai Technologies, Inc.* | 3,791 | 178,859 | ||||||
| VeriSign, Inc.* | 2,966 | 177,307 | ||||||
| Yandex N.V. — Class A* | 4,106 | 177,174 | ||||||
| Youku Tudou, Inc. ADR* | 5,842 | 177,013 | ||||||
| MercadoLibre, Inc. | 1,547 | 166,751 | ||||||
| Sohu.com, Inc.* | 2,183 | 159,206 | ||||||
| SouFun Holdings Ltd. ADR | 1,920 | 158,227 | ||||||
| YY, Inc. ADR* | 3,080 | 154,862 | ||||||
| NetEase, Inc. ADR | 1,968 | 154,685 | ||||||
| Bitauto Holdings Ltd. ADR* | 4,560 | 145,738 | ||||||
| Rackspace Hosting, Inc.* | 3,697 | 144,664 | ||||||
| CoStar Group, Inc.* | 780 | 143,972 | ||||||
| IAC/InterActiveCorp | 2,033 | 139,647 | ||||||
| Yelp, Inc. — Class A* | 1,967 | 135,625 | ||||||
| Pandora Media, Inc.* | 5,040 | 134,064 | ||||||
| VistaPrint N.V.* | 2,350 | 133,598 | ||||||
| AOL, Inc.* | 2,585 | 120,513 | ||||||
| Zillow, Inc. — Class A* | 1,324 | 108,211 | ||||||
| Shutterstock, Inc.* | 1,210 | 101,192 | ||||||
| Cornerstone OnDemand, Inc.* | 1,883 | 100,439 | ||||||
| j2 Global, Inc. | 1,889 | 94,469 | ||||||
| Dealertrack Technologies, Inc.* | 1,940 | 93,275 | ||||||
| Demandware, Inc.* | 1,410 | 90,409 | ||||||
| Gogo, Inc.* | 3,620 | 89,812 | ||||||
| Rocket Fuel, Inc.*,1 | 1,420 | 87,316 | ||||||
| OpenTable, Inc.* | 1,049 | 83,259 | ||||||
| Bankrate, Inc.* | 4,580 | 82,165 | ||||||
| Web.com Group, Inc.* | 2,540 | 80,747 | ||||||
| WebMD Health Corp. — Class A* | 1,981 | 78,250 | ||||||
| Trulia, Inc.* | 2,140 | 75,478 | ||||||
| ValueClick, Inc.* | 3,202 | 74,831 | ||||||
| Blucora, Inc.* | 2,300 | 67,068 | ||||||
| Angie’s List, Inc.* | 3,764 | 57,025 | ||||||
| Monster Worldwide, Inc.* | 7,422 | 52,919 | ||||||
| Liquidity Services, Inc.*,1 | 2,291 | 51,914 | ||||||
| Total Internet Software & Services | 8,539,306 | |||||||
| INTERNET RETAIL - 18.8% | ||||||||
| Amazon.com, Inc.* | 2,059 | 821,108 | ||||||
| Priceline.com, Inc.* | 399 | 463,798 | ||||||
| Netflix, Inc.* | 770 | 283,491 | ||||||
| TripAdvisor, Inc.* | 2,545 | 210,802 | ||||||
| Ctrip.com International Ltd. ADR* | 3,852 | 191,136 | ||||||
| Expedia, Inc. | 2,598 | 180,977 | ||||||
| Groupon, Inc. — Class A* | 13,905 | 163,662 | ||||||
| Vipshop Holdings Ltd. ADR* | 1,858 | 155,477 | ||||||
| Liberty Ventures* | 1,080 | 132,397 | ||||||
| E-Commerce China Dangdang, Inc. — | ||||||||
| Class A ADR*,1 | 13,810 | 131,886 | ||||||
| HomeAway, Inc.* | 2,885 | 117,939 | ||||||
| Shutterfly, Inc.* | 1,703 | 86,734 | ||||||
| Total Internet Retail | 2,939,407 | |||||||
| COMMUNICATIONS EQUIPMENT - 13.2% | ||||||||
| QUALCOMM, Inc. | 9,411 | 698,767 | ||||||
| Cisco Systems, Inc. | 30,694 | 689,080 | ||||||
| Juniper Networks, Inc.* | 9,405 | 212,271 | ||||||
| BlackBerry Ltd.* | 27,045 | 201,485 | ||||||
| F5 Networks, Inc.* | 1,852 | 168,273 | ||||||
| Ciena Corp.* | 4,128 | 98,783 | ||||||
| Total Communications Equipment | 2,068,659 | |||||||
| SYSTEMS SOFTWARE - 4.0% | ||||||||
| Symantec Corp. | 10,518 | 248,014 | ||||||
| Red Hat, Inc.* | 3,748 | 210,038 | ||||||
| Check Point Software Technologies Ltd.* | 2,529 | 163,171 | ||||||
| Total Systems Software | 621,223 | |||||||
| MOVIES & ENTERTAINMENT - 3.2% | ||||||||
| Time Warner, Inc. | 7,072 | 493,060 | ||||||
| APPLICATION SOFTWARE - 2.5% | ||||||||
| Intuit, Inc. | 3,740 | 285,437 | ||||||
| TIBCO Software, Inc.* | 4,961 | 111,523 | ||||||
| Total Application Software | 396,960 | |||||||
| SEMICONDUCTORS - 1.6% | ||||||||
| Broadcom Corp. — Class A | 8,553 | 253,596 | ||||||
| INVESTMENT BANKING & BROKERAGE - 0.9% | ||||||||
| E*TRADE Financial Corp.* | 7,409 | 145,513 | ||||||
| Total Common Stocks | ||||||||
| (Cost $10,207,873) | 15,457,724 | |||||||
| 76 | THE RYDEX FUNDS ANNUAL REPORT | SEE NOTES TO FINANCIAL STATEMENTS. |
| SCHEDULE OF INVESTMENTS (concluded) | December 31, 2013 |
| INTERNET FUND |
| Face | ||||||||
| Amount | Value | |||||||
| REPURCHASE AGREEMENT††,2 - 0.2% | ||||||||
| Credit Suisse Group | ||||||||
| issued 12/31/13 at 0.00% | ||||||||
| due 01/02/14 | $ | 28,167 | $ | 28,167 | ||||
| Total Repurchase Agreement | ||||||||
| (Cost $28,167) | 28,167 | |||||||
| SECURITIES LENDING COLLATERAL††,3 - 2.9% | ||||||||
| Repurchase Agreements | ||||||||
| HSBC Securities, Inc. | ||||||||
| issued 12/31/13 at 0.01% | ||||||||
| due 01/02/14 | 394,217 | 394,217 | ||||||
| Deutsche Bank Securities, Inc. | ||||||||
| issued 12/31/13 at 0.02% | ||||||||
| due 01/02/14 | 58,108 | 58,108 | ||||||
| Total Securities Lending Collateral | ||||||||
| (Cost $452,325) | 452,325 | |||||||
| Total Investments - 102.1% | ||||||||
| (Cost $10,688,365) | $ | 15,938,216 | ||||||
| Other Assets & Liabilities, net - (2.1)% | (321,348 | ) | ||||||
| Total Net Assets - 100.0% | $ | 15,616,868 | ||||||
| * | Non-income producing security. |
| † | Value determined based on Level 1 inputs — See Note 4. |
| †† | Value determined based on Level 2 inputs — See Note 4. |
| 1 | All or portion of this security is on loan at December 31, 2013 — See Note 8. |
| 2 | Repurchase Agreement — See Note 5. |
| 3 | Securities lending collateral — See Note 8. |
ADR — American Depository Receipt
| SEE NOTES TO FINANCIAL STATEMENTS. | THE RYDEX FUNDS ANNUAL REPORT | 77 |
| INTERNET FUND |
| STATEMENT OF ASSETS AND LIABILITIES |
| December 31, 2013 |
| Assets: | ||||
| Investments, at value - including $456,431 of securities loaned | ||||
| (cost $10,207,873) | $ | 15,457,724 | ||
| Repurchase agreements, at value | ||||
| (cost $480,492) | 480,492 | |||
| Total investments | ||||
| (cost $10,688,365) | 15,938,216 | |||
| Receivables: | ||||
| Securities sold | 431,732 | |||
| Fund shares sold | 88,525 | |||
| Interest and securities lending income | 615 | |||
| Dividends | 215 | |||
| Total assets | 16,459,303 | |||
| Liabilities: | ||||
| Payable for: | ||||
| Upon return of securities loaned | 452,325 | |||
| Securities purchased | 354,184 | |||
| Management fees | 10,192 | |||
| Fund shares redeemed | 6,981 | |||
| Transfer agent and administrative fees | 2,998 | |||
| Investor service fees | 2,998 | |||
| Portfolio accounting fees | 1,199 | |||
| Miscellaneous | 11,558 | |||
| Total liabilities | 842,435 | |||
| Net assets | $ | 15,616,868 | ||
| Net assets consist of: | ||||
| Paid in capital | $ | 10,592,632 | ||
| Undistributed net investment income | 6,482 | |||
| Accumulated net realized loss on investments | (232,097 | ) | ||
| Net unrealized appreciation on investments | 5,249,851 | |||
| Net assets | $ | 15,616,868 | ||
| Capital shares outstanding | 726,514 | |||
| Net asset value per share | $ | 21.50 |
| STATEMENT OF OPERATIONS |
| Year Ended December 31, 2013 |
| Investment Income: | ||||
| Dividends (net of foreign withholding tax of $216) | $ | 44,580 | ||
| Income from securities lending, net | 3,169 | |||
| Interest | 14 | |||
| Total investment income | 47,763 | |||
| Expenses: | ||||
| Management fees | 71,860 | |||
| Transfer agent and administrative fees | 21,135 | |||
| Investor service fees | 21,135 | |||
| Portfolio accounting fees | 8,454 | |||
| Professional fees | 7,592 | |||
| Custodian fees | 969 | |||
| Trustees’ fees* | 676 | |||
| Line of credit interest expense | 35 | |||
| Miscellaneous | 6,030 | |||
| Total expenses | 137,886 | |||
| Net investment loss | (90,123 | ) | ||
| Net Realized and Unrealized Gain (Loss): | ||||
| Net realized gain (loss) on: | ||||
| Investments | 668,206 | |||
| Net realized gain | 668,206 | |||
| Net change in unrealized appreciation (depreciation) on: | ||||
| Investments | 2,810,267 | |||
| Net change in unrealized appreciation (depreciation) | 2,810,267 | |||
| Net realized and unrealized gain | 3,478,473 | |||
| Net increase in net assets resulting from operations | $ | 3,388,350 |
| * | Relates to Trustees not deemed “interested persons” within the meaning of Section 2(a)(19) of the 1940 Act. |
| 78 | THE RYDEX FUNDS ANNUAL REPORT | SEE NOTES TO FINANCIAL STATEMENTS. |
| INTERNET FUND |
| STATEMENTS OF CHANGES IN NET ASSETS |
| Year Ended | Year Ended | |||||||
| December 31, | December 31, | |||||||
| 2013 | 2012 | |||||||
| Increase (Decrease) In Net Assets From Operations: | ||||||||
| Net investment loss | $ | (90,123 | ) | $ | (66,649 | ) | ||
| Net realized gain on investments | 668,206 | 542,750 | ||||||
| Net change in unrealized appreciation (depreciation) on investments | 2,810,267 | 252,580 | ||||||
| Net increase in net assets resulting from operations | 3,388,350 | 728,681 | ||||||
| Distributions to shareholders from: | ||||||||
| Net realized gains | (272,581 | ) | (1,259,155 | ) | ||||
| Total distributions to shareholders | (272,581 | ) | (1,259,155 | ) | ||||
| Capital share transactions: | ||||||||
| Proceeds from sale of shares | 31,399,391 | 15,977,247 | ||||||
| Distributions reinvested | 272,581 | 1,259,155 | ||||||
| Cost of shares redeemed | (25,440,930 | ) | (15,434,323 | ) | ||||
| Net increase from capital share transactions | 6,231,042 | 1,802,079 | ||||||
| Net increase in net assets | 9,346,811 | 1,271,605 | ||||||
| Net assets: | ||||||||
| Beginning of year | 6,270,057 | 4,998,452 | ||||||
| End of year | $ | 15,616,868 | $ | 6,270,057 | ||||
| Undistributed net investment income at end of year | $ | 6,482 | $ | — | ||||
| Capital share activity: | ||||||||
| Shares sold | 1,712,921 | 863,197 | ||||||
| Shares issued from reinvestment of distributions | 13,704 | 93,340 | ||||||
| Shares redeemed | (1,432,774 | ) | (811,702 | ) | ||||
| Net increase in shares | 293,851 | 144,835 | ||||||
| SEE NOTES TO FINANCIAL STATEMENTS. | THE RYDEX FUNDS ANNUAL REPORT | 79 |
| INTERNET FUND |
| FINANCIAL HIGHLIGHTS |
This table is presented to show selected data for a share outstanding throughout each period and to assist shareholders in evaluating a Fund’s performance for the periods presented.
| Year Ended | Year Ended | Year Ended | Year Ended | Year Ended | ||||||||||||||||
| December 31, | December 31, | December 31, | December 31, | December 31, | ||||||||||||||||
| 2013 | 2012 | 2011 | 2010 | 2009 | ||||||||||||||||
| Per Share Data | ||||||||||||||||||||
| Net asset value, beginning of period | $ | 14.49 | $ | 17.37 | $ | 19.71 | $ | 16.32 | $ | 9.84 | ||||||||||
| Income (loss) from investment operations: | ||||||||||||||||||||
| Net investment lossa | (.19 | ) | (.22 | ) | (.27 | ) | (.19 | ) | (.19 | ) | ||||||||||
| Net gain (loss) on investments (realized and unrealized) | 7.59 | 3.14 | (2.07 | ) | 3.58 | 6.67 | ||||||||||||||
| Total from investment operations | 7.40 | 2.92 | (2.34 | ) | 3.39 | 6.48 | ||||||||||||||
| Less distributions from: | ||||||||||||||||||||
| Net realized gains | (.39 | ) | (5.80 | ) | — | — | — | |||||||||||||
| Total distributions | (.39 | ) | (5.80 | ) | — | — | — | |||||||||||||
| Net asset value, end of period | $ | 21.50 | $ | 14.49 | $ | 17.37 | $ | 19.71 | $ | 16.32 | ||||||||||
| Total Returnb | 51.23 | % | 19.33 | % | (11.92 | %) | 20.77 | % | 65.85 | % | ||||||||||
| Ratios/Supplemental Data | ||||||||||||||||||||
| Net assets, end of period (in thousands) | $ | 15,617 | $ | 6,270 | $ | 4,998 | $ | 16,786 | $ | 30,360 | ||||||||||
| Ratios to average net assets: | ||||||||||||||||||||
| Net investment loss | (1.07 | %) | (1.18 | %) | (1.38 | %) | (1.15 | %) | (1.36 | %) | ||||||||||
| Total expenses | 1.63 | % | 1.67 | % | 1.71 | % | 1.66 | % | 1.64 | % | ||||||||||
| Portfolio turnover rate | 311 | % | 274 | % | 321 | % | 401 | % | 274 | % | ||||||||||
| a | Net investment loss per share was computed using average shares outstanding throughout the period. |
| b | Total return does not reflect the impact of any additional fees charged by insurance companies. |
| 80 | THE RYDEX FUNDS ANNUAL REPORT | SEE NOTES TO FINANCIAL STATEMENTS. |
This page intentionally left blank.
| THE RYDEX FUNDS ANNUAL REPORT | 81 |
| PERFORMANCE REPORT AND FUND PROFILE (Unaudited) | December 31, 2013 |
OBJECTIVE: Seeks to provide capital appreciation by investing in companies engaged in leisure and entertainment businesses (“Leisure Companies”).
For the year ended December 31, 2013, Leisure Fund rose 42.41%, compared with a gain of 32.39% for the S&P 500 Index. The S&P 500 Consumer Discretionary Index returned 43.08%.
Within the sector, the media industry and the hotels, restaurants & leisure industry contributed most of the Fund’s return for the year. No industry detracted, but the REITs industry and the diversified financial services industry contributed least.
Holdings that contributed the most to the Fund’s return were Walt Disney Co., Las Vegas Sands Corp. and Comcast Corp. Class A.
Ambev S.A., Life Time Fitness, Inc. and SeaWorld Entertainment, Inc. were the holdings contributing the least to return.
Performance displayed represents past performance, which is no guarantee of future results.
Holdings Diversification (Market Exposure as % of Net Assets)

“Holdings Diversification (Market Exposure as % of Net Assets)” excludes any temporary cash investments.
Inception Date: May 22, 2001
| Ten Largest Holdings (% of Total Net Assets) | ||||
| Philip Morris International, Inc. | 3.8 | % | ||
| Walt Disney Co. | 3.7 | % | ||
| Comcast Corp. — Class A | 3.7 | % | ||
| McDonald’s Corp. | 3.1 | % | ||
| Twenty-First Century Fox, | ||||
| Inc. — Class A | 2.8 | % | ||
| Altria Group, Inc. | 2.7 | % | ||
| Las Vegas Sands Corp. | 2.6 | % | ||
| Time Warner, Inc. | 2.5 | % | ||
| Starbucks Corp. | 2.4 | % | ||
| CBS Corp. — Class B | 2.0 | % | ||
| Top Ten Total | 29.3 | % | ||
“Ten Largest Holdings” exclude any temporary cash or derivative investments.
| 82 | THE RYDEX FUNDS ANNUAL REPORT |
| PERFORMANCE REPORT AND FUND PROFILE (Unaudited) (concluded) |
Cumulative Fund Performance*,†
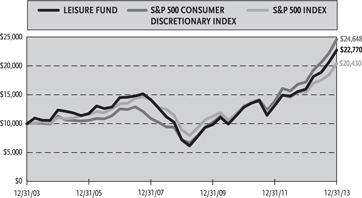
Average Annual Returns
Periods Ended December 31, 2013*,†
| 1 Year | 5 Year | 10 Year | ||||||||||
| Leisure Fund | 42.41 | % | 25.83 | % | 8.58 | % | ||||||
| S&P 500 Consumer Discretionary Index | 43.08 | % | 27.69 | % | 9.44 | % | ||||||
| S&P 500 Index | 32.39 | % | 17.94 | % | 7.41 | % | ||||||
| * | The performance data above represents past performance that is not predictive of future results. The investment return and principal value of an investment in the Fund will fluctuate so that an investor’s shares, when redeemed, may be worth more or less than their original cost. Returns are historical and include changes in principal and reinvested dividends and capital gains and do not reflect the effect of taxes. The S&P 500 Index and the S&P 500 Consumer Discretionary Index are unmanaged indices and, unlike the Fund, have no management fees or operating expenses to reduce their reported returns. |
| † | Returns do not reflect the impact of any additional fees charged by insurance companies. |
| THE RYDEX FUNDS ANNUAL REPORT | 83 |
| SCHEDULE OF INVESTMENTS | December 31, 2013 |
| LEISURE FUND |
| Shares | Value | |||||||
| COMMON STOCKS† - 99.3% | ||||||||
| RESTAURANTS - 16.2% | ||||||||
| McDonald’s Corp. | 3,797 | $ | 368,422 | |||||
| Starbucks Corp. | 3,650 | 286,123 | ||||||
| Yum! Brands, Inc. | 2,932 | 221,688 | ||||||
| Chipotle Mexican Grill, Inc. — Class A* | 283 | 150,777 | ||||||
| Darden Restaurants, Inc. | 1,956 | 106,348 | ||||||
| Panera Bread Co. — Class A* | 484 | 85,518 | ||||||
| Dunkin’ Brands Group, Inc. | 1,770 | 85,314 | ||||||
| Domino’s Pizza, Inc. | 1,060 | 73,829 | ||||||
| Wendy’s Co. | 8,080 | 70,458 | ||||||
| Brinker International, Inc. | 1,442 | 66,822 | ||||||
| Bloomin’ Brands, Inc.* | 2,740 | 65,787 | ||||||
| Buffalo Wild Wings, Inc.* | 420 | 61,824 | ||||||
| Cracker Barrel Old Country Store, Inc. | 540 | 59,438 | ||||||
| Cheesecake Factory, Inc. | 1,230 | 59,372 | ||||||
| Jack in the Box, Inc.* | 1,080 | 54,022 | ||||||
| Texas Roadhouse, Inc. — Class A | 1,910 | 53,098 | ||||||
| Krispy Kreme Doughnuts, Inc.* | 2,180 | 42,052 | ||||||
| Total Restaurants | 1,910,892 | |||||||
| MOVIES & ENTERTAINMENT - 15.2% | ||||||||
| Walt Disney Co. | 5,713 | 436,472 | ||||||
| Twenty-First Century Fox, Inc. — Class A | 9,610 | 338,080 | ||||||
| Time Warner, Inc. | 4,282 | 298,541 | ||||||
| Viacom, Inc. — Class B | 2,669 | 233,110 | ||||||
| Madison Square Garden Co. — Class A* | 1,400 | 80,612 | ||||||
| Lions Gate Entertainment Corp. | 2,413 | 76,396 | ||||||
| Cinemark Holdings, Inc. | 2,235 | 74,493 | ||||||
| Live Nation Entertainment, Inc.* | 3,752 | 74,140 | ||||||
| Imax Corp.* | 2,250 | 66,330 | ||||||
| Regal Entertainment Group — Class A | 3,400 | 66,130 | ||||||
| DreamWorks Animation SKG, Inc. — Class A* | 1,800 | 63,900 | ||||||
| Total Movies & Entertainment | 1,808,204 | |||||||
| CABLE & SATELLITE - 13.8% | ||||||||
| Comcast Corp. — Class A | 8,374 | 435,154 | ||||||
| Time Warner Cable, Inc. | 1,712 | 231,976 | ||||||
| DIRECTV* | 3,351 | 231,521 | ||||||
| DISH Network Corp. — Class A* | 3,331 | 192,932 | ||||||
| Liberty Global plc — Class A* | 1,846 | 164,276 | ||||||
| Charter Communications, Inc. — Class A* | 1,070 | 146,333 | ||||||
| AMC Networks, Inc. — Class A* | 1,270 | 86,500 | ||||||
| Cablevision Systems Corp. — Class A | 4,657 | 83,500 | ||||||
| Starz — Class A* | 2,363 | 69,094 | ||||||
| Total Cable & Satellite | 1,641,286 | |||||||
| TOBACCO - 9.5% | ||||||||
| Philip Morris International, Inc. | 5,116 | 445,757 | ||||||
| Altria Group, Inc. | 8,470 | 325,163 | ||||||
| Reynolds American, Inc. | 3,944 | 197,161 | ||||||
| Lorillard, Inc. | 3,235 | 163,950 | ||||||
| Total Tobacco | 1,132,031 | |||||||
| CASINOS & GAMING - 8.9% | ||||||||
| Las Vegas Sands Corp. | 3,854 | 303,964 | ||||||
| Wynn Resorts Ltd. | 869 | 168,768 | ||||||
| MGM Resorts International* | 5,326 | 125,268 | ||||||
| Melco Crown Entertainment Ltd. ADR* | 2,868 | 112,483 | ||||||
| International Game Technology | 4,606 | 83,645 | ||||||
| Bally Technologies, Inc.* | 850 | 66,683 | ||||||
| Caesars Entertainment Corp.* | 3,090 | 66,559 | ||||||
| Pinnacle Entertainment, Inc.* | 1,810 | 47,042 | ||||||
| Boyd Gaming Corp.* | 3,721 | 41,898 | ||||||
| Penn National Gaming, Inc.* | 2,769 | 39,680 | ||||||
| Total Casinos & Gaming | 1,055,990 | |||||||
| BROADCASTING - 7.5% | ||||||||
| CBS Corp. — Class B | 3,694 | 235,455 | ||||||
| Discovery Communications, Inc. — Class A* | 2,347 | 212,216 | ||||||
| Liberty Media Corp. — Class A* | 1,070 | 156,702 | ||||||
| Scripps Networks Interactive, Inc. — Class A | 1,537 | 132,812 | ||||||
| Grupo Televisa SAB ADR | 2,697 | 81,611 | ||||||
| Sinclair Broadcast Group, Inc. — Class A | 2,050 | 73,247 | ||||||
| Total Broadcasting | 892,043 | |||||||
| HOTELS, RESORTS & CRUISE LINES - 7.1% | ||||||||
| Carnival Corp. | 5,219 | 209,647 | ||||||
| Marriott International, Inc. — Class A | 2,938 | 145,020 | ||||||
| Starwood Hotels & Resorts Worldwide, Inc. | 1,808 | 143,646 | ||||||
| Royal Caribbean Cruises Ltd. | 2,527 | 119,830 | ||||||
| Wyndham Worldwide Corp. | 1,573 | 115,914 | ||||||
| Norwegian Cruise Line Holdings Ltd.* | 2,940 | 104,282 | ||||||
| Total Hotels, Resorts & Cruise Lines | 838,339 | |||||||
| PUBLISHING - 4.7% | ||||||||
| Thomson Reuters Corp. | 5,542 | 209,598 | ||||||
| News Corp. — Class A* | 6,884 | 124,050 | ||||||
| Gannett Company, Inc. | 3,369 | 99,655 | ||||||
| New York Times Co. — Class A | 3,760 | 59,671 | ||||||
| Meredith Corp. | 1,140 | 59,052 | ||||||
| Total Publishing | 552,026 | |||||||
| LEISURE PRODUCTS - 4.2% | ||||||||
| Mattel, Inc. | 3,256 | 154,920 | ||||||
| Polaris Industries, Inc. | 818 | 119,134 | ||||||
| Hasbro, Inc. | 1,847 | 101,603 | ||||||
| Brunswick Corp. | 1,693 | 77,980 | ||||||
| Sturm Ruger & Company, Inc. | 610 | 44,585 | ||||||
| Total Leisure Products | 498,222 | |||||||
| DISTILLERS & VINTNERS - 4.1% | ||||||||
| Brown-Forman Corp. — Class B | 1,989 | 150,309 | ||||||
| Constellation Brands, Inc. — Class A* | 1,947 | 137,030 | ||||||
| Beam, Inc. | 1,836 | 124,958 | ||||||
| Diageo plc ADR | 550 | 72,831 | ||||||
| Total Distillers & Vintners | 485,128 | |||||||
| BREWERS - 2.8% | ||||||||
| Molson Coors Brewing Co. — Class B | 2,135 | 119,880 | ||||||
| Anheuser-Busch InBev N.V. ADR | 998 | 106,247 | ||||||
| AMBEV S.A. ADR | 13,660 | 100,401 | ||||||
| Total Brewers | 326,528 | |||||||
| HOME ENTERTAINMENT SOFTWARE - 2.3% | ||||||||
| Activision Blizzard, Inc. | 7,236 | 129,018 | ||||||
| Electronic Arts, Inc.* | 4,190 | 96,119 | ||||||
| Take-Two Interactive Software, Inc.* | 2,709 | 47,055 | ||||||
| Total Home Entertainment Software | 272,192 | |||||||
| 84 | THE RYDEX FUNDS ANNUAL REPORT | SEE NOTES TO FINANCIAL STATEMENTS. |
| SCHEDULE OF INVESTMENTS (concluded) | December 31, 2013 |
| LEISURE FUND |
| Shares | Value | |||||||
| MOTORCYCLE MANUFACTURERS - 1.2% | ||||||||
| Harley-Davidson, Inc. | 2,123 | $ | 146,997 | |||||
| LEISURE FACILITIES - 1.1% | ||||||||
| Six Flags Entertainment Corp. | 1,948 | 71,725 | ||||||
| Life Time Fitness, Inc.* | 1,171 | 55,037 | ||||||
| Total Leisure Facilities | 126,762 | |||||||
| EDUCATION SERVICES - 0.7% | ||||||||
| Graham Holdings Co. — Class B | 130 | 86,232 | ||||||
| Total Common Stocks | ||||||||
| (Cost $6,523,098) | 11,772,872 | |||||||
| Face | ||||||||
| Amount | ||||||||
| REPURCHASE AGREEMENT††,1 - 0.6% | ||||||||
| Credit Suisse Group | ||||||||
| issued 12/31/13 at 0.00% | ||||||||
| due 01/02/14 | $ | 76,811 | 76,811 | |||||
| Total Repurchase Agreement | ||||||||
| (Cost $76,811) | 76,811 | |||||||
| Total Investments - 99.9% | ||||||||
| (Cost $6,599,909) | $ | 11,849,683 | ||||||
| Other Assets & Liabilities, net - 0.1% | 16,655 | |||||||
| Total Net Assets - 100.0% | $ | 11,866,338 | ||||||
| * | Non-income producing security. |
| † | Value determined based on Level 1 inputs — See Note 4. |
| †† | Value determined based on Level 2 inputs — See Note 4. |
| 1 | Repurchase Agreement — See Note 5. |
ADR — American Depository Receipt
plc — Public Limited Company
| SEE NOTES TO FINANCIAL STATEMENTS. | THE RYDEX FUNDS ANNUAL REPORT | 85 |
| LEISURE FUND |
| STATEMENT OF ASSETS AND LIABILITIES |
| December 31, 2013 |
| Assets: | ||||
| Investments, at value (cost $6,523,098) | $ | 11,772,872 | ||
| Repurchase agreements, at value (cost $76,811) | 76,811 | |||
| Total investments (cost $6,599,909) | 11,849,683 | |||
| Receivables: | ||||
| Fund shares sold | 25,737 | |||
| Dividends | 21,148 | |||
| Foreign taxes reclaim | 393 | |||
| Total assets | 11,896,961 | |||
| Liabilities: | ||||
| Payable for: | ||||
| Management fees | 8,084 | |||
| Transfer agent and administrative fees | 2,378 | |||
| Investor service fees | 2,378 | |||
| Fund shares redeemed | 1,704 | |||
| Portfolio accounting fees | 951 | |||
| Miscellaneous | 15,128 | |||
| Total liabilities | 30,623 | |||
| Net assets | $ | 11,866,338 | ||
| Net assets consist of: | ||||
| Paid in capital | $ | 7,217,837 | ||
| Undistributed net investment income | 13,896 | |||
| Accumulated net realized loss on investments | (615,169 | ) | ||
| Net unrealized appreciation on investments | 5,249,774 | |||
| Net assets | $ | 11,866,338 | ||
| Capital shares outstanding | 124,370 | |||
| Net asset value per share | $ | 95.41 |
| STATEMENT OF OPERATIONS |
| Year Ended December 31, 2013 |
| Investment Income: | ||||
| Dividends (net of foreign withholding tax of $3,319) | $ | 188,544 | ||
| Income from securities lending, net | 905 | |||
| Interest | 14 | |||
| Total investment income | 189,463 | |||
| Expenses: | ||||
| Management fees | 90,948 | |||
| Transfer agent and administrative fees | 26,749 | |||
| Investor service fees | 26,749 | |||
| Portfolio accounting fees | 10,700 | |||
| Professional fees | 9,697 | |||
| Custodian fees | 1,206 | |||
| Trustees’ fees* | 1,086 | |||
| Line of credit interest expense | 39 | |||
| Miscellaneous | 7,803 | |||
| Total expenses | 174,977 | |||
| Net investment income | 14,486 | |||
| Net Realized and Unrealized Gain (Loss): | ||||
| Net realized gain (loss) on: | ||||
| Investments | 1,449,045 | |||
| Net realized gain | 1,449,045 | |||
| Net change in unrealized appreciation (depreciation) on: | ||||
| Investments | 2,109,782 | |||
| Net change in unrealized appreciation (depreciation) | 2,109,782 | |||
| Net realized and unrealized gain | 3,558,827 | |||
| Net increase in net assets resulting from operations | $ | 3,573,313 |
* Relates to Trustees not deemed “interested persons” within the meaning of Section 2(a)(19) of the 1940 Act.
| 86 | THE RYDEX FUNDS ANNUAL REPORT | SEE NOTES TO FINANCIAL STATEMENTS. |
| LEISURE FUND |
| STATEMENTS OF CHANGES IN NET ASSETS |
| Year Ended | Year Ended | |||||||
| December 31, | December 31, | |||||||
| 2013 | 2012 | |||||||
| Increase (Decrease) In Net Assets From Operations: | ||||||||
| Net investment income | $ | 14,486 | $ | 79,924 | ||||
| Net realized gain on investments | 1,449,045 | 58,514 | ||||||
| Net change in unrealized appreciation (depreciation) on investments | 2,109,782 | 1,358,497 | ||||||
| Net increase in net assets resulting from operations | 3,573,313 | 1,496,935 | ||||||
| Distributions to shareholders from: | ||||||||
| Net investment income | (78,415 | ) | — | |||||
| Total distributions to shareholders | (78,415 | ) | — | |||||
| Capital share transactions: | ||||||||
| Proceeds from sale of shares | 21,685,214 | 22,539,709 | ||||||
| Distributions reinvested | 78,415 | — | ||||||
| Cost of shares redeemed | (22,445,161 | ) | (20,764,113 | ) | ||||
| Net increase (decrease) from capital share transactions | (681,532 | ) | 1,775,596 | |||||
| Net increase in net assets | 2,813,366 | 3,272,531 | ||||||
| Net assets: | ||||||||
| Beginning of year | 9,052,972 | 5,780,441 | ||||||
| End of year | $ | 11,866,338 | $ | 9,052,972 | ||||
| Undistributed net investment income at end of year | $ | 13,896 | $ | 79,864 | ||||
| Capital share activity: | ||||||||
| Shares sold | 258,383 | 362,303 | ||||||
| Shares issued from reinvestment of distributions | 867 | — | ||||||
| Shares redeemed | (269,137 | ) | (332,047 | ) | ||||
| Net increase (decrease) in shares | (9,887 | ) | 30,256 | |||||
| SEE NOTES TO FINANCIAL STATEMENTS. | THE RYDEX FUNDS ANNUAL REPORT | 87 |
| LEISURE FUND |
| FINANCIAL HIGHLIGHTS |
This table is presented to show selected data for a share outstanding throughout each period and to assist shareholders in evaluating a Fund’s performance for the periods presented.
| Year Ended | Year Ended | Year Ended | Year Ended | Year Ended | ||||||||||||||||
| December 31, | December 31, | December 31, | December 31, | December 31, | ||||||||||||||||
| 2013 | 2012 | 2011 | 2010 | 2009 | ||||||||||||||||
| Per Share Data | ||||||||||||||||||||
| Net asset value, beginning of period | $ | 67.43 | $ | 55.58 | $ | 54.25 | $ | 41.66 | $ | 30.47 | ||||||||||
| Income (loss) from investment operations: | ||||||||||||||||||||
| Net investment income (loss)a | .11 | .53 | (.11 | ) | (.14 | ) | .06 | |||||||||||||
| Net gain on investments (realized and unrealized) | 28.45 | 11.32 | 1.44 | 12.78 | 11.13 | |||||||||||||||
| Total from investment operations | 28.56 | 11.85 | 1.33 | 12.64 | 11.19 | |||||||||||||||
| Less distributions from: | ||||||||||||||||||||
| Net investment income | (.58 | ) | — | — | (.05 | ) | — | |||||||||||||
| Total distributions | (.58 | ) | — | — | (.05 | ) | — | |||||||||||||
| Net asset value, end of period | $ | 95.41 | $ | 67.43 | $ | 55.58 | $ | 54.25 | $ | 41.66 | ||||||||||
| Total Returnb | 42.41 | % | 21.32 | % | 2.45 | % | 30.34 | % | 36.72 | % | ||||||||||
| Ratios/Supplemental Data | ||||||||||||||||||||
| Net assets, end of period (in thousands) | $ | 11,866 | $ | 9,053 | $ | 5,780 | $ | 12,942 | $ | 11,722 | ||||||||||
| Ratios to average net assets: | ||||||||||||||||||||
| Net investment income (loss) | 0.14 | % | 0.85 | % | (0.20 | %) | (0.30 | %) | 0.17 | % | ||||||||||
| Total expenses | 1.64 | % | 1.67 | % | 1.71 | % | 1.65 | % | 1.64 | % | ||||||||||
| Portfolio turnover rate | 219 | % | 214 | % | 227 | % | 468 | % | 316 | % | ||||||||||
| a | Net investment income (loss) per share was computed using average shares outstanding throughout the period. |
| b | Total return does not reflect the impact of any additional fees charged by insurance companies. |
| 88 | THE RYDEX FUNDS ANNUAL REPORT | SEE NOTES TO FINANCIAL STATEMENTS. |
| This page intentionally left blank. |
| THE RYDEX FUNDS ANNUAL REPORT | 89 |
| PERFORMANCE REPORT AND FUND PROFILE (Unaudited) | December 31, 2013 |
OBJECTIVE: Seeks to provide capital appreciation by investing in U.S. and foreign companies that are involved in the precious metals sector, including exploration, mining, production and development, and other precious metals related services (“Precious Metals Companies”).
For the year ended December 31, 2013, Precious Metals Fund returned -46.10%, compared with the 32.39% increase in the S&P 500 Index. The S&P 500 Materials Index returned 25.60%.
Metals & mining companies account for all holdings in the portfolio. As a group, they detracted from return.
Freeport-McMoRan Copper & Gold, Inc., Vista Gold Corp. and Sandstorm Gold Ltd. were the leading contributors to return.
Newmont Mining Corp., Barrick Gold Corp. and Allied Nevada Gold Corp. detracted the most from return.
Performance displayed represents past performance, which is no guarantee of future results.
Holdings Diversification (Market Exposure as % of Net Assets)
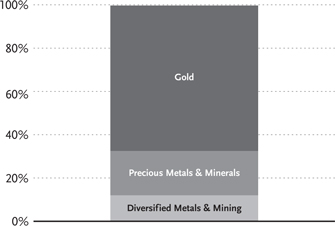
“Holdings Diversification (Market Exposure as % of Net Assets)” excludes any temporary cash investments.
Inception Date: May 29, 1997
| Ten Largest Holdings (% of Total Net Assets) | ||||
| Freeport-McMoRan Copper & Gold, Inc. | 8.9 | % | ||
| Barrick Gold Corp. | 7.8 | % | ||
| Newmont Mining Corp. | 6.8 | % | ||
| Goldcorp, Inc. | 6.2 | % | ||
| Silver Wheaton Corp. | 4.8 | % | ||
| Yamana Gold, Inc. | 3.7 | % | ||
| Randgold Resources Ltd. ADR | 3.4 | % | ||
| Agnico Eagle Mines Ltd. | 3.2 | % | ||
| Southern Copper Corp. | 3.1 | % | ||
| AngloGold Ashanti Ltd. ADR | 3.1 | % | ||
| Top Ten Total | 51.0 | % | ||
“Ten Largest Holdings” exclude any temporary cash or derivative investments.
| 90 | THE RYDEX FUNDS ANNUAL REPORT |
| PERFORMANCE REPORT AND FUND PROFILE (Unaudited) (concluded) |
Cumulative Fund Performance*,†

Average Annual Returns
Periods Ended December 31, 2013*,†
| 1 Year | 5 Year | 10 Year | ||||||||||
| Precious Metals Fund | -46.10 | % | -4.18 | % | -2.87 | % | ||||||
| S&P 500 Materials Index | 25.60 | % | 18.80 | % | 8.25 | % | ||||||
| S&P 500 Index | 32.39 | % | 17.94 | % | 7.41 | % | ||||||
| * | The performance data above represents past performance that is not predictive of future results. The investment return and principal value of an investment in the Fund will fluctuate so that an investor’s shares, when redeemed, may be worth more or less than their original cost. Returns are historical and include changes in principal and reinvested dividends and capital gains and do not reflect the effect of taxes. The S&P 500 Index and the S&P 500 Materials Index are unmanaged indices and, unlike the Fund, have no management fees or operating expenses to reduce their reported returns. |
| † | Returns do not reflect the impact of any additional fees charged by insurance companies. |
| THE RYDEX FUNDS ANNUAL REPORT | 91 |
| SCHEDULE OF INVESTMENTS | December 31, 2013 |
| PRECIOUS METALS FUND |
| Shares | Value | |||||||
| COMMON STOCKS† - 99.6% | ||||||||
| GOLD - 67.2% | ||||||||
| Barrick Gold Corp. | 99,142 | $ | 1,747,873 | |||||
| Newmont Mining Corp. | 66,238 | 1,525,461 | ||||||
| Goldcorp, Inc. | 64,564 | 1,399,102 | ||||||
| Yamana Gold, Inc.1 | 96,242 | 829,606 | ||||||
| Randgold Resources Ltd. ADR | 12,325 | 774,133 | ||||||
| Agnico Eagle Mines Ltd. | 27,351 | 721,519 | ||||||
| AngloGold Ashanti Ltd. ADR | 58,933 | 690,695 | ||||||
| Kinross Gold Corp. | 155,610 | 681,572 | ||||||
| Royal Gold, Inc. | 14,265 | 657,189 | ||||||
| Eldorado Gold Corp. | 113,522 | 645,940 | ||||||
| IAMGOLD Corp. | 174,255 | 580,269 | ||||||
| Gold Fields Ltd. ADR | 167,794 | 536,941 | ||||||
| New Gold, Inc.* | 99,694 | 522,397 | ||||||
| Cia de Minas Buenaventura SAA ADR | 46,105 | 517,298 | ||||||
| Franco-Nevada Corp. | 12,543 | 511,002 | ||||||
| Allied Nevada Gold Corp.*,1 | 137,486 | 488,075 | ||||||
| AuRico Gold, Inc. | 93,689 | 342,902 | ||||||
| Harmony Gold Mining Company Ltd. ADR | 134,684 | 340,751 | ||||||
| Seabridge Gold, Inc.*,1 | 34,794 | 253,996 | ||||||
| B2Gold Corp.* | 125,600 | 253,712 | ||||||
| Novagold Resources, Inc.* | 84,856 | 215,534 | ||||||
| Sibanye Gold Ltd. ADR | 40,490 | 194,757 | ||||||
| Pretium Resources, Inc.* | 37,176 | 191,828 | ||||||
| Gold Resource Corp. | 40,666 | 184,217 | ||||||
| Alamos Gold, Inc. | 15,131 | 183,539 | ||||||
| Sandstorm Gold Ltd.* | 23,160 | 98,893 | ||||||
| Newcrest Mining Ltd. ADR | 6,449 | 45,401 | ||||||
| Total Gold | 15,134,602 | |||||||
| PRECIOUS METALS & MINERALS - 20.4% | ||||||||
| Silver Wheaton Corp. | 53,263 | 1,075,380 | ||||||
| Pan American Silver Corp. | 45,803 | 535,895 | ||||||
| Coeur Mining, Inc.* | 45,201 | 490,431 | ||||||
| Hecla Mining Co. | 150,786 | 464,421 | ||||||
| First Majestic Silver Corp.* | 38,750 | 379,750 | ||||||
| Stillwater Mining Co.* | 30,632 | 377,999 | ||||||
| Silver Standard Resources, Inc.* | 43,800 | 304,848 | ||||||
| McEwen Mining, Inc.* | 142,779 | 279,847 | ||||||
| Endeavour Silver Corp.* | 74,868 | 271,771 | ||||||
| Dominion Diamond Corp.* | 12,650 | 181,654 | ||||||
| Silvercorp Metals, Inc. | 77,666 | 177,855 | ||||||
| Tahoe Resources, Inc.* | 4,121 | 68,573 | ||||||
| Total Precious Metals & Minerals | 4,608,424 | |||||||
| DIVERSIFIED METALS & MINING - 12.0% | ||||||||
| Freeport-McMoRan Copper & Gold, Inc. | 53,084 | 2,003,390 | ||||||
| Southern Copper Corp. | 24,350 | 699,089 | ||||||
| Total Diversified Metals & Mining | 2,702,479 | |||||||
| Total Common Stocks | ||||||||
| (Cost $16,970,882) | 22,445,505 | |||||||
| Face | ||||||||
| Amount | ||||||||
| REPURCHASE AGREEMENT††,2 - 0.3% | ||||||||
| Credit Suisse Group | ||||||||
| issued 12/31/13 at 0.00% | ||||||||
| due 01/02/14 $ | $ | 65,836 | 65,836 | |||||
| Total Repurchase Agreement | ||||||||
| (Cost $65,836) | 65,836 | |||||||
| SECURITIES LENDING COLLATERAL††,3 - 2.8% | ||||||||
| Repurchase Agreements | ||||||||
| HSBC Securities, Inc. | ||||||||
| issued 12/31/13 at 0.01% | ||||||||
| due 01/02/14 | 544,869 | 544,869 | ||||||
| Deutsche Bank Securities, Inc. | ||||||||
| issued 12/31/13 at 0.02% | ||||||||
| due 01/02/14 | 80,314 | 80,314 | ||||||
| Total Securities Lending Collateral | ||||||||
| (Cost $625,183) | 625,183 | |||||||
| Total Investments - 102.7% | ||||||||
| (Cost $17,661,901) | $ | 23,136,524 | ||||||
| Other Assets & Liabilities, net - (2.7)% | (598,768 | ) | ||||||
| Total Net Assets - 100.0% | $ | 22,537,756 | ||||||
| * | Non-income producing security. |
| † | Value determined based on Level 1 inputs — See Note 4. |
| †† | Value determined based on Level 2 inputs — See Note 4. |
| 1 | All or portion of this security is on loan at December 31, 2013 — See Note 8. |
| 2 | Repurchase Agreement — See Note 5. |
| 3 | Securities lending collateral — See Note 8. |
ADR — American Depository Receipt
| 92 | THE RYDEX FUNDS ANNUAL REPORT | SEE NOTES TO FINANCIAL STATEMENTS. |
| PRECIOUS METALS FUND |
| STATEMENT OF ASSETS AND LIABILITIES |
| December 31, 2013 |
| Assets: | ||||
| Investments, at value - including $612,287 of securities loaned | ||||
| (cost $16,970,882) | $ | 22,445,505 | ||
| Repurchase agreements, at value | ||||
| (cost $691,019) | 691,019 | |||
| Total investments | ||||
| (cost $17,661,901) | 23,136,524 | |||
| Receivables: | ||||
| Fund shares sold | 719,760 | |||
| Dividends | 9,545 | |||
| Interest and securities lending income | 978 | |||
| Total assets | 23,866,807 | |||
| Liabilities: | ||||
| Payable for: | ||||
| Securities purchased | 627,865 | |||
| Upon return of securities loaned | 625,183 | |||
| Management fees | 13,246 | |||
| Transfer agent and administrative fees | 4,415 | |||
| Investor service fees | 4,415 | |||
| Fund shares redeemed | 3,020 | |||
| Portfolio accounting fees | 1,766 | |||
| Miscellaneous | 49,141 | |||
| Total liabilities | 1,329,051 | |||
| Net assets | $ | 22,537,756 | ||
| Net assets consist of: | ||||
| Paid in capital | $ | 32,533,143 | ||
| Accumulated net investment loss | (14,154 | ) | ||
| Accumulated net realized loss on investments | (15,455,868 | ) | ||
| Net unrealized appreciation on investments | 5,474,635 | |||
| Net assets | $ | 22,537,756 | ||
| Capital shares outstanding* | 674,099 | |||
| Net asset value per share* | $ | 33.43 |
| STATEMENT OF OPERATIONS |
| Year Ended December 31, 2013 |
| Investment Income: | ||||
| Dividends (net of foreign withholding tax of $44,867) | $ | 661,025 | ||
| Income from securities lending, net | 12,283 | |||
| Interest | 54 | |||
| Total investment income | 673,362 | |||
| Expenses: | ||||
| Management fees | 242,141 | |||
| Transfer agent and administrative fees | 80,714 | |||
| Investor service fees | 80,714 | |||
| Portfolio accounting fees | 32,285 | |||
| Professional fees | 29,045 | |||
| Trustees’ fees** | 5,320 | |||
| Custodian fees | 3,504 | |||
| Line of credit interest expense | 819 | |||
| Miscellaneous | 23,798 | |||
| Total expenses | 498,340 | |||
| Net investment income | 175,022 | |||
| Net Realized and Unrealized Gain (Loss): | ||||
| Net realized gain (loss) on: | ||||
| Investments | (3,870,075 | ) | ||
| Foreign currency | 355 | |||
| Net realized loss | (3,869,720 | ) | ||
| Net change in unrealized appreciation (depreciation) on: | ||||
| Investments | (19,465,023 | ) | ||
| Foreign currency | 7 | |||
| Net change in unrealized appreciation (depreciation) | (19,465,016 | ) | ||
| Net realized and unrealized loss | (23,334,736 | ) | ||
| Net decrease in net assets resulting from operations | $ | (23,159,714 | ) |
| * | The shares outstanding and net asset value per share have been restated to reflect a 1-for-5 reverse share split effective January 24, 2014. See Note 10 in Notes to Financial Statements. |
| ** | Relates to Trustees not deemed “interested persons” within the meaning of Section 2(a)(19) of the 1940 Act. |
| SEE NOTES TO FINANCIAL STATEMENTS. | THE RYDEX FUNDS ANNUAL REPORT | 93 |
| PRECIOUS METALS FUND |
| STATEMENTS OF CHANGES IN NET ASSETS |
| Year Ended | Year Ended | |||||||
| December 31, | December 31, | |||||||
| 2013 | 2012 | |||||||
| Increase (Decrease) In Net Assets From Operations: | ||||||||
| Net investment income | $ | 175,022 | $ | 78,848 | ||||
| Net realized loss on investments | (3,869,720 | ) | (1,053,714 | ) | ||||
| Net change in unrealized appreciation (depreciation) on investments | (19,465,016 | ) | (2,852,815 | ) | ||||
| Net decrease in net assets resulting from operations | (23,159,714 | ) | (3,827,681 | ) | ||||
| Distributions to shareholders from: | ||||||||
| Net investment income | (302,070 | ) | — | |||||
| Net realized gains | — | (5,322,508 | ) | |||||
| Total distributions to shareholders | (302,070 | ) | (5,322,508 | ) | ||||
| Capital share transactions: | ||||||||
| Proceeds from sale of shares | 58,278,807 | 104,240,363 | ||||||
| Distributions reinvested | 302,070 | 5,322,508 | ||||||
| Cost of shares redeemed | (62,782,319 | ) | (107,193,735 | ) | ||||
| Net increase (decrease) from capital share transactions | (4,201,442 | ) | 2,369,136 | |||||
| Net decrease in net assets | (27,663,226 | ) | (6,781,053 | ) | ||||
| Net assets: | ||||||||
| Beginning of year | 50,200,982 | 56,982,035 | ||||||
| End of year | $ | 22,537,756 | $ | 50,200,982 | ||||
| Accumulated net investment loss at end of year | $ | (14,154 | ) | $ | (148,852 | ) | ||
| Capital share activity:* | ||||||||
| Shares sold | 1,367,505 | 1,489,875 | ||||||
| Shares issued from reinvestment of distributions | 8,473 | 83,099 | ||||||
| Shares redeemed | (1,500,708 | ) | (1,563,853 | ) | ||||
| Net increase (decrease) in shares | (124,730 | ) | 9,121 | |||||
| * | Capital share activity for the years ended December 31, 2012 and 2013 has been restated to reflect a 1-for-5 reverse share split effective January 24, 2014. See Note 10 in Notes to Financial Statements. |
| 94 | THE RYDEX FUNDS ANNUAL REPORT | SEE NOTES TO FINANCIAL STATEMENTS. |
| PRECIOUS METALS FUND |
| FINANCIAL HIGHLIGHTS |
This table is presented to show selected data for a share outstanding throughout each period and to assist shareholders in evaluating a Fund’s performance for the periods presented.
| Year Ended | Year Ended | Year Ended | Year Ended | Year Ended | ||||||||||||||||
| December 31, | December 31, | December 31, | December 31, | December 31, | ||||||||||||||||
| 2013d | 2012d | 2011d | 2010d | 2009d | ||||||||||||||||
| Per Share Data | ||||||||||||||||||||
| Net asset value, beginning of period | $ | 62.84 | $ | 72.16 | $ | 95.19 | $ | 68.93 | $ | 46.19 | ||||||||||
| Income (loss) from investment operations: | ||||||||||||||||||||
| Net investment income (loss)a | .25 | .10 | (.45 | ) | (.50 | ) | (.65 | ) | ||||||||||||
| Net gain (loss) on investments (realized and unrealized) | (29.21 | ) | (2.97 | ) | (22.53 | ) | 26.76 | 23.39 | ||||||||||||
| Total from investment operations | (28.96 | ) | (2.87 | ) | (22.98 | ) | 26.26 | 22.74 | ||||||||||||
| Less distributions from: | ||||||||||||||||||||
| Net investment income | (.45 | ) | — | (.05 | ) | (— | )b | — | ||||||||||||
| Net realized gains | — | (6.45 | ) | — | — | — | ||||||||||||||
| Total distributions | (.45 | ) | (6.45 | ) | (.05 | ) | (— | )b | — | |||||||||||
| Net asset value, end of period | $ | 33.43 | $ | 62.84 | $ | 72.16 | $ | 95.19 | $ | 68.93 | ||||||||||
| Total Returnc | (46.10 | %) | (4.10 | %) | (24.16 | %) | 38.08 | % | 49.24 | % | ||||||||||
| Ratios/Supplemental Data | ||||||||||||||||||||
| Net assets, end of period (in thousands) | $ | 22,538 | $ | 50,201 | $ | 56,982 | $ | 117,499 | $ | 86,277 | ||||||||||
| Ratios to average net assets: | ||||||||||||||||||||
| Net investment income (loss) | 0.54 | % | 0.14 | % | (0.52 | %) | (0.66 | %) | (1.14 | %) | ||||||||||
| Total expenses | 1.54 | % | 1.57 | % | 1.60 | % | 1.56 | % | 1.55 | % | ||||||||||
| Portfolio turnover rate | 193 | % | 140 | % | 199 | % | 234 | % | 253 | % | ||||||||||
| a | Net investment income (loss) per share was computed using average shares outstanding throughout the period. |
| b | Distributions from net investment income are less than $0.01 per share. |
| c | Total return does not reflect the impact of any additional fees charged by insurance companies. |
| d | Reverse share split — Per share amounts for the years ended December 31, 2009, 2010, 2011, 2012 and 2013 have been restated to reflect a 1:5 reverse share split effective January 24, 2014. See Note 10 in Notes to Financial Statements. |
| SEE NOTES TO FINANCIAL STATEMENTS. | THE RYDEX FUNDS ANNUAL REPORT | 95 |
| PERFORMANCE REPORT AND FUND PROFILE (Unaudited) | December 31, 2013 |
OBJECTIVE: Seeks to provide capital appreciation by investing in companies that are involved in the real estate industry, including real estate investment trusts (“REITs”), (collectively, “Real Estate Companies”).
For the year ended December 31, 2013, Real Estate Fund gained 3.94%, compared to a gain of 32.39% for the S&P 500 Index. The MSCI U.S. REIT Index returned 2.47%.
Within the sector, REITs, which compose almost all the portfolio, contributed most to return.
The strongest performing stocks included Zillow, Inc., Altisource Portfolio Solutions S.A., and Host Hotels & Resorts, Inc.
The stocks detracting most from performance were Digital Realty Trust, Inc., HCP, Inc. and American Campus Communities, Inc.
Performance displayed represents past performance, which is no guarantee of future results.
Holdings Diversification (Market Exposure as % of Net Assets)
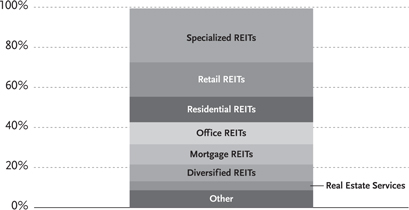
“Holdings Diversification (Market Exposure as % of Net Assets)” excludes any temporary cash investments.
Inception Date: October 1, 2001
| Ten Largest Holdings (% of Total Net Assets) | ||||
| Simon Property Group, Inc. | 2.6 | % | ||
| American Tower Corp. — Class A | 2.2 | % | ||
| Public Storage | 1.9 | % | ||
| Equity Residential | 1.7 | % | ||
| General Growth Properties, Inc. | 1.6 | % | ||
| Prologis, Inc. | 1.6 | % | ||
| Weyerhaeuser Co. | 1.6 | % | ||
| Ventas, Inc. | 1.6 | % | ||
| HCP, Inc. | 1.6 | % | ||
| Vornado Realty Trust | 1.5 | % | ||
| Top Ten Total | 17.9 | % | ||
“Ten Largest Holdings” exclude any temporary cash or derivative investments.
| 96 | THE RYDEX FUNDS ANNUAL REPORT |
| PERFORMANCE REPORT AND FUND PROFILE (Unaudited) (concluded) |
Cumulative Fund Performance*,†

Average Annual Returns
Periods Ended December 31, 2013*,†
| 1 Year | 5 Year | 10 Year | ||||||||||
| Real Estate Fund | 3.94 | % | 14.50 | % | 5.36 | % | ||||||
| MSCI U.S. REIT Index | 2.47 | % | 16.73 | % | 8.40 | % | ||||||
| S&P 500 Index | 32.39 | % | 17.94 | % | 7.41 | % | ||||||
| * | The performance data above represents past performance that is not predictive of future results. The investment return and principal value of an investment in the Fund will fluctuate so that an investor’s shares, when redeemed, may be worth more or less than their original cost. Returns are historical and include changes in principal and reinvested dividends and capital gains and do not reflect the effect of taxes. The S&P 500 Index and the MSCI U.S. REIT Index are unmanaged indices and, unlike the Fund, have no management fees or operating expenses to reduce their reported returns. |
| † | Returns do not reflect the impact of any additional fees charged by insurance companies. |
| THE RYDEX FUNDS ANNUAL REPORT | 97 |
| SCHEDULE OF INVESTMENTS | December 31, 2013 |
| REAL ESTATE FUND |
| Shares | Value | |||||||
| COMMON STOCKS† - 99.4% | ||||||||
| REAL ESTATE INVESTMENT TRUSTS (REITs) - 89.6% | ||||||||
| SPECIALIZED REITs - 26.9% | ||||||||
| American Tower Corp. — Class A | 3,990 | $ | 318,481 | |||||
| Public Storage | 1,885 | 283,729 | ||||||
| Weyerhaeuser Co. | 7,529 | 237,690 | ||||||
| Ventas, Inc. | 4,078 | 233,588 | ||||||
| HCP, Inc. | 6,362 | 231,068 | ||||||
| Health Care REIT, Inc. | 4,213 | 225,690 | ||||||
| Host Hotels & Resorts, Inc. | 11,113 | 216,037 | ||||||
| Plum Creek Timber Company, Inc. | 3,435 | 159,762 | ||||||
| Rayonier, Inc. | 3,078 | 129,584 | ||||||
| Extra Space Storage, Inc. | 2,928 | 123,357 | ||||||
| Gaming and Leisure Properties, Inc.* | 2,406 | 122,249 | ||||||
| Senior Housing Properties Trust | 5,187 | 115,307 | ||||||
| Hospitality Properties Trust | 4,104 | 110,931 | ||||||
| Corrections Corporation of America | 3,411 | 109,391 | ||||||
| Omega Healthcare Investors, Inc. | 3,594 | 107,101 | ||||||
| LaSalle Hotel Properties | 3,178 | 98,073 | ||||||
| RLJ Lodging Trust | 3,900 | 94,848 | ||||||
| EPR Properties | 1,793 | 88,144 | ||||||
| Sunstone Hotel Investors, Inc. | 6,551 | 87,783 | ||||||
| Geo Group, Inc. | 2,672 | 86,092 | ||||||
| Healthcare Trust of America, Inc. — Class A | 8,709 | 85,697 | ||||||
| DiamondRock Hospitality Co. | 7,273 | 84,003 | ||||||
| CubeSmart | 5,260 | 83,844 | ||||||
| Ryman Hospitality Properties, Inc. | 1,950 | 81,471 | ||||||
| Sovran Self Storage, Inc. | 1,250 | 81,463 | ||||||
| Healthcare Realty Trust, Inc. | 3,780 | 80,552 | ||||||
| Medical Properties Trust, Inc. | 6,375 | 77,903 | ||||||
| Pebblebrook Hotel Trust | 2,520 | 77,515 | ||||||
| Strategic Hotels & Resorts, Inc.* | 8,060 | 76,167 | ||||||
| Potlatch Corp. | 1,750 | 73,045 | ||||||
| Total Specialized REITs | 3,980,565 | |||||||
| RETAIL REITs - 17.2% | ||||||||
| Simon Property Group, Inc. | 2,519 | 383,292 | ||||||
| General Growth Properties, Inc. | 12,077 | 242,385 | ||||||
| Macerich Co. | 2,755 | 162,242 | ||||||
| Kimco Realty Corp. | 7,993 | 157,862 | ||||||
| Realty Income Corp. | 4,107 | 153,314 | ||||||
| Cole Real Estate Investment, Inc. | 10,470 | 146,999 | ||||||
| Federal Realty Investment Trust | 1,428 | 144,813 | ||||||
| DDR Corp. | 8,697 | 133,673 | ||||||
| Regency Centers Corp. | 2,544 | 117,787 | ||||||
| Taubman Centers, Inc. | 1,788 | 114,289 | ||||||
| National Retail Properties, Inc. | 3,568 | 108,217 | ||||||
| Weingarten Realty Investors | 3,718 | 101,948 | ||||||
| CBL & Associates Properties, Inc. | 5,484 | 98,493 | ||||||
| Tanger Factory Outlet Centers | 3,057 | 97,885 | ||||||
| Retail Properties of America, Inc. — Class A | 7,640 | 97,181 | ||||||
| Equity One, Inc. | 4,141 | 92,924 | ||||||
| Glimcher Realty Trust | 7,087 | 66,334 | ||||||
| Acadia Realty Trust | 2,630 | 65,303 | ||||||
| Pennsylvania Real Estate Investment Trust | 3,280 | 62,254 | ||||||
| Total Retail REITs | 2,547,195 | |||||||
| RESIDENTIAL REITs - 12.7% | ||||||||
| Equity Residential | 4,703 | 243,945 | ||||||
| AvalonBay Communities, Inc. | 1,874 | 221,563 | ||||||
| UDR, Inc. | 5,931 | 138,489 | ||||||
| Essex Property Trust, Inc. | 913 | 131,025 | ||||||
| Camden Property Trust | 2,177 | 123,828 | ||||||
| Mid-America Apartment Communities, Inc. | 2,008 | 121,966 | ||||||
| BRE Properties, Inc. | 2,123 | 116,149 | ||||||
| Apartment Investment & | ||||||||
| Management Co. — Class A | 4,249 | 110,092 | ||||||
| American Campus Communities, Inc. | 3,188 | 102,685 | ||||||
| Home Properties, Inc. | 1,865 | 100,001 | ||||||
| Equity Lifestyle Properties, Inc. | 2,740 | 99,270 | ||||||
| American Homes 4 Rent — Class A | 6,030 | 97,686 | ||||||
| Post Properties, Inc. | 1,976 | 89,374 | ||||||
| Sun Communities, Inc. | 1,640 | 69,930 | ||||||
| Education Realty Trust, Inc. | 6,520 | 57,506 | ||||||
| Associated Estates Realty Corp. | 3,400 | 54,570 | ||||||
| Total Residential REITs | 1,878,079 | |||||||
| OFFICE REITs - 11.0% | ||||||||
| Boston Properties, Inc. | 2,135 | 214,291 | ||||||
| SL Green Realty Corp. | 1,793 | 165,637 | ||||||
| Digital Realty Trust, Inc. | 2,942 | 144,511 | ||||||
| Alexandria Real Estate Equities, Inc. | 1,865 | 118,651 | ||||||
| Kilroy Realty Corp. | 2,240 | 112,403 | ||||||
| BioMed Realty Trust, Inc. | 5,789 | 104,897 | ||||||
| Douglas Emmett, Inc. | 4,349 | 101,288 | ||||||
| Highwoods Properties, Inc. | 2,790 | 100,914 | ||||||
| CommonWealth REIT | 3,954 | 92,168 | ||||||
| Piedmont Office Realty Trust, Inc. — Class A | 5,480 | 90,530 | ||||||
| Brandywine Realty Trust | 5,925 | 83,483 | ||||||
| Corporate Office Properties Trust | 3,307 | 78,343 | ||||||
| Mack-Cali Realty Corp. | 3,592 | 77,156 | ||||||
| DuPont Fabros Technology, Inc. | 2,944 | 72,746 | ||||||
| Government Properties Income Trust | 2,620 | 65,107 | ||||||
| Total Office REITs | 1,622,125 | |||||||
| MORTGAGE REITs - 10.1% | ||||||||
| Annaly Capital Management, Inc. | 17,263 | 172,111 | ||||||
| American Capital Agency Corp. | 7,938 | 153,124 | ||||||
| Starwood Property Trust, Inc. | 4,684 | 129,747 | ||||||
| NorthStar Realty Finance Corp. | 8,270 | 111,232 | ||||||
| Two Harbors Investment Corp. | 10,700 | 99,296 | ||||||
| MFA Financial, Inc. | 12,565 | 88,709 | ||||||
| Newcastle Investment Corp. | 14,120 | 81,049 | ||||||
| Invesco Mortgage Capital, Inc. | 5,279 | 77,496 | ||||||
| Redwood Trust, Inc. | 3,670 | 71,088 | ||||||
| New Residential Investment Corp. | 10,610 | 70,875 | ||||||
| Hatteras Financial Corp. | 4,301 | 70,278 | ||||||
| Colony Financial, Inc. | 3,420 | 69,392 | ||||||
| PennyMac Mortgage Investment Trust | 2,830 | 64,977 | ||||||
| CYS Investments, Inc. | 8,525 | 63,170 | ||||||
| iStar Financial, Inc.* | 4,420 | 63,073 | ||||||
| Capstead Mortgage Corp. | 4,940 | 59,675 | ||||||
| American Capital Mortgage | ||||||||
| Investment Corp. | 3,060 | 53,428 | ||||||
| Total Mortgage REITs | 1,498,720 | |||||||
| 98 | THE RYDEX FUNDS ANNUAL REPORT | SEE NOTES TO FINANCIAL STATEMENTS. |
| SCHEDULE OF INVESTMENTS (concluded) | December 31, 2013 |
| REAL ESTATE FUND |
| Shares | Value | |||||||
| DIVERSIFIED REITs - 8.4% | ||||||||
| Vornado Realty Trust | 2,576 | $ | 228,723 | |||||
| Duke Realty Corp. | 8,322 | 125,163 | ||||||
| Liberty Property Trust | 3,648 | 123,558 | ||||||
| WP Carey, Inc. | 1,858 | 113,988 | ||||||
| Spirit Realty Capital, Inc. | 10,933 | 107,471 | ||||||
| American Realty Capital Properties, Inc. | 6,860 | 88,220 | ||||||
| Lexington Realty Trust | 8,351 | 85,264 | ||||||
| PS Business Parks, Inc. | 1,070 | 81,769 | ||||||
| Cousins Properties, Inc. | 7,550 | 77,765 | ||||||
| Chambers Street Properties | 9,980 | 76,347 | ||||||
| Washington Real Estate Investment Trust | 2,970 | 69,379 | ||||||
| American Assets Trust, Inc. | 2,000 | 62,860 | ||||||
| Total Diversified REITs | 1,240,507 | |||||||
| Industrial REITs - 3.3% | ||||||||
| Prologis, Inc. | 6,547 | 241,912 | ||||||
| DCT Industrial Trust, Inc. | 11,920 | 84,990 | ||||||
| First Industrial Realty Trust, Inc. | 4,560 | 79,572 | ||||||
| EastGroup Properties, Inc. | 1,294 | 74,961 | ||||||
| Total Industrial REITs | 481,435 | |||||||
| Total Real Estate Investment Trusts (REITs) | 13,248,626 | |||||||
| Real Estate Management & Development - 9.8% | ||||||||
| Real Estate Services - 4.5% | ||||||||
| CBRE Group, Inc. — Class A* | 6,320 | 166,215 | ||||||
| Realogy Holdings Corp.* | 3,076 | 152,170 | ||||||
| Jones Lang LaSalle, Inc. | 1,179 | 120,718 | ||||||
| E-House China Holdings Ltd. ADR | 7,770 | 117,172 | ||||||
| Altisource Portfolio Solutions S.A.* | 650 | 103,110 | ||||||
| Total Real Estate Services | 659,385 | |||||||
| REAL ESTATE OPERATING COMPANIES - 2.6% | ||||||||
| Brookfield Office Properties, Inc. | 9,120 | 175,560 | ||||||
| Forest City Enterprises, Inc. — Class A* | 5,765 | 110,112 | ||||||
| Altisource Residential Corp. | 3,400 | 102,374 | ||||||
| Total Real Estate Operating Companies | 388,046 | |||||||
| DIVERSIFIED REAL ESTATE ACTIVITIES - 1.8% | ||||||||
| Brookfield Asset Management, Inc. — Class A | 3,000 | 116,489 | ||||||
| Alexander & Baldwin, Inc. | 1,920 | 80,122 | ||||||
| St. Joe Co.* | 3,982 | 76,415 | ||||||
| Total Diversified Real Estate Activities | 273,026 | |||||||
| REAL ESTATE DEVELOPMENT - 0.9% | ||||||||
| Howard Hughes Corp.* | 1,057 | 126,946 | ||||||
| Total Real Estate Management & Development | 1,447,403 | |||||||
| Total Common Stocks | ||||||||
| (Cost $9,548,585) | 14,696,029 | |||||||
| Face | ||||||||
| Amount | ||||||||
| REPURCHASE AGREEMENT††,1 - 0.4% | ||||||||
| Credit Suisse Group | ||||||||
| issued 12/31/13 at 0.00% | ||||||||
| due 01/02/14 | $ | 62,134 | 62,134 | |||||
| Total Repurchase Agreement | ||||||||
| (Cost $62,134) | 62,134 | |||||||
| Total Investments - 99.8% | ||||||||
| (Cost $9,610,719) | $ | 14,758,163 | ||||||
| Other Assets & Liabilities, net - 0.2% | 25,456 | |||||||
| Total Net Assets - 100.0% | $ | 14,783,619 | ||||||
| * | Non-income producing security. |
| † | Value determined based on Level 1 inputs — See Note 4. |
| †† | Value determined based on Level 2 inputs — See Note 4. |
| 1 | Repurchase Agreement — See Note 5. |
| ADR — American Depository Receipt |
| REIT — Real Estate Investment Trust |
| SEE NOTES TO FINANCIAL STATEMENTS. | THE RYDEX FUNDS ANNUAL REPORT | 99 |
| REAL ESTATE FUND |
| STATEMENT OF ASSETS AND LIABILITIES |
December 31, 2013
| Assets: | ||||
| Investments, at value | ||||
| (cost $9,548,585) | $ | 14,696,029 | ||
| Repurchase agreements, at value | ||||
| (cost $62,134) | 62,134 | |||
| Total investments | ||||
| (cost $9,610,719) | 14,758,163 | |||
| Receivables: | ||||
| Fund shares sold | 1,474,567 | |||
| Dividends | 77,441 | |||
| Interest and securities lending income | 7 | |||
| Total assets | 16,310,178 | |||
| Liabilities: | ||||
| Payable for: | ||||
| Securities purchased | 1,463,167 | |||
| Fund shares redeemed | 19,839 | |||
| Management fees | 8,808 | |||
| Transfer agent and administrative fees | 2,591 | |||
| Investor service fees | 2,591 | |||
| Portfolio accounting fees | 1,036 | |||
| Miscellaneous | 28,527 | |||
| Total liabilities | 1,526,559 | |||
| Net assets | $ | 14,783,619 | ||
| Net assets consist of: | ||||
| Paid in capital | $ | 20,307,389 | ||
| Undistributed net investment income | 439,497 | |||
| Accumulated net realized loss on investments | (11,110,711 | ) | ||
| Net unrealized appreciation on investments | 5,147,444 | |||
| Net assets | $ | 14,783,619 | ||
| Capital shares outstanding | 485,922 | |||
| Net asset value per share | $ | 30.42 |
| STATEMENT OF OPERATIONS |
| Year Ended December 31, 2013 |
| Investment Income: | ||||
| Dividends (net of foreign withholding tax of $2,823) | $ | 662,654 | ||
| Income from securities lending, net | 3,656 | |||
| Interest | 33 | |||
| Total investment income | 666,343 | |||
| Expenses: | ||||
| Management fees | 166,611 | |||
| Transfer agent and administrative fees | 49,003 | |||
| Investor service fees | 49,003 | |||
| Portfolio accounting fees | 19,601 | |||
| Professional fees | 18,651 | |||
| Trustees’ fees* | 2,688 | |||
| Custodian fees | 2,057 | |||
| Line of credit interest expense | 274 | |||
| Miscellaneous | 13,979 | |||
| Total expenses | 321,867 | |||
| Net investment income | 344,476 | |||
| Net Realized and Unrealized Gain (Loss): | ||||
| Net realized gain (loss) on: | ||||
| Investments | 3,322,071 | |||
| Net realized gain | 3,322,071 | |||
| Net change in unrealized appreciation | ||||
| (depreciation) on: | ||||
| Investments | (3,151,235 | ) | ||
| Net change in unrealized appreciation | ||||
| (depreciation) | (3,151,235 | ) | ||
| Net realized and unrealized gain | 170,836 | |||
| Net increase in net assets resulting from operations | $ | 515,312 |
* Relates to Trustees not deemed “interested persons” within the meaning of Section 2(a)(19) of the 1940 Act.
| 100 | THE RYDEX FUNDS ANNUAL REPORT | SEE NOTES TO FINANCIAL STATEMENTS. |
| REAL ESTATE FUND |
STATEMENTS OF CHANGES IN NET ASSETS
| Year Ended | Year Ended | |||||||
| December 31, | December 31, | |||||||
| 2013 | 2012 | |||||||
| Increase (Decrease) In Net Assets From Operations: | ||||||||
| Net investment income | $ | 344,476 | $ | 374,270 | ||||
| Net realized gain on investments | 3,322,071 | 987,420 | ||||||
| Net change in unrealized appreciation (depreciation) on investments | (3,151,235 | ) | 1,830,765 | |||||
| Net increase in net assets resulting from operations | 515,312 | 3,192,455 | ||||||
| Distributions to shareholders from: | ||||||||
| Net investment income | (363,786 | ) | (291,537 | ) | ||||
| Total distributions to shareholders | (363,786 | ) | (291,537 | ) | ||||
| Capital share transactions: | ||||||||
| Proceeds from sale of shares | 84,654,654 | 98,662,981 | ||||||
| Distributions reinvested | 363,786 | 291,537 | ||||||
| Cost of shares redeemed | (91,961,268 | ) | (95,281,301 | ) | ||||
| Net increase (decrease) from capital share transactions | (6,942,828 | ) | 3,673,217 | |||||
| Net increase (decrease) in net assets | (6,791,302 | ) | 6,574,135 | |||||
| Net assets: | ||||||||
| Beginning of year | 21,574,921 | 15,000,786 | ||||||
| End of year | $ | 14,783,619 | $ | 21,574,921 | ||||
| Undistributed net investment income at end of year | $ | 439,497 | $ | 374,269 | ||||
| Capital share activity: | ||||||||
| Shares sold | 2,600,127 | 3,412,502 | ||||||
| Shares issued from reinvestment of distributions | 11,978 | 10,151 | ||||||
| Shares redeemed | (2,841,779 | ) | (3,286,284 | ) | ||||
| Net increase (decrease) in shares | (229,674 | ) | 136,369 | |||||
| SEE NOTES TO FINANCIAL STATEMENTS. | THE RYDEX FUNDS ANNUAL REPORT | 101 |
| REAL ESTATE FUND |
FINANCIAL HIGHLIGHTS
This table is presented to show selected data for a share outstanding throughout each period and to assist shareholders in evaluating a Fund’s performance for the periods presented.
| Year Ended | Year Ended | Year Ended | Year Ended | Year Ended | ||||||||||||||||
| December 31, | December 31, | December 31, | December 31, | December 31, | ||||||||||||||||
| 2013 | 2012 | 2011 | 2010 | 2009 | ||||||||||||||||
| Per Share Data | ||||||||||||||||||||
| Net asset value, beginning of period | $ | 30.15 | $ | 25.90 | $ | 26.20 | $ | 21.44 | $ | 17.51 | ||||||||||
| Income (loss) from investment operations: | ||||||||||||||||||||
| Net investment incomea | .57 | .45 | .35 | .35 | .50 | |||||||||||||||
| Net gain on investments | ||||||||||||||||||||
| (realized and unrealized) | .62 | 4.28 | .20 | 4.97 | 3.90 | |||||||||||||||
| Total from investment operations | 1.19 | 4.73 | .55 | 5.32 | 4.40 | |||||||||||||||
| Less distributions from: | ||||||||||||||||||||
| Net investment income | (.92 | ) | (.48 | ) | (.85 | ) | (.56 | ) | (.47 | ) | ||||||||||
| Total distributions | (.92 | ) | (.48 | ) | (.85 | ) | (.56 | ) | (.47 | ) | ||||||||||
| Net asset value, end of period | $ | 30.42 | $ | 30.15 | $ | 25.90 | $ | 26.20 | $ | 21.44 | ||||||||||
| Total Returnb | 3.94 | % | 18.34 | % | 2.26 | % | 24.86 | % | 25.27 | % | ||||||||||
| Ratios/Supplemental Data | ||||||||||||||||||||
| Net assets, end of period (in thousands) | $ | 14,784 | $ | 21,575 | $ | 15,001 | $ | 25,262 | $ | 33,872 | ||||||||||
| Ratios to average net assets: | ||||||||||||||||||||
| Net investment income | 1.76 | % | 1.54 | % | 1.28 | % | 1.49 | % | 2.83 | % | ||||||||||
| Total expenses | 1.64 | % | 1.67 | % | 1.70 | % | 1.65 | % | 1.65 | % | ||||||||||
| Portfolio turnover rate | 416 | % | 348 | % | 351 | % | 394 | % | 450 | % | ||||||||||
a Net investment income per share was computed using average shares outstanding throughout the period.
b Total return does not reflect the impact of any additional fees charged by insurance companies.
| 102 | THE RYDEX FUNDS ANNUAL REPORT | SEE NOTES TO FINANCIAL STATEMENTS. |
This page intentionally left blank.
| THE RYDEX FUNDS ANNUAL REPORT | 103 |
| PERFORMANCE REPORT AND FUND PROFILE (Unaudited) | December 31, 2013 |
OBJECTIVE: Seeks to provide capital appreciation by investing in companies engaged in merchandising finished goods and services, including department stores, mail order operations and other companies involved in selling products to consumers (“Retailing Companies”).
For the year ended December 31, 2013, Retailing Fund rose 35.80%, compared with a gain of 32.39% for the S&P 500 Index. The S&P 500
Consumer Discretionary Index returned 43.08%.
Within the sector, heavily weighted specialty retail industry contributed most to return, followed by internet & catalog retail industry. No segment detracted from return, but the distributors industry contributed least.
Fund performance for the year benefited most from Amazon.com, Inc., Netflix, Inc. and priceline.com, Inc.
JC Penney Co., Inc., American Eagle Outfitters, Inc. and Abercrombie & Fitch Co. Class A were the largest detractors from the Fund’s performance for the period.
Performance displayed represents past performance, which is no guarantee of future results.
Holdings Diversification (Market Exposure as % of Net Assets)

“Holdings Diversification (Market Exposure as % of Net Assets)” excludes any temporary cash investments.
Inception Date: July 23, 2001
| Ten Largest Holdings (% of Total Net Assets) | ||||
| Wal-Mart Stores, Inc. | 5.5 | % | ||
| Amazon.com, Inc. | 4.5 | % | ||
| Home Depot, Inc. | 3.7 | % | ||
| CVS Caremark Corp. | 3.1 | % | ||
| Walgreen Co. | 2.6 | % | ||
| Priceline.com, Inc. | 2.5 | % | ||
| Costco Wholesale Corp. | 2.5 | % | ||
| Lowe’s Companies, Inc. | 2.5 | % | ||
| TJX Companies, Inc. | 2.3 | % | ||
| Target Corp. | 2.2 | % | ||
| Top Ten Total | 31.4 | % | ||
“Ten Largest Holdings” exclude any temporary cash or derivative investments.
| 104 | THE RYDEX FUNDS ANNUAL REPORT |
PERFORMANCE REPORT AND FUND PROFILE (Unaudited) (concluded)
Cumulative Fund Performance*,†
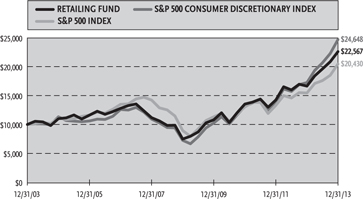
Average Annual Returns
Periods Ended December 31, 2013*,†
| 1 Year | 5 Year | 10 Year | ||||||||||
| Retailing Fund | 35.80 | % | 24.69 | % | 8.48 | % | ||||||
| S&P 500 Consumer | ||||||||||||
| Discretionary Index | 43.08 | % | 27.69 | % | 9.44 | % | ||||||
| S&P 500 Index | 32.39 | % | 17.94 | % | 7.41 | % | ||||||
| * | The performance data above represents past performance that is not predictive of future results. The investment return and principal value of an investment in the Fund will fluctuate so that an investor’s shares, when redeemed, may be worth more or less than their original cost. Returns are historical and include changes in principal and reinvested dividends and capital gains and do not reflect the effect of taxes. The S&P 500 Index and the S&P 500 Consumer Discretionary Index are unmanaged indices and, unlike the Fund, have no management fees or operating expenses to reduce their reported returns. |
| † | Returns do not reflect the impact of any additional fees charged by insurance companies. |
| THE RYDEX FUNDS ANNUAL REPORT | 105 |
| SCHEDULE OF INVESTMENTS | December 31, 2013 |
| RETAILING FUND |
| Shares | Value | |||||||
| COMMON STOCKS† - 99.6% | ||||||||
| APPAREL RETAIL - 16.3% | ||||||||
| TJX Companies, Inc. | 3,456 | $ | 220,252 | |||||
| The Gap, Inc. | 3,542 | 138,422 | ||||||
| L Brands, Inc. | 2,235 | 138,235 | ||||||
| Ross Stores, Inc. | 1,752 | 131,277 | ||||||
| Foot Locker, Inc. | 1,969 | 81,595 | ||||||
| Urban Outfitters, Inc.* | 2,080 | 77,168 | ||||||
| DSW, Inc. — Class A | 1,534 | 65,548 | ||||||
| Ascena Retail Group, Inc.* | 2,914 | 61,660 | ||||||
| Chico’s FAS, Inc. | 3,025 | 56,991 | ||||||
| American Eagle Outfitters, Inc. | 3,806 | 54,806 | ||||||
| Guess?, Inc. | 1,703 | 52,912 | ||||||
| Buckle, Inc. | 1,004 | 52,770 | ||||||
| Abercrombie & Fitch Co. — Class A | 1,584 | 52,129 | ||||||
| Men’s Wearhouse, Inc. | 1,001 | 51,131 | ||||||
| Genesco, Inc.* | 597 | 43,617 | ||||||
| ANN, Inc.* | 1,143 | 41,788 | ||||||
| Express, Inc.* | 2,190 | 40,887 | ||||||
| Jos. A. Bank Clothiers, Inc.* | 726 | 39,734 | ||||||
| Finish Line, Inc. — Class A | 1,377 | 38,790 | ||||||
| Children’s Place Retail Stores, Inc.* | 649 | 36,974 | ||||||
| Aeropostale, Inc.* | 3,221 | 29,279 | ||||||
| Francesca’s Holdings Corp.* | 1,500 | 27,615 | ||||||
| Total Apparel Retail | 1,533,580 | |||||||
| INTERNET RETAIL - 15.5% | ||||||||
| Amazon.com, Inc.* | 1,080 | 430,694 | ||||||
| Priceline.com, Inc.* | 205 | 238,293 | ||||||
| Netflix, Inc.* | 402 | 148,004 | ||||||
| TripAdvisor, Inc.* | 1,347 | 111,572 | ||||||
| Ctrip.com International Ltd. ADR* | 2,110 | 104,698 | ||||||
| Expedia, Inc. | 1,377 | 95,922 | ||||||
| Groupon, Inc. — Class A* | 7,375 | 86,804 | ||||||
| Vipshop Holdings Ltd. ADR* | 880 | 73,638 | ||||||
| Liberty Ventures* | 560 | 68,650 | ||||||
| HomeAway, Inc.* | 1,530 | 62,546 | ||||||
| Shutterfly, Inc.* | 900 | 45,837 | ||||||
| Total Internet Retail | 1,466,658 | |||||||
| SPECIALTY STORES - 12.1% | ||||||||
| Tiffany & Co. | 1,215 | 112,728 | ||||||
| Tractor Supply Co. | 1,402 | 108,767 | ||||||
| Staples, Inc. | 6,637 | 105,462 | ||||||
| PetSmart, Inc. | 1,227 | 89,264 | ||||||
| Dick’s Sporting Goods, Inc. | 1,526 | 88,661 | ||||||
| Ulta Salon Cosmetics & Fragrance, Inc.* | 850 | 82,042 | ||||||
| GNC Holdings, Inc. — Class A | 1,310 | 76,570 | ||||||
| Signet Jewelers Ltd. | 946 | 74,450 | ||||||
| Cabela’s, Inc.* | 1,058 | 70,526 | ||||||
| Sally Beauty Holdings, Inc.* | 2,329 | 70,406 | ||||||
| Office Depot, Inc.* | 10,290 | 54,434 | ||||||
| Five Below, Inc.* | 1,170 | 50,544 | ||||||
| Outerwall, Inc.* | 670 | 45,071 | ||||||
| Hibbett Sports, Inc.* | 640 | 43,014 | ||||||
| Vitamin Shoppe, Inc.* | 809 | 42,076 | ||||||
| Barnes & Noble, Inc.* | 2,140 | 31,993 | ||||||
| Total Specialty Stores | 1,146,008 | |||||||
| HYPERMARKETS & SUPER CENTERS - 9.3% | ||||||||
| Wal-Mart Stores, Inc. | 6,659 | 523,997 | ||||||
| Costco Wholesale Corp. | 1,984 | 236,116 | ||||||
| PriceSmart, Inc. | 530 | 61,236 | ||||||
| Cia Brasileira de Distribuicao Grupo | ||||||||
| Pao de Acucar ADR | 1,298 | 57,982 | ||||||
| Total Hypermarkets & Super Centers | 879,331 | |||||||
| AUTOMOTIVE RETAIL - 8.6% | ||||||||
| AutoZone, Inc.* | 270 | 129,044 | ||||||
| O’Reilly Automotive, Inc.* | 932 | 119,958 | ||||||
| CarMax, Inc.* | 2,076 | 97,614 | ||||||
| Advance Auto Parts, Inc. | 855 | 94,631 | ||||||
| AutoNation, Inc.* | 1,594 | 79,206 | ||||||
| Penske Automotive Group, Inc. | 1,420 | 66,967 | ||||||
| CST Brands, Inc. | 1,481 | 54,382 | ||||||
| Murphy USA, Inc.* | 1,090 | 45,300 | ||||||
| Group 1 Automotive, Inc. | 600 | 42,612 | ||||||
| Lithia Motors, Inc. — Class A | 610 | 42,346 | ||||||
| Asbury Automotive Group, Inc.* | 770 | 41,380 | ||||||
| Total Automotive Retail | 813,440 | |||||||
| HOME IMPROVEMENT RETAIL - 6.8% | ||||||||
| Home Depot, Inc. | 4,299 | 353,979 | ||||||
| Lowe’s Companies, Inc. | 4,729 | 234,322 | ||||||
| Lumber Liquidators Holdings, Inc.* | 520 | 53,503 | ||||||
| Total Home Improvement Retail | 641,804 | |||||||
| DRUG RETAIL - 6.4% | ||||||||
| CVS Caremark Corp. | 4,161 | 297,802 | ||||||
| Walgreen Co. | 4,215 | 242,110 | ||||||
| Rite Aid Corp.* | 13,950 | 70,587 | ||||||
| Total Drug Retail | �� | 610,499 | ||||||
| GENERAL MERCHANDISE STORES - 6.3% | ||||||||
| Target Corp. | 3,281 | 207,588 | ||||||
| Dollar General Corp.* | 2,406 | 145,130 | ||||||
| Dollar Tree, Inc.* | 2,004 | 113,066 | ||||||
| Family Dollar Stores, Inc. | 1,380 | 89,659 | ||||||
| Big Lots, Inc.* | 1,410 | 45,529 | ||||||
| Total General Merchandise Stores | 600,972 | |||||||
| DEPARTMENT STORES - 6.1% | ||||||||
| Macy’s, Inc. | 2,724 | 145,463 | ||||||
| Kohl’s Corp. | 2,040 | 115,770 | ||||||
| Nordstrom, Inc. | 1,846 | 114,083 | ||||||
| Sears Holdings Corp.*,1 | 1,587 | 77,826 | ||||||
| Dillard’s, Inc. — Class A | 707 | 68,727 | ||||||
| JC Penney Company, Inc.*,1 | 6,549 | 59,923 | ||||||
| Total Department Stores | 581,792 | |||||||
| 106 | THE RYDEX FUNDS ANNUAL REPORT | SEE NOTES TO FINANCIAL STATEMENTS. |
| SCHEDULE OF INVESTMENTS (concluded) | December 31, 2013 | |
| RETAILING FUND | ||
| Shares | Value | |||||||
| Homefurnishing Retail - 4.2% | ||||||||
| Bed Bath & Beyond, Inc.* | 1,708 | $ | 137,152 | |||||
| Williams-Sonoma, Inc. | 1,293 | 75,356 | ||||||
| Restoration Hardware Holdings, Inc.* | 800 | 53,840 | ||||||
| Pier 1 Imports, Inc. | 2,177 | 50,245 | ||||||
| Aaron’s, Inc. | 1,679 | 49,363 | ||||||
| Select Comfort Corp.* | 1,613 | 34,018 | ||||||
| Total Homefurnishing Retail | 399,974 | |||||||
| Computer & Electronics Retail - 3.1% | ||||||||
| Best Buy Company, Inc. | 2,935 | 117,047 | ||||||
| GameStop Corp. — Class A | 1,535 | 75,614 | ||||||
| Conn’s, Inc.* | 720 | 56,729 | ||||||
| Rent-A-Center, Inc. — Class A | 1,299 | 43,309 | ||||||
| Total Computer & Electronics Retail | 292,699 | |||||||
| Distributors - 2.9% | ||||||||
| Genuine Parts Co. | 1,411 | 117,381 | ||||||
| LKQ Corp.* | 3,170 | 104,293 | ||||||
| Pool Corp. | 920 | 53,489 | ||||||
| Total Distributors | 275,163 | |||||||
| Catalog Retail - 2.0% | ||||||||
| Liberty Interactive Corp. — Class A* | 4,321 | 126,821 | ||||||
| HSN, Inc. | 940 | 58,562 | ||||||
| Total Catalog Retail | 185,383 | |||||||
| Total Common Stocks | ||||||||
| (Cost $5,067,809) | 9,427,303 | |||||||
| Face | ||||||||
| Amount | ||||||||
| REPURCHASE AGREEMENT††,2 - 1.2% | ||||||||
| Credit Suisse Group | ||||||||
| issued 12/31/13 at 0.00% | ||||||||
| due 01/02/14 | $ | 117,415 | 117,415 | |||||
| Total Repurchase Agreement | ||||||||
| (Cost $117,415) | 117,415 | |||||||
| SECURITIES LENDING COLLATERAL††,3 - 0.7% | ||||||||
| Repurchase Agreements | ||||||||
| HSBC Securities, Inc. | ||||||||
| issued 12/31/13 at 0.01% | ||||||||
| due 01/02/14 | 58,175 | 58,175 | ||||||
| Deutsche Bank Securities, Inc. | ||||||||
| issued 12/31/13 at 0.02% | ||||||||
| due 01/02/14 | 8,575 | 8,575 | ||||||
| Total Securities Lending Collateral | ||||||||
| (Cost $66,750) | 66,750 | |||||||
| Total Investments - 101.5% | ||||||||
| (Cost $5,251,974) | $ | 9,611,468 | ||||||
| Other Assets & Liabilities, net - (1.5)% | (141,348 | ) | ||||||
| Total Net Assets - 100.0% | $ | 9,470,120 | ||||||
| * | Non-income producing security. |
| † | Value determined based on Level 1 inputs — See Note 4. |
| †† | Value determined based on Level 2 inputs — See Note 4. |
| 1 | All or portion of this security is on loan at December 31, 2013 — See Note 8. |
| 2 | Repurchase Agreement — See Note 5. |
| 3 | Securities lending collateral — See Note 8. ADR — American Depository Receipt |
| SEE NOTES TO FINANCIAL STATEMENTS. | THE RYDEX FUNDS ANNUAL REPORT | 107 |
| RETAILING FUND |
| STATEMENT OF ASSETS AND LIABILITIES |
December 31, 2013
| Assets: | ||||
| Investments, at value - including $66,682 of securities loaned | ||||
| (cost $5,067,809) | $ | 9,427,303 | ||
| Repurchase agreements, at value | ||||
| (cost $184,165) | 184,165 | |||
| Total investments | ||||
| (cost $5,251,974) | 9,611,468 | |||
| Receivables: | ||||
| Fund shares sold | 162,974 | |||
| Dividends | 7,063 | |||
| Interest and securities lending income | 263 | |||
| Total assets | 9,781,768 | |||
| Liabilities: | ||||
| Payable for: | ||||
| Securities purchased | 217,880 | |||
| Upon return of securities loaned | 66,750 | |||
| Management fees | 6,353 | |||
| Fund shares redeemed | 4,972 | |||
| Transfer agent and administrative fees | 1,868 | |||
| Investor service fees | 1,868 | |||
| Portfolio accounting fees | 747 | |||
| Miscellaneous | 11,210 | |||
| Total liabilities | 311,648 | |||
| Net assets | $ | 9,470,120 | ||
| Net assets consist of: | ||||
| Paid in capital | $ | 5,675,761 | ||
| Undistributed net investment income | — | |||
| Accumulated net realized loss on investments | (565,135 | ) | ||
| Net unrealized appreciation on investments | 4,359,494 | |||
| Net assets | $ | 9,470,120 | ||
| Capital shares outstanding | 464,852 | |||
| Net asset value per share | $ | 20.37 |
STATEMENT OF
OPERATIONS
Year Ended December 31, 2013
| Investment Income: | ||||
| Dividends (net of foreign withholding tax of $65) | $ | 90,231 | ||
| Income from securities lending, net | 1,716 | |||
| Interest | 12 | |||
| Total investment income | 91,959 | |||
| Expenses: | ||||
| Management fees | 66,677 | |||
| Transfer agent and administrative fees | 19,611 | |||
| Investor service fees | 19,611 | |||
| Portfolio accounting fees | 7,844 | |||
| Professional fees | 6,620 | |||
| Trustees’ fees* | 976 | |||
| Custodian fees | 887 | |||
| Line of credit interest expense | 129 | |||
| Miscellaneous | 6,046 | |||
| Total expenses | 128,401 | |||
| Net investment loss | (36,442 | ) | ||
| Net Realized and Unrealized Gain (Loss): | ||||
| Net realized gain (loss) on: | ||||
| Investments | 1,366,910 | |||
| Net realized gain | 1,366,910 | |||
| Net change in unrealized appreciation | ||||
| (depreciation) on: | ||||
| Investments | 917,540 | |||
| Net change in unrealized appreciation | ||||
| (depreciation) | 917,540 | |||
| Net realized and unrealized gain | 2,284,450 | |||
| Net increase in net assets resulting from operations | $ | 2,248,008 |
* Relates to Trustees not deemed “interested persons” within the meaning of Section 2(a)(19) of the 1940 Act.
| 108 | THE RYDEX FUNDS ANNUAL REPORT | SEE NOTES TO FINANCIAL STATEMENTS. |
| RETAILING FUND |
STATEMENTS OF CHANGES IN NET ASSETS
| Year Ended | Year Ended | |||||||
| December 31, | December 31, | |||||||
| 2013 | 2012 | |||||||
Increase (Decrease) In Net Assets From Operations: | ||||||||
| Net investment income (loss) | $ | (36,442 | ) | $ | 1,266 | |||
| Net realized gain on investments | 1,366,910 | 1,189,465 | ||||||
| Net change in unrealized appreciation (depreciation) on investments | 917,540 | 235,350 | ||||||
| Net increase in net assets resulting from operations | 2,248,008 | 1,426,081 | ||||||
Distributions to shareholders from: | ||||||||
| Net investment income | (1,279 | ) | — | |||||
| Net realized gains | (895,569 | ) | — | |||||
| Total distributions to shareholders | (896,848 | ) | — | |||||
Capital share transactions: | ||||||||
| Proceeds from sale of shares | 87,659,567 | 121,759,999 | ||||||
| Distributions reinvested | 896,848 | — | ||||||
| Cost of shares redeemed | (86,631,670 | ) | (130,125,691 | ) | ||||
| Net increase (decrease) from capital share transactions | 1,924,745 | (8,365,692 | ) | |||||
| Net increase (decrease)in net assets | 3,275,905 | (6,939,611 | ) | |||||
Net Assets: | ||||||||
| Beginning of year | 6,194,215 | 13,133,826 | ||||||
| End of year | $ | 9,470,120 | $ | 6,194,215 | ||||
| Undistributed net investment income at end of year | $ | — | $ | 1,279 | ||||
| Capital share activity: | ||||||||
| Shares sold | 4,514,444 | 7,458,045 | ||||||
| Shares issued from reinvestment of distributions | 44,708 | — | ||||||
| Shares redeemed | (4,465,082 | ) | (8,004,817 | ) | ||||
| Net increase (decrease) in shares | 94,070 | (546,772 | ) | |||||
| See Notes to Financial Statements. | THE RYDEX FUNDS ANNUAL REPORT | 109 |
| Retailing FUND |
FINANCIAL HIGHLIGHTS
This table is presented to show selected data for a share outstanding throughout each period and to assist shareholders in evaluating a Fund’s performance for the periods presented.
| Year Ended | Year Ended | Year Ended | Year Ended | Year Ended | ||||||||||||||||
| December 31, | December 31, | December 31, | December 31, | December 31, | ||||||||||||||||
| 2013 | 2012 | 2011 | 2010 | 2009 | ||||||||||||||||
| Per Share Data | ||||||||||||||||||||
| Net asset value, beginning of period | $ | 16.71 | $ | 14.31 | $ | 13.59 | $ | 10.86 | $ | 7.53 | ||||||||||
| Income (loss) from investment operations: | ||||||||||||||||||||
| Net investment income (loss)a | (.09 | ) | — | b | (.03 | ) | (.03 | ) | (.02 | ) | ||||||||||
| Net gain on investments (realized and unrealized) | 6.04 | 2.40 | .75 | 2.76 | 3.35 | |||||||||||||||
| Total from investment operations | 5.95 | 2.40 | .72 | 2.73 | 3.33 | |||||||||||||||
| Less distributions from: | ||||||||||||||||||||
| Net investment income | (— | )c | — | — | — | — | ||||||||||||||
| Net realized gains | (2.29 | ) | — | — | — | — | ||||||||||||||
| Total distributions | (2.29 | ) | — | — | — | — | ||||||||||||||
| Net asset value, end of period | $ | 20.37 | $ | 16.71 | $ | 14.31 | $ | 13.59 | $ | 10.86 | ||||||||||
| Total Returnd | 35.80 | % | 16.77 | % | 5.30 | % | 25.14 | % | 44.22 | % | ||||||||||
| Ratios/Supplemental Data | ||||||||||||||||||||
| Net assets, end of period (in thousands) | $ | 9,470 | $ | 6,194 | $ | 13,134 | $ | 9,477 | $ | 15,488 | ||||||||||
| Ratios to average net assets: | ||||||||||||||||||||
| Net investment income (loss) | (0.46 | %) | 0.01 | % | (0.20 | %) | (0.24 | %) | (0.19 | %) | ||||||||||
| Total expenses | 1.64 | % | 1.67 | % | 1.69 | % | 1.65 | % | 1.65 | % | ||||||||||
| Portfolio turnover rate | 1,219 | % | 1,043 | % | 621 | % | 616 | % | 470 | % | ||||||||||
a Net investment income (loss) per share was computed using average shares outstanding throughout the period.
b Net investment income is less than $0.01 per share.
c Distributions from net investment income are less than $0.01 per share.
d Total return does not reflect the impact of any additional fees charged by insurance companies.
| 110 | the RYDEX FUNDS ANNUAL REPORT | See Notes to Financial Statements. |
This page intentionally left blank.
| the RYDEX FUNDS ANNUAL REPORT | 111 |
| PERFORMANCE REPORT AND FUND PROFILE (Unaudited) | December 31, 2013 |
OBJECTIVE: Seeks to provide capital appreciation by investing in companies that are involved in the technology sector, including computer software and service companies, semiconductor manufacturers, networking and telecommunications equipment manufacturers, PC hardware and peripherals companies (“Technology Companies”).
For the year ended December 31, 2013, Technology Fund returned 35.39%, compared with a gain of 32.39% for the S&P 500 Index. The S&P 500 Information Technology Index returned 28.43%.
Within the sector, internet software & services industry contributed most to Fund performance, followed by the semiconductors & semiconductor equipment industry. No industry detracted, but the diversified financial services industry and office electronics industry contributed least to return.
Top-contributing holdings were Google, Inc. Class A, Facebook, Inc. Class A and Microsoft Corp.
Rackspace Hosting, Inc., Mellanox Technologies Ltd. and Teradata Corp. were the weakest-performing technology holdings for the period.
Performance displayed represents past performance, which is no guarantee of future results.
Holdings Diversification (Market Exposure as % of Net Assets)
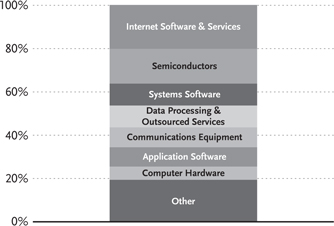
“Holdings Diversification (Market Exposure as % of Net Assets)” excludes any temporary cash investments.
Inception Date: May 2, 2001
| Ten Largest Holdings (% of Total Net Assets) | ||||
| Apple, Inc. | 3.7 | % | ||
| Google, Inc. — Class A | 3.1 | % | ||
| Microsoft Corp. | 2.9 | % | ||
| International Business Machines Corp. | 2.3 | % | ||
| Oracle Corp. | 2.1 | % | ||
| Visa, Inc. — Class A | 1.9 | % | ||
| Facebook, Inc. — Class A | 1.9 | % | ||
| Intel Corp. | 1.8 | % | ||
| QUALCOMM, Inc. | 1.8 | % | ||
| Cisco Systems, Inc. | 1.8 | % | ||
| Top Ten Total | 23.3 | % | ||
“Ten Largest Holdings” exclude any temporary cash or derivative investments.
| 112 | the RYDEX FUNDS ANNUAL REPORT |
performance report and FUND PROFILE (Unaudited) (concluded)
Cumulative Fund Performance*,†
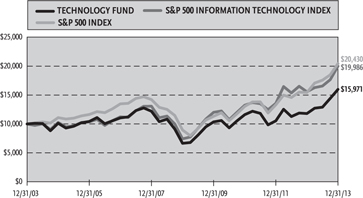
| Average Annual Returns | ||||||||||||
| Periods Ended December 31, 2013*,† | ||||||||||||
| 1 Year | 5 Year | 10 Year | ||||||||||
| Technology Fund | 35.39 | % | 19.14 | % | 4.79 | % | ||||||
| S&P 500 Information Technology Index | 28.43 | % | 21.90 | % | 7.17 | % | ||||||
| S&P 500 Index | 32.39 | % | 17.94 | % | 7.41 | % | ||||||
| * | The performance data above represents past performance that is not predictive of future results. The investment return and principal value of an investment in the Fund will fluctuate so that an investor’s shares, when redeemed, may be worth more or less than their original cost. Returns are historical and include changes in principal and reinvested dividends and capital gains and do not reflect the effect of taxes. The S&P 500 Index and the S&P 500 Information Technology Index are unmanaged indices and, unlike the Fund, have no management fees or operating expenses to reduce their reported returns. |
† Returns do not reflect the impact of any additional fees charged by insurance companies.
| the RYDEX FUNDS ANNUAL REPORT | 113 |
| SCHEDULE OF INVESTMENTS | December 31, 2013 |
| Technology Fund |
| Shares | Value | |||||||
| COMMON STOCKS† - 100.1% | ||||||||
| INTERNET SOFTWARE & SERVICES - 20.2% | ||||||||
| Google, Inc. — Class A* | 411 | $ | 460,612 | |||||
| Facebook, Inc. — Class A* | 4,983 | 272,371 | ||||||
| eBay, Inc.* | 3,690 | 202,544 | ||||||
| Twitter, Inc.* | 2,470 | 157,216 | ||||||
| Yahoo!, Inc.* | 3,763 | 152,176 | ||||||
| Baidu, Inc. ADR* | 816 | 145,150 | ||||||
| LinkedIn Corp. — Class A* | 574 | 124,460 | ||||||
| SINA Corp.* | 1,289 | 108,598 | ||||||
| Qihoo 360 Technology | ||||||||
| Company Ltd. ADR* | 1,240 | 101,742 | ||||||
| Yandex N.V. — Class A* | 2,330 | 100,540 | ||||||
| Youku Tudou, Inc. ADR* | 3,270 | 99,081 | ||||||
| MercadoLibre, Inc. | 896 | 96,580 | ||||||
| SouFun Holdings Ltd. ADR | 1,160 | 95,596 | ||||||
| Sohu.com, Inc.* | 1,290 | 94,080 | ||||||
| NetEase, Inc. ADR | 1,190 | 93,534 | ||||||
| YY, Inc. ADR* | 1,840 | 92,515 | ||||||
| Equinix, Inc.* | 407 | 72,222 | ||||||
| Akamai Technologies, Inc.* | 1,466 | 69,166 | ||||||
| VeriSign, Inc.* | 1,150 | 68,747 | ||||||
| Rackspace Hosting, Inc.* | 1,434 | 56,112 | ||||||
| IAC/InterActiveCorp | 780 | 53,578 | ||||||
| Yelp, Inc. — Class A* | 760 | 52,402 | ||||||
| Pandora Media, Inc.* | 1,950 | 51,870 | ||||||
| AOL, Inc.* | 1,000 | 46,620 | ||||||
| Zillow, Inc. — Class A* | 510 | 41,682 | ||||||
| OpenTable, Inc.* | 410 | 32,542 | ||||||
| Trulia, Inc.* | 820 | 28,921 | ||||||
| Total Internet Software & Services | 2,970,657 | |||||||
| Semiconductors - 16.1% | ||||||||
| Intel Corp. | 10,409 | 270,217 | ||||||
| Texas Instruments, Inc. | 3,786 | 166,243 | ||||||
| Micron Technology, Inc.* | 5,353 | 116,481 | ||||||
| Taiwan Semiconductor Manufacturing | ||||||||
| Company Ltd. ADR | 6,313 | 110,099 | ||||||
| Himax Technologies, Inc. ADR | 6,980 | 102,676 | ||||||
| Marvell Technology Group Ltd. | 7,031 | 101,106 | ||||||
| NXP Semiconductor N.V.* | 2,200 | 101,046 | ||||||
| Avago Technologies Ltd. | 1,869 | 98,851 | ||||||
| Broadcom Corp. — Class A | 3,295 | 97,697 | ||||||
| Analog Devices, Inc. | 1,867 | 95,086 | ||||||
| ARM Holdings plc ADR | 1,732 | 94,810 | ||||||
| Trina Solar Ltd. ADR* | 6,550 | 89,539 | ||||||
| Canadian Solar, Inc.* | 2,900 | 86,478 | ||||||
| Xilinx, Inc. | 1,834 | 84,217 | ||||||
| Linear Technology Corp. | 1,705 | 77,663 | ||||||
| Altera Corp. | 2,386 | 77,617 | ||||||
| NVIDIA Corp. | 4,551 | 72,907 | ||||||
| Microchip Technology, Inc. | 1,592 | 71,242 | ||||||
| Cree, Inc.* | 1,070 | 66,950 | ||||||
| Maxim Integrated Products, Inc. | 2,396 | 66,872 | ||||||
| Skyworks Solutions, Inc.* | 1,952 | 55,749 | ||||||
| First Solar, Inc.* | 972 | 53,110 | ||||||
| LSI Corp. | 4,510 | 49,700 | ||||||
| Atmel Corp.* | 5,660 | 44,318 | ||||||
| SunPower Corp. — Class A* | 1,460 | 43,523 | ||||||
| Synaptics, Inc.* | 620 | 32,122 | ||||||
| Cirrus Logic, Inc.* | 1,350 | 27,581 | ||||||
| Total Semiconductors | 2,353,900 | |||||||
| Systems Software - 10.1% | ||||||||
| Microsoft Corp. | 11,470 | 429,323 | ||||||
| Oracle Corp. | 8,079 | 309,103 | ||||||
| VMware, Inc. — Class A* | 1,638 | 146,945 | ||||||
| Symantec Corp. | 4,050 | 95,499 | ||||||
| Check Point Software Technologies Ltd.* | 1,474 | 95,102 | ||||||
| CA, Inc. | 2,783 | 93,648 | ||||||
| Red Hat, Inc.* | 1,449 | 81,202 | ||||||
| ServiceNow, Inc.* | 1,230 | 68,892 | ||||||
| NetSuite, Inc.* | 660 | 67,993 | ||||||
| CommVault Systems, Inc.* | 580 | 43,430 | ||||||
| Fortinet, Inc.* | 2,240 | 42,851 | ||||||
| Total Systems Software | 1,473,988 | |||||||
| Data Processing & Outsourced Services - 10.0% | ||||||||
| Visa, Inc. — Class A | 1,266 | 281,912 | ||||||
| MasterCard, Inc. — Class A | 285 | 238,106 | ||||||
| Automatic Data Processing, Inc. | 1,823 | 147,317 | ||||||
| Paychex, Inc. | 2,121 | �� | 96,569 | |||||
| Fidelity National Information Services, Inc. | 1,761 | 94,530 | ||||||
| Fiserv, Inc.* | 1,570 | 92,709 | ||||||
| Alliance Data Systems Corp.* | 333 | 87,556 | ||||||
| Western Union Co. | 4,250 | 73,313 | ||||||
| FleetCor Technologies, Inc.* | 620 | 72,645 | ||||||
| Computer Sciences Corp. | 1,219 | 68,118 | ||||||
| Vantiv, Inc. — Class A* | 1,900 | 61,959 | ||||||
| Total System Services, Inc. | 1,790 | 59,571 | ||||||
| Global Payments, Inc. | 810 | 52,642 | ||||||
| VeriFone Systems, Inc.* | 1,660 | 44,521 | ||||||
| Total Data Processing & Outsourced Services | 1,471,468 | |||||||
| Communications Equipment - 9.2% | ||||||||
| QUALCOMM, Inc. | 3,637 | 270,047 | ||||||
| Cisco Systems, Inc. | 11,843 | 265,875 | ||||||
| BlackBerry Ltd.* | 15,206 | 113,285 | ||||||
| Nokia Oyj ADR* | 12,700 | 102,997 | ||||||
| Motorola Solutions, Inc. | 1,481 | 99,968 | ||||||
| Juniper Networks, Inc.* | 3,615 | 81,591 | ||||||
| Harris Corp. | 930 | 64,923 | ||||||
| F5 Networks, Inc.* | 710 | 64,511 | ||||||
| Brocade Communications Systems, Inc.* | 5,460 | 48,430 | ||||||
| Palo Alto Networks, Inc.* | 820 | 47,125 | ||||||
| JDS Uniphase Corp.* | 3,194 | 41,458 | ||||||
| Riverbed Technology, Inc.* | 2,274 | 41,114 | ||||||
| Ciena Corp.* | 1,596 | 38,192 | ||||||
| Finisar Corp.* | 1,510 | 36,119 | ||||||
| Aruba Networks, Inc.* | 1,820 | 32,578 | ||||||
| Total Communications Equipment | 1,348,213 | |||||||
| Application Software - 8.9% | ||||||||
| Salesforce.com, Inc.* | 2,474 | 136,540 | ||||||
| Adobe Systems, Inc.* | 2,226 | 133,293 | ||||||
| NQ Mobile, Inc. ADR*,1 | 7,830 | 115,101 | ||||||
| 114 | the RYDEX FUNDS ANNUAL REPORT | See Notes to Financial Statements. |
| SCHEDULE OF INVESTMENTS (concluded) | December 31, 2013 |
| Technology Fund |
| Shares | Value | |||||||
| Intuit, Inc. | 1,445 | $ | 110,282 | |||||
| SAP AG ADR | 1,097 | 95,593 | ||||||
| Workday, Inc. — Class A* | 1,090 | 90,644 | ||||||
| Citrix Systems, Inc.* | 1,304 | 82,478 | ||||||
| Autodesk, Inc.* | 1,617 | 81,384 | ||||||
| ANSYS, Inc.* | 760 | 66,272 | ||||||
| Splunk, Inc.* | 910 | 62,490 | ||||||
| Concur Technologies, Inc.* | 570 | 58,813 | ||||||
| Nuance Communications, Inc.* | 3,370 | 51,224 | ||||||
| Informatica Corp.* | 1,212 | 50,298 | ||||||
| Cadence Design Systems, Inc.* | 3,420 | 47,948 | ||||||
| TIBCO Software, Inc.* | 1,925 | 43,274 | ||||||
| SolarWinds, Inc.* | 1,000 | 37,830 | ||||||
| Qlik Technologies, Inc.* | 1,370 | 36,483 | ||||||
| Total Application Software | 1,299,947 | |||||||
| COMPUTER HARDWARE - 6.2% | ||||||||
| Apple, Inc. | 969 | 543,715 | ||||||
| Hewlett-Packard Co. | 6,076 | 170,006 | ||||||
| 3D Systems Corp.* | 820 | 76,203 | ||||||
| Stratasys Ltd.* | 470 | 63,309 | ||||||
| NCR Corp.* | 1,680 | 57,221 | ||||||
| Total Computer Hardware | 910,454 | |||||||
| IT CONSULTING & OTHER SERVICES - 6.0% | ||||||||
| International Business Machines Corp. | 1,817 | 340,814 | ||||||
| Accenture plc — Class A | 1,607 | 132,128 | ||||||
| Cognizant Technology Solutions | ||||||||
| Corp. — Class A* | 1,308 | 132,082 | ||||||
| Infosys Ltd. ADR | 1,620 | 91,692 | ||||||
| Teradata Corp.* | 1,452 | 66,051 | ||||||
| Amdocs Ltd. | 1,490 | 61,448 | ||||||
| Leidos Holdings, Inc. | 1,027 | 47,745 | ||||||
| Total IT Consulting & Other Services | 871,960 | |||||||
| COMPUTER STORAGE & PERIPHERALS - 4.0% | ||||||||
| EMC Corp. | 6,882 | 173,082 | ||||||
| Seagate Technology plc | 2,090 | 117,374 | ||||||
| Western Digital Corp. | 1,261 | 105,798 | ||||||
| SanDisk Corp. | 1,344 | 94,806 | ||||||
| NetApp, Inc. | 2,178 | 89,603 | ||||||
| Total Computer Storage & Peripherals | 580,663 | |||||||
| SEMICONDUCTOR EQUIPMENT - 3.2% | ||||||||
| Applied Materials, Inc. | 6,291 | 111,287 | ||||||
| ASML Holding N.V. — Class G | 1,011 | 94,731 | ||||||
| KLA-Tencor Corp. | 1,210 | 77,997 | ||||||
| Lam Research Corp.* | 1,305 | 71,057 | ||||||
| SunEdison, Inc.* | 4,910 | 64,076 | ||||||
| Teradyne, Inc.* | 2,510 | 44,226 | ||||||
| Total Semiconductor Equipment | 463,374 | |||||||
| ELECTRONIC MANUFACTURING SERVICES - 2.2% | ||||||||
| TE Connectivity Ltd. | 1,860 | 102,504 | ||||||
| Flextronics International Ltd.* | 11,930 | 92,696 | ||||||
| Trimble Navigation Ltd.* | 2,070 | 71,829 | ||||||
| Jabil Circuit, Inc. | 2,922 | 50,960 | ||||||
| Total Electronic Manufacturing Services | 317,989 | |||||||
| ELECTRONIC COMPONENTS - 1.4% | ||||||||
| Corning, Inc. | 6,751 | 120,303 | ||||||
| Amphenol Corp. — Class A | 1,004 | 89,537 | ||||||
| Total Electronic Components | 209,840 | |||||||
| HOME ENTERTAINMENT SOFTWARE - 1.2% | ||||||||
| Activision Blizzard, Inc. | 4,595 | 81,930 | ||||||
| Electronic Arts, Inc.* | 2,661 | 61,043 | ||||||
| Take-Two Interactive Software, Inc.* | 1,720 | 29,876 | ||||||
| Total Home Entertainment Software | 172,849 | |||||||
| TECHNOLOGY DISTRIBUTORS - 0.8% | ||||||||
| Avnet, Inc. | 1,330 | 58,666 | ||||||
| Arrow Electronics, Inc.* | 1,040 | 56,420 | ||||||
| Total Technology Distributors | 115,086 | |||||||
| OFFICE ELECTRONICS - 0.6% | ||||||||
| Xerox Corp. | 7,583 | 92,285 | ||||||
| Total Common Stocks | ||||||||
| (Cost $8,815,089) | 14,652,673 | |||||||
| Face | ||||||||
| Amount | ||||||||
| REPURCHASE AGREEMENT††,2 - 1.1% | ||||||||
| Credit Suisse Group | ||||||||
| issued 12/31/13 at 0.00% | ||||||||
| due 01/02/14 | $ | 159,468 | 159,468 | |||||
| Total Repurchase Agreement | ||||||||
| (Cost $159,468) | 159,468 | |||||||
| SECURITIES LENDING COLLATERAL††,3 - 0.5% | ||||||||
| REPURCHASE AGREEMENTS | ||||||||
| HSBC Securities, Inc. | ||||||||
| issued 12/31/13 at 0.01% | ||||||||
| due 01/02/14 | 69,549 | 69,549 | ||||||
| Deutsche Bank Securities, Inc. | ||||||||
| issued 12/31/13 at 0.02% | ||||||||
| due 01/02/14 | 10,251 | 10,251 | ||||||
| Total Securities Lending Collateral | ||||||||
| (Cost $79,800) | 79,800 | |||||||
| Total Investments - 101.7% | ||||||||
| (Cost $9,054,357) | $ | 14,891,941 | ||||||
| Other Assets & Liabilities, net - (1.7)% | (243,432 | ) | ||||||
| Total Net Assets - 100.0% | $ | 14,648,509 | ||||||
| * | Non-income producing security. |
| † | Value determined based on Level 1 inputs — See Note 4. |
| †† | Value determined based on Level 2 inputs — See Note 4. |
| 1 | All or portion of this security is on loan at December 31, 2013 — See Note 8. |
| 2 | Repurchase Agreement — See Note 5. |
| 3 | Securities lending collateral — See Note 8. | |
| ADR — American Depository Receipt | ||
| plc — Public Limited Company |
| See Notes to Financial Statements. | THE RYDEX FUNDS ANNUAL REPORT | 115 |
| Technology Fund |
| STATEMENT OF ASSETS |
| AND LIABILITIES |
December 31, 2013
| Assets: | ||||
| Investments, at value - including $82,320 of securities loaned | ||||
| (cost $8,815,089) | $ | 14,652,673 | ||
| Repurchase agreements, at value | ||||
| (cost $239,268) | 239,268 | |||
| Total investments | ||||
| (cost $9,054,357) | 14,891,941 | |||
| Receivables: | ||||
| Fund shares sold | 51,614 | |||
| Dividends | 5,025 | |||
| Interest and securities lending income | 165 | |||
| Total assets | 14,948,745 | |||
| Liabilities: | ||||
| Payable for: | ||||
| Securities purchased | 140,059 | |||
| Upon return of securities loaned | 79,800 | |||
| Fund shares redeemed | 50,339 | |||
| Management fees | 9,404 | |||
| Transfer agent and administrative fees | 2,766 | |||
| Investor service fees | 2,766 | |||
| Portfolio accounting fees | 1,107 | |||
| Miscellaneous | 13,995 | |||
| Total liabilities | 300,236 | |||
| Net assets | $ | 14,648,509 | ||
| Net assets consist of: | ||||
| Paid in capital | $ | 10,291,839 | ||
| Undistributed net investment income | 1,649 | |||
| Accumulated net realized loss on investments | (1,482,563 | ) | ||
| Net unrealized appreciation on investments | 5,837,584 | |||
| Net assets | $ | 14,648,509 | ||
| Capital shares outstanding* | 226,571 | |||
| Net asset value per share* | $ | 64.65 |
| STATEMENT OF |
| OPERATIONS |
Year Ended December 31, 2013
| Investment Income: | ||||
| Dividends (net of foreign withholding tax of $123) | $ | 131,226 | ||
| Income from securities lending, net | 2,181 | |||
| Interest | 16 | |||
| Total investment income | 133,423 | |||
| Expenses: | ||||
| Management fees | 84,629 | |||
| Transfer agent and administrative fees | 24,891 | |||
| Investor service fees | 24,891 | |||
| Portfolio accounting fees | 9,956 | |||
| Professional fees | 8,700 | |||
| Custodian fees | 1,135 | |||
| Trustees’ fees** | 1,046 | |||
| Line of credit interest expense | 81 | |||
| Miscellaneous | 7,366 | |||
| Total expenses | 162,695 | |||
| Net investment loss | (29,272 | ) | ||
| Net Realized and Unrealized Gain (Loss): | ||||
| Net realized gain (loss) on: | ||||
| Investments | 1,249,660 | |||
| Net realized gain | 1,249,660 | |||
| Net change in unrealized appreciation (depreciation) on: | ||||
| Investments | 1,900,212 | |||
| Net change in unrealized appreciation (depreciation) | 1,900,212 | |||
| Net realized and unrealized gain | 3,149,872 | |||
| Net increase in net assets resulting from operations | $ | 3,120,600 |
* The shares outstanding and net asset value per share have been restated to reflect a 1-for-5 reverse share split effective January 24, 2014. See Note 10 in Notes to Financial Statements.
** Relates to Trustees not deemed “interested persons” within the meaning of Section 2(a)(19) of the 1940 Act.
| 116 | the RYDEX FUNDS ANNUAL REPORT | See Notes to Financial Statements. |
| Technology Fund |
STATEMENTS OF CHANGES IN NET ASSETS
| Year Ended | Year Ended | |||||||
| December 31, | December 31, | |||||||
| 2013 | 2012 | |||||||
| Increase (Decrease) In Net Assets From Operations: | ||||||||
| Net investment loss | $ | (29,272 | ) | $ | (28,061 | ) | ||
| Net realized gain on investments | 1,249,660 | 856,862 | ||||||
| Net change in unrealized appreciation (depreciation) on investments | 1,900,212 | 81,257 | ||||||
| Net increase in net assets resulting from operations | 3,120,600 | 910,058 | ||||||
| Distributions to shareholders from: | ||||||||
| Net realized gains | — | (1,504,762 | ) | |||||
| Total distributions to shareholders | — | (1,504,762 | ) | |||||
| Capital share transactions: | ||||||||
| Proceeds from sale of shares | 39,088,563 | 32,308,400 | ||||||
| Distributions reinvested | — | 1,504,762 | ||||||
| Cost of shares redeemed | (35,737,995 | ) | (34,894,941 | ) | ||||
| Net increase (decrease) from capital share transactions | 3,350,568 | (1,081,779 | ) | |||||
| Net increase (decrease) in net assets | 6,471,168 | (1,676,483 | ) | |||||
| Net assets: | ||||||||
| Beginning of year | 8,177,341 | 9,853,824 | ||||||
| End of year | $ | 14,648,509 | $ | 8,177,341 | ||||
| Undistributed net investment income at end of year | $ | 1,649 | $ | — | ||||
| Capital share activity:* | ||||||||
| Shares sold | 716,685 | 561,477 | ||||||
| Shares issued from reinvestment of distributions | — | 33,145 | ||||||
| Shares redeemed | (661,272 | ) | (608,650 | ) | ||||
| Net increase (decrease) in shares | 55,413 | (14,028 | ) | |||||
* Capital share activity for the years ended December 31, 2012 and 2013 has been restated to reflect a 1-for-5 reverse share split effective January 24, 2014. See Note 10 in Notes to Financial Statements.
| See Notes to Financial Statements. | THE RYDEX FUNDS ANNUAL REPORT | 117 |
| Technology Fund |
FINANCIAL HIGHLIGHTS
This table is presented to show selected data for a share outstanding throughout each period and to assist shareholders in evaluating a Fund’s performance for the periods presented.
| Year Ended | Year Ended | Year Ended | Year Ended | Year Ended | ||||||||||||||||
| December 31, | December 31, | December 31, | December 31, | December 31, | ||||||||||||||||
| 2013c | 2012c | 2011c | 2010c | 2009c | ||||||||||||||||
| Per Share Data | ||||||||||||||||||||
| Net asset value, beginning of period | $ | 47.78 | $ | 53.21 | $ | 61.47 | $ | 54.85 | $ | 35.25 | ||||||||||
| Income (loss) from investment operations: | ||||||||||||||||||||
| Net investment lossa | (.15 | ) | (.15 | ) | (.45 | ) | (.40 | ) | (.30 | ) | ||||||||||
| Net gain (loss) on investments (realized and unrealized) | 17.02 | 5.97 | (5.06 | ) | 7.02 | 19.90 | ||||||||||||||
| Total from investment operations | 16.87 | 5.82 | (5.51 | ) | 6.62 | 19.60 | ||||||||||||||
| Less distributions from: | ||||||||||||||||||||
| Net realized gains | — | (11.25 | ) | (2.75 | ) | — | — | |||||||||||||
| Total distributions | — | (11.25 | ) | (2.75 | ) | — | — | |||||||||||||
| Net asset value, end of period | $ | 64.65 | $ | 47.78 | $ | 53.21 | $ | 61.47 | $ | 54.85 | ||||||||||
| Total Returnb | 35.39 | % | 11.98 | % | (9.20 | %) | 12.03 | % | 55.60 | % | ||||||||||
| Ratios/Supplemental Data | ||||||||||||||||||||
| Net assets, end of period (in thousands) | $ | 14,649 | $ | 8,177 | $ | 9,854 | $ | 21,468 | $ | 39,967 | ||||||||||
| Ratios to average net assets: | ||||||||||||||||||||
| Net investment loss | (0.29 | %) | (0.27 | %) | (0.77 | %) | (0.74 | %) | (0.68 | %) | ||||||||||
| Total expenses | 1.63 | % | 1.67 | % | 1.71 | % | 1.65 | % | �� | 1.65 | % | |||||||||
| Portfolio turnover rate | 382 | % | 277 | % | 363 | % | 357 | % | 252 | % | ||||||||||
| a | Net investment loss per share was computed using average shares outstanding throughout the period. |
| b | Total return does not reflect the impact of any additional fees charged by insurance companies. |
| c | Reverse share split—Per share amounts for the years ended December 31, 2009, 2010, 2011, 2012 and 2013 have been restated to reflect a 1:5 reverse share split effective January 24, 2014. See Note 10 in Notes to Financial Statements. |
| 118 | the RYDEX FUNDS ANNUAL REPORT | See Notes to Financial Statements. |
This page intentionally left blank.
| THE RYDEX FUNDS ANNUAL REPORT | 119 |
| PERFORMANCE REPORT AND FUND PROFILE (Unaudited) | December 31, 2013 |
OBJECTIVE: Seeks to provide capital appreciation by investing in companies engaged in the development, manufacture, or sale of communications services or communications equipment (“Telecommunications Companies”).
For the year ended December 31, 2013, Telecommunications Fund returned 17.46%, compared with a gain of 32.39% for the S&P 500 Index. The S&P 500 Telecommunications Services Index returned 11.47%.
The industries contributing most were the wireless telecommunications services industry and the communications equipment industry. No industry detracted, but the diversified telecommunications services industry contributed least.
Sprint Corp., T-Mobile U.S., Inc and Qualcomm, Inc. were the strongest performers for the year.
CenturyLink, Inc., BlackBerry Ltd. and Ixia, Inc. detracted most from performance during the year.
Performance displayed represents past performance, which is no guarantee of future results.
Holdings Diversification (Market Exposure as % of Net Assets)
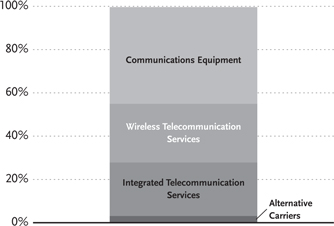
“Holdings Diversification (Market Exposure as % of Net Assets)” excludes any temporary cash investments.
| Inception Date: July 27, 2001 | ||||
| Ten Largest Holdings (% of Total Net Assets) | ||||
| AT&T, Inc. | 8.7 | % | ||
| Verizon Communications, Inc. | 7.6 | % | ||
| QUALCOMM, Inc. | 7.2 | % | ||
| Cisco Systems, Inc. | 7.1 | % | ||
| Sprint Corp. | 4.3 | % | ||
| T-Mobile US, Inc. | 3.6 | % | ||
| Crown Castle International Corp. | 3.2 | % | ||
| Vodafone Group plc ADR | 2.8 | % | ||
| CenturyLink, Inc. | 2.8 | % | ||
| Motorola Solutions, Inc. | 2.7 | % | ||
| Top Ten Total | 50.0 | % | ||
“Ten Largest Holdings” exclude any temporary cash or derivative investments.
| 120 | THE RYDEX FUNDS ANNUAL REPORT |
| PERFORMANCE REPORT AND FUND PROFILE (Unaudited) (concluded) |
Cumulative Fund Performance*,†
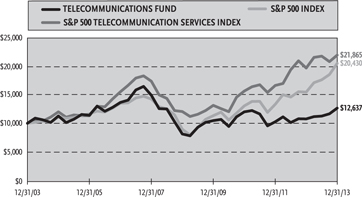
Average Annual Returns
Periods Ended December 31, 2013*,†
| 1 Year | 5 Year | 10 Year | ||||||||||
| Telecommunications Fund | 17.46 | % | 9.21 | % | 2.37 | % | ||||||
| S&P 500 Telecommunication Services Index | 11.47 | % | 12.67 | % | 8.14 | % | ||||||
| S&P 500 Index | 32.39 | % | 17.94 | % | 7.41 | % | ||||||
| * | The performance data above represents past performance that is not predictive of future results. The investment return and principal value of an investment in the Fund will fluctuate so that an investor’s shares, when redeemed, may be worth more or less than their original cost. Returns are historical and include changes in principal and reinvested dividends and capital gains and do not reflect the effect of taxes. The S&P 500 Index and the S&P 500 Telecommunication Services Index are unmanaged indices and, unlike the Fund, have no management fees or operating expenses to reduce their reported returns. |
| † | Returns do not reflect the impact of any additional fees charged by insurance companies. |
| THE RYDEX FUNDS ANNUAL REPORT | 121 |
| SCHEDULE OF INVESTMENTS | December 31, 2013 |
| TELECOMMUNICATIONS FUND |
| Shares | Value | |||||||
| COMMON STOCKS† - 99.5% | ||||||||
| COMMUNICATIONS EQUIPMENT - 44.7% | ||||||||
| QUALCOMM, Inc. | 2,129 | $ | 158,077 | |||||
| Cisco Systems, Inc. | 6,939 | 155,781 | ||||||
| Motorola Solutions, Inc. | 867 | 58,523 | ||||||
| Juniper Networks, Inc.* | 2,119 | 47,826 | ||||||
| BlackBerry Ltd.* | 5,343 | 39,805 | ||||||
| Nokia Oyj ADR* | 4,884 | 39,609 | ||||||
| Harris Corp. | 546 | 38,116 | ||||||
| F5 Networks, Inc.* | 416 | 37,798 | ||||||
| Ubiquiti Networks, Inc.* | 639 | 29,368 | ||||||
| Brocade Communications Systems, Inc.* | 3,200 | 28,384 | ||||||
| Palo Alto Networks, Inc.* | 481 | 27,643 | ||||||
| ARRIS Group, Inc.* | 1,092 | 26,607 | ||||||
| Telefonaktiebolaget LM Ericsson ADR | 2,161 | 26,451 | ||||||
| JDS Uniphase Corp.* | 1,872 | 24,299 | ||||||
| Riverbed Technology, Inc.* | 1,330 | 24,046 | ||||||
| ViaSat, Inc.* | 379 | 23,744 | ||||||
| Ciena Corp.* | 937 | 22,422 | ||||||
| Finisar Corp.* | 883 | 21,121 | ||||||
| Plantronics, Inc. | 433 | 20,113 | ||||||
| Polycom, Inc.* | 1,737 | 19,507 | ||||||
| Aruba Networks, Inc.* | 1,067 | 19,099 | ||||||
| ADTRAN, Inc. | 650 | 17,557 | ||||||
| NETGEAR, Inc.* | 484 | 15,943 | ||||||
| Infinera Corp.* | 1,599 | 15,638 | ||||||
| InterDigital, Inc. | 499 | 14,716 | ||||||
| Ixia* | 1,065 | 14,175 | ||||||
| Ruckus Wireless, Inc.* | 984 | 13,973 | ||||||
| Total Communications Equipment | 980,341 | |||||||
| WIRELESS TELECOMMUNICATION SERVICES - 27.0% | ||||||||
| Sprint Corp.* | 8,750 | 94,062 | ||||||
| T-Mobile US, Inc. | 2,336 | 78,583 | ||||||
| Crown Castle International Corp.* | 950 | 69,759 | ||||||
| Vodafone Group plc ADR | 1,574 | 61,874 | ||||||
| SBA Communications Corp. — Class A* | 537 | 48,244 | ||||||
| America Movil SAB de CV ADR | 1,818 | 42,487 | ||||||
| Mobile Telesystems OJSC ADR | 1,453 | 31,428 | ||||||
| China Mobile Ltd. ADR | 550 | 28,760 | ||||||
| VimpelCom Ltd. ADR | 2,064 | 26,708 | ||||||
| Tim Participacoes S.A. ADR | 987 | 25,899 | ||||||
| SK Telecom Company Ltd. ADR | 984 | 24,226 | ||||||
| Telephone & Data Systems, Inc. | 924 | 23,821 | ||||||
| Rogers Communications, Inc. — Class B | 495 | 22,399 | ||||||
| Leap Wireless International, Inc.* | 941 | 16,373 | ||||||
| Total Wireless Telecommunication Services | 594,623 | |||||||
| INTEGRATED TELECOMMUNICATION SERVICES - 24.7% | ||||||||
| AT&T, Inc. | 5,453 | 191,727 | ||||||
| Verizon Communications, Inc. | 3,378 | 165,995 | ||||||
| CenturyLink, Inc. | 1,934 | 61,598 | ||||||
| Windstream Holdings, Inc.1 | 3,740 | 29,845 | ||||||
| Telefonica Brasil S.A. ADR | 1,291 | 24,813 | ||||||
| BCE, Inc. | 549 | 23,766 | ||||||
| Telefonica S.A. ADR | 1,358 | 22,190 | ||||||
| China Unicom Hong Kong Ltd. ADR | 1,446 | 21,777 | ||||||
| Total Integrated Telecommunication Services | 541,711 | |||||||
| ALTERNATIVE CARRIERS - 3.1% | ||||||||
| Level 3 Communications, Inc.* | 1,155 | 38,312 | ||||||
| tw telecom, Inc. — Class A* | 971 | 29,586 | ||||||
| Total Alternative Carriers | 67,898 | |||||||
| Total Common Stocks | ||||||||
| (Cost $1,260,037) | 2,184,573 | |||||||
| Face | ||||||||
| Amount | ||||||||
| REPURCHASE AGREEMENT††,2 - 3.2% | ||||||||
| Credit Suisse Group | ||||||||
| issued 12/31/13 at 0.00% | ||||||||
| due 01/02/14 | $ | 69,341 | 69,341 | |||||
| Total Repurchase Agreement | ||||||||
| (Cost $69,341) | 69,341 | |||||||
| SECURITIES LENDING COLLATERAL††,3 - 1.1% | ||||||||
| Repurchase Agreements | ||||||||
| HSBC Securities, Inc. | ||||||||
| issued 12/31/13 at 0.01% | ||||||||
| due 01/02/14 | 21,571 | 21,571 | ||||||
| Deutsche Bank Securities, Inc. | ||||||||
| issued 12/31/13 at 0.02% | ||||||||
| due 01/02/14 | 3,179 | 3,179 | ||||||
| Total Securities Lending Collateral | ||||||||
| (Cost $24,750) | 24,750 | |||||||
| Total Investments - 103.8% | ||||||||
| (Cost $1,354,128) | $ | 2,278,664 | ||||||
| Other Assets & Liabilities, net - (3.8)% | (84,408 | ) | ||||||
| Total Net Assets - 100.0% | $ | 2,194,256 |
| * | Non-income producing security. |
| † | Value determined based on Level 1 inputs — See Note 4. | |
| †† | Value determined based on Level 2 inputs — See Note 4. |
| 1 | All or portion of this security is on loan at December 31, 2013 — See Note 8. |
| 2 | Repurchase Agreement — See Note 5. |
| 3 | Securities lending collateral — See Note 8. | |
| ADR — American Depository Receipt | ||
| plc — Public Limited Company |
| 122 | THE RYDEX FUNDS ANNUAL REPORT | SEE NOTES TO FINANCIAL STATEMENTS. |
| TELECOMMUNICATIONS FUND |
| STATEMENT OF ASSETS |
| AND LIABILITIES |
December 31, 2013
| Assets: | ||||
| Investments, at value - including $23,940 of securities loaned | ||||
| (cost $1,260,037) | $ | 2,184,573 | ||
| Repurchase agreements, at value | ||||
| (cost $94,091) | 94,091 | |||
| Total investments | ||||
| (cost $1,354,128) | 2,278,664 | |||
| Receivables: | ||||
| Fund shares sold | 163,081 | |||
| Dividends | 3,711 | |||
| Foreign taxes reclaim | 235 | |||
| Interest and securities lending income | 26 | |||
| Total assets | 2,445,717 | |||
| Liabilities: | ||||
| Payable for: | ||||
| Securities purchased | 217,520 | |||
| Upon return of securities loaned | 24,750 | |||
| Management fees | 2,002 | |||
| Fund shares redeemed | 1,239 | |||
| Transfer agent and administrative fees | 589 | |||
| Investor service fees | 589 | |||
| Portfolio accounting fees | 235 | |||
| Miscellaneous | 4,537 | |||
| Total liabilities | 251,461 | |||
| Net assets | $ | 2,194,256 | ||
| Net Assets Consist Of: | ||||
| Paid in capital | $ | 3,873,420 | ||
| Undistributed net investment income | 54,752 | |||
| Accumulated net realized loss on investments | (2,658,452 | ) | ||
| Net unrealized appreciation on investments | 924,536 | |||
| Net assets | $ | 2,194,256 | ||
| Capital shares outstanding* | 41,445 | |||
| Net asset value per share* | $ | 52.94 |
| STATEMENT OF |
| OPERATIONS |
Year Ended December 31, 2013
| Investment Income: | ||||
| Dividends (net of foreign withholding tax of $3,033) | $ | 105,688 | ||
| Income from securities lending, net | 1,749 | |||
| Interest | 6 | |||
| Total investment income | 107,443 | |||
| Expenses: | ||||
| Management fees | 27,093 | |||
| Transfer agent and administrative fees | 7,969 | |||
| Investor service fees | 7,969 | |||
| Portfolio accounting fees | 3,187 | |||
| Professional fees | 2,843 | |||
| Trustees’ fees** | 383 | |||
| Custodian fees | 355 | |||
| Line of credit interest expense | 80 | |||
| Miscellaneous | 2,372 | |||
| Total expenses | 52,251 | |||
| Net investment income | 55,192 | |||
| Net Realized and Unrealized Gain (Loss): | ||||
| Net realized gain (loss) on: | ||||
| Investments | 402,110 | |||
| Net realized gain | 402,110 | |||
| Net change in unrealized appreciation (depreciation) on: | ||||
| Investments | 15,291 | |||
| Net change in unrealized appreciation (depreciation) | 15,291 | |||
| Net realized and unrealized gain | 417,401 | |||
| Net increase in net assets resulting from operations | $ | 472,593 |
| * | The shares outstanding and net asset value per share have been restated to reflect a 1-for-5 reverse share split effective January 24, 2014. See Note 10 in Notes to Financial Statements. |
| ** | Relates to Trustees not deemed “interested persons” within the meaning of Section 2(a)(19) of the 1940 Act. |
| SEE NOTES TO FINANCIAL STATEMENTS. | THE RYDEX FUNDS ANNUAL REPORT | 123 |
| TELECOMMUNICATIONS FUND |
| STATEMENTS OF CHANGES IN NET ASSETS |
| Year Ended | Year Ended | |||||||
| December 31, | December 31, | |||||||
| 2013 | 2012 | |||||||
| Increase (Decrease) In Net Assets From Operations: | ||||||||
| Net investment income | $ | 55,192 | $ | 55,375 | ||||
| Net realized gain (loss) on investments | 402,110 | (231,460 | ) | |||||
| Net change in unrealized appreciation (depreciation) on investments | 15,291 | 43,706 | ||||||
| Net increase (decrease) in net assets resulting from operations | 472,593 | (132,379 | ) | |||||
| Distributions to shareholders from: | ||||||||
| Net investment income | (55,157 | ) | (63,032 | ) | ||||
| Total distributions to shareholders | (55,157 | ) | (63,032 | ) | ||||
| Capital share transactions: | ||||||||
| Proceeds from sale of shares | 37,680,590 | 39,023,725 | ||||||
| Distributions reinvested | 55,157 | 63,032 | ||||||
| Cost of shares redeemed | (38,856,105 | ) | (40,361,197 | ) | ||||
| Net decrease from capital share transactions | (1,120,358 | ) | (1,274,440 | ) | ||||
| Net decrease in net assets | (702,922 | ) | (1,469,851 | ) | ||||
| Net assets: | ||||||||
| Beginning of year | 2,897,178 | 4,367,029 | ||||||
| End of year | $ | 2,194,256 | $ | 2,897,178 | ||||
| Undistributed net investment income at end of year | $ | 54,752 | $ | 55,156 | ||||
| Capital share activity:* | ||||||||
| Shares sold | 771,074 | 842,843 | ||||||
| Shares issued from reinvestment of distributions | 1,110 | 1,437 | ||||||
| Shares redeemed | (793,719 | ) | (878,389 | ) | ||||
| Net decrease in shares | (21,535 | ) | (34,109 | ) | ||||
* Capital share activity for the years ended December 31, 2012 and 2013 has been restated to reflect a 1-for-5 reverse share split effective January 24, 2014. See Note 10 in Notes to Financial Statements.
| 124 | THE RYDEX FUNDS ANNUAL REPORT | SEE NOTES TO FINANCIAL STATEMENTS. |
| TELECOMMUNICATIONS FUND |
| FINANCIAL HIGHLIGHTS |
This table is presented to show selected data for a share outstanding throughout each period and to assist shareholders in evaluating a Fund’s performance for the periods presented.
| Year Ended | Year Ended | Year Ended | Year Ended | Year Ended | ||||||||||||||||
| December 31, | December 31, | December 31, | December 31, | December 31, | ||||||||||||||||
| 2013c | 2012c | 2011c | 2010c | 2009c | ||||||||||||||||
| Per Share Data | ||||||||||||||||||||
| Net asset value, beginning of period | $ | 46.00 | $ | 44.98 | $ | 55.21 | $ | 48.98 | $ | 39.70 | ||||||||||
| Income (loss) from investment operations: | ||||||||||||||||||||
| Net investment incomea | .85 | .65 | .80 | .30 | .90 | |||||||||||||||
| Net gain (loss) on investments (realized and unrealized) | 7.09 | 1.52 | (8.73 | ) | 6.78 | 10.38 | ||||||||||||||
| Total from investment operations | 7.94 | 2.17 | (7.93 | ) | 7.08 | 11.28 | ||||||||||||||
| Less distributions from: | ||||||||||||||||||||
| Net investment income | (1.00 | ) | (1.15 | ) | (.60 | ) | (.85 | ) | (2.00 | ) | ||||||||||
| Net realized gains | — | — | (1.70 | ) | — | — | ||||||||||||||
| Total distributions | (1.00 | ) | (1.15 | ) | (2.30 | ) | (.85 | ) | (2.00 | ) | ||||||||||
| Net asset value, end of period | $ | 52.94 | $ | 46.00 | $ | 44.98 | $ | 55.21 | $ | 48.98 | ||||||||||
| Total Returnb | 17.46 | % | 4.86 | % | (14.40 | %) | 14.51 | % | 28.68 | % | ||||||||||
| Ratios/Supplemental Data | ||||||||||||||||||||
| Net assets, end of period (in thousands) | $ | 2,194 | $ | 2,897 | $ | 4,367 | $ | 8,077 | $ | 5,748 | ||||||||||
| Ratios to average net assets: | ||||||||||||||||||||
| Net investment income | 1.73 | % | 1.46 | % | 1.49 | % | 0.66 | % | 2.03 | % | ||||||||||
| Total expenses | 1.64 | % | 1.67 | % | 1.71 | % | 1.67 | % | 1.66 | % | ||||||||||
| Portfolio turnover rate | 1,267 | % | 1,077 | % | 1,100 | % | 1,276 | % | 694 | % | ||||||||||
| a | Net investment income per share was computed using average shares outstanding throughout the period. |
| b | Total return does not reflect the impact of any additional fees charged by insurance companies. |
| c | Reverse share split—Per share amounts for the years ended December 31, 2009, 2010, 2011, 2012 and 2013 have been restated to reflect a 1:5 reverse share split effective January 24, 2014. See Note 10 in Notes to Financial Statements. |
| SEE NOTES TO FINANCIAL STATEMENTS. | THE RYDEX FUNDS ANNUAL REPORT | 125 |
| PERFORMANCE REPORT AND FUND PROFILE (Unaudited) | December 31, 2013 |
OBJECTIVE: Seeks to provide capital appreciation by investing in companies engaged in providing transportation services or companies engaged in the design, manufacture, distribution, or sale of transportation equipment (“Transportation Companies”).
For the year ended December 31, 2013, Transportation Fund returned 50.64%, compared with a gain of 32.39% for the S&P 500 Index. The S&P 500 Industrials Index returned 40.68%.
The road & rail segment industry contributed most to return, followed by the auto components industry. No industry detracted, but the lightly weighted marine industry contributed least.
Tesla Motors, Inc., Delta Air Lines, Inc. and United Parcel Services, Inc. Class B were the biggest contributors to performance for the year.
C.H. Robinson Worldwide, Inc., LATAM Airlines Group S.A. and Arkansas Best Corp. detracted most from performance during the year.
Performance displayed represents past performance, which is no guarantee of future results.
Holdings Diversification (Market Exposure as % of Net Assets)

“Holdings Diversification (Market Exposure as % of Net Assets)” excludes any temporary cash investments.
Inception Date: June 11, 2001
Ten Largest Holdings (% of Total Net Assets)
| United Parcel Service, Inc. — Class B | 5.5 | % | ||
| Union Pacific Corp. | 5.0 | % | ||
| Ford Motor Co. | 4.5 | % | ||
| General Motors Co. | 4.2 | % | ||
| FedEx Corp. | 3.8 | % | ||
| Johnson Controls, Inc. | 3.3 | % | ||
| Norfolk Southern Corp. | 3.0 | % | ||
| CSX Corp. | 3.0 | % | ||
| Delta Air Lines, Inc. | 2.7 | % | ||
| Tesla Motors, Inc. | 2.5 | % | ||
| Top Ten Total | 37.5 | % |
“Ten Largest Holdings” exclude any temporary cash or derivative investments.
| 126 | THE RYDEX FUNDS ANNUAL REPORT |
| PERFORMANCE REPORT AND FUND PROFILE (Unaudited) (concluded) |
Cumulative Fund Performance*,†

Average Annual Returns
Periods Ended December 31, 2013*,†
| 1 Year | 5 Year | 10 Year | ||||||||||
| Transportation Fund | 50.64 | % | 18.06 | % | 8.41 | % | ||||||
| S&P 500 Industrials Index | 40.68 | % | 19.84 | % | 8.57 | % | ||||||
| S&P 500 Index | 32.39 | % | 17.94 | % | 7.41 | % | ||||||
| * | The performance data above represents past performance that is not predictive of future results. The investment return and principal value of an investment in the Fund will fluctuate so that an investor’s shares, when redeemed, may be worth more or less than their original cost. Returns are historical and include changes in principal and reinvested dividends and capital gains and do not reflect the effect of taxes. The S&P 500 Index and the S&P 500 Industrials Index are unmanaged indices and, unlike the Fund, have no management fees or operating expenses to reduce their reported returns. |
| † | Returns do not reflect the impact of any additional fees charged by insurance companies. |
| THE RYDEX FUNDS ANNUAL REPORT | 127 |
| SCHEDULE OF INVESTMENTS | December 31, 2013 |
| TRANSPORTATION FUND |
| Shares | Value | |||||||
| COMMON STOCKS† - 99.2% | ||||||||
| AUTO PARTS & EQUIPMENT - 19.6% | ||||||||
| Johnson Controls, Inc. | 13,356 | $ | 685,164 | |||||
| BorgWarner, Inc. | 7,420 | 414,852 | ||||||
| Delphi Automotive plc | 6,710 | 403,472 | ||||||
| TRW Automotive Holdings Corp.* | 4,460 | 331,779 | ||||||
| Magna International, Inc. | 3,900 | 320,034 | ||||||
| Autoliv, Inc. | 3,400 | 312,120 | ||||||
| Lear Corp. | 3,643 | 294,974 | ||||||
| Allison Transmission Holdings, Inc. | 9,420 | 260,086 | ||||||
| Gentex Corp. | 7,240 | 238,848 | ||||||
| Visteon Corp.* | 2,799 | 229,210 | ||||||
| Tenneco, Inc.* | 3,760 | 212,703 | ||||||
| Dana Holding Corp. | 10,110 | 198,358 | ||||||
| American Axle & Manufacturing Holdings, Inc.* | 7,070 | 144,582 | ||||||
| Total Auto Parts & Equipment | 4,046,182 | |||||||
| RAILROADS - 17.8% | ||||||||
| Union Pacific Corp. | 6,144 | 1,032,192 | ||||||
| Norfolk Southern Corp. | 6,760 | 627,531 | ||||||
| CSX Corp. | 21,746 | 625,632 | ||||||
| Kansas City Southern | 3,412 | 422,508 | ||||||
| Canadian Pacific Railway Ltd. | 2,444 | 369,826 | ||||||
| Canadian National Railway Co. | 5,804 | 330,944 | ||||||
| Genesee & Wyoming, Inc. — Class A* | 2,669 | 256,357 | ||||||
| Total Railroads | 3,664,990 | |||||||
| AIRLINES - 15.6% | ||||||||
| Delta Air Lines, Inc. | 20,552 | 564,564 | ||||||
| American Airlines Group, Inc.*,1 | 19,713 | 497,753 | ||||||
| United Continental Holdings, Inc.* | 11,537 | 436,445 | ||||||
| Southwest Airlines Co. | 22,347 | 421,017 | ||||||
| Copa Holdings S.A. — Class A | 2,076 | 332,388 | ||||||
| Ryanair Holdings plc ADR* | 6,440 | 302,229 | ||||||
| Alaska Air Group, Inc. | 3,582 | 262,811 | ||||||
| Spirit Airlines, Inc.* | 4,700 | 213,427 | ||||||
| JetBlue Airways Corp.* | 21,430 | 183,227 | ||||||
| Total Airlines | 3,213,861 | |||||||
| AUTOMOBILE MANUFACTURERS - 15.3% | ||||||||
| Ford Motor Co. | 60,555 | 934,363 | ||||||
| General Motors Co.* | 21,080 | 861,540 | ||||||
| Tesla Motors, Inc.*,1 | 3,380 | 508,284 | ||||||
| Tata Motors Ltd. ADR | 10,760 | 331,408 | ||||||
| Toyota Motor Corp. ADR | 2,590 | 315,773 | ||||||
| Thor Industries, Inc. | 3,691 | 203,854 | ||||||
| Total Automobile Manufacturers | 3,155,222 | |||||||
| AIR FREIGHT & LOGISTICS - 13.5% | ||||||||
| United Parcel Service, Inc. — Class B | 10,797 | 1,134,548 | ||||||
| FedEx Corp. | 5,502 | 791,023 | ||||||
| Expeditors International | ||||||||
| of Washington, Inc. | 8,020 | 354,885 | ||||||
| CH Robinson Worldwide, Inc. | 6,022 | 351,323 | ||||||
| UTI Worldwide, Inc. | 9,010 | 158,216 | ||||||
| Total Air Freight & Logistics | 2,789,995 | |||||||
| TRUCKING - 11.8% | ||||||||
| Hertz Global Holdings, Inc.* | 14,862 | 425,351 | ||||||
| J.B. Hunt Transport Services, Inc. | 4,510 | 348,624 | ||||||
| Old Dominion Freight Line, Inc.* | 4,717 | 250,095 | ||||||
| Avis Budget Group, Inc.* | 6,007 | 242,803 | ||||||
| Ryder System, Inc. | 2,986 | 220,307 | ||||||
| Swift Transportation Co. — Class A*,1 | 8,840 | 196,336 | ||||||
| Landstar System, Inc. | 3,206 | 184,185 | ||||||
| Con-way, Inc. | 4,309 | 171,110 | ||||||
| Werner Enterprises, Inc. | 6,110 | 151,100 | ||||||
| Knight Transportation, Inc. | 7,560 | 138,650 | ||||||
| Arkansas Best Corp. | 3,070 | 103,398 | ||||||
| Total Trucking | 2,431,959 | |||||||
| MOTORCYCLE MANUFACTURERS - 2.2% | ||||||||
| Harley-Davidson, Inc. | 6,600 | 456,984 | ||||||
| TIRES & RUBBER - 2.1% | ||||||||
| Goodyear Tire & Rubber Co. | 11,985 | 285,842 | ||||||
| Cooper Tire & Rubber Co. | 6,320 | 151,933 | ||||||
| Total Tires & Rubber | 437,775 | |||||||
| MARINE - 1.3% | ||||||||
| Kirby Corp.* | 2,705 | 268,471 | ||||||
| Total Common Stocks | ||||||||
| (Cost $13,644,676) | 20,465,439 | |||||||
| 128 | THE RYDEX FUNDS ANNUAL REPORT | SEE NOTES TO FINANCIAL STATEMENTS. |
| SCHEDULE OF INVESTMENTS (concluded) | December 31, 2013 |
| TRANSPORTATION FUND |
| Face | ||||||||
| Amount | Value | |||||||
| REPURCHASE AGREEMENT††,2 - 0.4% | ||||||||
| Credit Suisse Group | ||||||||
| issued 12/31/13 at 0.00% | ||||||||
| due 01/02/14 | $ | 87,283 | $ | 87,283 | ||||
| Total Repurchase Agreement | ||||||||
| (Cost $87,283) | 87,283 | |||||||
| SECURITIES LENDING COLLATERAL††,3 - 3.4% | ||||||||
| Repurchase Agreements | ||||||||
| HSBC Securities, Inc. | ||||||||
| issued 12/31/13 at 0.01% | ||||||||
| due 01/02/14 | 607,188 | 607,188 | ||||||
| Deutsche Bank Securities, Inc. | ||||||||
| issued 12/31/13 at 0.02% | ||||||||
| due 01/02/14 | 89,500 | 89,500 | ||||||
| Total Securities Lending Collateral | ||||||||
| (Cost $696,688) | 696,688 | |||||||
| Total Investments - 103.0% | ||||||||
| (Cost $14,428,647) | $ | 21,249,410 | ||||||
| Other Assets & Liabilities, net - (3.0)% | (610,386 | ) | ||||||
| Total Net Assets - 100.0% | $ | 20,639,024 | ||||||
| * | Non-income producing security. |
| † | Value determined based on Level 1 inputs — See Note 4. |
| †† | Value determined based on Level 2 inputs — See Note 4. |
| 1 | All or portion of this security is on loan at December 31, 2013 — See Note 8. |
| 2 | Repurchase Agreement — See Note 5. |
| 3 | Securities lending collateral — See Note 8. | |
| ADR — American Depository Receipt | ||
| plc — Public Limited Company |
| SEE NOTES TO FINANCIAL STATEMENTS. | THE RYDEX FUNDS ANNUAL REPORT | 129 |
| TRANSPORTATION FUND |
| STATEMENT OF ASSETS |
| AND LIABILITIES |
December 31, 2013
| Assets: | ||||
| Investments, at value - including $683,810 of securities loaned | ||||
| (cost $13,644,676) | $ | 20,465,439 | ||
| Repurchase agreements, at value | ||||
| (cost $783,971) | 783,971 | |||
| Total investments | ||||
| (cost $14,428,647) | 21,249,410 | |||
| Receivables: | ||||
| Fund shares sold | 121,315 | |||
| Dividends | 15,030 | |||
| Interest and securities lending income | 1,108 | |||
| Total assets | 21,386,863 | |||
| Liabilities: | ||||
| Payable for: | ||||
| Upon return of securities loaned | 696,688 | |||
| Management fees | 14,309 | |||
| Fund shares redeemed | 7,284 | |||
| Transfer agent and administrative fees | 4,209 | |||
| Investor service fees | 4,209 | |||
| Portfolio accounting fees | 1,683 | |||
| Miscellaneous | 19,457 | |||
| Total liabilities | 747,839 | |||
| Net assets | $ | 20,639,024 | ||
| Net assets consist of: | ||||
| Paid in capital | $ | 23,695,966 | ||
| Undistributed net investment income | — | |||
| Accumulated net realized loss on investments | (9,877,705 | ) | ||
| Net unrealized appreciation on investments | 6,820,763 | |||
| Net assets | $ | 20,639,024 | ||
| Capital shares outstanding | 832,830 | |||
| Net asset value per share | $ | 24.78 |
| STATEMENT OF |
| OPERATIONS |
Year Ended December 31, 2013
| Investment Income: | ||||
| Dividends (net of foreign withholding tax of $1,990) | $ | 176,136 | ||
| Income from securities lending, net | 6,449 | |||
| Interest | 19 | |||
| Total investment income | 182,604 | |||
| Expenses: | ||||
| Management fees | 122,421 | |||
| Transfer agent and administrative fees | 36,006 | |||
| Investor service fees | 36,006 | |||
| Portfolio accounting fees | 14,403 | |||
| Professional fees | 12,975 | |||
| Custodian fees | 1,661 | |||
| Trustees’ fees* | 938 | |||
| Line of credit interest expense | 103 | |||
| Miscellaneous | 10,773 | |||
| Total expenses | 235,286 | |||
| Net investment loss | (52,682 | ) | ||
| Net Realized and Unrealized Gain (Loss): | ||||
| Net realized gain (loss) on: | ||||
| Investments | 484,010 | |||
| Net realized gain | 484,010 | |||
| Net change in unrealized appreciation (depreciation) on: | ||||
| Investments | 4,804,603 | |||
| Net change in unrealized appreciation (depreciation) | 4,804,603 | |||
| Net realized and unrealized gain | 5,288,613 | |||
| Net increase in net assets resulting from operations | $ | 5,235,931 |
* Relates to Trustees not deemed “interested persons” within the meaning of Section 2(a)(19) of the 1940 Act.
| 130 | THE RYDEX FUNDS ANNUAL REPORT | SEE NOTES TO FINANCIAL STATEMENTS. |
| TRANSPORTATION FUND |
| STATEMENTS OF CHANGES IN NET ASSETS |
| Year Ended | Year Ended | |||||||
| December 31, | December 31, | |||||||
| 2013 | 2012 | |||||||
| Increase (Decrease) In Net Assets From Operations: | ||||||||
| Net investment loss | $ | (52,682 | ) | $ | (15,925 | ) | ||
| Net realized gain on investments | 484,010 | 522,202 | ||||||
| Net change in unrealized appreciation (depreciation) on investments | 4,804,603 | 300,248 | ||||||
| Net increase in net assets resulting from operations | 5,235,931 | 806,525 | ||||||
| Capital share transactions: | ||||||||
| Proceeds from sale of shares | 51,959,880 | 33,992,011 | ||||||
| Cost of shares redeemed | (43,856,511 | ) | (33,069,006 | ) | ||||
| Net increase from capital share transactions | 8,103,369 | 923,005 | ||||||
| Net increase in net assets | 13,339,300 | 1,729,530 | ||||||
| Net assets: | ||||||||
| Beginning of year | 7,299,724 | 5,570,194 | ||||||
| End of year | $ | 20,639,024 | $ | 7,299,724 | ||||
| Undistributed net investment income at end of year | $ | — | $ | 1 | ||||
| Capital share activity: | ||||||||
| Shares sold | 2,603,391 | 2,251,174 | ||||||
| Shares redeemed | (2,214,360 | ) | (2,205,383 | ) | ||||
| Net increase in shares | 389,031 | 45,791 | ||||||
| SEE NOTES TO FINANCIAL STATEMENTS. | THE RYDEX FUNDS ANNUAL REPORT | 131 |
| TRANSPORTATION FUND |
| FINANCIAL HIGHLIGHTS |
This table is presented to show selected data for a share outstanding throughout each period and to assist shareholders in evaluating a Fund’s performance for the periods presented.
| Year Ended | Year Ended | Year Ended | Year Ended | Year Ended | ||||||||||||||||
| December 31, | December 31, | December 31, | December 31, | December 31, | ||||||||||||||||
| 2013 | 2012 | 2011 | 2010 | 2009 | ||||||||||||||||
| Per Share Data | ||||||||||||||||||||
| Net asset value, beginning of period | $ | 16.45 | $ | 14.00 | $ | 15.74 | $ | 12.68 | $ | 10.91 | ||||||||||
| Income (loss) from investment operations: | ||||||||||||||||||||
| Net investment lossa | (.08 | ) | (.04 | ) | (.10 | ) | (.04 | ) | (.03 | ) | ||||||||||
| Net gain (loss) on investments (realized and unrealized) | 8.41 | 2.49 | (1.64 | ) | 3.10 | 1.92 | ||||||||||||||
| Total from investment operations | 8.33 | 2.45 | (1.74 | ) | 3.06 | 1.89 | ||||||||||||||
| Less distributions from: | ||||||||||||||||||||
| Net investment income | — | — | — | — | (.12 | ) | ||||||||||||||
| Total distributions | — | — | — | — | (.12 | ) | ||||||||||||||
| Net asset value, end of period | $ | 24.78 | $ | 16.45 | $ | 14.00 | $ | 15.74 | $ | 12.68 | ||||||||||
| Total Returnb | 50.64 | % | 17.58 | % | (11.12 | %) | 24.13 | % | 17.39 | % | ||||||||||
| Ratios/Supplemental Data | ||||||||||||||||||||
| Net assets, end of period (in thousands) | $ | 20,639 | $ | 7,300 | $ | 5,570 | $ | 13,090 | $ | 8,462 | ||||||||||
| Ratios to average net assets: | ||||||||||||||||||||
| Net investment loss | (0.37 | %) | (0.29 | %) | (0.65 | %) | (0.32 | %) | (0.29 | %) | ||||||||||
| Total expenses | 1.63 | % | 1.67 | % | 1.71 | % | 1.65 | % | 1.67 | % | ||||||||||
| Portfolio turnover rate | 310 | % | 594 | % | 711 | % | 693 | % | 857 | % | ||||||||||
a Net investment loss per share was computed using average shares outstanding throughout the period.
b Total return does not reflect the impact of any additional fees charged by insurance companies.
| 132 | THE RYDEX FUNDS ANNUAL REPORT | SEE NOTES TO FINANCIAL STATEMENTS. |
This page intentionally left blank.
| THE RYDEX FUNDS ANNUAL REPORT | 133 |
| PERFORMANCE REPORT AND FUND PROFILE (Unaudited) | December 31, 2013 |
OBJECTIVE: Seeks to provide capital appreciation by investing in companies that operate public utilities (“Utilities Companies”).
For the year ended December 31, 2013, Utilities Fund rose 13.63%, compared with a gain of 32.39% for the S&P 500 Index. The S&P 500 Utilities Index returned 13.21%.
The multi-utilities industry was the largest contributor to return, followed by electric utilities. No industry detracted from return, but the water utilities industry contributed least to return.
Dominion Resources, Inc., NextEra Energy, Inc. and ONEOK, Inc. were the best-performing holdings over the one-year period.
FirstEnergy Corp., Enersis S.A. and Dynegy, Inc. were the main detractors.
Performance displayed represents past performance, which is no guarantee of future results.
Holdings Diversification (Market Exposure as % of Net Assets)
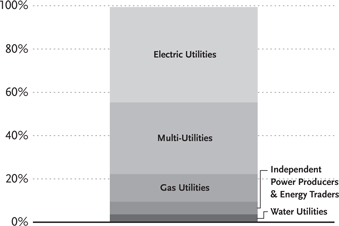
“Holdings Diversification (Market Exposure as % of Net Assets)” excludes any temporary cash investments.
| Inception Date: May 2, 2001 | ||||
| Ten Largest Holdings (% of Total Net Assets) | ||||
| Duke Energy Corp. | 3.8 | % | ||
| NextEra Energy, Inc. | 3.4 | % | ||
| Dominion Resources, Inc. | 3.3 | % | ||
| Southern Co. | 3.3 | % | ||
| Exelon Corp. | 2.7 | % | ||
| American Electric Power Company, Inc. | 2.6 | % | ||
| Sempra Energy | 2.6 | % | ||
| PPL Corp. | 2.4 | % | ||
| PG&E Corp. | 2.3 | % | ||
| Public Service Enterprise Group, Inc. | 2.2 | % | ||
| Top Ten Total | 28.6 | % | ||
“Ten Largest Holdings” exclude any temporary cash or derivative investments.
| 134 | THE RYDEX FUNDS ANNUAL REPORT |
| PERFORMANCE REPORT AND FUND PROFILE (Unaudited) (concluded) |
Cumulative Fund Performance*,†
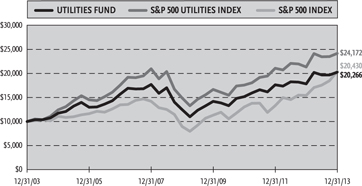
Average Annual Returns
Periods Ended December 31, 2013*,†
| 1 Year | 5 Year | 10 Year | ||||||||||
| Utilities Fund | 13.63 | % | 10.20 | % | 7.32 | % | ||||||
| S&P 500 Utilities Index | 13.21 | % | 10.17 | % | 9.23 | % | ||||||
| S&P 500 Index | 32.39 | % | 17.94 | % | 7.41 | % | ||||||
| * | The performance data above represents past performance that is not predictive of future results. The investment return and principal value of an investment in the Fund will fluctuate so that an investor’s shares, when redeemed, may be worth more or less than their original cost. Returns are historical and include changes in principal and reinvested dividends and capital gains and do not reflect the effect of taxes. The S&P 500 Index and the S&P 500 Utilities Index are unmanaged indices and, unlike the Fund, have no management fees or operating expenses to reduce their reported returns. |
| † | Returns do not reflect the impact of any additional fees charged by insurance companies. |
| THE RYDEX FUNDS ANNUAL REPORT | 135 |
| SCHEDULE OF INVESTMENTS | December 31, 2013 |
| UTILITIES FUND |
| Shares | Value | |||||||
| COMMON STOCKS† - 99.5% | ||||||||
| ELECTRIC UTILITIES - 44.2% | ||||||||
| Duke Energy Corp. | 5,654 | $ | 390,183 | |||||
| NextEra Energy, Inc. | 4,049 | 346,675 | ||||||
| Southern Co. | 8,190 | 336,691 | ||||||
| Exelon Corp. | 9,981 | 273,380 | ||||||
| American Electric Power Company, Inc. | 5,777 | 270,017 | ||||||
| PPL Corp. | 8,225 | 247,490 | ||||||
| Edison International | 4,731 | 219,045 | ||||||
| FirstEnergy Corp. | 6,492 | 214,106 | ||||||
| Xcel Energy, Inc. | 7,434 | 207,706 | ||||||
| Northeast Utilities | 4,882 | 206,948 | ||||||
| Entergy Corp. | 3,014 | 190,696 | ||||||
| OGE Energy Corp. | 4,335 | 146,957 | ||||||
| Pinnacle West Capital Corp. | 2,558 | 135,369 | ||||||
| ITC Holdings Corp. | 1,306 | 125,141 | ||||||
| Pepco Holdings, Inc. | 6,499 | 124,326 | ||||||
| Westar Energy, Inc. | 3,565 | 114,686 | ||||||
| Great Plains Energy, Inc. | 4,491 | 108,862 | ||||||
| Cia Energetica de Minas Gerais ADR | 12,790 | 99,634 | ||||||
| Cleco Corp. | 2,023 | 94,312 | ||||||
| Hawaiian Electric Industries, Inc. | 3,492 | 91,002 | ||||||
| Enersis S.A. ADR | 6,030 | 90,390 | ||||||
| UNS Energy Corp. | 1,479 | 88,518 | ||||||
| IDACORP, Inc. | 1,704 | 88,335 | ||||||
| Portland General Electric Co. | 2,814 | 84,983 | ||||||
| UIL Holdings Corp. | 2,160 | 83,700 | ||||||
| ALLETE, Inc. | 1,610 | 80,307 | ||||||
| PNM Resources, Inc. | 3,220 | 77,666 | ||||||
| Total Electric Utilities | 4,537,125 | |||||||
| MULTI-UTILITIES - 33.1% | ||||||||
| Dominion Resources, Inc. | 5,315 | 343,827 | ||||||
| Sempra Energy | 2,939 | 263,805 | ||||||
| PG&E Corp. | 5,924 | 238,619 | ||||||
| Public Service Enterprise Group, Inc. | 7,117 | 228,029 | ||||||
| Consolidated Edison, Inc. | 4,083 | 225,708 | ||||||
| DTE Energy Co. | 2,924 | 194,124 | ||||||
| NiSource, Inc. | 5,581 | 183,503 | ||||||
| CenterPoint Energy, Inc. | 7,689 | 178,231 | ||||||
| Wisconsin Energy Corp. | 4,129 | 170,693 | ||||||
| Ameren Corp. | 4,595 | 166,155 | ||||||
| CMS Energy Corp. | 5,592 | 149,698 | ||||||
| SCANA Corp. | 3,049 | 143,090 | ||||||
| MDU Resources Group, Inc. | 4,466 | 136,436 | ||||||
| Alliant Energy Corp. | 2,605 | 134,418 | ||||||
| Integrys Energy Group, Inc. | 2,150 | 116,982 | ||||||
| TECO Energy, Inc. | 6,345 | 109,388 | ||||||
| National Grid plc ADR | 1,510 | 98,633 | ||||||
| Vectren Corp. | 2,708 | 96,134 | ||||||
| Black Hills Corp. | 1,639 | 86,064 | ||||||
| Avista Corp. | 2,575 | 72,589 | ||||||
| NorthWestern Corp. | 1,659 | 71,868 | ||||||
| Total Multi-Utilities | 3,407,994 | |||||||
| GAS UTILITIES - 12.8% | ||||||||
| ONEOK, Inc. | 3,320 | 206,437 | ||||||
| National Fuel Gas Co. | 1,941 | 138,587 | ||||||
| AGL Resources, Inc. | 2,831 | 133,708 | ||||||
| UGI Corp. | 3,010 | 124,795 | ||||||
| Atmos Energy Corp. | 2,533 | 115,049 | ||||||
| Questar Corp. | 4,930 | 113,341 | ||||||
| Southwest Gas Corp. | 1,640 | 91,692 | ||||||
| Piedmont Natural Gas Company, Inc. | 2,691 | 89,234 | ||||||
| WGL Holdings, Inc. | 2,077 | 83,205 | ||||||
| New Jersey Resources Corp. | 1,700 | 78,608 | ||||||
| South Jersey Industries, Inc. | 1,370 | 76,665 | ||||||
| Laclede Group, Inc. | 1,510 | 68,765 | ||||||
| Total Gas Utilities | 1,320,086 | |||||||
| INDEPENDENT POWER PRODUCERS & ENERGY TRADERS - 5.8% | ||||||||
| AES Corp. | 12,487 | 181,186 | ||||||
| NRG Energy, Inc. | 6,022 | 172,952 | ||||||
| Calpine Corp.* | 8,401 | 163,904 | ||||||
| Dynegy, Inc.* | 3,820 | 82,206 | ||||||
| Total Independent Power Producers & Energy Traders | 600,248 | |||||||
| WATER UTILITIES - 3.6% | ||||||||
| American Water Works Company, Inc. | 3,611 | 152,601 | ||||||
| Aqua America, Inc. | 4,832 | 113,987 | ||||||
| Cia de Saneamento Basico do Estado | ||||||||
| de Sao Paulo ADR | 8,959 | 101,595 | ||||||
| Total Water Utilities | 368,183 | |||||||
| Total Common Stocks | ||||||||
| (Cost $5,910,154) | 10,233,636 | |||||||
| Face | ||||||||
| Amount | ||||||||
| REPURCHASE AGREEMENT††,1 - 0.6% | ||||||||
| Credit Suisse Group | ||||||||
| issued 12/31/13 at 0.00% | ||||||||
| due 01/02/14 | $ | 57,625 | 57,625 | |||||
| Total Repurchase Agreement | ||||||||
| (Cost $57,625) | 57,625 | |||||||
| Total Investments - 100.1% | ||||||||
| (Cost $5,967,779) | $ | 10,291,261 | ||||||
| Other Assets & Liabilities, net - (0.1)% | (8,893 | ) | ||||||
| Total Net Assets - 100.0% | $ | 10,282,368 | ||||||
| * | Non-income producing security. |
| † | Value determined based on Level 1 inputs — See Note 4. |
| †† | Value determined based on Level 2 inputs — See Note 4. |
| 1 | Repurchase Agreement — See Note 5. | |
| ADR — American Depository Receipt | ||
| plc — Public Limited Company |
| 136 | THE RYDEX FUNDS ANNUAL REPORT | SEE NOTES TO FINANCIAL STATEMENTS. |
| UTILITIES FUND |
| STATEMENT OF ASSETS |
| AND LIABILITIES |
December 31, 2013
| Assets: | ||||
| Investments, at value | ||||
| (cost $5,910,154) | $ | 10,233,636 | ||
| Repurchase agreements, at value | ||||
| (cost $57,625) | 57,625 | |||
| Total investments | ||||
| (cost $5,967,779) | 10,291,261 | |||
| Receivables: | ||||
| Fund shares sold | 258,598 | |||
| Dividends | 24,174 | |||
| Total assets | 10,574,033 | |||
| Liabilities: | ||||
| Payable for: | ||||
| Securities purchased | 257,335 | |||
| Management fees | 7,253 | |||
| Transfer agent and administrative fees | 2,133 | |||
| Investor service fees | 2,133 | |||
| Portfolio accounting fees | 853 | |||
| Fund shares redeemed | 150 | |||
| Miscellaneous | 21,808 | |||
| Total liabilities | 291,665 | |||
| Net assets | $ | 10,282,368 | ||
| Net assets consist of: | ||||
| Paid in capital | $ | 7,687,590 | ||
| Undistributed net investment income | 307,433 | |||
| Accumulated net realized loss on investments | (2,036,137 | ) | ||
| Net unrealized appreciation on investments | 4,323,482 | |||
| Net assets | $ | 10,282,368 | ||
| Capital shares outstanding | 492,155 | |||
| Net asset value per share | $ | 20.89 |
| STATEMENT OF |
| OPERATIONS |
Year Ended December 31, 2013
| Investment Income: | ||||
| Dividends | $ | 553,385 | ||
| Interest | 19 | |||
| Income from securities lending, net | 18 | |||
| Total investment income | 553,422 | |||
| Expenses: | ||||
| Management fees | 127,290 | |||
| Transfer agent and administrative fees | 37,438 | |||
| Investor service fees | 37,438 | |||
| Portfolio accounting fees | 14,975 | |||
| Professional fees | 13,336 | |||
| Trustees’ fees* | 2,002 | |||
| Custodian fees | 1,705 | |||
| Line of credit interest expense | 308 | |||
| Miscellaneous | 11,498 | |||
| Total expenses | 245,990 | |||
| Net investment income | 307,432 | |||
| Net Realized and Unrealized Gain (Loss): | ||||
| Net realized gain (loss) on: | ||||
| Investments | 2,653,830 | |||
| Net realized gain | 2,653,830 | |||
| Net change in unrealized appreciation (depreciation) on: | ||||
| Investments | (1,112,564 | ) | ||
| Net change in unrealized appreciation (depreciation) | (1,112,564 | ) | ||
| Net realized and unrealized gain | 1,541,266 | |||
| Net increase in net assets resulting from operations | $ | 1,848,698 |
* Relates to Trustees not deemed “interested persons” within the meaning of Section 2(a)(19) of the 1940 Act.
| SEE NOTES TO FINANCIAL STATEMENTS. | THE RYDEX FUNDS ANNUAL REPORT | 137 |
| UTILITIES FUND |
| STATEMENTS OF CHANGES IN NET ASSETS |
| Year Ended | Year Ended | |||||||
| December 31, | December 31, | |||||||
| 2013 | 2012 | |||||||
| Increase (Decrease) In Net Assets From Operations: | ||||||||
| Net investment income | $ | 307,432 | $ | 429,516 | ||||
| Net realized gain on investments | 2,653,830 | 692,692 | ||||||
| Net change in unrealized appreciation (depreciation) on investments | (1,112,564 | ) | (1,278,394 | ) | ||||
| Net increase (decrease) in net assets resulting from operations | 1,848,698 | (156,186 | ) | |||||
| Distributions to shareholders from: | ||||||||
| Net investment income | (429,515 | ) | (459,947 | ) | ||||
| Total distributions to shareholders | (429,515 | ) | (459,947 | ) | ||||
| Capital share transactions: | ||||||||
| Proceeds from sale of shares | 76,484,484 | 75,196,227 | ||||||
| Distributions reinvested | 429,515 | 459,947 | ||||||
| Cost of shares redeemed | (83,724,602 | ) | (91,024,832 | ) | ||||
| Net decrease from capital share transactions | (6,810,603 | ) | (15,368,658 | ) | ||||
| Net decrease in net assets | (5,391,420 | ) | (15,984,791 | ) | ||||
| Net assets: | ||||||||
| Beginning of year | 15,673,788 | 31,658,579 | ||||||
| End of year | $ | 10,282,368 | $ | 15,673,788 | ||||
| Undistributed net investment income at end of year | $ | 307,433 | $ | 429,516 | ||||
| Capital share activity: | ||||||||
| Shares sold | 3,596,412 | 3,813,322 | ||||||
| Shares issued from reinvestment of distributions | 20,395 | 24,822 | ||||||
| Shares redeemed | (3,944,119 | ) | (4,641,914 | ) | ||||
| Net decrease in shares | (327,312 | ) | (803,770 | ) | ||||
| 138 | THE RYDEX FUNDS ANNUAL REPORT | SEE NOTES TO FINANCIAL STATEMENTS. |
| UTILITIES FUND |
| FINANCIAL HIGHLIGHTS |
This table is presented to show selected data for a share outstanding throughout each period and to assist shareholders in evaluating a Fund’s performance for the periods presented.
| Year Ended | Year Ended | Year Ended | Year Ended | Year Ended | ||||||||||||||||
| December 31, | December 31, | December 31, | December 31, | December 31, | ||||||||||||||||
| 2013 | 2012 | 2011 | 2010 | 2009 | ||||||||||||||||
| Per Share Data | ||||||||||||||||||||
| Net asset value, beginning of period | $ | 19.13 | $ | 19.50 | $ | 17.04 | $ | 16.41 | $ | 15.41 | ||||||||||
| Income (loss) from investment operations: | ||||||||||||||||||||
| Net investment incomea | .43 | .42 | .43 | .41 | .41 | |||||||||||||||
| Net gain (loss) on investments (realized and unrealized) | 2.18 | (.22 | ) | 2.33 | .72 | 1.65 | ||||||||||||||
| Total from investment operations | 2.61 | .20 | 2.76 | 1.13 | 2.06 | |||||||||||||||
| Less distributions from: | ||||||||||||||||||||
| Net investment income | (.85 | ) | (.57 | ) | (.30 | ) | (.50 | ) | (1.06 | ) | ||||||||||
| Total distributions | (.85 | ) | (.57 | ) | (.30 | ) | (.50 | ) | (1.06 | ) | ||||||||||
| Net asset value, end of period | $ | 20.89 | $ | 19.13 | $ | 19.50 | $ | 17.04 | $ | 16.41 | ||||||||||
| Total Returnb | 13.63 | % | 1.12 | % | 16.29 | % | 6.88 | % | 13.80 | % | ||||||||||
| Ratios/Supplemental Data | ||||||||||||||||||||
| Net assets, end of period (in thousands) | $ | 10,282 | $ | 15,674 | $ | 31,659 | $ | 15,421 | $ | 15,814 | ||||||||||
| Ratios to average net assets: | ||||||||||||||||||||
| Net investment income | 2.05 | % | 2.16 | % | 2.36 | % | 2.48 | % | 2.69 | % | ||||||||||
| Total expenses | 1.64 | % | 1.67 | % | 1.69 | % | 1.66 | % | 1.67 | % | ||||||||||
| Portfolio turnover rate | 464 | % | 302 | % | 369 | % | 561 | % | 309 | % | ||||||||||
| a | Net investment income per share was computed using average shares outstanding throughout the period. |
| b | Total return does not reflect the impact of any additional fees charged by insurance companies. |
| SEE NOTES TO FINANCIAL STATEMENTS. | THE RYDEX FUNDS ANNUAL REPORT | 139 |
| NOTES TO FINANCIAL STATEMENTS |
| 1. | Organization and Significant Accounting Policies Organization |
The Rydex Variable Trust (the “Trust”), a Delaware business trust, is registered with the SEC under the Investment Company Act of 1940 (“1940 Act”) as a non-diversified, open-ended investment company and is authorized to issue an unlimited number of no par value shares. The Trust offers shares of the funds to insurance companies for their variable annuity and variable life insurance contracts.
At December 31, 2013, the Trust consisted of fifty-one separate funds. This report covers the Sector Funds (the “Funds”), while the other funds are contained in separate reports.
Guggenheim Investments (“GI”) provides advisory services and Rydex Fund Services, LLC (“RFS”) provides transfer agent, administrative and accounting services to the Trust. Guggenheim Distributors, LLC (“GDL”) acts as principal underwriter for the Trust. GI, RFS and GDL are affiliated entities.
The Funds invest in specific industry sectors. To the extent that investments are concentrated in a single sector, the Funds are subject to legislative or regulatory changes, adverse market conditions and/or increased competition affecting such sector.
The Funds seek capital appreciation and invest substantially all of their assets in equity securities of companies involved in their sector.
The Funds are designed and operated to accommodate frequent trading by shareholders and, unlike most mutual funds, offer unlimited exchange privileges with no minimum holding periods or transactions fees, which may cause the Funds to experience high portfolio turnover.
Significant Accounting Policies
The following significant accounting policies are in conformity with U.S. generally accepted accounting principles (“U.S. GAAP”) and are consistently followed by the Trust. This requires management to make estimates and assumptions that affect the reported amount of assets and liabilities and disclosure of contingent assets and liabilities at the date of the financial statements and the reported amounts of revenues and expenses during the reporting period. Actual results could differ from these estimates. All time references are based on Eastern Time.
A. Equity securities listed on an exchange (New York Stock Exchange (“NYSE”) or American Stock Exchange) are valued at the last quoted sales price as of the close of business on the NYSE, usually 4:00 p.m. on the valuation date. Equity securities listed on the NASDAQ market system are valued at the NASDAQ Official Closing Price on the valuation date.
Repurchase agreements are valued at amortized cost, which approximates market value.
Investments for which market quotations are not readily available are fair valued as determined in good faith by GI under the direction of the Board of Trustees using methods established or ratified by the Board of Trustees. These methods include, but are not limited to: (i) obtaining general information as to how these securities and assets trade; and (ii) obtaining other information and considerations, including current values in related markets.
B. Security transactions are recorded on the trade date for financial reporting purposes. Realized gains and losses from securities transactions are recorded using the identified cost basis. Proceeds from lawsuits related to investment holdings are recorded as realized gains in the respective Fund. Dividend income is recorded on the ex-dividend date, net of applicable taxes withheld by foreign countries. Taxable non-cash dividends are recorded as dividend income. Interest income, including amortization of premiums and accretion of discounts, is accrued on a daily basis. Distributions received from investments in REITs are recorded as dividend income on the ex-dividend date, subject to reclassification upon notice of the character of such distribution by the issuer.
C. Investment securities and other assets and liabilities denominated in foreign currencies are translated into U.S. dollar amounts at the date of valuation. Purchases and sales of investment securities and income and expense items denominated in foreign currencies are translated into U.S. dollar amounts on the respective dates of such transactions. The Trust does not isolate that portion of the results of operations resulting from changes in foreign exchange rates on investments from the fluctuations arising from changes in market prices of securities held. Such fluctuations are included with the net realized and unrealized gain and loss from investments.
Reported net realized foreign exchange gains or losses arise from sales of foreign currencies and currency gains or losses realized between the trade and settlement dates on investment transactions. Net unrealized exchange gains and losses arise from changes in the fair values of assets and liabilities other than investments in securities at the fiscal period end, resulting from changes in exchange rates.
D. Distributions of net investment income and net realized gains, if any, are declared and paid at least annually. Distributions are recorded on the ex-dividend date and are determined in accordance with income tax regulations which may differ from U.S. GAAP.
| 140 | THE RYDEX FUNDS ANNUAL REPORT |
| NOTES TO FINANCIAL STATEMENTS (continued) |
E. The Funds may leave cash overnight in their cash account with the custodian, U.S. Bank. Periodically, a Fund may have cash due to the custodian bank as an overdraft balance. A fee is incurred on this overdraft, calculated by multiplying the overdraft by a rate based on the federal funds rate.
F. Throughout the normal course of business, the Funds enter into contracts that contain a variety of representations and warranties which provide general indemnifications. The Funds’ maximum exposure under these arrangements is unknown, as this would involve future claims that may be made against the Funds and/or their affiliates that have not yet occurred. However, based on experience, the Funds expect the risk of loss to be remote.
2. Fees and Other Transactions with Affiliates
Under the terms of an investment advisory contract, the Trust pays GI investment advisory fees calculated at the annualized rates below, based on the average daily net assets of the Funds.
| Management Fees | ||||
| Fund | (as a % of Net Assets) | |||
| Banking Fund | 0.85 | % | ||
| Basic Materials Fund | 0.85 | % | ||
| Biotechnology Fund | 0.85 | % | ||
| Consumer Products Fund | 0.85 | % | ||
| Electronics Fund | 0.85 | % | ||
| Energy Fund | 0.85 | % | ||
| Energy Services Fund | 0.85 | % | ||
| Financial Services Fund | 0.85 | % | ||
| Health Care Fund | 0.85 | % | ||
| Internet Fund | 0.85 | % | ||
| Leisure Fund | 0.85 | % | ||
| Precious Metals Fund | 0.75 | % | ||
| Real Estate Fund | 0.85 | % | ||
| Retailing Fund | 0.85 | % | ||
| Technology Fund | 0.85 | % | ||
| Telecommunications Fund | 0.85 | % | ||
| Transportation Fund | 0.85 | % | ||
| Utilities Fund | 0.85 | % | ||
RFS provides transfer agent and administrative services to the Funds calculated at an annual percentage rate of 0.25% of the average daily net assets of each Fund.
RFS also provides accounting services to the Funds for fees calculated at annualized rates below, based on the average daily net assets of each Fund.
| Fund Accounting Fees | (as a % of net assets) | |||
| On the first $250 million | 0.10 | % | ||
| On the next $250 million | 0.075 | % | ||
| On the next $250 million | 0.05 | % | ||
| Over $750 million | 0.03 | % | ||
RFS engages external service providers to perform other necessary services for the Trust, such as audit and accounting related services, legal services, custody, printing and mailing, etc., on a pass-through basis. Such expenses are allocated to various Funds within the complex based on relative net assets.
The Trust has adopted an Investor Services Plan for which GDL and other firms that provide investor services (“Service Providers”) may receive compensation. The Funds will pay investor service fees to GDL at an annual rate not to exceed 0.25% of average daily net assets. GDL, in turn, will compensate Service Providers for providing such services, while retaining a portion of such payments to compensate itself for investor services it performs.
Certain officers and trustees of the Trust are also officers of GI, RFS and GDL.
3. Federal Income Tax Information
The Funds intend to comply with the provisions of Subchapter M of the Internal Revenue Code applicable to regulated investment companies and distribute substantially all taxable net investment income and capital gains sufficient to relieve the Funds from all, or substantially all, federal income, excise and state income taxes. Therefore, no provision for federal or state income tax is required.
Tax positions taken or expected to be taken in the course of preparing the Funds’ tax returns are evaluated to determine whether the tax positions are “more-likely-than-not” of being sustained by the applicable tax authority. Tax positions not deemed to meet the more-likely-than-not threshold would be recorded as a tax benefit or expense in the current year. Management has analyzed the Funds’ tax positions taken, or to be taken, on Federal income tax returns for all open tax years, and has concluded that no provision for income tax is required in the Funds’ financial statements. A Fund’s federal tax returns are subject to examination by the Internal Revenue Service for a period of three fiscal years after they are filed.
The RIC Modernization Act of 2010 was signed into law on December 22, 2010 and seeks to simplify some of the tax provisions applicable to regulated investment companies, the tax reporting to their shareholders and to improve the tax efficiency of certain fund structures. The greatest impact to the disclosure in the financial reports for the Funds was on the treatment of net capital losses, effective for tax years beginning after December 22, 2010.
| THE RYDEX FUNDS ANNUAL REPORT | 141 |
| NOTES TO FINANCIAL STATEMENTS (continued) |
One of the more prominent changes addresses capital loss carryforwards. Funds are permitted to carry forward capital losses incurred in taxable years beginning after December 22, 2010 for an unlimited period. However, any losses incurred during those future taxable years will be required to be utilized prior to the losses incurred in pre-enactment taxable years. Under pre-enactment law, capital losses could be carried forward for eight years, and carried forward as short-term capital, irrespective of the character of the original loss. As a result of this ordering rule, pre-enactment capital carryforwards may potentially expire unused. Additionally, post-enactment capital losses that are carried forward will retain their character as either short-term or long-term capital losses rather than being considered all short-term as under previous law.
Tax basis capital losses in excess of capital gains are carried forward to offset future net capital gains. For the year ended December 31, 2013, the following capital loss carryforward amounts expired, were used, or were permanently lost due to loss limitation rules in Section 382 of the Internal Revenue Code:
| Fund | Amount | |||
| Banking Fund | $ | 75,090 | ||
| Biotechnology Fund | 4,023,563 | |||
| Consumer Products Fund | 351,104 | |||
| Electronics Fund | 978,224 | |||
| Financial Services Fund | 1,038,474 | |||
| Health Care Fund | 4,305,507 | |||
| Leisure Fund | 395,086 | |||
| Real Estate Fund | 1,658,972 | |||
| Technology Fund | 945,536 | |||
| Transportation Fund | 923,316 | |||
| Utilities Fund | 1,664,172 | |||
The tax character of distributions paid during the year ended December 31, 2013 was as follows:
| Ordinary | Long-Term | Total | ||||||||||
| Fund | Income | Capital Gain | Distributions | |||||||||
| Banking Fund | $ | 880,430 | $ | — | $ | 880,430 | ||||||
| Basic Materials Fund | 92,149 | 624,095 | 716,244 | |||||||||
| Consumer Products Fund | 200,161 | — | 200,161 | |||||||||
| Electronics Fund | 7,978 | — | 7,978 | |||||||||
| Energy Fund | 45,288 | 322,147 | 367,435 | |||||||||
| Energy Services Fund | — | 611,941 | 611,941 | |||||||||
| Financial Services Fund | 56,822 | — | 56,822 | |||||||||
| Health Care Fund | 44,395 | — | 44,395 | |||||||||
| Internet Fund | — | 272,581 | 272,581 | |||||||||
| Leisure Fund | 78,415 | — | 78,415 | |||||||||
| Precious Metals Fund | 302,070 | — | 302,070 | |||||||||
| Real Estate Fund | 363,786 | — | 363,786 | |||||||||
| Retailing Fund | 228,248 | 668,600 | 896,848 | |||||||||
| Telecommunications Fund | 55,157 | — | 55,157 | |||||||||
| Utilities Fund | 429,515 | — | 429,515 | |||||||||
| 142 | THE RYDEX FUNDS ANNUAL REPORT |
| NOTES TO FINANCIAL STATEMENTS (continued) |
The tax character of distributions paid during the year ended December 31, 2012 was as follows:
| Ordinary | Long-Term | Total | ||||||||||
| Fund | Income | Capital Gain | Distributions | |||||||||
| Banking Fund | $ | 21,221 | $ | 8,644 | $ | 29,865 | ||||||
| Basic Materials Fund | 567,991 | 785,307 | 1,353,298 | |||||||||
| Consumer Products Fund | 186,253 | — | 186,253 | |||||||||
| Energy Fund | 773,036 | 2,635,811 | 3,408,847 | |||||||||
| Energy Services Fund | 47,149 | 2,568,873 | 2,616,022 | |||||||||
| Financial Services Fund | 18,017 | — | 18,017 | |||||||||
| Internet Fund | — | 1,259,155 | 1,259,155 | |||||||||
| Precious Metals Fund | — | 5,322,508 | 5,322,508 | |||||||||
| Real Estate Fund | 291,537 | — | 291,537 | |||||||||
| Technology Fund | — | 1,504,762 | 1,504,762 | |||||||||
| Telecommunications Fund | 63,032 | — | 63,032 | |||||||||
| Utilities Fund | 459,947 | — | 459,947 | |||||||||
Note: For federal income tax purposes, short-term capital gain distributions are treated as ordinary income distributions.
The tax character of distributable earnings/(accumulated losses) at December 31, 2013 was as follows:
| Undistributed | Undistributed | Net Unrealized | ||||||||||||||
| Ordinary | Long-Term | Appreciation/ | Capital Loss | |||||||||||||
| Fund | Income | Capital Gain | Depreciation | Carryforward1 | ||||||||||||
| Banking Fund | $ | 644,113 | $ | 168,959 | $ | 835,761 | $ | (1,563,261 | ) | |||||||
| Basic Materials Fund | 50,739 | 744,999 | 2,719,838 | — | ||||||||||||
| Biotechnology Fund | — | — | 11,806,891 | (4,473,498 | ) | |||||||||||
| Consumer Products Fund | 123,887 | 1,472,799 | 5,233,443 | — | ||||||||||||
| Electronics Fund | — | — | 618,567 | (2,127,542 | ) | |||||||||||
| Energy Fund | 324,906 | 2,986,723 | 8,813,425 | — | ||||||||||||
| Energy Services Fund | — | 1,809,161 | 7,136,773 | — | ||||||||||||
| Financial Services Fund | 61,717 | — | 1,040,084 | (5,050,843 | ) | |||||||||||
| Health Care Fund | 221,508 | 1,277,797 | 8,674,877 | (2,254,160 | ) | |||||||||||
| Internet Fund | 460,364 | 286,377 | 4,277,495 | — | ||||||||||||
| Leisure Fund | 76,275 | 843,583 | 4,566,607 | (837,964 | ) | |||||||||||
| Precious Metals Fund | 33,577 | — | (8,087,588 | ) | (1,941,376 | ) | ||||||||||
| Real Estate Fund | 335,611 | — | 1,648,428 | (7,507,809 | ) | |||||||||||
| Retailing Fund | — | 554,283 | 3,240,076 | — | ||||||||||||
| Technology Fund | — | — | 4,504,498 | (147,828 | ) | |||||||||||
| Telecommunications Fund | 54,273 | — | 101,219 | (1,834,656 | ) | |||||||||||
| Transportation Fund | — | — | 5,450,904 | (8,507,846 | ) | |||||||||||
| Utilities Fund | 307,432 | — | 2,598,552 | (311,206 | ) | |||||||||||
| THE RYDEX FUNDS ANNUAL REPORT | 143 |
| NOTES TO FINANCIAL STATEMENTS (continued) |
1A summary of the expiration of the aforementioned Capital Loss Carryforward is as follows:
| Total | ||||||||||||||||||||||||||||||||
| Expires in | Expires in | Expires in | Expires in | Expires in | Unlimited | Capital Loss | ||||||||||||||||||||||||||
| Fund | 2014 | 2015 | 2016 | 2017 | 2018 | Short-Term | Long-Term | Carryforward | ||||||||||||||||||||||||
| Banking Fund | $ | — | $ | — | $ | — | $ | — | $ | — | $ | (1,563,261 | ) | $ | — | $ | (1,563,261 | )* | ||||||||||||||
| Biotechnology Fund | — | — | — | (4,357,013 | ) | (116,485 | ) | — | — | (4,473,498 | ) | |||||||||||||||||||||
| Electronics Fund | (329,594 | ) | (329,594 | ) | (329,594 | ) | (67,626 | ) | (591,562 | ) | (479,572 | ) | — | (2,127,542 | )* | |||||||||||||||||
| Financial Services Fund | — | — | (2,323,999 | ) | (2,453,589 | ) | (273,255 | ) | — | — | (5,050,843 | ) | ||||||||||||||||||||
| Health Care Fund | — | — | (791,206 | ) | (1,462,954 | ) | — | — | — | (2,254,160 | )* | |||||||||||||||||||||
| Leisure Fund | — | — | (837,964 | ) | — | — | — | — | (837,964 | )* | ||||||||||||||||||||||
| Precious Metals | — | — | — | — | — | (1,712,662 | ) | (228,714 | ) | (1,941,376 | ) | |||||||||||||||||||||
| Real Estate Fund | — | — | (710,911 | ) | (6,796,898 | ) | — | — | — | (7,507,809 | ) | |||||||||||||||||||||
| Technology Fund | — | — | (147,828 | ) | — | — | — | — | (147,828 | ) | ||||||||||||||||||||||
| Telecommunications Fund | — | — | (501,247 | ) | (1,059,529 | ) | — | (47,773 | ) | (226,107 | ) | (1,834,656 | )* | |||||||||||||||||||
| Transportation Fund | — | — | — | (7,387,779 | ) | (1,120,067 | ) | — | — | (8,507,846 | ) | |||||||||||||||||||||
| Utilities Fund | — | — | — | (311,206 | ) | — | — | — | (311,206 | ) | ||||||||||||||||||||||
*In accordance with section 382 of the Internal Revenue Code, a portion of certain fund losses are subject to an annual limitation. Note, this annual limitation is generally applicable to all of the capital loss carryforwards shown with respect to each Fund.
Net investment income and net realized gains (losses) may differ for financial statement and tax purposes because of temporary or permanent book/tax differences. These differences are primarily due to wash sales, mark-to-market of passive foreign investment companies and foreign currency gains and losses. Additional differences may result from the tax treatment of net investment losses and expired capital loss carry-forwards. To the extent these differences are permanent, reclassifications are made to the appropriate equity accounts in the period that the differences arise. These reclassifications have no effect on net assets or NAV per share.
On the Statements of Assets and Liabilities the following adjustments were made for permanent book/tax differences:
| Undistributed | Accumulated | |||||||||||
| Paid In | Net Investment | Net Realized | ||||||||||
| Fund | Capital | Income | Gain (Loss) | |||||||||
| Banking Fund | $ | — | $ | 17,780 | $ | (17,780 | ) | |||||
| Basic Materials Fund | — | (1,808 | ) | 1,808 | ||||||||
| Biotechnology Fund | (318,906 | ) | 326,846 | (7,940 | ) | |||||||
| Consumer Products Fund | (1 | ) | (4 | ) | 5 | |||||||
| Electronics Fund | (490,368 | ) | (416 | ) | 490,784 | |||||||
| Energy Fund | — | (7,976 | ) | 7,976 | ||||||||
| Energy Services Fund | (64,187 | ) | 63,094 | 1,093 | ||||||||
| Financial Services Fund | (2,688 | ) | (13,880 | ) | 16,568 | |||||||
| Health Care Fund | (3,537,831 | ) | 80,298 | 3,457,533 | ||||||||
| Internet Fund | — | 96,605 | (96,605 | ) | ||||||||
| Leisure Fund | (498 | ) | (2,039 | ) | 2,537 | |||||||
| Precious Metals Fund | — | 261,746 | (261,746 | ) | ||||||||
| Real Estate Fund | (142,321 | ) | 84,538 | 57,783 | ||||||||
| Retailing Fund | (36,446 | ) | 36,442 | 4 | ||||||||
| Technology Fund | (37,799 | ) | 30,921 | 6,878 | ||||||||
| Telecommunications Fund | — | (439 | ) | 439 | ||||||||
| Transportation Fund | (52,754 | ) | 52,681 | 73 | ||||||||
| 144 | THE RYDEX FUNDS ANNUAL REPORT |
| NOTES TO FINANCIAL STATEMENTS (continued) |
At December 31, 2013, the cost of securities for Federal income tax purposes, the aggregate gross unrealized gain for all securities for which there was an excess of value over tax cost and the aggregate gross unrealized loss for all securities for which there was an excess of tax cost over value, were as follows:
| Tax | Tax | Net | ||||||||||||||
| Tax | Unrealized | Unrealized | Unrealized | |||||||||||||
| Fund | Cost | Gain | Loss | Gain (Loss) | ||||||||||||
| Banking Fund | $ | 5,169,267 | $ | 845,639 | $ | (9,878 | ) | $ | 835,761 | |||||||
| Basic Materials Fund | 9,051,025 | 2,826,164 | (106,326 | ) | 2,719,838 | |||||||||||
| Biotechnology Fund | 16,358,849 | 12,057,000 | (250,109 | ) | 11,806,891 | |||||||||||
| Consumer Products Fund | 10,366,769 | 5,242,364 | (8,921 | ) | 5,233,443 | |||||||||||
| Electronics Fund | 2,683,571 | 620,634 | (2,067 | ) | 618,567 | |||||||||||
| Energy Fund | 13,441,012 | 8,935,177 | (121,752 | ) | 8,813,425 | |||||||||||
| Energy Services Fund | 9,009,329 | 7,152,187 | (15,414 | ) | 7,136,773 | |||||||||||
| Financial Services Fund | 7,880,398 | 1,086,843 | (46,759 | ) | 1,040,084 | |||||||||||
| Health Care Fund | 22,066,321 | 8,878,967 | (204,090 | ) | 8,674,877 | |||||||||||
| Internet Fund | 11,660,721 | 4,324,626 | (47,131 | ) | 4,277,495 | |||||||||||
| Leisure Fund | 7,283,076 | 4,567,961 | (1,354 | ) | 4,566,607 | |||||||||||
| Precious Metals Fund | 31,224,124 | — | (8,087,600 | ) | (8,087,600 | ) | ||||||||||
| Real Estate Fund | 13,109,735 | 1,786,315 | (137,887 | ) | 1,648,428 | |||||||||||
| Retailing Fund | 6,371,392 | 3,243,765 | (3,689 | ) | 3,240,076 | |||||||||||
| Technology Fund | 10,387,443 | 4,536,996 | (32,498 | ) | 4,504,498 | |||||||||||
| Telecommunications Fund | 2,177,445 | 103,343 | (2,124 | ) | 101,219 | |||||||||||
| Transportation Fund | 15,798,506 | 5,484,884 | (33,980 | ) | 5,450,904 | |||||||||||
| Utilities Fund | 7,692,709 | 2,608,281 | (9,729 | ) | 2,598,552 | |||||||||||
| 4. | Fair Value Measurement |
In accordance with U.S. GAAP, fair value is defined as the price that the Fund would receive to sell an investment or pay to transfer a liability in an orderly transaction with an independent buyer in the principal market, or in the absence of a principal market the most advantageous market for the investment or liability. A three-tier hierarchy is utilized to distinguish between (1) inputs that reflect the assumptions market participants would use in pricing an asset or liability developed based on market data obtained from sources independent of the reporting entity (observable inputs) and (2) inputs that reflect the reporting entity’s own assumptions about the assumptions market participants would use in pricing an asset or liability developed based on the best information available in the circumstances (unobservable inputs) and to establish classification of fair value measurements for disclosure purposes. Various inputs are used in determining the value of the Funds’ investments. The inputs are summarized in the three broad levels listed below:
Level 1 — quoted prices in active markets for identical securities.
Level 2 — other significant observable inputs (including quoted prices for similar securities, interest rates, prepayment speeds, credit risk, etc.).
Level 3 — significant unobservable inputs (including the fund’s own assumptions used to determine the fair value of investments).
The inputs or methodologies used for valuing securities are not necessarily an indication of the risk associated with investing in those securities.
| THE RYDEX FUNDS ANNUAL REPORT | 145 |
| NOTES TO FINANCIAL STATEMENTS (continued) |
The following table summarizes the inputs used to value the Funds’ net assets at December 31, 2013:
| Level 1 | Level 2 | Level 3 | ||||||||||||||
| Investments | Investments | Investments | ||||||||||||||
| In Securities | In Securities | In Securities | Total | |||||||||||||
| Assets | ||||||||||||||||
| Banking Fund | $ | 5,953,720 | $ | 51,308 | $ | — | $ | 6,005,028 | ||||||||
| Basic Materials Fund | 11,524,479 | 246,384 | — | 11,770,863 | ||||||||||||
| Biotechnology Fund | 26,660,290 | 1,505,450 | — | 28,165,740 | ||||||||||||
| Consumer Products Fund | 15,470,563 | 129,649 | — | 15,600,212 | ||||||||||||
| Electronics Fund | 3,248,308 | 53,830 | — | 3,302,138 | ||||||||||||
| Energy Fund | 21,937,737 | 316,700 | — | 22,254,437 | ||||||||||||
| Energy Services Fund | 16,031,536 | 114,566 | — | 16,146,102 | ||||||||||||
| Financial Services Fund | 8,898,666 | 21,816 | — | 8,920,482 | ||||||||||||
| Health Care Fund | 30,150,964 | 590,234 | — | 30,741,198 | ||||||||||||
| Internet Fund | 15,457,724 | 480,492 | — | 15,938,216 | ||||||||||||
| Leisure Fund | 11,772,872 | 76,811 | — | 11,849,683 | ||||||||||||
| Precious Metals Fund | 22,445,505 | 691,019 | — | 23,136,524 | ||||||||||||
| Real Estate Fund | 14,696,029 | 62,134 | — | 14,758,163 | ||||||||||||
| Retailing Fund | 9,427,303 | 184,165 | — | 9,611,468 | ||||||||||||
| Technology Fund | 14,652,673 | 239,268 | — | 14,891,941 | ||||||||||||
| Telecommunications Fund | 2,184,573 | 94,091 | — | 2,278,664 | ||||||||||||
| Transportation Fund | 20,465,439 | 783,971 | — | 21,249,410 | ||||||||||||
| Utilities Fund | 10,233,636 | 57,625 | — | 10,291,261 | ||||||||||||
For the year ended December 31, 2013, there were no transfers between levels.
| 5. | Repurchase Agreements |
The Funds transfer uninvested cash balances into a single joint account, the daily aggregate balance of which is invested in one or more repurchase agreements collateralized by obligations of the U.S. Treasury and U.S. Government Agencies. The collateral is in the possession of the Funds’ custodian and is evaluated to ensure that its market value exceeds, at a minimum, 102% of the original face amount of the repurchase agreements. Each Fund holds a pro rata share of the collateral based on the dollar amount of the repurchase agreement entered into by each Fund.
At December 31, 2013, the repurchase agreements in the joint account were as follows:
| Counterparty and | Repurchase | |||||||||||||||||
| Terms of Agreement | Face Value | Price | Collateral | Par Value | Fair Value | |||||||||||||
| Credit Suisse Group | U.S. Treasury Note | |||||||||||||||||
| 0.00% | 2.13% | |||||||||||||||||
| Due 01/02/14 | $ | 19,614,479 | $ | 19,614,479 | 12/31/15 | $ | 19,342,400 | $ | 20,006,786 | |||||||||
In the event of counterparty default, the Funds have the right to collect the collateral to offset losses incurred. There is potential loss to the Funds in the event the Funds are delayed or prevented from exercising their rights to dispose of the collateral securities, including the risk of a possible decline in the value of the underlying securities during the period while the Funds seek to assert their rights. The Funds’ investment advisor, acting under the supervision of the Board of Trustees, reviews the value of the collateral and the creditworthiness of those banks and dealers with which the Funds enter into repurchase agreements to evaluate potential risks.
| 146 | THE RYDEX FUNDS ANNUAL REPORT |
| NOTES TO FINANCIAL STATEMENTS (continued) |
6. Securities Transactions
For the year ended December 31, 2013, the cost of purchases and proceeds from sales of investment securities, excluding government securities and short-term investments, were as follows:
| Fund | Purchases | Sales | ||||||
| Banking Fund | $ | 32,561,562 | $ | 38,908,783 | ||||
| Basic Materials Fund | 45,463,352 | 49,906,185 | ||||||
| Biotechnology Fund | 71,049,219 | 73,566,485 | ||||||
| Consumer Products Fund | 74,036,950 | 77,976,177 | ||||||
| Electronics Fund | 25,447,872 | 27,031,348 | ||||||
| Energy Fund | 42,861,462 | 47,425,246 | ||||||
| Energy Services Fund | 39,733,194 | 40,920,199 | ||||||
| Financial Services Fund | 45,621,296 | 49,446,556 | ||||||
| Health Care Fund | 69,595,442 | 65,283,358 | ||||||
| Internet Fund | 31,806,520 | 26,097,279 | ||||||
| Leisure Fund | 23,036,162 | 23,863,837 | ||||||
| Precious Metals Fund | 63,595,667 | 67,888,697 | ||||||
| Real Estate Fund | 81,872,368 | 88,586,992 | ||||||
| Retailing Fund | 90,294,281 | 89,726,885 | ||||||
| Technology Fund | 41,718,793 | 38,348,937 | ||||||
| Telecommunications Fund | 38,042,760 | 39,139,433 | ||||||
| Transportation Fund | 51,756,984 | 43,672,019 | ||||||
| Utilities Fund | 68,918,500 | 75,831,791 | ||||||
| 7. | Line of Credit |
The Trust, along with other affiliated trusts, secured an uncommitted, $75,000,000 line of credit from U.S. Bank, N.A., which expires June 15, 2014. This line of credit is reserved for emergency or temporary purposes. Borrowings, if any, under this arrangement bear interest equal to the Prime Rate, minus 2%, which shall be paid monthly, averaging 1.25% for the year ended December 31, 2013. On December 31, 2013, the Biotechnology Fund borrowed $205,000 under this agreement. The Funds did not have any other borrowings under this agreement at December 31, 2013.
The average daily balances borrowed for the year ended December 31, 2013 were as follows:
| Fund | Average Daily Balance | |||
| Banking Fund | $ | 6,581 | ||
| Basic Materials Fund | 9,444 | |||
| Biotechnology Fund | 18,301 | |||
| Consumer Products Fund | 10,181 | |||
| Electronics Fund | 2,233 | |||
| Energy Fund | 10,907 | |||
| Energy Services Fund | 12,230 | |||
| Financial Services Fund | 9,603 | |||
| Health Care Fund | 8,770 | |||
| Internet Fund | 2,762 | |||
| Leisure Fund | 3,110 | |||
| Precious Metals Fund | 64,342 | |||
| Real Estate Fund | 21,597 | |||
| Retailing Fund | 10,205 | |||
| Technology Fund | 6,353 | |||
| Telecommunications Fund | 6,304 | |||
| Transportation Fund | 8,132 | |||
| Utilities Fund | 24,244 | |||
| 8. | Portfolio Securities Loaned |
The Funds may lend their securities to approved brokers to earn additional income. Security lending income shown on the Statements of Operations is shown net of rebates paid to the borrowers and earnings on cash collateral investments shared with the lending agent. Within this arrangement, the Funds act as the lender, Credit Suisse acts as the lending agent, and other approved registered broker dealers act as the borrowers. The Funds receive cash collateral, valued at 102% of the value of the securities on loan. Under the terms of the Funds’ securities lending agreement with Credit Suisse, cash collateral is invested in one or more joint repurchase agreements collateralized by obligations of the U.S. Treasury or Government Agencies and cash. The Funds bear the risk of loss on cash collateral investments. Collateral is maintained over the life of the loan in an amount not less than the value of loaned securities, as determined at the close of fund business each day; any additional collateral required due to changes in security values is delivered to the Funds the next business day. Although the collateral mitigates the risk, the Funds could experience a delay in recovering its securities and a possible loss of income or value if the borrower fails to return the securities. The Funds have the right under the securities lending agreement to recover the securities from the borrower on demand.
| THE RYDEX FUNDS ANNUAL REPORT | 147 |
| NOTES TO FINANCIAL STATEMENTS (continued) |
At December 31, 2013, the Funds participated in securities lending as follows:
| Cash | ||||||||
| Value of | Collateral | |||||||
| Fund | Securities Loaned | Received | ||||||
| Banking Fund | $ | 50,568 | $ | 34,200 | * | |||
| Basic Materials Fund | 92,690 | 97,200 | ||||||
| Biotechnology Fund | 1,473,528 | 1,505,450 | ||||||
| Consumer Products Fund | 66,895 | 67,575 | ||||||
| Electronics Fund | 24,240 | 28,800 | ||||||
| Energy Fund | 129,090 | 132,750 | ||||||
| Health Care Fund | 394,414 | 409,175 | ||||||
| Internet Fund | 456,431 | 452,325 | * | |||||
| Precious Metals Fund | 612,287 | 625,183 | ||||||
| Retailing Fund | 66,682 | 66,750 | ||||||
| Technology Fund | 82,320 | 79,800 | * | |||||
| Telecommunications Fund | 23,940 | 24,750 | ||||||
| Transportation Fund | 683,810 | 696,688 | ||||||
* Subsequent to December 31, 2013, additional collateral was received.
Cash collateral received was invested in the following joint repurchase agreements at December 31, 2013:
| Counterparty and | Repurchase | |||||||||||||||||
| Terms of Agreement | Face Value | Price | Collateral | Par Value | Fair Value | |||||||||||||
| HSBC Securities, Inc. | Freddie Mac | |||||||||||||||||
| 0.01% | 0.00% | |||||||||||||||||
| Due 01/02/14 | $ | 3,678,443 | $ | 3,678,445 | 01/15/14 - 07/15/32 | $ | 6,233,587 | $ | 3,752,443 | |||||||||
| Deutsche Bank Securities, Inc. | Fannie Mae | |||||||||||||||||
| 0.02% | 0.00% - 1.38% | 830,054 | 551,310 | |||||||||||||||
| Due 01/02/14 | 542,203 | 542,203 | 11/15/16 - 05/15/30 | |||||||||||||||
| Federal Home Loan Bank | ||||||||||||||||||
| 0.38% | ||||||||||||||||||
| 06/24/16 | 919 | 915 | ||||||||||||||||
| Freddie Mac | ||||||||||||||||||
| 3.00% | ||||||||||||||||||
| 07/28/14 | 551 | 562 | ||||||||||||||||
| 9. | Reverse Share Split |
The Electronics Fund underwent a one-for-ten reverse share split effective April 5, 2013. The effect of the transaction was to divide the number of outstanding shares of the Fund by ten, resulting in a corresponding increase in the net asset value per share. The share transactions presented in the statement of changes in net assets and the per share data in the financial highlights for each of the periods presented prior to April 5, 2013 have been given retroactive effect to reflect this reverse share split. There were no changes in net assets, results of operations or total return as a result of this transaction.
| 10. | Subsequent Event |
Effective January 24, 2014, a reverse share split occurred for the following funds:
| Fund | Split Type |
| Precious Metals Fund | One-for-Five Reverse Split |
| Technology Fund | One-for-Five Reverse Split |
| Telecommunications Fund | One-for-Five Reverse Split |
The effect of these transactions was to divide the number of outstanding shares of the Funds by the respective split ratio, resulting in a corresponding increase in the net asset value per share. The shares outstanding and the net asset value per share on the statements of assets and liabilities as of December 31, 2013, the share transactions presented in the statements of changes in net assets for each of the two years in the period then ended, and the per share data in the financial highlights for each of the years in the five year period then ended have been given retroactive effect to reflect these reverse share splits. There were no changes in net assets, results of operations or total return as a result of the transactions.
| 148 | THE RYDEX FUNDS ANNUAL REPORT |
| NOTES TO FINANCIAL STATEMENTS (concluded) |
11. Legal Proceedings
Tribune Company
Rydex Variable Trust has been named as a defendant in the case entitled Marc S. Kirscher, as Litigation Trustee for the Tribune Litigation Trust v. FitzSimons, No. 12-2652 (S.D.N.Y.) (formerly Official Committee of Unsecured Creditors of Tribune Co. v. FitzSimons, Adv. Pro. No. 10-54010 (Bankr. D. Del.)) (the “FitzSimons” Action), as a result of the ownership of shares in the Tribune Company (“Tribune”) in 2007 by certain series of the Rydex Variable Trust when Tribune effected a leveraged buyout transaction (“LBO”) by which Tribune converted to a privately-held company. The plaintiff has alleged that, in connection with the LBO, insiders and shareholders were paid for their Tribune stock using financing that the insiders knew would, and ultimately did, leave the Tribune insolvent. The plaintiff has asserted claims against certain insiders, shareholders, professional advisers, and others involved in the LBO, and is attempting to obtain from these individuals and entities the proceeds paid out in connection with the LBO.
Rydex Variable Trust also has been named as a defendant in one or more of a group of lawsuits filed by a group of Tribune creditors that allege state law constructive fraudulent conveyance claims against former Tribune shareholders (the “SLCFC actions”).
The FitzSimons action and the SLCFC actions have been consolidated with the majority of the other Tribune LBO-related lawsuits in a multidistrict litigation proceeding captioned In re Tribune Company Fraudulent Conveyance Litig., No. 11-md-2696 (S.D.N.Y.) (the “MDL Proceeding”).
On September 23, 2013, the District Court granted the defendants’ omnibus motion to dismiss the SLCFC actions, on the basis that the creditors lacked standing. On September 30, 2013, the creditors filed a notice of appeal of the September 23 order. On October 28, 2013, the defendants filed a joint notice of cross-appeal of that same order.
On November 20, 2013, the District Court ordered the parties in the FitzSimons action to meet and confer regarding a potential protocol for the briefing and argument of motions to dismiss to be filed in that action. On January 24, 2014, the Court extended the time for service of summonses and complaints in the FitzSimons action to February 28, 2014.
None of these lawsuits allege any wrongdoing on the part of Rydex Variable Trust. The following series of Rydex Variable Trust held shares of Tribune and tendered these shares as part of Tribune’s LBO: Nova Fund, S&P 500 2x Strategy Fund, Multi-Cap Core Equity Fund, S&P 500 Pure Value Fund, Hedged Equity Fund and Multi-Hedge Strategies Fund (the “Funds”). The value of the proceeds received by the foregoing Funds was $12,580, $2,380, $1,360, $148,376, $2,720, and $119,034, respectively. At this stage of the proceedings, Rydex Variable Trust is not able to make a reliable predication as to the outcome of these lawsuits or the effect, if any, on a Fund’s net asset value.
Lyondell Chemical Company
In December 2011, Rydex Variable Trust was named as a defendant in Weisfelner, as Trustee of the LB Creditor Trust, v. Fund 1 (In re Lyondell Chemical Co.), Adv. Pro. No. 10-4609 (Bankr. S.D.N.Y.).
Similar to the claims made in the Tribune matter, the Weisfelner complaint seeks to have set aside and recovered as fraudulent transfers from former Lyondell Chemical Company (“Lyondell”) shareholders the consideration paid to them pursuant to the cash out merger of Lyondell shareholders in connection with the combination of Lyondell and Basell AF in 2007. Lyondell filed for bankruptcy in 2008.
On January 14, 2014, the Court granted in part and denied in part the defendants’ motion to dismiss the Creditor Trust action. In particular, the Court dismissed all defendants who were conduits for the proceeds from the merger transaction, and also ruled that the plaintiff could not bring any claims on behalf of certain entities who had ratified the merger transaction. The Court also dismissed without prejudice the plaintiff’s claims for intentional fraudulent transfer against the remaining defendants, and gave the Credit Trustee leave to replead these claims. Finally, the Court denied the motion to dismiss with respect to the plaintiff’s claims for constructive fraudulent transfer against the remaining defendants.
This lawsuit does not allege any wrongdoing on the part of Rydex Variable Trust. The following series of Rydex Variable Trust received cash proceeds from the cash out merger in the following amounts: Basic Materials Fund - $1,235,952; U.S. Long Short Momentum Fund - $523,200; Multi-Cap Core Equity Fund - $5,760; Hedged Equity Fund - $480; and Multi-Hedge Strategies Fund - $112,848. At this stage of the proceedings, Rydex Variable Trust is not able to make a reliable predication as to the outcome of these lawsuits or the effect, if any, on a Fund’s net asset value.
| THE RYDEX FUNDS ANNUAL REPORT | 149 |
| REPORT OF INDEPENDENT REGISTERED PUBLIC ACCOUNTING FIRM |
To the Board of Trustees and Shareholders of Rydex Variable Trust:
We have audited the accompanying statements of assets and liabilities, including the schedules of investments, of Banking Fund, Basic Materials Fund, Biotechnology Fund, Consumer Products Fund, Electronics Fund, Energy Fund, Energy Services Fund, Financial Services Fund, Health Care Fund, Internet Fund, Leisure Fund, Precious Metals Fund, Real Estate Fund, Retailing Fund, Technology Fund, Telecommunications Fund, Transportation Fund and Utilities Fund (eighteen of the series constituting the Rydex Variable Trust) (the “Funds”), as of December 31, 2013, and the related statements of operations for the year then ended, the statements of changes in net assets for each of the two years in the period then ended, and the financial highlights for each of the five years in the period then ended. These financial statements and financial highlights are the responsibility of the Funds’ management. Our responsibility is to express an opinion on these financial statements and financial highlights based on our audits.
We conducted our audits in accordance with the standards of the Public Company Accounting Oversight Board (United States). Those standards require that we plan and perform the audit to obtain reasonable assurance about whether the financial statements and financial highlights are free of material misstatement. We were not engaged to perform an audit of the Funds’ internal control over financial reporting. Our audits included consideration of internal control over financial reporting as a basis for designing audit procedures that are appropriate in the circumstances, but not for the purpose of expressing an opinion on the effectiveness of the Funds’ internal control over financial reporting.
Accordingly, we express no such opinion. An audit also includes examining, on a test basis, evidence supporting the amounts and disclosures in the financial statements and financial highlights, assessing the accounting principles used and significant estimates made by management, and evaluating the overall financial statement presentation. Our procedures included confirmation of securities owned as of December 31, 2013, by correspondence with the custodian and brokers or by other appropriate auditing procedures where replies from brokers were not received. We believe that our audits provide a reasonable basis for our opinion.
In our opinion, the financial statements and financial highlights referred to above present fairly, in all material respects, the financial position of the above listed Funds at December 31, 2013, the results of their operations for the year then ended, the changes in their net assets for each of the two years in the period then ended, and their financial highlights for each of the five years in the period then ended, in conformity with U.S. generally accepted accounting principles.
 |
McLean, Virginia
February 27, 2014
| 150 | THE RYDEX FUNDS ANNUAL REPORT |
| OTHER INFORMATION (Unaudited) |
Tax Information
This information is being provided as required by the Internal Revenue Code. Amounts shown may differ from those elsewhere in the report because of differences in tax and financial reporting practice.
Of the ordinary income distributions paid during the year, the following funds had the corresponding percentages qualify for the dividends received deduction for corporations:
| Fund | % Qualifying | |||
| Banking Fund | 13 | % | ||
| Basic Materials Fund | 100 | % | ||
| Electronics Fund | 100 | % | ||
| Energy Fund | 100 | % | ||
| Consumer Products Fund | 100 | % | ||
| Financial Services Fund | 100 | % | ||
| Health Care Fund | 100 | % | ||
| Leisure Fund | 100 | % | ||
| Precious Metals Fund | 100 | % | ||
| Retailing Fund | 70 | % | ||
| Telecommunications Fund | 100 | % | ||
| Utilities Fund | 100 | % | ||
With respect to the taxable year ended December 31, 2013, the Funds hereby designate as capital gain dividends the amounts listed below, or, if subsequently determined to be different, the net capital gain of such year:
| Energy | ||||||||||||||||
| Basic Materials | Energy | Services | Internet | |||||||||||||
| Fund | Fund | Fund | Fund | |||||||||||||
| From long-term capital gains, subject to the 15% rate gains category: | $ | 624,095 | $ | 322,147 | $ | 611,941 | $ | 272,581 | ||||||||
| Retailing | ||||||||||||||||
| Fund | ||||||||||||||||
| From long-term capital gains, subject to the 15% rate gains category | $ | 668,600 | ||||||||||||||
Proxy Voting Information
A description of the policies and procedures that the Trust uses to determine how to vote proxies relating to securities held in the Funds’ portfolios is available, without charge and upon request, by calling 1.800.820.0888. This information is also available from the EDGAR database on the SEC’s website at http://www.sec.gov.
Information regarding how the Funds voted proxies relating to portfolio securities during the most recent 12-month period ended June 30 is available without charge, upon request, by calling 1.800.820.0888. This information is also available from the EDGAR database on the SEC’s website at http://www.sec.gov.
Quarterly Portfolio Schedules Information
The Trust files its complete schedule of portfolio holdings with the SEC for the first and third quarters of each fiscal year on Form N-Q; which are available on the SEC’s website at http://www.sec.gov. The Funds’ Forms N-Q may be reviewed and copied at the SEC’s Public Reference Room in Washington, DC, and that information on the operation of the Public Reference Room may be obtained by calling 1-800-SEC-0330. Copies of the portfolio holdings are also available to shareholders, without charge and upon request, by calling 1.800.820.0888.
| THE RYDEX FUNDS ANNUAL REPORT | 151 |
| OTHER INFORMATION (Unaudited) (concluded) |
Office Locations
The offices of Guggenheim Investments can be found in the following locations:
330 Madison Avenue
10th Floor
New York, NY 10017
(Headquarters)
Four Irvington Centre
805 King Farm Boulevard
Suite 600
Rockville, MD 20850
9401 Indian Creek Parkway
40 Corporate Woods
Suite 850
Overland Park, KS 66210
| 152 | THE RYDEX FUNDS ANNUAL REPORT |
| INFORMATION ON BOARD OF TRUSTEES AND OFFICERS (Unaudited) |
A Board of Trustees oversees the Trust, as well as other trusts of GI, in which its members have no stated term of service, and continue to serve after election until resignation. The Statement of Additional Information includes further information about Fund Trustees and Officers, and can be obtained without charge by calling 800.820.0888.
All Trustees and Officers may be reached c/o Guggenheim Investments, 805 King Farm Boulevard, Suite 600, Rockville, MD 20850.
| TRUSTEE AND OFFICER | ||||
| Name and | Length of Service as Trustee | Number of | ||
| Year of Birth | (Year Began) | Funds Overseen | ||
| Donald C. Cacciapaglia* | Rydex Series Funds – 2012 | 213 | ||
| (1951) | Rydex Variable Trust – 2012 | |||
| Rydex Dynamic Funds – 2012 | ||||
| Rydex ETF Trust – 2012 |
Principal Occupations During Past Five Years: Current: Security Investors, LLC: President and CEO from April 2012 to present; Guggenheim Investments: President and Chief Administrative Officer from February 2010 to present; Previous: Channel Capital Group, Inc.: Chairman and CEO from April 2002 to February 2010
Positions held within the Trust: Trustee from 2012 to present; President from 2012 to present
| INDEPENDENT TRUSTEES | ||||
| Name and | Length of Service as Trustee | Number of | ||
| Year of Birth | (Year Began) | Funds Overseen | ||
| Corey A. Colehour | Rydex Series Funds – 1993 | 132 | ||
| (1945) | Rydex Variable Trust – 1998 | |||
| Rydex Dynamic Funds – 1999 | ||||
| Rydex ETF Trust – 2003 |
Principal Occupations During Past Five Years: Current: Retired; Previous: President and Senior Vice President of Schield Management Company (registered investment adviser) from 2003 to 2006
Positions held within the Trust: Trustee from 1993 to present; Member of the Audit and Governance and Nominating Committees from 1995 to present
| J. Kenneth Dalton | Rydex Series Funds – 1995 | 132 | ||
| (1941) | Rydex Variable Trust – 1998 | |||
| Rydex Dynamic Funds – 1999 | ||||
| Rydex ETF Trust – 2003 |
Principal Occupations During Past Five Years: Current: Retired
Positions held within the Trust: Trustee from 1995 to present; Member and Chairman of the Audit Committee from 1997 to present; Member of the Governance and Nominating Committees from 1995 to present; and Member of the Risk Oversight Committee from 2010 to present
| John O. Demaret | Rydex Series Funds – 1997 | 132 | ||
| (1940) | Rydex Variable Trust – 1998 | |||
| Rydex Dynamic Funds – 1999 | ||||
| Rydex ETF Trust – 2003 |
Principal Occupations During Past Five Years: Current: Retired
Positions held within the Trust: Trustee from 1997 to present; Chairman of the Board from 2006 to present; Member of the Audit Committee from 1997 to present; and Member of the Risk Oversight Committee from 2010 to present
| THE RYDEX FUNDS ANNUAL REPORT | 153 |
| INFORMATION ON BOARD OF TRUSTEES AND OFFICERS (Unaudited) (continued) |
| INDEPENDENT TRUSTEES - concluded | ||||
| Name and | Length of Service as Trustee | Number of | ||
| Year of Birth | (Year Began) | Funds Overseen | ||
| Werner E. Keller | Rydex Series Funds – 2005 | 132 | ||
| (1940) | Rydex Variable Trust – 2005 | |||
| Rydex Dynamic Funds – 2005 | ||||
| Rydex ETF Trust – 2005 | ||||
Principal Occupations During Past Five Years: Current: Founder and President of Keller Partners, LLC (investment research firm) from 2005 to present; Previous: Retired from 2001 to 2005 Positions held within the Trust: Vice Chairman of the Board of Trustees from 2010 to present; Trustee and Member of the Audit and Governance and Nominating Committees from 2005 to present; and Chairman and Member of the Risk Oversight Committee from 2010 to present
| Thomas F. Lydon, Jr. | Rydex Series Funds – 2005 | 132 | ||
| (1960) | Rydex Variable Trust – 2005 | |||
| Rydex Dynamic Funds – 2005 | ||||
| Rydex ETF Trust – 2005 |
Principal Occupations During Past Five Years: Current: President of Global Trends Investments (registered investment adviser) from 1996 to present
Positions held within the Trust: Trustee and Member of the Audit and Governance and Nominating Committees from 2005 to present
| Patrick T. McCarville | Rydex Series Funds – 1997 | 132 | ||
| (1942) | Rydex Variable Trust – 1998 | |||
| Rydex Dynamic Funds – 1999 | ||||
| Rydex ETF Trust – 2003 |
Principal Occupations During Past Five Years: Current: Retired; Previous: Chief Executive Officer of Par Industries, Inc., d/b/a Par Leasing from 1977 to 2010
Positions held within the Trust: Trustee from 1997 to present; Member of the Audit Committee from 1997 to present; and Chairman of the Governance and Nominating Committees from 1997 to present
| Roger Somers | Rydex Series Funds – 1993 | 132 | ||
| (1944) | Rydex Variable Trust – 1998 | |||
| Rydex Dynamic Funds – 1999 | ||||
| Rydex ETF Trust – 2003 |
Principal Occupations During Past Five Years: Current: Founder and Chief Executive Officer of Arrow Limousine from 1965 to present
Positions held within the Trust: Trustee from 1993 to present; Member of the Audit and Governance and Nominating Committees from 1995 to present
| 154 | THE RYDEX FUNDS ANNUAL REPORT |
| INFORMATION ON BOARD OF TRUSTEES AND OFFICERS (Unaudited) (concluded) |
EXECUTIVE OFFICERS
| Name, Position and | Principal Occupations | |||
| Year of Birth | During Past Five Years |
Michael P. Byrum* Vice President (1970) | Current: President, Security Benefit Asset Management Holdings, LLC; Senior Vice President, Security Investors, LLC; President & Chief Investment Officer, Rydex Holdings, LLC; Director & Chairman of the Board, Advisor Research Center, Inc.; and Manager, Rydex Specialized Products, LLC | |
| Previous: Guggenheim Distributors, LLC (f/k/a Rydex Distributors, LLC), Vice President (2009); Rydex Fund Services, LLC, Director (2009–2010), Secretary (2002–2010); Rydex Advisors, LLC (f/k/a PADCO Advisors, Inc.), Director (2008–2010), Chief Investment Officer (2006–2010), President (2004–2010), Secretary (2002–2010); Rydex Advisors II, LLC (f/k/a PADCO Advisors II, Inc.), Director (2008–2010), Chief Investment Officer (2006–2010), President (2004–2010), Secretary (2002–2010); Advisor Research Center, Inc., Secretary (2006–2009), and Executive Vice President (2006) | ||
Nikolaos Bonos* Vice President and Treasurer (1963) | Current: Senior Vice President, Security Investors, LLC; Chief Executive Officer & Manager, Rydex Specialized Products, LLC; Chief Executive Officer & President, Rydex Fund Services, LLC; Vice President, Rydex Holdings, LLC; Treasurer, SBL Fund; Security Equity Fund; Security Income Fund; Security Large Cap Value Fund & Security Mid Cap Growth Fund; and Vice President, Security Benefit Asset Management Holdings, LLC | |
| Previous: Security Global Investors, LLC, Senior Vice President (2010–2011); Rydex Advisors, LLC (f/k/a PADCO Advisors, Inc.) Senior Vice President (2006–2011); Rydex Fund Services, LLC (f/k/a Rydex Fund Services, Inc.), Director (2009); and Rydex Specialized Products, LLC, Chief Financial Officer (2005–2009) | ||
Elisabeth Miller* Chief Compliance Officer (1968) | Current: Chief Compliance Officer, Rydex Series Funds, Rydex Dynamic Funds, Rydex Variable Trust, Rydex ETF Trust, Security Equity Fund, Security Income Fund, Security Large Cap Value Fund, Security Mid Cap Growth Fund, SBL Fund, Security Investors, LLC, and Guggenheim Distributors, LLC | |
| Previous: Senior Manager, Security Investors, LLC and Guggenheim Distributors, LLC (2004–2009) | ||
| Amy J. Lee* | Current: Secretary and Senior Vice President, Security Investors, LLC (2004–present) | |
| Vice President and Secretary (1961) | Previous: Vice President, Associate General Counsel & Assistant Secretary, Security Benefit Life Insurance Company and Security Benefit Corporation (2004–2012) | |
Joseph M. Arruda* Assistant Treasurer (1966) | Current: Assistant Treasurer, SBL Fund; Security Equity Fund; Security Income Fund; Security Large Cap Value Fund & Security Mid Cap Growth Fund; Vice President, Security Investors, LLC; and Chief Financial Officer & Manager, Rydex Specialized Products, LLC | |
| Previous: Security Global Investors, LLC, Vice President (2010–2011); and Rydex Advisors, LLC (f/k/a PADCO Advisors, Inc.) & Rydex Advisors II, LLC (f/k/a PADCO Advisors II, Inc.), Vice President (2004–2011) |
| * | Officers of the Funds are deemed to be “interested persons” of the Trust, within the meaning of Section 2(a)(19) of the 1940 Act, inasmuch as this person is affiliated with Guggenheim Investments. |
| THE RYDEX FUNDS ANNUAL REPORT | 155 |
| GUGGENHEIM INVESTMENTS PRIVACY POLICIES (Unaudited) |
Rydex Funds, Guggenheim Funds, Rydex Investments, Guggenheim Distributors, LLC, Security Investors, LLC, Security Distributors, Inc. and Rydex Advisory Services (Collectively “Guggenheim Investments”).
Our Commitment to You
When you become a Guggenheim Investments investor, you entrust us with not only your hard-earned money but also with personal and financial information about you. We recognize that your relationship with us is based on trust and that you expect us to act responsibly and in your best interests. Because we have access to this private information about you, we hold ourselves to the highest standards in its safekeeping and use. This means, most importantly, that we do not sell client information to anyone—whether it is your personal information or if you are a current or former Guggenheim Investments client.
The Information We Collect About You
In the course of doing business with shareholders and investors, we collect nonpublic personal information about you. You typically provide personal information when you complete a Guggenheim Investments account application or when you request a transaction that involves Rydex and Guggenheim Investments funds or one of the Guggenheim Investments affiliated companies. “Nonpublic personal information” is personally identifiable private information about you. For example, it includes information regarding your name and address, Social Security or taxpayer identification number, assets, income, account balance, bank account information and investment activity (e.g., purchase and redemption history).
How We Handle Your Personal Information
As emphasized above, we do not sell information about current or former clients or their accounts to third parties. Nor do we share such information, except when necessary to complete transactions at your request or to make you aware of related investment products and services that we offer. Additional details about how we handle your personal information are provided below. To complete certain transactions or account changes that you direct, it may be necessary to provide identifying information to companies, individuals or groups that are not affiliated with Guggenheim Investments. For example, if you ask to transfer assets from another financial institution to Guggenheim Investments, we will need to provide certain information about you to that company to complete the transaction. To alert you to other Guggenheim Investments investment products and services, we may share your information within the Guggenheim Investments family of affiliated companies.
This would include, for example, sharing your information within Guggenheim Investments so we can make you aware of new Rydex and Guggenheim Investments funds or the services offered through another Guggenheim Investments affiliated company. In certain instances, we may contract with nonaffiliated companies to perform services for us. Where necessary, we will disclose information we have about you to these third parties. In all such cases, we provide the third party with only the information necessary to carry out its assigned responsibilities and only for that purpose. And we require these third parties to treat your private information with the same high degree of confidentiality that we do. In certain instances, we may share information with other financial institutions regarding individuals and entities in response to the U.S.A. Patriot Act. Finally, we will release information about you if you direct us to do so, if we are compelled by law to do so or in other circumstances permitted by law.
Opt Out Provisions
We do not sell your personal information to anyone. The law allows you to “opt out” of only certain kinds of information sharing with third parties. The firm does not share personal information about you with any third parties that triggers this opt-out right. This means YOU ARE ALREADY OPTED OUT.
How We Protect Privacy Online
Our concern for the privacy of our shareholders also extends to those who use our web site, guggenheiminvestments.com. Our web site uses some of the most secure forms of online communication available, including encryption technology, Secure Socket Layer (SSL) protocol, firewalls and user names and passwords. These technologies provide a high level of security and privacy when you access your account information or initiate online transactions. The Guggenheim Investments web site offers customized features that require our use of “http cookies”—tiny pieces of information that we ask your browser to store. However, we make very limited use of these cookies. We only use cookies for session management and security features on the Guggenheim Investments web site. We do not use them to pull data from your hard drive, to learn your email address, or to view data in cookies created by other web sites. We will not share the information in our cookies or give others access to it. See the legal information area on our web site for more details about web site security and privacy features.
| 156 | THE RYDEX FUNDS ANNUAL REPORT |
| GUGGENHEIM INVESTMENTS PRIVACY POLICIES (Unaudited) (concluded) |
How We Safeguard Your Personal Information
We restrict access to nonpublic personal information about shareholders to our employees and in some cases to third parties (for example, the service providers described above) as permitted by law. We maintain strict physical, electronic and procedural safeguards that comply with federal standards to guard your nonpublic personal information.
We’ll Keep You Informed
As required by federal law, we will notify shareholders of our privacy policy annually. We reserve the right to modify this policy at any time, but rest assured that if we do change it, we will tell you promptly. You will also be able to access our privacy policy from our web site at guggenheiminvestments.com. Should you have any questions regarding our privacy policy, contact us at 800.820.0888 or 301.296.5100.
| THE RYDEX FUNDS ANNUAL REPORT | 157 |
CLS ADVISORONE FUNDS
AMERIGO FUND
CLERMONT FUND
SELECT ALLOCATION FUND
RVAAO-2-1213x1214
This report and the financial statements contained herein are submitted for the general information of our shareholders. The report is not authorized for distribution to prospective investors unless preceded or accompanied by an effective prospectus.
Distributed by Guggenheim Distributors, LLC.
| THE GUGGENHEIM FUNDS annual REPORT | 1 |
| December 31, 2013 |
Dear Shareholder:
Security Investors, LLC (the “Investment Adviser”) is pleased to present the annual shareholder report for three of our funds that are part of the Rydex Variable Trust. This report covers performance of the Funds for the annual period ended December 31, 2013.
The Investment Adviser is a part of Guggenheim Investments, which represents the investment management businesses of Guggenheim Partners, LLC, a global, diversified financial services firm.
CLS Investments, LLC serves as investment sub-advisor to the Funds and is responsible for the day-to-day management of each Fund’s portfolio.
Guggenheim Distributors, LLC is the distributor of the Funds. Guggenheim Distributors, LLC is affiliated with Guggenheim Partners, LLC and Security Investors, LLC.
We encourage you to read the Market Overview section of the report, which follows this letter, and then the sub-advisor’s market commentary and portfolio positioning. After that, there is a Performance Report and Fund Profile for each Fund.
We are committed to providing innovative investment solutions and appreciate the trust you place in us.
Sincerely,

Donald C. Cacciapaglia
President
January 31, 2014
Read each fund’s prospectus and summary prospectus (if available) carefully before investing. It contains the fund’s investment objectives, risks, charges, expenses and other information, which should be considered carefully before investing. Obtain a prospectus and summary prospectus (if available) at guggenheiminvestments.com or call 800.820.0888.
The Funds are subject to a number of risks and may not be suitable for all investors. • Because the Funds invest primarily in underlying funds, the value of your investment will fluctuate in response to the performance of the underlying funds. • In addition, investing through the Fund in a portfolio of underlying funds involves certain additional expenses that would not arise if you invested directly in the underlying funds. • The Funds’ investment in underlying funds that invest in small or medium capitalization companies, fixed income securities, foreign securities and foreign currencies exposes the Funds to certain risks. • Investing in securities of small- or medium-capitalization companies may involve greater risk of loss and more abrupt fluctuations in market prices than investments in larger companies. • Fixed income investments will change in value in response to interest rate changes and other factors. • The value of fixed income investments with longer maturities will fluctuate more in response to interest rate changes than fixed income investments with shorter-term maturities. • Investments in foreign currencies are subject to the risk that those currencies will decline in value relative to the U.S. dollar. • Additionally, diplomatic, political or economic developments in foreign countries could adversely impact investments in securities of foreign companies.
| 2 | THE GUGGENHEIM FUNDS annual REPORT |
| Economic and market overview (Unaudited) | December 31, 2013 |
The year ended December 31, 2013 wound down with a series of stronger-than-expected economic data releases. ISM manufacturing data (historically indicative of expansion or contraction) rose to its highest levels in over two years, consumer confidence rebounded following the government shutdown, housing starts surged, and the job market strengthened. Citing improved labor market conditions and a sustainable economic expansion, the U.S. Federal Reserve (the “Fed”) announced in December that it would reduce its monthly bond purchases by $10 billion, to $75 billion, starting in January 2014. Yet, at the same time, the Fed lengthened the time frame before which it will raise rates by promising to keep the Fed funds target rate at 0-0.25% at least as long as the unemployment rate remains above 6.5% and perhaps “well past” the time this target is reached. For the first time, the Fed also added a lower-bound target for inflation of 2%–lengthening the expected time frame before rates rise.
As the U.S. economy slowly strengthens, we may return to an environment where taking credit risk is not just a consequence of staying within duration targets or reaching for yield, but rather a proactive choice driven by a positive outlook on the economy. To sustain optimism, the Fed will need to monitor the unintended consequences of tapering and avoid negative economic repercussions, as happened in the summer of 2013 when a spike in 10-year Treasury yields dampened home sales. For markets, the Fed must convince investors that the economy is strong enough to withstand steady reductions of its asset purchases. These will likely be Janet Yellen’s top priorities as she takes over the helm of the Fed.
Last January, the global economy faced myriad headwinds, choppiness lay ahead, and we expected plenty of volatility in 2013. Nevertheless, we believed at that point that risk assets were the best choice for investors. Now, the headwinds of 2013 have largely dissipated, and the outlook appears benign for risk assets for the first three to six months of 2014, if not longer.
Many pundits may have underestimated the strength in the U.S. economy, with both third quarter and fourth quarter economic growth beating expectations. The final three months of 2013 were exceptionally good for U.S. equities, which produced a wealth effect that probably boosted holiday sales. All of this bodes well for the first quarter of 2014.
Market conditions could be even stronger in Europe. Economic data from the euro area’s periphery is improving faster than from the core, where inflation is also rising at a faster pace, giving the peripheral nations a competitive advantage. In Asia, markets have priced for a more negative scenario that now appears less likely. With the U.S. and Europe now out of recession, they are ready to underpin a recovery in export growth in the Asian region. As a synchronous global expansion gets under way, investors may become more comfortable with taking risk, and this should be reflected in asset prices in many regions around the globe.
For 2014, investors should bear in mind that the Fed will continue injecting liquidity into financial markets even as it tapers its asset purchases. Assuming that the Fed continues the same pace of reductions at each Federal Open Market Committee meeting, it would still purchase more than $500 billion of bonds in 2014–nearly the size of the Fed’s QE2 from November 2010 to June 2011. This should help support credit spreads. An accelerated pace of tapering from the Fed would signal faster-than-expected economic growth and spark higher demand for risk assets. On balance, we expect the impact of tapering to be neutral. Barring economic weakness, we expect relatively benign market conditions with no major spike in volatility.
For the year ended December 31, 2013, the Standard & Poor’s 500 (“S&P 500”) Index* returned 32.39%. Foreign markets were also strong: the Morgan Stanley Capital International (“MSCI”) Europe-Australasia-Far East (“EAFE”) Index* returned 22.78%. The return of the MSCI Emerging Markets Index* was -2.60%.
In the bond market, the Barclays U.S. Aggregate Bond Index* posted a -2.02% return for the period. The Barclays U.S. Credit Index* returned -2.01%. The return of the Bank of America Merrill Lynch 3-Month U.S. Treasury Bill Index* was 0.07% for the 12-month period.
The opinions and forecasts expressed may not actually come to pass. This information is subject to change at any time, based on market and other conditions, and should not be construed as a recommendation of any specific security or strategy.
| THE GUGGENHEIM FUNDS annual REPORT | 3 |
| Economic and market overview (Unaudited) (continued) | December 31, 2013 |
*Index Definitions:
The following indices are referenced throughout this report. Indices are unmanaged and not available for direct investment. Index performance does not reflect transaction costs, fees, or expenses.
Barclays U.S. Aggregate Bond Index is a broad-based benchmark that measures the investment grade, U.S. dollar denominated, fixed-rate taxable bond market, including U.S. Treasuries, government-related and corporate securities, MBS (agency fixed-rate and hybrid ARM pass-throughs), ABS, and CMBS.
Barclays U.S. Credit Index comprises the Barclays U.S. Corporate Index and a non-corporate component that includes foreign agencies, sovereigns, supranationals and local authorities. It is a subset of the Barclays U.S. Government/Credit Index and Barclays U.S. Aggregate Index.
Bank of America Merrill Lynch 3-Month U.S. Treasury Bill Index is an unmanaged market index of U.S. Treasury securities maturing in 90 days that assumes reinvestment of all income.
MSCI EAFE Index is a free float-adjusted market capitalization index that is designed to measure the equity market performance of developed markets, excluding the U.S. & Canada.
MSCI Emerging Markets Index is a free float-adjusted market capitalization weighted index that is designed to measure equity market performance in the global emerging markets.
S&P 500® Index is a capitalization-weighted index of 500 stocks designed to measure the performance of the broad economy, representing all major industries and is considered a representation of the U.S. stock market.
| 4 | THE GUGGENHEIM FUNDS annual REPORT |
| Economic and market overview (Unaudited) (concluded) | December 31, 2013 |
CLS AdvisorOne Funds Market Commentary
The calendar year ended December 31, 2013, witnessed more domestic equity gains for the global stock markets, particularly in the U.S. The current bull market ranks among the strongest ever in U.S. market history measured either by the duration or magnitude of the gains. Performance hasn’t been quite as strong for balanced, diversified portfolios. While absolute returns have also been impressive, performance relative to the broad market has lagged.
Performance in the AdvisorOne Funds was impacted by a few factors. The trading decisions and positioning within our fixed income positions added value in 2013, primarily by (1) keeping duration (i.e., a portfolio’s interest-rate sensitivity) below average during a historic surge in bond yields, and (2) maintaining a credit tilt in the portfolios by emphasizing out-performing fixed income asset class segments such as high yield bonds and bank loans.
The negatives, however, were in the equity positioning. First, the portfolios have been underweight equities due to a variety of factors, as discussed in our portfolio positioning below. Second, the portfolios were overweight (and continuing to add to) international equity positions. While our preference has been to add to developed markets, such as Europe, we did have a modest overweight to emerging markets, which did not help. Third, within our domestic equity positioning, we have generally been underweight the better-performing consumer discretionary sector. What helped considerably in terms of our equity positioning are the greatly reduced positions in emerging market equities from prior time periods.
CLS AdvisorOne Investment Outlook and Portfolio Positioning
Our optimism entering 2013 is turning into more caution for 2014. While we recognize the current positives including strong market momentum, an accommodating the Fed, a general uptick in economic activity, and seasonal trends, there are other factors that give us pause. First, valuations are not suggesting the equity market is cheap in absolute terms. If anything, some measures suggest the market is richly priced. Second, investor sentiment is strongly bullish, or perhaps more concerning, becoming complacent. Typically, when valuations and sentiment measures are at such levels, stock market returns moving forward are typically below-average with higher probabilities of short-term losses. In response, we have generally reduced the risk in the portfolios, while of course remaining within the risk tolerance that each Fund is mandated to follow.
Within equities, there are a few clear themes within the AdvisorOne Funds. First, we have a preference for higher-quality companies, or in other words, companies with more stable profitability, strong balance sheets and higher dividend growth. These companies have attractive relative valuations and should perform better in a slower-growth environment and potentially higher interest rates. Second, we are building positions in technology stocks. Though many sectors appear pricey relative to the rest of the market and their own histories, the technology sector appears inexpensive relative to prior levels. With our expectation that corporations will begin to increase capital expenditures, the technology sector should be a beneficiary. Third, within our equity holdings, we are increasing our international positioning. While our preference is to increase exposure to developed regions such as Europe, we are also likely to increase our positions in emerging markets in the months/quarters ahead. Valuations for the international markets relative to the U.S. are attractive and growth is likely picking up in the international economies.
Regarding the bond market, our basic outlook has not changed. In short, long-term return prospects are not exciting due to the rising interest rate environment. Nonetheless, we are maintaining some core positions as fixed income continues to serve the valuable roles of providing income and adding to portfolio stability. Within fixed income, we continue to keep our portfolio durations below market averages in the anticipation of higher interest rates in the quarters/years ahead. In addition, we are continuing to use more non-traditional fixed income asset classes such as bank loans. Lastly, alternative investments, particularly those that offer lower volatility and lower correlations to the stock market, remain on our shopping list.
The opinions and forecasts expressed may not actually come to pass. This information is subject to change at any time, based on market and other conditions, and should not be construed as a recommendation of any specific security or strategy.
| THE GUGGENHEIM FUNDS annual REPORT | 5 |
| about shareholders’ fund expenses (Unaudited) |
All mutual funds have operating expenses and it is important for our shareholders to understand the impact of costs on their investments. Shareholders of a Fund incur two types of costs: (i) transaction costs, including sales charges (loads) on purchase payments, reinvested dividends, or other distributions; and exchange fees; and (ii) ongoing costs, including management fees, administrative services, and shareholder reports, among others. These ongoing costs, or operating expenses, are deducted from a fund’s gross income and reduce the investment return of the fund.
A fund’s expenses are expressed as a percentage of its average net assets, which is known as the expense ratio. The following examples are intended to help investors understand the ongoing costs (in dollars) of investing in a Fund and to compare these costs with the ongoing costs of investing in other mutual funds.
The examples are based on an investment of $1,000 made at the beginning of the period and held for the entire six-month period beginning June 30, 2013 and ending December 31, 2013.
The following tables illustrate a Fund’s costs in two ways:
Table 1. Based on actual Fund return. This section helps investors estimate the actual expenses paid over the period. The “Ending Account Value” shown is derived from the Fund’s actual return, and the fourth column shows the dollar amount that would have been paid by an investor who started with $1,000 in the Fund. Investors may use the information here, together with the amount invested, to estimate the expenses paid over the period. Simply divide the Fund’s account value by $1,000 (for example, an $8,600 account value divided by $1,000 = 8.6), then multiply the result by the number provided under the heading “Expenses Paid During Period.”
Table 2. Based on hypothetical 5% return. This section is intended to help investors compare a Fund’s cost with those of other mutual funds. The table provides information about hypothetical account values and hypothetical expenses based on the Fund’s actual expense ratio and an assumed rate of return of 5% per year before expenses, which is not the Fund’s actual return. The hypothetical account values and expenses may not be used to estimate the actual ending account balance or expenses paid during the period. The example is useful in making comparisons because the U.S. Securities and Exchange Commission (the “SEC”) requires all mutual funds to calculate expenses based on the 5% return. Investors can assess a Fund’s costs by comparing this hypothetical example with the hypothetical examples that appear in shareholder reports of other funds.
The calculations illustrated above assume no shares were bought or sold during the period. Actual costs may have been higher or lower, depending on the amount of investment and the timing of any purchases or redemptions.
Please note that the expenses shown in the table are meant to highlight your ongoing costs only and do not reflect any transactional costs, such as sales charges (loads) on purchase payments, and contingent deferred sales charges (“CDSC”) on redemptions, if any. Therefore, the second table is useful in comparing ongoing costs only, and will not help you determine the relative total costs of owning different funds. In addition, if these transactional costs were included, your costs would have been higher.
More information about a Fund’s expenses, including annual expense ratios for the past five years, can be found in the Financial Highlights section of this report. For additional information on operating expenses and other shareholder costs, please refer to the appropriate Fund prospectus.
| 6 | THE GUGGENHEIM FUNDS annual REPORT |
| about shareholders’ fund expenses (Unaudited) (concluded) |
| Beginning | Ending | Expenses | ||||||||||||||||||
| Expense | Fund | Account Value | Account Value | Paid During | ||||||||||||||||
| Ratio1 | Return | June 30, 2013 | December 31, 2013 | Period2 | ||||||||||||||||
| Table 1. Based on actual Fund return3 | ||||||||||||||||||||
| Amerigo Fund | 1.67 | % | 13.92 | % | $1,000.00 | $1,139.20 | $9.00 | |||||||||||||
| Clermont Fund | 1.67 | % | 6.30 | % | 1,000.00 | 1,063.00 | 8.68 | |||||||||||||
| Select Allocation Fund | 1.67 | % | 10.88 | % | 1,000.00 | 1,108.80 | 8.88 | |||||||||||||
| Table 2. Based on hypothetical 5% return (before expenses) | ||||||||||||||||||||
| Amerigo Fund | 1.67 | % | 5.00 | % | $1,000.00 | $1,016.79 | $8.49 | |||||||||||||
| Clermont Fund | 1.67 | % | 5.00 | % | 1,000.00 | 1,016.79 | 8.49 | |||||||||||||
| Select Allocation Fund | 1.67 | % | 5.00 | % | 1,000.00 | 1,016.79 | 8.49 | |||||||||||||
| 1 | Annualized and excludes expenses of the underlying funds in which the Funds invest. |
| 2 | Expenses are equal to the Fund’s annualized expense ratio, net of any applicable fee waivers, multiplied by the average account value over the period, multiplied by 184/365 (to reflect the one-half year period). Expenses shown do not include fees charged by insurance companies. |
| 3 | Actual cumulative return at net asset value for the period June 30, 2013 to December 31, 2013. |
| THE GUGGENHEIM FUNDS annual REPORT | 7 |
| performance report and FUND PROFILE (Unaudited) | December 31, 2013 |
AMERIGO FUND
OBJECTIVE: Seeks to provide long-term growth of capital without regard to current income.
Amerigo Fund returned 23.43% for the one-year period ended December 31, 2013, trailing its benchmark, the S&P 500® Index, which gained 32.39%.
During the period, domestic small-cap growth, health care, and consumer discretionary stocks outperformed most other asset classes.
Equity exposure was pared back slightly during the year in an effort to reduce risk in the portfolio as we believed that a mature bull market, higher valuations, and elevated bullish investor sentiment all warranted slightly more defensive positioning within the Fund.
Allocations over this period included an increase to domestic large-cap growth stocks, particularly technology, and developed international exposure, particularly that of developed Europe. Both domestic large-cap growth stocks and European stocks look attractive from a relative valuation perspective. In addition, Amerigo Fund has had an emphasis in allocating overweight positions to high quality stocks, as these types of companies tend to have more stable earnings during slow-growth environments.
Performance displayed represents past performance, which is no guarantee of future results.
Holdings Diversification (Market Exposure as % of Net Assets)

“Holdings Diversification (Market Exposure as % of Net Assets)” excludes any temporary cash investments.
Inception Date: July 1, 2003
| Ten Largest Holdings (% of Total Net Assets) | ||||
| Vanguard Dividend Appreciation ETF | 10.4 | % | ||
| iShares MSCI EAFE ETF | 7.4 | % | ||
| Financial Select Sector SPDR Fund | 6.5 | % | ||
| Technology Select Sector SPDR Fund | 6.2 | % | ||
| iShares Russell 1000 Growth ETF | 5.7 | % | ||
| Powershares QQQ Trust Series 1 | 5.5 | % | ||
| PowerShares International Dividend Achievers Portfolio | 5.2 | % | ||
| WisdomTree Emerging Markets Equity Income Fund | 4.9 | % | ||
| Energy Select Sector SPDR Fund | 4.9 | % | ||
| iShares MSCI USA Quality Factor ETF | 4.9 | % | ||
| Top Ten Total | 61.6 | % | ||
“Ten Largest Holdings” exclude any temporary cash or derivative investments.
| 8 | THE GUGGENHEIM FUNDS annual REPORT |
| PERFORMANCE REPORT AND FUND PROFILE (Unaudited) (concluded) |
Cumulative Fund Performance*,†
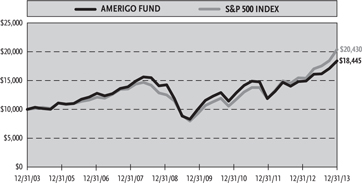
Average Annual Returns
Periods Ended December 31, 2013*,†
| 1 Year | 5 Year | 10 Year | ||||||||||
| Amerigo Fund | 23.43% | 15.87% | 6.31% | |||||||||
| S&P 500 Index | 32.39% | 17.94% | 7.41% |
| * | The performance data above represents past performance that is not predictive of future results. The investment return and principal value of an investment in the Fund will fluctuate so that an investor’s shares, when redeemed, may be worth more or less than their original cost. Returns are historical and include changes in principal and reinvested dividends and capital gains and do not reflect the effect of taxes. The S&P 500 Index is an unmanaged index and, unlike the Fund, has no management fees or operating expenses to reduce its reported return. |
| † | Returns do not reflect the impact of any additional fees charged by insurance companies. |
| the GUGGENHEIM FUNDS annual report | 9 |
| Schedule of Investments | December 31, 2013 |
| AMERIGO FUND | |
| Shares | Value | |||||||
| COMMON STOCKS† - 0.5% | ||||||||
| FINANCIALS - 0.5% | ||||||||
| Berkshire Hathaway, Inc. — Class B* | 6,200 | $ | 735,072 | |||||
| Total Common Stocks | ||||||||
| (Cost $608,532) | 735,072 | |||||||
| EXCHANGE TRADED FUNDS† - 97.3% | ||||||||
| UNITED STATES OF AMERICA - 64.8% | ||||||||
| Vanguard Dividend Appreciation ETF | 215,897 | 16,244,091 | ||||||
| Financial Select Sector SPDR Fund | 465,600 | 10,178,016 | ||||||
| Technology Select Sector SPDR Fund | 274,200 | 9,799,908 | ||||||
| iShares Russell 1000 Growth ETF | 103,794 | 8,921,094 | ||||||
| Powershares QQQ Trust Series 1 | 98,300 | 8,646,468 | ||||||
| Energy Select Sector SPDR Fund1 | 87,100 | 7,709,221 | ||||||
| iShares MSCI USA Quality Factor ETF | 135,900 | 7,681,068 | ||||||
| Vanguard Large-Capital ETF | 78,400 | 6,648,320 | ||||||
| Vanguard Mega Capital ETF1 | 87,799 | 5,545,385 | ||||||
| Consumer Staples Select | ||||||||
| Sector SPDR Fund1 | 99,300 | 4,267,914 | ||||||
| Health Care Select Sector SPDR Fund | 67,800 | 3,758,832 | ||||||
| Vanguard Information Technology ETF1 | 23,500 | 2,103,720 | ||||||
| SPDR S&P 500 ETF Trust | 11,147 | 2,058,516 | ||||||
| iShares US Pharmaceuticals ETF | 16,700 | 1,972,243 | ||||||
| iShares North American Tech-Software ETF1 | 21,600 | 1,772,712 | ||||||
| iShares Russell 3000 ETF1 | 15,200 | 1,681,880 | ||||||
| iShares S&P 100 ETF | 20,200 | 1,663,470 | ||||||
| SPDR S&P Insurance ETF | 15,100 | 952,659 | ||||||
| Total United States of America | 101,605,517 | |||||||
| GLOBAL - 23.3% | ||||||||
| iShares MSCI EAFE ETF | 172,400 | 11,561,144 | ||||||
| PowerShares International | ||||||||
| Dividend Achievers Portfolio | 439,100 | 8,097,004 | ||||||
| iShares Global 100 ETF1 | 93,100 | 7,199,423 | ||||||
| Vanguard FTSE All-World ex-US ETF1 | 89,200 | 4,525,116 | ||||||
| iShares Russell Top 200 Growth ETF1 | 63,500 | 2,867,660 | ||||||
| PowerShares DB Agriculture Fund*,1 | 94,600 | 2,294,996 | ||||||
| Total Global | 36,545,343 | |||||||
| EMERGING MARKETS - 6.0% | ||||||||
| WisdomTree Emerging Markets Equity | ||||||||
| Income Fund | 151,700 | 7,741,251 | ||||||
| iShares MSCI Emerging Markets ETF | 40,100 | 1,674,977 | ||||||
| Total Emerging Markets | 9,416,228 | |||||||
| EUROPEAN UNION - 2.4% | ||||||||
| iShares MSCI EMU ETF | 92,300 | 3,819,374 | ||||||
| EUROPE - 0.8% | ||||||||
| Vanguard FTSE Europe ETF | 21,800 | 1,281,840 | ||||||
| Total Exchange Traded Funds | ||||||||
| (Cost $127,292,633) | 152,668,302 | |||||||
| SHORT TERM INVESTMENTS† - 0.9% | ||||||||
| First American Treasury Obligations Fund | 1,386,099 | 1,386,099 | ||||||
| Total Short Term Investments | ||||||||
| (Cost $1,386,099) | 1,386,099 | |||||||
| Face | ||||||||
| Amount | ||||||||
| SECURITIES LENDING COLLATERAL††,2 - 12.8% | ||||||||
| Repurchase Agreements | ||||||||
| HSBC Securities, Inc. | ||||||||
| issued 12/31/13 at 0.01% | ||||||||
| due 01/02/14 | $ | 17,513,051 | 17,513,051 | |||||
| Deutsche Bank Securities, Inc. | ||||||||
| issued 12/31/13 at 0.02% | ||||||||
| due 01/02/14 | 2,581,424 | 2,581,424 | ||||||
| Total Securities Lending Collateral | ||||||||
| (Cost $20,094,475) | 20,094,475 | |||||||
| Total Investments - 111.5% | ||||||||
| (Cost $149,381,739) | $ | 174,883,948 | ||||||
| Other Assets & Liabilities, net - (11.5)% | (18,068,285 | ) | ||||||
| Total Net Assets - 100.0% | $ | 156,815,663 | ||||||
| * | Non-income producing security. |
| † | Value determined based on Level 1 inputs — See Note 4. |
| †† | Value determined based on Level 2 inputs — See Note 4. |
| 1 | All or portion of this security is on loan at December 31, 2013 — See Note 9. |
| 2 | Securities lending collateral — See Note 9. |
| 10 | the GUGGENHEIM FUNDS annual report | See Notes to Financial Statements. |
| amerigo fund |
| STATEMENT OF ASSETS |
| AND LIABILITIES |
| December 31, 2013 |
| Assets: | ||||
| Investments, at value - including | ||||
| $19,757,198 of securities loaned | ||||
| (cost $129,287,264) | $ | 154,789,473 | ||
| Repurchase agreements, at value | ||||
| (cost $20,094,475) | 20,094,475 | |||
| Total investments | ||||
| (cost $149,381,739) | 174,883,948 | |||
| Receivables: | ||||
| Securities sold | 2,134,967 | |||
| Dividends | 295,850 | |||
| Fund shares sold | 38,319 | |||
| Interest and securities lending income | 12,629 | |||
| Total assets | 177,365,713 | |||
| Liabilities: | ||||
| Payable for: | ||||
| Upon return of securities loaned | 20,094,475 | |||
| Management fees | 113,802 | |||
| Fund shares redeemed | 61,922 | |||
| Transfer agent and administrative fees | 31,612 | |||
| Investor service fees | 31,612 | |||
| Portfolio accounting fees | 12,644 | |||
| Miscellaneous | 203,983 | |||
| Total liabilities | 20,550,050 | |||
| Net assets | $ | 156,815,663 | ||
| Net assets consist of: | ||||
| Paid in capital | $ | 145,820,757 | ||
| Undistributed net investment income | 471,586 | |||
| Accumulated net realized loss on investments | (14,978,889 | ) | ||
| Net unrealized appreciation on investments | 25,502,209 | |||
| Net assets | $ | 156,815,663 | ||
| Capital shares outstanding | 3,709,283 | |||
| Net asset value per share | $ | 42.28 |
| STATEMENT OF |
| OPERATIONS |
| Year Ended December 31, 2013 |
| Investment income: | ||||
| Dividends | $ | 2,621,156 | ||
| Income from securities lending, net | 161,122 | |||
| Total investment income | 2,782,278 | |||
| Expenses: | ||||
| Management fees | 1,287,020 | |||
| Transfer agent and administrative fees | 357,505 | |||
| Investor service fees | 357,505 | |||
| Portfolio accounting fees | 143,001 | |||
| Professional fees | 127,714 | |||
| Custodian fees | 16,176 | |||
| Trustees’ fees* | 15,176 | |||
| Line of credit interest expense | 137 | |||
| Miscellaneous | 105,826 | |||
| Total expenses | 2,410,060 | |||
| Net investment income | 372,218 | |||
| Net Realized and Unrealized Gain (Loss): | ||||
| Net realized gain (loss) on: | ||||
| Investments in unaffiliated issuers | 17,470,683 | |||
| Investments in affiliated issuers | 268,950 | |||
| Net realized gain | 17,739,633 | |||
| Net change in unrealized appreciation (depreciation) on: | ||||
| Investments in unaffiliated issuers | 12,352,728 | |||
| Investments in affiliated issuers | (156,907 | ) | ||
| Net change in unrealized appreciation (depreciation) | 12,195,821 | |||
| Net realized and unrealized gain | 29,935,454 | |||
| Net increase in net assets resulting from operations | $ | 30,307,672 |
| * | Relates to Trustees not deemed “interested persons” within the meaning of Section 2(a)(19) of the 1940 Act. |
| See Notes to Financial Statements. | The GUGGENHEIM FUNDS annual report | 11 |
| amerigo fund |
| STATEMENTS OF CHANGES IN NET ASSETS |
| Year Ended | Year Ended | |||||||
| December 31, | December 31, | |||||||
| 2013 | 2012 | |||||||
| Increase (Decrease) In Net Assets From Operations: | ||||||||
| Net investment income | $ | 372,218 | $ | 38,624 | ||||
| Net realized gain on investments | 17,739,633 | 6,182,317 | ||||||
| Net change in unrealized appreciation (depreciation) on investments | 12,195,821 | 11,973,923 | ||||||
| Net increase in net assets resulting from operations | 30,307,672 | 18,194,864 | ||||||
| Distributions to shareholders from: | ||||||||
| Net investment income | (21,720 | ) | — | |||||
| Net realized gains | — | (7,691,849 | ) | |||||
| Total distributions to shareholders | (21,720 | ) | (7,691,849 | ) | ||||
| Capital share transactions: | ||||||||
| Proceeds from sale of shares | 25,962,205 | 16,971,804 | ||||||
| Distributions reinvested | 21,720 | 7,691,849 | ||||||
| Cost of shares redeemed | (32,615,080 | ) | (46,215,705 | ) | ||||
| Net decrease from capital share transactions | (6,631,155 | ) | (21,552,052 | ) | ||||
| Net increase (decrease) in net assets | 23,654,797 | (11,049,037 | ) | |||||
| Net assets: | ||||||||
| Beginning of year | 133,160,866 | 144,209,903 | ||||||
| End of year | $ | 156,815,663 | $ | 133,160,866 | ||||
| Undistributed net investment income at end of year | $ | 471,586 | $ | 283,587 | ||||
| Capital share activity: | ||||||||
| Shares sold | 681,676 | 488,481 | ||||||
| Shares issued from reinvestment of distributions | 528 | 233,724 | ||||||
| Shares redeemed | (860,277 | ) | (1,340,624 | ) | ||||
| Net decrease in shares | (178,073 | ) | (618,419 | ) | ||||
| 12 | the GUGGENHEIM FUNDS annual report | See Notes to Financial Statements. |
| amerigo fund |
| FINANCIAL HIGHLIGHTS |
This table is presented to show selected data for a share outstanding throughout each period and to assist shareholders in evaluating a Fund’s performance for the periods presented.
| Year Ended | Year Ended | Year Ended | Year Ended | Year Ended | ||||||||||||||||
| December 31, | December 31, | December 31, | December 31, | December 31, | ||||||||||||||||
| 2013 | 2012 | 2011 | 2010 | 2009 | ||||||||||||||||
| Per Share Data | ||||||||||||||||||||
| Net asset value, beginning of period | $ | 34.25 | $ | 32.01 | $ | 34.53 | $ | 30.01 | $ | 21.64 | ||||||||||
| Income (loss) from investment operations: | ||||||||||||||||||||
| Net investment income (loss)a | .10 | .01 | (.03 | ) | (.04 | ) | .03 | |||||||||||||
| Net gain (loss) on investments (realized and unrealized) | 7.94 | 4.28 | (2.49 | ) | 4.59 | 8.49 | ||||||||||||||
| Total from investment operations | 8.04 | 4.29 | (2.52 | ) | 4.55 | 8.52 | ||||||||||||||
| Less distributions from: | ||||||||||||||||||||
| Net investment income | (.01 | ) | — | — | (.03 | ) | (.15 | ) | ||||||||||||
| Net realized gains | — | (2.05 | ) | — | — | — | ||||||||||||||
| Total distributions | (.01 | ) | (2.05 | ) | — | (.03 | ) | (.15 | ) | |||||||||||
| Net asset value, end of period | $ | 42.28 | $ | 34.25 | $ | 32.01 | $ | 34.53 | $ | 30.01 | ||||||||||
| Total Returnb | 23.43 | % | 13.71 | % | (7.30 | %) | 15.13 | % | 39.41 | % | ||||||||||
| Ratios/Supplemental Data | ||||||||||||||||||||
| Net assets, end of period (in thousands) | $ | 156,816 | $ | 133,161 | $ | 144,210 | $ | 199,487 | $ | 213,072 | ||||||||||
| Ratios to average net assets: | ||||||||||||||||||||
| Net investment income (loss) | 0.26 | % | 0.03 | % | (0.09 | %) | (0.13 | %) | 0.12 | % | ||||||||||
| Total expensesc | 1.69 | % | 1.72 | % | 1.76 | % | 1.70 | % | 1.71 | % | ||||||||||
| Portfolio turnover rate | 90 | % | 19 | % | 48 | % | 77 | % | 102 | % | ||||||||||
| a | Net investment income (loss) per share was computed using average shares outstanding throughout the period. |
| b | Total return does not reflect the impact of any additional fees charged by insurance companies. |
| c | Does not include expenses of the underlying funds in which the Fund invests. |
| See Notes to Financial Statements. | The GUGGENHEIM FUNDS annual report | 13 |
| PERFORMANCE REPORT AND FUND PROFILE (Unaudited) | December 31, 2013 |
CLERMONT FUND
OBJECTIVE: Seeks a combination of current income and growth of capital.
Clermont Fund returned 10.17% for the one-year period ended December 31, 2013, compared with its blended benchmark, consisting of 45% S&P 500® Index and 55% Barclays U.S. Credit Index, which gained 12.37%.
During the year, domestic small-cap growth, health care, and consumer discretionary stocks outperformed most other asset classes.
Equity exposure was pared back slightly in an effort to reduce risk in the portfolio as we believed that a mature bull market, higher valuations, and elevated bullish investor sentiment all warranted slightly more defensive positioning within the Fund.
Allocations over this period included an increase to domestic large-cap growth stocks, particularly technology, and developed international exposure, particularly that of developed Europe. Both domestic large-cap growth stocks and European stocks look attractive from a relative valuation perspective. In addition, Clermont Fund has had an emphasis in allocating overweight positions to high quality stocks, as these types of companies tend to have more stable earnings during slow-growth environments.
Within the Fund’s fixed income allocations, we increased positioning to Treasury Inflation Protection Securities in an effort to improve the credit quality of the Fund as credit spreads are tighter than they have been historically. In addition, the Fund’s bond positioning continues to be shorter duration than our fixed income benchmarks in an effort to mitigate the risk of potentially rising interest rates.
Performance displayed represents past performance, which is no guarantee of future results.
Holdings Diversification (Market Exposure as % of Net Assets)

“Holdings Diversification (Market Exposure as % of Net Assets)” excludes any temporary cash investments.
Inception Date: July 1, 2003
| Ten Largest Holdings (% of Total Net Assets) | ||||
| Vanguard Dividend Appreciation ETF | 11.9 | % | ||
| iShares TIPS Bond ETF | 9.7 | % | ||
| iShares Floating Rate Bond ETF | 7.5 | % | ||
| PIMCO Enhanced Short Maturity Exchange-Traded Fund | 5.7 | % | ||
| PowerShares International Dividend Achievers Portfolio | 5.6 | % | ||
| iShares Global 100 ETF | 4.9 | % | ||
| PowerShares Senior Loan Portfolio | 3.8 | % | ||
| Technology Select Sector SPDR Fund | 3.4 | % | ||
| iShares MSCI USA Quality Factor ETF | 3.4 | % | ||
| Pimco Total Return ETF | 3.3 | % | ||
| Top Ten Total | 59.2 | % | ||
“Ten Largest Holdings” exclude any temporary cash or derivative investments.
| 14 | the GUGGENHEIM FUNDS annual report |
| PERFORMANCE REPORT AND FUND PROFILE (Unaudited) (concluded) |
Cumulative Fund Performance*,†

Average Annual Returns
Periods Ended December 31, 2013*,†
| 1 Year | 5 Year | 10 Year | ||||||||||
| Clermont Fund | 10.17% | 10.61% | 3.90% | |||||||||
| S&P 500 Index | 32.39% | 17.94% | 7.41% | |||||||||
| Synthetic Balanced Benchmark†† | 12.37% | 12.63% | 6.46% |
| * | The performance data above represents past performance that is not predictive of future results. The investment return and principal value of an investment in the Fund will fluctuate so that an investor’s shares, when redeemed, may be worth more or less than their original cost. Returns are historical and include changes in principal and reinvested dividends and capital gains and do not reflect the effect of taxes. The S&P 500 Index and Barclays U.S. Credit Index are unmanaged indices and, unlike the Fund, have no management fees or operating expenses to reduce their reported returns. |
| † | Returns do not reflect the impact of any additional fees charged by insurance companies. |
| †† | Benchmark reflects a 45/55 ratio of the performance of the S&P 500 Index and the Barclays U.S. Credit Index. |
| the GUGGENHEIM FUNDS annual report | 15 |
| SCHEDULE OF INVESTMENTS | December 31, 2013 |
| CLERMONT FUND | |
| Shares | Value | |||||||
| EXCHANGE TRADED FUNDS† - 99.1% | ||||||||
| UNITED STATES OF AMERICA - 71.9% | ||||||||
| Vanguard Dividend Appreciation ETF | 123,600 | $ | 9,299,664 | |||||
| iShares TIPS Bond ETF | 69,150 | 7,599,585 | ||||||
| iShares Floating Rate Bond ETF | 115,506 | 5,858,464 | ||||||
| PowerShares Senior Loan Portfolio1 | 118,500 | 2,948,280 | ||||||
| Technology Select Sector SPDR Fund | 75,200 | 2,687,648 | ||||||
| iShares MSCI USA Quality Factor ETF | 47,187 | 2,667,009 | ||||||
| iShares 1-3 Year Credit Bond ETF | 22,400 | 2,362,304 | ||||||
| SPDR Barclays Short Term | ||||||||
| Corporate Bond ETF1 | 76,550 | 2,349,320 | ||||||
| iShares iBoxx $ High Yield | ||||||||
| Corporate Bond ETF | 23,700 | 2,201,256 | ||||||
| Financial Select Sector SPDR Fund | 96,700 | 2,113,862 | ||||||
| iShares iBoxx $ Investment Grade | ||||||||
| Corporate Bond ETF1 | 18,500 | 2,112,885 | ||||||
| ProShares Short Russell2000* | 97,438 | 1,645,728 | ||||||
| Powershares QQQ Trust Series 1 | 16,442 | 1,446,238 | ||||||
| PIMCO 0-5 Year High Yield | ||||||||
| Corporate Bond Index | ||||||||
| Exchange-Traded Fund | 11,000 | 1,169,960 | ||||||
| Guggenheim BulletShares 2014 | ||||||||
| Corporate Bond ETF1,3 | 51,000 | 1,083,750 | ||||||
| Health Care Select Sector SPDR Fund | 19,500 | 1,081,080 | ||||||
| iShares Russell 1000 Growth ETF | 12,200 | 1,048,590 | ||||||
| Alerian MLP ETF1 | 53,900 | 958,881 | ||||||
| iShares North American | ||||||||
| Tech-Software ETF1 | 10,300 | 845,321 | ||||||
| RevenueShares Large Capital ETF | 22,000 | 802,560 | ||||||
| SPDR S&P 500 ETF Trust | 4,200 | 775,614 | ||||||
| PowerShares S&P 500 High | ||||||||
| Quality Portfolio1 | 33,000 | 673,563 | ||||||
| Vanguard Information Technology ETF | 6,500 | 581,880 | ||||||
| iShares 20+ Year Treasury Bond ETF1 | 5,000 | 509,300 | ||||||
| Vanguard Intermediate-Term | ||||||||
| Corporate Bond ETF | 5,900 | 487,930 | ||||||
| Schwab U.S. TIPs ETF | 9,000 | 474,930 | ||||||
| SPDR Nuveen Barclays Short Term | ||||||||
| Municipal Bond ETF | 16,500 | 400,785 | ||||||
| Energy Select Sector SPDR Fund | 1,100 | 97,361 | ||||||
| WisdomTree Managed | ||||||||
| Futures Strategy Fund* | 1,300 | 54,002 | ||||||
| Total United States of America | 56,337,750 | |||||||
| GLOBAL - 23.2% | ||||||||
| PIMCO Enhanced Short | ||||||||
| Maturity Exchange-Traded Fund | 44,200 | 4,477,460 | ||||||
| PowerShares International | ||||||||
| Dividend Achievers Portfolio | 237,200 | 4,373,968 | ||||||
| iShares Global 100 ETF | 49,700 | 3,843,301 | ||||||
| Pimco Total Return ETF | 24,500 | 2,566,130 | ||||||
| Vanguard FTSE All-World ex-US ETF1 | 37,800 | 1,917,594 | ||||||
| PowerShares DB Agriculture Fund* | 40,692 | 987,188 | ||||||
| Total Global | 18,165,641 | |||||||
| EMERGING MARKETS - 2.2% | ||||||||
| WisdomTree Emerging Markets | ||||||||
| Equity Income Fund1 | 33,900 | 1,729,917 | ||||||
| EUROPEAN UNION - 1.8% | ||||||||
| iShares MSCI EMU ETF | 34,700 | 1,435,886 | ||||||
| Total Exchange Traded Funds | ||||||||
| (Cost $72,152,085) | 77,669,194 | |||||||
| SHORT TERM INVESTMENTS† - 1.9% | ||||||||
| First American Treasury Obligations Fund | 1,473,506 | 1,473,506 | ||||||
| Total Short Term Investments | ||||||||
| (Cost $1,473,506) | 1,473,506 | |||||||
| Face | ||||||||
| Amount | ||||||||
| SECURITIES LENDING COLLATERAL††,2 - 12.8% | ||||||||
| Repurchase Agreements | ||||||||
| HSBC Securities, Inc. | ||||||||
| issued 12/31/13 at 0.01% | ||||||||
| due 01/02/14 | $ | 8,746,579 | 8,746,579 | |||||
| Deutsche Bank Securities, Inc. | ||||||||
| issued 12/31/13 at 0.02% | ||||||||
| due 01/02/14 | 1,289,246 | 1,289,246 | ||||||
| Total Securities Lending Collateral | ||||||||
| (Cost $10,035,825) | 10,035,825 | |||||||
| Total Investments - 113.8% | ||||||||
| (Cost $83,661,416) | $ | 89,178,525 | ||||||
| Other Assets & Liabilities, net - (13.8)% | (10,802,660 | ) | ||||||
| Total Net Assets - 100.0% | $ | 78,375,865 | ||||||
| * | Non-income producing security. |
| † | Value determined based on Level 1 inputs — See Note 4. |
| †† | Value determined based on Level 2 inputs — See Note 4. |
| 1 | All or portion of this security is on loan at December 31, 2013 — See Note 9. |
| 2 | Securities lending collateral — See Note 9. |
| 3 | Investment in a product that pays a management fee to a party related to the advisor. |
| 16 | the GUGGENHEIM FUNDS annual report | See Notes to Financial Statements. |
| clermont fund |
| STATEMENT OF ASSETS |
| AND LIABILITIES |
| December 31, 2013 |
| Assets: | ||||
| Investments, at value - including $9,763,920 | ||||
| of securities loaned | ||||
| (cost $73,625,591) | $ | 79,142,700 | ||
| Repurchase agreements, at value | ||||
| (cost $10,035,825) | 10,035,825 | |||
| Total investments | ||||
| (cost $83,661,416) | 89,178,525 | |||
| Receivables: | ||||
| Securities sold | 284,399 | |||
| Dividends | 119,901 | |||
| Fund shares sold | 71,641 | |||
| Interest and securities lending income | 20,720 | |||
| Total assets | 89,675,186 | |||
| Liabilities: | ||||
| Payable for: | ||||
| Upon return of securities loaned | 10,035,825 | |||
| Securities purchased | 1,037,666 | |||
| Management fees | 57,408 | |||
| Fund shares redeemed | 20,170 | |||
| Transfer agent and administrative fees | 15,947 | |||
| Investor service fees | 15,947 | |||
| Portfolio accounting fees | 6,379 | |||
| Miscellaneous | 109,979 | |||
| Total liabilities | 11,299,321 | |||
| Net assets | $ | 78,375,865 | ||
| Net assets consist of: | ||||
| Paid in capital | $ | 69,941,951 | ||
| Undistributed net investment income | 480,721 | |||
| Accumulated net realized gain on investments | 2,436,084 | |||
| Net unrealized appreciation on investments | 5,517,109 | |||
| Net assets | $ | 78,375,865 | ||
| Capital shares outstanding | 2,923,527 | |||
| Net asset value per share | $ | 26.81 |
| STATEMENT OF |
| OPERATIONS |
| Year Ended December 31, 2013 |
| Investment Income: | ||||
| Dividends | $ | 1,577,002 | ||
| Income from securities lending, net | 138,401 | |||
| Interest | 20,873 | |||
| Total investment income | 1,736,276 | |||
| Expenses: | ||||
| Management fees | 690,173 | |||
| Transfer agent and administrative fees | 191,715 | |||
| Investor service fees | 191,715 | |||
| Portfolio accounting fees | 76,685 | |||
| Professional fees | 69,402 | |||
| Custodian fees | 8,620 | |||
| Trustees’ fees* | 8,417 | |||
| Line of credit interest expense | 89 | |||
| Miscellaneous | 56,063 | |||
| Total expenses | 1,292,879 | |||
| Net investment income | 443,397 | |||
| Net Realized and Unrealized Gain (Loss): | ||||
| Net realized gain (loss) on: | ||||
| Investments | 5,957,412 | |||
| Net realized gain | 5,957,412 | |||
| Net change in unrealized appreciation | ||||
| (depreciation) on: | ||||
| Investments | 1,036,949 | |||
| Net change in unrealized appreciation | ||||
| (depreciation) | 1,036,949 | |||
| Net realized and unrealized gain | 6,994,361 | |||
| Net increase in net assets resulting | ||||
| from operations | $ | 7,437,758 |
* Relates to Trustees not deemed “interested persons” within the meaning of Section 2(a)(19) of the 1940 Act.
| See Notes to Financial Statements. | The GUGGENHEIM FUNDS annual report | 17 |
| clermont fund |
| STATEMENTS OF CHANGES IN NET ASSETS |
| Year Ended | Year Ended | |||||||
| December 31, | December 31, | |||||||
| 2013 | 2012 | |||||||
| Increase (Decrease) In Net Assets From Operations: | ||||||||
| Net investment income | $ | 443,397 | $ | 1,173,203 | ||||
| Net realized gain on investments | 5,957,412 | 5,446,808 | ||||||
| Net change in unrealized appreciation (depreciation) on investments | 1,036,949 | 1,111,898 | ||||||
| Net increase in net assets resulting from operations | 7,437,758 | 7,731,909 | ||||||
| Distributions to shareholders from: | ||||||||
| Net investment income | (1,163,542 | ) | (1,203,713 | ) | ||||
| Net realized gains | (1,760,517 | ) | — | |||||
| Total distributions to shareholders | (2,924,059 | ) | (1,203,713 | ) | ||||
| Capital share transactions: | ||||||||
| Proceeds from sale of shares | 18,035,766 | 20,118,272 | ||||||
| Distributions reinvested | 2,924,059 | 1,203,713 | ||||||
| Cost of shares redeemed | (23,282,630 | ) | (27,249,917 | ) | ||||
| Net decrease from capital share transactions | (2,322,805 | ) | (5,927,932 | ) | ||||
| Net increase in net assets | 2,190,894 | 600,264 | ||||||
| Net assets: | ||||||||
| Beginning of year | 76,184,971 | 75,584,707 | ||||||
| End of year | $ | 78,375,865 | $ | 76,184,971 | ||||
| Undistributed net investment income at end of year | $ | 480,721 | $ | 1,301,755 | ||||
| Capital share activity: | ||||||||
| Shares sold | 679,318 | 808,363 | ||||||
| Shares issued from reinvestment of distributions | 110,259 | 48,596 | ||||||
| Shares redeemed | (880,068 | ) | (1,100,577 | ) | ||||
| Net decrease in shares | (90,491 | ) | (243,618 | ) | ||||
| 18 | the GUGGENHEIM FUNDS annual report | See Notes to Financial Statements. |
| clermont fund |
| FINANCIAL HIGHLIGHTS |
This table is presented to show selected data for a share outstanding throughout each period and to assist shareholders in evaluating a Fund’s performance for the periods presented.
| Year Ended | Year Ended | Year Ended | Year Ended | Year Ended | ||||||||||||||||
| December 31, | December 31, | December 31, | December 31, | December 31, | ||||||||||||||||
| 2013 | 2012 | 2011 | 2010 | 2009 | ||||||||||||||||
| Per Share Data | ||||||||||||||||||||
| Net asset value, beginning of period | $ | 25.28 | $ | 23.20 | $ | 23.69 | $ | 21.73 | $ | 18.09 | ||||||||||
| Income (loss) from investment operations: | ||||||||||||||||||||
| Net investment incomea | .15 | .38 | .36 | .44 | .47 | |||||||||||||||
| Net gain (loss) on investments (realized and unrealized) | 2.41 | 2.11 | (.43 | ) | 1.94 | 3.61 | ||||||||||||||
| Total from investment operations | 2.56 | 2.49 | (.07 | ) | 2.38 | 4.08 | ||||||||||||||
| Less distributions from: | ||||||||||||||||||||
| Net investment income | (.41 | ) | (.41 | ) | (.42 | ) | (.42 | ) | (.44 | ) | ||||||||||
| Net realized gains | (.62 | ) | — | — | — | — | ||||||||||||||
| Total distributions | (1.03 | ) | (.41 | ) | (.42 | ) | (.42 | ) | (.44 | ) | ||||||||||
| Net asset value, end of period | $ | 26.81 | $ | 25.28 | $ | 23.20 | $ | 23.69 | $ | 21.73 | ||||||||||
| Total Returnb | 10.17 | % | 10.79 | % | (0.28 | %) | 10.99 | % | 22.58 | % | ||||||||||
| Ratios/Supplemental Data | ||||||||||||||||||||
| Net assets, end of period (in thousands) | $ | 78,376 | $ | 76,185 | $ | 75,585 | $ | 74,048 | $ | 66,803 | ||||||||||
| Ratios to average net assets: | ||||||||||||||||||||
| Net investment income | 0.58 | % | 1.54 | % | 1.50 | % | 1.97 | % | 2.41 | % | ||||||||||
| Total expensesc | 1.69 | % | 1.72 | % | 1.75 | % | 1.71 | % | 1.70 | % | ||||||||||
| Portfolio turnover rate | 94 | % | 46 | % | 28 | % | 68 | % | 128 | % | ||||||||||
| a | Net investment income per share was computed using average shares outstanding throughout the period. |
| b | Total return does not reflect the impact of any additional fees charged by insurance companies. |
| c | Does not include expenses of the underlying funds in which the Fund invests. |
| See Notes to Financial Statements. | The GUGGENHEIM FUNDS annual report | 19 |
| performance report and FUND PROFILE (Unaudited) | December 31, 2013 |
select allocation FUND
OBJECTIVE: Seeks to provide total return, consisting of capital growth and income.
Select Allocation Fund returned 18.75% for the one-year period ended December 31, 2013, compared with its blended benchmark, 75% S&P 500® Index and 25% Barclays U.S. Credit Index, which gained 22.94%.
As equity prices moved higher, equity exposure was trimmed to an underweight position. This underweight position hampered further advancement, but is designed to mitigate losses in the event of a correction. Conservative holdings are focused on less interest rate sensitive bonds, such as floating rate bank loans and short-term credit.
International equities continued to lag domestic equities during the time period, which did weigh on the Fund’s performance. An underweight to commodities was a positive for performance, while an underweight to consumer discretionary stocks detracted from performance.
Portfolio repositioning during the year brought down equity exposure while increasing exposure to developed international. Equity investments were also shifted away from value-oriented sectors toward growth sectors such as technology, basic materials and industrials. The Fund maintained its overweight position to technology as its strongest sector overweight.
Performance displayed represents past performance, which is no guarantee of future results.
Holdings Diversification (Market Exposure as % of Net Assets)
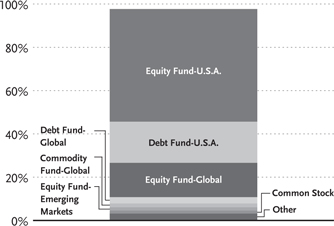
“Holdings Diversification (Market Exposure as % of Net Assets)” excludes any temporary cash investments.
Inception Date: November 10, 2006
| Ten Largest Holdings (% of Total Net Assets) | ||||
| iShares MSCI EAFE ETF | 9.1 | % | ||
| Powershares QQQ Trust Series 1 | 5.4 | % | ||
| SPDR Dow Jones Industrial Average ETF Trust | 5.2 | % | ||
| iShares MSCI ACWI ex US ETF | 5.1 | % | ||
| SPDR Barclays Short Term Corporate Bond ETF | 3.9 | % | ||
| Energy Select Sector SPDR Fund | 3.6 | % | ||
| PIMCO 0-5 Year High Yield Corporate Bond Index Exchange-Traded Fund | 3.6 | % | ||
| iShares Floating Rate Bond ETF | 3.5 | % | ||
| SPDR S&P MidCap 400 ETF Trust | 3.5 | % | ||
| Vanguard Growth ETF | 3.5 | % | ||
| Top Ten Total | 46.4 | % | ||
“Ten Largest Holdings” exclude any temporary cash or derivative investments.
| 20 | the GUGGENHEIM FUNDS annual report |
| performance report and FUND PROFILE (Unaudited) (concluded) |
Cumulative Fund Performance*,†

Average Annual Returns
Periods Ended December 31, 2013*,†
| Since | ||||||||||||
| Inception | ||||||||||||
| 1 Year | 5 Year | (11/10/06) | ||||||||||
| Select Allocation Fund | 18.75% | 14.58% | 4.32% | % | ||||||||
| S&P 500 Index | 32.39% | 17.94% | 6.45% | % | ||||||||
| Synthetic Balanced Benchmark†† | 22.94% | 15.60% | 6.55% | % | ||||||||
| * | The performance data above represents past performance that is not predictive of future results. The investment return and principal value of an investment in the Fund will fluctuate so that an investor’s shares, when redeemed, may be worth more or less than their original cost. Returns are historical and include changes in principal and reinvested dividends and capital gains and do not reflect the effect of taxes. The S&P 500 Index and Barclays U.S. Credit Index are unmanaged indices and, unlike the Fund, have no management fees or operating expenses to reduce their reported returns. |
| † | Returns do not reflect the impact of any additional fees charged by insurance companies. |
| †† | Benchmark reflects a 75/25 ratio of the performance of the S&P 500 Index and the Barclays U.S. Credit Index. |
| the GUGGENHEIM FUNDS annual report | 21 |
| Schedule of Investments | December 31, 2013 |
| Select Allocation FUND |
| Shares | Value | |||||||
| COMMON STOCKS† - 1.4% | ||||||||
| Financials - 1.4% | ||||||||
| Berkshire Hathaway, Inc. — Class B* | 3,070 | $ | 363,979 | |||||
| Total Common Stocks | ||||||||
| (Cost $296,274) | 363,979 | |||||||
| EXCHANGE TRADED FUNDS† - 96.0% | ||||||||
| United States of America - 72.0% | ||||||||
| Powershares QQQ Trust Series 1 | 16,392 | 1,441,839 | ||||||
| SPDR Dow Jones Industrial | ||||||||
| Average ETF Trust | 8,364 | 1,383,990 | ||||||
| SPDR Barclays Short Term | ||||||||
| Corporate Bond ETF | 33,930 | 1,041,312 | ||||||
| Energy Select Sector SPDR Fund1 | 10,863 | 961,484 | ||||||
| PIMCO 0-5 Year High Yield | ||||||||
| Corporate Bond Index | ||||||||
| Exchange-Traded Fund | 8,996 | 956,815 | ||||||
| iShares Floating Rate Bond ETF | 18,685 | 947,703 | ||||||
| SPDR S&P MidCap 400 ETF Trust | 3,880 | 947,496 | ||||||
| Vanguard Growth ETF | 9,971 | 927,802 | ||||||
| Vanguard Large-Capital ETF | 10,640 | 902,272 | ||||||
| Vanguard Total Stock Market ETF | 7,560 | 725,155 | ||||||
| iShares Core S&P 500 ETF | 3,740 | 694,331 | ||||||
| SPDR S&P 500 ETF Trust | 3,710 | 685,126 | ||||||
| Industrial Select Sector SPDR Fund | 12,872 | 672,691 | ||||||
| Vanguard Small-Capital ETF1 | 6,100 | 670,695 | ||||||
| Vanguard Information Technology ETF | 7,200 | 644,544 | ||||||
| iShares 1-3 Year Treasury Bond ETF | 6,660 | 561,971 | ||||||
| Vanguard Health Care ETF1 | 5,110 | 516,774 | ||||||
| SPDR Nuveen Barclays Short Term | ||||||||
| Municipal Bond ETF | 21,165 | 514,098 | ||||||
| iShares Russell 1000 Growth ETF | 5,948 | 511,231 | ||||||
| Technology Select Sector SPDR Fund | 13,216 | 472,340 | ||||||
| Financial Select Sector SPDR Fund | 19,610 | 428,675 | ||||||
| SPDR Barclays Short Term | ||||||||
| High Yield Bond ETF1 | 13,483 | 416,085 | ||||||
| iShares North American | ||||||||
| Tech-Software ETF1 | 4,344 | 356,512 | ||||||
| iShares Russell Mid-Capital ETF | 1,870 | 280,463 | ||||||
| iShares iBoxx $ High Yield | ||||||||
| Corporate Bond ETF | 3,010 | 279,569 | ||||||
| Vanguard Mega Capital Growth ETF | 3,800 | 275,424 | ||||||
| PowerShares DB US Dollar | ||||||||
| Index Bullish Fund* | 11,620 | 250,062 | ||||||
| Materials Select Sector SPDR Fund | 5,400 | 249,588 | ||||||
| iShares Credit Bond ETF | 2,270 | 242,663 | ||||||
| iShares 3-7 Year Treasury Bond ETF | 1,100 | 132,033 | ||||||
| ProShares Short Russell2000* | 6,300 | 106,407 | ||||||
| Market Vectors Wide Moat ETF | 2,778 | 80,118 | ||||||
| Total United States of America | 19,277,268 | |||||||
| Global - 20.6% | ||||||||
| iShares MSCI EAFE ETF | 36,306 | 2,434,681 | ||||||
| iShares MSCI ACWI ex US ETF | 29,093 | 1,358,061 | ||||||
| PIMCO Enhanced Short Maturity | ||||||||
| Exchange-Traded Fund | 7,783 | 788,418 | ||||||
| PowerShares DB Commodity | ||||||||
| Index Tracking Fund* | 12,691 | 325,524 | ||||||
| iShares MSCI Frontier 100 ETF | 8,191 | 276,364 | ||||||
| iShares Global Energy ETF | 4,626 | 199,936 | ||||||
| GreenHaven Continuous | ||||||||
| Commodity Index Fund* | 5,400 | 138,996 | ||||||
| Total Global | 5,521,980 | |||||||
| Emerging Markets - 2.5% | ||||||||
| iShares Core MSCI Emerging | ||||||||
| Markets ETF1 | 5,307 | 264,341 | ||||||
| iShares JP Morgan USD Emerging | ||||||||
| Markets Bond ETF1 | 2,323 | 251,256 | ||||||
| WisdomTree Emerging Markets | ||||||||
| SmallCap Dividend Fund | 3,350 | 154,402 | ||||||
| Total Emerging Markets | 669,999 | |||||||
| China - 0.5% | ||||||||
| Guggenheim China Small Capital ETF3 | 4,800 | 127,872 | ||||||
| Mexico - 0.4% | ||||||||
| iShares MSCI Mexico Capped ETF | 1,780 | 121,040 | ||||||
| Total Exchange Traded Funds | ||||||||
| (Cost $22,535,686) | 25,718,159 | |||||||
| SHORT TERM INVESTMENTS† - 3.5% | ||||||||
| First American Treasury | ||||||||
| Obligations Fund | 937,003 | 937,003 | ||||||
| Total Short Term Investments | ||||||||
| (Cost $937,003) | 937,003 | |||||||
| Face | ||||||||
| Amount | ||||||||
| SECURITIES LENDING COLLATERAL††,2 - 9.0% | ||||||||
| Repurchase Agreements | ||||||||
| HSBC Securities, Inc. | ||||||||
| issued 12/31/13 at 0.01% | ||||||||
| due 01/02/14 | $ | 2,096,915 | 2,096,915 | |||||
| Deutsche Bank Securities, Inc. | ||||||||
| issued 12/31/13 at 0.02% | ||||||||
| due 01/02/14 | 309,085 | 309,085 | ||||||
| Total Securities Lending Collateral | ||||||||
| (Cost $2,406,000) | 2,406,000 | |||||||
| Total Investments - 109.9% | ||||||||
| (Cost $26,174,963) | $ | 29,425,141 | ||||||
| Other Assets & Liabilities, net - (9.9)% | (2,654,137 | ) | ||||||
| Total Net Assets - 100.0% | $ | 26,771,004 | ||||||
| * | Non-income producing security. |
| † | Value determined based on Level 1 inputs — See Note 4. |
| †† | Value determined based on Level 2 inputs — See Note 4. |
| 1 | All or portion of this security is on loan at December 31, 2013 — See Note 9. |
| 2 | Securities lending collateral — See Note 9. |
| 3 | Investment in a product that pays a management fee to a party related to the advisor. |
| 22 | the GUGGENHEIM FUNDS annual report | See Notes to Financial Statements. |
| Select Allocation FUND |
| STATEMENT OF ASSETS AND LIABILITIES |
December 31, 2013
| Assets: | ||||
| Investments, at value - including $2,361,042 of securities loaned | ||||
| (cost $23,768,963) | $ | 27,019,141 | ||
| Repurchase agreements, at value | ||||
| (cost $2,406,000) | 2,406,000 | |||
| Total investments | ||||
| (cost $26,174,963) | 29,425,141 | |||
| Receivables: | ||||
| Dividends | 46,047 | |||
| Fund shares sold | 35,844 | |||
| Interest and securities lending income | 5,498 | |||
| Total assets | 29,512,530 | |||
| Liabilities: | ||||
| Payable for: | ||||
| Upon return of securities loaned | 2,406,000 | |||
| Securities purchased | 249,995 | |||
| Management fees | 19,183 | |||
| Fund shares redeemed | 12,754 | |||
| Transfer agent and administrative fees | 5,329 | |||
| Investor service fees | 5,329 | |||
| Portfolio accounting fees | 2,131 | |||
| Miscellaneous | 40,805 | |||
| Total liabilities | 2,741,526 | |||
| Net assets | $ | 26,771,004 | ||
| Net assets consist of: | ||||
| Paid in capital | $ | 26,932,401 | ||
| Undistributed net investment income | 145,389 | |||
| Accumulated net realized loss on investments | (3,556,964 | ) | ||
| Net unrealized appreciation on investments | 3,250,178 | |||
| Net assets | $ | 26,771,004 | ||
| Capital shares outstanding | 913,033 | |||
| Net asset value per share | $ | 29.32 |
| STATEMENT OF OPERATIONS |
Year Ended December 31, 2013
| Investment Income: | ||||
| Dividends | $ | 561,581 | ||
| Income from securities lending, net | 37,186 | |||
| Interest | 15,164 | |||
| Total investment income | 613,931 | |||
| Expenses: | ||||
| Management fees | 251,497 | |||
| Transfer agent and administrative fees | 69,860 | |||
| Investor service fees | 69,860 | |||
| Portfolio accounting fees | 27,944 | |||
| Professional fees | 25,389 | |||
| Trustees’ fees* | 3,519 | |||
| Custodian fees | 3,128 | |||
| Line of credit interest expense | 1,047 | |||
| Miscellaneous | 20,679 | |||
| Total expenses | 472,923 | |||
| Net investment income | 141,008 | |||
| Net Realized and Unrealized Gain (Loss): | ||||
| Net realized gain (loss) on: | ||||
| Investments | 4,928,303 | |||
| Net realized gain | 4,928,303 | |||
| Net change in unrealized appreciation (depreciation) on: | ||||
| Investments | (343,922 | ) | ||
| Net change in unrealized appreciation (depreciation) | (343,922 | ) | ||
| Net realized and unrealized gain | 4,584,381 | |||
| Net increase in net assets resulting from operations | $ | 4,725,389 |
* Relates to Trustees not deemed “interested persons” within the meaning of Section 2(a)(19) of the 1940 Act.
| See Notes to Financial Statements. | The GUGGENHEIM FUNDS annual report | 23 |
| Select Allocation FUND |
STATEMENTS OF CHANGES IN NET ASSETS
| Year Ended | Year Ended | |||||||
| December 31, | December 31, | |||||||
| 2013 | 2012 | |||||||
| Increase (Decrease) In Net Assets From Operations: | ||||||||
| Net investment income | $ | 141,008 | $ | 388,783 | ||||
| Net realized gain on investments | 4,928,303 | 1,599,312 | ||||||
| Net change in unrealized appreciation (depreciation) on investments | (343,922 | ) | 1,955,531 | |||||
| Net increase in net assets resulting from operations | 4,725,389 | 3,943,626 | ||||||
| Distributions to shareholders from: | ||||||||
| Net investment income | (387,107 | ) | (370,966 | ) | ||||
| Total distributions to shareholders | (387,107 | ) | (370,966 | ) | ||||
| Capital share transactions: | ||||||||
| Proceeds from sale of shares | 5,460,041 | 5,033,478 | ||||||
| Distributions reinvested | 387,107 | 370,966 | ||||||
| Cost of shares redeemed | (15,579,040 | ) | (11,738,381 | ) | ||||
| Net decrease from capital share transactions | (9,731,892 | ) | (6,333,937 | ) | ||||
| Net decrease in net assets | (5,393,610 | ) | (2,761,277 | ) | ||||
| Net assets: | ||||||||
| Beginning of year | 32,164,614 | 34,925,891 | ||||||
| End of year | $ | 26,771,004 | $ | 32,164,614 | ||||
| Undistributed net investment income at end of year | $ | 145,389 | $ | 388,782 | ||||
| Capital share activity: | ||||||||
| Shares sold | 195,543 | 206,887 | ||||||
| Shares issued from reinvestment of distributions | 13,549 | 15,260 | ||||||
| Shares redeemed | (579,066 | ) | (487,108 | ) | ||||
| Net decrease in shares | (369,974 | ) | (264,961 | ) | ||||
| 24 | the GUGGENHEIM FUNDS annual report | See Notes to Financial Statements. |
| Select Allocation FUND |
| FINANCIAL HIGHLIGHTS |
This table is presented to show selected data for a share outstanding throughout each period and to assist shareholders in evaluating a Fund’s performance for the periods presented.
| Year Ended | Year Ended | Year Ended | Year Ended | Year Ended | ||||||||||||||||
| December 31, | December 31, | December 31, | December 31, | December 31, | ||||||||||||||||
| 2013 | 2012 | 2011 | 2010 | 2009 | ||||||||||||||||
| Per Share Data | ||||||||||||||||||||
| Net asset value, beginning of period | $ | 25.07 | $ | 22.56 | $ | 23.93 | $ | 21.39 | $ | 16.11 | ||||||||||
| Income (loss) from investment operations: | ||||||||||||||||||||
| Net investment incomea | .14 | .28 | .23 | .28 | .31 | |||||||||||||||
| Net gain (loss) on investments (realized and unrealized) | 4.55 | 2.51 | (1.25 | ) | 2.66 | 5.45 | ||||||||||||||
| Total from investment operations | 4.69 | 2.79 | (1.02 | ) | 2.94 | 5.76 | ||||||||||||||
| Less distributions from: | ||||||||||||||||||||
| Net investment income | (.44 | ) | (.28 | ) | (.35 | ) | (.40 | ) | (.48 | ) | ||||||||||
| Total distributions | (.44 | ) | (.28 | ) | (.35 | ) | (.40 | ) | (.48 | ) | ||||||||||
| Net asset value, end of period | $ | 29.32 | $ | 25.07 | $ | 22.56 | $ | 23.93 | $ | 21.39 | ||||||||||
| Total Returnb | 18.75 | % | 12.42 | % | (4.21 | %) | 13.75 | % | 35.79 | % | ||||||||||
| Ratios/Supplemental Data | ||||||||||||||||||||
| Net assets, end of period (in thousands) | $ | 26,771 | $ | 32,165 | $ | 34,926 | $ | 42,028 | $ | 43,542 | ||||||||||
| Ratios to average net assets: | ||||||||||||||||||||
| Net investment income | 0.50 | % | 1.15 | % | 0.97 | % | 1.31 | % | 1.70 | % | ||||||||||
| Total expensesc | 1.69 | % | 1.72 | % | 1.75 | % | 1.70 | % | 1.71 | % | ||||||||||
| Portfolio turnover rate | 99 | % | 28 | % | 35 | % | 61 | % | 131 | % | ||||||||||
| a | Net investment income per share was computed using average shares outstanding throughout the period. |
| b | Total return does not reflect the impact of any additional fees charged by insurance companies. |
| c | Does not include expenses of the underlying funds in which the Fund invests. |
| See Notes to Financial Statements. | The GUGGENHEIM FUNDS annual report | 25 |
NOTES TO FINANCIAL STATEMENTS
1. Organization and Significant Accounting Policies Organization
The Rydex Variable Trust (the “Trust”), a Delaware business trust, is registered with the SEC under the Investment Company Act of 1940 (“1940 Act”) as a non-diversified, open-ended investment company and is authorized to issue an unlimited number of no par value shares. The Trust offers shares of the funds to insurance companies for their variable annuity and variable life insurance contracts.
At December 31, 2013, the Trust consisted of fifty-one separate funds. This report covers the CLS AdvisorOne Funds (the “Funds”), while the other funds are contained in separate reports.
Guggenheim Investments (“GI”) provides advisory services and Rydex Fund Services, LLC (“RFS”) provides transfer agent, administrative and accounting services to the Trust. Guggenheim Distributors, LLC (“GDL”) acts as principal underwriter for the Trust. GI, RFS and GDL are affiliated entities.
Each Fund invests primarily in Exchange Traded Funds (“ETFs”) (“underlying funds”), acting similar to a “fund of funds”.
CLS Investments, LLC serves as investment sub-advisor (the “Sub-Advisor”) to the Funds and is responsible for the day-to-day management of each Fund’s portfolio.
Significant Accounting Policies
The following significant accounting policies are in conformity with U.S. generally accepted accounting principles (“U.S. GAAP”) and are consistently followed by the Trust. This requires management to make estimates and assumptions that affect the reported amount of assets and liabilities and disclosure of contingent assets and liabilities at the date of the financial statements and the reported amounts of revenues and expenses during the reporting period. Actual results could differ from these estimates. All time references are based on Eastern Time.
A. Open-end investment companies (“Mutual Funds”) are valued at their net asset value per share (“NAV”) as of the close of business on the valuation date. Exchange Traded Funds (“ETFs”) and closed-end investment companies are valued at the last quoted sales price.
Equity securities listed on an exchange (New York Stock Exchange (“NYSE”) or American Stock Exchange) are valued at the last quoted sales price as of the close of business on the NYSE, usually 4:00 p.m. on the valuation date. Equity securities listed on the NASDAQ market system are valued at the NASDAQ Official Closing Price on the valuation date.
Investments for which market quotations are not readily available are fair valued as determined in good faith by GI under the direction of the Board of Trustees using methods established or ratified by the Board of Trustees. These methods include, but are not limited to: (i) obtaining general information as to how these securities and assets trade; and (ii) obtaining other information and considerations, including current values in related markets.
B. Security transactions are recorded on the trade date for financial reporting purposes. Realized gains and losses from securities transactions are recorded using the identified cost basis. Proceeds from lawsuits related to investment holdings are recorded as realized gains in the respective Fund. Dividend income is recorded on the ex-dividend date, net of applicable taxes withheld by foreign countries. Taxable non-cash dividends are recorded as dividend income. Interest income, including amortization of premiums and accretion of discount, is accrued on a daily basis.
C. Distributions of net investment income and net realized gains, if any, are declared and paid at least annually. Distributions are recorded on the ex-dividend date and are determined in accordance with income tax regulations which may differ from U.S. GAAP.
D. The Funds may leave cash overnight in their cash account with the custodian, U.S. Bank. Periodically, a Fund may have cash due to the custodian bank as an overdraft balance. A fee is incurred on this overdraft, calculated by multiplying the overdraft by a rate based on the federal funds rate.
E. Throughout the normal course of business, the Funds enter into contracts that contain a variety of representations and warranties which provide general indemnifications. The Funds’ maximum exposure under these arrangements is unknown, as this would involve future claims that may be made against the Funds and/or their affiliates that have not yet occurred. However, based on experience, the Funds expect the risk of loss to be remote.
2. Financial Instruments
The Funds invest to a significant extent in shares of ETFs to gain exposure to their investment objectives. ETFs are pooled investment vehicles, which may be managed or unmanaged, that generally seek to track the performance of a specific index. Although individual shares of an ETF are traded on an exchange (such as the NYSE, AMEX, or NASDAQ), large blocks of shares of ETFs are redeemable at net asset value. This ability to redeem large blocks of shares has historically resulted in the market price of individual shares of ETFs being at or near the NAV of the ETF’s underlying investments. However, shares of ETFs may trade below their NAV. The NAV of shares will fluctuate with changes in the market value of the ETF’s holdings. The trading prices of shares will fluctuate in accordance with changes in NAV as well as market supply and demand. The difference between the bid price and ask price, commonly referred to as the “spread,” will also vary for an ETF depending on the ETF’s trading volume and market liquidity. Generally, the greater the trading volume and market liquidity, the smaller the spread is and vice versa. Any of these factors may lead to an ETF’s shares trading at a premium or a discount to NAV. The Funds, from time to time, may invest in ETFs that are not registered pursuant to the 1940 Act. Such ETFs may include commodity pools that are registered pursuant to the Securities Act of 1933 and the Commodity Exchange Act.
| 26 | the GUGGENHEIM FUNDS annual report |
| NOTES TO FINANCIAL STATEMENTS (continued) |
3. Fees and Other Transactions with Affiliates
Under the terms of an investment advisory contract, the Funds pay GI investment advisory fees calculated at an annual percentage rate of 0.90% of the average daily net assets of each Fund.
GI pays the Sub-Advisor out of the advisory fees it receives. In addition, GI bears all of its own costs associated with providing these services and the expenses of the Trustees that are affiliated with GI. GI may make payments from its own resources to broker-dealers and other financial institutions in connection with the sale of Fund shares.
Each Fund indirectly bears a proportionate share of the total operating expenses (including investment management, shareholder servicing, custody, transfer agency, audit and other expenses) of the underlying funds in which the Fund invests.
RFS provides transfer agent and administrative services to the Funds calculated at an annual percentage rate of 0.25% of the average daily net assets of each Fund.
RFS also provides accounting services to the Funds for fees calculated at annualized rates below, based on the average daily net assets of each Fund.
| Fund Accounting Fees | (as a % of net assets) | |||
| On the first $250 million | 0.10 | % | ||
| On the next $250 million | 0.075 | % | ||
| On the next $250 million | 0.05 | % | ||
| Over $750 million | 0.03 | % | ||
RFS engages external service providers to perform other necessary services for the Trust, such as audit and accounting related services, legal services, custody, printing and mailing, etc., on a pass-through basis. Such expenses are allocated to various Funds within the complex based on relative net assets.
The Trust has adopted an Investor Services Plan for which GDL and other firms that provide investor services (“Service Providers”) may receive compensation. The Funds will pay investor service fees to GDL at an annual rate not to exceed 0.25% of average daily net assets. GDL, in turn, will compensate Service Providers for providing such services, while retaining a portion of such payments to compensate itself for investor services it performs.
The Board approved the use of a Distribution Plan for which GDL and other Service Providers may receive compensation. If a Service Provider provides distribution services, the Trust will pay distribution fees to GDL at an annual rate not to exceed 0.25% of average daily net assets, pursuant to Rule 12b-1 of the 1940 Act. GDL, in turn, will pay the Service Provider out of its fees. GDL may, at its discretion, retain a portion of such payments to compensate itself for distribution services. Although approved, for the year ended December 31, 2013, this plan was not utilized.
Certain officers and trustees of the Trust are also officers of GI, RFS and GDL.
4. Fair Value Measurement
In accordance with U.S. GAAP, fair value is defined as the price that the Fund would receive to sell an investment or pay to transfer a liability in an orderly transaction with an independent buyer in the principal market, or in the absence of a principal market the most advantageous market for the investment or liability. A three-tier hierarchy is utilized to distinguish between (1) inputs that reflect the assumptions market participants would use in pricing an asset or liability developed based on market data obtained from sources independent of the reporting entity (observable inputs) and (2) inputs that reflect the reporting entity’s own assumptions about the assumptions market participants would use in pricing an asset or liability developed based on the best information available in the circumstances (unobservable inputs) and to establish classification of fair value measurements for disclosure purposes. Various inputs are used in determining the value of the Funds’ investments. The inputs are summarized in the three broad levels listed below:
Level 1 — quoted prices in active markets for identical securities.
Level 2 — other significant observable inputs (including quoted prices for similar securities, interest rates, prepayment speeds, credit risk, etc.).
Level 3 — significant unobservable inputs (including the fund’s own assumptions used to determine the fair value of investments).
| the GUGGENHEIM FUNDS annual report | 27 |
NOTES TO FINANCIAL STATEMENTS (continued)
The inputs or methodologies used for valuing securities are not necessarily an indication of the risk associated with investing in those securities.
The following table summarizes the inputs used to value the Funds’ net assets at December 31, 2013:
| Level 1 | Level 2 | Level 3 | ||||||||||||||
| Investments | Investments | Investments | ||||||||||||||
| In Securities | In Securities | In Securities | Total | |||||||||||||
| Assets | ||||||||||||||||
| Amerigo Fund | $ | 154,789,473 | $ | 20,094,475 | $ | — | $ | 174,883,948 | ||||||||
| Clermont Fund | 79,142,700 | 10,035,825 | — | 89,178,525 | ||||||||||||
| Select Allocation Fund | 27,019,141 | 2,406,000 | — | 29,425,141 | ||||||||||||
For the year ended December 31, 2013, there were no transfers between levels.
5. Federal Income Tax Information
The Funds intend to comply with the provisions of Subchapter M of the Internal Revenue Code applicable to regulated investment companies and distribute substantially all taxable net investment income and capital gains sufficient to relieve the Funds from all, or substantially all, federal income, excise and state income taxes. Therefore, no provision for federal or state income tax is required.
Tax positions taken or expected to be taken in the course of preparing the Funds’ tax returns are evaluated to determine whether the tax positions are “more-likely-than-not” of being sustained by the applicable tax authority. Tax positions not deemed to meet the more-likely-than-not threshold would be recorded as a tax benefit or expense in the current year. Management has analyzed the Funds’ tax positions taken, or to be taken, on Federal income tax returns for all open tax years, and has concluded that no provision for income tax is required in the Funds’ financial statements. The Fund’s federal tax returns are subject to examination by the Internal Revenue Service for a period of three fiscal years after they are filed.
The RIC Modernization Act of 2010 was signed into law on December 22, 2010 and seeks to simplify some of the tax provisions applicable to regulated investment companies, the tax reporting to their shareholders and to improve the tax efficiency of certain fund structures. The greatest impact to the disclosure in the financial reports for the Funds was on the treatment of net capital losses, effective for tax years beginning after December 22, 2010.
One of the more prominent changes addresses capital loss carryforwards. Funds are permitted to carry forward capital losses incurred in taxable years beginning after December 22, 2010 for an unlimited period. However, any losses incurred during those future taxable years will be required to be utilized prior to the losses incurred in pre-enactment taxable years. Under pre-enactment law, capital losses could be carried forward for eight years, and carried forward as short-term capital, irrespective of the character of the original loss. As a result of this ordering rule, pre-enactment capital carryforwards may potentially expire unused. Additionally, post-enactment capital losses that are carried forward will retain their character as either short-term or long-term capital losses rather than being considered all short-term as under previous law.
Tax basis capital losses in excess of capital gains are carried forward to offset future net capital gains. For the year ended December 31, 2013, the following capital loss carryforward amounts expired, were used, or were permanently lost due to loss limitation rules in Section 382 of the Internal Revenue Code:
| Fund | Amount | |||
| Amerigo Fund | $ | 8,239,482 | ||
| Clermont Fund | 2,743,284 | |||
| Select Allocation Fund | 2,090,847 | |||
The tax character of distributions paid during 2013 was as follows:
| Ordinary | Long-Term | Total | ||||||||||
| Fund | Income | Capital Gain | Distributions | |||||||||
| Amerigo Fund | $ | 21,720 | $ | — | $ | 21,720 | ||||||
| Clermont Fund | 1,163,542 | 1,760,517 | 2,924,059 | |||||||||
| Select Allocation Fund | 387,107 | — | 387,107 | |||||||||
| 28 | the GUGGENHEIM FUNDS annual report |
| NOTES TO FINANCIAL STATEMENTS (continued) |
The tax character of distributions paid during 2012 was as follows:
| Ordinary | Long-Term | Total | ||||||||||
| Fund | Income | Capital Gain | Distributions | |||||||||
| Amerigo Fund | $ | — | $ | 7,691,849 | $ | 7,691,849 | ||||||
| Clermont Fund | 1,203,713 | — | 1,203,713 | |||||||||
| Select Allocation Fund | 370,966 | — | 370,966 | |||||||||
Note: For federal income tax purposes, short-term capital gain distributions are treated as ordinary income distributions.
The tax character of distributable earnings/(accumulated losses) at December 31, 2013, was as follows:
| Undistributed | Undistributed | Net Unrealized | ||||||||||||||
| Ordinary | Long-Term | Appreciation/ | Capital Loss | |||||||||||||
| Fund | Income | Capital Gain | (Depreciation) | Carryforward1 | ||||||||||||
| Amerigo Fund | $ | 372,218 | $ | 9,463,991 | $ | 25,582,186 | $ | (24,423,489 | ) | |||||||
| Clermont Fund | 443,393 | 3,204,050 | 5,538,913 | (752,442 | ) | |||||||||||
| Select Allocation Fund | 140,872 | 2,782,578 | 3,253,305 | (6,338,152 | ) | |||||||||||
1A summary of the expiration of the aforementioned Capital Loss Carryforward is as follows:
| Total | ||||||||||||
| Expires in | Expires in | Capital Loss | ||||||||||
| Fund | 2016 | 2017 | Carryforward | |||||||||
| Amerigo Fund | $ | (4,974,149 | ) | $ | (19,449,340 | ) | $ | (24,423,489 | )* | |||
| Clermont Fund | — | (752,442 | ) | (752,442 | )* | |||||||
| Select Allocation Fund | (1,369,091 | ) | (4,969,061 | ) | (6,338,152 | )* | ||||||
*In accordance with section 382 of the Internal Revenue Code, a portion of certain fund losses are subject to an annual limitation. Note, this annual limitation is generally applicable to all of the capital loss carryforwards shown with respect to each Fund.
Net investment income and net realized gains (losses) may differ for financial statement and tax purposes because of temporary or permanent book/tax differences. These differences are primarily due to wash sales and partnership income and expenses. Additional differences may result from the tax treatment of net investment losses and expired capital loss carryforwards. To the extent these differences are permanent, reclassifications are made to the appropriate equity accounts in the period that the differences arise. These reclassifications have no effect on net assets or NAV per share.
On the Statements of Assets and Liabilities the following adjustments were made for permanent book/tax differences:
| Undistributed | Accumulated | |||||||||||
| Paid In | Net Investment | Net Realized | ||||||||||
| Fund | Capital | Income (Loss) | Gain (Loss) | |||||||||
| Amerigo Fund | $ | — | $ | (162,499 | ) | $ | 162,499 | |||||
| Clermont Fund | — | (100,889 | ) | 100,889 | ||||||||
| Select Allocation Fund | — | 2,706 | (2,706 | ) | ||||||||
At December 31, 2013, the cost of securities for Federal income tax purposes, the aggregate gross unrealized gain for all securities for which there was an excess of value over tax cost and the aggregate gross unrealized loss for all securities for which there was an excess of tax cost over value, were as follows:
| Tax | Tax | Net | ||||||||||||||
| Tax | Unrealized | Unrealized | Unrealized | |||||||||||||
| Fund | Cost | Gain | Loss | Gain | ||||||||||||
| Amerigo Fund | $ | 149,301,762 | $ | 25,988,836 | $ | (406,650 | ) | $ | 25,582,186 | |||||||
| Clermont Fund | 83,639,612 | 6,235,136 | (696,223 | ) | 5,538,913 | |||||||||||
| Select Allocation Fund | 26,171,836 | 3,349,081 | (95,776 | ) | 3,253,305 | |||||||||||
| THE GUGGENHEIM FUNDS ANNUAL REPORT | 29 |
| NOTES TO FINANCIAL STATEMENTS (continued) |
6. Securities Transactions
For the year ended December 31, 2013, the cost of purchases and proceeds from sales of investment securities, excluding government securities and short-term investments, were as follows:
| Fund | Purchases | Sales | ||||||
| Amerigo Fund | $ | 126,687,642 | $ | 135,393,840 | ||||
| Clermont Fund | 70,948,759 | 74,860,532 | ||||||
| Select Allocation Fund | 27,129,529 | 37,108,685 | ||||||
7. Affiliated Transactions
Investments representing 5% or more of the outstanding voting shares of a portfolio company of a fund, or control of or by, or common control under GI, result in that portfolio company being considered an affiliated company of such fund, as defined in the 1940 Act. Transactions during the year ended December 31, 2013 in which the portfolio company is an “affiliated person” are as follows:
| Value | Value | Shares | Investment | Realized | ||||||||||||||||||||||||||
| Fund | Security | 12/31/12 | Additions | Reductions | 12/31/13 | 12/31/13 | Income | Gain | ||||||||||||||||||||||
| Amerigo Fund | Exchange Traded Fund: | |||||||||||||||||||||||||||||
| Barclays ETN+long C Leveraged | ||||||||||||||||||||||||||||||
| ETN Linked to S&P 500 | $ | 940,408 | $ | — | $ | 783,501 | $ | — | — | $ | — | $ | 268,950 | |||||||||||||||||
8. Line of Credit
The Trust, along with other affiliated trusts, secured an uncommitted, $75,000,000 line of credit from U.S. Bank, N.A., which expires June 15, 2014. This line of credit is reserved for emergency or temporary purposes. Borrowings, if any, under this arrangement bear interest equal to the Prime Rate, minus 2%, which shall be paid monthly, averaging 1.25% for the year ended December 31, 2013. The Funds did not have any borrowings under this agreement at December 31, 2013.
The average daily balances borrowed for the year ended December 31, 2013 were as follows:
| Fund | Average Daily Balance | |||
| Amerigo Fund | $ | 10,811 | ||
| Clermont Fund | 7,036 | |||
| Select Allocation Fund | 82,622 | |||
9. Portfolio Securities Loaned
The Funds may lend their securities to approved brokers to earn additional income. Security lending income shown on the Statements of Operations is shown net of rebates paid to the borrowers and earnings on cash collateral investments shared with the lending agent. Within this arrangement, the Funds act as the lender, Credit Suisse acts as the lending agent, and other approved registered broker dealers act as the borrowers. The Funds receive cash collateral, valued at 102% of the value of the securities on loan. Under the terms of the Funds’ securities lending agreement with Credit Suisse, cash collateral is invested in one or more joint repurchase agreements collateralized by obligations of the U.S. Treasury or Government Agencies and cash. The Funds bear the risk of loss on cash collateral investments. Collateral is maintained over the life of the loan in an amount not less than the value of loaned securities, as determined at the close of fund business each day; any additional collateral required due to changes in security values is delivered to the Funds the next business day. Although the collateral mitigates the risk, the Funds could experience a delay in recovering its securities and a possible loss of income or value if the borrower fails to return the securities. The Funds have the right under the securities lending agreement to recover the securities from the borrower on demand.
At December 31, 2013, the Funds participated in securities lending as follows:
| Value of | Cash | |||||||
| Fund | Securities Loaned | Collateral Received | ||||||
| Amerigo Fund | $ | 19,757,198 | $ | 20,094,475 | ||||
| Clermont Fund | 9,763,920 | 10,035,825 | ||||||
| Select Allocation Fund | 2,361,042 | 2,406,000 | ||||||
| 30 | THE GUGGENHEIM FUNDS ANNUAL REPORT |
| NOTES TO FINANCIAL STATEMENTS (continued) |
Cash collateral received was invested in the following joint repurchase agreements at December 31, 2013:
| Repurchase | ||||||||||||||||||
| Counterparty and Terms of Agreement | Face Value | Price | Collateral | Par Value | Fair Value | |||||||||||||
| HSBC Securities, Inc. | Freddie Mac | |||||||||||||||||
| 0.01% | 0.00% | |||||||||||||||||
| Due 01/02/14 | $ | 28,356,545 | $ | 28,356,562 | 01/15/14 - 07/15/32 | $ | 48,053,769 | $ | 28,927,014 | |||||||||
| Deutsche Bank Securities, Inc. | Fannie Mae | |||||||||||||||||
| 0.02% | 0.00% - 1.38% | |||||||||||||||||
| Due 01/02/14 | 4,179,755 | 4,179,760 | 11/15/16 - 05/15/30 | 6,398,755 | 4,249,969 | |||||||||||||
| Federal Home Loan Bank | ||||||||||||||||||
| 0.38% | ||||||||||||||||||
| 06/24/16 | 7,090 | 7,068 | ||||||||||||||||
| Freddie Mac | ||||||||||||||||||
| 3.00% | ||||||||||||||||||
| 07/28/14 | 4,256 | 4,320 | ||||||||||||||||
10. Legal Proceedings
Tribune Company
Rydex Variable Trust has been named as a defendant in the case entitled Marc S. Kirscher, as Litigation Trustee for the Tribune Litigation Trust v. FitzSimons, No. 12-2652 (S.D.N.Y.) (formerly Official Committee of Unsecured Creditors of Tribune Co. v. FitzSimons, Adv. Pro. No. 10-54010 (Bankr. D. Del.)) (the “FitzSimons” Action), as a result of the ownership of shares in the Tribune Company (“Tribune”) in 2007 by certain series of the Rydex Variable Trust when Tribune effected a leveraged buyout transaction (“LBO”) by which Tribune converted to a privately-held company. The plaintiff has alleged that, in connection with the LBO, insiders and shareholders were paid for their Tribune stock using financing that the insiders knew would, and ultimately did, leave the Tribune insolvent. The plaintiff has asserted claims against certain insiders, shareholders, professional advisers, and others involved in the LBO, and is attempting to obtain from these individuals and entities the proceeds paid out in connection with the LBO.
Rydex Variable Trust also has been named as a defendant in one or more of a group of lawsuits filed by a group of Tribune creditors that allege state law constructive fraudulent conveyance claims against former Tribune shareholders (the “SLCFC actions”).
The FitzSimons action and the SLCFC actions have been consolidated with the majority of the other Tribune LBO-related lawsuits in a multidistrict litigation proceeding captioned In re Tribune Company Fraudulent Conveyance Litig., No. 11-md-2696 (S.D.N.Y.) (the “MDL Proceeding”).
On September 23, 2013, the District Court granted the defendants’ omnibus motion to dismiss the SLCFC actions, on the basis that the creditors lacked standing. On September 30, 2013, the creditors filed a notice of appeal of the September 23 order. On October 28, 2013, the defendants filed a joint notice of cross-appeal of that same order.
On November 20, 2013, the District Court ordered the parties in the FitzSimons action to meet and confer regarding a potential protocol for the briefing and argument of motions to dismiss to be filed in that action. On January 24, 2014, the Court extended the time for service of summonses and complaints in the FitzSimons action to February 28, 2014.
None of these lawsuits allege any wrongdoing on the part of Rydex Variable Trust. The following series of Rydex Variable Trust held shares of Tribune and tendered these shares as part of Tribune’s LBO: Nova Fund, S&P 500 2x Strategy Fund, Multi-Cap Core Equity Fund, S&P 500 Pure Value Fund, Hedged Equity Fund and Multi-Hedge Strategies Fund (the “Funds”). The value of the proceeds received by the foregoing Funds was $12,580, $2,380, $1,360, $148,376, $2,720, and $119,034, respectively. At this stage of the proceedings, Rydex Variable Trust is not able to make a reliable predication as to the outcome of these lawsuits or the effect, if any, on a Fund’s net asset value.
Lyondell Chemical Company
In December 2011, Rydex Variable Trust was named as a defendant in Weisfelner, as Trustee of the LB Creditor Trust, v. Fund 1 (In re Lyondell Chemical Co.), Adv. Pro. No. 10-4609 (Bankr. S.D.N.Y.).
| THE GUGGENHEIM FUNDS ANNUAL REPORT | 31 |
| NOTES TO FINANCIAL STATEMENTS (concluded) |
Similar to the claims made in the Tribune matter, the Weisfelner complaint seeks to have set aside and recovered as fraudulent transfers from former Lyondell Chemical Company (“Lyondell”) shareholders the consideration paid to them pursuant to the cash out merger of Lyondell shareholders in connection with the combination of Lyondell and Basell AF in 2007. Lyondell filed for bankruptcy in 2008.
On January 14, 2014, the Court granted in part and denied in part the defendants’ motion to dismiss the Creditor Trust action. In particular, the Court dismissed all defendants who were conduits for the proceeds from the merger transaction, and also ruled that the plaintiff could not bring any claims on behalf of certain entities who had ratified the merger transaction. The Court also dismissed without prejudice the plaintiff’s claims for intentional fraudulent transfer against the remaining defendants, and gave the Credit Trustee leave to replead these claims. Finally, the Court denied the motion to dismiss with respect to the plaintiff’s claims for constructive fraudulent transfer against the remaining defendants.
This lawsuit does not allege any wrongdoing on the part of Rydex Variable Trust. The following series of Rydex Variable Trust received cash proceeds from the cash out merger in the following amounts: Basic Materials Fund - $1,235,952; U.S. Long Short Momentum Fund - $523,200; Multi-Cap Core Equity Fund - $5,760; Hedged Equity Fund - $480; and Multi-Hedge Strategies Fund - $112,848. At this stage of the proceedings, Rydex Variable Trust is not able to make a reliable predication as to the outcome of these lawsuits or the effect, if any, on a Fund’s net asset value.
| 32 | THE GUGGENHEIM FUNDS ANNUAL REPORT |
| REPORT OF INDEPENDENT REGISTERED PUBLIC ACCOUNTING FIRM |
To the Board of Trustees and Shareholders
of Rydex Variable Trust:
We have audited the accompanying statements of assets and liabilities, including the schedules of investments, of Amerigo Fund, Clermont Fund and Select Allocation Fund (three of the series constituting the Rydex Variable Trust) (the “Funds”) as of December 31, 2013, and the related statements of operations for the year then ended, the statements of changes in net assets for each of the two years in the period then ended, and the financial highlights for each of the five years in the period then ended. These financial statements and financial highlights are the responsibility of the Funds’ management. Our responsibility is to express an opinion on these financial statements and financial highlights based on our audits.
We conducted our audits in accordance with the standards of the Public Company Accounting Oversight Board (United States). Those standards require that we plan and perform the audit to obtain reasonable assurance about whether the financial statements and financial highlights are free of material misstatement. We were not engaged to perform an audit of the Funds’ internal control over financial reporting. Our audits included consideration of internal control over financial reporting as a basis for designing audit procedures that are appropriate in the circumstances, but not for the purpose of expressing an opinion on the effectiveness of the Funds’ internal control over financial reporting.
Accordingly, we express no such opinion. An audit also includes examining, on a test basis, evidence supporting the amounts and disclosures in the financial statements and financial highlights, assessing the accounting principles used and significant estimates made by management, and evaluating the overall financial statement presentation. Our procedures included confirmation of securities owned as of December 31, 2013, by correspondence with the custodian and brokers or by other appropriate auditing procedures where replies from brokers were not received. We believe that our audits provide a reasonable basis for our opinion.
In our opinion, the financial statements and financial highlights referred to above present fairly, in all material respects, the financial position of the above listed Funds at December 31, 2013, the results of their operations for the year then ended, the changes in their net assets for each of the two years in the period then ended, and their financial highlights for each of the five years in the period then ended, in conformity with U.S. generally accepted accounting principles.

McLean, Virginia
February 27, 2014
| THE GUGGENHEIM FUNDS ANNUAL REPORT | 33 |
| OTHER INFORMATION (Unaudited) |
Tax Information
This information is being provided as required by the Internal Revenue Code. Amounts shown may differ from those elsewhere in the report because of differences in tax and financial reporting practice.
Of the ordinary income distributions paid during the year, the following funds had the corresponding percentages qualify for the dividends received deduction for corporations:
| Fund | % Qualifying | |||
| Amerigo Fund | 100.00 | % | ||
| Clermont Fund | 54.51 | % | ||
| Select Allocation Fund | 97.95 | % | ||
With respect to the taxable year ended December 31, 2013, the Funds hereby designate as capital gain dividends the amounts listed below, or, if subsequently determined to be different, the net capital gain of such year:
| Clermont | ||||
| Fund | ||||
| From long-term capital gains, subject to the 15% rate gains category: | $ | 1,760,517 | ||
Proxy Voting Information
A description of the policies and procedures that the Trust uses to determine how to vote proxies relating to securities held in the Funds’ portfolios is available, without charge and upon request, by calling 1.800.820.0888. This information is also available from the EDGAR database on the SEC’s website at http://www.sec.gov.
Information regarding how the Funds voted proxies relating to portfolio securities during the most recent 12-month period ended June 30 is available without charge, upon request, by calling 1.800.820.0888. This information is also available from the EDGAR database on the SEC’s website at http://www.sec.gov.
Quarterly Portfolio Schedules Information
The Trust files its complete schedule of portfolio holdings with the SEC for the first and third quarters of each fiscal year on Form N-Q; which are available on the SEC’s website at http://www.sec.gov. The Funds’ Forms N-Q may be reviewed and copied at the SEC’s Public Reference Room in Washington, DC, and that information on the operation of the Public Reference Room may be obtained by calling 1-800-SEC-0330. Copies of the portfolio holdings are also available to shareholders, without charge and upon request, by calling 1.800.820.0888.
Office Locations
The offices of Guggenheim Investments can be found in the following locations:
330 Madison Avenue
10th Floor
New York, NY 10017
(Headquarters)
Four Irvington Centre
805 King Farm Boulevard
Suite 600
Rockville, MD 20850
9401 Indian Creek Parkway
40 Corporate Woods
Suite 850
Overland Park, KS 66210
| 34 | THE GUGGENHEIM FUNDS ANNUAL REPORT |
| INFORMATION ON BOARD OF TRUSTEES AND OFFICERS (Unaudited) |
A Board of Trustees oversees the Trust, as well as other trusts of GI, in which its members have no stated term of service, and continue to serve after election until resignation. The Statement of Additional Information includes further information about Fund Trustees and Officers, and can be obtained without charge by calling 800.820.0888.
All Trustees and Officers may be reached c/o Guggenheim Investments, 805 King Farm Boulevard, Suite 600, Rockville, MD 20850.
| TRUSTEE AND OFFICER | ||||
| Name and | Length of Service as Trustee | Number of Funds | ||
| Year of Birth | (Year Began) | Overseen | ||
| Donald C. Cacciapaglia* | Rydex Series Funds – 2012 | 213 | ||
| (1951) | Rydex Variable Trust – 2012 | |||
| Rydex Dynamic Funds – 2012 | ||||
| Rydex ETF Trust – 2012 |
Principal Occupations During Past Five Years: Current: Security Investors, LLC: President and CEO from April 2012 to present; Guggenheim Investments: President and Chief Administrative Officer from February 2010 to present; Previous: Channel Capital Group, Inc.: Chairman and CEO from April 2002 to February 2010
Positions held within the Trust: Trustee from 2012 to present; President from 2012 to present
| INDEPENDENT TRUSTEES | ||||
| Name and | Length of Service as Trustee | Number of Funds | ||
| Year of Birth | (Year Began) | Overseen | ||
| Corey A. Colehour | Rydex Series Funds – 1993 | 132 | ||
| (1945) | Rydex Variable Trust – 1998 | |||
| Rydex Dynamic Funds – 1999 | ||||
| Rydex ETF Trust – 2003 |
Principal Occupations During Past Five Years: Current: Retired; Previous: President and Senior Vice President of Schield Management Company (registered investment adviser) from 2003 to 2006
Positions held within the Trust: Trustee from 1993 to present; Member of the Audit and Governance and Nominating Committees from 1995 to present
| J. Kenneth Dalton | Rydex Series Funds – 1995 | 132 | ||
| (1941) | Rydex Variable Trust – 1998 | |||
| Rydex Dynamic Funds – 1999 | ||||
| Rydex ETF Trust – 2003 |
Principal Occupations During Past Five Years: Current: Retired
Positions held within the Trust: Trustee from 1995 to present; Member and Chairman of the Audit Committee from 1997 to present; Member of the Governance and Nominating Committees from 1995 to present; and Member of the Risk Oversight Committee from 2010 to present
| John O. Demaret | Rydex Series Funds – 1997 | 132 | ||
| (1940) | Rydex Variable Trust – 1998 | |||
| Rydex Dynamic Funds – 1999 | ||||
| Rydex ETF Trust – 2003 |
Principal Occupations During Past Five Years: Current: Retired
Positions held within the Trust: Trustee from 1997 to present; Chairman of the Board from 2006 to present; Member of the Audit Committee from 1997 to present; and Member of the Risk Oversight Committee from 2010 to present
| THE GUGGENHEIM FUNDS ANNUAL REPORT | 35 |
| INFORMATION ON BOARD OF TRUSTEES AND OFFICERS (Unaudited) (continued) |
| INDEPENDENT TRUSTEES – concluded | ||||
| Name and | Length of Service as Trustee | Number of Funds | ||
| Year of Birth | (Year Began) | Overseen | ||
| Werner E. Keller | Rydex Series Funds – 2005 | 132 | ||
| (1940) | Rydex Variable Trust – 2005 | |||
| Rydex Dynamic Funds – 2005 | ||||
| Rydex ETF Trust – 2005 | ||||
Principal Occupations During Past Five Years: Current: Founder and President of Keller Partners, LLC (investment research firm) from 2005 to present; Previous: Retired from 2001 to 2005
Positions held within the Trust: Vice Chairman of the Board of Trustees from 2010 to present; Trustee and Member of the Audit and Governance and Nominating Committees from 2005 to present; and Chairman and Member of the Risk Oversight Committee from 2010 to present
| Thomas F. Lydon, Jr. | Rydex Series Funds – 2005 | 132 | ||
| (1960) | Rydex Variable Trust – 2005 | |||
| Rydex Dynamic Funds – 2005 | ||||
| Rydex ETF Trust – 2005 |
Principal Occupations During Past Five Years: Current: President of Global Trends Investments (registered investment adviser) from 1996 to present Positions held within the Trust: Trustee and Member of the Audit and Governance and Nominating Committees from 2005 to present
| Patrick T. McCarville | Rydex Series Funds – 1997 | 132 | ||
| (1942) | Rydex Variable Trust – 1998 | |||
| Rydex Dynamic Funds – 1999 | ||||
| Rydex ETF Trust – 2003 |
Principal Occupations During Past Five Years: Current: Retired; Previous: Chief Executive Officer of Par Industries, Inc., d/b/a Par Leasing from 1977 to 2010
Positions held within the Trust: Trustee from 1997 to present; Member of the Audit Committee from 1997 to present; and Chairman of the Governance and
Nominating Committees from 1997 to present
| Roger Somers | Rydex Series Funds – 1993 | 132 | ||
| (1944) | Rydex Variable Trust – 1998 | |||
| Rydex Dynamic Funds – 1999 | ||||
| Rydex ETF Trust – 2003 |
Principal Occupations During Past Five Years: Current: Founder and Chief Executive Officer of Arrow Limousine from 1965 to present
Positions held within the Trust: Trustee from 1993 to present; Member of the Audit and Governance and Nominating Committees from 1995 to present
| 36 | THE GUGGENHEIM FUNDS ANNUAL REPORT |
| INFORMATION ON BOARD OF TRUSTEES AND OFFICERS (Unaudited) (concluded) |
EXECUTIVE OFFICERS
| Name, Position and | Principal Occupations | |||
| Year of Birth | During Past Five Years | |||
| Michael P. Byrum* Vice President (1970) | Current: President, Security Benefit Asset Management Holdings, LLC; Senior Vice President, Security Investors, LLC; President & Chief Investment Officer, Rydex Holdings, LLC; Director & Chairman of the Board, Advisor Research Center, Inc.; and Manager, Rydex Specialized Products, LLC | |||
| Previous: Guggenheim Distributors, LLC (f/k/a Rydex Distributors, LLC), Vice President (2009); Rydex Fund Services, LLC, Director (2009–2010), Secretary (2002–2010); Rydex Advisors, LLC (f/k/a PADCO Advisors, Inc.), Director (2008–2010), Chief Investment Officer (2006–2010), President (2004–2010), Secretary (2002–2010); Rydex Advisors II, LLC (f/k/a PADCO Advisors II, Inc.), Director (2008–2010), Chief Investment Officer (2006–2010), President (2004–2010), Secretary (2002–2010); Advisor Research Center, Inc., Secretary (2006–2009), and Executive Vice President (2006) | ||||
| Nikolaos Bonos* Vice President and Treasurer (1963) | Current: Senior Vice President, Security Investors, LLC; Chief Executive Officer & Manager, Rydex Specialized Products, LLC; Chief Executive Officer & President, Rydex Fund Services, LLC; Vice President, Rydex Holdings, LLC; Treasurer, SBL Fund; Security Equity Fund; Security Income Fund; Security Large Cap Value Fund & Security Mid Cap Growth Fund; and Vice President, Security Benefit Asset Management Holdings, LLC | |||
| Previous: Security Global Investors, LLC, Senior Vice President (2010–2011); Rydex Advisors, LLC (f/k/a PADCO Advisors, Inc.) Senior Vice President (2006–2011); Rydex Fund Services, LLC (f/k/a Rydex Fund Services, Inc.), Director (2009); and Rydex Specialized Products, LLC, Chief Financial Officer (2005–2009) | ||||
| Elisabeth Miller* Chief Compliance Officer (1968) | Current: Chief Compliance Officer, Rydex Series Funds, Rydex Dynamic Funds, Rydex Variable Trust, Rydex ETF Trust, Security Equity Fund, Security Income Fund, Security Large Cap Value Fund, Security Mid Cap Growth Fund, SBL Fund, Security Investors, LLC, and Guggenheim Distributors, LLC | |||
| Previous: Senior Manager, Security Investors, LLC and Guggenheim Distributors, LLC (2004–2009) | ||||
| Amy J. Lee* Vice President and Secretary (1961) | Current: Secretary and Senior Vice President, Security Investors, LLC (2004–present) Previous: Vice President, Associate General Counsel and Assistant Secretary, Security Benefit Life Insurance Company and Security Benefit Corporation (2004–2012) | |||
| Joseph M. Arruda* Assistant Treasurer (1966) | Current: Assistant Treasurer, SBL Fund, Security Equity Fund, Security Income Fund, Security Large Cap Value Fund & Security Mid Cap Growth Fund; Vice President, Security Investors, LLC; and Chief Financial Officer & Manager, Rydex Specialized Products, LLC | |||
| Previous: Security Global Investors, LLC, Vice President (2010–2011); and Rydex Advisors, LLC (f/k/a PADCO Advisors, Inc.) & Rydex Advisors II, LLC (f/k/a PADCO Advisors II, Inc.), Vice President (2004–2011) | ||||
| * | Officers of the Funds are deemed to be “interested persons” of the Trust, within the meaning of Section 2(a)(19) of the 1940 Act, inasmuch as this person is affiliated with Guggenheim Investments. |
| THE GUGGENHEIM FUNDS ANNUAL REPORT | 37 |
| GUGGENHEIM INVESTMENTS PRIVACY POLICIES (Unaudited) |
Rydex Funds, Guggenheim Funds, Rydex Investments, Guggenheim Distributors, LLC, Security Investors, LLC, Security Distributors, Inc. and Rydex Advisory Services (Collectively “Guggenheim Investments”).
Our Commitment to You
When you become a Guggenheim Investments investor, you entrust us with not only your hard-earned money but also with personal and financial information about you. We recognize that your relationship with us is based on trust and that you expect us to act responsibly and in your best interests. Because we have access to this private information about you, we hold ourselves to the highest standards in its safekeeping and use. This means, most importantly, that we do not sell client information to anyone—whether it is your personal information or if you are a current or former Guggenheim Investments client.
The Information We Collect About You
In the course of doing business with shareholders and investors, we collect nonpublic personal information about you. You typically provide personal information when you complete a Guggenheim Investments account application or when you request a transaction that involves Rydex and Guggenheim Investments funds or one of the Guggenheim Investments affiliated companies. “Nonpublic personal information” is personally identifiable private information about you. For example, it includes information regarding your name and address, Social Security or taxpayer identification number, assets, income, account balance, bank account information and investment activity (e.g., purchase and redemption history).
How We Handle Your Personal Information
As emphasized above, we do not sell information about current or former clients or their accounts to third parties. Nor do we share such information, except when necessary to complete transactions at your request or to make you aware of related investment products and services that we offer. Additional details about how we handle your personal information are provided below. To complete certain transactions or account changes that you direct, it may be necessary to provide identifying information to companies, individuals or groups that are not affiliated with Guggenheim Investments. For example, if you ask to transfer assets from another financial institution to Guggenheim Investments, we will need to provide certain information about you to that company to complete the transaction. To alert you to other Guggenheim Investments investment products and services, we may share your information within the Guggenheim Investments family of affiliated companies. This would include, for example, sharing your information within Guggenheim Investments so we can make you aware of new Rydex and Guggenheim Investments funds or the services offered through another Guggenheim Investments affiliated company. In certain instances, we may contract with nonaffiliated companies to perform services for us. Where necessary, we will disclose information we have about you to these third parties. In all such cases, we provide the third party with only the information necessary to carry out its assigned responsibilities and only for that purpose. And we require these third parties to treat your private information with the same high degree of confidentiality that we do. In certain instances, we may share information with other financial institutions regarding individuals and entities in response to the U.S.A. Patriot Act. Finally, we will release information about you if you direct us to do so, if we are compelled by law to do so or in other circumstances permitted by law.
Opt Out Provisions
We do not sell your personal information to anyone. The law allows you to “opt out” of only certain kinds of information sharing with third parties. The firm does not share personal information about you with any third parties that triggers this opt-out right. This means YOU ARE ALREADY OPTED OUT.
How We Protect Privacy Online
Our concern for the privacy of our shareholders also extends to those who use our web site, guggenheiminvestments.com. Our web site uses some of the most secure forms of online communication available, including encryption technology, Secure Socket Layer (SSL) protocol, firewalls and user names and passwords. These technologies provide a high level of security and privacy when you access your account information or initiate online transactions. The Guggenheim Investments web site offers customized features that require our use of “http cookies”—tiny pieces of information that we ask your browser to store. However, we make very limited use of these cookies. We only use cookies for session management and security features on the Guggenheim Investments web site. We do not use them to pull data from your hard drive, to learn your email address, or to view data in cookies created by other web sites. We will not share the information in our cookies or give others access to it. See the legal information area on our web site for more details about web site security and privacy features.
| 38 | THE GUGGENHEIM FUNDS ANNUAL REPORT |
| GUGGENHEIM INVESTMENTS PRIVACY POLICIES (Unaudited) (concluded) |
How We Safeguard Your Personal Information
We restrict access to nonpublic personal information about shareholders to our employees and in some cases to third parties (for example, the service providers described above) as permitted by law. We maintain strict physical, electronic and procedural safeguards that comply with federal standards to guard your nonpublic personal information.
We’ll Keep You Informed
As required by federal law, we will notify shareholders of our privacy policy annually. We reserve the right to modify this policy at any time, but rest assured that if we do change it, we will tell you promptly. You will also be able to access our privacy policy from our web site at guggenheiminvestments.com. Should you have any questions regarding our privacy policy, contact us at 800.820.0888 or 301.296.5100.
| THE GUGGENHEIM FUNDS ANNUAL REPORT | 39 |
This page intentionally left blank.
This page intentionally left blank.
This page intentionally left blank.
This page intentionally left blank.
This page intentionally left blank.
This page intentionally left blank.

GUGGENHEIM ALTERNATIVES FUNDS
GUGGENHEIM LONG SHORT EQUITY FUND
(Formerly U.S. Long Short Momentum Fund)
GUGGENHEIM GLOBAL MANAGED FUTURES STRATEGY FUND
GUGGENHEIM MULTI-HEDGE STRATEGIES FUND
RYDEX SPECIALTY FUND
RYDEX COMMODITIES STRATEGY FUND
RVALTS-ANN-2-1213x1214
This report and the financial statements contained herein are submitted for the general information of our shareholders. The report is not authorized for distribution to prospective investors unless preceded or accompanied by an effective prospectus.
Distributed by Guggenheim Distributors, LLC.
| THE GUGGENHEIM FUNDS ANNUAL REPORT | 1 |
| December 31, 2013 |
Security Investors, LLC (the “Investment Adviser”) is pleased to present the annual shareholder report for four alternative strategies funds (“the Funds”) that are part of the Rydex Variable Trust. This report covers performance of the Funds for the annual period ended December 31, 2013.
The Investment Adviser is a part of Guggenheim Investments, which represents the investment management businesses of Guggenheim Partners, LLC, a global, diversified financial services firm.
Guggenheim Distributors, LLC is the distributor of the Funds. Guggenheim Distributors, LLC is affiliated with Guggenheim Partners, LLC and Security Investors, LLC.
We encourage you to read the Economic and Market Overview section of the report, which follows this letter, and then the Performance Report and Fund Profile for each Fund.
We are committed to providing innovative investment solutions and appreciate the trust you place in us.
Sincerely,

Donald C. Cacciapaglia
President
January 31, 2014
Read a prospectus and summary prospectus (if available) carefully before investing. It contains the investment objectives, risks, charges, expenses and other information, which should be considered carefully before investing. Obtain a prospectus and summary prospectus (if available) at guggenheiminvestments.com or call 800.820.0888.
The Long Short Equity Strategy Fund is subject to a number of risks and is not suitable for all investors. • The Fund’s use of derivatives such as futures, options and swap agreements may expose the Fund to additional risks that it would not be subject to if it invested directly in the securities underlying those derivatives. • Certain of the derivative instruments, such as swaps and structured notes, are also subject to the risks of counterparty default and adverse tax treatment. • The Fund’s use of short selling involves increased risk and costs, including paying more for a security than it received from its sale and the risk of unlimited losses. • The more the Fund invests in leveraged instruments, the more the leverage will magnify any gains or losses on those leveraged investments. • The Fund’s investments in developed and emerging foreign markets may increase the Fund’s volatility due to the impact of diplomatic, political or economic developments on the country in question. • Additionally, the Fund’s exposure to foreign currencies subjects the Fund to the risk that those currencies will decline in value relative to the U.S. dollar, or, in the case of short positions, that the U.S. dollar will decline in value relative to the currencies. • The Fund’s fixed income investments will change in value in response to interest rate changes and other factors. • In certain circumstances the Fund may be subject to liquidity risk and it may be difficult for the Fund to purchase and sell particular investments within a reasonable time at a fair price. • This Fund is considered non-diversified and can invest a greater portion of its assets in securities of individual issuers than a diversified fund. As a result, changes in the market value of a single security could cause greater fluctuations in the value of Fund shares than would occur in a more diversified fund. See the prospectus for more information on these and additional risks. • Please read the prospectus for more detailed information regarding these and other risks.
| 2 | THE GUGGENHEIM FUNDS ANNUAL REPORT |
| December 31, 2013 |
The Global Managed Futures Strategy Fund may not be suitable for all investors. • The Fund’s investments in securities and derivatives, in general, are subject to market risks that may cause their prices, and therefore the Fund’s value, to fluctuate over time. An investment in the Fund may lose money. • The Fund’s investments in derivatives may pose risks in addition to those associated with investing directly insecurities or other investments, including illiquidity of the derivatives, imperfect correlations with underlying investments or the Fund’s other portfolio holdings, lack of availability and counterparty risk. While the majority of the Fund’s derivative investments will be used to obtain exposure to the commodities markets, certain of the Fund’s derivative investments will be employed to hedge risk and limit leveraged exposure. There is no guarantee that such hedging strategies will be effective at managing risk. • The Fund’s use of short selling involves increased risk and costs. The Fund risks paying more for a security than it received from its sale. Theoretically, securities sold short have the risk of unlimited losses. • The Fund’s investments in fixed income securities will change in value in response to interest rate changes and other factors. In general, bond prices rise when interest rates fall and vice versa. • The Fund’s indirect and direct exposure to foreign currencies subjects the Fund to the risk that those currencies will decline in value relative to the U.S. dollar, or, in the case of short positions, that the U.S. dollar will decline in value relative to the currency being hedged. • The Fund’s exposure to the commodity markets may subject the fund to greater volatility as commodity-linked investments may be affected by changes in overall market movements, commodity index volatility, changes in interest rates or factors affecting a particular industry or commodity—such as droughts, floods, weather, embargos, tariffs and international economic, political and regulatory developments. • The Fund may invest in securities of foreign companies directly, or indirectly through the use of other investment companies and financial instruments that are linked to the performance of foreign issuers. Foreign securities markets generally have less trading volume and less liquidity than U.S. markets, and prices in some foreign markets may fluctuate more than those of securities traded on U.S. markets. • This Fund is considered nondiversified and can invest a greater portion of its assets in securities of individual issuers than a diversified fund. As a result, changes in the market value of a single security could cause greater fluctuations in the value of fund shares than would occur in a more diversified fund. • See the prospectus for more details on these and other risks.
Multi-Hedge Strategies Fund is subject to a number of risks and may not be suitable for all investors. • The Fund’s use of derivatives such as futures, options and swap agreements may expose the Fund to additional risks that it would not be subject to if it invested directly in the securities underlying those derivatives. • The more the Fund invests in leveraged instruments, the more the leverage will magnify any gains or losses on those investments. • The Fund’s use of short selling involves increased risks and costs. The Fund risks paying more for a security than it received from its sale. • The Fund’s investments in high yield securities and unrated securities of similar credit quality (“junk bonds”) may be subject to greater levels of interest rate, credit and liquidity risk than funds that do not invest in such securities. • The Fund’s fixed income investments will change in value in response to interest rate changes and other factors. • The fund’s exposure to the commodity and currency markets may subject the fund to greater volatility as commodity- and currency-linked derivative investments may be affected by changes in overall market movements, commodity index volatility, changes in interest rates or factors affecting a particular industry, commodity or currency—such as droughts, floods, weather, livestock disease, embargoes, tariffs and international economic, political and regulatory developments. The fund may also incur transaction costs with the conversion between various currencies. • The Fund’s exposure to foreign currencies subjects the fund to the risk that those currencies will decline in value relative to the U.S. dollar, or, in the case of short positions, that the U.S. dollar will decline in value relative to the currency being hedged. • These risks may cause the Fund to experience higher losses and/or volatility than a fund that does not invest in derivatives, use leverage or short sales or have exposure to high yield/fixed income securities, foreign currencies and/or securities. • This Fund is considered non-diversified and can invest a greater portion of its assets in securities of individual issuers than a diversified fund. As a result, changes in the market value of a single security could cause greater fluctuations in the value of Fund shares than would occur in a more diversified fund. • Please read the prospectus for more detailed information regarding these and other risks.
The Commodities Strategy Fund is subject to a number of risks and may not be suitable for all investors • The Fund’s exposure to the commodity markets may subject the fund to greater volatility as commodity-linked investments may be affected by changes in overall market movements, commodity index volatility, changes in interest rates or factors affecting a particular industry or commodity—such as droughts, floods, weather, embargos, tariffs and international economic, political and regulatory developments. • To the extent that the Fund’s investments are concentrated in energy-related commodities, the Fund is subject to the risk that this sector will underperform the market as a whole. • The Fund’s use of derivatives, such as futures, options, structured notes and swap agreements, may expose the Fund to additional risks that it would not be subject to if it invested directly in the securities or investments underlying those derivatives. • The more the Fund invests in leveraged instruments, the more the leverage will magnify any gains or losses on those investments. • The Fund is subject to tracking error risks, which may cause the fund’s performance not to match that of or be lower than the fund’s underlying benchmark. • The Fund’s investments in other investment companies subjects the Fund to those risks affecting the investment company, including the possibility that the value of the underlying securities held by the investment company could decrease. Moreover, the Fund will incur its pro rata share of the expenses of the underlying investment companies’ expenses. • This Fund is considered non-diversified and can invest a greater portion of its assets in securities of individual issuers than a diversified fund. As a result, changes in the market value of a single security could cause greater fluctuations in the value of Fund shares than would occur in a more diversified fund. • See the prospectus for more information on these and additional risks.
| THE GUGGENHEIM FUNDS ANNUAL REPORT | 3 |
| ECONOMIC AND MARKET OVERVIEW (Unaudited) | December 31, 2013 |
The year ended December 31, 2013 wound down with a series of stronger-than-expected economic data releases. ISM manufacturing data (historically indicative of expansion or contraction) rose to its highest levels in over two years, consumer confidence rebounded following the government shutdown, housing starts surged, and the job market strengthened. Citing improved labor market conditions and a sustainable economic expansion, the U.S. Federal Reserve (the “Fed”) announced in December that it would reduce its monthly bond purchases by $10 billion, to $75 billion, starting in January 2014. Yet, at the same time, the Fed lengthened the time frame before which it will raise rates by promising to keep the Fed funds target rate at 0-0.25% at least as long as the unemployment rate remains above 6.5% and perhaps “well past” the time this target is reached. For the first time, the Fed also added a lower-bound target for inflation of 2%–lengthening the expected time frame before rates rise.
As the U.S. economy slowly strengthens, we may return to an environment where taking credit risk is not just a consequence of staying within duration targets or reaching for yield, but rather a proactive choice driven by a positive outlook on the economy. To sustain optimism, the Fed will need to monitor the unintended consequences of tapering and avoid negative economic repercussions, as happened in the summer of 2013 when a spike in 10-year Treasury yields dampened home sales. For markets, the Fed must convince investors that the economy is strong enough to withstand steady reductions of its asset purchases. These will likely be Janet Yellen’s top priorities as she takes over the helm of the Fed.
Last January, the global economy faced myriad headwinds, choppiness lay ahead, and we expected plenty of volatility in 2013. Nevertheless, we believed at that point that risk assets were the best choice for investors. Now, the headwinds of 2013 have largely dissipated, and the outlook appears benign for risk assets for the first three to six months of 2014, if not longer.
Many pundits may have underestimated the strength of the U.S. economy, with both third quarter and fourth quarter economic growth beating expectations. The final three months of 2013 were exceptionally good for U.S. equities, which produced a wealth effect that probably boosted holiday sales. All of this bodes well for the first quarter of 2014.
Market conditions could be even stronger in Europe. Economic data from the euro area’s periphery is improving faster than from the core, where inflation is also rising at a faster pace, giving the peripheral nations a competitive advantage. In Asia, markets have priced for a more negative scenario that now appears less likely. With the U.S. and Europe now out of recession, they are ready to underpin a recovery in export growth in the Asian region. As a synchronous global expansion gets under way, investors may become more comfortable with taking risk, and this should be reflected in asset prices in many regions around the globe.
For 2014, investors should bear in mind that the Fed will continue injecting liquidity into financial markets even as it tapers its asset purchases. Assuming that the Fed continues the same pace of reductions at each Federal Open Market Committee meeting, it would still purchase more than $500 billion of bonds in 2014–nearly the size of the Fed’s QE2 from November 2010 to June 2011. This should help support credit spreads. An accelerated pace of tapering from the Fed would signal faster-than-expected economic growth and spark higher demand for risk assets. On balance, we expect the impact of tapering to be neutral. Barring economic weakness, we expect relatively benign market conditions with no major spike in volatility.
For the year ended December 31, 2013, the Standard & Poor’s 500® (“S&P 500”) Index* returned 32.39%. Foreign markets were also strong: the Morgan Stanley Capital International (“MSCI”) Europe-Australasia-Far East (“EAFE”) Index* returned 22.78%. The return of the MSCI Emerging Markets Index* was -2.60%.
In the bond market, the Barclays U.S. Aggregate Bond Index* posted a -2.02% return for the period, while the Barclays U.S. Corporate High Yield Index* returned 7.44%. The return of the Bank of America Merrill Lynch 3-Month U.S. Treasury Bill Index* was 0.07% for the 12-month period.
The opinions and forecasts expressed may not actually come to pass. This information is subject to change at any time, based on market and other conditions, and should not be construed as a recommendation of any specific security or strategy.
| 4 | THE GUGGENHEIM FUNDS ANNUAL REPORT |
| ECONOMIC AND MARKET OVERVIEW (Unaudited) (concluded) | December 31, 2013 |
*Index Definitions:
The following indices are referenced throughout this report. Indices are unmanaged and not available for direct investment. Index performance does not reflect transaction costs, fees, or expenses.
Barclays U.S. Aggregate Bond Index is a broad-based benchmark that measures the investment grade, U.S. dollar denominated, fixed-rate taxable bond market, including U.S. Treasuries, government-related and corporate securities, MBS (agency fixed-rate and hybrid ARM pass-throughs), ABS, and CMBS.
Barclays U.S. Corporate High Yield Index measures the market of USD-denominated, non-investment grade, fixed-rate, taxable corporate bonds. Securities are classified as high yield if the middle rating of Moody’s, Fitch, and S&P is Ba1/BB +/BB + or below.
Bank of America Merrill Lynch 3-Month U.S. Treasury Bill Index is an unmanaged market index of U.S. Treasury securities maturing in 90 days that assumes reinvestment of all income.
MSCI EAFE Index is a free float-adjusted market capitalization index that is designed to measure the equity market performance of developed markets, excluding the US & Canada.
MSCI Emerging Markets Index is a free float-adjusted market capitalization weighted index that is designed to measure equity market performance in the global emerging markets.
S&P 500® Index is a capitalization-weighted index of 500 stocks designed to measure the performance of the broad economy, representing all major industries and is considered a representation of the U.S. stock market.
Russell 1000® Index measures the performance of the large-cap segment of the U.S. equity market. It is a subset of the Russell 3000 Index and includes approximately 1000 of the largest securities based on a combination of the market cap and current index membership. The Russell 1000 represents approximately 92% of the U.S. equity market.
Russell 3000® Index measures the performance of the largest 3,000 U.S. companies, representing approximately 98% of the investable U.S. equity market.
S&P GSCI®, a benchmark for investment performance in the commodity markets, measures investable commodity price movements and inflation in the world economy. The index is calculated primarily on a world production weighted basis and is comprised of the principal physical commodities that are the subject of active, liquid futures markets.
HFRX Global Hedge Fund Index is designed to be representative of the overall composition of the hedge fund universe. It is comprised of all eligible hedge fund strategies, including, but not limited to, convertible arbitrage, distressed securities, equity hedge, equity market neutral, event driven, macro, merger arbitrage and relative-value arbitrage. The strategies are asset weighted based on the distribution of assets in the hedge fund industry.
HFRX Equity Hedge Fund Index is designed to be representative of the overall composition of the equity hedge segment of the hedge fund universe. In an equity hedge strategy both long and short positions primarily in equities are maintained. Equities which are believed to be undervalued are bought and equities which are believed to be overvalued are sold.
| THE GUGGENHEIM FUNDS ANNUAL REPORT | 5 |
| ABOUT SHAREHOLDERS’ FUND EXPENSES (Unaudited) |
All mutual funds have operating expenses, and it is important for our shareholders to understand the impact of costs on their investments. Shareholders of a Fund incur two types of costs: (i) transaction costs, including sales charges (loads) on purchase payments, reinvested dividends, or other distributions; and exchange fees; and (ii) ongoing costs, including management fees, administrative services, and shareholder reports, among others. These ongoing costs, or operating expenses, are deducted from a fund’s gross income and reduce the investment return of the fund.
A fund’s expenses are expressed as a percentage of its average net assets, which is known as the expense ratio. The following examples are intended to help investors understand the ongoing costs (in dollars) of investing in a Fund and to compare these costs with the ongoing costs of investing in other mutual funds.
The examples are based on an investment of $1,000 made at the beginning of the period and held for the entire six-month period beginning
June 30, 2013 and ending December 31, 2013.
The following tables illustrate a Fund’s costs in two ways:
Table 1. Based on actual Fund return. This section helps investors estimate the actual expenses paid over the period. The “Ending Account Value” shown is derived from the Fund’s actual return, and the fourth column shows the dollar amount that would have been paid by an investor who started with $1,000 in the Fund. Investors may use the information here, together with the amount invested, to estimate the expenses paid over the period. Simply divide the Fund’s account value by $1,000 (for example, an $8,600 account value divided by $1,000 = 8.6), then multiply the result by the number provided under the heading “Expenses Paid During Period.”
Table 2. Based on hypothetical 5% return. This section is intended to help investors compare a Fund’s cost with those of other mutual funds. The table provides information about hypothetical account values and hypothetical expenses based on the Fund’s actual expense ratio and an assumed rate of return of 5% per year before expenses, which is not the Fund’s actual return. The hypothetical account values and expenses may not be used to estimate the actual ending account balance or expenses paid during the period. The example is useful in making comparisons because the U.S. Securities and Exchange Commission (the “SEC”) requires all mutual funds to calculate expenses based on the 5% return. Investors can assess a Fund’s costs by comparing this hypothetical example with the hypothetical examples that appear in shareholder reports of other funds.
The calculations illustrated above assume no shares were bought or sold during the period. Actual costs may have been higher or lower, depending on the amount of investment and the timing of any purchases or redemptions.
Please note that the expenses shown in the table are meant to highlight your ongoing costs only and do not reflect any transactional costs, such as sales charges (loads) on purchase payments, and contingent deferred sales charges (“CDSC”) on redemptions, if any. Therefore, the second table is useful in comparing ongoing costs only, and will not help you determine the relative total costs of owning different funds. In addition, if these transactional costs were included, your costs would have been higher.
More information about a Fund’s expenses, including annual expense ratios for the past five years, can be found in the Financial Highlights section of this report. For additional information on operating expenses and other shareholder costs, please refer to the appropriate Fund prospectus.
| 6 | THE GUGGENHEIM FUNDS ANNUAL REPORT |
| ABOUT SHAREHOLDERS’ FUND EXPENSES (Unaudited) (concluded) |
| Beginning | Ending | Expenses | ||||||||||||||||||
| Expense | Fund | Account Value | Account Value | Paid During | ||||||||||||||||
| Ratio1 | Return | June 30, 2013 | December 31, 2013 | Period2 | ||||||||||||||||
| Table 1. Based on actual Fund return3 | ||||||||||||||||||||
| Long Short Equity Fund | 2.25 | % | 9.73 | % | $1,000.00 | $1,097.30 | $11.89 | |||||||||||||
| Global Managed Futures Strategy Fund | 1.56 | % | 3.73 | % | 1,000.00 | 1,037.30 | 8.01 | |||||||||||||
| Multi-Hedge Strategies Fund | 2.59 | % | (0.26 | %) | 1,000.00 | 997.40 | 13.04 | |||||||||||||
| Commodities Strategy Fund | 1.53 | % | 3.83 | % | 1,000.00 | 1,038.30 | 7.86 | |||||||||||||
| Table 2. Based on hypothetical 5% return (before expenses) | ||||||||||||||||||||
| Long Short Equity Fund | 2.25 | % | 5.00 | % | $1,000.00 | $1,013.86 | $11.42 | |||||||||||||
| Global Managed Futures Strategy Fund | 1.56 | % | 5.00 | % | 1,000.00 | 1,017.34 | 7.93 | |||||||||||||
| Multi-Hedge Strategies Fund | 2.59 | % | 5.00 | % | 1,000.00 | 1,012.15 | 13.14 | |||||||||||||
| Commodities Strategy Fund | 1.53 | % | 5.00 | % | 1,000.00 | 1,017.49 | 7.78 | |||||||||||||
| 1 | Annualized and excludes expenses of the underlying funds in which the Fund invests. This ratio represents net expenses, which includes dividends on short sales and prime broker interest expenses. Excluding these expenses, the operating expense ratios of the Long Short Equity Fund and the Multi-Hedge Strategies Fund would be 1.65% and 1.15%, respectively. |
| 2 | Expenses are equal to the Fund’s annualized expense ratio, net of any applicable fee waivers, multiplied by the average account value over the period, multiplied by 184/365 (to reflect the one-half year period). Expenses shown do not include fees charged by insurance companies. |
| 3 | Actual cumulative return at net asset value for the period June 30, 2013 to December 31, 2013. |
| THE GUGGENHEIM FUNDS ANNUAL REPORT | 7 |
| PERFORMANCE REPORT AND FUND PROFILE (Unaudited) | December 31, 2013 |
LONG SHORT EQUITY FUND
OBJECTIVE: Seeks long-term capital appreciation.
For the one-year period ended December 31, 2013, the Long Short Equity Fund (formerly, the U.S. Long Short Momentum Fund) returned 17.46%.
The Fund’s Board of Trustees approved changes to the Fund effective October 30, 2013: a name change, new principal investment strategies and a new benchmark. The change of investment strategies better aligns the risk and return profile of the fund with its new HFRX Equity Hedge benchmark and the long/short equity peer universe.
The Fund’s new benchmark, the HFRX Equity Hedge Index, returned 11.14% for the one-year period ended December 31, 2013, but it was the benchmark only from October 31, 2013 through December 31, 2013. The Fund’s previous benchmark, the Russell 3000, returned 33.55% for the one-year period.
The annualized risk for the Fund was 4.8%, roughly in line with the 4.6% annualized risk of the HFRX Equity Hedge Index, and significantly lower than the risk level of a long-only equity index.
Trend-based strategies performed well during the 2013 calendar year. Our industry, stock and style tilts–each of which seeks to capture market trends through price momentum–all contributed positive returns to Fund performance.
Industry tilts based on momentum performed particularly well in the first and second quarters. Overweights in Household Durable, Building Products, Media and Biotechnology companies, as well as short positions in Metals & Mining companies, produced gains for the Fund.
Stock tilts excelled during the second and third quarters. During this period, Exxon Mobil, IBM, and Nu Skin Enterprises, Inc. were the three biggest contributors to returns on the long side, while Allied Nevada and Walter Energy short positions contributed significant positive returns to the Fund.
Style tilts produced their largest gains in the fourth quarter, with underweights of Book/Price and overweights of the Revenue/Price style both adding significant value to Fund performance.
The Fund’s assets can be subdivided into long and short positions. During 2013, the long basket represented 67% of assets on average, while the short, or hedging, basket averaged 25% of assets. The balance of Fund assets was allocated to cash during this time due to a lack of attractive shorting opportunities.
The strength of equity markets resulted in a contribution of 28.6% to fund returns from the long equity basket. Grossing up long-basket returns highlights the value added by this portfolio of stocks relative to a long-only equity benchmark. A full 100% allocation to the Fund’s long equity basket would have returned 42.7%, 9.6% better than a traditional capitalization-weighted of Russell 1000 Index, which returned 33.1% during the period.
Likewise, a full -100% allocation to our short basket would have returned -25.9%, versus a -33.1% return if an investor simply shorted the Russell 1000 Index, an improvement of 7.2% over this alternative hedging approach. While our hedging approach outperformed a whole market hedge, the rising prices of our hedging basket did create a -6.5% contribution to Fund returns. Transaction costs and Fund expenses were also costing the fund -2.4% during the year.
Performance displayed represents past performance which is no guarantee of future results.
| 8 | THE GUGGENHEIM FUNDS ANNUAL REPORT |
| PERFORMANCE REPORT AND FUND PROFILE (Unaudited) (concluded) |
Holdings Diversification (Market Exposure as % of Net Assets)
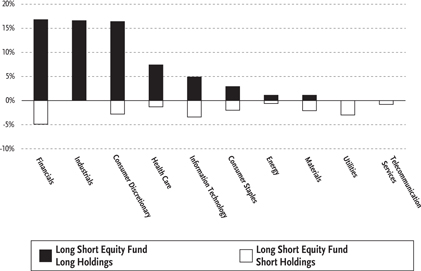
“Holdings Diversification (Market Exposure as % of Net Assets)” excludes any temporary cash investments.
Inception Date: May 1, 2002
Ten Largest Long Holdings (% of Total Net Assets)
| Kronos Worldwide, Inc. | 0.6 | % | ||
| Textron, Inc. | 0.6 | % | ||
| Clear Channel Outdoor Holdings, Inc. — Class A | 0.6 | % | ||
| Allergan, Inc. | 0.6 | % | ||
| Groupon, Inc. — Class A | 0.6 | % | ||
| IAC/InterActiveCorp | 0.6 | % | ||
| Techne Corp. | 0.6 | % | ||
| Lockheed Martin Corp. | 0.6 | % | ||
| Kirby Corp. | 0.5 | % | ||
| Booz Allen Hamilton Holding Corp. | 0.5 | % | ||
| Top Ten Total | 5.8 | % |
“Ten Largest Long Holdings” exclude any temporary cash or derivative investments.
Cumulative Fund Performance*,†

Average Annual Returns
Periods Ended December 31, 2013*,†
| 1 Year | 5 Year | 10 Year | ||||||||||
| Long Short Equity Fund | 17.46 | % | 10.16 | % | 5.17 | % | ||||||
| HFRX Equity Hedge Index†† | 11.14 | % | 3.04 | % | 0.39 | % | ||||||
| Russell 3000 Index | 33.55 | % | 18.71 | % | 7.88 | % | ||||||
| * | The performance data above represents past performance that is not predictive of future results. The investment return and principal value of an investment in the Fund will fluctuate so that an investor’s shares, when redeemed, may be worth more or less than their original cost. Returns are historical and include changes in principal and reinvested dividends and capital gains and do not reflect the effect of taxes. The HFRX Equity Hedge Index and the Russell 3000 Index are unmanaged indices and, unlike the Fund, have no management fees or operating expenses to reduce their reported return. |
| † | Returns do not reflect the impact of any additional fees charged by insurance companies. |
| †† | Effective October 30, 2013, the Fund’s current comparative broad-based market index, the Russell 3000 Index was replaced with the HFRX Equity Hedge Index. In light of the recent changes to the Fund’s principal investment strategies, the Fund’s Advisor, believes the HFRX Equity Hedge Index is an appropriate broad-based securities market index for purposes of comparing the Fund’s performance. |
| THE GUGGENHEIM FUNDS ANNUAL REPORT | 9 |
| SCHEDULE OF INVESTMENTS | December 31, 2013 |
| LONG SHORT EQUITY FUND |
| Shares | Value | |||||||
| COMMON STOCKS† - 67.2% | ||||||||
| FINANCIALS - 16.8% | ||||||||
| Northern Trust Corp.1 | 3,914 | $ | 242,238 | |||||
| Artisan Partners Asset | ||||||||
| Management, Inc. — Class A1 | 3,700 | 241,203 | ||||||
| Synovus Financial Corp.1 | 66,047 | 237,770 | ||||||
| Lazard Ltd. — Class A1 | 5,229 | 236,978 | ||||||
| LPL Financial Holdings, Inc.1 | 5,035 | 236,796 | ||||||
| Popular, Inc.*,1 | 8,241 | 236,764 | ||||||
| BOK Financial Corp.1 | 3,569 | 236,696 | ||||||
| Endurance Specialty Holdings Ltd.1 | 3,999 | 234,622 | ||||||
| Protective Life Corp.1 | 4,583 | 232,175 | ||||||
| Allied World Assurance Company | ||||||||
| Holdings AG1 | 2,056 | 231,938 | ||||||
| NASDAQ OMX Group, Inc.1 | 5,825 | 231,835 | ||||||
| Validus Holdings Ltd.1 | 5,745 | 231,466 | ||||||
| Valley National Bancorp1 | 22,872 | 231,465 | ||||||
| TCF Financial Corp.1 | 14,219 | 231,059 | ||||||
| American National Insurance Co.1 | 2,011 | 230,340 | ||||||
| StanCorp Financial Group, Inc.1 | 3,476 | 230,285 | ||||||
| BankUnited, Inc.1 | 6,995 | 230,275 | ||||||
| Fulton Financial Corp.1 | 17,522 | 229,188 | ||||||
| Mercury General Corp.1 | 4,588 | 228,070 | ||||||
| First Citizens BancShares, Inc. — Class A1 | 1,024 | 227,973 | ||||||
| Ares Capital Corp.1 | 12,816 | 227,740 | ||||||
| Hanover Insurance Group, Inc.1 | 3,810 | 227,495 | ||||||
| Kemper Corp.1 | 5,564 | 227,456 | ||||||
| HCC Insurance Holdings, Inc.1 | 4,928 | 227,378 | ||||||
| Aspen Insurance Holdings Ltd.1 | 5,498 | 227,122 | ||||||
| ProAssurance Corp.1 | 4,663 | 226,062 | ||||||
| SEI Investments Co.1 | 6,477 | 224,946 | ||||||
| Interactive Brokers Group, Inc. — Class A1 | 9,143 | 222,541 | ||||||
| First Niagara Financial Group, Inc.1 | 20,824 | 221,151 | ||||||
| CBOE Holdings, Inc.1 | 3,889 | 202,072 | ||||||
| Bank of Hawaii Corp.1 | 2,687 | 158,909 | ||||||
| Legg Mason, Inc.1 | 3,527 | 153,354 | ||||||
| Associated Banc-Corp.1 | 6,625 | 115,275 | ||||||
| PartnerRe Ltd.1 | 922 | 97,206 | ||||||
| WR Berkley Corp.1 | 2,101 | 91,162 | ||||||
| American Financial Group, Inc.1 | 896 | 51,717 | ||||||
| Commerce Bancshares, Inc.1 | 976 | 43,832 | ||||||
| Total Financials | 7,614,554 | |||||||
| INDUSTRIALS - 16.6% | ||||||||
| Textron, Inc.1 | 7,138 | 262,393 | ||||||
| Lockheed Martin Corp.1 | 1,683 | 250,195 | ||||||
| Kirby Corp.*,1 | 2,500 | 248,125 | ||||||
| TransDigm Group, Inc.1 | 1,514 | 243,784 | ||||||
| L-3 Communications Holdings, Inc.1 | 2,279 | 243,534 | ||||||
| Huntington Ingalls Industries, Inc.1 | 2,700 | 243,027 | ||||||
| Northrop Grumman Corp.1 | 2,090 | 239,535 | ||||||
| Hexcel Corp.*,1 | 5,357 | 239,404 | ||||||
| Robert Half International, Inc.1 | 5,677 | 238,377 | ||||||
| Spirit Aerosystems Holdings, Inc. — | ||||||||
| Class A*,1 | 6,980 | 237,878 | ||||||
| Dun & Bradstreet Corp.1 | 1,936 | 237,644 | ||||||
| Landstar System, Inc.1 | 4,132 | 237,383 | ||||||
| Triumph Group, Inc.1 | 3,118 | 237,186 | ||||||
| General Dynamics Corp.1 | 2,478 | 236,773 | ||||||
| Manpowergroup, Inc.1 | 2,735 | 234,827 | ||||||
| Rockwell Collins, Inc.1 | 3,167 | 234,105 | ||||||
| Alaska Air Group, Inc.1 | 3,181 | 233,390 | ||||||
| Harsco Corp.1 | 8,313 | 233,013 | ||||||
| Equifax, Inc.1 | 3,372 | 232,971 | ||||||
| Copa Holdings S.A. — Class A1 | 1,453 | 232,640 | ||||||
| Old Dominion Freight Line, Inc.*,1 | 4,384 | 232,440 | ||||||
| Exelis, Inc.1 | 12,180 | 232,151 | ||||||
| B/E Aerospace, Inc.*,1 | 2,660 | 231,500 | ||||||
| IHS, Inc. — Class A*,1 | 1,931 | 231,141 | ||||||
| Hubbell, Inc. — Class B1 | 2,105 | 229,235 | ||||||
| Southwest Airlines Co.1 | 11,996 | 226,005 | ||||||
| Alliant Techsystems, Inc.1 | 1,835 | 223,283 | ||||||
| Verisk Analytics, Inc. — Class A*,1 | 3,364 | 221,082 | ||||||
| Con-way, Inc.1 | 5,520 | 219,199 | ||||||
| United Continental Holdings, Inc.*,1 | 5,756 | 217,749 | ||||||
| Delta Air Lines, Inc.1 | 7,906 | 217,178 | ||||||
| AMERCO*,1 | 615 | 146,272 | ||||||
| Valmont Industries, Inc.1 | 506 | 75,455 | ||||||
| Nielsen Holdings N.V.1 | 402 | 18,448 | ||||||
| Total Industrials | 7,517,322 | |||||||
| CONSUMER DISCRETIONARY - 16.4% | ||||||||
| Clear Channel Outdoor Holdings, | ||||||||
| Inc. — Class A1 | 25,373 | 257,282 | ||||||
| Groupon, Inc. — Class A*,1 | 21,789 | 256,456 | ||||||
| Cablevision Systems Corp. — Class A1 | 13,680 | 245,282 | ||||||
| Expedia, Inc.1 | 3,512 | 244,646 | ||||||
| Liberty Ventures*,1 | 1,989 | 243,832 | ||||||
| Gentex Corp.1 | 7,321 | 241,519 | ||||||
| Scripps Networks Interactive, | ||||||||
| Inc. — Class A1 | 2,788 | 240,911 | ||||||
| HomeAway, Inc.*,1 | 5,875 | 240,170 | ||||||
| John Wiley & Sons, Inc. — Class A1 | 4,343 | 239,733 | ||||||
| Amazon.com, Inc.*,1 | 594 | 236,881 | ||||||
| BorgWarner, Inc.1 | 4,232 | 236,611 | ||||||
| Liberty Interactive Corp. — Class A*,1 | 8,028 | 235,622 | ||||||
| Allison Transmission Holdings, Inc.1 | 8,521 | 235,265 | ||||||
| Visteon Corp.*,1 | 2,870 | 235,024 | ||||||
| Goodyear Tire & Rubber Co.1 | 9,825 | 234,326 | ||||||
| Priceline.com, Inc.*,1 | 200 | 232,480 | ||||||
| Gannett Company, Inc.1 | 7,840 | 231,907 | ||||||
| Darden Restaurants, Inc.1 | 4,262 | 231,724 | ||||||
| Hyatt Hotels Corp. — Class A*,1 | 4,677 | 231,325 | ||||||
| Delphi Automotive plc1 | 3,800 | 228,494 | ||||||
| News Corp. — Class A*,1 | 12,631 | 227,611 | ||||||
| Johnson Controls, Inc.1 | 4,435 | 227,516 | ||||||
| TripAdvisor, Inc.*,1 | 2,743 | 227,203 | ||||||
| Cinemark Holdings, Inc.1 | 6,814 | 227,110 | ||||||
| Lear Corp.1 | 2,800 | 226,716 | ||||||
| TRW Automotive Holdings Corp.*,1 | 3,000 | 223,170 | ||||||
| Regal Entertainment Group — Class A1 | 11,417 | 222,061 | ||||||
| Six Flags Entertainment Corp.1 | 5,969 | 219,779 | ||||||
| Morningstar, Inc.1 | 2,774 | 216,622 | ||||||
| Netflix, Inc.*,1 | 451 | 166,045 | ||||||
| Brinker International, Inc.1 | 3,381 | 156,676 | ||||||
| 10 | THE GUGGENHEIM FUNDS ANNUAL REPORT | SEE NOTES TO FINANCIAL STATEMENTS. |
| SCHEDULE OF INVESTMENTS (continued) | December 31, 2013 |
| LONG SHORT EQUITY FUND |
| Shares | Value | |||||||
| Burger King Worldwide, Inc.1 | 5,195 | $ | 118,758 | |||||
| Choice Hotels International, Inc.1 | 1,804 | 88,594 | ||||||
| DISH Network Corp. — Class A*,1 | 768 | 44,483 | ||||||
| Taylor Morrison Home Corp. — Class A*,1 | 1,955 | 43,890 | ||||||
| CST Brands, Inc.1 | 428 | 15,716 | ||||||
| Total Consumer Discretionary | 7,431,440 | |||||||
| HEALTH CARE - 7.4% | ||||||||
| Allergan, Inc.1 | 2,311 | 256,706 | ||||||
| Techne Corp.1 | 2,650 | 250,875 | ||||||
| Forest Laboratories, Inc.*,1 | 4,025 | 241,621 | ||||||
| QIAGEN N.V.*,1 | 9,915 | 236,076 | ||||||
| PerkinElmer, Inc.1 | 5,717 | 235,712 | ||||||
| Allscripts Healthcare Solutions, Inc.*,1 | 15,114 | 233,662 | ||||||
| Hospira, Inc.*,1 | 5,602 | 231,251 | ||||||
| Bio-Rad Laboratories, Inc. — Class A*,1 | 1,870 | 231,151 | ||||||
| Zoetis, Inc.1 | 7,069 | 231,086 | ||||||
| AmerisourceBergen Corp. — Class A1 | 3,226 | 226,820 | ||||||
| Jazz Pharmaceuticals plc*,1 | 1,788 | 226,289 | ||||||
| Mallinckrodt plc*,1 | 4,275 | 223,412 | ||||||
| Cardinal Health, Inc.1 | 3,157 | 210,919 | ||||||
| Health Net, Inc.*,1 | 6,763 | 200,658 | ||||||
| Bruker Corp.*,1 | 5,801 | 114,686 | ||||||
| Total Health Care | 3,350,924 | |||||||
| INFORMATION TECHNOLOGY - 4.9% | ||||||||
| IAC/InterActiveCorp1 | 3,717 | 255,321 | ||||||
| Booz Allen Hamilton Holding Corp.1 | 12,867 | 246,403 | ||||||
| Leidos Holdings, Inc.1 | 5,174 | 240,539 | ||||||
| Zebra Technologies Corp. — Class A*,1 | 4,438 | 240,007 | ||||||
| Computer Sciences Corp.1 | 4,267 | 238,440 | ||||||
| Lexmark International, Inc. — Class A1 | 6,624 | 235,284 | ||||||
| VeriSign, Inc.*,1 | 3,871 | 231,408 | ||||||
| Diebold, Inc.1 | 6,990 | 230,740 | ||||||
| Dolby Laboratories, Inc. — Class A*,1 | 5,890 | 227,118 | ||||||
| AOL, Inc.*,1 | 1,481 | 69,044 | ||||||
| Total Information Technology | 2,214,304 | |||||||
| CONSUMER STAPLES - 2.9% | ||||||||
| Nu Skin Enterprises, Inc. — Class A1 | 1,718 | 237,463 | ||||||
| Estee Lauder Companies, Inc. — Class A1 | 3,081 | 232,061 | ||||||
| Dean Foods Co.*,1 | 13,131 | 225,722 | ||||||
| Coty, Inc. — Class A1 | 14,628 | 223,077 | ||||||
| Avon Products, Inc.1 | 12,901 | 222,155 | ||||||
| Hillshire Brands Co.1 | 5,632 | 188,334 | ||||||
| Total Consumer Staples | 1,328,812 | |||||||
| ENERGY - 1.1% | ||||||||
| World Fuel Services Corp.1 | 5,304 | 228,920 | ||||||
| CVR Energy, Inc.1 | 3,430 | 148,965 | ||||||
| Teekay Corp.1 | 2,771 | 133,036 | ||||||
| Total Energy | 510,921 | |||||||
| MATERIALS - 1.1% | ||||||||
| Kronos Worldwide, Inc.1 | 14,238 | 271,235 | ||||||
| Greif, Inc. — Class A1 | 4,315 | 226,106 | ||||||
| Total Materials | 497,341 | |||||||
| Total Common Stocks | ||||||||
| (Cost $26,489,250) | 30,465,618 | |||||||
| Face | ||||||||
| Amount | ||||||||
| REPURCHASE AGREEMENT††,2 - 36.6% | ||||||||
| Credit Suisse Group | ||||||||
| issued 12/31/13 at 0.00% | ||||||||
| due 01/02/14 | $ | 16,582,298 | 16,582,298 | |||||
| Total Repurchase Agreement | ||||||||
| (Cost $16,582,298) | 16,582,298 | |||||||
| Total Investments - 103.8% | ||||||||
| (Cost $43,071,548) | $ | 47,047,916 | ||||||
| Shares | ||||||||
| COMMON STOCKS SOLD SHORT† - (21.0)% | ||||||||
| Energy - (0.6)% | ||||||||
| Halliburton Co. | 932 | (47,299 | ) | |||||
| National Oilwell Varco, Inc. | 1,417 | (112,694 | ) | |||||
| Schlumberger Ltd. | 1,289 | (116,152 | ) | |||||
| Total Energy | (276,145 | ) | ||||||
| TELECOMMUNICATION SERVICES - (0.8)% | ||||||||
| Verizon Communications, Inc. | 2,329 | (114,447 | ) | |||||
| CenturyLink, Inc. | 3,631 | (115,647 | ) | |||||
| AT&T, Inc. | 3,295 | (115,853 | ) | |||||
| Total Telecommunication Services | (345,947 | ) | ||||||
| HEALTH CARE - (1.6)% | ||||||||
| Vertex Pharmaceuticals, Inc.* | 347 | (25,782 | ) | |||||
| Biogen Idec, Inc.* | 406 | (113,579 | ) | |||||
| Amgen, Inc. | 995 | (113,589 | ) | |||||
| Regeneron Pharmaceuticals, Inc.* | 414 | (113,949 | ) | |||||
| Celgene Corp.* | 677 | (114,386 | ) | |||||
| Abbott Laboratories | 3,064 | (117,443 | ) | |||||
| Gilead Sciences, Inc.* | 1,564 | (117,535 | ) | |||||
| Total Health Care | (716,263 | ) | ||||||
| CONSUMER STAPLES - (2.0)% | ||||||||
| Walgreen Co. | 581 | (33,373 | ) | |||||
| Green Mountain Coffee Roasters, Inc.* | 491 | (37,110 | ) | |||||
| Lorillard, Inc. | 991 | (50,224 | ) | |||||
| Procter & Gamble Co. | 1,359 | (110,636 | ) | |||||
| Wal-Mart Stores, Inc. | 1,429 | (112,448 | ) | |||||
| PepsiCo, Inc. | 1,379 | (114,374 | ) | |||||
| Philip Morris International, Inc. | 1,314 | (114,489 | ) | |||||
| Mondelez International, Inc. — Class A | 3,294 | (116,278 | ) | |||||
| Coca-Cola Co. | 2,847 | (117,610 | ) | |||||
| CVS Caremark Corp. | 1,658 | (118,663 | ) | |||||
| Total Consumer Staples | (925,205 | ) | ||||||
| MATERIALS - (2.0)% | ||||||||
| Newmont Mining Corp. | 4,796 | (110,452 | ) | |||||
| Tahoe Resources, Inc.* | 6,791 | (113,002 | ) | |||||
| International Paper Co. | 2,333 | (114,387 | ) | |||||
| Carpenter Technology Corp. | 1,852 | (115,194 | ) | |||||
| Nucor Corp. | 2,161 | (115,355 | ) | |||||
| Freeport-McMoRan Copper & Gold, Inc. | 3,249 | (122,617 | ) | |||||
| Alcoa, Inc. | 11,744 | (124,839 | ) | |||||
| Southern Copper Corp. | 4,378 | (125,693 | ) | |||||
| Total Materials | (941,539 | ) | ||||||
| CONSUMER DISCRETIONARY - (2.7)% | ||||||||
| PulteGroup, Inc. | 4,807 | (97,919 | ) | |||||
| Ford Motor Co. | 6,730 | (103,844 | ) | |||||
| SEE NOTES TO FINANCIAL STATEMENTS. | THE GUGGENHEIM FUNDS ANNUAL REPORT | 11 |
| SCHEDULE OF INVESTMENTS (concluded) | December 31, 2013 |
| LONG SHORT EQUITY FUND |
| Shares | Value | |||||||
| Dollar General Corp.* | 1,841 | $ | (111,049 | ) | ||||
| Dollar Tree, Inc.* | 2,006 | (113,179 | ) | |||||
| Tesla Motors, Inc.* | 755 | (113,537 | ) | |||||
| Target Corp. | 1,795 | (113,569 | ) | |||||
| General Motors Co.* | 2,787 | (113,904 | ) | |||||
| Macy’s, Inc. | 2,172 | (115,985 | ) | |||||
| Home Depot, Inc. | 1,409 | (116,017 | ) | |||||
| Lowe’s Companies, Inc. | 2,365 | (117,186 | ) | |||||
| Lennar Corp. — Class A | 3,184 | (125,959 | ) | |||||
| Total Consumer Discretionary | (1,242,148 | ) | ||||||
| UTILITIES - (3.0)% | ||||||||
| FirstEnergy Corp. | 3,176 | (104,744 | ) | |||||
| Exelon Corp. | 4,030 | (110,382 | ) | |||||
| Xcel Energy, Inc. | 4,024 | (112,431 | ) | |||||
| Duke Energy Corp. | 1,637 | (112,969 | ) | |||||
| OGE Energy Corp. | 3,333 | (112,989 | ) | |||||
| Edison International | 2,446 | (113,250 | ) | |||||
| Dominion Resources, Inc. | 1,757 | (113,660 | ) | |||||
| American Electric Power Company, Inc. | 2,436 | (113,859 | ) | |||||
| Northeast Utilities | 2,686 | (113,860 | ) | |||||
| Southern Co. | 2,778 | (114,204 | ) | |||||
| PPL Corp. | 3,814 | (114,763 | ) | |||||
| NextEra Energy, Inc. | 1,352 | (115,757 | ) | |||||
| Total Utilities | (1,352,868 | ) | ||||||
| INFORMATION TECHNOLOGY - (3.3)% | ||||||||
| Zynga, Inc. — Class A* | 27,170 | (103,246 | ) | |||||
| Micron Technology, Inc.* | 4,833 | (105,166 | ) | |||||
| Microsoft Corp. | 3,043 | (113,899 | ) | |||||
| QUALCOMM, Inc. | 1,537 | (114,122 | ) | |||||
| Brocade Communications Systems, Inc.* | 13,326 | (118,202 | ) | |||||
| Palo Alto Networks, Inc.* | 2,066 | (118,733 | ) | |||||
| Nuance Communications, Inc.* | 7,846 | (119,259 | ) | |||||
| Riverbed Technology, Inc.* | 6,684 | (120,847 | ) | |||||
| Juniper Networks, Inc.* | 5,405 | (121,991 | ) | |||||
| JDS Uniphase Corp.* | 9,444 | (122,583 | ) | |||||
| Cisco Systems, Inc. | 5,514 | (123,789 | ) | |||||
| F5 Networks, Inc.* | 1,373 | (124,750 | ) | |||||
| Oracle Corp. | 3,360 | (128,554 | ) | |||||
| Total Information Technology | (1,535,141 | ) | ||||||
| FINANCIALS - (5.0)% | ||||||||
| Vornado Realty Trust | 963 | (85,505 | ) | |||||
| Nationstar Mortgage Holdings, Inc.* | 2,606 | (96,318 | ) | |||||
| HCP, Inc. | 2,850 | (103,512 | ) | |||||
| Health Care REIT, Inc. | 1,939 | (103,872 | ) | |||||
| Realty Income Corp. | 2,831 | (105,681 | ) | |||||
| AvalonBay Communities, Inc. | 900 | (106,407 | ) | |||||
| Ventas, Inc. | 1,869 | (107,056 | ) | |||||
| General Growth Properties, Inc. | 5,477 | (109,923 | ) | |||||
| Equity Residential | 2,136 | (110,794 | ) | |||||
| Public Storage | 739 | (111,234 | ) | |||||
| Simon Property Group, Inc. | 734 | (111,686 | ) | |||||
| Prologis, Inc. | 3,079 | (113,769 | ) | |||||
| SL Green Realty Corp. | 1,241 | (114,644 | ) | |||||
| Wells Fargo & Co. | 2,553 | (115,906 | ) | |||||
| People’s United Financial, Inc. | 7,670 | (115,970 | ) | |||||
| American Tower Corp. — Class A | 1,457 | (116,298 | ) | |||||
| Weyerhaeuser Co. | 3,722 | (117,504 | ) | |||||
| Realogy Holdings Corp.* | 2,376 | (117,541 | ) | |||||
| Host Hotels & Resorts, Inc. | 6,181 | (120,159 | ) | |||||
| Ocwen Financial Corp.* | 2,539 | (140,788 | ) | |||||
| Total Financials | (2,224,567 | ) | ||||||
| Total Common Stock Sold Short | ||||||||
| (Proceeds $9,276,793) | (9,559,823 | ) | ||||||
| Total Securities Sold Short - (21.0)% | ||||||||
| (Proceeds $9,276,793) | $ | (9,559,823 | ) | |||||
| Other Assets & Liabilities, net - 17.2% | 7,807,155 | |||||||
| Total Net Assets - 100.0% | $ | 45,295,248 | ||||||
| * | Non-income producing security. |
| † | Value determined based on Level 1 inputs — See Note 4. |
| †† | Value determined based on Level 2 inputs — See Note 4. |
| 1 | All or a portion of this security is pledged as short security collateral at December 31, 2013. |
| 2 | Repurchase Agreement — See Note 5. |
plc— Public Limited Company
| 12 | THE GUGGENHEIM FUNDS ANNUAL REPORT | SEE NOTES TO FINANCIAL STATEMENTS. |
| LONG SHORT EQUITY FUND |
| STATEMENT OF ASSETS |
| AND LIABILITIES |
| December 31, 2013 |
| Assets: | ||||
| Investments, at value | ||||
| (cost $26,489,250) | $ | 30,465,618 | ||
| Repurchase agreements, at value | ||||
| (cost $16,582,298) | 16,582,298 | |||
| Total investments | ||||
| (cost $43,071,548) | 47,047,916 | |||
| Segregated cash with broker | 7,935,672 | |||
| Receivables: | ||||
| Dividends | 25,202 | |||
| Fund shares sold | 6,607 | |||
| Interest | 12 | |||
| Total assets | 55,015,409 | |||
| Liabilities: | ||||
| Securities sold short, at value | ||||
| (proceeds $9,276,793) | 9,559,823 | |||
| Payable for: | ||||
| Management fees | 33,151 | |||
| Fund shares redeemed | 29,246 | |||
| Investor service fees | 9,209 | |||
| Portfolio accounting fees | 3,684 | |||
| Transfer agent and administrative fees | 3,684 | |||
| Miscellaneous | 81,364 | |||
| Total liabilities | 9,720,161 | |||
| Net assets | $ | 45,295,248 | ||
| Net assets consist of: | ||||
| Paid in capital | $ | 54,749,475 | ||
| Accumulated net investment loss | (392 | ) | ||
| Accumulated net realized loss on investments | (13,147,173 | ) | ||
| Net unrealized appreciation on investments | 3,693,338 | |||
| Net assets | $ | 45,295,248 | ||
| Capital shares outstanding | 3,088,167 | |||
| Net asset value per share | $ | 14.67 |
| STATEMENT OF |
| OPERATIONS |
| Year Ended December 31, 2013 |
| Investment Income: | ||||
| Dividends (net of foreign withholding tax of $1,092) | $ | 523,244 | ||
| Interest | 3,288 | |||
| Income from securities lending, net | 2,635 | |||
| Total investment income | 529,167 | |||
| Expenses: | ||||
| Management fees | 387,836 | |||
| Transfer agent and administrative fees | 78,574 | |||
| Investor service fees | 107,732 | |||
| Portfolio accounting fees | 43,093 | |||
| Short sales dividend expense | 217,439 | |||
| Prime broker interest expense | 64,253 | |||
| Custodian fees | 4,899 | |||
| Trustees’ fees* | 4,319 | |||
| Miscellaneous | 72,653 | |||
| Total expenses | 980,798 | |||
| Net investment loss | (451,631 | ) | ||
| Net Realized and Unrealized Gain (Loss): | ||||
| Net realized gain (loss) on: | ||||
| Investments | 6,892,955 | |||
| Futures contracts | (925 | ) | ||
| Securities sold short | (2,058,846 | ) | ||
| Net realized gain | 4,833,184 | |||
| Net change in unrealized appreciation (depreciation) on: | ||||
| Investments | 2,853,020 | |||
| Securities sold short | (247,733 | ) | ||
| Net change in unrealized appreciation (depreciation) | 2,605,287 | |||
| Net realized and unrealized gain | 7,438,471 | |||
| Net increase in net assets resulting from operations | $ | 6,986,840 |
| * | Relates to Trustees not deemed “interested persons” within the meaning of Section 2(a)(19) of the 1940 Act. |
| SEE NOTES TO FINANCIAL STATEMENTS. | THE GUGGENHEIM FUNDS ANNUAL REPORT | 13 |
| LONG SHORT EQUITY FUND |
| STATEMENTS OF CHANGES IN NET ASSETS |
| Year Ended | Year Ended | |||||||
| December 31, | December 31, | |||||||
| 2013 | 2012 | |||||||
| Increase (Decrease) In Net Assets From Operations: | ||||||||
| Net investment income (loss) | $ | (451,631 | ) | $ | 432 | |||
| Net realized gain on investments | 4,833,184 | 2,131,725 | ||||||
| Net change in unrealized appreciation (depreciation) on investments | 2,605,287 | (319,588 | ) | |||||
| Net increase in net assets resulting from operations | 6,986,840 | 1,812,569 | ||||||
| Distributions to shareholders from: | ||||||||
| Net investment income | (1,298 | ) | — | |||||
| Total distributions to shareholders | (1,298 | ) | — | |||||
| Capital share transactions: | ||||||||
| Proceeds from sale of shares | 19,761,648 | 11,318,780 | ||||||
| Distributions reinvested | 1,298 | — | ||||||
| Cost of shares redeemed | (20,109,182 | ) | (14,512,612 | ) | ||||
| Net decrease from capital share transactions | (346,236 | ) | (3,193,832 | ) | ||||
| Net increase (decrease) in net assets | 6,639,306 | (1,381,263 | ) | |||||
| Net assets: | ||||||||
| Beginning of year | 38,655,942 | 40,037,205 | ||||||
| End of year | $ | 45,295,248 | $ | 38,655,942 | ||||
| (Accumulated)/Undistributed net investment (loss)/income at end of year | $ | (392 | ) | $ | 6,752 | |||
| Capital share activity: | ||||||||
| Shares sold | 1,474,084 | 913,674 | ||||||
| Shares issued from reinvestment of distributions | 92 | — | ||||||
| Shares redeemed | (1,480,360 | ) | (1,166,202 | ) | ||||
| Net decrease in shares | (6,184 | ) | (252,528 | ) | ||||
| 14 | THE GUGGENHEIM FUNDS ANNUAL REPORT | SEE NOTES TO FINANCIAL STATEMENTS. |
| LONG SHORT EQUITY FUND |
| FINANCIAL HIGHLIGHTS |
This table is presented to show selected data for a share outstanding throughout each period and to assist shareholders in evaluating a Fund’s performance for the periods presented.
| Year Ended | Year Ended | Year Ended | Year Ended | Year Ended | ||||||||||||||||
| December 31, | December 31, | December 31, | December 31, | December 31, | ||||||||||||||||
| 2013 | 2012 | 2011 | 2010 | 2009 | ||||||||||||||||
| Per Share Data | ||||||||||||||||||||
| Net asset value, beginning of period | $ | 12.49 | $ | 11.96 | $ | 12.80 | $ | 11.51 | $ | 9.05 | ||||||||||
| Income (loss) from investment operations: | ||||||||||||||||||||
| Net investment income (loss)a | (.14 | ) | — | b | (.03 | ) | (.05 | ) | (.03 | ) | ||||||||||
| Net gain (loss) on investments (realized and unrealized) | 2.32 | .53 | (.81 | ) | 1.34 | 2.50 | ||||||||||||||
| Total from investment operations | 2.18 | .53 | (.84 | ) | 1.29 | 2.47 | ||||||||||||||
| Less distributions from: | ||||||||||||||||||||
| Net investment income | (— | )c | — | — | — | (.01 | ) | |||||||||||||
| Total distributions | (— | ) | — | — | — | (.01 | ) | |||||||||||||
| Net asset value, end of period | $ | 14.67 | $ | 12.49 | $ | 11.96 | $ | 12.80 | $ | 11.51 | ||||||||||
| Total Returnd | 17.46 | % | 4.43 | % | (6.56 | %) | 11.21 | % | 27.29 | % | ||||||||||
| Ratios/Supplemental Data | ||||||||||||||||||||
| Net assets, end of period (in thousands) | $ | 45,295 | $ | 38,656 | $ | 40,037 | $ | 56,043 | $ | 68,347 | ||||||||||
| Ratios to average net assets: | ||||||||||||||||||||
| Net investment income (loss) | (1.05 | %) | 0.00 | %e | (0.26 | %) | (0.47 | %) | (0.33 | %) | ||||||||||
| Total expensesf | 2.28 | % | 1.86 | % | 1.76 | % | 1.72 | % | 1.71 | % | ||||||||||
| Portfolio turnover rate | 292 | % | 203 | % | 167 | % | 314 | % | 379 | % | ||||||||||
| a | Net investment income (loss) per share was computed using average shares outstanding throughout the period. |
| b | Net investment income is less than $0.01 per share. |
| c | Distributions from net investment income are less than $0.01 per share. |
| d | Total return does not reflect the impact of any additional fees charged by insurance companies. |
| e | Less than 0.01%. |
| f | Total expenses may include interest and dividend expense. Excluding interest and dividend expense related to short sales, operating expense ratios for the years ended December 31 would be: |
| 2013 | 2012 | 2011 | 2010 | 2009 | ||||||||||||||
| 1.62% | 1.73% | 1.76% | 1.71% | 1.71% | ||||||||||||||
| SEE NOTES TO FINANCIAL STATEMENTS. | THE GUGGENHEIM FUNDS ANNUAL REPORT | 15 |
| PERFORMANCE REPORT AND FUND PROFILE (Unaudited) | December 31, 2013 |
GLOBAL MANAGED FUTURES STRATEGY FUND
OBJECTIVE: Seeks to generate positive total returns over time.
For the one-year period ended December 31, 2013, the Fund returned 2.59%. The Bank of America Merrill Lynch 3-Month U.S. Treasury Bill Index returned 0.07%.
The year 2013 was the first full year of the Fund’s implementation of multiple proprietary strategies in seeking to better achieve its objective of positive absolute returns. The Fund combines multiple quantitative strategies that seek to profit from trends in the global, commodity, currency, equity and fixed income markets. In addition to the broader investment universe, the Fund is expected to benefit from the use of more sophisticated quantitative models and active fixed income management.
Much of 2013 was a difficult year for managed futures funds generally, but in the fourth quarter, trend-followers saw improved results in multiple components. While natural gas shot up sharply with cold weather in December after being down year to date, trend-followers benefited from precious metals, softs, and the yen continuing to see prices decline, and equities continuing their bullish trends.
For the year, the systematic strategies were positive, and cash management also contributed positively to the Fund’s return. Equities and currencies were among the largest contributors to performance, particularly in the fourth quarter, with the greatest gains in short positions on the yen and long positions for the euro and multiple equity markets. Commodities and fixed income trades were mixed with generally small gains and losses offsetting each other.
At the end of the year, the Fund was net short in commodities, with the largest long positions in the energy sector and the largest short positions in sugar, wheat and corn. In currencies, the Fund continues to be long the European currencies and short Canadian and Australian dollars as well as the yen. The Fund was long equities and European fixed income, and short U.S., UK, Japanese and Australian bonds.
Derivatives in the Fund are used to help provide desired exposure in the most efficient manner, as well as to provide liquidity.
Performance displayed represents past performance which is no guarantee of future results.
Holdings Diversification (Market Exposure as % of Net Assets)
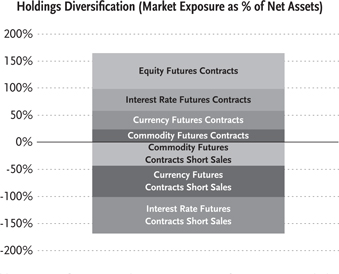
“Holdings Diversification (Market Exposure as % of Net Assets)” excludes any temporary cash investments.
Inception Date: November 7, 2008
The Fund invests principally in derivative investments such as futures contracts.
| 16 | THE GUGGENHEIM FUNDS ANNUAL REPORT |
| PERFORMANCE REPORT AND FUND PROFILE (Unaudited) (concluded) |
Cumulative Fund Performance*,†
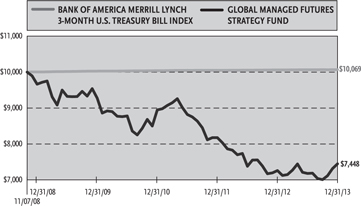
Average Annual Returns
Periods Ended December 31, 2013*,†
| Since | ||||||||||||
| Inception | ||||||||||||
| 1 Year | 5 Year | (11/07/08) | ||||||||||
| Global Managed Futures Strategy Fund | 2.59 | % | -5.08 | % | -5.56 | % | ||||||
| Bank of America Merrill Lynch 3-Month U.S. Treasury Bill Index | 0.07 | % | 0.12 | % | 0.13 | % | ||||||
| * | The performance data above represents past performance that is not predictive of future results. The investment return and principal value of an investment in the Fund will fluctuate so that an investor’s shares, when redeemed, may be worth more or less than their original cost. Returns are historical and include changes in principal and reinvested dividends and capital gains and do not reflect the effect of taxes. The Bank of America Merrill Lynch-3-Month U.S. Treasury Bill Index is an unmanaged index and, unlike the Fund, has no management fees or operating expenses to reduce its reported return. |
| † | Returns do not reflect the impact of any additional fees charged by insurance companies. |
| THE GUGGENHEIM FUNDS ANNUAL REPORT | 17 |
| CONSOLIDATED SCHEDULE OF INVESTMENTS | December 31, 2013 |
| GLOBAL MANAGED FUTURES STRATEGY FUND |
| Face | ||||||||
| Amount | Value | |||||||
| FEDERAL AGENCY DISCOUNT NOTES†† - 32.5% | ||||||||
| Fannie Mae1 | ||||||||
| 0.08% due 01/02/14 | $ | 1,000,000 | $ | 1,000,000 | ||||
| Federal Farm Credit Bank2 | ||||||||
| 0.03% due 01/15/14 | 1,000,000 | 999,989 | ||||||
| Federal Home Loan Bank2 | ||||||||
| 0.05% due 01/13/14 | 1,000,000 | 999,983 | ||||||
| Total Federal Agency Discount Notes | ||||||||
| (Cost $2,999,970) | 2,999,972 | |||||||
| REPURCHASE AGREEMENTS††,3 - 57.2% | ||||||||
| Deutsche Bank | ||||||||
| issued 12/31/13 at 0.01% | ||||||||
| due 01/02/14 | 1,321,916 | 1,321,916 | ||||||
| HSBC Group | ||||||||
| issued 12/31/13 at 0.01% | ||||||||
| due 01/02/14 | 1,321,916 | 1,321,916 | ||||||
| Credit Suisse Group | ||||||||
| issued 12/31/13 at 0.00% | ||||||||
| due 01/02/14 | 1,321,916 | 1,321,916 | ||||||
| Mizuho Financial Group, Inc. | ||||||||
| issued 12/31/13 at 0.01% | ||||||||
| due 01/02/14 | 1,315,937 | 1,315,937 | ||||||
| Total Repurchase Agreements | ||||||||
| (Cost $5,281,685) | 5,281,685 | |||||||
| Total Investments - 89.7% | ||||||||
| (Cost $8,281,655) | $ | 8,281,657 | ||||||
| Other Assets & Liabilities, net - 10.3% | 949,129 | |||||||
| Total Net Assets - 100.0% | $ | 9,230,786 | ||||||
| Unrealized | ||||||||
| Contracts | Gain (Loss) | |||||||
| EQUITY FUTURES CONTRACTS PURCHASED† | ||||||||
| March 2014 Topix Index | ||||||||
| Futures Contracts†† | ||||||||
| (Aggregate Value of | ||||||||
| Contracts $499,929) | 4 | $ | 25,275 | |||||
| January 2014 MSCI Taiwan Stock Index | ||||||||
| Futures Contracts†† | ||||||||
| (Aggregate Value of | ||||||||
| Contracts $733,152) | 24 | 24,349 | ||||||
| March 2014 Nikkei 225 (OSE) Index | ||||||||
| Futures Contracts†† | ||||||||
| (Aggregate Value of | ||||||||
| Contracts $463,559) | 3 | 23,131 | ||||||
| March 2014 Dow Jones Industrial Average Index | ||||||||
| Mini Futures Contracts | ||||||||
| (Aggregate Value of | ||||||||
| Contracts $495,750) | 6 | 18,111 | ||||||
| March 2014 Russell 2000 Index | ||||||||
| Mini Futures Contracts | ||||||||
| (Aggregate Value of | ||||||||
| Contracts $464,240) | 4 | 17,373 | ||||||
| March 2014 DAX Index | ||||||||
| Futures Contracts†† | ||||||||
| (Aggregate Value of | ||||||||
| Contracts $332,167) | 1 | 15,893 | ||||||
| January 2014 Amsterdam Index | ||||||||
| Futures Contracts†† | ||||||||
| (Aggregate Value of | ||||||||
| Contracts $333,197) | 3 | 13,161 | ||||||
| March 2014 SPI 200 Index | ||||||||
| Futures Contracts†† | ||||||||
| (Aggregate Value of | ||||||||
| Contracts $357,643) | 3 | 11,902 | ||||||
| March 2014 NASDAQ-100 Index | ||||||||
| Mini Futures Contracts | ||||||||
| (Aggregate Value of | ||||||||
| Contracts $574,240) | 8 | 11,881 | ||||||
| January 2014 IBEX 35 Index | ||||||||
| Futures Contracts†† | ||||||||
| (Aggregate Value of | ||||||||
| Contracts $269,641) | 2 | 11,479 | ||||||
| March 2014 S&P MidCap 400 Index | ||||||||
| Mini Futures Contracts | ||||||||
| (Aggregate Value of | ||||||||
| Contracts $402,270) | 3 | 10,794 | ||||||
| March 2014 FTSE 100 Index | ||||||||
| Futures Contracts†† | ||||||||
| (Aggregate Value of | ||||||||
| Contracts $333,883) | 3 | 9,619 | ||||||
| March 2014 S&P 500 Index | ||||||||
| Mini Futures Contracts | ||||||||
| (Aggregate Value of | ||||||||
| Contracts $461,063) | 5 | 9,523 | ||||||
| January 2014 CAC40 10 Euro Index | ||||||||
| Futures Contracts†† | ||||||||
| (Aggregate Value of | ||||||||
| Contracts $237,259) | 4 | 8,591 | ||||||
| January 2014 Hang Seng Index | ||||||||
| Futures Contracts†† | ||||||||
| (Aggregate Value of | ||||||||
| Contracts $151,264) | 1 | 3,612 | ||||||
| (Total Aggregate Value of | ||||||||
| Contracts $6,109,257) | $ | 214,694 | ||||||
| CURRENCY FUTURES CONTRACTS PURCHASED† | ||||||||
| March 2014 British Pound | ||||||||
| Futures Contracts | ||||||||
| (Aggregate Value of | ||||||||
| Contracts $1,137,950) | 11 | $ | 9,340 | |||||
| March 2014 Euro FX | ||||||||
| Futures Contracts | ||||||||
| (Aggregate Value of | ||||||||
| Contracts $1,031,850) | 6 | (353 | ) | |||||
| 18 | THE GUGGENHEIM FUNDS ANNUAL REPORT | SEE NOTES TO FINANCIAL STATEMENTS. |
| CONSOLIDATED SCHEDULE OF INVESTMENTS (continued) | December 31, 2013 |
| GLOBAL MANAGED FUTURES STRATEGY FUND |
| Unrealized | ||||||||
| Contracts | Gain (Loss) | |||||||
| March 2014 Swiss Franc | ||||||||
| Futures Contracts | ||||||||
| (Aggregate Value of | ||||||||
| Contracts $981,488) | 7 | $ | (5,695 | ) | ||||
| (Total Aggregate Value of | ||||||||
| Contracts $3,151,288) | $ | 3,292 | ||||||
| COMMODITY FUTURES CONTRACTS PURCHASED† | ||||||||
| February 2014 Gas Oil | ||||||||
| Futures Contracts | ||||||||
| (Aggregate Value of | ||||||||
| Contracts $188,900) | 2 | $ | 3,858 | |||||
| February 2014 WTI Crude | ||||||||
| Futures Contracts | ||||||||
| (Aggregate Value of | ||||||||
| Contracts $295,920) | 3 | 3,085 | ||||||
| March 2014 Brent Crude | ||||||||
| Futures Contracts | ||||||||
| (Aggregate Value of | ||||||||
| Contracts $221,260) | 2 | 2,750 | ||||||
| February 2014 Live Cattle | ||||||||
| Futures Contracts | ||||||||
| (Aggregate Value of | ||||||||
| Contracts $107,760) | 2 | 1,332 | ||||||
| March 2014 Copper | ||||||||
| Futures Contracts | ||||||||
| (Aggregate Value of | ||||||||
| Contracts $169,700) | 2 | 324 | ||||||
| February 2014 Lean Hogs | ||||||||
| Futures Contracts | ||||||||
| (Aggregate Value of | ||||||||
| Contracts $34,260) | 1 | 103 | ||||||
| February 2014 LME Lead | ||||||||
| Futures Contracts | ||||||||
| (Aggregate Value of | ||||||||
| Contracts $221,050) | 4 | (1,742 | ) | |||||
| February 2014 LME Zinc | ||||||||
| Futures Contracts | ||||||||
| (Aggregate Value of | ||||||||
| Contracts $205,250) | 4 | (3,314 | ) | |||||
| February 2014 Natural Gas | ||||||||
| Futures Contracts | ||||||||
| (Aggregate Value of | ||||||||
| Contracts $255,000) | 6 | (9,664 | ) | |||||
| March 2014 Soybean | ||||||||
| Futures Contracts | ||||||||
| (Aggregate Value of | ||||||||
| Contracts $451,413) | 7 | (11,493 | ) | |||||
| (Total Aggregate Value of | ||||||||
| Contracts $2,150,513) | $ | (14,761 | ) | |||||
| INTEREST RATE FUTURES CONTRACTS PURCHASED†† | ||||||||
| March 2014 Japanese Government 10 Year Bond | ||||||||
| Futures Contracts | ||||||||
| (Aggregate Value of | ||||||||
| Contracts $2,717,508) | 2 | $ | (11,213 | ) | ||||
| March 2014 Euro - Bobl | ||||||||
| Futures Contracts | ||||||||
| (Aggregate Value of | ||||||||
| Contracts $1,024,173) | 6 | (11,510 | ) | |||||
| (Total Aggregate Value of | ||||||||
| Contracts $3,741,681) | $ | (22,723 | ) | |||||
| COMMODITY FUTURES CONTRACTS SOLD SHORT† | ||||||||
| March 2014 Sugar #11 | ||||||||
| Futures Contracts | ||||||||
| (Aggregate Value of | ||||||||
| Contracts $940,766) | 51 | $ | 41,655 | |||||
| March 2014 Winter Wheat | ||||||||
| Futures Contracts | ||||||||
| (Aggregate Value of | ||||||||
| Contracts $512,600) | 16 | 34,403 | ||||||
| March 2014 Wheat | ||||||||
| Futures Contracts | ||||||||
| (Aggregate Value of | ||||||||
| Contracts $453,938) | 15 | 29,958 | ||||||
| February 2014 Gold 100 oz. | ||||||||
| Futures Contracts | ||||||||
| (Aggregate Value of | ||||||||
| Contracts $361,140) | 3 | 20,311 | ||||||
| March 2014 Corn | ||||||||
| Futures Contracts | ||||||||
| (Aggregate Value of | ||||||||
| Contracts $463,650) | 22 | 19,908 | ||||||
| March 2014 Silver | ||||||||
| Futures Contracts | ||||||||
| (Aggregate Value of | ||||||||
| Contracts $194,400) | 2 | 10,573 | ||||||
| February 2014 LME Primary Aluminum | ||||||||
| Futures Contracts | ||||||||
| (Aggregate Value of | ||||||||
| Contracts $311,544) | 7 | 4,587 | ||||||
| February 2014 LME Nickel | ||||||||
| Futures Contracts | ||||||||
| (Aggregate Value of | ||||||||
| Contracts $166,404) | 2 | 1,769 | ||||||
| March 2014 Cotton #2 | ||||||||
| Futures Contracts | ||||||||
| (Aggregate Value of | ||||||||
| Contracts $169,420) | 4 | (12,358 | ) | |||||
| March 2014 Coffee ‘C’ | ||||||||
| Futures Contracts | ||||||||
| (Aggregate Value of | ||||||||
| Contracts $456,225) | 11 | (17,543 | ) | |||||
| (Total Aggregate Value of | ||||||||
| Contracts $4,030,087) | $ | 133,263 | ||||||
| CURRENCY FUTURES CONTRACTS SOLD SHORT† | ||||||||
| March 2014 Japanese Yen | ||||||||
| Futures Contracts | ||||||||
| (Aggregate Value of | ||||||||
| Contracts $2,969,376) | 25 | $ | 59,191 | |||||
| SEE NOTES TO FINANCIAL STATEMENTS. | THE GUGGENHEIM FUNDS ANNUAL REPORT | 19 |
| CONSOLIDATED SCHEDULE OF INVESTMENTS (concluded) | December 31, 2013 |
| GLOBAL MANAGED FUTURES STRATEGY FUND |
| Unrealized | ||||||||
| Contracts | Gain (Loss) | |||||||
| March 2014 Australian Dollar | ||||||||
| Futures Contracts | ||||||||
| (Aggregate Value of | ||||||||
| Contracts $1,066,080) | 12 | $ | 21,623 | |||||
| March 2014 Canadian Dollar | ||||||||
| Futures Contracts | ||||||||
| (Aggregate Value of | ||||||||
| Contracts $1,315,440) | 14 | 665 | ||||||
| (Total Aggregate Value of | ||||||||
| Contracts $5,350,896) | $ | 81,479 | ||||||
| INTEREST RATE FUTURES CONTRACTS SOLD SHORT† | ||||||||
| March 2014 Long Gilt | ||||||||
| Futures Contracts†† | ||||||||
| (Aggregate Value of | ||||||||
| Contracts $528,409) | 3 | $ | 6,602 | |||||
| March 2014 U.S. Treasury Long Bond | ||||||||
| Futures Contracts | ||||||||
| (Aggregate Value of | ||||||||
| Contracts $512,125) | 4 | 5,457 | ||||||
| March 2014 Canadian Government 10 Year Bond | ||||||||
| Futures Contracts†† | ||||||||
| (Aggregate Value of | ||||||||
| Contracts $476,762) | 4 | 4,846 | ||||||
| March 2014 U.S. Treasury 5 Year Note | ||||||||
| Futures Contracts | ||||||||
| (Aggregate Value of | ||||||||
| Contracts $715,547) | 6 | 3,116 | ||||||
| March 2014 U.S. Treasury 10 Year Note | ||||||||
| Futures Contracts | ||||||||
| (Aggregate Value of | ||||||||
| Contracts $491,500) | 4 | 2,840 | ||||||
| March 2014 Euro - Bund | ||||||||
| Futures Contracts†† | ||||||||
| (Aggregate Value of | ||||||||
| Contracts $191,002) | 1 | 1,920 | ||||||
| March 2014 U.S. Treasury Ultra Long Bond | ||||||||
| Futures Contracts | ||||||||
| (Aggregate Value of | ||||||||
| Contracts $272,688) | 2 | 1,690 | ||||||
| March 2014 Australian Government 3 Year Bond | ||||||||
| Futures Contracts†† | ||||||||
| (Aggregate Value of | ||||||||
| Contracts $1,081,300) | 10 | 1,688 | ||||||
| March 2014 Australian Government 10 Year Bond | ||||||||
| Futures Contracts†† | ||||||||
| (Aggregate Value of | ||||||||
| Contracts $1,140,500) | 10 | (2,425 | ) | |||||
| March 2014 Euro - Schatz | ||||||||
| Futures Contracts†† | ||||||||
| (Aggregate Value of | ||||||||
| Contracts $1,067,167) | 7 | (5,190 | ) | |||||
| (Total Aggregate Value of | ||||||||
| Contracts $6,477,000) | $ | 20,544 | ||||||
| † | Value determined based on Level 1 inputs, unless otherwise noted — See Note 4. |
| †† | Value determined based on Level 2 inputs — See Note 4. |
| 1 | On September 7, 2008, the issuer was placed in conservatorship by the Federal Housing Finance Agency (FHFA). As conservator, the FHFA has full powers to control the assets and operations of the firm. |
| 2 | The issuer operates under a Congressional charter; its securities are neither issued nor guaranteed by the U.S. Government. |
| 3 | Repurchase Agreements — See Note 5. |
| 20 | THE GUGGENHEIM FUNDS ANNUAL REPORT | SEE NOTES TO FINANCIAL STATEMENTS. |
| GLOBAL MANAGED FUTURES STRATEGY FUND |
| CONSOLIDATED STATEMENT OF |
| ASSETS AND LIABILITIES |
December 31, 2013
| Assets: | ||||
| Investments, at value | ||||
| (cost $2,999,970) | $ | 2,999,972 | ||
| Repurchase agreements, at value | ||||
| (cost $5,281,685) | 5,281,685 | |||
| Total investments | ||||
| (cost $8,281,655) | 8,281,657 | |||
| Segregated cash with broker | 945,691 | |||
| Receivables: | ||||
| Fund shares sold | 49,862 | |||
| Variation margin | 9,572 | |||
| Total assets | 9,286,782 | |||
| Liabilities: | ||||
| Due to broker | 32,714 | |||
| Payable for: | ||||
| Management fees | 6,411 | |||
| Investor service fees | 1,781 | |||
| Fund shares redeemed | 1,023 | |||
| Transfer agent and administrative fees | 712 | |||
| Portfolio accounting fees | 712 | |||
| Miscellaneous | 12,643 | |||
| Total liabilities | 55,996 | |||
| Net assets | $ | 9,230,786 | ||
| Net assets consist of: | ||||
| Paid in capital | $ | 9,433,252 | ||
| Undistributed net investment income | — | |||
| Accumulated net realized loss on investments | (618,289 | ) | ||
| Net unrealized appreciation on investments | 415,823 | |||
| Net assets | $ | 9,230,786 | ||
| Capital shares outstanding | 496,205 | |||
| Net asset value per share | $ | 18.60 |
| CONSOLIDATED STATEMENT OF |
| OPERATIONS |
Year Ended December 31, 2013
| Investment Income: | ||||
| Interest | $ | 3,727 | ||
| Total investment income | 3,727 | |||
| Expenses: | ||||
| Management fees | 88,510 | |||
| Transfer agent and administrative fees | 16,442 | |||
| Investor service fees | 21,666 | |||
| Portfolio accounting fees | 8,666 | |||
| Trustees’ fees* | 1,120 | |||
| Custodian fees | 1,060 | |||
| Miscellaneous | 15,116 | |||
| Total expenses | 152,580 | |||
| Less: | ||||
| Expenses waived by Advisor | (10,419 | ) | ||
| Net expenses | 142,161 | |||
| Net investment loss | (138,434 | ) | ||
| Net Realized and Unrealized Gain (Loss): | ||||
| Net realized gain (loss) on: | ||||
| Investments | 95 | |||
| Futures contracts | (8,543 | ) | ||
| Foreign currency | 1,596 | |||
| Net realized loss | (6,852 | ) | ||
| Net change in unrealized appreciation (depreciation) on: | ||||
| Investments | (15 | ) | ||
| Futures contracts | 351,678 | |||
| Foreign currency | 85 | |||
| Net change in unrealized appreciation (depreciation) | 351,748 | |||
| Net realized and unrealized gain | 344,896 | |||
| Net increase in net assets resulting from operations | $ | 206,462 |
| * | Relates to Trustees not deemed “interested persons” within the meaning of Section 2(a)(19) of the 1940 Act. |
| SEE NOTES TO FINANCIAL STATEMENTS. | THE GUGGENHEIM FUNDS ANNUAL REPORT | 21 |
| GLOBAL MANAGED FUTURES STRATEGY FUND |
| CONSOLIDATED STATEMENTS OF CHANGES IN NET ASSETS |
| Year Ended | Year Ended | |||||||
| December 31, | December 31, | |||||||
| 2013 | 2012 | |||||||
| Increase (Decrease) In Net Assets From Operations: | ||||||||
| Net investment loss | $ | (138,434 | ) | $ | (230,263 | ) | ||
| Net realized loss on investments and foreign currency | (6,852 | ) | (1,257,412 | ) | ||||
| Net change in unrealized appreciation (depreciation) on investments and foreign currency | 351,748 | (44,367 | ) | |||||
| Net increase (decrease) in net assets resulting from operations | 206,462 | (1,532,042 | ) | |||||
| Capital share transactions: | ||||||||
| Proceeds from sale of shares | 3,214,155 | 5,183,917 | ||||||
| Cost of shares redeemed | (3,508,898 | ) | (8,863,140 | ) | ||||
| Net decrease from capital share transactions | (294,743 | ) | (3,679,223 | ) | ||||
| Net decrease in net assets | (88,281 | ) | (5,211,265 | ) | ||||
| Net assets: | ||||||||
| Beginning of year | 9,319,067 | 14,530,332 | ||||||
| End of year | $ | 9,230,786 | $ | 9,319,067 | ||||
| Undistributed net investment income at end of year | $ | — | $ | — | ||||
| Capital share activity: | ||||||||
| Shares sold | 178,063 | 271,589 | ||||||
| Shares redeemed | (195,169 | ) | (469,012 | ) | ||||
| Net decrease in shares | (17,106 | ) | (197,423 | ) | ||||
| 22 | THE GUGGENHEIM FUNDS ANNUAL REPORT | SEE NOTES TO FINANCIAL STATEMENTS. |
| GLOBAL MANAGED FUTURES STRATEGY FUND |
| CONSOLIDATED FINANCIAL HIGHLIGHTS |
This table is presented to show selected data for a share outstanding throughout each period and to assist shareholders in evaluating a Fund’s performance for the periods presented.
| Year Ended | Year Ended | Year Ended | Year Ended | Year Ended | ||||||||||||||||
| December 31, | December 31, | December 31, | December 31, | December 31, | ||||||||||||||||
| 2013d | 2012d | 2011d | 2010d | 2009d | ||||||||||||||||
| Per Share Data | ||||||||||||||||||||
| Net asset value, beginning of period | $ | 18.15 | $ | 20.44 | $ | 22.37 | $ | 23.19 | $ | 24.10 | ||||||||||
| Income (loss) from investment operations: | ||||||||||||||||||||
| Net investment lossa | (.29 | ) | (.36 | ) | (.46 | ) | (.43 | ) | (.49 | ) | ||||||||||
| Net gain (loss) on investments (realized and unrealized) | .74 | (1.93 | ) | (1.47 | ) | (.39 | ) | (.42 | ) | |||||||||||
| Total from investment operations | .45 | (2.29 | ) | (1.93 | ) | (.82 | ) | (.91 | ) | |||||||||||
| Net asset value, end of period | $ | 18.60 | $ | 18.15 | $ | 20.44 | $ | 22.37 | $ | 23.19 | ||||||||||
| Total Returnb | 2.59 | % | (11.20 | %) | (8.63 | %) | (3.54 | %) | (3.78 | %) | ||||||||||
| Ratios/Supplemental Data | ||||||||||||||||||||
| Net assets, end of period (in thousands) | $ | 9,231 | $ | 9,319 | $ | 14,530 | $ | 15,633 | $ | 28,633 | ||||||||||
| Ratios to average net assets: | ||||||||||||||||||||
| Net investment loss | (1.60 | %) | (1.89 | %) | (2.10 | %) | (1.96 | %) | (2.08 | %) | ||||||||||
| Total expenses | 1.76 | % | 2.05 | % | 2.26 | % | 2.19 | % | 2.32 | % | ||||||||||
| Net expensesc | 1.64 | % | 2.00 | % | 2.15 | % | 2.09 | % | 2.20 | % | ||||||||||
| Portfolio turnover rate | — | — | — | — | — | |||||||||||||||
| a | Net investment loss per share was computed using average shares outstanding throughout the period. |
| b | Total return does not reflect the impact of any additional fees charged by insurance companies. |
| c | Net expense information reflects the expense ratios after expense waivers. |
| d | Consolidated. |
| SEE NOTES TO FINANCIAL STATEMENTS. | THE GUGGENHEIM FUNDS ANNUAL REPORT | 23 |
| PERFORMANCE REPORT AND FUND PROFILE (Unaudited) | December 31, 2013 |
MULTI-HEDGE STRATEGIES FUND
OBJECTIVE: Seeks long-term capital appreciation with less risk than traditional equity funds.
2013 was the fourth full fiscal year of performance since the Fund’s objective was changed from hedge fund replication to capital appreciation. The risk-adjusted results for fiscal year 2013 were good for a fourth year, as the Fund generated a 1.65% return with only 2.7% annualized risk, for a Sharpe ratio* approximating 0.6. In addition to generating a good Sharpe ratio, the Fund generated a correlation** of 14% to the S&P 500 Index and -6% to the Barclays U.S. Aggregate Bond Index over the course of the year.
While a strong year for equities, the S&P 500 Index did have two negative-return calendar months. The Fund generated positive returns in one of these two months, illustrating its diversification benefits. Bonds did not fare as well in 2013, with the Barclays U.S. Aggregate Bond Index producing a negative annual total return. The Fund demonstrated its diversification benefit relative to bonds by generating positive returns during five of the Barclays U.S. Aggregate Bond Index’s six negative monthly returns.
While no longer a replication product, the Fund still maintains the HFRX Global Hedge Fund Index as one of its benchmarks. This benchmark returned 6.72% for the year. In contrast to the diversification benefits provided by Multi-Hedge Strategies Fund, the HFRX Global Hedge Fund Index had a correlation of 76% to the S&P 500 Index . In spite of the equity return contribution to HFRX Global Hedge Fund performance, the Multi-Hedge Strategies Fund has outperformed this index by approximately 4% (1.1% annualized), net of fees, since the Fund changed its investment objective.
Two of the five hedge fund styles (long/short equity and merger arbitrage) employed by the Fund contributed positive returns to the Fund this year, while three of the styles (global macro, fixed income strategies and market neutral) detracted from Fund performance.
Long/short equity contributed the most to gross returns: 2.5%. All three long/short models contributed positively to the Fund’s return, with 2.15% contributed by the industry rotation model, 0.17% by the size model and 0.16% by the Global Managed Futures Equities model that was introduced into the Fund in November.
Merger arbitrage contributed 1.4% to Fund gross returns. The model’s 2.3% return and 0.9% annualized risk represented the model’s fourth consecutive year of producing a very attractive Sharpe ratio in excess of 1.5.
Equity market neutral detracted -0.24% from gross Fund returns. The closed-end fund arbitrage model eked out a small gain of 0.5% during the year, while the equity market neutral model lost -1.2%.
Global macro strategies cost the Fund -0.16% of gross returns. Here again, results were mixed across models. The managed futures trend model generated a positive 1.3% gain, while the managed futures relative value and volatility arbitrage models lost -1.2% and -3.2%, respectively. The Global Managed Futures currency model was added during the third quarter. It generated a 5.1% return during the year and contributed 0.3% to Fund returns. Like the Global Managed Futures Equities model, the introduction of this model represents an important method for enhancing Fund performance by utilizing the research and development work being done elsewhere in the firm.
Fixed income strategies detracted -0.3% from gross fund return. The flattener model received an allocation during the October rebalance after the yield curve steepened significantly. This position was unprofitable during the fourth quarter as long-term Treasury yields continued to rise.
Performance displayed represents past performance which is no guarantee of future results.
| * | Sharpe Ratio: a risk-adjusted measure calculated using standard deviation and excess return to determine reward per unit of risk. The higher the Sharpe ratio, the better the fund’s historical risk-adjusted performance. |
| ** | Correlation is a measurement between -1 and 1, which indicates the linear relationship between two variables. If there is no relationship between two variables, the correlation coefficient is 0. If there is a perfect relationship, the correlation is 1. And if there is a perfect inverse relationship, the correlation is -1. |
| 24 | THE GUGGENHEIM FUNDS ANNUAL REPORT |
| PERFORMANCE REPORT AND FUND PROFILE (Unaudited) (concluded) |
Holdings Diversification (Market Exposure as % of Net Assets)
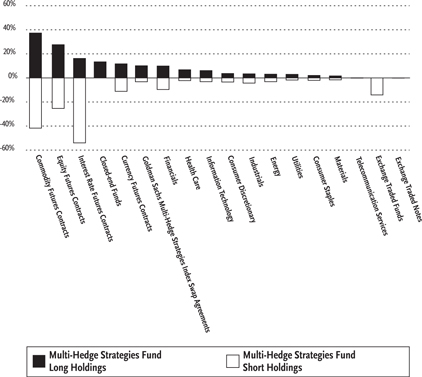
“Consolidated Holdings Diversification (Market Exposure as % of Net Assets)” excludes any temporary cash investments.
Inception Date: November 29, 2005
Ten Largest Long Holdings (% of Total Net Assets)
| Health Management Associates, Inc. — Class A | 1.6 | % | ||
| Sterling Financial Corp. | 1.4 | % | ||
| Hudson City Bancorp, Inc. | 1.3 | % | ||
| Life Technologies Corp. | 1.1 | % | ||
| UNS Energy Corp. | 1.0 | % | ||
| StellarOne Corp. | 0.9 | % | ||
| LSI Corp. | 0.8 | % | ||
| Hi-Tech Pharmacal Company, Inc. | 0.8 | % | ||
| Cooper Tire & Rubber Co. | 0.8 | % | ||
| BlackRock Enhanced Equity Dividend Trust | 0.7 | % | ||
| Top Ten Total | 10.6 | % |
“Ten Largest Long Holdings” exclude any temporary cash or derivative investments.
Cumulative Fund Performance*,†

Average Annual Returns
Periods Ended December 31, 2013*,†
| Since | ||||||||||||
| Inception | ||||||||||||
| 1 Year | 5 Year | (11/29/05) | ||||||||||
| Multi-Hedge Strategies Fund | 1.65 | % | 1.98 | % | 0.01 | % | ||||||
| HFRX Global Hedge Fund Index | 6.72 | % | 3.69 | % | 0.78 | % | ||||||
| S&P 500 Index | 32.39 | % | 17.94 | % | 7.14 | % | ||||||
| * | The performance data above represents past performance that is not predictive of future results. The investment return and principal value of an investment in the Fund will fluctuate so that an investor’s shares, when redeemed, may be worth more or less than their original cost. Returns are historical and include changes in principal and reinvested dividends and capital gains and do not reflect the effect of taxes. The HFRX Global Hedge Fund Index and the S&P 500 Index are unmanaged indices and, unlike the Fund, have no management fees or operating expenses to reduce theirs reported returns. |
| † | Returns do not reflect the impact of any additional fees charged by insurance companies. |
| THE GUGGENHEIM FUNDS ANNUAL REPORT | 25 |
| CONSOLIDATED SCHEDULE OF INVESTMENTS | December 31, 2013 |
| MULTI-HEDGE STRATEGIES FUND |
| Shares | Value | |||||||
| COMMON STOCKS† - 39.9% | ||||||||
| FINANCIALS - 9.9% | ||||||||
| Sterling Financial Corp.1 | 9,263 | $ | 315,683 | |||||
| Hudson City Bancorp, Inc.1 | 32,067 | 302,391 | ||||||
| StellarOne Corp.1 | 8,604 | 207,098 | ||||||
| KKR Financial Holdings LLC | 11,758 | 143,331 | ||||||
| Virginia Commerce Bancorp, Inc.*,1 | 7,531 | 127,952 | ||||||
| Host Hotels & Resorts, Inc.1 | 2,774 | 53,927 | ||||||
| Old Republic International Corp.1 | 2,994 | 51,706 | ||||||
| Regions Financial Corp.1 | 5,151 | 50,943 | ||||||
| Aspen Insurance Holdings Ltd.1 | 1,233 | 50,935 | ||||||
| XL Group plc — Class A1 | 1,591 | 50,657 | ||||||
| Everest Re Group Ltd.1 | 321 | 50,034 | ||||||
| Synovus Financial Corp.1 | 13,731 | 49,432 | ||||||
| Axis Capital Holdings Ltd.1 | 1,032 | 49,092 | ||||||
| First Niagara Financial Group, Inc.1 | 4,598 | 48,831 | ||||||
| Hanover Insurance Group, Inc.1 | 780 | 46,574 | ||||||
| Allstate Corp.1 | 842 | 45,923 | ||||||
| Berkshire Hathaway, Inc. — Class B*,1 | 365 | 43,275 | ||||||
| MFA Financial, Inc.1 | 6,114 | 43,165 | ||||||
| Protective Life Corp.1 | 717 | 36,323 | ||||||
| Corrections Corporation of America1 | 1,126 | 36,111 | ||||||
| HCC Insurance Holdings, Inc.1 | 711 | 32,806 | ||||||
| PartnerRe Ltd.1 | 302 | 31,840 | ||||||
| Wells Fargo & Co.1 | 648 | 29,419 | ||||||
| American Capital Agency Corp.1 | 1,472 | 28,395 | ||||||
| Goldman Sachs Group, Inc.1 | 157 | 27,830 | ||||||
| Popular, Inc.*,1 | 937 | 26,920 | ||||||
| Ares Capital Corp.1 | 1,510 | 26,833 | ||||||
| Bank of America Corp.1 | 1,711 | 26,640 | ||||||
| Leucadia National Corp.1 | 868 | 24,599 | ||||||
| Affiliated Managers Group, Inc.*,1 | 101 | 21,905 | ||||||
| Morgan Stanley1 | 698 | 21,889 | ||||||
| Omega Healthcare Investors, Inc.1 | 679 | 20,234 | ||||||
| SLM Corp.1 | 692 | 18,186 | ||||||
| SunTrust Banks, Inc.1 | 453 | 16,675 | ||||||
| Citigroup, Inc.1 | 315 | 16,415 | ||||||
| KeyCorp1 | 1,220 | 16,372 | ||||||
| Annaly Capital Management, Inc.1 | 1,302 | 12,981 | ||||||
| Extra Space Storage, Inc.1 | 296 | 12,470 | ||||||
| Ameriprise Financial, Inc.1 | 101 | 11,620 | ||||||
| WP Carey, Inc.1 | 189 | 11,595 | ||||||
| Eastern Insurance Holdings, Inc.1 | 150 | 3,674 | ||||||
| LPL Financial Holdings, Inc.1 | 69 | 3,245 | ||||||
| Ocwen Financial Corp.*,1 | 53 | 2,939 | ||||||
| Fifth Third Bancorp1 | 138 | 2,902 | ||||||
| Unum Group1 | 13 | 456 | ||||||
| Total Financials | 2,252,223 | |||||||
| HEALTH CARE - 6.8% | ||||||||
| Health Management Associates, | ||||||||
| Inc. — Class A*,1 | 27,746 | 363,457 | ||||||
| Life Technologies Corp.*,1 | 3,338 | 253,020 | ||||||
| Hi-Tech Pharmacal Company, Inc.*,1 | 4,400 | 190,916 | ||||||
| ViroPharma, Inc.*,1 | 2,871 | 143,119 | ||||||
| United Therapeutics Corp.*,1 | 528 | 59,706 | ||||||
| Express Scripts Holding Co.*,1 | 748 | 52,540 | ||||||
| Omnicare, Inc.1 | 862 | 52,030 | ||||||
| DENTSPLY International, Inc.1 | 1,057 | 51,243 | ||||||
| MEDNAX, Inc.*,1 | 892 | 47,615 | ||||||
| Cooper Companies, Inc.1 | 371 | 45,945 | ||||||
| Pfizer, Inc.1 | 1,428 | 43,740 | ||||||
| Medtronic, Inc.1 | 742 | 42,584 | ||||||
| Biogen Idec, Inc.*,1 | 138 | 38,606 | ||||||
| Amgen, Inc.1 | 287 | 32,764 | ||||||
| McKesson Corp.1 | 189 | 30,505 | ||||||
| Jazz Pharmaceuticals plc*,1 | 189 | 23,920 | ||||||
| Johnson & Johnson1 | 208 | 19,051 | ||||||
| Abbott Laboratories1 | 377 | 14,450 | ||||||
| Covance, Inc.*,1 | 151 | 13,297 | ||||||
| Universal Health Services, Inc. — Class B1 | 126 | 10,239 | ||||||
| UnitedHealth Group, Inc.1 | 75 | 5,648 | ||||||
| Mylan, Inc.*,1 | 101 | 4,383 | ||||||
| Zimmer Holdings, Inc.1 | 25 | 2,330 | ||||||
| Cigna Corp.1 | 25 | 2,187 | ||||||
| Total Health Care | 1,543,295 | |||||||
| INFORMATION TECHNOLOGY - 6.1% | ||||||||
| LSI Corp. | 17,459 | 192,399 | ||||||
| Pactera Technology International | ||||||||
| Ltd. ADR*,1 | 17,934 | 128,228 | ||||||
| RDA Microelectronics, Inc. ADR1 | 5,626 | 100,593 | ||||||
| AsiaInfo-Linkage, Inc.*,1 | 7,917 | 94,688 | ||||||
| Anaren, Inc.*,1 | 2,205 | 61,717 | ||||||
| Brocade Communications Systems, Inc.*,1 | 5,856 | 51,943 | ||||||
| Activision Blizzard, Inc.1 | 2,912 | 51,921 | ||||||
| Texas Instruments, Inc.1 | 1,164 | 51,111 | ||||||
| DST Systems, Inc.1 | 541 | 49,090 | ||||||
| Cisco Systems, Inc.1 | 2,063 | 46,314 | ||||||
| Cadence Design Systems, Inc.*,1 | 3,252 | 45,593 | ||||||
| CA, Inc.1 | 1,145 | 38,530 | ||||||
| Hewlett-Packard Co.1 | 1,352 | 37,830 | ||||||
| Computer Sciences Corp.1 | 661 | 36,937 | ||||||
| NeuStar, Inc. — Class A*,1 | 692 | 34,503 | ||||||
| Maxim Integrated Products, Inc.1 | 1,151 | 32,124 | ||||||
| Ebix, Inc.2 | 2,064 | 30,382 | ||||||
| Harris Corp.1 | 434 | 30,298 | ||||||
| QUALCOMM, Inc.1 | 390 | 28,958 | ||||||
| Fidelity National Information | ||||||||
| Services, Inc.1 | 535 | 28,719 | ||||||
| CoreLogic, Inc.*,1 | 786 | 27,927 | ||||||
| Leidos Holdings, Inc.1 | 585 | 27,197 | ||||||
| Intel Corp.1 | 887 | 23,027 | ||||||
| Xerox Corp.1 | 1,874 | 22,807 | ||||||
| IAC/InterActiveCorp1 | 289 | 19,851 | ||||||
| NVIDIA Corp.1 | 1,044 | 16,725 | ||||||
| Ingram Micro, Inc. — Class A*,1 | 623 | 14,616 | ||||||
| Western Digital Corp.1 | 164 | 13,760 | ||||||
| Microsoft Corp.1 | 308 | 11,528 | ||||||
| Symantec Corp.1 | 428 | 10,092 | ||||||
| Alliance Data Systems Corp.*,1 | 19 | 4,996 | ||||||
| EMC Corp.1 | 195 | 4,904 | ||||||
| KLA-Tencor Corp.1 | 75 | 4,834 | ||||||
| FLIR Systems, Inc.1 | 75 | 2,258 | ||||||
| Broadridge Financial Solutions, Inc.1 | 44 | 1,739 | ||||||
| 26 | THE GUGGENHEIM FUNDS ANNUAL REPORT | SEE NOTES TO FINANCIAL STATEMENTS. |
| CONSOLIDATED SCHEDULE OF INVESTMENTS (continued) | December 31, 2013 |
| MULTI-HEDGE STRATEGIES FUND |
| Shares | Value | |||||||
| Lam Research Corp.*,1 | 19 | $ | 1,035 | |||||
| SanDisk Corp.1 | 13 | 917 | ||||||
| First Solar, Inc.* | 6 | 328 | ||||||
| Total Information Technology | 1,380,419 | |||||||
| CONSUMER DISCRETIONARY - 3.7% | ||||||||
| Cooper Tire & Rubber Co.1 | 7,725 | 185,710 | ||||||
| Liberty Interactive Corp. — Class A*,1 | 1,774 | 52,067 | ||||||
| Lowe’s Companies, Inc.1 | 1,044 | 51,730 | ||||||
| Wyndham Worldwide Corp.1 | 692 | 50,994 | ||||||
| Thomson Reuters Corp.1 | 1,333 | 50,414 | ||||||
| Time Warner, Inc.1 | 711 | 49,572 | ||||||
| Lear Corp.1 | 503 | 40,729 | ||||||
| Abercrombie & Fitch Co. — Class A1 | 1,189 | 39,129 | ||||||
| H&R Block, Inc.1 | 1,333 | 38,710 | ||||||
| Macy’s, Inc.1 | 723 | 38,608 | ||||||
| Six Flags Entertainment Corp.1 | 899 | 33,101 | ||||||
| Hanesbrands, Inc.1 | 459 | 32,254 | ||||||
| Whirlpool Corp.1 | 176 | 27,607 | ||||||
| Fossil Group, Inc.*,1 | 195 | 23,388 | ||||||
| PulteGroup, Inc.1 | 1,132 | 23,059 | ||||||
| American Eagle Outfitters, Inc.1 | 1,541 | 22,190 | ||||||
| Leggett & Platt, Inc.1 | 692 | 21,410 | ||||||
| Comcast Corp. — Class A1 | 340 | 17,668 | ||||||
| Wendy’s Co.1 | 1,994 | 17,388 | ||||||
| Dillard’s, Inc. — Class A1 | 132 | 12,832 | ||||||
| Visteon Corp.*,1 | 88 | 7,206 | ||||||
| The Gap, Inc.1 | 94 | 3,674 | ||||||
| Viacom, Inc. — Class B1 | 19 | 1,659 | ||||||
| Total Consumer Discretionary | 841,099 | |||||||
| INDUSTRIALS - 3.4% | ||||||||
| Crane Co.1 | 799 | 53,733 | ||||||
| Trinity Industries, Inc.1 | 981 | 53,484 | ||||||
| Oshkosh Corp.1 | 1,025 | 51,640 | ||||||
| Northrop Grumman Corp.1 | 440 | 50,429 | ||||||
| Union Pacific Corp.1 | 294 | 49,392 | ||||||
| URS Corp.1 | 918 | 48,646 | ||||||
| Southwest Airlines Co.1 | 2,359 | 44,444 | ||||||
| FedEx Corp.1 | 308 | 44,281 | ||||||
| Exelis, Inc.1 | 2,000 | 38,120 | ||||||
| Alliant Techsystems, Inc.1 | 296 | 36,017 | ||||||
| Raytheon Co.1 | 359 | 32,561 | ||||||
| Air Lease Corp. — Class A1 | 1,038 | 32,260 | ||||||
| AECOM Technology Corp.*,1 | 1,038 | 30,548 | ||||||
| Dover Corp.1 | 308 | 29,734 | ||||||
| MRC Global, Inc.*,1 | 862 | 27,808 | ||||||
| AGCO Corp.1 | 446 | 26,399 | ||||||
| Ingersoll-Rand plc1 | 403 | 24,825 | ||||||
| Ryder System, Inc.1 | 327 | 24,126 | ||||||
| Pitney Bowes, Inc.1 | 742 | 17,289 | ||||||
| Waste Connections, Inc.1 | 296 | 12,914 | ||||||
| Alaska Air Group, Inc.1 | 138 | 10,125 | ||||||
| GATX Corp.1 | 170 | 8,869 | ||||||
| Manpowergroup, Inc.1 | 94 | 8,071 | ||||||
| AMERCO*,1 | 32 | 7,611 | ||||||
| Kirby Corp.*,1 | 75 | 7,444 | ||||||
| United Rentals, Inc.*,1 | 69 | 5,379 | ||||||
| Delta Air Lines, Inc.1 | 145 | 3,983 | ||||||
| Boeing Co.1 | 19 | 2,593 | ||||||
| Dun & Bradstreet Corp.1 | 19 | 2,332 | ||||||
| ITT Corp.1 | 19 | 825 | ||||||
| Total Industrials | 785,882 | |||||||
| ENERGY - 3.1% | ||||||||
| PAA Natural Gas Storage, LP1 | 6,446 | 148,258 | ||||||
| PVR Partners, LP1 | 5,484 | 147,136 | ||||||
| Hess Corp.1 | 610 | 50,630 | ||||||
| Chevron Corp.1 | 403 | 50,339 | ||||||
| Murphy Oil Corp.1 | 761 | 49,375 | ||||||
| ConocoPhillips1 | 547 | 38,646 | ||||||
| Superior Energy Services, Inc.*,1 | 1,277 | 33,981 | ||||||
| Helmerich & Payne, Inc.1 | 384 | 32,286 | ||||||
| Denbury Resources, Inc.*,1 | 1,654 | 27,175 | ||||||
| Marathon Petroleum Corp.1 | 270 | 24,768 | ||||||
| Continental Resources, Inc.*,1 | 189 | 21,266 | ||||||
| SM Energy Co.1 | 245 | 20,362 | ||||||
| Chesapeake Energy Corp.1 | 730 | 19,812 | ||||||
| Phillips 661 | 164 | 12,649 | ||||||
| Valero Energy Corp.1 | 226 | 11,390 | ||||||
| Patterson-UTI Energy, Inc.1 | 371 | 9,394 | ||||||
| Noble Energy, Inc.1 | 113 | 7,696 | ||||||
| Energen Corp.1 | 69 | 4,882 | ||||||
| Anadarko Petroleum Corp.1 | 32 | 2,538 | ||||||
| Golar LNG Ltd.1 | 69 | 2,504 | ||||||
| Pioneer Natural Resources Co. | 1 | 184 | ||||||
| Total Energy | 715,271 | |||||||
| UTILITIES - 3.0% | ||||||||
| UNS Energy Corp. | 3,624 | 216,897 | ||||||
| Westar Energy, Inc.1 | 1,573 | 50,603 | ||||||
| CMS Energy Corp.1 | 1,874 | 50,168 | ||||||
| DTE Energy Co.1 | 748 | 49,660 | ||||||
| Alliant Energy Corp.1 | 962 | 49,639 | ||||||
| Atmos Energy Corp.1 | 1,038 | 47,146 | ||||||
| Great Plains Energy, Inc.1 | 1,843 | 44,674 | ||||||
| Pinnacle West Capital Corp.1 | 812 | 42,971 | ||||||
| Northeast Utilities1 | 899 | 38,109 | ||||||
| NRG Energy, Inc.1 | 1,120 | 32,166 | ||||||
| AES Corp.1 | 1,480 | 21,475 | ||||||
| UGI Corp.1 | 365 | 15,133 | ||||||
| NiSource, Inc.1 | 446 | 14,664 | ||||||
| AGL Resources, Inc.1 | 308 | 14,547 | ||||||
| Integrys Energy Group, Inc.1 | 119 | 6,475 | ||||||
| Total Utilities | 694,327 | |||||||
| CONSUMER STAPLES - 2.1% | ||||||||
| Archer-Daniels-Midland Co.1 | 1,215 | 52,707 | ||||||
| Tyson Foods, Inc. — Class A1 | 1,516 | 50,725 | ||||||
| Energizer Holdings, Inc.1 | 453 | 49,033 | ||||||
| Molson Coors Brewing Co. — Class B1 | 862 | 48,402 | ||||||
| Kroger Co.1 | 1,183 | 46,764 | ||||||
| JM Smucker Co.1 | 421 | 43,624 | ||||||
| General Mills, Inc.1 | 761 | 37,982 | ||||||
| Hormel Foods Corp.1 | 786 | 35,504 | ||||||
| Herbalife Ltd. | 373 | 29,355 | ||||||
| CVS Caremark Corp.1 | 371 | 26,552 | ||||||
| Flowers Foods, Inc.1 | 1,192 | 25,592 | ||||||
| SEE NOTES TO FINANCIAL STATEMENTS. | THE GUGGENHEIM FUNDS ANNUAL REPORT | 27 |
| CONSOLIDATED SCHEDULE OF INVESTMENTS (continued) | December 31, 2013 |
| MULTI-HEDGE STRATEGIES FUND |
| Shares | Value | |||||||
| Coca-Cola Enterprises, Inc.1 | 551 | $ | 24,316 | |||||
| Nu Skin Enterprises, Inc. — Class A1 | 94 | 12,993 | ||||||
| Constellation Brands, Inc. — Class A*,1 | 44 | 3,097 | ||||||
| Green Mountain Coffee Roasters, Inc.*,1 | 38 | 2,872 | ||||||
| Total Consumer Staples | 489,518 | |||||||
| MATERIALS - 1.7% | ||||||||
| Dow Chemical Co.1 | 1,264 | 56,122 | ||||||
| Westlake Chemical Corp.1 | 434 | 52,979 | ||||||
| LyondellBasell Industries N.V. — Class A1 | 642 | 51,540 | ||||||
| Reliance Steel & Aluminum Co.1 | 673 | 51,040 | ||||||
| Rock Tenn Co. — Class A1 | 484 | 50,825 | ||||||
| Avery Dennison Corp.1 | 837 | 42,009 | ||||||
| Cabot Corp.1 | 497 | 25,546 | ||||||
| Greif, Inc. — Class A1 | 434 | 22,742 | ||||||
| Steel Dynamics, Inc.1 | 1,000 | 19,540 | ||||||
| Packaging Corporation of America1 | 44 | 2,784 | ||||||
| NewMarket Corp. | 6 | 2,005 | ||||||
| CF Industries Holdings, Inc. | 6 | 1,398 | ||||||
| Ecolab, Inc. | 6 | 626 | ||||||
| Total Materials | 379,156 | |||||||
| TELECOMMUNICATION SERVICES - 0.1% | ||||||||
| Verizon Communications, Inc.1 | 327 | 16,069 | ||||||
| AT&T, Inc.1 | 69 | 2,427 | ||||||
| Total Telecommunication Services | 18,496 | |||||||
| Total Common Stocks | ||||||||
| (Cost $7,929,423) | 9,099,686 | |||||||
| CLOSED-END FUNDS† - 13.4% | ||||||||
| BlackRock Enhanced Equity | ||||||||
| Dividend Trust1 | 20,338 | 161,484 | ||||||
| BlackRock Credit Allocation | ||||||||
| Income Trust1 | 11,924 | 155,727 | ||||||
| Eaton Vance Enhanced Equity | ||||||||
| Income Fund II1 | 11,583 | 150,463 | ||||||
| AllianceBernstein Income Fund, Inc.1 | 20,566 | 146,635 | ||||||
| Adams Express Co.1 | 11,108 | 145,182 | ||||||
| Western Asset/Claymore | ||||||||
| Inflation-Linked Opportunities | ||||||||
| &Income Fund1,6 | 12,772 | 143,940 | ||||||
| Cohen & Steers REIT and | ||||||||
| Preferred Income Fund, Inc.1 | 8,894 | 139,636 | ||||||
| AllianzGI Equity & Convertible | ||||||||
| Income Fund1 | 6,301 | 122,995 | ||||||
| Nuveen Dividend Advantage | ||||||||
| Municipal Income Fund1 | 8,848 | 110,776 | ||||||
| BlackRock Income Opportunity Trust, Inc.1 | 8,998 | 87,281 | ||||||
| Zweig Total Return Fund, Inc.1 | 5,663 | 78,942 | ||||||
| Western Asset/Claymore | ||||||||
| Inflation-Linked Securities | ||||||||
| &Income Fund1,6 | 6,652 | 75,966 | ||||||
| Tri-Continental Corp.1 | 3,664 | 73,207 | ||||||
| Gabelli Dividend & Income Trust1 | 3,258 | 72,230 | ||||||
| Eaton Vance Risk-Managed | ||||||||
| Diversified Equity Income Fund1 | 6,066 | 68,364 | ||||||
| Morgan Stanley Emerging | ||||||||
| Markets Debt Fund, Inc.1 | 6,960 | 66,398 | ||||||
| Advent Claymore Convertible | ||||||||
| Securities and Income Fund II1,6 | 8,117 | 59,092 | ||||||
| BlackRock Global | ||||||||
| Opportunities Equity Trust1 | 3,947 | 59,047 | ||||||
| Swiss Helvetia Fund, Inc.1 | 3,979 | 55,507 | ||||||
| John Hancock Hedged | ||||||||
| Equity & Income Fund1 | 3,230 | 55,136 | ||||||
| Nuveen Maryland Premium | ||||||||
| Income Municipal Fund1 | 4,602 | 54,902 | ||||||
| General American Investors | ||||||||
| Company, Inc.1 | 1,514 | 53,293 | ||||||
| Gabelli Healthcare & WellnessRx Trust1 | 4,666 | 48,433 | ||||||
| First Trust Enhanced Equity Income Fund1 | 3,413 | 45,461 | ||||||
| Western Asset Worldwide | ||||||||
| Income Fund, Inc.1 | 3,540 | 43,117 | ||||||
| China Fund, Inc.1 | 2,050 | 42,661 | ||||||
| Madison Covered Call & | ||||||||
| Equity Strategy Fund1 | 5,124 | 41,863 | ||||||
| GDL Fund1 | 3,571 | 39,352 | ||||||
| BlackRock MuniYield | ||||||||
| Michigan Quality Fund II, Inc.1 | 3,379 | 38,825 | ||||||
| Central Europe Russia and | ||||||||
| Turkey Fund, Inc.1 | 1,209 | 36,935 | ||||||
| Royce Value Trust, Inc.1 | 2,129 | 34,064 | ||||||
| Putnam High Income Securities Fund1 | 3,922 | 32,396 | ||||||
| Royce Micro-Capital Trust, Inc.1 | 2,549 | 32,143 | ||||||
| Morgan Stanley Income Securities, Inc.1 | 1,908 | 32,112 | ||||||
| Cohen & Steers Infrastructure Fund, Inc.1 | 1,551 | 31,951 | ||||||
| Clough Global Allocation Fund1 | 2,036 | 31,314 | ||||||
| MFS InterMarket Income Trust I1 | 3,310 | 26,844 | ||||||
| Lazard Global Total Return and | ||||||||
| Income Fund, Inc.1 | 1,497 | 26,377 | ||||||
| Clough Global Opportunities Fund1 | 1,642 | 21,461 | ||||||
| Eaton Vance Enhanced | ||||||||
| Equity Income Fund1 | 1,527 | 19,851 | ||||||
| Ellsworth Fund Ltd.1 | 2,398 | 19,640 | ||||||
| Bancroft Fund Ltd.1 | 1,037 | 19,288 | ||||||
| Liberty All Star Equity Fund1 | 3,137 | 18,728 | ||||||
| Morgan Stanley India | ||||||||
| Investment Fund, Inc.*,1 | 1,066 | 18,634 | ||||||
| New Ireland Fund, Inc.1 | 1,451 | 18,631 | ||||||
| Korea Equity Fund, Inc.1 | 2,154 | 17,921 | ||||||
| Nuveen New Jersey Dividend | ||||||||
| Advantage Municipal Fund1 | 1,400 | 17,472 | ||||||
| Liberty All Star Growth Fund, Inc.1 | 3,108 | 17,467 | ||||||
| Morgan Stanley Asia-Pacific Fund, Inc.1 | 1,037 | 17,276 | ||||||
| Delaware Investments National | ||||||||
| Municipal Income Fund1 | 1,444 | 16,866 | ||||||
| Helios Strategic Income Fund, Inc.1 | 2,176 | 14,492 | ||||||
| Madison Strategic Sector Premium Fund1 | 1,144 | 13,682 | ||||||
| Japan Smaller Capitalization Fund, Inc.1 | 1,317 | 12,077 | ||||||
| First Trust Dividend and Income Fund1 | 1,282 | 11,282 | ||||||
| DWS Global High Income Fund, Inc.1 | 1,260 | 10,080 | ||||||
| Asia Tigers Fund, Inc.1 | 873 | 9,804 | ||||||
| Nuveen Pennsylvania Dividend | ||||||||
| Advantage Municipal Fund 21 | 736 | 8,758 | ||||||
| Korea Fund, Inc.*,1 | 185 | 7,657 | ||||||
| European Equity Fund, Inc.*,1 | 834 | 7,523 | ||||||
| 28 | THE GUGGENHEIM FUNDS ANNUAL REPORT | SEE NOTES TO FINANCIAL STATEMENTS. |
| CONSOLIDATED Schedule of Investments (continued) | December 31, 2013 |
| multi-hedge strategies fund | |
| Shares | Value | |||||||
| India Fund, Inc.1 | 340 | $ | 6,800 | |||||
| New Germany Fund, Inc.1 | 313 | 6,238 | ||||||
| Templeton Dragon Fund, Inc.1 | 208 | 5,383 | ||||||
| Aberdeen Greater China Fund, Inc.1 | 109 | 1,107 | ||||||
| Total Closed-End Funds | ||||||||
| (Cost $2,849,573) | 3,058,169 | |||||||
| Face | ||||||||
| amount | ||||||||
| REPURCHASE AGREEMENTS††,3 - 34.6% | ||||||||
| Deutsche Bank | ||||||||
| issued 12/31/13 at 0.01% | ||||||||
| due 01/02/14 | $ | 1,977,609 | 1,977,609 | |||||
| HSBC Group | ||||||||
| issued 12/31/13 at 0.01% | ||||||||
| due 01/02/14 | 1,977,609 | 1,977,609 | ||||||
| Credit Suisse Group | ||||||||
| issued 12/31/13 at 0.00% | ||||||||
| due 01/02/14 | 1,977,609 | 1,977,609 | ||||||
| Mizuho Financial Group, Inc. | ||||||||
| issued 12/31/13 at 0.01% | ||||||||
| due 01/02/14 | 1,968,664 | 1,968,664 | ||||||
| Total Repurchase Agreements | ||||||||
| (Cost $7,901,491) | 7,901,491 | |||||||
| SECURITIES LENDING COLLATERAL††,4 - 0.1% | ||||||||
| Repurchase Agreements | ||||||||
| HSBC Securities, Inc. | ||||||||
| issued 12/31/13 at 0.01% | ||||||||
| due 01/02/14 | 27,889 | 27,889 | ||||||
| Deutsche Bank Securities, Inc. | ||||||||
| issued 12/31/13 at 0.02% | ||||||||
| due 01/02/14 | 4,111 | 4,111 | ||||||
| Total Securities Lending Collateral | ||||||||
| (Cost $32,000) | 32,000 | |||||||
| Total Investments - 88.0% | ||||||||
| (Cost $18,712,487) | $ | 20,091,346 | ||||||
| Shares | ||||||||
| COMMON STOCKS SOLD SHORT† - (31.1)% | ||||||||
| Telecommunication Services - (0.1)% | ||||||||
| Crown Castle International Corp.* | 57 | (4,186 | ) | |||||
| Level 3 Communications, Inc.* | 308 | (10,216 | ) | |||||
| Total Telecommunication Services | (14,402 | ) | ||||||
| Materials - (1.6)% | ||||||||
| Domtar Corp. | 13 | (1,226 | ) | |||||
| Kronos Worldwide, Inc. | 82 | (1,562 | ) | |||||
| Newmont Mining Corp. | 88 | (2,027 | ) | |||||
| Alcoa, Inc. | 955 | (10,152 | ) | |||||
| Air Products & Chemicals, Inc. | 94 | (10,507 | ) | |||||
| Royal Gold, Inc. | 352 | (16,216 | ) | |||||
| Silgan Holdings, Inc. | 358 | (17,191 | ) | |||||
| Aptargroup, Inc. | 314 | (21,292 | ) | |||||
| Southern Copper Corp. | 761 | (21,848 | ) | |||||
| Sigma-Aldrich Corp. | 251 | (23,597 | ) | |||||
| MeadWestvaco Corp. | 660 | (24,374 | ) | |||||
| Celanese Corp. — Class A | 446 | (24,668 | ) | |||||
| FMC Corp. | 327 | (24,675 | ) | |||||
| Praxair, Inc. | 195 | (25,356 | ) | |||||
| Ball Corp. | 497 | (25,676 | ) | |||||
| Tahoe Resources, Inc.* | 1,565 | (26,042 | ) | |||||
| EI du Pont de Nemours & Co. | 408 | (26,508 | ) | |||||
| Huntsman Corp. | 1,081 | (26,593 | ) | |||||
| Compass Minerals International, Inc. | 346 | (27,698 | ) | |||||
| Total Materials | (357,208 | ) | ||||||
| Utilities - (1.7)% | ||||||||
| American Water Works Company, Inc. | 170 | (7,184 | ) | |||||
| Hawaiian Electric Industries, Inc. | 585 | (15,245 | ) | |||||
| ITC Holdings Corp. | 164 | (15,714 | ) | |||||
| Aqua America, Inc. | 677 | (15,971 | ) | |||||
| TECO Energy, Inc. | 1,194 | (20,585 | ) | |||||
| FirstEnergy Corp. | 660 | (21,767 | ) | |||||
| NextEra Energy, Inc. | 258 | (22,090 | ) | |||||
| Exelon Corp. | 830 | (22,734 | ) | |||||
| Questar Corp. | 1,012 | (23,266 | ) | |||||
| CenterPoint Energy, Inc. | 1,018 | (23,597 | ) | |||||
| Consolidated Edison, Inc. | 434 | (23,992 | ) | |||||
| Dominion Resources, Inc. | 381 | (24,647 | ) | |||||
| Ameren Corp. | 685 | (24,770 | ) | |||||
| Pepco Holdings, Inc. | 1,308 | (25,022 | ) | |||||
| Southern Co. | 610 | (25,077 | ) | |||||
| Calpine Corp.* | 1,289 | (25,148 | ) | |||||
| MDU Resources Group, Inc. | 840 | (25,662 | ) | |||||
| ONEOK, Inc. | 415 | (25,805 | ) | |||||
| Total Utilities | (388,276 | ) | ||||||
| Consumer Staples - (2.0)% | ||||||||
| Costco Wholesale Corp. | 38 | (4,522 | ) | |||||
| PepsiCo, Inc. | 107 | (8,875 | ) | |||||
| Whole Foods Market, Inc. | 182 | (10,525 | ) | |||||
| Philip Morris International, Inc. | 126 | (10,978 | ) | |||||
| Church & Dwight Company, Inc. | 207 | (13,720 | ) | |||||
| Avon Products, Inc. | 1,142 | (19,665 | ) | |||||
| Fresh Market, Inc.* | 553 | (22,397 | ) | |||||
| Wal-Mart Stores, Inc. | 289 | (22,742 | ) | |||||
| Dean Foods Co.* | 1,380 | (23,722 | ) | |||||
| Mead Johnson Nutrition Co. — Class A | 289 | (24,207 | ) | |||||
| Brown-Forman Corp. — Class B | 324 | (24,485 | ) | |||||
| Kellogg Co. | 402 | (24,550 | ) | |||||
| McCormick & Company, Inc. | 358 | (24,673 | ) | |||||
| Beam, Inc. | 365 | (24,842 | ) | |||||
| Colgate-Palmolive Co. | 381 | (24,845 | ) | |||||
| Estee Lauder Companies, Inc. — Class A | 333 | (25,082 | ) | |||||
| Bunge Ltd. | 308 | (25,290 | ) | |||||
| Coca-Cola Co. | 616 | (25,447 | ) | |||||
| Mondelez International, Inc. — Class A | 736 | (25,981 | ) | |||||
| Sysco Corp. | 736 | (26,570 | ) | |||||
| Campbell Soup Co. | 629 | (27,223 | ) | |||||
| Monster Beverage Corp.* | 402 | (27,243 | ) | |||||
| Total Consumer Staples | (467,584 | ) | ||||||
| Health Care - (2.2)% | ||||||||
| IDEXX Laboratories, Inc.* | 13 | (1,383 | ) | |||||
| Boston Scientific Corp.* | 132 | (1,587 | ) | |||||
| Bruker Corp.* | 182 | (3,598 | ) | |||||
| See Notes to Financial Statements. | The GUGGENHEIM FUNDS annual report | 29 |
| CONSOLIDATED Schedule of Investments (continued) | December 31, 2013 |
| multi-hedge strategies fund | |
| Shares | Value | |||||||
| Cubist Pharmaceuticals, Inc.* | 69 | $ | (4,752 | ) | ||||
| Pharmacyclics, Inc.* | 50 | (5,289 | ) | |||||
| Varian Medical Systems, Inc.* | 88 | (6,837 | ) | |||||
| Agilent Technologies, Inc. | 126 | (7,206 | ) | |||||
| Salix Pharmaceuticals Ltd.* | 101 | (9,084 | ) | |||||
| HCA Holdings, Inc.* | 314 | (14,981 | ) | |||||
| Techne Corp. | 182 | (17,230 | ) | |||||
| Actavis plc* | 113 | (18,984 | ) | |||||
| Alexion Pharmaceuticals, Inc.* | 145 | (19,294 | ) | |||||
| Theravance, Inc.* | 591 | (21,069 | ) | |||||
| Health Net, Inc.* | 754 | (22,372 | ) | |||||
| CR Bard, Inc. | 170 | (22,770 | ) | |||||
| Alere, Inc.* | 635 | (22,987 | ) | |||||
| BioMarin Pharmaceutical, Inc.* | 352 | (24,735 | ) | |||||
| Merck & Company, Inc. | 497 | (24,875 | ) | |||||
| Endo Health Solutions, Inc.* | 371 | (25,028 | ) | |||||
| Incyte Corporation Ltd.* | 497 | (25,163 | ) | |||||
| Medivation, Inc.* | 396 | (25,273 | ) | |||||
| Allscripts Healthcare Solutions, Inc.* | 1,666 | (25,756 | ) | |||||
| Hologic, Inc.* | 1,176 | (26,283 | ) | |||||
| Forest Laboratories, Inc.* | 440 | (26,413 | ) | |||||
| Vertex Pharmaceuticals, Inc.* | 365 | (27,120 | ) | |||||
| Community Health Systems, Inc.* | 1,926 | (75,634 | ) | |||||
| Total Health Care | (505,703 | ) | ||||||
| Energy - (3.1)% | ||||||||
| RPC, Inc. | 19 | (339 | ) | |||||
| Tesoro Corp. | 13 | (761 | ) | |||||
| FMC Technologies, Inc.* | 289 | (15,089 | ) | |||||
| Newfield Exploration Co.* | 855 | (21,059 | ) | |||||
| Laredo Petroleum, Inc.* | 786 | (21,764 | ) | |||||
| Cobalt International Energy, Inc.* | 1,421 | (23,375 | ) | |||||
| Concho Resources, Inc.* | 220 | (23,760 | ) | |||||
| Kosmos Energy Ltd.* | 2,206 | (24,663 | ) | |||||
| Ultra Petroleum Corp.* | 1,144 | (24,768 | ) | |||||
| Devon Energy Corp. | 402 | (24,872 | ) | |||||
| Southwestern Energy Co.* | 641 | (25,211 | ) | |||||
| CONSOL Energy, Inc. | 679 | (25,829 | ) | |||||
| Range Resources Corp. | 308 | (25,967 | ) | |||||
| Dresser-Rand Group, Inc.* | 440 | (26,237 | ) | |||||
| Peabody Energy Corp. | 1,351 | (26,385 | ) | |||||
| Williams Companies, Inc. | 685 | (26,420 | ) | |||||
| SandRidge Energy, Inc.* | 4,469 | (27,127 | ) | |||||
| Teekay Corp. | 566 | (27,174 | ) | |||||
| McDermott International, Inc.* | 3,193 | (29,248 | ) | |||||
| Regency Energy Partners, LP | 5,594 | (146,898 | ) | |||||
| Plains All American Pipeline, LP | 2,868 | (148,477 | ) | |||||
| Total Energy | (715,423 | ) | ||||||
| Information Technology - (3.1)% | ||||||||
| Applied Materials, Inc. | 13 | (230 | ) | |||||
| Compuware Corp. | 38 | (426 | ) | |||||
| Red Hat, Inc.* | 25 | (1,401 | ) | |||||
| F5 Networks, Inc.* | 44 | (3,998 | ) | |||||
| Western Union Co. | 283 | (4,882 | ) | |||||
| Pandora Media, Inc.* | 214 | (5,692 | ) | |||||
| Concur Technologies, Inc.* | 57 | (5,881 | ) | |||||
| Nuance Communications, Inc.* | 446 | (6,779 | ) | |||||
| Linear Technology Corp. | 151 | (6,878 | ) | |||||
| JDS Uniphase Corp.* | 559 | (7,256 | ) | |||||
| Citrix Systems, Inc.* | 126 | (7,970 | ) | |||||
| National Instruments Corp. | 421 | (13,481 | ) | |||||
| Freescale Semiconductor Ltd.* | 930 | (14,927 | ) | |||||
| Teradata Corp.* | 339 | (15,421 | ) | |||||
| Rackspace Hosting, Inc.* | 427 | (16,709 | ) | |||||
| NCR Corp.* | 547 | (18,631 | ) | |||||
| Global Payments, Inc. | 321 | (20,862 | ) | |||||
| Altera Corp. | 673 | (21,893 | ) | |||||
| Juniper Networks, Inc.* | 999 | (22,547 | ) | |||||
| Zynga, Inc. — Class A* | 6,097 | (23,169 | ) | |||||
| TIBCO Software, Inc.* | 1,056 | (23,739 | ) | |||||
| Automatic Data Processing, Inc. | 302 | (24,405 | ) | |||||
| Diebold, Inc. | 754 | (24,890 | ) | |||||
| Atmel Corp.* | 3,275 | (25,643 | ) | |||||
| Equinix, Inc.* | 145 | (25,730 | ) | |||||
| Paychex, Inc. | 566 | (25,770 | ) | |||||
| VMware, Inc. — Class A* | 289 | (25,926 | ) | |||||
| Informatica Corp.* | 629 | (26,104 | ) | |||||
| Riverbed Technology, Inc.* | 1,446 | (26,144 | ) | |||||
| Solera Holdings, Inc. | 371 | (26,252 | ) | |||||
| Fairchild Semiconductor International, | ||||||||
| Inc. — Class A* | 1,974 | (26,353 | ) | |||||
| Salesforce.com, Inc.* | 478 | (26,381 | ) | |||||
| Polycom, Inc.* | 2,357 | (26,469 | ) | |||||
| Visa, Inc. — Class A | 119 | (26,499 | ) | |||||
| VeriFone Systems, Inc.* | 999 | (26,793 | ) | |||||
| Stratasys Ltd.* | 201 | (27,075 | ) | |||||
| ON Semiconductor Corp.* | 3,344 | (27,555 | ) | |||||
| Fortinet, Inc.* | 1,458 | (27,892 | ) | |||||
| Palo Alto Networks, Inc.* | 509 | (29,252 | ) | |||||
| Total Information Technology | (717,905 | ) | ||||||
| Consumer Discretionary - (3.4)% | ||||||||
| Delphi Automotive plc | 13 | (782 | ) | |||||
| Goodyear Tire & Rubber Co. | 50 | (1,192 | ) | |||||
| Deckers Outdoor Corp.* | 19 | (1,605 | ) | |||||
| Dollar Tree, Inc.* | 50 | (2,821 | ) | |||||
| Hasbro, Inc. | 63 | (3,466 | ) | |||||
| Tesla Motors, Inc.* | 25 | (3,760 | ) | |||||
| McDonald’s Corp. | 44 | (4,269 | ) | |||||
| Harley-Davidson, Inc. | 69 | (4,778 | ) | |||||
| Best Buy Company, Inc. | 126 | (5,025 | ) | |||||
| Garmin Ltd. | 126 | (5,824 | ) | |||||
| Madison Square Garden Co. — Class A* | 107 | (6,161 | ) | |||||
| Choice Hotels International, Inc. | 166 | (8,152 | ) | |||||
| Cabela’s, Inc.* | 138 | (9,199 | ) | |||||
| Wynn Resorts Ltd. | 63 | (12,235 | ) | |||||
| Harman International Industries, Inc. | 164 | (13,423 | ) | |||||
| Ulta Salon Cosmetics & Fragrance, Inc.* | 145 | (13,995 | ) | |||||
| Coach, Inc. | 270 | (15,155 | ) | |||||
| DSW, Inc. — Class A | 377 | (16,109 | ) | |||||
| Netflix, Inc.* | 50 | (18,409 | ) | |||||
| Carnival Corp. | 459 | (18,438 | ) | |||||
| Groupon, Inc. — Class A* | 1,590 | (18,714 | ) | |||||
| Morningstar, Inc. | 283 | (22,099 | ) | |||||
| Family Dollar Stores, Inc. | 346 | (22,480 | ) | |||||
| CarMax, Inc.* | 484 | (22,758 | ) | |||||
| 30 | the GUGGENHEIM FUNDS annual report | See Notes to Financial Statements. |
| CONSOLIDATED Schedule of Investments (continued) | December 31, 2013 |
| multi-hedge strategies fund | |
| Shares | Value | |||||||
| L Brands, Inc. | 377 | $ | (23,317 | ) | ||||
| Marriott International, Inc. — Class A | 488 | (24,088 | ) | |||||
| Panera Bread Co. — Class A* | 138 | (24,383 | ) | |||||
| Yum! Brands, Inc. | 327 | (24,725 | ) | |||||
| Apollo Education Group, Inc. — Class A* | 911 | (24,889 | ) | |||||
| Chico’s FAS, Inc. | 1,326 | (24,982 | ) | |||||
| Clear Channel Outdoor Holdings, | ||||||||
| Inc. — Class A | 2,483 | (25,178 | ) | |||||
| Allison Transmission Holdings, Inc. | 918 | (25,346 | ) | |||||
| Cinemark Holdings, Inc. | 761 | (25,364 | ) | |||||
| Ross Stores, Inc. | 339 | (25,401 | ) | |||||
| PVH Corp. | 189 | (25,708 | ) | |||||
| Advance Auto Parts, Inc. | 233 | (25,788 | ) | |||||
| Dick’s Sporting Goods, Inc. | 446 | (25,913 | ) | |||||
| DISH Network Corp. — Class A* | 459 | (26,585 | ) | |||||
| Tempur Sealy International, Inc.* | 497 | (26,818 | ) | |||||
| DreamWorks Animation SKG, | ||||||||
| Inc. — Class A* | 761 | (27,016 | ) | |||||
| Expedia, Inc. | 396 | (27,585 | ) | |||||
| Cablevision Systems Corp. — Class A | 1,540 | (27,612 | ) | |||||
| Lennar Corp. — Class A | 704 | (27,850 | ) | |||||
| DR Horton, Inc. | 1,301 | (29,039 | ) | |||||
| Total Consumer Discretionary | (768,436 | ) | ||||||
| Industrials - (4.3)% | ||||||||
| Stericycle, Inc.* | 13 | (1,510 | ) | |||||
| Owens Corning* | 75 | (3,054 | ) | |||||
| Regal-Beloit Corp. | 44 | (3,244 | ) | |||||
| Parker Hannifin Corp. | 32 | (4,116 | ) | |||||
| Cintas Corp. | 75 | (4,469 | ) | |||||
| Nordson Corp. | 63 | (4,681 | ) | |||||
| Clean Harbors, Inc.* | 107 | (6,416 | ) | |||||
| Lockheed Martin Corp. | 44 | (6,541 | ) | |||||
| WESCO International, Inc.* | 88 | (8,014 | ) | |||||
| Joy Global, Inc. | 145 | (8,481 | ) | |||||
| Kennametal, Inc. | 189 | (9,841 | ) | |||||
| IHS, Inc. — Class A* | 126 | (15,082 | ) | |||||
| MSC Industrial Direct Company, | ||||||||
| Inc. — Class A | 189 | (15,284 | ) | |||||
| Con-way, Inc. | 415 | (16,480 | ) | |||||
| WABCO Holdings, Inc.* | 207 | (19,336 | ) | |||||
| J.B. Hunt Transport Services, Inc. | 251 | (19,402 | ) | |||||
| CH Robinson Worldwide, Inc. | 352 | (20,536 | ) | |||||
| CSX Corp. | 748 | (21,520 | ) | |||||
| Stanley Black & Decker, Inc. | 270 | (21,786 | ) | |||||
| Covanta Holding Corp. | 1,251 | (22,205 | ) | |||||
| WW Grainger, Inc. | 90 | (22,988 | ) | |||||
| KBR, Inc. | 748 | (23,854 | ) | |||||
| Navistar International Corp.* | 629 | (24,022 | ) | |||||
| Verisk Analytics, Inc. — Class A* | 371 | (24,382 | ) | |||||
| Fastenal Co. | 522 | (24,800 | ) | |||||
| Cummins, Inc. | 176 | (24,811 | ) | |||||
| Kansas City Southern | 201 | (24,890 | ) | |||||
| United Parcel Service, Inc. — Class B | 239 | (25,114 | ) | |||||
| Pall Corp. | 296 | (25,264 | ) | |||||
| TransDigm Group, Inc. | 157 | (25,280 | ) | |||||
| Expeditors International of | ||||||||
| Washington, Inc. | 572 | (25,311 | ) | |||||
| Landstar System, Inc. | 444 | (25,508 | ) | |||||
| Xylem, Inc. | 742 | (25,673 | ) | |||||
| United Technologies Corp. | 226 | (25,719 | ) | |||||
| Triumph Group, Inc. | 339 | (25,788 | ) | |||||
| General Dynamics Corp. | 270 | (25,799 | ) | |||||
| Copart, Inc.* | 704 | (25,802 | ) | |||||
| Donaldson Company, Inc. | 597 | (25,946 | ) | |||||
| Toro Co. | 408 | (25,949 | ) | |||||
| Emerson Electric Co. | 371 | (26,036 | ) | |||||
| Harsco Corp. | 937 | (26,264 | ) | |||||
| SPX Corp. | 264 | (26,297 | ) | |||||
| Rollins, Inc. | 874 | (26,473 | ) | |||||
| Iron Mountain, Inc. | 893 | (27,103 | ) | |||||
| Armstrong World Industries, Inc.* | 471 | (27,134 | ) | |||||
| Chicago Bridge & Iron Company N.V. | 327 | (27,187 | ) | |||||
| 3M Co. | 195 | (27,349 | ) | |||||
| Textron, Inc. | 761 | (27,974 | ) | |||||
| United Continental Holdings, Inc.* | 805 | (30,453 | ) | |||||
| Total Industrials | (981,168 | ) | ||||||
| Financials - (9.6)% | ||||||||
| Investors Bancorp, Inc. | 5 | (128 | ) | |||||
| Plum Creek Timber Company, Inc. | 13 | (605 | ) | |||||
| Equity Residential | 19 | (986 | ) | |||||
| Chubb Corp. | 13 | (1,256 | ) | |||||
| BioMed Realty Trust, Inc. | 75 | (1,359 | ) | |||||
| St. Joe Co.* | 189 | (3,627 | ) | |||||
| WR Berkley Corp. | 101 | (4,382 | ) | |||||
| Aflac, Inc. | 69 | (4,609 | ) | |||||
| Principal Financial Group, Inc. | 94 | (4,635 | ) | |||||
| Invesco Ltd. | 132 | (4,805 | ) | |||||
| Prudential Financial, Inc. | 69 | (6,363 | ) | |||||
| Franklin Resources, Inc. | 113 | (6,523 | ) | |||||
| T. Rowe Price Group, Inc. | 82 | (6,869 | ) | |||||
| Kilroy Realty Corp. | 145 | (7,276 | ) | |||||
| UDR, Inc. | 365 | (8,523 | ) | |||||
| McGraw Hill Financial, Inc. | 119 | (9,306 | ) | |||||
| Comerica, Inc. | 220 | (10,459 | ) | |||||
| Legg Mason, Inc. | 314 | (13,653 | ) | |||||
| BB&T Corp. | 371 | (13,846 | ) | |||||
| BRE Properties, Inc. | 270 | (14,772 | ) | |||||
| CNA Financial Corp. | 377 | (16,170 | ) | |||||
| MetLife, Inc. | 327 | (17,632 | ) | |||||
| American Tower Corp. — Class A | 226 | (18,039 | ) | |||||
| E*TRADE Financial Corp.* | 930 | (18,265 | ) | |||||
| BankUnited, Inc. | 591 | (19,456 | ) | |||||
| American Campus Communities, Inc. | 610 | (19,648 | ) | |||||
| Realty Income Corp. | 528 | (19,710 | ) | |||||
| Washington Federal, Inc. | 849 | (19,774 | ) | |||||
| Boston Properties, Inc. | 207 | (20,777 | ) | |||||
| Mack-Cali Realty Corp. | 968 | (20,793 | ) | |||||
| AvalonBay Communities, Inc. | 182 | (21,517 | ) | |||||
| Lazard Ltd. — Class A | 490 | (22,207 | ) | |||||
| Eaton Vance Corp. | 528 | (22,593 | ) | |||||
| White Mountains Insurance Group Ltd. | 38 | (22,917 | ) | |||||
| Piedmont Office Realty Trust, | ||||||||
| Inc. — Class A | 1,389 | (22,946 | ) | |||||
| Alexandria Real Estate Equities, Inc. | 365 | (23,221 | ) | |||||
| See Notes to Financial St atements. | The GUGGENHEIM FUNDS annual report | 31 |
| CONSOLIDATED Schedule of Investments (continued) | December 31, 2013 |
| multi-hedge strategies fund | |
| Shares | Value | |||||||
| Arthur J Gallagher & Co. | 497 | $ | (23,324 | ) | ||||
| Brown & Brown, Inc. | 744 | (23,354 | ) | |||||
| Interactive Brokers Group, Inc. — Class A | 968 | (23,561 | ) | |||||
| First Citizens BancShares, Inc. — Class A | 107 | (23,821 | ) | |||||
| Duke Realty Corp. | 1,603 | (24,109 | ) | |||||
| CME Group, Inc. — Class A | 308 | (24,166 | ) | |||||
| Vornado Realty Trust | 277 | (24,595 | ) | |||||
| Forest City Enterprises, Inc. — Class A* | 1,289 | (24,620 | ) | |||||
| Bank of Hawaii Corp. | 421 | (24,898 | ) | |||||
| SL Green Realty Corp. | 270 | (24,943 | ) | |||||
| ProAssurance Corp. | 515 | (24,967 | ) | |||||
| Validus Holdings Ltd. | 622 | (25,060 | ) | |||||
| Commerce Bancshares, Inc. | 561 | (25,215 | ) | |||||
| Marsh & McLennan Companies, Inc. | 522 | (25,244 | ) | |||||
| Mercury General Corp. | 509 | (25,302 | ) | |||||
| Loews Corp. | 528 | (25,471 | ) | |||||
| Hartford Financial Services Group, Inc. | 704 | (25,506 | ) | |||||
| Markel Corp.* | 44 | (25,535 | ) | |||||
| MSCI, Inc. — Class A* | 586 | (25,620 | ) | |||||
| Signature Bank* | 239 | (25,673 | ) | |||||
| Jones Lang LaSalle, Inc. | 251 | (25,700 | ) | |||||
| Howard Hughes Corp.* | 214 | (25,701 | ) | |||||
| Cullen/Frost Bankers, Inc. | 346 | (25,753 | ) | |||||
| Bank of New York Mellon Corp. | 748 | (26,135 | ) | |||||
| American Express Co. | 289 | (26,221 | ) | |||||
| Northern Trust Corp. | 427 | (26,427 | ) | |||||
| United Bankshares, Inc. | 4,098 | (128,882 | ) | |||||
| KKR & Company, LP | 5,997 | (145,968 | ) | |||||
| Union First Market Bankshares Corp. | 8,379 | (207,883 | ) | |||||
| Umpqua Holdings Corp. | 15,477 | (296,230 | ) | |||||
| M&T Bank Corp. | 2,695 | (313,752 | ) | |||||
| Total Financials | (2,193,283 | ) | ||||||
| Total Common Stock Sold Short | �� | |||||||
| (Proceeds $6,320,619) | (7,109,388 | ) | ||||||
| EXCHANGE TRADED FUNDS SOLD SHORT† - (14.1)% | ||||||||
| iShares MSCI EAFE ETF | 5 | (335 | ) | |||||
| iShares MSCI Emerging Markets ETF | 24 | (1,002 | ) | |||||
| iShares MSCI Australia ETF | 128 | (3,119 | ) | |||||
| iShares MSCI Thailand Capped ETF | 50 | (3,433 | ) | |||||
| iShares MSCI Austria Capped ETF | 174 | (3,447 | ) | |||||
| iShares MSCI South Africa ETF | 54 | (3,482 | ) | |||||
| iShares MSCI France ETF | 148 | (4,211 | ) | |||||
| iShares MSCI Sweden ETF | 142 | (5,088 | ) | |||||
| iShares MSCI Italy Capped ETF | 384 | (5,987 | ) | |||||
| iShares MSCI Spain Capped ETF | 175 | (6,750 | ) | |||||
| iShares MSCI Mexico Capped ETF | 106 | (7,208 | ) | |||||
| iShares MSCI Chile Capped ETF | 157 | (7,459 | ) | |||||
| iShares MSCI Turkey ETF | 160 | (7,626 | ) | |||||
| Market Vectors Gold Miners ETF | 390 | (8,237 | ) | |||||
| iShares MSCI Singapore ETF | 659 | (8,679 | ) | |||||
| iShares JP Morgan USD Emerging | ||||||||
| Markets Bond ETF | 82 | (8,869 | ) | |||||
| iShares MSCI Belgium Capped ETF | 592 | (9,703 | ) | |||||
| iShares MSCI Germany ETF | 329 | (10,449 | ) | |||||
| iShares MSCI Malaysia ETF | 669 | (10,584 | ) | |||||
| iShares MSCI Brazil Capped ETF | 243 | (10,857 | ) | |||||
| iShares MSCI Hong Kong ETF | 711 | (14,647 | ) | |||||
| iShares MSCI Netherlands ETF | 612 | (15,869 | ) | |||||
| iShares MSCI United Kingdom ETF | 867 | (18,103 | ) | |||||
| iShares MSCI Taiwan ETF | 1,468 | (21,169 | ) | |||||
| iShares China Large-Capital ETF | 577 | (22,128 | ) | |||||
| iShares MSCI Canada ETF | 760 | (22,162 | ) | |||||
| iShares MSCI Japan ETF | 2,049 | (24,854 | ) | |||||
| iShares MSCI South Korea Capped ETF | 430 | (27,808 | ) | |||||
| Market Vectors Russia ETF | 998 | (28,812 | ) | |||||
| iShares MSCI Switzerland Capped ETF | 1,560 | (51,464 | ) | |||||
| iShares 20+ Year Treasury Bond ETF | 529 | (53,884 | ) | |||||
| Powershares QQQ Trust Series 1 | 722 | (63,507 | ) | |||||
| iShares iBoxx $ Investment Grade | ||||||||
| Corporate Bond ETF | 597 | (68,183 | ) | |||||
| iShares TIPS Bond ETF | 825 | (90,668 | ) | |||||
| iShares US Real Estate ETF | 1,605 | (101,259 | ) | |||||
| iShares Russell 1000 Value ETF | 1,313 | (123,632 | ) | |||||
| iShares Russell 2000 ETF | 1,250 | (144,138 | ) | |||||
| PowerShares Emerging Markets | ||||||||
| Sovereign Debt Portfolio | 5,623 | (151,821 | ) | |||||
| SPDR Barclays High Yield Bond ETF | 6,502 | (263,721 | ) | |||||
| iShares 7-10 Year Treasury Bond ETF | 4,119 | (408,770 | ) | |||||
| iShares Core Total US Bond Market ETF | 4,123 | (438,811 | ) | |||||
| SPDR S&P 500 ETF Trust | 5,045 | (931,644 | ) | |||||
| Total Exchange Traded Funds Sold Short | ||||||||
| (Proceeds $3,049,356) | (3,213,579 | ) | ||||||
| EXCHANGE TRADED NOTES SOLD SHORT† - (0.1)% | ||||||||
| iPath MSCI India Index ETN* | 564 | (32,126 | ) | |||||
| Total Exchange Traded Notes Sold Short | ||||||||
| (Proceeds $31,217) | (32,126 | ) | ||||||
| Total Securities Sold Short - (45.3)% | ||||||||
| (Proceeds $9,401,192) | $ | (10,355,093 | ) | |||||
| Other Assets & Liabilities, net - 57.3% | 13,072,983 | |||||||
| Total Net Assets - 100.0% | $ | 22,809,236 | ||||||
| Unrealized | ||||||||
| Contracts | Gain | |||||||
| CURRENCY FUTURES CONTRACTS PURCHASED† | ||||||||
| March 2014 British Pound | ||||||||
| Futures Contracts | ||||||||
| (Aggregate Value of | ||||||||
| Contracts $931,050) | 9 | $ | 13,722 | |||||
| March 2014 Euro FX | ||||||||
| Futures Contracts | ||||||||
| (Aggregate Value of | ||||||||
| Contracts $1,031,850) | 6 | 5,996 | ||||||
| March 2014 Swiss Franc | ||||||||
| Futures Contracts | ||||||||
| (Aggregate Value of | ||||||||
| Contracts $701,063) | 5 | 4,169 | ||||||
| (Total Aggregate Value of | ||||||||
| Contracts $2,663,963) | $ | 23,887 | ||||||
| 32 | the GUGGENHEIM FUNDS annual report | See Notes to Financial Statements. |
| CONSOLIDATED Schedule of Investments (continued) | December 31, 2013 |
| multi-hedge strategies fund |
| Unrealized | ||||||||
| Contracts | Gain (Loss) | |||||||
| COMMODITY FUTURES CONTRACTS PURCHASED† | ||||||||
| September 2014 WTI Crude | ||||||||
| Futures Contracts | ||||||||
| (Aggregate Value of | ||||||||
| Contracts $1,137,240) | 12 | $ | 20,632 | |||||
| June 2014 Live Cattle | ||||||||
| Futures Contracts | ||||||||
| (Aggregate Value of | ||||||||
| Contracts $984,200) | 19 | 19,376 | ||||||
| October 2014 Lean Hogs | ||||||||
| Futures Contracts | ||||||||
| (Aggregate Value of | ||||||||
| Contracts $1,004,700) | 30 | 17,856 | ||||||
| December 2014 Cotton #2 | ||||||||
| Futures Contracts | ||||||||
| (Aggregate Value of | ||||||||
| Contracts $1,097,880) | 28 | 16,372 | ||||||
| March 2014 Cocoa | ||||||||
| Futures Contracts | ||||||||
| (Aggregate Value of | ||||||||
| Contracts $162,420) | 6 | 12,901 | ||||||
| May 2014 Gasoline RBOB | ||||||||
| Futures Contracts | ||||||||
| (Aggregate Value of | ||||||||
| Contracts $993,586) | 8 | 2,362 | ||||||
| March 2014 Copper | ||||||||
| Futures Contracts | ||||||||
| (Aggregate Value of | ||||||||
| Contracts $84,850) | 1 | 51 | ||||||
| February 2014 New York Harbor | ||||||||
| Ultra-Low Sulfur Diesel | ||||||||
| Futures Contracts | ||||||||
| (Aggregate Value of | ||||||||
| Contracts $128,869) | 1 | 39 | ||||||
| February 2014 Gasoline RBOB | ||||||||
| Futures Contracts | ||||||||
| (Aggregate Value of | ||||||||
| Contracts $234,209) | 2 | (2,484 | ) | |||||
| March 2014 LME Zinc | ||||||||
| Futures Contracts | ||||||||
| (Aggregate Value of | ||||||||
| Contracts $154,350) | 3 | (4,511 | ) | |||||
| March 2014 LME Lead | ||||||||
| Futures Contracts | ||||||||
| (Aggregate Value of | ||||||||
| Contracts $166,414) | 3 | (5,328 | ) | |||||
| March 2014 Natural Gas | ||||||||
| Futures Contracts | ||||||||
| (Aggregate Value of | ||||||||
| Contracts $252,840) | 6 | (7,751 | ) | |||||
| December 2014 Cocoa | ||||||||
| Futures Contracts | ||||||||
| (Aggregate Value of | ||||||||
| Contracts $1,029,800) | 38 | (18,134 | ) | |||||
| November 2014 Soybean | ||||||||
| Futures Contracts | ||||||||
| (Aggregate Value of | ||||||||
| Contracts $1,075,400) | 19 | (57,779 | ) | |||||
| (Total Aggregate Value of | ||||||||
| Contracts $8,506,758) | $ | (6,398 | ) | |||||
| INTEREST RATE FUTURES CONTRACTS PURCHASED† | ||||||||
| March 2014 U.S. Treasury 10 Year Note | ||||||||
| Futures Contracts | ||||||||
| (Aggregate Value of | ||||||||
| Contracts $3,686,250) | 30 | $ | (68,950 | ) | ||||
| EQUITY FUTURES CONTRACTS PURCHASED† | ||||||||
| March 2014 S&P 500 Index Mini | ||||||||
| Futures Contracts | ||||||||
| (Aggregate Value of | ||||||||
| Contracts $3,504,075) | 38 | $ | 132,330 | |||||
| March 2014 NASDAQ-100 Index Mini | ||||||||
| Futures Contracts | ||||||||
| (Aggregate Value of | ||||||||
| Contracts $143,560) | 2 | 5,201 | ||||||
| March 2014 Dow Jones Industrial Average Index Mini | ||||||||
| Futures Contracts | ||||||||
| (Aggregate Value of | ||||||||
| Contracts $82,625) | 1 | 4,118 | ||||||
| January 2014 MSCI Taiwan Stock Index | ||||||||
| Futures Contracts†† | ||||||||
| (Aggregate Value of | ||||||||
| Contracts $122,192) | 4 | 3,938 | ||||||
| January 2014 Nikkei 225 Mini | ||||||||
| Futures Contracts†† | ||||||||
| (Aggregate Value of | ||||||||
| Contracts $46,413) | 3 | 3,071 | ||||||
| January 2014 Mini-Hang Seng Index | ||||||||
| Futures Contracts†† | ||||||||
| (Aggregate Value of | ||||||||
| Contracts $30,211) | 1 | 660 | ||||||
| January 2014 CBOE VIX Index | ||||||||
| Futures Contracts | ||||||||
| (Aggregate Value of | ||||||||
| Contracts $1,170,960) | 84 | (128,480 | ) | |||||
| April 2014 CBOE VIX Index | ||||||||
| Futures Contracts | ||||||||
| (Aggregate Value of | ||||||||
| Contracts $1,201,020) | 74 | (151,809 | ) | |||||
| (Total Aggregate Value of | ||||||||
| Contracts $6,301,056) | $ | (130,971 | ) | |||||
| EQUITY FUTURES CONTRACTS SOLD SHORT† | ||||||||
| February 2014 CBOE VIX Index | ||||||||
| Futures Contracts | ||||||||
| (Aggregate Value of | ||||||||
| Contracts $1,165,250) | 79 | $ | 196,988 | |||||
| See Notes to Financial Statements. | The GUGGENHEIM FUNDS annual report | 33 |
| CONSOLIDATED Schedule of Investments (continued) | December 31, 2013 |
| multi-hedge strategies fund |
| Unrealized | ||||||||
| Contracts | Gain (Loss) | |||||||
| March 2014 CBOE VIX Index | ||||||||
| Futures Contracts | ||||||||
| (Aggregate Value of | ||||||||
| Contracts $1,185,600) | 76 | $ | 105,332 | |||||
| May 2014 CBOE VIX Index | ||||||||
| Futures Contracts | ||||||||
| (Aggregate Value of | ||||||||
| Contracts $184,580) | 11 | 12,097 | ||||||
| March 2014 Russell 2000 Index Mini | ||||||||
| Futures Contracts | ||||||||
| (Aggregate Value of | ||||||||
| Contracts $1,624,840) | 14 | (68,654 | ) | |||||
| March 2014 S&P MidCap 400 Index Mini | ||||||||
| Futures Contracts | ||||||||
| (Aggregate Value of | ||||||||
| Contracts $1,609,080) | 12 | (69,331 | ) | |||||
| (Total Aggregate Value of | ||||||||
| Contracts $5,769,350) | $ | 176,432 | ||||||
| COMMODITY FUTURES CONTRACTS SOLD SHORT† | ||||||||
| March 2014 Corn | ||||||||
| Futures Contracts | ||||||||
| (Aggregate Value of | ||||||||
| Contracts $147,525) | 7 | $ | 40,906 | |||||
| February 2014 Gold 100 oz. | ||||||||
| Futures Contracts | ||||||||
| (Aggregate Value of | ||||||||
| Contracts $481,520) | 4 | 32,336 | ||||||
| March 2014 Soybean Oil | ||||||||
| Futures Contracts | ||||||||
| (Aggregate Value of | ||||||||
| Contracts $468,000) | 20 | 17,918 | ||||||
| May 2014 Cocoa | ||||||||
| Futures Contracts | ||||||||
| (Aggregate Value of | ||||||||
| Contracts $569,730) | 21 | 17,437 | ||||||
| March 2014 Silver | ||||||||
| Futures Contracts | ||||||||
| (Aggregate Value of | ||||||||
| Contracts $194,400) | 2 | 15,264 | ||||||
| May 2014 Wheat | ||||||||
| Futures Contracts | ||||||||
| (Aggregate Value of | ||||||||
| Contracts $183,600) | 6 | 10,805 | ||||||
| March 2014 WTI Crude | ||||||||
| Futures Contracts | ||||||||
| (Aggregate Value of | ||||||||
| Contracts $1,086,250) | 11 | 10,618 | ||||||
| September 2014 Cocoa | ||||||||
| Futures Contracts | ||||||||
| (Aggregate Value of | ||||||||
| Contracts $464,610) | 17 | 6,804 | ||||||
| March 2014 Sugar #11 | ||||||||
| Futures Contracts | ||||||||
| (Aggregate Value of | ||||||||
| Contracts $166,018) | 9 | 2,020 | ||||||
| April 2014 Gasoline RBOB | ||||||||
| Futures Contracts | ||||||||
| (Aggregate Value of | ||||||||
| Contracts $995,333) | 8 | 1,589 | ||||||
| January 2014 LME Primary Aluminum | ||||||||
| Futures Contracts | ||||||||
| (Aggregate Value of | ||||||||
| Contracts $220,200) | 5 | (438 | ) | |||||
| January 2014 LME Nickel | ||||||||
| Futures Contracts | ||||||||
| (Aggregate Value of | ||||||||
| Contracts $83,058) | 1 | (781 | ) | |||||
| June 2014 Lean Hogs | ||||||||
| Futures Contracts | ||||||||
| (Aggregate Value of | ||||||||
| Contracts $1,201,200) | 30 | (1,220 | ) | |||||
| April 2014 Live Cattle | ||||||||
| Futures Contracts | ||||||||
| (Aggregate Value of | ||||||||
| Contracts $974,160) | 18 | (3,171 | ) | |||||
| March 2014 Coffee ‘C’ | ||||||||
| Futures Contracts | ||||||||
| (Aggregate Value of | ||||||||
| Contracts $165,900) | 4 | (4,386 | ) | |||||
| July 2014 Soybean | ||||||||
| Futures Contracts | ||||||||
| (Aggregate Value of | ||||||||
| Contracts $1,008,600) | 16 | (4,516 | ) | |||||
| July 2014 Cotton #2 | ||||||||
| Futures Contracts | ||||||||
| (Aggregate Value of | ||||||||
| Contracts $1,090,830) | 26 | (18,201 | ) | |||||
| (Total Aggregate Value of | ||||||||
| Contracts $9,500,934) | $ | 122,984 | ||||||
| CURRENCY FUTURES CONTRACTS SOLD SHORT† | ||||||||
| March 2014 Japanese Yen | ||||||||
| Futures Contracts | ||||||||
| (Aggregate Value of | ||||||||
| Contracts $1,068,975) | 9 | $ | 34,304 | |||||
| March 2014 Australian Dollar | ||||||||
| Futures Contracts | ||||||||
| (Aggregate Value of | ||||||||
| Contracts $888,400) | 10 | 8,952 | ||||||
| March 2014 Canadian Dollar | ||||||||
| Futures Contracts | ||||||||
| (Aggregate Value of | ||||||||
| Contracts $563,760) | 6 | (622 | ) | |||||
| (Total Aggregate Value of | ||||||||
| Contracts $2,521,135) | $ | 42,634 | ||||||
| INTEREST RATE FUTURES CONTRACTS SOLD SHORT† | ||||||||
| March 2014 U.S. Treasury 2 Year Note | ||||||||
| Futures Contracts | ||||||||
| (Aggregate Value of | ||||||||
| Contracts $12,310,376) | 56 | $ | 20,044 | |||||
| 34 | the GUGGENHEIM FUNDS annual report | See Notes to Financial Statements. |
| CONSOLIDATED Schedule of Investments (concluded) | December 31, 2013 |
| multi-hedge strategies fund | |
| Unrealized | ||||||||
| Units | Gain (Loss) | |||||||
| EQUITY INDEX SWAP AGREEMENTS SOLD SHORT†† | ||||||||
| Goldman Sachs International | ||||||||
| January 2014 Goldman Sachs | ||||||||
| Multi-Hedge Strategies Index Swap, | ||||||||
| Terminating 01/14/145 | ||||||||
| (Notional Value $723,395) | 6,456 | $ | (20,899 | ) | ||||
| EQUITY INDEX SWAP AGREEMENTS†† | ||||||||
| Goldman Sachs International | ||||||||
| January 2014 Goldman Sachs | ||||||||
| Multi-Hedge Strategies Index Swap, | ||||||||
| Terminating 01/14/145 | ||||||||
| (Notional Value $2,293,960) | 18,458 | $ | 87,581 | |||||
| * | Non-income producing security. |
| † | Value determined based on Level 1 inputs, unless otherwise noted — See Note 4. |
| †† | Value determined based on Level 2 inputs — See Note 4. |
| 1 | All or a portion of this security is pledged as short security collateral at December 31, 2013. |
| 2 | All or portion of this security is on loan at December 31, 2013 — See Note 10. |
| 3 | Repurchase Agreements — See Note 5. |
| 4 | Securities lending collateral — See Note 10. |
| 5 | Total Return based on Goldman Sachs Multi-Hedge Strategies Index +/- financing at a variable rate. |
| 6 | Investment in a product that pays a management fee to a party related to the advisor. |
| See Notes to Financial Statements. | The GUGGENHEIM FUNDS annual report | 35 |
| multi-hedge strategies fund |
CONSOLIDATED STATEMENT OF ASSETS AND LIABILITIES |
December 31, 2013
| Assets: | ||||
| Investments, at value - including $29,440 of securities loaned | ||||
| (cost $10,778,996) | $ | 12,157,855 | ||
| Repurchase agreements, at value | ||||
| (cost $7,933,491) | 7,933,491 | |||
| Total investments | ||||
| (cost $18,712,487) | 20,091,346 | |||
| Segregated cash with broker | 12,601,660 | |||
| Unrealized appreciation on swap agreements | 87,581 | |||
| Receivables: | ||||
| Securities sold | 543,638 | |||
| Dividends | 31,782 | |||
| Variation margin | 6,973 | |||
| Fund shares sold | 1,045 | |||
| Interest | 175 | |||
| Total assets | 33,364,200 | |||
| Liabilities: | ||||
| Securities sold short, at value (proceeds $9,401,192) | 10,355,093 | |||
| Due to broker | 38,064 | |||
| Unrealized depreciation on swap agreements | 20,899 | |||
| Overdraft due to custodian bank | 13,552 | |||
| Payable for: | ||||
| Securities purchased | 46,578 | |||
| Upon return of securities loaned | 32,000 | |||
| Management fees | 21,381 | |||
| Fund shares redeemed | 2,060 | |||
| Miscellaneous | 25,337 | |||
| Total liabilities | 10,554,964 | |||
| Net assets | $ | 22,809,236 | ||
| Net assets consist of: | ||||
| Paid in capital | $ | 31,637,965 | ||
| Accumulated net investment loss | (311,811 | ) | ||
| Accumulated net realized loss on investments | (9,188,211 | ) | ||
| Net unrealized appreciation on investments | 671,293 | |||
| Net assets | $ | 22,809,236 | ||
| Capital shares outstanding | 1,002,585 | |||
| Net asset value per share | $ | 22.75 |
CONSOLIDATED STATEMENT OF OPERATIONS |
Year Ended December 31, 2013
| Investment Income: | ||||
| Dividends (net of foreign withholding tax of $497) | $ | 389,313 | ||
| Interest | 2,243 | |||
| Income from securities lending, net | 939 | |||
| Total investment income | 392,495 | |||
| Expenses: | ||||
| Management fees | 266,057 | |||
| Short sales dividend expense | 195,253 | |||
| Prime broker interest expense | 86,368 | |||
| Trustees’ fees* | 2,403 | |||
| Custodian fees | 144 | |||
| Miscellaneous | (1,502 | ) | ||
| Total expenses | 548,723 | |||
| Less: | ||||
| Expenses waived by Advisor | (14,520 | ) | ||
| Net expenses | 534,203 | |||
| Net investment loss | (141,708 | ) | ||
| Net Realized and Unrealized Gain (Loss): | ||||
| Net realized gain (loss) on: | ||||
| Investments | 2,636,052 | |||
| Swap agreements | 296,157 | |||
| Futures contracts | (59,157 | ) | ||
| Foreign currency | 62 | |||
| Securities sold short | (2,167,420 | ) | ||
| Options purchased | (760 | ) | ||
| Net realized gain | 704,934 | |||
| Net change in unrealized appreciation (depreciation) on: | ||||
| Investments | 144,881 | |||
| Securities sold short | (448,360 | ) | ||
| Swap agreements | 66,682 | |||
| Futures contracts | 7,266 | |||
| Options purchased | 310 | |||
| Foreign currency | (9 | ) | ||
| Net change in unrealized appreciation (depreciation) | (229,230 | ) | ||
| Net realized and unrealized gain | 475,704 | |||
| Net increase in net assets resulting from operations | $ | 333,996 |
* Relates to Trustees not deemed “interested persons” within the meaning of Section 2(a)(19) of the 1940 Act.
| 36 | the GUGGENHEIM FUNDS annual report | See Notes to Financial Statements. |
| multi-hedge strategies fund |
| CONSOLIDATED STATEMENTS OF CHANGES IN NET ASSETS |
| Year Ended | Year Ended | |||||||
| December 31, | December 31, | |||||||
| 2013 | 2012 | |||||||
| Increase (Decrease) In Net Assets From Operations: | ||||||||
| Net investment loss | $ | (141,708 | ) | $ | (276,763 | ) | ||
| Net realized gain (loss) on investments and foreign currency | 704,934 | (172,528 | ) | |||||
| Net change in unrealized appreciation (depreciation) on investments and foreign currency | (229,230 | ) | 809,455 | |||||
| Net increase in net assets resulting from operations | 333,996 | 360,164 | ||||||
| Distributions to shareholders from: | ||||||||
| Net investment income | — | (129,137 | ) | |||||
| Total distributions to shareholders | — | (129,137 | ) | |||||
| Capital share transactions: | ||||||||
| Proceeds from sale of shares | 13,501,356 | 17,824,650 | ||||||
| Value of proceeds from merger | — | 4,378,044 | ||||||
| Distributions reinvested | — | 129,137 | ||||||
| Cost of shares redeemed | (13,400,908 | ) | (18,796,037 | ) | ||||
| Net increase from capital share transactions | 100,448 | 3,535,794 | ||||||
| Net increase in net assets | 434,444 | 3,766,821 | ||||||
| Net assets: | ||||||||
| Beginning of year | 22,374,792 | 18,607,971 | ||||||
| End of year | $ | 22,809,236 | $ | 22,374,792 | ||||
| Accumulated net investment loss at end of year | $ | (311,811 | ) | $ | (319,958 | ) | ||
| Capital share activity: | ||||||||
| Shares sold | 596,618 | 990,880 | † | |||||
| Shares issued from reinvestment of distributions | — | 5,807 | ||||||
| Shares redeemed | (593,675 | ) | (842,713 | ) | ||||
| Net increase in shares | 2,943 | 153,974 | ||||||
† Includes 196,061 shares issued in connection with Fund merger—See Note 13.
| See Notes to Financial Statements. | The GUGGENHEIM FUNDS annual report | 37 |
| multi-hedge strategies fund |
| Consolidated FINANCIAL HIGHLIGHTS |
This table is presented to show selected data for a share outstanding throughout each period and to assist shareholders in evaluating a Fund’s performance for the periods presented.
| Year Ended | Year Ended | Year Ended | Year Ended | Year Ended | ||||||||||||||||
| December 31, | December 31, | December 31, | December 31, | December 31, | ||||||||||||||||
| 2013e | 2012e | 2011e | 2010e | 2009e | ||||||||||||||||
| Per Share Data | ||||||||||||||||||||
| Net asset value, beginning of period | $ | 22.38 | $ | 22.00 | $ | 21.30 | $ | 20.06 | $ | 20.97 | ||||||||||
| Income (loss) from investment operations: | ||||||||||||||||||||
| Net investment lossa | (.15 | ) | (.31 | ) | (.21 | ) | (.37 | ) | (.19 | ) | ||||||||||
| Net gain (loss) on investments (realized and unrealized) | .52 | .82 | .91 | 1.61 | (.50 | ) | ||||||||||||||
| Total from investment operations | .37 | .51 | .70 | 1.24 | (.69 | ) | ||||||||||||||
| Less distributions from: | ||||||||||||||||||||
| Net investment income | — | (.13 | ) | — | — | (.22 | ) | |||||||||||||
| Total distributions | — | (.13 | ) | — | — | (.22 | ) | |||||||||||||
| Net asset value, end of period | $ | 22.75 | $ | 22.38 | $ | 22.00 | $ | 21.30 | $ | 20.06 | ||||||||||
| Total Returnb | 1.65 | % | 2.23 | % | 3.38 | % | 6.18 | % | (3.28 | %) | ||||||||||
| Ratios/Supplemental Data | ||||||||||||||||||||
| Net assets, end of period (in thousands) | $ | 22,809 | $ | 22,375 | $ | 18,608 | $ | 17,637 | $ | 25,563 | ||||||||||
| Ratios to average net assets: | ||||||||||||||||||||
| Net investment loss | (0.65 | %) | (1.37 | %) | (0.96 | %) | (1.83 | %) | (0.95 | %) | ||||||||||
| Total expensesc | 2.51 | % | 2.16 | % | 2.55 | % | 3.39 | % | 1.87 | % | ||||||||||
| Net expensesd | 2.44 | % | 2.08 | % | 2.44 | % | 3.26 | % | 1.84 | % | ||||||||||
| Portfolio turnover rate | 324 | % | 461 | % | 397 | % | 845 | % | 1,074 | % | ||||||||||
| a | Net investment loss per share was computed using average shares outstanding throughout the period. |
| b | Total return does not reflect the impact of any additional fees charged by insurance companies. |
| c | Does not include expenses of the underlying funds in which the Fund invests. |
| d | Net expense information reflects the expense ratios after expense waivers, and may include interest and dividend expense. Excluding interest and dividend expense, related to short sales, operating expense ratios for the years ended December 31 would be: |
| 2013 | 2012 | 2011 | 2010 | 2009 | ||||||||||||||
| 1.15% | 1.15% | 1.17% | 1.17% | 1.15% | ||||||||||||||
| e | Consolidated. |
| 38 | the GUGGENHEIM FUNDS annual report | See Notes to Financial Statements. |
This page intentionally left blank.
| the GUGGENHEIM FUNDS annual report | 39 |
| performance report and FUND PROFILE (Unaudited) | December 31, 2013 |
COMMODITIES STRATEGY FUND
OBJECTIVE: Seeks to provide investment results that correlate, before fees and expenses, to the performance of a benchmark for commodities. The Fund’s current benchmark is the S&P GSCI™ (the “underlying index”).
For the one-year period ended December 31, 2013, the Fund returned -3.21%, compared with a return of -1.24% for its benchmark, the S&P GSCI.
Brent crude, crude oil and soybeans were the components which contributed the most to the underlying index during the year.
Corn, wheat and gold were the components which detracted the most from the underlying index during the year.
Investors confronted what many analysts termed the end of the commodities supercycle, as a 10-year rise in commodities prices reversed in 2013 on news of growing supplies and the prospect of less stimulus from the world’s major central banks. Slowing growth in developing markets contributed to lower demand.
Lower prices for precious metals and some agricultural commodities led the decline in the underlying index, as gold had its worst performance since 1980 and corn since 1970. Economists continue to grow concerned about a three-year slump in industrial metals, such as copper and aluminum. The modest performance of energy prices was one of the few commodities bright spots for the year. Only when weather turned colder late in the period did prices of some assets, such as natural gas and orange juice, jump.
Derivatives in the Fund are used to help provide exposure to the composition of the benchmark in the most efficient manner, as well as to provide liquidity.
Performance displayed represents past performance which is no guarantee of future results.
Holdings Diversification (Market Exposure as % of Net Assets)

“Holdings Diversification (Market Exposure as % of Net Assets)” excludes any temporary cash investments.
Inception Date: September 30, 2005
The Fund invests principally in derivative investments such as commodity-linked futures contracts.
| 40 | the GUGGENHEIM FUNDS annual report |
| PERFORMANCE REPORT AND FUND PROFILE (Unaudited) (concluded) |
Cumulative Fund Performance*,†

Average Annual Returns
Periods Ended December 31, 2013*,†
| Since | ||||||||||||
| Inception | ||||||||||||
| 1 Year | 5 Year | (09/30/05) | ||||||||||
| Commodities Strategy Fund | -3.21 | % | 1.43 | % | -7.57 | % | ||||||
| S&P 500 Index | 32.39 | % | 17.94 | % | 7.33 | % | ||||||
| S&P GSCI | -1.24 | % | 3.87 | % | -5.15 | % | ||||||
| * | The performance data above represents past performance that is not predictive of future results. The investment return and principal value of an investment in the Fund will fluctuate so that an investor’s shares, when redeemed, may be worth more or less than their original cost. Returns are historical and include changes in principal and reinvested dividends and capital gains and do not reflect the effect of taxes. The S&P Goldman Sachs Commodity Index and the S&P 500 Index are unmanaged indices and, unlike the Fund, have no management fees or operating expenses to reduce their reported returns. |
| † | Returns do not reflect the impact of any additional fees charged by insurance companies. |
| the GUGGENHEIM FUNDS annual report | 41 |
| CONSOLIDATED SCHEDULE OF INVESTMENTS | December 31, 2013 |
| Commodities Strategy Fund | |
| Face | ||||||||
| Amount | Value | |||||||
| FEDERAL AGENCY DISCOUNT NOTES†† - 40.5% | ||||||||
| Fannie Mae1 | ||||||||
| 0.08% due 01/02/14 | $ | 1,000,000 | $ | 1,000,000 | ||||
| Farmer Mac2 | ||||||||
| 0.03% due 01/02/14 | 1,000,000 | 999,999 | ||||||
| Federal Farm Credit Bank2 | ||||||||
| 0.03% due 01/10/14 | 500,000 | 499,996 | ||||||
| Total Federal Agency Discount Notes | ||||||||
| (Cost $2,499,993) | 2,499,995 | |||||||
| REPURCHASE AGREEMENTS††,3 - 53.4% | ||||||||
| Deutsche Bank | ||||||||
| issued 12/31/13 at 0.01% | ||||||||
| due 01/02/14 | 825,069 | 825,069 | ||||||
| HSBC Group | ||||||||
| issued 12/31/13 at 0.01% | ||||||||
| due 01/02/14 | 825,069 | 825,069 | ||||||
| Credit Suisse Group | ||||||||
| issued 12/31/13 at 0.00% | ||||||||
| due 01/02/14 | 825,069 | 825,069 | ||||||
| Mizuho Financial Group, Inc. | ||||||||
| issued 12/31/13 at 0.01% | ||||||||
| due 01/02/14 | 821,335 | 821,335 | ||||||
| Total Repurchase Agreements | ||||||||
| (Cost $3,296,542) | 3,296,542 | |||||||
| Total Investments - 93.9% | ||||||||
| (Cost $5,796,535) | $ | 5,796,537 | ||||||
| Other Assets & Liabilities, net - 6.1% | 373,553 | |||||||
| Total Net Assets - 100.0% | $ | 6,170,090 | ||||||
| Unrealized | ||||||||
| Contracts | Gain | |||||||
| COMMODITY FUTURES CONTRACTS PURCHASED† | ||||||||
| January 2014 Goldman Sachs | ||||||||
| Commodity Index | ||||||||
| Futures Contracts | ||||||||
| (Aggregate Value of | ||||||||
| Contracts $6,171,750) | 39 | $ | 17,161 | |||||
| † | Value determined based on Level 1 inputs — See Note 4. |
| †† | Value determined based on Level 2 inputs — See Note 4. |
| 1 | On September 7, 2008, the issuer was placed in conservatorship by the Federal Housing Finance Agency (FHFA). As conservator, the FHFA has full powers to control the assets and operations of the firm. |
| 2 | The issuer operates under a Congressional charter; its securities are neither issued nor guaranteed by the U.S. Government. |
| 3 | Repurchase Agreements — See Note 5. |
| 42 | The Guggenheim Funds annual REPORT | SEE NOTES TO FINANCIAL STATEMENTS. |
| COMMODITIES STRATEGY FUND |
| CONSOLIDATED STATEMENT OF |
| ASSETS AND LIABILITIES |
December 31, 2013
| Assets: | ||||
| Investments, at value | ||||
| (cost $2,499,993) | $ | 2,499,995 | ||
| Repurchase agreements, at value | ||||
| (cost $3,296,542) | 3,296,542 | |||
| Total investments | ||||
| (cost $5,796,535) | 5,796,537 | |||
| Segregated cash with broker | 420,000 | |||
| Total assets | 6,216,537 | |||
| Liabilities: | ||||
| Payable for: | ||||
| Variation margin | 22,003 | |||
| Fund shares redeemed | 6,403 | |||
| Management fees | 3,839 | |||
| Transfer agent and administrative fees | 1,280 | |||
| Investor service fees | 1,280 | |||
| Portfolio accounting fees | 512 | |||
| Miscellaneous | 11,130 | |||
| Total liabilities | 46,447 | |||
| Net assets | $ | 6,170,090 | ||
| Net assets consist of: | ||||
| Paid in capital | $ | 24,982,277 | ||
| Accumulated net investment loss | (1,734,738 | ) | ||
| Accumulated net realized loss on investments | (17,094,612 | ) | ||
| Net unrealized appreciation on investments | 17,163 | |||
| Net assets | $ | 6,170,090 | ||
| Capital shares outstanding | 568,858 | |||
| Net asset value per share | $ | 10.85 |
| CONSOLIDATED STATEMENT OF |
| OPERATIONS |
Year Ended December 31, 2013
| Investment Income: | ||||
| Interest | $ | 3,444 | ||
| Total investment income | 3,444 | |||
| Expenses: | ||||
| Management fees | 59,525 | |||
| Transfer agent and administrative fees | 17,333 | |||
| Investor service fees | 17,333 | |||
| Portfolio accounting fees | 6,933 | |||
| Professional fees | 6,408 | |||
| Trustees’ fees* | 924 | |||
| Custodian fees | 795 | |||
| Miscellaneous | 5,456 | |||
| Total expenses | 114,707 | |||
| Less: | ||||
| Expenses waived by Advisor | (7,524 | ) | ||
| Net expenses | 107,183 | |||
| Net investment loss | (103,739 | ) | ||
| Net Realized and Unrealized Gain (Loss): | ||||
| Net realized gain (loss) on: | ||||
| Futures contracts | (191,880 | ) | ||
| Net realized loss | (191,880 | ) | ||
| Net change in unrealized appreciation (depreciation) on: | ||||
| Investments | (398 | ) | ||
| Futures contracts | (118,954 | ) | ||
| Net change in unrealized appreciation (depreciation) | (119,352 | ) | ||
| Net realized and unrealized loss | (311,232 | ) | ||
| Net decrease in net assets resulting from operations | $ | (414,971 | ) |
| * | Relates to Trustees not deemed “interested persons” within the meaning of Section 2(a)(19) of the 1940 Act. |
| SEE NOTES TO FINANCIAL STATEMENTS. | THE GUGGENHEIM FUNDS ANNUAL REPORT | 43 |
| COMMODITIES STRATEGY FUND |
| CONSOLIDATED STATEMENTS OF CHANGES IN NET ASSETS |
| Year Ended | Year Ended | |||||||
| December 31, | December 31, | |||||||
| 2013 | 2012 | |||||||
| Increase (Decrease) In Net Assets From Operations: | ||||||||
| Net investment loss | $ | (103,739 | ) | $ | (140,900 | ) | ||
| Net realized loss on investments | (191,880 | ) | (285,427 | ) | ||||
| Net change in unrealized appreciation (depreciation) on investments | (119,352 | ) | 228,487 | |||||
| Net decrease in net assets resulting from operations | (414,971 | ) | (197,840 | ) | ||||
| Capital share transactions: | ||||||||
| Proceeds from sale of shares | 34,174,511 | 43,525,171 | ||||||
| Cost of shares redeemed | (35,226,952 | ) | (46,442,259 | ) | ||||
| Net decrease from capital share transactions | (1,052,441 | ) | (2,917,088 | ) | ||||
| Net decrease in net assets | (1,467,412 | ) | (3,114,928 | ) | ||||
| Net assets: | ||||||||
| Beginning of year | 7,637,502 | 10,752,430 | ||||||
| End of year | $ | 6,170,090 | $ | 7,637,502 | ||||
| Accumulated net investment loss at end of year | $ | (1,734,738 | ) | $ | (1,734,738 | ) | ||
| Capital share activity: | ||||||||
| Shares sold | 3,100,067 | 3,753,345 | ||||||
| Shares redeemed | (3,212,437 | ) | (4,018,021 | ) | ||||
| Net decrease in shares | (112,370 | ) | (264,676 | ) | ||||
| 44 | THE GUGGENHEIM FUNDS ANNUAL REPORT | SEE NOTES TO FINANCIAL STATEMENTS. |
| COMMODITIES STRATEGY FUND |
| CONSOLIDATED FINANCIAL HIGHLIGHTS |
This table is presented to show selected data for a share outstanding throughout each period and to assist shareholders in evaluating a Fund’s performance for the periods presented.
| Year Ended | Year Ended | Year Ended | Year Ended | Year Ended | ||||||||||||||||
| December 31, | December 31, | December 31, | December 31, | December 31, | ||||||||||||||||
| 2013d | 2012d | 2011d | 2010d | 2009d | ||||||||||||||||
| Per Share Data | ||||||||||||||||||||
| Net asset value, beginning of period | $ | 11.21 | $ | 11.37 | $ | 13.59 | $ | 12.58 | $ | 11.47 | ||||||||||
| Income (loss) from investment operations: | ||||||||||||||||||||
| Net investment lossa | (.16 | ) | (.17 | ) | (.22 | ) | (.17 | ) | (.13 | ) | ||||||||||
| Net gain (loss) on investments (realized and unrealized) | (.20 | ) | .01 | (.65 | ) | 1.18 | 1.45 | |||||||||||||
| Total from investment operations | (.36 | ) | (.16 | ) | (.87 | ) | 1.01 | 1.32 | ||||||||||||
| Less distributions from: | ||||||||||||||||||||
| Net investment income | — | — | (1.35 | ) | — | (.21 | ) | |||||||||||||
| Total distributions | — | — | (1.35 | ) | — | (.21 | ) | |||||||||||||
| Net asset value, end of period | $ | 10.85 | $ | 11.21 | $ | 11.37 | $ | 13.59 | $ | 12.58 | ||||||||||
| Total Returnb | (3.21 | %) | (1.41 | %) | (6.64 | %) | 8.03 | % | 11.56 | % | ||||||||||
| Ratios/Supplemental Data | ||||||||||||||||||||
| Net assets, end of period (in thousands) | $ | 6,170 | $ | 7,638 | $ | 10,752 | $ | 16,006 | $ | 21,386 | ||||||||||
| Ratios to average net assets: | ||||||||||||||||||||
| Net investment loss | (1.50 | %) | (1.46 | %) | (1.59 | %) | (1.46 | %) | (1.10 | %) | ||||||||||
| Total expenses | 1.65 | % | 1.69 | % | 1.76 | % | 1.67 | % | 1.58 | % | ||||||||||
| Net expensesc | 1.55 | % | 1.58 | % | 1.64 | % | 1.58 | % | 1.46 | % | ||||||||||
| Portfolio turnover rate | — | — | — | 69 | % | 359 | % | |||||||||||||
| a | Net investment loss per share was computed using average shares outstanding throughout the period. |
| b | Total return does not reflect the impact of any additional fees charged by insurance companies. |
| c | Net expense information reflects the expense ratios after expense waivers. |
| d | Consolidated. |
| SEE NOTES TO FINANCIAL STATEMENTS. | THE GUGGENHEIM FUNDS ANNUAL REPORT | 45 |
| CONSOLIDATED NOTES TO FINANCIAL STATEMENTS |
1. Organization, Consolidation of Subsidiary, and Significant Accounting Policies
Organization
The Rydex Variable Trust (the “Trust”), a Delaware business trust, is registered with the SEC under the Investment Company Act of 1940 (“1940 Act”) as a non-diversified, open-ended investment company and is authorized to issue an unlimited number of no par value shares. The Trust offers shares of the funds to insurance companies for their variable annuity and variable life insurance contracts.
At December 31, 2013, the Trust consisted of fifty-one separate funds. This report covers the Alternatives Funds (the “Funds”), while the other funds are contained in separate reports.
Guggenheim Investments (“GI”) provides advisory services, and Rydex Fund Services, LLC (“RFS”) provides transfer agent and administrative services and accounting services to the Trust. Guggenheim Distributors, LLC (“GDL”) acts as principal underwriter for the Trust. GI, RFS and GDL are affiliated entities.
Consolidation of Subsidiary
Each of the consolidated financial statements of the Global Managed Futures Strategy Fund, Multi-Hedge Strategies Fund and Commodities Strategy Fund include the accounts of a wholly-owned and controlled Cayman Islands subsidiary (the “Subsidiary”). Significant inter-company accounts and transactions have been eliminated in consolidation for the Funds.
Each Fund may invest up to 25% of its total assets in its Subsidiary which acts as an investment vehicle in order to effect certain investments consistent with the Fund’s investment objectives and policies.
A summary of each Fund’s investment in its respective Subsidiary is as follows:
| % of Total | ||||||||||
| Subsidiary | Net Assets of | |||||||||
| Inception | Net Assets at | the Fund at | ||||||||
| Date of | December 31, | December 31, | ||||||||
| Subsidiary | 2013 | 2013 | ||||||||
| Global Managed Futures Strategy Fund | 11/07/08 | $ | 1,233,608 | 13.4 | % | |||||
| Multi-Hedge Strategies Fund | 04/15/09 | 1,238,150 | 5.4 | % | ||||||
| Commodities Strategy Fund | 07/21/09 | 859,250 | 13.9 | % | ||||||
Significant Accounting Policies
The following significant accounting policies are in conformity with U.S. generally accepted accounting principles (“U.S. GAAP”) and are consistently followed by the Trust. This requires management to make estimates and assumptions that affect the reported amount of assets and liabilities and disclosure of contingent assets and liabilities at the date of the financial statements and the reported amounts of revenues and expenses during the reporting period. Actual results could differ from these estimates. All time references are based on Eastern Time.
A. Equity securities listed on an exchange (New York Stock Exchange (“NYSE”) or American Stock Exchange) are valued at the last quoted sales price as of the close of business on the NYSE, usually 4:00 p.m. on the valuation date. Equity securities listed on the NASDAQ market system are valued at the NASDAQ Official Closing Price on the valuation date.
Listed options held by a fund are valued at the Official Settlement Price listed by the exchange, usually as of 4:00 p.m. Long options are valued using the bid price and short options are valued using the ask price. In the event that a settlement price is not available, fair valuation is enacted. Over-the-counter options held by a fund are valued using the average bid price (for long options) or average ask price (for short options) obtained from one or more security dealers.
The value of futures contracts is accounted for using the unrealized gain or loss on the contracts that is determined by marking the contracts to their current realized settlement prices. Financial futures contracts are valued at the 4:00 p.m. price on the valuation date. In the event that the exchange for a specific futures contract closes earlier than 4:00 p.m., the futures contract is valued at the Official Settlement Price of the exchange. However, the underlying securities from which the futures contract value is derived are monitored until 4:00 p.m. to determine if fair valuation would provide a more accurate valuation.
Debt securities with a maturity of greater than 60 days at acquisition are valued at prices that reflect broker/dealer supplied valuations or are obtained from independent pricing services, which may consider the trade activity, treasury spreads, yields or price of bonds of comparable quality, coupon, maturity, and type, as well as prices quoted by dealers who make markets in such securities.
Short-term debt securities with a maturity of 60 days or less at acquisition and repurchase agreements are valued at amortized cost, which approximates market value.
Open-end investment companies (“Mutual Funds”) are valued at their net asset value per share (“NAV”) as of the close of business on the valuation date. Exchange Traded Funds (“ETFs”) and closed-end investment companies are valued at the last quoted sales price.
The value of swap agreements entered into by a Fund is accounted for using the unrealized gain or loss on the agreements that is determined by marking the agreements to the last quoted value of the index that the swap pertains to at the close of the NYSE. The swap’s market value is then adjusted to include dividends accrued, financing charges and/or interest associated with the swap agreements.
Investments for which market quotations are not readily available are fair valued as determined in good faith by GI under the
| 46 | THE GUGGENHEIM FUNDS ANNUAL REPORT |
| CONSOLIDATED NOTES TO FINANCIAL STATEMENTS (continued) |
direction of the Board of Trustees using methods established or ratified by the Board of Trustees. These methods include, but are not limited to: (i) obtaining general information as to how these securities and assets trade; (ii) in connection with futures contracts and options thereupon, and other derivative investments, obtaining information as to how (a) these contracts and other derivative investments trade in the futures or other derivative markets, respectively, and (b) the securities underlying these contracts and other derivative investments trade in the cash market; and (iii) obtaining other information and considerations, including current values in related markets.
B. Security transactions are recorded on the trade date for financial reporting purposes. Realized gains and losses from securities transactions are recorded using the identified cost basis. Proceeds from lawsuits related to investment holdings are recorded as realized gains in the respective Fund. Dividend income is recorded on the ex-dividend date, net of applicable taxes withheld by foreign countries. Taxable non-cash dividends are recorded as dividend income. Interest income, including amortization of premiums and accretion of discounts, is accrued on a daily basis. Distributions received from investments in REITs are recorded as dividend income on the ex-dividend date, subject to reclassification upon notice of the character of such distribution by the issuer.
C. Distributions of net investment income and net realized gains, if any, are declared and paid at least annually. Distributions are recorded on the ex-dividend date and are determined in accordance with income tax regulations which may differ from U.S. GAAP.
D. When a Fund engages in a short sale of a security, an amount equal to the proceeds is reflected as an asset and an equivalent liability. The amount of the liability is subsequently marked-to-market to reflect the market value of the short sale. The Fund maintains a segregated account of cash and/or securities as collateral for short sales. The Fund is exposed to market risk based on the amount, if any, that the market value of the security exceeds the market value of the securities in the segregated account.
Fees, if any, paid to brokers to borrow securities in connection with short sales are recorded as interest expense. In addition, the Fund must pay out the dividend rate of the equity or coupon rate of the treasury obligation to the lender and record this as an expense. Short dividend or interest expense is a cost associated with the investment objective of short sales transactions, rather than an operational cost associated with the day-to-day management of any mutual fund. The Funds may also receive rebate income from the broker resulting from the investment of the proceeds from securities sold short.
E. Upon the purchase of an option, the premium paid is recorded as an investment, the value of which is marked-to market daily. If a purchased option expires, the Fund realizes a loss in the amount of the cost of the option. When the Fund enters into a closing sale transaction, it realizes a gain or loss depending on whether the proceeds from the closing sale transaction are greater or less than the cost of the option. If the Fund exercises a put option, it realizes a gain or loss from the sale of the underlying security and the proceeds from such sale will be decreased by the premium originally paid. When the Fund exercises a call option, the cost of the security purchased by the Fund upon exercise increases by the premium originally paid.
F. Upon entering into a futures contract, a Fund deposits and maintains as collateral such initial margin as required by the exchange on which the transaction is affected. Pursuant to the contract, the Fund agrees to receive from or pay to the broker an amount of cash equal to the daily fluctuation in value of the contract. Such receipts or payments are known as variation margin and are recorded by the Fund as unrealized gains or losses.
When the contract is closed, the Fund records a realized gain or loss equal to the difference between the value of the contract at the time it was opened and the value at the time it was closed.
G. Swap agreements are marked-to-market daily and the change, if any, is recorded as unrealized gain or loss. Payments received or made as a result of an agreement or termination of the agreement are recognized as realized gains or losses.
H. Investment securities and other assets and liabilities denominated in foreign currencies are translated into U.S. dollar amounts at the date of valuation. Purchases and sales of investment securities and income and expense items denominated in foreign currencies are translated into U.S. dollar amounts on the respective dates of such transactions. The Funds do not isolate that portion of the results of operations resulting from changes in foreign exchange rates on investments from the fluctuations arising from changes in market prices of securities held. Such fluctuations are included with the net realized and unrealized gain and loss from investments.
Reported net realized foreign exchange gains or losses arise from sales of foreign currencies and currency gains or losses realized between the trade and settlement dates on investment transactions. Net unrealized exchange gains and losses arise from changes in the fair values of assets and liabilities other than investments in securities at the fiscal period end, resulting from changes in exchange rates.
I. Certain U.S. Government and Agency Obligations are traded on a discount basis; the interest rates shown on the Schedules of
| THE GUGGENHEIM FUNDS ANNUAL REPORT | 47 |
| CONSOLIDATED NOTES TO FINANCIAL STATEMENTS (continued) |
Investments reflect the effective rates paid at the time of purchase by the Funds. Other securities bear interest at the rates shown, payable at fixed dates through maturity.
J. The Funds may leave cash overnight in their cash account with the custodian, U.S. Bank. Periodically, a Fund may have cash due to the custodian bank as an overdraft balance. A fee is incurred on this overdraft, calculated by multiplying the overdraft by a rate based on the federal funds rate.
Segregated cash with the broker is held as collateral for short sales and investments in derivative instruments such as futures contracts or swap agreements.
K. Throughout the normal course of business, the Funds enter into contracts that contain a variety of representations and warranties which provide general indemnifications. The Funds’ maximum exposure under these arrangements is unknown, as this would involve future claims that may be made against the Funds and/or their affiliates that have not yet occurred. However, based on experience, the Funds expect the risk of loss to be remote.
2. Financial Instruments
As part of their investment strategy, the Funds utilize short sales and a variety of derivative instruments including futures, option and swap agreements. These investments involve, to varying degrees, elements of market risk and risks in excess of the amounts recognized in the Statements of Assets and Liabilities.
A short sale is a transaction in which a Fund sells a security it does not own. If the security sold short decreases in price between the time the Fund sells the security and closes its short position, that Fund will realize a gain on the transaction. Conversely, if the security increases in price during the period, that Fund will realize a loss on the transaction. The risk of such price increases is the principal risk of engaging in short sales.
An option on a security gives the purchaser of the option the right to sell, and the writer of the option the obligation to buy, the underlying security (put option) or the purchaser of the option the right to buy, and the writer of the option the obligation to sell, the underlying security (call option) at any time during the option period. The risk associated with purchasing options is limited to the premium originally paid. The risk in writing a call option is that a Fund may incur a loss if the market price of the underlying security increases and the option is exercised. The risk in writing a put option is that a Fund may incur a loss if the market price of the underlying security decreases and the option is exercised. In addition, there may be an imperfect correlation between the movement in prices of options and the underlying securities and a Fund may not be able to enter into a closing transaction because of an illiquid secondary market or, for over-the-counter options, because of the counterparty’s inability to perform.
A futures contract is an agreement to purchase (long) or sell (short) an agreed amount of securities or other instruments at a set price for delivery at a future date. There are significant risks associated with a Fund’s use of futures contracts and related options, including (i) there may be an imperfect or no correlation between the changes in market value of the underlying asset and the prices of futures contracts; (ii) there may not be a liquid secondary market for a futures contract; (iii) trading restrictions or limitations may be imposed by an exchange; and (iv) government regulations may restrict trading in futures contracts. When investing in futures, there is minimal counterparty credit risk to the Fund because futures are exchange-traded and the exchange’s clearinghouse, as counterparty to all exchange-traded futures, guarantees against default.
A swap is an agreement that obligates two parties to exchange a series of cash flows at specified intervals based upon or calculated by reference to changes in specified prices or rates for a specified amount of an underlying asset. A Fund bears the risk of loss of the amount expected to be received under a swap agreement in the event of the default or bankruptcy of a swap agreement counterparty. Additionally, there is no guarantee that a Fund or an underlying fund could eliminate its exposure under an outstanding swap agreement by entering into an offsetting swap agreement with the same or another party.
In conjunction with the use of short sales, futures, options and swap agreements, the Funds are required to maintain collateral in various forms. The Funds use, where appropriate, depending on the financial instrument utilized and the broker involved, margin deposits at the broker, cash and/or securities segregated at the custodian bank, discount notes or the repurchase agreements allocated to each Fund.
The Trust has established counterparty credit guidelines and enters into transactions only with financial institutions of investment grade or better. The Trust monitors the counterparty credit risk.
3. Fees and Other Transactions with Affiliates
Under the terms of an investment advisory contract, the Trust pays GI investment advisory fees calculated at the annualized rates below, based on the average daily net assets of the Funds for the year:
| 48 | THE GUGGENHEIM FUNDS ANNUAL REPORT |
| CONSOLIDATED NOTES TO FINANCIAL STATEMENTS (continued) |
| Management Fees | ||||
| Fund | (as a % of Net Assets) | |||
| Long Short Equity Fund | 0.90% | |||
| Global Managed Futures Strategy Fund | 0.90% | |||
| Multi-Hedge Strategies Fund | 1.15% | |||
| Commodities Strategy Fund | 0.75% | |||
GI has contractually agreed to waive the management fee it receives from each Subsidiary. This undertaking will continue in effect for so long as each Fund invests in the Subsidiary, and may not be terminated by GI unless GI obtains the prior approval of the Fund’s Board of Trustees for such termination. In any event, this undertaking will continue through April 30, 2014.
As part of its agreement with the Trust, GI will pay all expenses of the Multi-Hedge Strategies Fund, including the cost of transfer agency, custody, fund administration, legal, audit and other services, except interest expense, taxes (expected to be de minimis), brokerage commissions and other expenses connected with execution of portfolio transactions, short dividend expenses and extraordinary expenses.
RFS provides transfer agent and administrative services to the Funds for fees calculated at an annualized rate of 0.25% of the average daily net assets of each Fund. Fees related to the Multi-Hedge Strategies Fund are paid by GI, as previously noted.
Effective August 1, 2013, the transfer agent and administrative services fee has been amended to an annual percentage rate of 0.10% of the average daily net assets of the Long Short Equity and the Global Managed Futures Fund. Prior to August 1, 2013, the annual percentage rate was 0.25% of the average daily net assets of each Fund.
RFS also provides accounting services to the Funds for fees calculated at annualized rates below, based on the average daily net assets each Fund.
| Fund Accounting Fees | (as a % of Net Assets) | |||
| On the first $250 million | 0.10% | |||
| On the next $250 million | 0.075% | |||
| On the next $250 million | 0.05% | |||
| Over $750 million | 0.03% | |||
GI engages external service providers to perform other necessary services for the Trust, such as audit and accounting related services, legal services, custody, printing and mailing, etc., on a pass-through basis. Such expenses vary from Fund to Fund and are allocated to the Funds based on relative net assets. Certain expenses allocated to the Multi-Hedge Strategies Fund are paid by GI, as previously noted.
The Trust has adopted an Investor Services Plan for which GDL and other firms that provide investor services (“Service Providers”) may receive compensation. The Funds, except Multi-Hedge Strategies Fund, will pay investor service fees to GDL at an annual rate not to exceed 0.25% of average daily net assets. GDL, in turn, will compensate Service Providers for providing such services, while retaining a portion of such payments to compensate itself for investor services it performs.
Fees related to the Multi-Hedge Strategies Fund are paid by GI, as previously noted.
Certain officers and trustees of the Trust are also officers of GI, RFS and GDL.
4. Fair Value Measurement
In accordance with U.S. GAAP, fair value is defined as the price that the Fund would receive to sell an investment or pay to transfer a liability in an orderly transaction with an independent buyer in the principal market or, in the absence of a principal market, the most advantageous market for the investment or liability. A three-tier hierarchy is utilized to distinguish between (1) inputs that reflect the assumptions market participants would use in pricing an asset or liability developed based on market data obtained from sources independent of the reporting entity (observable inputs) and (2) inputs that reflect the reporting entity’s own assumptions about the assumptions market participants would use in pricing an asset or liability developed based on the best information available in the circumstances (unobservable inputs) and to establish classification of fair value measurements for disclosure purposes. Various inputs are used in determining the value of the Funds’ investments. The inputs are summarized in the three broad levels listed below:
Level 1 — quoted prices in active markets for identical securities.
Level 2 — other significant observable inputs (including quoted prices for similar securities, interest rates, prepayment speeds, credit risk, etc.).
Level 3 — significant unobservable inputs (including the fund’s own assumptions used to determine the fair value of investments).
The inputs or methodologies used for valuing securities are not necessarily an indication of the risk associated with investing in those securities.
The following table summarizes the inputs used to value the Funds’ net assets at December 31, 2013:
| THE GUGGENHEIM FUNDS ANNUAL REPORT | 49 |
| CONSOLIDATED NOTES TO FINANCIAL STATEMENTS (continued) |
| Level 1 | Level 1 | Level 2 | Level 2 | Level 3 | ||||||||||||||||||||
| Investments | Other Financial | Investments | Other Financial | Investments | ||||||||||||||||||||
| In Securities | Instruments* | In Securities | Instruments* | In Securities | Total | |||||||||||||||||||
| Assets | ||||||||||||||||||||||||
| Long Short Equity Fund | $ | 30,465,618 | $ | — | $ | 16,582,298 | $ | — | $ | — | $ | 47,047,916 | ||||||||||||
| Global Managed Futures Strategy Fund | — | 346,220 | 8,281,657 | 162,068 | — | 8,789,945 | ||||||||||||||||||
| Multi-Hedge Strategies Fund | 12,157,855 | 788,539 | 7,933,491 | 95,250 | — | 20,975,135 | ||||||||||||||||||
| Commodities Strategy Fund | — | 17,161 | 5,796,537 | — | — | 5,813,698 | ||||||||||||||||||
| Liabilities | ||||||||||||||||||||||||
| Long Short Equity Fund | $ | 9,559,823 | $ | — | $ | — | $ | — | $ | — | $ | 9,559,823 | ||||||||||||
| Global Managed Futures Strategy Fund | — | 62,162 | — | 30,338 | — | 92,500 | ||||||||||||||||||
| Multi-Hedge Strategies Fund | 10,355,093 | 616,546 | — | 20,899 | — | 10,992,538 | ||||||||||||||||||
| * | Other financial instruments may include futures contracts and/or swaps, which are reported as unrealized gain/loss at period end. |
For the year ended December 31, 2013, there were no transfers between levels.
5. Repurchase Agreements
The Funds transfer uninvested cash balances into a single joint account, the daily aggregate balance of which is invested in one or more repurchase agreements collateralized by obligations of the U.S. Treasury and U.S. Government Agencies. The collateral is in the possession of the Funds’ custodian and is evaluated to ensure that its market value exceeds, at a minimum, 102% of the original face amount of the repurchase agreements. Each Fund holds a pro rata share of the collateral based on the dollar amount of the repurchase agreement entered into by each Fund.
At December 31, 2013, the repurchase agreements in the joint account were as follows:
| Counterparty and Terms of Agreement | Face Value | Repurchase Price | Collateral | Par Value | Fair Value | |||||||||||||
| HSBC Group | U.S. Treasury Strips | |||||||||||||||||
| 0.01% | 0.00% | |||||||||||||||||
| Due 01/02/14 | $34,100,000 | $34,100,009 | 02/15/43 | $116,737,200 | $34,411,867 | |||||||||||||
| Freddie Mac | ||||||||||||||||||
| 2.00% | ||||||||||||||||||
| 04/01/23 | 370,745 | 370,158 | ||||||||||||||||
| Credit Suisse Group | U.S. Treasury Notes | |||||||||||||||||
| 0.00% | 2.13% | |||||||||||||||||
| Due 01/02/14 | 53,714,479 | 53,714,479 | 12/31/15 | 52,969,400 | 54,788,830 | |||||||||||||
| Deutsche Bank | U.S. Treasury Note | |||||||||||||||||
| 0.01% | 0.25% | |||||||||||||||||
| Due 01/02/14 | 34,100,000 | 34,100,009 | 04/15/16 | 34,954,600 | 34,782,068 | |||||||||||||
| Mizuho Financial Group, Inc. | U.S. Treasury Strips | |||||||||||||||||
| 0.01% | 0.00% | |||||||||||||||||
| Due 01/02/14 | 33,945,739 | 33,945,748 | 08/15/22 - 02/15/36 | 27,125,000 | 16,169,404 | |||||||||||||
| U.S. Treasury Notes | ||||||||||||||||||
| 1.50% - 8.00% | ||||||||||||||||||
| 12/31/18 - 05/15/22 | 15,109,500 | 18,455,296 | ||||||||||||||||
In the event of counterparty default, the Funds have the right to collect the collateral to offset losses incurred. There is potential loss to the Funds in the event the Funds are delayed or prevented from exercising their rights to dispose of the collateral securities, including the risk of a possible decline in the value of the underlying securities during the period while the Funds seek to assert their rights. The Funds’ investment advisor, acting under the supervision of the Board of Trustees, reviews the value of the collateral and the creditworthiness of those banks and dealers with which the Funds enter into repurchase agreements to evaluate potential risks.
| 50 | THE GUGGENHEIM FUNDS ANNUAL REPORT |
CONSOLIDATED NOTES TO FINANCIAL STATEMENTS (continued)
6. Derivative Investment Holdings Categorized by Risk Exposure
U.S. GAAP requires disclosures to enable investors to better understand how and why the Funds use derivative instruments, how these derivative instruments are accounted for and their effects on the Funds’ financial position and results of operations.
The following Funds utilized derivatives for the following purposes:
| Fund | Index Exposure | Liquidity | Hedging | Income | Speculation | |||||
| Long Short Equity Fund | x | x | x | |||||||
| Global Managed Futures Strategy Fund | x | x | ||||||||
| Multi-Hedge Strategies Fund | x | x | x | |||||||
| Commodities Strategy Fund | x | x |
The following table represents the notional amount of derivative instruments outstanding, as an approximate percentage of the Funds’ net assets on a daily basis.
| Approximate percentage of Fund’s | ||||||||
| net assets on a daily basis | ||||||||
| Fund | Long | Short | ||||||
| Long Short Equity Fund | — | — | ||||||
| Global Managed Futures Strategy Fund | 165 | % | 170 | % | ||||
| Multi-Hedge Strategies Fund | 105 | % | 135 | % | ||||
| Commodities Strategy Fund | 100 | % | — | |||||
The following is a summary of the location of derivative investments on the Funds’ Statements of Assets and Liabilities as of December 31, 2013:
| Derivative Investment Type | Asset Derivatives | Liability Derivatives |
| Equity/Interest Rate/Currency/Commodity contracts | Variation margin | Variation margin |
| Equity contracts | Unrealized appreciation on swap agreements | Unrealized depreciation on swap agreements |
The following table sets forth the fair value of the Funds’ derivative investments categorized by primary risk exposure at December 31, 2013:
| Asset Derivative Investments Value | ||||||||||||||||||||||||
| Futures | Swaps | Futures | Futures | Futures | Total Value at | |||||||||||||||||||
| Equity | Equity | Currency | Interest Rate | Commodity | December 31, | |||||||||||||||||||
| Fund | Contracts* | Contracts | Contracts* | Contracts* | Contracts* | 2013 | ||||||||||||||||||
| Global Managed Futures Strategy Fund | $ | 214,694 | $ | — | $ | 90,819 | $ | 28,159 | $ | 174,616 | $ | 508,208 | ||||||||||||
| Multi-Hedge Strategies Fund | 463,735 | 87,581 | 67,143 | 20,044 | 245,286 | 883,789 | ||||||||||||||||||
| Commodities Strategy Fund | — | — | — | — | 17,161 | 17,161 | ||||||||||||||||||
| Liability Derivative Investments Value | ||||||||||||||||||||||||
| Futures | Swaps | Futures | Futures | Futures | Total Value at | |||||||||||||||||||
| Equity | Equity | Currency | Interest Rate | Commodity | December 31, | |||||||||||||||||||
| Fund | Contracts* | Contracts | Contracts* | Contracts* | Contracts* | 2013 | ||||||||||||||||||
| Global Managed Futures Strategy Fund | $ | — | $ | — | $ | 6,048 | $ | 30,338 | $ | 56,114 | $ | 92,500 | ||||||||||||
| Multi-Hedge Strategies Fund | 418,274 | 20,899 | 622 | 68,950 | 128,700 | 637,445 | ||||||||||||||||||
| * | Includes cumulative appreciation (depreciation) of futures contracts as reported on the Schedules of Investments. Only current day’s variation margin is reported within the Statements of Assets and Liabilities. |
The following is a summary of the location of derivative investments on the Funds’ Statements of Operations for the year ended December 31, 2013:
| Derivative Investment Type | Location of Gain (Loss) on Derivatives | |
| Equity/Interest Rate/Currency/Commodity contracts | Net realized gain (loss) on futures contracts | |
| Net change in unrealized appreciation (depreciation) on futures contracts | ||
| Equity contracts | Net realized gain (loss) on swap agreement | |
| Net change in unrealized appreciation (depreciation) on swap agreements | ||
| Net realized gain (loss) on options purchased | ||
| Net change in appreciation (depreciation) on options purchased |
THE GUGGENHEIM FUNDS ANNUAL REPORT | 51
CONSOLIDATED NOTES TO FINANCIAL STATEMENTS (continued)
The following is a summary of the Funds’ realized gain (loss) and change in unrealized appreciation (depreciation) on derivative investments recognized on the Statements of Operations categorized by primary risk exposure for the year ended December 31, 2013:
| Realized Gain (Loss) on Derivative Investments Recognized on the Statements of Operations | ||||||||||||||||||||||||||||
| Futures | Swaps | Futures | Futures | Futures | Options | |||||||||||||||||||||||
| Equity | Equity | Currency | Interest Rate | Commodity | Purchased Equity | |||||||||||||||||||||||
| Fund | Contracts | Contracts | Contracts | Contracts | Contracts | Contracts | Total | |||||||||||||||||||||
| Long Short Equity Fund | $ | (925 | ) | $ | — | $ | — | $ | — | $ | — | $ | — | $ | (925) | |||||||||||||
| Global Managed Futures Strategy Fund | 734,753 | — | 58,323 | (299,476 | ) | (502,143 | ) | — | (8,543 | ) | ||||||||||||||||||
| Multi-Hedge Strategies Fund | 8,608 | 296,157 | 28,151 | (15,675 | ) | (80,241 | ) | (760 | ) | 236,240 | ||||||||||||||||||
| Commodities Strategy Fund | — | — | — | — | (191,880 | ) | — | (191,880 | ) | |||||||||||||||||||
| Change in Unrealized Appreciation (Depreciation) on Derivative Investments Recognized on the Statements of Operations | ||||||||||||||||||||||||||||
| Futures | Swaps | Futures | Futures | Futures | Options | |||||||||||||||||||||||
| Equity | Equity | Currency | Interest Rate | Commodity | Purchased Equity | |||||||||||||||||||||||
| Fund | Contracts | Contracts | Contracts | Contracts | Contracts | Contracts | Total | |||||||||||||||||||||
| Global Managed Futures Strategy Fund | $ | 148,504 | $ | — | $ | 46,270 | $ | (43,256 | ) | $ | 200,160 | $ | — | $ | 351,678 | |||||||||||||
| Multi-Hedge Strategies Fund | (96,140 | ) | 66,682 | 66,520 | (48,906 | ) | 85,792 | 310 | 74,258 | |||||||||||||||||||
| Commodities Strategy Fund | — | — | — | — | (118,954 | ) | — | (118,954 | ) | |||||||||||||||||||
7. Federal Income Tax Information
The Funds intend to comply with the provisions of Subchapter M of the Internal Revenue Code applicable to regulated investment companies and distribute substantially all taxable net investment income and capital gains sufficient to relieve the Funds from all, or substantially all, federal income, excise and state income taxes. Therefore, no provision for federal or state income tax is required.
Tax positions taken or expected to be taken in the course of preparing the Funds’ tax returns are evaluated to determine whether the tax positions are “more-likely-than-not” of being sustained by the applicable tax authority. Tax positions not deemed to meet the more-likely-than-not threshold would be recorded as a tax benefit or expense in the current year. Management has analyzed the Funds’ tax positions taken, or to be taken, on Federal income tax returns for all open tax years, and has concluded that no provision for income tax is required in the Funds’ financial statements. The Fund’s federal tax returns are subject to examination by the Internal Revenue Service for a period of three fiscal years after they are filed.
The Global Managed Futures Strategy Fund, the Multi-Hedge Strategies Fund and the Commodities Strategy Fund intend to invest up to 25% of their assets in the Subsidiary which is expected to provide the Funds with exposure to the commodities markets within the limitations of the federal tax requirements under Subchapter M of the Internal Revenue Code. The Global Managed Futures Strategy Fund, the Multi-Hedge Strategies Fund and the Commodities Strategy Fund have received a private letter ruling from the IRS that concludes that the income the Funds receive from the Subsidiary will constitute qualifying income for purposes of Subchapter M of the Internal Revenue Code. The Subsidiary will be classified as a corporation for U.S. federal income tax purposes. A foreign corporation, such as the Subsidiary, will generally not be subject to U.S. federal income taxation unless it is deemed to be engaged in a U.S. trade or business.
The RIC Modernization Act of 2010 was signed into law on December 22, 2010, and seeks to simplify some of the tax provisions applicable to regulated investment companies, the tax reporting to their shareholders and to improve the tax efficiency of certain fund structures. The greatest impact to the disclosure in the financial reports for the Funds was on the treatment of net capital losses, effective for tax years beginning after December 22, 2010.
One of the more prominent changes addresses capital loss carryforwards. Funds are permitted to carry forward capital losses incurred in taxable years beginning after December 22, 2010, for an unlimited period. However, any losses incurred during those future taxable years will be required to be utilized prior to the losses incurred in pre-enactment taxable years. Under pre-enactment law, capital losses could be carried forward for eight years, and carried forward as short-term capital, irrespective of the character of the original loss. As a result of this ordering rule, pre-enactment capital carryforwards may potentially expire unused. Additionally, post-enactment capital losses that are carried forward will retain their character as either short-term or long-term capital losses rather than being considered all short-term as under previous law.
52 | THE GUGGENHEIM FUNDS ANNUAL REPORT
CONSOLIDATED NOTES TO FINANCIAL STATEMENTS (continued)
Tax basis capital losses in excess of capital gains are carried forward to offset future net capital gains. For the year ended December 31, 2013, the following capital loss carryforward amounts expired, were used, or were permanently lost due to loss limitation rules in Section 382 of the Internal Revenue Code:
| Fund | Amount | |||
| Long Short Equity Fund | $ | 4,868,587 | ||
| Global Managed Futures Strategy Fund | 562,376 | |||
| Multi-Hedge Strategies Fund | 740,481 | |||
The tax character of distributions paid during the year ended December 31, 2013, was as follows:
| Ordinary | Long-Term | Total | ||||||||||
| Fund | Income | Capital Gain | Distributions | |||||||||
| Long Short Equity Fund | $ | 1,298 | $ | — | $ | 1,298 | ||||||
The tax character of distributions paid during the year ended December 31, 2012, was as follows:
| Ordinary | Long-Term | Total | ||||||||||
| Fund | Income | Capital Gain | Distributions | |||||||||
| Multi-Hedge Strategies Fund | $ | 129,137 | $ | — | $ | 129,137 | ||||||
Note: For federal income tax purposes, short-term capital gain distributions are treated as ordinary income distributions.
The tax character of distributable earnings/(accumulated losses) at December 31, 2013, was as follows:
| Undistributed | Undistributed | Net Unrealized | ||||||||||||||
| Ordinary | Long-Term | Appreciation/ | Capital Loss | |||||||||||||
| Fund | Income | Capital Gain | Depreciation | Carryforward1 | ||||||||||||
| Long Short Equity Fund | $ | — | $ | — | $ | 3,626,306 | $ | (13,080,433 | ) | |||||||
| Global Managed Futures Strategy Fund | — | — | 224,341 | (426,807 | ) | |||||||||||
| Multi-Hedge Strategies Fund | — | — | 282,104 | (9,110,834 | ) | |||||||||||
| Commodities Strategy Fund | — | — | (1,717,575 | ) | (17,094,612 | ) | ||||||||||
1 A summary of the expiration of the aforementioned Capital Loss Carryforward is as follows:
| Total | ||||||||||||||||||||||||||||||||
| Expires in | Expires in | Expires in | Expires in | Expires in | Unlimited | Capital Loss | ||||||||||||||||||||||||||
| Fund | 2014 | 2015 | 2016 | 2017 | 2018 | Short-Term | Long-Term | Carryforward | ||||||||||||||||||||||||
| Long Short Equity Fund | $ | — | $ | — | $ | (13,080,433 | ) | $ | — | $ | — | $ | — | $ | — | $ | (13,080,433 | ) | ||||||||||||||
| Global Managed Futures Strategy Fund | — | — | — | (57,408 | ) | (369,399 | ) | — | — | (426,807 | ) | |||||||||||||||||||||
| Multi-Hedge Strategies Fund | — | (1,258,216 | ) | (3,935,675 | ) | (3,551,038 | ) | (218,950 | ) | (13,773 | ) | (133,182 | ) | (9,110,834 | )* | |||||||||||||||||
| Commodities Strategy Fund | (2,783,728 | ) | — | (4,932,556 | ) | (9,377,788 | ) | — | — | (540 | ) | (17,094,612 | ) | |||||||||||||||||||
*In accordance with Section 382 of the Internal Revenue Code, a portion of certain fund losses are subject to an annual limitation. Note, this annual limitation is generally applicable to all of the capital loss carryforwards shown with respect to each Fund.
Net investment income and net realized gains (losses) may differ for financial statement and tax purposes because of temporary or permanent book/tax differences. These differences are primarily due to wash sales, and mark-to-market of passive foreign investment companies and futures contracts. Additional differences may result from the tax treatment of net investment losses and expired capital loss carryforwards. To the extent these differences are permanent, reclassifications are made to the appropriate equity accounts in the period that the differences arise. These reclassifications have no effect on net assets or NAV per share.
THE GUGGENHEIM FUNDS ANNUAL REPORT | 53
CONSOLIDATED NOTES TO FINANCIAL STATEMENTS (continued)
On the Statements of Assets and Liabilities the following adjustments were made for permanent book/tax differences:
| Undistributed | Accumulated | |||||||||||
| Paid In | Net Investment | Net Realized | ||||||||||
| Fund | Capital | Income | Gain | |||||||||
| Long Short Equity Fund | $ | (475,498 | ) | $ | 445,785 | $ | 29,713 | |||||
| Global Managed Futures Strategy Fund | (638,982 | ) | 138,434 | 500,548 | ||||||||
| Multi-Hedge Strategies Fund | (306,041 | ) | 149,855 | 156,186 | ||||||||
| Commodities Strategy Fund | (295,619 | ) | 103,739 | 191,880 | ||||||||
At December 31, 2013, the cost of securities for Federal income tax purposes, the aggregate gross unrealized gain for all securities for which there was an excess of value over tax cost and the aggregate gross unrealized loss for all securities for which there was an excess of tax cost over value, were as follows:
| Tax | Tax | Net | ||||||||||||||
| Tax | Unrealized | Unrealized | Unrealized | |||||||||||||
| Fund | Cost | Gain | Loss | Gain (Loss) | ||||||||||||
| Long Short Equity Fund | $ | 43,138,680 | $ | 3,978,525 | $ | (69,289 | ) | $ | 3,909,236 | |||||||
| Global Managed Futures Strategy Fund | 8,281,655 | 2 | — | 2 | ||||||||||||
| Multi-Hedge Strategies Fund | 19,046,269 | 1,359,983 | (314,906 | ) | 1,045,077 | |||||||||||
| Commodities Strategy Fund | 7,531,275 | — | (1,734,740 | ) | (1,734,740 | ) | ||||||||||
8. Securities Transactions
For the year ended December 31, 2013, the cost of purchases and proceeds from sales of investment securities, excluding government securities and short-term investments, were as follows:
| Fund | Purchases | Sales | ||||||
| Long Short Equity Fund | $ | 56,167,330 | $ | 53,119,779 | ||||
| Global Managed Futures Strategy Fund | — | — | ||||||
| Multi-Hedge Strategies Fund | 14,433,894 | 17,248,595 | ||||||
| Commodities Strategy Fund | — | — | ||||||
9. Line of Credit
The Trust, along with other affiliated trusts, secured an uncommitted, $75,000,000 line of credit from U.S. Bank, N.A., which expires June 15, 2014. This line of credit is reserved for emergency or temporary purposes. Borrowings, if any, under this arrangement bear interest equal to the Prime Rate, minus 2%, which shall be paid monthly, averaging 1.25% for the year ended December 31, 2013. The Funds did not have any borrowings under this agreement at December 31, 2013.
The average daily balances borrowed for the year ended December 31, 2013, was as follows:
| Fund | Average Daily Balance | |||
| Multi-Hedge Strategies Fund | $ 230 | |||
10. Portfolio Securities Loaned
The Funds may lend their securities to approved brokers to earn additional income. Security lending income shown on the Statements of Operations is shown net of rebates paid to the borrowers and earnings on cash collateral investments shared with the lending agent. Within this arrangement, the Funds act as the lender, Credit Suisse acts as the lending agent, and other approved registered broker dealers act as the borrowers. The Funds receive cash collateral, valued at 102% of the value of the securities on loan. Under the terms of the Funds’ securities lending agreement with Credit Suisse, cash collateral is invested in one or more joint repurchase agreements collateralized by obligations of the U.S. Treasury or Government Agencies and cash. The Funds bear the risk of loss on cash collateral investments. Collateral is maintained over the life of the loan in an amount not less than the value of loaned securities, as determined at the close of fund business each day; any additional collateral required due to changes in security values is delivered to the Funds the next business day. Although the collateral mitigates the risk, the Funds could experience a delay in recovering its securities and a possible loss of income or value if the borrower fails to return the securities. The Funds have the right under the securities lending agreement to recover the securities from the borrower on demand.
54 | THE GUGGENHEIM FUNDS ANNUAL REPORT
CONSOLIDATED NOTES TO FINANCIAL STATEMENTS (continued)
At December 31, 2013, the Funds participated in securities lending as follows:
| Fund | Value of Securities Loaned | Cash Collateral Received | ||||||
| Multi-Hedge Strategies Fund | $ | 29,440 | $ | 32,000 | ||||
The following represents a breakdown of the collateral for the joint repurchase agreements at December 31, 2013:
| Counterparty and Terms of Agreement | Face Value | Repurchase Price | Collateral | Par Value | Fair Value | |||||||||||||
| HSBC Securities, Inc. | Freddie Mac | |||||||||||||||||
| 0.01% | 0.00% | |||||||||||||||||
| Due 01/02/14 | $ | 27,889 | $ | 27,889 | 01/15/14 - 07/15/32 | $ | 47,262 | $ | 28,450 | |||||||||
| Deutsche Bank Securities, Inc. | Fannie Mae | |||||||||||||||||
| 0.02% | 0.00% - 1.38% | |||||||||||||||||
| Due 01/02/14 | 4,111 | 4,111 | 11/15/16 - 05/15/30 | 6,293 | 4,180 | |||||||||||||
| Federal Home Loan Bank | ||||||||||||||||||
| 0.38% | ||||||||||||||||||
| 06/24/16 | 7 | 7 | ||||||||||||||||
| Freddie Mac | ||||||||||||||||||
| 3.00% | ||||||||||||||||||
| 07/28/14 | 4 | 4 | ||||||||||||||||
11. Offsetting
In the normal course of business, the Funds enter into transactions subject to enforceable master netting arrangements or other similar arrangements. Generally, the right to offset in those agreements allows the Funds to counteract the exposure to a specific counterparty with collateral received or delivered to that counterparty based on the terms of the arrangements. These arrangements provide for the right to liquidate upon the occurrence of an event of default, credit event upon merger or additional termination event.
In order to better define their contractual rights and to secure rights that will help the Funds mitigate their counterparty risk, the Funds may enter into an International Swaps and Derivatives Association, Inc. Master Agreement (“ISDA Master Agreement”) or similar agreement with their derivative contract counterparties. An ISDA Master Agreement is a bilateral agreement between a Fund and a counterparty that governs OTC derivatives, including foreign exchange contracts, and typically contains, among other things, collateral posting terms and netting provisions in the event of a default and/or termination event. The provisions of the ISDA Master Agreement typically permit a single net payment in the event of a default (close-out netting) or similar event, including the bankruptcy or insolvency of the counterparty.
For derivatives traded under an ISDA Master Agreement, the collateral requirements are typically calculated by netting the mark to market amount for each transaction under such agreement and comparing that amount to the value of any collateral currently pledged by the Funds and the counterparty. For financial reporting purposes, cash collateral that has been pledged to cover obligations of the Funds and cash collateral received from the counterparty, if any, is reported separately on the Statement of Assets and Liabilities as segregated cash with broker/receivable for variation margin, or payable for swap settlement/variation margin. Generally, the amount of collateral due from or to a counter-party must exceed a minimum transfer amount threshold (e.g., $300,000) before a transfer is required to be made. To the extent amounts due to the Funds from their counterparties are not fully collateralized, contractually or otherwise, the Funds bear the risk of loss from counterparty nonperformance. The Funds attempt to mitigate counterparty risk by only entering into agreements with counterparties that they believe to be of good standing and by monitoring the financial stability of those counterparties.
For financial reporting purposes, the Funds do not offset derivative assets and derivative liabilities that are subject to netting arrangements in the Statement of Assets and Liabilities.
THE GUGGENHEIM FUNDS ANNUAL REPORT | 55
CONSOLIDATED NOTES TO FINANCIAL STATEMENTS (continued)
The following tables present derivative financial instruments and secured financing transactions that are subject to enforceable netting arrangements and offset in the Statements of Assets and Liabilities in conformity with U.S. GAAP.
| Gross Amounts Not Offset | ||||||||||||||||||||||||||
| in the Statements of | ||||||||||||||||||||||||||
| Assets and Liabilities | ||||||||||||||||||||||||||
| Net Amount of Assets | ||||||||||||||||||||||||||
| Gross Amounts Offset | Presented on the | Cash | ||||||||||||||||||||||||
| Gross Amounts of | in the Statements of | Statements of Assets | Financial | Collateral | Net | |||||||||||||||||||||
| Fund | Instrument | Recognized Assets1 | Assets and Liabilities | and Liabilities | Instruments | Received2 | Amount | |||||||||||||||||||
| Multi-Hedge Strategies Fund | Swap equity contracts | $ | 87,581 | $ | — | $ | 87,581 | $ | 20,899 | $ | — | $ | 66,682 | |||||||||||||
| Gross Amounts Not Offset | ||||||||||||||||||||||||||
| in the Statements of | ||||||||||||||||||||||||||
| Assets and Liabilities | ||||||||||||||||||||||||||
| Net Amount of Liabilities | ||||||||||||||||||||||||||
| Gross Amounts Offset | Presented on the | Cash | ||||||||||||||||||||||||
| Gross Amounts of | in the Statements of | Statements of Assets | Financial | Collateral | Net | |||||||||||||||||||||
| Fund | Instrument | Recognized Liabilities1 | Assets and Liabilities | and Liabilities | Instruments | Pledged2 | Amount | |||||||||||||||||||
| Multi-Hedge Strategies Fund | Swap equity contracts | $ | 20,899 | $ | — | $ | 20,899 | $ | 20,899 | $ | — | $ | — | |||||||||||||
| 1 | Exchange traded futures are excluded from these reported amounts. |
| 2 | Excludes maintenance margin deposits held at the broker related to derivatives. These amounts are reflected as Segregated cash with broker on the Statements of Assets and Liabilities. |
12. Name Change
U.S. Long Short Momentum Fund Name and Principal Investment Strategies Change
At a meeting held on August 26, 2013, the Board of Trustees (the “Board”) of Rydex Series Funds (the “Trust”) approved a new name and revised principal investment strategies for the U.S. Long Short Momentum Fund. Effective October 30, 2013, the new name of the Fund is “Long Short Equity Fund”. The changes to the Fund’s name and principal investment strategies will not result in an increase in the Fund’s fees.
13. Fund Merger
On July 13, 2012, the Multi-Hedge Strategies Fund acquired all of the net assets of Alternative Strategies Allocation Fund, a separate series of the Trust, in exchange for shares of the Multi-Hedge Strategies Fund, pursuant to an agreement and plan of reorganization approved by the Board of Trustees and approved by the shareholders of the Alternative Strategies Allocation Fund. The primary reason for the transaction was to combine a smaller fund into a larger fund with a similar investment objective. The acquisition was accomplished through a combination of a tax-free exchange of the outstanding shares of the Alternative Strategies Allocation Fund 236,140 valued at $4,378,044 for respective shares of the Multi-Hedge Strategies Fund 196,061, with the remainder coming from capital transactions. For financial reporting purposes, the net assets received and shares issued by Multi-Hedge Strategies Fund were recorded at fair value; however, the Alternative Strategies Allocation Fund’s cost of the investments were carried forward to align ongoing reporting of Multi-Hedge Strategies Fund realized and unrealized gains and losses with amounts distributable to shareholders for tax purposes.
Alternative Strategies Allocation Fund’s net assets on July 13, 2012, were $4,378,044, including $91,645 of unrealized appreciation. Alternative Strategies Allocation Fund’s net assets were primarily comprised of investments with a fair value of $7,009,565. The aggregate net assets of Multi-Hedge Strategies Fund immediately before and after the acquisition were $18,483,956 and $22,862,000, respectively.
The financial statements reflect the operations of the Multi-Hedge Strategies Fund for the period prior to the acquisition and the combined fund for the period subsequent to the fund merger. Because the combined investment portfolios have been managed as a single integrated portfolio since the acquisition was completed, it is not practicable to separate the amounts of revenue and earnings of the Alternative Strategies Allocation Fund that have been included in the combined fund’s Statement of Operations since the acquisition was completed. Assuming the acquisition had been completed on January 1, 2011, Multi-Hedge Strategies Fund pro-forma net investment loss, net gain on investments and net increase in net assets from operations for the period January 1, 2011 to December 31, 2011 would have been ($275,605), $595,571 and $319,966, respectively. Guggenheim Investments and its affiliates bore all of the expenses related to the reorganization.
56 | THE GUGGENHEIM FUNDS ANNUAL REPORT
CONSOLIDATED NOTES TO FINANCIAL STATEMENTS (continued)
14. Legal Proceedings
Tribune Company
Rydex Variable Trust has been named as a defendant in the case entitled Marc S. Kirscher, as Litigation Trustee for the Tribune Litigation Trust v. FitzSimons, No. 12-2652 (S.D.N.Y.) (formerly Official Committee of Unsecured Creditors of Tribune Co. v. FitzSimons, Adv. Pro. No. 10-54010 (Bankr. D. Del.)) (the “FitzSimons” Action), as a result of the ownership of shares in the Tribune Company (“Tribune”) in 2007 by certain series of the Rydex Variable Trust when Tribune effected a leveraged buyout transaction (“LBO”) by which Tribune converted to a privately-held company. The plaintiff has alleged that, in connection with the LBO, insiders and shareholders were paid for their Tribune stock using financing that the insiders knew would, and ultimately did, leave the Tribune insolvent. The plaintiff has asserted claims against certain insiders, shareholders, professional advisers, and others involved in the LBO, and is attempting to obtain from these individuals and entities the proceeds paid out in connection with the LBO.
Rydex Variable Trust also has been named as a defendant in one or more of a group of lawsuits filed by a group of Tribune creditors that allege state law constructive fraudulent conveyance claims against former Tribune shareholders (the “SLCFC actions”).
The FitzSimons action and the SLCFC actions have been consolidated with the majority of the other Tribune LBO-related lawsuits in a multidistrict litigation proceeding captioned In re Tribune Company Fraudulent Conveyance Litig., No. 11-md-2696 (S.D.N.Y.) (the “MDL Proceeding”). On November 6, 2012, the defendants moved to dismiss the SLCFC actions. On December 21, 2012, the plaintiffs filed a memorandum in opposition to the motion to dismiss. On February 4, 2013, the defendants filed a reply in support of the motion to dismiss. The Court has not yet issued a decision on the motion.
On September 23, 2013, the District Court granted the defendants’ omnibus motion to dismiss the SLCFC actions, on the basis that the creditors lacked standing. On September 30, 2013, the creditors filed a notice of appeal of the September 23 order. On October 28, 2013, the defendants filed a joint notice of cross-appeal of that same order.
On November 20, 2013, the District Court ordered the parties in the FitzSimons action to meet and confer regarding a potential protocol for the briefing and argument of motions to dismiss to be filed in that action. On January 24, 2014, the Court extended the time for service of summonses and complaints in the FitzSimons action to February 28, 2014.
None of these lawsuits allege any wrongdoing on the part of Rydex Variable Trust. The following series of Rydex Variable Trust held shares of Tribune and tendered these shares as part of Tribune’s LBO: Nova Fund, S&P 500 2x Strategy Fund, Multi-Cap Core Equity Fund, S&P 500 Pure Value Fund, Hedged Equity Fund and Multi-Hedge Strategies Fund (the “Funds”). The value of the proceeds received by the foregoing Funds was $12,580, $2,380, $1,360, $148,376, $2,720, and $119,034, respectively. At this stage of the proceedings, Rydex Variable Trust is not able to make a reliable predication as to the outcome of these lawsuits or the effect, if any, on a Fund’s net asset value.
Lyondell Chemical Company
In December 2011, Rydex Variable Trust was named as a defendant in Weisfelner, as Trustee of the LB Creditor Trust, v. Fund 1 (In re Lyondell Chemical Co.), Adv. Pro. No. 10-4609 (Bankr. S.D.N.Y.).
Similar to the claims made in the Tribune matter, the Weisfelner complaint seeks to have set aside and recovered as fraudulent transfers from former Lyondell Chemical Company (“Lyondell”) shareholders the consideration paid to them pursuant to the cash out merger of Lyondell shareholders in connection with the combination of Lyondell and Basell AF in 2007. Lyondell filed for bankruptcy in 2008.
On January 14, 2014, the Court granted in part and denied in part the defendants’ motion to dismiss the Creditor Trust action. In particular, the Court dismissed all defendants who were conduits for the proceeds from the merger transaction, and also ruled that the plaintiff could not bring any claims on behalf of certain entities who had ratified the merger transaction. The Court also dismissed without prejudice the plaintiff’s claims for intentional fraudulent transfer against the remaining defendants, and gave the Credit Trustee leave to replead these claims. Finally, the Court denied the motion to dismiss with respect to the plaintiff’s claims for constructive fraudulent transfer against the remaining defendants.
THE GUGGENHEIM FUNDS ANNUAL REPORT | 57
CONSOLIDATED NOTES TO FINANCIAL STATEMENTS (concluded)
This lawsuit does not allege any wrongdoing on the part of Rydex Variable Trust. The following series of Rydex Variable Trust received cash proceeds from the cash out merger in the following amounts: Basic Materials Fund - $1,235,952; U.S. Long Short Momentum Fund - $523,200; Multi-Cap Core Equity Fund - $5,760; Hedged Equity Fund - $480; and Multi-Hedge Strategies Fund - $112,848. At this stage of the proceedings, Rydex Variable Trust is not able to make a reliable predication as to the outcome of these lawsuits or the effect, if any, on a Fund’s net asset value.
58 | THE GUGGENHEIM FUNDS ANNUAL REPORT
REPORT OF INDEPENDENT REGISTERED PUBLIC ACCOUNTING FIRM
To the Board of Trustees and Shareholders
of Rydex Variable Trust:
We have audited the accompanying statement of assets and liabilities, including the schedules of investments, of Long Short Equity Fund, Global Managed Futures Strategy Fund (consolidated), Multi-Hedge Strategies Fund (consolidated) and Commodities Strategy Fund (consolidated) (four of the series constituting the Rydex Variable Trust) (the “Funds”) as of December 31, 2013, and the related statements of operations for the year then ended, the statements of changes in net assets for each of the two years in the period then ended, and the financial highlights for each of the five years in the period then ended. These financial statements and financial highlights are the responsibility of the Funds’ management. Our responsibility is to express an opinion on these financial statements and financial highlights based on our audits.
We conducted our audits in accordance with the standards of the Public Company Accounting Oversight Board (United States). Those standards require that we plan and perform the audit to obtain reasonable assurance about whether the financial statements and financial highlights are free of material misstatement. We were not engaged to perform an audit of the Funds’ internal control over financial reporting. Our audits included consideration of internal control over financial reporting as a basis for designing audit procedures that are appropriate in the circumstances, but not for the purpose of expressing an opinion on the effectiveness of the Funds’ internal control over financial reporting. Accordingly, we express no such opinion. An audit also includes examining, on a test basis, evidence supporting the amounts and disclosures in the financial statements and financial highlights, assessing the accounting principles used and significant estimates made by management, and evaluating the overall financial statement presentation. Our procedures included confirmation of securities owned as of December 31, 2013, by correspondence with the custodian and brokers or by other appropriate auditing procedures where replies from brokers were not received. We believe that our audits provide a reasonable basis for our opinion.
In our opinion, the financial statements and financial highlights referred to above present fairly, in all material respects, the financial position of the above listed Funds at December 31, 2013, the results of their operations for the year then ended, the changes in their net assets for each of the two years in the period then ended, and their financial highlights for each of the five years in the period then ended, in conformity with U.S. generally accepted accounting principles.

McLean, Virginia
February 27, 2014
THE GUGGENHEIM FUNDS ANNUAL REPORT | 59
OTHER INFORMATION (Unaudited)
Tax Information
This information is being provided as required by the Internal Revenue Code. Amounts shown may differ from those elsewhere in the report because of differences in tax and financial reporting practice.
Of the ordinary income distributions paid during the year, the following funds had the corresponding percentages qualify for the dividends received deduction for corporations:
| Fund | % Qualifying | |||
| Long Short Equity Fund | 100 | % | ||
Proxy Voting Information
A description of the policies and procedures that the Trust uses to determine how to vote proxies relating to securities held in the Funds’ portfolios is available, without charge and upon request, by calling 1.800.820.0888. This information is also available from the EDGAR database on the SEC’s website at http://www.sec.gov.
Information regarding how the Funds voted proxies relating to portfolio securities during the most recent 12-month period ended June 30 is available without charge, upon request, by calling 1.800.820.0888. This information is also available from the EDGAR database on the SEC’s website at http://www.sec.gov.
Quarterly Portfolio Schedules Information
The Trust files its complete schedule of portfolio holdings with the SEC for the first and third quarters of each fiscal year on Form N-Q; which are available on the SEC’s website at http://www.sec.gov. The Funds’ Forms N-Q may be reviewed and copied at the SEC’s Public Reference Room in Washington, DC, and that information on the operation of the Public Reference Room may be obtained by calling 1-800-SEC-0330. Copies of the portfolio holdings are also available to shareholders, without charge and upon request, by calling 1.800.820.0888.
Office Locations
The offices of Guggenheim Investments can be found in the following locations:
330 Madison Avenue
10th Floor
New York, NY 10017
(Headquarters)
Four Irvington Centre
805 King Farm Boulevard
Suite 600
Rockville, MD 20850
9401 Indian Creek Parkway
40 Corporate Woods
Suite 850
Overland Park, KS 66210
60 | THE GUGGENHEIM FUNDS ANNUAL REPORT
| INFORMATION ON BOARD OF TRUSTEES AND OFFICERS (Unaudited) |
A Board of Trustees oversees the Trust, as well as other trusts of GI, in which its members have no stated term of service, and continue to serve after election until resignation. The Statement of Additional Information includes further information about Fund Trustees and Officers, and can be obtained without charge by calling 800.820.0888.
All Trustees and Officers may be reached c/o Guggenheim Investments, 805 King Farm Boulevard, Suite 600, Rockville, MD 20850.
| TRUSTEE AND OFFICER | ||||
| Name and | Length of Service as Trustee | Number of Funds | ||
| Year of Birth | (Year Began) | Overseen | ||
| Donald C. Cacciapaglia* | Rydex Series Funds – 2012 | 213 | ||
| (1951) | Rydex Variable Trust – 2012 | |||
| Rydex Dynamic Funds – 2012 | ||||
| Rydex ETF Trust – 2012 |
Principal Occupations During Past Five Years: Current: Security Investors, LLC: President and CEO from April 2012 to present; Guggenheim Investments: President and Chief Administrative Officer from February 2010 to present; Previous: Channel Capital Group, Inc.: Chairman and CEO from April 2002 to February 2010
Positions held within the Trust: Trustee from 2012 to present; President from 2012 to present
| INDEPENDENT TRUSTEES | ||||
| Name and | Length of Service as Trustee | Number of Funds | ||
| Year of Birth | (Year Began) | Overseen | ||
| Corey A. Colehour | Rydex Series Funds – 1993 | 132 | ||
| (1945) | Rydex Variable Trust – 1998 | |||
| Rydex Dynamic Funds – 1999 | ||||
| Rydex ETF Trust – 2003 |
Principal Occupations During Past Five Years: Current: Retired; Previous: President and Senior Vice President of Schield Management Company (registered investment adviser) from 2003 to 2006
Positions held within the Trust: Trustee from 1993 to present; Member of the Audit and Governance and Nominating Committees from 1995 to present
| J. Kenneth Dalton | Rydex Series Funds – 1995 | 132 | ||
| (1941) | Rydex Variable Trust – 1998 | |||
| Rydex Dynamic Funds – 1999 | ||||
| Rydex ETF Trust – 2003 |
Principal Occupations During Past Five Years: Current: Retired
Positions held within the Trust: Trustee from 1995 to present; Member and Chairman of the Audit Committee from 1997 to present; Member of the Governance and Nominating Committees from 1995 to present; and Member of the Risk Oversight Committee from 2010 to present
| John O. Demaret | Rydex Series Funds – 1997 | 132 | ||
| (1940) | Rydex Variable Trust – 1998 | |||
| Rydex Dynamic Funds – 1999 | ||||
| Rydex ETF Trust – 2003 |
Principal Occupations During Past Five Years: Current: Retired
Positions held within the Trust: Trustee from 1997 to present; Chairman of the Board from 2006 to present; Member of the Audit Committee from 1997 to present; and Member of the Risk Oversight Committee from 2010 to present
| the GUGGENHEIM FUNDS annual report | 61 |
| INFORMATION ON BOARD OF TRUSTEES AND OFFICERS (Unaudited) (continued) |
| INDEPENDENT TRUSTEES – continued | ||||
| Name and | Length of Service as Trustee | Number of Funds | ||
| Year of Birth | (Year Began) | Overseen | ||
| Werner E. Keller | Rydex Series Funds – 2005 | 132 | ||
| (1940) | Rydex Variable Trust – 2005 | |||
| Rydex Dynamic Funds – 2005 | ||||
| Rydex ETF Trust – 2005 | ||||
Principal Occupations During Past Five Years: Current: Founder and President of Keller Partners, LLC (investment research firm) from 2005 to present; Previous: Retired from 2001 to 2005
Positions held within the Trust: Vice Chairman of the Board of Trustees from 2010 to present; Trustee and Member of the Audit and Governance and Nominating Committees from 2005 to present; and Chairman and Member of the Risk Oversight Committee from 2010 to present
| Thomas F. Lydon, Jr. | Rydex Series Funds – 2005 | 132 | ||
| (1960) | Rydex Variable Trust – 2005 | |||
| Rydex Dynamic Funds – 2005 | ||||
| Rydex ETF Trust – 2005 |
Principal Occupations During Past Five Years: Current: President of Global Trends Investments (registered investment adviser) from 1996 to present
Positions held within the Trust: Trustee and Member of the Audit and Governance and Nominating Committees from 2005 to present
| Patrick T. McCarville | Rydex Series Funds – 1997 | 132 | ||
| (1942) | Rydex Variable Trust – 1998 | |||
| Rydex Dynamic Funds – 1999 | ||||
| Rydex ETF Trust – 2003 |
Principal Occupations During Past Five Years: Current: Retired; Previous: Chief Executive Officer of Par Industries, Inc., d/b/a Par Leasing from 1977 to 2010
Positions held within the Trust: Trustee from 1997 to present; Member of the Audit Committee from 1997 to present; and Chairman of the Governance and Nominating Committees from 1997 to present
| Roger Somers | Rydex Series Funds – 1993 | 132 | ||
| (1944) | Rydex Variable Trust – 1998 | |||
| Rydex Dynamic Funds – 1999 | ||||
| Rydex ETF Trust – 2003 |
Principal Occupations During Past Five Years: Current: Founder and Chief Executive Officer of Arrow Limousine from 1965 to present
Positions held within the Trust: Trustee from 1993 to present; Member of the Audit and Governance and Nominating Committees from 1995 to present
EXECUTIVE OFFICERS
| Name, Position and | Principal Occupations | |||
| Year of Birth | During Past Five Years | |||
| Michael P. Byrum* Vice President (1970) | Current: President, Security Benefit Asset Management Holdings, LLC; Senior Vice President, Security Investors, LLC; President & Chief Investment Officer, Rydex Holdings, LLC; Director & Chairman of the Board, Advisor Research Center, Inc.; and Manager, Rydex Specialized Products, LLC | |||
| Previous: Guggenheim Distributors, LLC (f/k/a Rydex Distributors, LLC), Vice President (2009); Rydex Fund Services, LLC, Director (2009–2010), Secretary (2002–2010); Rydex Advisors, LLC (f/k/a PADCO Advisors, Inc.), Director (2008–2010), Chief Investment Officer (2006–2010), President (2004–2010), Secretary (2002–2010); Rydex Advisors II, LLC (f/k/a PADCO Advisors II, Inc.), Director (2008–2010), Chief Investment Officer (2006–2010), President (2004–2010), Secretary (2002–2010); Advisor Research Center, Inc., Secretary (2006–2009), and Executive Vice President (2006) | ||||
| 62 | the GUGGENHEIM FUNDS annual report |
| INFORMATION ON BOARD OF TRUSTEES AND OFFICERS (Unaudited) (concluded) |
EXECUTIVE OFFICERS – concluded
| Name, Position and | Principal Occupations | |||
| Year of Birth | During Past Five Years | |||
| Nikolaos Bonos* Vice President and Treasurer (1963) | Current: Senior Vice President, Security Investors, LLC; Chief Executive Officer & Manager, Rydex Specialized Products, LLC; Chief Executive Officer & President, Rydex Fund Services, LLC; Vice President, Rydex Holdings, LLC; Treasurer, SBL Fund; Security Equity Fund; Security Income Fund; Security Large Cap Value Fund & Security Mid Cap Growth Fund; and Vice President, Security Benefit Asset Management Holdings, LLC | |||
| Previous: Security Global Investors, LLC, Senior Vice President (2010–2011); Rydex Advisors, LLC (f/k/a PADCO Advisors, Inc.) Senior Vice President (2006–2011); Rydex Fund Services, LLC (f/k/a Rydex Fund Services, Inc.), Director (2009); and Rydex Specialized Products, LLC, Chief Financial Officer (2005–2009) | ||||
| Elisabeth Miller* Chief Compliance Officer (1968) | Current: Chief Compliance Officer, Rydex Series Funds, Rydex Dynamic Funds, Rydex Variable Trust, Rydex ETF Trust, Security Equity Fund, Security Income Fund, Security Large Cap Value Fund, Security Mid Cap Growth Fund, SBL Fund, Security Investors, LLC, and Guggenheim Distributors, LLC | |||
| Previous: Senior Manager, Security Investors, LLC and Guggenheim Distributors, LLC (2004–2009) | ||||
| Amy J. Lee* Vice President and | Current: Secretary and Senior Vice President, Security Investors, LLC (2004– present) | |||
| Secretary (1961) | Previous: Vice President, Associate General Counsel and Assistant Secretary, Security Benefit Life Insurance Company and Security Benefit Corporation (2004–2012) | |||
Joseph M. Arruda* Assistant Treasurer (1966) | Current: Assistant Treasurer, SBL Fund, Security Equity Fund, Security Income Fund, Security Large Cap Value Fund & Security Mid Cap Growth Fund; Vice President, Security Investors, LLC; and Chief Financial Officer & Manager, Rydex Specialized Products, LLC | |||
| Previous: Security Global Investors, LLC, Vice President (2010–2011); and Rydex Advisors, LLC (f/k/a PADCO Advisors, Inc.) & Rydex Advisors II, LLC (f/k/a PADCO Advisors II, Inc.), Vice President (2004–2011) | ||||
| * | Officers of the Funds are deemed to be “interested persons” of the Trust, within the meaning of Section 2(a)(19) of the 1940 Act, inasmuch as this person is affiliated with Guggenheim Investments. |
| the GUGGENHEIM FUNDS annual report | 63 |
| GUGGENHEIM INVESTMENTS PRIVACY POLICIES (Unaudited) |
Rydex Funds, Guggenheim Funds, Rydex Investments, Guggenheim Distributors, LLC, Security Investors, LLC, Security Distributors, Inc. and Rydex Advisory Services (Collectively “Guggenheim Investments”).
Our Commitment to You
When you become a Guggenheim Investments investor, you entrust us with not only your hard-earned money but also with personal and financial information about you. We recognize that your relationship with us is based on trust and that you expect us to act responsibly and in your best interests. Because we have access to this private information about you, we hold ourselves to the highest standards in its safekeeping and use. This means, most importantly, that we do not sell client information to anyone—whether it is your personal information or if you are a current or former Guggenheim Investments client.
The Information We Collect About You
In the course of doing business with shareholders and investors, we collect nonpublic personal information about you. You typically provide personal information when you complete a Guggenheim Investments account application or when you request a transaction that involves Rydex and Guggenheim Investments funds or one of the Guggenheim Investments affiliated companies. “Nonpublic personal information” is personally identifiable private information about you. For example, it includes information regarding your name and address, Social Security or taxpayer identification number, assets, income, account balance, bank account information and investment activity (e.g., purchase and redemption history).
How We Handle Your Personal Information
As emphasized above, we do not sell information about current or former clients or their accounts to third parties. Nor do we share such information, except when necessary to complete transactions at your request or to make you aware of related investment products and services that we offer. Additional details about how we handle your personal information are provided below. To complete certain transactions or account changes that you direct, it may be necessary to provide identifying information to companies, individuals or groups that are not affiliated with Guggenheim Investments. For example, if you ask to transfer assets from another financial institution to Guggenheim Investments, we will need to provide certain information about you to that company to complete the transaction. To alert you to other Guggenheim Investments investment products and services, we may share your information within the Guggenheim Investments family of affiliated companies. This would include, for example, sharing your information within Guggenheim Investments so we can make you aware of new Rydex and Guggenheim Investments funds or the services offered through another Guggenheim Investments affiliated company. In certain instances, we may contract with nonaffiliated companies to perform services for us. Where necessary, we will disclose information we have about you to these third parties. In all such cases, we provide the third party with only the information necessary to carry out its assigned responsibilities and only for that purpose. And we require these third parties to treat your private information with the same high degree of confidentiality that we do. In certain instances, we may share information with other financial institutions regarding individuals and entities in response to the U.S.A. Patriot Act. Finally, we will release information about you if you direct us to do so, if we are compelled by law to do so or in other circumstances permitted by law.
Opt Out Provisions
We do not sell your personal information to anyone. The law allows you to “opt out” of only certain kinds of information sharing with third parties. The firm does not share personal information about you with any third parties that triggers this opt-out right. This means YOU ARE ALREADY OPTED OUT.
How We Protect Privacy Online
Our concern for the privacy of our shareholders also extends to those who use our web site, guggenheiminvestments.com. Our web site uses some of the most secure forms of online communication available, including encryption technology, Secure Socket Layer (SSL) protocol, firewalls and user names and passwords. These technologies provide a high level of security and privacy when you access your account information or initiate online transactions. The Guggenheim Investments web site offers customized features that require our use of “http cookies”—tiny pieces of information that we ask your browser to store. However, we make very limited use of these cookies. We only use cookies for session management and security features on the Guggenheim Investments web site. We do not use them to pull data from your hard drive, to learn your email address, or to view data in cookies created by other web sites. We will not share the information in our cookies or give others access to it. See the legal information area on our web site for more details about web site security and privacy features.
| 64 | the GUGGENHEIM FUNDS annual report |
| GUGGENHEIM INVESTMENTS PRIVACY POLICIES (Unaudited) (concluded) |
How We Safeguard Your Personal Information
We restrict access to nonpublic personal information about shareholders to our employees and in some cases to third parties (for example, the service providers described above) as permitted by law. We maintain strict physical, electronic and procedural safeguards that comply with federal standards to guard your nonpublic personal information.
We’ll Keep You Informed
As required by federal law, we will notify shareholders of our privacy policy annually. We reserve the right to modify this policy at any time, but rest assured that if we do change it, we will tell you promptly. You will also be able to access our privacy policy from our web site at guggenheiminvestments.com. Should you have any questions regarding our privacy policy, contact us at 800.820.0888 or 301.296.5100.
| the GUGGENHEIM FUNDS annual report | 65 |
| This page intentionally left blank. |
| This page intentionally left blank. |
| This page intentionally left blank. |
| This page intentionally left blank. |
Item 2. Code of Ethics.
The registrant’s Board of Trustees has adopted a code of ethics that applies to the registrant’s principal executive officer and principal financial officer. No substantive amendments were approved or waivers were granted to the Code during the period covered by this report. The Code is filed as an exhibit to this Form N-CSR.
Item 3. Audit Committee Financial Expert.
The registrant's Board of Trustees has determined that Werner Keller, an "independent" Trustee serving on the registrant's audit committee, is an "audit committee financial expert," as defined in Item 3 of Form N-CSR. Under applicable securities laws, a person who is determined to be an audit committee financial expert will not be deemed an "expert" for any purpose, including without limitation for the purposes of Section 11 of the Securities Act of 1933, as a result of being designated or identified as an audit committee financial expert. The designation or identification of a person as an audit committee financial expert does not impose on such person any duties, obligations, or liabilities that are greater than the duties, obligations, and liabilities imposed on such person as a member of the audit committee and Board of Trustees in the absence of such designation or identification.
Item 4. Principal Accountant Fees and Services.
(a) Audit Fees. The aggregate Audit Fees billed by the registrant’s principal accountant, for the audit of the annual financial statements in connection with statutory and regulatory filings for the fiscal years ended December 31, 2013 and December 31, 2012 were $743,330 and $821,880, respectively.
(b) Audit-Related Fees. The aggregate Audit Related Fees billed by the registrant’s principal accountant for the fiscal years ended December 31, 2013 and December 31, 2012 were $0 and $0, respectively.
The aggregate fees billed in the Reporting Periods for assurance and related services by the Auditor to the Registrant’s investment adviser (not including any sub-investment adviser whose role is primarily portfolio management and is subcontracted with or overseen by another investment adviser), and any entity controlling, controlled by or under common control with the investment adviser that provides ongoing services to the Registrant (“Service Affiliates”) which required pre-approval by the Audit Committee which related to the review of the transfer agent function for the fiscal years ended December 31, 2013 and December 31, 2012 were $35,000 and $35,000, respectively.
(c) Tax Fees. The aggregate Tax Fees billed by the registrant’s principal accountant for professional services rendered for tax compliance, tax advice, and tax planning, including preparation of tax returns and distribution assistance, for the fiscal years ended December 31, 2013 and December 31, 2012 were $220,941 and $0, respectively.
(d) All Other Fees. The aggregate All Other Fees billed by the registrant’s principal accountant for products and services provided by the Auditor, other than the services reported in paragraphs (a) through (c) of this Item, for the fiscal years ended December 31, 2013 and December 31, 2012 were $0 and $0, respectively.
(e) Audit Committee Pre-Approval Policies and Procedures. The audit committee has adopted a policy whereby audit and non-audit services performed by the registrant’s principal accountant for the registrant, its investment advisor, and any entity controlling, controlled by, or under common control with the investment advisor that provides ongoing services to the registrant require pre-approval in advance at regularly scheduled audit committee meetings. If such service is required between regularly scheduled audit committee meetings, the chairman of the audit committee, J. Kenneth Dalton, is authorized to pre-approve the service with full committee approval at the next scheduled meeting. There shall be no waivers of the pre-approval process. No services described in (b)-(d) above were approved pursuant to paragraph (c)(7)(i)(C) of Rule 2-01 of Regulation S-X.
(f) Not applicable.
(g) Non-Audit Fees. The aggregate non-audit fees billed by the registrant’s accountant for the most recent fiscal year and the preceding fiscal year for services rendered to the registrant, the investment advisor, and any entity controlling, controlled by, or under common control with the advisor that provides ongoing services to the registrant were $255,941 and $35,000, respectively. These aggregate fees were less than the aggregate fees billed for the same periods by the registrant’s principal accountant for audit services rendered to the registrant, the investment advisor, and any entity controlling, controlled by, or under common control with the advisor that provides ongoing services to the registrant.
(h) Auditor Independence. All non-audit services rendered in (g) above were pre-approved by the registrant’s audit committee. As such, the audit committee has considered these services in maintaining the principal accountant’s independence.
Item 5. Audit Committee of Listed Registrants.
Not applicable.
Item 6. Investments
Schedule of Investments is included as part of the report to shareholders filed under Item 1 of this form.
Item 7. Disclosure of Proxy Voting Policies and Procedures for Closed-End Management Investment Companies.
Not applicable.
Item 8. Portfolio Managers of Closed-End Management Investment Companies.
Not applicable.
Item 9. Purchases of Equity Securities by Closed-End Management Investment Company and Affiliated Purchasers.
Not applicable.
Item 10. Submission of Matters to a Vote of Security Holders.
Not applicable.
Item 11. Controls and Procedures.
(a) The registrant’s President (principal executive officer) and Treasurer (principal financial officer) have evaluated the registrant’s disclosure controls and procedures within 90 days of this filing and have concluded that the registrant’s disclosure controls and procedures were effective as of that date in ensuring that information required to be disclosed by the registrant in this Form N-CSR was recorded, processed, summarized, and reported timely.
(b) The registrant’s principal executive officer and principal financial officer are aware of no change in the registrant’s internal control over financial reporting that occurred during the registrant’s second fiscal quarter covered by this report that has materially affected, or is reasonably likely to materially affect, the registrant’s internal control over financial reporting.
Item 12. Exhibits.
(a)(1) The registrant’s code of ethics pursuant to Item 2 of Form N-CSR is attached.
(a)(2) Separate certifications by the President (principal executive officer) and Treasurer (principal financial officer) of the registrant as required by Rule 30a-2(a) under the Act (17 CFR 270.30a-2(a)) are attached.
(b) A certification by the registrant’s President (principal executive officer) and Treasurer (principal financial officer) as required by Rule 30a-2(b) under the Act (17 CFR 270.30a-2(b)) is attached.
SIGNATURES
Pursuant to the requirements of the Securities Exchange Act of 1934 and the Investment Company Act of 1940, the registrant has duly caused this report to be signed on its behalf by the undersigned, thereunto duly authorized.
(Registrant) Rydex Variable Trust
By (Signature and Title)* /s/ Donald C. Cacciapaglia
Donald C. Cacciapaglia, President
Date March 10, 2014
Pursuant to the requirements of the Securities Exchange Act of 1934 and the Investment Company Act of 1940, this report has been signed below by the following persons on behalf of the registrant and in the capacities and on the dates indicated.
By (Signature and Title)* /s/ Donald C. Cacciapaglia
Donald C. Cacciapaglia, President
Date March 10, 2014
By (Signature and Title)* /s/ Nikolaos Bonos
Nikolaos Bonos, Vice President and Treasurer
Date March 10, 2014
* Print the name and title of each signing officer under his or her signature.