UNITED STATES
SECURITIES AND EXCHANGE COMMISSION
Washington, D.C. 20549
FORM N-CSR
CERTIFIED SHAREHOLDER REPORT OF REGISTERED
MANAGEMENT INVESTMENT COMPANIES
Investment Company Act file number 811- 08821
| Rydex Variable Trust |
(Exact name of registrant as specified in charter)
805 King Farm Boulevard, Suite 600 Rockville, Maryland 20850 |
(Address of principal executive offices) (Zip code)
Richard M. Goldman Rydex Variable Trust 805 King Farm Boulevard, Suite 600 Rockville, Maryland 20850 |
(Name and address of agent for service)
Registrant’s telephone number, including area code: 1-301-296-5100
Date of fiscal year end: December 31
Date of reporting period: December 31, 2011
Form N-CSR is to be used by management investment companies to file reports with the Commission not later than 10 days after the transmission to stockholders of any report that is required to be transmitted to stockholders under Rule 30e-1 under the Investment Company Act of 1940 (17 CFR 270.30e-1). The Commission may use the information provided on Form N-CSR in its regulatory, disclosure review, inspection, and policymaking roles.
A registrant is required to disclose the information specified by Form N-CSR, and the Commission will make this information public. A registrant is not required to respond to the collection of information contained in Form N-CSR unless the Form displays a currently valid Office of Management and Budget (“OMB”) control number. Please direct comments concerning the accuracy of the information collection burden estimate and any suggestions for reducing the burden to Secretary, Securities and Exchange Commission, 450 Fifth Street, NW, Washington, DC 20549-0609. The OMB has reviewed this collection of information under the clearance requirements of 44 U.S.C. § 3507.
| Item 1. | Reports to Stockholders. |
DOMESTIC EQUITY FUNDS
NOVA FUND
INVERSE S&P 500 STRATEGY FUND
NASDAQ-100® FUND
INVERSE NASDAQ-100® STRATEGY FUND
S&P 500 2x STRATEGY FUND
NASDAQ-100® 2x STRATEGY FUND
MID-CAP 1.5x STRATEGY FUND
INVERSE MID-CAP STRATEGY FUND
RUSSELL 2000® 2x STRATEGY FUND
RUSSELL 2000® 1.5x STRATEGY FUND
INVERSE RUSSELL 2000® STRATEGY FUND
DOW 2x STRATEGY FUND
INVERSE DOW 2x STRATEGY FUND
S&P 500 PURE GROWTH FUND
S&P 500 PURE VALUE FUND
S&P MIDCAP 400 PURE GROWTH FUND
S&P MIDCAP 400 PURE VALUE FUND
S&P SMALLCAP 600 PURE GROWTH FUND
S&P SMALLCAP 600 PURE VALUE FUND
INTERNATIONAL EQUITY FUNDS
EUROPE 1.25x STRATEGY FUND
JAPAN 2x STRATEGY FUND
SPECIALTY FUNDS
STRENGTHENING DOLLAR 2x STRATEGY FUND
WEAKENING DOLLAR 2x STRATEGY FUND
REAL ESTATE FUND
FIXED INCOME FUNDS
GOVERNMENT LONG BOND 1.2x STRATEGY FUND
INVERSE GOVERNMENT LONG BOND STRATEGY FUND
MONEY MARKET FUND
U.S. GOVERNMENT MONEY MARKET FUND
This report and the financial statements contained herein are submitted for the general information of our shareholders. The report is not authorized for distribution to prospective investors unless preceded or accompanied by an effective prospectus.
Distributed by Rydex Distributors, LLC.
| 2 | ||||
| 4 | ||||
| 5 | ||||
| 8 | ||||
| 20 | ||||
| 26 | ||||
| 34 | ||||
| 40 | ||||
| 52 | ||||
| 60 | ||||
| 70 | ||||
| 76 | ||||
| 102 | ||||
| 128 | ||||
| 134 | ||||
| 142 | ||||
| 148 | ||||
| 156 | ||||
| 164 | ||||
| 172 | ||||
| 180 | ||||
| 188 | ||||
| 196 | ||||
| 204 | ||||
| 210 | ||||
| 216 | ||||
| 222 | ||||
| 230 | ||||
| 236 | ||||
| 242 | ||||
| 248 | ||||
| 263 | ||||
| 264 | ||||
| 269 | ||||
| 273 | ||||
THE RYDEX FUNDSANNUALREPORT | 1
To Our Shareholders:
Financial markets endured a lot of turbulence in 2011, due to a variety of events: concerns about debt in the eurozone and in the U.S., which lost its triple-A credit rating, a tsunami-induced Japanese nuclear-plant disaster that disrupted automobile production around the globe, Mideast social unrest that led to a jump in oil prices and weak growth in many of the world’s developed economies. Reflecting the volatility in the stock market was the S&P 500 Index*, which finished the year up about 2%, but only after an 8% rise in the first few months of 2011, then a bearish 19% drop by early October, followed by a 12% fourth-quarter rebound spurred by improved economic data.
The U.S. Federal Reserve was a major factor in the markets for most of 2011, from its winding down of a second asset-purchase program (quantitative easing) in June to August’s “operation twist,” which shifted $400 billion in holdings from short-term to long-term Treasuries. The Fed said it would keep short-term interest rates near zero at least until mid-2013, and late in the year, some analysts were speculating that a third round of quantitative easing might be needed in 2012 to boost subpar growth.
While late-year improvements in economic measures may have dampened concern that the U.S. could slip back into recession, Europe’s recession fears were rising, as high unemployment and austerity measures weighed on weaker members of the euro zone, and threatened the economic engines of Germany and France. The Stoxx Europe 600 Index* was down about 11% for the year, with most individual country indices posting declines in double digits. Many investors continued to brace for a solution to Greece’s debt situation that would prevent financial problems from spreading to other weak countries or to banks, and stabilize the sliding euro, the year’s worst-performing major currency.
Even though they were not at the eye of the sovereign debt storm, many emerging market economies performed poorly in 2011, with those having the strongest links to the eurozone suffering the most. The MSCI Emerging Markets Index* was off by almost 20%, despite pockets of growth. China is facing slowing industrial production, sliding property values and the potential for a hard landing of the economy if housing and banks collapse.
While the market forces play out, many investors have been driven to the sidelines or to safe havens. Gold reached a record high of near $1,900 an ounce in August amid the U.S. debt downgrade, but then lost ground to the rising dollar amid continuing debate over Europe’s debt woes. Still, gold added 10% for the year, while the dollar ended the year within about 3% from where it began against the currencies of most major markets, including the euro, the pound, Canadian dollar and Swiss franc.
Sluggish economic data, concern over European financial weakness and the Fed’s policy efforts also drove investors into U.S. government debt over the course of 2011, despite the country’s lowered credit rating. The 30% total return of the Barclays Capital Long U.S. Treasury Index* made it one of the best-performing of the year, and it gave a lift to indices for corporate bonds, high yield bonds and municipals, which all grew by mid-to-high single digits.
The U.S. economy had momentum heading into 2012, as data showed the world’s largest economy to be maintaining a sustainable, if modest, expansion. Consumer confidence was improving, employment rising and monetary policy remained accommodative. We finished 2011 on a positive note, especially when compared to other countries, and so far continue to be insulated from the worst aspects of the economic troubles in Europe and China.
2 | THE RYDEX FUNDSANNUALREPORT
LETTER TO OUR SHAREHOLDERS (concluded)
We look forward to continuing our service to you. Thank you for investing in our funds.
Sincerely,

Michael Byrum
President and Chief Investment Officer
| * | Indices are defined as follows: |
S&P 500® Index is a capitalization-weighted index covering 500 industrial, utility, transportation and financial companies of the U.S. markets (mostly NYSE Euronext issues).
The STOXX Europe 600 Index is derived from the STOXX Europe Total Market Index (TMI) and is a subset of the STOXX Global 1800 Index. With a fixed number of 600 components, the STOXX Europe 600 Index represents large-, mid- and small-capitalization companies across 18 countries of the European region: Austria, Belgium, Denmark, Finland, France, Germany, Greece, Iceland, Ireland, Italy, Luxembourg, the Netherlands, Norway, Portugal, Spain, Sweden, Switzerland and the United Kingdom.
The Barclays Capital Long U.S. Treasury Index includes publicly issued U.S. Treasury securities that have a remaining maturity of 10 or more years, are rated investment grade, and have $250 million or more of outstanding face value. In addition, the securities must be denominated in U.S. dollars and must be fixed rate and non convertible. Excluded from the Long U.S. Treasury Index are certain special issues, such as flower bonds, TINs, state and local government series bonds, TIPS, and coupon issues that have been stripped from bonds included in the index. The Long U.S. Treasury Index is market capitalization weighted and the securities in the index are updated on the last business day of each month.
MSCI Emerging Markets Index is a free float-adjusted market capitalization index that is designed to measure equity market performance in the global emerging markets.
Performance displayed represents past performance which is no guarantee of future results. Of course, fund performance is subject to daily market volatility and may be better or worse since the end of the last quarter. For up-to-date fund performance, call us at 800.820.0888 or visit www.rydex-sgi.com.
Read each fund’s prospectus and summary prospectus (if available) carefully before investing. It contains the fund’s investment objectives, risks, charges, expenses and other information, which should be considered carefully before investing. Obtain a prospectus and summary prospectus (if available) at www.rydex-sgi.com or call 800.820.0888.
The referenced fund(s) are distributed by Rydex Distributors, LLC (RDL). Guggenheim Investments represents the investment management businesses of Guggenheim Partners, LLC, which includes Security Investors, LLC (d.b.a., Security Global Investors and Rydex Investments), the investment advisor to the referenced fund(s). Rydex Distributors, LLC is affiliated with Guggenheim Partners, LLC and Security Investors, LLC.
THE RYDEX FUNDSANNUALREPORT | 3
A BRIEF NOTE ON THE COMPOUNDING OF RETURNS (Unaudited)
Many of the Funds described in this report are benchmarked daily to leveraged and/or inverse leveraged versions of published indices. To properly evaluate the performance of these funds, it is essential to understand the effect of mathematical compounding on their respective returns.
Because of the nonlinear effects of leverage applied over time, it is possible for a fund to perform in line with its benchmark for several individual periods in a row, yet seem to trail the benchmark over the entire period. It is also possible that a fund that performs in-line with its benchmark on a daily basis may seem to outperform its benchmark over longer periods.
An Example of Compounding
For example, consider a hypothetical fund that is designed to produce returns that correspond to 150% of an index. On the first day of a period, the index rises from a level of 100 to a level of 106, producing a 6.0% gain and an expectation that the fund will rise by 9.0%. On the same day, the fund’s net asset value (“NAV”) increases from $10.00 to $10.90 for a gain of 9.0% — in line with its benchmark.
On day two, assume the index falls from 106 to 99 for a loss of about 6.6%. The fund, as expected, falls 9.9% to a price of $9.82. On each day, the fund performed exactly in line with its benchmark, but for the two-day period, the fund was down 1.8%, while the index was down only 1.0%. Without taking into account the daily compounding of returns, one would expect the fund to lose 1.5% and would see the fund as trailing by 0.3% when in fact it had performed perfectly. This example is summarized in the table below.
| Index Level | Index Performance | Fund Expectation | Fund NAV | Fund Performance | Assessment | |||||||||||||||||
Start | 100 | $ | 10.00 | |||||||||||||||||||
Day 1 | 106 | 6.0 | % | 9.0 | % | $ | 10.90 | 9.0 | % | In line | ||||||||||||
Day 2 | 99 | -6.6 | % | -9.9 | % | $ | 9.82 | -9.9 | % | In line | ||||||||||||
Cumulative | -1.0 | % | -1.5 | % | -1.8 | % | -0.3% | |||||||||||||||
As illustrated by this simple example, the effect of leverage can make it difficult to form expectations or judgments about fund performance given only the returns of the unleveraged index.
Because certain funds seek to track the performance of their benchmark on a daily basis, mathematical compounding, especially with respect to those funds that use leverage as part of their investment strategy, may prevent a fund from correlating with the monthly, quarterly, annual or other period performance of its benchmark. Due to the compounding of daily returns, leveraged and inverse funds’ returns over periods other than one day will likely differ in amount and possibly direction from the benchmark return for the same period. Investors should monitor their leveraged and inverse funds’ holdings consistent with their strategies, as frequently as daily. For those funds that consistently apply leverage, the value of the fund’s shares will tend to increase or decrease more than the value of any increase or decrease in its benchmark index. For more on correlation, leverage and other risks, please read the prospectus.
In general, any change in direction in an index will produce compounding that seems to work against an investor. Were the index to move in the same direction (either up or down) for two or more periods in a row, the compounding of those returns would work in an investor’s favor, causing the fund to seemingly beat its benchmark.
As a general rule of thumb, more leverage in a fund will magnify the compounding effect, while less leverage will generally produce results that are more in line with expectations. In addition, periods of high volatility in an underlying index will also cause the effects of compounding to be more pronounced, while lower volatility will produce a more muted effect.
4 | THE RYDEX FUNDSANNUALREPORT
ABOUT SHAREHOLDERS’ FUND EXPENSES (Unaudited)
December 31, 2011
All mutual funds have operating expenses and it is important for our shareholders to understand the impact of costs on their investments. Shareholders of a Fund incur two types of costs: (i) transaction costs, including sales charges (loads) on purchase payments, reinvested dividends, or other distributions; and exchange fees; and (ii) ongoing costs, including management fees, administrative services, and shareholder reports, among others. These ongoing costs, or operating expenses, are deducted from a fund’s gross income and reduce the investment return of the fund.
A fund’s expenses are expressed as a percentage of its average net assets, which is known as the expense ratio. The following examples are intended to help investors understand the ongoing costs (in dollars) of investing in a Fund and to compare these costs with the ongoing costs of investing in other mutual funds.
The examples are based on an investment of $1,000 made at the beginning of the period and held for the entire six-month period beginning June 30, 2011 and ending December 31, 2011.
The following tables illustrate a Fund’s costs in two ways:
Table 1. Based on actual Fund return. This section helps investors estimate the actual expenses paid over the period. The “Ending Account Value” shown is derived from the Fund’s actual return, and the fourth column shows the dollar amount that would have been paid by an investor who started with $1,000 in the Fund. Investors may use the information here, together with the amount invested, to estimate the expenses paid over the period. Simply divide the Fund’s account value by $1,000 (for example, an $8,600 account value divided by $1,000 = 8.6 ), then multiply the result by the number provided under the heading “Expenses Paid During Period.”
Table 2. Based on hypothetical 5% return. This section is intended to help investors compare a Fund’s cost with those of other mutual funds. The table provides information about hypothetical account values and hypothetical expenses based on the Fund’s actual expense ratio and an assumed rate of return of 5% per year before expenses, which is not the Fund’s actual return. The hypothetical account values and expenses may not be used to estimate the actual ending account balance or expenses paid during the period. The example is useful in making comparisons because the U.S. Securities and Exchange Commission (the “SEC”) requires all mutual funds to calculate expenses based on the 5% return. Investors can assess a Fund’s costs by comparing this hypothetical example with the hypothetical examples that appear in shareholder reports of other funds.
The calculations illustrated above assume no shares were bought or sold during the period. Actual costs may have been higher or lower, depending on the amount of investment and the timing of any purchases or redemptions.
Please note that the expenses shown in the table are meant to highlight your ongoing costs only and do not reflect any transactional costs, such as sales charges (loads) on purchase payments, and contingent deferred sales charges (“CDSC”) on redemptions, if any. Therefore, the second table is useful in comparing ongoing costs only, and will not help you determine the relative total costs of owning different funds. In addition, if these transactional costs were included, your costs would have been higher.
More information about a Fund’s expenses, including annual expense ratios for the past five years, can be found in the Financial Highlights section of this report. For additional information on operating expenses and other shareholder costs, please refer to the appropriate Fund prospectus.
THE RYDEX FUNDSANNUALREPORT | 5
ABOUT SHAREHOLDERS’ FUND EXPENSES (Unaudited) (continued)
| Expense Ratio1 | Fund Return | Beginning Account Value June 30, 2011 | Ending Account Value December 31, 2011 | Expenses Paid During Period2 | ||||||||||||||||
Table 1. Based on actual Fund return3 | ||||||||||||||||||||
Nova Fund | 1.57 | % | (8.26 | )% | $ | 1,000.00 | $ | 917.40 | $ | 7.59 | ||||||||||
Inverse S&P 500 Strategy Fund | 1.72 | % | (1.87 | )% | 1,000.00 | 981.30 | 8.59 | |||||||||||||
NASDAQ-100® Fund | 1.60 | % | (2.18 | )% | 1,000.00 | 978.20 | 7.98 | |||||||||||||
Inverse NASDAQ-100® Strategy Fund | 1.75 | % | (3.72 | )% | 1,000.00 | 962.80 | 8.66 | |||||||||||||
S&P 500 2x Strategy Fund | 1.72 | % | (12.83 | )% | 1,000.00 | 871.70 | 8.11 | |||||||||||||
NASDAQ-100® 2x Strategy Fund | 1.75 | % | (8.15 | )% | 1,000.00 | 918.50 | 8.46 | |||||||||||||
Mid-Cap 1.5x Strategy Fund | 1.72 | % | (16.89 | )% | 1,000.00 | 831.10 | 7.94 | |||||||||||||
Inverse Mid-Cap Strategy Fund | 1.72 | % | 2.04 | % | 1,000.00 | 1,020.40 | 8.76 | |||||||||||||
Russell 2000® 2x Strategy Fund | 1.82 | % | (27.01 | )% | 1,000.00 | 729.90 | 7.94 | |||||||||||||
Russell 2000® 1.5x Strategy Fund | 1.81 | % | (18.67 | )% | 1,000.00 | 813.30 | 8.27 | |||||||||||||
Inverse Russell 2000® Strategy Fund | 1.83 | % | 0.05 | % | 1,000.00 | 1,000.50 | 9.23 | |||||||||||||
Dow 2x Strategy Fund | 1.75 | % | (5.59 | )% | 1,000.00 | 944.10 | 8.58 | |||||||||||||
Inverse Dow 2x Strategy Fund | 1.74 | % | (11.09 | )% | 1,000.00 | 889.10 | 8.29 | |||||||||||||
S&P 500 Pure Growth Fund | 1.57 | % | (9.51 | )% | 1,000.00 | 904.90 | 7.54 | |||||||||||||
S&P 500 Pure Value Fund | 1.57 | % | (11.19 | )% | 1,000.00 | 888.10 | 7.47 | |||||||||||||
S&P MidCap 400 Pure Growth Fund | 1.57 | % | (11.58 | )% | 1,000.00 | 884.20 | 7.46 | |||||||||||||
S&P MidCap 400 Pure Value Fund | 1.57 | % | (9.72 | )% | 1,000.00 | 902.80 | 7.53 | |||||||||||||
S&P SmallCap 600 Pure Growth Fund | 1.57 | % | (5.96 | )% | 1,000.00 | 940.40 | 7.68 | |||||||||||||
S&P SmallCap 600 Pure Value Fund | 1.57 | % | (9.32 | )% | 1,000.00 | 906.80 | 7.55 | |||||||||||||
Europe 1.25x Strategy Fund | 1.74 | % | (23.74 | )% | 1,000.00 | 762.60 | 7.73 | |||||||||||||
Japan 2x Strategy Fund | 1.56 | % | (23.19 | )% | 1,000.00 | 768.10 | 6.95 | |||||||||||||
Strengthening Dollar 2x Strategy Fund | 1.75 | % | 11.33 | % | 1,000.00 | 1,113.30 | 9.32 | |||||||||||||
Weakening Dollar 2x Strategy Fund | 1.74 | % | (14.25 | )% | 1,000.00 | 857.50 | 8.15 | |||||||||||||
Real Estate Fund | 1.66 | % | (6.39 | )% | 1,000.00 | 936.10 | 8.10 | |||||||||||||
Government Long Bond 1.2x Strategy Fund | 1.27 | % | 40.28 | % | 1,000.00 | 1,402.80 | 7.69 | |||||||||||||
Inverse Government Long Bond Strategy Fund | 4.34 | % | (28.21 | )% | 1,000.00 | 717.90 | 18.79 | |||||||||||||
U.S. Government Money Market Fund | 0.07 | % | 0.00 | % | 1,000.00 | 1,000.00 | 0.35 | |||||||||||||
6 | THE RYDEX FUNDSANNUALREPORT
ABOUT SHAREHOLDERS’ FUND EXPENSES (Unaudited) (concluded)
| Expense Ratio1 | Fund Return | Beginning Account Value June 30, 2011 | Ending Account Value December 31, 2011 | Expenses Paid During Period2 | ||||||||||||||||
Table 2. Based on hypothetical 5% return (before expenses) | ||||||||||||||||||||
Nova Fund | 1.57 | % | 5.00 | % | $ | 1,000.00 | $ | 1,017.29 | $ | 7.98 | ||||||||||
Inverse S&P 500 Strategy Fund | 1.72 | % | 5.00 | % | 1,000.00 | 1,016.53 | 8.74 | |||||||||||||
NASDAQ-100® Fund | 1.60 | % | 5.00 | % | 1,000.00 | 1,017.14 | 8.13 | |||||||||||||
Inverse NASDAQ-100® Strategy Fund | 1.75 | % | 5.00 | % | 1,000.00 | 1,016.38 | 8.89 | |||||||||||||
S&P 500 2x Strategy Fund | 1.72 | % | 5.00 | % | 1,000.00 | 1,016.53 | 8.74 | |||||||||||||
NASDAQ-100® 2x Strategy Fund | 1.75 | % | 5.00 | % | 1,000.00 | 1,016.38 | 8.89 | |||||||||||||
Mid-Cap 1.5x Strategy Fund | 1.72 | % | 5.00 | % | 1,000.00 | 1,016.53 | 8.74 | |||||||||||||
Inverse Mid-Cap Strategy Fund | 1.72 | % | 5.00 | % | 1,000.00 | 1,016.53 | 8.74 | |||||||||||||
Russell 2000® 2x Strategy Fund | 1.82 | % | 5.00 | % | 1,000.00 | 1,016.03 | 9.25 | |||||||||||||
Russell 2000® 1.5x Strategy Fund | 1.81 | % | 5.00 | % | 1,000.00 | 1,016.08 | 9.20 | |||||||||||||
Inverse Russell 2000® Strategy Fund | 1.83 | % | 5.00 | % | 1,000.00 | 1,015.98 | 9.30 | |||||||||||||
Dow 2x Strategy Fund | 1.75 | % | 5.00 | % | 1,000.00 | 1,016.38 | 8.89 | |||||||||||||
Inverse Dow 2x Strategy Fund | 1.74 | % | 5.00 | % | 1,000.00 | 1,016.43 | 8.84 | |||||||||||||
S&P 500 Pure Growth Fund | 1.57 | % | 5.00 | % | 1,000.00 | 1,017.29 | 7.98 | |||||||||||||
S&P 500 Pure Value Fund | 1.57 | % | 5.00 | % | 1,000.00 | 1,017.29 | 7.98 | |||||||||||||
S&P MidCap 400 Pure Growth Fund | 1.57 | % | 5.00 | % | 1,000.00 | 1,017.29 | 7.98 | |||||||||||||
S&P MidCap 400 Pure Value Fund | 1.57 | % | 5.00 | % | 1,000.00 | 1,017.29 | 7.98 | |||||||||||||
S&P SmallCap 600 Pure Growth Fund | 1.57 | % | 5.00 | % | 1,000.00 | 1,017.29 | 7.98 | |||||||||||||
S&P SmallCap 600 Pure Value Fund | 1.57 | % | 5.00 | % | 1,000.00 | 1,017.29 | 7.98 | |||||||||||||
Europe 1.25x Strategy Fund | 1.74 | % | 5.00 | % | 1,000.00 | 1,016.43 | 8.84 | |||||||||||||
Japan 2x Strategy Fund | 1.56 | % | 5.00 | % | 1,000.00 | 1,017.34 | 7.93 | |||||||||||||
Strengthening Dollar 2x Strategy Fund | 1.75 | % | 5.00 | % | 1,000.00 | 1,016.38 | 8.89 | |||||||||||||
Weakening Dollar 2x Strategy Fund | 1.74 | % | 5.00 | % | 1,000.00 | 1,016.43 | 8.84 | |||||||||||||
Real Estate Fund | 1.66 | % | 5.00 | % | 1,000.00 | 1,016.84 | 8.44 | |||||||||||||
Government Long Bond 1.2x Strategy Fund | 1.27 | % | 5.00 | % | 1,000.00 | 1,018.80 | 6.46 | |||||||||||||
Inverse Government Long Bond Strategy Fund | 4.34 | % | 5.00 | % | 1,000.00 | 1,003.33 | 21.91 | |||||||||||||
U.S. Government Money Market Fund | 0.07 | % | 5.00 | % | 1,000.00 | 1,024.85 | 0.36 | |||||||||||||
| 1 | This ratio represents annualized Total Expenses, which include interest and dividend expense from securities sold short. Excluding short interest expense, the operating expense ratio of the Inverse Government Long Bond Strategy Fund would be 2.63% lower. |
| 2 | Expenses are equal to the Fund’s annualized expense ratio, net of any applicable fee waivers, multiplied by the average account value over the period, multiplied by 184/365 (to reflect the one-half year period). Expenses shown do not include fees charged by insurance companies. |
| 3 | Actual cumulative return at net asset value for the period June 30, 2011 to December 31, 2011. |
THE RYDEX FUNDSANNUALREPORT | 7
| PERFORMANCE REPORT AND FUND PROFILE (Unaudited) | December 31, 2011 |
OBJECTIVE: Seeks to provide investment results that match, before fees and expenses, the performance of a specific benchmark on a daily basis. The Fund’s current benchmark is 150% of the performance of the S&P 500® Index (the “underlying index”). The Fund does not seek to achieve its investment objective over a period of time greater than one day.
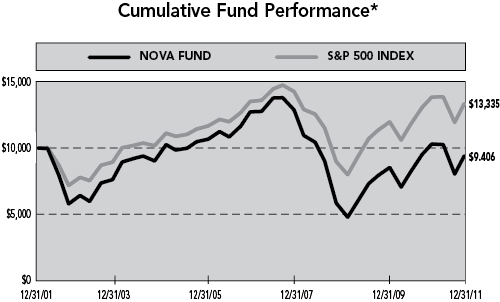
For the year ended December 31, 2011, Nova Fund maintained a daily correlation of over 99% to its benchmark of 150% of the daily price movement of the S&P 500 Index. Nova Fund returned -1.17%, while the S&P 500 Index gained 2.11% over the same time period.
Sectors contributing most to performance of the index were Consumer Staples, Health Care and Utilities. Financials was the largest detractor from performance, followed by Materials and Industrials.
Apple, Inc., Exxon Mobile Corp. and International Business Machines Corp. contributed the most performance to the index for 2011. Bank of America Corp., Citigroup, Inc. and Goldman Sachs Group, Inc. detracted from performance for the year.
Derivatives in the Fund were used to help provide exposure to the composition of the benchmark in the highest efficient manner and to provide leverage, not for hedging purposes.
Due to the compounding of daily returns, leveraged and inverse funds’ returns over periods other than one day will likely differ in amount and possibly direction from the benchmark return for the same period. Investors should monitor their leveraged and inverse funds’ holdings to ensure that they are consistent with their strategies, as frequently as daily.
The effects of compounding may cause the longer-term correlation of the fund to its benchmark to diminish. The apparent discrepancy between the leveraged and unleveraged indices is the result of compounding, which is described briefly on page 4 of this report.
Standard & Poor’s 500 Index (S&P 500®) – a capitalization-weighted index covering 500 industrial, utility, transportation and financial companies of the U.S. markets (mostly NYSE Euronext issues).
Holdings Diversification (Market Exposure as % of Net Assets)
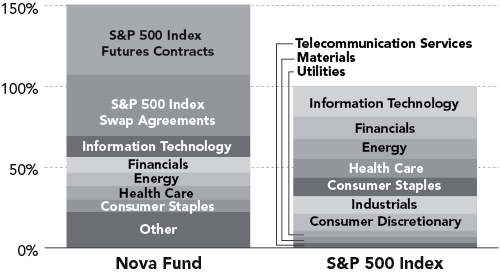
“Holdings Diversification (Market Exposure as % of Net Assets)” excludes any temporary cash investments.
Inception Date: May 7, 1997
Ten Largest Holdings (% of Total Net Assets) | ||||
Exxon Mobil Corp. | 2.5 | % | ||
Apple, Inc. | 2.3 | % | ||
International Business Machines Corp. | 1.3 | % | ||
Chevron Corp. | 1.3 | % | ||
Microsoft Corp. | 1.2 | % | ||
General Electric Co. | 1.1 | % | ||
Procter & Gamble Co. | 1.1 | % | ||
AT&T, Inc. | 1.1 | % | ||
Johnson & Johnson | 1.1 | % | ||
Pfizer, Inc. | 1.0 | % | ||
|
| |||
Top Ten Total | 14.0 | % | ||
|
| |||
“Ten Largest Holdings” exclude any temporary cash or derivative investments.
8 | THE RYDEX FUNDSANNUALREPORT
| PERFORMANCE REPORT AND FUND PROFILE (Unaudited) (concluded) |
NOVA FUND
Average Annual Returns*
Periods Ended 12/31/11
| 1 Year | 5 Year | 10 Year | ||||||||||
Nova Fund | -1.17 | % | -5.85 | % | -0.61 | % | ||||||
S&P 500 Index | 2.11 | % | -0.25 | % | 2.92 | % | ||||||
| * | The performance data represents past performance that is not predictive of future results. The investment return and principal value of an investment in the Fund will fluctuate so that an investor’s shares, when redeemed, may be worth more or less than their original cost. Returns are historical and include changes in principal and reinvested dividends and capital gains and do not reflect the effect of taxes. The S&P 500 Index is an unmanaged index and, unlike the Fund, has no management fees or operating expenses to reduce its reported return. |
| Returns | do not reflect the impact of any additional fees charged by insurance companies. |
THE RYDEX FUNDSANNUALREPORT | 9
| SCHEDULE OF INVESTMENTS | December 31, 2011 |
NOVA FUND
| SHARES | VALUE | |||||||
COMMON STOCKS† - 69.2% | ||||||||
INFORMATION TECHNOLOGY - 13.2 % | ||||||||
Apple, Inc.* | 1,250 | $ | 506,250 | |||||
International Business Machines Corp. | 1,591 | 292,553 | ||||||
Microsoft Corp. | 10,078 | 261,625 | ||||||
Google, Inc. — Class A* | 338 | 218,314 | ||||||
Intel Corp. | 6,856 | 166,258 | ||||||
Oracle Corp. | 5,292 | 135,740 | ||||||
Cisco Systems, Inc. | 7,234 | 130,791 | ||||||
QUALCOMM, Inc. | 2,262 | 123,731 | ||||||
Visa, Inc. — Class A | 683 | 69,345 | ||||||
Hewlett-Packard Co. | 2,680 | 69,037 | ||||||
EMC Corp.* | 2,748 | 59,192 | ||||||
Mastercard, Inc. — Class A | 142 | 52,940 | ||||||
eBay, Inc.* | 1,540 | 46,708 | ||||||
Accenture plc — Class A | 860 | 45,778 | ||||||
Texas Instruments, Inc. | 1,532 | 44,597 | ||||||
Automatic Data Processing, Inc. | 658 | 35,539 | ||||||
Dell, Inc.* | 2,060 | 30,138 | ||||||
Corning, Inc. | 2,119 | 27,505 | ||||||
Yahoo!, Inc.* | 1,668 | 26,905 | ||||||
Cognizant Technology Solutions Corp. — Class A* | 406 | 26,110 | ||||||
Intuit, Inc. | 403 | 21,194 | ||||||
Broadcom Corp. — Class A* | 652 | 19,143 | ||||||
Salesforce.com, Inc.* | 188 | 19,074 | ||||||
Adobe Systems, Inc.* | 664 | 18,771 | ||||||
Applied Materials, Inc. | 1,752 | 18,764 | ||||||
Motorola Solutions, Inc. | 391 | 18,099 | ||||||
TE Connectivity Ltd. | 571 | 17,592 | ||||||
NetApp, Inc.* | 480 | 17,410 | ||||||
Altera Corp. | 429 | 15,916 | ||||||
SanDisk Corp.* | 320 | 15,747 | ||||||
Symantec Corp.* | 991 | 15,509 | ||||||
Citrix Systems, Inc.* | 251 | 15,241 | ||||||
Western Union Co. | 833 | 15,211 | ||||||
Xerox Corp. | 1,868 | 14,869 | ||||||
Juniper Networks, Inc.* | 712 | 14,532 | ||||||
Analog Devices, Inc. | 399 | 14,276 | ||||||
Motorola Mobility Holdings, Inc.* | 351 | 13,619 | ||||||
Paychex, Inc. | 430 | 12,947 | ||||||
NVIDIA Corp.* | 830 | 11,504 | ||||||
Fiserv, Inc.* | 193 | 11,337 | ||||||
Xilinx, Inc. | 352 | 11,285 | ||||||
F5 Networks, Inc.* | 106 | 11,249 | ||||||
Teradata Corp.* | 229 | 11,109 | ||||||
Red Hat, Inc.* | 260 | 10,735 | ||||||
KLA-Tencor Corp. | 221 | 10,663 | ||||||
CA, Inc. | 502 | 10,148 | ||||||
Amphenol Corp. — Class A | 220 | 9,986 | ||||||
Western Digital Corp.* | 314 | 9,718 | ||||||
Microchip Technology, Inc. | 256 | 9,377 | ||||||
Autodesk, Inc.* | 307 | 9,311 | ||||||
Electronic Arts, Inc.* | 450 | 9,270 | ||||||
Linear Technology Corp. | 305 | 9,159 | ||||||
Fidelity National Information Services, Inc. | 324 | 8,615 | ||||||
Micron Technology, Inc.* | 1,334 | 8,391 | ||||||
Akamai Technologies, Inc.* | 245 | 7,909 | ||||||
BMC Software, Inc.* | 235 | 7,703 | ||||||
VeriSign, Inc. | 213 | 7,608 | ||||||
Harris Corp. | 156 | 5,622 | ||||||
FLIR Systems, Inc. | 218 | 5,465 | ||||||
Computer Sciences Corp. | 209 | 4,953 | ||||||
Jabil Circuit, Inc. | 248 | 4,876 | ||||||
LSI Corp.* | 763 | 4,540 | ||||||
SAIC, Inc.* | 369 | 4,535 | ||||||
Molex, Inc. | 188 | 4,486 | ||||||
Advanced Micro Devices, Inc.* | 789 | 4,261 | ||||||
Total System Services, Inc. | 215 | 4,205 | ||||||
Novellus Systems, Inc.* | 92 | 3,799 | ||||||
Teradyne, Inc.* | 250 | 3,407 | ||||||
Lexmark International, Inc. — Class A | 98 | 3,241 | ||||||
JDS Uniphase Corp.* | 309 | 3,226 | ||||||
|
| |||||||
Total Information Technology | 2,908,663 | |||||||
|
| |||||||
FINANCIALS - 9.3% | ||||||||
Wells Fargo & Co. | 7,105 | 195,814 | ||||||
Berkshire Hathaway, Inc. — Class B* | 2,372 | 180,984 | ||||||
JPMorgan Chase & Co. | 5,121 | 170,273 | ||||||
Citigroup, Inc. | 3,931 | 103,425 | ||||||
Bank of America Corp. | 13,642 | 75,850 | ||||||
U.S. Bancorp | 2,563 | 69,329 | ||||||
American Express Co. | 1,359 | 64,104 | ||||||
Goldman Sachs Group, Inc. | 665 | 60,136 | ||||||
Simon Property Group, Inc. | 399 | 51,447 | ||||||
MetLife, Inc. | 1,420 | 44,276 | ||||||
PNC Financial Services Group, Inc. | 706 | 40,715 | ||||||
Travelers Companies, Inc. | 556 | 32,899 | ||||||
Bank of New York Mellon Corp. | 1,638 | 32,613 | ||||||
ACE Ltd. | 456 | 31,975 | ||||||
Prudential Financial, Inc. | 633 | 31,726 | ||||||
Morgan Stanley | 1,992 | 30,139 | ||||||
Aflac, Inc. | 629 | 27,211 | ||||||
State Street Corp. | 665 | 26,806 | ||||||
Capital One Financial Corp. | 619 | 26,177 | ||||||
Public Storage | 194 | 26,085 | ||||||
Chubb Corp. | 372 | 25,750 | ||||||
BlackRock, Inc. — Class A | 139 | 24,775 | ||||||
BB&T Corp. | 938 | 23,609 | ||||||
Equity Residential | 402 | 22,926 | ||||||
Marsh & McLennan Companies, Inc. | 725 | 22,924 | ||||||
HCP, Inc. | 546 | 22,621 | ||||||
CME Group, Inc. — Class A | 92 | 22,418 | ||||||
Ventas, Inc. | 390 | 21,501 | ||||||
Aon Corp. | 431 | 20,171 | ||||||
Boston Properties, Inc. | 198 | 19,721 | ||||||
| 10 | THE RYDEX FUNDSANNUALREPORT | See Notes to Financial Statements. |
| SCHEDULE OF INVESTMENTS | December 31, 2011 |
NOVA FUND
| SHARES | VALUE | |||||||
T. Rowe Price Group, Inc. | 344 | $ | 19,591 | |||||
Vornado Realty Trust | 247 | 18,984 | ||||||
Franklin Resources, Inc. | 197 | 18,924 | ||||||
Allstate Corp. | 679 | 18,611 | ||||||
Discover Financial Services | 741 | 17,784 | ||||||
ProLogis, Inc. | 618 | 17,669 | ||||||
AvalonBay Communities, Inc. | 130 | 16,978 | ||||||
Charles Schwab Corp. | 1,450 | 16,327 | ||||||
Progressive Corp. | 830 | 16,193 | ||||||
Fifth Third Bancorp | 1,240 | 15,773 | ||||||
Loews Corp. | 412 | 15,512 | ||||||
Ameriprise Financial, Inc. | 306 | 15,190 | ||||||
Health Care REIT, Inc. | 260 | 14,178 | ||||||
Host Hotels & Resorts, Inc. | 949 | 14,017 | ||||||
American International Group, Inc.* | 589 | 13,665 | ||||||
Weyerhaeuser Co. | 722 | 13,480 | ||||||
M&T Bank Corp. | 167 | 12,749 | ||||||
SunTrust Banks, Inc. | 720 | 12,744 | ||||||
Northern Trust Corp. | 320 | 12,691 | ||||||
Invesco Ltd. | 608 | 12,215 | ||||||
IntercontinentalExchange, Inc.* | 99 | 11,934 | ||||||
Principal Financial Group, Inc. | 412 | 10,135 | ||||||
KeyCorp | 1,290 | 9,920 | ||||||
Hartford Financial Services Group, Inc. | 600 | 9,750 | ||||||
SLM Corp. | 683 | 9,152 | ||||||
NYSE Euronext | 350 | 9,135 | ||||||
Kimco Realty Corp. | 549 | 8,916 | ||||||
Moody’s Corp. | 262 | 8,824 | ||||||
XL Group plc — Class A | 428 | 8,462 | ||||||
Unum Group | 398 | 8,386 | ||||||
Lincoln National Corp. | 408 | 7,923 | ||||||
Plum Creek Timber Company, Inc. | 215 | 7,860 | ||||||
Regions Financial Corp. | 1,693 | 7,280 | ||||||
Comerica, Inc. | 266 | 6,863 | ||||||
CBRE Group, Inc. — Class A* | 442 | 6,727 | ||||||
Cincinnati Financial Corp. | 216 | 6,579 | ||||||
Huntington Bancshares, Inc. | 1,162 | 6,379 | ||||||
People’s United Financial, Inc. | 482 | 6,194 | ||||||
Torchmark Corp. | 141 | 6,118 | ||||||
Leucadia National Corp. | 265 | 6,026 | ||||||
Assurant, Inc. | 120 | 4,927 | ||||||
Hudson City Bancorp, Inc. | 708 | 4,425 | ||||||
Genworth Financial, Inc. — Class A* | 659 | 4,316 | ||||||
NASDAQ OMX Group, Inc.* | 176 | 4,314 | ||||||
Zions Bancorporation | 246 | 4,005 | ||||||
Legg Mason, Inc. | 165 | 3,968 | ||||||
Apartment Investment & Management Co. — Class A | 160 | 3,666 | ||||||
First Horizon National Corp. | 350 | 2,800 | ||||||
E*Trade Financial Corp.* | 339 | 2,698 | ||||||
Federated Investors, Inc. — Class B | 129 | 1,954 | ||||||
|
| |||||||
Total Financials | 2,061,311 | |||||||
|
| |||||||
ENERGY - 8.5% | ||||||||
Exxon Mobil Corp. | 6,451 | 546,787 | ||||||
Chevron Corp. | 2,681 | 285,258 | ||||||
ConocoPhillips | 1,793 | 130,656 | ||||||
Schlumberger Ltd. | 1,809 | 123,573 | ||||||
Occidental Petroleum Corp. | 1,089 | 102,039 | ||||||
Anadarko Petroleum Corp. | 672 | 51,294 | ||||||
Apache Corp. | 520 | 47,102 | ||||||
Halliburton Co. | 1,237 | 42,689 | ||||||
National Oilwell Varco, Inc. | 569 | 38,686 | ||||||
EOG Resources, Inc. | 370 | 36,449 | ||||||
Devon Energy Corp. | 539 | 33,418 | ||||||
Baker Hughes, Inc. | 589 | 28,649 | ||||||
El Paso Corp. | 1,042 | 27,686 | ||||||
Marathon Oil Corp. | 945 | 27,660 | ||||||
Spectra Energy Corp. | 872 | 26,814 | ||||||
Williams Companies, Inc. | 798 | 26,350 | ||||||
Hess Corp. | 404 | 22,947 | ||||||
Noble Energy, Inc. | 240 | 22,654 | ||||||
Chesapeake Energy Corp. | 890 | 19,838 | ||||||
FMC Technologies, Inc.* | 319 | 16,661 | ||||||
Cameron International Corp.* | 329 | 16,183 | ||||||
Valero Energy Corp. | 759 | 15,977 | ||||||
Marathon Petroleum Corp. | 475 | 15,813 | ||||||
Pioneer Natural Resources Co. | 169 | 15,122 | ||||||
Murphy Oil Corp. | 270 | 15,050 | ||||||
Southwestern Energy Co.* | 468 | 14,948 | ||||||
Range Resources Corp. | 219 | 13,565 | ||||||
Peabody Energy Corp. | 369 | 12,218 | ||||||
Consol Energy, Inc. | 310 | 11,377 | ||||||
Equities Corp. | 201 | 11,013 | ||||||
Cabot Oil & Gas Corp. | 144 | 10,930 | ||||||
Noble Corp.* | 344 | 10,396 | ||||||
Helmerich & Payne, Inc. | 146 | 8,521 | ||||||
Denbury Resources, Inc.* | 539 | 8,139 | ||||||
QEP Resources, Inc. | 240 | 7,032 | ||||||
Newfield Exploration Co.* | 182 | 6,867 | ||||||
Nabors Industries Ltd.* | 391 | 6,780 | ||||||
Alpha Natural Resources, Inc.* | 299 | 6,109 | ||||||
Sunoco, Inc. | 146 | 5,989 | ||||||
Diamond Offshore Drilling, Inc. | 96 | 5,305 | ||||||
Rowan Companies, Inc.* | 173 | 5,247 | ||||||
Tesoro Corp.* | 195 | 4,555 | ||||||
|
| |||||||
Total Energy | 1,884,346 | |||||||
|
| |||||||
HEALTH CARE - 8.2% | ||||||||
Johnson & Johnson | 3,672 | 240,810 | ||||||
Pfizer, Inc. | 10,347 | 223,909 | ||||||
Merck & Company, Inc. | 4,112 | 155,022 | ||||||
Abbott Laboratories | 2,102 | 118,195 | ||||||
Bristol-Myers Squibb Co. | 2,282 | 80,418 | ||||||
UnitedHealth Group, Inc. | 1,433 | 72,624 | ||||||
Amgen, Inc. | 1,068 | 68,576 | ||||||
Eli Lilly & Co. | 1,377 | 57,228 | ||||||
Medtronic, Inc. | 1,426 | 54,544 | ||||||
Gilead Sciences, Inc.* | 1,007 | 41,216 | ||||||
| See Notes to Financial Statements. | THE RYDEX FUNDSANNUALREPORT | 11 |
| SCHEDULE OF INVESTMENTS (continued) | December 31, 2011 |
NOVA FUND
| SHARES | VALUE | |||||||
Celgene Corp.* | 603 | $ | 40,763 | |||||
Baxter International, Inc. | 760 | 37,605 | ||||||
Allergan, Inc. | 407 | 35,710 | ||||||
Biogen Idec, Inc.* | 324 | 35,656 | ||||||
WellPoint, Inc. | 468 | 31,005 | ||||||
Express Scripts, Inc.* | 666 | 29,764 | ||||||
Medco Health Solutions, Inc.* | 532 | 29,739 | ||||||
Covidien plc | 654 | 29,437 | ||||||
McKesson Corp. | 327 | 25,477 | ||||||
Intuitive Surgical, Inc.* | 52 | 24,077 | ||||||
Thermo Fisher Scientific, Inc.* | 508 | 22,845 | ||||||
Becton Dickinson and Co. | 294 | 21,968 | ||||||
Stryker Corp. | 434 | 21,574 | ||||||
Aetna, Inc. | 484 | 20,420 | ||||||
Humana, Inc. | 218 | 19,099 | ||||||
Cardinal Health, Inc. | 469 | 19,046 | ||||||
Agilent Technologies, Inc.* | 469 | 16,382 | ||||||
Cigna Corp. | 380 | 15,960 | ||||||
St. Jude Medical, Inc. | 437 | 14,989 | ||||||
Zimmer Holdings, Inc.* | 245 | 13,088 | ||||||
AmerisourceBergen Corp. — Class A | 351 | 13,054 | ||||||
Perrigo Co. | 130 | 12,649 | ||||||
Mylan, Inc.* | 576 | 12,361 | ||||||
Quest Diagnostics, Inc. | 210 | 12,193 | ||||||
Cerner Corp.* | 198 | 12,127 | ||||||
Laboratory Corporation of America Holdings* | 138 | 11,864 | ||||||
Forest Laboratories, Inc.* | 360 | 10,894 | ||||||
Edwards Lifesciences Corp.* | 154 | 10,888 | ||||||
Boston Scientific Corp.* | 1,991 | 10,632 | ||||||
Watson Pharmaceuticals, Inc.* | 174 | 10,499 | ||||||
CR Bard, Inc. | 120 | 10,260 | ||||||
Varian Medical Systems, Inc.* | 152 | 10,204 | ||||||
DaVita, Inc.* | 132 | 10,007 | ||||||
Waters Corp.* | 127 | 9,404 | ||||||
Life Technologies Corp.* | 240 | 9,338 | ||||||
CareFusion Corp.* | 300 | 7,623 | ||||||
Hospira, Inc.* | 225 | 6,833 | ||||||
DENTSPLY International, Inc. | 194 | 6,788 | ||||||
Coventry Health Care, Inc.* | 197 | 5,983 | ||||||
Patterson Companies, Inc. | 162 | 4,782 | ||||||
PerkinElmer, Inc. | 153 | 3,060 | ||||||
Tenet Healthcare Corp.* | 582 | 2,986 | ||||||
|
| |||||||
Total Health Care | 1,821,575 | |||||||
|
| |||||||
CONSUMER STAPLES - 8.0% | ||||||||
Procter & Gamble Co. | 3,711 | 247,561 | ||||||
Coca-Cola Co. | 3,059 | 214,038 | ||||||
Philip Morris International, Inc. | 2,338 | 183,486 | ||||||
Wal-Mart Stores, Inc. | 2,351 | 140,496 | ||||||
PepsiCo, Inc. | 2,100 | 139,335 | ||||||
Kraft Foods, Inc. — Class A | 2,373 | 88,655 | ||||||
Altria Group, Inc. | 2,770 | 82,130 | ||||||
CVS Caremark Corp. | 1,745 | 71,161 | ||||||
Colgate-Palmolive Co. | 654 | 60,423 | ||||||
Costco Wholesale Corp. | 589 | 49,075 | ||||||
Walgreen Co. | 1,197 | 39,573 | ||||||
Kimberly-Clark Corp. | 530 | 38,987 | ||||||
General Mills, Inc. | 872 | 35,238 | ||||||
Archer-Daniels-Midland Co. | 896 | 25,626 | ||||||
HJ Heinz Co. | 438 | 23,670 | ||||||
Sysco Corp. | 797 | 23,376 | ||||||
Lorillard, Inc. | 187 | 21,318 | ||||||
Kroger Co. | 809 | 19,594 | ||||||
Reynolds American, Inc. | 457 | 18,929 | ||||||
Mead Johnson Nutrition Co. — Class A | 271 | 18,626 | ||||||
Kellogg Co. | 339 | 17,143 | ||||||
Estee Lauder Companies, Inc. — Class A | 151 | 16,960 | ||||||
Whole Foods Market, Inc. | 221 | 15,377 | ||||||
Sara Lee Corp. | 800 | 15,136 | ||||||
ConAgra Foods, Inc. | 560 | 14,784 | ||||||
Hershey Co. | 206 | 12,727 | ||||||
JM Smucker Co. | 158 | 12,351 | ||||||
Clorox Co. | 179 | 11,914 | ||||||
Dr Pepper Snapple Group, Inc. | 293 | 11,568 | ||||||
Brown-Forman Corp. — Class B | 140 | 11,271 | ||||||
Coca-Cola Enterprises, Inc. | 419 | 10,802 | ||||||
Beam, Inc. | 209 | 10,707 | ||||||
Avon Products, Inc. | 578 | 10,098 | ||||||
Safeway, Inc. | 460 | 9,678 | ||||||
Molson Coors Brewing Co. — Class B | 211 | 9,187 | ||||||
McCormick & Company, Inc. | 182 | 9,176 | ||||||
Tyson Foods, Inc. — Class A | 396 | 8,173 | ||||||
Campbell Soup Co. | 244 | 8,111 | ||||||
Hormel Foods Corp. | 189 | 5,536 | ||||||
Constellation Brands, Inc. — Class A* | 239 | 4,940 | ||||||
Dean Foods Co.* | 248 | 2,778 | ||||||
SUPERVALU, Inc. | 287 | 2,330 | ||||||
|
| |||||||
Total Consumer Staples | 1,772,044 | |||||||
|
| |||||||
INDUSTRIALS - 7.4% | ||||||||
General Electric Co. | 14,213 | 254,555 | ||||||
United Parcel Service, Inc. — Class B | 1,299 | 95,074 | ||||||
United Technologies Corp. | 1,224 | 89,462 | ||||||
Caterpillar, Inc. | 874 | 79,184 | ||||||
3M Co. | 942 | 76,990 | ||||||
Boeing Co. | 1,007 | 73,863 | ||||||
Union Pacific Corp. | 655 | 69,391 | ||||||
Honeywell International, Inc. | 1,041 | 56,578 | ||||||
Emerson Electric Co. | 990 | 46,124 | ||||||
Deere & Co. | 559 | 43,239 | ||||||
Danaher Corp. | 769 | 36,174 | ||||||
FedEx Corp. | 430 | 35,909 | ||||||
Precision Castparts Corp. | 206 | 33,947 | ||||||
Norfolk Southern Corp. | 455 | 33,151 | ||||||
General Dynamics Corp. | 477 | 31,678 | ||||||
Illinois Tool Works, Inc. | 655 | 30,595 | ||||||
| 12 | THE RYDEX FUNDSANNUALREPORT | See Notes to Financial Statements. |
| SCHEDULE OF INVESTMENTS (continued) | December 31, 2011 |
NOVA FUND
| SHARES | VALUE | |||||||
CSX Corp. | 1,411 | $ | 29,716 | |||||
Tyco International Ltd. | 625 | 29,194 | ||||||
Lockheed Martin Corp. | 358 | 28,962 | ||||||
Cummins, Inc. | 260 | 22,885 | ||||||
Raytheon Co. | 466 | 22,545 | ||||||
Northrop Grumman Corp. | 354 | 20,702 | ||||||
Goodrich Corp. | 166 | 20,534 | ||||||
Waste Management, Inc. | 620 | 20,280 | ||||||
Eaton Corp. | 453 | 19,719 | ||||||
PACCAR, Inc. | 479 | 17,948 | ||||||
Fastenal Co. | 401 | 17,488 | ||||||
WW Grainger, Inc. | 86 | 16,098 | ||||||
Parker Hannifin Corp. | 204 | 15,555 | ||||||
Stanley Black & Decker, Inc. | 229 | 15,480 | ||||||
CH Robinson Worldwide, Inc. | 217 | 15,142 | ||||||
Dover Corp. | 252 | 14,629 | ||||||
Rockwell Automation, Inc. | 194 | 14,234 | ||||||
Ingersoll-Rand plc | 419 | 12,767 | ||||||
Roper Industries, Inc. | 140 | 12,162 | ||||||
Fluor Corp. | 234 | 11,758 | ||||||
Expeditors International of Washington, Inc. | 285 | 11,674 | ||||||
Republic Services, Inc. — Class A | 422 | 11,626 | ||||||
Cooper Industries plc | 212 | 11,480 | ||||||
Rockwell Collins, Inc. | 205 | 11,351 | ||||||
Joy Global, Inc. | 144 | 10,796 | ||||||
Stericycle, Inc.* | 120 | 9,350 | ||||||
L-3 Communications Holdings, Inc. | 139 | 9,269 | ||||||
Southwest Airlines Co. | 1,046 | 8,954 | ||||||
Pall Corp. | 155 | 8,858 | ||||||
Flowserve Corp. | 80 | 7,946 | ||||||
Iron Mountain, Inc. | 252 | 7,762 | ||||||
Jacobs Engineering Group, Inc.* | 179 | 7,264 | ||||||
Textron, Inc. | 378 | 6,989 | ||||||
Equifax, Inc. | 170 | 6,586 | ||||||
Xylem, Inc. | 251 | 6,448 | ||||||
Quanta Services, Inc.* | 287 | 6,182 | ||||||
Robert Half International, Inc. | 195 | 5,550 | ||||||
Dun & Bradstreet Corp. | 70 | 5,238 | ||||||
Cintas Corp. | 150 | 5,221 | ||||||
Masco Corp. | 486 | 5,093 | ||||||
Pitney Bowes, Inc. | 267 | 4,950 | ||||||
Snap-on, Inc. | 83 | 4,201 | ||||||
Avery Dennison Corp. | 144 | 4,130 | ||||||
Ryder System, Inc. | 73 | 3,879 | ||||||
RR Donnelley & Sons Co. | 262 | 3,781 | ||||||
First Solar, Inc.* | 84 | 2,836 | ||||||
|
| |||||||
Total Industrials | 1,651,126 | |||||||
|
| |||||||
CONSUMER DISCRETIONARY - 7.4% | ||||||||
McDonald’s Corp. | 1,372 | 137,653 | ||||||
Walt Disney Co. | 2,413 | 90,487 | ||||||
Home Depot, Inc. | 2,076 | 87,275 | ||||||
Comcast Corp. — Class A | 3,663 | 86,850 | ||||||
Amazon.com, Inc.* | 490 | 84,819 | ||||||
Ford Motor Co.* | 5,122 | 55,113 | ||||||
News Corp. — Class A | 2,954 | 52,699 | ||||||
Time Warner, Inc. | 1,348 | 48,717 | ||||||
NIKE, Inc. — Class B | 503 | 48,474 | ||||||
Target Corp. | 900 | 46,098 | ||||||
Starbucks Corp. | 1,000 | 46,010 | ||||||
Lowe’s Companies, Inc. | 1,683 | 42,715 | ||||||
DIRECTV — Class A* | 947 | 40,494 | ||||||
Yum! Brands, Inc. | 625 | 36,881 | ||||||
Viacom, Inc. — Class B | 740 | 33,603 | ||||||
Priceline.com, Inc.* | 70 | 32,740 | ||||||
TJX Companies, Inc. | 507 | 32,727 | ||||||
Johnson Controls, Inc. | 917 | 28,665 | ||||||
Time Warner Cable, Inc. | 437 | 27,780 | ||||||
Coach, Inc. | 397 | 24,233 | ||||||
CBS Corp. — Class B | 881 | 23,910 | ||||||
Carnival Corp. | 612 | 19,976 | ||||||
Bed Bath & Beyond, Inc.* | 321 | 18,608 | ||||||
Macy’s, Inc. | 566 | 18,214 | ||||||
McGraw-Hill Companies, Inc. | 399 | 17,943 | ||||||
Kohl’s Corp. | 346 | 17,075 | ||||||
Omnicom Group, Inc. | 370 | 16,495 | ||||||
Chipotle Mexican Grill, Inc. — Class A* | 44 | 14,861 | ||||||
Ross Stores, Inc. | 310 | 14,734 | ||||||
Discovery Communications, Inc. — Class A* | 357 | 14,626 | ||||||
VF Corp. | 115 | 14,604 | ||||||
O’Reilly Automotive, Inc.* | 170 | 13,591 | ||||||
Dollar Tree, Inc.* | 160 | 13,298 | ||||||
Limited Brands, Inc. | 327 | 13,194 | ||||||
Staples, Inc. | 940 | 13,057 | ||||||
Starwood Hotels & Resorts Worldwide, Inc. | 269 | 12,904 | ||||||
Genuine Parts Co. | 209 | 12,791 | ||||||
Mattel, Inc. | 457 | 12,686 | ||||||
Ralph Lauren Corp. — Class A | 90 | 12,427 | ||||||
Harley-Davidson, Inc. | 313 | 12,166 | ||||||
AutoZone, Inc.* | 37 | 12,024 | ||||||
Wynn Resorts Ltd. | 106 | 11,712 | ||||||
Tiffany & Co. | 176 | 11,662 | ||||||
Nordstrom, Inc. | 213 | 10,588 | ||||||
Marriott International, Inc. — Class A | 361 | 10,530 | ||||||
BorgWarner, Inc.* | 150 | 9,561 | ||||||
Best Buy Company, Inc. | 399 | 9,325 | ||||||
CarMax, Inc.* | 302 | 9,205 | ||||||
Family Dollar Stores, Inc. | 158 | 9,110 | ||||||
The Gap, Inc. | 472 | 8,756 | ||||||
Apollo Group, Inc. — Class A* | 161 | 8,673 | ||||||
Darden Restaurants, Inc. | 173 | 7,885 | ||||||
Wyndham Worldwide Corp. | 206 | 7,793 | ||||||
International Game Technology | 399 | 6,863 | ||||||
| See Notes to Financial Statements. | THE RYDEX FUNDSANNUALREPORT | 13 |
| SCHEDULE OF INVESTMENTS (continued) | December 31, 2011 |
NOVA FUND
| SHARES | VALUE | |||||||
JC Penney Company, Inc. | 195 | $ | 6,854 | |||||
H&R Block, Inc. | 398 | 6,499 | ||||||
Newell Rubbermaid, Inc. | 390 | 6,298 | ||||||
Interpublic Group of Companies, Inc. | 621 | 6,042 | ||||||
Scripps Networks Interactive, Inc. — Class A | 132 | 5,599 | ||||||
Abercrombie & Fitch Co. — Class A | 113 | 5,519 | ||||||
Netflix, Inc.* | 77 | 5,335 | ||||||
Hasbro, Inc. | 156 | 4,975 | ||||||
Whirlpool Corp. | 103 | 4,887 | ||||||
DR Horton, Inc. | 372 | 4,691 | ||||||
Goodyear Tire & Rubber Co.* | 326 | 4,619 | ||||||
GameStop Corp. — Class A* | 190 | 4,585 | ||||||
Leggett & Platt, Inc. | 191 | 4,401 | ||||||
Lennar Corp. — Class A | 219 | 4,303 | ||||||
Cablevision Systems Corp. — Class A | 300 | 4,266 | ||||||
Gannett Company, Inc. | 319 | 4,265 | ||||||
Urban Outfitters, Inc.* | 145 | 3,996 | ||||||
Harman International Industries, Inc. | 96 | 3,652 | ||||||
Expedia, Inc. | 123 | 3,569 | ||||||
Big Lots, Inc.* | 91 | 3,436 | ||||||
DeVry, Inc. | 86 | 3,308 | ||||||
TripAdvisor, Inc.* | 123 | 3,101 | ||||||
PulteGroup, Inc.* | 456 | 2,877 | ||||||
AutoNation, Inc.* | 62 | 2,286 | ||||||
Washington Post Co. — Class B | 5 | 1,884 | ||||||
Sears Holdings Corp.* | 52 | 1,653 | ||||||
Orchard Supply Hardware Stores Corp. — Class A*,5,††† | 2 | 17 | ||||||
|
| |||||||
Total Consumer Discretionary | 1,637,797 | |||||||
|
| |||||||
UTILITIES - 2.7% | ||||||||
Southern Co. | 1,172 | 54,252 | ||||||
Dominion Resources, Inc. | 762 | 40,447 | ||||||
Duke Energy Corp. | 1,800 | 39,600 | ||||||
Exelon Corp. | 890 | 38,599 | ||||||
NextEra Energy, Inc. | 567 | 34,519 | ||||||
American Electric Power Company, Inc. | 654 | 27,017 | ||||||
FirstEnergy Corp. | 560 | 24,808 | ||||||
Consolidated Edison, Inc. | 398 | 24,688 | ||||||
PPL Corp. | 779 | 22,918 | ||||||
PG&E Corp. | 547 | 22,547 | ||||||
Progress Energy, Inc. | 401 | 22,464 | ||||||
Public Service Enterprise Group, Inc. | 679 | 22,414 | ||||||
Edison International | 439 | 18,175 | ||||||
Xcel Energy, Inc. | 657 | 18,159 | ||||||
Sempra Energy | 321 | 17,655 | ||||||
Entergy Corp. | 240 | 17,532 | ||||||
DTE Energy Co. | 230 | 12,523 | ||||||
ONEOK, Inc. | 142 | 12,310 | ||||||
CenterPoint Energy, Inc. | 571 | 11,471 | ||||||
Ameren Corp. | 330 | 10,933 | ||||||
Wisconsin Energy Corp. | 311 | 10,873 | ||||||
Constellation Energy Group, Inc. | 269 | 10,671 | ||||||
AES Corp.* | 871 | 10,313 | ||||||
NiSource, Inc. | 379 | 9,024 | ||||||
Northeast Utilities | 240 | 8,657 | ||||||
CMS Energy Corp. | 344 | 7,596 | ||||||
Pinnacle West Capital Corp. | 149 | 7,179 | ||||||
SCANA Corp. | 155 | 6,984 | ||||||
AGL Resources, Inc. | 156 | 6,593 | ||||||
Pepco Holdings, Inc. | 310 | 6,293 | ||||||
Integrys Energy Group, Inc. | 115 | 6,231 | ||||||
NRG Energy, Inc.* | 310 | 5,617 | ||||||
TECO Energy, Inc. | 290 | 5,551 | ||||||
|
| |||||||
Total Utilities | 594,613 | |||||||
|
| |||||||
MATERIALS - 2.4% | ||||||||
EI du Pont de Nemours & Co. | 1,250 | 57,225 | ||||||
Monsanto Co. | 722 | 50,591 | ||||||
Freeport-McMoRan Copper & Gold, Inc. | 1,275 | 46,907 | ||||||
Dow Chemical Co. | 1,589 | 45,700 | ||||||
Praxair, Inc. | 406 | 43,401 | ||||||
Newmont Mining Corp. | 668 | 40,087 | ||||||
Air Products & Chemicals, Inc. | 287 | 24,450 | ||||||
Ecolab, Inc. | 400 | 23,124 | ||||||
Mosaic Co. | 398 | 20,071 | ||||||
PPG Industries, Inc. | 215 | 17,950 | ||||||
International Paper Co. | 590 | 17,464 | ||||||
Nucor Corp. | 430 | 17,015 | ||||||
CF Industries Holdings, Inc. | 91 | 13,193 | ||||||
Alcoa, Inc. | 1,431 | 12,378 | ||||||
Cliffs Natural Resources, Inc. | 195 | 12,158 | ||||||
Sherwin-Williams Co. | 122 | 10,891 | ||||||
Sigma-Aldrich Corp. | 169 | 10,556 | ||||||
FMC Corp. | 97 | 8,346 | ||||||
Ball Corp. | 223 | 7,963 | ||||||
Eastman Chemical Co. | 190 | 7,421 | ||||||
Vulcan Materials Co. | 178 | 7,004 | ||||||
Allegheny Technologies, Inc. | 146 | 6,979 | ||||||
Airgas, Inc. | 89 | 6,949 | ||||||
MeadWestvaco Corp. | 230 | 6,888 | ||||||
International Flavors & Fragrances, Inc. | 108 | 5,661 | ||||||
United States Steel Corp. | 196 | 5,186 | ||||||
Sealed Air Corp. | 254 | 4,371 | ||||||
Bemis Company, Inc. | 142 | 4,271 | ||||||
Owens-Illinois, Inc.* | 219 | 4,244 | ||||||
Titanium Metals Corp. | 109 | 1,633 | ||||||
|
| |||||||
Total Materials | 540,077 | |||||||
|
| |||||||
TELECOMMUNICATION SERVICES - 2.1% | ||||||||
AT&T, Inc. | 7,976 | 241,194 | ||||||
Verizon Communications, Inc. | 3,809 | 152,817 | ||||||
American Tower Corp. — Class A | 527 | 31,625 | ||||||
CenturyLink, Inc. | 840 | 31,248 | ||||||
Sprint Nextel Corp.* | 4,032 | 9,435 | ||||||
Windstream Corp. | 781 | 9,169 | ||||||
Frontier Communications Corp. | 1,342 | 6,911 | ||||||
| 14 | THE RYDEX FUNDSANNUALREPORT | See Notes to Financial Statements. |
| SCHEDULE OF INVESTMENTS (continued) | December 31, 2011 |
NOVA FUND
| SHARES | VALUE | |||||||
MetroPCS Communications, Inc.* | 394 | $ | 3,420 | |||||
|
| |||||||
Total Telecommunication Services | 485,819 | |||||||
|
| |||||||
Total Common Stocks | 15,357,371 | |||||||
|
| |||||||
PREFERRED STOCKS - 0.0% | ||||||||
Orchard Supply Hardware — Class A*,1,5,††† | 2 | — | ||||||
|
| |||||||
Total Preferred Stocks | — | |||||||
|
| |||||||
| FACE AMOUNT | ||||||||
REPURCHASE AGREEMENTS††,2 - 28.1% | ||||||||
Credit Suisse Group | $ | 2,322,320 | 2,322,320 | |||||
Mizuho Financial Group, Inc. issued 12/30/11 at 0.00% due 01/03/12 | 1,348,273 | 1,348,273 | ||||||
HSBC Group | 1,290,650 | 1,290,650 | ||||||
Deutsche Bank | 1,290,650 | 1,290,650 | ||||||
|
| |||||||
Total Repurchase Agreements | 6,251,893 | |||||||
|
| |||||||
Total Investments - 97.3% | $ | 21,609,264 | ||||||
|
| |||||||
Cash & Other Assets, | 599,085 | |||||||
|
| |||||||
Total Net Assets - 100.0% | $ | 22,208,349 | ||||||
| CONTRACTS | UNREALIZED GAIN (LOSS) | |||||||
FUTURES CONTRACTS PURCHASED† | ||||||||
March 2012 S&P 500 | 154 | $ | 140,418 | |||||
|
| |||||||
| UNITS | ||||||||
EQUITY INDEX SWAP AGREEMENTS†† | ||||||||
Goldman Sachs International | 2,181 | $ | 3,568 | |||||
Barclays Bank plc | 1,240 | (6,688 | ) | |||||
Morgan Stanley Capital Services, Inc. | 1,247 | (9,354 | ) | |||||
Credit Suisse Capital, LLC | 2,017 | (10,753 | ) | |||||
|
| |||||||
(Total Notional Value | $ | (23,227 | ) | |||||
|
| |||||||
| * | Non-income producing security. |
| † | Value determined based on Level 1 inputs — See Note 4. |
| †† | Value determined based on Level 2 inputs — See Note 4. |
| ††† | Value determined based on Level 3 inputs — See Note 4. |
| 1 | Perpetual maturity. |
| 2 | Repurchase Agreements — See Note 5. |
| 3 | All or a portion of this security is pledged as equity index swap collateral at December 31, 2011. |
| 4 | Total Return based on S&P 500 Index +/- financing at a variable rate. |
| 5 | Illiquid Security. |
plc — Public Limited Company
REIT — Real Estate Investment Trust
| See Notes to Financial Statements. | THE RYDEX FUNDSANNUALREPORT | 15 |
NOVA FUND
STATEMENT OF ASSETS AND LIABILITIES
| December 31, 2011 | ||||
ASSETS: | ||||
Investments, at value | $ | 15,357,371 | ||
Repurchase agreements, at value | 6,251,893 | |||
|
| |||
Total investments | 21,609,264 | |||
Segregated cash with broker | 854,826 | |||
Unrealized appreciation on swap agreements | 3,568 | |||
Receivables: | ||||
Fund shares sold | 28,541 | |||
Dividends | 21,901 | |||
Securities sold | 2,513 | |||
|
| |||
Total assets | 22,520,613 | |||
|
| |||
LIABILITIES: | ||||
Unrealized depreciation on swap agreements | 26,795 | |||
Overdraft due to custodian bank | 27 | |||
Payable for: | ||||
Fund shares redeemed | 166,541 | |||
Variation margin | 45,430 | |||
Management fees | 14,461 | |||
Transfer agent and administrative fees | 4,820 | |||
Investor service fees | 4,820 | |||
Swap settlement | 2,155 | |||
Portfolio accounting fees | 1,928 | |||
Miscellaneous | 45,287 | |||
|
| |||
Total liabilities | 312,264 | |||
|
| |||
NETASSETS | $ | 22,208,349 | ||
|
| |||
NETASSETSCONSISTOF: | ||||
Paid in capital | $ | 45,125,522 | ||
Undistributed net investment income | — | |||
Accumulated net realized loss on investments | (28,361,222 | ) | ||
Net unrealized appreciation on investments | 5,444,049 | |||
|
| |||
Net assets | $ | 22,208,349 | ||
Capital shares outstanding | 307,010 | |||
Net asset value per share | $ | 72.34 | ||
|
| |||
STATEMENT OF OPERATIONS
| Year Ended December 31, 2011 | ||||
INVESTMENT INCOME: | ||||
Dividends | $ | 390,984 | ||
Interest | 3,342 | |||
|
| |||
Total investment income | 394,326 | |||
|
| |||
EXPENSES: | ||||
Management fees | 199,201 | |||
Transfer agent and administrative fees | 66,401 | |||
Investor service fees | 66,401 | |||
Portfolio accounting fees | 26,560 | |||
Custodian fees | 6,669 | |||
Trustees’ fees* | 2,689 | |||
Miscellaneous | 60,085 | |||
|
| |||
Total expenses | 428,006 | |||
|
| |||
Net investment loss | (33,680 | ) | ||
|
| |||
NET REALIZEDAND UNREALIZED GAIN (LOSS): | ||||
Net realized gain (loss) on: | ||||
Investments | 2,068,938 | |||
Swap agreements | 380,653 | |||
Futures contracts | (884,300 | ) | ||
|
| |||
Net realized gain | 1,565,291 | |||
|
| |||
Net change in unrealized appreciation (depreciation) on: | ||||
Investments | (3,338,419 | ) | ||
Swap agreements | (27,593 | ) | ||
Futures contracts | 19,426 | |||
|
| |||
Net change in unrealized appreciation (depreciation) | (3,346,586 | ) | ||
|
| |||
Net realized and unrealized loss | (1,781,295 | ) | ||
|
| |||
Net decrease in net assets resulting from operations | $ | (1,814,975 | ) | |
|
| |||
| * | Relates to Trustees not deemed “interested persons” within the meaning of Section 2(a) (19) of the 1940 Act. |
| 16 | THE RYDEX FUNDSANNUALREPORT | See Notes to Financial Statements. |
NOVA FUND
STATEMENTS OF CHANGES IN NET ASSETS
| Year Ended December 31, 2011 | Year Ended December 31, 2010 | |||||||
INCREASE (DECREASE) IN NET ASSETS FROM OPERATIONS: | ||||||||
Net investment income (loss) | $ | (33,680 | ) | $ | 13,783 | |||
Net realized gain on investments | 1,565,291 | 6,976,829 | ||||||
Net change in unrealized appreciation (depreciation) on investments | (3,346,586 | ) | (1,202,164 | ) | ||||
|
|
|
| |||||
Net increase (decrease) in net assets resulting from operations | (1,814,975 | ) | 5,788,448 | |||||
|
|
|
| |||||
DISTRIBUTIONSTOSHAREHOLDERSFROM: | ||||||||
Net investment income | (12,745 | ) | (74,019 | ) | ||||
|
|
|
| |||||
Total distributions to shareholders | (12,745 | ) | (74,019 | ) | ||||
|
|
|
| |||||
CAPITALSHARETRANSACTIONS: | ||||||||
Proceeds from sale of shares | 161,732,900 | 129,840,432 | ||||||
Distributions reinvested | 12,745 | 74,019 | ||||||
Cost of shares redeemed | (167,353,710 | ) | (156,545,401 | ) | ||||
|
|
|
| |||||
Net decrease from capital share transactions | (5,608,065 | ) | (26,630,950 | ) | ||||
|
|
|
| |||||
Net decrease in net assets | (7,435,785 | ) | (20,916,521 | ) | ||||
NETASSETS: | ||||||||
Beginning of year | 29,644,134 | 50,560,655 | ||||||
|
|
|
| |||||
End of year | $ | 22,208,349 | $ | 29,644,134 | ||||
|
|
|
| |||||
Undistributed net investment income at end of year | $ | — | $ | 13,783 | ||||
|
|
|
| |||||
CAPITALSHAREACTIVITY: | ||||||||
Shares sold | 2,171,324 | 2,067,256 | ||||||
Shares issued from reinvestment of distributions | 177 | 1,089 | ||||||
Shares redeemed | (2,269,291 | ) | (2,490,178 | ) | ||||
|
|
|
| |||||
Net decrease in shares | (97,790 | ) | (421,833 | ) | ||||
|
|
|
| |||||
| See Notes to Financial Statements. | THE RYDEX FUNDSANNUALREPORT | 17 |
NOVA FUND
FINANCIAL HIGHLIGHTS
This table is presented to show selected data for a share outstanding throughout each period, and to assist shareholders in evaluating a Fund’s performance for the periods presented.
| Year Ended December 31, 2011 | Year Ended December 31, 2010 | Year Ended December 31, 2009c | Year Ended December 31, 2008c | Year Ended December 31, 2007c | ||||||||||||||||
Per Share Data | ||||||||||||||||||||
Net asset value, beginning of period | $ | 73.23 | $ | 61.16 | $ | 45.50 | $ | 100.60 | $ | 100.90 | ||||||||||
|
|
|
|
|
|
|
|
|
| |||||||||||
Income (loss) from investment operations: | ||||||||||||||||||||
Net investment income (loss)a | (.09 | ) | .02 | .09 | .60 | 1.20 | ||||||||||||||
Net gain (loss) on investments (realized and unrealized) | (.76 | ) | 12.19 | 16.06 | (55.40 | ) | — | |||||||||||||
|
|
|
|
|
|
|
|
|
| |||||||||||
Total from investment operations | (.85 | ) | 12.21 | 16.15 | (54.80 | ) | 1.20 | |||||||||||||
|
|
|
|
|
|
|
|
|
| |||||||||||
Less distributions from: | ||||||||||||||||||||
Net investment income | (.04 | ) | (.14 | ) | (.49 | ) | (.30 | ) | (1.50 | ) | ||||||||||
|
|
|
|
|
|
|
|
|
| |||||||||||
Total distributions | (.04 | ) | (.14 | ) | (.49 | ) | (.30 | ) | (1.50 | ) | ||||||||||
|
|
|
|
|
|
|
|
|
| |||||||||||
Net asset value, end of period | $ | 72.34 | $ | 73.23 | $ | 61.16 | $ | 45.50 | $ | 100.60 | ||||||||||
|
|
|
|
|
|
|
|
|
| |||||||||||
Total Returnb | (1.17 | %) | 19.97 | % | 35.51 | % | (54.47 | %) | 1.13 | % | ||||||||||
|
|
|
|
|
|
|
|
|
| |||||||||||
Ratios/Supplemental Data | ||||||||||||||||||||
Net assets, end of period (in thousands) | $ | 22,208 | $ | 29,644 | $ | 50,561 | $ | 35,087 | $ | 82,191 | ||||||||||
|
|
|
|
|
|
|
|
|
| |||||||||||
Ratios to average net assets: | ||||||||||||||||||||
Net investment income (loss) | (0.13 | %) | 0.03 | % | 0.19 | % | 0.75 | % | 1.12 | % | ||||||||||
Total expenses | 1.61 | % | 1.55 | % | 1.55 | % | 1.52 | % | 1.46 | % | ||||||||||
|
|
|
|
|
|
|
|
|
| |||||||||||
Portfolio turnover rate | 146 | % | 58 | % | 84 | % | 182 | % | 94 | % | ||||||||||
| a | Net investment income (loss) per share was computed using average shares outstanding throughout the period. |
| b | Total return does not reflect the impact of any additional fees charged by insurance companies and has not been annualized. |
| c | Per share amounts for the years ended December 31, 2007 — December 31, 2008 and the period January 1, 2009 through April 19, 2009 have been restated to reflect a 1:10 reverse stock split effective April 20, 2009. |
| 18 | THE RYDEX FUNDSANNUALREPORT | See Notes to Financial Statements. |
This page intentionally left blank.
THE RYDEX FUNDSANNUALREPORT | 19
PERFORMANCE REPORT AND FUND PROFILE (Unaudited) | December 31, 2011 |
OBJECTIVE: Seeks to provide investment results that match, before fees and expenses, the performance of a specific benchmark on a daily basis. The Fund’s current benchmark is the inverse (opposite) of the performance of the S&P 500® Index (the “underlying index”). The Fund does not seek to achieve its investment objective over a period of time greater than one day.
For the year ended December 31, 2011, Inverse S&P 500 Strategy Fund maintained a daily correlation of over 99% to its benchmark of -100% of the daily price movement of the S&P 500 Index. Inverse S&P 500 Strategy Fund returned -9.04%, while the S&P 500 Index gained 2.11% over the same time period.
Sectors contributing most to performance of the index were Consumer Staples, Health Care and Utilities. Financials was the largest detractor from performance, followed by Materials and Industrials.
Apple, Inc., Exxon Mobile Corp. and International Business Machines Corp. contributed the most performance to the index for 2011. Bank of America Corp., Citigroup, Inc. and Goldman Sachs Group, Inc. detracted from performance for the year.
Derivatives in the Fund were used to help provide exposure to the composition of the benchmark in the highest efficient manner and not for hedging purposes.
Due to the compounding of daily returns, leveraged and inverse funds’ returns over periods other than one day will likely differ in amount and possibly direction from the benchmark return for the same period. Investors should monitor their leveraged and inverse funds’ holdings to ensure that they are consistent with their strategies, as frequently as daily.
The effects of compounding may cause the longer-term correlation of the fund to its benchmark to diminish. The apparent discrepancy between the leveraged and unleveraged indices is the result of compounding, which is described briefly on page 4 of this report.
Standard & Poor’s 500 Index (S&P 500®) – a capitalization-weighted index covering 500 industrial, utility, transportation and financial companies of the U.S. markets (mostly NYSE Euronext issues).
Holdings Diversification (Market Exposure as % of Net Assets)
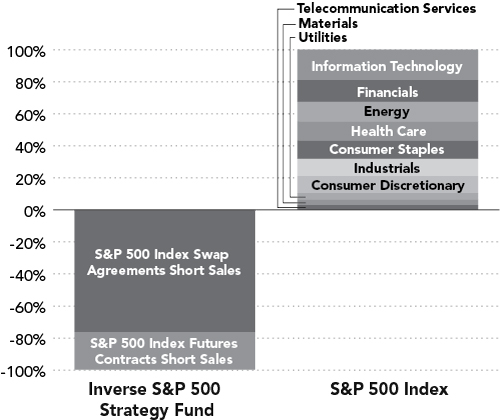
“Holdings Diversification (Market Exposure as % of Net Assets)” excludes any temporary cash investments.
Inception Date: June 9, 1997
The Fund invests principally in derivative investments such as swap agreements and futures contracts.
20 | THE RYDEX FUNDSANNUALREPORT
| PERFORMANCE REPORT AND FUND PROFILE (Unaudited) (concluded) |
INVERSE S&P 500 STRATEGY FUND
Cumulative Fund Performance*

Average Annual Returns*
Periods Ended 12/31/11
| 1 Year | 5 Year | 10 Year | ||||||||||
Inverse S&P 500 Strategy Fund | -9.04 | % | -5.13 | % | -5.17 | % | ||||||
S&P 500 Index | 2.11 | % | -0.25 | % | 2.92 | % | ||||||
| * | The performance data represents past performance that is not predictive of future results. The investment return and principal value of an investment in the Fund will fluctuate so that an investor’s shares, when redeemed, may be worth more or less than their original cost. Returns are historical and include changes in principal and reinvested dividends and capital gains and do not reflect the effect of taxes. The S&P 500 Index is an unmanaged index and, unlike the Fund, has no management fees or operating expenses to reduce its reported return. |
Returns do not reflect the impact of any additional fees charged by insurance companies.
THE RYDEX FUNDSANNUALREPORT | 21
| SCHEDULE OF INVESTMENTS | December 31, 2011 |
INVERSE S&P 500 STRATEGY FUND
| FACE AMOUNT | VALUE | |||||||
FEDERAL AGENCY DISCOUNT NOTES†† - 29.0% |
| |||||||
Federal Home Loan Bank1 | $ | 1,000,000 | $ | 999,999 | ||||
Farmer Mac1 | 1,000,000 | 999,999 | ||||||
Fannie Mae2 | 1,000,000 | 999,982 | ||||||
Freddie Mac2 | 1,000,000 | 999,962 | ||||||
|
| |||||||
Total Federal Agency Discount Notes | 3,999,942 | |||||||
|
| |||||||
REPURCHASE AGREEMENTS††,3 - 76.1% |
| |||||||
Credit Suisse Group issued 12/30/11 at 0.00% due 01/03/124 | 3,681,865 | 3,681,865 | ||||||
Mizuho Financial Group, Inc. issued 12/30/11 at 0.00% due 01/03/12 | 2,340,864 | 2,340,864 | ||||||
HSBC Group | 2,240,817 | 2,240,817 | ||||||
Deutsche Bank | 2,240,817 | 2,240,817 | ||||||
|
| |||||||
Total Repurchase Agreements | 10,504,363 | |||||||
|
| |||||||
Total Investments - 105.1% | $ | 14,504,305 | ||||||
|
| |||||||
Liabilities, Less Cash & Other Assets - (5.1)% | (703,873 | ) | ||||||
|
| |||||||
Total Net Assets - 100.0% | $ | 13,800,432 | ||||||
| CONTRACTS | UNREALIZED GAIN (LOSS ) | |||||||
FUTURES CONTRACTS SOLD SHORT† |
| |||||||
March 2012 S&P 500 Index Mini Futures Contracts (Aggregate Value of Contracts $3,253,900) | 52 | $ | (12,588 | ) | ||||
|
| |||||||
| UNITS | ||||||||
EQUITY INDEX SWAP AGREEMENTS SOLD SHORT†† |
| |||||||
Barclays Bank plc | 4,879 | $ | 26,250 | |||||
Credit Suisse Capital, LLC | 1,562 | 8,309 | ||||||
Morgan Stanley Capital Services, Inc. | 645 | 4,810 | ||||||
Goldman Sachs International | 1,262 | (2,995 | ) | |||||
|
| |||||||
(Total Notional Value $10,498,509) | $ | 36,374 | ||||||
|
| |||||||
| † | Value determined based on Level 1 inputs — See Note 4. |
| †† | Value determined based on Level 2 inputs — See Note 4. |
| 1 | The issuer operates under a Congressional charter; its securities are neither issued nor guaranteed by the U.S. Government. |
| 2 | On September 7, 2008, the issuer was placed in conservatorship by the Federal Housing Finance Agency (FHFA). As conservator, the FHFA has full powers to control the assets and operations of the firm. |
| 3 | Repurchase Agreements — See Note 5. |
| 4 | All or a portion of this security is pledged as equity index swap collateral at December 31, 2011. |
| 5 | Total Return based on S&P 500 Index +/- financing at a variable rate. |
plc — Public Limited Company
| 22 | THE RYDEX FUNDSANNUALREPORT | See Notes to Financial Statements. |
INVERSE S&P 500 STRATEGY FUND
|
STATEMENT OF ASSETS AND LIABILITIES
December 31, 2011
ASSETS: | ||||
Investments, at value | $ | 3,999,942 | ||
Repurchase agreements, at value | 10,504,363 | |||
|
| |||
Total investments | 14,504,305 | |||
Segregated cash with broker | 337,429 | |||
Unrealized appreciation on swap agreements | 39,369 | |||
Receivable for swap settlement | 3,207 | |||
Receivables: | ||||
Fund shares sold | 25,585 | |||
Variation margin | 15,340 | |||
|
| |||
Total assets | 14,925,235 | |||
|
| |||
LIABILITIES: | ||||
Unrealized depreciation on swap agreements | 2,995 | |||
Payable for: | ||||
Fund shares redeemed | 1,060,399 | |||
Management fees | 14,989 | |||
Transfer agent and administrative fees | 4,164 | |||
Investor service fees | 4,164 | |||
Portfolio accounting fees | 1,665 | |||
Miscellaneous | 36,427 | |||
|
| |||
Total liabilities | 1,124,803 | |||
|
| |||
NETASSETS | $ | 13,800,432 | ||
|
| |||
NETASSETSCONSISTOF: | ||||
Paid in capital | $ | 27,359,728 | ||
Undistributed net investment income | — | |||
Accumulated net realized loss on investments | (13,583,064 | ) | ||
Net unrealized appreciation on investments | 23,768 | |||
|
| |||
Net assets | $ | 13,800,432 | ||
Capital shares outstanding | 431,502 | |||
Net asset value per share | $ | 31.98 | ||
|
|
STATEMENT OF OPERATIONS
Year Ended December 31, 2011
INVESTMENT INCOME: | ||||
Interest | $ | 11,814 | ||
|
| |||
Total investment income | 11,814 | |||
|
| |||
EXPENSES: | ||||
Management fees | 198,424 | |||
Transfer agent and administrative fees | 55,118 | |||
Investor service fees | 55,118 | |||
Portfolio accounting fees | 22,047 | |||
Professional fees | 20,296 | |||
Custodian fees | 5,475 | |||
Trustees’ fees* | 2,140 | |||
Miscellaneous | 27,970 | |||
|
| |||
Total expenses | 386,588 | |||
|
| |||
Net investment loss | (374,774 | ) | ||
|
| |||
NET REALIZEDAND UNREALIZED GAIN (LOSS): | ||||
Net realized gain (loss) on: | ||||
Swap agreements | (3,208,304 | ) | ||
Futures contracts | (531,825 | ) | ||
|
| |||
Net realized loss | (3,740,129 | ) | ||
|
| |||
Net change in unrealized appreciation (depreciation) on: | ||||
Investments | (156 | ) | ||
Swap agreements | 41,838 | |||
Futures contracts | (11,268 | ) | ||
|
| |||
Net change in unrealized appreciation (depreciation) | 30,414 | |||
|
| |||
Net realized and unrealized loss | (3,709,715 | ) | ||
|
| |||
Net decrease in net assets resulting from operations | $ | (4,084,489 | ) | |
|
|
| * | Relates to Trustees not deemed “interested persons” within the meaning of Section 2(a)(19) of the 1940 Act. |
| See Notes to Financial Statements. | THE RYDEX FUNDSANNUALREPORT | 23 |
INVERSE S&P 500 STRATEGY FUND
STATEMENTS OF CHANGES IN NET ASSETS
| Year Ended December 31, 2011 | Year Ended December 31, 2010 | |||||||
INCREASE (DECREASE) IN NET ASSETS FROM OPERATIONS: | ||||||||
Net investment loss | $ | (374,774 | ) | $ | (600,201 | ) | ||
Net realized loss on investments | (3,740,129 | ) | (14,163,216 | ) | ||||
Net change in unrealized appreciation (depreciation) on investments | 30,414 | 332,339 | ||||||
|
|
|
| |||||
Net decrease in net assets resulting from operations | (4,084,489 | ) | (14,431,078 | ) | ||||
|
|
|
| |||||
CAPITALSHARETRANSACTIONS: | ||||||||
Proceeds from sale of shares | 394,998,962 | 398,947,468 | ||||||
Cost of shares redeemed | (395,099,572 | ) | (389,495,091 | ) | ||||
|
|
|
| |||||
Net increase (decrease) from capital share transactions | (100,610 | ) | 9,452,377 | |||||
|
|
|
| |||||
Net decrease in net assets | (4,185,099 | ) | (4,978,701 | ) | ||||
NETASSETS: | ||||||||
Beginning of year | 17,985,531 | 22,964,232 | ||||||
|
|
|
| |||||
End of year | $ | 13,800,432 | $ | 17,985,531 | ||||
|
|
|
| |||||
Undistributed net investment income at end of year | $ | — | $ | — | ||||
|
|
|
| |||||
CAPITALSHAREACTIVITY: | ||||||||
Shares sold | 11,654,915 | 9,547,734 | ||||||
Shares redeemed | (11,734,938 | ) | (9,578,574 | ) | ||||
|
|
|
| |||||
Net decrease in shares | (80,023 | ) | (30,840 | ) | ||||
|
|
|
| |||||
| 24 | THE RYDEX FUNDSANNUALREPORT | See Notes to Financial Statements. |
INVERSE S&P 500 STRATEGY FUND
FINANCIAL HIGHLIGHTS
This table is presented to show selected data for a share outstanding throughout each period, and to assist shareholders in evaluating a Fund’s performance for the periods presented.
| Year Ended December 31, 2011 | Year Ended December 31, 2010 | Year Ended December 31, 2009 | Year Ended December 31, 2008 | Year Ended December 31, 2007d | ||||||||||||||||
Per Share Data | ||||||||||||||||||||
Net asset value, beginning of period | $ | 35.16 | $ | 42.34 | $ | 58.44 | $ | 42.21 | $ | 43.90 | ||||||||||
|
|
|
|
|
|
|
|
|
| |||||||||||
Income (loss) from investment operations: | ||||||||||||||||||||
Net investment income (loss)a | (.57 | ) | (.63 | ) | (.84 | ) | (.07 | ) | 1.35 | |||||||||||
Net gain (loss) on investments (realized and unrealized) | (2.61 | ) | (6.55 | ) | (15.26 | ) | 16.17 | (1.00 | ) | |||||||||||
|
|
|
|
|
|
|
|
|
| |||||||||||
Total from investment operations | (3.18 | ) | (7.18 | ) | (16.10 | ) | 16.10 | .35 | ||||||||||||
|
|
|
|
|
|
|
|
|
| |||||||||||
Less distributions from: | ||||||||||||||||||||
Net investment income | — | — | — | (.36 | ) | (2.04 | ) | |||||||||||||
|
|
|
|
|
|
|
|
|
| |||||||||||
Total distributions | — | — | — | (.36 | ) | (2.04 | ) | |||||||||||||
|
|
|
|
|
|
|
|
|
| |||||||||||
Other capital items | — | — | — | .49 | c | — | ||||||||||||||
|
|
|
|
|
|
|
|
|
| |||||||||||
Net asset value, end of period | $ | 31.98 | $ | 35.16 | $ | 42.34 | $ | 58.44 | $ | 42.21 | ||||||||||
|
|
|
|
|
|
|
|
|
| |||||||||||
Total Returnb | (9.04 | %) | (16.96 | %) | (27.55 | %) | 39.25 | %c | 0.83 | % | ||||||||||
|
|
|
|
|
|
|
|
|
| |||||||||||
Ratios/Supplemental Data | ||||||||||||||||||||
Net assets, end of period (in thousands) | $ | 13,800 | $ | 17,986 | $ | 22,964 | $ | 23,877 | $ | 21,581 | ||||||||||
|
|
|
|
|
|
|
|
|
| |||||||||||
Ratios to average net assets: | ||||||||||||||||||||
Net investment income (loss) | (1.70 | %) | (1.55 | %) | (1.57 | %) | (0.14 | %) | 3.04 | % | ||||||||||
Total expenses | 1.75 | % | 1.70 | % | 1.72 | % | 1.67 | % | 1.63 | % | ||||||||||
|
|
|
|
|
|
|
|
|
| |||||||||||
Portfolio turnover rate | — | — | — | — | — | |||||||||||||||
| a | Net investment income (loss) per share was computed using average shares outstanding throughout the period. |
| b | Total return does not reflect the impact of any additional fees charged by insurance companies and has not been annualized. |
| c | Excluding the Capital Contribution, the Fund’s total return would have been 38.09%. |
| d | Per share amounts for the period December 31, 2006 – April 22, 2007 have been restated to reflect a 1:10 reverse stock split effective April 23, 2007. |
| See Notes to Financial Statements. | THE RYDEX FUNDSANNUALREPORT | 25 |
| PERFORMANCE REPORT AND FUND PROFILE (Unaudited) | December 31, 2011 |
OBJECTIVE: Seeks to provide investment results that correspond, before fees and expenses, to a benchmark for over-the-counter securities on a daily basis. The Fund’s current benchmark is the NASDAQ-100 Index® (the “underlying index”).
For the year ended December 31, 2011, NASDAQ-100® Fund maintained a daily correlation of over 99% to its benchmark of 100% of the daily price movement of the NASDAQ-100 Index. The Fund rose 2.17%, while the NASDAQ-100 Index gained 3.66% over the same time period.
Information Technology, which accounted for 66% of the index, and Health Care contributed most to the performance of the index during the year, while lightly weighted Industrials detracted most from return.
Apple, Inc., QUALCOMM, Inc. and Google, Inc. were among the stocks contributing the most performance to the index for the year, while Oracle Corp., Research In Motion Ltd. and Teva Pharmaceutical Industries Ltd. detracted from performance for the year.
Derivatives in the Fund were used to help provide exposure to the composition of the benchmark in the highest efficient manner and not for hedging purposes.
The NASDAQ-100® Index includes 100 of the largest domestic and international non-financial securities listed on The Nasdaq Stock Market based on market capitalization. The Index reflects companies across major industry groups including computer hardware and software, telecommunications, retail/wholesale trade and biotechnology. It does not contain securities of financial companies, including investment companies.
Holdings Diversification (Market Exposure as % of Net Assets)
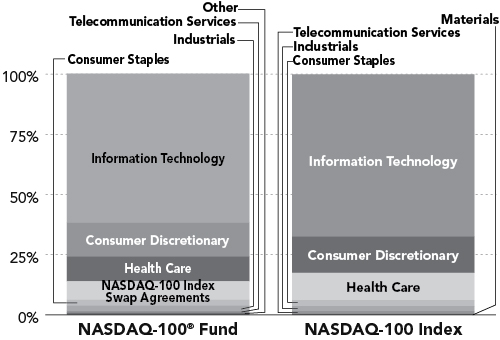
“Holdings Diversification (Market Exposure as % of Net Assets)” excludes any temporary cash investments.
Inception Date: May 7, 1997
Ten Largest Holdings (% of Total Net Assets) | ||||
Apple, Inc. | 13.8 | % | ||
Microsoft Corp. | 8.0 | % | ||
Google, Inc. — Class A | 6.1 | % | ||
Oracle Corp. | 4.8 | % | ||
Intel Corp. | 4.5 | % | ||
Cisco Systems, Inc. | 3.6 | % | ||
QUALCOMM, Inc. | 3.4 | % | ||
Amazon.com, Inc. | 2.9 | % | ||
Amgen, Inc. | 2.1 | % | ||
Comcast Corp. — Class A | 1.8 | % | ||
|
| |||
Top Ten Total | 51.0 | % | ||
|
| |||
“Ten Largest Holdings” exclude any temporary cash or derivative investments.
26 | THE RYDEX FUNDSANNUALREPORT
| PERFORMANCE REPORT AND FUND PROFILE (Unaudited) (concluded) |
NASDAQ-100® FUND
Cumulative Fund Performance*
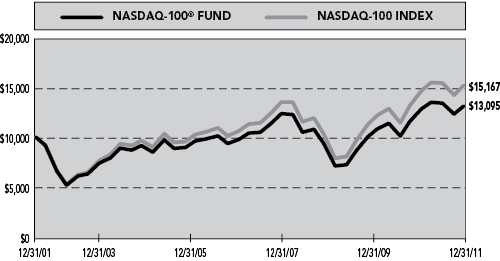
Average Annual Returns*
Periods Ended 12/31/11
| 1 Year | 5 Year | 10 Year | ||||||||||
NASDAQ-100® Fund | 2.17 | % | 4.72 | % | 2.73 | % | ||||||
NASDAQ-100 Index | 3.66 | % | 6.05 | % | 4.25 | % | ||||||
| * | The performance data represents past performance that is not predictive of future results. The investment return and principal value of an investment in the Fund will fluctuate so that an investor’s shares, when redeemed, may be worth more or less than their original cost. Returns are historical and include changes in principal and reinvested dividends and capital gains and do not reflect the effect of taxes. The NASDAQ-100 Index is an unmanaged index and, unlike the Fund, has no management fees or operating expenses to reduce its reported return. |
| Returns do not reflect the impact of any additional fees charged by insurance companies. |
THE RYDEX FUNDSANNUALREPORT | 27
| SCHEDULE OF INVESTMENTS | December 31, 2011 |
NASDAQ-100® FUND
| SHARES | VALUE | |||||||
COMMON STOCKS† - 92.1% | ||||||||
INFORMATION TECHNOLOGY - 61.8% |
| |||||||
Apple, Inc.* | 15,078 | $ | 6,106,590 | |||||
Microsoft Corp. | 136,461 | 3,542,528 | ||||||
Google, Inc. — Class A* | 4,148 | 2,679,193 | ||||||
Oracle Corp. | 81,832 | 2,098,991 | ||||||
Intel Corp. | 82,601 | 2,003,074 | ||||||
Cisco Systems, Inc. | 87,200 | 1,576,576 | ||||||
QUALCOMM, Inc. | 27,272 | 1,491,778 | ||||||
eBay, Inc.* | 20,938 | 635,050 | ||||||
Baidu, Inc. ADR* | 4,394 | 511,769 | ||||||
Automatic Data Processing, Inc. | 7,926 | 428,083 | ||||||
Dell, Inc.* | 29,137 | 426,274 | ||||||
Yahoo!, Inc.* | 20,124 | 324,600 | ||||||
Cognizant Technology Solutions Corp. — Class A* | 4,905 | 315,441 | ||||||
Intuit, Inc. | 4,831 | 254,062 | ||||||
Broadcom Corp. — Class A* | 7,882 | 231,416 | ||||||
Applied Materials, Inc. | 21,376 | 228,937 | ||||||
Activision Blizzard, Inc. | 18,560 | 228,659 | ||||||
Adobe Systems, Inc.* | 7,962 | 225,086 | ||||||
NetApp, Inc.* | 5,977 | 216,786 | ||||||
Altera Corp. | 5,198 | 192,846 | ||||||
SanDisk Corp.* | 3,902 | 192,017 | ||||||
Symantec Corp.* | 11,958 | 187,143 | ||||||
Citrix Systems, Inc.* | 3,020 | 183,374 | ||||||
Check Point Software Technologies Ltd.* | 3,367 | 176,902 | ||||||
Paychex, Inc. | 5,874 | 176,866 | ||||||
CA, Inc. | 8,002 | 161,760 | ||||||
NVIDIA Corp.* | 9,898 | 137,186 | ||||||
F5 Networks, Inc.* | 1,288 | 136,683 | ||||||
Xilinx, Inc. | 4,257 | 136,479 | ||||||
Marvell Technology Group Ltd.* | 9,827 | 136,104 | ||||||
Fiserv, Inc.* | 2,282 | 134,045 | ||||||
KLA-Tencor Corp. | 2,706 | 130,565 | ||||||
Seagate Technology plc | 7,536 | 123,590 | ||||||
Maxim Integrated Products, Inc. | 4,732 | 123,221 | ||||||
Nuance Communications, Inc.* | 4,872 | 122,580 | ||||||
Research In Motion Ltd.* | 8,444 | 122,438 | ||||||
Avago Technologies Ltd. | 3,982 | 114,921 | ||||||
Microchip Technology, Inc. | 3,100 | 113,553 | ||||||
Autodesk, Inc.* | 3,674 | 111,432 | ||||||
Linear Technology Corp. | 3,695 | 110,961 | ||||||
Electronic Arts, Inc.* | 5,371 | 110,643 | ||||||
Micron Technology, Inc.* | 16,022 | 100,778 | ||||||
Akamai Technologies, Inc.* | 2,907 | 93,838 | ||||||
VeriSign, Inc. | 2,577 | 92,050 | ||||||
BMC Software, Inc.* | 2,758 | 90,407 | ||||||
Lam Research Corp.* | 1,933 | 71,560 | ||||||
Flextronics International Ltd.* | 11,565 | 65,458 | ||||||
Infosys Ltd. ADR | 1,261 | 64,790 | ||||||
|
| |||||||
Total Information Technology | 27,239,083 | |||||||
|
| |||||||
CONSUMER DISCRETIONARY - 14.1% | ||||||||
Amazon.com, Inc.* | 7,373 | 1,276,266 | ||||||
Comcast Corp. — Class A | 33,940 | 804,717 | ||||||
Starbucks Corp. | 12,095 | 556,491 | ||||||
News Corp. — Class A | 27,939 | 498,432 | ||||||
DIRECTV — Class A* | 11,445 | 489,388 | ||||||
Priceline.com, Inc.* | 803 | 375,571 | ||||||
Bed Bath & Beyond, Inc.* | 3,967 | 229,967 | ||||||
Wynn Resorts Ltd. | 2,024 | 223,632 | ||||||
Ross Stores, Inc. | 3,748 | 178,142 | ||||||
O’Reilly Automotive, Inc.* | 2,076 | 165,976 | ||||||
Dollar Tree, Inc.* | 1,926 | 160,070 | ||||||
Staples, Inc. | 11,343 | 157,554 | ||||||
Mattel, Inc. | 5,496 | 152,569 | ||||||
Liberty Interactive Corp. — Class A* | 9,102 | 147,589 | ||||||
Garmin Ltd. | 3,141 | 125,043 | ||||||
Apollo Group, Inc. — Class A* | 2,115 | 113,935 | ||||||
Sirius XM Radio, Inc.* | 60,842 | 110,732 | ||||||
Virgin Media, Inc. | 4,881 | 104,356 | ||||||
Fossil, Inc.* | 1,010 | 80,154 | ||||||
Netflix, Inc.* | 900 | 62,361 | ||||||
Expedia, Inc. | 1,960 | 56,865 | ||||||
Ctrip.com International Ltd. ADR* | 2,391 | 55,949 | ||||||
Sears Holdings Corp.* | 1,731 | 55,011 | ||||||
TripAdvisor, Inc.* | 1,960 | 49,399 | ||||||
Orchard Supply Hardware Stores Corp. — Class A*,5,††† | 57 | 429 | ||||||
|
| |||||||
Total Consumer Discretionary | 6,230,598 | |||||||
|
| |||||||
HEALTH CARE - 10.4% | ||||||||
Amgen, Inc. | 14,222 | 913,195 | ||||||
Gilead Sciences, Inc.* | 12,183 | 498,650 | ||||||
Celgene Corp.* | 7,198 | 486,585 | ||||||
Teva Pharmaceutical Industries Ltd. ADR | 11,349 | 458,046 | ||||||
Biogen Idec, Inc.* | 3,936 | 433,157 | ||||||
Express Scripts, Inc.* | 7,878 | 352,068 | ||||||
Intuitive Surgical, Inc.* | 630 | 291,696 | ||||||
Alexion Pharmaceuticals, Inc.* | 3,006 | 214,929 | ||||||
Cerner Corp.* | 2,741 | 167,886 | ||||||
Mylan, Inc.* | 6,917 | 148,439 | ||||||
Perrigo Co. | 1,506 | 146,534 | ||||||
Life Technologies Corp.* | 2,893 | 112,567 | ||||||
Vertex Pharmaceuticals, Inc.* | 3,380 | 112,250 | ||||||
Henry Schein, Inc.* | 1,466 | 94,454 | ||||||
DENTSPLY International, Inc. | 2,296 | 80,337 | ||||||
Warner Chilcott plc — Class A* | 4,125 | 62,411 | ||||||
|
| |||||||
Total Health Care | 4,573,204 | |||||||
|
| |||||||
| 28 | THE RYDEX FUNDSANNUALREPORT | See Notes to Financial Statements. |
| SCHEDULE OF INVESTMENTS (concluded) | December 31, 2011 |
NASDAQ-100® FUND
| SHARES | VALUE | |||||||
CONSUMER STAPLES - 2.3% |
| |||||||
Costco Wholesale Corp. | 7,033 | $ | 585,990 | |||||
Whole Foods Market, Inc. | 2,905 | 202,130 | ||||||
Hansen Natural Corp.* | 1,410 | 129,917 | ||||||
Green Mountain Coffee Roasters, Inc.* | 2,507 | 112,439 | ||||||
|
| |||||||
Total Consumer Staples | 1,030,476 | |||||||
|
| |||||||
INDUSTRIALS - 2.1% | ||||||||
PACCAR, Inc. | 5,807 | 217,588 | ||||||
Fastenal Co. | 4,785 | 208,674 | ||||||
CH Robinson Worldwide, Inc. | 2,667 | 186,103 | ||||||
Expeditors International of Washington, Inc. | 3,437 | 140,780 | ||||||
Stericycle, Inc.* | 1,384 | 107,841 | ||||||
First Solar, Inc.* | 1,400 | 47,264 | ||||||
|
| |||||||
Total Industrials | 908,250 | |||||||
|
| |||||||
TELECOMMUNICATION SERVICES - 0.9% | ||||||||
Vodafone Group plc ADR | 14,899 | 417,619 | ||||||
|
| |||||||
MATERIALS - 0.5% | ||||||||
Sigma-Aldrich Corp. | 1,951 | 121,860 | ||||||
Randgold Resources Ltd. ADR | 923 | 94,238 | ||||||
|
| |||||||
Total Materials | 216,098 | |||||||
|
| |||||||
Total Common Stocks | 40,615,328 | |||||||
|
| |||||||
PREFERRED STOCKS - 0.0% | ||||||||
Orchard Supply Hardware — Class A*,1,5,††† | 57 | — | ||||||
|
| |||||||
Total Preferred Stocks (Cost $2,334) | — | |||||||
|
| |||||||
| FACE AMOUNT | ||||||||
REPURCHASE AGREEMENTS††,2 - 8.6% |
| |||||||
Credit Suisse Group issued 12/30/11 at 0.00% due 01/03/123 | $ | 1,216,566 | 1,216,566 | |||||
Mizuho Financial Group, Inc. issued 12/30/11 at 0.00% due 01/03/12 | 888,724 | 888,724 | ||||||
HSBC Group issued 12/30/11 at 0.00% due 01/03/12 | 850,741 | 850,741 | ||||||
Deutsche Bank issued 12/30/11 at 0.00% due 01/03/12 | 850,740 | 850,740 | ||||||
|
| |||||||
Total Repurchase Agreements | 3,806,771 | |||||||
|
| |||||||
Total Investments - 100.7% | $ | 44,422,099 | ||||||
|
| |||||||
Liabilities, Less Cash & Other Assets - (0.7)% | (302,153 | ) | ||||||
|
| |||||||
Total Net Assets - 100.0% | $ | 44,119,946 | ||||||
| CONTRACTS | UNREALIZED LOSS | |||||||
FUTURES CONTRACTS PURCHASED† | ||||||||
March 2012 NASDAQ-100 Index Mini Futures Contracts (Aggregate Value of Contracts $136,305) | 3 | $ | (11 | ) | ||||
|
| |||||||
| UNITS | ||||||||
EQUITY INDEX SWAP AGREEMENTS†† | ||||||||
Barclays Bank plc January 2012 NASDAQ-100 Index Swap, Terminating 01/31/124 | 288 | $ | (1,960 | ) | ||||
Credit Suisse Capital, LLC January 2012 NASDAQ-100 Index Swap, Terminating 01/31/124 | 491 | (3,440 | ) | |||||
Morgan Stanley Capital Services, Inc. January 2012 NASDAQ-100 Index Swap, Terminating 01/30/124 (Notional Value $661,789) | 291 | (4,408 | ) | |||||
Goldman Sachs International January 2012 NASDAQ-100 Index Swap, Terminating 01/27/124 (Notional Value $959,146) | 421 | (6,367 | ) | |||||
|
| |||||||
(Total Notional Value $3,396,314) | $ | (16,175 | ) | |||||
|
| |||||||
| * | Non-income producing security. |
| † | Value determined based on Level 1 inputs — See Note 4. |
| †† | Value determined based on Level 2 inputs — See Note 4. |
| ††† | Value determined based on Level 3 inputs — See Note 4. |
| 1 | Perpetual maturity. |
| 2 | Repurchase Agreements — See Note 5. |
| 3 | All or a portion of this security is pledged as equity index swap collateral at December 31, 2011. |
| 4 | Total Return based on NASDAQ-100 Index +/- financing at a variable rate. |
| 5 | Illiquid Security. |
ADR — American Depositary Receipt
plc — Public Limited Company
| See Notes to Financial Statements. | THE RYDEX FUNDSANNUALREPORT | 29 |
NASDAQ-100® FUND
STATEMENT OF ASSETS AND LIABILITIES
December 31, 2011
ASSETS: | ||||
Investments, at value | $ | 40,615,328 | ||
Repurchase agreements, at value | 3,806,771 | |||
|
| |||
Total investments | 44,422,099 | |||
Segregated cash with broker | 147,535 | |||
Receivables: | ||||
Fund shares sold | 70,550 | |||
Dividends | 23,600 | |||
Variation margin | 1,800 | |||
|
| |||
Total assets | 44,665,584 | |||
|
| |||
LIABILITIES: | ||||
Unrealized depreciation on swap agreements | 16,175 | |||
Overdraft due to custodian bank | 304 | |||
Payable for: | ||||
Fund shares redeemed | 384,450 | |||
Management fees | 30,166 | |||
Transfer agent and administrative fees | 10,055 | |||
Investor service fees | 10,055 | |||
Swap settlement | 4,132 | |||
Portfolio accounting fees | 4,022 | |||
Miscellaneous | 86,279 | |||
|
| |||
Total liabilities | 545,638 | |||
|
| |||
NETASSETS | $ | 44,119,946 | ||
|
| |||
NETASSETSCONSISTOF: | ||||
Paid in capital | $ | 41,053,723 | ||
Accumulated net investment loss | (1 | ) | ||
Accumulated net realized loss on investments | (12,619,417 | ) | ||
Net unrealized appreciation on investments | 15,685,641 | |||
|
| |||
Net assets | $ | 44,119,946 | ||
Capital shares outstanding | 2,283,079 | |||
Net asset value per share | $ | 19.32 | ||
|
|
STATEMENT OF OPERATIONS
Year Ended December 31, 2011
INVESTMENT INCOME: | ||||
Dividends (net of foreign withholding tax of $129) | $ | 322,376 | ||
Interest | 8,297 | |||
|
| |||
Total investment income | 330,673 | |||
|
| |||
EXPENSES: | ||||
Management fees | 375,779 | |||
Transfer agent and administrative fees | 125,260 | |||
Investor service fees | 125,260 | |||
Portfolio accounting fees | 50,103 | |||
Custodian fees | 12,265 | |||
Trustees’ fees* | 4,976 | |||
Miscellaneous | 129,875 | |||
|
| |||
Total expenses | 823,518 | |||
|
| |||
Net investment loss | (492,845 | ) | ||
|
| |||
NET REALIZEDAND UNREALIZED GAIN (LOSS): | ||||
Net realized gain (loss) on: | ||||
Investments | 7,614,785 | |||
Swap agreements | (258,099 | ) | ||
Futures contracts | (981,982 | ) | ||
|
| |||
Net realized gain | 6,374,704 | |||
|
| |||
Net change in unrealized appreciation (depreciation) on: | ||||
Investments | (6,775,985 | ) | ||
Swap agreements | 51,996 | |||
Futures contracts | (19,611 | ) | ||
|
| |||
Net change in unrealized appreciation (depreciation) | (6,743,600 | ) | ||
|
| |||
Net realized and unrealized loss | (368,896 | ) | ||
|
| |||
Net decrease in net assets resulting from operations | $ | (861,741 | ) | |
|
|
| * | Relates to Trustees not deemed “interested persons” within the meaning of Section 2(a)(19) of the 1940 Act. |
| 30 | THE RYDEX FUNDSANNUALREPORT | See Notes to Financial Statements. |
NASDAQ-100® FUND
STATEMENTS OF CHANGES IN NET ASSETS
| Year Ended December 31, 2011 | Year Ended December 31, 2010 | |||||||
INCREASE (DECREASE) IN NET ASSETS FROM OPERATIONS: | ||||||||
Net investment loss | $ | (492,845 | ) | $ | (404,894 | ) | ||
Net realized gain on investments | 6,374,704 | 11,139,559 | ||||||
Net change in unrealized appreciation (depreciation) on investments | (6,743,600 | ) | (3,046,693 | ) | ||||
|
|
|
| |||||
Net increase (decrease) in net assets resulting from operations | (861,741 | ) | 7,687,972 | |||||
|
|
|
| |||||
CAPITALSHARETRANSACTIONS: | ||||||||
Proceeds from sale of shares | 226,910,655 | 209,726,239 | ||||||
Cost of shares redeemed | (237,224,363 | ) | (219,660,925 | ) | ||||
|
|
|
| |||||
Net decrease from capital share transactions | (10,313,708 | ) | (9,934,686 | ) | ||||
|
|
|
| |||||
Net decrease in net assets | (11,175,449 | ) | (2,246,714 | ) | ||||
NETASSETS: | ||||||||
Beginning of year | 55,295,395 | 57,542,109 | ||||||
|
|
|
| |||||
End of year | $ | 44,119,946 | $ | 55,295,395 | ||||
|
|
|
| |||||
Accumulated/(Undistributed) net investment income/(loss) at end of year | $ | (1 | ) | $ | — | |||
|
|
|
| |||||
CAPITALSHAREACTIVITY: | ||||||||
Shares sold | 11,600,013 | 12,635,076 | ||||||
Shares redeemed | (12,240,899 | ) | (13,316,411 | ) | ||||
|
|
|
| |||||
Net decrease in shares | (640,886 | ) | (681,335 | ) | ||||
|
|
|
| |||||
| See Notes to Financial Statements. | THE RYDEX FUNDSANNUALREPORT | 31 |
NASDAQ-100® FUND
FINANCIAL HIGHLIGHTS
This table is presented to show selected data for a share outstanding throughout each period, and to assist shareholders in evaluating a Fund’s performance for the periods presented.
| Year Ended December 31, 2011 | Year Ended December 31, 2010 | Year Ended December 31, 2009 | Year Ended December 31, 2008 | Year Ended December 31, 2007 | ||||||||||||||||
Per Share Data | ||||||||||||||||||||
Net asset value, beginning of period | $ | 18.91 | $ | 15.96 | $ | 10.50 | $ | 18.12 | $ | 15.39 | ||||||||||
|
|
|
|
|
|
|
|
|
| |||||||||||
Income (loss) from investment operations: | ||||||||||||||||||||
Net investment income (loss)a | (.19 | ) | (.14 | ) | (.12 | ) | (.09 | ) | .03 | |||||||||||
Net gain (loss) on investments (realized and unrealized) | .60 | 3.09 | 5.58 | (7.51 | ) | 2.71 | ||||||||||||||
|
|
|
|
|
|
|
|
|
| |||||||||||
Total from investment operations | .41 | 2.95 | 5.46 | (7.60 | ) | 2.74 | ||||||||||||||
|
|
|
|
|
|
|
|
|
| |||||||||||
Less distributions from: | ||||||||||||||||||||
Net investment income | — | — | — | (.02 | ) | (.01 | ) | |||||||||||||
|
|
|
|
|
|
|
|
|
| |||||||||||
Total distributions | — | — | — | (.02 | ) | (.01 | ) | |||||||||||||
|
|
|
|
|
|
|
|
|
| |||||||||||
Net asset value, end of period | $ | 19.32 | $ | 18.91 | $ | 15.96 | $ | 10.50 | $ | 18.12 | ||||||||||
|
|
|
|
|
|
|
|
|
| |||||||||||
Total Returnb | 2.17 | % | 18.48 | % | 52.00 | % | (41.91 | %) | 17.82 | % | ||||||||||
|
|
|
|
|
|
|
|
|
| |||||||||||
Ratios/Supplemental Data | ||||||||||||||||||||
Net assets, end of period (in thousands) | $ | 44,120 | $ | 55,295 | $ | 57,542 | $ | 32,986 | $ | 82,492 | ||||||||||
|
|
|
|
|
|
|
|
|
| |||||||||||
Ratios to average net assets: | ||||||||||||||||||||
Net investment loss | (0.98 | %) | (0.85 | %) | (0.94 | %) | (0.62 | %) | 0.18 | % | ||||||||||
Total expenses | 1.64 | % | 1.59 | % | 1.59 | % | 1.55 | % | 1.51 | % | ||||||||||
|
|
|
|
|
|
|
|
|
| |||||||||||
Portfolio turnover rate | 68 | % | 49 | % | 59 | % | 107 | % | 110 | % | ||||||||||
| a | Net investment income (loss) per share was computed using average shares outstanding throughout the period. |
| b | Total return does not reflect the impact of any additional fees charged by insurance companies and has not been annualized. |
| 32 | THE RYDEX FUNDSANNUALREPORT | See Notes to Financial Statements. |
This page intentionally left blank.
THE RYDEX FUNDSANNUALREPORT | 33
| PERFORMANCE REPORT AND FUND PROFILE (Unaudited) | December 31, 2011 |
INVERSE NASDAQ-100® STRATEGY FUND
OBJECTIVE: Seeks to provide investment results that match, before fees and expenses, the performance of a specific benchmark on a daily basis. The Fund’s current benchmark is the inverse (opposite) of the performance of the NASDAQ-100 Index® (the “underlying index”). The Fund does not seek to achieve its investment objective over a period of time greater than one day.
For the year ended December 31, 2011, with the NASDAQ-100 Index up 3.66%, the Inverse NASDAQ-100® Fund returned -10.08%. For the one-year period ended December 31, 2011, Inverse NASDAQ-100® Fund maintained a daily correlation of over 99% to its benchmark of - 100% of the daily price movement of the NASDAQ-100 Index.
Information Technology, which accounted for 66% of the index, and Health Care contributed most to the performance of the index during the year, while lightly weighted Industrials detracted most from return.
Apple, Inc., QUALCOMM, Inc. and Google, Inc. were among the stocks contributing the most performance to the index for the year, while Oracle Corp., Research In Motion Ltd. and Teva Pharmaceutical Industries Ltd. detracted from performance for the year.
Derivatives in the Fund were used to help provide exposure to the composition of the benchmark in the highest efficient manner and not for hedging purposes.
Due to the compounding of daily returns, leveraged and inverse funds’ returns over periods other than one day will likely differ in amount and possibly direction from the benchmark return for the same period. Investors should monitor their leveraged and inverse funds’ holdings to ensure that they are consistent with their strategies, as frequently as daily.
The effects of compounding may cause the longer-term correlation of the fund to its benchmark to diminish. The apparent discrepancy between the leveraged and unleveraged indices is the result of compounding, which is described briefly on page 4 of this report.
The NASDAQ-100® Index includes 100 of the largest domestic and international non-financial securities listed on The Nasdaq Stock Market based on market capitalization. The Index reflects companies across major industry groups including computer hardware and software, telecommunications, retail/wholesale trade and biotechnology. It does not contain securities of financial companies, including investment companies.
Holdings Diversification (Market Exposure as % of Net Assets)
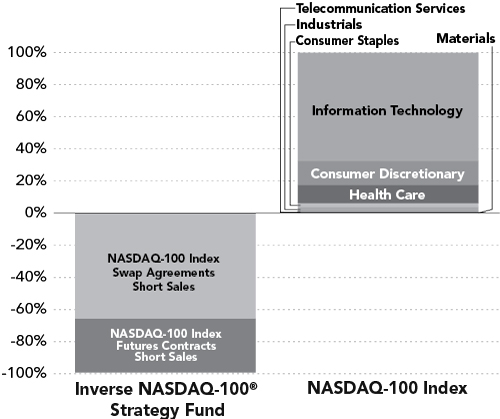
“Holdings Diversification (Market Exposure as % of Net Assets)” excludes any temporary cash investments.
Inception Date: May 21, 2001
The Fund invests principally in derivative investments such as swap agreements and futures contracts.
34 | THE RYDEX FUNDSANNUALREPORT
PERFORMANCE REPORT AND FUND PROFILE (Unaudited) (concluded)
INVERSE NASDAQ-100® STRATEGY FUND
Cumulative Fund Performance*
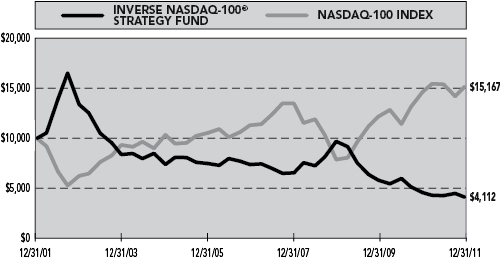
Average Annual Returns*
Periods Ended 12/31/11
| 1 Year | 5 Year | 10 Year | ||||||||||
Inverse NASDAQ-100® Strategy Fund | -10.08 | % | -11.04 | % | -8.50 | % | ||||||
NASDAQ-100 Index | 3.66 | % | 6.05 | % | 4.25 | % | ||||||
| * | The performance data represents past performance that is not predictive of future results. The investment return and principal value of an investment in the Fund will fluctuate so that an investor’s shares, when redeemed, may be worth more or less than their original cost. Returns are historical and include changes in principal and reinvested dividends and capital gains and do not reflect the effect of taxes. The NASDAQ-100 Index is an unmanaged index and, unlike the Fund, has no management fees or operating expenses to reduce its reported return. |
| Returns do not reflect the impact of any additional fees charged by insurance companies. |
THE RYDEX FUNDSANNUALREPORT | 35
| SCHEDULE OF INVESTMENTS | December 31, 2011 |
INVERSE NASDAQ-100® STRATEGY FUND
| FACE AMOUNT | VALUE | |||||||
FEDERAL AGENCY |
| |||||||
Federal Home Loan Bank1 0.01% due 01/04/12 | $ | 1,000,000 | $ | 999,999 | ||||
Fannie Mae2 0.01% due 03/13/12 | 1,000,000 | 999,961 | ||||||
|
| |||||||
Total Federal Agency Discount Notes | 1,999,960 | |||||||
|
| |||||||
REPURCHASE AGREEMENTS††,3 - 69.3% | ||||||||
Credit Suisse Group issued 12/30/11 at 0.00% due 01/03/124 | 1,480,245 | 1,480,245 | ||||||
Mizuho Financial Group, Inc. issued 12/30/11 at 0.00% due 01/03/12 | 1,256,795 | 1,256,795 | ||||||
HSBC Group issued 12/30/11 at 0.00% due 01/03/12 | 1,203,082 | 1,203,082 | ||||||
Deutsche Bank issued 12/30/11 at 0.00% due 01/03/12 | 1,203,082 | 1,203,082 | ||||||
|
| |||||||
Total Repurchase Agreements | 5,143,204 | |||||||
|
| |||||||
Total Investments - 96.2% | $ | 7,143,164 | ||||||
|
| |||||||
Cash & Other Assets, Less Liabilities - 3.8% | 280,130 | |||||||
|
| |||||||
Total Net Assets - 100.0% | $ | 7,423,294 | ||||||
| CONTRACTS | UNREALIZED GAIN | |||||||
FUTURES CONTRACTS SOLD SHORT† | ||||||||
March 2012 NASDAQ-100 Index Mini Futures Contracts (Aggregate Value of Contracts $2,498,925) | 55 | $ | 6,477 | |||||
|
| |||||||
| UNITS | ||||||||
EQUITY INDEX SWAP AGREEMENTS SOLD SHORT†† | ||||||||
Barclays Bank plc January 2012 NASDAQ-100 Index Swap, Terminating 01/31/125 (Notional Value $2,192,236) | 962 | $ | 6,801 | |||||
Credit Suisse Capital, LLC January 2012 NASDAQ-100 Index Swap, Terminating 01/31/125 (Notional Value $1,815,699) | 797 | 5,583 | ||||||
Goldman Sachs International January 2012 NASDAQ-100 Index Swap, Terminating 01/27/125 (Notional Value $535,736) | 235 | 3,551 | ||||||
Morgan Stanley Capital Services, Inc. January 2012 NASDAQ-100 Index Swap, Terminating 01/30/125 (Notional Value $326,711) | 143 | 2,157 | ||||||
|
| |||||||
(Total Notional Value $4,870,382) | $ | 18,092 | ||||||
|
| |||||||
| † | Value determined based on Level 1 inputs — See Note 4. |
| †† | Value determined based on Level 2 inputs — See Note 4. |
| 1 | The issuer operates under a Congressional charter; its securities are neither issued nor guaranteed by the U.S. Government. |
| 2 | On September 7, 2008, the issuer was placed in conservatorship by the Federal Housing Finance Agency (FHFA). As conservator, the FHFA has full powers to control the assets and operations of the firm. |
| 3 | Repurchase Agreements — See Note 5. |
| 4 | All or a portion of this security is pledged as equity index swap collateral at December 31, 2011. |
| 5 | Total Return based on NASDAQ-100 Index +/- financing at a variable rate. |
| plc — Public Limited Company |
| 36 | THE RYDEX FUNDSANNUALREPORT | See Notes to Financial Statements. |
INVERSE NASDAQ-100® STRATEGY FUND
STATEMENT OF ASSETS AND LIABILITIES
December 31, 2011
ASSETS: | ||||
Investments, at value | $ | 1,999,960 | ||
Repurchase agreements, at value | 5,143,204 | |||
|
| |||
Total investments | 7,143,164 | |||
Segregated cash with broker | 252,785 | |||
Unrealized appreciation on swap agreements | 18,092 | |||
Receivables: | ||||
Fund shares sold | 48,937 | |||
Variation margin | 5,969 | |||
|
| |||
Total assets | 7,468,947 | |||
|
| |||
LIABILITIES: | ||||
Payable for: | ||||
Fund shares redeemed | 22,104 | |||
Management fees | 5,534 | |||
Transfer agent and administrative fees | 1,537 | |||
Investor service fees | 1,537 | |||
Portfolio accounting fees | 615 | |||
Miscellaneous | 14,326 | |||
|
| |||
Total liabilities | 45,653 | |||
|
| |||
NETASSETS | $ | 7,423,294 | ||
|
| |||
NETASSETSCONSISTOF: | ||||
Paid in capital | $ | 31,087,105 | ||
Undistributed net investment income | — | |||
Accumulated net realized loss on investments | (23,688,361 | ) | ||
Net unrealized appreciation on investments | 24,550 | |||
|
| |||
Net assets | $ | 7,423,294 | ||
Capital shares outstanding | 698,872 | |||
Net asset value per share | $ | 10.62 | ||
|
|
STATEMENT OF OPERATIONS
Year Ended December 31, 2011
INVESTMENT INCOME: | ||||
Interest | $ | 4,123 | ||
|
| |||
Total investment income | 4,123 | |||
|
| |||
EXPENSES: | ||||
Management fees | 75,628 | |||
Transfer agent and administrative fees | 21,008 | |||
Investor service fees | 21,008 | |||
Portfolio accounting fees | 8,403 | |||
Custodian fees | 2,078 | |||
Trustees’ fees* | 835 | |||
Miscellaneous | 21,352 | |||
|
| |||
Total expenses | 150,312 | |||
|
| |||
Net investment loss | (146,189 | ) | ||
|
| |||
NET REALIZEDAND UNREALIZED GAIN (LOSS): | ||||
Net realized gain (loss) on: | ||||
Swap agreements | (564,650 | ) | ||
Futures contracts | (717,404 | ) | ||
|
| |||
Net realized loss | (1,282,054 | ) | ||
|
| |||
Net change in unrealized appreciation (depreciation) on: | ||||
Investments | (19 | ) | ||
Swap agreements | (17,977 | ) | ||
Futures contracts | 5,409 | |||
|
| |||
Net change in unrealized appreciation (depreciation) | (12,587 | ) | ||
|
| |||
Net realized and unrealized loss | (1,294,641 | ) | ||
|
| |||
Net decrease in net assets resulting from operations | $ | (1,440,830 | ) | |
|
|
| * | Relates to Trustees not deemed “interested persons” within the meaning of Section 2(a)(19) of the 1940 Act. |
| See Notes to Financial Statements. | THE RYDEX FUNDSANNUALREPORT | 37 |
INVERSE NASDAQ-100® STRATEGY FUND
STATEMENTS OF CHANGES IN NET ASSETS
| Year Ended December 31, 2011 | Year Ended December 31, 2010 | |||||||
INCREASE (DECREASE) IN NET ASSETS FROM OPERATIONS: | ||||||||
Net investment loss | $ | (146,189 | ) | $ | (234,162 | ) | ||
Net realized loss on investments | (1,282,054 | ) | (4,135,013 | ) | ||||
Net change in unrealized appreciation (depreciation) on investments | (12,587 | ) | 507,808 | |||||
|
|
|
| |||||
Net decrease in net assets resulting from operations | (1,440,830 | ) | (3,861,367 | ) | ||||
|
|
|
| |||||
CAPITALSHARETRANSACTIONS: | ||||||||
Proceeds from sale of shares | 162,231,430 | 203,935,349 | ||||||
Cost of shares redeemed | (161,014,514 | ) | (206,735,433 | ) | ||||
|
|
|
| |||||
Net increase (decrease) from capital share transactions | 1,216,916 | (2,800,084 | ) | |||||
|
|
|
| |||||
Net decrease in net assets | (223,914 | ) | (6,661,451 | ) | ||||
NETASSETS: | ||||||||
Beginning of year | 7,647,208 | 14,308,659 | ||||||
|
|
|
| |||||
End of year | $ | 7,423,294 | $ | 7,647,208 | ||||
|
|
|
| |||||
Undistributed net investment income at end of year | $ | — | $ | — | ||||
|
|
|
| |||||
CAPITALSHAREACTIVITY: | ||||||||
Shares sold | 14,562,624 | 14,531,086 | ||||||
Shares redeemed | (14,511,309 | ) | (14,837,287 | ) | ||||
|
|
|
| |||||
Net increase (decrease) in shares | 51,315 | (306,201 | ) | |||||
|
|
|
| |||||
| 38 | THE RYDEX FUNDSANNUALREPORT | See Notes to Financial Statements. |
INVERSE NASDAQ-100® STRATEGY FUND
FINANCIAL HIGHLIGHTS
This table is presented to show selected data for a share outstanding throughout each period, and to assist shareholders in evaluating a Fund’s performance for the periods presented.
| Year Ended December 31, 2011 | Year Ended December 31, 2010 | Year Ended December 31, 2009 | Year Ended December 31, 2008 | Year Ended December 31, 2007 | ||||||||||||||||
Per Share Data | ||||||||||||||||||||
Net asset value, beginning of period | $ | 11.81 | $ | 15.00 | $ | 25.05 | $ | 16.99 | $ | 19.79 | ||||||||||
|
|
|
|
|
|
|
|
|
| |||||||||||
Income (loss) from investment operations: | ||||||||||||||||||||
Net investment income (loss)a | (.19 | ) | (.22 | ) | (.31 | ) | .02 | .64 | ||||||||||||
Net gain (loss) on investments (realized and unrealized) | (1.00 | ) | (2.97 | ) | (9.72 | ) | 8.13 | (2.87 | ) | |||||||||||
|
|
|
|
|
|
|
|
|
| |||||||||||
Total from investment operations | (1.19 | ) | (3.19 | ) | (10.03 | ) | 8.15 | (2.23 | ) | |||||||||||
|
|
|
|
|
|
|
|
|
| |||||||||||
Less distributions from: | ||||||||||||||||||||
Net investment income | — | — | (.02 | ) | (.09 | ) | (.57 | ) | ||||||||||||
|
|
|
|
|
|
|
|
|
| |||||||||||
Total distributions | — | — | (.02 | ) | (.09 | ) | (.57 | ) | ||||||||||||
|
|
|
|
|
|
|
|
|
| |||||||||||
Net asset value, end of period | $ | 10.62 | $ | 11.81 | $ | 15.00 | $ | 25.05 | $ | 16.99 | ||||||||||
|
|
|
|
|
|
|
|
|
| |||||||||||
Total Returnb | (10.08 | %) | (21.27 | %) | (40.05 | %) | 47.96 | % | (11.28 | %) | ||||||||||
|
|
|
|
|
|
|
|
|
| |||||||||||
Ratios/Supplemental Data | ||||||||||||||||||||
Net assets, end of period (in thousands) | $ | 7,423 | $ | 7,647 | $ | 14,309 | $ | 12,127 | $ | 13,640 | ||||||||||
|
|
|
|
|
|
|
|
|
| |||||||||||
Ratios to average net assets: | ||||||||||||||||||||
Net investment income (loss) | (1.74 | %) | (1.59 | %) | (1.61 | %) | 0.08 | % | 3.40 | % | ||||||||||
Total expenses | 1.79 | % | 1.74 | % | 1.75 | % | 1.70 | % | 1.68 | % | ||||||||||
|
|
|
|
|
|
|
|
|
| |||||||||||
Portfolio turnover rate | — | — | — | — | — | |||||||||||||||
| a | Net investment income (loss) per share was computed using average shares outstanding throughout the period. |
| b | Total return does not reflect the impact of any additional fees charged by insurance companies and has not been annualized. |
| See Notes to Financial Statements. | THE RYDEX FUNDSANNUALREPORT | 39 |
| PERFORMANCE REPORT AND FUND PROFILE (Unaudited) | December 31, 2011 | |||||
OBJECTIVE: Seeks to provide investment results that match, before fees and expenses, the performance of a specific benchmark on a daily basis. The Fund’s current benchmark is 200% of the performance of the S&P 500® Index (the “underlying index”). The Fund does not seek to achieve its investment objective over a period of time greater than one day.
For the year ended December 31, 2011, S&P 500 2x Strategy Fund maintained a daily correlation of over 99% to its benchmark of 200% of the daily price movement of the S&P 500® Index. S&P 500 2x Strategy Fund returned -3.95%, while the S&P 500 Index gained 2.11% over the same time period.
Sectors contributing most to performance of the index were Consumer Staples, Health Care and Utilities. Financials was the largest detractor from performance, followed by Materials and Industrials.
Apple, Inc., Exxon Mobile Corp. and International Business Machines Corp. contributed the most performance to the index for 2011. Bank of America Corp., Citigroup, Inc. and Goldman Sachs Group, Inc. detracted from performance for the year.
Derivatives in the Fund were used to help provide exposure to the composition of the benchmark in the highest efficient manner and to provide leverage, not for hedging purposes.
Due to the compounding of daily returns, leveraged and inverse funds’ returns over periods other than one day will likely differ in amount and possibly direction from the benchmark return for the same period. Investors should monitor their leveraged and inverse funds’ holdings to ensure that they are consistent with their strategies, as frequently as daily.
The effects of compounding may cause the longer-term correlation of the fund to its benchmark to diminish. The apparent discrepancy between the leveraged and unleveraged indices is the result of compounding, which is described briefly on page 4 of this report.
Standard & Poor’s 500 Index (S&P 500®) – a capitalization-weighted index covering 500 industrial, utility, transportation and financial companies of the U.S. markets (mostly NYSE Euronext issues).
Holdings Diversification (Market Exposure as % of Net Assets)
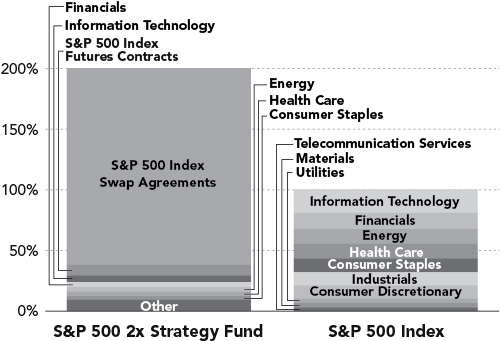
“Holdings Diversification (Market Exposure as % of Net Assets)” excludes any temporary cash investments.
Inception Date: October 1, 2001
Ten Largest Holdings (% of Total Net Assets) | ||||
Exxon Mobil Corp. | 1.1 | % | ||
Apple, Inc. | 1.0 | % | ||
International Business Machines Corp. | 0.6 | % | ||
Chevron Corp. | 0.6 | % | ||
Microsoft Corp. | 0.5 | % | ||
General Electric Co. | 0.5 | % | ||
Procter & Gamble Co. | 0.5 | % | ||
AT&T, Inc. | 0.5 | % | ||
Johnson & Johnson | 0.5 | % | ||
Pfizer, Inc. | 0.4 | % | ||
|
| |||
Top Ten Total | 6.2 | % | ||
|
| |||
“Ten Largest Holdings” exclude any temporary cash or derivative investments.
| 40 | THE RYDEX FUNDSANNUALREPORT |
| PERFORMANCE REPORT AND FUND PROFILE (Unaudited) (concluded) | ||||
S&P 500 2x STRATEGY FUND
Cumulative Fund Performance*
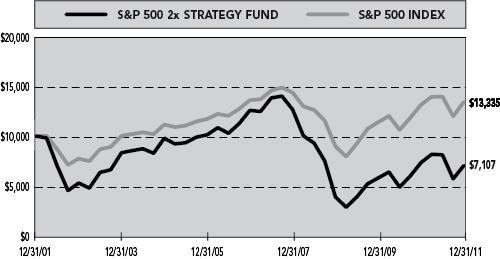
Average Annual Returns*
Periods Ended 12/31/11
| 1 Year | 5 Year | 10 Year | ||||||||||
S&P 500 2x Strategy Fund | -3.95 | % | -10.69 | % | -3.36 | % | ||||||
S&P 500 Index | 2.11 | % | -0.25 | % | 2.92 | % | ||||||
| * | The performance data represents past performance that is not predictive of future results. The investment return and principal value of an investment in the Fund will fluctuate so that an investor’s shares, when redeemed, may be worth more or less than their original cost. Returns are historical and include changes in principal and reinvested dividends and capital gains and do not reflect the effect of taxes. The S&P 500 Index is an unmanaged index and, unlike the Fund, has no management fees or operating expenses to reduce its reported return. |
| Returns do not reflect the impact of any additional fees charged by insurance companies. |
THE RYDEX FUNDSANNUALREPORT | 41
SCHEDULE OF INVESTMENTS | December 31, 2011 |
S&P 500 2x STRATEGY FUND
| SHARES | VALUE | |||||||
COMMON STOCKS† - 29.4% | ||||||||
INFORMATION TECHNOLOGY - 5.6% | ||||||||
Apple, Inc.* | 546 | $ | 221,130 | |||||
International Business Machines Corp. | 698 | 128,348 | ||||||
Microsoft Corp. | 4,430 | 115,003 | ||||||
Google, Inc. — Class A* | 150 | 96,885 | ||||||
Intel Corp. | 3,014 | 73,089 | ||||||
Oracle Corp. | 2,327 | 59,688 | ||||||
Cisco Systems, Inc. | 3,182 | 57,531 | ||||||
QUALCOMM, Inc. | 997 | 54,536 | ||||||
Visa, Inc. — Class A | 301 | 30,561 | ||||||
Hewlett-Packard Co. | 1,176 | 30,294 | ||||||
EMC Corp.* | 1,207 | 25,999 | ||||||
Mastercard, Inc. — Class A | 60 | 22,369 | ||||||
eBay, Inc.* | 680 | 20,624 | ||||||
Accenture plc — Class A | 379 | 20,174 | ||||||
Texas Instruments, Inc. | 676 | 19,678 | ||||||
Automatic Data Processing, Inc. | 292 | 15,771 | ||||||
Dell, Inc.* | 904 | 13,226 | ||||||
Corning, Inc. | 934 | 12,123 | ||||||
Yahoo!, Inc.* | 734 | 11,839 | ||||||
Cognizant Technology Solutions Corp. — Class A* | 179 | 11,511 | ||||||
Intuit, Inc. | 176 | 9,256 | ||||||
Broadcom Corp. — Class A* | 289 | 8,485 | ||||||
Applied Materials, Inc. | 769 | 8,236 | ||||||
Adobe Systems, Inc.* | 291 | 8,227 | ||||||
Salesforce.com, Inc.* | 80 | 8,117 | ||||||
Motorola Solutions, Inc. | 170 | 7,869 | ||||||
TE Connectivity Ltd. | 251 | 7,733 | ||||||
NetApp, Inc.* | 212 | 7,689 | ||||||
Altera Corp. | 190 | 7,049 | ||||||
SanDisk Corp.* | 140 | 6,889 | ||||||
Symantec Corp.* | 436 | 6,823 | ||||||
Western Union Co. | 366 | 6,683 | ||||||
Citrix Systems, Inc.* | 108 | 6,558 | ||||||
Xerox Corp. | 821 | 6,535 | ||||||
Juniper Networks, Inc.* | 311 | 6,348 | ||||||
Analog Devices, Inc. | 172 | 6,154 | ||||||
Motorola Mobility Holdings, Inc.* | 156 | 6,053 | ||||||
Paychex, Inc. | 190 | 5,721 | ||||||
NVIDIA Corp.* | 365 | 5,059 | ||||||
Fiserv, Inc.* | 83 | 4,875 | ||||||
Xilinx, Inc. | 151 | 4,841 | ||||||
KLA-Tencor Corp. | 99 | 4,777 | ||||||
F5 Networks, Inc.* | 45 | 4,775 | ||||||
Teradata Corp.* | 95 | 4,608 | ||||||
Red Hat, Inc.* | 110 | 4,542 | ||||||
CA, Inc. | 218 | 4,407 | ||||||
Amphenol Corp. — Class A | 96 | 4,357 | ||||||
Western Digital Corp.* | 138 | 4,271 | ||||||
Autodesk, Inc.* | 134 | 4,064 | ||||||
Linear Technology Corp. | 135 | 4,054 | ||||||
Electronic Arts, Inc.* | 196 | 4,038 | ||||||
Microchip Technology, Inc. | 110 | 4,029 | ||||||
Fidelity National Information Services, Inc. | 144 | 3,829 | ||||||
Micron Technology, Inc.* | 584 | 3,673 | ||||||
Akamai Technologies, Inc.* | 106 | 3,422 | ||||||
VeriSign, Inc. | 94 | 3,358 | ||||||
BMC Software, Inc.* | 99 | 3,245 | ||||||
Harris Corp. | 69 | 2,487 | ||||||
FLIR Systems, Inc. | 89 | 2,231 | ||||||
Computer Sciences Corp. | 92 | 2,180 | ||||||
SAIC, Inc.* | 168 | 2,065 | ||||||
Jabil Circuit, Inc. | 104 | 2,045 | ||||||
LSI Corp.* | 333 | 1,981 | ||||||
Molex, Inc. | 81 | 1,933 | ||||||
Total System Services, Inc. | 96 | 1,878 | ||||||
Advanced Micro Devices, Inc.* | 346 | 1,868 | ||||||
Novellus Systems, Inc.* | 39 | 1,610 | ||||||
Teradyne, Inc.* | 109 | 1,486 | ||||||
Lexmark International, Inc. — Class A | 42 | 1,389 | ||||||
JDS Uniphase Corp.* | 132 | 1,378 | ||||||
|
| |||||||
Total Information Technology | 1,275,559 | |||||||
|
| |||||||
FINANCIALS - 4.0% | ||||||||
Wells Fargo & Co. | 3,117 | 85,905 | ||||||
Berkshire Hathaway, Inc. — Class B* | 1,042 | 79,505 | ||||||
JPMorgan Chase & Co. | 2,249 | 74,779 | ||||||
Citigroup, Inc. | 1,726 | 45,411 | ||||||
Bank of America Corp. | 5,998 | 33,349 | ||||||
U.S. Bancorp | 1,125 | 30,431 | ||||||
American Express Co. | 598 | 28,208 | ||||||
Goldman Sachs Group, Inc. | 291 | 26,315 | ||||||
Simon Property Group, Inc. | 170 | 21,920 | ||||||
MetLife, Inc. | 624 | 19,456 | ||||||
PNC Financial Services Group, Inc. | 309 | 17,820 | ||||||
Travelers Companies, Inc. | 244 | 14,437 | ||||||
Bank of New York Mellon Corp. | 718 | 14,295 | ||||||
Prudential Financial, Inc. | 279 | 13,983 | ||||||
ACE Ltd. | 199 | 13,954 | ||||||
Morgan Stanley | 882 | 13,345 | ||||||
Aflac, Inc. | 279 | 12,070 | ||||||
State Street Corp. | 291 | 11,730 | ||||||
Chubb Corp. | 165 | 11,421 | ||||||
Capital One Financial Corp. | 270 | 11,418 | ||||||
Public Storage | 82 | 11,026 | ||||||
BlackRock, Inc. — Class A | 58 | 10,338 | ||||||
BB&T Corp. | 410 | 10,320 | ||||||
Equity Residential | 180 | 10,265 | ||||||
Marsh & McLennan Companies, Inc. | 318 | 10,055 | ||||||
HCP, Inc. | 241 | 9,985 | ||||||
CME Group, Inc. — Class A | 39 | 9,503 | ||||||
Ventas, Inc. | 170 | 9,372 | ||||||
Aon Corp. | 191 | 8,939 | ||||||
| 42 | THE RYDEX FUNDSANNUALREPORT | See Notes to Financial Statements. |
| SCHEDULE OF INVESTMENTS (continued) | December 31, 2011 |
S&P 500 2x STRATEGY FUND
| SHARES | VALUE | |||||||
Boston Properties, Inc. | 87 | $ | 8,665 | |||||
T. Rowe Price Group, Inc. | 150 | 8,542 | ||||||
Vornado Realty Trust | 109 | 8,378 | ||||||
Franklin Resources, Inc. | 86 | 8,261 | ||||||
Allstate Corp. | 299 | 8,196 | ||||||
Discover Financial Services | 330 | 7,920 | ||||||
ProLogis, Inc. | 270 | 7,719 | ||||||
AvalonBay Communities, Inc. | 56 | 7,314 | ||||||
Charles Schwab Corp. | 640 | 7,206 | ||||||
Progressive Corp. | 365 | 7,121 | ||||||
Fifth Third Bancorp | 540 | 6,869 | ||||||
Loews Corp. | 180 | 6,777 | ||||||
Ameriprise Financial, Inc. | 134 | 6,652 | ||||||
Host Hotels & Resorts, Inc. | 420 | 6,203 | ||||||
Health Care REIT, Inc. | 111 | 6,053 | ||||||
Weyerhaeuser Co. | 322 | 6,012 | ||||||
American International Group, Inc.* | 259 | 6,009 | ||||||
Northern Trust Corp. | 143 | 5,671 | ||||||
M&T Bank Corp. | 74 | 5,649 | ||||||
SunTrust Banks, Inc. | 316 | 5,593 | ||||||
Invesco Ltd. | 267 | 5,364 | ||||||
IntercontinentalExchange, Inc.* | 40 | 4,822 | ||||||
Principal Financial Group, Inc. | 180 | 4,428 | ||||||
KeyCorp | 562 | 4,322 | ||||||
Hartford Financial Services Group, Inc. | 260 | 4,225 | ||||||
NYSE Euronext | 159 | 4,150 | ||||||
SLM Corp. | 301 | 4,033 | ||||||
Moody’s Corp. | 116 | 3,907 | ||||||
Kimco Realty Corp. | 238 | 3,865 | ||||||
XL Group plc — Class A | 190 | 3,756 | ||||||
Unum Group | 173 | 3,645 | ||||||
Lincoln National Corp. | 179 | 3,476 | ||||||
Plum Creek Timber Company, Inc. | 95 | 3,473 | ||||||
Regions Financial Corp. | 746 | 3,208 | ||||||
Comerica, Inc. | 118 | 3,044 | ||||||
Cincinnati Financial Corp. | 96 | 2,924 | ||||||
CBRE Group, Inc. — Class A* | 190 | 2,892 | ||||||
Huntington Bancshares, Inc. | 510 | 2,800 | ||||||
People’s United Financial, Inc. | 213 | 2,737 | ||||||
Leucadia National Corp. | 115 | 2,615 | ||||||
Torchmark Corp. | 60 | 2,603 | ||||||
Assurant, Inc. | 54 | 2,217 | ||||||
Hudson City Bancorp, Inc. | 310 | 1,937 | ||||||
Genworth Financial, Inc. — Class A* | 290 | 1,900 | ||||||
NASDAQ OMX Group, Inc.* | 75 | 1,838 | ||||||
Legg Mason, Inc. | 74 | 1,780 | ||||||
Zions Bancorporation | 106 | 1,726 | ||||||
Apartment Investment & Management Co. — Class A | 70 | 1,604 | ||||||
First Horizon National Corp. | 160 | 1,280 | ||||||
E*Trade Financial Corp.* | 150 | 1,194 | ||||||
Federated Investors, Inc. — Class B | 60 | 909 | ||||||
|
| |||||||
Total Financials | 903,039 | |||||||
|
| |||||||
ENERGY - 3.6% | ||||||||
Exxon Mobil Corp. | 2,837 | 240,464 | ||||||
Chevron Corp. | 1,177 | 125,233 | ||||||
ConocoPhillips | 786 | 57,276 | ||||||
Schlumberger Ltd. | 791 | 54,033 | ||||||
Occidental Petroleum Corp. | 485 | 45,445 | ||||||
Anadarko Petroleum Corp. | 294 | 22,441 | ||||||
Apache Corp. | 227 | 20,562 | ||||||
Halliburton Co. | 550 | 18,980 | ||||||
National Oilwell Varco, Inc. | 249 | 16,930 | ||||||
EOG Resources, Inc. | 159 | 15,663 | ||||||
Devon Energy Corp. | 239 | 14,818 | ||||||
Baker Hughes, Inc. | 262 | 12,744 | ||||||
Marathon Oil Corp. | 416 | 12,176 | ||||||
El Paso Corp. | 452 | 12,010 | ||||||
Spectra Energy Corp. | 385 | 11,839 | ||||||
Williams Companies, Inc. | 352 | 11,623 | ||||||
Hess Corp. | 176 | 9,997 | ||||||
Noble Energy, Inc. | 104 | 9,817 | ||||||
Chesapeake Energy Corp. | 390 | 8,693 | ||||||
FMC Technologies, Inc.* | 141 | 7,364 | ||||||
Cameron International Corp.* | 145 | 7,133 | ||||||
Marathon Petroleum Corp. | 210 | 6,991 | ||||||
Valero Energy Corp. | 331 | 6,968 | ||||||
Southwestern Energy Co.* | 206 | 6,580 | ||||||
Pioneer Natural Resources Co. | 72 | 6,443 | ||||||
Murphy Oil Corp. | 114 | 6,354 | ||||||
Range Resources Corp. | 90 | 5,575 | ||||||
Peabody Energy Corp. | 160 | 5,298 | ||||||
Consol Energy, Inc. | 133 | 4,881 | ||||||
Equities Corp. | 88 | 4,822 | ||||||
Cabot Oil & Gas Corp. | 60 | 4,554 | ||||||
Noble Corp.* | 149 | 4,503 | ||||||
Denbury Resources, Inc.* | 235 | 3,548 | ||||||
Helmerich & Payne, Inc. | 60 | 3,502 | ||||||
QEP Resources, Inc. | 105 | 3,077 | ||||||
Nabors Industries Ltd.* | 170 | 2,948 | ||||||
Newfield Exploration Co.* | 78 | 2,943 | ||||||
Alpha Natural Resources, Inc.* | 130 | 2,656 | ||||||
Sunoco, Inc. | 63 | 2,584 | ||||||
Rowan Companies, Inc.* | 74 | 2,244 | ||||||
Diamond Offshore Drilling, Inc. | 40 | 2,210 | ||||||
Tesoro Corp.* | 84 | 1,962 | ||||||
|
| |||||||
Total Energy | 825,884 | |||||||
|
| |||||||
HEALTH CARE - 3.5% | ||||||||
Johnson & Johnson | 1,614 | 105,846 | ||||||
Pfizer, Inc. | 4,549 | 98,440 | ||||||
Merck & Company, Inc. | 1,804 | 68,011 | ||||||
Abbott Laboratories | 920 | 51,732 | ||||||
Bristol-Myers Squibb Co. | 1,000 | 35,240 | ||||||
UnitedHealth Group, Inc. | 630 | 31,928 | ||||||
Amgen, Inc. | 467 | 29,986 | ||||||
Eli Lilly & Co. | 600 | 24,936 | ||||||
Medtronic, Inc. | 621 | 23,753 | ||||||
| See Notes to Financial Statements. | THE RYDEX FUNDSANNUALREPORT | 43 |
| SCHEDULE OF INVESTMENTS (continued) | December 31, 2011 | |||||
S&P 500 2x STRATEGY FUND
| SHARES | VALUE | |||||||
Gilead Sciences, Inc.* | 445 | $ | 18,214 | |||||
Celgene Corp.* | 263 | 17,779 | ||||||
Baxter International, Inc. | 334 | 16,526 | ||||||
Allergan, Inc. | 181 | 15,881 | ||||||
Biogen Idec, Inc.* | 144 | 15,847 | ||||||
WellPoint, Inc. | 206 | 13,647 | ||||||
Express Scripts, Inc.* | 292 | 13,049 | ||||||
Medco Health Solutions, Inc.* | 233 | 13,025 | ||||||
Covidien plc | 286 | 12,873 | ||||||
McKesson Corp. | 144 | 11,219 | ||||||
Intuitive Surgical, Inc.* | 23 | 10,649 | ||||||
Thermo Fisher Scientific, Inc.* | 220 | 9,893 | ||||||
Becton Dickinson and Co. | 127 | 9,489 | ||||||
Stryker Corp. | 190 | 9,445 | ||||||
Aetna, Inc. | 214 | 9,029 | ||||||
Cardinal Health, Inc. | 204 | 8,284 | ||||||
Humana, Inc. | 94 | 8,235 | ||||||
Agilent Technologies, Inc.* | 205 | 7,161 | ||||||
Cigna Corp. | 170 | 7,140 | ||||||
St. Jude Medical, Inc. | 189 | 6,483 | ||||||
Perrigo Co. | 60 | 5,838 | ||||||
AmerisourceBergen Corp. — Class A | 153 | 5,690 | ||||||
Zimmer Holdings, Inc.* | 106 | 5,663 | ||||||
Quest Diagnostics, Inc. | 93 | 5,400 | ||||||
Mylan, Inc.* | 251 | 5,386 | ||||||
Cerner Corp.* | 85 | 5,206 | ||||||
Laboratory Corporation of America Holdings* | 59 | 5,072 | ||||||
Edwards Lifesciences Corp.* | 68 | 4,808 | ||||||
Forest Laboratories, Inc.* | 157 | 4,751 | ||||||
Boston Scientific Corp.* | 877 | 4,683 | ||||||
Watson Pharmaceuticals, Inc.* | 75 | 4,525 | ||||||
Varian Medical Systems, Inc.* | 67 | 4,498 | ||||||
CR Bard, Inc. | 49 | 4,189 | ||||||
DaVita, Inc.* | 54 | 4,094 | ||||||
Life Technologies Corp.* | 105 | 4,086 | ||||||
Waters Corp.* | 52 | 3,851 | ||||||
CareFusion Corp.* | 133 | 3,380 | ||||||
Hospira, Inc.* | 102 | 3,098 | ||||||
DENTSPLY International, Inc. | 84 | 2,939 | ||||||
Coventry Health Care, Inc.* | 85 | 2,581 | ||||||
Patterson Companies, Inc. | 52 | 1,535 | ||||||
PerkinElmer, Inc. | 67 | 1,340 | ||||||
Tenet Healthcare Corp.* | 257 | 1,318 | ||||||
|
| |||||||
Total Health Care | 797,671 | |||||||
|
| |||||||
CONSUMER STAPLES - 3.4% | ||||||||
Procter & Gamble Co. | 1,629 | 108,671 | ||||||
Coca-Cola Co. | 1,344 | 94,040 | ||||||
Philip Morris International, Inc. | 1,028 | 80,677 | ||||||
Wal-Mart Stores, Inc. | 1,039 | 62,091 | ||||||
PepsiCo, Inc. | 925 | 61,374 | ||||||
Kraft Foods, Inc. — Class A | 1,051 | 39,265 | ||||||
Altria Group, Inc. | 1,213 | 35,965 | ||||||
CVS Caremark Corp. | 770 | 31,401 | ||||||
Colgate-Palmolive Co. | 282 | 26,054 | ||||||
Costco Wholesale Corp. | 252 | 20,997 | ||||||
Kimberly-Clark Corp. | 237 | 17,434 | ||||||
Walgreen Co. | 526 | 17,390 | ||||||
General Mills, Inc. | 380 | 15,356 | ||||||
Archer-Daniels-Midland Co. | 395 | 11,297 | ||||||
Sysco Corp. | 349 | 10,236 | ||||||
HJ Heinz Co. | 189 | 10,214 | ||||||
Lorillard, Inc. | 80 | 9,120 | ||||||
Kroger Co. | 353 | 8,550 | ||||||
Reynolds American, Inc. | 200 | 8,284 | ||||||
Mead Johnson Nutrition Co. — Class A | 120 | 8,248 | ||||||
Kellogg Co. | 147 | 7,434 | ||||||
Estee Lauder Companies, Inc. — Class A | 66 | 7,413 | ||||||
Sara Lee Corp. | 346 | 6,546 | ||||||
Whole Foods Market, Inc. | 94 | 6,541 | ||||||
ConAgra Foods, Inc. | 242 | 6,389 | ||||||
Hershey Co. | 91 | 5,622 | ||||||
JM Smucker Co. | 67 | 5,237 | ||||||
Clorox Co. | 78 | 5,192 | ||||||
Dr Pepper Snapple Group, Inc. | 127 | 5,014 | ||||||
Coca-Cola Enterprises, Inc. | 185 | 4,769 | ||||||
Brown-Forman Corp. — Class B | 59 | 4,750 | ||||||
Beam, Inc. | 92 | 4,713 | ||||||
Avon Products, Inc. | 260 | 4,542 | ||||||
Safeway, Inc. | 201 | 4,229 | ||||||
Molson Coors Brewing Co. — Class B | 93 | 4,049 | ||||||
McCormick & Company, Inc. | 79 | 3,983 | ||||||
Tyson Foods, Inc. — Class A | 173 | 3,571 | ||||||
Campbell Soup Co. | 102 | 3,390 | ||||||
Hormel Foods Corp. | 82 | 2,402 | ||||||
Constellation Brands, Inc. — Class A* | 103 | 2,129 | ||||||
Dean Foods Co.* | 105 | 1,176 | ||||||
SUPERVALU, Inc. | 125 | 1,015 | ||||||
|
| |||||||
Total Consumer Staples | 776,770 | |||||||
|
| |||||||
INDUSTRIALS - 3.2% | ||||||||
General Electric Co. | 6,251 | 111,955 | ||||||
United Parcel Service, Inc. — Class B | 571 | 41,791 | ||||||
United Technologies Corp. | 534 | 39,030 | ||||||
Caterpillar, Inc. | 380 | 34,428 | ||||||
3M Co. | 414 | 33,836 | ||||||
Boeing Co. | 436 | 31,981 | ||||||
Union Pacific Corp. | 283 | 29,981 | ||||||
Honeywell International, Inc. | 458 | 24,892 | ||||||
Emerson Electric Co. | 435 | 20,267 | ||||||
Deere & Co. | 242 | 18,719 | ||||||
Danaher Corp. | 334 | 15,711 | ||||||
FedEx Corp. | 188 | 15,700 | ||||||
| 44 | THE RYDEX FUNDSANNUALREPORT | See Notes to Financial Statements. |
| SCHEDULE OF INVESTMENTS (continued) | December 31, 2011 |
S&P 500 2x STRATEGY FUND
| SHARES | VALUE | |||||||
Norfolk Southern Corp. | 199 | $ | 14,499 | |||||
General Dynamics Corp. | 211 | 14,013 | ||||||
Precision Castparts Corp. | 85 | 14,007 | ||||||
Illinois Tool Works, Inc. | 286 | 13,359 | ||||||
CSX Corp. | 621 | 13,078 | ||||||
Tyco International Ltd. | 273 | 12,752 | ||||||
Lockheed Martin Corp. | 157 | 12,701 | ||||||
Raytheon Co. | 205 | 9,918 | ||||||
Cummins, Inc. | 110 | 9,682 | ||||||
Goodrich Corp. | 74 | 9,154 | ||||||
Northrop Grumman Corp. | 155 | 9,064 | ||||||
Waste Management, Inc. | 272 | 8,897 | ||||||
Eaton Corp. | 198 | 8,619 | ||||||
PACCAR, Inc. | 212 | 7,944 | ||||||
Fastenal Co. | 180 | 7,850 | ||||||
Parker Hannifin Corp. | 89 | 6,786 | ||||||
CH Robinson Worldwide, Inc. | 97 | 6,769 | ||||||
Stanley Black & Decker, Inc. | 100 | 6,760 | ||||||
WW Grainger, Inc. | 36 | 6,739 | ||||||
Dover Corp. | 107 | 6,211 | ||||||
Rockwell Automation, Inc. | 84 | 6,163 | ||||||
Ingersoll-Rand plc | 185 | 5,637 | ||||||
Republic Services, Inc. — Class A | 186 | 5,124 | ||||||
Expeditors International of Washington, Inc. | 125 | 5,120 | ||||||
Cooper Industries plc | 94 | 5,090 | ||||||
Fluor Corp. | 100 | 5,025 | ||||||
Rockwell Collins, Inc. | 90 | 4,983 | ||||||
Roper Industries, Inc. | 57 | 4,952 | ||||||
Joy Global, Inc. | 61 | 4,573 | ||||||
Southwest Airlines Co. | 461 | 3,946 | ||||||
L-3 Communications Holdings, Inc. | 59 | 3,934 | ||||||
Pall Corp. | 68 | 3,886 | ||||||
Stericycle, Inc.* | 49 | 3,818 | ||||||
Iron Mountain, Inc. | 110 | 3,388 | ||||||
Flowserve Corp. | 33 | 3,278 | ||||||
Textron, Inc. | 169 | 3,125 | ||||||
Jacobs Engineering Group, Inc.* | 76 | 3,084 | ||||||
Xylem, Inc. | 109 | 2,800 | ||||||
Equifax, Inc. | 70 | 2,712 | ||||||
Quanta Services, Inc.* | 124 | 2,671 | ||||||
Robert Half International, Inc. | 85 | 2,419 | ||||||
Cintas Corp. | 65 | 2,263 | ||||||
Masco Corp. | 212 | 2,222 | ||||||
Pitney Bowes, Inc. | 118 | 2,188 | ||||||
Dun & Bradstreet Corp. | 29 | 2,170 | ||||||
Avery Dennison Corp. | 60 | 1,721 | ||||||
RR Donnelley & Sons Co. | 111 | 1,602 | ||||||
Ryder System, Inc. | 30 | 1,594 | ||||||
Snap-on, Inc. | 30 | 1,519 | ||||||
First Solar, Inc.* | 40 | 1,350 | ||||||
|
| |||||||
Total Industrials | 719,450 | |||||||
|
| |||||||
CONSUMER DISCRETIONARY - 3.1% | ||||||||
McDonald’s Corp. | 604 | 60,599 | ||||||
Walt Disney Co. | 1,063 | 39,862 | ||||||
Home Depot, Inc. | 912 | 38,340 | ||||||
Comcast Corp. — Class A | 1,610 | 38,173 | ||||||
Amazon.com, Inc.* | 214 | 37,043 | ||||||
Ford Motor Co.* | 2,251 | 24,221 | ||||||
News Corp. — Class A | 1,298 | 23,156 | ||||||
Time Warner, Inc. | 592 | 21,395 | ||||||
NIKE, Inc. — Class B | 219 | 21,105 | ||||||
Target Corp. | 395 | 20,232 | ||||||
Starbucks Corp. | 439 | 20,198 | ||||||
Lowe’s Companies, Inc. | 740 | 18,781 | ||||||
DIRECTV — Class A* | 418 | 17,874 | ||||||
Yum! Brands, Inc. | 273 | 16,110 | ||||||
Viacom, Inc. — Class B | 327 | 14,849 | ||||||
TJX Companies, Inc. | 220 | 14,201 | ||||||
Priceline.com, Inc.* | 29 | 13,564 | ||||||
Johnson Controls, Inc. | 400 | 12,504 | ||||||
Time Warner Cable, Inc. | 189 | 12,015 | ||||||
CBS Corp. — Class B | 387 | 10,503 | ||||||
Coach, Inc. | 171 | 10,438 | ||||||
Carnival Corp. | 268 | 8,748 | ||||||
Bed Bath & Beyond, Inc.* | 142 | 8,232 | ||||||
Macy’s, Inc. | 248 | 7,981 | ||||||
McGraw-Hill Companies, Inc. | 174 | 7,825 | ||||||
Kohl’s Corp. | 150 | 7,402 | ||||||
Omnicom Group, Inc. | 159 | 7,088 | ||||||
VF Corp. | 52 | 6,603 | ||||||
Ross Stores, Inc. | 137 | 6,512 | ||||||
Chipotle Mexican Grill, Inc. — Class A* | 19 | 6,417 | ||||||
Discovery Communications, Inc. — Class A* | 156 | 6,391 | ||||||
O’Reilly Automotive, Inc.* | 76 | 6,076 | ||||||
Limited Brands, Inc. | 146 | 5,891 | ||||||
Dollar Tree, Inc.* | 70 | 5,818 | ||||||
Staples, Inc. | 414 | 5,750 | ||||||
Genuine Parts Co. | 92 | 5,630 | ||||||
Mattel, Inc. | 200 | 5,552 | ||||||
AutoZone, Inc.* | 17 | 5,524 | ||||||
Harley-Davidson, Inc. | 138 | 5,364 | ||||||
Starwood Hotels & Resorts Worldwide, Inc. | 111 | 5,325 | ||||||
Ralph Lauren Corp. — Class A | 38 | 5,247 | ||||||
Wynn Resorts Ltd. | 47 | 5,193 | ||||||
Tiffany & Co. | 75 | 4,969 | ||||||
Nordstrom, Inc. | 96 | 4,772 | ||||||
Marriott International, Inc. — Class A | 159 | 4,638 | ||||||
BorgWarner, Inc.* | 70 | 4,462 | ||||||
Best Buy Company, Inc. | 174 | 4,066 | ||||||
Family Dollar Stores, Inc. | 69 | 3,979 | ||||||
CarMax, Inc.* | 130 | 3,962 | ||||||
| See Notes to Financial Statements. | THE RYDEX FUNDSANNUALREPORT | 45 |
| SCHEDULE OF INVESTMENTS (continued) | December 31, 2011 |
S&P 500 2x STRATEGY FUND
| SHARES | VALUE | |||||||
The Gap, Inc. | 205 | $ | 3,803 | |||||
Apollo Group, Inc. — Class A* | 68 | 3,663 | ||||||
Darden Restaurants, Inc. | 78 | 3,555 | ||||||
Wyndham Worldwide Corp. | 90 | 3,405 | ||||||
International Game Technology | 176 | 3,027 | ||||||
JC Penney Company, Inc. | 85 | 2,988 | ||||||
H&R Block, Inc. | 173 | 2,825 | ||||||
Newell Rubbermaid, Inc. | 170 | 2,745 | ||||||
Interpublic Group of Companies, Inc. | 273 | 2,656 | ||||||
Abercrombie & Fitch Co. — Class A | 51 | 2,491 | ||||||
Scripps Networks Interactive, Inc. — Class A | 58 | 2,460 | ||||||
Hasbro, Inc. | 69 | 2,200 | ||||||
DR Horton, Inc. | 170 | 2,144 | ||||||
Whirlpool Corp. | 45 | 2,135 | ||||||
Netflix, Inc.* | 30 | 2,079 | ||||||
Goodyear Tire & Rubber Co.* | 145 | 2,055 | ||||||
GameStop Corp. — Class A* | 80 | 1,930 | ||||||
Leggett & Platt, Inc. | 82 | 1,889 | ||||||
Gannett Company, Inc. | 140 | 1,872 | ||||||
Cablevision Systems Corp. — Class A | 130 | 1,849 | ||||||
Lennar Corp. — Class A | 94 | 1,847 | ||||||
Urban Outfitters, Inc.* | 65 | 1,791 | ||||||
Expedia, Inc. | 56 | 1,625 | ||||||
Harman International Industries, Inc. | 38 | 1,446 | ||||||
TripAdvisor, Inc.* | 56 | 1,412 | ||||||
DeVry, Inc. | 36 | 1,385 | ||||||
Big Lots, Inc.* | 35 | 1,322 | ||||||
PulteGroup, Inc.* | 199 | 1,256 | ||||||
AutoNation, Inc.* | 28 | 1,032 | ||||||
Sears Holdings Corp.* | 23 | 731 | ||||||
Orchard Supply Hardware Stores Corp. — Class A*,5,††† | 1 | 9 | ||||||
|
| |||||||
Total Consumer Discretionary | 716,207 | |||||||
|
| |||||||
UTILITIES - 1.1% | ||||||||
Southern Co. | 510 | 23,608 | ||||||
Dominion Resources, Inc. | 337 | 17,888 | ||||||
Duke Energy Corp. | 786 | 17,292 | ||||||
Exelon Corp. | 390 | 16,914 | ||||||
NextEra Energy, Inc. | 248 | 15,098 | ||||||
American Electric Power Company, Inc. | 290 | 11,980 | ||||||
FirstEnergy Corp. | 245 | 10,854 | ||||||
Consolidated Edison, Inc. | 170 | 10,545 | ||||||
Progress Energy, Inc. | 180 | 10,084 | ||||||
PPL Corp. | 342 | 10,062 | ||||||
PG&E Corp. | 240 | 9,893 | ||||||
Public Service Enterprise Group, Inc. | 299 | 9,870 | ||||||
Edison International | 190 | 7,866 | ||||||
Xcel Energy, Inc. | 284 | 7,850 | ||||||
Sempra Energy | 142 | 7,810 | ||||||
Entergy Corp. | 100 | 7,305 | ||||||
DTE Energy Co. | 96 | 5,227 | ||||||
ONEOK, Inc. | 60 | 5,201 | ||||||
CenterPoint Energy, Inc. | 250 | 5,023 | ||||||
Wisconsin Energy Corp. | 137 | 4,790 | ||||||
Ameren Corp. | 143 | 4,738 | ||||||
Constellation Energy Group, Inc. | 117 | 4,641 | ||||||
AES Corp.* | 382 | 4,523 | ||||||
NiSource, Inc. | 170 | 4,048 | ||||||
Northeast Utilities | 105 | 3,787 | ||||||
Pinnacle West Capital Corp. | 70 | 3,373 | ||||||
CMS Energy Corp. | 149 | 3,290 | ||||||
SCANA Corp. | 68 | 3,064 | ||||||
AGL Resources, Inc. | 69 | 2,916 | ||||||
Pepco Holdings, Inc. | 130 | 2,639 | ||||||
Integrys Energy Group, Inc. | 46 | 2,492 | ||||||
NRG Energy, Inc.* | 136 | 2,464 | ||||||
TECO Energy, Inc. | 127 | 2,431 | ||||||
|
| |||||||
Total Utilities | 259,566 | |||||||
|
| |||||||
MATERIALS - 1.0% | ||||||||
EI du Pont de Nemours & Co. | 547 | 25,042 | ||||||
Monsanto Co. | 320 | 22,422 | ||||||
Freeport-McMoRan Copper & Gold, Inc. | 557 | 20,492 | ||||||
Dow Chemical Co. | 700 | 20,132 | ||||||
Praxair, Inc. | 176 | 18,814 | ||||||
Newmont Mining Corp. | 297 | 17,823 | ||||||
Air Products & Chemicals, Inc. | 125 | 10,649 | ||||||
Ecolab, Inc. | 176 | 10,175 | ||||||
Mosaic Co. | 175 | 8,825 | ||||||
International Paper Co. | 258 | 7,637 | ||||||
PPG Industries, Inc. | 91 | 7,598 | ||||||
Nucor Corp. | 186 | 7,360 | ||||||
CF Industries Holdings, Inc. | 39 | 5,654 | ||||||
Alcoa, Inc. | 632 | 5,467 | ||||||
Cliffs Natural Resources, Inc. | 85 | 5,300 | ||||||
Sherwin-Williams Co. | 50 | 4,463 | ||||||
Sigma-Aldrich Corp. | 71 | 4,435 | ||||||
Ball Corp. | 96 | 3,428 | ||||||
FMC Corp. | 39 | 3,356 | ||||||
MeadWestvaco Corp. | 106 | 3,175 | ||||||
Eastman Chemical Co. | 80 | 3,125 | ||||||
Vulcan Materials Co. | 76 | 2,991 | ||||||
Allegheny Technologies, Inc. | 60 | 2,868 | ||||||
Airgas, Inc. | 36 | 2,811 | ||||||
International Flavors & Fragrances, Inc. | 48 | 2,516 | ||||||
United States Steel Corp. | 85 | 2,249 | ||||||
Owens-Illinois, Inc.* | 97 | 1,880 | ||||||
Bemis Company, Inc. | 60 | 1,805 | ||||||
Sealed Air Corp. | 100 | 1,721 | ||||||
Titanium Metals Corp. | 49 | 734 | ||||||
|
| |||||||
Total Materials | 234,947 | |||||||
|
| |||||||
| 46 | THE RYDEX FUNDSANNUALREPORT | See Notes to Financial Statements. |
| SCHEDULE OF INVESTMENTS (concluded) | December 31, 2011 |
S&P 500 2x STRATEGY FUND
| SHARES | VALUE | |||||||
TELECOMMUNICATION SERVICES - 0.9% | ||||||||
AT&T, Inc. | 3,505 | $ | 105,991 | |||||
Verizon Communications, Inc. | 1,675 | 67,201 | ||||||
American Tower Corp. — Class A | 230 | 13,802 | ||||||
CenturyLink, Inc. | 370 | 13,764 | ||||||
Sprint Nextel Corp.* | 1,776 | 4,156 | ||||||
Windstream Corp. | 349 | 4,097 | ||||||
Frontier Communications Corp. | 589 | 3,033 | ||||||
MetroPCS Communications, Inc.* | 170 | 1,476 | ||||||
|
| |||||||
Total Telecommunication Services | 213,520 | |||||||
|
| |||||||
Total Common Stocks | 6,722,613 | |||||||
|
| |||||||
PREFERRED STOCKS - 0.0% | ||||||||
Orchard Supply Hardware — Class A*,1,5,††† | 1 | — | ||||||
|
| |||||||
Total Preferred Stocks | — | |||||||
|
| |||||||
WARRANTS†† - 0.0% | ||||||||
Krispy Kreme Doughnuts, Inc. $12.21, 03/02/12* | 4 | — | ||||||
|
| |||||||
Total Warrants | — | |||||||
|
| |||||||
| FACE AMOUNT | ||||||||
REPURCHASE AGREEMENTS††,2 - 47.3% | ||||||||
Credit Suisse Group issued 12/30/11 at 0.00% due 01/03/123 | $ | 4,819,658 | 4,819,658 | |||||
Mizuho Financial Group, Inc. issued 12/30/11 at 0.00% due 01/03/12 | 2,053,374 | 2,053,374 | ||||||
HSBC Group issued 12/30/11 at 0.00% due 01/03/12 | 1,965,615 | 1,965,615 | ||||||
Deutsche Bank issued 12/30/11 at 0.00% due 01/03/12 | 1,965,615 | 1,965,615 | ||||||
|
| |||||||
Total Repurchase Agreements | 10,804,262 | |||||||
|
| |||||||
Total Investments - 76.7% |
| $ | 17,526,875 | |||||
|
| |||||||
Cash & Other Assets, |
| 5,335,629 | ||||||
|
| |||||||
Total Net Assets - 100.0% |
| $ | 22,862,504 | |||||
| CONTRACTS | UNREALIZED GAIN (LOSS) | |||||||
FUTURES CONTRACTS PURCHASED† | ||||||||
March 2012 S&P 500 Index Mini Futures Contracts (Aggregate Value of Contracts $2,064,975) | 33 | $ | 12,024 | |||||
|
| |||||||
| UNITS | ||||||||
EQUITY INDEX SWAP AGREEMENTS†† | ||||||||
Morgan Stanley Capital Services, Inc. | 771 | $ | (5,785 | ) | ||||
Goldman Sachs International | 3,861 | (28,855 | ) | |||||
Barclays Bank plc | 11,838 | (34,811 | ) | |||||
Credit Suisse Capital, LLC | 12,946 | (60,879 | ) | |||||
|
| |||||||
(Total Notional Value $36,993,941) | $ | (130,330 | ) | |||||
|
| |||||||
| * | Non-income producing security. |
| † | Value determined based on Level 1 inputs — See Note 4. |
| †† | Value determined based on Level 2 inputs — See Note 4. |
| ††† | Value determined based on Level 3 inputs — See Note 4. |
| 1 | Perpetual maturity. |
| 2 | Repurchase Agreements — See Note 5. |
| 3 | All or a portion of this security is pledged as equity index swap collateral at December 31, 2011. |
| 4 | Total Return based on S&P 500 Index +/- financing at a variable rate. |
| 5 | Illiquid security. |
plc — Public Limited Company
REIT — Real Estate Investment Trust
| See Notes to Financial Statements. | THE RYDEX FUNDSANNUALREPORT | 47 |
S&P 500 2x STRATEGY FUND
STATEMENT OF ASSETS AND LIABILITIES
December 31, 2011
ASSETS: | ||||
Investments, at value | $ | 6,722,613 | ||
Repurchase agreements, at value | 10,804,262 | |||
|
| |||
Total investments | 17,526,875 | |||
Segregated cash with broker | 201,415 | |||
Receivables: | ||||
Fund shares sold | 5,309,420 | |||
Dividends | 10,186 | |||
Securities sold | 1,073 | |||
|
| |||
Total assets | 23,048,969 | |||
|
| |||
LIABILITIES: | ||||
Unrealized depreciation on swap agreements | 130,330 | |||
Overdraft due to custodian bank | 15 | |||
Payable for: | ||||
Management fees | 12,993 | |||
Variation margin | 4,506 | |||
Transfer agent and administrative fees | 3,609 | |||
Investor service fees | 3,609 | |||
Portfolio accounting fees | 1,444 | |||
Miscellaneous | 29,959 | |||
|
| |||
Total liabilities | 186,465 | |||
|
| |||
NETASSETS | $ | 22,862,504 | ||
|
| |||
NETASSETSCONSISTOF: | ||||
Paid in capital | $ | 45,664,160 | ||
Undistributed net investment income | — | |||
Accumulated net realized loss on investments | (25,346,291 | ) | ||
Net unrealized appreciation on investments | 2,544,635 | |||
|
| |||
Net assets | $ | 22,862,504 | ||
Capital shares outstanding | 211,593 | |||
Net asset value per share | $ | 108.05 | ||
|
|
STATEMENT OF OPERATIONS
Year Ended December 31, 2011
INVESTMENT INCOME: | ||||
Dividends | $ | 182,159 | ||
Interest | 4,417 | |||
|
| |||
Total investment income | 186,576 | |||
|
| |||
EXPENSES: | ||||
Management fees | 161,463 | |||
Transfer agent and administrative fees | 44,851 | |||
Investor service fees | 44,851 | |||
Portfolio accounting fees | 17,940 | |||
Custodian fees | 4,706 | |||
Trustees’ fees* | 1,863 | |||
Miscellaneous | 40,710 | |||
|
| |||
Total expenses | 316,384 | |||
|
| |||
Net investment loss | (129,808 | ) | ||
|
| |||
NETREALIZEDAND UNREALIZED GAIN (LOSS): | ||||
Net realized gain (loss) on: | ||||
Investments | 520,706 | |||
Swap agreements | (1,444,729 | ) | ||
Futures contracts | (159,005 | ) | ||
|
| |||
Net realized loss | (1,083,028 | ) | ||
|
| |||
Net change in unrealized appreciation (depreciation) on: | ||||
Investments | (1,041,956 | ) | ||
Swap agreements | (135,059 | ) | ||
Futures contracts | (56,376 | ) | ||
|
| |||
Net change in unrealized appreciation (depreciation) | (1,233,391 | ) | ||
|
| |||
Net realized and unrealized loss | (2,316,419 | ) | ||
|
| |||
Net decrease in net assets resulting from operations | $ | (2,446,227 | ) | |
|
|
| * | Relates to Trustees not deemed “interested persons” within the meaning of Section 2(a)(19) of the 1940 Act. |
| 48 | THE RYDEX FUNDSANNUALREPORT | See Notes to Financial Statements. |
S&P 500 2x STRATEGY FUND
STATEMENTS OF CHANGES IN NET ASSETS
| Year Ended December 31, 2011 | Year Ended December 31, 2010 | |||||||
INCREASE (DECREASE) IN NET ASSETS FROM OPERATIONS: | ||||||||
Net investment loss | $ | (129,808 | ) | $ | (106,532 | ) | ||
Net realized gain (loss) on investments | (1,083,028 | ) | 4,122,020 | |||||
Net change in unrealized appreciation (depreciation) on investments | (1,233,391 | ) | (240,293 | ) | ||||
|
|
|
| |||||
Net increase (decrease) in net assets resulting from operations | (2,446,227 | ) | 3,775,195 | |||||
|
|
|
| |||||
CAPITALSHARETRANSACTIONS: | ||||||||
Proceeds from sale of shares | 318,976,204 | 363,397,174 | ||||||
Cost of shares redeemed | (314,691,287 | ) | (375,020,497 | ) | ||||
|
|
|
| |||||
Net increase (decrease) from capital share transactions | 4,284,917 | (11,623,323 | ) | |||||
|
|
|
| |||||
Net increase (decrease) in net assets | 1,838,690 | (7,848,128 | ) | |||||
NETASSETS: | ||||||||
Beginning of year | 21,023,814 | 28,871,942 | ||||||
|
|
|
| |||||
End of year | $ | 22,862,504 | $ | 21,023,814 | ||||
|
|
|
| |||||
Undistributed net investment income at end of year | $ | — | $ | — | ||||
|
|
|
| |||||
CAPITALSHAREACTIVITY: | ||||||||
Shares sold | 2,739,869 | 3,884,836 | ||||||
Shares redeemed | (2,715,164 | ) | (4,020,003 | ) | ||||
|
|
|
| |||||
Net increase (decrease) in shares | 24,705 | (135,167 | ) | |||||
|
|
|
| |||||
| See Notes to Financial Statements. | THE RYDEX FUNDSANNUALREPORT | 49 |
S&P 500 2x STRATEGY FUND
FINANCIAL HIGHLIGHTS
This table is presented to show selected data for a share outstanding throughout each period, and to assist shareholders in evaluating a Fund’s performance for the periods presented.
| Year Ended December 31, 2011 | Year Ended December 31, 2010 | Year Ended December 31, 2009c | Year Ended December 31, 2008c | Year Ended December 31, 2007c | ||||||||||||||||
Per Share Data | ||||||||||||||||||||
Net asset value, beginning of period | $ | 112.49 | $ | 89.65 | $ | 61.59 | $ | 192.40 | $ | 217.10 | ||||||||||
|
|
|
|
|
|
|
|
|
| |||||||||||
Income (loss) from investment operations: | ||||||||||||||||||||
Net investment income (loss)a | (.83 | ) | (.55 | ) | (.19 | ) | .70 | 2.60 | ||||||||||||
Net gain (loss) on investments (realized and unrealized) | (3.61 | ) | 23.39 | 28.76 | (131.51 | ) | (.80 | ) | ||||||||||||
|
|
|
|
|
|
|
|
|
| |||||||||||
Total from investment operations | (4.44 | ) | 22.84 | 28.57 | (130.81 | ) | 1.80 | |||||||||||||
|
|
|
|
|
|
|
|
|
| |||||||||||
Less distributions from: | ||||||||||||||||||||
Net investment income | — | — | (.51 | ) | — | (2.30 | ) | |||||||||||||
Net realized gains | — | — | — | — | (24.20 | ) | ||||||||||||||
|
|
|
|
|
|
|
|
|
| |||||||||||
Total distributions | — | — | (.51 | ) | — | (26.50 | ) | |||||||||||||
|
|
|
|
|
|
|
|
|
| |||||||||||
Net asset value, end of period | $ | 108.05 | $ | 112.49 | $ | 89.65 | $ | 61.59 | $ | 192.40 | ||||||||||
|
|
|
|
|
|
|
|
|
| |||||||||||
Total Returnb | (3.95 | %) | 25.47 | % | 46.40 | % | (67.98 | %) | 0.61 | % | ||||||||||
|
|
|
|
|
|
|
|
|
| |||||||||||
Ratios/Supplemental Data | ||||||||||||||||||||
Net assets, end of period (in thousands) | $ | 22,863 | $ | 21,024 | $ | 28,872 | $ | 26,513 | $ | 36,429 | ||||||||||
|
|
|
|
|
|
|
|
|
| |||||||||||
Ratios to average net assets: | ||||||||||||||||||||
Net investment income (loss) | (0.72 | %) | (0.59 | %) | (0.30 | %) | 0.56 | % | 1.12 | % | ||||||||||
Total expenses | 1.76 | % | 1.71 | % | 1.71 | % | 1.67 | % | 1.62 | % | ||||||||||
|
|
|
|
|
|
|
|
|
| |||||||||||
Portfolio turnover rate | 232 | % | 68 | % | 204 | % | 305 | % | 104 | % | ||||||||||
| a | Net investment income (loss) per share was computed using average shares outstanding throughout the period. |
| b | Total return does not reflect the impact of any additional fees charged by insurance companies and has not been annualized. |
| c | Per share amounts for the years ended December 31, 2007 — December 31, 2008 and the period January 1, 2009 through April 19, 2009 have been restated to reflect a 1:10 reverse stock split effective April 20, 2009. |
| 50 | THE RYDEX FUNDSANNUALREPORT | See Notes to Financial Statements. |
This page intentionally left blank.
| THE RYDEX FUNDSANNUALREPORT | 51 |
PERFORMANCE REPORT AND FUND PROFILE (Unaudited) | December 31, 2011 |
OBJECTIVE: Seeks to provide investment results that match, before fees and expenses, the performance of a specific benchmark on a daily basis. The Fund’s current benchmark is 200% of the performance of the NASDAQ-100 Index® (the “underlying index”). The Fund does not seek to achieve its investment objective over a period of time greater than one day.
For the year ended December 31, 2011, with the NASDAQ-100 Index up 3.66%, the NASDAQ-100® 2x Strategy Fund returned -0.68%. For the year ended December 31, 2011, the Fund maintained a daily correlation of over 99% to its benchmark of 200% of the daily price movement of the NASDAQ-100 Index.
Information Technology, which accounted for 66% of the index, and Health Care contributed most to the performance of the index during the year, while lightly weighted Industrials detracted most from return.
Apple, Inc., QUALCOMM, Inc. and Google, Inc. were among the stocks contributing the most performance to the index for the year, while Oracle Corp., Research In Motion Ltd. and Teva Pharmaceutical Industries Ltd. detracted from performance for the year.
Derivatives in the Fund were used to help provide exposure to the composition of the benchmark in the highest efficient manner and to provide leverage, not for hedging purposes.
Due to the compounding of daily returns, leveraged and inverse funds’ returns over periods other than one day will likely differ in amount and possibly direction from the benchmark return for the same period. Investors should monitor their leveraged and inverse funds’ holdings to ensure that they are consistent with their strategies, as frequently as daily.
The effects of compounding may cause the longer-term correlation of the fund to its benchmark to diminish. The apparent discrepancy between the leveraged and unleveraged indices is the result of compounding, which is described briefly on page 4 of this report.
The NASDAQ-100® Index includes 100 of the largest domestic and international non-financial securities listed on The Nasdaq Stock Market based on market capitalization. The Index reflects companies across major industry groups including computer hardware and software, telecommunications, retail/wholesale trade and biotechnology. It does not contain securities of financial companies, including investment companies.
Holdings Diversification (Market Exposure as % of Net Assets)
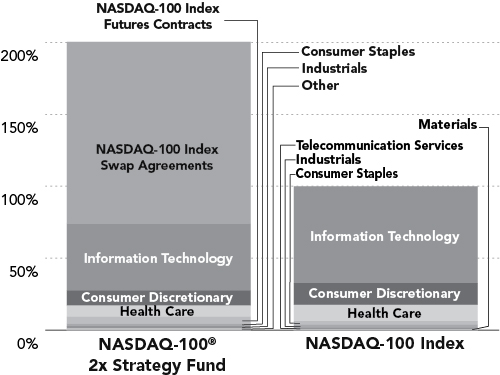
“Holdings Diversification (Market Exposure as % of Net Assets)” excludes any temporary cash investments.
Inception Date: October 1, 2001
Ten Largest Holdings (% of Total Net Assets) | ||||
Apple, Inc. | 10.4 | % | ||
Microsoft Corp. | 6.0 | % | ||
Google, Inc. — Class A | 4.6 | % | ||
Oracle Corp. | 3.6 | % | ||
Intel Corp. | 3.4 | % | ||
Cisco Systems, Inc. | 2.7 | % | ||
QUALCOMM, Inc. | 2.5 | % | ||
Amazon.com, Inc. | 2.2 | % | ||
Amgen, Inc. | 1.6 | % | ||
Comcast Corp. — Class A | 1.4 | % | ||
|
| |||
Top Ten Total | 38.4 | % | ||
|
| |||
“Ten Largest Holdings” exclude any temporary cash or derivative investments.
52 | THE RYDEX FUNDSANNUALREPORT
PERFORMANCE REPORT AND FUND PROFILE (Unaudited) (concluded) |
NASDAQ-100® 2x STRATEGY FUND
Cumulative Fund Performance*
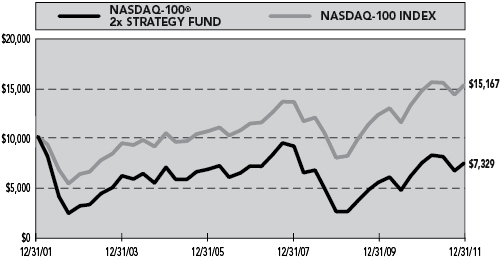
Average Annual Returns*
Periods Ended 12/31/11
| 1 Year | 5 Year | 10 Year | ||||||||||
NASDAQ-100® 2x Strategy Fund | -0.68 | % | 0.80 | % | -3.06 | % | ||||||
NASDAQ-100 Index | 3.66 | % | 6.05 | % | 4.25 | % | ||||||
| * | The performance data represents past performance that is not predictive of future results. The investment return and principal value of an investment in the Fund will fluctuate so that an investor’s shares, when redeemed, may be worth more or less than their original cost. Returns are historical and include changes in principal and reinvested dividends and capital gains and do not reflect the effect of taxes. The NASDAQ-100 Index is an unmanaged index and, unlike the Fund, has no management fees or operating expenses to reduce its reported return. |
Returns do not reflect the impact of any additional fees charged by insurance companies.
THE RYDEX FUNDSANNUALREPORT | 53
| SCHEDULE OF INVESTMENTS | December 31, 2011 |
NASDAQ-100® 2x STRATEGY FUND
| SHARES | VALUE | |||||||
COMMON STOCKS† - 69.2% | ||||||||
INFORMATION TECHNOLOGY - 46.4% |
| |||||||
Apple, Inc.* | 5,740 | $ | 2,324,700 | |||||
Microsoft Corp. | 51,977 | 1,349,323 | ||||||
Google, Inc. — Class A* | 1,584 | 1,023,106 | ||||||
Oracle Corp. | 31,166 | 799,408 | ||||||
Intel Corp. | 31,460 | 762,905 | ||||||
Cisco Systems, Inc. | 33,213 | 600,491 | ||||||
QUALCOMM, Inc. | 10,390 | 568,333 | ||||||
eBay, Inc.* | 7,972 | 241,791 | ||||||
Baidu, Inc. ADR* | 1,679 | 195,553 | ||||||
Automatic Data Processing, Inc. | 3,017 | 162,948 | ||||||
Dell, Inc.* | 11,104 | 162,452 | ||||||
Yahoo!, Inc.* | 7,666 | 123,653 | ||||||
Cognizant Technology Solutions Corp. — Class A* | 1,868 | 120,131 | ||||||
Intuit, Inc. | 1,842 | 96,871 | ||||||
Broadcom Corp. — Class A* | 3,000 | 88,080 | ||||||
Applied Materials, Inc. | 8,140 | 87,179 | ||||||
Activision Blizzard, Inc. | 7,070 | 87,102 | ||||||
Adobe Systems, Inc.* | 3,030 | 85,658 | ||||||
NetApp, Inc.* | 2,272 | 82,405 | ||||||
Altera Corp. | 1,984 | 73,606 | ||||||
SanDisk Corp.* | 1,480 | 72,831 | ||||||
Symantec Corp.* | 4,555 | 71,286 | ||||||
Citrix Systems, Inc.* | 1,149 | 69,767 | ||||||
Paychex, Inc. | 2,237 | 67,356 | ||||||
Check Point Software Technologies Ltd.* | 1,280 | 67,251 | ||||||
CA, Inc. | 3,045 | 61,555 | ||||||
NVIDIA Corp.* | 3,768 | 52,224 | ||||||
F5 Networks, Inc.* | 490 | 51,999 | ||||||
Xilinx, Inc. | 1,618 | 51,873 | ||||||
Marvell Technology Group Ltd.* | 3,744 | 51,854 | ||||||
Fiserv, Inc.* | 865 | 50,810 | ||||||
KLA-Tencor Corp. | 1,034 | 49,890 | ||||||
Seagate Technology plc | 2,870 | 47,068 | ||||||
Maxim Integrated Products, Inc. | 1,798 | 46,820 | ||||||
Nuance Communications, Inc.* | 1,858 | 46,747 | ||||||
Research In Motion Ltd.* | 3,213 | 46,589 | ||||||
Avago Technologies Ltd. | 1,518 | 43,809 | ||||||
Microchip Technology, Inc. | 1,180 | 43,223 | ||||||
Autodesk, Inc.* | 1,401 | 42,492 | ||||||
Linear Technology Corp. | 1,408 | 42,282 | ||||||
Electronic Arts, Inc.* | 2,048 | 42,189 | ||||||
Micron Technology, Inc.* | 6,104 | 38,394 | ||||||
Akamai Technologies, Inc.* | 1,108 | 35,766 | ||||||
VeriSign, Inc. | 980 | 35,006 | ||||||
BMC Software, Inc.* | 1,055 | 34,583 | ||||||
Lam Research Corp.* | 740 | 27,395 | ||||||
Flextronics International Ltd.* | 4,406 | 24,938 | ||||||
Infosys Ltd. ADR | 481 | 24,714 | ||||||
|
| |||||||
Total Information Technology | 10,376,406 | |||||||
|
| |||||||
CONSUMER DISCRETIONARY - 10.6% | ||||||||
Amazon.com, Inc.* | 2,808 | 486,065 | ||||||
Comcast Corp. — Class A | 12,934 | 306,665 | ||||||
Starbucks Corp. | 4,603 | 211,784 | ||||||
News Corp. — Class A | 10,644 | 189,889 | ||||||
DIRECTV — Class A* | 4,362 | 186,519 | ||||||
Priceline.com, Inc.* | 306 | 143,119 | ||||||
Bed Bath & Beyond, Inc.* | 1,515 | 87,825 | ||||||
Wynn Resorts Ltd. | 773 | 85,409 | ||||||
Ross Stores, Inc. | 1,428 | 67,873 | ||||||
O’Reilly Automotive, Inc.* | 790 | 63,161 | ||||||
Dollar Tree, Inc.* | 737 | 61,252 | ||||||
Staples, Inc. | 4,317 | 59,963 | ||||||
Mattel, Inc. | 2,089 | 57,991 | ||||||
Liberty Interactive Corp. — Class A* | 3,467 | 56,217 | ||||||
Garmin Ltd. | 1,200 | 47,772 | ||||||
Apollo Group, Inc. — Class A* | 803 | 43,258 | ||||||
Sirius XM Radio, Inc.* | 23,169 | 42,168 | ||||||
Virgin Media, Inc. | 1,861 | 39,788 | ||||||
Fossil, Inc.* | 390 | 30,950 | ||||||
Netflix, Inc.* | 340 | 23,559 | ||||||
Expedia, Inc. | 749 | 21,721 | ||||||
Ctrip.com International Ltd. ADR* | 913 | 21,364 | ||||||
Sears Holdings Corp.* | 658 | 20,911 | ||||||
TripAdvisor, Inc.* | 749 | 18,870 | ||||||
Orchard Supply Hardware Stores Corp. — Class A*,5,††† | 28 | 210 | ||||||
|
| |||||||
Total Consumer Discretionary | 2,374,303 | |||||||
|
| |||||||
HEALTH CARE - 7.8% | ||||||||
Amgen, Inc. | 5,411 | 347,440 | ||||||
Gilead Sciences, Inc.* | 4,636 | 189,751 | ||||||
Celgene Corp.* | 2,738 | 185,089 | ||||||
Teva Pharmaceutical Industries Ltd. ADR | 4,325 | 174,557 | ||||||
Biogen Idec, Inc.* | 1,500 | 165,075 | ||||||
Express Scripts, Inc.* | 2,999 | 134,025 | ||||||
Intuitive Surgical, Inc.* | 236 | 109,270 | ||||||
Alexion Pharmaceuticals, Inc.* | 1,140 | 81,510 | ||||||
Cerner Corp.* | 1,046 | 64,068 | ||||||
Mylan, Inc.* | 2,635 | 56,547 | ||||||
Perrigo Co. | 575 | 55,948 | ||||||
Vertex Pharmaceuticals, Inc.* | 1,290 | 42,841 | ||||||
Life Technologies Corp.* | 1,101 | 42,840 | ||||||
Henry Schein, Inc.* | 553 | 35,630 | ||||||
DENTSPLY International, Inc. | 879 | 30,756 | ||||||
Warner Chilcott plc — Class A* | 1,567 | 23,709 | ||||||
|
| |||||||
Total Health Care | 1,739,056 | |||||||
|
| |||||||
| 54 | THE RYDEX FUNDSANNUALREPORT | See Notes to Financial Statements. |
| SCHEDULE OF INVESTMENTS (concluded) | December 31, 2011 |
NASDAQ-100® 2x STRATEGY FUND
| SHARES | VALUE | |||||||
CONSUMER STAPLES - 1.8% | ||||||||
Costco Wholesale Corp. | 2,677 | $ | 223,048 | |||||
Whole Foods Market, Inc. | 1,108 | 77,095 | ||||||
Hansen Natural Corp.* | 540 | 49,756 | ||||||
Green Mountain Coffee Roasters, Inc.* | 957 | 42,921 | ||||||
|
| |||||||
Total Consumer Staples | 392,820 | |||||||
|
| |||||||
INDUSTRIALS - 1.5% | ||||||||
PACCAR, Inc. | 2,213 | 82,921 | ||||||
Fastenal Co. | 1,826 | 79,632 | ||||||
CH Robinson Worldwide, Inc. | 1,010 | 70,478 | ||||||
Expeditors International of Washington, Inc. | 1,307 | 53,535 | ||||||
Stericycle, Inc.* | 522 | 40,674 | ||||||
First Solar, Inc.* | 529 | 17,859 | ||||||
|
| |||||||
Total Industrials | 345,099 | |||||||
|
| |||||||
TELECOMMUNICATION SERVICES - 0.7% | ||||||||
Vodafone Group plc ADR | 5,680 | 159,210 | ||||||
|
| |||||||
MATERIALS - 0.4% | ||||||||
Sigma-Aldrich Corp. | 747 | 46,658 | ||||||
Randgold Resources Ltd. ADR | 357 | 36,450 | ||||||
|
| |||||||
Total Materials | 83,108 | |||||||
|
| |||||||
Total Common Stocks | 15,470,002 | |||||||
|
| |||||||
PREFERRED STOCKS - 0.0% | ||||||||
Orchard Supply Hardware — Class A*,1,5,††† | 28 | — | ||||||
|
| |||||||
Total Preferred Stocks | — | |||||||
|
| |||||||
| FACE AMOUNT | ||||||||
REPURCHASE AGREEMENTS††,2 - 27.1% | ||||||||
Credit Suisse Group issued 12/30/11 at 0.00% due 01/03/123 | $ | 4,264,748 | 4,264,748 | |||||
Mizuho Financial Group, Inc. issued 12/30/11 at 0.00% due 01/03/12 | 611,331 | 611,331 | ||||||
HSBC Group issued 12/30/11 at 0.00% due 01/03/12 | 585,203 | 585,203 | ||||||
Deutsche Bank issued 12/30/11 at 0.00% due 01/03/12 | $ | 585,203 | 585,203 | |||||
|
| |||||||
Total Repurchase Agreements | 6,046,485 | |||||||
|
| |||||||
Total Investments - 96.3% | $ | 21,516,487 | ||||||
|
| |||||||
Cash & Other Assets, Less Liabilities - 3.7% | 823,629 | |||||||
|
| |||||||
Total Net Assets - 100.0% | $ | 22,340,116 | ||||||
| CONTRACTS | UNREALIZED GAIN (LOSS) | |||||||
FUTURES CONTRACTS PURCHASED† | ||||||||
March 2012 NASDAQ-100 Index Mini Futures Contracts | 23 | $ | 22,768 | |||||
|
| |||||||
| UNITS | ||||||||
EQUITY INDEX SWAP AGREEMENTS†† | ||||||||
Morgan Stanley Capital Services, Inc. January 2012 NASDAQ-100 Index Swap, Terminating 01/30/124 | 251 | $ | (3,809 | ) | ||||
Barclays Bank plc January 2012 NASDAQ-100 Index Swap, Terminating 01/31/124 | 988 | (7,007 | ) | |||||
Credit Suisse Capital, LLC January 2012 NASDAQ-100 Index Swap, Terminating 01/31/124 | 3,662 | (21,022 | ) | |||||
Goldman Sachs International January 2012 NASDAQ-100 Index Swap, Terminating 01/27/124 (Notional Value $17,080,402) | 7,499 | (113,379 | ) | |||||
|
| |||||||
(Total Notional Value $28,244,575) | $ | (145,217 | ) | |||||
|
| |||||||
| * | Non-income producing security. |
| † | Value determined based on Level 1 inputs — See Note 4. |
| †† | Value determined based on Level 2 inputs — See Note 4. |
| ††† | Value determined based on Level 3 inputs — See Note 4. |
| 1 | Perpetual maturity. |
| 2 | Repurchase Agreements — See Note 5. |
| 3 | All or a portion of this security is pledged as equity index swap collateral at December 31, 2011. |
| 4 | Total Return based on NASDAQ-100 Index +/- financing at a variable rate. |
| 5 | Illiquid security. |
ADR — American Depositary Receipt
plc — Public limited Company
| See Notes to Financial Statements. | THE RYDEX FUNDSANNUALREPORT | 55 |
NASDAQ-100® 2x STRATEGY FUND
STATEMENT OF ASSETS AND LIABILITIES
December 31, 2011
ASSETS: | ||||
Investments, at value | $ | 15,470,002 | ||
Repurchase agreements, at value | 6,046,485 | |||
|
| |||
Total investments | 21,516,487 | |||
Segregated cash with broker | 229,760 | |||
Receivables: | ||||
Fund shares sold | 805,496 | |||
Dividends | 10,612 | |||
|
| |||
Total assets | 22,562,355 | |||
|
| |||
LIABILITIES: | ||||
Unrealized depreciation on swap agreements | 145,217 | |||
Overdraft due to custodian bank | 148 | |||
Payable for: | ||||
Management fees | 16,559 | |||
Transfer agent and administrative fees | 4,600 | |||
Investor service fees | 4,600 | |||
Variation margin | 2,530 | |||
Portfolio accounting fees | 1,840 | |||
Fund shares redeemed | 637 | |||
Miscellaneous | 46,108 | |||
|
| |||
Total liabilities | 222,239 | |||
|
| |||
NETASSETS | $ | 22,340,116 | ||
|
| |||
NETASSETSCONSISTOF: | ||||
Paid in capital | $ | 23,947,373 | ||
Undistributed net investment income | — | |||
Accumulated net realized loss on investments | (6,736,080 | ) | ||
Net unrealized appreciation on investments | 5,128,823 | |||
|
| |||
Net assets | $ | 22,340,116 | ||
Capital shares outstanding | 1,079,833 | |||
Net asset value per share | $ | 20.69 | ||
|
|
STATEMENT OF OPERATIONS
Year Ended December 31, 2011
INVESTMENT INCOME: | ||||
Dividends (net of foreign withholding tax of $58) | $ | 125,190 | ||
Interest | 6,684 | |||
|
| |||
Total investment income | 131,874 | |||
|
| |||
EXPENSES: | ||||
Management fees | 242,184 | |||
Transfer agent and administrative fees | 67,273 | |||
Investor service fees | 67,273 | |||
Portfolio accounting fees | 26,909 | |||
Custodian fees | 6,770 | |||
Trustees’ fees* | 2,787 | |||
Miscellaneous | 70,008 | |||
|
| |||
Total expenses | 483,204 | |||
|
| |||
Net investment loss | (351,330 | ) | ||
|
| |||
NET REALIZEDAND UNREALIZED GAIN (LOSS): | ||||
Net realized gain (loss) on: | ||||
Investments | 1,806,320 | |||
Swap agreements | (1,582,554 | ) | ||
Futures contracts | (720,564 | ) | ||
|
| |||
Net realized loss | (496,798 | ) | ||
|
| |||
Net change in unrealized appreciation (depreciation) on: | ||||
Investments | (1,388,046 | ) | ||
Swap agreements | 76,560 | |||
Futures contracts | (44,577 | ) | ||
|
| |||
Net change in unrealized appreciation (depreciation) | (1,356,063 | ) | ||
|
| |||
Net realized and unrealized loss | (1,852,861 | ) | ||
|
| |||
Net decrease in net assets resulting from operations | $ | (2,204,191 | ) | |
|
|
| * | Relates to Trustees not deemed “interested persons” within the meaning of Section 2(a)(19) of the 1940 Act. |
| 56 | THE RYDEX FUNDSANNUALREPORT | See Notes to Financial Statements. |
NASDAQ-100® 2x STRATEGY FUND
STATEMENTS OF CHANGES IN NET ASSETS
| Year Ended December 31, 2011 | Year Ended December 31, 2010 | |||||||
INCREASE (DECREASE) IN NET ASSETS FROM OPERATIONS: | ||||||||
Net investment loss | $ | (351,330 | ) | $ | (306,098 | ) | ||
Net realized gain (loss) on investments | (496,798 | ) | 12,173,138 | |||||
Net change in unrealized appreciation (depreciation) on investments | (1,356,063 | ) | (5,279,221 | ) | ||||
|
|
|
| |||||
Net increase (decrease) in net assets resulting from operations | (2,204,191 | ) | 6,587,819 | |||||
|
|
|
| |||||
DISTRIBUTIONS TO SHAREHOLDERS FROM: | ||||||||
Net realized gains | (3,561,876 | ) | — | |||||
|
|
|
| |||||
Total distributions to shareholders | (3,561,876 | ) | — | |||||
|
|
|
| |||||
CAPITALSHARETRANSACTIONS: | ||||||||
Proceeds from sale of shares | 173,420,325 | 235,719,363 | ||||||
Distributions reinvested | 3,561,876 | — | ||||||
Cost of shares redeemed | (182,983,002 | ) | (244,312,378 | ) | ||||
|
|
|
| |||||
Net decrease from capital share transactions | (6,000,801 | ) | (8,593,015 | ) | ||||
|
|
|
| |||||
Net decrease in net assets | (11,766,868 | ) | (2,005,196 | ) | ||||
NETASSETS: | ||||||||
Beginning of year | 34,106,984 | 36,112,180 | ||||||
|
|
|
| |||||
End of year | $ | 22,340,116 | $ | 34,106,984 | ||||
|
|
|
| |||||
Undistributed net investment income at end of year | $ | — | $ | — | ||||
|
|
|
| |||||
CAPITALSHAREACTIVITY: | ||||||||
Shares sold | 6,781,085 | 12,584,632 | ||||||
Shares issued from reinvestment of distributions | 162,125 | — | ||||||
Shares redeemed | (7,258,388 | ) | (13,211,686 | ) | ||||
|
|
|
| |||||
Net decrease in shares | (315,178 | ) | (627,054 | ) | ||||
|
|
|
| |||||
| See Notes to Financial Statements. | THE RYDEX FUNDSANNUALREPORT | 57 |
NASDAQ-100® 2x STRATEGY FUND
FINANCIAL HIGHLIGHTS
This table is presented to show selected data for a share outstanding throughout each period, and to assist shareholders in evaluating a Fund’s performance for the periods presented.
| Year Ended December 31, 2011 | Year Ended December 31, 2010 | Year Ended December 31, 2009 | Year Ended December 31, 2008 | Year Ended December 31, 2007 | ||||||||||||||||
Per Share Data | ||||||||||||||||||||
Net asset value, beginning of period | $ | 24.45 | $ | 17.86 | $ | 8.20 | $ | 29.98 | $ | 23.46 | ||||||||||
|
|
|
|
|
|
|
|
|
| |||||||||||
Income (loss) from investment operations: | ||||||||||||||||||||
Net investment income (loss)a | (.33 | ) | (.22 | ) | (.14 | ) | (.10 | ) | .13 | |||||||||||
Net gain (loss) on investments (realized and unrealized) | .39 | 6.81 | 9.80 | (21.66 | ) | 6.49 | ||||||||||||||
|
|
|
|
|
|
|
|
|
| |||||||||||
Total from investment operations | .06 | 6.59 | 9.66 | (21.76 | ) | 6.62 | ||||||||||||||
|
|
|
|
|
|
|
|
|
| |||||||||||
Less distributions from: | ||||||||||||||||||||
Net investment income | — | — | — | (.02 | ) | (.10 | ) | |||||||||||||
Net realized gains | (3.82 | ) | — | — | — | — | ||||||||||||||
|
|
|
|
|
|
|
|
|
| |||||||||||
Total distributions | (3.82 | ) | — | — | (.02 | ) | (.10 | ) | ||||||||||||
|
|
|
|
|
|
|
|
|
| |||||||||||
Net asset value, end of period | $ | 20.69 | $ | 24.45 | $ | 17.86 | $ | 8.20 | $ | 29.98 | ||||||||||
|
|
|
|
|
|
|
|
|
| |||||||||||
Total Returnb | (0.68 | %) | 36.90 | % | 117.80 | % | (72.60 | %) | 28.20 | % | ||||||||||
|
|
|
|
|
|
|
|
|
| |||||||||||
Ratios/Supplemental Data | ||||||||||||||||||||
Net assets, end of period (in thousands) | $ | 22,340 | $ | 34,107 | $ | 36,112 | $ | 23,347 | $ | 65,069 | ||||||||||
|
|
|
|
|
|
|
|
|
| |||||||||||
Ratios to average net assets: | ||||||||||||||||||||
Net investment income (loss) | (1.31 | %) | (1.16 | %) | (1.19 | %) | (0.53 | %) | 0.45 | % | ||||||||||
Total expenses | 1.80 | % | 1.74 | % | 1.75 | % | 1.72 | % | 1.66 | % | ||||||||||
|
|
|
|
|
|
|
|
|
| |||||||||||
Portfolio turnover rate | 22 | % | 92 | % | 80 | % | 175 | % | 203 | % | ||||||||||
| a | Net investment income (loss) per share was computed using average shares outstanding throughout the period. |
| b | Total return does not reflect the impact of any additional fees charged by insurance companies and has not been annualized. |
| 58 | THE RYDEX FUNDSANNUALREPORT | See Notes to Financial Statements. |
This page intentionally left blank.
THE RYDEX FUNDSANNUALREPORT | 59
| PERFORMANCE REPORT AND FUND PROFILE (Unaudited) | December 31, 2011 | |
| MID-CAP 1.5x STRATEGY FUND | ||
OBJECTIVE: Seeks to provide investment results that correlate, before fees and expenses, to the performance of a specific benchmark for mid-cap securities on a daily basis. The Fund’s current benchmark is 150% of the performance of the S&P MidCap 400® Index (the “underlying index”). The Fund does not seek to achieve its investment objective over a period of time greater than one day.
For the year ended December 31, 2011, the Mid-Cap 1.5x Strategy Fund returned -7.59%. Over the year, its benchmark, the S&P MidCap 400® Index, returned -1.73%. The Fund had a correlation of more than 99% to its benchmark of 150% of the daily price movement of the S&P MidCap 400 Index.
Utilities and Consumer Staples provided the most performance to the index during the year. Information Technology and Energy were the largest detractors from performance.
Dollar Tree, Inc., Perrigo Co. and Hansen Natural Corp. contributed the most performance to the index for the year. Cree, Inc., Rovi Corp and Arch Coal, Inc. were the largest detractors from performance for the year.
Derivatives in the Fund were used to help provide exposure to the composition of the benchmark in the highest efficient manner and to provide leverage, not for hedging purposes.
Due to the compounding of daily returns, leveraged and inverse funds’ returns over periods other than one day will likely differ in amount and possibly direction from the benchmark return for the same period. Investors should monitor their leveraged and inverse funds’ holdings to ensure that they are consistent with their strategies, as frequently as daily.
The effects of compounding may cause the longer-term correlation of the fund to its benchmark to diminish. The apparent discrepancy between the leveraged and unleveraged indices is the result of compounding, which is described briefly on page 4 of this report.
The S&P MidCap 400® Index provides investors with a benchmark for mid-sized companies. The index covers approximately 7% of the U.S. equity market, and seeks to remain an accurate measure of mid-sized companies, reflecting the risk and return characteristics of the broader mid-cap universe on an on-going basis.
Holdings Diversification (Market Exposure as % of
Net Assets)

“Holdings Diversification (Market Exposure as % of Net Assets)” excludes any temporary cash investments.
Inception Date: October 1, 2001
Ten Largest Holdings | ||||
Kansas City Southern | 0.6 | % | ||
Hansen Natural Corp. | 0.5 | % | ||
Vertex Pharmaceuticals, Inc. | 0.5 | % | ||
AMETEK, Inc. | 0.5 | % | ||
Macerich Co. | 0.5 | % | ||
Church & Dwight Company, Inc. | 0.5 | % | ||
Green Mountain Coffee Roasters, Inc. | 0.4 | % | ||
Henry Schein, Inc. | 0.4 | % | ||
Federal Realty Investment Trust | 0.4 | % | ||
SL Green Realty Corp. | 0.4 | % | ||
|
| |||
Top Ten Total | 4.7 | % | ||
|
| |||
“Ten Largest Holdings” exclude any temporary cash or derivative investments.
| 60 | THE RYDEX FUNDSANNUALREPORT |
| PERFORMANCE REPORT AND FUND PROFILE (Unaudited) (concluded) | ||
| MID-CAP 1.5x STRATEGY FUND | ||
Cumulative Fund Performance*
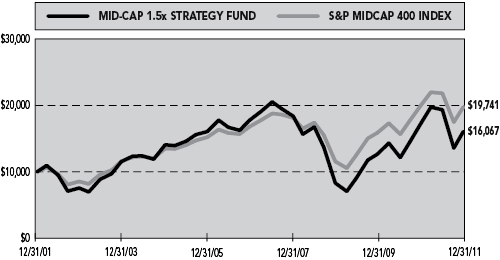
Average Annual Returns*
Periods Ended 12/31/11
| 1 Year | 5 Year | 10 Year | ||||||||||
Mid-Cap 1.5x Strategy Fund | -7.59 | % | -1.95 | % | 4.86 | % | ||||||
S&P MidCap 400 Index | -1.73 | % | 3.32 | % | 7.04 | % | ||||||
| * | The performance data represents past performance that is not predictive of future results. The investment return and principal value of an investment in the Fund will fluctuate so that an investor’s shares, when redeemed, may be worth more or less than their original cost. Returns are historical and include changes in principal and reinvested dividends and capital gains and do not reflect the effect of taxes. The S&P MidCap 400 Index is an unmanaged index and, unlike the Fund, has no management fees or operating expenses to reduce its reported return. |
| Returns do not reflect the impact of any additional fees charged by insurance companies. |
| THE RYDEX FUNDSANNUALREPORT | 61 |
| SCHEDULE OF INVESTMENTS | December 31, 2011 | |
| MID-CAP 1.5x STRATEGY FUND | ||
| SHARES | VALUE | |||||||
COMMON STOCKS† - 79.7 % | ||||||||
FINANCIALS - 16.5% | ||||||||
Macerich Co. | 1,240 | $ | 62,744 | |||||
Federal Realty Investment Trust | 598 | 54,268 | ||||||
SL Green Realty Corp. | 810 | 53,978 | ||||||
UDR, Inc. | 2,066 | 51,857 | ||||||
New York Community Bancorp, Inc. | 4,118 | 50,940 | ||||||
Rayonier, Inc. | 1,138 | 50,789 | ||||||
Affiliated Managers Group, Inc.* | 496 | 47,591 | ||||||
Essex Property Trust, Inc. | 320 | 44,963 | ||||||
Realty Income Corp. | 1,250 | 43,700 | ||||||
Everest Re Group Ltd. | 507 | 42,634 | ||||||
Camden Property Trust | 670 | 41,701 | ||||||
Alexandria Real Estate Equities, Inc. | 580 | 40,003 | ||||||
MSCI, Inc. — Class A* | 1,140 | 37,540 | ||||||
WR Berkley Corp. | 1,050 | 36,109 | ||||||
Reinsurance Group of America, Inc. — Class A | 690 | 36,053 | ||||||
Arthur J Gallagher & Co. | 1,070 | 35,781 | ||||||
BRE Properties, Inc. | 700 | 35,336 | ||||||
Senior Housing Properties Trust | 1,530 | 34,333 | ||||||
Liberty Property Trust | 1,088 | 33,597 | ||||||
Taubman Centers, Inc. | 540 | 33,534 | ||||||
Fidelity National Financial, Inc. — Class A | 2,065 | 32,895 | ||||||
Regency Centers Corp. | 850 | 31,977 | ||||||
Cullen | 570 | 30,159 | ||||||
Raymond James Financial, Inc. | 960 | 29,722 | ||||||
Transatlantic Holdings, Inc. | 538 | 29,445 | ||||||
HCC Insurance Holdings, Inc. | 1,070 | 29,425 | ||||||
Duke Realty Corp. | 2,380 | 28,679 | ||||||
Commerce Bancshares, Inc. | 749 | 28,552 | ||||||
First Niagara Financial Group, Inc. | 3,278 | 28,289 | ||||||
American Campus Communities, Inc. | 670 | 28,113 | ||||||
East West Bancorp, Inc. | 1,400 | 27,650 | ||||||
American Financial Group, Inc. | 730 | 26,930 | ||||||
Hospitality Properties Trust | 1,166 | 26,795 | ||||||
Signature Bank* | 440 | 26,396 | ||||||
Home Properties, Inc. | 450 | 25,906 | ||||||
National Retail Properties, Inc. | 975 | 25,720 | ||||||
Eaton Vance Corp. | 1,084 | 25,626 | ||||||
Hancock Holding Co. | 800 | 25,576 | ||||||
Jones Lang LaSalle, Inc. | 410 | 25,117 | ||||||
Weingarten Realty Investors | 1,140 | 24,875 | ||||||
Brown & Brown, Inc. | 1,098 | 24,848 | ||||||
SEI Investments Co. | 1,384 | 24,012 | ||||||
Old Republic International Corp. | 2,410 | 22,341 | ||||||
Mack-Cali Realty Corp. | 817 | 21,806 | ||||||
Valley National Bancorp | 1,757 | 21,734 | ||||||
Highwoods Properties, Inc. | 680 | 20,176 | ||||||
Waddell & Reed Financial, Inc. — Class A | 800 | 19,816 | ||||||
Bank of Hawaii Corp. | 440 | 19,576 | ||||||
SVB Financial Group* | 410 | 19,553 | ||||||
City National Corp. | 440 | 19,439 | ||||||
Jefferies Group, Inc. | 1,370 | 18,837 | ||||||
Omega Healthcare Investors, Inc. | 970 | 18,770 | ||||||
Fulton Financial Corp. | 1,880 | 18,443 | ||||||
Associated Banc-Corp. | 1,630 | 18,207 | ||||||
Protective Life Corp. | 781 | 17,619 | ||||||
Aspen Insurance Holdings Ltd. | 658 | 17,437 | ||||||
Prosperity Bancshares, Inc. | 430 | 17,350 | ||||||
FirstMerit Corp. | 1,026 | 15,523 | ||||||
Mercury General Corp. | 340 | 15,511 | ||||||
StanCorp Financial Group, Inc. | 419 | 15,398 | ||||||
TCF Financial Corp. | 1,480 | 15,274 | ||||||
Hanover Insurance Group, Inc. | 420 | 14,679 | ||||||
Trustmark Corp. | 600 | 14,574 | ||||||
Corporate Office Properties Trust | 680 | 14,457 | ||||||
Washington Federal, Inc. | 1,010 | 14,130 | ||||||
Webster Financial Corp. | 690 | 14,069 | ||||||
Kemper Corp. | 470 | 13,729 | ||||||
First American Financial Corp. | 987 | 12,505 | ||||||
Apollo Investment Corp. | 1,850 | 11,914 | ||||||
Westamerica Bancorporation | 270 | 11,853 | ||||||
Potlatch Corp. | 377 | 11,728 | ||||||
Janus Capital Group, Inc. | 1,761 | 11,112 | ||||||
Cathay General Bancorp | 736 | 10,988 | ||||||
Synovus Financial Corp. | 7,390 | 10,420 | ||||||
Greenhill & Company, Inc. | 270 | 9,820 | ||||||
Equity One, Inc. | 563 | 9,560 | ||||||
International Bancshares Corp. | 500 | 9,167 | ||||||
BancorpSouth, Inc. | 677 | 7,461 | ||||||
Astoria Financial Corp. | 790 | 6,707 | ||||||
|
| |||||||
Total Financials | 2,035,841 | |||||||
| �� |
|
| ||||||
INDUSTRIALS - 13.3% | ||||||||
Kansas City Southern* | 1,039 | 70,662 | ||||||
AMETEK, Inc. | 1,510 | 63,571 | ||||||
Donaldson Company, Inc. | 700 | 47,656 | ||||||
AGCO Corp.* | 920 | 39,532 | ||||||
KBR, Inc. | 1,400 | 39,018 | ||||||
J.B. Hunt Transport Services, Inc. | 844 | 38,039 | ||||||
BE Aerospace, Inc.* | 966 | 37,394 | ||||||
Hubbell, Inc. — Class B | 550 | 36,773 | ||||||
Gardner Denver, Inc. | 477 | 36,758 | ||||||
Waste Connections, Inc. | 1,055 | 34,963 | ||||||
Kirby Corp.* | 520 | 34,237 | ||||||
Wabtec Corp. | 447 | 31,268 | ||||||
Pentair, Inc. | 930 | 30,960 | ||||||
Lincoln Electric Holdings, Inc. | 790 | 30,905 | ||||||
| 62 | THE RYDEX FUNDSANNUALREPORT | See Notes to Financial Statements. |
| SCHEDULE OF INVESTMENTS (continued) | December 31, 2011 | |
| MID-CAP 1.5x STRATEGY FUND | ||
| SHARES | VALUE | |||||||
MSC Industrial Direct Co., Inc. — Class A | 430 | $ | 30,766 | |||||
Timken Co. | 790 | 30,581 | ||||||
IDEX Corp. | 788 | 29,243 | ||||||
Towers Watson & Co. — Class A | 485 | 29,066 | ||||||
SPX Corp. | 480 | 28,930 | ||||||
Clean Harbors, Inc.* | 440 | 28,041 | ||||||
Manpower, Inc. | 770 | 27,527 | ||||||
Kennametal, Inc. | 752 | 27,463 | ||||||
Thomas & Betts Corp.* | 488 | 26,645 | ||||||
URS Corp.* | 750 | 26,340 | ||||||
Alaska Air Group, Inc.* | 337 | 25,305 | ||||||
Carlisle Companies, Inc. | 570 | 25,251 | ||||||
Fortune Brands Home & Security, Inc.* | 1,467 | 24,983 | ||||||
Copart, Inc.* | 503 | 24,089 | ||||||
Triumph Group, Inc. | 404 | 23,614 | ||||||
CLARCOR, Inc. | 470 | 23,495 | ||||||
Nordson Corp. | 563 | 23,184 | ||||||
Woodward, Inc. | 560 | 22,921 | ||||||
Graco, Inc. | 557 | 22,776 | ||||||
Trinity Industries, Inc. | 750 | 22,545 | ||||||
AECOM Technology Corp.* | 1,088 | 22,380 | ||||||
Crane Co. | 460 | 21,487 | ||||||
Landstar System, Inc. | 444 | 21,276 | ||||||
Acuity Brands, Inc. | 401 | 21,253 | ||||||
Regal-Beloit Corp. | 390 | 19,878 | ||||||
GATX Corp. | 439 | 19,167 | ||||||
Valmont Industries, Inc. | 210 | 19,066 | ||||||
Corrections Corporation of America* | 934 | 19,026 | ||||||
Oshkosh Corp.* | 858 | 18,344 | ||||||
Alliant Techsystems, Inc. | 310 | 17,720 | ||||||
Watsco, Inc. | 269 | 17,663 | ||||||
United Rentals, Inc.* | 588 | 17,375 | ||||||
ITT Corp. | 871 | 16,836 | ||||||
Shaw Group, Inc.* | 615 | 16,543 | ||||||
Lennox International, Inc. | 485 | 16,369 | ||||||
Esterline Technologies Corp.* | 290 | 16,231 | ||||||
FTI Consulting, Inc.* | 382 | 16,204 | ||||||
Alexander & Baldwin, Inc. | 390 | 15,920 | ||||||
Exelis, Inc. | 1,741 | 15,756 | ||||||
Harsco Corp. | 756 | 15,558 | ||||||
Con-way, Inc. | 520 | 15,163 | ||||||
Huntington Ingalls Industries, Inc.* | 460 | 14,389 | ||||||
Terex Corp.* | 1,028 | 13,888 | ||||||
Rollins, Inc. | 610 | 13,554 | ||||||
UTI Worldwide, Inc. | 970 | 12,891 | ||||||
General Cable Corp.* | 496 | 12,405 | ||||||
Corporate Executive Board Co. | 314 | 11,963 | ||||||
Brink’s Co. | 440 | 11,827 | ||||||
HNI Corp. | 420 | 10,962 | ||||||
Deluxe Corp. | 480 | 10,925 | ||||||
Herman Miller, Inc. | 550 | 10,148 | ||||||
JetBlue Airways Corp.* | 1,920 | 9,984 | ||||||
Werner Enterprises, Inc. | 408 | 9,833 | ||||||
Mine Safety Appliances Co. | 290 | 9,605 | ||||||
Granite Construction, Inc. | 330 | 7,828 | ||||||
Korn* | 450 | 7,677 | ||||||
|
| |||||||
Total Industrials | 1,641,595 | |||||||
|
| |||||||
INFORMATION TECHNOLOGY - 12.2% | ||||||||
Trimble Navigation Ltd.* | 1,160 | 50,344 | ||||||
ANSYS, Inc.* | 870 | 49,834 | ||||||
Alliance Data Systems Corp.* | 470 | 48,805 | ||||||
Equinix, Inc.* | 450 | 45,630 | ||||||
Avnet, Inc.* | 1,400 | 43,526 | ||||||
Rackspace Hosting, Inc.* | 980 | 42,150 | ||||||
Lam Research Corp.* | 1,126 | 41,685 | ||||||
Arrow Electronics, Inc.* | 1,057 | 39,542 | ||||||
Factset Research Systems, Inc. | 425 | 37,094 | ||||||
Informatica Corp.* | 1,000 | 36,930 | ||||||
Synopsys, Inc.* | 1,347 | 36,638 | ||||||
TIBCO Software, Inc.* | 1,520 | 36,343 | ||||||
MICROS Systems, Inc.* | 757 | 35,261 | ||||||
Atmel Corp.* | 4,350 | 35,235 | ||||||
Global Payments, Inc. | 741 | 35,109 | ||||||
VeriFone Systems, Inc.* | 988 | 35,094 | ||||||
Riverbed Technology, Inc.* | 1,460 | 34,310 | ||||||
Gartner, Inc.* | 898 | 31,223 | ||||||
Solera Holdings, Inc. | 668 | 29,753 | ||||||
Skyworks Solutions, Inc.* | 1,770 | 28,709 | ||||||
Jack Henry & Associates, Inc. | 820 | 27,560 | ||||||
Polycom, Inc.* | 1,668 | 27,188 | ||||||
Cadence Design Systems, Inc.* | 2,560 | 26,624 | ||||||
Broadridge Financial Solutions, Inc. | 1,167 | 26,316 | ||||||
Ingram Micro, Inc. — Class A* | 1,444 | 26,266 | ||||||
Rovi Corp.* | 1,036 | 25,465 | ||||||
Cypress Semiconductor Corp.* | 1,457 | 24,609 | ||||||
NCR Corp.* | 1,482 | 24,394 | ||||||
Cree, Inc.* | 1,088 | 23,980 | ||||||
National Instruments Corp. | 870 | 22,576 | ||||||
Concur Technologies, Inc.* | 438 | 22,246 | ||||||
NeuStar, Inc. — Class A* | 613 | 20,946 | ||||||
Parametric Technology Corp.* | 1,097 | 20,031 | ||||||
Tech Data Corp.* | 384 | 18,973 | ||||||
ADTRAN, Inc. | 596 | 17,975 | ||||||
Diebold, Inc. | 593 | 17,832 | ||||||
Zebra Technologies Corp. — Class A* | 489 | 17,496 | ||||||
Compuware Corp.* | 2,057 | 17,114 | ||||||
Silicon Laboratories, Inc.* | 390 | 16,934 | ||||||
Semtech Corp.* | 620 | 15,388 | ||||||
Plantronics, Inc. | 414 | 14,755 | ||||||
Convergys Corp.* | 1,129 | 14,417 | ||||||
DST Systems, Inc. | 316 | 14,384 | ||||||
Fairchild Semiconductor International, Inc. — Class A* | 1,187 | 14,291 | ||||||
QLogic Corp.* | 948 | 14,220 | ||||||
| See Notes to Financial Statements. | THE RYDEX FUNDSANNUALREPORT | 63 |
| SCHEDULE OF INVESTMENTS (continued) | December 31, 2011 | |
| MID-CAP 1.5x STRATEGY FUND | ||
| SHARES | VALUE | |||||||
RF Micro Devices, Inc.* | 2,617 | $ | 14,132 | |||||
AOL, Inc.* | 915 | 13,817 | ||||||
Itron, Inc.* | 380 | 13,593 | ||||||
Vishay Intertechnology, Inc.* | 1,482 | 13,323 | ||||||
CoreLogic, Inc.* | 1,002 | 12,956 | ||||||
ValueClick, Inc.* | 780 | 12,706 | ||||||
International Rectifier Corp.* | 650 | 12,623 | ||||||
Intersil Corp. — Class A | 1,188 | 12,403 | ||||||
Lender Processing Services, Inc. | 794 | 11,966 | ||||||
Mentor Graphics Corp.* | 878 | 11,906 | ||||||
Fair Isaac Corp. | 330 | 11,827 | ||||||
Ciena Corp.* | 910 | 11,011 | ||||||
Quest Software, Inc.* | 529 | 9,839 | ||||||
Monster Worldwide, Inc.* | 1,210 | 9,595 | ||||||
ACI Worldwide, Inc.* | 320 | 9,165 | ||||||
Acxiom Corp.* | 741 | 9,048 | ||||||
MEMC Electronic Materials, Inc.* | 2,170 | 8,550 | ||||||
Advent Software, Inc.* | 303 | 7,381 | ||||||
Integrated Device Technology, Inc.* | 1,334 | 7,284 | ||||||
Tellabs, Inc. | 1,753 | 7,082 | ||||||
Mantech International Corp. — Class A | 220 | 6,873 | ||||||
|
| |||||||
Total Information Technology | 1,512,275 | |||||||
|
| |||||||
CONSUMER DISCRETIONARY - 10.3% | ||||||||
PetSmart, Inc. | 1,043 | 53,495 | ||||||
Advance Auto Parts, Inc. | 680 | 47,348 | ||||||
Tractor Supply Co. | 670 | 47,001 | ||||||
PVH Corp. | 640 | 45,114 | ||||||
LKQ Corp.* | 1,379 | 41,480 | ||||||
Gentex Corp. | 1,350 | 39,946 | ||||||
Panera Bread Co. — Class A* | 279 | 39,465 | ||||||
Fossil, Inc.* | 490 | 38,886 | ||||||
Williams-Sonoma, Inc. | 973 | 37,460 | ||||||
Polaris Industries, Inc. | 649 | 36,331 | ||||||
Signet Jewelers Ltd. | 820 | 36,047 | ||||||
Foot Locker, Inc. | 1,441 | 34,353 | ||||||
Dick’s Sporting Goods, Inc. | 910 | 33,561 | ||||||
Mohawk Industries, Inc.* | 540 | 32,319 | ||||||
NVR, Inc.* | 44 | 30,184 | ||||||
Tupperware Brands Corp. | 538 | 30,112 | ||||||
Toll Brothers, Inc.* | 1,380 | 28,180 | ||||||
American Eagle Outfitters, Inc. | 1,827 | 27,935 | ||||||
Deckers Outdoor Corp.* | 359 | 27,130 | ||||||
Under Armour, Inc. — Class A* | 340 | 24,409 | ||||||
Service Corporation International | 2,143 | 22,823 | ||||||
Brinker International, Inc. | 761 | 20,364 | ||||||
Rent-A-Center, Inc. | 549 | 20,313 | ||||||
AMC Networks, Inc. — Class A* | 540 | 20,293 | ||||||
Hanesbrands, Inc.* | 920 | 20,111 | ||||||
John Wiley & Sons, Inc. — Class A | 450 | 19,980 | ||||||
Warnaco Group, Inc.* | 377 | 18,865 | ||||||
Aaron’s, Inc. | 707 | 18,863 | ||||||
Ascena Retail Group, Inc.* | 634 | 18,842 | ||||||
Guess?, Inc. | 630 | 18,787 | ||||||
Life Time Fitness, Inc.* | 398 | 18,606 | ||||||
Sotheby’s | 640 | 18,259 | ||||||
Chico’s FAS, Inc. | 1,580 | 17,601 | ||||||
Bally Technologies, Inc.* | 400 | 15,824 | ||||||
Lamar Advertising Co. — Class A* | 550 | 15,125 | ||||||
Cheesecake Factory, Inc.* | 512 | 15,027 | ||||||
Wendy’s Co. | 2,788 | 14,944 | ||||||
Saks, Inc.* | 1,506 | 14,683 | ||||||
HSN, Inc. | 377 | 13,670 | ||||||
ANN, Inc.* | 496 | 12,291 | ||||||
Aeropostale, Inc.* | 756 | 11,529 | ||||||
Meredith Corp. | 350 | 11,428 | ||||||
Thor Industries, Inc. | 407 | 11,164 | ||||||
DreamWorks Animation SKG, Inc. — Class A* | 669 | 11,102 | ||||||
WMS Industries, Inc.* | 524 | 10,752 | ||||||
ITT Educational Services, Inc.* | 187 | 10,638 | ||||||
99 Cents Only Stores* | 450 | 9,877 | ||||||
Strayer Education, Inc. | 99 | 9,622 | ||||||
Bob Evans Farms, Inc. | 279 | 9,358 | ||||||
RadioShack Corp. | 940 | 9,127 | ||||||
Regis Corp. | 540 | 8,937 | ||||||
New York Times Co. — Class A* | 1,140 | 8,812 | ||||||
Matthews International Corp. — Class A | 260 | 8,172 | ||||||
Collective Brands, Inc.* | 567 | 8,148 | ||||||
Valassis Communications, Inc.* | 415 | 7,980 | ||||||
Scholastic Corp. | 230 | 6,893 | ||||||
International Speedway Corp. — Class A | 270 | 6,845 | ||||||
MDC Holdings, Inc. | 354 | 6,241 | ||||||
Office Depot, Inc.* | 2,645 | 5,687 | ||||||
Barnes & Noble, Inc.* | 380 | 5,502 | ||||||
Scientific Games Corp. — Class A* | 545 | 5,287 | ||||||
American Greetings Corp. — Class A | 380 | 4,754 | ||||||
KB Home | 680 | 4,570 | ||||||
|
| |||||||
Total Consumer Discretionary | 1,278,452 | |||||||
|
| |||||||
HEALTH CARE - 8.0% | ||||||||
Vertex Pharmaceuticals, Inc.* | 1,960 | 65,092 | ||||||
Henry Schein, Inc.* | 848 | 54,637 | ||||||
Mettler-Toledo International, Inc.* | 297 | 43,870 | ||||||
Hologic, Inc.* | 2,480 | 43,425 | ||||||
IDEXX Laboratories, Inc.* | 529 | 40,712 | ||||||
Regeneron Pharmaceuticals, Inc.* | 710 | 39,355 | ||||||
| 64 | THE RYDEX FUNDSANNUALREPORT | See Notes to Financial Statements. |
| SCHEDULE OF INVESTMENTS (continued) | December 31, 2011 | |
| MID-CAP 1.5x STRATEGY FUND | ||
| SHARES | VALUE | |||||||
Endo Pharmaceuticals Holdings, Inc.* | 1,100 | $ | 37,983 | |||||
Omnicare, Inc. | 1,079 | 37,172 | ||||||
Universal Health Services, Inc. — Class B | 910 | 35,363 | ||||||
ResMed, Inc.* | 1,389 | 35,281 | ||||||
Allscripts Healthcare Solutions, Inc.* | 1,783 | 33,770 | ||||||
Mednax, Inc.* | 459 | 33,053 | ||||||
Cooper Companies, Inc. | 450 | 31,734 | ||||||
AMERIGROUP Corp.* | 452 | 26,704 | ||||||
Gen-Probe, Inc.* | 441 | 26,072 | ||||||
Covance, Inc.* | 568 | 25,969 | ||||||
HMS Holdings Corp.* | 800 | 25,584 | ||||||
Catalyst Health Solutions, Inc.* | 470 | 24,440 | ||||||
Techne Corp. | 350 | 23,891 | ||||||
Health Net, Inc.* | 780 | 23,728 | ||||||
Teleflex, Inc. | 380 | 23,290 | ||||||
United Therapeutics Corp.* | 490 | 23,152 | ||||||
Lincare Holdings, Inc. | 832 | 21,391 | ||||||
WellCare Health Plans, Inc.* | 400 | 21,000 | ||||||
Hill-Rom Holdings, Inc. | 585 | 19,709 | ||||||
Medicis Pharmaceutical Corp. — Class A | 590 | 19,617 | ||||||
Thoratec Corp.* | 560 | 18,794 | ||||||
Bio-Rad Laboratories, Inc. — Class A* | 186 | 17,863 | ||||||
Health Management Associates, Inc. — Class A* | 2,390 | 17,614 | ||||||
LifePoint Hospitals, Inc.* | 455 | 16,903 | ||||||
Owens & Minor, Inc. | 600 | 16,674 | ||||||
STERIS Corp. | 550 | 16,401 | ||||||
VCA Antech, Inc.* | 820 | 16,195 | ||||||
Community Health Systems, Inc.* | 850 | 14,832 | ||||||
Charles River Laboratories International, Inc.* | 467 | 12,763 | ||||||
Masimo Corp.* | 570 | 10,650 | ||||||
|
| |||||||
Total Health Care | 994,683 | |||||||
|
| |||||||
ENERGY - 5.5% | ||||||||
Cimarex Energy Co. | 810 | 50,139 | ||||||
Southern Union Co. | 1,170 | 49,269 | ||||||
Plains Exploration & Production Co.* | 1,330 | 48,838 | ||||||
Oceaneering International, Inc. | 1,020 | 47,053 | ||||||
HollyFrontier Corp. | 1,960 | 45,864 | ||||||
SM Energy Co. | 600 | 43,860 | ||||||
Oil States International, Inc.* | 480 | 36,658 | ||||||
Dresser-Rand Group, Inc.* | 713 | 35,586 | ||||||
Energen Corp. | 680 | 34,000 | ||||||
Patterson-UTI Energy, Inc. | 1,450 | 28,971 | ||||||
Arch Coal, Inc. | 1,990 | 28,875 | ||||||
World Fuel Services Corp. | 670 | 28,127 | ||||||
Tidewater, Inc. | 490 | 24,157 | ||||||
CARBO Ceramics, Inc. | 180 | 22,199 | ||||||
Superior Energy Services, Inc.* | 750 | 21,330 | ||||||
Dril-Quip, Inc.* | 319 | 20,997 | ||||||
Atwood Oceanics, Inc.* | 527 | 20,969 | ||||||
Unit Corp.* | 390 | 18,096 | ||||||
Helix Energy Solutions Group, Inc.* | 990 | 15,642 | ||||||
Bill Barrett Corp.* | 440 | 14,991 | ||||||
Forest Oil Corp.* | 1,057 | 14,322 | ||||||
Northern Oil and Gas, Inc.* | 590 | 14,148 | ||||||
Quicksilver Resources, Inc.* | 1,130 | 7,582 | ||||||
Patriot Coal Corp.* | 858 | 7,267 | ||||||
Comstock Resources, Inc.* | 450 | 6,885 | ||||||
|
| |||||||
Total Energy | 685,825 | |||||||
|
| |||||||
MATERIALS - 5.4% | ||||||||
Albemarle Corp. | 834 | 42,959 | ||||||
Ashland, Inc. | 733 | 41,898 | ||||||
Rock-Tenn Co. — Class A | 660 | 38,082 | ||||||
Reliance Steel & Aluminum Co. | 708 | 34,473 | ||||||
Valspar Corp. | 879 | 34,255 | ||||||
Temple-Inland, Inc. | 1,030 | 32,661 | ||||||
Martin Marietta Materials, Inc. | 430 | 32,426 | ||||||
Aptargroup, Inc. | 618 | 32,241 | ||||||
Sonoco Products Co. | 940 | 30,982 | ||||||
RPM International, Inc. | 1,230 | 30,196 | ||||||
Domtar Corp. | 346 | 27,666 | ||||||
Steel Dynamics, Inc. | 2,060 | 27,089 | ||||||
Packaging Corporation of America | 920 | 23,221 | ||||||
Carpenter Technology Corp. | 417 | 21,467 | ||||||
Compass Minerals International, Inc. | 310 | 21,344 | ||||||
Cytec Industries, Inc. | 470 | 20,985 | ||||||
Cabot Corp. | 604 | 19,413 | ||||||
Scotts Miracle-Gro Co. — Class A | 402 | 18,769 | ||||||
Silgan Holdings, Inc. | 470 | 18,161 | ||||||
Sensient Technologies Corp. | 476 | 18,040 | ||||||
NewMarket Corp. | 90 | 17,830 | ||||||
Commercial Metals Co. | 1,087 | 15,033 | ||||||
Olin Corp. | 750 | 14,737 | ||||||
Greif, Inc. — Class A | 290 | 13,210 | ||||||
Intrepid Potash, Inc.* | 490 | 11,089 | ||||||
Louisiana-Pacific Corp.* | 1,279 | 10,322 | ||||||
Minerals Technologies, Inc. | 166 | 9,384 | ||||||
Worthington Industries, Inc. | 504 | 8,256 | ||||||
|
| |||||||
Total Materials | 666,189 | |||||||
|
| |||||||
UTILITIES - 4.7% | ||||||||
OGE Energy Corp. | 920 | 52,173 | ||||||
Alliant Energy Corp. | 1,050 | 46,316 | ||||||
NSTAR | 979 | 45,974 | ||||||
National Fuel Gas Co. | 776 | 43,130 | ||||||
MDU Resources Group, Inc. | 1,777 | 38,134 | ||||||
N.V. Energy, Inc. | 2,219 | 36,281 | ||||||
Questar Corp. | 1,670 | 33,166 | ||||||
UGI Corp. | 1,089 | 32,017 | ||||||
| See Notes to Financial Statements. | THE RYDEX FUNDSANNUALREPORT | 65 |
| SCHEDULE OF INVESTMENTS (concluded) | December 31, 2011 | |
| MID-CAP 1.5x STRATEGY FUND | ||
| SHARES | VALUE | |||||||
Westar Energy, Inc. | 1,100 | $ | 31,658 | |||||
Aqua America, Inc. | 1,309 | 28,863 | ||||||
Atmos Energy Corp. | 850 | 28,347 | ||||||
Great Plains Energy, Inc. | 1,278 | 27,835 | ||||||
Hawaiian Electric Industries, Inc. | 900 | 23,832 | ||||||
Vectren Corp. | 770 | 23,277 | ||||||
Cleco Corp. | 570 | 21,717 | ||||||
WGL Holdings, Inc. | 480 | 21,226 | ||||||
IDACORP, Inc. | 470 | 19,933 | ||||||
PNM Resources, Inc. | 751 | 13,691 | ||||||
Black Hills Corp. | 370 | 12,425 | ||||||
|
| |||||||
Total Utilities | 579,995 | |||||||
|
| |||||||
CONSUMER STAPLES - 3.4% | ||||||||
Hansen Natural Corp.* | 709 | 65,327 | ||||||
Church & Dwight Company, Inc. | 1,350 | 61,776 | ||||||
Green Mountain Coffee Roasters, Inc.* | 1,220 | 54,717 | ||||||
Energizer Holdings, Inc.* | 631 | 48,890 | ||||||
Ralcorp Holdings, Inc.* | 520 | 44,460 | ||||||
Smithfield Foods, Inc.* | 1,540 | 37,391 | ||||||
Corn Products International, Inc. | 709 | 37,286 | ||||||
Flowers Foods, Inc. | 1,060 | 20,119 | ||||||
Ruddick Corp. | 460 | 19,614 | ||||||
Lancaster Colony Corp. | 190 | 13,175 | ||||||
Universal Corp. | 210 | 9,652 | ||||||
Tootsie Roll Industries, Inc. | 239 | 5,657 | ||||||
|
| |||||||
Total Consumer Staples | 418,064 | |||||||
|
| |||||||
TELECOMMUNICATION SERVICES - 0.4% | ||||||||
tw telecom, Inc. — Class A* | 1,410 | 27,326 | ||||||
Telephone & Data Systems, Inc. | 870 | 22,524 | ||||||
|
| |||||||
Total Telecommunication Services | 49,850 | |||||||
|
| |||||||
Total Common Stocks | 9,862,769 | |||||||
|
| |||||||
WARRANTS†† - 0.0% | ||||||||
Krispy Kreme Doughnuts, Inc. $12.21, 03/02/12* | 155 | 3 | ||||||
|
| |||||||
Total Warrants | 3 | |||||||
|
| |||||||
| FACE AMOUNT | ||||||||
REPURCHASE AGREEMENTS††,1 - 48.1% | ||||||||
Credit Suisse Group issued 12/30/11 at 0.00% due 01/03/122 | $ | 1,742,847 | 1,742,847 | |||||
Mizuho Financial Group, Inc. issued 12/30/11 at 0.00% due 01/03/12 | 1,443,030 | 1,443,030 | ||||||
HSBC Group issued 12/30/11 at 0.00% due 01/03/12 | 1,381,357 | 1,381,357 | ||||||
Deutsche Bank issued 12/30/11 at 0.00% due 01/03/12 | 1,381,357 | 1,381,357 | ||||||
|
| |||||||
Total Repurchase Agreements | 5,948,591 | |||||||
|
| |||||||
Total Investments - 127.8% | $ | 15,811,363 | ||||||
|
| |||||||
Liabilities, Less Cash & Other Assets - (27.8)% | (3,442,971 | ) | ||||||
|
| |||||||
Total Net Assets - 100.0% | $ | 12,368,392 | ||||||
| CONTRACTS | UNREALIZED GAIN (LOSS) | |||||||
FUTURES CONTRACTS PURCHASED† | ||||||||
March 2012 S&P MidCap 400 Index Mini Futures Contracts (Aggregate Value of Contracts $2,273,440) | 26 | $ | 80,659 | |||||
|
| |||||||
| UNITS | ||||||||
EQUITY INDEX SWAP AGREEMENTS†† | ||||||||
Credit Suisse Capital, LLC January 2012 S&P MidCap 400 Index Swap, Terminating 01/31/123 | 532 | $ | (2,121 | ) | ||||
Morgan Stanley Capital Services, Inc. January 2012 S&P MidCap 400 Index Swap, Terminating 01/30/123 | 300 | (2,342 | ) | |||||
Barclays Bank plc January 2012 S&P MidCap 400 Index Swap, Terminating 01/31/123 | 5,164 | (7,219 | ) | |||||
Goldman Sachs International January 2012 S&P MidCap 400 Index Swap, Terminating 01/27/123 | 1,233 | (9,592 | ) | |||||
|
| |||||||
(Total Notional Value $6,354,616) | $ | (21,274 | ) | |||||
|
| |||||||
| * | Non-income producing security. |
| † | Value determined based on Level 1 inputs — See Note 4. |
| †† | Value determined based on Level 2 inputs — See Note 4. |
| 1 | Repurchase Agreements — See Note 5. |
| 2 | All or a portion of this security is pledged as equity index swap collateral at December 31, 2011. |
| 3 | Total Return based on S&P MidCap 400 Index +/- financing at a variable rate. |
| plc — Public Limited Company |
| 66 | THE RYDEX FUNDSANNUALREPORT | See Notes to Financial Statements. |
MID-CAP 1.5x STRATEGY FUND
STATEMENT OF ASSETS AND LIABILITIES |
| December 31, 2011 |
ASSETS: | ||||
Investments, at value | $ | 9,862,772 | ||
Repurchase agreements, at value | 5,948,591 | |||
|
| |||
Total investments | 15,811,363 | |||
Segregated cash with broker | 770,186 | |||
Receivables: | ||||
Fund shares sold | 449,236 | |||
Dividends | 9,020 | |||
Securities sold | 4,004 | |||
|
| |||
Total assets | 17,043,809 | |||
|
| |||
LIABILITIES: | ||||
Unrealized depreciation on swap agreements | 21,274 | |||
Payable for: | ||||
Securities purchased | 2,479,874 | |||
Fund shares redeemed | 2,073,341 | |||
Variation margin | 58,463 | |||
Management fees | 10,348 | |||
Transfer agent and administrative fees | 2,874 | |||
Investor service fees | 2,874 | |||
Portfolio accounting fees | 1,150 | |||
Miscellaneous | 25,219 | |||
|
| |||
Total liabilities | 4,675,417 | |||
|
| |||
NETASSETS | $ | 12,368,392 | ||
|
| |||
NETASSETSCONSISTOF: | ||||
Paid in capital | $ | 18,902,047 | ||
Undistributed net investment income | — | |||
Accumulated net realized loss on investments | (8,092,482 | ) | ||
Net unrealized appreciation on investments | 1,558,827 | |||
|
| |||
Net assets | $ | 12,368,392 | ||
Capital shares outstanding | 651,264 | |||
Net asset value per share | $ | 18.99 | ||
|
|
STATEMENT OF OPERATIONS |
| Year Ended December 31, 2011 |
INVESTMENT INCOME: | ||||
Dividends | $ | 127,719 | ||
Interest | 2,375 | |||
|
| |||
Total investment income | 130,094 | |||
|
| |||
EXPENSES: | ||||
Management fees | 133,793 | |||
Transfer agent and administrative fees | 37,165 | |||
Investor service fees | 37,165 | |||
Portfolio accounting fees | 14,866 | |||
Custodian fees | 3,720 | |||
Trustees’ fees* | 1,499 | |||
Miscellaneous | 34,509 | |||
|
| |||
Total expenses | 262,717 | |||
|
| |||
Net investment loss | (132,623 | ) | ||
|
| |||
NET REALIZEDAND UNREALIZED GAIN (LOSS): | ||||
Net realized gain (loss) on: | ||||
Investments | 366,738 | |||
Swap agreements | (718,909 | ) | ||
Futures contracts | 243,794 | |||
|
| |||
Net realized loss | (108,377 | ) | ||
|
| |||
Net change in unrealized appreciation (depreciation) on: | ||||
Investments | (1,208,436 | ) | ||
Swap agreements | 23,582 | |||
Futures contracts | (16,542 | ) | ||
|
| |||
Net change in unrealized appreciation (depreciation) | (1,201,396 | ) | ||
|
| |||
Net realized and unrealized loss | (1,309,773 | ) | ||
|
| |||
Net decrease in net assets resulting from operations | $ | (1,442,396 | ) | |
|
|
| * | Relates to Trustees not deemed “interested persons” within the meaning of Section 2(a)(19) of the 1940 Act. |
| See Notes to Financial Statements. | THE RYDEX FUNDSANNUALREPORT | 67 |
MID-CAP 1.5x STRATEGY FUND
STATEMENTS OF CHANGES IN NET ASSETS
| Year Ended December 31, 2011 | Year Ended December 31, 2010 | |||||||
INCREASE (DECREASE) IN NET ASSETS FROM OPERATIONS: | ||||||||
Net investment loss | $ | (132,623 | ) | $ | (112,459 | ) | ||
Net realized gain (loss) on investments | (108,377 | ) | 2,379,850 | |||||
Net change in unrealized appreciation (depreciation) on investments | (1,201,396 | ) | 1,550,747 | |||||
|
|
|
| |||||
Net increase (decrease) in net assets resulting from operations | (1,442,396 | ) | 3,818,138 | |||||
|
|
|
| |||||
CAPITALSHARETRANSACTIONS: | ||||||||
Proceeds from sale of shares | 97,127,253 | 104,638,982 | ||||||
Cost of shares redeemed | (103,876,009 | ) | (102,273,776 | ) | ||||
|
|
|
| |||||
Net increase (decrease) from capital share transactions | (6,748,756 | ) | 2,365,206 | |||||
|
|
|
| |||||
Net increase (decrease) in net assets | (8,191,152 | ) | 6,183,344 | |||||
NETASSETS: | ||||||||
Beginning of year | 20,559,544 | 14,376,200 | ||||||
|
|
|
| |||||
End of year | $ | 12,368,392 | $ | 20,559,544 | ||||
|
|
|
| |||||
Undistributed net investment income at end of year | $ | — | $ | — | ||||
|
|
|
| |||||
CAPITALSHAREACTIVITY: | ||||||||
Shares sold | 4,625,219 | 6,201,083 | ||||||
Shares redeemed | (4,974,156 | ) | (6,162,822 | ) | ||||
|
|
|
| |||||
Net increase (decrease) in shares | (348,937 | ) | 38,261 | |||||
|
|
|
| |||||
| 68 | THE RYDEX FUNDSANNUALREPORT | See Notes to Financial Statements. |
MID-CAP 1.5x STRATEGY FUND
FINANCIAL HIGHLIGHTS
This table is presented to show selected data for a share outstanding throughout each period, and to assist shareholders in evaluating a Fund’s performance for the periods presented.
| Year Ended December 31, 2011 | Year Ended December 31, 2010 | Year Ended December 31, 2009 | Year Ended December 31, 2008 | Year Ended December 31, 2007 | ||||||||||||||||
Per Share Data | ||||||||||||||||||||
Net asset value, beginning of period | $ | 20.56 | $ | 14.95 | $ | 9.81 | $ | 21.72 | $ | 24.20 | ||||||||||
|
|
|
|
|
|
|
|
|
| |||||||||||
Income (loss) from investment operations: | ||||||||||||||||||||
Net investment income (loss)a | (.19 | ) | (.13 | ) | (.07 | ) | .01 | .28 | ||||||||||||
Net gain (loss) on investments (realized and unrealized) | (1.38 | ) | 5.74 | 5.22 | (11.92 | ) | .65 | |||||||||||||
|
|
|
|
|
|
|
|
|
| |||||||||||
Total from investment operations | (1.57 | ) | 5.61 | 5.15 | (11.91 | ) | .93 | |||||||||||||
|
|
|
|
|
|
|
|
|
| |||||||||||
Less distributions from: | ||||||||||||||||||||
Net investment income | — | — | (.01 | ) | — | (.40 | ) | |||||||||||||
Net realized gains | — | — | — | — | (3.01 | ) | ||||||||||||||
|
|
|
|
|
|
|
|
|
| |||||||||||
Total distributions | — | — | (.01 | ) | — | (3.41 | ) | |||||||||||||
|
|
|
|
|
|
|
|
|
| |||||||||||
Net asset value, end of period | $ | 18.99 | $ | 20.56 | $ | 14.95 | $ | 9.81 | $ | 21.72 | ||||||||||
|
|
|
|
|
|
|
|
|
| |||||||||||
Total Returnb | (7.59 | %) | 37.55 | % | 52.40 | % | (54.83 | %) | 3.60 | % | ||||||||||
|
|
|
|
|
|
|
|
|
| |||||||||||
Ratios/Supplemental Data | ||||||||||||||||||||
Net assets, end of period (in thousands) | $ | 12,368 | $ | 20,560 | $ | 14,376 | $ | 13,150 | $ | 27,893 | ||||||||||
|
|
|
|
|
|
|
|
|
| |||||||||||
Ratios to average net assets: | ||||||||||||||||||||
Net investment income (loss) | (0.89 | %) | (0.78 | %) | (0.58 | %) | 0.07 | % | 1.05 | % | ||||||||||
Total expenses | 1.77 | % | 1.71 | % | 1.71 | % | 1.66 | % | 1.64 | % | ||||||||||
|
|
|
|
|
|
|
|
|
| |||||||||||
Portfolio turnover rate | 222 | % | 176 | % | 61 | % | 163 | % | 368 | % | ||||||||||
| a | Net investment income (loss) per share was computed using average shares outstanding throughout the period. |
| b | Total return does not reflect the impact of any additional fees charged by insurance companies and has not been annualized. |
| See Notes to Financial Statements. | THE RYDEX FUNDSANNUALREPORT | 69 |
PERFORMANCE REPORT AND FUND PROFILE (Unaudited) | December 31, 2011 |
OBJECTIVE: Seeks to provide investment results that match, before fees and expenses, the performance of a specific benchmark on a daily basis. The Fund’s current benchmark is the inverse (opposite) of the performance of the S&P MidCap 400 Index (the “underlying index”). The Fund does not seek to achieve its investment objective over a period of time greater than one day.
For the year ended December 31, 2011, Inverse Mid-Cap Strategy Fund returned -7.34%. Over the year, its benchmark, the S&P MidCap 400® Index, returned -1.73%. Inverse Mid-Cap Strategy Fund achieved a daily correlation of 99% to its benchmark of -100% of the daily price movement of the S&P MidCap 400 Index.
Utilities and Consumer Staples provided the most performance to the index during the year. Information Technology and Energy were the largest detractors from performance.
Dollar Tree, Inc., Perrigo Co. and Hansen Natural Corp. contributed the most performance to the index for the year. Cree, Inc., Rovi Corp and Arch Coal, Inc. were the largest detractors from performance for the year.
Derivatives in the Fund were used to help provide exposure to the composition of the benchmark in the highest efficient manner and not for hedging purposes.
Due to the compounding of daily returns, leveraged and inverse funds’ returns over periods other than one day will likely differ in amount and possibly direction from the benchmark return for the same period. Investors should monitor their leveraged and inverse funds’ holdings to ensure that they are consistent with their strategies, as frequently as daily.
The effects of compounding may cause the longer-term correlation of the fund to its benchmark to diminish. The apparent discrepancy between the leveraged and unleveraged indices is the result of compounding, which is described briefly on page 4 of this report.
The S&P MidCap 400® Index provides investors with a benchmark for mid-sized companies. The index covers approximately 7% of the U.S. equity market, and seeks to remain an accurate measure of mid-sized companies, reflecting the risk and return characteristics of the broader mid-cap universe on an on-going basis.
Holdings Diversification (Market Exposure as % of
Net Assets)
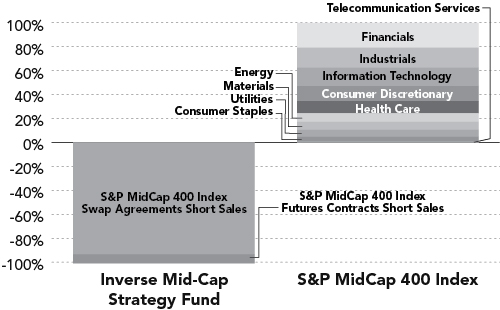
“Holdings Diversification (Market Exposure as % of Net Assets)” excludes any temporary cash investments.
Inception Date: May 3, 2004
The Fund invests principally in derivative investments such as swap agreements and futures contracts.
70 | THE RYDEX FUNDSANNUALREPORT
PERFORMANCE REPORT AND FUND PROFILE (Unaudited) (concluded) |
INVERSE MID-CAP STRATEGY FUND
Cumulative Fund Performance*
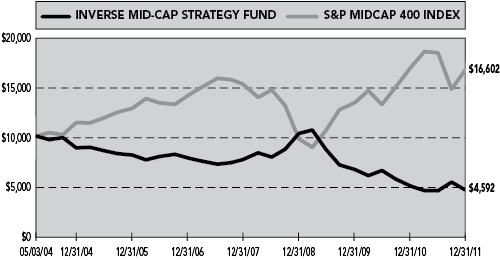
Average Annual Returns*
Periods Ended 12/31/11
| 1 Year | 5 Year | Since Inception (05/03/04) | ||||||||||
Inverse Mid-Cap Strategy Fund | -7.34 | % | -10.00 | % | -9.66 | % | ||||||
S&P MidCap 400 Index | -1.73 | % | 3.32 | % | 6.84 | % | ||||||
| * | The performance data represents past performance that is not predictive of future results. The investment return and principal value of an investment in the Fund will fluctuate so that an investor’s shares, when redeemed, may be worth more or less than their original cost. Returns are historical and include changes in principal and reinvested dividends and capital gains and do not reflect the effect of taxes. The S&P MidCap 400 Index is an unmanaged index and, unlike the Fund, has no management fees or operating expenses to reduce its reported return. |
| Returns do not reflect the impact of any additional fees charged by insurance companies. |
THE RYDEX FUNDSANNUALREPORT | 71
SCHEDULE OF INVESTMENTS | December 31, 2011 |
INVERSE MID-CAP STRATEGY FUND
| FACE AMOUNT | VALUE | |||||||
FEDERAL AGENCY DISCOUNT NOTES†† - 26.3% |
| |||||||
Freddie Mac1 0.01% due 01/09/12 | $ | 100,000 | $ | 100,000 | ||||
Federal Home Loan Bank2 0.01% due 02/29/12 | 100,000 | 99,997 | ||||||
Farmer Mac2 0.02% due 03/27/12 | 100,000 | 99,995 | ||||||
|
| |||||||
Total Federal Agency Discount Notes | 299,992 | |||||||
|
| |||||||
REPURCHASE AGREEMENTS††,3 - 66.1% |
| |||||||
Credit Suisse Group issued 12/30/11 at 0.00% due 01/03/124 | 437,074 | 437,074 | ||||||
Mizuho Financial Group, Inc. issued 12/30/11 at 0.00% due 01/03/12 | 108,896 | 108,896 | ||||||
HSBC Group issued 12/30/11 at 0.00% due 01/03/12 | 104,241 | 104,241 | ||||||
Deutsche Bank issued 12/30/11 at 0.00% due 01/03/12 | 104,241 | 104,241 | ||||||
|
| |||||||
Total Repurchase Agreements | 754,452 | |||||||
|
| |||||||
Total Investments – 92.4 % | $ | 1,054,444 | ||||||
|
| |||||||
Cash & Other Assets, | 86,780 | |||||||
|
| |||||||
Total Net Assets – 100.0% | $ | 1,141,224 | ||||||
| CONTRACTS | UNREALIZED GAIN | |||||||
FUTURES CONTRACTS SOLD SHORT† |
| |||||||
March 2012 S&P MidCap 400 Index Mini Futures Contracts (Aggregate Value of Contracts $87,440) | 1 | $ | 1,377 | |||||
|
| |||||||
| UNITS | ||||||||
EQUITY INDEX SWAP AGREEMENTS SOLD SHORT†† |
| |||||||
Goldman Sachs International January 2012 S&P MidCap 400 Index Swap, Terminating 01/27/125 | 656 | $ | 5,097 | |||||
Morgan Stanley Capital Services, Inc. January 2012 S&P MidCap 400 Index Swap, Terminating 01/30/125 | 180 | 1,394 | ||||||
Credit Suisse Capital, LLC January 2012 S&P MidCap 400 Index Swap, Terminating 01/31/125 | 282 | 1,124 | ||||||
Barclays Bank plc January 2012 S&P MidCap 400 Index Swap, Terminating 01/31/125 | 91 | 365 | ||||||
|
| |||||||
(Total Notional Value $1,063,130) | $ | 7,980 | ||||||
|
| |||||||
| † | Value determined based on Level 1 inputs — See Note 4. |
| †† | Value determined based on Level 2 inputs — See Note 4. |
| 1 | On September 7, 2008, the issuer was placed in conservatorship by the Federal Housing Finance Agency (FHFA). As conservator, the FHFA has full powers to control the assets and operations of the firm. |
| 2 | The issuer operates under a Congressional charter; its securities are neither issued nor guaranteed by the U.S. Government. |
| 3 | Repurchase Agreements — See Note 5. |
| 4 | All or a portion of this security is pledged as equity index swap collateral at December 31, 2011. |
| 5 | Total Return based on S&P MidCap 400 Index +/- financing at a variable rate. |
| plc — Public Limited Company |
| 72 | THE RYDEX FUNDSANNUALREPORT | See Notes to Financial Statements. |
INVERSE MID-CAP STRATEGY FUND
| STATEMENT OF ASSETS AND LIABILITIES | ||
December 31, 2011
ASSETS: | ||||
Investments, at value | $ | 299,992 | ||
Repurchase agreements, at value | 754,452 | |||
|
| |||
Total investments | 1,054,444 | |||
Segregated cash with broker | 82,345 | |||
Unrealized appreciation on swap agreements | 7,980 | |||
Receivables: | ||||
Fund shares sold | 1,585 | |||
Variation margin | 630 | |||
|
| |||
Total assets | 1,146,984 | |||
|
| |||
LIABILITIES: | ||||
Payable for: | ||||
Management fees | 1,438 | |||
Transfer agent and administrative fees | 400 | |||
Investor service fees | 400 | |||
Fund shares redeemed | 170 | |||
Portfolio accounting fees | 160 | |||
Miscellaneous | 3,192 | |||
|
| |||
Total liabilities | 5,760 | |||
|
| |||
NETASSETS | $ | 1,141,224 | ||
|
| |||
NETASSETSCONSISTOF: | ||||
Paid in capital | $ | 4,112,712 | ||
Undistributed net investment income | — | |||
Accumulated net realized loss on investments | (2,980,844 | ) | ||
Net unrealized appreciation on investments | 9,356 | |||
|
| |||
Net assets | $ | 1,141,224 | ||
Capital shares outstanding | 54,415 | |||
Net asset value per share | $ | 20.97 | ||
|
|
| STATEMENT OF OPERATIONS | ||
Year Ended December 31, 2011
INVESTMENT INCOME: | ||||
Interest | $ | 787 | ||
|
| |||
Total investment income | 787 | |||
|
| |||
EXPENSES: | ||||
Management fees | 16,206 | |||
Transfer agent and administrative fees | 4,502 | |||
Investor service fees | 4,502 | |||
Portfolio accounting fees | 1,800 | |||
Custodian fees | 442 | |||
Trustees’ fees* | 192 | |||
Miscellaneous | 3,878 | |||
|
| |||
Total expenses | 31,522 | |||
|
| |||
Net investment loss | (30,735 | ) | ||
|
| |||
NET REALIZEDAND UNREALIZED GAIN (LOSS): | ||||
Net realized gain (loss) on: | ||||
Swap agreements | (364,548 | ) | ||
Futures contracts | (3,413 | ) | ||
|
| |||
Net realized loss | (367,961 | ) | ||
|
| |||
Net change in unrealized appreciation (depreciation) on: | ||||
Investments | (1 | ) | ||
Swap agreements | (1,933 | ) | ||
Futures contracts | 845 | |||
|
| |||
Net change in unrealized appreciation (depreciation) | (1,089 | ) | ||
|
| |||
Net realized and unrealized loss | (369,050 | ) | ||
|
| |||
Net decrease in net assets resulting from operations | $ | (399,785 | ) | |
|
|
| * | Relates to Trustees not deemed “interested persons” within the meaning of Section 2(a)(19) of the 1940 Act. |
| See Notes to Financial Statements. | THE RYDEX FUNDSANNUALREPORT | 73 |
INVERSE MID-CAP STRATEGY FUND
| STATEMENTS OF CHANGES IN NET ASSETS |
| Year Ended December 31, 2011 | Year Ended December 31, 2010 | |||||||
INCREASE (DECREASE) IN NET ASSETS FROM OPERATIONS: | ||||||||
Net investment loss | $ | (30,735 | ) | $ | (61,139 | ) | ||
Net realized loss on investments | (367,961 | ) | (1,944,753 | ) | ||||
Net change in unrealized appreciation (depreciation) on investments | (1,089 | ) | 150,351 | |||||
|
|
|
| |||||
Net decrease in net assets resulting from operations | (399,785 | ) | (1,855,541 | ) | ||||
|
|
|
| |||||
CAPITALSHARETRANSACTIONS: | ||||||||
Proceeds from sale of shares | 23,035,223 | 34,511,809 | ||||||
Cost of shares redeemed | (24,471,556 | ) | (34,356,055 | ) | ||||
|
|
|
| |||||
Net increase (decrease) from capital share transactions | (1,436,333 | ) | 155,754 | |||||
|
|
|
| |||||
Net decrease in net assets | (1,836,118 | ) | (1,699,787 | ) | ||||
NETASSETS: | ||||||||
Beginning of year | 2,977,342 | 4,677,129 | ||||||
|
|
|
| |||||
End of year | $ | 1,141,224 | $ | 2,977,342 | ||||
|
|
|
| |||||
Undistributed net investment income at end of year | $ | — | $ | — | ||||
|
|
|
| |||||
CAPITALSHAREACTIVITY: | ||||||||
Shares sold | 1,048,482 | 1,239,965 | ||||||
Shares redeemed | (1,125,608 | ) | (1,262,816 | ) | ||||
|
|
|
| |||||
Net decrease in shares | (77,126 | ) | (22,851 | ) | ||||
|
|
|
| |||||
| 74 | THE RYDEX FUNDSANNUALREPORT | See Notes to Financial Statements. |
INVERSE MID-CAP STRATEGY FUND
| FINANCIAL HIGHLIGHTS |
This table is presented to show selected data for a share outstanding throughout each period, and to assist shareholders in evaluating a Fund’s performance for the periods presented.
| Year Ended December 31, 2011 | Year Ended December 31, 2010 | Year Ended December 31, 2009 | Year Ended December 31, 2008 | Year Ended December 31, 2007 | ||||||||||||||||
Per Share Data | ||||||||||||||||||||
Net asset value, beginning of period | $ | 22.63 | $ | 30.29 | $ | 46.80 | $ | 35.03 | $ | 36.96 | ||||||||||
|
|
|
|
|
|
|
|
|
| |||||||||||
Income (loss) from investment operations: | ||||||||||||||||||||
Net investment income (loss)a | (.37 | ) | (.42 | ) | (.61 | ) | .05 | 1.06 | ||||||||||||
Net gain (loss) on investments (realized and unrealized) | (1.29 | ) | (7.24 | ) | (15.90 | ) | 12.04 | (1.81 | ) | |||||||||||
|
|
|
|
|
|
|
|
|
| |||||||||||
Total from investment operations | (1.66 | ) | (7.66 | ) | (16.51 | ) | 12.09 | (.75 | ) | |||||||||||
|
|
|
|
|
|
|
|
|
| |||||||||||
Less distributions from: | ||||||||||||||||||||
Net investment income | — | — | — | (.32 | ) | (1.18 | ) | |||||||||||||
|
|
|
|
|
|
|
|
|
| |||||||||||
Total distributions | — | — | — | (.32 | ) | (1.18 | ) | |||||||||||||
|
|
|
|
|
|
|
|
|
| |||||||||||
Net asset value, end of period | $ | 20.97 | $ | 22.63 | $ | 30.29 | $ | 46.80 | $ | 35.03 | ||||||||||
|
|
|
|
|
|
|
|
|
| |||||||||||
Total Returnb | (7.34 | %) | (25.29 | %) | (35.28 | %) | 34.42 | % | (1.98 | %) | ||||||||||
|
|
|
|
|
|
|
|
|
| |||||||||||
Ratios/Supplemental Data | ||||||||||||||||||||
Net assets, end of period (in thousands) | $ | 1,141 | $ | 2,977 | $ | 4,677 | $ | 4,813 | $ | 3,029 | ||||||||||
|
|
|
|
|
|
|
|
|
| |||||||||||
Ratios to average net assets: | ||||||||||||||||||||
Net investment income (loss) | (1.71 | %) | (1.56 | %) | (1.58 | %) | 0.12 | % | 3.04 | % | ||||||||||
Total expenses | 1.75 | % | 1.71 | % | 1.71 | % | 1.67 | % | 1.67 | % | ||||||||||
|
|
|
|
|
|
|
|
|
| |||||||||||
Portfolio turnover rate | — | — | — | — | — | |||||||||||||||
| a | Net investment income (loss) per share was computed using average shares outstanding throughout the period. |
| b | Total return does not reflect the impact of any additional fees charged by insurance companies and has not been annualized. |
| See Notes to Financial Statements. | THE RYDEX FUNDSANNUALREPORT | 75 |
| PERFORMANCE REPORT AND FUND PROFILE (Unaudited) | December 31, 2011 |
RUSSELL 2000® 2x STRATEGY FUND
OBJECTIVE: Seeks to provide investment results that match, before fees and expenses, the performance of a specific benchmark on a daily basis. The Fund’s current benchmark is 200% of the performance of the Russell 2000® Index (the “underlying index”). The Fund does not seek to achieve its investment objective over a period of time greater than one day.
For the year ended December 31, 2011, Russell 2000® 2x Strategy Fund maintained a daily correlation of over 99% to its benchmark of 200% of the daily price movement of the Russell 2000 Index. Russell 2000® 2x Strategy Fund returned -19.38%, while the Russell 2000 Index returned -4.18% over the same time period.
Among sectors, the biggest performance contributors to the index during the period were Utilities and Health Care. Information Technology and Consumer Discretionary detracted from index performance for the year.
Healthspring, Inc., Pharmasset, Inc. and Netlogic Microsystems, Inc. were the largest contributors to performance of the index for the year. Hecla Mining Co., MF Global Holdings Ltd. and Meritor, Inc. were the leading detractors for the year.
Derivatives in the Fund were used to help provide exposure to the composition of the benchmark in the highest efficient manner and to provide leverage, not for hedging purposes.
Due to the compounding of daily returns, leveraged and inverse funds’ returns over periods other than one day will likely differ in amount and possibly direction from the benchmark return for the same period. Investors should monitor their leveraged and inverse funds’ holdings to ensure that they are consistent with their strategies, as frequently as daily.
The effects of compounding may cause the longer-term correlation of the fund to its benchmark to diminish. The apparent discrepancy between the leveraged and unleveraged indices is the result of compounding, which is described briefly on page 4 of this report.
Russell 2000® Index measures the performance of the small-cap value segment of the U.S. equity universe.
Holdings Diversification (Market Exposure as % of Net Assets)
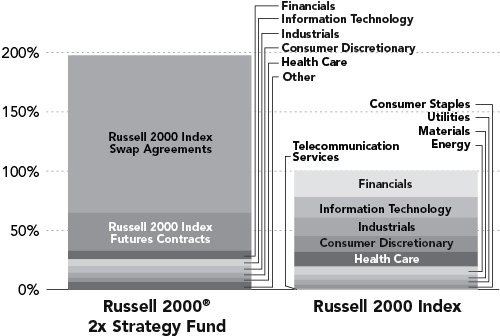
“Holdings Diversification (Market Exposure as % of Net Assets)” excludes any temporary cash investments.
Inception Date: October 27, 2006
Ten Largest Holdings (% of Total Net Assets) | ||||
Healthspring, Inc. | 0.1 | % | ||
Netlogic Microsystems, Inc. | 0.1 | % | ||
SuccessFactors, Inc. | 0.1 | % | ||
Clean Harbors, Inc. | 0.1 | % | ||
American Campus Communities, Inc. | 0.1 | % | ||
Salix Pharmaceuticals Ltd. | 0.1 | % | ||
Signature Bank | 0.1 | % | ||
Jack Henry & Associates, Inc. | 0.1 | % | ||
World Fuel Services Corp. | 0.1 | % | ||
Onyx Pharmaceuticals, Inc. | 0.1 | % | ||
|
| |||
Top Ten Total | 1.0 | % | ||
|
| |||
“Ten Largest Holdings” exclude any temporary cash or derivative investments.
76 | THE RYDEX FUNDSANNUALREPORT
| PERFORMANCE REPORT AND FUND PROFILE (Unaudited) (concluded) |
RUSSELL 2000® 2x STRATEGY FUND
Cumulative Fund Performance*
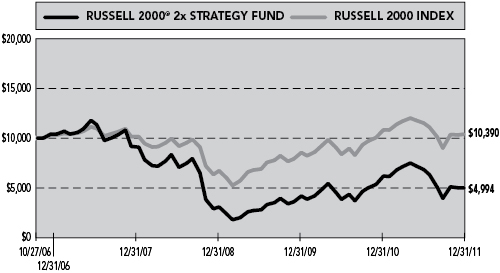
Average Annual Returns*
Periods Ended 12/31/11
| 1 Year | 5 Year | Since Inception (10/27/06) | ||||||||||
Russell 2000® 2x Strategy Fund | -19.38 | % | -13.66 | % | -12.55 | % | ||||||
Russell 2000 Index | -4.18 | % | 0.15 | % | 0.74 | % | ||||||
| * | The performance data represents past performance that is not predictive of future results. The investment return and principal value of an investment in the Fund will fluctuate so that an investor’s shares, when redeemed, may be worth more or less than their original cost. Returns are historical and include changes in principal and reinvested dividends and capital gains and do not reflect the effect of taxes. The Russell 2000 Index is an unmanaged index and, unlike the Fund, has no management fees or operating expenses to reduce its reported return. |
| Returns | do not reflect the impact of any additional fees charged by insurance companies. |
THE RYDEX FUNDSANNUALREPORT | 77
| SCHEDULE OF INVESTMENTS | December 31, 2011 |
RUSSELL 2000® 2x STRATEGY FUND
| SHARES | VALUE | |||||||
COMMON STOCKS† - 32.7 % | ||||||||
FINANCIALS - 7.2% | ||||||||
American Campus Communities, Inc. | 137 | $ | 5,749 | |||||
Signature Bank* | 95 | 5,699 | ||||||
Home Properties, Inc. | 92 | 5,296 | ||||||
Hancock Holding Co. | 157 | 5,019 | ||||||
Tanger Factory Outlet Centers | 169 | 4,955 | ||||||
Mid-America Apartment | 79 | 4,941 | ||||||
ProAssurance Corp. | 61 | 4,869 | ||||||
National Retail Properties, Inc. | 182 | 4,801 | ||||||
BioMed Realty Trust, Inc. | 265 | 4,791 | ||||||
MFA Financial, Inc. | 703 | 4,724 | ||||||
CBL & Associates Properties, Inc. | 297 | 4,663 | ||||||
Kilroy Realty Corp. | 120 | 4,568 | ||||||
Post Properties, Inc. | 103 | 4,503 | ||||||
Extra Space Storage, Inc. | 184 | 4,458 | ||||||
Highwoods Properties, Inc. | 146 | 4,332 | ||||||
Delphi Financial Group, Inc. — Class A | 96 | 4,253 | ||||||
Alterra Capital Holdings Ltd. | 177 | 4,183 | ||||||
SVB Financial Group* | 87 | 4,149 | ||||||
Equity Lifestyle Properties, Inc. | 61 | 4,068 | ||||||
LaSalle Hotel Properties | 168 | 4,067 | ||||||
Entertainment Properties Trust | 92 | 4,021 | ||||||
Omega Healthcare Investors, Inc. | 203 | 3,928 | ||||||
Hatteras Financial Corp. | 146 | 3,850 | ||||||
Prosperity Bancshares, Inc. | 95 | 3,833 | ||||||
Washington Real Estate Investment Trust | 129 | 3,528 | ||||||
Colonial Properties Trust | 166 | 3,463 | ||||||
Starwood Property Trust, Inc. | 187 | 3,461 | ||||||
Stifel Financial Corp.* | 103 | 3,301 | ||||||
FirstMerit Corp. | 214 | 3,238 | ||||||
DiamondRock Hospitality Co. | 332 | 3,200 | ||||||
Invesco Mortgage Capital, Inc. | 225 | 3,161 | ||||||
Iberiabank Corp. | 62 | 3,057 | ||||||
Trustmark Corp. | 123 | 2,988 | ||||||
Webster Financial Corp. | 143 | 2,916 | ||||||
Cash America International, Inc. | 62 | 2,891 | ||||||
FNB Corp. | 255 | 2,884 | ||||||
United Bankshares, Inc. | 102 | 2,884 | ||||||
DuPont Fabros Technology, Inc. | 116 | 2,810 | ||||||
Healthcare Realty Trust, Inc. | 151 | 2,807 | ||||||
CNO Financial Group, Inc.* | 444 | 2,802 | ||||||
Umpqua Holdings Corp. | 226 | 2,800 | ||||||
Westamerica Bancorporation | 62 | 2,722 | ||||||
Platinum Underwriters Holdings Ltd. | 78 | 2,661 | ||||||
Northwest Bancshares, Inc. | 210 | 2,612 | ||||||
First American Financial Corp. | 204 | 2,585 | ||||||
RLI Corp. | 35 | 2,550 | ||||||
Apollo Investment Corp. | 390 | 2,512 | ||||||
DCT Industrial Trust, Inc. | 489 | 2,504 | ||||||
Two Harbors Investment Corp. | 269 | 2,486 | ||||||
Ezcorp, Inc. — Class A* | 94 | 2,479 | ||||||
Sovran Self Storage, Inc. | 58 | 2,475 | ||||||
Texas Capital Bancshares, Inc.* | 78 | 2,388 | ||||||
UMB Financial Corp. | 64 | 2,384 | ||||||
Knight Capital Group, Inc. — Class A* | 198 | 2,340 | ||||||
Potlatch Corp. | 74 | 2,302 | ||||||
Cathay General Bancorp | 152 | 2,269 | ||||||
EastGroup Properties, Inc. | 52 | 2,261 | ||||||
PS Business Parks, Inc. | 40 | 2,217 | ||||||
Medical Properties Trust, Inc. | 222 | 2,191 | ||||||
Ocwen Financial Corp.* | 151 | 2,186 | ||||||
Old National Bancorp | 186 | 2,167 | ||||||
Montpelier Re Holdings Ltd. | 121 | 2,148 | ||||||
Susquehanna Bancshares, Inc. | 256 | 2,145 | ||||||
CYS Investments, Inc. | 161 | 2,116 | ||||||
Capstead Mortgage Corp. | 170 | 2,115 | ||||||
National Health Investors, Inc. | 48 | 2,111 | ||||||
National Penn Bancshares, Inc. | 246 | 2,076 | ||||||
First Cash Financial Services, Inc.* | 58 | 2,035 | ||||||
CubeSmart | 191 | 2,032 | ||||||
Prospect Capital Corp. | 216 | 2,007 | ||||||
First Financial Bankshares, Inc. | 60 | 2,006 | ||||||
First Financial Bancorp | 120 | 1,997 | ||||||
World Acceptance Corp.* | 27 | 1,984 | ||||||
Pebblebrook Hotel Trust | 102 | 1,956 | ||||||
Glimcher Realty Trust | 211 | 1,941 | ||||||
Community Bank System, Inc. | 69 | 1,918 | ||||||
Selective Insurance Group, Inc. | 108 | 1,915 | ||||||
LTC Properties, Inc. | 62 | 1,913 | ||||||
Wintrust Financial Corp. | 68 | 1,907 | ||||||
International Bancshares Corp. | 104 | 1,907 | ||||||
Sunstone Hotel Investors, Inc.* | 233 | 1,899 | ||||||
MB Financial, Inc. | 110 | 1,881 | ||||||
Strategic Hotels & Resorts, Inc.* | 348 | 1,869 | ||||||
CVB Financial Corp. | 179 | 1,795 | ||||||
Lexington Realty Trust | 237 | 1,775 | ||||||
Equity One, Inc. | 104 | 1,766 | ||||||
BancorpSouth, Inc. | 160 | 1,763 | ||||||
MarketAxess Holdings, Inc. | 58 | 1,746 | ||||||
First Industrial Realty Trust, Inc.* | 167 | 1,708 | ||||||
Financial Engines, Inc.* | 76 | 1,697 | ||||||
Glacier Bancorp, Inc. | 141 | 1,696 | ||||||
Primerica, Inc. | 70 | 1,627 | ||||||
Park National Corp. | 25 | 1,626 | ||||||
DFC Global Corp.* | 89 | 1,607 | ||||||
Sun Communities, Inc. | 44 | 1,607 | ||||||
Government Properties Income Trust | 71 | 1,601 | ||||||
Tower Group, Inc. | 79 | 1,593 | ||||||
Provident Financial Services, Inc. | 118 | 1,580 | ||||||
Anworth Mortgage Asset Corp. | 251 | 1,576 | ||||||
Redwood Trust, Inc. | 153 | 1,558 | ||||||
| 78 | THE RYDEX FUNDSANNUALREPORT | See Notes to Financial Statements. |
| SCHEDULE OF INVESTMENTS (continued) | December 31, 2011 |
RUSSELL 2000® 2x STRATEGY FUND
| SHARES | VALUE | |||||||
Bank of the Ozarks, Inc. | 51 | $ | 1,511 | |||||
Argo Group International Holdings Ltd. | 52 | 1,506 | ||||||
Education Realty Trust, Inc. | 146 | 1,494 | ||||||
Acadia Realty Trust | 74 | 1,490 | ||||||
NBT Bancorp, Inc. | 67 | 1,483 | ||||||
Credit Acceptance Corp.* | 18 | 1,481 | ||||||
Harleysville Group, Inc. | 26 | 1,471 | ||||||
First Midwest Bancorp, Inc. | 145 | 1,469 | ||||||
Solar Capital Ltd. | 66 | 1,458 | ||||||
Columbia Banking System, Inc. | 75 | 1,445 | ||||||
Astoria Financial Corp. | 169 | 1,435 | ||||||
Infinity Property & Casualty Corp. | 25 | 1,419 | ||||||
Associated Estates Realty Corp. | 88 | 1,404 | ||||||
Fifth Street Finance Corp. | 146 | 1,397 | ||||||
MGIC Investment Corp.* | 373 | 1,391 | ||||||
Hersha Hospitality Trust | 281 | 1,371 | ||||||
Employers Holdings, Inc. | 75 | 1,357 | ||||||
Franklin Street Properties Corp. | 135 | 1,343 | ||||||
First Potomac Realty Trust | 102 | 1,331 | ||||||
Nelnet, Inc. — Class A | 54 | 1,321 | ||||||
PrivateBancorp, Inc. | 118 | 1,296 | ||||||
Oritani Financial Corp. | 101 | 1,290 | ||||||
Investors Bancorp, Inc.* | 92 | 1,240 | ||||||
Chemical Financial Corp. | 58 | 1,237 | ||||||
Greenlight Capital Re Ltd.* | 52 | 1,231 | ||||||
Boston Private Financial Holdings, Inc. | 154 | 1,223 | ||||||
Symetra Financial Corp. | 134 | 1,215 | ||||||
American Assets Trust, Inc. | 59 | 1,210 | ||||||
American Equity Investment Life Holding Co. | 116 | 1,206 | ||||||
National Financial Partners Corp.* | 89 | 1,203 | ||||||
Independent Bank Corp. | 44 | 1,201 | ||||||
Investors Real Estate Trust | 164 | 1,196 | ||||||
Navigators Group, Inc.* | 25 | 1,192 | ||||||
City Holding Co. | 35 | 1,186 | ||||||
BlackRock Kelso Capital Corp. | 145 | 1,183 | ||||||
Inland Real Estate Corp. | 155 | 1,180 | ||||||
Evercore Partners, Inc. — Class A | 44 | 1,171 | ||||||
Oriental Financial Group, Inc. | 96 | 1,163 | ||||||
BBCN Bancorp, Inc.* | 123 | 1,162 | ||||||
PHH Corp.* | 108 | 1,156 | ||||||
CreXus Investment Corp. | 111 | 1,152 | ||||||
Cousins Properties, Inc. | 178 | 1,141 | ||||||
PacWest Bancorp | 59 | 1,118 | ||||||
Pennsylvania Real Estate Investment Trust | 107 | 1,117 | ||||||
Amtrust Financial Services, Inc. | 47 | 1,116 | ||||||
Pinnacle Financial Partners, Inc.* | 69 | 1,114 | ||||||
Meadowbrook Insurance Group, Inc. | 104 | 1,111 | ||||||
Walter Investment Management Corp. | 54 | 1,108 | ||||||
KBW, Inc. | 72 | 1,093 | ||||||
First Commonwealth Financial Corp. | 205 | 1,078 | ||||||
ARMOUR Residential REIT, Inc. | 151 | 1,065 | ||||||
Home Bancshares, Inc. | 41 | 1,062 | ||||||
Trustco Bank Corp. | 186 | 1,043 | ||||||
Horace Mann Educators Corp. | 75 | 1,028 | ||||||
Colony Financial, Inc. | 65 | 1,021 | ||||||
Retail Opportunity Investments Corp. | 86 | 1,018 | ||||||
S&T Bancorp, Inc. | 52 | 1,017 | ||||||
Universal Health Realty Income Trust | 26 | 1,014 | ||||||
Forestar Group, Inc.* | 67 | 1,014 | ||||||
Safety Insurance Group, Inc. | 25 | 1,012 | ||||||
Cohen & Steers, Inc. | 35 | 1,012 | ||||||
iStar Financial, Inc.* | 189 | 1,000 | ||||||
Brookline Bancorp, Inc. | 117 | 987 | ||||||
Simmons First National Corp. — Class A | 36 | 979 | ||||||
Advance America Cash Advance Centers, Inc. | 109 | 976 | ||||||
PICO Holdings, Inc.* | 47 | 967 | ||||||
Chesapeake Lodging Trust | 62 | 959 | ||||||
Sabra Health Care REIT, Inc. | 79 | 955 | ||||||
Newcastle Investment Corp. | 203 | 944 | ||||||
Investment Technology Group, Inc.* | 86 | 930 | ||||||
SCBT Financial Corp. | 32 | 928 | ||||||
PennantPark Investment Corp. | 91 | 918 | ||||||
Compass Diversified Holdings | 73 | 904 | ||||||
Maiden Holdings Ltd. | 102 | 894 | ||||||
NorthStar Realty Finance Corp. | 187 | 892 | ||||||
State Bank Financial Corp.* | 59 | 891 | ||||||
Berkshire Hills Bancorp, Inc. | 40 | 888 | ||||||
Sterling Financial Corp.* | 53 | 885 | ||||||
BGC Partners, Inc. — Class A | 149 | 885 | ||||||
Western Alliance Bancorporation* | 141 | 878 | ||||||
RLJ Lodging Trust | 52 | 875 | ||||||
First Financial Corp. | 26 | 865 | ||||||
PennyMac Mortgage Investment Trust | 52 | 864 | ||||||
Lakeland Financial Corp. | 33 | 854 | ||||||
ViewPoint Financial Group | 65 | 846 | ||||||
Flagstone Reinsurance Holdings S.A. | 102 | 846 | ||||||
Sandy Spring Bancorp, Inc. | 48 | 842 | ||||||
Triangle Capital Corp. | 44 | 841 | ||||||
Duff & Phelps Corp. — Class A | 58 | 841 | ||||||
WesBanco, Inc. | 43 | 837 | ||||||
1st Source Corp. | 33 | 836 | ||||||
Banco Latinoamericano de Comercio Exterior S.A. | 52 | 835 | ||||||
| See Notes to Financial Statements. | THE RYDEX FUNDSANNUALREPORT | 79 |
| SCHEDULE OF INVESTMENTS (continued) | December 31, 2011 |
RUSSELL 2000® 2x STRATEGY FUND
| SHARES | VALUE | |||||||
United Fire & Casualty Co. | 41 | $ | 827 | |||||
AMERISAFE, Inc.* | 35 | 814 | ||||||
Hercules Technology Growth Capital, Inc. | 85 | 802 | ||||||
Ashford Hospitality Trust, Inc. | 100 | 800 | ||||||
GAMCO Investors, Inc. — Class A | 18 | 783 | ||||||
Resource Capital Corp. | 139 | 780 | ||||||
Urstadt Biddle Properties, Inc. — Class A | 43 | 777 | ||||||
Dime Community Bancshares, Inc. | 61 | 769 | ||||||
First Busey Corp. | 153 | 765 | ||||||
Community Trust Bancorp, Inc. | 26 | 765 | ||||||
FelCor Lodging Trust, Inc.* | 249 | 759 | ||||||
Renasant Corp. | 50 | 750 | ||||||
FBL Financial Group, Inc. — Class A | 22 | 748 | ||||||
Flushing Financial Corp. | 59 | 745 | ||||||
Getty Realty Corp. | 53 | 739 | ||||||
Coresite Realty Corp. | 41 | 731 | ||||||
Citizens, Inc.* | 75 | 727 | ||||||
Ramco-Gershenson Properties Trust | 73 | 718 | ||||||
Excel Trust, Inc. | 59 | 708 | ||||||
Dynex Capital, Inc. | 76 | 694 | ||||||
Southside Bancshares, Inc. | 32 | 693 | ||||||
Tejon Ranch Co.* | 28 | 685 | ||||||
OneBeacon Insurance Group Ltd. | 44 | 677 | ||||||
Bancfirst Corp. | 18 | 676 | ||||||
Washington Trust Bancorp, Inc. | 28 | 668 | ||||||
Piper Jaffray Cos.* | 33 | 667 | ||||||
eHealth, Inc.* | 45 | 661 | ||||||
INTL FCStone, Inc.* | 28 | 660 | ||||||
Cardinal Financial Corp. | 60 | 644 | ||||||
HFF, Inc. — Class A* | 62 | 640 | ||||||
Hudson Valley Holding Corp. | 30 | 637 | ||||||
Hilltop Holdings, Inc.* | 75 | 634 | ||||||
Hudson Pacific Properties, Inc. | 44 | 623 | ||||||
Monmouth Real Estate Investment Corp. — Class A | 68 | 622 | ||||||
MCG Capital Corp. | 155 | 618 | ||||||
Radian Group, Inc. | 263 | 615 | ||||||
Campus Crest Communities, Inc. | 61 | 614 | ||||||
ICG Group, Inc.* | 78 | 602 | ||||||
Epoch Holding Corp. | 27 | 600 | ||||||
Safeguard Scientifics, Inc.* | 38 | 600 | ||||||
Rockville Financial, Inc. | 57 | 591 | ||||||
TowneBank | 48 | 588 | ||||||
Tompkins Financial Corp. | 15 | 578 | ||||||
Republic Bancorp, Inc. — Class A | 25 | 573 | ||||||
Saul Centers, Inc. | 16 | 567 | ||||||
TICC Capital Corp. | 65 | 562 | ||||||
MVC Capital, Inc. | 48 | 556 | ||||||
GFI Group, Inc. | 135 | 556 | ||||||
Beneficial Mutual Bancorp, Inc.* | 66 | 552 | ||||||
Banner Corp. | 32 | 549 | ||||||
Tower Bancorp, Inc. | 19 | 542 | ||||||
Winthrop Realty Trust | 53 | 539 | ||||||
West Coast Bancorp* | 34 | 530 | ||||||
NewStar Financial, Inc.* | 52 | 529 | ||||||
CapLease, Inc. | 130 | 525 | ||||||
Apollo Commercial Real Estate Finance, Inc. | 40 | 525 | ||||||
StellarOne Corp. | 46 | 523 | ||||||
Camden National Corp. | 16 | 522 | ||||||
Ladenburg Thalmann Financial Services, Inc.* | 210 | 521 | ||||||
Sterling Bancorp | 60 | 518 | ||||||
United Financial Bancorp, Inc. | 32 | 515 | ||||||
Provident New York Bancorp | 77 | 511 | ||||||
Union First Market Bankshares Corp. | 38 | 505 | ||||||
Netspend Holdings, Inc.* | 62 | 503 | ||||||
National Bankshares, Inc. | 18 | 503 | ||||||
Kennedy-Wilson Holdings, Inc. | 47 | 497 | ||||||
Territorial Bancorp, Inc. | 25 | 494 | ||||||
SY Bancorp, Inc. | 24 | 493 | ||||||
Summit Hotel Properties, Inc. | 52 | 491 | ||||||
Enterprise Financial Services Corp. | 33 | 488 | ||||||
Kite Realty Group Trust | 108 | 487 | ||||||
Citizens & Northern Corp. | 26 | 480 | ||||||
Global Indemnity plc* | 24 | 476 | ||||||
Gladstone Commercial Corp. | 27 | 474 | ||||||
Univest Corporation of Pennsylvania | 32 | 468 | ||||||
Cedar Realty Trust, Inc. | 108 | 465 | ||||||
Eagle Bancorp, Inc.* | 32 | 465 | ||||||
German American Bancorp, Inc. | 25 | 455 | ||||||
Northfield Bancorp, Inc. | 32 | 453 | ||||||
Stewart Information Services Corp. | 39 | 450 | ||||||
Presidential Life Corp. | 45 | 450 | ||||||
Great Southern Bancorp, Inc. | 19 | 448 | ||||||
Arrow Financial Corp. | 19 | 445 | ||||||
National Interstate Corp. | 18 | 444 | ||||||
First Merchants Corp. | 52 | 440 | ||||||
Central Pacific Financial Corp.* | 34 | 439 | ||||||
Calamos Asset Management, Inc. | 35 | 438 | ||||||
Wilshire Bancorp, Inc.* | 119 | 432 | ||||||
First Interstate Bancsystem, Inc. | 33 | 430 | ||||||
One Liberty Properties, Inc. | 26 | 429 | ||||||
Heritage Financial Corp. | 34 | 427 | ||||||
Ameris Bancorp* | 41 | 421 | ||||||
First of Long Island Corp. | 16 | 421 | ||||||
Westfield Financial, Inc. | 57 | 420 | ||||||
First Connecticut Bancorp, Inc. | 32 | 416 | ||||||
Parkway Properties, Inc. | 42 | 414 | ||||||
American Safety Insurance Holdings Ltd.* | 19 | 413 | ||||||
SWS Group, Inc. | 60 | 412 | ||||||
Bancorp, Inc.* | 57 | 412 | ||||||
First Community Bancshares, Inc. | 33 | 412 | ||||||
CNB Financial Corp. | 26 | 410 | ||||||
| 80 | THE RYDEX FUNDSANNUALREPORT | See Notes to Financial Statements. |
| SCHEDULE OF INVESTMENTS (continued) | December 31, 2011 |
RUSSELL 2000® 2x STRATEGY FUND
| SHARES | VALUE | |||||||
Centerstate Banks, Inc. | 61 | $ | 404 | |||||
OmniAmerican Bancorp, Inc.* | 25 | 392 | ||||||
Baldwin & Lyons, Inc. — Class B | 18 | 392 | ||||||
Agree Realty Corp. | 16 | 390 | ||||||
Phoenix Companies, Inc.* | 231 | 388 | ||||||
Financial Institutions, Inc. | 24 | 387 | ||||||
State Auto Financial Corp. | 28 | 381 | ||||||
Virtus Investment Partners, Inc.* | 5 | 380 | ||||||
First Bancorp | 34 | 379 | ||||||
STAG Industrial, Inc. | 33 | 379 | ||||||
RAIT Financial Trust | 79 | 375 | ||||||
Bryn Mawr Bank Corp. | 19 | 370 | ||||||
Peoples Bancorp, Inc. | 25 | 370 | ||||||
Cogdell Spencer, Inc. | 87 | 370 | ||||||
Trico Bancshares | 26 | 370 | ||||||
CoBiz Financial, Inc. | 64 | 369 | ||||||
Heartland Financial USA, Inc. | 24 | 368 | ||||||
OceanFirst Financial Corp. | 28 | 366 | ||||||
Washington Banking Co. | 30 | 357 | ||||||
Bancorp Rhode Island, Inc. | 9 | 357 | ||||||
ESB Financial Corp. | 25 | 352 | ||||||
Apollo Residential Mortgage, Inc. | 23 | 351 | ||||||
Cowen Group, Inc. — Class A* | 135 | 350 | ||||||
Penns Woods Bancorp, Inc. | 9 | 349 | ||||||
Lakeland Bancorp, Inc. | 40 | 345 | ||||||
Fox Chase Bancorp, Inc. | 27 | 341 | ||||||
American Capital Mortgage Investment Corp. | 18 | 339 | ||||||
Gladstone Capital Corp. | 44 | 336 | ||||||
Crawford & Co. — Class B | 54 | 333 | ||||||
Virginia Commerce Bancorp, Inc.* | 43 | 332 | ||||||
Franklin Financial Corp.* | 28 | 332 | ||||||
State Bancorp, Inc. | 27 | 329 | ||||||
Westwood Holdings Group, Inc. | 9 | 329 | ||||||
West Bancorporation, Inc. | 34 | 326 | ||||||
WSFS Financial Corp. | 9 | 324 | ||||||
Medallion Financial Corp. | 28 | 319 | ||||||
MainSource Financial Group, Inc. | 36 | 318 | ||||||
FXCM, Inc. | 32 | 312 | ||||||
Pacific Continental Corp. | 35 | 310 | ||||||
Mission West Properties, Inc. | 34 | 307 | ||||||
SeaBright Holdings, Inc. | 40 | 306 | ||||||
Oppenheimer Holdings, Inc. — Class A | 19 | 306 | ||||||
NGP Capital Resources Co. | 42 | 302 | ||||||
Chatham Lodging Trust | 28 | 302 | ||||||
Bank Mutual Corp. | 94 | 299 | ||||||
Artio Global Investors, Inc. | 61 | 298 | ||||||
Golub Capital BDC, Inc. | 19 | 295 | ||||||
Home Federal Bancorp, Inc. | 28 | 291 | ||||||
Gladstone Investment Corp. | 40 | 291 | ||||||
1st United Bancorp, Inc.* | 52 | 289 | ||||||
Farmer Mac | 16 | 288 | ||||||
First Financial Holdings, Inc. | 32 | 286 | ||||||
Hanmi Financial Corp.* | 38 | 281 | ||||||
BofI Holding, Inc.* | 17 | 276 | ||||||
ESSA Bancorp, Inc. | 26 | 272 | ||||||
Medley Capital Corp. | 26 | 270 | ||||||
Edelman Financial Group, Inc. | 41 | 269 | ||||||
Kearny Financial Corp. | 28 | 266 | ||||||
Gleacher & Company, Inc.* | 158 | 265 | ||||||
First Bancorp, Inc. | 17 | 261 | ||||||
Terreno Realty Corp. | 17 | 257 | ||||||
Century Bancorp, Inc. — Class A | 9 | 254 | ||||||
Solar Senior Capital Ltd. | 16 | 252 | ||||||
Capital City Bank Group, Inc. | 26 | 248 | ||||||
Doral Financial Corp.* | 257 | 246 | ||||||
Center Bancorp, Inc. | 25 | 244 | ||||||
Encore Bancshares, Inc.* | 18 | 243 | ||||||
UMH Properties, Inc. | 26 | 242 | ||||||
BankFinancial Corp. | 43 | 237 | ||||||
Park Sterling Corp.* | 58 | 237 | ||||||
First Defiance Financial Corp. | 16 | 233 | ||||||
Kansas City Life Insurance Co. | 7 | 230 | ||||||
Sierra Bancorp | 26 | 229 | ||||||
Donegal Group, Inc. — Class A | 16 | 227 | ||||||
Walker & Dunlop, Inc.* | 18 | 226 | ||||||
Seacoast Banking Corporation of Florida* | 146 | 222 | ||||||
Kohlberg Capital Corp. | 35 | 221 | ||||||
Marlin Business Services Corp. | 17 | 216 | ||||||
New Mountain Finance Corp. | 16 | 215 | ||||||
Main Street Capital Corp. | 10 | 212 | ||||||
Metro Bancorp, Inc.* | 25 | 209 | ||||||
FBR & Company* | 102 | 209 | ||||||
MidSouth Bancorp, Inc. | 16 | 208 | ||||||
Harris & Harris Group, Inc.* | 60 | 208 | ||||||
THL Credit, Inc. | 17 | 208 | ||||||
Nicholas Financial, Inc. | 16 | 205 | ||||||
Cape Bancorp, Inc.* | 26 | 204 | ||||||
Southwest Bancorp, Inc.* | 34 | 203 | ||||||
Meridian Interstate Bancorp, Inc.* | 16 | 199 | ||||||
Pacific Capital Bancorp North America* | 7 | 198 | ||||||
Flagstar Bancorp, Inc.* | 390 | 197 | ||||||
Ames National Corp. | 10 | 195 | ||||||
First Pactrust Bancorp, Inc. | 19 | 195 | ||||||
JMP Group, Inc. | 27 | 193 | ||||||
Arlington Asset Investment Corp. — Class A | 9 | 192 | ||||||
MPG Office Trust, Inc.* | 96 | 191 | ||||||
Whitestone REIT — Class B | 16 | 190 | ||||||
Heritage Commerce Corp.* | 40 | 190 | ||||||
Consolidated-Tomoka Land Co. | 7 | 189 | ||||||
Sun Bancorp, Inc.* | 78 | 189 | ||||||
Bank of Marin Bancorp | 5 | 188 | ||||||
Alliance Financial Corp. | 6 | 185 | ||||||
Taylor Capital Group, Inc.* | 19 | 185 | ||||||
AG Mortgage Investment Trust, Inc. | 9 | 181 | ||||||
| See Notes to Financial Statements. | THE RYDEX FUNDSANNUALREPORT | 81 |
| SCHEDULE OF INVESTMENTS (continued) | December 31, 2011 |
RUSSELL 2000® 2x STRATEGY FUND
| SHARES | VALUE | |||||||
Bridge Capital Holdings* | 17 | $ | 177 | |||||
Merchants Bancshares, Inc. | 6 | 175 | ||||||
Hallmark Financial Services* | 25 | 175 | ||||||
Suffolk Bancorp* | 16 | 173 | ||||||
Clifton Savings Bancorp, Inc. | 18 | 167 | ||||||
Charter Financial Corp. | 18 | 167 | ||||||
Roma Financial Corp. | 16 | 157 | ||||||
EMC Insurance Group, Inc. | 7 | 144 | ||||||
CIFC Corp.* | 26 | 140 | ||||||
Orrstown Financial Services, Inc. | 17 | 140 | ||||||
Independence Holding Co. | 16 | 130 | ||||||
Universal Insurance Holdings, Inc. | 35 | 125 | ||||||
Avatar Holdings, Inc.* | 17 | 122 | ||||||
Gain Capital Holdings, Inc. | 17 | 114 | ||||||
Bank of Kentucky Financial Corp. | 5 | 100 | ||||||
Fidus Investment Corp. | 7 | 91 | ||||||
United Community Banks, Inc.* | 10 | 70 | ||||||
Imperial Holdings, Inc.* | 36 | 68 | ||||||
Pzena Investment Management, Inc. — Class A | 15 | 65 | ||||||
Hampton Roads Bankshares, Inc.* | 16 | 44 | ||||||
First Marblehead Corp.* | 30 | 35 | ||||||
Fortegra Financial Corp.* | 5 | 33 | ||||||
Cascade Bancorp* | 5 | 22 | ||||||
Capital Bank Corp.* | 10 | 20 | ||||||
|
| |||||||
Total Financials | 474,991 | |||||||
|
| |||||||
INFORMATION TECHNOLOGY - 5.6% |
| |||||||
Netlogic Microsystems, Inc.* | 134 | 6,642 | ||||||
SuccessFactors, Inc.* | 159 | 6,339 | ||||||
Jack Henry & Associates, Inc. | 169 | 5,680 | ||||||
Parametric Technology Corp.* | 239 | 4,364 | ||||||
Concur Technologies, Inc.* | 84 | 4,266 | ||||||
InterDigital, Inc. | 96 | 4,183 | ||||||
Wright Express Corp.* | 77 | 4,180 | ||||||
ADTRAN, Inc. | 130 | 3,921 | ||||||
CommVault Systems, Inc.* | 85 | 3,631 | ||||||
Anixter International, Inc.* | 59 | 3,519 | ||||||
CACI International, Inc. — Class A* | 62 | 3,467 | ||||||
Taleo Corp. — Class A* | 88 | 3,405 | ||||||
Ultimate Software Group, Inc.* | 52 | 3,386 | ||||||
QLIK Technologies, Inc.* | 135 | 3,267 | ||||||
Plantronics, Inc. | 91 | 3,243 | ||||||
Hittite Microwave Corp.* | 65 | 3,210 | ||||||
Semtech Corp.* | 129 | 3,202 | ||||||
SolarWinds, Inc.* | 114 | 3,186 | ||||||
Aruba Networks, Inc.* | 171 | 3,167 | ||||||
Cognex Corp. | 88 | 3,150 | ||||||
FEI Co.* | 76 | 3,099 | ||||||
Viasat, Inc.* | 67 | 3,090 | ||||||
Cymer, Inc.* | 61 | 3,035 | ||||||
Finisar Corp.* | 178 | 2,981 | ||||||
RF Micro Devices, Inc.* | 547 | 2,954 | ||||||
Aspen Technology, Inc.* | 169 | 2,932 | ||||||
Microsemi Corp.* | 169 | 2,831 | ||||||
JDA Software Group, Inc.* | 87 | 2,818 | ||||||
MAXIMUS, Inc. | 67 | 2,770 | ||||||
Sapient Corp. | 219 | 2,759 | ||||||
Universal Display Corp.* | 75 | 2,752 | ||||||
MKS Instruments, Inc. | 98 | 2,726 | ||||||
Fair Isaac Corp. | 75 | 2,688 | ||||||
Arris Group, Inc.* | 248 | 2,683 | ||||||
j2 Global, Inc. | 93 | 2,617 | ||||||
Cavium, Inc.* | 92 | 2,616 | ||||||
Progress Software Corp.* | 135 | 2,612 | ||||||
Convergys Corp.* | 204 | 2,605 | ||||||
Netgear, Inc.* | 77 | 2,585 | ||||||
Mentor Graphics Corp.* | 190 | 2,576 | ||||||
ValueClick, Inc.* | 151 | 2,460 | ||||||
Coherent, Inc.* | 46 | 2,404 | ||||||
Cardtronics, Inc.* | 87 | 2,354 | ||||||
Entegris, Inc.* | 266 | 2,321 | ||||||
DealerTrack Holdings, Inc.* | 85 | 2,317 | ||||||
Blackbaud, Inc. | 83 | 2,299 | ||||||
Quest Software, Inc.* | 121 | 2,251 | ||||||
Blue Coat Systems, Inc.* | 86 | 2,189 | ||||||
TiVo, Inc.* | 239 | 2,144 | ||||||
RightNow Technologies, Inc.* | 50 | 2,136 | ||||||
NetSuite, Inc.* | 52 | 2,109 | ||||||
Cirrus Logic, Inc.* | 128 | 2,029 | ||||||
ACI Worldwide, Inc.* | 70 | 2,005 | ||||||
Acxiom Corp.* | 163 | 1,990 | ||||||
Power Integrations, Inc. | 60 | 1,990 | ||||||
Take-Two Interactive Software, Inc.* | 145 | 1,965 | ||||||
Synaptics, Inc.* | 65 | 1,960 | ||||||
Cabot Microelectronics Corp.* | 41 | 1,937 | ||||||
Sourcefire, Inc.* | 59 | 1,910 | ||||||
Scansource, Inc.* | 53 | 1,908 | ||||||
Littelfuse, Inc. | 43 | 1,848 | ||||||
Plexus Corp.* | 67 | 1,834 | ||||||
Heartland Payment Systems, Inc. | 75 | 1,827 | ||||||
Euronet Worldwide, Inc.* | 98 | 1,811 | ||||||
Bottomline Technologies, Inc.* | 77 | 1,784 | ||||||
Manhattan Associates, Inc.* | 44 | 1,781 | ||||||
Tyler Technologies, Inc.* | 59 | 1,776 | ||||||
GT Advanced Technologies, Inc.* | 245 | 1,774 | ||||||
Unisys Corp.* | 86 | 1,695 | ||||||
NIC, Inc. | 125 | 1,664 | ||||||
OSI Systems, Inc.* | 34 | 1,659 | ||||||
Benchmark Electronics, Inc.* | 122 | 1,643 | ||||||
Tessera Technologies, Inc.* | 97 | 1,625 | ||||||
OpenTable, Inc.* | 41 | 1,604 | ||||||
Synchronoss Technologies, Inc.* | 53 | 1,601 | ||||||
Syntel, Inc. | 34 | 1,590 | ||||||
Integrated Device Technology, Inc.* | 291 | 1,589 | ||||||
TriQuint Semiconductor, Inc.* | 323 | 1,573 | ||||||
RealPage, Inc.* | 62 | 1,567 | ||||||
LogMeIn, Inc.* | 40 | 1,542 | ||||||
| 82 | THE RYDEX FUNDSANNUALREPORT | See Notes to Financial Statements. |
| SCHEDULE OF INVESTMENTS (continued) | December 31, 2011 |
RUSSELL 2000® 2x STRATEGY FUND
| SHARES | VALUE | |||||||
Veeco Instruments, Inc.* | 74 | $ | 1,539 | |||||
Advent Software, Inc.* | 63 | 1,535 | ||||||
SYNNEX Corp.* | 50 | 1,523 | ||||||
Comtech Telecommunications Corp. | 53 | 1,517 | ||||||
MicroStrategy, Inc. — Class A* | 14 | 1,516 | ||||||
Brightpoint, Inc.* | 139 | 1,496 | ||||||
Sanmina-SCI Corp.* | 160 | 1,490 | ||||||
Rambus, Inc.* | 195 | 1,472 | ||||||
Insight Enterprises, Inc.* | 95 | 1,453 | ||||||
Omnivision Technologies, Inc.* | 117 | 1,432 | ||||||
Earthlink, Inc. | 220 | 1,417 | ||||||
Websense, Inc.* | 75 | 1,405 | ||||||
Diodes, Inc.* | 65 | 1,385 | ||||||
Tekelec* | 126 | 1,377 | ||||||
Lattice Semiconductor Corp.* | 229 | 1,360 | ||||||
Netscout Systems, Inc.* | 77 | 1,355 | ||||||
Ancestry.com, Inc.* | 59 | 1,355 | ||||||
Electronics for Imaging, Inc.* | 95 | 1,354 | ||||||
Rofin-Sinar Technologies, Inc.* | 59 | 1,348 | ||||||
Constant Contact, Inc.* | 58 | 1,346 | ||||||
Kenexa Corp.* | 50 | 1,335 | ||||||
FARO Technologies, Inc.* | 29 | 1,334 | ||||||
Brooks Automation, Inc. | 129 | 1,325 | ||||||
Infinera Corp.* | 210 | 1,319 | ||||||
Kulicke & Soffa Industries, Inc.* | 141 | 1,304 | ||||||
Ceva, Inc.* | 43 | 1,301 | ||||||
BroadSoft, Inc.* | 43 | 1,299 | ||||||
LivePerson, Inc.* | 103 | 1,293 | ||||||
Liquidity Services, Inc.* | 35 | 1,292 | ||||||
Ebix, Inc. | 58 | 1,282 | ||||||
Mantech International Corp. — Class A | 41 | 1,281 | ||||||
Stratasys, Inc.* | 42 | 1,277 | ||||||
MTS Systems Corp. | 31 | 1,263 | ||||||
Volterra Semiconductor Corp.* | 49 | 1,255 | ||||||
3D Systems Corp.* | 87 | 1,253 | ||||||
comScore, Inc.* | 59 | 1,251 | ||||||
Loral Space & Communications, Inc.* | 19 | 1,233 | ||||||
Rogers Corp.* | 33 | 1,216 | ||||||
Verint Systems, Inc.* | 44 | 1,212 | ||||||
Opnet Technologies, Inc. | 33 | 1,210 | ||||||
Ultratech, Inc.* | 49 | 1,204 | ||||||
ATMI, Inc.* | 59 | 1,182 | ||||||
Emulex Corp.* | 172 | 1,180 | ||||||
Harmonic, Inc.* | 225 | 1,134 | ||||||
Digital River, Inc.* | 75 | 1,127 | ||||||
Higher One Holdings, Inc.* | 61 | 1,125 | ||||||
Standard Microsystems Corp.* | 43 | 1,108 | ||||||
TTM Technologies, Inc.* | 100 | 1,096 | ||||||
Monotype Imaging Holdings, Inc.* | 70 | 1,091 | ||||||
Quantum Corp.* | 450 | 1,080 | ||||||
Newport Corp.* | 77 | 1,048 | ||||||
S1 Corp.* | 109 | 1,043 | ||||||
Micrel, Inc. | 102 | 1,031 | ||||||
CSG Systems International, Inc.* | 69 | 1,015 | ||||||
Sonus Networks, Inc.* | 417 | 1,001 | ||||||
Black Box Corp. | 35 | 981 | ||||||
DTS, Inc.* | 36 | 981 | ||||||
United Online, Inc. | 179 | 974 | ||||||
Magma Design Automation, Inc.* | 133 | 955 | ||||||
Forrester Research, Inc.* | 28 | 950 | ||||||
Pegasystems, Inc. | 32 | 941 | ||||||
iGate Corp.* | 59 | 928 | ||||||
Amkor Technology, Inc.* | 212 | 924 | ||||||
Measurement Specialties, Inc.* | 33 | 923 | ||||||
Park Electrochemical Corp. | 36 | 922 | ||||||
TNS, Inc.* | 52 | 921 | ||||||
Monolithic Power Systems, Inc.* | 60 | 904 | ||||||
SS&C Technologies Holdings, Inc.* | 50 | 903 | ||||||
Super Micro Computer, Inc.* | 57 | 894 | ||||||
Maxwell Technologies, Inc.* | 55 | 893 | ||||||
Advanced Energy Industries, Inc.* | 83 | 891 | ||||||
Entropic Communications, Inc.* | 170 | 869 | ||||||
InfoSpace, Inc.* | 78 | 857 | ||||||
DemandTec, Inc.* | 65 | 856 | ||||||
Spansion, Inc. — Class A* | 103 | 853 | ||||||
Applied Micro Circuits Corp.* | 125 | 840 | ||||||
Bankrate, Inc.* | 39 | 839 | ||||||
Mercury Computer Systems, Inc.* | 62 | 824 | ||||||
Intermec, Inc.* | 119 | 816 | ||||||
TeleTech Holdings, Inc.* | 50 | 810 | ||||||
Checkpoint Systems, Inc.* | 74 | 810 | ||||||
Ixia* | 76 | 799 | ||||||
Vocus, Inc.* | 36 | 795 | ||||||
Badger Meter, Inc. | 27 | 795 | ||||||
Xyratex Ltd. | 58 | 773 | ||||||
Interactive Intelligence Group, Inc.* | 33 | 756 | ||||||
STEC, Inc.* | 88 | 756 | ||||||
Dice Holdings, Inc.* | 90 | 746 | ||||||
ExlService Holdings, Inc.* | 33 | 738 | ||||||
Sycamore Networks, Inc.* | 41 | 734 | ||||||
Accelrys, Inc.* | 109 | 732 | ||||||
Photronics, Inc.* | 118 | 717 | ||||||
Silicon Image, Inc.* | 152 | 714 | ||||||
Web.com Group, Inc.* | 62 | 710 | ||||||
Oplink Communications, Inc.* | 43 | 708 | ||||||
EPIQ Systems, Inc. | 58 | 697 | ||||||
Cass Information Systems, Inc. | 19 | 691 | ||||||
RealD, Inc.* | 86 | 683 | ||||||
PROS Holdings, Inc.* | 45 | 670 | ||||||
OCZ Technology Group, Inc.* | 100 | 661 | ||||||
Methode Electronics, Inc. | 79 | 655 | ||||||
Silicon Graphics International Corp.* | 57 | 653 | ||||||
KIT Digital, Inc.* | 77 | 651 | ||||||
Daktronics, Inc. | 67 | 641 | ||||||
Electro Scientific Industries, Inc.* | 43 | 623 | ||||||
| See Notes to Financial Statements. | THE RYDEX FUNDSANNUALREPORT | 83 |
| SCHEDULE OF INVESTMENTS (continued) | December 31, 2011 |
RUSSELL 2000® 2x STRATEGY FUND
| SHARES | VALUE | |||||||
CTS Corp. | 67 | $ | 616 | |||||
Electro Rent Corp. | 35 | 600 | ||||||
Kemet Corp.* | 85 | 599 | ||||||
ShoreTel, Inc.* | 93 | 593 | ||||||
Globecomm Systems, Inc.* | 43 | 588 | ||||||
LoopNet, Inc.* | 32 | 585 | ||||||
Internap Network Services Corp.* | 98 | 582 | ||||||
Keynote Systems, Inc. | 28 | 575 | ||||||
Global Cash Access Holdings, Inc.* | 129 | 574 | ||||||
GSI Group, Inc.* | 54 | 552 | ||||||
Extreme Networks* | 188 | 549 | ||||||
Fabrinet* | 40 | 547 | ||||||
Zygo Corp.* | 31 | 547 | ||||||
Rudolph Technologies, Inc.* | 59 | 546 | ||||||
Cohu, Inc. | 48 | 545 | ||||||
Power-One, Inc.* | 139 | 543 | ||||||
Digi International, Inc.* | 48 | 536 | ||||||
QuinStreet, Inc.* | 57 | 534 | ||||||
IXYS Corp.* | 48 | 520 | ||||||
Calix, Inc.* | 80 | 518 | ||||||
XO Group, Inc.* | 62 | 517 | ||||||
Anaren, Inc.* | 31 | 515 | ||||||
LTX-Credence Corp.* | 96 | 514 | ||||||
Avid Technology, Inc.* | 60 | 512 | ||||||
STR Holdings, Inc.* | 62 | 510 | ||||||
Kopin Corp.* | 130 | 504 | ||||||
Formfactor, Inc.* | 99 | 501 | ||||||
VirnetX Holding Corp.* | 20 | 499 | ||||||
Advanced Analogic Technologies, Inc.* | 86 | 497 | ||||||
Stamps.com, Inc.* | 19 | 496 | ||||||
Move, Inc.* | 78 | 493 | ||||||
Integrated Silicon Solution, Inc.* | 53 | 484 | ||||||
Perficient, Inc.* | 48 | 480 | ||||||
Computer Task Group, Inc.* | 34 | 479 | ||||||
CIBER, Inc.* | 124 | 479 | ||||||
Inphi Corp.* | 40 | 478 | ||||||
Cornerstone OnDemand, Inc.* | 26 | 474 | ||||||
SPS Commerce, Inc.* | 18 | 467 | ||||||
Cray, Inc.* | 72 | 466 | ||||||
Saba Software, Inc.* | 59 | 466 | ||||||
Exar Corp.* | 71 | 462 | ||||||
MIPS Technologies, Inc. — Class A* | 103 | 459 | ||||||
ModusLink Global Solutions, Inc. | 85 | 459 | ||||||
American Software, Inc. — Class A | 48 | 454 | ||||||
Supertex, Inc.* | 24 | 453 | ||||||
Symmetricom, Inc.* | 84 | 453 | ||||||
Procera Networks, Inc.* | 28 | 436 | ||||||
Deltek, Inc.* | 43 | 422 | ||||||
Echo Global Logistics, Inc.* | 26 | 420 | ||||||
Envestnet, Inc.* | 35 | 419 | ||||||
Vishay Precision Group, Inc.* | 26 | 415 | ||||||
Richardson Electronics Ltd. | 33 | 406 | ||||||
Callidus Software, Inc.* | 61 | 392 | ||||||
Virtusa Corp.* | 27 | 391 | ||||||
Actuate Corp.* | 66 | 387 | ||||||
Pericom Semiconductor Corp.* | 50 | 380 | ||||||
Seachange International, Inc.* | 53 | 373 | ||||||
VASCO Data Security International, Inc.* | 57 | 372 | ||||||
SciQuest, Inc.* | 26 | 371 | ||||||
IntraLinks Holdings, Inc.* | 59 | 368 | ||||||
Zix Corp.* | 128 | 361 | ||||||
Wave Systems Corp. — Class A* | 166 | 360 | ||||||
Bel Fuse, Inc. — Class B | 19 | 356 | ||||||
Sigma Designs, Inc.* | 59 | 354 | ||||||
Active Network, Inc.* | 26 | 354 | ||||||
Imation Corp.* | 59 | 338 | ||||||
Rubicon Technology, Inc.* | 36 | 338 | ||||||
NVE Corp.* | 6 | 333 | ||||||
Echelon Corp.* | 68 | 331 | ||||||
Mindspeed Technologies, Inc.* | 70 | 321 | ||||||
RealNetworks, Inc. | 42 | 315 | ||||||
Intevac, Inc.* | 42 | 311 | ||||||
PDF Solutions, Inc.* | 43 | 300 | ||||||
ServiceSource International, Inc.* | 19 | 298 | ||||||
Glu Mobile, Inc.* | 93 | 292 | ||||||
Anadigics, Inc.* | 132 | 289 | ||||||
Multi-Fineline Electronix, Inc.* | 14 | 288 | ||||||
Oclaro, Inc.* | 102 | 288 | ||||||
Lionbridge Technologies, Inc.* | 125 | 286 | ||||||
Immersion Corp.* | 55 | 285 | ||||||
FSI International, Inc.* | 77 | 282 | ||||||
Axcelis Technologies, Inc.* | 210 | 279 | ||||||
Agilysys, Inc.* | 35 | 278 | ||||||
LeCroy Corp.* | 33 | 278 | ||||||
Tangoe, Inc.* | 18 | 277 | ||||||
Convio, Inc.* | 25 | 277 | ||||||
Marchex, Inc. — Class A | 44 | 275 | ||||||
MoSys, Inc.* | 65 | 273 | ||||||
Openwave Systems, Inc.* | 171 | 270 | ||||||
Ultra Clean Holdings* | 43 | 263 | ||||||
TeleNav, Inc.* | 33 | 258 | ||||||
DDi Corp. | 27 | 252 | ||||||
KVH Industries, Inc.* | 32 | 249 | ||||||
X-Rite, Inc.* | 53 | 246 | ||||||
PRGX Global, Inc.* | 41 | 244 | ||||||
Pulse Electronics Corp. | 87 | 244 | ||||||
PLX Technology, Inc.* | 84 | 241 | ||||||
Westell Technologies, Inc. — Class A* | 104 | 231 | ||||||
Hackett Group, Inc.* | 61 | 228 | ||||||
ePlus, Inc.* | 8 | 226 | ||||||
DSP Group, Inc.* | 43 | 224 | ||||||
Aviat Networks, Inc.* | 122 | 223 | ||||||
TeleCommunication Systems, Inc.* | 92 | 216 | ||||||
NCI, Inc.* | 18 | 210 | ||||||
ORBCOMM, Inc.* | 69 | 206 | ||||||
support.com, Inc.* | 91 | 205 | ||||||
| 84 | THE RYDEX FUNDSANNUALREPORT | See Notes to Financial Statements. |
| SCHEDULE OF INVESTMENTS (continued) | December 31, 2011 |
RUSSELL 2000® 2x STRATEGY FUND
| SHARES | VALUE | |||||||
Alpha & Omega Semiconductor Ltd.* | 28 | $ | 205 | |||||
Dynamics Research Corp.* | 17 | 193 | ||||||
GSI Technology, Inc.* | 41 | 192 | ||||||
Rosetta Stone, Inc.* | 25 | 191 | ||||||
Novatel Wireless, Inc.* | 59 | 185 | ||||||
Guidance Software, Inc.* | 28 | 181 | ||||||
Radisys Corp.* | 34 | 172 | ||||||
Identive Group, Inc.* | 76 | 169 | ||||||
Carbonite, Inc.* | 15 | 167 | ||||||
TechTarget, Inc.* | 27 | 158 | ||||||
Rimage Corp. | 14 | 158 | ||||||
MaxLinear, Inc. — Class A* | 33 | 157 | ||||||
PC Connection, Inc. | 14 | 155 | ||||||
FalconStor Software, Inc.* | 60 | 155 | ||||||
Emcore Corp.* | 179 | 154 | ||||||
Responsys, Inc.* | 17 | 151 | ||||||
Dot Hill Systems Corp.* | 112 | 149 | ||||||
Nanometrics, Inc.* | 8 | 147 | ||||||
Amtech Systems, Inc.* | 17 | 145 | ||||||
SRS Labs, Inc.* | 25 | 144 | ||||||
Numerex Corp. — Class A* | 17 | 140 | ||||||
eMagin Corp.* | 36 | 133 | ||||||
Powerwave Technologies, Inc.* | 63 | 131 | ||||||
Communications Systems, Inc. | 9 | 127 | ||||||
Limelight Networks, Inc.* | 41 | 121 | ||||||
Digimarc Corp.* | 5 | 119 | ||||||
Aeroflex Holding Corp.* | 10 | 102 | ||||||
Ellie Mae, Inc.* | 18 | 102 | ||||||
THQ, Inc.* | 132 | 100 | ||||||
Demand Media, Inc.* | 15 | 100 | ||||||
QAD, Inc. — Class A* | 9 | 94 | ||||||
MoneyGram International, Inc.* | 5 | 89 | ||||||
AXT, Inc.* | 20 | 83 | ||||||
Meru Networks, Inc.* | 19 | 78 | ||||||
NeoPhotonics Corp.* | 17 | 78 | ||||||
Smith Micro Software, Inc.* | 67 | 76 | ||||||
Motricity, Inc.* | 79 | 71 | ||||||
Opnext, Inc.* | 85 | 69 | ||||||
Stream Global Services, Inc.* | 17 | 56 | ||||||
Dialogic, Inc.* | 34 | 41 | ||||||
FriendFinder Networks, Inc.* | 5 | 4 | ||||||
|
| |||||||
Total Information Technology | 370,101 | |||||||
|
| |||||||
INDUSTRIALS - 5.1% | ||||||||
Clean Harbors, Inc.* | 91 | 5,799 | ||||||
HEICO Corp. | 88 | 5,146 | ||||||
Woodward, Inc. | 125 | 5,116 | ||||||
Alaska Air Group, Inc.* | 67 | 5,031 | ||||||
CLARCOR, Inc. | 99 | 4,949 | ||||||
Hexcel Corp.* | 192 | 4,648 | ||||||
Triumph Group, Inc. | 78 | 4,559 | ||||||
Genesee & Wyoming, Inc. — Class A* | 75 | 4,543 | ||||||
Acuity Brands, Inc. | 84 | 4,452 | ||||||
Dollar Thrifty Automotive Group, Inc.* | 62 | 4,356 | ||||||
Moog, Inc. — Class A* | 96 | 4,217 | ||||||
Teledyne Technologies, Inc.* | 73 | 4,004 | ||||||
Watsco, Inc. | 59 | 3,874 | ||||||
Middleby Corp.* | 41 | 3,856 | ||||||
United Rentals, Inc.* | 128 | 3,782 | ||||||
FTI Consulting, Inc.* | 87 | 3,691 | ||||||
Old Dominion Freight Line, Inc.* | 90 | 3,648 | ||||||
Robbins & Myers, Inc. | 75 | 3,641 | ||||||
EMCOR Group, Inc. | 135 | 3,619 | ||||||
Esterline Technologies Corp.* | 61 | 3,414 | ||||||
Curtiss-Wright Corp. | 95 | 3,356 | ||||||
CoStar Group, Inc.* | 49 | 3,270 | ||||||
Actuant Corp. — Class A | 138 | 3,131 | ||||||
United Stationers, Inc. | 95 | 3,093 | ||||||
AO Smith Corp. | 77 | 3,089 | ||||||
Acacia Research - Acacia Technologies* | 84 | 3,067 | ||||||
Belden, Inc. | 92 | 3,062 | ||||||
Applied Industrial Technologies, Inc. | 87 | 3,060 | ||||||
Chart Industries, Inc.* | 56 | 3,028 | ||||||
Brady Corp. — Class A | 93 | 2,936 | ||||||
Mueller Industries, Inc. | 76 | 2,920 | ||||||
Simpson Manufacturing Company, Inc. | 85 | 2,861 | ||||||
Rollins, Inc. | 126 | 2,800 | ||||||
Barnes Group, Inc. | 110 | 2,652 | ||||||
EnerSys* | 102 | 2,649 | ||||||
Corporate Executive Board Co. | 69 | 2,629 | ||||||
Tetra Tech, Inc.* | 121 | 2,612 | ||||||
HUB Group, Inc. — Class A* | 79 | 2,562 | ||||||
Brink’s Co. | 95 | 2,554 | ||||||
JetBlue Airways Corp.* | 485 | 2,522 | ||||||
RSC Holdings, Inc.* | 133 | 2,460 | ||||||
Advisory Board Co.* | 31 | 2,301 | ||||||
Healthcare Services Group, Inc. | 128 | 2,264 | ||||||
Deluxe Corp. | 97 | 2,208 | ||||||
Herman Miller, Inc. | 119 | 2,196 | ||||||
HNI Corp. | 84 | 2,192 | ||||||
Geo Group, Inc.* | 130 | 2,178 | ||||||
Avis Budget Group, Inc.* | 203 | 2,176 | ||||||
ABM Industries, Inc. | 104 | 2,144 | ||||||
Portfolio Recovery Associates, Inc.* | 31 | 2,093 | ||||||
Watts Water Technologies, Inc. — Class A | 60 | 2,053 | ||||||
Werner Enterprises, Inc. | 85 | 2,048 | ||||||
Raven Industries, Inc. | 33 | 2,043 | ||||||
Atlas Air Worldwide Holdings, Inc.* | 53 | 2,037 | ||||||
Kaydon Corp. | 66 | 2,013 | ||||||
Knight Transportation, Inc. | 126 | 1,971 | ||||||
Beacon Roofing Supply, Inc.* | 95 | 1,922 | ||||||
MasTec, Inc.* | 108 | 1,876 | ||||||
Forward Air Corp. | 58 | 1,859 | ||||||
II-VI, Inc.* | 100 | 1,836 | ||||||
| See Notes to Financial Statements. | THE RYDEX FUNDSANNUALREPORT | 85 |
| SCHEDULE OF INVESTMENTS (continued) | December 31, 2011 |
RUSSELL 2000® 2x STRATEGY FUND
| SHARES | VALUE | |||||||
RBC Bearings, Inc.* | 44 | $ | 1,835 | |||||
Franklin Electric Company, Inc. | 42 | 1,830 | ||||||
Granite Construction, Inc. | 77 | 1,826 | ||||||
Mine Safety Appliances Co. | 52 | 1,722 | ||||||
Orbital Sciences Corp.* | 118 | 1,715 | ||||||
Titan International, Inc. | 85 | 1,654 | ||||||
US Airways Group, Inc.* | 326 | 1,653 | ||||||
Huron Consulting Group, Inc.* | 42 | 1,627 | ||||||
Korn* | 94 | 1,604 | ||||||
Unifirst Corp. | 28 | 1,589 | ||||||
Briggs & Stratton Corp. | 100 | 1,549 | ||||||
Aircastle Ltd. | 118 | 1,501 | ||||||
ESCO Technologies, Inc. | 52 | 1,497 | ||||||
Tennant Co. | 38 | 1,477 | ||||||
Heartland Express, Inc. | 102 | 1,458 | ||||||
Blount International, Inc.* | 100 | 1,452 | ||||||
Kaman Corp. | 53 | 1,448 | ||||||
USG Corp.* | 142 | 1,443 | ||||||
Allegiant Travel Co.* | 27 | 1,440 | ||||||
Cubic Corp. | 33 | 1,438 | ||||||
AAR Corp. | 75 | 1,438 | ||||||
Generac Holdings, Inc.* | 51 | 1,430 | ||||||
Dycom Industries, Inc.* | 68 | 1,423 | ||||||
McGrath Rentcorp | 48 | 1,392 | ||||||
Lindsay Corp. | 25 | 1,372 | ||||||
Colfax Corp.* | 48 | 1,367 | ||||||
SYKES Enterprises, Inc.* | 87 | 1,362 | ||||||
Rush Enterprises, Inc. — Class A* | 64 | 1,339 | ||||||
Mobile Mini, Inc.* | 76 | 1,326 | ||||||
SkyWest, Inc. | 105 | 1,322 | ||||||
Knoll, Inc. | 89 | 1,322 | ||||||
Astec Industries, Inc.* | 40 | 1,288 | ||||||
Exponent, Inc.* | 28 | 1,287 | ||||||
Ceradyne, Inc.* | 48 | 1,285 | ||||||
TAL International Group, Inc. | 44 | 1,267 | ||||||
EnPro Industries, Inc.* | 38 | 1,253 | ||||||
Swift Transportation Co.* | 152 | 1,252 | ||||||
Interface, Inc. — Class A | 105 | 1,212 | ||||||
Albany International Corp. — Class A | 52 | 1,202 | ||||||
Insperity, Inc. | 47 | 1,191 | ||||||
Universal Forest Products, Inc. | 38 | 1,173 | ||||||
TrueBlue, Inc.* | 84 | 1,166 | ||||||
American Science & Engineering, Inc. | 17 | 1,158 | ||||||
Quanex Building Products Corp. | 77 | 1,157 | ||||||
Aegion Corp.* | 75 | 1,151 | ||||||
Amerco, Inc. | 13 | 1,149 | ||||||
Navigant Consulting, Inc.* | 100 | 1,141 | ||||||
AZZ, Inc. | 25 | 1,136 | ||||||
Steelcase, Inc. — Class A | 152 | 1,134 | ||||||
CIRCOR International, Inc. | 32 | 1,130 | ||||||
DigitalGlobe, Inc.* | 66 | 1,129 | ||||||
Interline Brands, Inc.* | 70 | 1,090 | ||||||
Wabash National Corp.* | 136 | 1,066 | ||||||
ACCO Brands Corp.* | 109 | 1,052 | ||||||
Team, Inc.* | 34 | 1,011 | ||||||
Altra Holdings, Inc.* | 53 | 998 | ||||||
Resources Connection, Inc. | 94 | 995 | ||||||
Meritor, Inc.* | 187 | 995 | ||||||
Layne Christensen Co.* | 41 | 992 | ||||||
ICF International, Inc.* | 40 | 991 | ||||||
G&K Services, Inc. — Class A | 34 | 990 | ||||||
GeoEye, Inc.* | 44 | 978 | ||||||
Arkansas Best Corp. | 50 | 964 | ||||||
Aerovironment, Inc.* | 30 | 944 | ||||||
Sauer-Danfoss, Inc.* | 26 | 941 | ||||||
Trimas Corp.* | 52 | 933 | ||||||
Encore Wire Corp. | 35 | 907 | ||||||
John Bean Technologies Corp. | 58 | 891 | ||||||
Sun Hydraulics Corp. | 38 | 890 | ||||||
On Assignment, Inc.* | 79 | 883 | ||||||
Standex International Corp. | 25 | 854 | ||||||
Primoris Services Corp. | 56 | 836 | ||||||
Greenbrier Companies, Inc.* | 34 | 826 | ||||||
Gibraltar Industries, Inc.* | 59 | 824 | ||||||
Kforce, Inc.* | 66 | 814 | ||||||
Global Power Equipment Group, Inc.* | 34 | 808 | ||||||
Cascade Corp. | 17 | 802 | ||||||
Trex Company, Inc.* | 35 | 802 | ||||||
Comfort Systems USA, Inc. | 74 | 793 | ||||||
MYR Group, Inc.* | 41 | 785 | ||||||
Consolidated Graphics, Inc.* | 16 | 772 | ||||||
Pendrell Corp.* | 297 | 760 | ||||||
Textainer Group Holdings Ltd. | 26 | 757 | ||||||
Heidrick & Struggles International, Inc. | 35 | 754 | ||||||
Tutor Perini Corp.* | 61 | 753 | ||||||
Mueller Water Products, Inc. — Class A | 306 | 747 | ||||||
Titan Machinery, Inc.* | 34 | 739 | ||||||
H&E Equipment Services, Inc.* | 55 | 738 | ||||||
Gorman-Rupp Co. | 27 | 733 | ||||||
Ennis, Inc. | 54 | 720 | ||||||
AAON, Inc. | 35 | 717 | ||||||
Quad | 50 | 717 | ||||||
Mistras Group, Inc.* | 28 | 714 | ||||||
Kelly Services, Inc. — Class A | 52 | 711 | ||||||
Viad Corp. | 40 | 699 | ||||||
Apogee Enterprises, Inc. | 56 | 687 | ||||||
Astronics Corp.* | 19 | 680 | ||||||
RailAmerica, Inc.* | 45 | 670 | ||||||
Multi-Color Corp. | 26 | 669 | ||||||
Great Lakes Dredge & Dock Corp. | 120 | 667 | ||||||
Encore Capital Group, Inc.* | 31 | 659 | ||||||
US Ecology, Inc. | 35 | 657 | ||||||
Swisher Hygiene, Inc.* | 171 | 640 | ||||||
GenCorp, Inc.* | 120 | 638 | ||||||
| 86 | THE RYDEX FUNDSANNUALREPORT | See Notes to Financial Statements. |
| SCHEDULE OF INVESTMENTS (continued) | December 31, 2011 |
RUSSELL 2000® 2x STRATEGY FUND
| SHARES | VALUE | |||||||
PMFG, Inc.* | 32 | $ | 624 | |||||
American Railcar Industries, Inc.* | 26 | 622 | ||||||
Taser International, Inc.* | 120 | 614 | ||||||
Marten Transport Ltd. | 34 | 612 | ||||||
Preformed Line Products Co. | 10 | 597 | ||||||
Standard Parking Corp.* | 33 | 590 | ||||||
Kadant, Inc.* | 26 | 588 | ||||||
Wesco Aircraft Holdings, Inc.* | 42 | 588 | ||||||
Twin Disc, Inc. | 16 | 581 | ||||||
Hawaiian Holdings, Inc.* | 98 | 568 | ||||||
Capstone Turbine Corp.* | 486 | 564 | ||||||
DXP Enterprises, Inc.* | 17 | 547 | ||||||
Powell Industries, Inc.* | 17 | 532 | ||||||
Spirit Airlines, Inc.* | 34 | 530 | ||||||
Accuride Corp.* | 74 | 527 | ||||||
FreightCar America, Inc.* | 25 | 524 | ||||||
Columbus McKinnon Corp.* | 41 | 520 | ||||||
Douglas Dynamics, Inc. | 35 | 512 | ||||||
EnergySolutions, Inc.* | 164 | 507 | ||||||
Commercial Vehicle Group, Inc.* | 56 | 506 | ||||||
InnerWorkings, Inc.* | 54 | 503 | ||||||
Federal Signal Corp.* | 121 | 502 | ||||||
Ameresco, Inc. — Class A* | 36 | 494 | ||||||
Air Transport Services Group, Inc.* | 103 | 486 | ||||||
Furmanite Corp.* | 77 | 486 | ||||||
Dolan Co.* | 57 | 486 | ||||||
Alamo Group, Inc. | 18 | 485 | ||||||
Houston Wire & Cable Co. | 35 | 484 | ||||||
LB Foster Co. | 17 | 481 | ||||||
Dynamic Materials Corp. | 24 | 475 | ||||||
CBIZ, Inc.* | 75 | 458 | ||||||
EnerNOC, Inc.* | 42 | 457 | ||||||
Graham Corp. | 20 | 449 | ||||||
NACCO Industries, Inc. — Class A | 5 | 446 | ||||||
NCI Building Systems, Inc.* | 41 | 446 | ||||||
Celadon Group, Inc. | 37 | 437 | ||||||
Kratos Defense & Security Solutions, Inc.* | 70 | 418 | ||||||
CAI International, Inc.* | 26 | 402 | ||||||
Odyssey Marine Exploration, Inc.* | 146 | 400 | ||||||
Miller Industries, Inc. | 25 | 393 | ||||||
Genco Shipping & Trading Ltd.* | 58 | 392 | ||||||
Northwest Pipe Co.* | 17 | 389 | ||||||
SeaCube Container Leasing Ltd. | 26 | 385 | ||||||
Insteel Industries, Inc. | 35 | 385 | ||||||
CRA International, Inc.* | 19 | 377 | ||||||
Cenveo, Inc.* | 109 | 371 | ||||||
GP Strategies Corp.* | 27 | 364 | ||||||
Saia, Inc.* | 29 | 362 | ||||||
American Reprographics Co.* | 77 | 353 | ||||||
Michael Baker Corp.* | 18 | 353 | ||||||
Orion Marine Group, Inc.* | 53 | 352 | ||||||
Ampco-Pittsburgh Corp. | 18 | 348 | ||||||
Pacer International, Inc.* | 65 | 348 | ||||||
CDI Corp. | 25 | 345 | ||||||
Aceto Corp. | 50 | 345 | ||||||
Sterling Construction Company, Inc.* | 32 | 345 | ||||||
Thermon Group Holdings, Inc.* | 19 | 335 | ||||||
Vicor Corp. | 41 | 326 | ||||||
Park-Ohio Holdings Corp.* | 18 | 321 | ||||||
American Superconductor Corp.* | 87 | 321 | ||||||
Republic Airways Holdings, Inc.* | 93 | 319 | ||||||
Flow International Corp.* | 91 | 318 | ||||||
Hudson Highland Group, Inc.* | 65 | 311 | ||||||
Casella Waste Systems, Inc. — Class A* | 48 | 307 | ||||||
Kimball International, Inc. — Class B | 60 | 304 | ||||||
Quality Distribution, Inc.* | 27 | 304 | ||||||
Barrett Business Services, Inc. | 15 | 299 | ||||||
LMI Aerospace, Inc.* | 17 | 298 | ||||||
Courier Corp. | 25 | 293 | ||||||
Schawk, Inc. — Class A | 26 | 291 | ||||||
Lydall, Inc.* | 30 | 285 | ||||||
A123 Systems, Inc.* | 176 | 283 | ||||||
Met-Pro Corp. | 31 | 280 | ||||||
Griffon Corp. | 29 | 265 | ||||||
KEYW Holding Corp.* | 35 | 259 | ||||||
Hill International, Inc.* | 50 | 257 | ||||||
Zipcar, Inc.* | 19 | 255 | ||||||
TMS International Corp.* | 25 | 247 | ||||||
Metalico, Inc.* | 74 | 243 | ||||||
Ducommun, Inc. | 19 | 242 | ||||||
Roadrunner Transportation Systems, Inc.* | 17 | 240 | ||||||
LSI Industries, Inc. | 40 | 240 | ||||||
Pike Electric Corp.* | 33 | 237 | ||||||
Franklin Covey Co.* | 28 | 237 | ||||||
Energy Recovery, Inc.* | 91 | 235 | ||||||
NL Industries, Inc. | 18 | 233 | ||||||
American Woodmark Corp. | 17 | 232 | ||||||
Fuel Tech, Inc.* | 35 | 230 | ||||||
Argan, Inc. | 15 | 228 | ||||||
FuelCell Energy, Inc.* | 249 | 217 | ||||||
TRC Companies, Inc.* | 36 | 216 | ||||||
RPX Corp.* | 17 | 215 | ||||||
WCA Waste Corp.* | 32 | 208 | ||||||
Builders FirstSource, Inc.* | 95 | 194 | ||||||
NN, Inc.* | 32 | 192 | ||||||
AT Cross Co. — Class A* | 17 | 192 | ||||||
Hurco Companies, Inc.* | 9 | 189 | ||||||
Intersections, Inc. | 17 | 189 | ||||||
Broadwind Energy, Inc.* | 275 | 187 | ||||||
PowerSecure International, Inc.* | 35 | 173 | ||||||
Xerium Technologies, Inc.* | 26 | 170 | ||||||
VSE Corp. | 7 | 170 | ||||||
Tecumseh Products Co. — Class A* | 35 | 164 | ||||||
Baltic Trading Ltd. | 33 | 157 | ||||||
Coleman Cable, Inc.* | 18 | 157 | ||||||
| See Notes to Financial Statements. | THE RYDEX FUNDSANNUALREPORT | 87 |
| SCHEDULE OF INVESTMENTS (continued) | December 31, 2011 |
RUSSELL 2000® 2x STRATEGY FUND
| SHARES | VALUE | |||||||
Valence Technology, Inc.* | 146 | $ | 143 | |||||
Excel Maritime Carriers Ltd.* | 92 | 133 | ||||||
Ultrapetrol Bahamas Ltd.* | 43 | 128 | ||||||
Lawson Products, Inc. | 8 | 123 | ||||||
UniTek Global Services, Inc.* | 27 | 122 | ||||||
Eagle Bulk Shipping, Inc.* | 127 | 120 | ||||||
Patriot Transportation Holding, Inc.* | 5 | 108 | ||||||
Active Power, Inc.* | 164 | 108 | ||||||
Heritage-Crystal Clean, Inc.* | 6 | 99 | ||||||
Essex Rental Corp.* | 32 | 94 | ||||||
International Shipholding Corp. | 5 | 93 | ||||||
Universal Truckload Services, Inc. | 5 | 91 | ||||||
Microvision, Inc.* | 209 | 75 | ||||||
Covenant Transportation Group, Inc. — Class A* | 18 | 53 | ||||||
Satcon Technology Corp.* | 60 | 36 | ||||||
|
| |||||||
Total Industrials | 340,279 | |||||||
|
| |||||||
CONSUMER DISCRETIONARY - 4.3% |
| |||||||
Rent-A-Center, Inc. | 126 | 4,662 | ||||||
Warnaco Group, Inc.* | 84 | 4,203 | ||||||
Domino’s Pizza, Inc.* | 121 | 4,108 | ||||||
Life Time Fitness, Inc.* | 87 | 4,067 | ||||||
Ascena Retail Group, Inc.* | 128 | 3,804 | ||||||
Sotheby’s | 131 | 3,737 | ||||||
Wolverine World Wide, Inc. | 103 | 3,671 | ||||||
Carter’s, Inc.* | 91 | 3,623 | ||||||
Dana Holding Corp.* | 290 | 3,524 | ||||||
Tenneco, Inc.* | 118 | 3,514 | ||||||
Six Flags Entertainment Corp. | 85 | 3,505 | ||||||
Cinemark Holdings, Inc. | 184 | 3,402 | ||||||
Cheesecake Factory, Inc.* | 113 | 3,317 | ||||||
Brunswick Corp. | 178 | 3,215 | ||||||
Men’s Wearhouse, Inc. | 99 | 3,209 | ||||||
Vail Resorts, Inc. | 67 | 2,838 | ||||||
Hillenbrand, Inc. | 127 | 2,835 | ||||||
Pool Corp. | 93 | 2,799 | ||||||
Pier 1 Imports, Inc.* | 198 | 2,758 | ||||||
HSN, Inc. | 75 | 2,720 | ||||||
Steven Madden Ltd.* | 78 | 2,691 | ||||||
Childrens Place Retail Stores, Inc.* | 50 | 2,656 | ||||||
Coinstar, Inc.* | 58 | 2,647 | ||||||
Group 1 Automotive, Inc. | 49 | 2,538 | ||||||
Jos A. Bank Clothiers, Inc.* | 52 | 2,536 | ||||||
Genesco, Inc.* | 41 | 2,531 | ||||||
Strayer Education, Inc. | 26 | 2,527 | ||||||
Crocs, Inc.* | 171 | 2,526 | ||||||
Aeropostale, Inc.* | 163 | 2,486 | ||||||
ANN, Inc.* | 100 | 2,478 | ||||||
Monro Muffler Brake, Inc. | 63 | 2,444 | ||||||
Select Comfort Corp.* | 109 | 2,364 | ||||||
Iconix Brand Group, Inc.* | 145 | 2,362 | ||||||
Hibbett Sports, Inc.* | 52 | 2,349 | ||||||
Live Nation Entertainment, Inc.* | 278 | 2,310 | ||||||
Buffalo Wild Wings, Inc.* | 34 | 2,295 | ||||||
Saks, Inc.* | 232 | 2,262 | ||||||
Meredith Corp. | 67 | 2,188 | ||||||
BJ’s Restaurants, Inc.* | 48 | 2,175 | ||||||
Cracker Barrel Old Country Store, Inc. | 43 | 2,168 | ||||||
Buckle, Inc. | 53 | 2,166 | ||||||
Express, Inc.* | 108 | 2,154 | ||||||
Cabela’s, Inc.* | 83 | 2,110 | ||||||
New York Times Co. — Class A* | 270 | 2,087 | ||||||
99 Cents Only Stores* | 95 | 2,085 | ||||||
Bob Evans Farms, Inc. | 62 | 2,079 | ||||||
Vitamin Shoppe, Inc.* | 50 | 1,994 | ||||||
Jack in the Box, Inc.* | 95 | 1,986 | ||||||
Regis Corp. | 119 | 1,969 | ||||||
Matthews International Corp. — Class A | 62 | 1,949 | ||||||
Finish Line, Inc. — Class A | 101 | 1,948 | ||||||
Valassis Communications, Inc.* | 101 | 1,942 | ||||||
Texas Roadhouse, Inc. | 125 | 1,862 | ||||||
Helen of Troy Ltd.* | 60 | 1,842 | ||||||
True Religion Apparel, Inc.* | 52 | 1,798 | ||||||
Arbitron, Inc. | 52 | 1,789 | ||||||
Jones Group, Inc. | 167 | 1,762 | ||||||
Collective Brands, Inc.* | 120 | 1,724 | ||||||
Cooper Tire & Rubber Co. | 121 | 1,695 | ||||||
Penske Automotive Group, Inc. | 88 | 1,694 | ||||||
Gaylord Entertainment Co.* | 67 | 1,617 | ||||||
Scholastic Corp. | 53 | 1,588 | ||||||
Liz Claiborne, Inc.* | 184 | 1,588 | ||||||
International Speedway Corp. — Class A | 62 | 1,572 | ||||||
Peet’s Coffee & Tea, Inc.* | 25 | 1,567 | ||||||
American Public Education, Inc.* | 36 | 1,558 | ||||||
DineEquity, Inc.* | 34 | 1,435 | ||||||
Papa John’s International, Inc.* | 38 | 1,432 | ||||||
Ascent Capital Group, Inc. — Class A* | 28 | 1,420 | ||||||
Shutterfly, Inc.* | 62 | 1,411 | ||||||
Orient-Express Hotels Ltd. — Class A* | 186 | 1,389 | ||||||
CEC Entertainment, Inc. | 40 | 1,378 | ||||||
iRobot Corp.* | 46 | 1,373 | ||||||
MDC Holdings, Inc. | 77 | 1,358 | ||||||
National CineMedia, Inc. | 109 | 1,352 | ||||||
Ryland Group, Inc. | 85 | 1,340 | ||||||
Asbury Automotive Group, Inc.* | 62 | 1,337 | ||||||
American Axle & Manufacturing Holdings, Inc.* | 135 | 1,335 | ||||||
PF Chang’s China Bistro, Inc. | 43 | 1,329 | ||||||
Vera Bradley, Inc.* | 41 | 1,322 | ||||||
Shuffle Master, Inc.* | 110 | 1,289 | ||||||
Cato Corp. — Class A | 52 | 1,258 | ||||||
GNC Holdings, Inc. — Class A* | 43 | 1,245 | ||||||
Pinnacle Entertainment, Inc.* | 121 | 1,229 | ||||||
Steiner Leisure Ltd.* | 27 | 1,226 | ||||||
Columbia Sportswear Co. | 26 | 1,210 | ||||||
| 88 | THE RYDEX FUNDSANNUALREPORT | See Notes to Financial Statements. |
| SCHEDULE OF INVESTMENTS (continued) | December 31, 2011 |
RUSSELL 2000® 2x STRATEGY FUND
| SHARES | VALUE | |||||||
Meritage Homes Corp.* | 52 | $ | 1,206 | |||||
La-Z-Boy, Inc.* | 101 | 1,202 | ||||||
Zumiez, Inc.* | 43 | 1,194 | ||||||
Capella Education Co.* | 33 | 1,190 | ||||||
Office Depot, Inc.* | 553 | 1,189 | ||||||
Belo Corp. — Class A | 186 | 1,172 | ||||||
Sinclair Broadcast Group, Inc. — Class A | 103 | 1,167 | ||||||
Ethan Allen Interiors, Inc. | 49 | 1,162 | ||||||
PEP Boys-Manny Moe & Jack | 105 | 1,155 | ||||||
Churchill Downs, Inc. | 22 | 1,147 | ||||||
Sturm Ruger & Company, Inc. | 34 | 1,138 | ||||||
Scientific Games Corp. — Class A* | 117 | 1,135 | ||||||
Charming Shoppes, Inc.* | 231 | 1,132 | ||||||
Oxford Industries, Inc. | 25 | 1,128 | ||||||
Ameristar Casinos, Inc. | 65 | 1,124 | ||||||
Sonic Automotive, Inc. — Class A | 74 | 1,096 | ||||||
Fred’s, Inc. — Class A | 75 | 1,094 | ||||||
KB Home | 156 | 1,048 | ||||||
Core-Mark Holding Company, Inc. | 26 | 1,030 | ||||||
Interval Leisure Group, Inc.* | 74 | 1,007 | ||||||
Lithia Motors, Inc. — Class A | 43 | 940 | ||||||
American Greetings Corp. — Class A | 74 | 926 | ||||||
Quiksilver, Inc.* | 255 | 921 | ||||||
Stewart Enterprises, Inc. — Class A | 159 | 916 | ||||||
K12, Inc.* | 51 | 915 | ||||||
Grand Canyon Education, Inc.* | 57 | 910 | ||||||
Skechers U.S.A., Inc. — Class A* | 75 | 909 | ||||||
Blue Nile, Inc.* | 22 | 899 | ||||||
Barnes & Noble, Inc.* | 62 | 898 | ||||||
Maidenform Brands, Inc.* | 49 | 897 | ||||||
Ruby Tuesday, Inc.* | 129 | 890 | ||||||
Knology, Inc.* | 61 | 866 | ||||||
Modine Manufacturing Co.* | 91 | 861 | ||||||
Drew Industries, Inc.* | 35 | 859 | ||||||
Dorman Products, Inc.* | 23 | 849 | ||||||
Stage Stores, Inc. | 60 | 833 | ||||||
Bridgepoint Education, Inc.* | 36 | 828 | ||||||
G-III Apparel Group Ltd.* | 33 | 822 | ||||||
Sonic Corp.* | 121 | 814 | ||||||
Boyd Gaming Corp.* | 109 | 813 | ||||||
Lumber Liquidators Holdings, Inc.* | 46 | 812 | ||||||
Standard Motor Products, Inc. | 40 | 802 | ||||||
Harte-Hanks, Inc. | 85 | 773 | ||||||
OfficeMax, Inc.* | 169 | 767 | ||||||
Krispy Kreme Doughnuts, Inc.* | 117 | 765 | ||||||
Jakks Pacific, Inc. | 52 | 734 | ||||||
Lions Gate Entertainment Corp.* | 88 | 732 | ||||||
Brown Shoe Company, Inc. | 82 | 730 | ||||||
Cavco Industries, Inc.* | 18 | 721 | ||||||
Callaway Golf Co. | 130 | 719 | ||||||
Denny’s Corp.* | 191 | 718 | ||||||
Superior Industries International, Inc. | 43 | 711 | ||||||
AFC Enterprises, Inc.* | 48 | 706 | ||||||
America’s Car-Mart, Inc.* | 18 | 705 | ||||||
Red Robin Gourmet Burgers, Inc.* | 25 | 692 | ||||||
Digital Generation, Inc.* | 58 | 691 | ||||||
MDC Partners, Inc. — Class A | 50 | 676 | ||||||
Standard Pacific Corp.* | 211 | 671 | ||||||
NutriSystem, Inc. | 51 | 659 | ||||||
Body Central Corp.* | 26 | 649 | ||||||
Bebe Stores, Inc. | 77 | 641 | ||||||
Hot Topic, Inc. | 90 | 595 | ||||||
Arctic Cat, Inc.* | 26 | 586 | ||||||
Wet Seal, Inc. — Class A* | 179 | 584 | ||||||
Rue21, Inc.* | 27 | 583 | ||||||
Bravo Brio Restaurant Group, Inc.* | 34 | 583 | ||||||
Universal Technical Institute, Inc.* | 45 | 575 | ||||||
National Presto Industries, Inc. | 6 | 562 | ||||||
Universal Electronics, Inc.* | 33 | 557 | ||||||
EW Scripps Co. — Class A* | 69 | 553 | ||||||
Smith & Wesson Holding Corp.* | 123 | 536 | ||||||
Fuel Systems Solutions, Inc.* | 32 | 528 | ||||||
Movado Group, Inc. | 29 | 527 | ||||||
Libbey, Inc.* | 41 | 522 | ||||||
hhgregg, Inc.* | 35 | 506 | ||||||
Marcus Corp. | 40 | 504 | ||||||
Fisher Communications, Inc.* | 17 | 490 | ||||||
World Wrestling Entertainment, Inc. — Class A | 52 | 485 | ||||||
Stoneridge, Inc.* | 57 | 481 | ||||||
Leapfrog Enterprises, Inc.* | 84 | 470 | ||||||
Big 5 Sporting Goods Corp. | 44 | 459 | ||||||
PetMed Express, Inc. | 44 | 457 | ||||||
Winnebago Industries, Inc.* | 60 | 443 | ||||||
Haverty Furniture Companies, Inc. | 40 | 439 | ||||||
Shoe Carnival, Inc.* | 17 | 437 | ||||||
Central European Media Enterprises Ltd. — Class A* | 66 | 430 | ||||||
Kirkland’s, Inc.* | 32 | 426 | ||||||
Multimedia Games Holding Company, Inc.* | 53 | 421 | ||||||
Weyco Group, Inc. | 17 | 417 | ||||||
Speedway Motorsports, Inc. | 26 | 399 | ||||||
REX American Resources Corp.* | 18 | 398 | ||||||
Exide Technologies* | 151 | 397 | ||||||
Systemax, Inc.* | 24 | 394 | ||||||
M/I Homes, Inc.* | 41 | 394 | ||||||
Beazer Homes USA, Inc.* | 156 | 387 | ||||||
West Marine, Inc.* | 33 | 384 | ||||||
Journal Communications, Inc. — Class A* | 86 | 378 | ||||||
Conn’s, Inc.* | 33 | 366 | ||||||
Talbots, Inc.* | 136 | 362 | ||||||
Perry Ellis International, Inc.* | 25 | 355 | ||||||
Stein Mart, Inc.* | 52 | 354 | ||||||
Mac-Gray Corp. | 25 | 345 | ||||||
Cost Plus, Inc.* | 35 | 341 | ||||||
Blyth, Inc. | 6 | 341 | ||||||
| See Notes to Financial Statements. | THE RYDEX FUNDSANNUALREPORT | 89 |
| SCHEDULE OF INVESTMENTS (continued) | December 31, 2011 |
RUSSELL 2000® 2x STRATEGY FUND
| SHARES | VALUE | |||||||
Lincoln Educational Services Corp. | 43 | $ | 340 | |||||
Spartan Motors, Inc. | 70 | 337 | ||||||
Saga Communications, Inc. — Class A* | 9 | 336 | ||||||
Caribou Coffee Company, Inc.* | 24 | 335 | ||||||
Corinthian Colleges, Inc.* | 154 | 334 | ||||||
Ruth’s Hospitality Group, Inc.* | 67 | 333 | ||||||
Delta Apparel, Inc.* | 17 | 325 | ||||||
Destination Maternity Corp. | 19 | 318 | ||||||
Zagg, Inc.* | 44 | 311 | ||||||
VOXX International Corp.* | 36 | 304 | ||||||
Casual Male Retail Group, Inc.* | 87 | 298 | ||||||
Tuesday Morning Corp.* | 86 | 297 | ||||||
Entercom Communications Corp. — Class A* | 48 | 295 | ||||||
Town Sports International Holdings, Inc.* | 40 | 294 | ||||||
Carrols Restaurant Group, Inc.* | 25 | 289 | ||||||
Benihana, Inc.* | 28 | 286 | ||||||
Teavana Holdings, Inc.* | 15 | 282 | ||||||
CSS Industries, Inc. | 14 | 279 | ||||||
MarineMax, Inc.* | 42 | 274 | ||||||
McClatchy Co. — Class A* | 113 | 270 | ||||||
LIN TV Corp. — Class A* | 60 | 254 | ||||||
Morgans Hotel Group Co.* | 43 | 254 | ||||||
Build-A-Bear Workshop, Inc.* | 29 | 245 | ||||||
Rentrak Corp.* | 17 | 243 | ||||||
Francesca’s Holdings Corp.* | 14 | 242 | ||||||
Archipelago Learning, Inc.* | 25 | 242 | ||||||
Cumulus Media, Inc. — Class A* | 72 | 240 | ||||||
Citi Trends, Inc.* | 27 | 237 | ||||||
Martha Stewart Living Omnimedia | 52 | 229 | ||||||
Steinway Musical Instruments, Inc.* | 9 | 225 | ||||||
Zale Corp.* | 59 | 225 | ||||||
Unifi, Inc.* | 28 | 213 | ||||||
Nexstar Broadcasting Group, Inc.* | 27 | 212 | ||||||
Cherokee, Inc. | 18 | 210 | ||||||
McCormick & Schmick’s Seafood Restaurants, Inc.* | 24 | 210 | ||||||
Outdoor Channel Holdings, Inc. | 28 | 209 | ||||||
Lifetime Brands, Inc. | 17 | 206 | ||||||
RG Barry Corp. | 17 | 205 | ||||||
Overstock.com, Inc.* | 26 | 204 | ||||||
Red Lion Hotels Corp.* | 28 | 194 | ||||||
O’Charleys, Inc.* | 35 | 192 | ||||||
Skullcandy, Inc.* | 15 | 188 | ||||||
Motorcar Parts of America, Inc.* | 25 | 188 | ||||||
Summer Infant, Inc.* | 26 | 183 | ||||||
Black Diamond, Inc.* | 24 | 179 | ||||||
Hovnanian Enterprises, Inc. — Class A* | 122 | 177 | ||||||
Jamba, Inc.* | 133 | 174 | ||||||
Monarch Casino & Resort, Inc.* | 17 | 173 | ||||||
Kenneth Cole Productions, Inc. — Class A* | 16 | 169 | ||||||
Isle of Capri Casinos, Inc.* | 36 | 168 | ||||||
AH Belo Corp. — Class A | 35 | 166 | ||||||
Sealy Corp.* | 96 | 165 | ||||||
Gray Television, Inc.* | 101 | 164 | ||||||
Pacific Sunwear of California, Inc.* | 94 | 161 | ||||||
Entravision Communications Corp. | 102 | 159 | ||||||
Einstein Noah Restaurant Group, Inc. | 10 | 158 | ||||||
Luby’s, Inc.* | 35 | 158 | ||||||
Christopher & Banks Corp. | 67 | 157 | ||||||
K-Swiss, Inc.* | 51 | 149 | ||||||
Orbitz Worldwide, Inc.* | 39 | 147 | ||||||
Ambassadors Group, Inc. | 32 | 144 | ||||||
Coldwater Creek, Inc.* | 122 | 144 | ||||||
Valuevision Media, Inc. — Class A* | 76 | 143 | ||||||
Amerigon, Inc.* | 10 | 143 | ||||||
New York & Company, Inc.* | 51 | 136 | ||||||
National American University Holdings, Inc. | 17 | 129 | ||||||
Global Sources Ltd.* | 26 | 126 | ||||||
Geeknet, Inc.* | 7 | 119 | ||||||
US Auto Parts Network, Inc.* | 27 | 118 | ||||||
ReachLocal, Inc.* | 19 | 117 | ||||||
1-800-Flowers.com, Inc. — Class A* | 51 | 112 | ||||||
Johnson Outdoors, Inc.* | 7 | 107 | ||||||
Furniture Brands International, Inc.* | 85 | 105 | ||||||
Eastman Kodak Co.* | 160 | 104 | ||||||
Cambium Learning Group, Inc.* | 33 | 100 | ||||||
Tower International, Inc.* | 9 | 97 | ||||||
Marine Products Corp.* | 19 | 94 | ||||||
Bon-Ton Stores, Inc. | 25 | 84 | ||||||
School Specialty, Inc.* | 33 | 83 | ||||||
Crown Media Holdings, Inc. — Class A* | 68 | 82 | ||||||
Skyline Corp. | 18 | 78 | ||||||
Gordmans Stores, Inc.* | 5 | 63 | ||||||
Shiloh Industries, Inc.* | 6 | 50 | ||||||
Dial Global, Inc.* | 6 | 19 | ||||||
|
| |||||||
Total Consumer Discretionary |
| 284,452 | ||||||
|
| |||||||
HEALTH CARE - 4.1% | ||||||||
Healthspring, Inc.* | 139 | 7,581 | ||||||
Salix Pharmaceuticals Ltd.* | 120 | 5,742 | ||||||
Onyx Pharmaceuticals, Inc.* | 125 | 5,494 | ||||||
HMS Holdings Corp.* | 167 | 5,341 | ||||||
WellCare Health Plans, Inc.* | 87 | 4,567 | ||||||
Cubist Pharmaceuticals, Inc.* | 115 | 4,556 | ||||||
Cepheid, Inc.* | 127 | 4,370 | ||||||
Questcor Pharmaceuticals, Inc.* | 104 | 4,324 | ||||||
| 90 | THE RYDEX FUNDSANNUALREPORT | See Notes to Financial Statements. |
| SCHEDULE OF INVESTMENTS (continued) | December 31, 2011 |
RUSSELL 2000® 2x STRATEGY FUND
| SHARES | VALUE | |||||||
Medicis Pharmaceutical Corp. — Class A | 127 | $ | 4,223 | |||||
Centene Corp.* | 102 | 4,038 | ||||||
Viropharma, Inc.* | 137 | 3,752 | ||||||
STERIS Corp. | 117 | 3,489 | ||||||
Owens & Minor, Inc. | 124 | 3,446 | ||||||
HealthSouth Corp.* | 185 | 3,269 | ||||||
Seattle Genetics, Inc.* | 195 | 3,259 | ||||||
athenahealth, Inc.* | 66 | 3,242 | ||||||
Ariad Pharmaceuticals, Inc.* | 263 | 3,222 | ||||||
Alkermes plc* | 185 | 3,212 | ||||||
Haemonetics Corp.* | 52 | 3,183 | ||||||
Theravance, Inc.* | 136 | 3,006 | ||||||
Magellan Health Services, Inc.* | 59 | 2,919 | ||||||
Align Technology, Inc.* | 120 | 2,847 | ||||||
Quality Systems, Inc. | 75 | 2,774 | ||||||
Medivation, Inc.* | 59 | 2,720 | ||||||
Zoll Medical Corp.* | 43 | 2,717 | ||||||
Incyte Corporation Ltd.* | 179 | 2,687 | ||||||
West Pharmaceutical Services, Inc. | 67 | 2,543 | ||||||
Impax Laboratories, Inc.* | 126 | 2,541 | ||||||
PAREXEL International Corp.* | 119 | 2,468 | ||||||
Volcano Corp.* | 99 | 2,355 | ||||||
Chemed Corp. | 44 | 2,253 | ||||||
Par Pharmaceutical Companies, Inc.* | 67 | 2,193 | ||||||
Medicines Co.* | 109 | 2,032 | ||||||
Air Methods Corp.* | 24 | 2,027 | ||||||
Cyberonics, Inc.* | 59 | 1,977 | ||||||
Masimo Corp.* | 105 | 1,962 | ||||||
Auxilium Pharmaceuticals, Inc.* | 93 | 1,853 | ||||||
Insulet Corp.* | 95 | 1,789 | ||||||
Acorda Therapeutics, Inc.* | 75 | 1,788 | ||||||
PDL BioPharma, Inc. | 281 | 1,742 | ||||||
Vivus, Inc.* | 177 | 1,726 | ||||||
Immunogen, Inc.* | 149 | 1,725 | ||||||
HeartWare International, Inc.* | 25 | 1,725 | ||||||
Accretive Health, Inc.* | 74 | 1,701 | ||||||
Jazz Pharmaceuticals, Inc.* | 43 | 1,661 | ||||||
MWI Veterinary Supply, Inc.* | 25 | 1,661 | ||||||
Meridian Bioscience, Inc. | 88 | 1,658 | ||||||
NxStage Medical, Inc.* | 93 | 1,654 | ||||||
Momenta Pharmaceuticals, Inc.* | 95 | 1,652 | ||||||
Arthrocare Corp.* | 52 | 1,647 | ||||||
MAKO Surgical Corp.* | 65 | 1,639 | ||||||
Luminex Corp.* | 77 | 1,635 | ||||||
Amsurg Corp.* | 60 | 1,562 | ||||||
Halozyme Therapeutics, Inc.* | 162 | 1,541 | ||||||
IPC The Hospitalist Company, Inc.* | 33 | 1,509 | ||||||
CONMED Corp.* | 57 | 1,463 | ||||||
Isis Pharmaceuticals, Inc.* | 202 | 1,456 | ||||||
Spectrum Pharmaceuticals, Inc.* | 98 | 1,434 | ||||||
Analogic Corp. | 25 | 1,433 | ||||||
SonoSite, Inc.* | 26 | 1,400 | ||||||
Pharmacyclics, Inc.* | 94 | 1,393 | ||||||
Inhibitex, Inc.* | 123 | 1,346 | ||||||
InterMune, Inc.* | 106 | 1,336 | ||||||
Neogen Corp.* | 42 | 1,287 | ||||||
Nektar Therapeutics* | 228 | 1,276 | ||||||
Hanger Orthopedic Group, Inc.* | 68 | 1,271 | ||||||
Micromet, Inc.* | 176 | 1,265 | ||||||
Wright Medical Group, Inc.* | 75 | 1,237 | ||||||
Integra LifeSciences Holdings Corp.* | 40 | 1,233 | ||||||
DexCom, Inc.* | 132 | 1,229 | ||||||
Ironwood Pharmaceuticals, Inc.* | 102 | 1,221 | ||||||
Exelixis, Inc.* | 257 | 1,217 | ||||||
Molina Healthcare, Inc.* | 54 | 1,206 | ||||||
Orthofix International N.V.* | 34 | 1,198 | ||||||
Akorn, Inc.* | 107 | 1,190 | ||||||
Abaxis, Inc.* | 43 | 1,190 | ||||||
Kindred Healthcare, Inc.* | 100 | 1,177 | ||||||
Computer Programs & Systems, Inc. | 23 | 1,176 | ||||||
ICU Medical, Inc.* | 26 | 1,170 | ||||||
Optimer Pharmaceuticals, Inc.* | 95 | 1,163 | ||||||
Omnicell, Inc.* | 70 | 1,156 | ||||||
Merit Medical Systems, Inc.* | 85 | 1,137 | ||||||
NPS Pharmaceuticals, Inc.* | 169 | 1,114 | ||||||
Team Health Holdings, Inc.* | 50 | 1,103 | ||||||
Endologix, Inc.* | 96 | 1,102 | ||||||
ABIOMED, Inc.* | 59 | 1,090 | ||||||
Rigel Pharmaceuticals, Inc.* | 138 | 1,089 | ||||||
Opko Health, Inc.* | 221 | 1,083 | ||||||
Emeritus Corp.* | 61 | 1,068 | ||||||
AVEO Pharmaceuticals, Inc.* | 61 | 1,049 | ||||||
National Healthcare Corp. | 24 | 1,006 | ||||||
Landauer, Inc. | 19 | 979 | ||||||
Medidata Solutions, Inc.* | 44 | 957 | ||||||
Greatbatch, Inc.* | 43 | 950 | ||||||
NuVasive, Inc.* | 75 | 944 | ||||||
PharMerica Corp.* | 59 | 896 | ||||||
Invacare Corp. | 58 | 887 | ||||||
Quidel Corp.* | 58 | 878 | ||||||
Neurocrine Biosciences, Inc.* | 102 | 867 | ||||||
OraSure Technologies, Inc.* | 95 | 865 | ||||||
MedAssets, Inc.* | 93 | 860 | ||||||
Sequenom, Inc.* | 193 | 859 | ||||||
AMAG Pharmaceuticals, Inc.* | 44 | 832 | ||||||
Dynavax Technologies Corp.* | 246 | 817 | ||||||
Genomic Health, Inc.* | 32 | 812 | ||||||
Idenix Pharmaceuticals, Inc.* | 108 | 804 | ||||||
Bio-Reference Labs, Inc.* | 49 | 797 | ||||||
Exact Sciences Corp.* | 98 | 796 | ||||||
Conceptus, Inc.* | 61 | 771 | ||||||
Triple-S Management Corp.* | 38 | 761 | ||||||
Emergent Biosolutions, Inc.* | 45 | 758 | ||||||
Universal American Corp. | 59 | 750 | ||||||
Hi-Tech Pharmacal Company, Inc.* | 19 | 739 | ||||||
Ensign Group, Inc. | 30 | 735 | ||||||
Sunrise Senior Living, Inc.* | 113 | 732 | ||||||
| See Notes to Financial Statements. | THE RYDEX FUNDSANNUALREPORT | 91 |
| SCHEDULE OF INVESTMENTS (continued) | December 31, 2011 |
RUSSELL 2000® 2x STRATEGY FUND
| SHARES | VALUE | |||||||
Curis, Inc.* | 156 | $ | 730 | |||||
PSS World Medical, Inc.* | 30 | 726 | ||||||
Select Medical Holdings Corp.* | 84 | 712 | ||||||
AngioDynamics, Inc.* | 48 | 711 | ||||||
Staar Surgical Co.* | 67 | 703 | ||||||
Achillion Pharmaceuticals, Inc.* | 91 | 693 | ||||||
Cantel Medical Corp. | 24 | 670 | ||||||
Metropolitan Health Networks, Inc.* | 88 | 657 | ||||||
Amedisys, Inc.* | 60 | 655 | ||||||
Alnylam Pharmaceuticals, Inc.* | 79 | 644 | ||||||
American Dental Partners, Inc.* | 34 | 640 | ||||||
Synovis Life Technologies, Inc.* | 23 | 640 | ||||||
HealthStream, Inc.* | 34 | 627 | ||||||
Vical, Inc.* | 142 | 626 | ||||||
Assisted Living Concepts, Inc. — Class A | 42 | 625 | ||||||
Arqule, Inc.* | 104 | 587 | ||||||
Vanguard Health Systems, Inc.* | 57 | 583 | ||||||
Accuray, Inc.* | 137 | 580 | ||||||
MAP Pharmaceuticals, Inc.* | 44 | 579 | ||||||
MedQuist Holdings, Inc.* | 59 | 568 | ||||||
Symmetry Medical, Inc.* | 71 | 567 | ||||||
Depomed, Inc.* | 109 | 565 | ||||||
Raptor Pharmaceutical Corp.* | 89 | 557 | ||||||
Affymetrix, Inc.* | 135 | 552 | ||||||
Arena Pharmaceuticals, Inc.* | 292 | 546 | ||||||
Ardea Biosciences, Inc.* | 32 | 538 | ||||||
Enzon Pharmaceuticals, Inc.* | 80 | 536 | ||||||
Chelsea Therapeutics International Ltd.* | 104 | 534 | ||||||
ZIOPHARM Oncology, Inc.* | 120 | 529 | ||||||
Natus Medical, Inc.* | 56 | 528 | ||||||
Corvel Corp.* | 10 | 517 | ||||||
AVANIR Pharmaceuticals, Inc. — Class A* | 252 | 517 | ||||||
US Physical Therapy, Inc. | 26 | 512 | ||||||
ExamWorks Group, Inc.* | 53 | 502 | ||||||
Merge Healthcare, Inc.* | 101 | 490 | ||||||
Progenics Pharmaceuticals, Inc.* | 57 | 487 | ||||||
Ligand Pharmaceuticals, Inc. — Class B* | 41 | 487 | ||||||
RTI Biologics, Inc.* | 109 | 484 | ||||||
Spectranetics Corp.* | 65 | 469 | ||||||
Healthways, Inc.* | 67 | 460 | ||||||
SurModics, Inc.* | 31 | 454 | ||||||
Cambrex Corp.* | 62 | 445 | ||||||
Cell Therapeutics, Inc.* | 382 | 443 | ||||||
Lexicon Pharmaceuticals, Inc.* | 341 | 440 | ||||||
Affymax, Inc.* | 66 | 436 | ||||||
eResearchTechnology, Inc.* | 92 | 431 | ||||||
Immunomedics, Inc.* | 128 | 426 | ||||||
LHC Group, Inc.* | 33 | 423 | ||||||
ISTA Pharmaceuticals, Inc.* | 59 | 416 | ||||||
Capital Senior Living Corp.* | 52 | 413 | ||||||
BioScrip, Inc.* | 74 | 404 | ||||||
Transcend Services, Inc.* | 17 | 403 | ||||||
Gentiva Health Services, Inc.* | 59 | 398 | ||||||
Antares Pharma, Inc.* | 178 | 392 | ||||||
Solta Medical, Inc.* | 120 | 377 | ||||||
Geron Corp.* | 252 | 373 | ||||||
Columbia Laboratories, Inc.* | 146 | 365 | ||||||
Santarus, Inc.* | 109 | 361 | ||||||
Vascular Solutions, Inc.* | 32 | 356 | ||||||
Infinity Pharmaceuticals, Inc.* | 40 | 354 | ||||||
Maxygen, Inc.* | 62 | 349 | ||||||
Keryx Biopharmaceuticals, Inc.* | 137 | 347 | ||||||
Kensey Nash Corp.* | 18 | 345 | ||||||
Tornier N.V.* | 19 | 342 | ||||||
IRIS International, Inc.* | 36 | 337 | ||||||
Obagi Medical Products, Inc.* | 33 | 335 | ||||||
Nymox Pharmaceutical Corp.* | 40 | 329 | ||||||
Synergetics USA, Inc.* | 44 | 325 | ||||||
Savient Pharmaceuticals, Inc.* | 143 | 319 | ||||||
Metabolix, Inc.* | 70 | 318 | ||||||
AtriCure, Inc.* | 28 | 311 | ||||||
Palomar Medical Technologies, Inc.* | 33 | 307 | ||||||
Corcept Therapeutics, Inc.* | 88 | 301 | ||||||
Almost Family, Inc.* | 18 | 298 | ||||||
Exactech, Inc.* | 18 | 296 | ||||||
Cadence Pharmaceuticals, Inc.* | 75 | 296 | ||||||
Sciclone Pharmaceuticals, Inc.* | 69 | 296 | ||||||
Pain Therapeutics, Inc.* | 77 | 293 | ||||||
Cross Country Healthcare, Inc.* | 52 | 289 | ||||||
Targacept, Inc.* | 51 | 284 | ||||||
Sangamo Biosciences, Inc.* | 100 | 284 | ||||||
Vanda Pharmaceuticals, Inc.* | 59 | 281 | ||||||
Rockwell Medical Technologies, Inc.* | 33 | 280 | ||||||
Delcath Systems, Inc.* | 91 | 278 | ||||||
Anthera Pharmaceuticals, Inc.* | 45 | 276 | ||||||
Furiex Pharmaceuticals, Inc.* | 16 | 267 | ||||||
Biotime, Inc.* | 46 | 267 | ||||||
Cardiovascular Systems, Inc.* | 27 | 266 | ||||||
Dyax Corp.* | 195 | 265 | ||||||
XenoPort, Inc.* | 67 | 255 | ||||||
Five Star Quality Care, Inc.* | 85 | 255 | ||||||
Cerus Corp.* | 91 | 255 | ||||||
Codexis, Inc.* | 48 | 254 | ||||||
Array Biopharma, Inc.* | 116 | 251 | ||||||
CryoLife, Inc.* | 52 | 250 | ||||||
Hansen Medical, Inc.* | 93 | 240 | ||||||
Novavax, Inc.* | 190 | 239 | ||||||
Oncothyreon, Inc.* | 30 | 227 | ||||||
Skilled Healthcare Group, Inc. — Class A* | 41 | 224 | ||||||
Chindex International, Inc.* | 26 | 222 | ||||||
Aegerion Pharmaceuticals, Inc.* | 13 | 218 | ||||||
Allos Therapeutics, Inc.* | 152 | 216 | ||||||
Celldex Therapeutics, Inc.* | 83 | 216 | ||||||
Medtox Scientific, Inc.* | 15 | 211 | ||||||
Dusa Pharmaceuticals, Inc.* | 48 | 210 | ||||||
| 92 | THE RYDEX FUNDSANNUALREPORT | See Notes to Financial Statements. |
| SCHEDULE OF INVESTMENTS (continued) | December 31, 2011 |
RUSSELL 2000® 2x STRATEGY FUND
| SHARES | VALUE | |||||||
Pozen, Inc.* | 53 | $ | 209 | |||||
AVI BioPharma, Inc.* | 273 | 203 | ||||||
Cytori Therapeutics, Inc.* | 92 | 202 | ||||||
Astex Pharmaceuticals* | 107 | 202 | ||||||
Cynosure, Inc.* | 17 | 200 | ||||||
Synta Pharmaceuticals Corp.* | 42 | 196 | ||||||
Pacific Biosciences of California, Inc.* | 70 | 196 | ||||||
Sun Healthcare Group, Inc.* | 50 | 194 | ||||||
Durect Corp.* | 163 | 192 | ||||||
Alphatec Holdings, Inc.* | 110 | 189 | ||||||
Sagent Pharmaceuticals, Inc.* | 9 | 189 | ||||||
Zalicus, Inc.* | 144 | 174 | ||||||
SIGA Technologies, Inc.* | 69 | 174 | ||||||
Medical Action Industries, Inc.* | 33 | 173 | ||||||
Uroplasty, Inc.* | 40 | 170 | ||||||
Harvard Bioscience, Inc.* | 43 | 166 | ||||||
Peregrine Pharmaceuticals, Inc.* | 160 | 165 | ||||||
Enzo Biochem, Inc.* | 73 | 164 | ||||||
Osiris Therapeutics, Inc.* | 30 | 160 | ||||||
Cleveland Biolabs, Inc.* | 56 | 160 | ||||||
Nabi Biopharmaceuticals* | 84 | 158 | ||||||
BioCryst Pharmaceuticals, Inc.* | 62 | 153 | ||||||
Insmed, Inc.* | 50 | 152 | ||||||
Young Innovations, Inc. | 5 | 148 | ||||||
GTx, Inc.* | 44 | 148 | ||||||
Lannett Company, Inc.* | 33 | 146 | ||||||
KV Pharmaceutical Co. — Class A* | 101 | 141 | ||||||
Providence Service Corp.* | 10 | 138 | ||||||
MannKind Corp.* | 54 | 135 | ||||||
Navidea Biopharmaceuticals, Inc.* | 50 | 131 | ||||||
RadNet, Inc.* | 61 | 130 | ||||||
Albany Molecular Research, Inc.* | 44 | 129 | ||||||
Bacterin International Holdings, Inc.* | 43 | 123 | ||||||
Endocyte, Inc.* | 32 | 120 | ||||||
Fluidigm Corp.* | 9 | 118 | ||||||
Anacor Pharmaceuticals, Inc.* | 19 | 118 | ||||||
OncoGenex Pharmaceutical, Inc.* | 10 | 117 | ||||||
Biospecifics Technologies Corp.* | 7 | 116 | ||||||
CardioNet, Inc.* | 48 | 114 | ||||||
Amicus Therapeutics, Inc.* | 33 | 114 | ||||||
Sucampo Pharmaceuticals, Inc. — Class A* | 25 | 111 | ||||||
Biosante Pharmaceuticals, Inc.* | 216 | 108 | ||||||
Trius Therapeutics, Inc.* | 14 | 100 | ||||||
BioMimetic Therapeutics, Inc.* | 35 | 100 | ||||||
Orexigen Therapeutics, Inc.* | 59 | 95 | ||||||
AMN Healthcare Services, Inc.* | 20 | 89 | ||||||
Unilife Corp.* | 28 | 87 | ||||||
Cornerstone Therapeutics, Inc.* | 15 | 84 | ||||||
BG Medicine, Inc.* | 16 | 76 | ||||||
Pernix Therapeutics Holdings* | 8 | 74 | ||||||
Sunesis Pharmaceuticals, Inc.* | 59 | 69 | ||||||
Stereotaxis, Inc.* | 83 | 68 | ||||||
Acura Pharmaceuticals, Inc.* | 18 | 63 | ||||||
DynaVox, Inc. — Class A* | 17 | 62 | ||||||
Pacira Pharmaceuticals, Inc.* | 7 | 61 | ||||||
Alliance HealthCare Services, Inc.* | 48 | 60 | ||||||
Complete Genomics, Inc.* | 19 | 56 | ||||||
Biolase Technology, Inc.* | 21 | 54 | ||||||
Transcept Pharmaceuticals, Inc.* | 6 | 47 | ||||||
Ampio Pharmaceuticals, Inc.* | 10 | 43 | ||||||
Alimera Sciences, Inc.* | 27 | 34 | ||||||
PharmAthene, Inc.* | 20 | 25 | ||||||
Zogenix, Inc.* | 10 | 22 | ||||||
Neostem, Inc.* | 17 | 9 | ||||||
|
| |||||||
Total Health Care | 270,100 | |||||||
|
| |||||||
ENERGY - 2.2% | ||||||||
World Fuel Services Corp. | 135 | 5,667 | ||||||
Complete Production Services, Inc.* | 153 | 5,135 | ||||||
Rosetta Resources, Inc.* | 110 | 4,785 | ||||||
Energy XXI Bermuda Ltd.* | 149 | 4,750 | ||||||
Dril-Quip, Inc.* | 69 | 4,542 | ||||||
Berry Petroleum Co. — Class A | 101 | 4,244 | ||||||
Lufkin Industries, Inc. | 61 | 4,106 | ||||||
Kodiak Oil & Gas Corp.* | 410 | 3,895 | ||||||
Key Energy Services, Inc.* | 246 | 3,806 | ||||||
Golar LNG Ltd. | 78 | 3,467 | ||||||
Oasis Petroleum, Inc.* | 119 | 3,462 | ||||||
Bristow Group, Inc. | 72 | 3,412 | ||||||
Helix Energy Solutions Group, Inc.* | 210 | 3,318 | ||||||
Bill Barrett Corp.* | 92 | 3,134 | ||||||
CVR Energy, Inc.* | 167 | 3,128 | ||||||
Northern Oil and Gas, Inc.* | 124 | 2,974 | ||||||
McMoRan Exploration Co.* | 194 | 2,823 | ||||||
Stone Energy Corp.* | 100 | 2,638 | ||||||
Swift Energy Co.* | 87 | 2,586 | ||||||
Gulfport Energy Corp.* | 86 | 2,533 | ||||||
Cloud Peak Energy, Inc.* | 122 | 2,357 | ||||||
SemGroup Corp. — Class A* | 88 | 2,293 | ||||||
Carrizo Oil & Gas, Inc.* | 72 | 1,897 | ||||||
Gulfmark Offshore, Inc. — Class A* | 41 | 1,722 | ||||||
Newpark Resources, Inc.* | 179 | 1,701 | ||||||
Parker Drilling Co.* | 231 | 1,656 | ||||||
ION Geophysical Corp.* | 265 | 1,624 | ||||||
Patriot Coal Corp.* | 181 | 1,533 | ||||||
Contango Oil & Gas Co.* | 26 | 1,513 | ||||||
Petroleum Development Corp.* | 42 | 1,475 | ||||||
W&T Offshore, Inc. | 68 | 1,442 | ||||||
Tetra Technologies, Inc.* | 154 | 1,438 | ||||||
Comstock Resources, Inc.* | 93 | 1,423 | ||||||
Western Refining, Inc.* | 103 | 1,369 | ||||||
Cheniere Energy, Inc.* | 156 | 1,356 | ||||||
Targa Resources Corp. | 33 | 1,343 | ||||||
Hornbeck Offshore Services, Inc.* | 43 | 1,334 | ||||||
Apco Oil and Gas International, Inc. | 16 | 1,308 | ||||||
| See Notes to Financial Statements. | THE RYDEX FUNDSANNUALREPORT | 93 |
| SCHEDULE OF INVESTMENTS (continued) | December 31, 2011 |
RUSSELL 2000® 2x STRATEGY FUND
| SHARES | VALUE | |||||||
Clean Energy Fuels Corp.* | 103 | $ | 1,283 | |||||
Approach Resources, Inc.* | 43 | 1,265 | ||||||
GeoResources, Inc.* | 41 | 1,202 | ||||||
Magnum Hunter Resources Corp.* | 222 | 1,197 | ||||||
Pioneer Drilling Co.* | 119 | 1,152 | ||||||
Exterran Holdings, Inc.* | 125 | 1,138 | ||||||
Nordic American Tankers Ltd. | 90 | 1,079 | ||||||
Hercules Offshore, Inc.* | 230 | 1,021 | ||||||
Rex Energy Corp.* | 69 | 1,018 | ||||||
Resolute Energy Corp.* | 94 | 1,015 | ||||||
Crosstex Energy, Inc. | 78 | 986 | ||||||
Basic Energy Services, Inc.* | 48 | 946 | ||||||
Energy Partners Ltd.* | 58 | 847 | ||||||
Gulf Island Fabrication, Inc. | 28 | 818 | ||||||
Ship Finance International Ltd. | 84 | 785 | ||||||
Tesco Corp.* | 62 | 784 | ||||||
Hyperdynamics Corp.* | 309 | 757 | ||||||
Petroquest Energy, Inc.* | 108 | 713 | ||||||
Goodrich Petroleum Corp.* | 51 | 700 | ||||||
Endeavour International Corp.* | 73 | 634 | ||||||
PHI, Inc.* | 25 | 621 | ||||||
Vaalco Energy, Inc.* | 101 | 610 | ||||||
Knightsbridge Tankers Ltd. | 44 | 601 | ||||||
Panhandle Oil and Gas, Inc. — Class A | 18 | 591 | ||||||
Overseas Shipholding Group, Inc. | 53 | 579 | ||||||
Rentech, Inc.* | 439 | 575 | ||||||
BPZ Resources, Inc.* | 201 | 571 | ||||||
Mitcham Industries, Inc.* | 26 | 568 | ||||||
Dawson Geophysical Co.* | 14 | 553 | ||||||
OYO Geospace Corp.* | 7 | 541 | ||||||
Abraxas Petroleum Corp.* | 162 | 535 | ||||||
Triangle Petroleum Corp.* | 86 | 513 | ||||||
Harvest Natural Resources, Inc.* | 69 | 509 | ||||||
Penn Virginia Corp. | 95 | 503 | ||||||
Matrix Service Co.* | 53 | 500 | ||||||
FX Energy, Inc.* | 100 | 480 | ||||||
James River Coal Co.* | 68 | 471 | ||||||
Warren Resources, Inc.* | 142 | 463 | ||||||
C&J Energy Services, Inc.* | 22 | 460 | ||||||
Uranium Energy Corp.* | 142 | 435 | ||||||
Frontline Ltd. | 101 | 433 | ||||||
Cal Dive International, Inc.* | 186 | 418 | ||||||
Amyris, Inc.* | 36 | 415 | ||||||
Vantage Drilling Co.* | 350 | 406 | ||||||
Green Plains Renewable Energy, Inc.* | 40 | 390 | ||||||
Houston American Energy Corp.* | 32 | 390 | ||||||
Venoco, Inc.* | 57 | 386 | ||||||
Clayton Williams Energy, Inc.* | 5 | 379 | ||||||
Gastar Exploration Ltd.* | 119 | 378 | ||||||
Callon Petroleum Co.* | 75 | 373 | ||||||
Natural Gas Services Group, Inc.* | 23 | 333 | ||||||
Solazyme, Inc.* | 27 | 321 | ||||||
Delek US Holdings, Inc. | 28 | 319 | ||||||
Teekay Tankers Ltd. — Class A | 87 | 306 | ||||||
Willbros Group, Inc.* | 75 | 275 | ||||||
Evolution Petroleum Corp.* | 33 | 266 | ||||||
USEC, Inc.* | 228 | 260 | ||||||
Scorpio Tankers, Inc.* | 51 | 249 | ||||||
Global Geophysical Services, Inc.* | 36 | 242 | ||||||
Voyager Oil & Gas, Inc.* | 94 | 242 | ||||||
Uranerz Energy Corp.* | 125 | 228 | ||||||
Alon USA Energy, Inc. | 26 | 226 | ||||||
Westmoreland Coal Co.* | 16 | 204 | ||||||
ATP Oil & Gas Corp.* | 26 | 191 | ||||||
Ur-Energy, Inc.* | 206 | 177 | ||||||
Syntroleum Corp.* | 179 | 172 | ||||||
Union Drilling, Inc.* | 27 | 168 | ||||||
Miller Energy Resources, Inc.* | 60 | 167 | ||||||
GMX Resources, Inc.* | 116 | 145 | ||||||
Uranium Resources, Inc.* | 189 | 137 | ||||||
Zion Oil & Gas, Inc.* | 61 | 135 | ||||||
Crimson Exploration, Inc.* | 44 | 126 | ||||||
CAMAC Energy, Inc.* | 117 | 118 | ||||||
DHT Holdings, Inc. | 127 | 94 | ||||||
RigNet, Inc.* | 5 | 84 | ||||||
Hallador Energy Co. | 7 | 70 | ||||||
Gevo, Inc.* | 10 | 63 | ||||||
Geokinetics, Inc.* | 19 | 41 | ||||||
L&L Energy, Inc.* | 10 | 26 | ||||||
|
| |||||||
Total Energy | 142,561 | |||||||
|
| |||||||
MATERIALS - 1.5% | ||||||||
Coeur d’Alene Mines Corp.* | 178 | 4,297 | ||||||
Sensient Technologies Corp. | 99 | 3,752 | ||||||
Olin Corp. | 163 | 3,203 | ||||||
NewMarket Corp. | 15 | 2,972 | ||||||
Hecla Mining Co. | 552 | 2,887 | ||||||
Buckeye Technologies, Inc. | 75 | 2,508 | ||||||
Balchem Corp. | 56 | 2,270 | ||||||
HB Fuller Co. | 96 | 2,219 | ||||||
Stillwater Mining Co.* | 210 | 2,197 | ||||||
Schweitzer-Mauduit International, Inc. | 33 | 2,193 | ||||||
PolyOne Corp. | 187 | 2,160 | ||||||
Eagle Materials, Inc. | 84 | 2,155 | ||||||
Chemtura Corp.* | 190 | 2,155 | ||||||
Innophos Holdings, Inc. | 44 | 2,137 | ||||||
Louisiana-Pacific Corp.* | 264 | 2,130 | ||||||
Thompson Creek Metals Company, Inc.* | 301 | 2,095 | ||||||
Minerals Technologies, Inc. | 36 | 2,035 | ||||||
Worthington Industries, Inc. | 113 | 1,851 | ||||||
Calgon Carbon Corp.* | 112 | 1,760 | ||||||
Clearwater Paper Corp.* | 49 | 1,745 | ||||||
Globe Specialty Metals, Inc. | 127 | 1,701 | ||||||
Kaiser Aluminum Corp. | 33 | 1,514 | ||||||
Boise, Inc. | 206 | 1,467 | ||||||
| 94 | THE RYDEX FUNDSANNUALREPORT | See Notes to Financial Statements. |
| SCHEDULE OF INVESTMENTS (continued) | December 31, 2011 |
RUSSELL 2000® 2x STRATEGY FUND
| SHARES | VALUE | |||||||
RTI International Metals, Inc.* | 62 | $ | 1,439 | |||||
Georgia Gulf Corp.* | 70 | 1,364 | ||||||
Graphic Packaging Holding Co.* | 316 | 1,346 | ||||||
OM Group, Inc.* | 60 | 1,343 | ||||||
Koppers Holdings, Inc. | 39 | 1,340 | ||||||
Kraton Performance Polymers, Inc.* | 65 | 1,320 | ||||||
Texas Industries, Inc. | 42 | 1,293 | ||||||
AMCOL International Corp. | 48 | 1,289 | ||||||
PH Glatfelter Co. | 91 | 1,285 | ||||||
Haynes International, Inc. | 23 | 1,256 | ||||||
Gold Resource Corp. | 59 | 1,254 | ||||||
A. Schulman, Inc. | 59 | 1,250 | ||||||
KapStone Paper and Packaging Corp.* | 75 | 1,181 | ||||||
Innospec, Inc.* | 41 | 1,151 | ||||||
Deltic Timber Corp. | 19 | 1,147 | ||||||
Stepan Co. | 14 | 1,122 | ||||||
Jaguar Mining, Inc.* | 168 | 1,072 | ||||||
Tredegar Corp. | 48 | 1,066 | ||||||
Flotek Industries, Inc.* | 102 | 1,016 | ||||||
LSB Industries, Inc.* | 33 | 925 | ||||||
Quaker Chemical Corp. | 23 | 894 | ||||||
Materion Corp.* | 36 | 874 | ||||||
Century Aluminum Co.* | 101 | 860 | ||||||
Golden Star Resources Ltd.* | 510 | 842 | ||||||
Ferro Corp.* | 169 | 826 | ||||||
Wausau Paper Corp. | 100 | 826 | ||||||
Horsehead Holding Corp.* | 83 | 748 | ||||||
Myers Industries, Inc. | 59 | 728 | ||||||
US Gold Corp.* | 212 | 712 | ||||||
Universal Stainless & Alloy* | 18 | 672 | ||||||
Hawkins, Inc. | 17 | 627 | ||||||
Neenah Paper, Inc. | 27 | 603 | ||||||
American Vanguard Corp. | 44 | 587 | ||||||
TPC Group, Inc.* | 24 | 560 | ||||||
Zep, Inc. | 40 | 559 | ||||||
Paramount Gold and Silver Corp.* | 230 | 492 | ||||||
Vista Gold Corp.* | 143 | 439 | ||||||
FutureFuel Corp. | 35 | 435 | ||||||
Zoltek Companies, Inc.* | 55 | 419 | ||||||
General Moly, Inc.* | 132 | 408 | ||||||
Omnova Solutions, Inc.* | 84 | 387 | ||||||
Midway Gold Corp.* | 170 | 359 | ||||||
Noranda Aluminum Holding Corp. | 43 | 355 | ||||||
Olympic Steel, Inc. | 15 | 350 | ||||||
AM Castle & Co.* | 32 | 303 | ||||||
Golden Minerals Co.* | 52 | 302 | ||||||
KMG Chemicals, Inc. | 17 | 294 | ||||||
Metals USA Holdings Corp.* | 26 | 292 | ||||||
Spartech Corp.* | 61 | 289 | ||||||
Headwaters, Inc.* | 126 | 280 | ||||||
Landec Corp.* | 49 | 270 | ||||||
SunCoke Energy, Inc.* | 24 | 269 | ||||||
Senomyx, Inc.* | 75 | 261 | ||||||
Revett Minerals, Inc.* | 50 | 236 | ||||||
AEP Industries, Inc.* | 8 | 225 | ||||||
US Energy Corp.* | 48 | 140 | ||||||
Chase Corp. | 9 | 125 | ||||||
Handy & Harman Ltd.* | 5 | 49 | ||||||
Verso Paper Corp.* | 27 | 26 | ||||||
|
| |||||||
Total Materials | 95,785 | |||||||
|
| |||||||
UTILITIES - 1.2% | ||||||||
Piedmont Natural Gas Company, Inc. | 142 | 4,825 | ||||||
Cleco Corp. | 119 | 4,534 | ||||||
WGL Holdings, Inc. | 101 | 4,466 | ||||||
New Jersey Resources Corp. | 88 | 4,330 | ||||||
IDACORP, Inc. | 101 | 4,283 | ||||||
Southwest Gas Corp. | 95 | 4,037 | ||||||
Portland General Electric Co. | 152 | 3,844 | ||||||
UIL Holdings Corp. | 102 | 3,608 | ||||||
South Jersey Industries, Inc. | 58 | 3,295 | ||||||
PNM Resources, Inc. | 168 | 3,063 | ||||||
Unisource Energy Corp. | 79 | 2,917 | ||||||
El Paso Electric Co. | 84 | 2,910 | ||||||
Avista Corp. | 113 | 2,910 | ||||||
Northwest Natural Gas Co. | 53 | 2,540 | ||||||
Black Hills Corp. | 75 | 2,519 | ||||||
Allete, Inc. | 58 | 2,435 | ||||||
NorthWestern Corp. | 67 | 2,398 | ||||||
MGE Energy, Inc. | 43 | 2,011 | ||||||
Atlantic Power Corp. | 138 | 1,973 | ||||||
CH Energy Group, Inc. | 32 | 1,868 | ||||||
Empire District Electric Co. | 85 | 1,793 | ||||||
Laclede Group, Inc. | 42 | 1,700 | ||||||
California Water Service Group | 85 | 1,552 | ||||||
Otter Tail Corp. | 67 | 1,475 | ||||||
American States Water Co. | 39 | 1,361 | ||||||
Central Vermont Public Service Corp. | 28 | 983 | ||||||
Chesapeake Utilities Corp. | 17 | 737 | ||||||
SJW Corp. | 28 | 662 | ||||||
Ormat Technologies, Inc. | 36 | 649 | ||||||
Middlesex Water Co. | 34 | 634 | ||||||
Dynegy, Inc.* | 202 | 560 | ||||||
Unitil Corp. | 19 | 539 | ||||||
Connecticut Water Service, Inc. | 17 | 461 | ||||||
York Water Co. | 25 | 441 | ||||||
Cadiz, Inc.* | 25 | 241 | ||||||
Consolidated Water Company Ltd. | 27 | 232 | ||||||
Genie Energy Ltd. — Class B | 28 | 222 | ||||||
Pennichuck Corp. | 7 | 202 | ||||||
Artesian Resources Corp. — Class A | 9 | 169 | ||||||
|
| |||||||
Total Utilities | 79,379 | |||||||
|
| |||||||
| See Notes to Financial Statements. | THE RYDEX FUNDSANNUALREPORT | 95 |
| SCHEDULE OF INVESTMENTS (continued) | December 31, 2011 |
RUSSELL 2000® 2x STRATEGY FUND
| SHARES | VALUE | |||||||
CONSUMER STAPLES - 1.2 % | ||||||||
Nu Skin Enterprises, Inc. — Class A | 109 | $ | 5,294 | |||||
Ruddick Corp. | 103 | 4,392 | ||||||
TreeHouse Foods, Inc.* | 67 | 4,380 | ||||||
Casey’s General Stores, Inc. | 77 | 3,966 | ||||||
United Natural Foods, Inc.* | 91 | 3,641 | ||||||
Darling International, Inc.* | 227 | 3,017 | ||||||
Pricesmart, Inc. | 36 | 2,505 | ||||||
Lancaster Colony Corp. | 35 | 2,427 | ||||||
Hain Celestial Group, Inc.* | 66 | 2,420 | ||||||
Fresh Market, Inc.* | 59 | 2,354 | ||||||
Sanderson Farms, Inc. | 44 | 2,206 | ||||||
B&G Foods, Inc. | 90 | 2,166 | ||||||
Snyders-Lance, Inc. | 89 | 2,003 | ||||||
Universal Corp. | 43 | 1,976 | ||||||
Boston Beer Company, Inc. — Class A* | 17 | 1,846 | ||||||
Elizabeth Arden, Inc.* | 48 | 1,778 | ||||||
Fresh Del Monte Produce, Inc. | 66 | 1,651 | ||||||
Vector Group Ltd. | 89 | 1,581 | ||||||
Andersons, Inc. | 35 | 1,528 | ||||||
J&J Snack Foods Corp. | 28 | 1,492 | ||||||
Rite Aid Corp.* | 1,167 | 1,470 | ||||||
WD-40 Co. | 32 | 1,293 | ||||||
Heckmann Corp.* | 187 | 1,244 | ||||||
Cal-Maine Foods, Inc. | 32 | 1,170 | ||||||
Prestige Brands Holdings, Inc.* | 103 | 1,161 | ||||||
Weis Markets, Inc. | 27 | 1,078 | ||||||
Winn-Dixie Stores, Inc.* | 107 | 1,004 | ||||||
Tootsie Roll Industries, Inc. | 41 | 970 | ||||||
Spectrum Brands Holdings, Inc.* | 31 | 849 | ||||||
Chiquita Brands International, Inc.* | 95 | 792 | ||||||
Central Garden and Pet Co. — Class A* | 94 | 782 | ||||||
Spartan Stores, Inc. | 42 | 777 | ||||||
Nash Finch Co. | 26 | 761 | ||||||
Central European Distribution Corp.* | 146 | 639 | ||||||
Smart Balance, Inc.* | 117 | 627 | ||||||
Dole Food Company, Inc.* | 72 | 623 | ||||||
Calavo Growers, Inc. | 24 | 616 | ||||||
Pilgrim’s Pride Corp.* | 102 | 588 | ||||||
USANA Health Sciences, Inc.* | 18 | 547 | ||||||
Pantry, Inc.* | 43 | 515 | ||||||
Inter Parfums, Inc. | 33 | 513 | ||||||
Alliance One International, Inc.* | 168 | 457 | ||||||
National Beverage Corp.* | 27 | 434 | ||||||
Coca-Cola Bottling Company Consolidated | 7 | 410 | ||||||
Nature’s Sunshine Products, Inc.* | 26 | 404 | ||||||
Seneca Foods Corp. — Class A* | 15 | 387 | ||||||
Ingles Markets, Inc. — Class A | 23 | 346 | ||||||
Diamond Foods, Inc. | 10 | 323 | ||||||
Susser Holdings Corp.* | 14 | 317 | ||||||
Chefs’ Warehouse, Inc.* | 17 | 304 | ||||||
Medifast, Inc.* | 22 | 302 | ||||||
Revlon, Inc. — Class A* | 19 | 283 | ||||||
Village Super Market, Inc. — Class A | 9 | 256 | ||||||
Limoneira Co. | 15 | 254 | ||||||
Schiff Nutrition International, Inc.* | 23 | 246 | ||||||
Omega Protein Corp.* | 34 | 242 | ||||||
Nutraceutical International Corp.* | 17 | 192 | ||||||
Star Scientific, Inc.* | 72 | 157 | ||||||
Alico, Inc. | 8 | 155 | ||||||
Synutra International, Inc.* | 30 | 152 | ||||||
Female Health Co. | 33 | 149 | ||||||
Farmer Brothers Co. | 18 | 138 | ||||||
MGP Ingredients, Inc. | 25 | 126 | ||||||
Oil-Dri Corporation of America | 6 | 121 | ||||||
Craft Brewers Alliance, Inc.* | 19 | 114 | ||||||
Imperial Sugar Co. | 26 | 93 | ||||||
Primo Water Corp.* | 28 | 85 | ||||||
Harbinger Group, Inc.* | 17 | 68 | ||||||
Lifeway Foods, Inc.* | 7 | 67 | ||||||
|
| |||||||
Total Consumer Staples | 77,224 | |||||||
|
| |||||||
TELECOMMUNICATION SERVICES - 0.3% |
| |||||||
AboveNet, Inc.* | 42 | 2,730 | ||||||
Cogent Communications Group, Inc.* | 91 | 1,537 | ||||||
Cincinnati Bell, Inc.* | 392 | 1,188 | ||||||
Leap Wireless International, Inc.* | 122 | 1,133 | ||||||
Consolidated Communications Holdings, Inc. | 52 | 991 | ||||||
Premiere Global Services, Inc.* | 100 | 847 | ||||||
General Communication, Inc. — Class A* | 86 | 842 | ||||||
Atlantic Tele-Network, Inc. | 19 | 742 | ||||||
Neutral Tandem, Inc.* | 64 | 684 | ||||||
Vonage Holdings Corp.* | 273 | 669 | ||||||
Iridium Communications, Inc.* | 86 | 663 | ||||||
USA Mobility, Inc. | 44 | 610 | ||||||
NTELOS Holdings Corp. | 28 | 571 | ||||||
Cbeyond, Inc.* | 56 | 449 | ||||||
Shenandoah Telecommunications Co. | 41 | 430 | ||||||
Lumos Networks Corp. | 28 | 430 | ||||||
8x8, Inc.* | 121 | 384 | ||||||
SureWest Communications | 28 | 337 | ||||||
HickoryTech Corp. | 28 | 310 | ||||||
Alaska Communications Systems Group, Inc. | 94 | 283 | ||||||
inContact, Inc.* | 60 | 266 | ||||||
IDT Corp. — Class B | 28 | 263 | ||||||
Fairpoint Communications, Inc.* | 44 | 191 | ||||||
| 96 | THE RYDEX FUNDSANNUALREPORT | See Notes to Financial Statements. |
| SCHEDULE OF INVESTMENTS (concluded) | December 31, 2011 |
RUSSELL 2000® 2x STRATEGY FUND
| SHARES | VALUE | |||||||
Towerstream Corp.* | 84 | $ | 176 | |||||
Globalstar, Inc.* | 201 | 109 | ||||||
Boingo Wireless, Inc.* | 5 | 43 | ||||||
|
| |||||||
Total Telecommunication Services | 16,878 | |||||||
|
| |||||||
Total Common Stocks (Cost $1,954,391) | 2,151,750 | |||||||
|
| |||||||
WARRANTS†† - 0.0% | ||||||||
Magnum Hunter Resources Corp. $10.50, 08/16/13 | 6 | — | ||||||
|
| |||||||
Total Warrants (Cost $—) | — | |||||||
|
| |||||||
| FACE AMOUNT | ||||||||
REPURCHASE AGREEMENTS††,1 - 55.4% |
| |||||||
Credit Suisse Group issued 12/30/11 at 0.00% due 01/03/122 | $ | 1,330,201 | 1,330,201 | |||||
Mizuho Financial Group, Inc. issued 12/30/11 at 0.00% due 01/03/12 | 794,736 | 794,736 | ||||||
HSBC Group issued 12/30/11 at 0.00% due 01/03/12 | 760,770 | 760,770 | ||||||
Deutsche Bank issued 12/30/11 at 0.00% due 01/03/12 | 760,770 | 760,770 | ||||||
|
| |||||||
Total Repurchase Agreements (Cost $3,646,477) |
| 3,646,477 | ||||||
|
| |||||||
Total Investments – 88.1% (Cost $5,600,868) | $ | 5,798,227 | ||||||
|
| |||||||
Cash & Other Assets, Less Liabilities - 11.9% | 779,918 | |||||||
|
| |||||||
Total Net Assets – 100.0% | $ | 6,578,145 | ||||||
| CONTRACTS | UNREALIZED GAIN (LOSS) | |||||||
FUTURES CONTRACTS PURCHASED† |
| |||||||
March 2012 Russell 2000 Index Mini Futures Contracts (Aggregate Value of Contracts $2,135,560) | 29 | $ | 53,026 | |||||
|
| |||||||
| UNITS | ||||||||
EQUITY INDEX SWAP AGREEMENTS†† |
| |||||||
Credit Suisse Capital, LLC January 2012 Russell 2000 Index Swap, Terminating 01/31/123 (Notional Value $1,277,689) | 1,725 | $ | (5,332 | ) | ||||
Goldman Sachs International January 2012 Russell 2000 Index Swap, Terminating 01/27/123 (Notional Value $1,126,663) | 1,521 | (15,097 | ) | |||||
Morgan Stanley Capital Services, Inc. January 2012 Russell 2000 Index Swap, Terminating 01/30/123 (Notional Value $2,359,607) | 3,185 | (15,385 | ) | |||||
Barclays Bank plc January 2012 Russell 2000 Index Swap, Terminating 01/31/123 (Notional Value $3,945,446) | 5,325 | (21,440 | ) | |||||
|
| |||||||
(Total Notional Value $8,709,405) | $ | (57,254 | ) | |||||
|
| |||||||
| * | Non-income producing security. |
| † | Value determined based on Level 1 inputs — See Note 4. |
| †† | Value determined based on Level 2 inputs — See Note 4. |
| 1 | Repurchase Agreements — See Note 5. |
| 2 | All or a portion of this security is pledged as equity index swap collateral at December 31, 2011. |
| 3 | Total Return based on Russell 2000 Index +/- financing at a variable rate. |
| plc — Public Limited Company |
| REIT — Real Estate Investment Trust |
| See Notes to Financial Statements. | THE RYDEX FUNDSANNUALREPORT | 97 |
RUSSELL 2000® 2x STRATEGY FUND
STATEMENT OF ASSETS AND LIABILITIES
December 31, 2011
ASSETS: | ||||
Investments, at value (cost $1,954,391) | $ | 2,151,750 | ||
Repurchase agreements, at value (cost $3,646,477) | 3,646,477 | |||
|
| |||
Total investments (cost $5,600,868) | 5,798,227 | |||
Segregated cash with broker | 557,476 | |||
Receivables: | ||||
Fund shares sold | 306,621 | |||
Dividends | 3,072 | |||
Securities sold | 360 | |||
Interest | 1 | |||
|
| |||
Total assets | 6,665,757 | |||
|
| |||
LIABILITIES: | ||||
Unrealized depreciation on swap agreements | 57,254 | |||
Payable for: | ||||
Variation margin | 15,080 | |||
Management fees | 4,469 | |||
Transfer agent and administrative fees | 1,241 | |||
Investor service fees | 1,241 | |||
Portfolio accounting fees | 497 | |||
Fund shares redeemed | 16 | |||
Miscellaneous | 7,814 | |||
|
| |||
Total liabilities | 87,612 | |||
|
| |||
NETASSETS | $ | 6,578,145 | ||
|
| |||
NETASSETSCONSISTOF: | ||||
Paid in capital | $ | 8,452,556 | ||
Accumulated net investment loss | (307 | ) | ||
Accumulated net realized loss on investments | (2,067,235 | ) | ||
Net unrealized appreciation on investments | 193,131 | |||
|
| |||
Net assets | $ | 6,578,145 | ||
Capital shares outstanding | 60,058 | |||
Net asset value per share | $ | 109.53 | ||
|
|
STATEMENT OF OPERATIONS
Year Ended December 31, 2011
INVESTMENT INCOME: | ||||
Dividends (net of foreign withholding tax of $2) | $ | 13,700 | ||
Interest | 1,702 | |||
|
| |||
Total investment income | 15,402 | |||
|
| |||
EXPENSES: | ||||
Management fees | 44,600 | |||
Transfer agent and administrative fees | 12,389 | |||
Investor service fees | 12,389 | |||
Portfolio accounting fees | 4,955 | |||
Custodian fees | 1,220 | |||
Trustees’ fees* | 476 | |||
Miscellaneous | 13,949 | |||
|
| |||
Total expenses | 89,978 | |||
|
| |||
Net investment loss | (74,576 | ) | ||
|
| |||
NET REALIZEDAND UNREALIZED GAIN (LOSS): |
| |||
Net realized gain (loss) on: | ||||
Investments | 87,221 | |||
Swap agreements | (877,802 | ) | ||
Futures contracts | (147,647 | ) | ||
Foreign currency | (1 | ) | ||
|
| |||
Net realized loss | (938,229 | ) | ||
|
| |||
Net change in unrealized appreciation (depreciation) on: | ||||
Investments | (174,334 | ) | ||
Swap agreements | 20,946 | |||
Futures contracts | 34,600 | |||
|
| |||
Net change in unrealized appreciation (depreciation) | (118,788 | ) | ||
|
| |||
Net realized and unrealized loss | (1,057,017 | ) | ||
|
| |||
Net decrease in net assets resulting from operations | $ | (1,131,593 | ) | |
|
| |||
| * | Relates to Trustees not deemed “interested persons” within the meaning of Section 2(a)(19) of the 1940 Act. |
| 98 | THE RYDEX FUNDSANNUALREPORT | See Notes to Financial Statements. |
RUSSELL 2000® 2x STRATEGY FUND
STATEMENTS OF CHANGES IN NET ASSETS
| Year Ended December 31, 2011 | Year Ended December 31, 2010 | |||||||
INCREASE (DECREASE) IN NET ASSETS FROM OPERATIONS: | ||||||||
Net investment loss | $ | (74,576 | ) | $ | (42,246 | ) | ||
Net realized gain (loss) on investments | (938,229 | ) | 1,553,607 | |||||
Net change in unrealized appreciation (depreciation) on investments | (118,788 | ) | (234,983 | ) | ||||
|
|
|
| |||||
Net increase (decrease) in net assets resulting from operations | (1,131,593 | ) | 1,276,378 | |||||
|
|
|
| |||||
DISTRIBUTIONSTOSHAREHOLDERSFROM: | ||||||||
Net realized gains | (487,848 | ) | — | |||||
|
|
|
| |||||
Total distributions to shareholders | (487,848 | ) | — | |||||
|
|
|
| |||||
CAPITALSHARETRANSACTIONS: | ||||||||
Proceeds from sale of shares | 50,562,437 | 48,589,346 | ||||||
Distributions reinvested | 487,848 | — | ||||||
Cost of shares redeemed | (47,926,370 | ) | (48,443,340 | ) | ||||
|
|
|
| |||||
Net increase from capital share transactions | 3,123,915 | 146,006 | ||||||
|
|
|
| |||||
Net increase in net assets | 1,504,474 | 1,422,384 | ||||||
NETASSETS: | ||||||||
Beginning of year | 5,073,671 | 3,651,287 | ||||||
|
|
|
| |||||
End of year | $ | 6,578,145 | $ | 5,073,671 | ||||
|
|
|
| |||||
Accumulated net investment loss at end of year | $ | (307 | ) | $ | (201 | ) | ||
|
|
|
| |||||
CAPITALSHAREACTIVITY: | ||||||||
Shares sold | 367,620 | 426,047 | ||||||
Shares issued from reinvestment of distributions | 4,471 | — | ||||||
Shares redeemed | (346,218 | ) | (428,349 | ) | ||||
|
|
|
| |||||
Net increase (decrease) in shares | 25,873 | (2,302 | ) | |||||
|
|
|
| |||||
| See Notes to Financial Statements. | THE RYDEX FUNDSANNUALREPORT | 99 |
RUSSELL 2000® 2x STRATEGY FUND
FINANCIAL HIGHLIGHTS
This table is presented to show selected data for a share outstanding throughout each period, and to assist shareholders in evaluating a Fund’s performance for the periods presented.
| Year Ended December 31, 2011 | Year Ended December 31, 2010 | Year Ended December 31, 2009c | Year Ended December 31, 2008c | Year Ended December 31, 2007c | ||||||||||||||||
Per Share Data | ||||||||||||||||||||
Net asset value, beginning of period | $ | 148.42 | $ | 100.07 | $ | 73.67 | $ | 224.30 | $ | 259.70 | ||||||||||
|
|
|
|
|
|
|
|
|
| |||||||||||
Income (loss) from investment operations: | ||||||||||||||||||||
Net investment income (loss)a | (2.04 | ) | (1.25 | ) | (.67 | ) | .10 | 2.50 | ||||||||||||
Net gain (loss) on investments (realized and unrealized) | (26.77 | ) | 49.60 | 27.08 | (148.93 | ) | (35.20 | ) | ||||||||||||
|
|
|
|
|
|
|
|
|
| |||||||||||
Total from investment operations | (28.81 | ) | 48.35 | 26.41 | (148.83 | ) | (32.70 | ) | ||||||||||||
|
|
|
|
|
|
|
|
|
| |||||||||||
Less distributions from: | ||||||||||||||||||||
Net investment income | — | — | (.01 | ) | (1.80 | ) | (.10 | ) | ||||||||||||
Net realized gains | (10.08 | ) | — | — | — | (2.60 | ) | |||||||||||||
|
|
|
|
|
|
|
|
|
| |||||||||||
Total distributions | (10.08 | ) | — | (.01 | ) | (1.80 | ) | (2.70 | ) | |||||||||||
|
|
|
|
|
|
|
|
|
| |||||||||||
Net asset value, end of period | $ | 109.53 | $ | 148.42 | $ | 100.07 | $ | 73.67 | $ | 224.30 | ||||||||||
|
|
|
|
|
|
|
|
|
| |||||||||||
Total Returnb | (19.38 | %) | 48.30 | % | 35.85 | % | (66.18 | %) | (12.59 | %) | ||||||||||
|
|
|
|
|
|
|
|
|
| |||||||||||
Ratios/Supplemental Data | ||||||||||||||||||||
Net assets, end of period (in thousands) | $ | 6,578 | $ | 5,074 | $ | 3,651 | $ | 3,421 | $ | 6,205 | ||||||||||
|
|
|
|
|
|
|
|
|
| |||||||||||
Ratios to average net assets: | ||||||||||||||||||||
Net investment income (loss) | (1.50 | %) | (1.11 | %) | (0.97 | %) | 0.06 | % | 0.95 | % | ||||||||||
Total expenses | 1.82 | % | 1.74 | % | 1.75 | % | 1.68 | % | 1.64 | % | ||||||||||
|
|
|
|
|
|
|
|
|
| |||||||||||
Portfolio turnover rate | 15 | % | 100 | % | 493 | % | 347 | % | 174 | % | ||||||||||
| a | Net investment income (loss) per share was computed using average shares outstanding throughout the period. |
| b | Total return does not reflect the impact of any additional fees charged by insurance companies and has not been annualized. |
| c | Per share amounts for the years ended December 31, 2007 — December 31, 2008 and the period January 1, 2009 through April 19, 2009 have been restated to reflect a 1:10 reverse stock split effective April 20, 2009. |
| 100 | THE RYDEX FUNDSANNUALREPORT | See Notes to Financial Statements. |
This page intentionally left blank.
THE RYDEX FUNDSANNUALREPORT | 101
| PERFORMANCE REPORT AND FUND PROFILE (Unaudited) | December 31, 2011 |
RUSSELL 2000® 1.5x STRATEGY FUND
OBJECTIVE: Seeks to provide investment results that correlate, before fees and expenses, to the performance of a specific benchmark for small-cap securities on a daily basis. The Fund’s current benchmark is 150% of the performance of the Russell 2000® Index (the “underlying index”). The Fund does not seek to achieve its investment objective over a period of time greater than one day.
For the year ended December 31, 2011, Russell 2000® 1.5x Strategy Fund maintained a daily correlation of over 99% to its benchmark of 150% of the daily price movement of the Russell 2000 Index. Russell 2000® 1.5x Strategy Fund returned -12.18%, while the Russell 2000 Index returned -4.18% over the same time period.
Among sectors, the biggest performance contributors to the index during the period were Utilities and Health Care. Information Technology and Consumer Discretionary detracted from index performance for the year.
Healthspring, Inc., Pharmasset, Inc. and Netlogic Microsystems, Inc. were the largest contributors to performance of the index for the year. Hecla Mining Co., MF Global Holdings Ltd. and Meritor, Inc. were the leading detractors for the year.
Derivatives in the Fund were used to help provide exposure to the composition of the benchmark in the highest efficient manner and to provide leverage, not for hedging purposes.
Due to the compounding of daily returns, leveraged and inverse funds’ returns over periods other than one day will likely differ in amount and possibly direction from the benchmark return for the same period. Investors should monitor their leveraged and inverse funds’ holdings to ensure that they are consistent with their strategies, as frequently as daily.
The effects of compounding may cause the longer-term correlation of the fund to its benchmark to diminish. The apparent discrepancy between the leveraged and unleveraged indices is the result of compounding, which is described briefly on page 4 of this report.
Russell 2000® Index measures the performance of the small-cap value segment of the U.S. equity universe.
Holdings Diversification (Market Exposure as % of Net Assets)
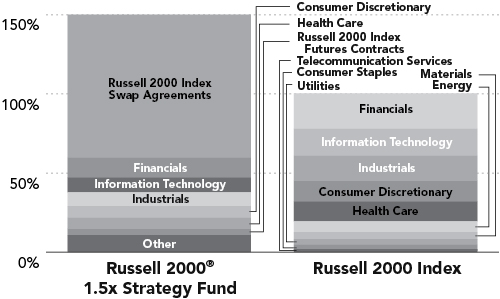
“Holdings Diversification (Market Exposure as % of Net Assets)” excludes any temporary cash investments.
Inception Date: October 1, 2001
Ten Largest Holdings (% of Total Net Assets) | ||||
Healthspring, Inc. | 0.2 | % | ||
Netlogic Microsystems, Inc. | 0.2 | % | ||
SuccessFactors, Inc. | 0.2 | % | ||
Clean Harbors, Inc. | 0.2 | % | ||
World Fuel Services Corp. | 0.2 | % | ||
Jack Henry & Associates, Inc. | 0.2 | % | ||
American Campus Communities, Inc. | 0.2 | % | ||
Signature Bank | 0.1 | % | ||
Salix Pharmaceuticals Ltd. | 0.1 | % | ||
Onyx Pharmaceuticals, Inc. | 0.1 | % | ||
|
| |||
Top Ten Total | 1.7 | % | ||
|
| |||
“Ten Largest Holdings” exclude any temporary cash or derivative investments.
| 102 | THE RYDEX FUNDSANNUALREPORT |
| PERFORMANCE REPORT AND FUND PROFILE (Unaudited) (concluded) |
RUSSELL 2000® 1.5x STRATEGY FUND
Cumulative Fund Performance*
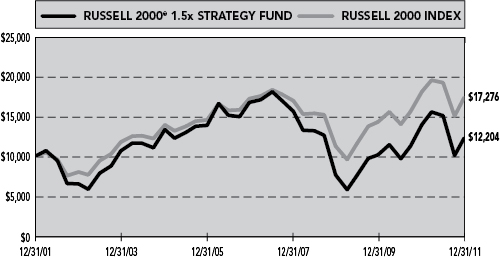
Average Annual Returns*
Periods Ended 12/31/11
| 1 Year | 5 Year | 10 Year | ||||||||||
Russell 2000® 1.5x Strategy Fund | -12.18 | % | -6.05 | % | 2.01 | % | ||||||
Russell 2000 Index | -4.18 | % | 0.15 | % | 5.62 | % | ||||||
| * | The performance data represents past performance that is not predictive of future results. The investment return and principal value of an investment in the Fund will fluctuate so that an investor’s shares, when redeemed, may be worth more or less than their original cost. Returns are historical and include changes in principal and reinvested dividends and capital gains and do not reflect the effect of taxes. The Russell 2000 Index is an unmanaged index and, unlike the Fund, has no management fees or operating expenses to reduce its reported return. |
Returns do not reflect the impact of any additional fees charged by insurance companies.
THE RYDEX FUNDSANNUALREPORT | 103
| SCHEDULE OF INVESTMENTS | December 31, 2011 |
RUSSELL 2000® 1.5x STRATEGY FUND
| SHARES | VALUE | |||||||
COMMON STOCKS† - 55.5% | ||||||||
FINANCIALS - 12.2% | ||||||||
American Campus Communities, Inc. | 388 | $ | 16,280 | |||||
Signature Bank* | 262 | 15,717 | ||||||
Home Properties, Inc. | 266 | 15,314 | ||||||
Tanger Factory Outlet Centers | 482 | 14,132 | ||||||
National Retail Properties, Inc. | 523 | 13,797 | ||||||
Hancock Holding Co. | 430 | 13,747 | ||||||
ProAssurance Corp. | 168 | 13,410 | ||||||
MFA Financial, Inc. | 1,989 | 13,366 | ||||||
BioMed Realty Trust, Inc. | 739 | 13,361 | ||||||
Mid-America Apartment Communities, Inc. | 211 | 13,198 | ||||||
CBL & Associates Properties, Inc. | 830 | 13,031 | ||||||
Extra Space Storage, Inc. | 524 | 12,697 | ||||||
Kilroy Realty Corp. | 327 | 12,449 | ||||||
Post Properties, Inc. | 283 | 12,373 | ||||||
Highwoods Properties, Inc. | 412 | 12,224 | ||||||
Alterra Capital Holdings Ltd. | 506 | 11,957 | ||||||
Equity Lifestyle Properties, Inc. | 177 | 11,804 | ||||||
LaSalle Hotel Properties | 480 | 11,621 | ||||||
Delphi Financial Group, Inc. — Class A | 262 | 11,607 | ||||||
SVB Financial Group* | 242 | 11,541 | ||||||
Entertainment Properties Trust | 262 | 11,452 | ||||||
Hatteras Financial Corp. | 420 | 11,075 | ||||||
Omega Healthcare Investors, Inc. | 566 | 10,952 | ||||||
Prosperity Bancshares, Inc. | 261 | 10,531 | ||||||
Washington Real Estate Investment Trust | 371 | 10,147 | ||||||
Colonial Properties Trust | 465 | 9,700 | ||||||
Starwood Property Trust, Inc. | 524 | 9,699 | ||||||
Stifel Financial Corp.* | 302 | 9,679 | ||||||
FirstMerit Corp. | 609 | 9,214 | ||||||
Invesco Mortgage Capital, Inc. | 646 | 9,076 | ||||||
DiamondRock Hospitality Co. | 939 | 9,052 | ||||||
Trustmark Corp. | 353 | 8,574 | ||||||
Webster Financial Corp. | 412 | 8,401 | ||||||
Iberiabank Corp. | 169 | 8,332 | ||||||
United Bankshares, Inc. | 285 | 8,057 | ||||||
FNB Corp. | 712 | 8,053 | ||||||
Healthcare Realty Trust, Inc. | 433 | 8,049 | ||||||
RLI Corp. | 110 | 8,015 | ||||||
DuPont Fabros Technology, Inc. | 330 | 7,993 | ||||||
Cash America International, Inc. | 171 | 7,974 | ||||||
Umpqua Holdings Corp. | 636 | 7,880 | ||||||
CNO Financial Group, Inc.* | 1,243 | 7,843 | ||||||
Westamerica Bancorporation | 171 | 7,507 | ||||||
First American Financial Corp. | 591 | 7,488 | ||||||
Platinum Underwriters Holdings Ltd. | 215 | 7,334 | ||||||
Northwest Bancshares, Inc. | 587 | 7,302 | ||||||
Two Harbors Investment Corp. | 785 | 7,253 | ||||||
DCT Industrial Trust, Inc. | 1,375 | 7,040 | ||||||
Apollo Investment Corp. | 1,092 | 7,032 | ||||||
Potlatch Corp. | 222 | 6,906 | ||||||
Ezcorp, Inc. — Class A* | 259 | 6,830 | ||||||
Knight Capital Group, Inc. — Class A* | 563 | 6,655 | ||||||
UMB Financial Corp. | 178 | 6,631 | ||||||
Sovran Self Storage, Inc. | 155 | 6,614 | ||||||
Texas Capital Bancshares, Inc.* | 216 | 6,612 | ||||||
Cathay General Bancorp | 440 | 6,569 | ||||||
EastGroup Properties, Inc. | 151 | 6,565 | ||||||
Medical Properties Trust, Inc. | 632 | 6,238 | ||||||
World Acceptance Corp.* | 84 | 6,174 | ||||||
Montpelier Re Holdings Ltd. | 347 | 6,159 | ||||||
Susquehanna Bancshares, Inc. | 734 | 6,151 | ||||||
Old National Bancorp | 527 | 6,140 | ||||||
First Cash Financial Services, Inc.* | 173 | 6,071 | ||||||
Ocwen Financial Corp.* | 414 | 5,995 | ||||||
CYS Investments, Inc. | 456 | 5,992 | ||||||
Capstead Mortgage Corp. | 480 | 5,971 | ||||||
PS Business Parks, Inc. | 106 | 5,876 | ||||||
CubeSmart | 551 | 5,863 | ||||||
National Penn Bancshares, Inc. | 692 | 5,840 | ||||||
First Financial Bankshares, Inc. | 174 | 5,817 | ||||||
National Health Investors, Inc. | 132 | 5,805 | ||||||
Prospect Capital Corp. | 606 | 5,630 | ||||||
Glimcher Realty Trust | 604 | 5,557 | ||||||
Community Bank System, Inc. | 199 | 5,532 | ||||||
Pebblebrook Hotel Trust | 287 | 5,505 | ||||||
International Bancshares Corp. | 300 | 5,501 | ||||||
First Financial Bancorp | 326 | 5,425 | ||||||
Wintrust Financial Corp. | 193 | 5,414 | ||||||
Sunstone Hotel Investors, Inc.* | 657 | 5,355 | ||||||
Selective Insurance Group, Inc. | 299 | 5,301 | ||||||
Strategic Hotels & Resorts, Inc.* | 984 | 5,284 | ||||||
LTC Properties, Inc. | 171 | 5,277 | ||||||
MB Financial, Inc. | 304 | 5,198 | ||||||
Equity One, Inc. | 303 | 5,145 | ||||||
BancorpSouth, Inc. | 466 | 5,135 | ||||||
Lexington Realty Trust | 674 | 5,048 | ||||||
CVB Financial Corp. | 498 | 4,995 | ||||||
First Industrial Realty Trust, Inc.* | 484 | 4,951 | ||||||
Financial Engines, Inc.* | 216 | 4,823 | ||||||
MarketAxess Holdings, Inc. | 158 | 4,757 | ||||||
Glacier Bancorp, Inc. | 392 | 4,716 | ||||||
Sun Communities, Inc. | 127 | 4,639 | ||||||
Bank of the Ozarks, Inc. | 155 | 4,593 | ||||||
Argo Group International Holdings Ltd. | 157 | 4,547 | ||||||
| 104 | THE RYDEX FUNDSANNUALREPORT | See Notes to Financial Statements. |
| SCHEDULE OF INVESTMENTS (continued) | December 31, 2011 |
RUSSELL 2000® 1.5x STRATEGY FUND
| SHARES | VALUE | |||||||
Primerica, Inc. | 194 | $ | 4,509 | |||||
Redwood Trust, Inc. | 441 | 4,489 | ||||||
Park National Corp. | 69 | 4,489 | ||||||
Provident Financial Services, Inc. | 332 | 4,445 | ||||||
Solar Capital Ltd. | 201 | 4,440 | ||||||
Acadia Realty Trust | 220 | 4,431 | ||||||
Anworth Mortgage Asset Corp. | 701 | 4,402 | ||||||
Tower Group, Inc. | 215 | 4,337 | ||||||
DFC Global Corp.* | 239 | 4,316 | ||||||
Government Properties Income Trust | 191 | 4,307 | ||||||
NBT Bancorp, Inc. | 192 | 4,249 | ||||||
First Midwest Bancorp, Inc. | 416 | 4,214 | ||||||
Education Realty Trust, Inc. | 411 | 4,205 | ||||||
Columbia Banking System, Inc. | 218 | 4,201 | ||||||
Astoria Financial Corp. | 485 | 4,118 | ||||||
Harleysville Group, Inc. | 70 | 3,960 | ||||||
Employers Holdings, Inc. | 218 | 3,944 | ||||||
Fifth Street Finance Corp. | 411 | 3,933 | ||||||
MGIC Investment Corp.* | 1,052 | 3,924 | ||||||
Infinity Property & Casualty Corp. | 69 | 3,915 | ||||||
Franklin Street Properties Corp. | 391 | 3,890 | ||||||
Hersha Hospitality Trust | 782 | 3,816 | ||||||
Associated Estates Realty Corp. | 239 | 3,812 | ||||||
Nelnet, Inc. — Class A | 153 | 3,744 | ||||||
First Potomac Realty Trust | 283 | 3,693 | ||||||
Oritani Financial Corp. | 289 | 3,691 | ||||||
American Assets Trust, Inc. | 179 | 3,671 | ||||||
Greenlight Capital Re Ltd.* | 154 | 3,645 | ||||||
PrivateBancorp, Inc. | 330 | 3,623 | ||||||
BBCN Bancorp, Inc.* | 373 | 3,525 | ||||||
Investors Bancorp, Inc.* | 260 | 3,505 | ||||||
Independent Bank Corp. | 127 | 3,466 | ||||||
Boston Private Financial Holdings, Inc. | 435 | 3,454 | ||||||
American Equity Investment Life Holding Co. | 329 | 3,422 | ||||||
CreXus Investment Corp. | 328 | 3,405 | ||||||
Evercore Partners, Inc. — Class A | 127 | 3,381 | ||||||
BlackRock Kelso Capital Corp. | 414 | 3,378 | ||||||
Symetra Financial Corp. | 371 | 3,365 | ||||||
PHH Corp.* | 312 | 3,338 | ||||||
Investors Real Estate Trust | 455 | 3,319 | ||||||
Inland Real Estate Corp. | 435 | 3,310 | ||||||
Credit Acceptance Corp.* | 40 | 3,291 | ||||||
Chemical Financial Corp. | 154 | 3,283 | ||||||
Cousins Properties, Inc. | 507 | 3,250 | ||||||
PacWest Bancorp | 171 | 3,240 | ||||||
Home Bancshares, Inc. | 125 | 3,239 | ||||||
National Financial Partners Corp.* | 238 | 3,218 | ||||||
Amtrust Financial Services, Inc. | 135 | 3,206 | ||||||
Pennsylvania Real Estate Investment Trust | 306 | 3,195 | ||||||
Meadowbrook Insurance Group, Inc. | 298 | 3,183 | ||||||
Walter Investment Management Corp. | 153 | 3,138 | ||||||
Oriental Financial Group, Inc. | 257 | 3,112 | ||||||
Navigators Group, Inc.* | 65 | 3,099 | ||||||
Pinnacle Financial Partners, Inc.* | 191 | 3,085 | ||||||
First Commonwealth Financial Corp. | 586 | 3,082 | ||||||
S&T Bancorp, Inc. | 154 | 3,011 | ||||||
ARMOUR Residential REIT, Inc. | 426 | 3,003 | ||||||
Forestar Group, Inc.* | 198 | 2,996 | ||||||
KBW, Inc. | 197 | 2,990 | ||||||
Horace Mann Educators Corp. | 218 | 2,989 | ||||||
City Holding Co. | 88 | 2,982 | ||||||
Cohen & Steers, Inc. | 102 | 2,948 | ||||||
Trustco Bank Corp. | 520 | 2,917 | ||||||
Retail Opportunity Investments Corp. | 241 | 2,853 | ||||||
Simmons First National Corp. — Class A | 103 | 2,801 | ||||||
Colony Financial, Inc. | 177 | 2,781 | ||||||
Brookline Bancorp, Inc. | 328 | 2,768 | ||||||
iStar Financial, Inc.* | 523 | 2,767 | ||||||
Safety Insurance Group, Inc. | 68 | 2,753 | ||||||
Advance America Cash Advance Centers, Inc. | 304 | 2,721 | ||||||
Compass Diversified Holdings | 219 | 2,713 | ||||||
Newcastle Investment Corp. | 579 | 2,692 | ||||||
Chesapeake Lodging Trust | 173 | 2,675 | ||||||
RLJ Lodging Trust | 156 | 2,625 | ||||||
ViewPoint Financial Group | 201 | 2,615 | ||||||
State Bank Financial Corp.* | 173 | 2,614 | ||||||
WesBanco, Inc. | 134 | 2,609 | ||||||
Sabra Health Care REIT, Inc. | 215 | 2,599 | ||||||
PennantPark Investment Corp. | 257 | 2,593 | ||||||
PICO Holdings, Inc.* | 126 | 2,593 | ||||||
PennyMac Mortgage Investment Trust | 156 | 2,593 | ||||||
Investment Technology Group, Inc.* | 239 | 2,584 | ||||||
AMERISAFE, Inc.* | 111 | 2,581 | ||||||
United Fire & Casualty Co. | 127 | 2,563 | ||||||
Community Trust Bancorp, Inc. | 87 | 2,560 | ||||||
NorthStar Realty Finance Corp. | 532 | 2,538 | ||||||
Sterling Financial Corp.* | 151 | 2,522 | ||||||
Duff & Phelps Corp. — Class A | 173 | 2,509 | ||||||
Banco Latinoamericano de Comercio Exterior S.A. | 156 | 2,504 | ||||||
Flagstone Reinsurance Holdings S.A. | 302 | 2,504 | ||||||
BGC Partners, Inc. — Class A | 420 | 2,495 | ||||||
| See Notes to Financial Statements. | THE RYDEX FUNDSANNUALREPORT | 105 |
| SCHEDULE OF INVESTMENTS (continued) | December 31, 2011 |
RUSSELL 2000® 1.5x STRATEGY FUND
| SHARES | VALUE | |||||||
Western Alliance Bancorporation* | 394 | $ | 2,455 | |||||
Maiden Holdings Ltd. | 279 | 2,444 | ||||||
SCBT Financial Corp. | 84 | 2,437 | ||||||
Urstadt Biddle Properties, Inc. — Class A | 134 | 2,423 | ||||||
Universal Health Realty Income Trust | 62 | 2,418 | ||||||
Triangle Capital Corp. | 126 | 2,409 | ||||||
Berkshire Hills Bancorp, Inc. | 107 | 2,374 | ||||||
Sandy Spring Bancorp, Inc. | 135 | 2,369 | ||||||
FBL Financial Group, Inc. — Class A | 69 | 2,347 | ||||||
Ashford Hospitality Trust, Inc. | 286 | 2,288 | ||||||
Hercules Technology Growth Capital, Inc. | 241 | 2,275 | ||||||
Lakeland Financial Corp. | 87 | 2,251 | ||||||
Flushing Financial Corp. | 178 | 2,248 | ||||||
1st Source Corp. | 88 | 2,229 | ||||||
Resource Capital Corp. | 397 | 2,227 | ||||||
Dime Community Bancshares, Inc. | 174 | 2,192 | ||||||
First Busey Corp. | 436 | 2,180 | ||||||
Ramco-Gershenson Properties Trust | 218 | 2,143 | ||||||
FelCor Lodging Trust, Inc.* | 695 | 2,120 | ||||||
Citizens, Inc.* | 217 | 2,103 | ||||||
Excel Trust, Inc. | 175 | 2,100 | ||||||
Getty Realty Corp. | 150 | 2,093 | ||||||
First Financial Corp. | 62 | 2,063 | ||||||
Tejon Ranch Co.* | 84 | 2,056 | ||||||
Dynex Capital, Inc. | 222 | 2,027 | ||||||
Hudson Valley Holding Corp. | 95 | 2,016 | ||||||
Washington Trust Bancorp, Inc. | 84 | 2,004 | ||||||
OneBeacon Insurance Group Ltd. | 129 | 1,985 | ||||||
Renasant Corp. | 132 | 1,980 | ||||||
Epoch Holding Corp. | 89 | 1,978 | ||||||
Coresite Realty Corp. | 109 | 1,942 | ||||||
INTL FCStone, Inc.* | 81 | 1,909 | ||||||
Southside Bancshares, Inc. | 86 | 1,863 | ||||||
Hilltop Holdings, Inc.* | 218 | 1,842 | ||||||
Cardinal Financial Corp. | 171 | 1,837 | ||||||
Tower Bancorp, Inc. | 64 | 1,827 | ||||||
Virtus Investment Partners, Inc.* | 24 | 1,824 | ||||||
Rockville Financial, Inc. | 175 | 1,813 | ||||||
Hudson Pacific Properties, Inc. | 127 | 1,798 | ||||||
Monmouth Real Estate Investment Corp. — Class A | 196 | 1,793 | ||||||
eHealth, Inc.* | 121 | 1,779 | ||||||
Piper Jaffray Cos.* | 87 | 1,757 | ||||||
HFF, Inc. — Class A* | 170 | 1,756 | ||||||
Radian Group, Inc. | 746 | 1,746 | ||||||
MCG Capital Corp. | 434 | 1,732 | ||||||
Safeguard Scientifics, Inc.* | 108 | 1,705 | ||||||
Campus Crest Communities, Inc. | 168 | 1,690 | ||||||
Tompkins Financial Corp. | 43 | 1,656 | ||||||
GAMCO Investors, Inc. — Class A | 38 | 1,653 | ||||||
GFI Group, Inc. | 396 | 1,632 | ||||||
West Coast Bancorp* | 104 | �� | 1,622 | |||||
TowneBank | 132 | 1,616 | ||||||
NewStar Financial, Inc.* | 156 | 1,587 | ||||||
Winthrop Realty Trust | 156 | 1,587 | ||||||
Beneficial Mutual Bancorp, Inc.* | 188 | 1,572 | ||||||
TICC Capital Corp. | 181 | 1,566 | ||||||
Saul Centers, Inc. | 44 | 1,558 | ||||||
Great Southern Bancorp, Inc. | 66 | 1,557 | ||||||
WSFS Financial Corp. | 43 | 1,546 | ||||||
Bancfirst Corp. | 41 | 1,539 | ||||||
Westwood Holdings Group, Inc. | 42 | 1,535 | ||||||
MVC Capital, Inc. | 132 | 1,530 | ||||||
StellarOne Corp. | 133 | 1,514 | ||||||
Sterling Bancorp | 175 | 1,512 | ||||||
Banner Corp. | 88 | 1,509 | ||||||
Arrow Financial Corp. | 64 | 1,500 | ||||||
CapLease, Inc. | 371 | 1,499 | ||||||
Summit Hotel Properties, Inc. | 156 | 1,473 | ||||||
Ladenburg Thalmann Financial Services, Inc.* | 592 | 1,468 | ||||||
Camden National Corp. | 45 | 1,467 | ||||||
Provident New York Bancorp | 218 | 1,448 | ||||||
Apollo Commercial Real Estate Finance, Inc. | 110 | 1,444 | ||||||
Union First Market Bankshares Corp. | 108 | 1,435 | ||||||
Kennedy-Wilson Holdings, Inc. | 133 | 1,407 | ||||||
United Financial Bancorp, Inc. | 87 | 1,400 | ||||||
Kite Realty Group Trust | 310 | 1,398 | ||||||
American Safety Insurance Holdings Ltd.* | 64 | 1,392 | ||||||
Global Indemnity plc* | 69 | 1,368 | ||||||
Netspend Holdings, Inc.* | 168 | 1,362 | ||||||
Ameris Bancorp* | 132 | 1,357 | ||||||
Territorial Bancorp, Inc. | 68 | 1,343 | ||||||
Calamos Asset Management, Inc. | 107 | 1,339 | ||||||
Cedar Realty Trust, Inc. | 310 | 1,336 | ||||||
SY Bancorp, Inc. | 65 | 1,334 | ||||||
Republic Bancorp, Inc. — Class A | 58 | 1,328 | ||||||
Enterprise Financial Services Corp. | 88 | 1,302 | ||||||
Citizens & Northern Corp. | 70 | 1,293 | ||||||
Presidential Life Corp. | 129 | 1,289 | ||||||
Univest Corporation of Pennsylvania | 87 | 1,274 | ||||||
Wilshire Bancorp, Inc.* | 350 | 1,271 | ||||||
First Merchants Corp. | 150 | 1,270 | ||||||
Trico Bancshares | 89 | 1,266 | ||||||
| 106 | THE RYDEX FUNDSANNUALREPORT | See Notes to Financial Statements. |
| SCHEDULE OF INVESTMENTS (continued) | December 31, 2011 |
RUSSELL 2000® 1.5x STRATEGY FUND
| SHARES | VALUE | |||||||
Stewart Information Services Corp. | 109 | $ | 1,259 | |||||
Parkway Properties, Inc. | 127 | 1,252 | ||||||
First Connecticut Bancorp, Inc. | 96 | 1,249 | ||||||
Bryn Mawr Bank Corp. | 64 | 1,247 | ||||||
Eagle Bancorp, Inc.* | 85 | 1,236 | ||||||
Bancorp, Inc.* | 170 | 1,229 | ||||||
German American Bancorp, Inc. | 67 | 1,219 | ||||||
Northfield Bancorp, Inc. | 86 | 1,218 | ||||||
SWS Group, Inc. | 170 | 1,168 | ||||||
First of Long Island Corp. | 44 | 1,158 | ||||||
Centerstate Banks, Inc. | 173 | 1,145 | ||||||
Financial Institutions, Inc. | 70 | 1,130 | ||||||
Westfield Financial, Inc. | 153 | 1,126 | ||||||
Agree Realty Corp. | 46 | 1,121 | ||||||
National Bankshares, Inc. | 40 | 1,117 | ||||||
State Auto Financial Corp. | 82 | 1,114 | ||||||
Central Pacific Financial Corp.* | 86 | 1,111 | ||||||
First Interstate Bancsystem, Inc. | 85 | 1,108 | ||||||
Gladstone Commercial Corp. | 63 | 1,106 | ||||||
Heritage Financial Corp. | 88 | 1,105 | ||||||
CNB Financial Corp. | 70 | 1,105 | ||||||
Phoenix Companies, Inc.* | 657 | 1,104 | ||||||
Lakeland Bancorp, Inc. | 128 | 1,103 | ||||||
Cogdell Spencer, Inc. | 258 | 1,097 | ||||||
State Bancorp, Inc. | 89 | 1,086 | ||||||
First Community Bancshares, Inc. | 87 | 1,086 | ||||||
Enstar Group Ltd.* | 11 | 1,080 | ||||||
Oppenheimer Holdings, Inc. — Class A | 67 | 1,079 | ||||||
OceanFirst Financial Corp. | 82 | 1,072 | ||||||
Fox Chase Bancorp, Inc. | 84 | 1,061 | ||||||
Franklin Financial Corp.* | 89 | 1,054 | ||||||
OmniAmerican Bancorp, Inc.* | 67 | 1,052 | ||||||
Virginia Commerce Bancorp, Inc.* | 134 | 1,036 | ||||||
Heartland Financial USA, Inc. | 67 | 1,028 | ||||||
Washington Banking Co. | 86 | 1,024 | ||||||
One Liberty Properties, Inc. | 62 | 1,023 | ||||||
CoBiz Financial, Inc. | 177 | 1,021 | ||||||
RAIT Financial Trust | 215 | 1,021 | ||||||
STAG Industrial, Inc. | 88 | 1,009 | ||||||
Golub Capital BDC, Inc. | 64 | 992 | ||||||
Pacific Continental Corp. | 110 | 974 | ||||||
ESB Financial Corp. | 69 | 971 | ||||||
First Bancorp | 87 | 970 | ||||||
National Interstate Corp. | 39 | 962 | ||||||
Gladstone Capital Corp. | 126 | 961 | ||||||
Baldwin & Lyons, Inc. — Class B | 44 | 959 | ||||||
Cowen Group, Inc. — Class A* | 370 | 958 | ||||||
MainSource Financial Group, Inc. | 108 | 954 | ||||||
Peoples Bancorp, Inc. | 64 | 948 | ||||||
Crawford & Co. — Class B | 153 | 942 | ||||||
Medallion Financial Corp. | 82 | 933 | ||||||
Mission West Properties, Inc. | 103 | 929 | ||||||
NGP Capital Resources Co. | 129 | 928 | ||||||
Gladstone Investment Corp. | 127 | 923 | ||||||
Arlington Asset Investment Corp. — Class A | 43 | 917 | ||||||
Home Federal Bancorp, Inc. | 87 | 905 | ||||||
FXCM, Inc. | 90 | 878 | ||||||
Chatham Lodging Trust | 81 | 873 | ||||||
1st United Bancorp, Inc.* | 156 | 866 | ||||||
Bank of Marin Bancorp | 23 | 865 | ||||||
Artio Global Investors, Inc. | 175 | 854 | ||||||
Kansas City Life Insurance Co. | 26 | 853 | ||||||
Main Street Capital Corp. | 40 | 850 | ||||||
Apollo Residential Mortgage, Inc. | 55 | 839 | ||||||
SeaBright Holdings, Inc. | 109 | 834 | ||||||
Alliance Financial Corp. | 27 | 834 | ||||||
West Bancorporation, Inc. | 87 | 833 | ||||||
Walker & Dunlop, Inc.* | 66 | 829 | ||||||
Farmer Mac | 46 | 829 | ||||||
American Capital Mortgage Investment Corp. | 44 | 828 | ||||||
Bank Mutual Corp. | 259 | 824 | ||||||
Capital Southwest Corp. | 10 | 816 | ||||||
BofI Holding, Inc.* | 49 | 796 | ||||||
Hanmi Financial Corp.* | 107 | 792 | ||||||
First Financial Holdings, Inc. | 87 | 777 | ||||||
Kearny Financial Corp. | 81 | 769 | ||||||
Bancorp Rhode Island, Inc. | 19 | 754 | ||||||
First Bancorp, Inc. | 49 | 753 | ||||||
Diamond Hill Investment Group, Inc. | 10 | 740 | ||||||
Penns Woods Bancorp, Inc. | 19 | 737 | ||||||
Gleacher & Company, Inc.* | 438 | 736 | ||||||
Merchants Bancshares, Inc. | 25 | 730 | ||||||
Metro Bancorp, Inc.* | 87 | 729 | ||||||
Terreno Realty Corp. | 48 | 727 | ||||||
Edelman Financial Group, Inc. | 109 | 716 | ||||||
Solar Senior Capital Ltd. | 45 | 709 | ||||||
AG Mortgage Investment Trust, Inc. | 35 | 705 | ||||||
BankFinancial Corp. | 126 | 696 | ||||||
Doral Financial Corp.* | 719 | 687 | ||||||
Pacific Capital Bancorp North America* | 24 | 678 | ||||||
First Pactrust Bancorp, Inc. | 66 | 676 | ||||||
First Defiance Financial Corp. | 46 | 671 | ||||||
Kohlberg Capital Corp. | 106 | 669 | ||||||
Southwest Bancorp, Inc.* | 112 | 668 | ||||||
Center Bancorp, Inc. | 66 | 645 | ||||||
Medley Capital Corp. | 62 | 645 | ||||||
ESSA Bancorp, Inc. | 61 | 639 | ||||||
| See Notes to Financial Statements. | THE RYDEX FUNDSANNUALREPORT | 107 |
| SCHEDULE OF INVESTMENTS (continued) | December 31, 2011 |
RUSSELL 2000® 1.5x STRATEGY FUND
| SHARES | VALUE | |||||||
Donegal Group, Inc. — Class A | 45 | $ | 637 | |||||
JMP Group, Inc. | 88 | 629 | ||||||
United Community Banks, Inc.* | 90 | 629 | ||||||
Seacoast Banking Corporation of Florida* | 413 | 628 | ||||||
Consolidated-Tomoka Land Co. | 23 | 623 | ||||||
Park Sterling Corp.* | 151 | 616 | ||||||
Taylor Capital Group, Inc.* | 63 | 612 | ||||||
Meridian Interstate Bancorp, Inc.* | 49 | 610 | ||||||
Marlin Business Services Corp. | 48 | 610 | ||||||
Harris & Harris Group, Inc.* | 175 | 605 | ||||||
Nicholas Financial, Inc. | 46 | 590 | ||||||
THL Credit, Inc. | 48 | 586 | ||||||
Capital City Bank Group, Inc. | 61 | 583 | ||||||
Encore Bancshares, Inc.* | 43 | 581 | ||||||
MidSouth Bancorp, Inc. | 44 | 572 | ||||||
FBR & Company* | 279 | 572 | ||||||
UMH Properties, Inc. | 61 | 568 | ||||||
Flagstar Bancorp, Inc.* | 1,093 | 552 | ||||||
Sierra Bancorp | 62 | 546 | ||||||
Bank of Kentucky Financial Corp. | 27 | 541 | ||||||
Century Bancorp, Inc. — Class A | 19 | 537 | ||||||
Whitestone REIT — Class B | 45 | 536 | ||||||
EMC Insurance Group, Inc. | 26 | 535 | ||||||
MPG Office Trust, Inc.* | 267 | 531 | ||||||
Sun Bancorp, Inc.* | 212 | 513 | ||||||
Bridge Capital Holdings* | 49 | 510 | ||||||
Heritage Commerce Corp.* | 107 | 507 | ||||||
Suffolk Bancorp* | 46 | 496 | ||||||
New Mountain Finance Corp. | 37 | 496 | ||||||
Cape Bancorp, Inc.* | 61 | 479 | ||||||
Hallmark Financial Services* | 66 | 461 | ||||||
Roma Financial Corp. | 45 | 443 | ||||||
Clifton Savings Bancorp, Inc. | 43 | 399 | ||||||
Ames National Corp. | 20 | 390 | ||||||
Universal Insurance Holdings, Inc. | 107 | 383 | ||||||
Charter Financial Corp. | 40 | 370 | ||||||
Avatar Holdings, Inc.* | 50 | 359 | ||||||
CIFC Corp.* | 62 | 335 | ||||||
Orrstown Financial Services, Inc. | 40 | 330 | ||||||
Independence Holding Co. | 37 | 301 | ||||||
Fidus Investment Corp. | 21 | 272 | ||||||
Bridge Bancorp, Inc. | 13 | 259 | ||||||
Gain Capital Holdings, Inc. | 38 | 255 | ||||||
Pzena Investment Management, Inc. — Class A | 48 | 208 | ||||||
Imperial Holdings, Inc.* | 103 | 194 | ||||||
Fortegra Financial Corp.* | 27 | 180 | ||||||
Enterprise Bancorp, Inc. | 10 | 143 | ||||||
First Marblehead Corp.* | 113 | 132 | ||||||
Hampton Roads Bankshares, Inc.* | 46 | 126 | ||||||
Cascade Bancorp* | 25 | 110 | ||||||
Capital Bank Corp.* | 34 | 68 | ||||||
|
| |||||||
Total Financials | 1,347,578 | |||||||
|
| |||||||
INFORMATION TECHNOLOGY - 9.6% | ||||||||
Netlogic Microsystems, Inc.* | 375 | 18,589 | ||||||
SuccessFactors, Inc.* | 466 | 18,579 | ||||||
Jack Henry & Associates, Inc. | 485 | 16,301 | ||||||
Concur Technologies, Inc.* | 246 | 12,494 | ||||||
Parametric Technology Corp.* | 672 | 12,271 | ||||||
Wright Express Corp.* | 218 | 11,833 | ||||||
InterDigital, Inc. | 257 | 11,197 | ||||||
ADTRAN, Inc. | 366 | 11,039 | ||||||
CommVault Systems, Inc.* | 239 | 10,210 | ||||||
Anixter International, Inc.* | 170 | 10,139 | ||||||
Ultimate Software Group, Inc.* | 151 | 9,833 | ||||||
QLIK Technologies, Inc.* | 389 | 9,414 | ||||||
CACI International, Inc. — Class A* | 168 | 9,395 | ||||||
Plantronics, Inc. | 263 | 9,373 | ||||||
Semtech Corp.* | 370 | 9,183 | ||||||
Taleo Corp. — Class A* | 236 | 9,131 | ||||||
SolarWinds, Inc.* | 324 | 9,056 | ||||||
Viasat, Inc.* | 196 | 9,040 | ||||||
FEI Co.* | 219 | 8,931 | ||||||
Aruba Networks, Inc.* | 480 | 8,890 | ||||||
Hittite Microwave Corp.* | 175 | 8,641 | ||||||
Cognex Corp. | 239 | 8,554 | ||||||
Finisar Corp.* | 501 | 8,389 | ||||||
RF Micro Devices, Inc.* | 1,550 | 8,370 | ||||||
Cymer, Inc.* | 168 | 8,360 | ||||||
Aspen Technology, Inc.* | 476 | 8,259 | ||||||
Microsemi Corp.* | 482 | 8,074 | ||||||
Universal Display Corp.* | 220 | 8,072 | ||||||
MAXIMUS, Inc. | 195 | 8,063 | ||||||
MKS Instruments, Inc. | 287 | 7,984 | ||||||
Fair Isaac Corp. | 219 | 7,849 | ||||||
JDA Software Group, Inc.* | 241 | 7,806 | ||||||
Sapient Corp. | 610 | 7,686 | ||||||
Cavium, Inc.* | 266 | 7,562 | ||||||
Arris Group, Inc.* | 698 | 7,552 | ||||||
Convergys Corp.* | 591 | 7,547 | ||||||
Mentor Graphics Corp.* | 544 | 7,377 | ||||||
j2 Global, Inc. | 262 | 7,373 | ||||||
Netgear, Inc.* | 215 | 7,218 | ||||||
ValueClick, Inc.* | 441 | 7,184 | ||||||
Progress Software Corp.* | 369 | 7,140 | ||||||
Coherent, Inc.* | 133 | 6,952 | ||||||
Blackbaud, Inc. | 245 | 6,786 | ||||||
Entegris, Inc.* | 760 | 6,631 | ||||||
DealerTrack Holdings, Inc.* | 239 | 6,515 | ||||||
Cardtronics, Inc.* | 239 | 6,467 | ||||||
Quest Software, Inc.* | 346 | 6,436 | ||||||
Cabot Microelectronics Corp.* | 132 | 6,237 | ||||||
Blue Coat Systems, Inc.* | 241 | 6,133 | ||||||
NetSuite, Inc.* | 151 | 6,123 | ||||||
TiVo, Inc.* | 675 | 6,055 | ||||||
Cirrus Logic, Inc.* | 374 | 5,928 | ||||||
RightNow Technologies, Inc.* | 134 | 5,726 | ||||||
| 108 | THE RYDEX FUNDSANNUALREPORT | See Notes to Financial Statements. |
| SCHEDULE OF INVESTMENTS (continued) | December 31, 2011 |
RUSSELL 2000® 1.5x STRATEGY FUND
| SHARES | VALUE | |||||||
Take-Two Interactive Software, Inc.* | 419 | $ | 5,677 | |||||
Power Integrations, Inc. | 171 | 5,670 | ||||||
ACI Worldwide, Inc.* | 196 | 5,613 | ||||||
Acxiom Corp.* | 455 | 5,556 | ||||||
Synaptics, Inc.* | 183 | 5,517 | ||||||
Littelfuse, Inc. | 128 | 5,501 | ||||||
Scansource, Inc.* | 151 | 5,436 | ||||||
Tyler Technologies, Inc.* | 179 | 5,390 | ||||||
Plexus Corp.* | 194 | 5,312 | ||||||
Heartland Payment Systems, Inc. | 218 | 5,310 | ||||||
Euronet Worldwide, Inc.* | 286 | 5,285 | ||||||
Manhattan Associates, Inc.* | 126 | 5,100 | ||||||
OSI Systems, Inc.* | 104 | 5,073 | ||||||
GT Advanced Technologies, Inc.* | 698 | 5,054 | ||||||
OpenTable, Inc.* | 129 | 5,048 | ||||||
Sourcefire, Inc.* | 152 | 4,922 | ||||||
Tessera Technologies, Inc.* | 287 | 4,807 | ||||||
Unisys Corp.* | 243 | 4,790 | ||||||
Bottomline Technologies, Inc.* | 203 | 4,704 | ||||||
NIC, Inc. | 350 | 4,659 | ||||||
Benchmark Electronics, Inc.* | 344 | 4,634 | ||||||
Veeco Instruments, Inc.* | 221 | 4,597 | ||||||
Synchronoss Technologies, Inc.* | 152 | 4,592 | ||||||
MicroStrategy, Inc. — Class A* | 42 | 4,549 | ||||||
Integrated Device Technology, Inc.* | 828 | 4,521 | ||||||
TriQuint Semiconductor, Inc.* | 919 | 4,476 | ||||||
Comtech Telecommunications Corp. | 152 | 4,350 | ||||||
Advent Software, Inc.* | 178 | 4,336 | ||||||
RealPage, Inc.* | 171 | 4,321 | ||||||
Sanmina-SCI Corp.* | 457 | 4,255 | ||||||
Diodes, Inc.* | 199 | 4,239 | ||||||
Brightpoint, Inc.* | 390 | 4,196 | ||||||
LogMeIn, Inc.* | 108 | 4,163 | ||||||
Loral Space & Communications, Inc.* | 64 | 4,152 | ||||||
Rambus, Inc.* | 548 | 4,137 | ||||||
FARO Technologies, Inc.* | 89 | 4,094 | ||||||
Mantech International Corp. — Class A | 131 | 4,092 | ||||||
Websense, Inc.* | 218 | 4,083 | ||||||
Syntel, Inc. | 86 | 4,022 | ||||||
SYNNEX Corp.* | 132 | 4,021 | ||||||
Insight Enterprises, Inc.* | 261 | 3,991 | ||||||
Liquidity Services, Inc.* | 108 | 3,985 | ||||||
Kenexa Corp.* | 149 | 3,978 | ||||||
Earthlink, Inc. | 614 | 3,954 | ||||||
Ancestry.com, Inc.* | 172 | 3,949 | ||||||
Ceva, Inc.* | 130 | 3,934 | ||||||
Omnivision Technologies, Inc.* | 321 | 3,927 | ||||||
Lattice Semiconductor Corp.* | 655 | 3,891 | ||||||
Tekelec* | 351 | 3,836 | ||||||
Stratasys, Inc.* | 126 | 3,832 | ||||||
Brooks Automation, Inc. | 370 | 3,800 | ||||||
BroadSoft, Inc.* | 125 | 3,775 | ||||||
LivePerson, Inc.* | 300 | 3,765 | ||||||
Netscout Systems, Inc.* | 212 | 3,731 | ||||||
MTS Systems Corp. | 91 | 3,708 | ||||||
Kulicke & Soffa Industries, Inc.* | 400 | 3,700 | ||||||
comScore, Inc.* | 174 | 3,689 | ||||||
Infinera Corp.* | 587 | 3,686 | ||||||
Electronics for Imaging, Inc.* | 258 | 3,676 | ||||||
Constant Contact, Inc.* | 158 | 3,667 | ||||||
Standard Microsystems Corp.* | 135 | 3,479 | ||||||
Rofin-Sinar Technologies, Inc.* | 152 | 3,473 | ||||||
Verint Systems, Inc.* | 126 | 3,470 | ||||||
ATMI, Inc.* | 173 | 3,465 | ||||||
3D Systems Corp.* | 239 | 3,442 | ||||||
Volterra Semiconductor Corp.* | 134 | 3,432 | ||||||
Emulex Corp.* | 495 | 3,396 | ||||||
Ebix, Inc. | 153 | 3,381 | ||||||
Digital River, Inc.* | 223 | 3,349 | ||||||
Ultratech, Inc.* | 132 | 3,243 | ||||||
Harmonic, Inc.* | 635 | 3,200 | ||||||
Rogers Corp.* | 85 | 3,133 | ||||||
TTM Technologies, Inc.* | 284 | 3,113 | ||||||
Opnet Technologies, Inc. | 84 | 3,080 | ||||||
Monotype Imaging Holdings, Inc.* | 196 | 3,056 | ||||||
Quantum Corp.* | 1,261 | 3,026 | ||||||
Black Box Corp. | 105 | 2,944 | ||||||
Newport Corp.* | 215 | 2,926 | ||||||
S1 Corp.* | 305 | 2,919 | ||||||
Sonus Networks, Inc.* | 1,180 | 2,832 | ||||||
Micrel, Inc. | 280 | 2,831 | ||||||
CSG Systems International, Inc.* | 192 | 2,824 | ||||||
Forrester Research, Inc.* | 82 | 2,783 | ||||||
DTS, Inc.* | 102 | 2,778 | ||||||
Park Electrochemical Corp. | 107 | 2,741 | ||||||
iGate Corp.* | 173 | 2,721 | ||||||
United Online, Inc. | 500 | 2,720 | ||||||
TNS, Inc.* | 152 | 2,693 | ||||||
Magma Design Automation, Inc.* | 370 | 2,657 | ||||||
Monolithic Power Systems, Inc.* | 174 | 2,622 | ||||||
Badger Meter, Inc. | 88 | 2,590 | ||||||
Advanced Energy Industries, Inc.* | 240 | 2,575 | ||||||
Amkor Technology, Inc.* | 590 | 2,572 | ||||||
Pegasystems, Inc. | 87 | 2,558 | ||||||
Maxwell Technologies, Inc.* | 155 | 2,517 | ||||||
Bankrate, Inc.* | 117 | 2,516 | ||||||
SS&C Technologies Holdings, Inc.* | 138 | 2,492 | ||||||
| See Notes to Financial Statements. | THE RYDEX FUNDSANNUALREPORT | 109 |
| SCHEDULE OF INVESTMENTS (continued) | December 31, 2011 |
RUSSELL 2000® 1.5x STRATEGY FUND
| SHARES | VALUE | |||||||
Entropic Communications, Inc.* | 485 | $ | 2,478 | |||||
Measurement Specialties, Inc.* | 88 | 2,460 | ||||||
Checkpoint Systems, Inc.* | 222 | 2,429 | ||||||
InfoSpace, Inc.* | 217 | 2,385 | ||||||
Spansion, Inc. — Class A* | 287 | 2,376 | ||||||
Applied Micro Circuits Corp.* | 353 | 2,372 | ||||||
Super Micro Computer, Inc.* | 150 | 2,352 | ||||||
Xyratex Ltd. | 175 | 2,331 | ||||||
Ixia* | 220 | 2,312 | ||||||
Intermec, Inc.* | 332 | 2,278 | ||||||
Vocus, Inc.* | 103 | 2,275 | ||||||
DemandTec, Inc.* | 172 | 2,265 | ||||||
Mercury Computer Systems, Inc.* | 169 | 2,246 | ||||||
Dice Holdings, Inc.* | 266 | 2,205 | ||||||
VirnetX Holding Corp.* | 87 | 2,172 | ||||||
TeleTech Holdings, Inc.* | 132 | 2,138 | ||||||
EPIQ Systems, Inc. | 174 | 2,091 | ||||||
Accelrys, Inc.* | 309 | 2,076 | ||||||
Silicon Image, Inc.* | 436 | 2,049 | ||||||
STEC, Inc.* | 235 | 2,019 | ||||||
Photronics, Inc.* | 330 | 2,006 | ||||||
Silicon Graphics International Corp.* | 175 | 2,006 | ||||||
Sycamore Networks, Inc.* | 109 | 1,951 | ||||||
Web.com Group, Inc.* | 170 | 1,947 | ||||||
ExlService Holdings, Inc.* | 87 | 1,946 | ||||||
Electro Scientific Industries, Inc.* | 132 | 1,911 | ||||||
Interactive Intelligence Group, Inc.* | 83 | 1,902 | ||||||
RealD, Inc.* | 238 | 1,890 | ||||||
Oplink Communications, Inc.* | 114 | 1,878 | ||||||
OCZ Technology Group, Inc.* | 284 | 1,877 | ||||||
KIT Digital, Inc.* | 221 | 1,867 | ||||||
Electro Rent Corp. | 108 | 1,852 | ||||||
Daktronics, Inc. | 192 | 1,837 | ||||||
PROS Holdings, Inc.* | 123 | 1,830 | ||||||
Keynote Systems, Inc. | 89 | 1,828 | ||||||
Methode Electronics, Inc. | 215 | 1,782 | ||||||
CTS Corp. | 192 | 1,766 | ||||||
Kemet Corp.* | 246 | 1,734 | ||||||
Cass Information Systems, Inc. | 47 | 1,710 | ||||||
Globecomm Systems, Inc.* | 125 | 1,710 | ||||||
Internap Network Services Corp.* | 284 | 1,687 | ||||||
Stamps.com, Inc.* | 64 | 1,672 | ||||||
ICG Group, Inc.* | 216 | 1,668 | ||||||
ShoreTel, Inc.* | 259 | 1,652 | ||||||
Global Cash Access Holdings, Inc.* | 366 | 1,629 | ||||||
Rudolph Technologies, Inc.* | 172 | 1,593 | ||||||
LoopNet, Inc.* | 87 | 1,590 | ||||||
Digi International, Inc.* | 140 | 1,562 | ||||||
Zygo Corp.* | 88 | 1,553 | ||||||
GSI Group, Inc.* | 151 | 1,545 | ||||||
Cohu, Inc. | 135 | 1,532 | ||||||
Power-One, Inc.* | 390 | 1,525 | ||||||
Extreme Networks* | 517 | 1,510 | ||||||
LTX-Credence Corp.* | 279 | 1,493 | ||||||
Fabrinet* | 107 | 1,464 | ||||||
Anaren, Inc.* | 88 | 1,463 | ||||||
IXYS Corp.* | 135 | 1,462 | ||||||
XO Group, Inc.* | 174 | 1,451 | ||||||
Kopin Corp.* | 371 | 1,439 | ||||||
Avid Technology, Inc.* | 168 | 1,433 | ||||||
QuinStreet, Inc.* | 152 | 1,423 | ||||||
Formfactor, Inc.* | 281 | 1,422 | ||||||
STR Holdings, Inc.* | 172 | 1,416 | ||||||
Calix, Inc.* | 218 | 1,410 | ||||||
Move, Inc.* | 223 | 1,409 | ||||||
Advanced Analogic Technologies, Inc.* | 241 | 1,393 | ||||||
NVE Corp.* | 25 | 1,388 | ||||||
Integrated Silicon Solution, Inc.* | 151 | 1,380 | ||||||
CIBER, Inc.* | 352 | 1,359 | ||||||
Perficient, Inc.* | 135 | 1,351 | ||||||
MIPS Technologies, Inc. — Class A* | 302 | 1,347 | ||||||
Exar Corp.* | 202 | 1,313 | ||||||
Symmetricom, Inc.* | 240 | 1,294 | ||||||
Procera Networks, Inc.* | 83 | 1,293 | ||||||
Inphi Corp.* | 108 | 1,292 | ||||||
ModusLink Global Solutions, Inc. | 239 | 1,291 | ||||||
Virtusa Corp.* | 89 | 1,289 | ||||||
Cray, Inc.* | 196 | 1,268 | ||||||
Envestnet, Inc.* | 106 | 1,268 | ||||||
Deltek, Inc.* | 128 | 1,257 | ||||||
Computer Task Group, Inc.* | 87 | 1,225 | ||||||
Bel Fuse, Inc. — Class B | 64 | 1,200 | ||||||
American Software, Inc. — Class A | 126 | 1,191 | ||||||
Saba Software, Inc.* | 150 | 1,183 | ||||||
Supertex, Inc.* | 62 | 1,171 | ||||||
Actuate Corp.* | 196 | 1,149 | ||||||
IntraLinks Holdings, Inc.* | 180 | 1,123 | ||||||
Vishay Precision Group, Inc.* | 70 | 1,119 | ||||||
SPS Commerce, Inc.* | 43 | 1,116 | ||||||
Cornerstone OnDemand, Inc.* | 61 | 1,113 | ||||||
Sigma Designs, Inc.* | 180 | 1,080 | ||||||
Callidus Software, Inc.* | 167 | 1,072 | ||||||
Seachange International, Inc.* | 151 | 1,062 | ||||||
Richardson Electronics Ltd. | 86 | 1,057 | ||||||
Zix Corp.* | 373 | 1,052 | ||||||
Pericom Semiconductor Corp.* | 133 | 1,012 | ||||||
Multi-Fineline Electronix, Inc.* | 49 | 1,007 | ||||||
SciQuest, Inc.* | 70 | 999 | ||||||
Wave Systems Corp. — Class A* | 459 | 996 | ||||||
| 110 | THE RYDEX FUNDSANNUALREPORT | See Notes to Financial Statements. |
| SCHEDULE OF INVESTMENTS (continued) | December 31, 2011 |
RUSSELL 2000® 1.5x STRATEGY FUND
| SHARES | VALUE | |||||||
Imation Corp.* | 173 | $ | 991 | |||||
Echo Global Logistics, Inc.* | 61 | 985 | ||||||
VASCO Data Security International, Inc.* | 150 | 978 | ||||||
Intevac, Inc.* | 132 | 977 | ||||||
Echelon Corp.* | 199 | 969 | ||||||
Rubicon Technology, Inc.* | 103 | 967 | ||||||
Active Network, Inc.* | 70 | 952 | ||||||
Tangoe, Inc.* | 61 | 939 | ||||||
PDF Solutions, Inc.* | 134 | 934 | ||||||
ServiceSource International, Inc.* | 58 | 910 | ||||||
Mindspeed Technologies, Inc.* | 196 | 898 | ||||||
RealNetworks, Inc. | 112 | 840 | ||||||
Agilysys, Inc.* | 104 | 827 | ||||||
DDi Corp. | 88 | 821 | ||||||
Immersion Corp.* | 158 | 818 | ||||||
Glu Mobile, Inc.* | 260 | 816 | ||||||
Anadigics, Inc.* | 371 | 812 | ||||||
FSI International, Inc.* | 220 | 805 | ||||||
Marchex, Inc. — Class A | 128 | 800 | ||||||
Lionbridge Technologies, Inc.* | 349 | 799 | ||||||
Oclaro, Inc.* | 279 | 787 | ||||||
Axcelis Technologies, Inc.* | 587 | 781 | ||||||
Ultra Clean Holdings* | 127 | 776 | ||||||
Convio, Inc.* | 69 | 763 | ||||||
Openwave Systems, Inc.* | 479 | 757 | ||||||
LeCroy Corp.* | 89 | 748 | ||||||
MoSys, Inc.* | 177 | 743 | ||||||
Nanometrics, Inc.* | 40 | 737 | ||||||
Digimarc Corp.* | 30 | 717 | ||||||
X-Rite, Inc.* | 151 | 701 | ||||||
PLX Technology, Inc.* | 243 | 697 | ||||||
TeleNav, Inc.* | 89 | 695 | ||||||
DSP Group, Inc.* | 132 | 688 | ||||||
KVH Industries, Inc.* | 88 | 685 | ||||||
Westell Technologies, Inc. — Class A* | 300 | 666 | ||||||
Pulse Electronics Corp. | 234 | 655 | ||||||
PRGX Global, Inc.* | 109 | 649 | ||||||
Hackett Group, Inc.* | 169 | 632 | ||||||
Aviat Networks, Inc.* | 343 | 628 | ||||||
TeleCommunication Systems, Inc.* | 260 | 611 | ||||||
Communications Systems, Inc. | 43 | 605 | ||||||
Alpha & Omega Semiconductor Ltd.* | 82 | 599 | ||||||
support.com, Inc.* | 262 | 589 | ||||||
ORBCOMM, Inc.* | 192 | 574 | ||||||
Guidance Software, Inc.* | 88 | 570 | ||||||
Radisys Corp.* | 110 | 557 | ||||||
Dynamics Research Corp.* | 49 | 556 | ||||||
Novatel Wireless, Inc.* | 175 | 548 | ||||||
PC Connection, Inc. | 48 | 532 | ||||||
Rimage Corp. | 47 | 529 | ||||||
GSI Technology, Inc.* | 109 | 510 | ||||||
ePlus, Inc.* | 18 | 509 | ||||||
Identive Group, Inc.* | 219 | 488 | ||||||
Rosetta Stone, Inc.* | 63 | 481 | ||||||
TechTarget, Inc.* | 82 | 479 | ||||||
NCI, Inc.* | 39 | 454 | ||||||
FalconStor Software, Inc.* | 175 | 452 | ||||||
Emcore Corp.* | 500 | 431 | ||||||
Dot Hill Systems Corp.* | 323 | 430 | ||||||
Limelight Networks, Inc.* | 145 | 429 | ||||||
Responsys, Inc.* | 48 | 427 | ||||||
QAD, Inc. — Class A* | 40 | 420 | ||||||
Carbonite, Inc.* | 37 | 411 | ||||||
Aeroflex Holding Corp.* | 40 | 410 | ||||||
Amtech Systems, Inc.* | 48 | 408 | ||||||
MaxLinear, Inc. — Class A* | 84 | 399 | ||||||
Numerex Corp. — Class A* | 48 | 395 | ||||||
MoneyGram International, Inc.* | 22 | 391 | ||||||
eMagin Corp.* | 103 | 381 | ||||||
SRS Labs, Inc.* | 66 | 380 | ||||||
Powerwave Technologies, Inc.* | 178 | 370 | ||||||
Travelzoo, Inc.* | 12 | 295 | ||||||
Demand Media, Inc.* | 43 | 286 | ||||||
THQ, Inc.* | 371 | 282 | ||||||
AXT, Inc.* | 67 | 279 | ||||||
Meru Networks, Inc.* | 65 | 268 | ||||||
Ellie Mae, Inc.* | 43 | 243 | ||||||
NeoPhotonics Corp.* | 49 | 224 | ||||||
Smith Micro Software, Inc.* | 196 | 221 | ||||||
Motricity, Inc.* | 218 | 196 | ||||||
Opnext, Inc.* | 238 | 192 | ||||||
Viasystems Group, Inc.* | 10 | 169 | ||||||
Stream Global Services, Inc.* | 49 | 162 | ||||||
Dialogic, Inc.* | 86 | 103 | ||||||
Quepasa Corp.* | 14 | 46 | ||||||
FriendFinder Networks, Inc.* | 25 | 19 | ||||||
|
| |||||||
Total Information Technology | 1,053,129 | |||||||
|
| |||||||
INDUSTRIALS - 8.7% | ||||||||
Clean Harbors, Inc.* | 264 | 16,825 | ||||||
Alaska Air Group, Inc.* | 197 | 14,793 | ||||||
Woodward, Inc. | 350 | 14,326 | ||||||
CLARCOR, Inc. | 280 | 13,997 | ||||||
HEICO Corp. | 235 | 13,743 | ||||||
Genesee & Wyoming, Inc. — Class A* | 220 | 13,328 | ||||||
Hexcel Corp.* | 545 | 13,194 | ||||||
Acuity Brands, Inc. | 241 | 12,773 | ||||||
Triumph Group, Inc. | 212 | 12,391 | ||||||
Dollar Thrifty Automotive Group, Inc.* | 171 | 12,014 | ||||||
Moog, Inc. — Class A* | 262 | 11,510 | ||||||
Teledyne Technologies, Inc.* | 202 | 11,080 | ||||||
Old Dominion Freight Line, Inc.* | 262 | 10,619 | ||||||
| See Notes to Financial Statements. | THE RYDEX FUNDSANNUALREPORT | 111 |
| SCHEDULE OF INVESTMENTS (continued) | December 31, 2011 |
RUSSELL 2000® 1.5x STRATEGY FUND
| SHARES | VALUE | |||||||
Robbins & Myers, Inc. | 217 | $ | 10,535 | |||||
United Rentals, Inc.* | 346 | 10,224 | ||||||
FTI Consulting, Inc.* | 240 | 10,181 | ||||||
Middleby Corp.* | 107 | 10,062 | ||||||
Watsco, Inc. | 152 | 9,980 | ||||||
EMCOR Group, Inc. | 369 | 9,893 | ||||||
Esterline Technologies Corp.* | 169 | 9,459 | ||||||
CoStar Group, Inc.* | 139 | 9,275 | ||||||
Curtiss-Wright Corp. | 259 | 9,150 | ||||||
Acacia Research - Acacia Technologies* | 243 | 8,872 | ||||||
Actuant Corp. — Class A | 389 | 8,826 | ||||||
AO Smith Corp. | 218 | 8,746 | ||||||
Belden, Inc. | 262 | 8,719 | ||||||
United Stationers, Inc. | 262 | 8,531 | ||||||
Applied Industrial Technologies, Inc. | 241 | 8,476 | ||||||
Chart Industries, Inc.* | 156 | 8,435 | ||||||
Brady Corp. — Class A | 266 | 8,398 | ||||||
Mueller Industries, Inc. | 211 | 8,107 | ||||||
Simpson Manufacturing Company, Inc. | 239 | 8,045 | ||||||
Rollins, Inc. | 352 | 7,821 | ||||||
Tetra Tech, Inc.* | 347 | 7,492 | ||||||
EnerSys* | 282 | 7,324 | ||||||
Corporate Executive Board Co. | 192 | 7,315 | ||||||
Barnes Group, Inc. | 301 | 7,257 | ||||||
JetBlue Airways Corp.* | 1,378 | 7,166 | ||||||
Brink’s Co. | 261 | 7,016 | ||||||
HUB Group, Inc. — Class A* | 215 | 6,972 | ||||||
RSC Holdings, Inc.* | 370 | 6,845 | ||||||
Healthcare Services Group, Inc. | 376 | 6,651 | ||||||
Deluxe Corp. | 286 | 6,509 | ||||||
Advisory Board Co.* | 87 | 6,456 | ||||||
HNI Corp. | 246 | 6,421 | ||||||
Raven Industries, Inc. | 103 | 6,376 | ||||||
Avis Budget Group, Inc.* | 589 | 6,314 | ||||||
Portfolio Recovery Associates, Inc.* | 92 | 6,212 | ||||||
ABM Industries, Inc. | 300 | 6,186 | ||||||
Geo Group, Inc.* | 369 | 6,181 | ||||||
Watts Water Technologies, Inc. — Class A | 176 | 6,021 | ||||||
Herman Miller, Inc. | 324 | 5,978 | ||||||
Franklin Electric Company, Inc. | 133 | 5,793 | ||||||
Atlas Air Worldwide Holdings, Inc.* | 150 | 5,765 | ||||||
Werner Enterprises, Inc. | 239 | 5,760 | ||||||
MasTec, Inc.* | 313 | 5,437 | ||||||
Kaydon Corp. | 177 | 5,398 | ||||||
Knight Transportation, Inc. | 342 | 5,349 | ||||||
II-VI, Inc.* | 289 | 5,306 | ||||||
Beacon Roofing Supply, Inc.* | 262 | 5,300 | ||||||
RBC Bearings, Inc.* | 126 | 5,254 | ||||||
Granite Construction, Inc. | 216 | 5,124 | ||||||
Mine Safety Appliances Co. | 153 | 5,067 | ||||||
Forward Air Corp. | 156 | 5,000 | ||||||
Huron Consulting Group, Inc.* | 127 | 4,920 | ||||||
Unifirst Corp. | 86 | 4,880 | ||||||
Orbital Sciences Corp.* | 326 | 4,737 | ||||||
Allegiant Travel Co.* | 88 | 4,694 | ||||||
Titan International, Inc. | 241 | 4,690 | ||||||
US Airways Group, Inc.* | 909 | 4,609 | ||||||
Korn* | 265 | 4,521 | ||||||
Briggs & Stratton Corp. | 286 | 4,430 | ||||||
ESCO Technologies, Inc. | 152 | 4,375 | ||||||
Amerco, Inc. | 49 | 4,332 | ||||||
Kaman Corp. | 153 | 4,180 | ||||||
AAR Corp. | 217 | 4,160 | ||||||
Aircastle Ltd. | 325 | 4,134 | ||||||
Dycom Industries, Inc.* | 197 | 4,121 | ||||||
Blount International, Inc.* | 281 | 4,080 | ||||||
Tennant Co. | 104 | 4,042 | ||||||
Heartland Express, Inc. | 280 | 4,001 | ||||||
Exponent, Inc.* | 87 | 3,999 | ||||||
USG Corp.* | 393 | 3,993 | ||||||
Knoll, Inc. | 264 | 3,920 | ||||||
McGrath Rentcorp | 134 | 3,885 | ||||||
Colfax Corp.* | 133 | 3,788 | ||||||
Rush Enterprises, Inc. — Class A* | 181 | 3,787 | ||||||
SkyWest, Inc. | 300 | 3,777 | ||||||
SYKES Enterprises, Inc.* | 240 | 3,758 | ||||||
Mobile Mini, Inc.* | 215 | 3,752 | ||||||
Lindsay Corp. | 68 | 3,733 | ||||||
Generac Holdings, Inc.* | 133 | 3,728 | ||||||
Cubic Corp. | 85 | 3,705 | ||||||
TAL International Group, Inc. | 126 | 3,628 | ||||||
Swift Transportation Co.* | 438 | 3,609 | ||||||
Ceradyne, Inc.* | 134 | 3,589 | ||||||
Astec Industries, Inc.* | 110 | 3,543 | ||||||
EnPro Industries, Inc.* | 107 | 3,529 | ||||||
Albany International Corp. — Class A | 152 | 3,514 | ||||||
Interface, Inc. — Class A | 304 | 3,508 | ||||||
Universal Forest Products, Inc. | 111 | 3,427 | ||||||
TrueBlue, Inc.* | 245 | 3,401 | ||||||
Aegion Corp.* | 218 | 3,344 | ||||||
American Science & Engineering, Inc. | 49 | 3,337 | ||||||
Team, Inc.* | 112 | 3,332 | ||||||
DigitalGlobe, Inc.* | 192 | 3,285 | ||||||
Steelcase, Inc. — Class A | 438 | 3,267 | ||||||
Navigant Consulting, Inc.* | 284 | 3,240 | ||||||
Insperity, Inc. | 126 | 3,194 | ||||||
CIRCOR International, Inc. | 90 | 3,178 | ||||||
Quanex Building Products Corp. | 211 | 3,169 | ||||||
AZZ, Inc. | 69 | 3,135 | ||||||
G&K Services, Inc. — Class A | 107 | 3,115 | ||||||
| 112 | THE RYDEX FUNDSANNUALREPORT | See Notes to Financial Statements. |
| SCHEDULE OF INVESTMENTS (continued) | December 31, 2011 |
RUSSELL 2000® 1.5x STRATEGY FUND
| SHARES | VALUE | |||||||
Higher One Holdings, Inc.* | 168 | $ | 3,098 | |||||
Interline Brands, Inc.* | 196 | 3,052 | ||||||
Wabash National Corp.* | 386 | 3,026 | ||||||
ACCO Brands Corp.* | 303 | 2,924 | ||||||
GeoEye, Inc.* | 129 | 2,866 | ||||||
Altra Holdings, Inc.* | 151 | 2,843 | ||||||
Encore Wire Corp. | 108 | 2,797 | ||||||
Resources Connection, Inc. | 260 | 2,753 | ||||||
Aerovironment, Inc.* | 86 | 2,706 | ||||||
Greenbrier Companies, Inc.* | 111 | 2,695 | ||||||
ICF International, Inc.* | 108 | 2,676 | ||||||
Trimas Corp.* | 147 | 2,639 | ||||||
Layne Christensen Co.* | 109 | 2,638 | ||||||
Sun Hydraulics Corp. | 110 | 2,577 | ||||||
Arkansas Best Corp. | 132 | 2,544 | ||||||
Gorman-Rupp Co. | 88 | 2,389 | ||||||
On Assignment, Inc.* | 213 | 2,381 | ||||||
Kforce, Inc.* | 193 | 2,380 | ||||||
Consolidated Graphics, Inc.* | 49 | 2,366 | ||||||
Gibraltar Industries, Inc.* | 169 | 2,359 | ||||||
Standex International Corp. | 69 | 2,357 | ||||||
NACCO Industries, Inc. — Class A | 26 | 2,320 | ||||||
John Bean Technologies Corp. | 150 | 2,305 | ||||||
Astronics Corp.* | 64 | 2,292 | ||||||
Cascade Corp. | 48 | 2,264 | ||||||
Comfort Systems USA, Inc. | 211 | 2,262 | ||||||
Primoris Services Corp. | 151 | 2,254 | ||||||
Heidrick & Struggles International, Inc. | 103 | 2,219 | ||||||
Sauer-Danfoss, Inc.* | 61 | 2,209 | ||||||
AAON, Inc. | 107 | 2,192 | ||||||
Tutor Perini Corp.* | 176 | 2,172 | ||||||
Global Power Equipment Group, Inc.* | 90 | 2,138 | ||||||
Mueller Water Products, Inc. — Class A | 872 | 2,128 | ||||||
Mistras Group, Inc.* | 82 | 2,090 | ||||||
MYR Group, Inc.* | 109 | 2,086 | ||||||
Kelly Services, Inc. — Class A | 152 | 2,079 | ||||||
US Ecology, Inc. | 110 | 2,066 | ||||||
Trex Company, Inc.* | 90 | 2,062 | ||||||
Ennis, Inc. | 153 | 2,039 | ||||||
H&E Equipment Services, Inc.* | 151 | 2,026 | ||||||
PMFG, Inc.* | 103 | 2,010 | ||||||
Quad | 132 | 1,893 | ||||||
Viad Corp. | 108 | 1,888 | ||||||
Apogee Enterprises, Inc. | 153 | 1,876 | ||||||
Titan Machinery, Inc.* | 86 | 1,869 | ||||||
Encore Capital Group, Inc.* | 87 | 1,850 | ||||||
Great Lakes Dredge & Dock Corp. | 329 | 1,829 | ||||||
RailAmerica, Inc.* | 121 | 1,802 | ||||||
Textainer Group Holdings Ltd. | 61 | 1,776 | ||||||
Swisher Hygiene, Inc.* | 474 | 1,773 | ||||||
Taser International, Inc.* | 343 | 1,756 | ||||||
GenCorp, Inc.* | 327 | 1,740 | ||||||
Wesco Aircraft Holdings, Inc.* | 118 | 1,651 | ||||||
Hawaiian Holdings, Inc.* | 280 | 1,624 | ||||||
Capstone Turbine Corp.* | 1,377 | 1,597 | ||||||
Douglas Dynamics, Inc. | 109 | 1,594 | ||||||
Marten Transport Ltd. | 88 | 1,583 | ||||||
Kadant, Inc.* | 70 | 1,583 | ||||||
Accuride Corp.* | 222 | 1,581 | ||||||
DXP Enterprises, Inc.* | 49 | 1,578 | ||||||
Standard Parking Corp.* | 88 | 1,573 | ||||||
Multi-Color Corp. | 61 | 1,570 | ||||||
Twin Disc, Inc. | 43 | 1,562 | ||||||
Powell Industries, Inc.* | 49 | 1,533 | ||||||
Dolan Co.* | 170 | 1,448 | ||||||
Federal Signal Corp.* | 348 | 1,444 | ||||||
Air Transport Services Group, Inc.* | 302 | 1,425 | ||||||
Houston Wire & Cable Co. | 103 | 1,423 | ||||||
Ameresco, Inc. — Class A* | 103 | 1,413 | ||||||
EnerNOC, Inc.* | 130 | 1,413 | ||||||
Commercial Vehicle Group, Inc.* | 156 | 1,410 | ||||||
EnergySolutions, Inc.* | 456 | 1,409 | ||||||
InnerWorkings, Inc.* | 151 | 1,406 | ||||||
Spirit Airlines, Inc.* | 90 | 1,404 | ||||||
American Railcar Industries, Inc.* | 58 | 1,388 | ||||||
FreightCar America, Inc.* | 66 | 1,383 | ||||||
Dynamic Materials Corp. | 69 | 1,365 | ||||||
CBIZ, Inc.* | 222 | 1,356 | ||||||
Furmanite Corp.* | 214 | 1,350 | ||||||
LB Foster Co. | 47 | 1,330 | ||||||
Columbus McKinnon Corp.* | 104 | 1,320 | ||||||
Celadon Group, Inc. | 109 | 1,287 | ||||||
CRA International, Inc.* | 64 | 1,270 | ||||||
GP Strategies Corp.* | 89 | 1,200 | ||||||
Preformed Line Products Co. | 20 | 1,193 | ||||||
NCI Building Systems, Inc.* | 109 | 1,185 | ||||||
Genco Shipping & Trading Ltd.* | 170 | 1,149 | ||||||
Insteel Industries, Inc. | 103 | 1,132 | ||||||
Odyssey Marine Exploration, Inc.* | 412 | 1,129 | ||||||
Kratos Defense & Security Solutions, Inc.* | 188 | 1,122 | ||||||
Alamo Group, Inc. | 41 | 1,104 | ||||||
Northwest Pipe Co.* | 48 | 1,097 | ||||||
CAI International, Inc.* | 70 | 1,082 | ||||||
Saia, Inc.* | 85 | 1,061 | ||||||
Aceto Corp. | 152 | 1,049 | ||||||
Miller Industries, Inc. | 66 | 1,038 | ||||||
Pacer International, Inc.* | 193 | 1,033 | ||||||
Graham Corp. | 46 | 1,032 | ||||||
Cenveo, Inc.* | 303 | 1,030 | ||||||
Thermon Group Holdings, Inc.* | 58 | 1,022 | ||||||
Orion Marine Group, Inc.* | 151 | 1,004 | ||||||
| See Notes to Financial Statements. | THE RYDEX FUNDSANNUALREPORT | 113 |
| SCHEDULE OF INVESTMENTS (continued) | December 31, 2011 | |
| RUSSELL 2000® 1.5x STRATEGY FUND | ||
| SHARES | VALUE | |||||||
American Reprographics Co.* | 217 | $ | 996 | |||||
Quality Distribution, Inc.* | 86 | 968 | ||||||
American Superconductor Corp.* | 259 | 956 | ||||||
Sterling Construction Company, Inc.* | 88 | 948 | ||||||
Griffon Corp. | 103 | 940 | ||||||
CDI Corp. | 68 | 939 | ||||||
Flow International Corp.* | 263 | 920 | ||||||
SeaCube Container Leasing Ltd. | 62 | 918 | ||||||
Republic Airways Holdings, Inc.* | 265 | 909 | ||||||
Hurco Companies, Inc.* | 43 | 903 | ||||||
Zipcar, Inc.* | 66 | 886 | ||||||
Vicor Corp. | 111 | 884 | ||||||
Kimball International, Inc. — Class B | 174 | 882 | ||||||
Lydall, Inc.* | 92 | 873 | ||||||
Michael Baker Corp.* | 44 | 863 | ||||||
Barrett Business Services, Inc. | 43 | 858 | ||||||
Casella Waste Systems, Inc. — Class A* | 132 | 845 | ||||||
LMI Aerospace, Inc.* | 48 | 842 | ||||||
Hudson Highland Group, Inc.* | 175 | 838 | ||||||
Ampco-Pittsburgh Corp. | 43 | 832 | ||||||
KEYW Holding Corp.* | 111 | 821 | ||||||
Ducommun, Inc. | 64 | 816 | ||||||
A123 Systems, Inc.* | 500 | 805 | ||||||
Park-Ohio Holdings Corp.* | 45 | 803 | ||||||
Courier Corp. | 63 | 739 | ||||||
Metalico, Inc.* | 223 | 734 | ||||||
Met-Pro Corp. | 81 | 732 | ||||||
Fuel Tech, Inc.* | 110 | 724 | ||||||
Schawk, Inc. — Class A | 63 | 706 | ||||||
Roadrunner Transportation Systems, Inc.* | 49 | 692 | ||||||
Hill International, Inc.* | 134 | 689 | ||||||
Franklin Covey Co.* | 80 | 678 | ||||||
Energy Recovery, Inc.* | 262 | 676 | ||||||
TMS International Corp.* | 68 | 672 | ||||||
American Woodmark Corp. | 48 | 656 | ||||||
LSI Industries, Inc. | 109 | 654 | ||||||
Patriot Transportation Holding, Inc.* | 30 | 651 | ||||||
Argan, Inc. | 42 | 639 | ||||||
Pike Electric Corp.* | 87 | 626 | ||||||
TRC Companies, Inc.* | 103 | 619 | ||||||
FuelCell Energy, Inc.* | 699 | 610 | ||||||
RPX Corp.* | 48 | 607 | ||||||
VSE Corp. | 24 | 583 | ||||||
WCA Waste Corp.* | 86 | 560 | ||||||
AT Cross Co. — Class A* | 48 | 541 | ||||||
PowerSecure International, Inc.* | 108 | 535 | ||||||
Intersections, Inc. | 48 | 532 | ||||||
Builders FirstSource, Inc.* | 259 | 528 | ||||||
Broadwind Energy, Inc.* | 769 | 523 | ||||||
NL Industries, Inc. | 40 | 519 | ||||||
NN, Inc.* | 86 | 516 | ||||||
Tecumseh Products Co. — Class A* | 108 | 508 | ||||||
Universal Truckload Services, Inc. | 25 | 454 | ||||||
International Shipholding Corp. | 24 | 449 | ||||||
Heritage-Crystal Clean, Inc.* | 27 | 447 | ||||||
Baltic Trading Ltd. | 89 | 423 | ||||||
Xerium Technologies, Inc.* | 62 | 405 | ||||||
Valence Technology, Inc.* | 411 | 403 | ||||||
Ultrapetrol Bahamas Ltd.* | 129 | 384 | ||||||
Excel Maritime Carriers Ltd.* | 263 | 381 | ||||||
Coleman Cable, Inc.* | 43 | 374 | ||||||
Eagle Bulk Shipping, Inc.* | 345 | 325 | ||||||
Active Power, Inc.* | 456 | 301 | ||||||
UniTek Global Services, Inc.* | 63 | 285 | ||||||
Lawson Products, Inc. | 18 | 278 | ||||||
Essex Rental Corp.* | 92 | 271 | ||||||
Microvision, Inc.* | 588 | 212 | ||||||
Omega Flex, Inc.* | 10 | 141 | ||||||
Covenant Transportation Group, Inc. — Class A* | 44 | 131 | ||||||
Satcon Technology Corp.* | 193 | 116 | ||||||
|
| |||||||
Total Industrials | 960,388 | |||||||
|
| |||||||
CONSUMER DISCRETIONARY - 7.4% | ||||||||
Rent-A-Center, Inc. | 353 | 13,061 | ||||||
Warnaco Group, Inc.* | 239 | 11,960 | ||||||
Domino’s Pizza, Inc.* | 345 | 11,713 | ||||||
Life Time Fitness, Inc.* | 239 | 11,173 | ||||||
Carter’s, Inc.* | 267 | 10,629 | ||||||
Sotheby’s | 371 | 10,585 | ||||||
Ascena Retail Group, Inc.* | 349 | 10,372 | ||||||
Wolverine World Wide, Inc. | 284 | 10,122 | ||||||
Dana Holding Corp.* | 823 | 9,999 | ||||||
Tenneco, Inc.* | 332 | 9,887 | ||||||
Six Flags Entertainment Corp. | 237 | 9,774 | ||||||
Cinemark Holdings, Inc. | 519 | 9,596 | ||||||
Cheesecake Factory, Inc.* | 324 | 9,509 | ||||||
Men’s Wearhouse, Inc. | 284 | 9,204 | ||||||
Brunswick Corp. | 497 | 8,976 | ||||||
Vail Resorts, Inc. | 197 | 8,345 | ||||||
Childrens Place Retail Stores, Inc.* | 153 | 8,127 | ||||||
Pool Corp. | 265 | 7,976 | ||||||
Coinstar, Inc.* | 174 | 7,941 | ||||||
HSN, Inc. | 218 | 7,905 | ||||||
Genesco, Inc.* | 128 | 7,903 | ||||||
Hillenbrand, Inc. | 352 | 7,857 | ||||||
Pier 1 Imports, Inc.* | 557 | 7,759 | ||||||
Jos A. Bank Clothiers, Inc.* | 157 | 7,655 | ||||||
Buffalo Wild Wings, Inc.* | 110 | 7,426 | ||||||
Steven Madden Ltd.* | 212 | 7,314 | ||||||
| 114 | THE RYDEX FUNDSANNUALREPORT | See Notes to Financial Statements. |
| SCHEDULE OF INVESTMENTS (continued) | December 31, 2011 | |
| RUSSELL 2000® 1.5x STRATEGY FUND | ||
| SHARES | VALUE | |||||||
Crocs, Inc.* | 480 | $ | 7,090 | |||||
Hibbett Sports, Inc.* | 156 | 7,048 | ||||||
ANN, Inc.* | 284 | 7,038 | ||||||
Aeropostale, Inc.* | 457 | 6,969 | ||||||
Group 1 Automotive, Inc. | 134 | 6,941 | ||||||
Strayer Education, Inc. | 70 | 6,803 | ||||||
Select Comfort Corp.* | 312 | 6,767 | ||||||
Iconix Brand Group, Inc.* | 411 | 6,695 | ||||||
Monro Muffler Brake, Inc. | 169 | 6,556 | ||||||
Live Nation Entertainment, Inc.* | 788 | 6,548 | ||||||
Cracker Barrel Old Country Store, Inc. | 127 | 6,402 | ||||||
Meredith Corp. | 196 | 6,399 | ||||||
Saks, Inc.* | 649 | 6,328 | ||||||
Buckle, Inc. | 151 | 6,171 | ||||||
Cabela’s, Inc.* | 240 | 6,101 | ||||||
Express, Inc.* | 305 | 6,082 | ||||||
BJ’s Restaurants, Inc.* | 132 | 5,982 | ||||||
New York Times Co. — Class A* | 765 | 5,913 | ||||||
Bob Evans Farms, Inc. | 171 | 5,735 | ||||||
99 Cents Only Stores* | 261 | 5,729 | ||||||
Finish Line, Inc. — Class A | 283 | 5,458 | ||||||
Matthews International Corp. — Class A | 171 | 5,375 | ||||||
Valassis Communications, Inc.* | 279 | 5,365 | ||||||
Jack in the Box, Inc.* | 256 | 5,350 | ||||||
Regis Corp. | 323 | 5,346 | ||||||
Helen of Troy Ltd.* | 174 | 5,342 | ||||||
Vitamin Shoppe, Inc.* | 133 | 5,304 | ||||||
Arbitron, Inc. | 153 | 5,265 | ||||||
True Religion Apparel, Inc.* | 152 | 5,256 | ||||||
Texas Roadhouse, Inc. | 348 | 5,185 | ||||||
Jones Group, Inc. | 483 | 5,096 | ||||||
Penske Automotive Group, Inc. | 259 | 4,986 | ||||||
Collective Brands, Inc.* | 345 | 4,958 | ||||||
Cooper Tire & Rubber Co. | 348 | 4,875 | ||||||
Gaylord Entertainment Co.* | 199 | 4,804 | ||||||
Scholastic Corp. | 153 | 4,585 | ||||||
Liz Claiborne, Inc.* | 528 | 4,557 | ||||||
Ascent Capital Group, Inc. — Class A* | 89 | 4,514 | ||||||
American Public Education, Inc.* | 104 | 4,501 | ||||||
International Speedway Corp. — Class A | 171 | 4,335 | ||||||
Peet’s Coffee & Tea, Inc.* | 68 | 4,262 | ||||||
Papa John’s International, Inc.* | 109 | 4,107 | ||||||
Steiner Leisure Ltd.* | 89 | 4,040 | ||||||
iRobot Corp.* | 133 | 3,970 | ||||||
Orient-Express Hotels Ltd. — Class A* | 529 | 3,952 | ||||||
PF Chang’s China Bistro, Inc. | 127 | 3,926 | ||||||
Shutterfly, Inc.* | 170 | 3,869 | ||||||
Ryland Group, Inc. | 240 | 3,782 | ||||||
Cato Corp. — Class A | 156 | 3,775 | ||||||
MDC Holdings, Inc. | 214 | 3,773 | ||||||
National CineMedia, Inc. | 303 | 3,757 | ||||||
CEC Entertainment, Inc. | 109 | 3,755 | ||||||
Asbury Automotive Group, Inc.* | 171 | 3,687 | ||||||
GNC Holdings, Inc. — Class A* | 127 | 3,677 | ||||||
American Axle & Manufacturing Holdings, Inc.* | 369 | 3,649 | ||||||
DineEquity, Inc.* | 86 | 3,630 | ||||||
Sturm Ruger & Company, Inc. | 108 | 3,614 | ||||||
Meritage Homes Corp.* | 154 | 3,571 | ||||||
Zumiez, Inc.* | 128 | 3,553 | ||||||
Churchill Downs, Inc. | 68 | 3,545 | ||||||
Pinnacle Entertainment, Inc.* | 348 | 3,536 | ||||||
Vera Bradley, Inc.* | 109 | 3,515 | ||||||
Shuffle Master, Inc.* | 299 | 3,504 | ||||||
La-Z-Boy, Inc.* | 285 | 3,391 | ||||||
PEP Boys-Manny Moe & Jack | 304 | 3,344 | ||||||
Office Depot, Inc.* | 1,552 | 3,337 | ||||||
Belo Corp. — Class A | 523 | 3,295 | ||||||
Columbia Sportswear Co. | 70 | 3,259 | ||||||
Sonic Automotive, Inc. — Class A | 220 | 3,258 | ||||||
Ethan Allen Interiors, Inc. | 136 | 3,225 | ||||||
Charming Shoppes, Inc.* | 655 | 3,210 | ||||||
Oxford Industries, Inc. | 71 | 3,204 | ||||||
Sinclair Broadcast Group, Inc. — Class A | 281 | 3,184 | ||||||
Scientific Games Corp. — Class A* | 328 | 3,182 | ||||||
Capella Education Co.* | 87 | 3,136 | ||||||
Fred’s, Inc. — Class A | 214 | 3,120 | ||||||
Ameristar Casinos, Inc. | 175 | 3,026 | ||||||
Interval Leisure Group, Inc.* | 220 | 2,994 | ||||||
Biglari Holdings, Inc.* | 8 | 2,946 | ||||||
KB Home | 438 | 2,943 | ||||||
Blue Nile, Inc.* | 70 | 2,862 | ||||||
Meritor, Inc.* | 528 | 2,809 | ||||||
American Greetings Corp. — Class A | 222 | 2,777 | ||||||
Lithia Motors, Inc. — Class A | 127 | 2,776 | ||||||
K12, Inc.* | 152 | 2,727 | ||||||
Quiksilver, Inc.* | 724 | 2,614 | ||||||
Drew Industries, Inc.* | 106 | 2,600 | ||||||
Skechers U.S.A., Inc. — Class A* | 214 | 2,594 | ||||||
Ruby Tuesday, Inc.* | 370 | 2,553 | ||||||
Stewart Enterprises, Inc. — Class A | 440 | 2,534 | ||||||
Modine Manufacturing Co.* | 262 | 2,479 | ||||||
Stage Stores, Inc. | 178 | 2,472 | ||||||
Barnes & Noble, Inc.* | 170 | 2,462 | ||||||
Knology, Inc.* | 173 | 2,457 | ||||||
| See Notes to Financial Statements. | THE RYDEX FUNDSANNUALREPORT | 115 |
| SCHEDULE OF INVESTMENTS (continued) | December 31, 2011 | |
| RUSSELL 2000® 1.5x STRATEGY FUND | ||
| SHARES | VALUE | |||||||
Core-Mark Holding Company, Inc. | 61 | $ | 2,416 | |||||
Grand Canyon Education, Inc.* | 151 | 2,410 | ||||||
Maidenform Brands, Inc.* | 129 | 2,361 | ||||||
Lumber Liquidators Holdings, Inc.* | 133 | 2,349 | ||||||
Bridgepoint Education, Inc.* | 102 | 2,346 | ||||||
National Presto Industries, Inc. | 25 | 2,340 | ||||||
Sonic Corp.* | 347 | 2,335 | ||||||
Dorman Products, Inc.* | 62 | 2,290 | ||||||
Boyd Gaming Corp.* | 303 | 2,260 | ||||||
Harte-Hanks, Inc. | 246 | 2,236 | ||||||
Superior Industries International, Inc. | 134 | 2,216 | ||||||
G-III Apparel Group Ltd.* | 88 | 2,192 | ||||||
OfficeMax, Inc.* | 482 | 2,188 | ||||||
Jakks Pacific, Inc. | 154 | 2,173 | ||||||
Standard Motor Products, Inc. | 108 | 2,165 | ||||||
Krispy Kreme Doughnuts, Inc.* | 330 | 2,158 | ||||||
Lions Gate Entertainment Corp.* | 259 | 2,155 | ||||||
Denny’s Corp.* | 548 | 2,060 | ||||||
Brown Shoe Company, Inc. | 230 | 2,047 | ||||||
NutriSystem, Inc. | 157 | 2,030 | ||||||
Callaway Golf Co. | 363 | 2,007 | ||||||
AFC Enterprises, Inc.* | 134 | 1,970 | ||||||
Red Robin Gourmet Burgers, Inc.* | 69 | 1,911 | ||||||
Rue21, Inc.* | 88 | 1,901 | ||||||
Standard Pacific Corp.* | 587 | 1,867 | ||||||
Digital Generation, Inc.* | 156 | 1,860 | ||||||
Bebe Stores, Inc. | 219 | 1,824 | ||||||
MDC Partners, Inc. — Class A | 133 | 1,798 | ||||||
Bravo Brio Restaurant Group, Inc.* | 104 | 1,784 | ||||||
America’s Car-Mart, Inc.* | 45 | 1,763 | ||||||
Movado Group, Inc. | 91 | 1,653 | ||||||
Wet Seal, Inc. — Class A* | 501 | 1,633 | ||||||
Hot Topic, Inc. | 244 | 1,613 | ||||||
Arctic Cat, Inc.* | 70 | 1,578 | ||||||
Body Central Corp.* | 63 | 1,572 | ||||||
Cavco Industries, Inc.* | 39 | 1,562 | ||||||
Universal Technical Institute, Inc.* | 121 | 1,546 | ||||||
EW Scripps Co. — Class A* | 193 | 1,546 | ||||||
Smith & Wesson Holding Corp.* | 344 | 1,500 | ||||||
hhgregg, Inc.* | 103 | 1,488 | ||||||
Universal Electronics, Inc.* | 88 | 1,485 | ||||||
Blyth, Inc. | 26 | 1,477 | ||||||
Fisher Communications, Inc.* | 50 | 1,442 | ||||||
World Wrestling Entertainment, Inc. — Class A | 153 | 1,426 | ||||||
Fuel Systems Solutions, Inc.* | 86 | 1,418 | ||||||
Libbey, Inc.* | 109 | 1,389 | ||||||
Marcus Corp. | 109 | 1,374 | ||||||
Leapfrog Enterprises, Inc.* | 242 | 1,353 | ||||||
Big 5 Sporting Goods Corp. | 127 | 1,326 | ||||||
PetMed Express, Inc. | 127 | 1,318 | ||||||
Central European Media Enterprises Ltd. — Class A* | 202 | 1,317 | ||||||
Stoneridge, Inc.* | 149 | 1,256 | ||||||
Winnebago Industries, Inc.* | 170 | 1,255 | ||||||
Shoe Carnival, Inc.* | 48 | 1,234 | ||||||
Multimedia Games Holding Company, Inc.* | 151 | 1,199 | ||||||
Haverty Furniture Companies, Inc. | 107 | 1,175 | ||||||
Kirkland’s, Inc.* | 87 | 1,157 | ||||||
Exide Technologies* | 436 | 1,147 | ||||||
Steinway Musical Instruments, Inc.* | 43 | 1,077 | ||||||
Destination Maternity Corp. | 64 | 1,070 | ||||||
Stein Mart, Inc.* | 157 | 1,069 | ||||||
Systemax, Inc.* | 65 | 1,067 | ||||||
Beazer Homes USA, Inc.* | 430 | 1,066 | ||||||
Journal Communications, | 240 | 1,056 | ||||||
Talbots, Inc.* | 390 | 1,037 | ||||||
Cost Plus, Inc.* | 106 | 1,034 | ||||||
M/I Homes, Inc.* | 107 | 1,027 | ||||||
West Marine, Inc.* | 88 | 1,023 | ||||||
Lincoln Educational Services Corp. | 126 | 995 | ||||||
Ruth’s Hospitality Group, Inc.* | 199 | 989 | ||||||
Perry Ellis International, Inc.* | 68 | 967 | ||||||
Caribou Coffee Company, Inc.* | 69 | 963 | ||||||
Corinthian Colleges, Inc.* | 434 | 942 | ||||||
Spartan Motors, Inc. | 195 | 938 | ||||||
Speedway Motorsports, Inc. | 61 | 935 | ||||||
Conn’s, Inc.* | 82 | 910 | ||||||
Mac-Gray Corp. | 66 | 910 | ||||||
Weyco Group, Inc. | 37 | 908 | ||||||
REX American Resources Corp.* | 40 | 884 | ||||||
VOXX International Corp.* | 104 | 879 | ||||||
MarineMax, Inc.* | 133 | 867 | ||||||
Benihana, Inc.* | 82 | 839 | ||||||
CSS Industries, Inc. | 42 | 837 | ||||||
Tuesday Morning Corp.* | 241 | 831 | ||||||
Entercom Communications Corp. — Class A* | 135 | 830 | ||||||
Casual Male Retail Group, Inc.* | 241 | 824 | ||||||
Town Sports International Holdings, Inc.* | 108 | 794 | ||||||
Carrols Restaurant Group, Inc.* | 67 | 775 | ||||||
McClatchy Co. — Class A* | 324 | 774 | ||||||
Citi Trends, Inc.* | 88 | 773 | ||||||
Morgans Hotel Group Co.* | 127 | 749 | ||||||
Francesca’s Holdings Corp.* | 43 | 744 | ||||||
| 116 | THE RYDEX FUNDSANNUALREPORT | See Notes to Financial Statements. |
| SCHEDULE OF INVESTMENTS (continued) | December 31, 2011 | |
| RUSSELL 2000® 1.5x STRATEGY FUND | ||
| SHARES | VALUE | |||||||
Amerigon, Inc.* | 52 | $ | 742 | |||||
Build-A-Bear Workshop, Inc.* | 86 | 728 | ||||||
Teavana Holdings, Inc.* | 38 | 714 | ||||||
LIN TV Corp. — Class A* | 168 | 711 | ||||||
Saga Communications, Inc. — Class A* | 19 | 710 | ||||||
Delta Apparel, Inc.* | 36 | 687 | ||||||
Rentrak Corp.* | 48 | 685 | ||||||
Zale Corp.* | 179 | 682 | ||||||
Unifi, Inc.* | 89 | 676 | ||||||
Martha Stewart Living Omnimedia | 153 | 673 | ||||||
Cumulus Media, Inc. — Class A* | 200 | 668 | ||||||
Outdoor Channel Holdings, Inc. | 89 | 664 | ||||||
Archipelago Learning, Inc.* | 67 | 648 | ||||||
Einstein Noah Restaurant Group, Inc. | 40 | 633 | ||||||
O’Charleys, Inc.* | 111 | 609 | ||||||
McCormick & Schmick’s Seafood Restaurants, Inc.* | 68 | 594 | ||||||
RG Barry Corp. | 49 | 592 | ||||||
Summer Infant, Inc.* | 84 | 591 | ||||||
Lifetime Brands, Inc. | 48 | 583 | ||||||
Red Lion Hotels Corp.* | 82 | 568 | ||||||
Skullcandy, Inc.* | 45 | 563 | ||||||
Black Diamond, Inc.* | 70 | 523 | ||||||
AH Belo Corp. — Class A | 108 | 513 | ||||||
Monarch Casino & Resort, Inc.* | 50 | 510 | ||||||
Cherokee, Inc. | 43 | 502 | ||||||
Hovnanian Enterprises, Inc. — Class A* | 346 | 502 | ||||||
Isle of Capri Casinos, Inc.* | 107 | 500 | ||||||
Motorcar Parts of America, Inc.* | 66 | 495 | ||||||
Nexstar Broadcasting Group, Inc.* | 63 | 494 | ||||||
Luby’s, Inc.* | 108 | 487 | ||||||
Sealy Corp.* | 283 | 487 | ||||||
Jamba, Inc.* | 367 | 481 | ||||||
Overstock.com, Inc.* | 61 | 478 | ||||||
Kenneth Cole Productions, Inc. — Class A* | 45 | 477 | ||||||
Tower International, Inc.* | 43 | 462 | ||||||
Christopher & Banks Corp. | 197 | 461 | ||||||
Gray Television, Inc.* | 284 | 460 | ||||||
Pacific Sunwear of California, Inc.* | 263 | 450 | ||||||
K-Swiss, Inc.* | 153 | 447 | ||||||
Entravision Communications Corp. | 284 | 443 | ||||||
New York & Company, Inc.* | 158 | 420 | ||||||
Valuevision Media, Inc. — Class A* | 222 | 417 | ||||||
Ambassadors Group, Inc. | 92 | 415 | ||||||
Johnson Outdoors, Inc.* | 27 | 414 | ||||||
Coldwater Creek, Inc.* | 344 | 406 | ||||||
Orbitz Worldwide, Inc.* | 107 | 402 | ||||||
US Auto Parts Network, Inc.* | 89 | 389 | ||||||
Eastman Kodak Co.* | 581 | 377 | ||||||
National American University Holdings, Inc. | 49 | 371 | ||||||
ReachLocal, Inc.* | 58 | 358 | ||||||
Geeknet, Inc.* | 20 | 341 | ||||||
1-800-Flowers.com, Inc. — Class A* | 153 | 337 | ||||||
Marine Products Corp.* | 66 | 327 | ||||||
Gordmans Stores, Inc.* | 25 | 314 | ||||||
Global Sources Ltd.* | 61 | 296 | ||||||
Furniture Brands International, Inc.* | 240 | 295 | ||||||
Cambium Learning Group, Inc.* | 89 | 269 | ||||||
Crown Media Holdings, Inc. — Class A* | 197 | 238 | ||||||
Bon-Ton Stores, Inc. | 69 | 233 | ||||||
School Specialty, Inc.* | 88 | 220 | ||||||
Shiloh Industries, Inc.* | 23 | 193 | ||||||
Skyline Corp. | 39 | 170 | ||||||
Dial Global, Inc.* | 27 | 86 | ||||||
|
| |||||||
Total Consumer Discretionary | 814,156 | |||||||
|
| |||||||
HEALTH CARE - 7.0% | ||||||||
Healthspring, Inc.* | 389 | 21,216 | ||||||
Salix Pharmaceuticals Ltd.* | 326 | 15,599 | ||||||
Onyx Pharmaceuticals, Inc.* | 354 | 15,558 | ||||||
HMS Holdings Corp.* | 479 | 15,318 | ||||||
Cubist Pharmaceuticals, Inc.* | 333 | 13,193 | ||||||
WellCare Health Plans, Inc.* | 238 | 12,495 | ||||||
Questcor Pharmaceuticals, Inc.* | 300 | 12,474 | ||||||
Cepheid, Inc.* | 347 | 11,940 | ||||||
Medicis Pharmaceutical Corp. — Class A | 345 | 11,471 | ||||||
Centene Corp.* | 282 | 11,164 | ||||||
Viropharma, Inc.* | 395 | 10,819 | ||||||
STERIS Corp. | 329 | 9,811 | ||||||
Owens & Minor, Inc. | 352 | 9,782 | ||||||
athenahealth, Inc.* | 197 | 9,677 | ||||||
Haemonetics Corp.* | 151 | 9,244 | ||||||
HealthSouth Corp.* | 523 | 9,241 | ||||||
Alkermes plc* | 525 | 9,114 | ||||||
Seattle Genetics, Inc.* | 541 | 9,043 | ||||||
Ariad Pharmaceuticals, Inc.* | 738 | 9,041 | ||||||
Magellan Health Services, Inc.* | 179 | 8,855 | ||||||
Theravance, Inc.* | 387 | 8,553 | ||||||
Medivation, Inc.* | 177 | 8,161 | ||||||
Align Technology, Inc.* | 344 | 8,161 | ||||||
Zoll Medical Corp.* | 127 | 8,024 | ||||||
Quality Systems, Inc. | 215 | 7,953 | ||||||
Incyte Corporation Ltd.* | 501 | 7,520 | ||||||
Impax Laboratories, Inc.* | 369 | 7,443 | ||||||
West Pharmaceutical Services, Inc. | 196 | 7,438 | ||||||
Volcano Corp.* | 287 | 6,828 | ||||||
| See Notes to Financial Statements. | THE RYDEX FUNDSANNUALREPORT | 117 |
| SCHEDULE OF INVESTMENTS (continued) | December 31, 2011 | |
| RUSSELL 2000® 1.5x STRATEGY FUND | ||
| SHARES | VALUE | |||||||
PAREXEL International Corp.* | 328 | $ | 6,803 | |||||
Chemed Corp. | 128 | 6,555 | ||||||
Par Pharmaceutical Companies, Inc.* | 197 | 6,448 | ||||||
Masimo Corp.* | 301 | 5,624 | ||||||
Medicines Co.* | 301 | 5,611 | ||||||
Auxilium Pharmaceuticals, Inc.* | 266 | 5,301 | ||||||
Air Methods Corp.* | 62 | 5,236 | ||||||
Acorda Therapeutics, Inc.* | 217 | 5,173 | ||||||
Cyberonics, Inc.* | 152 | 5,092 | ||||||
Accretive Health, Inc.* | 217 | 4,987 | ||||||
Arthrocare Corp.* | 157 | 4,974 | ||||||
Jazz Pharmaceuticals, Inc.* | 127 | 4,906 | ||||||
Immunogen, Inc.* | 421 | 4,875 | ||||||
Vivus, Inc.* | 500 | 4,875 | ||||||
PDL BioPharma, Inc. | 784 | 4,861 | ||||||
Insulet Corp.* | 258 | 4,858 | ||||||
SonoSite, Inc.* | 86 | 4,632 | ||||||
MWI Veterinary Supply, Inc.* | 69 | 4,584 | ||||||
NxStage Medical, Inc.* | 257 | 4,569 | ||||||
HeartWare International, Inc.* | 66 | 4,554 | ||||||
Amsurg Corp.* | 174 | 4,531 | ||||||
Momenta Pharmaceuticals, Inc.* | 259 | 4,504 | ||||||
Luminex Corp.* | 212 | 4,501 | ||||||
MAKO Surgical Corp.* | 176 | 4,437 | ||||||
Meridian Bioscience, Inc. | 232 | 4,371 | ||||||
Halozyme Therapeutics, Inc.* | 458 | 4,356 | ||||||
Spectrum Pharmaceuticals, Inc.* | 283 | 4,140 | ||||||
Neogen Corp.* | 133 | 4,075 | ||||||
Isis Pharmaceuticals, Inc.* | 565 | 4,074 | ||||||
IPC The Hospitalist Company, Inc.* | 87 | 3,978 | ||||||
Analogic Corp. | 69 | 3,955 | ||||||
CONMED Corp.* | 151 | 3,876 | ||||||
Pharmacyclics, Inc.* | 261 | 3,868 | ||||||
Inhibitex, Inc.* | 353 | 3,862 | ||||||
InterMune, Inc.* | 297 | 3,742 | ||||||
Micromet, Inc.* | 506 | 3,638 | ||||||
Orthofix International N.V.* | 103 | 3,629 | ||||||
Hanger Orthopedic Group, Inc.* | 194 | 3,626 | ||||||
Nektar Therapeutics* | 638 | 3,570 | ||||||
Wright Medical Group, Inc.* | 215 | 3,548 | ||||||
Abaxis, Inc.* | 126 | 3,486 | ||||||
Molina Healthcare, Inc.* | 155 | 3,461 | ||||||
DexCom, Inc.* | 368 | 3,426 | ||||||
Ironwood Pharmaceuticals, Inc.* | 285 | 3,411 | ||||||
Team Health Holdings, Inc.* | 154 | 3,399 | ||||||
Akorn, Inc.* | 305 | 3,392 | ||||||
Exelixis, Inc.* | 714 | 3,381 | ||||||
Kindred Healthcare, Inc.* | 284 | 3,343 | ||||||
Integra LifeSciences Holdings Corp.* | 107 | 3,299 | ||||||
ABIOMED, Inc.* | 173 | 3,195 | ||||||
Optimer Pharmaceuticals, Inc.* | 261 | 3,195 | ||||||
NPS Pharmaceuticals, Inc.* | 483 | 3,183 | ||||||
Omnicell, Inc.* | 192 | 3,172 | ||||||
Endologix, Inc.* | 276 | 3,168 | ||||||
ICU Medical, Inc.* | 70 | 3,150 | ||||||
Merit Medical Systems, Inc.* | 235 | 3,144 | ||||||
Computer Programs & Systems, Inc. | 61 | 3,118 | ||||||
Rigel Pharmaceuticals, Inc.* | 388 | 3,061 | ||||||
Opko Health, Inc.* | 615 | 3,014 | ||||||
AVEO Pharmaceuticals, Inc.* | 174 | 2,993 | ||||||
PSS World Medical, Inc.* | 123 | 2,975 | ||||||
Greatbatch, Inc.* | 134 | 2,961 | ||||||
Emeritus Corp.* | 168 | 2,942 | ||||||
NuVasive, Inc.* | 220 | 2,770 | ||||||
Medidata Solutions, Inc.* | 126 | 2,741 | ||||||
National Healthcare Corp. | 64 | 2,682 | ||||||
PharMerica Corp.* | 171 | 2,596 | ||||||
Hi-Tech Pharmacal Company, Inc.* | 64 | 2,489 | ||||||
Sequenom, Inc.* | 547 | 2,434 | ||||||
MedAssets, Inc.* | 263 | 2,433 | ||||||
AMAG Pharmaceuticals, Inc.* | 126 | 2,383 | ||||||
OraSure Technologies, Inc.* | 261 | 2,378 | ||||||
Landauer, Inc. | 46 | 2,369 | ||||||
Neurocrine Biosciences, Inc.* | 278 | 2,363 | ||||||
Genomic Health, Inc.* | 92 | 2,336 | ||||||
Universal American Corp. | 182 | 2,313 | ||||||
Invacare Corp. | 151 | 2,309 | ||||||
Exact Sciences Corp.* | 284 | 2,306 | ||||||
Dynavax Technologies Corp.* | 693 | 2,301 | ||||||
Quidel Corp.* | 151 | 2,285 | ||||||
Idenix Pharmaceuticals, Inc.* | 305 | 2,271 | ||||||
Triple-S Management Corp.* | 111 | 2,222 | ||||||
Conceptus, Inc.* | 175 | 2,212 | ||||||
Emergent Biosolutions, Inc.* | 131 | 2,206 | ||||||
Ensign Group, Inc. | 89 | 2,181 | ||||||
Bio-Reference Labs, Inc.* | 134 | 2,180 | ||||||
Corvel Corp.* | 42 | 2,172 | ||||||
Sunrise Senior Living, Inc.* | 324 | 2,100 | ||||||
Select Medical Holdings Corp.* | 246 | 2,086 | ||||||
Staar Surgical Co.* | 198 | 2,077 | ||||||
Achillion Pharmaceuticals, Inc.* | 265 | 2,019 | ||||||
Curis, Inc.* | 430 | 2,012 | ||||||
AngioDynamics, Inc.* | 133 | 1,970 | ||||||
Cantel Medical Corp. | 69 | 1,927 | ||||||
Amedisys, Inc.* | 171 | 1,866 | ||||||
Metropolitan Health Networks, Inc.* | 236 | 1,763 | ||||||
Alnylam Pharmaceuticals, Inc.* | 215 | 1,752 | ||||||
Vical, Inc.* | 393 | 1,733 | ||||||
Arqule, Inc.* | 307 | 1,731 | ||||||
Synovis Life Technologies, Inc.* | 61 | 1,698 | ||||||
Vanguard Health Systems, Inc.* | 164 | 1,676 | ||||||
MAP Pharmaceuticals, Inc.* | 127 | 1,673 | ||||||
| 118 | THE RYDEX FUNDSANNUALREPORT | See Notes to Financial Statements. |
| SCHEDULE OF INVESTMENTS (continued) | December 31, 2011 | |
| RUSSELL 2000® 1.5x STRATEGY FUND | ||
| SHARES | VALUE | |||||||
MedQuist Holdings, Inc.* | 173 | $ | 1,664 | |||||
Assisted Living Concepts, | 111 | 1,653 | ||||||
Accuray, Inc.* | 389 | 1,645 | ||||||
American Dental Partners, Inc.* | 86 | 1,619 | ||||||
Affymetrix, Inc.* | 391 | 1,599 | ||||||
Symmetry Medical, Inc.* | 200 | 1,598 | ||||||
HealthStream, Inc.* | 86 | 1,587 | ||||||
Raptor Pharmaceutical Corp.* | 248 | 1,552 | ||||||
Depomed, Inc.* | 298 | 1,544 | ||||||
Chelsea Therapeutics International Ltd.* | 300 | 1,539 | ||||||
Arena Pharmaceuticals, Inc.* | 811 | 1,517 | ||||||
Natus Medical, Inc.* | 156 | 1,471 | ||||||
ZIOPHARM Oncology, Inc.* | 330 | 1,455 | ||||||
Ardea Biosciences, Inc.* | 86 | 1,446 | ||||||
AVANIR Pharmaceuticals, Inc. — Class A* | 700 | 1,435 | ||||||
ExamWorks Group, Inc.* | 151 | 1,431 | ||||||
Enzon Pharmaceuticals, Inc.* | 213 | 1,427 | ||||||
Merge Healthcare, Inc.* | 285 | 1,382 | ||||||
RTI Biologics, Inc.* | 303 | 1,345 | ||||||
Progenics Pharmaceuticals, Inc.* | 156 | 1,332 | ||||||
Healthways, Inc.* | 194 | 1,331 | ||||||
Spectranetics Corp.* | 182 | 1,314 | ||||||
Ligand Pharmaceuticals, Inc. — Class B* | 109 | 1,294 | ||||||
Affymax, Inc.* | 194 | 1,282 | ||||||
ISTA Pharmaceuticals, Inc.* | 179 | 1,262 | ||||||
SurModics, Inc.* | 86 | 1,261 | ||||||
eResearchTechnology, Inc.* | 268 | 1,257 | ||||||
Cell Therapeutics, Inc.* | 1,082 | 1,255 | ||||||
US Physical Therapy, Inc. | 63 | 1,240 | ||||||
Capital Senior Living Corp.* | 156 | 1,239 | ||||||
Lexicon Pharmaceuticals, Inc.* | 959 | 1,237 | ||||||
Cambrex Corp.* | 171 | 1,228 | ||||||
Immunomedics, Inc.* | 368 | 1,225 | ||||||
BioScrip, Inc.* | 221 | 1,207 | ||||||
Transcend Services, Inc.* | 49 | 1,163 | ||||||
Tornier N.V.* | 64 | 1,152 | ||||||
Gentiva Health Services, Inc.* | 168 | 1,134 | ||||||
LHC Group, Inc.* | 87 | 1,116 | ||||||
Obagi Medical Products, Inc.* | 108 | 1,097 | ||||||
Antares Pharma, Inc.* | 495 | 1,089 | ||||||
Solta Medical, Inc.* | 343 | 1,077 | ||||||
Geron Corp.* | 724 | 1,072 | ||||||
Columbia Laboratories, Inc.* | 412 | 1,030 | ||||||
AtriCure, Inc.* | 89 | 988 | ||||||
Santarus, Inc.* | 297 | 983 | ||||||
Keryx Biopharmaceuticals, Inc.* | 385 | 974 | ||||||
Palomar Medical Technologies, Inc.* | 104 | 967 | ||||||
Vascular Solutions, Inc.* | 86 | 957 | ||||||
IRIS International, Inc.* | 102 | 954 | ||||||
Maxygen, Inc.* | 168 | 946 | ||||||
Synergetics USA, Inc.* | 127 | 937 | ||||||
Infinity Pharmaceuticals, Inc.* | 105 | 928 | ||||||
Nymox Pharmaceutical Corp.* | 111 | 912 | ||||||
Sagent Pharmaceuticals, Inc.* | 43 | 903 | ||||||
Metabolix, Inc.* | 194 | 883 | ||||||
Savient Pharmaceuticals, Inc.* | 395 | 881 | ||||||
Targacept, Inc.* | 156 | 869 | ||||||
Cross Country Healthcare, Inc.* | 156 | 866 | ||||||
Cadence Pharmaceuticals, Inc.* | 218 | 861 | ||||||
Cardiovascular Systems, Inc.* | 84 | 827 | ||||||
Kensey Nash Corp.* | 43 | 825 | ||||||
Sciclone Pharmaceuticals, Inc.* | 192 | 824 | ||||||
Sangamo Biosciences, Inc.* | 290 | 824 | ||||||
Pain Therapeutics, Inc.* | 214 | 813 | ||||||
Delcath Systems, Inc.* | 264 | 805 | ||||||
Corcept Therapeutics, Inc.* | 235 | 804 | ||||||
Aegerion Pharmaceuticals, Inc.* | 47 | 787 | ||||||
Biotime, Inc.* | 133 | 773 | ||||||
Furiex Pharmaceuticals, Inc.* | 46 | 769 | ||||||
XenoPort, Inc.* | 199 | 758 | ||||||
Dyax Corp.* | 550 | 748 | ||||||
Vanda Pharmaceuticals, Inc.* | 157 | 747 | ||||||
Almost Family, Inc.* | 45 | 746 | ||||||
Anthera Pharmaceuticals, Inc.* | 121 | 743 | ||||||
CryoLife, Inc.* | 154 | 739 | ||||||
Cerus Corp.* | 262 | 734 | ||||||
Codexis, Inc.* | 136 | 721 | ||||||
Rockwell Medical Technologies, Inc.* | 84 | 711 | ||||||
Young Innovations, Inc. | 24 | 711 | ||||||
Exactech, Inc.* | 43 | 708 | ||||||
Five Star Quality Care, Inc.* | 235 | 705 | ||||||
Array Biopharma, Inc.* | 323 | 698 | ||||||
Novavax, Inc.* | 544 | 685 | ||||||
Oncothyreon, Inc.* | 90 | 682 | ||||||
Hansen Medical, Inc.* | 259 | 668 | ||||||
Allos Therapeutics, Inc.* | 441 | 626 | ||||||
Celldex Therapeutics, Inc.* | 239 | 621 | ||||||
Synta Pharmaceuticals Corp.* | 133 | 621 | ||||||
Medtox Scientific, Inc.* | 44 | 618 | ||||||
Pozen, Inc.* | 151 | 596 | ||||||
Astex Pharmaceuticals* | 311 | 588 | ||||||
Cytori Therapeutics, Inc.* | 264 | 581 | ||||||
Dusa Pharmaceuticals, Inc.* | 132 | 578 | ||||||
Skilled Healthcare Group, Inc. — Class A* | 104 | 568 | ||||||
Fluidigm Corp.* | 43 | 566 | ||||||
AVI BioPharma, Inc.* | 758 | 565 | ||||||
Cynosure, Inc.* | 48 | 564 | ||||||
Pacific Biosciences of California, Inc.* | 194 | 543 | ||||||
Durect Corp.* | 457 | 539 | ||||||
| See Notes to Financial Statements. | THE RYDEX FUNDSANNUALREPORT | 119 |
| SCHEDULE OF INVESTMENTS (continued) | December 31, 2011 | |
| RUSSELL 2000® 1.5x STRATEGY FUND | ||
| SHARES | VALUE | |||||||
Navidea Biopharmaceuticals, Inc.* | 200 | $ | 524 | |||||
Alphatec Holdings, Inc.* | 304 | 523 | ||||||
Harvard Bioscience, Inc.* | 135 | 522 | ||||||
Chindex International, Inc.* | 61 | 520 | ||||||
Sun Healthcare Group, Inc.* | 132 | 512 | ||||||
Zalicus, Inc.* | 417 | 505 | ||||||
SIGA Technologies, Inc.* | 193 | 486 | ||||||
Enzo Biochem, Inc.* | 217 | 486 | ||||||
Peregrine Pharmaceuticals, Inc.* | 444 | 457 | ||||||
Nabi Biopharmaceuticals* | 243 | 457 | ||||||
Medical Action Industries, Inc.* | 87 | 455 | ||||||
Osiris Therapeutics, Inc.* | 85 | 455 | ||||||
Uroplasty, Inc.* | 107 | 455 | ||||||
Biospecifics Technologies Corp.* | 27 | 449 | ||||||
Cleveland Biolabs, Inc.* | 151 | 432 | ||||||
GTx, Inc.* | 126 | 423 | ||||||
BioCryst Pharmaceuticals, Inc.* | 168 | 415 | ||||||
Insmed, Inc.* | 134 | 409 | ||||||
MannKind Corp.* | 162 | 405 | ||||||
KV Pharmaceutical Co. — Class A* | 287 | 402 | ||||||
Anacor Pharmaceuticals, Inc.* | 63 | 391 | ||||||
Unilife Corp.* | 125 | 390 | ||||||
Lannett Company, Inc.* | 87 | 385 | ||||||
AMN Healthcare Services, Inc.* | 85 | 377 | ||||||
Albany Molecular Research, Inc.* | 127 | 372 | ||||||
RadNet, Inc.* | 168 | 358 | ||||||
Bacterin International Holdings, Inc.* | 125 | 358 | ||||||
Endocyte, Inc.* | 91 | 342 | ||||||
Providence Service Corp.* | 23 | 316 | ||||||
CardioNet, Inc.* | 132 | 313 | ||||||
Biosante Pharmaceuticals, Inc.* | 610 | 306 | ||||||
Amicus Therapeutics, Inc.* | 89 | 306 | ||||||
BioMimetic Therapeutics, Inc.* | 106 | 302 | ||||||
Sucampo Pharmaceuticals, Inc. — Class A* | 68 | 301 | ||||||
Trius Therapeutics, Inc.* | 42 | 300 | ||||||
Orexigen Therapeutics, Inc.* | 177 | 285 | ||||||
Cornerstone Therapeutics, Inc.* | 43 | 241 | ||||||
OncoGenex Pharmaceutical, Inc.* | 20 | 235 | ||||||
Pacira Pharmaceuticals, Inc.* | 27 | 234 | ||||||
Acura Pharmaceuticals, Inc.* | 65 | 227 | ||||||
BG Medicine, Inc.* | 45 | 212 | ||||||
Transcept Pharmaceuticals, Inc.* | 26 | 204 | ||||||
Stereotaxis, Inc.* | 241 | 198 | ||||||
Sunesis Pharmaceuticals, Inc.* | 152 | 178 | ||||||
DynaVox, Inc. — Class A* | 48 | 175 | ||||||
Ampio Pharmaceuticals, Inc.* | 40 | 171 | ||||||
Complete Genomics, Inc.* | 58 | 170 | ||||||
Alliance HealthCare Services, Inc.* | 133 | 168 | ||||||
Pernix Therapeutics Holdings* | 18 | 167 | ||||||
Biolase Technology, Inc.* | 61 | 157 | ||||||
Epocrates, Inc.* | 14 | 109 | ||||||
PharmAthene, Inc.* | 73 | 93 | ||||||
Alimera Sciences, Inc.* | 63 | 79 | ||||||
Neostem, Inc.* | 98 | 50 | ||||||
Zogenix, Inc.* | 20 | 45 | ||||||
|
| |||||||
Total Health Care | 766,967 | |||||||
|
| |||||||
ENERGY - 3.7% | ||||||||
World Fuel Services Corp. | 392 | 16,456 | ||||||
Complete Production Services, Inc.* | 439 | 14,733 | ||||||
Energy XXI Bermuda Ltd.* | 416 | 13,262 | ||||||
Rosetta Resources, Inc.* | 298 | 12,963 | ||||||
Dril-Quip, Inc.* | 193 | 12,703 | ||||||
Berry Petroleum Co. — Class A | 288 | 12,102 | ||||||
Lufkin Industries, Inc. | 169 | 11,375 | ||||||
Kodiak Oil & Gas Corp.* | 1,171 | 11,125 | ||||||
Key Energy Services, Inc.* | 698 | 10,798 | ||||||
Golar LNG Ltd. | 219 | 9,735 | ||||||
Oasis Petroleum, Inc.* | 329 | 9,571 | ||||||
Helix Energy Solutions Group, Inc.* | 594 | 9,385 | ||||||
Bristow Group, Inc. | 195 | 9,241 | ||||||
CVR Energy, Inc.* | 490 | 9,178 | ||||||
Bill Barrett Corp.* | 264 | 8,994 | ||||||
Northern Oil and Gas, Inc.* | 353 | 8,465 | ||||||
McMoRan Exploration Co.* | 546 | 7,944 | ||||||
Stone Energy Corp.* | 278 | 7,334 | ||||||
Swift Energy Co.* | 238 | 7,073 | ||||||
Gulfport Energy Corp.* | 234 | 6,891 | ||||||
Cloud Peak Energy, Inc.* | 342 | 6,607 | ||||||
SemGroup Corp. — Class A* | 239 | 6,228 | ||||||
Carrizo Oil & Gas, Inc.* | 220 | 5,797 | ||||||
Gulfmark Offshore, Inc. — Class A* | 129 | 5,419 | ||||||
Newpark Resources, Inc.* | 501 | 4,760 | ||||||
Parker Drilling Co.* | 656 | 4,704 | ||||||
Petroleum Development Corp.* | 133 | 4,670 | ||||||
ION Geophysical Corp.* | 737 | 4,518 | ||||||
Patriot Coal Corp.* | 507 | 4,294 | ||||||
Contango Oil & Gas Co.* | 70 | 4,073 | ||||||
W&T Offshore, Inc. | 191 | 4,051 | ||||||
Western Refining, Inc.* | 304 | 4,040 | ||||||
Tetra Technologies, Inc.* | 432 | 4,035 | ||||||
Comstock Resources, Inc.* | 262 | 4,009 | ||||||
Cheniere Energy, Inc.* | 460 | 3,997 | ||||||
Hornbeck Offshore Services, Inc.* | 127 | 3,940 | ||||||
Apco Oil and Gas International, Inc. | 48 | 3,923 | ||||||
Approach Resources, Inc.* | 125 | 3,676 | ||||||
| 120 | THE RYDEX FUNDSANNUALREPORT | See Notes to Financial Statements. |
| SCHEDULE OF INVESTMENTS (continued) | December 31, 2011 | |
| RUSSELL 2000® 1.5x STRATEGY FUND | ||
| SHARES | VALUE | |||||||
Targa Resources Corp. | 89 | $ | 3,621 | |||||
Clean Energy Fuels Corp.* | 279 | 3,476 | ||||||
Magnum Hunter Resources Corp.* | 626 | 3,374 | ||||||
Pioneer Drilling Co.* | 347 | 3,359 | ||||||
GeoResources, Inc.* | 110 | 3,224 | ||||||
Exterran Holdings, Inc.* | 351 | 3,194 | ||||||
Nordic American Tankers Ltd. | 262 | 3,141 | ||||||
Crosstex Energy, Inc. | 233 | 2,945 | ||||||
Hercules Offshore, Inc.* | 649 | 2,882 | ||||||
Rex Energy Corp.* | 194 | 2,863 | ||||||
Resolute Energy Corp.* | 262 | 2,830 | ||||||
Basic Energy Services, Inc.* | 135 | 2,660 | ||||||
Gulf Island Fabrication, Inc. | 85 | 2,483 | ||||||
Ship Finance International Ltd. | 246 | 2,298 | ||||||
Energy Partners Ltd.* | 156 | 2,278 | ||||||
Hyperdynamics Corp.* | 870 | 2,131 | ||||||
Tesco Corp.* | 168 | 2,124 | ||||||
Goodrich Petroleum Corp.* | 152 | 2,087 | ||||||
Petroquest Energy, Inc.* | 308 | 2,033 | ||||||
Clayton Williams Energy, Inc.* | 26 | 1,973 | ||||||
Endeavour International Corp.* | 219 | 1,903 | ||||||
Knightsbridge Tankers Ltd. | 127 | 1,736 | ||||||
Vaalco Energy, Inc.* | 286 | 1,727 | ||||||
PHI, Inc.* | 68 | 1,690 | ||||||
Overseas Shipholding Group, Inc. | 153 | 1,672 | ||||||
Dawson Geophysical Co.* | 42 | 1,660 | ||||||
Rentech, Inc.* | 1,246 | 1,632 | ||||||
BPZ Resources, Inc.* | 572 | 1,624 | ||||||
OYO Geospace Corp.* | 21 | 1,624 | ||||||
Mitcham Industries, Inc.* | 71 | 1,551 | ||||||
Abraxas Petroleum Corp.* | 460 | 1,518 | ||||||
Triangle Petroleum Corp.* | 243 | 1,451 | ||||||
Matrix Service Co.* | 152 | 1,435 | ||||||
Harvest Natural Resources, Inc.* | 194 | 1,432 | ||||||
James River Coal Co.* | 199 | 1,377 | ||||||
Penn Virginia Corp. | 260 | 1,375 | ||||||
FX Energy, Inc.* | 284 | 1,363 | ||||||
Warren Resources, Inc.* | 393 | 1,281 | ||||||
Panhandle Oil and Gas, Inc. — Class A | 39 | 1,280 | ||||||
C&J Energy Services, Inc.* | 60 | 1,256 | ||||||
Frontline Ltd. | 286 | 1,227 | ||||||
Uranium Energy Corp.* | 392 | 1,200 | ||||||
Amyris, Inc.* | 103 | 1,189 | ||||||
Cal Dive International, Inc.* | 526 | 1,184 | ||||||
Vantage Drilling Co.* | 985 | 1,143 | ||||||
Venoco, Inc.* | 168 | 1,137 | ||||||
Callon Petroleum Co.* | 214 | 1,064 | ||||||
Houston American Energy Corp.* | 87 | 1,061 | ||||||
Gastar Exploration Ltd.* | 331 | 1,053 | ||||||
Green Plains Renewable Energy, Inc.* | 107 | 1,044 | ||||||
Natural Gas Services Group, Inc.* | 70 | 1,012 | ||||||
Delek US Holdings, Inc. | 87 | 993 | ||||||
Teekay Tankers Ltd. — Class A | 241 | 848 | ||||||
Willbros Group, Inc.* | 215 | 789 | ||||||
Solazyme, Inc.* | 63 | 750 | ||||||
USEC, Inc.* | 655 | 747 | ||||||
ATP Oil & Gas Corp.* | 98 | 721 | ||||||
Global Geophysical Services, Inc.* | 104 | 699 | ||||||
Evolution Petroleum Corp.* | 84 | 676 | ||||||
Voyager Oil & Gas, Inc.* | 263 | 676 | ||||||
Scorpio Tankers, Inc.* | 133 | 650 | ||||||
Uranerz Energy Corp.* | 353 | 642 | ||||||
Westmoreland Coal Co.* | 46 | 586 | ||||||
Union Drilling, Inc.* | 88 | 549 | ||||||
Alon USA Energy, Inc. | 61 | 531 | ||||||
Ur-Energy, Inc.* | 588 | 505 | ||||||
Miller Energy Resources, Inc.* | 174 | 485 | ||||||
Syntroleum Corp.* | 494 | 474 | ||||||
RigNet, Inc.* | 27 | 452 | ||||||
GMX Resources, Inc.* | 329 | 411 | ||||||
Zion Oil & Gas, Inc.* | 173 | 382 | ||||||
Uranium Resources, Inc.* | 524 | 380 | ||||||
Crimson Exploration, Inc.* | 128 | 366 | ||||||
CAMAC Energy, Inc.* | 326 | 329 | ||||||
DHT Holdings, Inc. | 370 | 274 | ||||||
Hallador Energy Co. | 26 | 258 | ||||||
Gevo, Inc.* | 40 | 252 | ||||||
Geokinetics, Inc.* | 64 | 138 | ||||||
L&L Energy, Inc.* | 50 | 130 | ||||||
|
| |||||||
Total Energy | 404,639 | |||||||
|
| |||||||
MATERIALS - 2.5% | ||||||||
Coeur d’Alene Mines Corp.* | 504 | 12,167 | ||||||
Sensient Technologies Corp. | 282 | 10,688 | ||||||
NewMarket Corp. | 49 | 9,707 | ||||||
Olin Corp. | 456 | 8,960 | ||||||
Hecla Mining Co. | 1,572 | 8,222 | ||||||
Buckeye Technologies, Inc. | 219 | 7,323 | ||||||
HB Fuller Co. | 282 | 6,517 | ||||||
Balchem Corp. | 156 | 6,324 | ||||||
Eagle Materials, Inc. | 246 | 6,312 | ||||||
Innophos Holdings, Inc. | 129 | 6,264 | ||||||
Chemtura Corp.* | 544 | 6,169 | ||||||
Stillwater Mining Co.* | 587 | 6,140 | ||||||
PolyOne Corp. | 524 | 6,052 | ||||||
Louisiana-Pacific Corp.* | 743 | 5,996 | ||||||
Thompson Creek Metals Company, Inc.* | 852 | 5,930 | ||||||
Schweitzer-Mauduit International, Inc. | 88 | 5,848 | ||||||
Minerals Technologies, Inc. | 103 | 5,823 | ||||||
| See Notes to Financial Statements. | THE RYDEX FUNDSANNUALREPORT | 121 |
| SCHEDULE OF INVESTMENTS (continued) | December 31, 2011 | |
| RUSSELL 2000® 1.5x STRATEGY FUND | ||
| SHARES | VALUE | |||||||
Worthington Industries, Inc. | 324 | $ | 5,307 | |||||
Calgon Carbon Corp.* | 323 | 5,074 | ||||||
Globe Specialty Metals, Inc. | 351 | 4,700 | ||||||
Clearwater Paper Corp.* | 131 | 4,665 | ||||||
Boise, Inc. | 586 | 4,172 | ||||||
Texas Industries, Inc. | 133 | 4,094 | ||||||
RTI International Metals, Inc.* | 175 | 4,062 | ||||||
Kaiser Aluminum Corp. | 88 | 4,037 | ||||||
Deltic Timber Corp. | 66 | 3,986 | ||||||
OM Group, Inc.* | 175 | 3,918 | ||||||
Haynes International, Inc. | 70 | 3,822 | ||||||
Graphic Packaging Holding Co.* | 893 | 3,804 | ||||||
Georgia Gulf Corp.* | 194 | 3,781 | ||||||
PH Glatfelter Co. | 263 | 3,714 | ||||||
A. Schulman, Inc. | 175 | 3,707 | ||||||
Koppers Holdings, Inc. | 106 | 3,642 | ||||||
Innospec, Inc.* | 128 | 3,593 | ||||||
AMCOL International Corp. | 132 | 3,544 | ||||||
Kraton Performance Polymers, Inc.* | 173 | 3,512 | ||||||
KapStone Paper and Packaging Corp.* | 221 | 3,479 | ||||||
Stepan Co. | 42 | 3,367 | ||||||
Gold Resource Corp. | 152 | 3,230 | ||||||
LSB Industries, Inc.* | 111 | 3,111 | ||||||
Jaguar Mining, Inc.* | 474 | 3,024 | ||||||
Tredegar Corp. | 131 | 2,910 | ||||||
Flotek Industries, Inc.* | 282 | 2,809 | ||||||
Materion Corp.* | 108 | 2,622 | ||||||
Quaker Chemical Corp. | 67 | 2,606 | ||||||
Century Aluminum Co.* | 285 | 2,425 | ||||||
Golden Star Resources Ltd.* | 1,447 | 2,388 | ||||||
Ferro Corp.* | 483 | 2,362 | ||||||
Wausau Paper Corp. | 279 | 2,305 | ||||||
Horsehead Holding Corp.* | 238 | 2,144 | ||||||
Myers Industries, Inc. | 173 | 2,135 | ||||||
US Gold Corp.* | 590 | 1,982 | ||||||
Neenah Paper, Inc. | 88 | 1,964 | ||||||
Zep, Inc. | 127 | 1,775 | ||||||
Hawkins, Inc. | 48 | 1,769 | ||||||
American Vanguard Corp. | 127 | 1,694 | ||||||
TPC Group, Inc.* | 66 | 1,540 | ||||||
Universal Stainless & Alloy* | 38 | 1,420 | ||||||
Paramount Gold and Silver Corp.* | 653 | 1,397 | ||||||
FutureFuel Corp. | 107 | 1,329 | ||||||
Vista Gold Corp.* | 395 | 1,213 | ||||||
Zoltek Companies, Inc.* | 155 | 1,181 | ||||||
General Moly, Inc.* | 375 | 1,159 | ||||||
Olympic Steel, Inc. | 49 | 1,143 | ||||||
Omnova Solutions, Inc.* | 246 | 1,134 | ||||||
Noranda Aluminum Holding Corp. | 127 | 1,048 | ||||||
Midway Gold Corp.* | 476 | 1,004 | ||||||
Golden Minerals Co.* | 156 | 906 | ||||||
Zagg, Inc.* | 127 | 898 | ||||||
Landec Corp.* | 151 | 834 | ||||||
Spartech Corp.* | 176 | 832 | ||||||
AM Castle & Co.* | 86 | 814 | ||||||
SunCoke Energy, Inc.* | 72 | 806 | ||||||
Headwaters, Inc.* | 343 | 761 | ||||||
Senomyx, Inc.* | 218 | 759 | ||||||
Metals USA Holdings Corp.* | 61 | 686 | ||||||
KMG Chemicals, Inc. | 38 | 656 | ||||||
Revett Minerals, Inc.* | 133 | 628 | ||||||
AEP Industries, Inc.* | 22 | 619 | ||||||
United States Lime & Minerals, Inc.* | 10 | 601 | ||||||
Chase Corp. | 43 | 598 | ||||||
US Energy Corp.* | 131 | 381 | ||||||
Handy & Harman Ltd.* | 27 | 267 | ||||||
Verso Paper Corp.* | 89 | 85 | ||||||
|
| |||||||
Total Materials | 276,376 | |||||||
|
| |||||||
UTILITIES - 2.0% | ||||||||
Piedmont Natural Gas Company, Inc. | 393 | 13,354 | ||||||
Cleco Corp. | 346 | 13,183 | ||||||
WGL Holdings, Inc. | 286 | 12,647 | ||||||
IDACORP, Inc. | 284 | 12,044 | ||||||
New Jersey Resources Corp. | 239 | 11,759 | ||||||
Southwest Gas Corp. | 262 | 11,132 | ||||||
Portland General Electric Co. | 415 | 10,495 | ||||||
UIL Holdings Corp. | 279 | 9,868 | ||||||
South Jersey Industries, Inc. | 167 | 9,487 | ||||||
PNM Resources, Inc. | 482 | 8,787 | ||||||
Avista Corp. | 324 | 8,343 | ||||||
El Paso Electric Co. | 240 | 8,314 | ||||||
Unisource Energy Corp. | 215 | 7,938 | ||||||
Allete, Inc. | 177 | 7,430 | ||||||
Black Hills Corp. | 217 | 7,287 | ||||||
Northwest Natural Gas Co. | 152 | 7,285 | ||||||
NorthWestern Corp. | 197 | 7,051 | ||||||
MGE Energy, Inc. | 134 | 6,267 | ||||||
Atlantic Power Corp. | 387 | 5,534 | ||||||
CH Energy Group, Inc. | 88 | 5,137 | ||||||
Laclede Group, Inc. | 125 | 5,059 | ||||||
Empire District Electric Co. | 239 | 5,041 | ||||||
Otter Tail Corp. | 197 | 4,338 | ||||||
California Water Service Group | 235 | 4,291 | ||||||
American States Water Co. | 107 | 3,734 | ||||||
Central Vermont Public Service Corp. | 79 | 2,773 | ||||||
Chesapeake Utilities Corp. | 48 | 2,081 | ||||||
SJW Corp. | 84 | 1,986 | ||||||
Ormat Technologies, Inc. | 105 | 1,893 | ||||||
Unitil Corp. | 64 | 1,816 | ||||||
Middlesex Water Co. | 89 | 1,661 | ||||||
Dynegy, Inc.* | 570 | 1,579 | ||||||
Connecticut Water Service, Inc. | 49 | 1,329 | ||||||
| 122 | THE RYDEX FUNDSANNUALREPORT | See Notes to Financial Statements. |
| SCHEDULE OF INVESTMENTS (continued) | December 31, 2011 | |
| RUSSELL 2000® 1.5x STRATEGY FUND | ||
| SHARES | VALUE | |||||||
York Water Co. | 67 | $ | 1,182 | |||||
Artesian Resources Corp. — Class A | 42 | 791 | ||||||
Pennichuck Corp. | 27 | 778 | ||||||
Consolidated Water Company Ltd. | 84 | 721 | ||||||
Genie Energy Ltd. — Class B | 89 | 706 | ||||||
Cadiz, Inc.* | 66 | 636 | ||||||
|
| |||||||
Total Utilities | 225,737 | |||||||
|
| |||||||
CONSUMER STAPLES - 2.0% | ||||||||
Nu Skin Enterprises, Inc. — Class A | 303 | 14,717 | ||||||
TreeHouse Foods, Inc.* | 199 | 13,011 | ||||||
Ruddick Corp. | 281 | 11,982 | ||||||
Casey’s General Stores, Inc. | 218 | 11,229 | ||||||
United Natural Foods, Inc.* | 264 | 10,563 | ||||||
Darling International, Inc.* | 653 | 8,678 | ||||||
Lancaster Colony Corp. | 107 | 7,419 | ||||||
Hain Celestial Group, Inc.* | 196 | 7,185 | ||||||
Pricesmart, Inc. | 102 | 7,098 | ||||||
Sanderson Farms, Inc. | 129 | 6,467 | ||||||
B&G Foods, Inc. | 263 | 6,330 | ||||||
Universal Corp. | 134 | 6,159 | ||||||
Fresh Market, Inc.* | 153 | 6,105 | ||||||
Snyders-Lance, Inc. | 262 | 5,895 | ||||||
Fresh Del Monte Produce, Inc. | 202 | 5,052 | ||||||
Elizabeth Arden, Inc.* | 134 | 4,963 | ||||||
Boston Beer Company, Inc. — Class A* | 44 | 4,777 | ||||||
Vector Group Ltd. | 266 | 4,724 | ||||||
Andersons, Inc. | 108 | 4,715 | ||||||
J&J Snack Foods Corp. | 87 | 4,635 | ||||||
Rite Aid Corp.* | 3,299 | 4,157 | ||||||
Heckmann Corp.* | 524 | 3,485 | ||||||
WD-40 Co. | 86 | 3,475 | ||||||
Prestige Brands Holdings, Inc.* | 279 | 3,144 | ||||||
Cal-Maine Foods, Inc. | 83 | 3,035 | ||||||
Tootsie Roll Industries, Inc. | 128 | 3,030 | ||||||
Winn-Dixie Stores, Inc.* | 309 | 2,898 | ||||||
Weis Markets, Inc. | 63 | 2,516 | ||||||
Spartan Stores, Inc. | 132 | 2,442 | ||||||
Spectrum Brands Holdings, Inc.* | 86 | 2,356 | ||||||
Central Garden and Pet Co. — Class A* | 263 | 2,188 | ||||||
Chiquita Brands International, Inc.* | 257 | 2,143 | ||||||
Nash Finch Co. | 70 | 2,050 | ||||||
Central European Distribution Corp.* | 414 | 1,811 | ||||||
Smart Balance, Inc.* | 329 | 1,763 | ||||||
Calavo Growers, Inc. | 66 | 1,695 | ||||||
Dole Food Company, Inc.* | 194 | 1,678 | ||||||
Pilgrim’s Pride Corp.* | 281 | 1,619 | ||||||
Pantry, Inc.* | 134 | 1,604 | ||||||
Coca-Cola Bottling Company Consolidated | 27 | 1,581 | ||||||
Diamond Foods, Inc. | 43 | 1,388 | ||||||
Inter Parfums, Inc. | 86 | 1,338 | ||||||
Alliance One International, Inc.* | 484 | 1,316 | ||||||
Seneca Foods Corp. — Class A* | 48 | 1,239 | ||||||
USANA Health Sciences, Inc.* | 39 | 1,184 | ||||||
Village Super Market, Inc. — Class A | 40 | 1,138 | ||||||
Chefs’ Warehouse, Inc.* | 60 | 1,072 | ||||||
Ingles Markets, Inc. — Class A | 68 | 1,024 | ||||||
Medifast, Inc.* | 74 | 1,015 | ||||||
National Beverage Corp.* | 62 | 996 | ||||||
Nature’s Sunshine Products, Inc.* | 62 | 962 | ||||||
Revlon, Inc. — Class A* | 63 | 937 | ||||||
Susser Holdings Corp.* | 41 | 927 | ||||||
Schiff Nutrition International, Inc.* | 71 | 760 | ||||||
Limoneira Co. | 44 | 744 | ||||||
Omega Protein Corp.* | 104 | 742 | ||||||
Nutraceutical International Corp.* | 48 | 543 | ||||||
Oil-Dri Corporation of America | 25 | 506 | ||||||
Star Scientific, Inc.* | 225 | 491 | ||||||
Female Health Co. | 108 | 487 | ||||||
Synutra International, Inc.* | 92 | 466 | ||||||
Craft Brewers Alliance, Inc.* | 64 | 385 | ||||||
Alico, Inc. | 18 | 349 | ||||||
MGP Ingredients, Inc. | 68 | 343 | ||||||
Farmer Brothers Co. | 40 | 306 | ||||||
Lifeway Foods, Inc.* | 26 | 251 | ||||||
Imperial Sugar Co. | 70 | 250 | ||||||
Primo Water Corp.* | 82 | 249 | ||||||
Harbinger Group, Inc.* | 49 | 196 | ||||||
|
| |||||||
Total Consumer Staples | 221,978 | |||||||
|
| |||||||
TELECOMMUNICATION SERVICES - 0.4% | ||||||||
AboveNet, Inc.* | 133 | 8,646 | ||||||
Cogent Communications Group, Inc.* | 259 | 4,375 | ||||||
Cincinnati Bell, Inc.* | 1,117 | 3,385 | ||||||
Leap Wireless International, Inc.* | 345 | 3,205 | ||||||
Consolidated Communications Holdings, Inc. | 154 | 2,934 | ||||||
Premiere Global Services, Inc.* | 284 | 2,405 | ||||||
General Communication, Inc. — Class A* | 239 | 2,340 | ||||||
Pendrell Corp.* | 849 | 2,173 | ||||||
Vonage Holdings Corp.* | 782 | 1,916 | ||||||
Iridium Communications, Inc.* | 240 | 1,850 | ||||||
Neutral Tandem, Inc.* | 173 | 1,849 | ||||||
Atlantic Tele-Network, Inc. | 47 | 1,835 | ||||||
USA Mobility, Inc. | 127 | 1,761 | ||||||
NTELOS Holdings Corp. | 83 | 1,692 | ||||||
| See Notes to Financial Statements. | THE RYDEX FUNDSANNUALREPORT | 123 |
| SCHEDULE OF INVESTMENTS (concluded) | December 31, 2011 | |
| RUSSELL 2000® 1.5x STRATEGY FUND | ||
| SHARES | VALUE | |||||||
Shenandoah Telecommunications Co. | 133 | $ | 1,394 | |||||
Lumos Networks Corp. | 83 | 1,273 | ||||||
Cbeyond, Inc.* | 152 | 1,218 | ||||||
8x8, Inc.* | 348 | 1,103 | ||||||
SureWest Communications | 89 | 1,071 | ||||||
HickoryTech Corp. | 82 | 909 | ||||||
IDT Corp. — Class B | 89 | 835 | ||||||
inContact, Inc.* | 175 | 775 | ||||||
Alaska Communications Systems Group, Inc. | 256 | 771 | ||||||
Fairpoint Communications, Inc.* | 127 | 550 | ||||||
Towerstream Corp.* | 234 | 491 | ||||||
Globalstar, Inc.* | 566 | 306 | ||||||
Boingo Wireless, Inc.* | 27 | 232 | ||||||
|
| |||||||
Total Telecommunication Services | 51,294 | |||||||
|
| |||||||
Total Common Stocks | 6,122,242 | |||||||
|
| |||||||
WARRANTS†† - 0.0% | ||||||||
Krispy Kreme Doughnuts, Inc. | 52 | 1 | ||||||
Magnum Hunter Resources Corp. | 13 | — | ||||||
|
| |||||||
Total Warrants | 1 | |||||||
|
| |||||||
| FACE AMOUNT | ||||||||
REPURCHASE AGREEMENTS††,1 - 62.8% | ||||||||
Credit Suisse Group issued 12/30/11 at 0.00% due 01/03/122 | $ | 2,714,999 | 2,714,999 | |||||
Mizuho Financial Group, Inc. issued 12/30/11 at 0.00% due 01/03/12 | 1,441,661 | 1,441,661 | ||||||
HSBC Group issued 12/30/11 at 0.00% due 01/03/12 | 1,380,046 | 1,380,046 | ||||||
Deutsche Bank issued 12/30/11 at 0.00% due 01/03/12 | 1,380,046 | 1,380,046 | ||||||
|
| |||||||
Total Repurchase Agreements | 6,916,752 | |||||||
|
| |||||||
Total Investments – 118.3% | $ | 13,038,995 | ||||||
|
| |||||||
Liabilities, Less Cash & | (2,017,303 | ) | ||||||
|
| |||||||
Total Net Assets – 100.0% | $ | 11,021,692 | ||||||
| CONTRACTS | UNREALIZED GAIN (LOSS) | |||||||
FUTURES CONTRACTS PURCHASED† | ||||||||
March 2012 Russell 2000 Index Mini Futures Contracts (Aggregate Value of Contracts $441,840) | 6 | $ | 4,136 | |||||
|
| |||||||
| UNITS | ||||||||
EQUITY INDEX SWAP AGREEMENTS†† | ||||||||
Morgan Stanley Capital Services, Inc. January 2012 Russell 2000 Index Swap, Terminating 01/30/123 (Notional Value $437,013) | 590 | $ | (5,833 | ) | ||||
Barclays Bank plc January 2012 Russell 2000 Index Swap, Terminating 01/31/123 | 4,804 | (19,341 | ) | |||||
Credit Suisse Capital, LLC January 2012 Russell 2000 Index Swap, Terminating 01/31/123 (Notional Value $3,779,641) | 5,101 | (20,622 | ) | |||||
Goldman Sachs International January 2012 Russell 2000 Index Swap, Terminating 01/27/123 (Notional Value $2,206,135) | 2,978 | (27,126 | ) | |||||
|
| |||||||
(Total Notional Value $9,982,051) | $ | (72,922 | ) | |||||
|
| |||||||
| * | Non-income producing security. |
| † | Value determined based on Level 1 inputs — See Note 4. |
| †† | Value determined based on Level 2 inputs — See Note 4. |
| 1 | Repurchase Agreements — See Note 5. |
| 2 | All or a portion of this security is pledged as equity index swap collateral at December 31, 2011. |
| 3 | Total Return based on Russell 2000 Index +/- financing at a variable rate. |
| plc | — Public Limited Company |
| REIT | — Real Estate Investment Trust |
| 124 | THE RYDEX FUNDSANNUALREPORT | See Notes to Financial Statements. |
RUSSELL 2000® 1.5x STRATEGY FUND
STATEMENT OF ASSETS AND LIABILITIES
December 31, 2011
ASSETS: | ||||
Investments, at value | $ | 6,122,243 | ||
Repurchase agreements, at value | 6,916,752 | |||
|
| |||
Total investments | 13,038,995 | |||
Segregated cash with broker | 183,138 | |||
Receivables: | ||||
Dividends | 8,745 | |||
Securities sold | 972 | |||
|
| |||
Total assets | 13,231,850 | |||
|
| |||
LIABILITIES: | ||||
Unrealized depreciation on swap agreements | 72,922 | |||
Payable for: | ||||
Fund shares redeemed | 2,035,854 | |||
Swap settlement | 64,077 | |||
Management fees | 10,009 | |||
Variation margin | 4,413 | |||
Transfer agent and administrative fees | 2,780 | |||
Investor service fees | 2,780 | |||
Portfolio accounting fees | 1,112 | |||
Miscellaneous | 16,211 | |||
|
| |||
Total liabilities | 2,210,158 | |||
|
| |||
NETASSETS | $ | 11,021,692 | ||
|
| |||
NETASSETSCONSISTOF: | ||||
Paid in capital | $ | 20,770,283 | ||
Accumulated net investment loss | (496 | ) | ||
Accumulated net realized loss on investments | (9,779,215 | ) | ||
Net unrealized appreciation on investments | 31,120 | |||
|
| |||
Net assets | $ | 11,021,692 | ||
Capital shares outstanding | 412,100 | |||
Net asset value per share | $ | 26.75 | ||
|
|
STATEMENT OF OPERATIONS
For the Year Ended December 31, 2011
INVESTMENT INCOME: | ||||
Dividends (net of foreign withholding tax of $8) | $ | 36,267 | ||
Interest | 6,188 | |||
|
| |||
Total investment income | 42,455 | |||
|
| |||
EXPENSES: | ||||
Management fees | 117,519 | |||
Transfer agent and administrative fees | 32,644 | |||
Investor service fees | 32,644 | |||
Portfolio accounting fees | 13,058 | |||
Custodian fees | 3,141 | |||
Trustees’ fees* | 1,314 | |||
Miscellaneous | 36,646 | |||
|
| |||
Total expenses | 236,966 | |||
|
| |||
Net investment loss | (194,511 | ) | ||
|
| |||
NET REALIZEDAND UNREALIZED GAIN (LOSS): | ||||
Net realized gain (loss) on: | ||||
Investments | 852,660 | |||
Swap agreements | (1,742,191 | ) | ||
Futures contracts | (516,184 | ) | ||
Foreign currency | (2 | ) | ||
|
| |||
Net realized loss | (1,405,717 | ) | ||
|
| |||
Net change in unrealized appreciation (depreciation) on: | ||||
Investments | (948,397 | ) | ||
Swap agreements | 107,550 | |||
Futures contracts | (16,011 | ) | ||
|
| |||
Net change in unrealized appreciation (depreciation) | (856,858 | ) | ||
|
| |||
Net realized and unrealized loss | (2,262,575 | ) | ||
|
| |||
Net decrease in net assets resulting from operations | $ | (2,457,086 | ) | |
|
|
| * | Relates to Trustees not deemed “interested persons” within the meaning of Section 2(a)(19) of the 1940 Act. |
| See Notes to Financial Statements. | THE RYDEX FUNDSANNUALREPORT | 125 |
RUSSELL 2000® 1.5x STRATEGY FUND
STATEMENTS OF CHANGES IN NET ASSETS
| Year Ended December 31, 2011 | Year Ended December 31, 2010 | |||||||
INCREASE (DECREASE) IN NET ASSETS FROM OPERATIONS: | ||||||||
Net investment loss | $ | (194,511 | ) | $ | (158,445 | ) | ||
Net realized gain (loss) on investments | (1,405,717 | ) | 2,460,035 | |||||
Net change in unrealized appreciation (depreciation) on investments | (856,858 | ) | (550,603 | ) | ||||
|
|
|
| |||||
Net increase (decrease) in net assets resulting from operations | (2,457,086 | ) | 1,750,987 | |||||
|
|
|
| |||||
CAPITAL SHARE TRANSACTIONS: | ||||||||
Proceeds from sale of shares | 123,646,020 | 192,625,276 | ||||||
Cost of shares redeemed | (127,453,330 | ) | (187,677,270 | ) | ||||
|
|
|
| |||||
Net increase (decrease) from capital share transactions | (3,807,310 | ) | 4,948,006 | |||||
|
|
|
| |||||
Net increase (decrease) in net assets | (6,264,396 | ) | 6,698,993 | |||||
NETASSETS: | ||||||||
Beginning of year | 17,286,088 | 10,587,095 | ||||||
|
|
|
| |||||
End of year | $ | 11,021,692 | $ | 17,286,088 | ||||
|
|
|
| |||||
Accumulated net investment loss at end of year | $ | (496 | ) | $ | (772 | ) | ||
|
|
|
| |||||
CAPITALSHAREACTIVITY: | ||||||||
Shares sold | 4,208,817 | 7,843,412 | ||||||
Shares redeemed | (4,364,441 | ) | (7,755,086 | ) | ||||
|
|
|
| |||||
Net increase (decrease) in shares | (155,624 | ) | 88,326 | |||||
|
|
|
| |||||
| 126 | THE RYDEX FUNDSANNUALREPORT | See Notes to Financial Statements. |
RUSSELL 2000® 1.5x STRATEGY FUND
FINANCIAL HIGHLIGHTS
This table is presented to show selected data for a share outstanding throughout each period, and to assist shareholders in evaluating a Fund’s performance for the periods presented.
| Year Ended December 31, 2011 | Year Ended December 31, 2010 | Year Ended December 31, 2009 | Year Ended December 31, 2008 | Year Ended December 31, 2007 | ||||||||||||||||
Per Share Data | ||||||||||||||||||||
Net asset value, beginning of period | $ | 30.45 | $ | 22.08 | $ | 16.57 | $ | 34.20 | $ | 41.14 | ||||||||||
|
|
|
|
|
|
|
|
|
| |||||||||||
Income (loss) from investment operations: | ||||||||||||||||||||
Net investment income (loss)a | (.45 | ) | (.27 | ) | (.14 | ) | .01 | .49 | ||||||||||||
Net gain (loss) on investments (realized and unrealized) | (3.25 | ) | 8.64 | 5.65 | (17.58 | ) | (3.26 | ) | ||||||||||||
|
|
|
|
|
|
|
|
|
| |||||||||||
Total from investment operations | (3.70 | ) | 8.37 | 5.51 | (17.57 | ) | (2.77 | ) | ||||||||||||
|
|
|
|
|
|
|
|
|
| |||||||||||
Less distributions from: | ||||||||||||||||||||
Net investment income | — | — | — | (.06 | ) | (.96 | ) | |||||||||||||
Net realized gains | — | — | — | — | (3.21 | ) | ||||||||||||||
|
|
|
|
|
|
|
|
|
| |||||||||||
Total distributions | — | — | — | (.06 | ) | (4.17 | ) | |||||||||||||
|
|
|
|
|
|
|
|
|
| |||||||||||
Net asset value, end of period | $ | 26.75 | $ | 30.45 | $ | 22.08 | $ | 16.57 | $ | 34.20 | ||||||||||
|
|
|
|
|
|
|
|
|
| |||||||||||
Total Returnb | (12.18 | %) | 37.85 | % | 33.31 | % | (51.36 | %) | (6.74 | %) | ||||||||||
|
|
|
|
|
|
|
|
|
| |||||||||||
Ratios/Supplemental Data | ||||||||||||||||||||
Net assets, end of period (in thousands) | $ | 11,022 | $ | 17,286 | $ | 10,587 | $ | 13,978 | $ | 21,879 | ||||||||||
|
|
|
|
|
|
|
|
|
| |||||||||||
Ratios to average net assets: | ||||||||||||||||||||
Net investment income (loss) | (1.49 | %) | (1.11 | %) | (0.83 | %) | 0.05 | % | 1.16 | % | ||||||||||
Total expenses | 1.81 | % | 1.74 | % | 1.74 | % | 1.68 | % | 1.66 | % | ||||||||||
|
|
|
|
|
|
|
|
|
| |||||||||||
Portfolio turnover rate | 65 | % | 249 | % | 376 | % | 490 | % | 354 | % | ||||||||||
| a | Net investment income (loss) per share was computed using average shares outstanding throughout the period. |
| b | Total return does not reflect the impact of any additional fees charged by insurance companies and has not been annualized. |
| See Notes to Financial Statements. | THE RYDEX FUNDSANNUALREPORT | 127 |
PERFORMANCE REPORT AND FUND PROFILE (Unaudited) | December 31, 2011 |
INVERSE RUSSELL 2000® STRATEGY FUND
OBJECTIVE: Seeks to provide investment results that match, before fees and expenses, the performance of a specific benchmark on a daily basis. The Fund’s current benchmark is the inverse (opposite) of the performance of the Russell 2000® Index (the “underlying index”). The Fund does not seek to achieve its investment objective over a period of time greater than one day.
For the year ended December 31, 2011, Inverse Russell 2000® Strategy Fund maintained a daily correlation of over 99% to its benchmark of -100% of the daily price movement of the Russell 2000 Index. Inverse Russell 2000® Strategy Fund returned -7.61% while the Russell 2000 Index returned -4.18% over the same time period.
Among sectors, the biggest performance contributors to the index during the period were Utilities and Health Care. Information Technology and Consumer Discretionary detracted from index performance for the year.
Healthspring, Inc., Pharmasset, Inc. and Netlogic Microsystems, Inc. were the largest contributors to performance of the index for the year. Hecla Mining Co., MF Global Holdings Ltd. and Meritor, Inc. were the leading detractors for the year.
Derivatives in the Fund were used to help provide exposure to the composition of the benchmark in the highest efficient manner and not for hedging purposes.
Due to the compounding of daily returns, leveraged and inverse funds’ returns over periods other than one day will likely differ in amount and possibly direction from the benchmark return for the same period. Investors should monitor their leveraged and inverse funds’ holdings to ensure that they are consistent with their strategies, as frequently as daily.
The effects of compounding may cause the longer-term correlation of the fund to its benchmark to diminish. The apparent discrepancy between the leveraged and unleveraged indices is the result of compounding, which is described briefly on page 4 of this report.
Russell 2000® Index measures the performance of the small-cap value segment of the U.S. equity universe.
Holdings Diversification (Market Exposure as % of Net Assets)
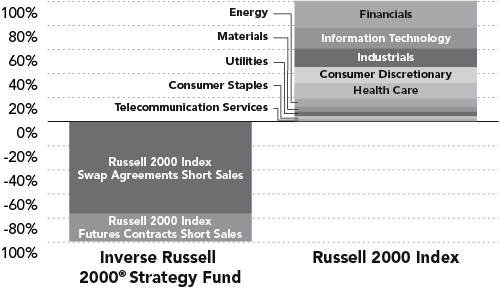
“Holdings Diversification (Market Exposure as % of Net Assets)” excludes any temporary cash investments.
Inception Date: May 3, 2004
The Fund invests principally in derivative investments such as swap agreements and futures contracts.
128 | THE RYDEX FUNDSANNUALREPORT
PERFORMANCE REPORT AND FUND PROFILE (Unaudited) (concluded)
INVERSE RUSSELL 2000® STRATEGY FUND
Cumulative Fund Performance*
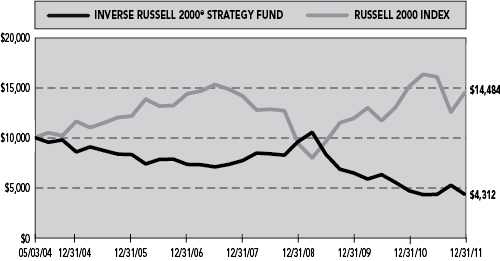
Average Annual Returns*
Periods Ended 12/31/11
| 1 Year | 5 Year | Since Inception (05/03/04) | ||||||||||
Inverse Russell 2000® Strategy Fund | -7.61 | % | -10.02 | % | -10.40 | % | ||||||
Russell 2000 Index | -4.18 | % | 0.15 | % | 4.95 | % | ||||||
| * | The performance data represents past performance that is not predictive of future results. The investment return and principal value of an investment in the Fund will fluctuate so that an investor’s shares, when redeemed, may be worth more or less than their original cost. Returns are historical and include changes in principal and reinvested dividends and capital gains and do not reflect the effect of taxes. The Russell 2000 Index is an unmanaged index and, unlike the Fund, has no management fees or operating expenses to reduce its reported return. |
Returns do not reflect the impact of any additional fees charged by insurance companies.
THE RYDEX FUNDSANNUALREPORT | 129
SCHEDULE OF INVESTMENTS | December 31, 2011 |
INVERSE RUSSELL 2000® STRATEGY FUND
| FACE AMOUNT | VALUE | |||||||
FEDERAL AGENCY | ||||||||
Federal Home Loan Bank1 | $ | 300,000 | $ | 299,998 | ||||
Freddie Mac2 | 300,000 | 299,985 | ||||||
Federal Farm Credit Bank1 | 300,000 | 299,883 | ||||||
|
| |||||||
Total Federal Agency Discount | 899,866 | |||||||
|
| |||||||
REPURCHASE |
| |||||||
Credit Suisse Group | 964,764 | 964,764 | ||||||
Mizuho Financial Group, Inc. | 704,684 | 704,684 | ||||||
HSBC Group | 674,566 | 674,566 | ||||||
Deutsche Bank | 674,566 | 674,566 | ||||||
|
| |||||||
Total Repurchase Agreements | 3,018,580 | |||||||
|
| |||||||
Total Investments – 81.0% | $ | 3,918,446 | ||||||
|
| |||||||
Cash & Other Assets, | 916,656 | |||||||
|
| |||||||
Total Net Assets – 100.0% | $ | 4,835,102 | ||||||
| CONTRACTS | UNREALIZED GAIN | |||||||
FUTURES CONTRACTS | ||||||||
March 2012 Russell 2000 Index | 15 | $ | 3,671 | |||||
|
| |||||||
| UNITS | ||||||||
EQUITY INDEX SWAP | ||||||||
Morgan Stanley Capital Services, Inc. | 606 | $ | 5,966 | |||||
Credit Suisse Capital, LLC | 1,447 | 5,848 | ||||||
Goldman Sachs International | 1,953 | 4,353 | ||||||
Barclays Bank plc | 978 | 3,972 | ||||||
|
| |||||||
(Total Notional Value $3,691,852) | $ | 20,139 | ||||||
|
| |||||||
| † | Value determined based on Level 1 inputs — See Note 4. |
| †† | Value determined based on Level 2 inputs — See Note 4. |
| 1 | The issuer operates under a Congressional charter; its securities are neither issued nor guaranteed by the U.S. Government. |
| 2 | On September 7, 2008, the issuer was placed in conservatorship by the Federal Housing Finance Agency (FHFA). As conservator, the FHFA has full powers to control the assets and operations of the firm. |
| 3 | Repurchase Agreements — See Note 5. |
| 4 | All or a portion of this security is pledged as equity index swap collateral at December 31, 2011. |
| 5 | Total Return based on Russell 2000 Index +/- financing at a variable rate. |
plc — Public Limited Company
| 130 | THE RYDEX FUNDSANNUALREPORT | See Notes to Financial Statements. |
INVERSE RUSSELL 2000® STRATEGY FUND
STATEMENT OF ASSETS AND LIABILITIES
December 31, 2011
ASSETS: | ||||
Investments, at value | $ | 899,866 | ||
Repurchase agreements, at value | 3,018,580 | |||
|
| |||
Total investments | 3,918,446 | |||
Segregated cash with broker | 100,073 | |||
Unrealized appreciation on swap agreements | 20,139 | |||
Receivables: | ||||
Fund shares sold | 802,837 | |||
Variation margin | 3,922 | |||
|
| |||
Total assets | 4,845,417 | |||
|
| |||
LIABILITIES: | ||||
Payable for: | ||||
Management fees | 3,098 | |||
Transfer agent and administrative fees | 860 | |||
Investor service fees | 860 | |||
Portfolio accounting fees | 344 | |||
Fund shares redeemed | 80 | |||
Miscellaneous | 5,073 | |||
|
| |||
Total liabilities | 10,315 | |||
|
| |||
NETASSETS | $ | 4,835,102 | ||
|
| |||
NETASSETSCONSISTOF: | ||||
Paid in capital | $ | 20,130,916 | ||
Undistributed net investment income | — | |||
Accumulated net realized loss on investments | (15,319,657 | ) | ||
Net unrealized appreciation on investments | 23,843 | |||
|
| |||
Net assets | $ | 4,835,102 | ||
Capital shares outstanding | 252,190 | |||
Net asset value per share | $ | 19.17 | ||
|
|
STATEMENT OF OPERATIONS
Year Ended December 31, 2011
INVESTMENT INCOME: | ||||
Interest | $ | 3,048 | ||
|
| |||
Total investment income | 3,048 | |||
|
| |||
EXPENSES: | ||||
Management fees | 60,125 | |||
Transfer agent and administrative fees | 16,701 | |||
Investor service fees | 16,701 | |||
Portfolio accounting fees | 6,680 | |||
Custodian fees | 1,663 | |||
Trustees’ fees* | 616 | |||
Miscellaneous | 19,047 | |||
|
| |||
Total expenses | 121,533 | |||
|
| |||
Net investment loss | (118,485 | ) | ||
|
| |||
NET REALIZEDAND UNREALIZED GAIN (LOSS): | ||||
Net realized gain (loss) on: | ||||
Swap agreements | (82,194 | ) | ||
Futures contracts | 3,393 | |||
|
| |||
Net realized loss | (78,801 | ) | ||
|
| |||
Net change in unrealized appreciation (depreciation) on: | ||||
Investments | 19 | |||
Swap agreements | (463 | ) | ||
Futures contracts | (3,077 | ) | ||
|
| |||
Net change in unrealized appreciation (depreciation) | (3,521 | ) | ||
|
| |||
Net realized and unrealized loss | (82,322 | ) | ||
|
| |||
Net decrease in net assets resulting from operations | $ | (200,807 | ) | |
|
|
| * | Relates to Trustees not deemed “interested persons” within the meaning of Section 2(a)(19) of the 1940 Act. |
| See Notes to Financial Statements. | THE RYDEX FUNDSANNUALREPORT | 131 |
INVERSE RUSSELL 2000® STRATEGY FUND
STATEMENTS OF CHANGES IN NET ASSETS
| Year Ended December 31, 2011 | Year Ended December 31, 2010 | |||||||
INCREASE (DECREASE) IN NET ASSETS FROM OPERATIONS: | ||||||||
Net investment loss | $ | (118,485 | ) | $ | (150,833 | ) | ||
Net realized loss on investments | (78,801 | ) | (3,514,403 | ) | ||||
Net change in unrealized appreciation (depreciation) on investments | (3,521 | ) | 194,049 | |||||
|
|
|
| |||||
Net decrease in net assets resulting from operations | (200,807 | ) | (3,471,187 | ) | ||||
|
|
|
| |||||
CAPITALSHARETRANSACTIONS: | ||||||||
Proceeds from sale of shares | 183,878,531 | 205,622,652 | ||||||
Cost of shares redeemed | (184,489,501 | ) | (207,937,932 | ) | ||||
|
|
|
| |||||
Net decrease from capital share transactions | (610,970 | ) | (2,315,280 | ) | ||||
|
|
|
| |||||
Net decrease in net assets | (811,777 | ) | (5,786,467 | ) | ||||
NETASSETS: | ||||||||
Beginning of year | 5,646,879 | 11,433,346 | ||||||
|
|
|
| |||||
End of year | $ | 4,835,102 | $ | 5,646,879 | ||||
|
|
|
| |||||
Undistributed net investment income at end of year | $ | — | $ | — | ||||
|
|
|
| |||||
CAPITALSHAREACTIVITY: | ||||||||
Shares sold | 9,095,126 | 7,976,108 | ||||||
Shares redeemed | (9,115,056 | ) | (8,102,738 | ) | ||||
|
|
|
| |||||
Net decrease in shares | (19,930 | ) | (126,630 | ) | ||||
|
|
|
| |||||
| 132 | THE RYDEX FUNDSANNUALREPORT | See Notes to Financial Statements. |
INVERSE RUSSELL 2000® STRATEGY FUND
FINANCIAL HIGHLIGHTS
This table is presented to show selected data for a share outstanding throughout each period, and to assist shareholders in evaluating a Fund’s performance for the periods presented.
| Year Ended December 31, 2011 | Year Ended December 31, 2010 | Year Ended December 31, 2009 | Year Ended December 31, 2008 | Year Ended December 31, 2007 | ||||||||||||||||
Per Share Data | ||||||||||||||||||||
Net asset value, beginning of period | $ | 20.75 | $ | 28.67 | $ | 42.70 | $ | 34.66 | $ | 34.61 | ||||||||||
|
|
|
|
|
|
|
|
|
| |||||||||||
Income (loss) from investment operations: | ||||||||||||||||||||
Net investment income (loss)a | (.36 | ) | (.41 | ) | (.56 | ) | .08 | 1.10 | ||||||||||||
Net gain (loss) on investments (realized and unrealized) | (1.22 | ) | (7.51 | ) | (13.47 | ) | 8.54 | .76 | ||||||||||||
|
|
|
|
|
|
|
|
|
| |||||||||||
Total from investment operations | (1.58 | ) | (7.92 | ) | (14.03 | ) | 8.62 | 1.86 | ||||||||||||
|
|
|
| �� |
|
|
|
|
|
| ||||||||||
Less distributions from: | ||||||||||||||||||||
Net investment income | — | — | — | (.58 | ) | (1.81 | ) | |||||||||||||
|
|
|
|
|
|
|
|
|
| |||||||||||
Total distributions | — | — | — | (.58 | ) | (1.81 | ) | |||||||||||||
|
|
|
|
|
|
|
|
|
| |||||||||||
Net asset value, end of period | $ | 19.17 | $ | 20.75 | $ | 28.67 | $ | 42.70 | $ | 34.66 | ||||||||||
|
|
|
|
|
|
|
|
|
| |||||||||||
Total Returnb | (7.61 | %) | (27.62 | %) | (32.86 | %) | 24.69 | % | 5.37 | % | ||||||||||
|
|
|
|
|
|
|
|
|
| |||||||||||
Ratios/Supplemental Data | ||||||||||||||||||||
Net assets, end of period (in thousands) | $ | 4,835 | $ | 5,647 | $ | 11,433 | $ | 7,778 | $ | 11,535 | ||||||||||
|
|
|
|
|
|
|
|
|
| |||||||||||
Ratios to average net assets: | ||||||||||||||||||||
Net investment income (loss) | (1.77 | %) | (1.58 | %) | (1.60 | %) | 0.22 | % | 3.19 | % | ||||||||||
Total expenses | 1.82 | % | 1.73 | % | 1.73 | % | 1.69 | % | 1.67 | % | ||||||||||
|
|
|
|
|
|
|
|
|
| |||||||||||
Portfolio turnover rate | — | — | — | — | — | |||||||||||||||
| a | Net investment income (loss) per share was computed using average shares outstanding throughout the period. |
| b | Total return does not reflect the impact of any additional fees charged by insurance companies and has not been annualized. |
| See Notes to Financial Statements. | THE RYDEX FUNDSANNUALREPORT | 133 |
| PERFORMANCE REPORT AND FUND PROFILE (Unaudited) | December 31, 2011 | |
| DOW 2x STRATEGY FUND |
OBJECTIVE: Seeks to provide investment results that match the performance, before fees and expenses, of a specific benchmark on a daily basis. The Fund’s current benchmark is 200% of the performance of the Dow Jones Industrial AverageSM (the “underlying index”). The Fund does not seek to achieve its investment objective over a period of time greater than one day.
For the year ended December 31, 2011, Dow 2x Strategy Fund maintained a daily correlation of over 99% to its benchmark of 200% of the daily price movement of the Dow Jones Industrial Average. Dow 2x Strategy Fund gained 9.09% while the Dow Jones Industrial Average rose 8.38% over the same time period.
Consumer Discretionary and Energy provided the most performance to the index during the year. Materials and Financials were the largest detractors from performance for the year.
International Business Machines Corp., McDonald’s Corp. and Chevron Corp. were the largest contributors to performance of the index for the year. Hewlett-Packard Co., JPMorgan Chase & Co. and Bank of America Corp. were the largest detractors from performance for the year.
Derivatives in the Fund were used to help provide exposure to the composition of the benchmark in the highest efficient manner and to provide leverage, not for hedging purposes.
Due to the compounding of daily returns, leveraged and inverse funds’ returns over periods other than one day will likely differ in amount and possibly direction from the benchmark return for the same period. Investors should monitor their leveraged and inverse funds’ holdings to ensure that they are consistent with their strategies, as frequently as daily.
The effects of compounding may cause the longer-term correlation of the fund to its benchmark to diminish. The apparent discrepancy between the leveraged and unleveraged indices is the result of compounding, which is described briefly on page 4 of this report.
The Dow Jones Industrial AverageSM is a price-weighted average of 30 significant stocks traded on the New York Stock Exchange and the Nasdaq. The DJIA was invented by Charles Dow back in 1896.
Holdings Diversification (Market Exposure as % of Net Assets)
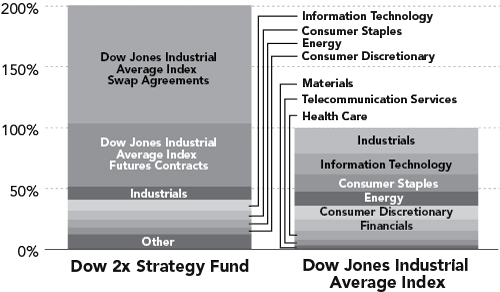
“Holdings Diversification (Market Exposure as % of Net Assets)” excludes any temporary cash investments.
Inception Date: May 3, 2004
Ten Largest Holdings (% of Total Net Assets) | ||||
International Business Machines Corp. | 5.8 | % | ||
Chevron Corp. | 3.4 | % | ||
McDonald’s Corp. | 3.2 | % | ||
Caterpillar, Inc. | 2.9 | % | ||
Exxon Mobil Corp. | 2.7 | % | ||
3M Co. | 2.6 | % | ||
United Technologies Corp. | 2.5 | % | ||
Boeing Co. | 2.3 | % | ||
Coca-Cola Co. | 2.2 | % | ||
Procter & Gamble Co. | 2.1 | % | ||
|
| |||
Top Ten Total | 29.7 | % | ||
|
| |||
“Ten Largest Holdings” exclude any temporary cash or derivative investments.
| 134 | THE RYDEX FUNDSANNUALREPORT |
| PERFORMANCE REPORT AND FUND PROFILE (Unaudited) (concluded) | ||
DOW 2x STRATEGY FUND |
Cumulative Fund Performance*

Average Annual Returns*
Periods Ended 12/31/11
| 1 Year | 5 Year | Since Inception (05/03/04) | ||||||||||
Dow 2x Strategy Fund | 9.09 | % | -5.09 | % | 0.65 | % | ||||||
Dow Jones Industrial Average Index | 8.38 | % | 2.37 | % | 4.91 | % | ||||||
| * | The performance data represents past performance that is not predictive of future results. The investment return and principal value of an investment in the Fund will fluctuate so that an investor’s shares, when redeemed, may be worth more or less than their original cost. Returns are historical and include changes in principal and reinvested dividends and capital gains and do not reflect the effect of taxes. The Dow Jones Industrial Average Index is an unmanaged index and, unlike the Fund, has no management fees or operating expenses to reduce its reported return. |
| Returns do not reflect the impact of any additional fees charged by insurance companies. |
| THE RYDEX FUNDSANNUALREPORT | 135 |
| SCHEDULE OF INVESTMENTS | December 31, 2011 | |
DOW 2x STRATEGY FUND |
| SHARES | VALUE | |||||||
COMMON STOCKS† - 51.3% | ||||||||
INDUSTRIALS - 10.9% | ||||||||
Caterpillar, Inc. | 6,050 | $ | 548,130 | |||||
3M Co. | 6,050 | 494,467 | ||||||
United Technologies Corp. | 6,652 | 486,195 | ||||||
Boeing Co. | 6,050 | 443,767 | ||||||
General Electric Co. | 6,050 | 108,355 | ||||||
|
| |||||||
Total Industrials | 2,080,914 | |||||||
|
| |||||||
INFORMATION TECHNOLOGY - 8.8 % | ||||||||
International Business Machines Corp. | 6,051 | 1,112,658 | ||||||
Microsoft Corp. | 6,050 | 157,058 | ||||||
Hewlett-Packard Co. | 6,050 | 155,848 | ||||||
Intel Corp. | 6,049 | 146,688 | ||||||
Cisco Systems, Inc. | 6,050 | 109,384 | ||||||
|
| |||||||
Total Information Technology | 1,681,636 | |||||||
|
| |||||||
CONSUMER STAPLES - 7.4% |
| |||||||
Coca-Cola Co. | 6,050 | 423,318 | ||||||
Procter & Gamble Co. | 6,052 | 403,729 | ||||||
Wal-Mart Stores, Inc. | 6,050 | 361,548 | ||||||
Kraft Foods, Inc. — Class A | 6,052 | 226,103 | ||||||
|
| |||||||
Total Consumer Staples | 1,414,698 | |||||||
|
| |||||||
ENERGY - 6.0% | ||||||||
Chevron Corp. | 6,050 | 643,720 | ||||||
Exxon Mobil Corp. | 6,050 | 512,798 | ||||||
|
| |||||||
Total Energy | 1,156,518 | |||||||
|
| |||||||
CONSUMER DISCRETIONARY - 5.7% | ||||||||
McDonald’s Corp. | 6,052 | 607,197 | ||||||
Home Depot, Inc. | 6,050 | 254,342 | ||||||
Walt Disney Co. | 6,050 | 226,875 | ||||||
|
| |||||||
Total Consumer Discretionary | 1,088,414 | |||||||
|
| |||||||
FINANCIALS - 4.6% | ||||||||
Travelers Companies, Inc. | 6,050 | 357,979 | ||||||
American Express Co. | 6,050 | 285,379 | ||||||
JPMorgan Chase & Co. | 6,049 | 201,129 | ||||||
Bank of America Corp. | 6,050 | 33,638 | ||||||
|
| |||||||
Total Financials | 878,125 | |||||||
|
| |||||||
HEALTH CARE - 4.0% | ||||||||
Johnson & Johnson | 6,049 | 396,693 | ||||||
Merck & Company, Inc. | 6,050 | 228,085 | ||||||
Pfizer, Inc. | 6,050 | 130,922 | ||||||
|
| |||||||
Total Health Care | 755,700 | |||||||
|
| |||||||
TELECOMMUNICATION SERVICES - 2.2 % | ||||||||
Verizon Communications, Inc. | 6,046 | 242,566 | ||||||
AT&T, Inc. | 6,050 | 182,952 | ||||||
|
| |||||||
Total Telecommunication Services | 425,518 | |||||||
|
| |||||||
MATERIALS - 1.7% | ||||||||
EI du Pont de Nemours & Co. | 6,050 | 276,969 | ||||||
Alcoa, Inc. | 6,050 | 52,333 | ||||||
|
| |||||||
Total Materials | 329,302 | |||||||
|
| |||||||
Total Common Stocks | 9,810,825 | |||||||
|
| |||||||
| FACE AMOUNT | ||||||||
REPURCHASE | ||||||||
Credit Suisse Group | $ | 2,358,202 | 2,358,202 | |||||
Mizuho Financial Group, Inc. | 1,353,330 | 1,353,330 | ||||||
HSBC Group | 1,295,490 | 1,295,490 | ||||||
Deutsche Bank | 1,295,490 | 1,295,490 | ||||||
|
| |||||||
Total Repurchase Agreements | 6,302,512 | |||||||
|
| |||||||
Total Investments – 84.3% | $ | 16,113,337 | ||||||
|
| |||||||
Cash & Other Assets, | 3,010,465 | |||||||
|
| |||||||
Total Net Assets – 100.0% | $ | 19,123,802 | ||||||
| CONTRACTS | UNREALIZED GAIN (LOSS) | |||||||
FUTURES CONTRACTS PURCHASED† | ||||||||
March 2012 Dow Jones Industrial | 164 | $ | 46,052 | |||||
|
| |||||||
| UNITS | ||||||||
EQUITY INDEX SWAP AGREEMENTS†† | ||||||||
Morgan Stanley Capital Services, Inc. | 136 | $ | (9,836 | ) | ||||
| 136 | THE RYDEX FUNDSANNUALREPORT | See Notes to Financial Statements. |
| SCHEDULE OF INVESTMENTS (concluded) | December 31, 2011 | |
DOW 2x STRATEGY FUND |
| UNITS | UNREALIZED LOSS | |||||||
Goldman Sachs International | 452 | $ | (10,121 | ) | ||||
Credit Suisse Capital, LLC | 430 | (30,157 | ) | |||||
Barclays Bank plc | 500 | (34,974 | ) | |||||
|
| |||||||
(Total Notional Value $18,549,198) | $ | (85,088 | ) | |||||
|
| |||||||
| † | Value determined based on Level 1 inputs — See Note 4. |
| †† | Value determined based on Level 2 inputs — See Note 4. |
| 1 | Repurchase Agreements — See Note 5. |
| 2 | All or a portion of this security is pledged as equity index swap collateral at December 31, 2011. |
| 3 | Total Return based on Dow Jones Industrial Average Index +/- financing at a variable rate. |
| plc — Public Limited Company |
| See Notes to Financial Statements. | THE RYDEX FUNDSANNUALREPORT | 137 |
| DOW 2x STRATEGY FUND |
| STATEMENT OF ASSETS AND LIABILITIES | ||
December 31, 2011
ASSETS: | ||||
Investments, at value | $ | 9,810,825 | ||
Repurchase agreements, at value | 6,302,512 | |||
|
| |||
Total investments | 16,113,337 | |||
Segregated cash with broker | 1,156,510 | |||
Receivables: | ||||
Fund shares sold | 2,084,049 | |||
Dividends | 12,852 | |||
|
| |||
Total assets | 19,366,748 | |||
|
| |||
LIABILITIES: | ||||
Unrealized depreciation on swap agreements | 85,088 | |||
Payable for: | ||||
Variation margin | 63,140 | |||
Fund shares redeemed | 51,487 | |||
Management fees | 11,890 | |||
Transfer agent and administrative fees | 3,303 | |||
Investor service fees | 3,303 | |||
Portfolio accounting fees | 1,321 | |||
Miscellaneous | 23,414 | |||
|
| |||
Total liabilities | 242,946 | |||
|
| |||
NETASSETS | $ | 19,123,802 | ||
|
| |||
NETASSETSCONSISTOF: | ||||
Paid in capital | $ | 43,065,668 | ||
Undistributed net investment income | — | |||
Accumulated net realized loss on investments | (24,799,765 | ) | ||
Net unrealized appreciation on investments | 857,899 | |||
|
| |||
Net assets | $ | 19,123,802 | ||
Capital shares outstanding | 214,426 | |||
Net asset value per share | $ | 89.19 | ||
|
| |||
| STATEMENT OF OPERATIONS | ||||
| Year Ended December 31, 2011 | ||||
INVESTMENT INCOME: | ||||
Dividends | $ | 223,979 | ||
Interest | 1,979 | |||
|
| |||
Total investment income | 225,958 | |||
|
| |||
EXPENSES: | ||||
Management fees | 124,798 | |||
Transfer agent and administrative fees | 34,666 | |||
Investor service fees | 34,666 | |||
Portfolio accounting fees | 13,866 | |||
Custodian fees | 3,777 | |||
Trustees’ fees* | 1,367 | |||
Miscellaneous | 34,315 | |||
|
| |||
Total expenses | 247,455 | |||
|
| |||
Net investment loss | (21,497 | ) | ||
|
| |||
NET REALIZEDAND UNREALIZED GAIN (LOSS): | ||||
Net realized gain (loss) on: | ||||
Investments | 1,730,800 | |||
Swap agreements | 518,416 | |||
Futures contracts | (81,532 | ) | ||
|
| |||
Net realized gain | 2,167,684 | |||
|
| |||
Net change in unrealized appreciation (depreciation) on: | ||||
Investments | (978,984 | ) | ||
Swap agreements | (105,275 | ) | ||
Futures contracts | 17,087 | |||
|
| |||
Net change in unrealized appreciation (depreciation) | (1,067,172 | ) | ||
|
| |||
Net realized and unrealized gain | 1,100,512 | |||
|
| |||
Net increase in net assets resulting from operations | $ | 1,079,015 | ||
|
| |||
| * | Relates to Trustees not deemed “interested persons” within the meaning of Section 2(a)(19) of the 1940 Act. |
| 138 | THE RYDEX FUNDSANNUALREPORT | See Notes to Financial Statements. |
| DOW 2x STRATEGY FUND |
| STATEMENTS OF CHANGES IN NET ASSETS | ||
| Year Ended December 31, 2011 | Year Ended December 31, 2010 | |||||||
INCREASE (DECREASE) IN NET ASSETS FROM OPERATIONS: | ||||||||
Net investment loss | $ | (21,497 | ) | $ | (6,332 | ) | ||
Net realized gain on investments | 2,167,684 | 3,066,208 | ||||||
Net change in unrealized appreciation (depreciation) on investments | (1,067,172 | ) | (208,035 | ) | ||||
|
|
|
| |||||
Net increase in net assets resulting from operations | 1,079,015 | 2,851,841 | ||||||
|
|
|
| |||||
DISTRIBUTIONSTOSHAREHOLDERSFROM: | ||||||||
Net investment income | — | (74,124 | ) | |||||
|
|
|
| |||||
Total distributions to shareholders | — | (74,124 | ) | |||||
|
|
|
| |||||
CAPITALSHARETRANSACTIONS: | ||||||||
Proceeds from sale of shares | 113,934,828 | 95,323,862 | ||||||
Distributions reinvested | — | 74,124 | ||||||
Cost of shares redeemed | (110,532,364 | ) | (103,392,691 | ) | ||||
|
|
|
| |||||
Net increase (decrease) from capital share transactions | 3,402,464 | (7,994,705 | ) | |||||
|
|
|
| |||||
Net increase (decrease) in net assets | 4,481,479 | (5,216,988 | ) | |||||
NETASSETS: | ||||||||
Beginning of year | 14,642,323 | 19,859,311 | ||||||
|
|
|
| |||||
End of year | $ | 19,123,802 | $ | 14,642,323 | ||||
|
|
|
| |||||
Undistributed net investment income at end of year | $ | — | $ | — | ||||
|
|
|
| |||||
CAPITALSHAREACTIVITY: | ||||||||
Shares sold | 1,309,736 | 1,369,488 | ||||||
Shares issued from reinvestment of distributions | — | 972 | ||||||
Shares redeemed | (1,274,404 | ) | (1,492,091 | ) | ||||
|
|
|
| |||||
Net increase (decrease) in shares | 35,332 | (121,631 | ) | |||||
|
|
|
| |||||
| See Notes to Financial Statements. | THE RYDEX FUNDSANNUALREPORT | 139 |
| DOW 2x STRATEGY FUND |
| FINANCIAL HIGHLIGHTS | ||
This table is presented to show selected data for a share outstanding throughout each period, and to assist shareholders in evaluating a Fund’s performance for the periods presented.
| Year Ended December 31, 2011 | Year Ended December 31, 2010 | Year Ended December 31, 2009c | Year Ended December 31, 2008c | Year Ended December 31, 2007c | ||||||||||||||||
Per Share Data | ||||||||||||||||||||
Net asset value, beginning of period | $ | 81.76 | $ | 66.04 | $ | 48.25 | $ | 128.50 | $ | 134.45 | ||||||||||
|
|
|
|
|
|
|
|
|
| |||||||||||
Income (loss) from investment operations: | ||||||||||||||||||||
Net investment income (loss)a | (.14 | ) | (.04 | ) | .22 | .75 | 1.80 | |||||||||||||
Net gain (loss) on investments (realized and unrealized) | 7.57 | 16.25 | 17.57 | (80.10 | ) | 9.65 | ||||||||||||||
|
|
|
|
|
|
|
|
|
| |||||||||||
Total from investment operations | 7.43 | 16.21 | 17.79 | (79.35 | ) | 11.45 | ||||||||||||||
|
|
|
|
|
|
|
|
|
| |||||||||||
Less distributions from: | ||||||||||||||||||||
Net investment income | — | (.49 | ) | — | (.90 | ) | (1.50 | ) | ||||||||||||
Net realized gains | — | — | — | — | (15.90 | ) | ||||||||||||||
|
|
|
|
|
|
|
|
|
| |||||||||||
Total distributions | — | (.49 | ) | — | (.90 | ) | (17.40 | ) | ||||||||||||
|
|
|
|
|
|
|
|
|
| |||||||||||
Net asset value, end of period | $ | 89.19 | $ | 81.76 | $ | 66.04 | $ | 48.25 | $ | 128.50 | �� | |||||||||
|
|
|
|
|
|
|
|
|
| |||||||||||
Total Returnb | 9.09 | % | 24.58 | % | 36.90 | % | (61.71 | %) | 8.15 | % | ||||||||||
|
|
|
|
|
|
|
|
|
| |||||||||||
Ratios/Supplemental Data | ||||||||||||||||||||
Net assets, end of period (in thousands) | $ | 19,124 | $ | 14,642 | $ | 19,859 | $ | 36,348 | $ | 44,825 | ||||||||||
|
|
|
|
|
|
|
|
|
| |||||||||||
Ratios to average net assets: | ||||||||||||||||||||
Net investment income (loss) | (0.16 | %) | (0.05 | %) | 0.48 | % | 0.90 | % | 1.22 | % | ||||||||||
Total expenses | 1.78 | % | 1.73 | % | 1.75 | % | 1.68 | % | 1.63 | % | ||||||||||
|
|
|
|
|
|
|
|
|
| |||||||||||
Portfolio turnover rate | 587 | % | 129 | % | 80 | % | 78 | % | 105 | % | ||||||||||
| a | Net investment income (loss) per share was computed using average shares outstanding throughout the period. |
| b | Total return does not reflect the impact of any additional fees charged by insurance companies and has not been annualized. |
| c | Per share amounts for the years ended December 31, 2007 — December 31, 2008 and the period January 1, 2009 through April 19, 2009 have been restated to reflect a 1:5 reverse stock split effective April 20, 2009. |
| 140 | THE RYDEX FUNDSANNUALREPORT | See Notes to Financial Statements. |
This page intentionally left blank.
| THE RYDEX FUNDSANNUALREPORT | 141 |
| PERFORMANCE REPORT AND FUND PROFILE (Unaudited) | December 31, 2011 | |
| INVERSE DOW 2x STRATEGY FUND | ||
OBJECTIVE: Seeks to provide investment results that match, before fees and expenses, the performance of a specific benchmark on a daily basis. The Fund’s current benchmark is 200% of the inverse (opposite ) of the performance of the Dow Jones Industrial AverageSM (the “underlying index”). The Fund does not seek to achieve its investment objective over a period of time greater than one day.
For the year ended December 31, 2011, Inverse Dow 2x Strategy Fund maintained a daily correlation of over 99% to its benchmark of -200% of the daily price movement of the Dow Jones Industrial Average. Inverse Dow 2x Strategy Fund returned -27.07% while the Dow Jones Industrial Average rose 8.38% over the same time period.
Consumer Discretionary and Energy provided the most performance to the index during the year. Materials and Financials were the largest detractors from performance for the year.
International Business Machines Corp., McDonald’s Corp. and Chevron Corp. were the largest contributors to performance of the index for the year. Hewlett-Packard Co., JPMorgan Chase & Co. and Bank of America Corp. were the largest detractors from performance for the year.
Derivatives in the Fund were used to help provide exposure to the composition of the benchmark in the highest efficient manner and to provide leverage, not for hedging purposes.
Due to the compounding of daily returns, leveraged and inverse funds’ returns over periods other than one day will likely differ in amount and possibly direction from the benchmark return for the same period. Investors should monitor their leveraged and inverse funds’ holdings to ensure that they are consistent with their strategies, as frequently as daily.
The effects of compounding may cause the longer-term correlation of the fund to its benchmark to diminish. The apparent discrepancy between the leveraged and unleveraged indices is the result of compounding, which is described briefly on page 4 of this report.
The Dow Jones Industrial AverageSM is a price-weighted average of 30 significant stocks traded on the New York Stock Exchange and the Nasdaq. The DJIA was invented by Charles Dow back in 1896.
Holdings Diversification (Market Exposure as % of Net Assets)
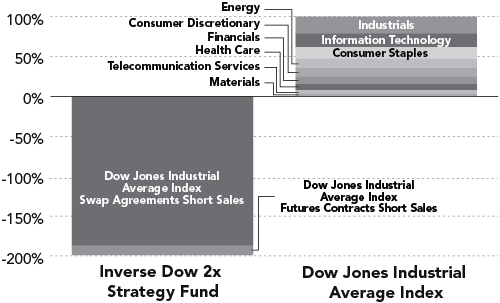
“Holdings Diversification (Market Exposure as % of Net Assets)” excludes any temporary cash investments.
Inception Date: May 3, 2004
The Fund invests principally in derivative investments such as swap agreements and futures contracts.
| 142 | THE RYDEX FUNDSANNUALREPORT |
| PERFORMANCE REPORT AND FUND PROFILE (Unaudited) (concluded) | ||
INVERSE DOW 2x STRATEGY FUND |
Cumulative Fund Performance*
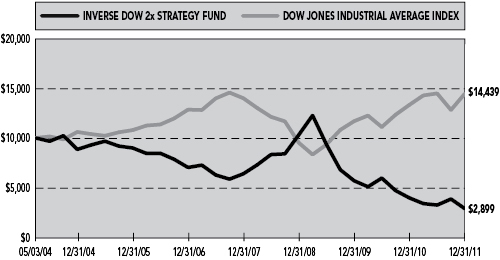
Average Annual Returns*
Periods Ended 12/31/11
| 1 Year | 5 Year | Since Inception (05/03/04) | ||||||||||
Inverse Dow 2x Strategy Fund | -27.07 | % | -16.26 | % | -14.92 | % | ||||||
Dow Jones Industrial Average Index | 8.38 | % | 2.37 | % | 4.91 | % | ||||||
| * | The performance data represents past performance that is not predictive of future results. The investment return and principal value of an investment in the Fund will fluctuate so that an investor’s shares, when redeemed, may be worth more or less than their original cost. Returns are historical and include changes in principal and reinvested dividends and capital gains and do not reflect the effect of taxes. The Dow Jones Industrial Average Index is an unmanaged index and, unlike the Fund, has no management fees or operating expenses to reduce its reported return. |
| Returns do not reflect the impact of any additional fees charged by insurance companies. |
| THE RYDEX FUNDSANNUALREPORT | 143 |
| SCHEDULE OF INVESTMENTS | December 31, 2011 | |
| INVERSE DOW 2x STRATEGY FUND |
| FACE AMOUNT | VALUE | |||||||
FEDERAL AGENCY DISCOUNT NOTES†† - 28.7% | ||||||||
Federal Home Loan Bank1 | $ | 1,000,000 | $ | 999,999 | ||||
Farmer Mac1 | 1,000,000 | 999,999 | ||||||
|
| |||||||
Total Federal Agency Discount Notes | 1,999,998 | |||||||
|
| |||||||
| REPURCHASE AGREEMENTS††,2 - 69.6% | ||||||||
Credit Suisse Group | 2,411,056 | 2,411,056 | ||||||
Mizuho Financial Group, Inc. issued 12/30/11 at 0.00% due 01/03/12 | 838,698 | 838,698 | ||||||
HSBC Group | 802,853 | 802,853 | ||||||
Deutsche Bank | 802,853 | 802,853 | ||||||
|
| |||||||
Total Repurchase Agreements | 4,855,460 | |||||||
|
| |||||||
Total Investments – 98.3% | $ | 6,855,458 | ||||||
|
| |||||||
Cash & Other Assets, | 116,114 | |||||||
|
| |||||||
Total Net Assets – 100.0% | $ | 6,971,572 | ||||||
| CONTRACTS | UNREALIZED GAIN (LOSS) | |||||||
FUTURES CONTRACTS SOLD SHORT† | ||||||||
March 2012 Dow Jones Industrial | 14 | $ | (2,154 | ) | ||||
|
| |||||||
| UNITS | ||||||||
EQUITY INDEX SWAP AGREEMENTS SOLD SHORT†† | ||||||||
Barclays Bank plc | 390 | $ | 27,205 | |||||
Credit Suisse Capital, LLC | 370 | 25,973 | ||||||
Goldman Sachs International | 265 | 18,340 | ||||||
Morgan Stanley Capital Services, Inc. | 40 | 2,889 | ||||||
|
| |||||||
(Total Notional Value $13,026,877) | $ | 74,407 | ||||||
|
| |||||||
| † | Value determined based on Level 1 inputs — See Note 4. |
| †† | Value determined based on Level 2 inputs — See Note 4. |
| 1 | The issuer operates under a Congressional charter; its securities are neither issued nor guaranteed by the U.S. Government. |
| 2 | Repurchase Agreements — See Note 5. |
| 3 | All or a portion of this security is pledged as equity index swap collateral at December 31, 2011. |
| 4 | Total Return based on Dow Jones Industrial Average Index +/- financing at a variable rate. |
| plc — Public Limited Company |
| 144 | THE RYDEX FUNDSANNUALREPORT | See Notes to Financial Statements. |
| INVERSE DOW 2x STRATEGY FUND |
| STATEMENT OF ASSETS AND LIABILITIES | ||
December 31, 2011 | ||
ASSETS: | ||||
Investments, at value | $ | 1,999,998 | ||
Repurchase agreements, at value | 4,855,460 | |||
|
| |||
Total investments | 6,855,458 | |||
Segregated cash with broker | 916,211 | |||
Unrealized appreciation on swap agreements | 74,407 | |||
Receivable for swap settlement | 41,000 | |||
Receivables: | ||||
Variation margin | 9,198 | |||
|
| |||
Total assets | 7,896,274 | |||
|
| |||
LIABILITIES: | ||||
Payable for: | ||||
Fund shares redeemed | 891,531 | |||
Management fees | 7,246 | |||
Transfer agent and administrative fees | 2,013 | |||
Investor service fees | 2,013 | |||
Portfolio accounting fees | 805 | |||
Miscellaneous | 21,094 | |||
|
| |||
Total liabilities | 924,702 | |||
|
| |||
NETASSETS | $ | 6,971,572 | ||
|
| |||
NETASSETSCONSISTOF: | ||||
Paid in capital | $ | 33,378,784 | ||
Undistributed net investment income | — | |||
Accumulated net realized loss on investments | (26,479,465 | ) | ||
Net unrealized appreciation on investments | 72,253 | |||
|
| |||
Net assets | $ | 6,971,572 | ||
Capital shares outstanding | 695,917 | |||
Net asset value per share | $ | 10.02 | ||
|
| |||
| STATEMENT OF OPERATIONS | ||||
For the Year Ended December 31, 2011 |
| |||
INVESTMENT INCOME : | ||||
Interest | $ | 5,576 | ||
|
| |||
Total investment income | 5,576 | |||
|
| |||
EXPENSES: | ||||
Management fees | 103,417 | |||
Transfer agent and administrative fees | 28,727 | |||
Investor service fees | 28,727 | |||
Portfolio accounting fees | 11,491 | |||
Custodian fees | 2,804 | |||
Trustees’ fees* | 1,162 | |||
Miscellaneous | 28,252 | |||
|
| |||
Total expenses | 204,580 | |||
|
| |||
Net investment loss | (199,004 | ) | ||
|
| |||
NET REALIZEDAND UNREALIZED GAIN (LOSS): | ||||
Net realized gain (loss) on: | ||||
Swap agreements | (3,244,871 | ) | ||
Futures contracts | (681,714 | ) | ||
|
| |||
Net realized loss | (3,926,585 | ) | ||
|
| |||
Net change in unrealized appreciation (depreciation) on: | ||||
Investments | (49 | ) | ||
Swap agreements | 134,166 | |||
Futures contracts | (1,981 | ) | ||
|
| |||
Net change in unrealized appreciation (depreciation) | 132,136 | |||
|
| |||
Net realized and unrealized loss | (3,794,449 | ) | ||
|
| |||
Net decrease in net assets resulting from operations | $ | (3,993,453 | ) | |
|
|
| * | Relates to Trustees not deemed “interested persons” within the meaning of Section 2(a)(19) of the 1940 Act. |
| See Notes to Financial Statements. | THE RYDEX FUNDSANNUALREPORT | 145 |
| INVERSE DOW 2x STRATEGY FUND |
| STATEMENTS OF CHANGES IN NET ASSETS | ||
| Year Ended December 31, 2011 | Year Ended December 31, 2010 | |||||||
INCREASE (DECREASE) IN NET ASSETS FROM OPERATIONS: | ||||||||
Net investment loss | $ | (199,004 | ) | $ | (275,950 | ) | ||
Net realized loss on investments | (3,926,585 | ) | (5,990,379 | ) | ||||
Net change in unrealized appreciation (depreciation) on investments | 132,136 | (178,873 | ) | |||||
|
|
|
| |||||
Net decrease in net assets resulting from operations | (3,993,453 | ) | (6,445,202 | ) | ||||
|
|
|
| |||||
CAPITALSHARETRANSACTIONS: | ||||||||
Proceeds from sale of shares | 256,758,907 | 265,338,764 | ||||||
Cost of shares redeemed | (260,838,407 | ) | (261,870,045 | ) | ||||
|
|
|
| |||||
Net increase (decrease) from capital share transactions | (4,079,500 | ) | 3,468,719 | |||||
|
|
|
| |||||
Net decrease in net assets | (8,072,953 | ) | (2,976,483 | ) | ||||
NETASSETS: | ||||||||
Beginning of year | 15,044,525 | 18,021,008 | ||||||
|
|
|
| |||||
End of year | $ | 6,971,572 | $ | 15,044,525 | ||||
|
|
|
| |||||
Undistributed net investment income at end of year | $ | — | $ | — | ||||
|
|
|
| |||||
CAPITALSHAREACTIVITY: | ||||||||
Shares sold | 21,327,799 | 15,495,577 | ||||||
Shares redeemed | (21,726,764 | ) | (15,315,106 | ) | ||||
|
|
|
| |||||
Net increase (decrease) in shares | (398,965 | ) | 180,471 | |||||
|
|
|
| |||||
| 146 | THE RYDEX FUNDSANNUALREPORT | See Notes to Financial Statements. |
| INVERSE DOW 2x STRATEGY FUND |
| FINANCIAL HIGHLIGHTS | ||
This table is presented to show selected data for a share outstanding throughout each period, and to assist shareholders in evaluating a Fund’s performance for the periods presented.
| Year Ended December 31, 2011 | Year Ended December 31, 2010 | Year Ended December 31, 2009 | Year Ended December 31, 2008 | Year Ended December 31, 2007 | ||||||||||||||||
Per Share Data | ||||||||||||||||||||
Net asset value, beginning of period | $ | 13.74 | $ | 19.71 | $ | 35.61 | $ | 28.79 | $ | 33.34 | ||||||||||
|
|
|
|
|
|
|
|
|
| |||||||||||
Income (loss) from investment operations: | ||||||||||||||||||||
Net investment income (loss)a | (.21 | ) | (.27 | ) | (.47 | ) | (.01 | ) | 1.02 | |||||||||||
Net gain (loss) on investments (realized and unrealized) | (3.51 | ) | (5.70 | ) | (15.43 | ) | 18.12 | (4.06 | ) | |||||||||||
|
|
|
|
|
|
|
|
|
| |||||||||||
Total from investment operations | (3.72 | ) | (5.97 | ) | (15.90 | ) | 18.11 | (3.04 | ) | |||||||||||
|
|
|
|
|
|
|
|
|
| |||||||||||
Less distributions from: | ||||||||||||||||||||
Net investment income | — | — | — | (.18 | ) | (1.51 | ) | |||||||||||||
Net realized gains | — | — | — | (11.11 | ) | — | ||||||||||||||
|
|
|
|
|
|
|
|
|
| |||||||||||
Total distributions | — | — | — | (11.29 | ) | (1.51 | ) | |||||||||||||
|
|
|
|
|
|
|
|
|
| |||||||||||
Net asset value, end of period | $ | 10.02 | $ | 13.74 | $ | 19.71 | $ | 35.61 | $ | 28.79 | ||||||||||
|
|
|
|
|
|
|
|
|
| |||||||||||
Total Returnb | (27.07 | %) | (30.29 | %) | (44.65 | %) | 60.84 | % | (8.99 | %) | ||||||||||
|
|
|
|
|
|
|
|
|
| |||||||||||
Ratios/Supplemental Data | ||||||||||||||||||||
Net assets, end of period (in thousands) | $ | 6,972 | $ | 15,045 | $ | 18,021 | $ | 11,703 | $ | 11,885 | ||||||||||
|
|
|
|
|
|
|
|
|
| |||||||||||
Ratios to average net assets: | ||||||||||||||||||||
Net investment income (loss) | (1.73 | %) | (1.59 | %) | (1.61 | %) | (0.03 | %) | 3.36 | % | ||||||||||
Total expenses | 1.78 | % | 1.74 | % | 1.74 | % | 1.69 | % | 1.66 | % | ||||||||||
|
|
|
|
|
|
|
|
|
| |||||||||||
Portfolio turnover rate | — | — | — | — | — | |||||||||||||||
| a | Net investment income (loss) per share was computed using average shares outstanding throughout the period. |
| b | Total return does not reflect the impact of any additional fees charged by insurance companies and has not been annualized. |
| See Notes to Financial Statements. | THE RYDEX FUNDSANNUALREPORT | 147 |
| PERFORMANCE REPORT AND FUND PROFILE (Unaudited) | December 31, 2011 |
OBJECTIVE: Seeks to provide investment results that match, before fees and expenses, the performance of a benchmark for large-cap growth securities on a daily basis. The Fund’s current benchmark is the S&P 500 Pure Growth Index (the “underlying index”).
For the year ended December 31, 2011, S&P 500 Pure Growth Fund returned -1.09%, compared with a gain of 0.76% for the S&P 500 Pure Growth Index.
The large-cap growth stocks comprising the index outperformed their large-cap value stock counterparts. Consumer Discretionary was the sector contributing most to performance, followed by Health Care. Information Technology was the sector detracting most from performance for the year.
Stocks contributing the most to return were Intuitive Surgical, Inc., Biogen Idec, Inc. and Ross Stores, Inc., while Netflix, Inc., Tenet Healthcare Corp. and NetApp, Inc. were the largest detractors from performance.
The S&P 500® Pure Growth Index is narrow in focus, containing only those S&P 500 Index companies with strong growth characteristics as selected by S&P. The S&P 500 Index is a capitalization-weighted index covering 500 industrial, utility, transportation and financial companies of the U.S. markets (mostly NYSE Euronext issues).
Holdings Diversification (Market Exposure as % of Net Assets)
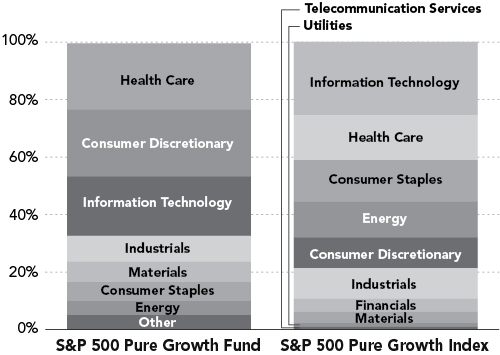
“Holdings Diversification (Market Exposure as % of Net Assets)” excludes any temporary cash investments.
Inception Date: May 3, 2004
Ten Largest Holdings (% of Total Net Assets) | ||||
Apple, Inc. | 1.4 | % | ||
Visa, Inc. — Class A | 1.3 | % | ||
Celgene Corp. | 1.3 | % | ||
Newmont Mining Corp. | 1.3 | % | ||
Apollo Group, Inc. — Class A | 1.3 | % | ||
Google, Inc. — Class A | 1.3 | % | ||
Intuitive Surgical, Inc. | 1.2 | % | ||
O’Reilly Automotive, Inc. | 1.2 | % | ||
AutoZone, Inc. | 1.2 | % | ||
Medco Health Solutions, Inc. | 1.2 | % | ||
|
| |||
Top Ten Total | 12.7 | % | ||
|
| |||
“Ten Largest Holdings” exclude any temporary cash or derivative investments.
148 | THE RYDEX FUNDSANNUALREPORT
PERFORMANCE REPORT AND FUND PROFILE (Unaudited) (concluded)
S&P 500 PURE GROWTH FUND
Cumulative Fund Performance*
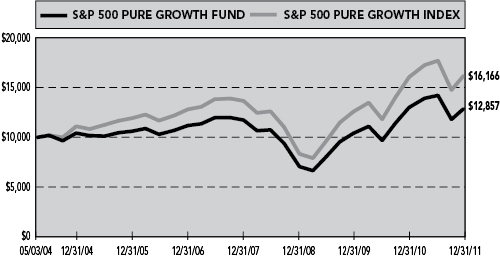
Average Annual Returns*
Periods Ended 12/31/11
| 1 Year | 5 Year | Since Inception (05/03/04) | ||||||||||
S&P 500 Pure Growth Fund | -1.09 | % | 2.83 | % | 3.33 | % | ||||||
S&P 500 Pure Growth Index | 0.76 | % | 4.77 | % | 6.47 | % | ||||||
| * | The performance data represents past performance that is not predictive of future results. The investment return and principal value of an investment in the Fund will fluctuate so that an investor’s shares, when redeemed, may be worth more or less than their original cost. Returns are historical and include changes in principal and reinvested dividends and capital gains and do not reflect the effect of taxes. The S&P 500 Pure Growth Index is an unmanaged index and, unlike the Fund, has no management fees or operating expenses to reduce its reported return. |
| Returns do not reflect the impact of any additional fees charged by insurance companies. |
THE RYDEX FUNDSANNUALREPORT | 149
| SCHEDULE OF INVESTMENTS | December 31, 2011 |
S&P 500 PURE GROWTH FUND
| SHARES | VALUE | |||||||
COMMON STOCKS† - 99.5% | ||||||||
HEALTH CARE - 23.1% | ||||||||
Celgene Corp.* | 7,293 | $ | 493,007 | |||||
Intuitive Surgical, Inc.* | 1,013 | 469,029 | ||||||
Medco Health Solutions, Inc.* | 8,135 | 454,746 | ||||||
Mylan, Inc.* | 20,750 | 445,295 | ||||||
Biogen Idec, Inc.* | 4,045 | 445,152 | ||||||
Express Scripts, Inc.* | 9,123 | 407,707 | ||||||
Perrigo Co. | 4,160 | 404,768 | ||||||
Gilead Sciences, Inc.* | 9,453 | 386,911 | ||||||
UnitedHealth Group, Inc. | 6,800 | 344,624 | ||||||
Laboratory Corporation of America Holdings* | 3,967 | 341,043 | ||||||
Edwards Lifesciences Corp.* | 4,740 | 335,118 | ||||||
Varian Medical Systems, Inc.* | 4,884 | 327,863 | ||||||
Abbott Laboratories | 5,710 | 321,073 | ||||||
CR Bard, Inc. | 3,730 | 318,915 | ||||||
Amgen, Inc. | 4,490 | 288,303 | ||||||
DaVita, Inc.* | 3,530 | 267,609 | ||||||
Quest Diagnostics, Inc. | 4,400 | 255,464 | ||||||
Zimmer Holdings, Inc.* | 4,650 | 248,403 | ||||||
Becton Dickinson and Co. | 3,320 | 248,070 | ||||||
Stryker Corp. | 4,990 | 248,053 | ||||||
Baxter International, Inc. | 4,850 | 239,978 | ||||||
Waters Corp.* | 3,198 | 236,812 | ||||||
Life Technologies Corp.* | 6,026 | 234,472 | ||||||
Allergan, Inc. | 2,617 | 229,616 | ||||||
Cerner Corp.* | 3,680 | 225,400 | ||||||
Watson Pharmaceuticals, Inc.* | 3,555 | 214,509 | ||||||
St. Jude Medical, Inc. | 6,020 | 206,486 | ||||||
Johnson & Johnson | 2,740 | 179,689 | ||||||
|
| |||||||
Total Health Care | 8,818,115 | |||||||
|
| |||||||
CONSUMER DISCRETIONARY - 23.1% | ||||||||
Apollo Group, Inc. — Class A* | 8,998 | 484,722 | ||||||
O’Reilly Automotive, Inc.* | 5,735 | 458,513 | ||||||
AutoZone, Inc.* | 1,409 | 457,883 | ||||||
Netflix, Inc.* | 6,560 | 454,542 | ||||||
Chipotle Mexican Grill, Inc. — Class A* | 1,320 | 445,817 | ||||||
DeVry, Inc. | 11,350 | 436,521 | ||||||
Dollar Tree, Inc.* | 5,240 | 435,496 | ||||||
Priceline.com, Inc.* | 927 | 433,567 | ||||||
Ross Stores, Inc. | 8,930 | 424,443 | ||||||
Coach, Inc. | 6,741 | 411,471 | ||||||
Discovery Communications, Inc. — Class A* | 9,596 | 393,148 | ||||||
Amazon.com, Inc.* | 2,239 | 387,571 | ||||||
DIRECTV — Class A* | 8,894 | 380,307 | ||||||
Family Dollar Stores, Inc. | 6,000 | 345,960 | ||||||
Scripps Networks Interactive, Inc. — Class A | 7,890 | 334,694 | ||||||
TJX Companies, Inc. | 4,883 | 315,198 | ||||||
Wynn Resorts Ltd. | 2,438 | 269,375 | ||||||
Bed Bath & Beyond, Inc.* | 4,610 | 267,242 | ||||||
McDonald’s Corp. | 2,587 | 259,554 | ||||||
Yum! Brands, Inc. | 4,097 | 241,764 | ||||||
Ralph Lauren Corp. — Class A | 1,719 | 237,360 | ||||||
Viacom, Inc. — Class B | 4,844 | 219,966 | ||||||
NIKE, Inc. — Class B | 2,240 | 215,869 | ||||||
Tiffany & Co. | 2,730 | 180,890 | ||||||
VF Corp. | 1,170 | 148,578 | ||||||
Starbucks Corp. | 3,187 | 146,634 | ||||||
|
| |||||||
Total Consumer Discretionary | 8,787,085 | |||||||
|
| |||||||
INFORMATION TECHNOLOGY - 20.7% | ||||||||
Apple, Inc.* | 1,317 | 533,385 | ||||||
Visa, Inc. — Class A | 5,020 | 509,681 | ||||||
Google, Inc. — Class A* | 737 | 476,028 | ||||||
F5 Networks, Inc.* | 3,960 | 420,235 | ||||||
Cognizant Technology Solutions Corp. — Class A* | 6,493 | 417,565 | ||||||
Altera Corp. | 9,821 | 364,359 | ||||||
Salesforce.com, Inc.* | 3,521 | 357,241 | ||||||
Red Hat, Inc.* | 8,521 | 351,832 | ||||||
SanDisk Corp.* | 6,966 | 342,797 | ||||||
Mastercard, Inc. — Class A | 910 | 339,266 | ||||||
KLA-Tencor Corp. | 6,950 | 335,337 | ||||||
Intuit, Inc. | 5,748 | 302,287 | ||||||
Microchip Technology, Inc. | 8,190 | 300,000 | ||||||
Broadcom Corp. — Class A* | 10,014 | 294,011 | ||||||
QUALCOMM, Inc. | 5,210 | 284,987 | ||||||
NetApp, Inc.* | 7,254 | 263,103 | ||||||
Citrix Systems, Inc.* | 3,922 | 238,144 | ||||||
Teradata Corp.* | 4,833 | 234,449 | ||||||
Automatic Data Processing, Inc. | 4,300 | 232,243 | ||||||
Fiserv, Inc.* | 3,940 | 231,436 | ||||||
Amphenol Corp. — Class A | 5,092 | 231,126 | ||||||
Oracle Corp. | 8,190 | 210,074 | ||||||
International Business Machines Corp. | 1,135 | 208,704 | ||||||
Xilinx, Inc. | 6,360 | 203,902 | ||||||
Akamai Technologies, Inc.* | 5,916 | 190,968 | ||||||
|
| |||||||
Total Information Technology | 7,873,160 | |||||||
|
| |||||||
INDUSTRIALS - 9.0% | ||||||||
Stericycle, Inc.* | 5,443 | 424,119 | ||||||
First Solar, Inc.* | 11,857 | 400,292 | ||||||
CH Robinson Worldwide, Inc. | 4,130 | 288,191 | ||||||
WW Grainger, Inc. | 1,534 | 287,149 | ||||||
Lockheed Martin Corp. | 3,150 | 254,835 | ||||||
Dun & Bradstreet Corp. | 3,260 | 243,946 | ||||||
Deere & Co. | 3,102 | 239,940 | ||||||
Pall Corp. | 3,820 | 218,313 | ||||||
United Parcel Service, Inc. — Class B | 2,922 | 213,861 | ||||||
Union Pacific Corp. | 2,011 | 213,045 | ||||||
Goodrich Corp. | 1,409 | 174,293 | ||||||
| 150 | THE RYDEX FUNDSANNUALREPORT | See Notes to Financial Statements. |
| SCHEDULE OF INVESTMENTS (concluded) | December 31, 2011 |
S&P 500 PURE GROWTH FUND
| SHARES | VALUE | |||||||
Rockwell Automation, Inc. | 2,327 | $ | 170,732 | |||||
Roper Industries, Inc. | 1,950 | 169,396 | ||||||
Joy Global, Inc. | 1,937 | 145,217 | ||||||
|
| |||||||
Total Industrials | 3,443,329 | |||||||
|
| |||||||
MATERIALS - 7.1% | ||||||||
Newmont Mining Corp. | 8,092 | 485,601 | ||||||
Cliffs Natural Resources, Inc. | 4,750 | 296,162 | ||||||
FMC Corp. | 2,929 | 252,011 | ||||||
International Flavors & Fragrances, Inc. | 4,742 | 248,576 | ||||||
Ecolab, Inc. | 4,030 | 232,974 | ||||||
Sigma-Aldrich Corp. | 3,625 | 226,417 | ||||||
CF Industries Holdings, Inc. | 1,524 | 220,950 | ||||||
PPG Industries, Inc. | 2,540 | 212,065 | ||||||
Sherwin-Williams Co. | 2,200 | 196,394 | ||||||
Praxair, Inc. | 1,770 | 189,213 | ||||||
Monsanto Co. | 1,970 | 138,038 | ||||||
|
| |||||||
Total Materials | 2,698,401 | |||||||
|
| |||||||
CONSUMER STAPLES - 6.4% | ||||||||
PepsiCo, Inc. | 5,775 | 383,171 | ||||||
Philip Morris International, Inc. | 4,237 | 332,520 | ||||||
Coca-Cola Co. | 4,239 | 296,603 | ||||||
Hershey Co. | 3,935 | 243,104 | ||||||
Colgate-Palmolive Co. | 2,508 | 231,714 | ||||||
Kimberly-Clark Corp. | 2,920 | 214,795 | ||||||
Mead Johnson Nutrition Co. — Class A | 2,898 | 199,180 | ||||||
Estee Lauder Companies, Inc. — Class A | 1,613 | 181,172 | ||||||
Kellogg Co. | 3,464 | 175,174 | ||||||
Brown-Forman Corp. — Class B | 2,083 | 167,702 | ||||||
|
| |||||||
Total Consumer Staples | 2,425,135 | |||||||
|
| |||||||
ENERGY - 5.1% | ||||||||
Southwestern Energy Co.* | 9,199 | 293,816 | ||||||
Peabody Energy Corp. | 7,712 | 255,344 | ||||||
Diamond Offshore Drilling, Inc. | 4,610 | 254,749 | ||||||
EOG Resources, Inc. | 2,470 | 243,320 | ||||||
Helmerich & Payne, Inc. | 3,730 | 217,683 | ||||||
Cameron International Corp.* | 4,052 | 199,318 | ||||||
Pioneer Natural Resources Co. | 2,096 | 187,550 | ||||||
Schlumberger Ltd. | 2,190 | 149,599 | ||||||
Cabot Oil & Gas Corp. | 1,820 | 138,138 | ||||||
|
| |||||||
Total Energy | 1,939,517 | |||||||
|
| |||||||
FINANCIALS - 4.1% | ||||||||
Intercontinental Exchange, Inc.* | 3,659 | 441,092 | ||||||
Aflac, Inc. | 6,760 | 292,438 | ||||||
Franklin Resources, Inc. | 2,660 | 255,520 | ||||||
BlackRock, Inc. — Class A | 1,400 | 249,536 | ||||||
T. Rowe Price Group, Inc. | 2,870 | 163,446 | ||||||
Ventas, Inc. | 2,716 | 149,733 | ||||||
|
| |||||||
Total Financials | 1,551,765 | |||||||
|
| |||||||
TELECOMMUNICATION SERVICES - 0.9% | ||||||||
American Tower Corp. — Class A | 5,717 | 343,077 | ||||||
|
| |||||||
Total Common Stocks | 37,879,584 | |||||||
|
| |||||||
| FACE AMOUNT | ||||||||
REPURCHASE AGREEMENT ††,1 - 0.9% | ||||||||
Credit Suisse Group issued 12/30/11 at 0.00% due 01/03/12 | $ | 330,382 | 330,382 | |||||
|
| |||||||
Total Repurchase Agreement | 330,382 | |||||||
|
| |||||||
Total Investments – 100.4% | $ | 38,209,966 | ||||||
|
| |||||||
Liabilities, Less Other Assets – (0.4)% | (144,135 | ) | ||||||
|
| |||||||
Total Net Assets – 100.0% | $ | 38,065,831 | ||||||
| * | Non-income producing security. |
| † | Value determined based on Level 1 inputs — See Note 4. |
| †† | Value determined based on Level 2 inputs — See Note 4. |
| 1 | Repurchase Agreement — See Note 5. |
| See Notes to Financial Statements. | THE RYDEX FUNDSANNUALREPORT | 151 |
S&P 500 PURE GROWTH FUND
STATEMENT OF ASSETS AND LIABILITIES
December 31, 2011
ASSETS: | ||||
Investments, at value | $ | 37,879,584 | ||
Repurchase agreements, at value | 330,382 | |||
|
| |||
Total investments | 38,209,966 | |||
Receivables: | ||||
Securities sold | 1,385,752 | |||
From advisor | 17,402 | |||
Dividends | 17,169 | |||
|
| |||
Total assets | 39,630,289 | |||
|
| |||
LIABILITIES: | ||||
Overdraft due to custodian bank | 994 | |||
Payable for: | ||||
Fund shares redeemed | 1,424,884 | |||
Management fees | 23,790 | |||
Transfer agent and administrative fees | 7,930 | |||
Investor service fees | 7,930 | |||
Portfolio accounting fees | 3,172 | |||
Miscellaneous | 95,758 | |||
|
| |||
Total liabilities | 1,564,458 | |||
|
| |||
NETASSETS | $ | 38,065,831 | ||
|
| |||
NETASSETSCONSISTOF: | ||||
Paid in capital | $ | 36,921,864 | ||
Undistributed net investment income | — | |||
Accumulated net realized loss on investments | (5,363,583 | ) | ||
Net unrealized appreciation on investments | 6,507,550 | |||
|
| |||
Net Assets | $ | 38,065,831 | ||
Capital shares outstanding | 1,269,278 | |||
Net asset value per share | $ | 29.99 | ||
|
|
STATEMENT OF OPERATIONS
Year Ended December 31, 2011
INVESTMENTINCOME: | ||||
Dividends | $ | 374,199 | ||
Interest | 84 | |||
|
| |||
Total investment income | 374,283 | |||
|
| |||
EXPENSES: | ||||
Management fees | 353,064 | |||
Transfer agent and administrative fees | 117,688 | |||
Investor service fees | 117,688 | |||
Portfolio accounting fees | 47,074 | |||
Professional fees | 38,332 | |||
Tax expense | 17,402 | |||
Custodian fees | 11,609 | |||
Trustees’ fees* | 4,755 | |||
Miscellaneous | 66,442 | |||
|
| |||
Total expenses | 774,054 | |||
|
| |||
Less: | ||||
Expenses waived/reimbursed by advisor | (17,402 | ) | ||
|
| |||
Net expenses | 756,652 | |||
|
| |||
Net investment loss | (382,369 | ) | ||
|
| |||
NET REALIZEDAND UNREALIZED GAIN (LOSS): | ||||
Net realized gain (loss) on: | ||||
Investments | 192,209 | |||
|
| |||
Net realized gain | 192,209 | |||
|
| |||
Net change in unrealized appreciation (depreciation) on: | ||||
Investments | (3,041,473 | ) | ||
|
| |||
Net change in unrealized appreciation (depreciation) | (3,041,473 | ) | ||
|
| |||
Net realized and unrealized loss | (2,849,264 | ) | ||
|
| |||
Net decrease in net assets resulting from operations | $ | (3,231,633 | ) | |
|
|
| * | Relates to Trustees not deemed “interested persons” within the meaning of Section 2(a)(19) of the 1940 Act. |
| 152 | THE RYDEX FUNDSANNUALREPORT | See Notes to Financial Statements. |
S&P 500 PURE GROWTH FUND
STATEMENTS OF CHANGES IN NET ASSETS
| Year Ended December 31, 2011 | Year Ended December 31, 2010 | |||||||
INCREASE (DECREASE) IN NET ASSETS FROM OPERATIONS: | ||||||||
Net investment loss | $ | (382,369 | ) | $ | (231,425 | ) | ||
Net realized gain on investments | 192,209 | 3,033,781 | ||||||
Net change in unrealized appreciation (depreciation) on investments | (3,041,473 | ) | 3,932,349 | |||||
|
|
|
| |||||
Net increase (decrease) in net assets resulting from operations | (3,231,633 | ) | 6,734,705 | |||||
|
|
|
| |||||
CAPITAL SHARE TRANSACTIONS: | ||||||||
Proceeds from sale of shares | 230,679,908 | 116,171,404 | ||||||
Cost of shares redeemed | (238,683,634 | ) | (108,085,568 | ) | ||||
|
|
|
| |||||
Net increase (decrease) from capital share transactions | (8,003,726 | ) | 8,085,836 | |||||
|
|
|
| |||||
Net increase (decrease) in net assets | (11,235,359 | ) | 14,820,541 | |||||
NET ASSETS: | ||||||||
Beginning of year | 49,301,190 | 34,480,649 | ||||||
|
|
|
| |||||
End of year | $ | 38,065,831 | $ | 49,301,190 | ||||
|
|
|
| |||||
Undistributed net investment income at end of year | $ | — | $ | — | ||||
|
|
|
| |||||
CAPITAL SHARE ACTIVITY: | ||||||||
Shares sold | 7,395,202 | 4,426,580 | ||||||
Shares redeemed | (7,751,645 | ) | (4,222,735 | ) | ||||
|
|
|
| |||||
Net increase (decrease) in shares | (356,443 | ) | 203,845 | |||||
|
|
|
| |||||
| See Notes to Financial Statements. | THE RYDEX FUNDSANNUALREPORT | 153 |
S&P 500 PURE GROWTH FUND
FINANCIAL HIGHLIGHTS
This table is presented to show selected data for a share outstanding throughout each period, and to assist shareholders in evaluating a Fund’s performance for the periods presented.
| Year Ended December 31, 2011 | Year Ended December 31, 2010 | Year Ended December 31, 2009 | Year Ended December 31, 2008 | Year Ended December 31, 2007 | ||||||||||||||||
Per Share Data | ||||||||||||||||||||
Net asset value, beginning of period | $ | 30.33 | $ | 24.25 | $ | 16.47 | $ | 27.36 | $ | 26.68 | ||||||||||
|
|
|
|
|
|
|
|
|
| |||||||||||
Income (loss) from investment operations: | ||||||||||||||||||||
Net investment lossa | (.25 | ) | (.20 | ) | (.10 | ) | (.09 | ) | (.16 | ) | ||||||||||
Net gain (loss) on investments (realized and unrealized) | (.09 | ) | 6.28 | 7.88 | (10.80 | ) | 1.46 | |||||||||||||
|
|
|
|
|
|
|
|
|
| |||||||||||
Total from investment operations | (.34 | ) | 6.08 | 7.78 | (10.89 | ) | 1.30 | |||||||||||||
|
|
|
|
|
|
|
|
|
| |||||||||||
Less distributions from: | ||||||||||||||||||||
Net realized gains | — | — | — | — | (.62 | ) | ||||||||||||||
|
|
|
|
|
|
|
|
|
| |||||||||||
Total distributions | — | — | — | — | (.62 | ) | ||||||||||||||
|
|
|
|
|
|
|
|
|
| |||||||||||
Net asset value, end of period | $ | 29.99 | $ | 30.33 | $ | 24.25 | $ | 16.47 | $ | 27.36 | ||||||||||
|
|
|
|
|
|
|
|
|
| |||||||||||
Total Returnb | (1.09 | %) | 25.03 | % | 47.24 | % | (39.80 | %) | 4.87 | % | ||||||||||
|
|
|
|
|
|
|
|
|
| |||||||||||
Ratios/Supplemental Data | ||||||||||||||||||||
Net assets, end of period (in thousands) | $ | 38,066 | $ | 49,301 | $ | 34,481 | $ | 13,207 | $ | 36,275 | ||||||||||
|
|
|
|
|
|
|
|
|
| |||||||||||
Ratios to average net assets: | ||||||||||||||||||||
Net investment loss | (0.81 | %) | (0.77 | %) | (0.53 | %) | (0.40 | %) | (0.57 | %) | ||||||||||
Total expenses | 1.64 | % | 1.57 | % | 1.55 | % | 1.51 | % | 1.48 | % | ||||||||||
Net expensesc | 1.61 | % | 1.57 | % | 1.55 | % | 1.51 | % | 1.48 | % | ||||||||||
|
|
|
|
|
|
|
|
|
| |||||||||||
Portfolio turnover rate | 423 | % | 356 | % | 497 | % | 360 | % | 521 | % | ||||||||||
| a | Net investment loss per share was computed using average shares outstanding throughout the period. |
| b | Total return does not reflect the impact of any additional fees charged by insurance companies and has not been annualized. |
| c | Net expense information reflects the expense ratio after expense waivers. |
| 154 | THE RYDEX FUNDSANNUALREPORT | See Notes to Financial Statements. |
This page intentionally left blank.
THE RYDEX FUNDSANNUALREPORT | 155
| PERFORMANCE REPORT AND FUND PROFILE (Unaudited) | December 31, 2011 |
OBJECTIVE: Seeks to provide investment results that match, before fees and expenses, the performance of a benchmark for large-cap value securities on a daily basis. The Fund’s current benchmark is the S&P 500 Pure Value Index (the “underlying index”).
For the year ended December 31, 2011, S&P 500 Pure Value Fund returned -3.17%, compared with a loss of 0.82% for the S&P 500 Pure Value Index.
The large-cap value stocks that comprise the index underperformed their large-cap growth stock counterparts. Utilities and Health Care were the sectors providing the largest contribution to return. The weakest-performing sectors were Financials and Consumer Discretionary.
The strongest contributors to index performance for the year included Humana, Inc., Constellation Energy Group, Inc. and Dean Foods Co. The stocks detracting most from performance were Sears Holdings Corp., Bank of America Corp. and Computer Sciences Corp.
The S&P 500® Pure Value Index is narrow in focus, containing only those S&P 500 Index companies with strong value characteristics as selected by S&P. The S&P 500 Index is a capitalization-weighted index covering 500 industrial, utility, transportation and financial companies of the U.S. markets (mostly NYSE Euronext issues).
Holdings Diversification (Market Exposure as % of Net Assets)
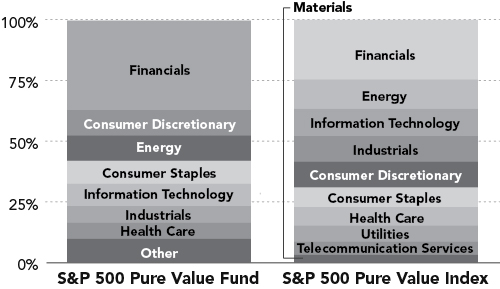
“Holdings Diversification (Market Exposure as % of Net Assets)” excludes any temporary cash investments.
Inception Date: May 3, 2004
Ten Largest Holdings | ||||
American International Group, Inc. | 2.3 | % | ||
Computer Sciences Corp. | 2.2 | % | ||
Marathon Oil Corp. | 1.8 | % | ||
Whirlpool Corp. | 1.8 | % | ||
Genworth Financial, Inc. — Class A | 1.8 | % | ||
Hartford Financial Services Group, Inc. | 1.8 | % | ||
Valero Energy Corp. | 1.7 | % | ||
Tenet Healthcare Corp. | 1.6 | % | ||
Archer-Daniels-Midland Co. | 1.6 | % | ||
Tyson Foods, Inc. — Class A | 1.5 | % | ||
|
| |||
Top Ten Total | 18.1 | % | ||
|
| |||
“Ten Largest Holdings” exclude any temporary cash or derivative investments.
156 | THE RYDEX FUNDSANNUALREPORT
PERFORMANCE REPORT AND FUND PROFILE (Unaudited) (concluded)
S&P 500 PURE VALUE FUND
Cumulative Fund Performance*
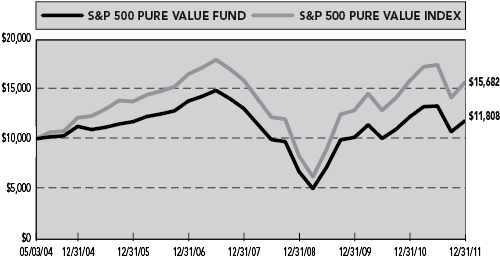
Average Annual Returns*
Periods Ended 12/31/11
| 1 Year | 5 Year | Since Inception (05/03/04) | ||||||||||
S&P 500 Pure Value Fund | -3.17 | % | -3.06 | % | 2.19 | % | ||||||
S&P 500 Pure Value Index | -0.82 | % | -1.00 | % | 6.05 | % | ||||||
| * | The performance data represents past performance that is not predictive of future results. The investment return and principal value of an investment in the Fund will fluctuate so that an investor’s shares, when redeemed, may be worth more or less than their original cost. Returns are historical and include changes in principal and reinvested dividends and capital gains and do not reflect the effect of taxes. The S&P 500 Pure Value Index is an unmanaged index and, unlike the Fund, has no management fees or operating expenses to reduce its reported return. |
Returns do not reflect the impact of any additional fees charged by insurance companies.
THE RYDEX FUNDSANNUALREPORT | 157
| SCHEDULE OF INVESTMENTS | December 31, 2011 |
S&P 500 PURE VALUE FUND
| SHARES | VALUE | |||||||
COMMON STOCKS† - 99.6% | ||||||||
FINANCIALS - 36.6% | ||||||||
American International Group, Inc.* | 31,080 | $ | 721,056 | |||||
Genworth Financial, Inc. — Class A* | 86,257 | 564,983 | ||||||
Hartford Financial Services Group, Inc. | 34,705 | 563,956 | ||||||
Lincoln National Corp. | 24,241 | 470,760 | ||||||
Morgan Stanley | 30,383 | 459,695 | ||||||
Hudson City Bancorp, Inc. | 71,830 | 448,937 | ||||||
MetLife, Inc. | 14,328 | 446,747 | ||||||
Citigroup, Inc. | 15,876 | 417,698 | ||||||
Allstate Corp. | 14,717 | 403,393 | ||||||
Prudential Financial, Inc. | 7,581 | 379,960 | ||||||
Bank of America Corp. | 66,557 | 370,057 | ||||||
Assurant, Inc. | 8,379 | 344,042 | ||||||
XL Group plc — Class A | 16,914 | 334,390 | ||||||
Unum Group | 15,441 | 325,342 | ||||||
JPMorgan Chase & Co. | 9,682 | 321,926 | ||||||
Goldman Sachs Group, Inc. | 3,223 | 291,456 | ||||||
SunTrust Banks, Inc. | 16,182 | 286,421 | ||||||
Principal Financial Group, Inc. | 11,323 | 278,546 | ||||||
Capital One Financial Corp. | 6,572 | 277,930 | ||||||
Bank of New York Mellon Corp. | 13,590 | 270,577 | ||||||
E*Trade Financial Corp.* | 33,040 | 262,998 | ||||||
KeyCorp | 32,000 | 246,080 | ||||||
Legg Mason, Inc. | 9,609 | 231,096 | ||||||
Loews Corp. | 5,718 | 215,283 | ||||||
Regions Financial Corp. | 44,851 | 192,859 | ||||||
Leucadia National Corp. | 8,330 | 189,424 | ||||||
ACE Ltd. | 2,634 | 184,696 | ||||||
Cincinnati Financial Corp. | 5,869 | 178,770 | ||||||
Ameriprise Financial, Inc. | 3,560 | 176,718 | ||||||
PNC Financial Services Group, Inc. | 3,023 | 174,336 | ||||||
Comerica, Inc. | 6,380 | 164,604 | ||||||
Fifth Third Bancorp | 11,905 | 151,432 | ||||||
NASDAQ OMX Group, Inc.* | 5,502 | 134,854 | ||||||
BB&T Corp. | 5,194 | 130,733 | ||||||
Huntington Bancshares, Inc. | 23,210 | 127,423 | ||||||
Weyerhaeuser Co. | 6,807 | 127,087 | ||||||
Wells Fargo & Co. | 4,570 | 125,949 | ||||||
CME Group, Inc. — Class A | 480 | 116,962 | ||||||
First Horizon National Corp. | 14,280 | 114,240 | ||||||
Torchmark Corp. | 2,621 | 113,725 | ||||||
SLM Corp. | 8,169 | �� | 109,465 | |||||
NYSE Euronext | 4,152 | 108,367 | ||||||
|
| |||||||
Total Financials | 11,554,973 | |||||||
|
| |||||||
CONSUMER DISCRETIONARY - 10.8% | ||||||||
Whirlpool Corp. | 12,086 | 573,481 | ||||||
GameStop Corp. — Class A* | 16,480 | 397,662 | ||||||
Best Buy Company, Inc. | 16,250 | 379,763 | ||||||
Gannett Company, Inc. | 22,963 | 307,015 | ||||||
Sears Holdings Corp.* | 8,907 | 283,064 | ||||||
Ford Motor Co.* | 25,760 | 277,178 | ||||||
Washington Post Co. — Class B | 733 | 276,202 | ||||||
Staples, Inc. | 17,970 | 249,603 | ||||||
JC Penney Company, Inc. | 7,024 | 246,894 | ||||||
Johnson Controls, Inc. | 4,880 | 152,549 | ||||||
Goodyear Tire & Rubber Co.* | 8,982 | 127,275 | ||||||
AutoNation, Inc.* | 3,188 | 117,542 | ||||||
Orchard Supply Hardware Stores Corp. — Class A*,3,††† | 215 | 1,621 | ||||||
|
| |||||||
Total Consumer Discretionary | 3,389,849 | |||||||
|
| |||||||
ENERGY - 10.5% | ||||||||
Marathon Oil Corp. | 19,905 | 582,619 | ||||||
Valero Energy Corp. | 25,785 | 542,774 | ||||||
Sunoco, Inc. | 10,196 | 418,240 | ||||||
Tesoro Corp.* | 17,761 | 414,897 | ||||||
Marathon Petroleum Corp. | 11,782 | 392,223 | ||||||
Murphy Oil Corp. | 4,620 | 257,519 | ||||||
Hess Corp. | 4,326 | 245,717 | ||||||
ConocoPhillips | 2,900 | 211,323 | ||||||
Alpha Natural Resources, Inc.* | 6,280 | 128,300 | ||||||
Nabors Industries Ltd.* | 5,950 | 103,173 | ||||||
|
| |||||||
Total Energy | 3,296,785 | |||||||
|
| |||||||
CONSUMER STAPLES - 9.3% | ||||||||
Archer-Daniels-Midland Co. | 18,049 | 516,201 | ||||||
Tyson Foods, Inc. — Class A | 23,651 | 488,157 | ||||||
Dean Foods Co.* | 40,335 | 451,752 | ||||||
Safeway, Inc. | 20,942 | 440,620 | ||||||
Kroger Co. | 14,492 | 350,996 | ||||||
Walgreen Co. | 6,300 | 208,278 | ||||||
CVS Caremark Corp. | 4,907 | 200,107 | ||||||
Molson Coors Brewing Co. — Class B | 3,370 | 146,730 | ||||||
Sysco Corp. | 4,605 | 135,065 | ||||||
|
| |||||||
Total Consumer Staples | 2,937,906 | |||||||
|
| |||||||
INFORMATION TECHNOLOGY - 9.3% | ||||||||
Computer Sciences Corp. | 29,763 | 705,383 | ||||||
Jabil Circuit, Inc. | 18,334 | 360,446 | ||||||
Micron Technology, Inc.* | 50,750 | 319,218 | ||||||
Xerox Corp. | 35,063 | 279,101 | ||||||
SAIC, Inc.* | 22,300 | 274,067 | ||||||
Hewlett-Packard Co. | 9,550 | 246,008 | ||||||
Western Digital Corp.* | 6,890 | 213,246 | ||||||
Lexmark International, Inc. — Class A | 5,050 | 167,003 | ||||||
Harris Corp. | 4,090 | 147,404 | ||||||
Corning, Inc. | 9,190 | 119,286 | ||||||
Dell, Inc.* | 6,876 | 100,596 | ||||||
|
| |||||||
Total Information Technology | 2,931,758 | |||||||
|
| |||||||
| 158 | THE RYDEX FUNDSANNUALREPORT | See Notes to Financial Statements. |
| SCHEDULE OF INVESTMENTS (concluded) | December 31, 2011 |
S&P 500 PURE VALUE FUND
| SHARES | VALUE | |||||||
INDUSTRIALS - 6.7% | ||||||||
RR Donnelley & Sons Co. | 24,814 | $ | 358,066 | |||||
L-3 Communications Holdings, Inc. | 5,033 | 335,600 | ||||||
Northrop Grumman Corp. | 5,325 | 311,406 | ||||||
Southwest Airlines Co. | 34,070 | 291,639 | ||||||
Avery Dennison Corp. | 9,890 | 283,645 | ||||||
Jacobs Engineering Group, Inc.* | 4,265 | 173,074 | ||||||
Ingersoll-Rand plc | 4,180 | 127,365 | ||||||
Ryder System, Inc. | 2,321 | 123,338 | ||||||
Textron, Inc. | 5,660 | 104,653 | ||||||
|
| |||||||
Total Industrials | 2,108,786 | |||||||
|
| |||||||
HEALTH CARE - 6.6% | ||||||||
Tenet Healthcare Corp.* | 101,240 | 519,361 | ||||||
Coventry Health Care, Inc.* | 10,814 | 328,421 | ||||||
Cardinal Health, Inc. | 8,076 | 327,966 | ||||||
AmerisourceBergen Corp. — Class A | 8,640 | 321,322 | ||||||
McKesson Corp. | 3,876 | 301,979 | ||||||
Cigna Corp. | 4,450 | 186,900 | ||||||
PerkinElmer, Inc. | 5,500 | 110,000 | ||||||
|
| |||||||
Total Health Care | 2,095,949 | |||||||
|
| |||||||
MATERIALS - 4.4% | ||||||||
Alcoa, Inc. | 34,384 | 297,422 | ||||||
United States Steel Corp. | 9,830 | 260,102 | ||||||
Sealed Air Corp. | 12,574 | 216,399 | ||||||
Owens-Illinois, Inc.* | 9,490 | 183,916 | ||||||
International Paper Co. | 5,512 | 163,155 | ||||||
Dow Chemical Co. | 4,670 | 134,309 | ||||||
Bemis Company, Inc. | 3,870 | 116,410 | ||||||
|
| |||||||
Total Materials | 1,371,713 | |||||||
|
| |||||||
UTILITIES - 3.3% | ||||||||
NRG Energy, Inc.* | 24,714 | 447,818 | ||||||
Pepco Holdings, Inc. | 9,526 | 193,378 | ||||||
Edison International | 4,014 | 166,180 | ||||||
Integrys Energy Group, Inc. | 2,352 | 127,431 | ||||||
DTE Energy Co. | 2,035 | 110,806 | ||||||
|
| |||||||
Total Utilities | 1,045,613 | |||||||
|
| |||||||
TELECOMMUNICATION SERVICES - 2.1% | ||||||||
Sprint Nextel Corp.* | 115,318 | 269,844 | ||||||
MetroPCS Communications, Inc.* | 20,340 | 176,551 | ||||||
Frontier Communications Corp. | 22,450 | 115,618 | ||||||
CenturyLink, Inc. | 2,900 | 107,880 | ||||||
|
| |||||||
Total Telecommunication Services | 669,893 | |||||||
|
| |||||||
Total Common Stocks | 31,403,225 | |||||||
|
| |||||||
PREFERRED STOCKS - 0.0% |
| |||||||
Orchard Supply Hardware — Class A*,1,3,††† | 215 | — | ||||||
|
| |||||||
Total Preferred Stocks | — | |||||||
|
| |||||||
| FACE AMOUNT | ||||||||
REPURCHASE AGREEMENT††,2 - 0.3% | ||||||||
Credit Suisse Group | $ | 102,623 | 102,623 | |||||
|
| |||||||
Total Repurchase Agreement | 102,623 | |||||||
|
| |||||||
Total Investments – 99.9% | $ | 31,505,848 | ||||||
|
| |||||||
Other Assets, Less Liabilities – 0.1% | 40,910 | |||||||
|
| |||||||
Total Net Assets – 100.0% | $ | 31,546,758 | ||||||
| * | Non-income producing security. |
| † | Value determined based on Level 1 inputs — See Note 4. |
| †† | Value determined based on Level 2 inputs — See Note 4. |
| ††† | Value determined based on Level 3 inputs — See Note 4. |
| 1 | Perpetual maturity. |
| 2 | Repurchase Agreement — See Note 5. |
| 3 | Illiquid security. |
plc — Public Limited Company
| See Notes to Financial Statements. | THE RYDEX FUNDSANNUALREPORT | 159 |
S&P 500 PURE VALUE FUND
STATEMENT OF ASSETS AND LIABILITIES
December 31, 2011
ASSETS: | ||||
Investments, at value | $ | 31,403,225 | ||
Repurchase agreements, at value | 102,623 | |||
|
| |||
Total investments | 31,505,848 | |||
Receivables: | ||||
Fund shares sold | 99,901 | |||
Dividends | 36,535 | |||
|
| |||
Total assets | 31,642,284 | |||
|
| |||
LIABILITIES: | ||||
Payable for: | ||||
Management fees | 17,834 | |||
Fund shares redeemed | 10,236 | |||
Transfer agent and administrative fees | 5,945 | |||
Investor service fees | 5,945 | |||
Portfolio accounting fees | 2,378 | |||
Miscellaneous | 53,188 | |||
|
| |||
Total liabilities | 95,526 | |||
|
| |||
NETASSETS | $ | 31,546,758 | ||
|
| |||
NETASSETSCONSISTOF: | ||||
Paid in capital | $ | 38,468,477 | ||
Undistributed net investment income | 113,232 | |||
Accumulated net realized loss on investments | (9,090,183 | ) | ||
Net unrealized appreciation on investments | 2,055,232 | |||
|
| |||
Net assets | $ | 31,546,758 | ||
Capital shares outstanding | 400,429 | |||
Net asset value per share | $ | 78.78 | ||
|
|
STATEMENT OF OPERATIONS
Year Ended December 31, 2011
INVESTMENT INCOME: | ||||
Dividends | $ | 640,450 | ||
Interest | 53 | |||
|
| |||
Total investment income | 640,503 | |||
|
| |||
EXPENSES: | ||||
Management fees | 246,023 | |||
Transfer agent and administrative fees | 82,008 | |||
Investor service fees | 82,008 | |||
Portfolio accounting fees | 32,803 | |||
Printing expenses | 26,692 | |||
Professional fees | 26,530 | |||
Custodian fees | 8,151 | |||
Trustees’ fees* | 3,260 | |||
Miscellaneous | 19,796 | |||
|
| |||
Total Expenses | 527,271 | |||
|
| |||
Net investment income | 113,232 | |||
|
| |||
NET REALIZEDAND UNREALIZED GAIN (LOSS): | ||||
Net realized gain (loss) on: | ||||
Investments | (1,907,648 | ) | ||
|
| |||
Net realized loss | (1,907,648 | ) | ||
|
| |||
Net change in unrealized appreciation (depreciation) on: | ||||
Investments | (1,637,848 | ) | ||
|
| |||
Net change in unrealized appreciation (depreciation) | (1,637,848 | ) | ||
|
| |||
Net realized and unrealized loss | (3,545,496 | ) | ||
|
| |||
Net decrease in net assets resulting from operations | $ | (3,432,264 | ) | |
|
|
| * | Relates to Trustees not deemed “interested persons” within the meaning of Section 2(a)(19) of the 1940 Act. |
| 160 | THE RYDEX FUNDSANNUALREPORT | See Notes to Financial Statements. |
S&P 500 PURE VALUE FUND
STATEMENTS OF CHANGES IN NET ASSETS
| Year Ended December 31, 2011 | Year Ended December 31, 2010 | |||||||
INCREASE (DECREASE) IN NET ASSETS FROM OPERATIONS: | ||||||||
Net investment income | $ | 113,232 | $ | 8,103 | ||||
Net realized gain (loss) on investments | (1,907,648 | ) | 3,395,380 | |||||
Net change in unrealized appreciation (depreciation) on investments | (1,637,848 | ) | 1,018,637 | |||||
|
|
|
| |||||
Net increase (decrease) in net assets resulting from operations | (3,432,264 | ) | 4,422,120 | |||||
|
|
|
| |||||
DISTRIBUTIONSTOSHAREHOLDERSFROM: | ||||||||
Net investment income | (8,103 | ) | (184,518 | ) | ||||
|
|
|
| |||||
Total distributions to shareholders | (8,103 | ) | (184,518 | ) | ||||
|
|
|
| |||||
CAPITALSHARETRANSACTIONS: | ||||||||
Proceeds from sale of shares | 261,707,044 | 124,591,277 | ||||||
Distributions reinvested | 8,103 | 184,518 | ||||||
Cost of shares redeemed | (255,971,396 | ) | (127,621,142 | ) | ||||
|
|
|
| |||||
Net increase (decrease) from capital share transactions | 5,743,751 | (2,845,347 | ) | |||||
|
|
|
| |||||
Net increase in net assets | 2,303,384 | 1,392,255 | ||||||
NET ASSETS: | ||||||||
Beginning of year | 29,243,374 | 27,851,119 | ||||||
|
|
|
| |||||
End of year | $ | 31,546,758 | $ | 29,243,374 | ||||
|
|
|
| |||||
Undistributed net investment income at end of year | $ | 113,232 | $ | 8,103 | ||||
|
|
|
| |||||
CAPITALSHAREACTIVITY: | ||||||||
Shares sold | 3,203,719 | 1,689,047 | ||||||
Shares issued from reinvestment of distributions | 101 | 2,462 | ||||||
Shares redeemed | (3,162,705 | ) | (1,740,816 | ) | ||||
|
|
|
| |||||
Net increase (decrease) in shares | 41,115 | (49,307 | ) | |||||
|
|
|
| |||||
| See Notes to Financial Statements. | THE RYDEX FUNDSANNUALREPORT | 161 |
S&P 500 PURE VALUE FUND
FINANCIAL HIGHLIGHTS
This table is presented to show selected data for a share outstanding throughout each period, and to assist shareholders in evaluating a Fund’s performance for the periods presented.
| Year Ended December 31, 2011 | Year Ended December 31, 2010 | Year Ended December 31, 2009c | Year Ended December 31, 2008c | Year Ended December 31, 2007c | ||||||||||||||||
Per Share Data | ||||||||||||||||||||
Net asset value, beginning of period | $ | 81.39 | $ | 68.16 | $ | 45.81 | $ | 126.85 | $ | 158.90 | ||||||||||
|
|
|
|
|
|
|
|
|
| |||||||||||
Income (loss) from investment operations: | ||||||||||||||||||||
Net investment incomea | .29 | .02 | .65 | 2.35 | 2.10 | |||||||||||||||
Net gain (loss) on investments (realized and unrealized) | (2.88 | ) | 13.79 | 22.78 | (65.04 | ) | (10.15 | ) | ||||||||||||
|
|
|
|
|
|
|
|
|
| |||||||||||
Total from investment operations | (2.59 | ) | 13.81 | 23.43 | (62.69 | ) | (8.05 | ) | ||||||||||||
|
|
|
|
|
|
|
|
|
| |||||||||||
Less distributions from: | ||||||||||||||||||||
Net investment income | (.02 | ) | (.58 | ) | (1.08 | ) | (1.15 | ) | (2.85 | ) | ||||||||||
Net realized gains | — | — | — | (17.20 | ) | (21.15 | ) | |||||||||||||
|
|
|
|
|
|
|
|
|
| |||||||||||
Total distributions | (.02 | ) | (.58 | ) | (1.08 | ) | (18.35 | ) | (24.00 | ) | ||||||||||
|
|
|
|
|
|
|
|
|
| |||||||||||
Net asset value, end of period | $ | 78.78 | $ | 81.39 | $ | 68.16 | $ | 45.81 | $ | 126.85 | ||||||||||
|
|
|
|
|
|
|
|
|
| |||||||||||
Total Returnb | (3.17 | %) | 20.32 | % | 51.22 | % | (48.65 | %) | (5.37 | %) | ||||||||||
|
|
|
|
|
|
|
|
|
| |||||||||||
Ratios/Supplemental Data | ||||||||||||||||||||
Net assets, end of period (in thousands) | $ | 31,547 | $ | 29,243 | $ | 27,851 | $ | 9,479 | $ | 24,799 | ||||||||||
|
|
|
|
|
|
|
|
|
| |||||||||||
Ratios to average net assets: | ||||||||||||||||||||
Net investment income | 0.35 | % | 0.03 | % | 1.18 | % | 2.42 | % | 1.28 | % | ||||||||||
Total expenses | 1.61 | % | 1.56 | % | 1.54 | % | 1.51 | % | 1.49 | % | ||||||||||
|
|
|
|
|
|
|
|
|
| |||||||||||
Portfolio turnover rate | 724 | % | 425 | % | 421 | % | 389 | % | 307 | % | ||||||||||
| a | Net investment income per share was computed using average shares outstanding throughout the period. |
| b | Total return does not reflect the impact of any additional fees charged by insurance companies and has not been annualized. |
| c | Per share amounts for the years ended December 31, 2007 – December 31, 2008 and the period January 1, 2009 through April 19, 2009 have been restated to reflect a 1:5 reverse stock split effective April 20, 2009. |
| 162 | THE RYDEX FUNDSANNUALREPORT | See Notes to Financial Statements. |
This page intentionally left blank.
THE RYDEX FUNDSANNUALREPORT | 163
| PERFORMANCE REPORT AND FUND PROFILE (Unaudited) | December 31, 2011 |
S&P MIDCAP 400 PURE GROWTH FUND
OBJECTIVE: Seeks to provide investment results that match, before fees and expenses, the performance of a benchmark for mid-cap growth securities on a daily basis. The Fund’s current benchmark is the S&P MidCap 400 Pure Growth Index (the “underlying index”).
For the year ended December 31, 2011, S&P MidCap 400 Pure Growth Fund returned -0.66%, compared with a gain of 0.59% gain for the S&P MidCap 400 Pure Growth Index.
Mid-cap growth stocks significantly outperformed their mid-cap value stock counterparts, with Industrials and Consumer Staples holdings contributing most to return. The Information Technology sector was the largest detractor from performance, followed by the Financials sector.
NewMarket Corp., Hansen Natural Corp. and Rackspace Hosting, Inc. added the most to return for the year. Cree, Inc., Guess?, Inc. and Skyworks Solutions, Inc. detracted the most from performance for the year.
The S&P MidCap 400® Pure Growth Index is narrow in focus, containing only those S&P MidCap 400 Index companies with strong growth characteristics as selected by S&P. The S&P MidCap 400 Index measures the performance of the mid-capitalization sector of the U.S. equity market.
Holdings Diversification (Market Exposure as % of Net Assets)
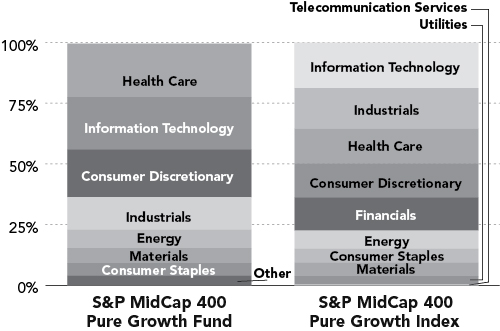
“Holdings Diversification (Market Exposure as % of Net Assets)” excludes any temporary cash investments.
Inception Date: May 3, 2004
Ten Largest Holdings (% of Total Net Assets) | ||||
ITT Educational Services, Inc. | 2.2 | % | ||
Strayer Education, Inc. | 1.8 | % | ||
AMERIGROUP Corp. | 1.8 | % | ||
Mednax, Inc. | 1.7 | % | ||
Triumph Group, Inc. | 1.7 | % | ||
Regeneron Pharmaceuticals, Inc. | 1.7 | % | ||
Catalyst Health Solutions, Inc. | 1.7 | % | ||
Alliance Data Systems Corp. | 1.7 | % | ||
United Therapeutics Corp. | 1.6 | % | ||
Equinix, Inc. | 1.6 | % | ||
|
| |||
Top Ten Total | 17.5 | % | ||
|
| |||
“Ten Largest Holdings” exclude any temporary cash or derivative investments.
164 | THE RYDEX FUNDSANNUALREPORT
| PERFORMANCE REPORT AND FUND PROFILE (Unaudited) (concluded) |
S&P MIDCAP 400 PURE GROWTH FUND
Cumulative Fund Performance*
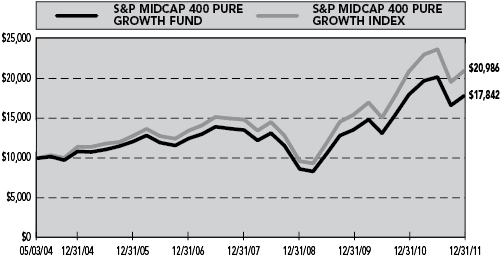
Average Annual Returns*
Periods Ended 12/31/11
| 1 Year | 5 Year | Since Inception (05/03/04) | ||||||||||
S&P MidCap 400 Pure Growth Fund | -0.66 | % | 7.42 | % | 7.85 | % | ||||||
S&P MidCap 400 Pure Growth Index | 0.59 | % | 9.29 | % | 10.15 | % | ||||||
| * | The performance data represents past performance that is not predictive of future results. The investment return and principal value of an investment in the Fund will fluctuate so that an investor’s shares, when redeemed, may be worth more or less than their original cost. Returns are historical and include changes in principal and reinvested dividends and capital gains and do not reflect the effect of taxes. The S&P MidCap 400 Pure Growth Index is an unmanaged index and, unlike the Fund, has no management fees or operating expenses to reduce its reported return. |
Returns do not reflect the impact of any additional fees charged by insurance companies.
THE RYDEX FUNDSANNUALREPORT | 165
| SCHEDULE OF INVESTMENTS | December 31, 2011 | |||
S&P MIDCAP 400 PURE GROWTH FUND |
| SHARES | VALUE | |||||||
COMMON STOCKS† - 99.5% | ||||||||
HEALTH CARE - 22.1% | ||||||||
AMERIGROUP Corp.* | 8,250 | $ | 487,410 | |||||
Mednax, Inc.* | 6,554 | 471,953 | ||||||
Regeneron Pharmaceuticals, Inc.* | 8,210 | 455,080 | ||||||
Catalyst Health Solutions, Inc.* | 8,735 | 454,220 | ||||||
United Therapeutics Corp.* | 9,460 | 446,985 | ||||||
Gen-Probe, Inc.* | 6,480 | 383,098 | ||||||
Bio-Rad Laboratories, Inc. — Class A* | 3,500 | 336,140 | ||||||
Endo Pharmaceuticals Holdings, Inc.* | 8,900 | 307,317 | ||||||
IDEXX Laboratories, Inc.* | 3,977 | 306,070 | ||||||
Henry Schein, Inc.* | 4,500 | 289,935 | ||||||
HMS Holdings Corp.* | 8,370 | 267,673 | ||||||
Thoratec Corp.* | 7,827 | 262,674 | ||||||
Cooper Companies, Inc. | 3,681 | 259,584 | ||||||
Techne Corp. | 3,770 | 257,340 | ||||||
Mettler-Toledo International, Inc.* | 1,726 | 254,947 | ||||||
Medicis Pharmaceutical Corp. — Class A | 7,038 | 234,013 | ||||||
ResMed, Inc.* | 8,096 | 205,638 | ||||||
Covance, Inc.* | 3,980 | 181,966 | ||||||
Allscripts Healthcare Solutions, Inc.* | 9,157 | 173,434 | ||||||
|
| |||||||
Total Health Care | 6,035,477 | |||||||
|
| |||||||
INFORMATION TECHNOLOGY - 21.5% | ||||||||
Alliance Data Systems Corp.* | 4,350 | 451,704 | ||||||
Equinix, Inc.* | 4,343 | 440,380 | ||||||
Silicon Laboratories, Inc.* | 8,949 | 388,566 | ||||||
Rackspace Hosting, Inc.* | 8,514 | 366,187 | ||||||
Global Payments, Inc. | 7,165 | 339,478 | ||||||
Informatica Corp.* | 8,502 | 313,979 | ||||||
Factset Research Systems, Inc. | 3,360 | 293,261 | ||||||
ANSYS, Inc.* | 4,890 | 280,099 | ||||||
Rovi Corp.* | 10,983 | 269,962 | ||||||
Lam Research Corp.* | 6,920 | 256,178 | ||||||
Concur Technologies, Inc.* | 4,999 | 253,899 | ||||||
VeriFone Systems, Inc.* | 7,090 | 251,837 | ||||||
Solera Holdings, Inc. | 5,350 | 238,289 | ||||||
Semtech Corp.* | 9,409 | 233,531 | ||||||
Riverbed Technology, Inc.* | 8,565 | 201,277 | ||||||
ADTRAN, Inc. | 6,032 | 181,925 | ||||||
Zebra Technologies Corp. — Class A* | 4,973 | 177,934 | ||||||
MICROS Systems, Inc.* | 3,638 | 169,458 | ||||||
Jack Henry & Associates, Inc. | 4,982 | 167,445 | ||||||
NeuStar, Inc. — Class A* | 3,950 | 134,971 | ||||||
ACI Worldwide, Inc.* | 4,614 | 132,145 | ||||||
Gartner, Inc.* | 3,446 | 119,817 | ||||||
Trimble Navigation Ltd.* | 2,550 | 110,670 | ||||||
Advent Software, Inc.* | 4,243 | 103,359 | ||||||
|
| |||||||
Total Information Technology | 5,876,351 | |||||||
|
| |||||||
CONSUMER DISCRETIONARY - 19.7% | ||||||||
ITT Educational Services, Inc.* | 10,611 | 603,660 | ||||||
Strayer Education, Inc. | 5,091 | 494,794 | ||||||
Advance Auto Parts, Inc. | 5,666 | 394,524 | ||||||
Panera Bread Co. — Class A* | 2,777 | 392,807 | ||||||
Under Armour, Inc. — Class A* | 5,279 | 378,979 | ||||||
PVH Corp. | 5,293 | 373,104 | ||||||
Tractor Supply Co. | 5,048 | 354,117 | ||||||
Fossil, Inc.* | 4,452 | 353,311 | ||||||
Deckers Outdoor Corp.* | 4,526 | 342,030 | ||||||
PetSmart, Inc. | 5,970 | 306,201 | ||||||
Warnaco Group, Inc.* | 5,647 | 282,576 | ||||||
LKQ Corp.* | 9,023 | 271,412 | ||||||
Life Time Fitness, Inc.* | 5,396 | 252,263 | ||||||
Tupperware Brands Corp. | 4,479 | 250,690 | ||||||
Polaris Industries, Inc. | 4,217 | 236,068 | ||||||
Gentex Corp. | 3,769 | 111,525 | ||||||
|
| |||||||
Total Consumer Discretionary | 5,398,061 | |||||||
|
| |||||||
INDUSTRIALS - 13.4% | ||||||||
Triumph Group, Inc. | 7,855 | 459,125 | ||||||
Clean Harbors, Inc.* | 5,770 | 367,722 | ||||||
Alaska Air Group, Inc.* | 4,680 | 351,421 | ||||||
Watsco, Inc. | 5,080 | 333,553 | ||||||
Valmont Industries, Inc. | 3,320 | 301,423 | ||||||
Copart, Inc.* | 5,330 | 255,254 | ||||||
MSC Industrial Direct Co., Inc. — Class A | 3,450 | 246,847 | ||||||
Wabtec Corp. | 3,250 | 227,337 | ||||||
Woodward, Inc. | 5,320 | 217,748 | ||||||
FTI Consulting, Inc.* | 5,030 | 213,373 | ||||||
Donaldson Company, Inc. | 2,890 | 196,751 | ||||||
J.B. Hunt Transport Services, Inc. | 4,160 | 187,491 | ||||||
AMETEK, Inc. | 3,910 | 164,611 | ||||||
Gardner Denver, Inc. | 2,030 | 156,432 | ||||||
|
| |||||||
Total Industrials | 3,679,088 | |||||||
|
| |||||||
ENERGY - 7.6% | ||||||||
CARBO Ceramics, Inc. | 2,790 | 344,091 | ||||||
Bill Barrett Corp.* | 9,625 | 327,924 | ||||||
Dresser-Rand Group, Inc.* | 5,117 | 255,389 | ||||||
Cimarex Energy Co. | 3,520 | 217,888 | ||||||
Dril-Quip, Inc.* | 3,205 | 210,953 | ||||||
Oil States International, Inc.* | 2,710 | 206,963 | ||||||
Northern Oil and Gas, Inc.* | 8,561 | 205,293 | ||||||
Oceaneering International, Inc. | 3,766 | 173,726 | ||||||
SM Energy Co. | 1,750 | 127,925 | ||||||
|
| |||||||
Total Energy | 2,070,152 | |||||||
|
| |||||||
| 166 | THE RYDEX FUNDSANNUALREPORT | See Notes to Financial Statements. |
| SCHEDULE OF INVESTMENTS (concluded) | December 31, 2011 | |||
S&P MIDCAP 400 PURE GROWTH FUND |
| SHARES | VALUE | |||||||
MATERIALS - 6.1% | ||||||||
NewMarket Corp. | 2,120 | $ | 419,993 | |||||
Rock-Tenn Co. — Class A | 6,140 | 354,278 | ||||||
Compass Minerals International, Inc. | 4,043 | 278,361 | ||||||
Aptargroup, Inc. | 4,450 | 232,156 | ||||||
Intrepid Potash, Inc.* | 8,830 | 199,823 | ||||||
Albemarle Corp. | 3,867 | 199,189 | ||||||
|
| |||||||
Total Materials | 1,683,800 | |||||||
|
| |||||||
CONSUMER STAPLES - 5.2% | ||||||||
Hansen Natural Corp.* | 3,971 | 365,888 | ||||||
Green Mountain Coffee Roasters, Inc.* | 7,997 | 358,665 | ||||||
Lancaster Colony Corp. | 4,010 | 278,053 | ||||||
Corn Products International, Inc. | 5,120 | 269,261 | ||||||
Church & Dwight Company, Inc. | 3,370 | 154,211 | ||||||
|
| |||||||
Total Consumer Staples | 1,426,078 | |||||||
|
| |||||||
FINANCIALS - 3.9% | ||||||||
Signature Bank* | 4,730 | 283,753 | ||||||
MSCI, Inc. — Class A* | 5,463 | 179,897 | ||||||
Federal Realty Investment Trust | 1,960 | 177,870 | ||||||
Taubman Centers, Inc. | 2,710 | 168,291 | ||||||
Home Properties, Inc. | 2,270 | 130,684 | ||||||
Essex Property Trust, Inc. | 900 | 126,459 | ||||||
|
| |||||||
Total Financials | 1,066,954 | |||||||
|
| |||||||
Total Common Stocks | 27,235,961 | |||||||
|
| |||||||
WARRANTS†† - 0.0% | ||||||||
Krispy Kreme Doughnuts, Inc. $12.21, 03/02/12* | 6 | — | ||||||
|
| |||||||
Total Warrants | — | |||||||
|
| |||||||
| FACE AMOUNT | ||||||||
REPURCHASE AGREEMENT††,1 - 0.8% | ||||||||
Credit Suisse Group issued 12/30/11 at 0.00% due 01/03/12 | $ | 215,840 | 215,840 | |||||
|
| |||||||
Total Repurchase Agreement | 215,840 | |||||||
|
| |||||||
Total Investments – 100.3% | $ | 27,451,801 | ||||||
|
| |||||||
Liabilities, Less Other Assets – (0.3)% | (72,714 | ) | ||||||
|
| |||||||
Total Net Assets – 100.0% | $ | 27,379,087 | ||||||
| * | Non-income producing security. |
| † | Value determined based on Level 1 inputs — See Note 4. |
| †† | Value determined based on Level 2 inputs — See Note 4. |
| 1 | Repurchase Agreement — See Note 5. |
| See Notes to Financial Statements. | THE RYDEX FUNDSANNUALREPORT | 167 |
S&P MIDCAP 400 PURE GROWTH FUND
STATEMENT OF ASSETS AND LIABILITIES
December 31, 2011
ASSETS: | ||||
Investments, at value | $ | 27,235,961 | ||
Repurchase agreements, at value | 215,840 | |||
|
| |||
Total investments | 27,451,801 | |||
Receivables: | ||||
Securities sold | 2,365,624 | |||
Dividends | 12,336 | |||
|
| |||
Total assets | 29,829,761 | |||
|
| |||
LIABILITIES: | ||||
Payable for: | ||||
Fund shares redeemed | 2,340,156 | |||
Management fees | 18,824 | |||
Transfer agent and administrative fees | 6,275 | |||
Investor service fees | 6,275 | |||
Portfolio accounting fees | 2,510 | |||
Miscellaneous | 76,634 | |||
|
| |||
Total liabilities | 2,450,674 | |||
|
| |||
NETASSETS | $ | 27,379,087 | ||
|
| |||
NETASSETSCONSISTOF: | ||||
Paid in capital | $ | 19,939,296 | ||
Undistributed net investment income | — | |||
Accumulated net realized gain on investments | 2,473,203 | |||
Net unrealized appreciation on investments | 4,966,588 | |||
|
| |||
Net assets | $ | 27,379,087 | ||
Capital shares outstanding | 749,908 | |||
Net asset value per share | $ | 36.51 | ||
|
|
STATEMENT OF OPERATIONS
Year Ended December 31, 2011
INVESTMENTINCOME: | ||||
Dividends | $ | 157,933 | ||
Interest | 94 | |||
|
| |||
Total investment income | 158,027 | |||
|
| |||
EXPENSES: | ||||
Management fees | 335,722 | |||
Transfer agent and administrative fees | 111,908 | |||
Investor service fees | 111,908 | |||
Portfolio accounting fees | 44,763 | |||
Custodian fees | 10,867 | |||
Trustees’ fees* | 4,677 | |||
Miscellaneous | 103,063 | |||
|
| |||
Total Expenses | 722,908 | |||
|
| |||
Net investment loss | (564,881 | ) | ||
|
| |||
NET REALIZEDAND UNREALIZED GAIN (LOSS): | ||||
Net realized gain (loss) on: | ||||
Investments | 5,778,505 | |||
|
| |||
Net realized gain | 5,778,505 | |||
|
| |||
Net change in unrealized appreciation (depreciation) on: | ||||
Investments | (5,963,605 | ) | ||
|
| |||
Net change in unrealized appreciation (depreciation) | (5,963,605 | ) | ||
|
| |||
Net realized and unrealized loss | (185,100 | ) | ||
|
| |||
Net decrease in net assets resulting from operations | $ | (749,981 | ) | |
|
|
| * | Relates to Trustees not deemed “interested persons” within the meaning of Section 2(a)(19) of the 1940 Act. |
| 168 | THE RYDEX FUNDSANNUALREPORT | See Notes to Financial Statements. |
S&P MIDCAP 400 PURE GROWTH FUND
STATEMENTS OF CHANGES IN NET ASSETS
| Year Ended December 31, 2011 | Year Ended December 31, 2010 | |||||||
INCREASE (DECREASE) IN NET ASSETS FROM OPERATIONS: | ||||||||
Net investment loss | $ | (564,881 | ) | $ | (399,570 | ) | ||
Net realized gain on investments | 5,778,505 | 5,437,951 | ||||||
Net change in unrealized appreciation (depreciation) on investments | (5,963,605 | ) | 3,193,005 | |||||
|
|
|
| |||||
Net increase (decrease) in net assets resulting from operations | (749,981 | ) | 8,231,386 | |||||
|
|
|
| |||||
DISTRIBUTIONSTOSHAREHOLDERSFROM: | ||||||||
Net realized gains | (1,787,658 | ) | — | |||||
|
|
|
| |||||
Total distributions to shareholders | (1,787,658 | ) | — | |||||
|
|
|
| |||||
CAPITALSHARETRANSACTIONS: | ||||||||
Proceeds from sale of shares | 97,830,713 | 112,741,033 | ||||||
Distributions reinvested | 1,787,658 | — | ||||||
Cost of shares redeemed | (131,880,115 | ) | (103,711,891 | ) | ||||
|
|
|
| |||||
Net increase (decrease) from capital share transactions | (32,261,744 | ) | 9,029,142 | |||||
|
|
|
| |||||
Net increase (decrease) in net assets | (34,799,383 | ) | 17,260,528 | |||||
NETASSETS: | ||||||||
Beginning of year | 62,178,470 | 44,917,942 | ||||||
|
|
|
| |||||
End of year | $ | 27,379,087 | $ | 62,178,470 | ||||
|
|
|
| |||||
Undistributed net investment income at end of year | $ | — | $ | — | ||||
|
|
|
| |||||
CAPITALSHAREACTIVITY: | ||||||||
Shares sold | 2,391,774 | 3,306,088 | ||||||
Shares issued from reinvestment of distributions | 47,519 | — | ||||||
Shares redeemed | (3,275,926 | ) | (3,239,015 | ) | ||||
|
|
|
| |||||
Net increase (decrease) in shares | (836,633 | ) | 67,073 | |||||
|
|
|
| |||||
| See Notes to Financial Statements. | THE RYDEX FUNDSANNUALREPORT | 169 |
S&P MIDCAP 400 PURE GROWTH FUND
FINANCIAL HIGHLIGHTS
This table is presented to show selected data for a share outstanding throughout each period, and to assist shareholders in evaluating a Fund’s performance for the periods presented.
| Year Ended December 31, 2011 | Year Ended December 31, 2010 | Year Ended December 31, 2009 | Year Ended December 31, 2008 | Year Ended December 31, 2007 | ||||||||||||||||
Per Share Data | ||||||||||||||||||||
Net asset value, beginning of period | $ | 39.19 | $ | 29.56 | $ | 18.85 | $ | 29.51 | $ | 29.33 | ||||||||||
|
|
|
|
|
|
|
|
|
| |||||||||||
Income (loss) from investment operations: | ||||||||||||||||||||
Net investment lossa | (.52 | ) | (.35 | ) | (.25 | ) | (.24 | ) | (.19 | ) | ||||||||||
Net gain (loss) on investments (realized and unrealized) | .34 | 9.98 | 10.96 | (10.42 | ) | 2.69 | ||||||||||||||
|
|
|
|
|
|
|
|
|
| |||||||||||
Total from investment operations | (.18 | ) | 9.63 | 10.71 | (10.66 | ) | 2.50 | |||||||||||||
|
|
|
|
|
|
|
|
|
| |||||||||||
Less distributions from: | ||||||||||||||||||||
Net realized gains | (2.50 | ) | — | — | — | (2.32 | ) | |||||||||||||
|
|
|
|
|
|
|
|
|
| |||||||||||
Total distributions | (2.50 | ) | — | — | — | (2.32 | ) | |||||||||||||
|
|
|
|
|
|
|
|
|
| |||||||||||
Net asset value, end of period | $ | 36.51 | $ | 39.19 | $ | 29.56 | $ | 18.85 | $ | 29.51 | ||||||||||
|
|
|
|
|
|
|
|
|
| |||||||||||
Total Returnb | (0.66 | %) | 32.58 | % | 56.82 | % | (36.12 | %) | 8.42 | % | ||||||||||
|
|
|
|
|
|
|
|
|
| |||||||||||
Ratios/Supplemental Data | ||||||||||||||||||||
Net assets, end of period (in thousands) | $ | 27,379 | $ | 62,178 | $ | 44,918 | $ | 11,695 | $ | 25,940 | ||||||||||
|
|
|
|
|
|
|
|
|
| |||||||||||
Ratios to average net assets: | ||||||||||||||||||||
Net investment loss | (1.26 | %) | (1.06 | %) | (1.01 | %) | (0.89 | %) | (0.61 | %) | ||||||||||
Total expenses | 1.61 | % | 1.56 | % | 1.55 | % | 1.51 | % | 1.48 | % | ||||||||||
|
|
|
|
|
|
|
|
|
| |||||||||||
Portfolio turnover rate | 202 | % | 304 | % | 244 | % | 381 | % | 591 | % | ||||||||||
| a | Net investment loss per share was computed using average shares outstanding throughout the period. |
| b | Total return does not reflect the impact of any additional fees charged by insurance companies and has not been annualized. |
| 170 | THE RYDEX FUNDSANNUALREPORT | See Notes to Financial Statements. |
This page intentionally left blank.
| THE RYDEX FUNDSANNUALREPORT | 171 |
| PERFORMANCE REPORT AND FUND PROFILE (Unaudited) | December 31, 2011 |
S&P MIDCAP 400 PURE VALUE FUND
OBJECTIVE: Seeks to provide investment results that match, before fees and expenses, the performance of a benchmark for mid-cap value securities on a daily basis. The Fund’s current benchmark is the S&P MidCap 400 Pure Value Index (the “underlying index”).
For the year ended December 31, 2011, S&P MidCap 400 Pure Value Fund returned -7.15%, compared with a return of -5.06% for the S&P MidCap 400 Pure Value Index.
Mid-cap value stocks significantly underperformed their mid-cap growth stock counterparts. The sectors contributing most to performance were Utilities and Consumer Staples. The Industrials and Health Care sectors detracted the most from return.
PNM Resources, Inc., Omnicare, Inc. and Frontier Oil contributed the most to return for the year. Kindred Healthcare, Inc., Community Health Systems, Inc. and Overseas Shipping Group, Inc. detracted the most from return for the year.
The S&P MidCap 400® Pure Value Index is narrow in focus, containing only those S&P MidCap 400 Index companies with strong value characteristics as selected by S&P. The S&P MidCap 400 Index measures the performance of the mid-capitalization sector of the U.S. equity market.
Holdings Diversification (Market Exposure as % of
Net Assets)
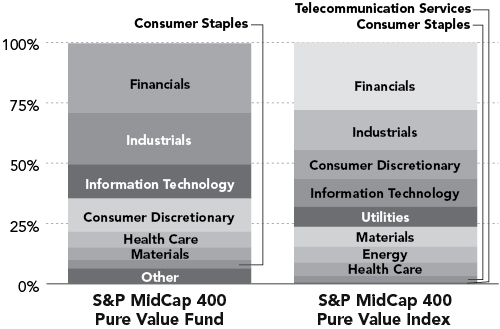
“Holdings Diversification (Market Exposure as % of Net Assets)” excludes any temporary cash investments.
Inception Date: May 3, 2004
Ten Largest Holdings (% of Total Net Assets) | ||||
ITT Corp. | 2.7 | % | ||
Exelis, Inc. | 2.6 | % | ||
First American Financial Corp. | 2.4 | % | ||
JetBlue Airways Corp. | 2.2 | % | ||
Ingram Micro, Inc. — Class A | 2.2 | % | ||
Community Health Systems, Inc. | 2.1 | % | ||
URS Corp. | 2.0 | % | ||
Collective Brands, Inc. | 1.9 | % | ||
Avnet, Inc. | 1.9 | % | ||
Oshkosh Corp. | 1.9 | % | ||
|
| |||
Top Ten Total | 21.9 | % | ||
|
| |||
“Ten Largest Holdings” exclude any temporary cash or derivative investments.
172 | THE RYDEX FUNDSANNUALREPORT
PERFORMANCE REPORT AND FUND PROFILE (Unaudited) (concluded)
S&P MIDCAP 400 PURE VALUE FUND
Cumulative Fund Performance*
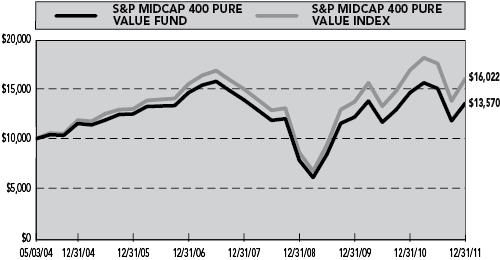
Average Annual Returns*
Periods Ended 12/31/11
| 1 Year | 5 Year | Since Inception (05/03/04) | ||||||||||
S&P MidCap 400 Pure Value Fund | -7.15 | % | -1.46 | % | 4.06 | % | ||||||
S&P MidCap 400 Pure Value Index | -5.06 | % | 0.69 | % | 6.35 | % | ||||||
| * | The performance data represents past performance that is not predictive of future results. The investment return and principal value of an investment in the Fund will fluctuate so that an investor’s shares, when redeemed, may be worth more or less than their original cost. Returns are historical and include changes in principal and reinvested dividends and capital gains and do not reflect the effect of taxes. The S&P MidCap 400 Pure Value Index is an unmanaged index and, unlike the Fund, has no management fees or operating expenses to reduce its reported return. |
| Returns do not reflect the impact of any additional fees charged by insurance companies. |
THE RYDEX FUNDSANNUALREPORT | 173
| SCHEDULE OF INVESTMENTS | December 31, 2011 |
S&P MIDCAP 400 PURE VALUE FUND
| SHARES | VALUE | |||||||
COMMON STOCKS† - 99.5% | ||||||||
FINANCIALS - 28.7% | ||||||||
First American Financial Corp. | 44,057 | $ | 558,202 | |||||
Protective Life Corp. | 17,913 | 404,117 | ||||||
Astoria Financial Corp. | 45,686 | 387,874 | ||||||
Reinsurance Group of America, Inc. — Class A | 7,356 | 384,351 | ||||||
Hanover Insurance Group, Inc. | 10,634 | 371,658 | ||||||
Old Republic International Corp. | 39,439 | 365,600 | ||||||
Aspen Insurance Holdings Ltd. | 13,340 | 353,510 | ||||||
Kemper Corp. | 10,548 | 308,107 | ||||||
StanCorp Financial Group, Inc. | 7,861 | 288,892 | ||||||
Jefferies Group, Inc. | 19,850 | 272,938 | ||||||
Transatlantic Holdings, Inc. | 4,898 | 268,068 | ||||||
Everest Re Group Ltd. | 2,953 | 248,318 | ||||||
American Financial Group, Inc. | 6,524 | 240,670 | ||||||
BancorpSouth, Inc. | 21,293 | 234,649 | ||||||
Fidelity National Financial, Inc. — Class A | 14,023 | 223,386 | ||||||
First Niagara Financial Group, Inc. | 25,144 | 216,993 | ||||||
TCF Financial Corp. | 18,220 | 188,030 | ||||||
Washington Federal, Inc. | 12,869 | 180,037 | ||||||
Apollo Investment Corp. | 27,145 | 174,814 | ||||||
HCC Insurance Holdings, Inc. | 6,356 | 174,790 | ||||||
Janus Capital Group, Inc. | 23,710 | 149,610 | ||||||
New York Community Bancorp, Inc. | 10,970 | 135,699 | ||||||
Associated Banc-Corp. | 11,790 | 131,694 | ||||||
International Bancshares Corp. | 7,086 | 129,922 | ||||||
WR Berkley Corp. | 2,955 | 101,622 | ||||||
Fulton Financial Corp. | 9,233 | 90,576 | ||||||
|
| |||||||
Total Financials | 6,584,127 | |||||||
|
| |||||||
INDUSTRIALS - 21.4% | ||||||||
ITT Corp. | 32,040 | 619,333 | ||||||
Exelis, Inc. | 64,590 | 584,540 | ||||||
JetBlue Airways Corp.* | 96,114 | 499,793 | ||||||
URS Corp.* | 13,018 | 457,192 | ||||||
Oshkosh Corp.* | 20,320 | 434,442 | ||||||
Huntington Ingalls Industries, Inc.* | 12,030 | 376,298 | ||||||
General Cable Corp.* | 14,880 | 372,149 | ||||||
AECOM Technology Corp.* | 14,042 | 288,844 | ||||||
Manpower, Inc. | 5,809 | 207,672 | ||||||
Con-way, Inc. | 6,860 | 200,038 | ||||||
UTI Worldwide, Inc. | 14,490 | 192,572 | ||||||
Brink’s Co. | 6,022 | 161,871 | ||||||
KBR, Inc. | 5,351 | 149,132 | ||||||
Terex Corp.* | 9,930 | 134,154 | ||||||
Harsco Corp. | 5,996 | 123,398 | ||||||
AGCO Corp.* | 2,140 | 91,956 | ||||||
|
| |||||||
Total Industrials | 4,893,384 | |||||||
|
| |||||||
INFORMATION TECHNOLOGY - 14.2% | ||||||||
Ingram Micro, Inc. — Class A* | 27,363 | 497,733 | ||||||
Avnet, Inc.* | 13,990 | 434,949 | ||||||
Arrow Electronics, Inc.* | 11,078 | 414,428 | ||||||
Tech Data Corp.* | 8,331 | 411,635 | ||||||
MEMC Electronic Materials, Inc.* | 97,230 | 383,086 | ||||||
Tellabs, Inc. | 64,728 | 261,501 | ||||||
Vishay Intertechnology, Inc.* | 22,140 | 199,039 | ||||||
Itron, Inc.* | 5,470 | 195,662 | ||||||
International Rectifier Corp.* | 7,010 | 136,134 | ||||||
CoreLogic, Inc.* | 8,677 | 112,194 | ||||||
Monster Worldwide, Inc.* | 13,440 | 106,579 | ||||||
Fairchild Semiconductor International, Inc. — Class A* | 7,710 | 92,828 | ||||||
|
| |||||||
Total Information Technology | 3,245,768 | |||||||
|
| |||||||
CONSUMER DISCRETIONARY - 13.7% | ||||||||
Collective Brands, Inc.* | 30,500 | 438,285 | ||||||
RadioShack Corp. | 29,470 | 286,154 | ||||||
Regis Corp. | 14,722 | 243,649 | ||||||
American Greetings Corp. — Class A | 19,289 | 241,305 | ||||||
Scholastic Corp. | 7,632 | 228,731 | ||||||
Barnes & Noble, Inc.* | 15,097 | 218,605 | ||||||
Office Depot, Inc.* | 101,270 | 217,730 | ||||||
New York Times Co. — Class A* | 26,230 | 202,758 | ||||||
Valassis Communications, Inc.* | 10,460 | 201,146 | ||||||
Thor Industries, Inc. | 6,970 | 191,187 | ||||||
Wendy’s Co. | 26,095 | 139,869 | ||||||
Mohawk Industries, Inc.* | 2,304 | 137,894 | ||||||
Saks, Inc.* | 14,110 | 137,572 | ||||||
KB Home | 19,310 | 129,763 | ||||||
Bob Evans Farms, Inc. | 3,320 | 111,353 | ||||||
|
| |||||||
Total Consumer Discretionary | 3,126,001 | |||||||
|
| |||||||
HEALTH CARE - 6.4% | ||||||||
Community Health Systems, Inc.* | 26,945 | 470,190 | ||||||
Health Net, Inc.* | 10,481 | 318,832 | ||||||
Owens & Minor, Inc. | 9,478 | 263,394 | ||||||
LifePoint Hospitals, Inc.* | 4,888 | 181,589 | ||||||
Health Management Associates, Inc. — Class A* | 16,310 | 120,205 | ||||||
Omnicare, Inc. | 3,367 | 115,993 | ||||||
|
| |||||||
Total Health Care | 1,470,203 | |||||||
|
| |||||||
MATERIALS - 5.3% | ||||||||
Commercial Metals Co. | 14,317 | 198,004 | ||||||
Steel Dynamics, Inc. | 13,150 | 172,923 | ||||||
Ashland, Inc. | 2,694 | 153,989 | ||||||
Reliance Steel & Aluminum Co. | 2,870 | 139,740 | ||||||
Worthington Industries, Inc. | 7,762 | 127,142 | ||||||
Greif, Inc. — Class A | 2,720 | 123,896 | ||||||
| 174 | THE RYDEX FUNDSANNUALREPORT | See Notes to Financial Statements. |
| SCHEDULE OF INVESTMENTS (concluded) | December 31, 2011 |
S&P MIDCAP 400 PURE VALUE FUND
| SHARES | VALUE | |||||||
Louisiana-Pacific Corp.* | 14,282 | $ | 115,256 | |||||
Cabot Corp. | 2,777 | 89,253 | ||||||
Cytec Industries, Inc. | 1,930 | 86,174 | ||||||
|
| |||||||
Total Materials | 1,206,377 | |||||||
|
| |||||||
CONSUMER STAPLES - 3.4% |
| |||||||
Smithfield Foods, Inc.* | 14,143 | 343,392 | ||||||
Universal Corp. | 6,467 | 297,223 | ||||||
Ruddick Corp. | 3,100 | 132,184 | ||||||
|
| |||||||
Total Consumer Staples | 772,799 | |||||||
|
| |||||||
ENERGY - 3.1% |
| |||||||
World Fuel Services Corp. | 6,240 | 261,955 | ||||||
HollyFrontier Corp. | 7,750 | 181,350 | ||||||
Arch Coal, Inc. | 7,160 | 103,892 | ||||||
Patriot Coal Corp.* | 10,790 | 91,391 | ||||||
Quicksilver Resources, Inc.* | 11,870 | 79,648 | ||||||
|
| |||||||
Total Energy | 718,236 | |||||||
|
| |||||||
UTILITIES - 2.1% |
| |||||||
UGI Corp. | 4,446 | 130,712 | ||||||
Great Plains Energy, Inc. | 5,993 | 130,528 | ||||||
N.V. Energy, Inc. | 7,079 | 115,742 | ||||||
Atmos Energy Corp. | 3,414 | 113,857 | ||||||
|
| |||||||
Total Utilities | 490,839 | |||||||
|
| |||||||
TELECOMMUNICATION SERVICES - 1.2% |
| |||||||
Telephone & Data Systems, Inc. | 10,747 | 278,240 | ||||||
|
| |||||||
Total Common Stocks | 22,785,974 | |||||||
|
| |||||||
WARRANTS†† - 0.0% |
| |||||||
Krispy Kreme Doughnuts, Inc. $12.21, 03/02/12* | 27 | 1 | ||||||
|
| |||||||
Total Warrants | 1 | |||||||
|
| |||||||
| FACE AMOUNT | ||||||||
REPURCHASE AGREEMENT††,1 - 0.9% | ||||||||
Credit Suisse Group | $ | 194,255 | 194,255 | |||||
|
| |||||||
Total Repurchase Agreement | 194,255 | |||||||
|
| |||||||
Total Investments – 100.4% | $ | 22,980,230 | ||||||
|
| |||||||
Liabilities, Less Other Assets – (0.4)% | (80,679 | ) | ||||||
|
| |||||||
Total Net Assets – 100.0% | $ | 22,899,551 | ||||||
| * | Non-income producing security. |
| † | Value determined based on Level 1 inputs — See Note 4. |
| †† | Value determined based on Level 2 inputs — See Note 4. |
| 1 | Repurchase Agreement — See Note 5. |
| See Notes to Financial Statements. | THE RYDEX FUNDSANNUALREPORT | 175 |
S&P MIDCAP 400 PURE VALUE FUND
STATEMENT OF ASSETS AND LIABILITIES
December 31, 2011
ASSETS: | ||||
Investments, at value | $ | 22,785,975 | ||
Repurchase agreements, at value | 194,255 | |||
|
| |||
Total investments | 22,980,230 | |||
Receivables: | ||||
Securities sold | 217,599 | |||
Dividends | 12,775 | |||
Fund shares sold | 39 | |||
|
| |||
Total assets | 23,210,643 | |||
|
| |||
LIABILITIES: | ||||
Payable for: | ||||
Securities purchased | 266,946 | |||
Management fees | 8,911 | |||
Transfer agent and administrative fees | 2,970 | |||
Investor service fees | 2,970 | |||
Fund shares redeemed | 1,996 | |||
Portfolio accounting fees | 1,188 | |||
Miscellaneous | 26,111 | |||
|
| |||
Total liabilities | 311,092 | |||
|
| |||
NETASSETS | $ | 22,899,551 | ||
|
| |||
NETASSETSCONSISTOF: | ||||
Paid in capital | $ | 26,485,336 | ||
Undistributed net investment income | — | |||
Accumulated net realized loss on investments | (4,948,142 | ) | ||
Net unrealized appreciation on investments | 1,362,357 | |||
|
| |||
Net assets | $ | 22,899,551 | ||
Capital shares outstanding | 310,423 | |||
Net asset value per share | $ | 73.77 | ||
|
|
STATEMENT OF OPERATIONS
Year Ended December 31, 2011
INVESTMENTINCOME: | ||||
Dividends | $ | 250,905 | ||
Interest | 29 | |||
|
| |||
Total investment income | 250,934 | |||
|
| |||
EXPENSES: | ||||
Management fees | 117,779 | |||
Transfer agent and administrative fees | 39,260 | |||
Investor service fees | 39,260 | |||
Portfolio accounting fees | 15,704 | |||
Custodian fees | 3,905 | |||
Trustees’ fees* | 1,638 | |||
Miscellaneous | 35,724 | |||
|
| |||
Total Expenses | 253,270 | |||
|
| |||
Net investment loss | (2,336 | ) | ||
|
| |||
NET REALIZEDAND UNREALIZED GAIN (LOSS): | ||||
Net realized gain (loss) on: | ||||
Investments | (407,767 | ) | ||
|
| |||
Net realized loss | (407,767 | ) | ||
|
| |||
Net change in unrealized appreciation (depreciation) on: | ||||
Investments | (1,069,872 | ) | ||
|
| |||
Net change in unrealized appreciation (depreciation) | (1,069,872 | ) | ||
|
| |||
Net realized and unrealized loss | (1,477,639 | ) | ||
|
| |||
Net decrease in net assets resulting from operations | $ | (1,479,975 | ) | |
|
|
| * | Relates to Trustees not deemed “interested persons” within the meaning of Section 2(a)(19) of the 1940 Act. |
| 176 | THE RYDEX FUNDSANNUALREPORT | See Notes to Financial Statements. |
S&P MIDCAP 400 PURE VALUE FUND
STATEMENTS OF CHANGES IN NET ASSETS
| Year Ended December 31, 2011 | Year Ended December 31, 2010 | |||||||
INCREASE (DECREASE)INNETASSETSFROMOPERATIONS: | ||||||||
Net investment loss | $ | (2,336 | ) | $ | (11,370 | ) | ||
Net realized gain (loss) on investments | (407,767 | ) | 2,255,787 | |||||
Net change in unrealized appreciation (depreciation) on investments | (1,069,872 | ) | (27,441 | ) | ||||
|
|
|
| |||||
Net increase (decrease) in net assets resulting from operations | (1,479,975 | ) | 2,216,976 | |||||
|
|
|
| |||||
DISTRIBUTIONSTOSHAREHOLDERSFROM: | ||||||||
Net investment income | — | (141,797 | ) | |||||
|
|
|
| |||||
Total distributions to shareholders | — | (141,797 | ) | |||||
|
|
|
| |||||
CAPITALSHARETRANSACTIONS: | ||||||||
Proceeds from sale of shares | 64,054,761 | 64,430,849 | ||||||
Distributions reinvested | — | 141,797 | ||||||
Cost of shares redeemed | (55,550,335 | ) | (80,279,065 | ) | ||||
|
|
|
| |||||
Net increase (decrease) from capital share transactions | 8,504,426 | (15,706,419 | ) | |||||
|
|
|
| |||||
Net increase (decrease) in net assets | 7,024,451 | (13,631,240 | ) | |||||
NETASSETS: | ||||||||
Beginning of year | 15,875,100 | 29,506,340 | ||||||
|
|
|
| |||||
End of year | $ | 22,899,551 | $ | 15,875,100 | ||||
|
|
|
| |||||
Undistributed net investment income at end of year | $ | — | $ | — | ||||
|
|
|
| |||||
CAPITALSHAREACTIVITY: | ||||||||
Shares sold | 816,848 | 899,338 | ||||||
Shares issued from reinvestment of distributions | — | 1,894 | ||||||
Shares redeemed | (706,250 | ) | (1,142,948 | ) | ||||
|
|
|
| |||||
Net increase (decrease) in shares | 110,598 | (241,716 | ) | |||||
|
|
|
| |||||
| See Notes to Financial Statements. | THE RYDEX FUNDSANNUALREPORT | 177 |
S&P MIDCAP 400 PURE VALUE FUND
FINANCIAL HIGHLIGHTS
This table is presented to show selected data for a share outstanding throughout each period, and to assist shareholders in evaluating a Fund’s performance for the periods presented.
| Year Ended December 31, 2011 | Year Ended December 31, 2010 | Year Ended December 31, 2009c | Year Ended December 31, 2008c | Year Ended December 31, 2007c | ||||||||||||||||
Per Share Data | ||||||||||||||||||||
Net asset value, beginning of period | $ | 79.45 | $ | 66.83 | $ | 43.46 | $ | 104.20 | $ | 111.90 | ||||||||||
|
|
|
|
|
|
|
|
|
| |||||||||||
Income (loss) from investment operations: | ||||||||||||||||||||
Net investment income (loss)a | (.01 | ) | (.03 | ) | .50 | 1.75 | 1.05 | |||||||||||||
Net gain (loss) on investments (realized and unrealized) | (5.67 | ) | 13.44 | 23.46 | (47.84 | ) | (6.45 | ) | ||||||||||||
|
|
|
|
|
|
|
|
|
| |||||||||||
Total from investment operations | (5.68 | ) | 13.41 | 23.96 | (46.09 | ) | (5.40 | ) | ||||||||||||
|
|
|
|
|
|
|
|
|
| |||||||||||
Less distributions from: | ||||||||||||||||||||
Net investment income | — | (.79 | ) | (.59 | ) | — | (2.20 | ) | ||||||||||||
Net realized gains | — | — | — | (14.65 | ) | (.10 | ) | |||||||||||||
|
|
|
|
|
|
|
|
|
| |||||||||||
Total distributions | — | (.79 | ) | (.59 | ) | (14.65 | ) | (2.30 | ) | |||||||||||
|
|
|
|
|
|
|
|
|
| |||||||||||
Net asset value, end of period | $ | 73.77 | $ | 79.45 | $ | 66.83 | $ | 43.46 | $ | 104.20 | ||||||||||
|
|
|
|
|
|
|
|
|
| |||||||||||
Total Returnb | (7.15 | %) | 20.13 | % | 55.22 | % | (43.63 | %) | (4.85 | %) | ||||||||||
|
|
|
|
|
|
|
|
|
| |||||||||||
Ratios/Supplemental Data | ||||||||||||||||||||
Net assets, end of period (in thousands) | $ | 22,900 | $ | 15,875 | $ | 29,506 | $ | 7,595 | $ | 15,998 | ||||||||||
|
|
|
|
|
|
|
|
|
| |||||||||||
Ratios to average net assets: | ||||||||||||||||||||
Net investment income (loss) | (0.01 | %) | (0.05 | %) | 0.90 | % | 2.06 | % | 0.87 | % | ||||||||||
Total expenses | 1.61 | % | 1.54 | % | 1.54 | % | 1.51 | % | 1.49 | % | ||||||||||
|
|
|
|
|
|
|
|
|
| |||||||||||
Portfolio turnover rate | 334 | % | 250 | % | 321 | % | 255 | % | 358 | % | ||||||||||
| a | Net investment income (loss) per share was computed using average shares outstanding throughout the period. |
| b | Total return does not reflect the impact of any additional fees charged by insurance companies and has not been annualized. |
| c | Per share amounts for the years ended December 31, 2007 – December 31, 2008 and the period January 1, 2009 through April 19, 2009 have been restated to reflect a 1:5 reverse stock split effective April 20, 2009. |
| 178 | THE RYDEX FUNDSANNUALREPORT | See Notes to Financial Statements. |
This page intentionally left blank.
| THE RYDEX FUNDSANNUALREPORT | 179 |
| PERFORMANCE REPORT AND FUND PROFILE (Unaudited) | December 31, 2011 |
S&P SMALLCAP 600 PURE GROWTH FUND
OBJECTIVE: Seeks to provide investment results that match, before fees and expenses, the performance of a benchmark for small-cap growth securities on a daily basis. The Fund’s current benchmark is the S&P SmallCap 600 Pure Growth Index (the “underlying index”).
For the year ended December 31, 2011, S&P SmallCap 600 Pure Growth Fund rose 3.52%, compared with a gain of 5.24% for the S&P SmallCap 600 Pure Growth Index.
Small-cap growth stocks significantly outperformed their value stock counterparts. The Health Care sector added the most to return, followed by Consumer Discretionary holdings. The Industrials and Consumer Staples sectors were the largest detractors from return.
The best-performing stocks in the S&P SmallCap 600 Pure Growth Index were Questcor Pharmaceuticals, Inc., Sturm Ruger & Co., Inc. and Liquidity Services, Inc. The weakest performers were Smith Micro Software, Inc., Medifast, Inc. and TriQuint Semiconductor, Inc.
The S&P SmallCap 600® Pure Growth Index is narrow in focus, containing only those S&P SmallCap 600 Index companies with strong growth characteristics as selected by S&P. The S&P SmallCap 600 Index measures the performance of the small-capitalization sector of the U.S. equity market.
Holdings Diversification (Market Exposure as % of Net Assets)
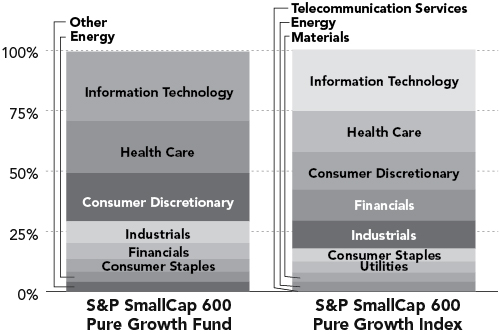
“Holdings Diversification (Market Exposure as % of Net Assets)” excludes any temporary cash investments.
Inception Date: May 3, 2004
Ten Largest Holdings | ||||
Buffalo Wild Wings, Inc. | 1.1 | % | ||
Healthspring, Inc. | 1.1 | % | ||
World Acceptance Corp. | 1.1 | % | ||
Hi-Tech Pharmacal Company, Inc. | 1.1 | % | ||
SEACOR Holdings, Inc. | 1.1 | % | ||
Coinstar, Inc. | 1.1 | % | ||
Allegiant Travel Co. | 1.1 | % | ||
American Science & Engineering, Inc. | 1.1 | % | ||
MWI Veterinary Supply, Inc. | 1.1 | % | ||
Magellan Health Services, Inc. | 1.1 | % | ||
|
| |||
Top Ten Total | 11.0 | % | ||
|
| |||
“Ten Largest Holdings” exclude any temporary cash or derivative investments.
180 | THE RYDEX FUNDSANNUALREPORT
PERFORMANCE REPORT AND FUND PROFILE (Unaudited) (concluded)
S&P SMALLCAP 600 PURE GROWTH FUND
Cumulative Fund Performance*
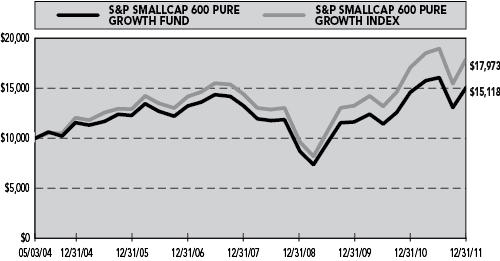
Average Annual Returns*
Periods Ended 12/31/11
| 1 Year | 5 Year | Since Inception (05/03/04) | ||||||||||
S&P SmallCap 600 Pure Growth Fund | 3.52 | % | 2.67 | % | 5.54 | % | ||||||
S&P SmallCap 600 Pure Growth Index | 5.24 | % | 4.84 | % | 7.95 | % | ||||||
| * | The performance data represents past performance that is not predictive of future results. The investment return and principal value of an investment in the Fund will fluctuate so that an investor’s shares, when redeemed, may be worth more or less than their original cost. Returns are historical and include changes in principal and reinvested dividends and capital gains and do not reflect the effect of taxes. The S&P SmallCap 600 Pure Growth Index is an unmanaged index and, unlike the Fund, has no management fees or operating expenses to reduce its reported return. |
Returns do not reflect the impact of any additional fees charged by insurance companies.
THE RYDEX FUNDSANNUALREPORT | 181
| SCHEDULE OF INVESTMENTS | December 31, 2011 |
S&P SMALLCAP 600 PURE GROWTH FUND
| SHARES | VALUE | |||||||
COMMON STOCKS† - 99.4% | ||||||||
INFORMATION TECHNOLOGY - 28.6% | ||||||||
Hittite Microwave Corp.* | 4,587 | $ | 226,506 | |||||
CACI International, Inc. — Class A* | 3,980 | 222,562 | ||||||
RightNow Technologies, Inc.* | 5,184 | 221,512 | ||||||
Veeco Instruments, Inc.* | 10,126 | 210,621 | ||||||
Cirrus Logic, Inc.* | 12,674 | 200,883 | ||||||
CommVault Systems, Inc.* | 4,614 | 197,110 | ||||||
LogMeIn, Inc.* | 4,980 | 191,979 | ||||||
Kulicke & Soffa Industries, Inc.* | 20,246 | 187,276 | ||||||
Sourcefire, Inc.* | 5,652 | 183,012 | ||||||
Power Integrations, Inc. | 5,245 | 173,924 | ||||||
Exar Corp.* | 26,530 | 172,445 | ||||||
MAXIMUS, Inc. | 4,158 | 171,933 | ||||||
Wright Express Corp.* | 3,107 | 168,648 | ||||||
MicroStrategy, Inc. — Class A* | 1,545 | 167,354 | ||||||
Volterra Semiconductor Corp.* | 6,427 | 164,595 | ||||||
Synaptics, Inc.* | 5,426 | 163,594 | ||||||
InfoSpace, Inc.* | 14,790 | 162,542 | ||||||
Ebix, Inc. | 7,007 | 154,855 | ||||||
Rubicon Technology, Inc.* | 16,104 | 151,217 | ||||||
DTS, Inc.* | 5,502 | 149,874 | ||||||
Entropic Communications, Inc.* | 28,836 | 147,352 | ||||||
Cognex Corp. | 4,070 | 145,665 | ||||||
Cabot Microelectronics Corp.* | 2,864 | 135,324 | ||||||
Littelfuse, Inc. | 3,111 | 133,711 | ||||||
Cymer, Inc.* | 2,680 | 133,357 | ||||||
Tyler Technologies, Inc.* | 4,335 | 130,527 | ||||||
Opnet Technologies, Inc. | 3,540 | 129,812 | ||||||
GT Advanced Technologies, Inc.* | 16,629 | 120,394 | ||||||
Higher One Holdings, Inc.* | 6,430 | 118,569 | ||||||
Websense, Inc.* | 5,822 | 109,046 | ||||||
MTS Systems Corp. | 2,580 | 105,135 | ||||||
OSI Systems, Inc.* | 2,125 | 103,658 | ||||||
JDA Software Group, Inc.* | 3,057 | 99,016 | ||||||
Viasat, Inc.* | 2,137 | 98,558 | ||||||
Stamps.com, Inc.* | 3,744 | 97,831 | ||||||
comScore, Inc.* | 4,590 | 97,308 | ||||||
Netscout Systems, Inc.* | 5,407 | 95,163 | ||||||
Interactive Intelligence Group, Inc.* | 4,139 | 94,866 | ||||||
Netgear, Inc.* | 2,713 | 91,075 | ||||||
Manhattan Associates, Inc.* | 2,190 | 88,651 | ||||||
j2 Global, Inc. | 3,087 | 86,868 | ||||||
Ceva, Inc.* | 2,848 | 86,180 | ||||||
Synchronoss Technologies, Inc.* | 2,721 | 82,201 | ||||||
LivePerson, Inc.* | 6,537 | 82,039 | ||||||
Forrester Research, Inc.* | 2,383 | 80,879 | ||||||
Blackbaud, Inc. | 2,781 | 77,034 | ||||||
FARO Technologies, Inc.* | 1,633 | 75,118 | ||||||
Liquidity Services, Inc.* | 1,703 | 62,841 | ||||||
Taleo Corp. — Class A* | 1,577 | 61,014 | ||||||
Global Payments, Inc. | 1 | 47 | ||||||
|
| |||||||
Total Information Technology | 6,611,681 | |||||||
|
| |||||||
HEALTH CARE - 21.7% | ||||||||
Healthspring, Inc.* | 4,760 | 259,610 | ||||||
Hi-Tech Pharmacal Company, Inc.* | 6,553 | 254,846 | ||||||
MWI Veterinary Supply, Inc.* | 3,659 | 243,104 | ||||||
Magellan Health Services, Inc.* | 4,911 | 242,947 | ||||||
SonoSite, Inc.* | 4,330 | 233,214 | ||||||
IPC The Hospitalist Company, Inc.* | 5,058 | 231,252 | ||||||
Corvel Corp.* | 4,311 | 222,922 | ||||||
ICU Medical, Inc.* | 4,730 | 212,850 | ||||||
Cubist Pharmaceuticals, Inc.* | 5,191 | 205,667 | ||||||
Haemonetics Corp.* | 3,311 | 202,699 | ||||||
Air Methods Corp.* | 2,333 | 197,022 | ||||||
Questcor Pharmaceuticals, Inc.* | 4,694 | 195,177 | ||||||
Computer Programs & Systems, Inc. | 3,710 | 189,618 | ||||||
Zoll Medical Corp.* | 2,945 | 186,065 | ||||||
Quality Systems, Inc. | 4,958 | 183,396 | ||||||
Chemed Corp. | 3,457 | 177,033 | ||||||
Cyberonics, Inc.* | 5,190 | 173,865 | ||||||
Medicines Co.* | 9,254 | 172,495 | ||||||
NuVasive, Inc.* | 13,570 | 170,846 | ||||||
Landauer, Inc. | 3,150 | 162,225 | ||||||
Analogic Corp. | 2,670 | 153,044 | ||||||
Viropharma, Inc.* | 5,576 | 152,727 | ||||||
Neogen Corp.* | 4,981 | 152,618 | ||||||
Ensign Group, Inc. | 5,688 | 139,356 | ||||||
Arqule, Inc.* | 21,259 | 119,901 | ||||||
Abaxis, Inc.* | 3,364 | 93,082 | ||||||
Salix Pharmaceuticals Ltd.* | 1,847 | 88,379 | ||||||
|
| |||||||
Total Health Care | 5,015,960 | |||||||
|
| |||||||
CONSUMER DISCRETIONARY - 20.0% |
| |||||||
Buffalo Wild Wings, Inc.* | 3,924 | 264,909 | ||||||
Coinstar, Inc.* | 5,485 | 250,335 | ||||||
American Public Education, Inc.* | 5,350 | 231,548 | ||||||
Capella Education Co.* | 6,167 | 222,320 | ||||||
Peet’s Coffee & Tea, Inc.* | 3,369 | 211,169 | ||||||
BJ’s Restaurants, Inc.* | 4,538 | 205,662 | ||||||
Biglari Holdings, Inc.* | 556 | 204,741 | ||||||
Jos A. Bank Clothiers, Inc.* | 4,109 | 200,355 | ||||||
Buckle, Inc. | 4,626 | 189,065 | ||||||
Steven Madden Ltd.* | 5,393 | 186,059 | ||||||
DineEquity, Inc.* | 4,359 | 183,993 | ||||||
True Religion Apparel, Inc.* | 5,081 | 175,701 | ||||||
Sturm Ruger & Company, Inc. | 5,182 | 173,390 | ||||||
Hibbett Sports, Inc.* | 3,778 | 170,690 | ||||||
Genesco, Inc.* | 2,740 | 169,168 | ||||||
Carter’s, Inc.* | 4,137 | 164,694 | ||||||
Monro Muffler Brake, Inc. | 4,209 | 163,267 | ||||||
| 182 | THE RYDEX FUNDSANNUALREPORT | See Notes to Financial Statements. |
| SCHEDULE OF INVESTMENTS (concluded) | December 31, 2011 |
S&P SMALLCAP 600 PURE GROWTH FUND
| SHARES | VALUE | |||||||
CEC Entertainment, Inc. | 4,706 | $ | 162,122 | |||||
National Presto Industries, Inc. | 1,710 | 160,056 | ||||||
iRobot Corp.* | 4,819 | 143,847 | ||||||
Vitamin Shoppe, Inc.* | 3,480 | 138,782 | ||||||
Rue21, Inc.* | 6,349 | 137,138 | ||||||
Childrens Place Retail Stores, Inc.* | 2,400 | 127,488 | ||||||
Papa John’s International, Inc.* | 2,870 | 108,142 | ||||||
Arbitron, Inc. | 3,087 | 106,224 | ||||||
Blue Nile, Inc.* | 2,309 | 94,392 | ||||||
Wolverine World Wide, Inc. | 2,270 | 80,903 | ||||||
|
| |||||||
Total Consumer Discretionary | 4,626,160 | |||||||
|
| |||||||
INDUSTRIALS - 9.0% | ||||||||
Allegiant Travel Co.* | 4,681 | 249,685 | ||||||
American Science & Engineering, Inc. | 3,643 | 248,125 | ||||||
Portfolio Recovery Associates, Inc.* | 3,435 | 231,931 | ||||||
Cubic Corp. | 4,470 | 194,847 | ||||||
Dolan Co.* | 20,303 | 172,982 | ||||||
Exponent, Inc.* | 3,268 | 150,230 | ||||||
Franklin Electric Company, Inc. | 2,910 | 126,760 | ||||||
Toro Co. | 2,020 | 122,533 | ||||||
AZZ, Inc. | 2,540 | 115,418 | ||||||
Teledyne Technologies, Inc.* | 2,050 | 112,443 | ||||||
Lindsay Corp. | 1,812 | 99,461 | ||||||
II-VI, Inc.* | 5,078 | 93,232 | ||||||
Aerovironment, Inc.* | 2,624 | 82,577 | ||||||
Forward Air Corp. | 2,310 | 74,036 | ||||||
|
| |||||||
Total Industrials | 2,074,260 | |||||||
|
| |||||||
FINANCIALS - 6.6% | ||||||||
World Acceptance Corp.* | 3,488 | 256,368 | ||||||
Infinity Property & Casualty Corp. | 3,411 | 193,540 | ||||||
Cash America International, Inc. | 3,922 | 182,883 | ||||||
Financial Engines, Inc.* | 6,680 | 149,164 | ||||||
Ezcorp, Inc. — Class A* | 5,474 | 144,349 | ||||||
ProAssurance Corp. | 1,650 | 131,703 | ||||||
RLI Corp. | 1,450 | 105,647 | ||||||
Mid-America Apartment Communities, Inc. | 1,570 | 98,204 | ||||||
First Cash Financial Services, Inc.* | 2,674 | 93,831 | ||||||
PS Business Parks, Inc. | 1,680 | 93,122 | ||||||
EastGroup Properties, Inc. | 1,686 | 73,307 | ||||||
|
| |||||||
Total Financials | 1,522,118 | |||||||
|
| |||||||
CONSUMER STAPLES - 5.3% | ||||||||
Boston Beer Company, Inc. – Class A* | 2,020 | 219,291 | ||||||
TreeHouse Foods, Inc.* | 3,155 | 206,274 | ||||||
Sanderson Farms, Inc. | 4,080 | 204,530 | ||||||
Casey’s General Stores, Inc. | 3,968 | 204,392 | ||||||
J&J Snack Foods Corp. | 3,100 | 165,168 | ||||||
Medifast, Inc.* | 9,569 | 131,287 | ||||||
WD-40 Co. | 2,104 | 85,023 | ||||||
|
| |||||||
Total Consumer Staples | 1,215,965 | |||||||
|
| |||||||
ENERGY - 4.0% | ||||||||
SEACOR Holdings, Inc.* | 2,823 | 251,134 | ||||||
Contango Oil & Gas Co.* | 3,618 | 210,495 | ||||||
GeoResources, Inc.* | 5,940 | 174,101 | ||||||
Lufkin Industries, Inc. | 1,650 | 111,062 | ||||||
Approach Resources, Inc. | 3,180 | 93,524 | ||||||
OYO Geospace Corp.* | 1,110 | 85,836 | ||||||
|
| |||||||
Total Energy | 926,152 | |||||||
|
| |||||||
MATERIALS - 2.5% | ||||||||
Hawkins, Inc. | 4,577 | 168,708 | ||||||
Balchem Corp. | 3,723 | 150,930 | ||||||
Deltic Timber Corp. | 2,210 | 133,462 | ||||||
Schweitzer-Mauduit International, Inc. | 1,870 | 124,280 | ||||||
|
| |||||||
Total Materials | 577,380 | |||||||
|
| |||||||
UTILITIES - 0.9% | ||||||||
South Jersey Industries, Inc. | 1,890 | 107,371 | ||||||
American States Water Co. | 2,640 | 92,136 | ||||||
|
| |||||||
Total Utilities | 199,507 | |||||||
|
| |||||||
TELECOMMUNICATION SERVICES - 0.8% |
| |||||||
Atlantic Tele-Network, Inc. | 4,670 | 182,364 | ||||||
|
| |||||||
Total Common Stocks | 22,951,547 | |||||||
|
| |||||||
| FACE AMOUNT | ||||||||
REPURCHASE AGREEMENT††,1 - 0.7% |
| |||||||
Credit Suisse Group | $ | 155,653 | 155,653 | |||||
|
| |||||||
Total Repurchase Agreement | 155,653 | |||||||
|
| |||||||
Total Investments — 100.1% | $ | 23,107,200 | ||||||
|
| |||||||
Liabilities, Less Other Assets — (0.1)% |
| (21,017 | ) | |||||
|
| |||||||
Total Net Assets — 100.0% | $ | 23,086,183 | ||||||
| * | Non-income producing security. |
| † | Value determined based on Level 1 inputs — See Note 4. |
| †† | Value determined based on Level 2 inputs — See Note 4. |
| 1 | Repurchase Agreement — See Note 5. |
| See Notes to Financial Statements. | THE RYDEX FUNDSANNUALREPORT | 183 |
S&P SMALLCAP 600 PURE GROWTH FUND
STATEMENT OF ASSETS AND LIABILITIES
December 31, 2011
ASSETS: | ||||
Investments, at value | $ | 22,951,547 | ||
Repurchase agreements, at value | 155,653 | |||
|
| |||
Total investments | 23,107,200 | |||
Receivables: | ||||
Fund shares sold | 2,405,633 | |||
Dividends | 4,003 | |||
|
| |||
Total assets | 25,516,836 | |||
|
| |||
LIABILITIES: | ||||
Payable for: | ||||
Securities purchased | 1,964,684 | |||
Fund shares redeemed | 409,886 | |||
Management fees | 11,171 | |||
Transfer agent and administrative fees | 3,724 | |||
Investor service fees | 3,724 | |||
Portfolio accounting fees | 1,490 | |||
Miscellaneous | 35,974 | |||
|
| |||
Total liabilities | 2,430,653 | |||
|
| |||
NETASSETS | $ | 23,086,183 | ||
|
| |||
NETASSETSCONSISTOF: | ||||
Paid in capital | $ | 27,769,226 | ||
Undistributed net investment income | — | |||
Accumulated net realized loss on investments | (7,335,375 | ) | ||
Net unrealized appreciation on investments | 2,652,332 | |||
|
| |||
Net assets | $ | 23,086,183 | ||
Capital shares outstanding | 746,654 | |||
Net asset value per share | $ | 30.92 | ||
|
|
STATEMENT OF OPERATIONS
Year Ended December 31, 2011
INVESTMENTINCOME: | ||||
Dividends | $ | 69,161 | ||
Interest | 54 | |||
|
| |||
Total investment income | 69,215 | |||
|
| |||
EXPENSES: | ||||
Management fees | 157,103 | |||
Transfer agent and administrative fees | 52,368 | |||
Investor service fees | 52,368 | |||
Portfolio accounting fees | 20,947 | |||
Custodian fees | 5,152 | |||
Trustees’ fees* | 2,223 | |||
Miscellaneous | 47,940 | |||
|
| |||
Total Expenses | 338,101 | |||
|
| |||
Net investment loss | (268,886 | ) | ||
|
| |||
NET REALIZEDAND UNREALIZED GAIN (LOSS): | ||||
Net realized gain (loss) on: | ||||
Investments | 724,289 | |||
|
| |||
Net realized gain | 724,289 | |||
|
| |||
Net change in unrealized appreciation (depreciation) on: | ||||
Investments | (2,018,590 | ) | ||
|
| |||
Net change in unrealized appreciation (depreciation) | (2,018,590 | ) | ||
|
| |||
Net realized and unrealized loss | (1,294,301 | ) | ||
|
| |||
Net decrease in net assets resulting from operations | $ | (1,563,187 | ) | |
|
|
| * | Relates to Trustees not deemed “interested persons” within the meaning of Section 2(a)(19) of the 1940 Act. |
| 184 | THE RYDEX FUNDSANNUALREPORT | See Notes to Financial Statements. |
S&P SMALLCAP 600 PURE GROWTH FUND
STATEMENTS OF CHANGES IN NET ASSETS
| Year Ended December 31, 2011 | Year Ended December 31, 2010 | |||||||
INCREASE (DECREASE) IN NET ASSETS FROM OPERATIONS: | ||||||||
Net investment loss | $ | (268,886 | ) | $ | (146,349 | ) | ||
Net realized gain on investments | 724,289 | 881,785 | ||||||
Net change in unrealized appreciation (depreciation) on investments | (2,018,590 | ) | 2,039,219 | |||||
|
|
|
| |||||
Net increase (decrease) in net assets resulting from operations | (1,563,187 | ) | 2,774,655 | |||||
|
|
|
| |||||
CAPITALSHARETRANSACTIONS: | ||||||||
Proceeds from sale of shares | 88,067,125 | 96,754,486 | ||||||
Cost of shares redeemed | (91,337,235 | ) | (85,165,739 | ) | ||||
|
|
|
| |||||
Net increase (decrease) from capital share transactions | (3,270,110 | ) | 11,588,747 | |||||
|
|
|
| |||||
Net increase (decrease) in net assets | (4,833,297 | ) | 14,363,402 | |||||
NETASSETS: | ||||||||
Beginning of year | 27,919,480 | 13,556,078 | ||||||
|
|
|
| |||||
End of year | $ | 23,086,183 | $ | 27,919,480 | ||||
|
|
|
| |||||
Undistributed net investment income at end of year | $ | — | $ | — | ||||
|
|
|
| |||||
CAPITALSHAREACTIVITY: | ||||||||
Shares sold | 2,822,439 | 3,748,828 | ||||||
Shares redeemed | (3,010,338 | ) | (3,383,275 | ) | ||||
|
|
|
| |||||
Net increase (decrease) in shares | (187,899 | ) | 365,553 | |||||
|
|
|
| |||||
| See Notes to Financial Statements. | THE RYDEX FUNDSANNUALREPORT | 185 |
S&P SMALLCAP 600 PURE GROWTH FUND
FINANCIAL HIGHLIGHTS
This table is presented to show selected data for a share outstanding throughout each period, and to assist shareholders in evaluating a Fund’s performance for the periods presented.
| Year Ended December 31, 2011 | Year Ended December 31, 2010 | Year Ended December 31, 2009 | Year Ended December 31, 2008 | Year Ended December 31, 2007 | ||||||||||||||||
Per Share Data | ||||||||||||||||||||
Net asset value, beginning of period | $ | 29.87 | $ | 23.82 | $ | 17.78 | $ | 27.07 | $ | 29.92 | ||||||||||
|
|
|
|
|
|
|
|
|
| |||||||||||
Income (loss) from investment operations: | ||||||||||||||||||||
Net investment lossa | (.40 | ) | (.25 | ) | (.23 | ) | (.01 | ) | (.28 | ) | ||||||||||
Net gain (loss) on investments (realized and unrealized) | 1.45 | 6.30 | 6.27 | (9.28 | ) | .30 | ||||||||||||||
|
|
|
|
|
|
|
|
|
| |||||||||||
Total from investment operations | 1.05 | 6.05 | 6.04 | (9.29 | ) | .02 | ||||||||||||||
|
|
|
|
|
|
|
|
|
| |||||||||||
Less distributions from: | ||||||||||||||||||||
Net realized gains | — | — | — | — | (2.87 | ) | ||||||||||||||
|
|
|
|
|
|
|
|
|
| |||||||||||
Total distributions | — | — | — | — | (2.87 | ) | ||||||||||||||
|
|
|
|
|
|
|
|
|
| |||||||||||
Net asset value, end of period | $ | 30.92 | $ | 29.87 | $ | 23.82 | $ | 17.78 | $ | 27.07 | ||||||||||
|
|
|
|
|
|
|
|
|
| |||||||||||
Total Returnb | 3.52 | % | 25.40 | % | 33.97 | % | (34.32 | %) | (0.11 | %) | ||||||||||
|
|
|
|
|
|
|
|
|
| |||||||||||
Ratios/Supplemental Data | ||||||||||||||||||||
Net assets, end of period (in thousands) | $ | 23,086 | $ | 27,919 | $ | 13,556 | $ | 13,717 | $ | 12,428 | ||||||||||
|
|
|
|
|
|
|
|
|
| |||||||||||
Ratios to average net assets: | ||||||||||||||||||||
Net investment loss | (1.28 | %) | (0.96 | %) | (1.13 | %) | (0.04 | %) | (0.90 | %) | ||||||||||
Total expenses | 1.61 | % | 1.57 | % | 1.56 | % | 1.52 | % | 1.49 | % | ||||||||||
|
|
|
|
|
|
|
|
|
| |||||||||||
Portfolio turnover rate | 358 | % | 529 | % | 633 | % | 465 | % | 573 | % | ||||||||||
| a | Net investment loss per share was computed using average shares outstanding throughout the period. |
| b | Total return does not reflect the impact of any additional fees charged by insurance companies and has not been annualized. |
| 186 | THE RYDEX FUNDSANNUALREPORT | See Notes to Financial Statements. |
This page intentionally left blank.
| THE RYDEX FUNDSANNUALREPORT | 187 |
| PERFORMANCE REPORT AND FUND PROFILE (Unaudited) | December 31, 2011 | |||
|
OBJECTIVE: Seeks to provide investment results that match, before fees and expenses, the performance of a benchmark for small-cap value securities on a daily basis. The Fund’s current benchmark is the S&P SmallCap 600 Pure Value Index (the “underlying index”).
For the year ended December 31, 2011, S&P SmallCap 600 Pure Value Fund returned -9.44%, compared with a return of -7.48% for the S&P SmallCap 600 Pure Value Index.
Small-cap value stocks significantly underperformed their small-cap growth stock counterparts. The sectors contributing the most to return were the Utilities and Health Care sectors. Sectors detracting the most from return were the Consumer Discretionary, Information Technology and Financials sectors.
The stocks contributing the most to return in the S&P SmallCap 600 Pure Value Index were SWS Group, Inc., Lithia Motors, Inc. and Kendle International, Inc. Those detracting the most from return were School Specialty, Inc., Corinthian Colleges, Inc. and Christopher & Banks Corp.
The S&P SmallCap 600® Pure Value Index is narrow in focus, containing only those S&P SmallCap 600 Index companies with strong value characteristics as selected by S&P. The S&P SmallCap 600 Index measures the performance of the small-capitalization sector of the U.S. equity market.
Holdings Diversification (Market Exposure as % of Net Assets)
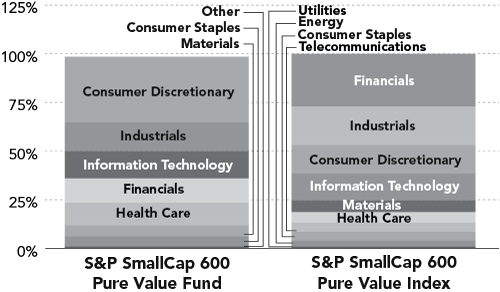
“Holdings Diversification (Market Exposure as % of Net Assets)” excludes any temporary cash investments.
Inception Date: May 3, 2004
| Ten Largest Holdings | ||||
(% of Total Net Assets) | ||||
Gentiva Health Services, Inc. | 1.7 | % | ||
Career Education Corp. | 1.6 | % | ||
VOXX International Corp. | 1.6 | % | ||
Tuesday Morning Corp. | 1.6 | % | ||
SkyWest, Inc. | 1.5 | % | ||
Amedisys, Inc. | 1.5 | % | ||
Healthways, Inc. | 1.4 | % | ||
Kindred Healthcare, Inc. | 1.4 | % | ||
Boyd Gaming Corp. | 1.4 | % | ||
Lincoln Educational Services Corp. | 1.4 | % | ||
|
| |||
Top Ten Total | 15.1 | % | ||
|
| |||
“Ten Largest Holdings” exclude any temporary cash or derivative investments.
188 | THE RYDEX FUNDSANNUALREPORT
PERFORMANCE REPORT AND FUND PROFILE (Unaudited) (concluded)
S&P SMALLCAP 600 PURE VALUE FUND
Cumulative Fund Performance*
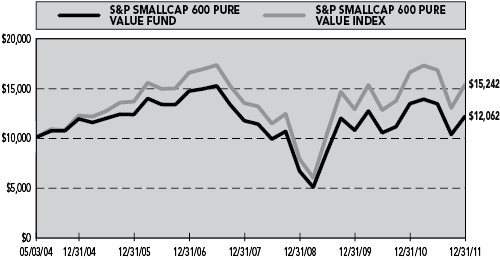
Average Annual Returns*
Periods Ended 12/31/11
| 1 Year | 5 Year | Since Inception (05/03/04) | ||||||||||
S&P SmallCap 600 Pure Value Fund | -9.44 | % | – | 3.72 | % | 2.48 | % | |||||
S&P SmallCap 600 Pure Value Index | -7.48 | % | – | 1.50 | % | 5.65 | % | |||||
| * | The performance data represents past performance that is not predictive of future results. The investment return and principal value of an investment in the Fund will fluctuate so that an investor’s shares, when redeemed, may be worth more or less than their original cost. Returns are historical and include changes in principal and reinvested dividends and capital gains and do not reflect the effect of taxes. The S&P SmallCap 600 Pure Value Index is an unmanaged index and, unlike the Fund, has no management fees or operating expenses to reduce its reported return. |
| Returns do not reflect the impact of any additional fees charged by insurance companies. |
THE RYDEX FUNDSANNUALREPORT | 189
| SCHEDULE OF INVESTMENTS | December 31, 2011 | |||
S&P SMALLCAP 600 PURE VALUE FUND
| ||||
| SHARES | VALUE | |||||||
COMMON STOCKS† - 99.5% | ||||||||
CONSUMER DISCRETIONARY - 33.7% |
| |||||||
Career Education Corp.* | 25,619 | $ | 204,183 | |||||
VOXX International Corp.* | 24,136 | 203,949 | ||||||
Tuesday Morning Corp.* | 58,745 | 202,670 | ||||||
Boyd Gaming Corp.* | 24,091 | 179,719 | ||||||
Lincoln Educational Services Corp. | 22,309 | 176,241 | ||||||
Perry Ellis International, Inc.* | 12,350 | 175,617 | ||||||
Marriott Vacations Worldwide Corp.* | 9,338 | 160,240 | ||||||
OfficeMax, Inc.* | 34,301 | 155,726 | ||||||
Brown Shoe Company, Inc. | 16,327 | 145,310 | ||||||
Skechers U.S.A., Inc. — Class A* | 11,660 | 141,319 | ||||||
MarineMax, Inc.* | 21,279 | 138,739 | ||||||
Stein Mart, Inc.* | 19,385 | 132,012 | ||||||
Big 5 Sporting Goods Corp. | 12,207 | 127,441 | ||||||
Quiksilver, Inc.* | 34,878 | 125,910 | ||||||
Stage Stores, Inc. | 8,358 | 116,093 | ||||||
Ruby Tuesday, Inc.* | 16,706 | 115,271 | ||||||
Sonic Automotive, Inc. — Class A | 7,159 | 106,025 | ||||||
Fred’s, Inc. — Class A | 7,237 | 105,515 | ||||||
Group 1 Automotive, Inc. | 1,854 | 96,037 | ||||||
PEP Boys-Manny Moe & Jack | 8,681 | 95,491 | ||||||
Callaway Golf Co. | 17,075 | 94,425 | ||||||
Spartan Motors, Inc. | 19,440 | 93,506 | ||||||
Coldwater Creek, Inc.* | 68,744 | 81,118 | ||||||
Digital Generation, Inc.* | 6,661 | 79,399 | ||||||
Lithia Motors, Inc. — Class A | 3,120 | 68,203 | ||||||
Christopher & Banks Corp. | 28,772 | 67,326 | ||||||
Zale Corp.* | 17,364 | 66,157 | ||||||
Superior Industries International, Inc. | 3,939 | 65,151 | ||||||
M/I Homes, Inc.* | 6,750 | 64,800 | ||||||
Corinthian Colleges, Inc.* | 28,965 | 62,854 | ||||||
Standard Pacific Corp.* | 19,120 | 60,802 | ||||||
Winnebago Industries, Inc.* | 8,120 | 59,926 | ||||||
Haverty Furniture Companies, Inc. | 5,233 | 57,458 | ||||||
O’Charleys, Inc.* | 9,967 | 54,719 | ||||||
EW Scripps Co. — Class A* | 6,598 | 52,850 | ||||||
La-Z-Boy, Inc.* | 3,933 | 46,803 | ||||||
School Specialty, Inc.* | 16,676 | 41,690 | ||||||
Universal Electronics, Inc.* | 2,433 | 41,045 | ||||||
Harte-Hanks, Inc. | 4,120 | 37,451 | ||||||
Live Nation Entertainment, Inc.* | 4,324 | 35,932 | ||||||
Ruth’s Hospitality Group, Inc.* | 7,060 | 35,088 | ||||||
Red Robin Gourmet Burgers, Inc.* | 1,144 | 31,689 | ||||||
Jack in the Box, Inc.* | 1,469 | 30,702 | ||||||
Cabela’s, Inc.* | 1,180 | 29,996 | ||||||
Jakks Pacific, Inc. | 2,080 | 29,349 | ||||||
|
| |||||||
Total Consumer Discretionary | 4,291,947 | |||||||
|
| |||||||
INDUSTRIALS - 14.8% | ||||||||
SkyWest, Inc. | 15,633 | 196,819 | ||||||
Orion Marine Group, Inc.* | 21,343 | 141,931 | ||||||
Kelly Services, Inc. — Class A | 9,685 | 132,491 | ||||||
AAR Corp. | 6,115 | 117,225 | ||||||
Universal Forest Products, Inc. | 3,707 | 114,435 | ||||||
CDI Corp. | 6,983 | 96,435 | ||||||
Griffon Corp. | 9,976 | 91,081 | ||||||
Standard Register Co. | 38,004 | 88,549 | ||||||
Lawson Products, Inc. | 5,427 | 83,739 | ||||||
Briggs & Stratton Corp. | 5,110 | 79,154 | ||||||
ABM Industries, Inc. | 3,384 | 69,778 | ||||||
Arkansas Best Corp. | 3,610 | 69,565 | ||||||
Comfort Systems USA, Inc. | 6,115 | 65,553 | ||||||
United Stationers, Inc. | 2,003 | 65,218 | ||||||
Lydall, Inc.* | 6,872 | 65,215 | ||||||
Aegion Corp.* | 4,060 | 62,280 | ||||||
Viad Corp. | 3,000 | 52,440 | ||||||
EnerSys* | 1,970 | 51,161 | ||||||
G&K Services, Inc. — Class A | 1,440 | 41,918 | ||||||
Apogee Enterprises, Inc. | 3,248 | 39,820 | ||||||
EMCOR Group, Inc. | 1,437 | 38,526 | ||||||
Geo Group, Inc.* | 1,940 | 32,495 | ||||||
Standex International Corp. | 950 | 32,452 | ||||||
Powell Industries, Inc.* | 1,035 | 32,375 | ||||||
Insperity, Inc. | 1,260 | 31,941 | ||||||
|
| |||||||
Total Industrials | 1,892,596 | |||||||
|
| |||||||
INFORMATION TECHNOLOGY - 14.1% | ||||||||
SYNNEX Corp.* | 4,608 | 140,360 | ||||||
Benchmark Electronics, Inc.* | 9,307 | 125,365 | ||||||
NCI, Inc.* | 10,537 | 122,756 | ||||||
Insight Enterprises, Inc.* | 7,900 | 120,791 | ||||||
Black Box Corp. | 4,273 | 119,815 | ||||||
Radisys Corp.* | 19,613 | 99,242 | ||||||
Sigma Designs, Inc.* | 14,259 | 85,554 | ||||||
United Online, Inc. | 15,385 | 83,694 | ||||||
Intevac, Inc.* | 10,561 | 78,151 | ||||||
Brightpoint, Inc.* | 7,104 | 76,439 | ||||||
Scansource, Inc.* | 1,960 | 70,560 | ||||||
Cohu, Inc. | 6,078 | 68,985 | ||||||
Checkpoint Systems, Inc.* | 5,900 | 64,546 | ||||||
CTS Corp. | 6,904 | 63,517 | ||||||
Novatel Wireless, Inc.* | 17,378 | 54,393 | ||||||
Pericom Semiconductor Corp.* | 6,581 | 50,081 | ||||||
Avid Technology, Inc.* | 5,722 | 48,809 | ||||||
Bel Fuse, Inc. — Class B | 2,495 | 46,781 | ||||||
Plexus Corp.* | 1,660 | 45,451 | ||||||
CIBER, Inc.* | 11,660 | 45,008 | ||||||
TTM Technologies, Inc.* | 4,058 | 44,476 | ||||||
Advanced Energy Industries, Inc.* | 3,960 | 42,491 | ||||||
Anixter International, Inc.* | 676 | 40,317 | ||||||
THQ, Inc.* | 46,822 | 35,585 | ||||||
DSP Group, Inc.* | 5,410 | 28,186 | ||||||
|
| |||||||
Total Information Technology | 1,801,353 | |||||||
|
| |||||||
FINANCIALS - 12.4% | ||||||||
Stewart Information Services Corp. | 12,802 | 147,863 | ||||||
Horace Mann Educators Corp. | 10,324 | 141,542 | ||||||
| 190 | THE RYDEX FUNDSANNUALREPORT | See Notes to Financial Statements. |
| SCHEDULE OF INVESTMENTS (concluded) | December 31, 2011 | |||
S&P SMALLCAP 600 PURE VALUE FUND
|
| SHARES | VALUE | |||||||
Piper Jaffray Cos.* | 5,104 | $ | 103,101 | |||||
Delphi Financial Group, Inc. — Class A | 2,067 | 91,568 | ||||||
Investment Technology Group, Inc.* | 8,127 | 87,853 | ||||||
Presidential Life Corp. | 8,468 | 84,595 | ||||||
Selective Insurance Group, Inc. | 4,705 | 83,420 | ||||||
Tower Group, Inc. | 4,120 | 83,100 | ||||||
United Fire & Casualty Co. | 3,727 | 75,211 | ||||||
Susquehanna Bancshares, Inc. | 8,188 | 68,615 | ||||||
First Commonwealth Financial Corp. | 12,760 | 67,118 | ||||||
Meadowbrook Insurance Group, Inc. | 5,675 | 60,609 | ||||||
First BanCorp.* | 17,060 | 59,539 | ||||||
SWS Group, Inc. | 8,172 | 56,142 | ||||||
Wintrust Financial Corp. | 1,879 | 52,706 | ||||||
Cedar Realty Trust, Inc. | 11,072 | 47,720 | ||||||
Parkway Properties, Inc. | 4,609 | 45,445 | ||||||
Safety Insurance Group, Inc. | 1,056 | 42,747 | ||||||
PrivateBancorp, Inc. | 3,698 | 40,604 | ||||||
United Community Banks, Inc.* | 5,626 | 39,326 | ||||||
Calamos Asset Management, Inc. | 3,030 | 37,905 | ||||||
National Financial Partners Corp.* | 2,370 | 32,042 | ||||||
Prospect Capital Corp. | 3,361 | 31,224 | ||||||
|
| |||||||
Total Financials | 1,579,995 | |||||||
|
| |||||||
HEALTH CARE - 11.5% | ||||||||
Gentiva Health Services, Inc.* | 31,772 | 214,461 | ||||||
Amedisys, Inc.* | 17,174 | 187,368 | ||||||
Healthways, Inc.* | 26,807 | 183,896 | ||||||
Kindred Healthcare, Inc.* | 15,390 | 181,140 | ||||||
Almost Family, Inc.* | 8,182 | 135,658 | ||||||
Cross Country Healthcare, Inc.* | 22,107 | 122,694 | ||||||
Molina Healthcare, Inc.* | 4,762 | 106,335 | ||||||
PharMerica Corp.* | 6,782 | 102,951 | ||||||
LHC Group, Inc.* | 7,480 | 95,968 | ||||||
Invacare Corp. | 3,668 | 56,084 | ||||||
Symmetry Medical, Inc.* | 5,577 | 44,560 | ||||||
Natus Medical, Inc.* | 4,000 | 37,720 | ||||||
|
| |||||||
Total Health Care | 1,468,835 | |||||||
|
| |||||||
MATERIALS - 5.7% | ||||||||
OM Group, Inc.* | 5,600 | 125,384 | ||||||
A. Schulman, Inc. | 4,742 | 100,436 | ||||||
Wausau Paper Corp. | 9,704 | 80,155 | ||||||
Olympic Steel, Inc. | 3,340 | 77,889 | ||||||
Materion Corp.* | 3,140 | 76,239 | ||||||
PolyOne Corp. | 5,810 | �� | 67,105 | |||||
Neenah Paper, Inc. | 2,740 | 61,157 | ||||||
AM Castle & Co.* | 5,867 | 55,502 | ||||||
Century Aluminum Co.* | 6,290 | 53,528 | ||||||
AK Steel Holding Corp. | 4,110 | 33,949 | ||||||
|
| |||||||
Total Materials | 731,344 | |||||||
|
| |||||||
CONSUMER STAPLES - 5.2% | ||||||||
Seneca Foods Corp. — Class A* | 6,530 | 168,605 | ||||||
Nash Finch Co. | 5,196 | 152,139 | ||||||
Spartan Stores, Inc. | 6,116 | 113,146 | ||||||
Central Garden and Pet Co. — Class A* | 12,267 | 102,061 | ||||||
Andersons, Inc. | 2,250 | 98,235 | ||||||
Alliance One International, Inc.* | 12,179 | 33,127 | ||||||
|
| |||||||
Total Consumer Staples | 667,313 | |||||||
|
| |||||||
ENERGY - 1.8% | ||||||||
Exterran Holdings, Inc.* | 10,380 | 94,458 | ||||||
Matrix Service Co.* | 8,179 | 77,210 | ||||||
Overseas Shipholding Group, Inc. | 5,230 | 57,164 | ||||||
|
| |||||||
Total Energy | 228,832 | |||||||
|
| |||||||
UTILITIES - 0.3% | ||||||||
Laclede Group, Inc. | 849 | 34,359 | ||||||
|
| |||||||
Total Common Stocks | 12,696,574 | |||||||
|
| |||||||
| FACE AMOUNT | ||||||||
REPURCHASE AGREEMENT††,1 - 0.8% | ||||||||
Credit Suisse Group issued 12/30/11 at 0.00%due 01/03/12 | $ | 102,235 | 102,235 | |||||
|
| |||||||
Total Repurchase Agreement | 102,235 | |||||||
|
| |||||||
Total Investments - 100.3% | $ | 12,798,809 | ||||||
|
| |||||||
Liabilities, Less Other Assets - (0.3)% | (42,232 | ) | ||||||
|
| |||||||
Total Net Assets - 100.0% | $ | 12,756,577 | ||||||
| * | Non-income producing security. |
| † | Value determined based on Level 1 inputs — See Note 4. |
| †† | Value determined based on Level 2 inputs — See Note 4. |
| 1 | Repurchase Agreement — See Note 5. |
| See Notes to Financial Statements. | THE RYDEX FUNDSANNUALREPORT | 191 |
S&P SMALLCAP 600 PURE VALUE FUND
STATEMENT OF ASSETS AND LIABILITIES
December 31, 2011
ASSETS: | ||||
Investments, at value | $ | 12,696,574 | ||
Repurchase agreements, at value | 102,235 | |||
|
| |||
Total investments | 12,798,809 | |||
Receivables: | ||||
Securities sold | 270,766 | |||
Fund shares sold | 13,055 | |||
Dividends | 6,305 | |||
|
| |||
Total assets | 13,088,935 | |||
|
| |||
LIABILITIES: | ||||
Payable for: | ||||
Fund shares redeemed | 203,681 | |||
Securities purchased | 95,914 | |||
Management fees | 6,583 | |||
Transfer agent and administrative fees | 2,194 | |||
Investor service fees | 2,194 | |||
Portfolio accounting fees | 878 | |||
Miscellaneous | 20,914 | |||
|
| |||
Total liabilities | 332,358 | |||
|
| |||
NETASSETS | $ | 12,756,577 | ||
|
| |||
NETASSETSCONSISTOF: | ||||
Paid in capital | $ | 17,571,571 | ||
Accumulated net investment loss | (1 | ) | ||
Accumulated net realized loss on investments | (5,893,263 | ) | ||
Net unrealized appreciation on investments | 1,078,270 | |||
|
| |||
Net assets | $ | 12,756,577 | ||
Capital shares outstanding | 138,116 | |||
Net asset value per share | $ | 92.36 | ||
|
|
STATEMENT OF OPERATIONS
Year Ended December 31, 2011
INVESTMENT INCOME: | ||||
Dividends | $ | 98,654 | ||
Interest | 29 | |||
|
| |||
Total investment income | 98,683 | |||
|
| |||
EXPENSES: | ||||
Management fees | 85,711 | |||
Transfer agent and administrative fees | 28,570 | |||
Investor service fees | 28,570 | |||
Portfolio accounting fees | 11,428 | |||
Custodian fees | 2,964 | |||
Trustees’ fees* | 1,228 | |||
Miscellaneous | 26,341 | |||
|
| |||
Total expenses | 184,812 | |||
|
| |||
Net investment loss | (86,129 | ) | ||
|
| |||
NET REALIZEDAND UNREALIZED GAIN (LOSS): | ||||
Net realized gain (loss) on: | ||||
Investments | 1,049,265 | |||
|
| |||
Net realized gain | 1,049,265 | |||
|
| |||
Net change in unrealized appreciation (depreciation) on: | ||||
Investments | (1,631,473 | ) | ||
|
| |||
Net change in unrealized appreciation (depreciation) | (1,631,473 | ) | ||
|
| |||
Net realized and unrealized gain | (582,208 | ) | ||
|
| |||
Net decrease in net assets resulting from operations | $ | (668,337 | ) | |
|
|
| * | Relates to Trustees not deemed “interested persons” within the meaning of Section 2(a)(19) of the 1940 Act. |
| 192 | THE RYDEX FUNDSANNUALREPORT | See Notes to Financial Statements. |
| S&P SMALLCAP 600 PURE VALUE FUND | ||
STATEMENTS OF CHANGES IN NET ASSETS | ||
| Year Ended December 31, 2011 | Year Ended December 31, 2010 | |||||||
INCREASE (DECREASE) IN NET ASSETS FROM OPERATIONS: | ||||||||
Net investment loss | $ | (86,129 | ) | $ | (132,245 | ) | ||
Net realized gain (loss) on investments | 1,049,265 | (147,775 | ) | |||||
Net change in unrealized appreciation (depreciation) on investments | (1,631,473 | ) | 723,537 | |||||
|
|
|
| |||||
Net increase (decrease) in net assets resulting from operations | (668,337 | ) | 443,517 | |||||
|
|
|
| |||||
CAPITALSHARETRANSACTIONS: | ||||||||
Proceeds from sale of shares | 54,571,846 | 126,900,019 | ||||||
Cost of shares redeemed | (58,374,680 | ) | (123,677,761 | ) | ||||
|
|
|
| |||||
Net increase (decrease) from capital share transactions | (3,802,834 | ) | 3,222,258 | |||||
|
|
|
| |||||
Net increase (decrease) in net assets | (4,471,171 | ) | 3,665,775 | |||||
NETASSETS: | ||||||||
Beginning of year | 17,227,748 | 13,561,973 | ||||||
|
|
|
| |||||
End of year | $ | 12,756,577 | $ | 17,227,748 | ||||
|
|
|
| |||||
Accumulated/(Undistributed) net investment income/(loss) at end of year | $ | (1 | ) | $ | — | |||
|
|
|
| |||||
CAPITALSHAREACTIVITY: | ||||||||
Shares sold | 566,974 | 1,392,712 | ||||||
Shares redeemed | (597,783 | ) | (1,390,154 | ) | ||||
|
|
|
| |||||
Net increase (decrease) in shares | (30,809 | ) | 2,558 | |||||
|
|
|
| |||||
| See Notes to Financial Statements. | THE RYDEX FUNDSANNUALREPORT | 193 |
| S&P SMALLCAP 600 PURE VALUE FUND | ||
FINANCIAL HIGHLIGHTS | ||
This table is presented to show selected data for a share outstanding throughout each period, and to assist shareholders in evaluating a Fund’s performance for the periods presented.
| Year Ended December 31, 2011 | Year Ended December 31, 2010 | Year Ended December 31, 2009c | Year Ended December 31, 2008c | Year Ended December 31, 2007c | ||||||||||||||||
Per Share Data | ||||||||||||||||||||
Net asset value, beginning of period | $ | 101.98 | $ | 81.52 | $ | 50.83 | $ | 91.10 | $ | 143.00 | ||||||||||
|
|
|
|
|
|
|
|
|
| |||||||||||
Income (loss) from investment operations: | ||||||||||||||||||||
Net investment income (loss)a | (.73 | ) | (.56 | ) | (.26 | ) | 1.20 | .95 | ||||||||||||
Net gain (loss) on investments (realized and unrealized) | (8.89 | ) | 21.02 | 31.93 | (40.87 | ) | (29.85 | ) | ||||||||||||
|
|
|
|
|
|
|
|
|
| |||||||||||
Total from investment operations | (9.62 | ) | 20.46 | 31.67 | (39.67 | ) | (28.90 | ) | ||||||||||||
|
|
|
|
|
|
|
|
|
| |||||||||||
Less distributions from: | ||||||||||||||||||||
Net investment income | — | — | (.98 | ) | (.60 | ) | (.30 | ) | ||||||||||||
Net realized gains | — | — | — | — | (22.70 | ) | ||||||||||||||
|
|
|
|
|
|
|
|
|
| |||||||||||
Total distributions | — | — | (.98 | ) | (.60 | ) | (23.00 | ) | ||||||||||||
|
|
|
|
|
|
|
|
|
| |||||||||||
Net asset value, end of period | $ | 92.36 | $ | 101.98 | $ | 81.52 | $ | 50.83 | $ | 91.10 | ||||||||||
|
|
|
|
|
|
|
|
|
| |||||||||||
Total Returnb | (9.44 | %) | 25.10 | % | 62.33 | % | (43.50 | %) | (20.36 | %) | ||||||||||
|
|
|
|
|
|
|
|
|
| |||||||||||
Ratios/Supplemental Data | ||||||||||||||||||||
Net assets, end of period (in thousands) | $ | 12,757 | $ | 17,228 | $ | 13,562 | $ | 10,310 | $ | 9,710 | ||||||||||
|
|
|
|
|
|
|
|
|
| |||||||||||
Ratios to average net assets: | ||||||||||||||||||||
Net investment income (loss) | (0.75 | %) | (0.61 | %) | (0.37 | %) | 1.60 | % | 0.66 | % | ||||||||||
Total expenses | 1.62 | % | 1.55 | % | 1.55 | % | 1.52 | % | 1.49 | % | ||||||||||
|
|
|
|
|
|
|
|
|
| |||||||||||
Portfolio turnover rate | 404 | % | 526 | % | 380 | % | 391 | % | 241 | % | ||||||||||
| a | Net investment income (loss) per share was computed using average shares outstanding throughout the period. |
| b | Total return does not reflect the impact of any additional fees charged by insurance companies and has not been annualized. |
| c | Per share amounts for the years ended December 31, 2007 – December 31, 2008 and the period January 1, 2009 through April 19, 2009 have been restated to reflect a 1:5 reverse stock split effective April 20, 2009. |
| 194 | THE RYDEX FUNDSANNUALREPORT | See Notes to Financial Statements. |
This page intentionally left blank.
| THE RYDEX FUNDSANNUALREPORT | 195 |
PERFORMANCE REPORT AND FUND PROFILE (Unaudited) | December 31, 2011 |
OBJECTIVE: Seeks to provide investment results that correlate, before fees and expenses, to the performance of a specific benchmark. The Fund’s current benchmark is 125% of the fair value of the STOXX 50® Index (the “underlying index”).
For the year ended December 31, 2011, Europe 1.25x Strategy Fund maintained a daily correlation of over 99% to its benchmark of 125% of the daily price movement of the STOXX 50 Index. Europe 1.25x Strategy Fund returned -15.14% while the STOXX 50 Index returned -8.17% over the same period.
The sectors contributing the most to the return of the index were Health Care and Consumer Staples. Detracting most from performance was Financials, which was 11% of the portfolio. Materials was the other large detractor from return.
The STOXX 50 tracks some of the largest companies in Europe, but its most heavily weighted sector, Financials, is still under stress. The Fund’s returns, expressed in dollar terms, were also impacted by the 3.2% decline of the euro against the dollar during the year.
The stocks contributing most to the performance of the index were Vodafone Group plc, GlaxoSmithKline plc and Royal Dutch Shell plc Class A. Those detracting from performance were HSBC Holdings plc, Rio Tinto plc and BNP Paribas SA.
Derivatives in the Fund were used to help provide exposure to the composition of the benchmark in the highest efficient manner and to provide leverage, not for hedging purposes.
Due to the compounding of daily returns, leveraged and inverse funds’ returns over periods other than one day will likely differ in amount and possibly direction from the benchmark return for the same period. Investors should monitor their leveraged and inverse funds’ holdings to ensure that they are consistent with their strategies, as frequently as daily.
The effects of compounding may cause the longer-term correlation of the fund to its benchmark to diminish. The apparent discrepancy between the leveraged and unleveraged indices is the result of compounding, which is described briefly on page 4 of this report.
The STOXX 50® Index provides a blue-chip representation of supersector leaders in the eurozone. The index covers 50 stocks from 12 eurozone countries: Austria, Belgium, Finland, France, Germany, Greece, Ireland, Italy, Luxembourg, the Netherlands, Portugal and Spain.
Holdings Diversification (Market Exposure as % of Net Assets)
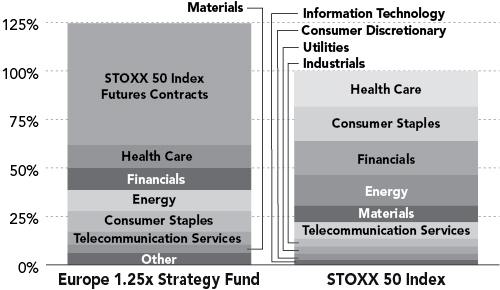
“Holdings Diversification (Market Exposure as % of Net Assets)” excludes any temporary cash investments.
Inception Date: October 1, 2001
| Ten Largest Holdings | ||||
(% of Total Net Assets) | ||||
Nestle S.A. ADR | 4.2 | % | ||
Novartis AG ADR | 3.7 | % | ||
Vodafone Group plc ADR | 3.5 | % | ||
BP plc ADR | 3.4 | % | ||
HSBC Holdings plc ADR | 3.1 | % | ||
Royal Dutch Shell plc ADR | 3.0 | % | ||
GlaxoSmithKline plc ADR | 2.9 | % | ||
Total S.A. ADR | 2.8 | % | ||
British American Tobacco plc ADR | 2.5 | % | ||
Sanofi ADR | 2.2 | % | ||
|
| |||
Top Ten Total | 31.3 | % | ||
|
| |||
“Ten Largest Holdings” exclude any temporary cash or derivative investments.
196 | THE RYDEX FUNDSANNUALREPORT
| PERFORMANCE REPORT AND FUND PROFILE (Unaudited) (concluded) | ||
| EUROPE 1.25x STRATEGY FUND | ||
Cumulative Fund Performance*
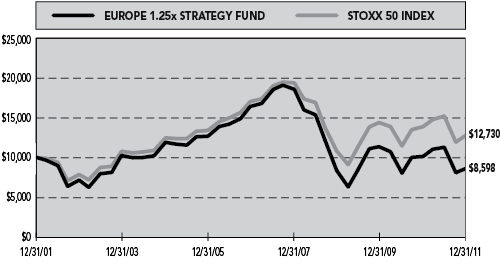
Average Annual Returns*
Periods Ended 12/31/11
| 1 Year | 5 Year | 10 Year | ||||||||||
Europe 1.25x Strategy Fund | -15.14 | % | -12.12 | % | -1.50 | % | ||||||
STOXX 50 Index (Total Return/Dollars) | -8.17 | % | -5.64 | % | 2.44 | % | ||||||
| * | The performance data represents past performance that is not predictive of future results. The investment return and principal value of an investment in the Fund will fluctuate so that an investor’s shares, when redeemed, may be worth more or less than their original cost. Returns are historical and include changes in principal and reinvested dividends and capital gains and do not reflect the effect of taxes. The STOXX 50 Index (Total Return/Dollars) is an unmanaged index and, unlike the Fund, has no management fees or operating expenses to reduce its reported return. |
| Returns do not reflect the impact of any additional fees charged by insurance companies. |
THE RYDEX FUNDSANNUALREPORT | 197
| SCHEDULE OF INVESTMENTS | December 31, 2011 | |
| EUROPE 1.25x STRATEGY FUND | ||
| SHARES | VALUE | |||||||
COMMON STOCKS† - 62.0% | ||||||||
HEALTH CARE - 12.2% | ||||||||
Novartis AG ADR | 2,626 | $ | 150,128 | |||||
GlaxoSmithKline plc ADR | 2,543 | 116,037 | ||||||
Sanofi ADR | 2,404 | 87,842 | ||||||
AstraZeneca plc ADR | 1,767 | 81,795 | ||||||
Roche Holding AG ADR | 1,348 | 57,357 | ||||||
|
| |||||||
Total Health Care | 493,159 | |||||||
|
| |||||||
FINANCIALS - 11.3% | ||||||||
HSBC Holdings plc ADR | 3,323 | 126,606 | ||||||
Banco Santander S.A. ADR | 8,839 | 66,469 | ||||||
UBS AG* | 4,283 | 50,668 | ||||||
Banco Bilbao Vizcaya Argentaria | ||||||||
S.A. ADR | 5,172 | 44,324 | ||||||
Deutsche Bank AG | 1,078 | 40,813 | ||||||
Barclays plc ADR | 2,912 | 32,003 | ||||||
ING Groep N.V. ADR* | 4,273 | 30,637 | ||||||
Credit Suisse Group AG ADR | 1,295 | 30,407 | ||||||
Allianz SE ADR | 2,705 | 25,616 | ||||||
Societe Generale S.A. ADR | 2,140 | 9,330 | ||||||
|
| |||||||
Total Financials | 456,873 | |||||||
|
| |||||||
ENERGY - 10.8% | ||||||||
BP plc ADR | 3,259 | 139,290 | ||||||
Royal Dutch Shell plc ADR | 1,690 | 123,522 | ||||||
Total S.A. ADR | 2,239 | 114,435 | ||||||
ENI SpA ADR | 1,504 | 62,070 | ||||||
|
| |||||||
Total Energy | 439,317 | |||||||
|
| |||||||
CONSUMER STAPLES - 10.7% | ||||||||
Nestle S.A. ADR | 2,929 | 169,033 | ||||||
British American Tobacco plc ADR | 1,070 | 101,522 | ||||||
Diageo plc ADR | 700 | 61,194 | ||||||
Unilever N.V. | 1,724 | 59,254 | ||||||
Anheuser-Busch InBev N.V. ADR | 686 | 41,839 | ||||||
|
| |||||||
Total Consumer Staples | 432,842 | |||||||
|
| |||||||
TELECOMMUNICATION SERVICES - 6.8% | ||||||||
Vodafone Group plc ADR | 5,035 | 141,131 | ||||||
Telefonica S.A. ADR | 3,941 | 67,746 | ||||||
Deutsche Telekom AG ADR | 3,457 | 39,583 | ||||||
France Telecom S.A. ADR | 1,871 | 29,300 | ||||||
|
| |||||||
Total Telecommunication Services | 277,760 | |||||||
|
| |||||||
MATERIALS - 4.2% | ||||||||
Rio Tinto plc ADR | 1,447 | 70,787 | ||||||
BHP Billiton Ltd. ADR | 967 | 68,299 | ||||||
Anglo American plc ADR | 1,652 | 29,984 | ||||||
|
| |||||||
Total Materials | 169,070 | |||||||
|
| |||||||
INDUSTRIALS - 3.1% | ||||||||
Siemens AG ADR | 824 | 78,783 | ||||||
ABB Ltd. ADR* | 2,591 | 48,789 | ||||||
|
| |||||||
Total Industrials | 127,572 | |||||||
|
| |||||||
INFORMATION TECHNOLOGY - 1.7% | ||||||||
SAP AG ADR | 1,039 | 55,015 | ||||||
Nokia Oyj ADR | 3,287 | 15,843 | ||||||
|
| |||||||
Total Information Technology | 70,858 | |||||||
|
| |||||||
CONSUMER DISCRETIONARY - 1.2% | ||||||||
Daimler AG | 1,147 | 50,308 | ||||||
|
| |||||||
Total Common Stocks | 2,517,759 | |||||||
|
| |||||||
| FACE AMOUNT | ||||||||
REPURCHASE AGREEMENTS††,1 - 30.8% | ||||||||
Mizuho Financial Group, Inc. issued 12/30/11 at 0.00% due 01/03/12 | $ | 322,977 | 322,977 | |||||
HSBC Group issued 12/30/11 at 0.00% due 01/03/12 | 309,173 | 309,173 | ||||||
Deutsche Bank issued 12/30/11 at 0.00% due 01/03/12 | 309,173 | 309,173 | ||||||
Credit Suisse Group issued 12/30/11 at 0.00% due 01/03/12 | 309,173 | 309,173 | ||||||
|
| |||||||
Total Repurchase Agreements | 1,250,496 | |||||||
|
| |||||||
Total Investments - 92.8% | $ | 3,768,255 | ||||||
|
| |||||||
Cash & Other Assets, Less Liabilities - 7.2% | 294,422 | |||||||
|
| |||||||
Total Net Assets - 100.0% | $ | 4,062,677 | ||||||
| 198 | THE RYDEX FUNDSANNUALREPORT | See Notes to Financial Statements. |
| SCHEDULE OF INVESTMENTS (concluded) | December 31, 2011 | |
| EUROPE 1.25x STRATEGY FUND | ||
| CONTRACTS | UNREALIZED GAIN (LOSS) | |||||||
FUTURES CONTRACTS PURCHASED† | ||||||||
March 2012 STOXX 50 Index Futures Contracts (Aggregate Value of Contracts $1,823,099) | 60 | $ | 64,234 | |||||
March 2012 EURO STOXX 50 Index Futures Contracts (Aggregate Value of Contracts $716,817) | 24 | 16,953 | ||||||
|
| |||||||
(Total Aggregate Value of Contracts $2,539,916) | $ | 81,187 | ||||||
|
| |||||||
CURRENCY FUTURES CONTRACTS PURCHASED† |
| |||||||
March 2012 EURO Currency Futures Contracts (Aggregate Value of Contracts $2,589,800) | 16 | $ | (82,084 | ) | ||||
|
| |||||||
Country Diversification
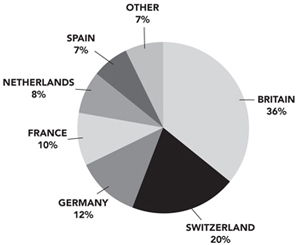
The pie chart above reflects percentages of the market value of Common Stocks.
| * | Non-income producing security. |
| † | Value determined based on Level 1 inputs — See Note 4. |
| †† | Value determined based on Level 2 inputs — See Note 4. |
| 1 | Repurchase Agreements — See Note 5. |
| ADR — American Depositary Receipt |
| plc — Public Limited Company |
| See Notes to Financial Statements. | THE RYDEX FUNDSANNUALREPORT | 199 |
| EUROPE 1.25x STRATEGY FUND |
| STATEMENT OF ASSETS AND LIABILITIES | ||
December 31, 2011 |
ASSETS: | ||||
Investments, at value | $ | 2,517,759 | ||
Repurchase agreements, at value | 1,250,496 | |||
|
| |||
Total investments | 3,768,255 | |||
Foreign currency, at value | 71,746 | |||
Segregated cash with broker | 252,448 | |||
Receivables: | ||||
Variation margin | 26,023 | |||
Dividends | 13,364 | |||
Foreign taxes reclaim | 4,513 | |||
|
| |||
Total assets | 4,136,349 | |||
|
| |||
LIABILITIES: | ||||
Due to broker | 48,899 | |||
Payable for: | ||||
Fund shares redeemed | 5,588 | |||
Management fees | 3,537 | |||
Transfer agent and administrative fees | 983 | |||
Investor service fees | 983 | |||
Portfolio accounting fees | 393 | |||
Miscellaneous | 13,289 | |||
|
| |||
Total liabilities | 73,672 | |||
|
| |||
NETASSETS | $ | 4,062,677 | ||
|
| |||
NETASSETSCONSISTOF: | ||||
Paid in capital | $ | 11,197,248 | ||
Undistributed net investment income | 80,825 | |||
Accumulated net realized loss on investments | (7,510,014 | ) | ||
Net unrealized appreciation on investments | 294,618 | |||
|
| |||
Net assets | $ | 4,062,677 | ||
Capital shares outstanding | 323,550 | |||
Net asset value per share | $ | 12.56 | ||
|
| |||
| STATEMENT OF OPERATIONS | ||||
Year Ended December 31, 2011 | ||||
INVESTMENT INCOME: | ||||
Dividends (net of foreign withholding tax of $893) | $ | 236,647 | ||
Interest | 1,373 | |||
|
| |||
Total investment income | 238,020 | |||
|
| |||
EXPENSES: | ||||
Management fees | 73,755 | |||
Transfer agent and administrative fees | 20,488 | |||
Investor service fees | 20,488 | |||
Portfolio accounting fees | 8,195 | |||
Custodian fees | 1,991 | |||
Trustees’ fees* | 841 | |||
Miscellaneous | 19,865 | |||
|
| |||
Total expenses | 145,623 | |||
|
| |||
Net investment income | 92,397 | |||
|
| |||
NET REALIZEDAND UNREALIZED GAIN (LOSS): | ||||
Net realized gain (loss) on: | ||||
Investments | (272,270 | ) | ||
Futures contracts | (443,319 | ) | ||
Foreign currency | (11,572 | ) | ||
|
| |||
Net realized loss | (727,161 | ) | ||
|
| |||
Net change in unrealized appreciation (depreciation) on: | ||||
Investments | (737,612 | ) | ||
Futures contracts | (8,758 | ) | ||
Foreign currency | (436 | ) | ||
|
| |||
Net change in unrealized appreciation (depreciation) | (746,806 | ) | ||
|
| |||
Net realized and unrealized loss | (1,473,967 | ) | ||
|
| |||
Net decrease in net assets resulting from operations | $ | (1,381,570 | ) | |
|
|
| * | Relates to Trustees not deemed “interested persons” within the meaning of Section 2(a)(19) of the 1940 Act. |
| 200 | THE RYDEX FUNDSANNUALREPORT | See Notes to Financial Statements. |
| EUROPE 1.25x STRATEGY FUND | ||
| STATEMENTS OF CHANGES IN NET ASSETS | ||
| Year Ended December 31, 2011 | Year Ended December 31, 2010 | |||||||
INCREASE (DECREASE) IN NET ASSETS FROM OPERATIONS: | ||||||||
Net investment income | $ | 92,397 | $ | 93,292 | ||||
Net realized loss on investments | (727,161 | ) | (830,942 | ) | ||||
Net change in unrealized appreciation (depreciation) on investments | (746,806 | ) | (2,430,297 | ) | ||||
|
|
|
| |||||
Net decrease in net assets resulting from operations | (1,381,570 | ) | (3,167,947 | ) | ||||
|
|
|
| |||||
| DISTRIBUTIONSTOSHAREHOLDERSFROM: | ||||||||
Net investment income | — | (169,256 | ) | |||||
|
|
|
| |||||
Total distributions to shareholders | — | (169,256 | ) | |||||
|
|
|
| |||||
CAPITALSHARETRANSACTIONS: | ||||||||
Proceeds from sale of shares | 54,002,824 | 87,347,017 | ||||||
Distributions reinvested | — | 169,256 | ||||||
Cost of shares redeemed | (57,621,107 | ) | (97,474,706 | ) | ||||
|
|
|
| |||||
Net decrease from capital share transactions | (3,618,283 | ) | (9,958,433 | ) | ||||
|
|
|
| |||||
Net decrease in net assets | (4,999,853 | ) | (13,295,636 | ) | ||||
NETASSETS: | ||||||||
Beginning of year | 9,062,530 | 22,358,166 | ||||||
|
|
|
| |||||
End of year | $ | 4,062,677 | $ | 9,062,530 | ||||
|
|
|
| |||||
Undistributed net investment income at end of year | $ | 80,825 | $ | — | ||||
|
|
|
| |||||
CAPITALSHAREACTIVITY: | ||||||||
Shares sold | 3,582,718 | 5,949,770 | ||||||
Shares issued from reinvestment of distributions | — | 11,157 | ||||||
Shares redeemed | (3,871,502 | ) | (6,684,951 | ) | ||||
|
|
|
| |||||
Net decrease in shares | (288,784 | ) | (724,024 | ) | ||||
|
|
|
| |||||
| See Notes to Financial Statements. | THE RYDEX FUNDSANNUALREPORT | 201 |
| EUROPE 1.25x STRATEGY FUND | ||
| FINANCIAL HIGHLIGHTS | ||
This table is presented to show selected data for a share outstanding throughout each period, and to assist shareholders in evaluating a Fund’s performance for the periods presented.
| Year Ended December 31, 2011 | Year Ended December 31, 2010 | Year Ended December 31, 2009 | Year Ended December 31, 2008 | Year Ended December 31, 2007 | ||||||||||||||||
Per Share Data | ||||||||||||||||||||
Net asset value, beginning of period | $ | 14.80 | $ | 16.73 | $ | 12.65 | $ | 29.95 | $ | 29.60 | ||||||||||
|
|
|
|
|
|
|
|
|
| |||||||||||
Income (loss) from investment operations: | ||||||||||||||||||||
Net investment incomea | .17 | .12 | .13 | .55 | .70 | |||||||||||||||
Net gain (loss) on investments (realized and unrealized) | (2.41 | ) | (1.85 | ) | 4.31 | (17.04 | ) | 3.26 | ||||||||||||
|
|
|
|
|
|
|
|
|
| |||||||||||
Total from investment operations | (2.24 | ) | (1.73 | ) | 4.44 | (16.49 | ) | 3.96 | ||||||||||||
|
|
|
|
|
|
|
|
|
| |||||||||||
Less distributions from: | ||||||||||||||||||||
Net investment income | — | (.20 | ) | (.36 | ) | (.19 | ) | (.71 | ) | |||||||||||
Net realized gains | — | — | — | (.62 | ) | (2.90 | ) | |||||||||||||
|
|
|
|
|
|
|
|
|
| |||||||||||
Total distributions | — | (.20 | ) | (.36 | ) | (.81 | ) | (3.61 | ) | |||||||||||
|
|
|
|
|
|
|
|
|
| |||||||||||
Net asset value, end of period | $ | 12.56 | $ | 14.80 | $ | 16.73 | $ | 12.65 | $ | 29.95 | ||||||||||
|
|
|
|
|
|
|
|
|
| |||||||||||
Total Returnb | (15.14 | %) | (10.35 | %) | 35.01 | % | (54.86 | %) | 13.06 | % | ||||||||||
|
|
|
|
|
|
|
|
|
| |||||||||||
Ratios/Supplemental Data | ||||||||||||||||||||
Net assets, end of period (in thousands) | $ | 4,063 | $ | 9,063 | $ | 22,358 | $ | 12,535 | $ | 82,833 | ||||||||||
|
|
|
|
|
|
|
|
|
| |||||||||||
Ratios to average net assets: | ||||||||||||||||||||
Net investment income | 1.13 | % | 0.82 | % | 0.90 | % | 2.33 | % | 2.18 | % | ||||||||||
Total expenses | 1.78 | % | 1.71 | % | 1.71 | % | 1.67 | % | 1.63 | % | ||||||||||
|
|
|
|
|
|
|
|
|
| |||||||||||
Portfolio turnover rate | 446 | % | 461 | % | 321 | % | 111 | % | 220 | % | ||||||||||
| a | Net investment income per share was computed using average shares outstanding throughout the period. |
| b | Total return does not reflect the impact of any additional fees charged by insurance companies and has not been annualized. |
| 202 | THE RYDEX FUNDSANNUALREPORT | See Notes to Financial Statements. |
This page intentionally left blank.
| THE RYDEX FUNDSANNUALREPORT | 203 |
| PERFORMANCE REPORT AND FUND PROFILE (Unaudited) | December 31, 2011 |
OBJECTIVE: Seeks to provide investment results that correlate, before fees and expenses, to the performance of a specific benchmark. The Fund’s current benchmark is 200% of the fair value of the Nikkei-225 Stock Average (the “underlying index”)
For the year ended December 31, 2011, Japan 2x Strategy Fund maintained a daily correlation of over 99% to its benchmark of 200% of the daily price movement of the fair value of the Nikkei-225 Stock Average Index. Japan 2x Strategy Fund returned -28.94%, while the Nikkei-225 Stock Average Index returned -12.24% over the same time period.
The only sector contributing to performance of the index was Consumer Staples. The sectors detracting most from performance were Information Technology, Industrials and Consumer Discretionary.
Stocks contributing most to return of the index were Fast Retailing Co. LTD, Konami Corp. and Eisai Co Ltd. Those detracting most from performance were Advantest Corp., TDK Corp. and SoftBank Corp.
The Japanese yen appreciated more than 5% against the dollar during the year, which helped the Fund’s performance as it does not hedge out its foreign currency exposure.
Derivatives in the Fund were used to help provide exposure to the composition of the benchmark in the highest efficient manner and to provide leverage, not for hedging purposes.
Due to the compounding of daily returns, leveraged and inverse funds’ returns over periods other than one day will likely differ in amount and possibly direction from the benchmark return for the same period. Investors should monitor their leveraged and inverse funds’ holdings to ensure that they are consistent with their strategies, as frequently as daily.
The effects of compounding may cause the longer-term correlation of the fund to its benchmark to diminish. The apparent discrepancy between the leveraged and unleveraged indices is the result of compounding, which is described briefly on page 4 of this report.
The Nikkei-225 Stock Average is a price-weighted index comprised of Japan’s top 225 blue-chip companies on the Tokyo Stock Exchange.
Holdings Diversification (Market Exposure as % of Net Assets)
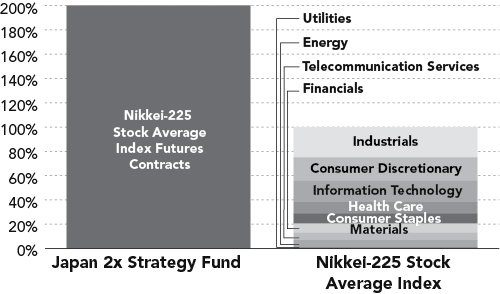
“Holdings Diversification (Market Exposure as % of Net Assets)” excludes any temporary cash investments.
Inception Date: October 1, 2001
The Fund invests principally in derivative investments such as swap agreements and futures contracts.
204 | THE RYDEX FUNDSANNUALREPORT
| PERFORMANCE REPORT AND FUND PROFILE (Unaudited) (concluded) |
JAPAN 2x STRATEGY FUND
Cumulative Fund Performance*

Average Annual Returns*
Periods Ended 12/31/11
| 1 Year | 5 Year | 10 Year | ||||||||||
Japan 2x Strategy Fund | -28.94 | % | -9.56 | % | -0.26 | % | ||||||
Nikkei-225 Stock Average Index | -12.24 | % | -5.36 | % | 3.18 | % | ||||||
| * | The performance data represents past performance that is not predictive of future results. The investment return and principal value of an investment in the Fund will fluctuate so that an investor’s shares, when redeemed, may be worth more or less than their original cost. Returns are historical and include changes in principal and reinvested dividends and capital gains and do not reflect the effect of taxes. The Nikkei-225 Stock Average Index is an unmanaged index and, unlike the Fund, has no management fees or operating expenses to reduce its reported return. |
Returns do not reflect the impact of any additional fees charged by insurance companies.
THE RYDEX FUNDSANNUALREPORT | 205
| SCHEDULE OF INVESTMENTS | December 31, 2011 |
JAPAN 2x STRATEGY FUND
| FACE AMOUNT | VALUE | |||||||
REPURCHASE AGREEMENTS††,1 - 74.5% |
| |||||||
Mizuho Financial Group, Inc. issued 12/30/11 at 0.00% due 01/03/12 | $ | 418,968 | $ | 418,968 | ||||
HSBC Group issued 12/30/11 at 0.00% due 01/03/12 | 401,062 | 401,062 | ||||||
Deutsche Bank issued 12/30/11 at 0.00% due 01/03/12 | 401,062 | 401,062 | ||||||
Credit Suisse Group issued 12/30/11 at 0.00% due 01/03/12 | 401,061 | 401,061 | ||||||
|
| |||||||
Total Repurchase Agreements | 1,622,153 | |||||||
|
| |||||||
Total Investments - 74.5% | $ | 1,622,153 | ||||||
|
| |||||||
Cash & Other Assets, Less Liabilities - 25.5% | 554,808 | |||||||
|
| |||||||
Total Net Assets - 100.0% | $ | 2,176,961 | ||||||
| CONTRACTS | UNREALIZED GAIN (LOSS) | |||||||
CURRENCY FUTURES CONTRACTS PURCHASED† |
| |||||||
March 2012 Japanese Yen Currency Futures Contracts (Aggregate Value of Contracts $4,390,875) | 27 | $ | 28,005 | |||||
|
| |||||||
FUTURES CONTRACTS PURCHASED† |
| |||||||
March 2012 Nikkei-225 Stock Average Index Futures Contracts (Aggregate Value of Contracts $4,349,175) | 103 | $ | (75,953 | ) | ||||
|
| |||||||
| † | Value determined based on Level 1 inputs — See Note 4 |
| †† | Value determined based on Level 2 inputs — See Note 4. |
| 1 | Repurchase Agreements — See Note 5. |
| 206 | THE RYDEX FUNDSANNUALREPORT | See Notes to Financial Statements. |
JAPAN 2x STRATEGY FUND
STATEMENT OF ASSETS AND LIABILITIES
December 31, 2011
ASSETS: | ||||
Repurchase agreements, at value (cost $1,622,153) | $ | 1,622,153 | ||
Segregated cash with broker | 541,500 | |||
Receivables: | ||||
Variation margin | 30,149 | |||
Fund shares sold | 178 | |||
|
| |||
Total assets | 2,193,980 | |||
|
| |||
| LIABILITIES: | ||||
Payable for: | ||||
Fund shares redeemed | 5,110 | |||
Management fees | 1,658 | |||
Transfer agent and administrative fees | 553 | |||
Investor service fees | 553 | |||
Portfolio accounting fees | 221 | |||
Miscellaneous | 8,924 | |||
|
| |||
Total liabilities | 17,019 | |||
|
| |||
NETASSETS | $ | 2,176,961 | ||
|
| |||
NETASSETSCONSISTOF: | ||||
Paid in capital | $ | 10,791,506 | ||
Undistributed net investment income | — | |||
Accumulated net realized loss on investments | (8,566,597 | ) | ||
Net unrealized depreciation on investments | (47,948 | ) | ||
|
| |||
Net assets | $ | 2,176,961 | ||
Capital shares outstanding | 142,506 | |||
Net asset value per share | $ | 15.28 | ||
|
|
STATEMENT OF OPERATIONS
Year Ended December 31, 2011
INVESTMENT INCOME: | ||||
Interest | $ | 2,300 | ||
|
| |||
Total investment income | 2,300 | |||
|
| |||
EXPENSES: | ||||
Management fees | 38,851 | |||
Transfer agent and administrative fees | 12,950 | |||
Investor service fees | 12,950 | |||
Portfolio accounting fees | 5,180 | |||
Custodian fees | 1,239 | |||
Trustees’ fees* | 557 | |||
Miscellaneous | 11,810 | |||
|
| |||
Total expenses | 83,537 | |||
|
| |||
Net investment loss | (81,237 | ) | ||
|
| |||
NET REALIZEDAND UNREALIZED GAIN (LOSS): | ||||
Net realized gain (loss) on: | ||||
Futures contracts | (1,531,646 | ) | ||
|
| |||
Net realized loss | (1,531,646 | ) | ||
|
| |||
Net change in unrealized appreciation (depreciation) on: | ||||
Futures contracts | (344,963 | ) | ||
|
| |||
Net change in unrealized appreciation (depreciation) | (344,963 | ) | ||
|
| |||
Net realized and unrealized loss | (1,876,609 | ) | ||
|
| |||
Net decrease in net assets resulting from operations | $ | (1,957,846 | ) | |
|
|
| * | Relates to Trustees not deemed “interested persons” within the meaning of Section 2(a)(19) of the 1940 Act. |
| See Notes to Financial Statements. | THE RYDEX FUNDSANNUALREPORT |�� 207 |
JAPAN 2x STRATEGY FUND
STATEMENTS OF CHANGES IN NET ASSETS
| Year Ended December 31, 2011 | Year Ended December 31, 2010 | |||||||
INCREASE (DECREASE) IN NET ASSETS FROM OPERATIONS: | ||||||||
Net investment loss | $ | (81,237 | ) | $ | (97,116 | ) | ||
Net realized gain (loss) on investments | (1,531,646 | ) | 580,853 | |||||
Net change in unrealized appreciation (depreciation) on investments | (344,963 | ) | 127,894 | |||||
|
|
|
| |||||
Net increase (decrease) in net assets resulting from operations | (1,957,846 | ) | 611,631 | |||||
|
|
|
| |||||
CAPITALSHARETRANSACTIONS: | ||||||||
Proceeds from sale of shares | 58,342,360 | 74,254,486 | ||||||
Cost of shares redeemed | (62,825,233 | ) | (74,658,275 | ) | ||||
|
|
|
| |||||
Net decrease from capital share transactions | (4,482,873 | ) | (403,789 | ) | ||||
|
|
|
| |||||
Net Increase (decrease) in net assets | (6,440,719 | ) | 207,842 | |||||
NETASSETS: | ||||||||
Beginning of year | 8,617,680 | 8,409,838 | ||||||
|
|
|
| |||||
End of year | $ | 2,176,961 | $ | 8,617,680 | ||||
|
|
|
| |||||
Undistributed net investment income at end of year | $ | — | $ | — | ||||
|
|
|
| |||||
CAPITALSHAREACTIVITY: | ||||||||
Shares sold | 3,122,204 | 4,076,487 | ||||||
Shares redeemed | (3,380,711 | ) | (4,128,317 | ) | ||||
|
|
|
| |||||
Net decrease in shares | (258,507 | ) | (51,830 | ) | ||||
|
|
|
| |||||
| 208 | THE RYDEX FUNDSANNUALREPORT | See Notes to Financial Statements. |
JAPAN 2x STRATEGY FUND
FINANCIAL HIGHLIGHTS
This table is presented to show selected data for a share outstanding throughout each period, and to assist shareholders in evaluating a Fund’s performance for the periods presented.
| Year Ended December 31, 2011 | Year Ended December 31, 2010 | Year Ended December 31, 2009 | Year Ended December 31, 2008 | Year Ended December 31, 2007 | ||||||||||||||||
Per Share Data | ||||||||||||||||||||
Net asset value, beginning of period | $ | 21.49 | $ | 18.57 | $ | 15.08 | $ | 22.73 | $ | 27.13 | ||||||||||
|
|
|
|
|
|
|
|
|
| |||||||||||
Income (loss) from investment operations: | ||||||||||||||||||||
Net investment income (loss)a | (.30 | ) | (.26 | ) | (.23 | ) | .05 | .88 | ||||||||||||
Net gain (loss) on investments (realized and unrealized) | (5.91 | ) | 3.18 | 3.79 | (7.86 | ) | (3.83 | ) | ||||||||||||
|
|
|
|
|
|
|
|
|
| |||||||||||
Total from investment operations | (6.21 | ) | 2.92 | 3.56 | (7.81 | ) | (2.95 | ) | ||||||||||||
|
|
|
|
|
|
|
|
|
| |||||||||||
Less distributions from: | ||||||||||||||||||||
Net investment income | — | — | (.07 | ) | (.13 | ) | (1.45 | ) | ||||||||||||
|
|
|
|
|
|
|
|
|
| |||||||||||
Total distributions | — | — | (.07 | ) | (.13 | ) | (1.45 | ) | ||||||||||||
|
|
|
|
|
|
|
|
|
| |||||||||||
Payments by affiliates | — | — | — | .29 | b | — | ||||||||||||||
|
|
|
|
|
|
|
|
|
| |||||||||||
Net asset value, end of period | $ | 15.28 | $ | 21.49 | $ | 18.57 | $ | 15.08 | $ | 22.73 | ||||||||||
|
|
|
|
|
|
|
|
|
| |||||||||||
Total Returnc | (28.94 | %) | 15.72 | % | 23.68 | % | (32.97 | %)b | (11.23 | %) | ||||||||||
|
|
|
|
|
|
|
|
|
| |||||||||||
Ratios/Supplemental Data | ||||||||||||||||||||
Net assets, end of period (in thousands) | $ | 2,177 | $ | 8,618 | $ | 8,410 | $ | 13,104 | $ | 15,568 | ||||||||||
|
|
|
|
|
|
|
|
|
| |||||||||||
Ratios to average net assets: | ||||||||||||||||||||
Net investment income (loss) | (1.57 | %) | (1.44 | %) | (1.49 | %) | 0.25 | % | 3.32 | % | ||||||||||
Total expenses | 1.61 | % | 1.55 | % | 1.60 | % | 1.65 | % | 1.64 | % | ||||||||||
|
|
|
|
|
|
|
|
|
| |||||||||||
Portfolio turnover rate | — | — | — | — | — | |||||||||||||||
| a | Net investment income (loss) per share was computed using average shares outstanding throughout the period. |
| b | Excluding the reimbursement, the Fund’s total return would have been (34.25%). |
| c | Total return does not reflect the impact of any additional fees charged by insurance companies and has not been annualized. |
| See Notes to Financial Statements. | THE RYDEX FUNDSANNUALREPORT | 209 |
| PERFORMANCE REPORT AND FUND PROFILE (Unaudited) | December 31, 2011 |
STRENGTHENING DOLLAR 2x STRATEGY FUND
OBJECTIVE: Seeks to provide investment results that match the performance of a specific benchmark, before fees and expenses, on a daily basis. The Fund’s current benchmark is 200% of the performance of the U.S. Dollar Index® (the “underlying index”). The Fund does not seek to achieve its investment objective over a period of time greater than one day.
For the year ended December 31, 2011, Strengthening Dollar 2x Strategy Fund maintained a daily correlation of over 99% to its benchmark of 200% of the daily price movement of the U.S. Dollar Index. Strengthening Dollar 2x Strategy Fund returned -4.26%, compared with a 1.45% gain for its benchmark, the U.S. Dollar Index.
The U.S. Dollar Index fell to its 2011 low point in late April, when it appeared the global economy was strengthening. It traded in a narrow range until August, when S&P lowered the U.S. triple-A debt rating and Europe was overcome by sovereign debt woes. As the year progressed, the negative effects of the European debt crisis and possible collapse of the euro currency bloc drove investors to the dollar in waves of safe-haven buying.
At year end, the index was about flat, as the dollar finished within about 3% against the currencies of most major markets, including the euro, the pound, Canadian dollar and Swiss franc. The yen was the key exception, which rose about 5% against the dollar. The rise was not expected, given the country’s difficult year in the wake of the earthquake and tsunami. Analysts attributed the rise to strong buying from Japanese corporations who were repatriating overseas profits, despite central bank intervention designed to weaken the currency and help the country’s economic recovery.
Derivatives in the Fund were used to help provide exposure to the composition of the benchmark in the highest efficient manner and to provide leverage, not for hedging purposes.
Due to the compounding of daily returns, leveraged and inverse funds’ returns over periods other than one day will likely differ in amount and possibly direction from the benchmark return for the same period. Investors should monitor their leveraged and inverse funds’ holdings to ensure that they are consistent with their strategies, as frequently as daily.
The effects of compounding may cause the longer-term correlation of the fund to its benchmark to diminish. The apparent discrepancy between the leveraged and unleveraged indices is the result of compounding, which is described briefly on page 4 of this report.
The USD or U.S. Dollar Index® (USDX) is an index that determines the relative value of the United States dollar to a basket of foreign currencies. This formulated “basket” of currencies comprises the weighting of six other currencies as follows: Euro (EUR), 57.6% + Japanese Yen (JPY), 13.6% + Pound Sterling (GBP), 11.9% + Canadian Dollar (CAD), 9.1% + Swedish Krona (SEK), 4.2% + Swiss Franc (CHF) 3.6% .
Holdings Diversification (Market Exposure as % of Net Assets)
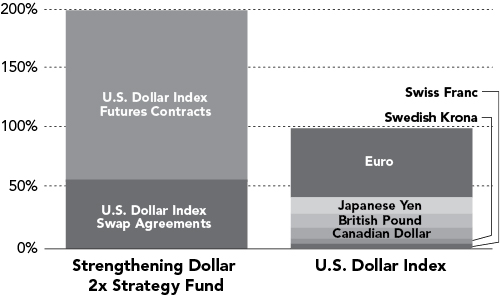
“Holdings Diversification (Market Exposure as % of Net Assets)” excludes any temporary cash investments.
Inception Date: September 30, 2005
The Fund invests principally in derivative investments such as swap agreements and futures contracts.
210 | THE RYDEX FUNDSANNUALREPORT
| PERFORMANCE REPORT AND FUND PROFILE (Unaudited) (concluded) |
STRENGTHENING DOLLAR 2x STRATEGY FUND
Cumulative Fund Performance*

Average Annual Returns*
Periods Ended 12/31/11
| 1 Year | 5 Year | Since Inception (09/30/05) | ||||||||||
Strengthening Dollar 2x Strategy Fund | -4.26 | % | -6.26 | % | -6.27 | % | ||||||
U.S. Dollar Index | 1.45 | % | -0.84 | % | -1.75 | % | ||||||
| * | The performance data represents past performance that is not predictive of future results. The investment return and principal value of an investment in the Fund will fluctuate so that an investor’s shares, when redeemed, may be worth more or less than their original cost. Returns are historical and include changes in principal and reinvested dividends and capital gains and do not reflect the effect of taxes. The U.S. Dollar Index is an unmanaged index and, unlike the Fund, has no management fees or operating expenses to reduce its reported return. |
| Returns do not reflect the impact of any additional fees charged by insurance companies. |
THE RYDEX FUNDSANNUALREPORT | 211
| SCHEDULE OF INVESTMENTS | December 31, 2011 |
STRENGTHENING DOLLAR 2x STRATEGY FUND
| FACE AMOUNT | VALUE | |||||||
FEDERAL AGENCY DISCOUNT NOTES†† - 12.9% |
| |||||||
Fannie Mae1 0.01% due 02/13/12 | $ | 1,000,000 | $ | 999,982 | ||||
|
| |||||||
Total Federal Agency Discount Notes | 999,982 | |||||||
|
| |||||||
REPURCHASE AGREEMENTS††,2 - 83.0% | ||||||||
Credit Suisse Group issued 12/30/11 at 0.00% due 01/03/123 | $ | 1,806,888 | 1,806,888 | |||||
Mizuho Financial Group, Inc. issued 12/30/11 at 0.00% due 01/03/12 | 1,574,398 | 1,574,398 | ||||||
HSBC Group issued 12/30/11 at 0.00% | 1,507,110 | 1,507,110 | ||||||
Deutsche Bank issued 12/30/11 at 0.00% due 01/03/12 | 1,507,111 | 1,507,111 | ||||||
|
| |||||||
Total Repurchase Agreements | 6,395,507 | |||||||
|
| |||||||
Total Investments - 95.9% | $ | 7,395,489 | ||||||
|
| |||||||
Cash & Other Assets, Less Liabilities - 4.1% | 312,266 | |||||||
|
| |||||||
Total Net Assets - 100.0% | $ | 7,707,755 | ||||||
| CONTRACTS | UNREALIZED GAIN | |||||||
CURRENCY FUTURES CONTRACTS PURCHASED† |
| |||||||
March 2012 U.S. Dollar Index Futures Contract (Aggregate Value of Contracts $11,046,995) | 137 | $ | 150,666 | |||||
|
| |||||||
| UNITS | ||||||||
CURRENCY INDEX SWAP AGREEMENTS†† |
| |||||||
Goldman Sachs International February 2011 U.S. Dollar Index Swap, Terminating 02/28/124 (Notional Value $4,297,036) | 53,460 | $ | 6,524 | |||||
|
| |||||||
| † | Value determined based on Level 1 inputs — See Note 4. |
| †† | Value determined based on Level 2 inputs — See Note 4. |
| 1 | On September 7, 2008, the issuer was placed in conservatorship by the Federal Housing Finance Agency (FHFA). As conservator, the FHFA has full powers to control the assets and operations of the firm. |
| 2 | Repurchase Agreements — See Note 5. |
| 3 | All or a portion of this security is pledged as currency index swap collateral at December 31, 2011. |
| 4 | Total Return based on U.S. Dollar Index +/- financing at a variable rate. |
| 212 | THE RYDEX FUNDSANNUALREPORT | See Notes to Financial Statements. |
STRENGTHENING DOLLAR 2x STRATEGY FUND
STATEMENT OF ASSETS AND LIABILITIES
December 31, 2011 | ||||
| ASSETS: | ||||
Investments, at value | $ | 999,982 | ||
Repurchase agreements, at value | 6,395,507 | |||
|
| |||
Total investments | 7,395,489 | |||
Segregated cash with broker | 246,600 | |||
Receivable for swap settlement | 34,676 | |||
Unrealized appreciation on swap agreements | 6,524 | |||
Receivables: | ||||
Fund shares sold | 80,182 | |||
|
| |||
Total assets | 7,763,471 | |||
|
| |||
| LIABILITIES: | ||||
Payable for: | ||||
Variation margin | 37,812 | |||
Management fees | 5,025 | |||
Transfer agent and administrative fees | 1,396 | |||
Investor service fees | 1,396 | |||
Portfolio accounting fees | 558 | |||
Fund shares redeemed | 210 | |||
Miscellaneous | 9,319 | |||
|
| |||
Total liabilities | 55,716 | |||
|
| |||
NETASSETS | $ | 7,707,755 | ||
|
| |||
NETASSETSCONSISTOF: | ||||
Paid in capital | $ | 11,520,243 | ||
Undistributed net investment income | — | |||
Accumulated net realized loss on investments | (3,969,678 | ) | ||
Net unrealized appreciation on investments | 157,190 | |||
|
| |||
Net assets | $ | 7,707,755 | ||
Capital shares outstanding | 612,721 | |||
Net asset value per share | $ | 12.58 | ||
|
| |||
STATEMENT OF OPERATIONS
Year Ended December 31, 2011
| INVESTMENT INCOME: | ||||
Interest | $ | 2,324 | ||
|
| |||
Total investment income | 2,324 | |||
|
| |||
| EXPENSES: | ||||
Management fees | 44,325 | |||
Transfer agent and administrative fees | 12,312 | |||
Investor service fees | 12,312 | |||
Portfolio accounting fees | 4,925 | |||
Custodian fees | 1,208 | |||
Trustees’ fees* | 486 | |||
Miscellaneous | 11,360 | |||
|
| |||
Total expenses | 86,928 | |||
|
| |||
Net investment loss | (84,604 | ) | ||
|
| |||
| NET REALIZEDAND UNREALIZED GAIN (LOSS): | ||||
Net realized gain (loss) on: | ||||
Swap agreements | (120,576 | ) | ||
Futures contracts | (546,043 | ) | ||
|
| |||
Net realized loss | (666,619 | ) | ||
|
| |||
Net change in unrealized appreciation (depreciation) on: | ||||
Swap agreements | 16,298 | |||
Futures contracts | 288,304 | |||
|
| |||
Net change in unrealized appreciation (depreciation) | 304,602 | |||
|
| |||
Net realized and unrealized loss | (362,017 | ) | ||
|
| |||
Net decrease in net assets resulting from operations | $ | (446,621 | ) | |
|
|
| * | Relates to Trustees not deemed “interested persons” within the meaning of Section 2(a)(19) of the 1940 Act. |
| See Notes to Financial Statements. | THE RYDEX FUNDSANNUALREPORT | 213 |
STRENGTHENING DOLLAR 2x STRATEGY FUND
STATEMENTS OF CHANGES IN NET ASSETS
| Year Ended December 31, 2011 | Year Ended December 31, 2010 | |||||||
INCREASE (DECREASE) IN NET ASSETS FROM OPERATIONS: | ||||||||
Net investment loss | $ | (84,604 | ) | $ | (159,685 | ) | ||
Net realized loss on investments | (666,619 | ) | (301,915 | ) | ||||
Net change in unrealized appreciation (depreciation) on investments | 304,602 | (368,918 | ) | |||||
|
|
|
| |||||
Net decrease in net assets resulting from operations | (446,621 | ) | (830,518 | ) | ||||
|
|
|
| |||||
CAPITALSHARETRANSACTIONS: | ||||||||
Proceeds from sale of shares | 71,501,960 | 125,762,833 | ||||||
Cost of shares redeemed | (70,218,128 | ) | (125,587,200 | ) | ||||
|
|
|
| |||||
Net increase from capital share transactions | 1,283,832 | 175,633 | ||||||
|
|
|
| |||||
Net increase (decrease) in net assets | 837,211 | (654,885 | ) | |||||
NETASSETS: | ||||||||
Beginning of year | 6,870,544 | 7,525,429 | ||||||
|
|
|
| |||||
End of year | $ | 7,707,755 | $ | 6,870,544 | ||||
|
|
|
| |||||
Undistributed net investment income at end of year | $ | — | $ | — | ||||
|
|
|
| |||||
CAPITALSHAREACTIVITY:1 | ||||||||
Shares sold | 5,952,013 | 8,638,068 | ||||||
Shares redeemed | (5,861,718 | ) | (8,662,329 | ) | ||||
|
|
|
| |||||
Net increase (decrease) in shares | 90,295 | (24,261 | ) | |||||
|
|
|
| |||||
| 1 | The share activity for the year ended December 31, 2010 and the period January 1, 2011 through December 1, 2011 have been restated to reflect a 1:2 reverse share split effective December 2, 2011 — See note 10. |
| 214 | THE RYDEX FUNDSANNUALREPORT | See Notes to Financial Statements. |
STRENGTHENING DOLLAR 2x STRATEGY FUND
FINANCIAL HIGHLIGHTS
This table is presented to show selected data for a share outstanding throughout each period, and to assist shareholders in evaluating a Fund’s performance for the periods presented.
| Year Ended December 31, 2011c | Year Ended December 31, 2010c | Year Ended December 31, 2009c | Year Ended December 31, 2008c | Year Ended December 31, 2007c | ||||||||||||||||
Per Share Data | ||||||||||||||||||||
Net asset value, beginning of period | $ | 13.16 | $ | 13.76 | $ | 42.50 | $ | 40.26 | $ | 45.18 | ||||||||||
|
|
|
|
|
|
|
|
|
| |||||||||||
Income (loss) from investment operations: | ||||||||||||||||||||
Net investment income (loss)a | (.20 | ) | (.22 | ) | (.54 | ) | (.16 | ) | 1.40 | |||||||||||
Net gain (loss) on investments (realized and unrealized) | (.38 | ) | (.38 | ) | (7.64 | ) | 2.40 | (6.32 | ) | |||||||||||
|
|
|
|
|
|
|
|
|
| |||||||||||
Total from investment operations | (.58 | ) | (.60 | ) | (8.18 | ) | 2.24 | (4.92 | ) | |||||||||||
|
|
|
|
|
|
|
|
|
| |||||||||||
Less distributions from: | ||||||||||||||||||||
Net realized gains | — | — | (20.56 | ) | — | — | ||||||||||||||
|
|
|
|
|
|
|
|
|
| |||||||||||
Total distributions | — | — | (20.56 | ) | — | — | ||||||||||||||
|
|
|
|
|
|
|
|
|
| |||||||||||
Net asset value, end of period | $ | 12.58 | $ | 13.16 | $ | 13.76 | $ | 42.50 | $ | 40.26 | ||||||||||
|
|
|
|
|
|
|
|
|
| |||||||||||
Total Returnb | (4.26 | %) | (4.51 | %) | (15.84 | %) | 5.56 | % | (10.89 | %) | ||||||||||
|
|
|
|
|
|
|
|
|
| |||||||||||
Ratios/Supplemental Data | ||||||||||||||||||||
Net assets, end of period (in thousands) | $ | 7,708 | $ | 6,871 | $ | 7,525 | $ | 7,024 | $ | 4,006 | ||||||||||
|
|
|
|
|
|
|
|
|
| |||||||||||
Ratios to average net assets: | ||||||||||||||||||||
Net investment income (loss) | (1.72 | %) | (1.55 | %) | (1.57 | %) | (0.41 | %) | 3.26 | % | ||||||||||
Total expenses | 1.77 | % | 1.69 | % | 1.72 | % | 1.69 | % | 1.61 | % | ||||||||||
|
|
|
|
|
|
|
|
|
| |||||||||||
Portfolio turnover rate | — | — | — | — | — | |||||||||||||||
| a | Net investment income (loss) per share was computed using average shares outstanding throughout the period. |
| b | Total return does not reflect the impact of any additional fees charged by insurance companies and has not been annualized. |
| c | Per share amounts for the years ended December 31, 2007 — December 31, 2010 and the period January 1, 2011 through December 1, 2011 have been restated to reflect a 1:2 reverse stock split effective December 2, 2011. |
THE RYDEX FUNDSANNUALREPORT | 215
| PERFORMANCE REPORT AND FUND PROFILE (Unaudited) | December 31, 2011 |
WEAKENING DOLLAR 2x STRATEGY FUND
OBJECTIVE: Seeks to provide investment results that match, before fees and expenses, the performance of a specific benchmark on a daily basis. The Fund’s current benchmark is 200% of the inverse (opposite) of the performance of the U.S. Dollar Index® (the “underlying index”). The Fund does not seek to achieve its investment objective over a period of time greater than one day.
For the year ended December 31, 2011, Weakening Dollar 2x Strategy Fund maintained a daily correlation of over 99% to its benchmark of -200% of the daily price movement of the U.S. Dollar Index. Weakening Dollar 2x Strategy Fund returned -3.68%, compared with a 1.45% gain for its benchmark, the U.S. Dollar Index.
The U.S. Dollar Index fell to its 2011 low point in late April, when it appeared the global economy was strengthening. It traded in a narrow range until August, when S&P lowered the U.S. triple-A debt rating and Europe was overcome by sovereign debt woes. As the year progressed, the negative effects of the European debt crisis and possible collapse of the euro currency bloc drove investors to the dollar in waves of safe-haven buying.
At year end, the index was about flat, as the dollar finished within about 3% against the currencies of most major markets, including the euro, the pound, Canadian dollar and Swiss franc. The yen was the key exception, which rose about 5% against the dollar. The rise was not expected, given the country’s difficult year in the wake of the earthquake and tsunami. Analysts attributed the rise to strong buying from Japanese corporations who were repatriating overseas profits, despite central bank intervention designed to weaken the currency and help the country’s economic recovery.
Derivatives in the Fund were used to help provide exposure to the composition of the benchmark in the highest efficient manner and to provide leverage, not for hedging purposes.
Due to the compounding of daily returns, leveraged and inverse funds’ returns over periods other than one day will likely differ in amount and possibly direction from the benchmark return for the same period. Investors should monitor their leveraged and inverse funds’ holdings to ensure that they are consistent with their strategies, as frequently as daily.
The effects of compounding may cause the longer-term correlation of the fund to its benchmark to diminish. The apparent discrepancy between the leveraged and unleveraged indices is the result of compounding, which is described briefly on page 4 of this report.
The USD or U.S. Dollar Index® (USDX) is an index that determines the relative value of the United States dollar to a basket of foreign currencies. This formulated “basket” of currencies comprises the weighting of six other currencies as follows: Euro (EUR), 57.6% + Japanese Yen (JPY), 13.6% + Pound Sterling (GBP), 11.9% + Canadian Dollar (CAD), 9.1% + Swedish Krona (SEK), 4.2% + Swiss Franc (CHF) 3.6% .
Holdings Diversification (Market Exposure as % of Net Assets)
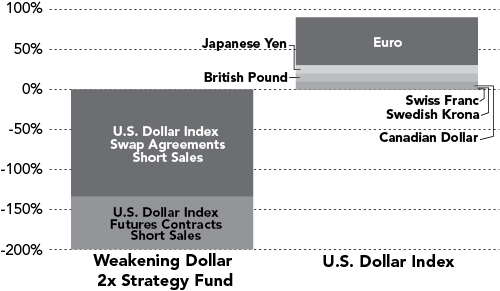
“Holdings Diversification (Market Exposure as % of Net Assets)” excludes any temporary cash investments.
Inception Date: September 30, 2005
The Fund invests principally in derivative investments such as swap agreements and futures contracts.
216 | THE RYDEX FUNDSANNUALREPORT
| PERFORMANCE REPORT AND FUND PROFILE (Unaudited) (concluded) |
WEAKENING DOLLAR 2x STRATEGY FUND
Cumulative Fund Performance*
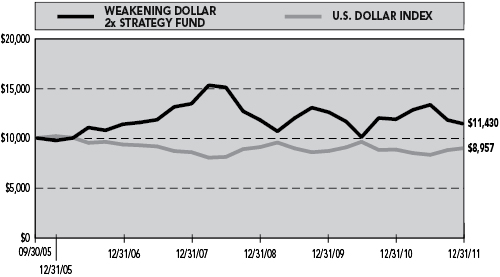
Average Annual Returns*
Periods Ended 12/31/11
| 1 Year | 5 Year | Since Inception (09/30/05) | ||||||||||
Weakening Dollar 2x Strategy Fund | -3.68 | % | 0.09 | % | 2.16 | % | ||||||
U.S. Dollar Index | 1.45 | % | -0.84 | % | -1.75 | % | ||||||
| * | The performance data represents past performance that is not predictive of future results. The investment return and principal value of an investment in the Fund will fluctuate so that an investor’s shares, when redeemed, may be worth more or less than their original cost. Returns are historical and include changes in principal and reinvested dividends and capital gains and do not reflect the effect of taxes. The U.S. Dollar Index is an unmanaged index and, unlike the Fund, has no management fees or operating expenses to reduce its reported return. |
Returns do not reflect the impact of any additional fees charged by insurance companies.
THE RYDEX FUNDSANNUALREPORT | 217
| SCHEDULE OF INVESTMENTS | December 31, 2011 |
WEAKENING DOLLAR 2x STRATEGY FUND
| FACE AMOUNT | VALUE | |||||||
FEDERAL AGENCY DISCOUNT NOTES†† - 28.8% |
| |||||||
Federal Home Loan Bank1 | $ | 200,000 | $ | 199,999 | ||||
Freddie Mac2 | 200,000 | 199,989 | ||||||
Federal Farm Credit Bank1 | 200,000 | 199,922 | ||||||
|
| |||||||
Total Federal Agency Discount Notes | 599,910 | |||||||
|
| |||||||
REPURCHASE AGREEMENTS††,3 - 73.3% |
| |||||||
Credit Suisse Group issued 12/30/11 at 0.00% due 01/03/124 | 643,464 | 643,464 | ||||||
Mizuho Financial Group, Inc. issued 12/30/11 at 0.00% due 01/03/12 | 303,571 | 303,571 | ||||||
HSBC Group issued 12/30/11 at 0.00% due 01/03/12 | 290,597 | 290,597 | ||||||
Deutsche Bank issued 12/30/11 at 0.00% due 01/03/12 | 290,596 | 290,596 | ||||||
|
| |||||||
Total Repurchase Agreements | 1,528,228 | |||||||
|
| |||||||
Total Investments – 102.1% | $ | 2,128,138 | ||||||
|
| |||||||
Liabilities, Less Cash & Other Assets – (2.1)% | (44,488 | ) | ||||||
|
| |||||||
Total Net Assets – 100.0% | $ | 2,083,650 | ||||||
| CONTRACTS | UNREALIZED LOSS | |||||||
CURRENCY FUTURES SOLD SHORT† |
| |||||||
March 2012 U.S. Dollar Index Futures Contract (Aggregate Value of Contracts $1,370,795) | 17 | $ | (20,515 | ) | ||||
|
| |||||||
| UNITS | ||||||||
CURRENCY INDEX SWAP AGREEMENTS SOLD SHORT†† |
| |||||||
Goldman Sachs International February 2011 U.S. Dollar Index Swap, Terminating 02/28/125 | 34,734 | $ | (49,341 | ) | ||||
|
| |||||||
| † | Value determined based on Level 1 inputs — See Note 4. |
| †† | Value determined based on Level 2 inputs — See Note 4. |
| 1 | The issuer operates under a Congressional charter; its securities are neither issued nor guaranteed by the U.S. Government. |
| 2 | On September 7, 2008, the issuer was placed in conservatorship by the Federal Housing Finance Agency (FHFA). As conservator, the FHFA has full powers to control the assets and operations of the firm. |
| 3 | Repurchase Agreements — See Note 5. |
| 4 | All or a portion of this security is pledged as currency index swap collateral at December 31, 2011. |
| 5 | Total Return based on U.S. Dollar Index +/- financing at a variable rate. |
| 218 | THE RYDEX FUNDSANNUALREPORT | See Notes to Financial Statements. |
WEAKENING DOLLAR 2x STRATEGY FUND
STATEMENT OF ASSETS AND LIABILITIES
December 31, 2011
ASSETS: | ||||
Investments, at value | $ | 599,910 | ||
Repurchase agreements, at value | 1,528,228 | |||
|
| |||
Total investments | 2,128,138 | |||
Segregated cash with broker | 30,600 | |||
Receivables: | ||||
Variation margin | 4,692 | |||
Fund shares sold | 3,978 | |||
|
| |||
Total assets | 2,167,408 | |||
|
| |||
LIABILITIES: | ||||
Unrealized depreciation on swap agreements | 49,341 | |||
Payable for: | ||||
Swap settlement | 24,257 | |||
Management fees | 1,730 | |||
Transfer agent and administrative fees | 480 | |||
Investor service fees | 480 | |||
Fund shares redeemed | 465 | |||
Portfolio accounting fees | 192 | |||
Miscellaneous | 6,813 | |||
|
| |||
Total liabilities | 83,758 | |||
|
| |||
NETASSETS | $ | 2,083,650 | ||
|
| |||
NETASSETSCONSISTOF: | ||||
Paid in capital | $ | 2,912,590 | ||
Undistributed net investment income | — | |||
Accumulated net realized loss on investments | (759,106 | ) | ||
Net unrealized depreciation on investments | (69,834 | ) | ||
|
| |||
Net assets | $ | 2,083,650 | ||
Capital shares outstanding | 85,669 | |||
Net asset value per share | $ | 24.32 | ||
|
|
STATEMENT OF OPERATIONS
Year Ended December 31, 2011
INVESTMENT INCOME: | ||||
Interest | $ | 1,863 | ||
|
| |||
Total investment income | 1,863 | |||
|
| |||
EXPENSES: | ||||
Management fees | 34,727 | |||
Transfer agent and administrative fees | 9,647 | |||
Investor service fees | 9,647 | |||
Portfolio accounting fees | 3,859 | |||
Custodian fees | 955 | |||
Trustees’ fees* | 391 | |||
Miscellaneous | 8,999 | |||
|
| |||
Total expenses | 68,225 | |||
|
| |||
Net investment loss | (66,362 | ) | ||
|
| |||
NET REALIZEDAND UNREALIZED GAIN (LOSS): | ||||
Net realized gain (loss) on: | ||||
Swap agreements | (89,557 | ) | ||
Futures contracts | 59,710 | |||
|
| |||
Net realized loss | (29,847 | ) | ||
|
| |||
Net change in unrealized appreciation (depreciation) on: | ||||
Investments | 22 | |||
Swap agreements | (62,731 | ) | ||
Futures contracts | (85,736 | ) | ||
|
| |||
Net change in unrealized appreciation (depreciation) | (148,445 | ) | ||
|
| |||
Net realized and unrealized loss | (178,292 | ) | ||
|
| |||
Net decrease in net assets resulting from operations | $ | (244,654 | ) | |
|
|
| * | Relates to Trustees not deemed “interested persons” within the meaning of Section 2(a)(19) of the 1940 Act. |
| See Notes to Financial Statements. | THE RYDEX FUNDSANNUALREPORT | 219 |
WEAKENING DOLLAR 2x STRATEGY FUND
STATEMENTS OF CHANGES IN NET ASSETS
| Year Ended December 31, 2011 | Year Ended December 31, 2010 | |||||||
INCREASE (DECREASE) IN NET ASSETS FROM OPERATIONS: | ||||||||
Net investment loss | $ | (66,362 | ) | $ | (55,663 | ) | ||
Net realized loss on investments | (29,847 | ) | (779,665 | ) | ||||
Net change in unrealized appreciation (depreciation) on investments | (148,445 | ) | 304,699 | |||||
|
|
|
| |||||
Net decrease in net assets resulting from operations | (244,654 | ) | (530,629 | ) | ||||
|
|
|
| |||||
CAPITALSHARETRANSACTIONS: | ||||||||
Proceeds from sale of shares | 25,622,519 | 23,120,221 | ||||||
Cost of shares redeemed | (26,595,917 | ) | (24,195,851 | ) | ||||
|
|
|
| |||||
Net decrease from capital share transactions | (973,398 | ) | (1,075,630 | ) | ||||
|
|
|
| |||||
Net decrease in net assets | (1,218,052 | ) | (1,606,259 | ) | ||||
NETASSETS: | ||||||||
Beginning of year | 3,301,702 | 4,907,961 | ||||||
|
|
|
| |||||
End of year | $ | 2,083,650 | $ | 3,301,702 | ||||
|
|
|
| |||||
Undistributed net investment income at end of year | $ | — | $ | — | ||||
|
|
|
| |||||
CAPITALSHAREACTIVITY: | ||||||||
Shares sold | 938,352 | 939,074 | ||||||
Shares redeemed | (983,413 | ) | (991,828 | ) | ||||
|
|
|
| |||||
Net decrease in shares | (45,061 | ) | (52,754 | ) | ||||
|
|
|
| |||||
| 220 | THE RYDEX FUNDSANNUALREPORT | See Notes to Financial Statements. |
WEAKENING DOLLAR 2x STRATEGY FUND
FINANCIAL HIGHLIGHTS
This table is presented to show selected data for a share outstanding throughout each period, and to assist shareholders in evaluating a Fund’s performance for the periods presented.
| Year Ended December 31, 2011 | Year Ended December 31, 2010 | Year Ended December 31, 2009 | Year Ended December 31, 2008 | Year Ended December 31, 2007 | ||||||||||||||||
Per Share Data | ||||||||||||||||||||
Net asset value, beginning of period | $ | 25.26 | $ | 26.75 | $ | 25.10 | $ | 28.60 | $ | 27.51 | ||||||||||
|
|
|
|
|
|
|
|
|
| |||||||||||
Income (loss) from investment operations: | ||||||||||||||||||||
Net investment income (loss)a | (.47 | ) | (.38 | ) | (.40 | ) | .07 | .89 | ||||||||||||
Net gain (loss) on investments (realized and unrealized) | (.47 | ) | (1.11 | ) | 2.06 | (3.57 | ) | 4.15 | ||||||||||||
|
|
|
|
|
|
|
|
|
| |||||||||||
Total from investment operations | (.94 | ) | (1.49 | ) | 1.66 | (3.50 | ) | 5.04 | ||||||||||||
|
|
|
|
|
|
|
|
|
| |||||||||||
Less distributions from: | ||||||||||||||||||||
Net investment income | — | — | (.01 | ) | — | (3.95 | ) | |||||||||||||
|
|
|
|
|
|
|
|
|
| |||||||||||
Total distributions | — | — | (.01 | ) | — | (3.95 | ) | |||||||||||||
|
|
|
|
|
|
|
|
|
| |||||||||||
Net asset value, end of period | $ | 24.32 | $ | 25.26 | $ | 26.75 | $ | 25.10 | $ | 28.60 | ||||||||||
|
|
|
|
|
|
|
|
|
| |||||||||||
Total Returnb | (3.68 | %) | (5.61 | %) | 6.61 | % | (12.24 | %) | 18.12 | % | ||||||||||
|
|
|
|
|
|
|
|
|
| |||||||||||
Ratios/Supplemental Data | ||||||||||||||||||||
Net assets, end of period (in thousands) | $ | 2,084 | $ | 3,302 | $ | 4,908 | $ | 10,965 | $ | 13,579 | ||||||||||
|
|
|
|
|
|
|
|
|
| |||||||||||
Ratios to average net assets: | ||||||||||||||||||||
Net investment income (loss) | (1.72 | %) | (1.55 | %) | (1.58 | %) | 0.23 | % | 3.02 | % | ||||||||||
Total expenses | 1.77 | % | 1.70 | % | 1.71 | % | 1.68 | % | 1.64 | % | ||||||||||
|
|
|
|
|
|
|
|
|
| |||||||||||
Portfolio turnover rate | — | — | — | — | — | |||||||||||||||
| a | Net investment income (loss) per share was computed using average shares outstanding throughout the period. |
| b | Total return does not reflect the impact of any additional fees charged by insurance companies and has not been annualized. |
| See Notes to Financial Statements. | THE RYDEX FUNDSANNUALREPORT | 221 |
PERFORMANCE REPORT AND FUND PROFILE (Unaudited) | December 31, 2011 |
OBJECTIVE: Seeks to provide capital appreciation by investing in companies that are involved in the real estate industry, including real estate investment trusts (“REITs”) (collectively, “Real Estate Companies”).
Real Estate Fund gained 2.26%, compared to a gain of 2.11% for the S&P 500 Index. Within the sector, Real Estate Investment Trusts (REITs), which compose 93% of the portfolio, contributed almost all of the return. Real Estate Management & Development segment detracted from performance.
REITs performed well, driven by their dividend payout. They also benefited from a revival in economic growth that aided occupancy and rents, as well as low interest rates, which enabled them to raise a record amount of capital in public markets and improve balance sheets. REIT sectors delivering double-digit gains in 2011 included the self-storage segment, apartment segment, health care segment and retail segment. Lodging, industrial, office and mortgage REITs were all down for the year.
The strongest performing stocks included Simon Property Group, Inc., Public Storage and HCP, Inc. Corporate Office Properties Trust, Forest City Enterprises, Inc. Class A and CBRE Group, Inc. detracted from performance for the year.
Standard & Poor’s 500 Index (S&P 500®) – a capitalization-weighted index covering 500 industrial, utility, transportation and financial companies of the U.S. markets (mostly NYSE Euronext issues).
Holdings Diversification (Market Exposure as % of Net Assets)
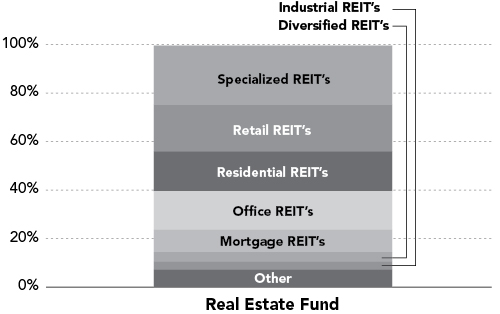
“Holdings Diversification (Market Exposure as % of Net Assets)” excludes any temporary cash investments.
Inception Date: October 1, 2001
Ten Largest Holdings (% of Total Net Assets) | ||||
Simon Property Group, Inc. | 3.5 | % | ||
Public Storage | 2.8 | % | ||
HCP, Inc. | 2.4 | % | ||
Equity Residential | 2.4 | % | ||
Ventas, Inc. | 2.3 | % | ||
Boston Properties, Inc. | 2.2 | % | ||
Vornado Realty Trust | 2.2 | % | ||
Annaly Capital Management, Inc. | 2.2 | % | ||
General Growth Properties, Inc. | 2.2 | % | ||
ProLogis, Inc. | 2.1 | % | ||
|
| |||
Top Ten Total | 24.3 | % | ||
|
| |||
“Ten Largest Holdings” exclude any temporary cash or derivative investments.
222 | THE RYDEX FUNDSANNUALREPORT
| PERFORMANCE REPORT AND FUND PROFILE (Unaudited) (concluded) |
REAL ESTATE FUND
Cumulative Fund Performance*
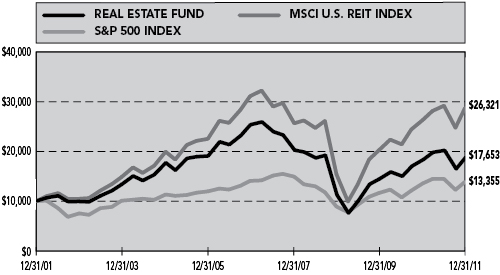
Average Annual Returns*
Periods Ended 12/31/11
| 1 Year | 5 Year | 10 Year | ||||||||||
Real Estate Fund | 2.26 | % | -5.46 | % | 5.85 | % | ||||||
MSCI U.S. REIT Index | 8.69 | % | -1.51 | % | 10.16 | % | ||||||
S&P 500 Index | 2.11 | % | -0.25 | % | 2.92 | % | ||||||
| * | The performance data represents past performance that is not predictive of future results. The investment return and principal value of an investment in the Fund will fluctuate so that an investor’s shares, when redeemed, may be worth more or less than their original cost. Returns are historical and include changes in principal and reinvested dividends and capital gains and do not reflect the effect of taxes. The S&P 500 Index and MSCI U.S. REIT Index are unmanaged indices and, unlike the Fund, have no management fees or operating expenses to reduce their reported returns. |
Returns do not reflect the impact of any additional fees charged by insurance companies.
THE RYDEX FUNDSANNUALREPORT | 223
| SCHEDULE OF INVESTMENTS | December 31, 2011 |
REAL ESTATE FUND
| SHARES | VALUE | |||||||
COMMON STOCKS† - 99.5% | ||||||||
REAL ESTATE INVESTMENT TRUSTS (REITs) - 94.2% |
| |||||||
Specialized REITs - 24.3% | ||||||||
Public Storage | 3,137 | $ | 421,801 | |||||
HCP, Inc. | 8,602 | 356,381 | ||||||
Ventas, Inc. | 6,235 | 343,736 | ||||||
Health Care REIT, Inc. | 5,120 | 279,194 | ||||||
Host Hotels & Resorts, Inc. | 18,664 | 275,667 | ||||||
Plum Creek Timber Company, Inc. | 5,650 | 206,564 | ||||||
Rayonier, Inc. | 4,508 | 201,192 | ||||||
Senior Housing Properties Trust | 7,267 | 163,071 | ||||||
Hospitality Properties Trust | 6,274 | 144,177 | ||||||
Extra Space Storage, Inc. | 5,278 | 127,886 | ||||||
Omega Healthcare Investors, Inc. | 6,324 | 122,369 | ||||||
LaSalle Hotel Properties | 5,008 | 121,244 | ||||||
Entertainment Properties Trust | 2,729 | 119,285 | ||||||
DiamondRock Hospitality Co. | 11,063 | 106,647 | ||||||
Healthcare Realty Trust, Inc. | 5,610 | 104,290 | ||||||
CubeSmart | 9,091 | 96,728 | ||||||
Potlatch Corp. | 3,030 | 94,263 | ||||||
Sovran Self Storage, Inc. | 2,181 | 93,063 | ||||||
National Health Investors, Inc. | 2,110 | 92,798 | ||||||
Medical Properties Trust, Inc. | 9,097 | 89,787 | ||||||
Sunstone Hotel Investors, Inc.* | 10,471 | 85,339 | ||||||
|
| |||||||
Total Specialized REITs | 3,645,482 | |||||||
|
| |||||||
Retail REITs - 19.3% | ||||||||
Simon Property Group, Inc. | 4,105 | 529,299 | ||||||
General Growth Properties, Inc. | 21,478 | 322,600 | ||||||
Kimco Realty Corp. | 13,520 | 219,565 | ||||||
Macerich Co. | 4,325 | 218,845 | ||||||
Federal Realty Investment Trust | 2,218 | 201,283 | ||||||
Realty Income Corp. | 5,211 | 182,177 | ||||||
Taubman Centers, Inc. | 2,576 | 159,970 | ||||||
Regency Centers Corp. | 4,212 | 158,455 | ||||||
DDR Corp. | 12,857 | 156,470 | ||||||
Weingarten Realty Investors | 6,461 | 140,979 | ||||||
National Retail Properties, Inc. | 5,328 | 140,553 | ||||||
Tanger Factory Outlet Centers | 4,616 | 135,341 | ||||||
CBL & Associates Properties, Inc. | 8,260 | 129,682 | ||||||
Equity One, Inc. | 6,991 | 118,707 | ||||||
Glimcher Realty Trust | 9,230 | 84,916 | ||||||
|
| |||||||
Total Retail REITs | 2,898,842 | |||||||
|
| |||||||
Residential REITs - 16.3% | ||||||||
Equity Residential | 6,189 | 352,959 | ||||||
AvalonBay Communities, Inc. | 2,326 | 303,776 | ||||||
UDR, Inc. | 8,094 | 203,159 | ||||||
Essex Property Trust, Inc. | 1,343 | 188,705 | ||||||
Camden Property Trust | 2,967 | 184,666 | ||||||
BRE Properties, Inc. | 3,343 | 168,755 | ||||||
American Campus Communities, Inc. | 3,568 | 149,713 | ||||||
Home Properties, Inc. | 2,505 | 144,213 | ||||||
Apartment Investment & Management Co. — Class A | 6,289 | 144,081 | ||||||
Equity Lifestyle Properties, Inc. | 2,132 | 142,183 | ||||||
Mid-America Apartment Communities, Inc. | 2,154 | 134,733 | ||||||
Post Properties, Inc. | 3,017 | 131,903 | ||||||
Colonial Properties Trust | 5,632 | 117,483 | ||||||
Education Realty Trust, Inc. | 8,320 | 85,114 | ||||||
|
| |||||||
Total Residential REITs | 2,451,443 | |||||||
|
| |||||||
Office REITs - 15.8% | ||||||||
Boston Properties, Inc. | 3,322 | 330,871 | ||||||
Digital Realty Trust, Inc. | 3,358 | 223,878 | ||||||
SL Green Realty Corp. | 3,076 | 204,985 | ||||||
Alexandria Real Estate Equities, Inc. | 2,585 | 178,287 | ||||||
Duke Realty Corp. | 12,456 | 150,095 | ||||||
Piedmont Office Realty Trust, Inc. — Class A | 8,590 | 146,374 | ||||||
BioMed Realty Trust, Inc. | 7,769 | 140,463 | ||||||
Mack-Cali Realty Corp. | 4,872 | 130,034 | ||||||
Douglas Emmett, Inc. | 7,049 | 128,574 | ||||||
Kilroy Realty Corp. | 3,350 | 127,534 | ||||||
Highwoods Properties, Inc. | 4,185 | 124,169 | ||||||
DuPont Fabros Technology, Inc. | 4,254 | 103,032 | ||||||
Corporate Office Properties Trust | 4,771 | 101,431 | ||||||
Brandywine Realty Trust | 10,400 | 98,800 | ||||||
CommonWealth REIT | 5,894 | 98,076 | ||||||
Lexington Realty Trust | 12,021 | 90,037 | ||||||
|
| |||||||
Total Office REITs | 2,376,640 | |||||||
|
| |||||||
Mortgage REITs - 9.3% | ||||||||
Annaly Capital Management, Inc. | 20,242 | 323,062 | ||||||
American Capital Agency Corp. | 7,325 | 205,686 | ||||||
MFA Financial, Inc. | 19,060 | 128,083 | ||||||
Hatteras Financial Corp. | 4,431 | 116,845 | ||||||
Starwood Property Trust, Inc. | 5,864 | 108,543 | ||||||
Invesco Mortgage Capital, Inc. | 7,439 | 104,518 | ||||||
Two Harbors Investment Corp. | 10,200 | 94,248 | ||||||
CYS Investments, Inc. | 6,565 | 86,264 | ||||||
Capstead Mortgage Corp. | 6,820 | 84,841 | ||||||
Anworth Mortgage Asset Corp. | 11,807 | 74,148 | ||||||
Redwood Trust, Inc. | 7,005 | 71,311 | ||||||
|
| |||||||
Total Mortgage REITs | 1,397,549 | |||||||
|
| |||||||
Diversified REITs - 4.0% | ||||||||
Vornado Realty Trust | 4,232 | 325,272 | ||||||
Liberty Property Trust | 5,318 | 164,220 | ||||||
Washington Real Estate Investment Trust | 4,136 | 113,120 | ||||||
|
| |||||||
Total Diversified REITs | 602,612 | |||||||
|
| |||||||
| 224 | THE RYDEX FUNDSANNUALREPORT | See Notes to Financial Statements. |
| SCHEDULE OF INVESTMENTS (concluded) | December 31, 2011 |
REAL ESTATE FUND
| SHARES | VALUE | |||||||
Industrial REITs - 3.3% | ||||||||
ProLogis, Inc. | 10,890 | $ | 311,345 | |||||
EastGroup Properties, Inc. | 2,136 | 92,873 | ||||||
First Industrial Realty Trust, Inc.* | 8,293 | 84,837 | ||||||
|
| |||||||
Total Industrial REITs | 489,055 | |||||||
|
| |||||||
Forest Products - 1.9% | ||||||||
Weyerhaeuser Co. | 15,039 | 280,778 | ||||||
|
| |||||||
Total Real Estate Investment Trusts (REITs) | 14,142,401 | |||||||
|
| |||||||
REAL ESTATE MANAGEMENT & DEVELOPMENT - 5.3% | ||||||||
Real Estate Services - 2.2% | ||||||||
CBRE Group, Inc. — Class A* | 12,248 | 186,415 | ||||||
Jones Lang LaSalle, Inc. | 2,259 | 138,386 | ||||||
|
| |||||||
Total Real Estate Services | 324,801 | |||||||
|
| |||||||
Real Estate Operating Companies - 1.6% | ||||||||
Brookfield Office Properties, Inc. | 15,140 | 236,790 | ||||||
|
| |||||||
Real Estate Management & Development - 0.8% | ||||||||
Forest City Enterprises, Inc. — Class A* | 10,342 | 122,242 | ||||||
|
| |||||||
Diversified Real Estate Activities - 0.7% | ||||||||
St. Joe Co.* | 6,652 | 97,518 | ||||||
|
| |||||||
Total Real Estate Management & Development | 781,351 | |||||||
|
| |||||||
Total Common Stocks | 14,923,752 | |||||||
|
| |||||||
| FACE AMOUNT | ||||||||
REPURCHASE AGREEMENT††,1 - 0.7% | ||||||||
Credit Suisse Group issued 12/30/11 at 0.00% due 01/03/12 | $ | 105,846 | 105,846 | |||||
|
| |||||||
Total Repurchase Agreement | 105,846 | |||||||
|
| |||||||
Total Investments – 100.2% | $ | 15,029,598 | ||||||
|
| |||||||
Liabilities, Less Other Assets – (0.2)% | (28,812 | ) | ||||||
|
| |||||||
Total Net Assets – 100.0% | $ | 15,000,786 | ||||||
| * | Non-income producing security. |
| † | Value determined based on Level 1 inputs — See Note 4. |
| †† | Value determined based on Level 2 inputs — See Note 4. |
| 1 | Repurchase Agreement — See Note 5. |
| REIT — Real Estate Investment Trust |
| See Notes to Financial Statements. | THE RYDEX FUNDSANNUALREPORT | 225 |
REAL ESTATE FUND
STATEMENT OF ASSETS AND LIABILITIES
December 31, 2011
ASSETS: | ||||
Investments, at value | $ | 14,923,752 | ||
Repurchase agreements, at value | 105,846 | |||
|
| |||
Total investments | 15,029,598 | |||
Receivables: | ||||
Securities sold | 278,347 | |||
Dividends | 95,167 | |||
|
| |||
Total assets | 15,403,112 | |||
|
| |||
LIABILITIES: | ||||
Payable for: | ||||
Fund shares redeemed | 349,131 | |||
Management fees | 10,359 | |||
Transfer agent and administrative fees | 3,047 | |||
Investor service fees | 3,047 | |||
Portfolio accounting fees | 1,218 | |||
Miscellaneous | 35,524 | |||
|
| |||
Total liabilities | 402,326 | |||
|
| |||
NETASSETS | $ | 15,000,786 | ||
|
| |||
NETASSETSCONSISTOF: | ||||
Paid in capital | $ | 23,808,525 | ||
Undistributed net investment income | 276,240 | |||
Accumulated net realized loss on investments | (15,551,893 | ) | ||
Net unrealized appreciation on investments | 6,467,914 | |||
|
| |||
Net assets | $ | 15,000,786 | ||
Capital shares outstanding | 579,227 | |||
Net asset value per share | $ | 25.90 | ||
|
|
STATEMENT OF OPERATIONS
Year Ended December 31, 2011
INVESTMENT INCOME: | ||||
Dividends (net of foreign withholding tax of $1,539) | $ | 643,467 | ||
Interest | 32 | |||
|
| |||
Total investment income | 643,499 | |||
|
| |||
| EXPENSES: | ||||
Management fees | 183,133 | |||
Transfer agent and administrative fees | 53,862 | |||
Investor service fees | 53,862 | |||
Portfolio accounting fees | 21,545 | |||
Custodian fees | 5,370 | |||
Trustees’ fees* | 2,239 | |||
Miscellaneous | 47,247 | |||
|
| |||
Total expenses | 367,258 | |||
|
| |||
Net investment income | 276,241 | |||
|
| |||
NET REALIZEDAND UNREALIZED GAIN (LOSS): | ||||
Net realized gain (loss) on: | ||||
Investments | 2,388,000 | |||
|
| |||
Net realized gain | 2,388,000 | |||
|
| |||
Net change in unrealized appreciation (depreciation) on: | ||||
Investments | (4,274,207 | ) | ||
|
| |||
Net change in unrealized appreciation (depreciation) | (4,274,207 | ) | ||
|
| |||
Net realized and unrealized loss | (1,886,207 | ) | ||
|
| |||
Net decrease in net assets resulting from operations | $ | (1,609,966 | ) | |
|
|
| * | Relates to Trustees not deemed “interested persons” within the meaning of Section 2(a)(19) of the 1940 Act. |
| 226 | THE RYDEX FUNDSANNUALREPORT | See Notes to Financial Statements. |
REAL ESTATE FUND
STATEMENTS OF CHANGES IN NET ASSETS
| Year Ended December 31, 2011 | Year Ended December 31, 2010 | |||||||
INCREASE (DECREASE) IN NET ASSETS FROM OPERATIONS: | ||||||||
Net investment income | $ | 276,241 | $ | 497,373 | ||||
Net realized gain on investments | 2,388,000 | 2,163,334 | ||||||
Net change in unrealized appreciation (depreciation) on investments | (4,274,207 | ) | 1,676,248 | |||||
|
|
|
| |||||
Net increase (decrease) in net assets resulting from operations | (1,609,966 | ) | 4,336,955 | |||||
|
|
|
| |||||
DISTRIBUTIONSTOSHAREHOLDERSFROM: | ||||||||
Net investment income | (469,840 | ) | (575,246 | ) | ||||
|
|
|
| |||||
Total distributions to shareholders | (469,840 | ) | (575,246 | ) | ||||
|
|
|
| |||||
CAPITALSHARETRANSACTIONS: | ||||||||
Proceeds from sale of shares | 97,117,326 | 159,529,139 | ||||||
Distributions reinvested | 469,840 | 575,246 | ||||||
Cost of shares redeemed | (105,768,554 | ) | (172,476,141 | ) | ||||
|
|
|
| |||||
Net decrease from capital share transactions | (8,181,388 | ) | (12,371,756 | ) | ||||
|
|
|
| |||||
Net decrease in net assets | (10,261,194 | ) | (8,610,047 | ) | ||||
NETASSETS: | ||||||||
Beginning of year | 25,261,980 | 33,872,027 | ||||||
|
|
|
| |||||
End of year | $ | 15,000,786 | $ | 25,261,980 | ||||
|
|
|
| |||||
Undistributed net investment income at end of year | $ | 276,240 | $ | 497,372 | ||||
|
|
|
| |||||
CAPITALSHAREACTIVITY: | ||||||||
Shares sold | 3,558,431 | 6,687,209 | ||||||
Shares issued from reinvestment of distributions | 18,839 | 22,818 | ||||||
Shares redeemed | (3,962,377 | ) | (7,325,879 | ) | ||||
|
|
|
| |||||
Net decrease in shares | (385,107 | ) | (615,852 | ) | ||||
|
|
|
| |||||
| See Notes to Financial Statements. | THE RYDEX FUNDSANNUALREPORT | 227 |
REAL ESTATE FUND
FINANCIAL HIGHLIGHTS
This table is presented to show selected data for a share outstanding throughout each period, and to assist shareholders in evaluating a Fund’s performance for the periods presented.
| Year Ended December 31, 2011 | Year Ended December 31, 2010 | Year Ended December 31, 2009 | Year Ended December 31, 2008 | Year Ended December 31, 2007 | ||||||||||||||||
Per Share Data | ||||||||||||||||||||
Net asset value, beginning of period | $ | 26.20 | $ | 21.44 | $ | 17.51 | $ | 34.35 | $ | 50.25 | ||||||||||
|
|
|
|
|
|
|
|
|
| |||||||||||
Income (loss) from investment operations: | ||||||||||||||||||||
Net investment incomea | .35 | .35 | .50 | .79 | .63 | |||||||||||||||
Net gain (loss) on investments (realized and unrealized) | .20 | 4.97 | 3.90 | (15.47 | ) | (10.02 | ) | |||||||||||||
|
|
|
|
|
|
|
|
|
| |||||||||||
Total from investment operations | .55 | 5.32 | 4.40 | (14.68 | ) | (9.39 | ) | |||||||||||||
|
|
|
|
|
|
|
|
|
| |||||||||||
Less distributions from: | ||||||||||||||||||||
Net investment income | (.85 | ) | (.56 | ) | (.47 | ) | (.20 | ) | (1.09 | ) | ||||||||||
Net realized gains | — | — | — | (1.96 | ) | (5.42 | ) | |||||||||||||
|
|
|
|
|
|
|
|
|
| |||||||||||
Total distributions | (.85 | ) | (.56 | ) | (.47 | ) | (2.16 | ) | (6.51 | ) | ||||||||||
|
|
|
|
|
|
|
|
|
| |||||||||||
Net asset value, end of period | $ | 25.90 | $ | 26.20 | $ | 21.44 | $ | 17.51 | $ | 34.35 | ||||||||||
|
|
|
|
|
|
|
|
|
| |||||||||||
Total Returnb | 2.26 | % | 24.86 | % | 25.27 | % | (41.64 | %) | (19.12 | %) | ||||||||||
|
|
|
|
|
|
|
|
|
| |||||||||||
Ratios/Supplemental Data | ||||||||||||||||||||
Net assets, end of period (in thousands) | $ | 15,001 | $ | 25,262 | $ | 33,872 | $ | 15,437 | $ | 31,757 | ||||||||||
|
|
|
|
|
|
|
|
|
| |||||||||||
Ratios to average net assets: | ||||||||||||||||||||
Net investment income | 1.28 | % | 1.49 | % | 2.83 | % | 2.61 | % | 1.28 | % | ||||||||||
Total expenses | 1.70 | % | 1.65 | % | 1.65 | % | 1.62 | % | 1.60 | % | ||||||||||
|
|
|
|
|
|
|
|
|
| |||||||||||
Portfolio turnover rate | 351 | % | 394 | % | 450 | % | 288 | % | 226 | % | ||||||||||
| a | Net investment income per share was computed using average shares outstanding throughout the period. |
| b | Total return does not reflect the impact of any additional fees charged by insurance companies and has not been annualized. |
| 228 | THE RYDEX FUNDSANNUALREPORT | See Notes to Financial Statements. |
This page intentionally left blank.
THE RYDEX FUNDSANNUALREPORT | 229
| PERFORMANCE REPORT AND FUND PROFILE (Unaudited) | December 31, 2011 |
GOVERNMENT LONG BOND 1.2x STRATEGY FUND
OBJECTIVE: Seeks to provide investment results that correspond, before fees and expenses, to a benchmark for U.S. Government securities on a daily basis. The Fund’s current benchmark is 120% of the daily price movement of the Long Treasury Bond. The Long Treasury Bond is the U.S. Treasury bond with the longest maturity, which is currently 30 years. The price movement of the Long Treasury Bond is based on the daily price change of the most recently issued Long Treasury Bond. The Fund does not seek to achieve its investment objective over a period of time greater than one day.
The strong performance of Treasuries in 2011 helped the Government Long Bond 1.2x Strategy Fund close up 41.52% for the year, as investors ignored an unprecedented downgrade of the U.S. credit rating in August. The yield on the 30-year bond stayed above 4% for the first half of 2011. But a worsening European sovereign debt situation and the Fed’s confirmation that it would shift asset purchases to longer-term securities to spur U.S. economic growth helped drive the yield below 4%. The yield slipped below 3% as safe-haven buying continued through the end of the year.
Derivatives in the Fund are used to provide additional exposure to composition of the benchmark in the highest efficient manner and to provide leverage, not for hedging purposes.
Due to the compounding of daily returns, leveraged and inverse funds’ returns over periods other than one day will likely differ in amount and possibly direction from the benchmark return for the same period. Investors should monitor their leveraged and inverse funds’ holdings to ensure that they are consistent with their strategies, as frequently as daily.
The effects of compounding may cause the longer-term correlation of the fund to its benchmark to diminish. The apparent discrepancy between the leveraged and unleveraged indices is the result of compounding, which is described briefly on page 4 of this report.
Holdings Diversification (Market Exposure as % of Net Assets)
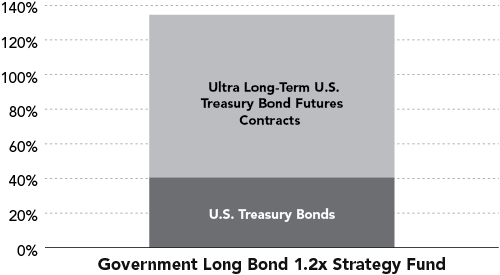
“Holdings Diversification (Market Exposure as % of Net Assets)” excludes any temporary cash investments.
Inception Date: August 18, 1997
The Fund invests principally in U.S. Government securities and in derivative investments such as futures contracts.
230 | THE RYDEX FUNDSANNUALREPORT
| PERFORMANCE REPORT AND FUND PROFILE (Unaudited) (concluded) |
GOVERNMENT LONG BOND 1.2x STRATEGY FUND
Cumulative Fund Performance*
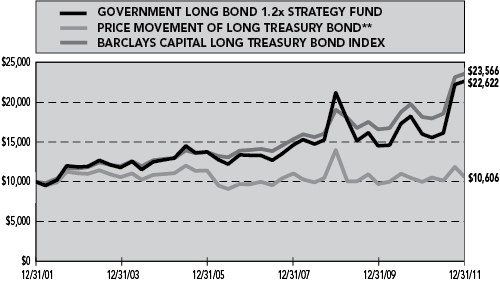
Average Annual Returns*
Periods Ended 12/31/11
| 1 Year | 5 Year | 10 Year | ||||||||||
Government Long Bond 1.2x Strategy Fund | 41.52 | % | 11.16 | % | 8.51 | % | ||||||
Price Movement of Long Treasury Bond** | 6.26 | % | 1.88 | % | 0.59 | % | ||||||
Barclays Capital Long Treasury Bond Index | 29.93 | % | 11.00 | % | 8.95 | % | ||||||
| * | The performance data represents past performance that is not predictive of future results. The investment return and principal value of an investment in the Fund will fluctuate so that an investor’s shares, when redeemed, may be worth more or less than their original cost. Returns are historical and include changes in principal and reinvested dividends and capital gains and do not reflect the effect of taxes. The Barclays Capital Long Treasury Bond Index and Price Movement of Long Treasury Bond are unmanaged indices and, unlike the Fund, have no management fees or operating expenses to reduce their reported returns. |
| ** | Does not reflect any interest. |
Returns do not reflect the impact of any additional fees charged by insurance companies.
THE RYDEX FUNDSANNUALREPORT | 231
| SCHEDULE OF INVESTMENTS | December 31, 2011 |
GOVERNMENT LONG BOND 1.2x STRATEGY FUND
| FACE AMOUNT | VALUE | |||||||
U.S. GOVERNMENT SECURITIES† - 40.5% |
| |||||||
U.S. Treasury Bond 3.12% due 11/15/41 | $ | 15,991,000 | $ | 16,710,595 | ||||
|
| |||||||
Total U.S. Government Securities | 16,710,595 | |||||||
|
| |||||||
FEDERAL AGENCY DISCOUNT NOTES†† - 24.2% |
| |||||||
Farmer Mac1 | ||||||||
0.02% due 03/27/12 | 2,000,000 | 1,999,906 | ||||||
0.02% due 04/03/12 | 1,000,000 | 999,949 | ||||||
|
| |||||||
Total Farmer Mac | 2,999,855 | |||||||
|
| |||||||
Federal Home Loan Bank1 0.01% due 01/25/12 | 2,000,000 | 1,999,987 | ||||||
|
| |||||||
Freddie Mac2 | ||||||||
0.01% due 01/25/12 | 1,000,000 | 999,988 | ||||||
0.01% due 04/05/12 | 1,000,000 | 999,948 | ||||||
|
| |||||||
Total Freddie Mac | 1,999,936 | |||||||
|
| |||||||
Federal Farm Credit Bank1 0.08% due 08/24/12 | 2,000,000 | 1,999,220 | ||||||
|
| |||||||
Fannie Mae2 0.01% due 03/13/12 | 1,000,000 | 999,961 | ||||||
|
| |||||||
Total Federal Agency Discount Notes | 9,998,959 | |||||||
|
| |||||||
REPURCHASE AGREEMENTS††,3 - 30.6% |
| |||||||
Mizuho Financial Group, Inc. issued 12/30/11 at 0.00% due 01/03/12 | 3,261,797 | 3,261,797 | ||||||
HSBC Group issued 12/30/11 at 0.00% due 01/03/12 | 3,122,391 | 3,122,391 | ||||||
Deutsche Bank issued 12/30/11 at 0.00% due 01/03/12 | 3,122,391 | 3,122,391 | ||||||
Credit Suisse Group issued 12/30/11 at 0.00% due 01/03/12 | 3,122,391 | 3,122,391 | ||||||
|
| |||||||
Total Repurchase Agreements | 12,628,970 | |||||||
|
| |||||||
Total Investments – 95.3% | 39,338,524 | |||||||
|
| |||||||
Cash & Other Assets, Less Liabilities – 4.7% | 1,919,645 | |||||||
|
| |||||||
Total Net Assets – 100.0% | $ | 41,258,169 | ||||||
| CONTRACTS | UNREALIZED GAIN | |||||||
INTEREST RATE FUTURES CONTRACTS PURCHASED† | ||||||||
March 2012 Ultra Long-Term U.S. Treasury Bond Futures Contracts (Aggregate Value of Contracts $38,765,375) | 242 | $ | 329,660 | |||||
|
| |||||||
| † | Value determined based on Level 1 inputs — See Note 4. |
| †† | Value determined based on Level 2 inputs — See Note 4. |
| 1 | The issuer operates under a Congressional charter; its securities are neither issued nor guaranteed by the U.S. Government. |
| 2 | On September 7, 2008, the issuer was placed in conservatorship by the Federal Housing Finance Agency (FHFA). As conservator, the FHFA has full powers to control the assets and operations of the firm. |
| 3 | Repurchase Agreements — See Note 5. |
| 232 | THE RYDEX FUNDSANNUALREPORT | See Notes to Financial Statements. |
GOVERNMENT LONG BOND 1.2x STRATEGY FUND
STATEMENT OF ASSETS AND LIABILITIES
December 31, 2011
ASSETS: | ||||
Investments, at value | $ | 26,709,554 | ||
Repurchase agreements, at value | 12,628,970 | |||
|
| |||
Total investments | 39,338,524 | |||
Segregated cash with broker | 1,391,500 | |||
Receivables: | ||||
Fund shares sold | 492,367 | |||
Variation margin | 136,125 | |||
Securities sold | 104,500 | |||
Interest | 64,928 | |||
|
| |||
Total assets | 41,527,944 | |||
|
| |||
LIABILITIES: | ||||
Payable for: | ||||
Fund shares redeemed | 178,174 | |||
Management fees | 16,011 | |||
Investor service fees | 8,005 | |||
Transfer agent and administrative fees | 6,404 | |||
Portfolio accounting fees | 3,202 | |||
Miscellaneous | 57,979 | |||
|
| |||
Total liabilities | 269,775 | |||
|
| |||
NETASSETS | $ | 41,258,169 | ||
|
| |||
NETASSETSCONSISTOF: | ||||
Paid in capital | $ | 31,062,069 | ||
Undistributed net investment income | — | |||
Accumulated net realized gain on investments | 9,302,920 | |||
Net unrealized appreciation on investments | 893,180 | |||
|
| |||
Net assets | $ | 41,258,169 | ||
Capital shares outstanding | 2,092,325 | |||
Net asset value per share | $ | 19.72 | ||
|
|
STATEMENT OF OPERATIONS
Year Ended December 31, 2011
INVESTMENT INCOME: | ||||
Interest | $ | 1,139,546 | ||
|
| |||
Total investment income | 1,139,546 | |||
|
| |||
EXPENSES: | ||||
Management fees | 183,917 | |||
Transfer agent and administrative fees | 73,568 | |||
Investor service fees | 91,959 | |||
Portfolio accounting fees | 36,783 | |||
Professional fees | 50,505 | |||
Printing expenses | 29,730 | |||
Custodian fees | 10,723 | |||
Trustees’ fees* | 3,249 | |||
Miscellaneous | (6,905 | ) | ||
|
| |||
Total expenses | 473,529 | |||
|
| |||
Net investment income | 666,017 | |||
|
| |||
NET REALIZEDAND UNREALIZED GAIN (LOSS): | ||||
Net realized gain (loss) on: | ||||
Investments | 12,161,361 | |||
Futures contracts | 4,557,141 | |||
|
| |||
Net realized gain | 16,718,502 | |||
|
| |||
Net change in unrealized appreciation (depreciation) on: | ||||
Investments | 476,730 | |||
Futures contracts | 108,642 | |||
|
| |||
Net change in unrealized appreciation (depreciation) | 585,372 | |||
|
| |||
Net realized and unrealized gain | 17,303,874 | |||
|
| |||
Net increase in net assets resulting from operations | $ | 17,969,891 | ||
|
|
| * | Relates to Trustees not deemed “interested persons” within the meaning of Section 2(a)(19) of the 1940 Act. |
| See Notes to Financial Statements. | THE RYDEX FUNDSANNUALREPORT | 233 |
GOVERNMENT LONG BOND 1.2x STRATEGY FUND
STATEMENTS OF CHANGES IN NET ASSETS
| Year Ended December 31, 2011 | Year Ended December 31, 2010 | |||||||
INCREASE (DECREASE) IN NET ASSETS FROM OPERATIONS: | ||||||||
Net investment income | $ | 666,017 | $ | 1,060,729 | ||||
Net realized gain (loss) on investments | 16,718,502 | (74,418 | ) | |||||
Net change in unrealized appreciation (depreciation) on investments | 585,372 | 620,529 | ||||||
|
|
|
| |||||
Net increase in net assets resulting from operations | 17,969,891 | 1,606,840 | ||||||
|
|
|
| |||||
DISTRIBUTIONSTOSHAREHOLDERSFROM: | ||||||||
Net investment income | (666,150 | ) | (1,069,767 | ) | ||||
|
|
|
| |||||
Total distributions to shareholders | (666,150 | ) | (1,069,767 | ) | ||||
|
|
|
| |||||
CAPITALSHARETRANSACTIONS: | ||||||||
Proceeds from sale of shares | 516,116,894 | 646,517,465 | ||||||
Distributions reinvested | 666,150 | 1,069,678 | ||||||
Cost of shares redeemed | (509,661,255 | ) | (655,383,267 | ) | ||||
|
|
|
| |||||
Net increase (decrease) from capital share transactions | 7,121,789 | (7,796,124 | ) | |||||
|
|
|
| |||||
Net increase (decrease) in net assets | 24,425,530 | (7,259,051 | ) | |||||
NETASSETS: | ||||||||
Beginning of year | 16,832,639 | 24,091,690 | ||||||
|
|
|
| |||||
End of year | $ | 41,258,169 | $ | 16,832,639 | ||||
|
|
|
| |||||
Undistributed net investment income at end of year | $ | — | $ | — | ||||
|
|
|
| |||||
CAPITALSHAREACTIVITY:1 | ||||||||
Shares sold | 33,790,980 | 44,922,690 | ||||||
Shares issued from reinvestment of distributions | 42,389 | 76,372 | ||||||
Shares redeemed | (32,926,021 | ) | (45,641,653 | ) | ||||
|
|
|
| |||||
Net increase (decrease) in shares | 907,348 | (642,591 | ) | |||||
|
|
|
| |||||
| 1 | The share activity for the year ended December 31, 2010 and the period January 1, 2011 through December 1, 2011 have been restated to reflect a 1:2 reverse share split effective December 2, 2011 — See Note 10. |
| 234 | THE RYDEX FUNDSANNUALREPORT | See Notes to Financial Statements. |
GOVERNMENT LONG BOND 1.2x STRATEGY FUND
FINANCIAL HIGHLIGHTS
This table is presented to show selected data for a share outstanding throughout each period, and to assist shareholders in evaluating a Fund’s performance for the periods presented.
| Year Ended December 31, 2011c | Year Ended December 31, 2010c | Year Ended December 31, 2009c | Year Ended December 31, 2008c | Year Ended December 31, 2007c | ||||||||||||||||
Per Share Data | ||||||||||||||||||||
Net asset value, beginning of period | $ | 14.20 | $ | 13.18 | $ | 34.48 | $ | 24.48 | $ | 23.12 | ||||||||||
|
|
|
|
|
|
|
|
|
| |||||||||||
Income (loss) from investment operations: | ||||||||||||||||||||
Net investment incomea | .29 | .34 | .56 | .70 | .82 | |||||||||||||||
Net gain (loss) on investments (realized and unrealized) | 5.52 | 1.00 | (10.66 | ) | 10.00 | 1.36 | ||||||||||||||
|
|
|
|
|
|
|
|
|
| |||||||||||
Total from investment operations | 5.81 | 1.34 | (10.10 | ) | 10.70 | 2.18 | ||||||||||||||
|
|
|
|
|
|
|
|
|
| |||||||||||
Less distributions from: | ||||||||||||||||||||
Net investment income | (.29 | ) | (.32 | ) | (.56 | ) | (.70 | ) | (.82 | ) | ||||||||||
Net realized gains | — | — | (10.64 | ) | — | — | ||||||||||||||
|
|
|
|
|
|
|
|
|
| |||||||||||
Total distributions | (.29 | ) | (.32 | ) | (11.20 | ) | (.70 | ) | (.82 | ) | ||||||||||
|
|
|
|
|
|
|
|
|
| |||||||||||
Net asset value, end of period | $ | 19.72 | $ | 14.20 | $ | 13.18 | $ | 34.48 | $ | 24.48 | ||||||||||
|
|
|
|
|
|
|
|
|
| |||||||||||
Total Returnb | 41.52 | % | 10.14 | % | (31.54 | %) | 44.87 | % | 9.77 | % | ||||||||||
|
|
|
|
|
|
|
|
|
| |||||||||||
Ratios/Supplemental Data | ||||||||||||||||||||
Net assets, end of period (in thousands) | $ | 41,258 | $ | 16,833 | $ | 24,092 | $ | 63,594 | $ | 52,250 | ||||||||||
|
|
|
|
|
|
|
|
|
| |||||||||||
Ratios to average net assets: | ||||||||||||||||||||
Net investment income | 1.81 | % | 2.39 | % | 2.29 | % | 2.75 | % | 3.60 | % | ||||||||||
Total expenses | 1.29 | % | 1.25 | % | 1.26 | % | 1.22 | % | 1.20 | % | ||||||||||
|
|
|
|
|
|
|
|
|
| |||||||||||
Portfolio turnover rate | 2,585 | % | 2,452 | % | 1,694 | % | 1,372 | % | 1,367 | % | ||||||||||
| a | Net investment income per share was computed using average shares outstanding throughout the period. |
| b | Total return does not reflect the impact of any additional fees charged by insurance companies and has not been annualized. |
| c | Per share amounts for the years ended December 31, 2007 — December 31, 2010 and the period January 1, 2011 through December 1, 2011 have been restated to reflect a 1:2 reverse stock split effective December 2, 2011. |
| See Notes to Financial Statements. | THE RYDEX FUNDSANNUALREPORT | 235 |
| PERFORMANCE REPORT AND FUND PROFILE (Unaudited) | December 31, 2011 |
INVERSE GOVERNMENT LONG BOND STRATEGY FUND
OBJECTIVE: Seeks to provide total returns that inversely correlate, before fees and expenses, to the price movements of a benchmark for U.S. Treasury debt instruments or futures contracts on a specified debt instrument on a daily basis. The Fund’s current benchmark is the daily price movement of the Long Treasury Bond. The Long Treasury Bond is the U.S. Treasury bond with the longest maturity, which is currently 30 years. The price movement of the Long Treasury Bond is based on the daily price change of the most recently issued Long Treasury Bond. The Fund does not seek to achieve its investment objective over a period of time greater than one day.
The strong performance of Treasuries in 2011 resulted in negative movement for Inverse Government Long Bond Strategy Fund in the higher price/lower yield environment, causing the Fund to return -30.44% for the year. The yield on the 30-year bond stayed above 4% for the first half of 2011. But a worsening European sovereign debt situation and the Fed’s confirmation that it would shift asset purchases to longer-term securities to spur U.S. economic growth helped drive the yield below 4%. The yield slipped below 3% as safe-haven buying continued through the end of the year.
Derivatives in the Fund are used to help provide exposure to the composition of the benchmark in the highest efficient manner, not for hedging purposes.
Due to the compounding of daily returns, leveraged and inverse funds’ returns over periods other than one day will likely differ in amount and possibly direction from the benchmark return for the same period. Investors should monitor their leveraged and inverse funds’ holdings to ensure that they are consistent with their strategies, as frequently as daily.
The effects of compounding may cause the longer-term correlation of the fund to its benchmark to diminish. The apparent discrepancy between the leveraged and unleveraged indices is the result of compounding, which is described briefly on page 4 of this report.
Holdings Diversification (Market Exposure as % of Net Assets)
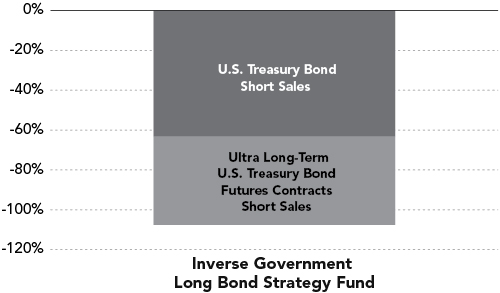
“Holdings Diversification (Market Exposure as % of Net Assets)” excludes any temporary cash investments.
Inception Date: May 1, 2003
The Fund invests principally in short sales and derivative investments such as futures contracts.
236 | THE RYDEX FUNDSANNUALREPORT
PERFORMANCE REPORT AND FUND PROFILE (Unaudited) (concluded)
INVERSE GOVERNMENT LONG BOND STRATEGY FUND
Cumulative Fund Performance*
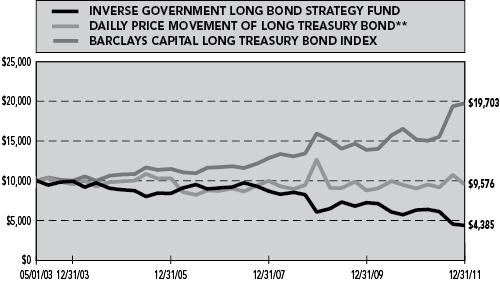
Average Annual Returns*
Periods Ended 12/31/11
| 1 Year | 5 Year | Since Inception (05/01/03) | ||||||||||
Inverse Government Long Bond Strategy Fund | -30.44 | % | -13.56 | % | -9.07 | % | ||||||
Barclays Capital Long Treasury Bond Index | 29.93 | % | 11.00 | % | 8.14 | % | ||||||
Daily Price Movement of Long Treasury Bond** | 6.26 | % | 1.88 | % | -0.50 | % | ||||||
| * | The performance data represents past performance that is not predictive of future results. The investment return and principal value of an investment in the Fund will fluctuate so that an investor’s shares, when redeemed, may be worth more or less than their original cost. Returns are historical and include changes in principal and reinvested dividends and capital gains and do not reflect the effect of taxes. The Barclays Capital Long Treasury Bond Index and Price Movement of Long Treasury Bond are unmanaged indices and, unlike the Fund, have no management fees or operating expenses to reduce their reported returns. |
| ** | Does not reflect any interest. |
Returns do not reflect the impact of any additional fees charged by insurance companies.
THE RYDEX FUNDSANNUALREPORT | 237
| SCHEDULE OF INVESTMENTS | December 31, 2011 |
INVERSE GOVERNMENT LONG BOND STRATEGY FUND
| FACE AMOUNT | VALUE | |||||||
FEDERAL AGENCY DISCOUNT NOTES†† - 44.0% |
| |||||||
Federal Home Loan Bank1 | $ | 1,000,000 | $ | 1,000,000 | ||||
Farmer Mac1 | 1,000,000 | 999,999 | ||||||
Fannie Mae2 | 1,000,000 | 999,982 | ||||||
|
| |||||||
Total Federal Agency Discount Notes | 2,999,981 | |||||||
|
| |||||||
REPURCHASE AGREEMENTS†† - 163.8% | ||||||||
Individual Repurchase Agreements4 | ||||||||
Barclays Capital issued 12/30/11 at (0.05%) due 01/03/12 (secured by a U.S. Treasury Bond, at a rate of 3.125% and maturing 11/15/41 as collateral, with a value of $5,874,694) to be repurchased at $5,759,472 | 5,759,503 | 5,759,503 | ||||||
Joint Repurchase Agreements3 | ||||||||
Mizuho Financial Group, Inc. issued 12/30/11 at 0.00% due 01/03/12 | 1,399,264 | 1,399,264 | ||||||
Credit Suisse Group issued 12/30/11 at 0.00% due 01/03/12 | 1,339,461 | 1,339,461 | ||||||
Deutsche Bank issued 12/30/11 at 0.00% due 01/03/12 | 1,339,461 | 1,339,461 | ||||||
HSBC Group issued 12/30/11 at 0.00% due 01/03/12 | 1,339,461 | 1,339,461 | ||||||
|
| |||||||
Total Repurchase Agreements | 11,177,150 | |||||||
|
| |||||||
Total Long Investments - 207.8% | 14,177,131 | |||||||
|
| |||||||
U.S. GOVERNMENT SECURITIES SOLD SHORT† - (63.0)% | ||||||||
U.S. Treasury Bond 3.12% due 11/15/41 | $ | 4,115,000 | $ | (4,300,175 | ) | |||
|
| |||||||
Total U.S. Government Securities Sold Short | (4,300,175 | ) | ||||||
|
| |||||||
Liabilities, Less Cash & Other Assets – (44.8)% | (3,054,721 | ) | ||||||
|
| |||||||
Total Net Assets – 100.0% | $ | 6,822,235 | ||||||
| CONTRACTS | UNREALIZED LOSS | |||||||
INTEREST RATE FUTURES CONTRACTS SOLD SHORT† | ||||||||
March 2012 Ultra Long-Term U.S. Treasury Bond Futures Contracts (Aggregate Value of Contracts $3,043,563) | 19 | $ | (20,465 | ) | ||||
|
| |||||||
| † | Value determined based on Level 1 inputs — See Note 4. |
| †† | Value determined based on Level 2 inputs — See Note 4. |
| 1 | The issuer operates under a Congressional charter; its securities are neither issued nor guaranteed by the U.S. Government. |
| 2 | On September 7, 2008, the issuer was placed in conservatorship by the Federal Housing Finance Agency (FHFA). As conservator, the FHFA has full powers to control the assets and operations of the firm. |
| 3 | Repurchase Agreements — See Note 5. |
| 4 | All or portion of this security is pledged as short collateral at December 31, 2011. |
| 238 | THE RYDEX FUNDSANNUALREPORT | See Notes to Financial Statements. |
INVERSE GOVERNMENT LONG BOND STRATEGY FUND
STATEMENT OF ASSETS AND LIABILITIES
December 31, 2011
ASSETS: | ||||
Investments, at value | $ | 2,999,981 | ||
Repurchase agreements, at value | 11,177,150 | |||
|
| |||
Total investments | 14,177,131 | |||
Segregated cash with broker | 109,250 | |||
Receivables: | ||||
Fund shares sold | 2,558 | |||
|
| |||
Total assets | 14,288,939 | |||
|
| |||
LIABILITIES: | ||||
Securities sold short, at value (proceeds $4,350,378) | 4,300,175 | |||
Payable for: | ||||
Securities purchased | 1,567,500 | |||
Fund shares redeemed | 1,526,775 | |||
Interest | 22,657 | |||
Variation margin | 10,688 | |||
Management fees | 8,110 | |||
Transfer agent and administrative fees | 2,253 | |||
Investor service fees | 2,253 | |||
Portfolio accounting fees | 901 | |||
Miscellaneous | 25,392 | |||
|
| |||
Total liabilities | 7,466,704 | |||
|
| |||
NETASSETS | $ | 6,822,235 | ||
|
| |||
NETASSETSCONSISTOF: | ||||
Paid in capital | $ | 23,863,004 | ||
Undistributed net investment income | — | |||
Accumulated net realized loss on investments | (17,070,507 | ) | ||
Net unrealized appreciation on investments | 29,738 | |||
|
| |||
Net assets | $ | 6,822,235 | ||
Capital shares outstanding | 692,338 | |||
Net asset value per share | $ | 9.85 | ||
|
|
STATEMENT OF OPERATIONS
Year Ended December 31, 2011
INVESTMENT INCOME: | ||||
Interest | $ | 9,783 | ||
|
| |||
Total investment income | 9,783 | |||
|
| |||
EXPENSES: | ||||
Management fees | 138,822 | |||
Transfer agent and administrative fees | 38,562 | |||
Investor service fees | 38,562 | |||
Portfolio accounting fees | 15,425 | |||
Interest expense | 483,465 | |||
Custodian fees | 3,726 | |||
Trustees’ fees* | 1,547 | |||
Miscellaneous | 34,909 | |||
|
| |||
Total expenses | 755,018 | |||
|
| |||
Net investment loss | (745,235 | ) | ||
|
| |||
NET REALIZEDAND UNREALIZED GAIN (LOSS): | ||||
Net realized gain (loss) on: | ||||
Futures contracts | (1,530,371 | ) | ||
Securities sold short | (2,236,270 | ) | ||
|
| |||
Net realized loss | (3,766,641 | ) | ||
|
| |||
Net change in unrealized appreciation (depreciation) on: | ||||
Investments | (138 | ) | ||
Securities sold short | (230,095 | ) | ||
Futures contracts | 20,584 | |||
|
| |||
Net change in unrealized appreciation (depreciation) | (209,649 | ) | ||
|
| |||
Net realized and unrealized loss | (3,976,290 | ) | ||
|
| |||
Net decrease in net assets resulting from operations | $ | (4,721,525 | ) | |
|
|
| * | Relates to Trustees not deemed “interested persons” within the meaning of Section 2(a)(19) of the 1940 Act. |
| See Notes to Financial Statements. | THE RYDEX FUNDSANNUALREPORT | 239 |
INVERSE GOVERNMENT LONG BOND STRATEGY FUND
STATEMENTS OF CHANGES IN NET ASSETS
| Year Ended December 31, 2011 | Year Ended December 31, 2010 | |||||||
INCREASE (DECREASE) IN NET ASSETS FROM OPERATIONS: | ||||||||
Net investment loss | $ | (745,235 | ) | $ | (953,506 | ) | ||
Net realized loss on investments | (3,766,641 | ) | (814,122 | ) | ||||
Net change in unrealized appreciation (depreciation) on investments | (209,649 | ) | (867,897 | ) | ||||
|
|
|
| |||||
Net decrease in net assets resulting from operations | (4,721,525 | ) | (2,635,525 | ) | ||||
|
|
|
| |||||
CAPITALSHARETRANSACTIONS: | ||||||||
Proceeds from sale of shares | 298,887,611 | 461,891,203 | ||||||
Cost of shares redeemed | (304,524,470 | ) | (470,014,885 | ) | ||||
|
|
|
| |||||
Net decrease from capital share transactions | (5,636,859 | ) | (8,123,682 | ) | ||||
|
|
|
| |||||
Net decrease in net assets | (10,358,384 | ) | (10,759,207 | ) | ||||
NETASSETS: | ||||||||
Beginning of year | 17,180,619 | 27,939,826 | ||||||
|
|
|
| |||||
End of year | $ | 6,822,235 | $ | 17,180,619 | ||||
|
|
|
| |||||
Undistributed net investment income at end of year | $ | — | $ | — | ||||
|
|
|
| |||||
CAPITALSHAREACTIVITY: | ||||||||
Shares sold | 22,747,274 | 32,095,890 | ||||||
Shares redeemed | (23,268,301 | ) | (32,603,212 | ) | ||||
|
|
|
| |||||
Net decrease in shares | (521,027 | ) | (507,322 | ) | ||||
|
|
|
| |||||
| 240 | THE RYDEX FUNDSANNUALREPORT | See Notes to Financial Statements. |
INVERSE GOVERNMENT LONG BOND STRATEGY FUND
FINANCIAL HIGHLIGHTS
This table is presented to show selected data for a share outstanding throughout each period, and to assist shareholders in evaluating a Fund’s performance for the periods presented.
| Year Ended December 31, 2011 | Year Ended December 31, 2010 | Year Ended December 31, 2009 | Year Ended December 31, 2008 | Year Ended December 31, 2007 | ||||||||||||||||
Per Share Data | ||||||||||||||||||||
Net asset value, beginning of period | $ | 14.16 | $ | 16.24 | $ | 13.60 | $ | 19.58 | $ | 21.55 | ||||||||||
|
|
|
|
|
|
|
|
|
| |||||||||||
Income (loss) from investment operations: | ||||||||||||||||||||
Net investment income (loss)a | (.63 | ) | (.73 | ) | (.33 | ) | (.21 | ) | .70 | |||||||||||
Net gain (loss) on investments (realized and unrealized) | (3.68 | ) | (1.35 | ) | 2.97 | (5.68 | ) | (1.67 | ) | |||||||||||
|
|
|
|
|
|
|
|
|
| |||||||||||
Total from investment operations | (4.31 | ) | (2.08 | ) | 2.64 | (5.89 | ) | (.97 | ) | |||||||||||
|
|
|
|
|
|
|
|
|
| |||||||||||
Less distributions from: | ||||||||||||||||||||
Net investment income | — | — | — | (.09 | ) | (1.00 | ) | |||||||||||||
|
|
|
|
|
|
|
|
|
| |||||||||||
Total distributions | — | — | — | (.09 | ) | (1.00 | ) | |||||||||||||
|
|
|
|
|
|
|
|
|
| |||||||||||
Net asset value, end of period | $ | 9.85 | $ | 14.16 | $ | 16.24 | $ | 13.60 | $ | 19.58 | ||||||||||
|
|
|
|
|
|
|
|
|
| |||||||||||
Total Returnb | (30.44 | %) | (12.81 | %) | 19.41 | % | (30.21 | %) | (4.51 | %) | ||||||||||
|
|
|
|
|
|
|
|
|
| |||||||||||
Ratios/Supplemental Data | ||||||||||||||||||||
Net assets, end of period (in thousands) | $ | 6,822 | $ | 17,181 | $ | 27,940 | $ | 10,625 | $ | 17,611 | ||||||||||
|
|
|
|
|
|
|
|
|
| |||||||||||
Ratios to average net assets: | ||||||||||||||||||||
Net investment income (loss) | (4.83 | %) | (5.12 | %) | (2.09 | %) | (1.12 | %) | 3.17 | % | ||||||||||
Total expenses | 4.89 | % | 5.31 | % | 2.23 | % | 4.12 | % | 3.83 | % | ||||||||||
Operating expensesc | 1.76 | % | 1.70 | % | 1.71 | % | 1.65 | % | 1.63 | % | ||||||||||
|
|
|
|
|
|
|
|
|
| |||||||||||
Portfolio turnover rate | 2,031 | % | 3,555 | % | — | 2,851 | % | 1,123 | % | |||||||||||
| a | Net investment income (loss) per share was computed using average shares outstanding throughout the period. |
| b | Total return does not reflect the impact of any additional fees charged by insurance companies and has not been annualized. |
| c | Operating expenses exclude interest from securities sold short. |
| See Notes to Financial Statements. | THE RYDEX FUNDSANNUALREPORT | 241 |
| PERFORMANCE REPORT AND FUND PROFILE (Unaudited) | December 31, 2011 |
U.S. GOVERNMENT MONEY MARKET FUND
OBJECTIVE: Seeks to provide security of principal, high current income, and liquidity.
For the year ended December 31, 2011, U.S. Government Money Market Fund returned 0.00%.
Money market yields continued to languish in the near-zero short-term interest-rate environment maintained by the Fed. An estimated $1.2 trillion has moved out of the universe of money market funds since February 2009, due to a combination of the record-low Treasury yields, new Securities and Exchange Commission (SEC) regulations and investor concern about the money market funds’ exposure to European banks.
All money market funds struggled to attain higher yields, while adhering to the new money market regulations established by the SEC in February 2010. The money market reforms enacted by the SEC are considered to be working well to provide money market funds additional safety and liquidity.
Since plans by Congress and the Administration to reduce the U.S. Government debt fell short of needed action in August 2011, Standard & Poor’s lowered the credit rating of the United States’ long-term debt to AA+ from AAA. Short-term debt, affirmed at A-1+, remains a top-tier approved credit for this Fund. Although long-term Government agencies were downgraded as well, the short-term agency debt, held in the Fund, remains at A-1+.
Uncertainty surrounding sovereign credit risk led us to halt investment in counterparties with major exposure to Greece, Italy, Portugal and Spain.
As the Federal Reserve continues its programs to keep interest rates low, the Fund continues to waive shareholder fees.
Holdings Diversification (Market Exposure as % of Net Assets)
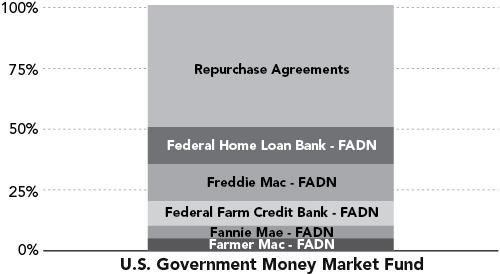
FADN - Federal Agency Discount Notes
Inception Date: May 7, 1997
The Fund invests principally in money market instruments issued or guaranteed as to principal and interest by the U.S. Government, its agencies or instrumentalities and enters into repurchase agreements fully collateralized by U.S. government securities.
242 | THE RYDEX FUNDSANNUALREPORT
| PERFORMANCE REPORT AND FUND PROFILE (Unaudited) (concluded) |
U.S. GOVERNMENT MONEY MARKET FUND
Average Annual Returns*
Periods Ended 12/31/11
| 1 Year | 5 Year | 10 Year | ||||||||||
U.S. Government Money Market Fund | 0.00 | % | 1.01 | % | 1.15 | % | ||||||
| * | The performance data represents past performance that is not predictive of future results. The investment return and principal value of an investment in the Fund will fluctuate so that an investor’s shares, when redeemed, may be worth more or less than their original cost. Returns are historical and include changes in principal and reinvested dividends and capital gains and do not reflect the effect of taxes. |
| Returns do not reflect the impact of any additional fees charged by insurance companies. |
THE RYDEX FUNDSANNUALREPORT | 243
| SCHEDULE OF INVESTMENTS | December 31, 2011 |
U.S. GOVERNMENT MONEY MARKET FUND
| FACE AMOUNT | VALUE | |||||||
FEDERAL AGENCY DISCOUNT NOTES†† - 50.8% |
| |||||||
Federal Home Loan Bank1 | ||||||||
0.07% due 01/18/12 | $ | 20,000,000 | $ | 19,999,339 | ||||
0.09% due 02/29/12 | 10,000,000 | 9,998,525 | ||||||
|
| |||||||
Total Federal Home Loan Bank | 29,997,864 | |||||||
|
| |||||||
Freddie Mac2 | ||||||||
0.08% due 04/02/12 | 10,000,000 | 9,997,955 | ||||||
0.05% due 06/11/12 | 10,000,000 | 9,997,750 | ||||||
0.06% due 05/29/12 | 10,000,000 | 9,997,310 | ||||||
|
| |||||||
Total Freddie Mac | 29,993,015 | |||||||
|
| |||||||
Federal Farm Credit Bank1 | ||||||||
0.14% due 03/27/12 | 10,000,000 | 9,996,656 | ||||||
0.13% due 09/24/12 | 10,000,000 | 9,990,358 | ||||||
|
| |||||||
Total Federal Farm Credit Bank | 19,987,014 | |||||||
|
| |||||||
Fannie Mae2 | 10,000,000 | 9,998,944 | ||||||
|
| |||||||
Farmer Mac1 | 10,000,000 | 9,997,445 | ||||||
|
| |||||||
Total Federal Agency Discount Notes | 99,974,282 | |||||||
|
| |||||||
REPURCHASE AGREEMENTS††,3 - 50.1% | ||||||||
Mizuho Financial Group, Inc. issued 12/30/11 at 0.00% due 01/03/12 | 25,436,295 | 25,436,295 | ||||||
HSBC Group issued 12/30/11 at 0.00% due 01/03/12 | 24,349,178 | 24,349,178 | ||||||
Deutsche Bank issued 12/30/11 at 0.00% due 01/03/12 | 24,349,178 | 24,349,178 | ||||||
Credit Suisse Group issued 12/30/11 at 0.00% due 01/03/12 | 24,349,177 | 24,349,177 | ||||||
|
| |||||||
Total Repurchase Agreements | 98,483,828 | |||||||
|
| |||||||
Total Investments - 100.9% | $ | 198,458,110 | ||||||
|
| |||||||
Liabilities - (0.9)% | (1,818,365 | ) | ||||||
|
| |||||||
Total Net Assets - 100.0% | $ | 196,639,745 | ||||||
| †† | Value determined based on Level 2 inputs — See Note 4. |
| 1 | The issuer operates under a Congressional charter; its securities are neither issued nor guaranteed by the U.S. Government. |
| 2 | On September 7, 2008, the issuer was placed in conservatorship by the Federal Housing Finance Agency (FHFA). As conservator, the FHFA has full powers to control the assets and operations of the firm. |
| 3 | Repurchase Agreements — See Note 5. |
| 244 | THE RYDEX FUNDSANNUALREPORT | See Notes to Financial Statements. |
U.S. GOVERNMENT MONEY MARKET FUND
STATEMENT OF ASSETS AND LIABILITIES
December 31, 2011
ASSETS: | ||||
Investments, at value | $ | 99,974,282 | ||
Repurchase agreements, at value | 98,483,828 | |||
|
| |||
Total investments | 198,458,110 | |||
|
| |||
Total assets | 198,458,110 | |||
|
| |||
LIABILITIES: | ||||
Payable for: | ||||
Fund shares redeemed | 1,478,045 | |||
Miscellaneous | 340,320 | |||
|
| |||
Total liabilities | 1,818,365 | |||
|
| |||
NET ASSETS | $ | 196,639,745 | ||
|
| |||
NET ASSETS CONSISTOF: | ||||
Paid in capital | $ | 196,635,981 | ||
Undistributed net investment income | 3,286 | |||
Accumulated net realized gain on investments | 478 | |||
Net unrealized appreciation on investments | — | |||
|
| |||
Net assets | $ | 196,639,745 | ||
Capital shares outstanding | 196,655,582 | |||
Net asset value per share | $ | 1.00 | ||
|
|
STATEMENT OF OPERATIONS
Year Ended December 31, 2011
INVESTMENT INCOME: | ||||
Interest | $ | 201,101 | ||
|
| |||
Total investment income | 201,101 | |||
|
| |||
EXPENSES: | ||||
Management fees | 1,111,465 | |||
Transfer agent and administrative fees | 444,591 | |||
Investor service fees | 555,733 | |||
Portfolio accounting fees | 219,267 | |||
Professional fees | 196,863 | |||
Printing expenses | 158,094 | |||
Custodian fees | 55,421 | |||
Trustees’ fees* | 22,413 | |||
Miscellaneous | 105,284 | |||
|
| |||
Total expenses | 2,869,131 | |||
Less: | ||||
Expenses waived by service company | (662,970 | ) | ||
Expenses waived by distributor | (555,743 | ) | ||
Expenses waived/reimbursed by advisor | (1,452,584 | ) | ||
|
| |||
Total waived expenses | (2,671,297 | ) | ||
|
| |||
Net expenses | 197,834 | |||
|
| |||
Net investment income | 3,267 | |||
|
| |||
NET REALIZEDAND UNREALIZED GAIN (LOSS): |
| |||
Net realized gain (loss) on: | ||||
Investments | 478 | |||
|
| |||
Net realized gain | 478 | |||
|
| |||
Net increase in net assets resulting from operations | $ | 3,745 | ||
|
| |||
| * | Relates to Trustees not deemed “interested persons” within the meaning of Section 2(a)(19) of the 1940 Act. |
| See Notes to Financial Statements. | THE RYDEX FUNDSANNUALREPORT | 245 |
U.S. GOVERNMENT MONEY MARKET FUND
STATEMENTS OF CHANGES IN NET ASSETS
| Year Ended December 31, 2011 | Year Ended December 31, 2010 | |||||||
INCREASE (DECREASE)IN NET ASSETS FROM OPERATIONS: | ||||||||
Net investment income | $ | 3,267 | $ | 13,401 | ||||
Net realized gain on investments | 478 | — | ||||||
|
|
|
| |||||
Net increase in net assets resulting from operations | 3,745 | 13,401 | ||||||
|
|
|
| |||||
DISTRIBUTIONS TO SHAREHOLDERS FROM: | ||||||||
Net investment income | (7,356 | ) | (13,400 | ) | ||||
Net realized gains | — | (7,879 | ) | |||||
|
|
|
| |||||
Total distributions to shareholders | (7,356 | ) | (21,279 | ) | ||||
|
|
|
| |||||
CAPITAL SHARE TRANSACTIONS: | ||||||||
Proceeds from sale of shares | 897,529,678 | 920,292,877 | ||||||
Distributions reinvested | 7,297 | 21,279 | ||||||
Cost of shares redeemed | (908,675,849 | ) | (943,975,363 | ) | ||||
|
|
|
| |||||
Net decrease from capital share transactions | (11,138,874 | ) | (23,661,207 | ) | ||||
|
|
|
| |||||
Net decrease in net assets | (11,142,485 | ) | (23,669,085 | ) | ||||
NET ASSETS: | ||||||||
Beginning of year | 207,782,230 | 231,451,315 | ||||||
|
|
|
| |||||
End of year | $ | 196,639,745 | $ | 207,782,230 | ||||
|
|
|
| |||||
Undistributed net investment income at end of year | $ | 3,286 | $ | 7,375 | ||||
|
|
|
| |||||
CAPITAL SHARE ACTIVITY: | ||||||||
Shares sold | 897,529,678 | 920,292,876 | ||||||
Shares issued from reinvestment of distributions | 7,297 | 21,280 | ||||||
Shares redeemed | (908,675,849 | ) | (943,975,363 | ) | ||||
|
|
|
| |||||
Net decrease in shares | (11,138,874 | ) | (23,661,207 | ) | ||||
|
|
|
| |||||
| 246 | THE RYDEX FUNDSANNUALREPORT | See Notes to Financial Statements. |
U.S. GOVERNMENT MONEY MARKET FUND
FINANCIAL HIGHLIGHTS
This table is presented to show selected data for a share outstanding throughout each period, and to assist shareholders in evaluating a Fund’s performance for the periods presented.
| Year Ended December 31, 2011 | Year Ended December 31, 2010 | Year Ended December 31, 2009 | Year Ended December 31, 2008 | Year Ended December 31, 2007 | ||||||||||||||||
Per Share Data | ||||||||||||||||||||
Net asset value, beginning of period | $ | 1.00 | $ | 1.00 | $ | 1.00 | $ | 1.00 | $ | 1.00 | ||||||||||
|
|
|
|
|
|
|
|
|
| |||||||||||
Income (loss) from investment operations: | ||||||||||||||||||||
Net investment incomea | — | b | — | b | — | b | .01 | .04 | ||||||||||||
Net gain on investments (realized and unrealized) | — | b | — | — | b | — | b | — | ||||||||||||
|
|
|
|
|
|
|
|
|
| |||||||||||
Total from investment operations | — | b | — | b | — | b | .01 | .04 | ||||||||||||
|
|
|
|
|
|
|
|
|
| |||||||||||
Less distributions from: | ||||||||||||||||||||
Net investment income | — | b | — | b | — | b | (.01 | ) | (.04 | ) | ||||||||||
|
|
|
|
|
|
|
|
|
| |||||||||||
Total distributions | — | b | — | b | — | b | (.01 | ) | (.04 | ) | ||||||||||
|
|
|
|
|
|
|
|
|
| |||||||||||
Net asset value, end of period | $ | 1.00 | $ | 1.00 | $ | 1.00 | $ | 1.00 | $ | 1.00 | ||||||||||
|
|
|
|
|
|
|
|
|
| |||||||||||
Total Returnc | 0.00 | % | 0.01 | % | 0.06 | % | 1.14 | % | 3.90 | % | ||||||||||
|
|
|
|
|
|
|
|
|
| |||||||||||
Ratios/Supplemental Data | ||||||||||||||||||||
Net assets, end of period (in thousands) | $ | 196,640 | $ | 207,782 | $ | 231,451 | $ | 360,946 | $ | 277,346 | ||||||||||
|
|
|
|
|
|
|
|
|
| |||||||||||
Ratios to average net assets: | ||||||||||||||||||||
Net investment income | — | e | 0.01 | % | 0.02 | % | 1.09 | % | 3.80 | % | ||||||||||
Total expenses | 1.29 | % | 1.25 | % | 1.28 | % | 1.22 | % | 1.19 | % | ||||||||||
Net expensesd | 0.09 | % | 0.18 | % | 0.54 | % | 1.22 | % | 1.19 | % | ||||||||||
|
|
|
|
|
|
|
|
|
| |||||||||||
Portfolio turnover rate | — | — | — | — | — | |||||||||||||||
| a | Net investment income per share was computed using average shares outstanding throughout the period. |
| b | Less than $0.01 per share. |
| c | Total return does not reflect the impact of any additional fees charged by insurance companies and has not been annualized. |
| d | Net expense information reflects the expense ratios after expense waivers. |
| e | Less than 0.01%. |
THE RYDEX FUNDSANNUALREPORT | 247
| 1. | Organization and Significant Accounting Policies |
Organization
The Rydex Variable Trust (the “Trust”), a Delaware business trust, is registered with the SEC under the Investment Company Act of 1940 (the “1940 Act”) as a non-diversified, open-ended investment company and is authorized to issue an unlimited number of no par value shares. The Trust offers shares of the Funds to insurance companies for their variable annuity and variable life insurance contracts.
At December 31, 2011, the Trust consisted of fifty-seven separate funds. This report covers the Target Beta and Money Market funds (the “Funds”), while the other funds are contained in separate reports.
Rydex Investments (“RI”) provides advisory services, and Rydex Fund Services, LLC (“RFS”) provides transfer agent, administrative, and accounting services to the Trust. Rydex Distributors, LLC (“RDL”) acts as principal underwriter for the Trust. RI, RFS and RDL are affiliated entities.
The Funds are designed and operated to accommodate frequent trading by shareholders and, unlike most mutual funds, offer unlimited exchange privileges with no minimum holding periods or transactions fees, which may cause the Funds to experience high portfolio turnover.
Significant Accounting Policies
The following significant accounting policies are in conformity with U.S. generally accepted accounting principles and are consistently followed by the Trust. This requires management to make estimates and assumptions that affect the reported amount of assets and liabilities and disclosure of contingent assets and liabilities at the date of the financial statements and the reported amounts of revenues and expenses during the reporting period. Actual results could differ from these estimates. All time references are based on Eastern Time.
A. Equity securities listed on an exchange (New York Stock Exchange (“NYSE”) or American Stock Exchange) are valued at the last quoted sales price as of the close of business on the NYSE on the valuation date. Equity securities listed on the NASDAQ market system are valued at the NASDAQ Official Closing Price on the valuation date.
The value of futures contracts purchased and sold by the Funds are accounted for using the unrealized gain or loss on the contracts that is determined by marking the contracts to their current realized settlement prices. Financial futures contracts are valued at the 4:00 p.m. price on the valuation date. In the event that the exchange for a specific futures contract closes earlier than 4:00 p.m., the futures contract is valued at the Official Settlement Price of the exchange. However, the underlying securities from which the futures contract value is derived are monitored until 4:00 p.m. to determine if fair valuation would provide a more accurate valuation.
The U.S. Government Money Market Fund values debt securities at amortized cost pursuant to Rule 2a-7 of the 1940 Act, which approximates market value.
With the exception of the U.S. Government Money Market Fund, non-U.S. government securities are valued by either independent pricing services, the last traded fill price, or at the reported bid price at the close of business. Other debt securities with a maturity of greater than 60 days at acquisition are valued at prices that reflect broker/dealer-supplied valuations or are obtained from independent pricing services, which may consider the trade activity, treasury benchmarks, yield or price of bonds of comparable quality, coupon, maturity, and type, as well as prices quoted by dealers who make markets in such securities. Short-term debt securities with a maturity of 60 days or less at acquisition and repurchase agreements are valued at amortized cost, which approximates market value.
The value of equity index swap agreements entered into by a Fund is accounted for using the unrealized gain or loss on the agreements that is determined by marking the agreements to the last quoted value of the index that the swap pertains to at the close of the NYSE. The swap’s market value is then adjusted to include dividends accrued, financing charges and/or interest associated with the swap agreements.
The value of currency index swap agreements entered into by a Fund is accounted for using the unrealized gain or loss on the agreements that is determined by marking the agreements to the broker quote.
Investments for which market quotations are not readily available are fair valued as determined in good faith by RI under the direction of the Board of Trustees using methods established or ratified by the Board of Trustees. These methods include, but are not limited to: (i) using general information as to how these securities and assets trade; (ii) in connection with futures contracts and options thereupon, and other derivative investments, using information as to how (a) these contracts and other derivative investments trade in the futures or other derivative markets, respectively, and (b) the securities underlying these contracts and other derivative investments trade in the cash market; and (iii) using other information and considerations, including current values in related markets.
B. Security transactions are recorded on the trade date for financial reporting purposes. Realized gains and losses from securities transactions are recorded using the identified cost basis. Proceeds from lawsuits related to investment holdings are recorded as realized gains. Dividend income is recorded on the ex-dividend date, net of applicable taxes withheld by foreign countries. Taxable non-cash dividends are recorded as dividend income. Interest income, including amortization of premiums and accretion of discount, is accrued on a daily basis. Distributions received from investments in REITs are recorded as dividend income on the ex-dividend date, subject to reclassification upon notice of the character of such distribution by the issuer.
C. Net investment income is computed and dividends are declared daily in the Government Long Bond 1.2x Strategy Fund and the U.S. Government Money Market Fund. Income
248 | THE RYDEX FUNDSANNUALREPORT
NOTES TO FINANCIAL STATEMENTS (continued)
dividends in these Funds are accrued daily. Dividends are reinvested in additional shares unless shareholders request payment in cash. Distributions of net investment income in the remaining Funds and distributions of net realized gains, if any, in all Funds are declared at least annually and recorded on the ex-dividend date and are determined in accordance with income tax regulations which may differ from U.S. generally accepted accounting principles.
D. When a Fund engages in a short sale of a security, an amount equal to the proceeds is reflected as an asset and an equivalent liability. The amount of the liability is subsequently marked-to-market to reflect the market value of the short sale. The Fund maintains a segregated account of cash and/or securities as collateral for short sales. The Fund is exposed to market risk based on the amount, if any, that the market value of the security exceeds the market value of the securities in the segregated account.
Fees, if any, paid to brokers to borrow securities in connection with short sales are recorded as interest expense. In addition, the Fund must pay out the dividend rate of the equity or coupon rate of the treasury obligation to the lender and record this as an expense. Short dividend or interest expense is a cost associated with the investment objective of short sales transactions, rather than an operational cost associated with the day-to-day management of any mutual fund. The Funds may also receive rebate income from the broker resulting from the investment of the proceeds from securities sold short.
E. Upon entering into a futures contract, a Fund deposits and maintains as collateral such initial margin as required by the exchange on which the transaction is affected. Pursuant to the contract, the Fund agrees to receive from or pay to the broker an amount of cash equal to the daily fluctuation in value of the contract. Such receipts or payments are known as variation margin and are recorded by the Fund as unrealized gains or losses. When the contract is closed, the Fund records a realized gain or loss equal to the difference between the value of the contract at the time it was opened and the value at the time it was closed.
F. Swap agreements are marked-to-market daily and the change, if any, is recorded as unrealized gain or loss. Payments received or made as a result of an agreement or termination of the agreement are recognized as realized gains or losses.
G. Investment securities and other assets and liabilities denominated in foreign currencies are translated into U.S. dollar amounts at the date of valuation. Purchases and sales of investment securities and income and expense items denominated in foreign currencies are translated into U.S. dollar amounts on the respective dates of such transactions. The Funds do not isolate that portion of the results of operations resulting from changes in foreign exchange rates on investments from the fluctuations arising from changes in market prices of securities held. Such fluctuations are included with the net realized and unrealized gain and loss from investments.
Reported net realized foreign exchange gains or losses arise from sales of foreign currencies and currency gains or losses realized between the trade and settlement dates on investment transactions. Net unrealized exchange gains and losses arise from changes in the fair values of assets and liabilities other than investments in securities at the fiscal period end, resulting from changes in exchange rates.
H. Certain U.S. Government and Agency Obligations are traded on a discount basis; the interest rates shown on the Schedules of Investments reflect the effective rates paid at the time of purchase by the Funds. Other securities bear interest at the rates shown, payable at fixed dates through maturity.
I. The Funds may leave cash overnight in their cash account with the custodian, U.S. Bank. Periodically, a Fund may have cash due to the custodian bank as an overdraft balance. A fee is incurred on this overdraft, calculated by multiplying the overdraft by a rate based on the federal funds rate. Segregated cash with the broker is held as collateral for investments in derivative instruments such as futures contracts or swap agreements.
J. Throughout the normal course of business, the Funds enter into contracts that contain a variety of representations and warranties which provide general indemnifications. The Funds’ maximum exposure under these arrangements is unknown, as this would involve future claims that may be made against the Funds and/or their affiliates that have not yet occurred. However, based on experience, the Funds expect the risk of loss to be remote.
| 2. | Financial Instruments |
As part of their investment strategies, the Funds utilize short sales and a variety of derivative instruments, including futures and swap agreements. These investments involve, to varying degrees, elements of market risk and risks in excess of the amounts recognized in the Statements of Assets and Liabilities.
A short sale is a transaction in which a Fund sells a security it does not own. If the security sold short decreases in price between the time the Fund sells the security and closes its short position, that Fund will realize a gain on the transaction. Conversely, if the security increases in price during the period, that Fund will realize a loss on the transaction. The risk of such price increases is the principal risk of engaging in short sales.
A futures contract is an agreement to purchase (long) or sell (short) an agreed amount of securities or other instruments at a set price for delivery at a future date. There are significant risks associated with a Fund’s or an underlying fund’s use of futures contracts and related options, including (i) there may be an imperfect or no correlation between the changes in market value of the underlying asset and the prices of futures contracts; (ii) there may not be a liquid secondary market for a futures contract; (iii) trading restrictions or limitations may be imposed by an exchange; and (iv) government regulations may restrict trading in
| THE RYDEX FUNDSANNUALREPORT | 249 |
NOTES TO FINANCIAL STATEMENTS (continued)
futures contracts. When investing in futures, there is minimal counterparty credit risk to the Fund because futures are exchange-traded and the exchange’s clearinghouse, as counterparty to all exchange-traded futures, guarantees against default.
A swap is an agreement that obligates two parties to exchange a series of cash flows at specified intervals based upon or calculated by reference to changes in specified prices or rates for a specified amount of an underlying asset. A Fund bears the risk of loss of the amount expected to be received under a swap agreement in the event of the default or bankruptcy of a swap agreement counterparty. Additionally, there is no guarantee that a Fund or an underlying fund could eliminate its exposure under an outstanding swap agreement by entering into an offsetting swap agreement with the same or another party.
In conjunction with the use of short sales, futures and swap agreements, the Funds are required to maintain collateral in various forms. The Funds use, where appropriate, depending on the financial instrument utilized and the broker involved, margin deposits at the broker, cash and/or securities segregated at the custodian bank, discount notes, or the repurchase agreements allocated to each Fund.
The Trust has established counterparty credit guidelines and enters into transactions only with financial institutions of investment grade or better. The Trust monitors the counterparty credit risk.
| 3. | Fees and Other Transactions with Affiliates |
Under the terms of an investment advisory contract, the Funds pay RI investment advisory fees calculated at the annualized rates below, based on the average daily net assets of the Funds for the year:
Fund | Management Fees (as a % of Net Assets) | |||
Nova Fund | 0.75 | % | ||
Inverse S&P 500 Strategy Fund | 0.90 | % | ||
Nasdaq-100® Fund | 0.75 | % | ||
Inverse Nasdaq-100® Strategy Fund | 0.90 | % | ||
S&P 500 2x Strategy Fund | 0.90 | % | ||
Nasdaq-100® 2x Strategy Fund | 0.90 | % | ||
Mid-Cap 1.5x Strategy Fund | 0.90 | % | ||
Inverse Mid-Cap Strategy Fund | 0.90 | % | ||
Russell 2000® 2x Strategy Fund | 0.90 | % | ||
Russell 2000® 1.5x Strategy Fund | 0.90 | % | ||
Inverse Russell 2000® Strategy Fund | 0.90 | % | ||
Dow 2x Strategy Fund | 0.90 | % | ||
Inverse Dow 2x Strategy Fund | 0.90 | % | ||
S&P 500 Pure Growth Fund | 0.75 | % | ||
S&P 500 Pure Value Fund | 0.75 | % | ||
S&P MidCap 400 Pure Growth Fund | 0.75 | % | ||
S&P MidCap 400 Pure Value Fund | 0.75 | % | ||
S&P SmallCap 600 Pure Growth Fund | 0.75 | % | ||
S&P SmallCap 600 Pure Value Fund | 0.75 | % | ||
Europe 1.25x Strategy Fund | 0.90 | % | ||
Fund | Management Fees (as a % of Net Assets) | |||
Japan 2x Strategy Fund | 0.75 | % | ||
Strengthening Dollar 2x Strategy Fund | 0.90 | % | ||
Weakening Dollar 2x Strategy Fund | 0.90 | % | ||
Real Estate Fund | 0.85 | % | ||
Government Long Bond 1.2x Strategy Fund | 0.50 | % | ||
Inverse Government Long Bond Strategy Fund | 0.90 | % | ||
U.S. Government Money Market Fund | 0.50 | % | ||
RFS provides transfer agent and administrative services to the Trust for fees calculated at the annualized rates based on the average daily net assets of the Funds. For these services, RFS receives the following:
Fund | Transfer Agent and Administrative Fees (as a % of Net Assets) | |||
Government Long Bond 1.2x Strategy Fund | 0.20 | % | ||
U.S. Government Money Market Fund | 0.20 | % | ||
Remaining Funds | 0.25 | % | ||
RFS also provides accounting services to the Funds for fees calculated at annualized rates below, based on the average daily net assets of each Fund.
Fund Accounting | (as a % of net assets) | |||
On the first $250 million | 0.10 | % | ||
On the next $250 million | 0.075 | % | ||
On the next $250 million | 0.05 | % | ||
Over $750 million | 0.03 | % | ||
RFS engages external service providers to perform other necessary services for the Trust, such as audit related services, legal services, printing and mailing, etc., on a pass-through basis. Such expenses are allocated to various Funds within the complex based on relative net assets.
The Trust has adopted an Investor Services Plan for which RDL and other firms that provide investor services (“Service Providers”) may receive compensation. The Funds will pay investor service fees to RDL at an annual rate not to exceed 0.25% of average daily net assets. RDL, in turn, will compensate Service Providers for providing such services, while retaining a portion of such payments to compensate itself for investor services it performs.
RI and its affiliates have voluntarily agreed to waive their fees and/or reimburse expense, including but not limited to accounting, shareholder investor services and investment advisory fees, in an attempt to maintain a positive net yield for the U.S. Government Money Market Fund. RI or its affiliates may terminate this voluntary waiver at any time upon notice to the Fund. When shareholder investor services fees are waived, dealer compensation will be reduced to the extent of such waiver.
Certain officers and trustees of the Trust are also officers of RI, RFS and RDL.
| 250 | THE RYDEX FUNDSANNUALREPORT |
NOTES TO FINANCIAL STATEMENTS (continued)
| 4. | Fair Value Measurement |
In accordance with U.S. generally accepted accounting principles, fair value is defined as the price that the Fund would receive to sell an investment or pay to transfer a liability in an orderly transaction with an independent buyer in the principal market, or in the absence of a principal market the most advantageous market for the investment or liability. A three-tier hierarchy is utilized to distinguish between (1) inputs that reflect the assumptions market participants would use in pricing an asset or liability developed based on market data obtained from sources independent of the reporting entity (observable inputs) and (2) inputs that reflect the reporting entity’s own assumptions about the assumptions market participants would use in pricing an asset or liability developed based on the best information available in the circumstances (unobservable inputs) and to establish classification of fair value measurements for disclosure purposes. Various inputs are used in determining the value of the Funds’ investments. The inputs are summarized in the three broad levels listed below:
Level 1 — | quoted prices in active markets for identical securities. | |
Level 2 — | other significant observable inputs (including quoted prices for similar securities, interest rates, prepayment speeds, credit risk, etc.). | |
Level 3 — | significant unobservable inputs (including the fund’s own assumptions used to determine the fair value of investments). | |
The inputs or methodologies used for valuing securities are not necessarily an indication of the risk associated with investing in those securities.
The following table summarizes the inputs used to value the Funds’ net assets at December 31, 2011:
Fund | Level 1 Investments In Securities | Level 1 Other Financial Instruments* | Level 2 Investments In Securities | Level 2 Other Financial Instruments* | Level 3 Investments In Securities | Total | ||||||||||||||||||
Assets | ||||||||||||||||||||||||
Nova Fund | $ | 15,357,354 | $ | 140,418 | $ | 6,251,893 | $ | 3,568 | $ | 17 | $ | 21,753,250 | ||||||||||||
Inverse S&P 500 Strategy Fund | — | — | 14,504,305 | 39,369 | — | 14,543,674 | ||||||||||||||||||
NASDAQ-100® Fund | 40,614,899 | — | 3,806,771 | — | 429 | 44,422,099 | ||||||||||||||||||
Inverse NASDAQ-100® Strategy Fund | — | 6,477 | 7,143,164 | 18,092 | — | 7,167,733 | ||||||||||||||||||
S&P 500 2x Strategy Fund | 6,722,604 | 12,024 | 10,804,262 | — | 9 | 17,538,899 | ||||||||||||||||||
NASDAQ-100® 2x Strategy Fund | 15,469,792 | 22,768 | 6,046,485 | — | 210 | 21,539,255 | ||||||||||||||||||
Mid-Cap 1.5x Strategy Fund | 9,862,769 | 80,659 | 5,948,594 | — | — | 15,892,022 | ||||||||||||||||||
Inverse Mid-Cap Strategy Fund | — | 1,377 | 1,054,444 | 7,980 | — | 1,063,801 | ||||||||||||||||||
Russell 2000® 2x Strategy Fund | 2,151,750 | 53,026 | 3,646,477 | — | — | 5,851,253 | ||||||||||||||||||
Russell 2000® 1.5x Strategy Fund | 6,122,242 | 4,136 | 6,916,753 | — | — | 13,043,131 | ||||||||||||||||||
Inverse Russell 2000® Strategy Fund | — | 3,671 | 3,918,446 | 20,139 | — | 3,942,256 | ||||||||||||||||||
Dow 2x Strategy Fund | 9,810,825 | 46,052 | 6,302,512 | — | — | 16,159,389 | ||||||||||||||||||
Inverse Dow 2x Strategy Fund | — | — | 6,855,458 | 74,407 | — | 6,929,865 | ||||||||||||||||||
S&P 500 Pure Growth Fund | 37,879,584 | — | 330,382 | — | — | 38,209,966 | ||||||||||||||||||
S&P 500 Pure Value Fund | 31,401,604 | — | 102,623 | — | 1,621 | 31,505,848 | ||||||||||||||||||
S&P MidCap 400 Pure Growth Fund | 27,235,961 | — | 215,840 | — | — | 27,451,801 | ||||||||||||||||||
S&P MidCap 400 Pure Value Fund | 22,785,974 | — | 194,256 | — | — | 22,980,230 | ||||||||||||||||||
S&P SmallCap 600 Pure Growth Fund | 22,951,547 | — | 155,653 | — | — | 23,107,200 | ||||||||||||||||||
S&P SmallCap 600 Pure Value Fund | 12,696,574 | — | 102,235 | — | — | 12,798,809 | ||||||||||||||||||
Europe 1.25x Strategy Fund | 2,517,759 | 81,187 | 1,250,496 | — | — | 3,849,442 | ||||||||||||||||||
Japan 2x Strategy Fund | — | 28,005 | 1,622,153 | — | — | 1,650,158 | ||||||||||||||||||
Strengthening Dollar 2x Strategy Fund | — | 150,666 | 7,395,489 | 6,524 | — | 7,552,679 | ||||||||||||||||||
Weakening Dollar 2x Strategy Fund | — | — | 2,128,138 | — | — | 2,128,138 | ||||||||||||||||||
Real Estate Fund | 14,923,752 | — | 105,846 | — | — | 15,029,598 | ||||||||||||||||||
Government Long Bond 1.2x Strategy Fund | 16,710,595 | 329,660 | 22,627,929 | — | — | 39,668,184 | ||||||||||||||||||
Inverse Government Long Bond Strategy Fund | — | — | 14,177,131 | — | — | 14,177,131 | ||||||||||||||||||
U.S. Government Money Market Fund | — | — | 198,458,110 | — | — | 198,458,110 | ||||||||||||||||||
| THE RYDEX FUNDSANNUALREPORT | 251 |
NOTES TO FINANCIAL STATEMENTS (continued)
Fund | Level 1 Investments In Securities | Level 1 Other Financial Instruments* | Level 2 Investments In Securities | Level 2 Other Financial Instruments* | Level 3 Investments In Securities | Total | ||||||||||||||||||
Liabilities | ||||||||||||||||||||||||
Nova Fund | $ | — | $ | — | $ | — | $ | 26,795 | $ | — | $ | 26,795 | ||||||||||||
Inverse S&P 500 Strategy Fund | — | 12,588 | — | 2,995 | — | 15,583 | ||||||||||||||||||
NASDAQ-100® Fund | — | 11 | — | 16,175 | — | 16,186 | ||||||||||||||||||
S&P 500 2x Strategy Fund | — | — | — | 130,330 | — | 130,330 | ||||||||||||||||||
NASDAQ-100® 2x Strategy Fund | — | — | — | 145,217 | — | 145,217 | ||||||||||||||||||
Mid-Cap 1.5x Strategy Fund | — | — | — | 21,274 | — | 21,274 | ||||||||||||||||||
Russell 2000® 2x Strategy Fund | — | — | — | 57,254 | — | 57,254 | ||||||||||||||||||
Russell 2000® 1.5x Strategy Fund | — | — | — | 72,922 | — | 72,922 | ||||||||||||||||||
Dow 2x Strategy Fund | — | — | — | 85,088 | — | 85,088 | ||||||||||||||||||
Inverse Dow 2x Strategy Fund | — | 2,154 | — | — | — | 2,154 | ||||||||||||||||||
Europe 1.25x Strategy Fund | — | 82,084 | — | — | — | 82,084 | ||||||||||||||||||
Japan 2x Strategy Fund | — | 75,953 | — | — | — | 75,953 | ||||||||||||||||||
Weakening Dollar 2x Strategy Fund | — | 20,515 | — | 49,341 | — | 69,856 | ||||||||||||||||||
Inverse Government Long Bond Strategy Fund | 4,300,175 | 20,465 | — | — | — | 4,320,640 | ||||||||||||||||||
| * | Other financial instruments includes futures contracts and/or swaps, which are reported as unrealized gain/loss at period end. |
Transfers between investment levels may occur as the markets fluctuate and/or the availability of data used in an investment’s valuation changes. The Funds recognize transfers between the levels as of the beginning of the period. There were no securities that transferred between levels.
Summary of Fair Value Level 3 Activity
Following is a reconciliation of Level 3 assets for which significant unobservable inputs were used to determine fair value for the year ended December 31, 2011:
| Securities | ||||
Nova Fund | ||||
Assets: | ||||
Beginning Balance | $ | — | ||
Total change in unrealized gains or losses included in earnings | (160 | ) | ||
Issuances | 177 | |||
|
| |||
Ending Balance | $ | 17 | ||
|
| |||
| Securities | ||||
NASDAQ-100® Fund | ||||
Assets: | ||||
Beginning Balance | $ | — | ||
Total change in unrealized gains or losses included in earnings | (4,239 | ) | ||
Issuances | 4,668 | |||
|
| |||
Ending Balance | $ | 429 | ||
|
| |||
| Securities | ||||
S&P 500 2x Strategy Fund | ||||
Assets: | ||||
Beginning Balance | $ | — | ||
Total change in unrealized gains or losses included in earnings | (88 | ) | ||
Issuances | 97 | |||
|
| |||
Ending Balance | $ | 9 | ||
|
| |||
| Securities | ||||
NASDAQ-100® 2x Strategy Fund | ||||
Assets: | ||||
Beginning Balance | $ | — | ||
Total change in unrealized gains or losses included in earnings | (2,239 | ) | ||
Issuances | 2,449 | |||
|
| |||
Ending Balance | $ | 210 | ||
|
| |||
| 252 | THE RYDEX FUNDSANNUALREPORT |
NOTES TO FINANCIAL STATEMENTS (continued)
| Securities | ||||
Russell 2000® 2x Strategy Fund | ||||
Assets: | ||||
Beginning Balance | $ | 5 | ||
Total realized gains or losses included in earnings | (43 | ) | ||
Total change in unrealized gains or losses included in earnings | 84 | |||
Sales | (46 | ) | ||
|
| |||
Ending Balance | $ | — | ||
|
| |||
| Securities | ||||
Russell 2000® 1.5x Strategy Fund | ||||
Assets: | ||||
Beginning Balance | $ | 10 | ||
Total realized gains or losses included in earnings | (22 | ) | ||
Total change in unrealized gains or losses included in earnings | 104 | |||
Sales | (92 | ) | ||
|
| |||
Ending Balance | $ | — | ||
|
| |||
| Securities | ||||
S&P 500 Pure Value Fund | ||||
Assets: | ||||
Beginning Balance | $ | — | ||
Total change in unrealized gains or losses included in earnings | (21,819 | ) | ||
Issuances | 23,440 | |||
|
| |||
Ending Balance | $ | 1,621 | ||
|
| |||
| 5. | Repurchase Agreements |
The Funds transfer uninvested cash balances into a single joint account, the daily aggregate balance of which is invested in one or more repurchase agreements collateralized by obligations of the U.S. Treasury and U.S. Government Agencies. The collateral is in the possession of the Funds’ custodian and is evaluated to ensure that its market value exceeds, at a minimum, 102% of the original face amount of the repurchase agreements. Each Fund holds a pro rata share of the collateral based on the dollar amount of the repurchase agreement entered into by each Fund.
At December 31, 2011, the collateral for the repurchase agreements in the joint account was as follows:
Counterparty and Terms of Agreement | Face Value | Repurchase Price | Collateral | Par Value | Fair Value | |||||||||||||
Mizuho Financial Group, Inc. 0.00% Due 01/03/12 | $ | 54,060,482 | $ | 54,060,482 | U.S. Treasury Notes 0.25%—1.50% 10/31/13—07/31/16 | $ | 53,866,200 | $ | 55,141,700 | |||||||||
Credit Suisse Group 0.00% Due 01/03/12 | 85,180,088 | 85,180,088 | U.S. Treasury Note 1.75% 05/31/16 | 82,911,100 | 86,883,924 | |||||||||||||
HSBC Group 0.00% Due 01/03/12 | 51,750,000 | 51,750,000 | U.S. Treasury STRIPS 0.00% 02/15/13—05/15/14 | 52,817,100 | 52,679,331 | |||||||||||||
U.S. Treasury Note 2.63% 06/30/14 | 100,000 | 105,740 | ||||||||||||||||
Deutsche Bank 0.00% Due 01/03/12 | 51,750,000 | 51,750,000 | U.S. Treasury Note 2.63% 11/15/20 | 48,930,100 | 52,785,053 | |||||||||||||
In the event of counterparty default, the Funds have the right to collect the collateral to offset losses incurred. There is potential loss to the Funds in the event the Funds are delayed or prevented from exercising their rights to dispose of the collateral securities, including the risk of a possible decline in the value of the underlying securities during the period while the Funds seek to assert their rights. The Funds’ investment advisor, acting under the supervision of the Board of Trustees, reviews the value of the collateral and the creditworthiness of those banks and dealers with which the Funds enter into repurchase agreements to evaluate potential risks.
| THE RYDEX FUNDSANNUALREPORT | 253 |
NOTES TO FINANCIAL STATEMENTS (continued)
| 6. | Derivative Investment Holdings Categorized by Risk Exposure |
U.S. generally accepted accounting principles requires disclosures to enable investors to better understand how and why the Funds use derivative instruments, how these derivative instruments are accounted for and their effects on the Funds’ financial position and results of operations. None of the derivatives currently held by the Funds are being used as hedging instruments. The following Funds utilized derivatives for the following purposes:
| Futures | Swaps | |||||||
Fund Name | Index Exposure | Liquidity | Index Exposure | Liquidity | ||||
Nova Fund | x | x | x | x | ||||
Inverse S&P 500 Strategy Fund | x | x | x | x | ||||
NASDAQ-100® Fund | x | x | x | x | ||||
Inverse NASDAQ-100® Strategy Fund | x | x | x | x | ||||
S&P 500 2x Strategy Fund | x | x | x | x | ||||
NASDAQ-100® 2x Strategy Fund | x | x | x | x | ||||
Mid-Cap 1.5x Strategy Fund | x | x | x | x | ||||
Inverse Mid-Cap Strategy Fund | x | x | x | x | ||||
Russell 2000® 2x Strategy Fund | x | x | x | x | ||||
Russell 2000® 1.5x Strategy Fund | x | x | x | x | ||||
Inverse Russell 2000® Strategy Fund | x | x | x | x | ||||
Dow 2x Strategy Fund | x | x | x | x | ||||
Inverse Dow 2x Strategy Fund | x | x | x | x | ||||
Europe 1.25x Strategy Fund | x | x | ||||||
Japan 2x Strategy Fund | x | x | ||||||
Strengthening Dollar 2x Strategy Fund | x | x | x | x | ||||
Weakening Dollar 2x Strategy Fund | x | x | x | x | ||||
Government Long Bond 1.2x Strategy Fund | x | x | ||||||
Inverse Government Long Bond Strategy Fund | x | x | ||||||
The following table represents the notional amount of derivative instruments outstanding, as an approximate percentage of the Funds’ net assets on a daily basis, while the risk to the Fund is limited to the profit earned on such derivatives.
Fund | Approximate percentage of Fund’s net assets on a daily basis | |||
Nova Fund | 80 | % | ||
Inverse S&P 500 Strategy Fund | 100 | % | ||
NASDAQ-100® Fund | 10 | % | ||
Inverse NASDAQ-100® Strategy Fund | 100 | % | ||
S&P 500 2x Strategy Fund | 170 | % | ||
NASDAQ-100® 2x Strategy Fund | 130 | % | ||
Mid-Cap 1.5x Strategy Fund | 70 | % | ||
Inverse Mid-Cap Strategy Fund | 100 | % | ||
Russell 2000® 2x Strategy Fund | 165 | % | ||
Russell 2000® 1.5x Strategy Fund | 95 | % | ||
Inverse Russell 2000® Strategy Fund | 100 | % | ||
Dow 2x Strategy Fund | 150 | % | ||
Inverse Dow 2x Strategy Fund | 200 | % | ||
Europe 1.25x Strategy Fund | 65 | %* | ||
Japan 2x Strategy Fund | 200 | %* | ||
Strengthening Dollar 2x Strategy Fund | 200 | % | ||
Weakening Dollar 2x Strategy Fund | 200 | % | ||
Government Long Bond 1.2x Strategy Fund | 95 | % | ||
Inverse Government Long Bond Strategy Fund | 45 | % | ||
| * | These Funds utilize a combination of currency and/or financial-linked derivatives to obtain exposure to their benchmarks. The combined derivative instrument exposure is 125% and 400% for the Europe 1.25x Strategy Fund and Japan 2x Strategy Fund, respectively. |
| 254 | THE RYDEX FUNDSANNUALREPORT |
NOTES TO FINANCIAL STATEMENTS (continued)
The following is a summary of the location of derivative investments on the Funds’ Statements of Assets and Liabilities as of December 31, 2011:
Location on the Statements of Assets and Liabilities
Derivative Investments Type | Asset Derivatives | Liability Derivatives | ||
Equity, currency and interest rate contracts | Variation margin | Variation margin | ||
| Unrealized appreciation on swap agreements | Unrealized depreciation on swap agreements |
The following table sets forth the fair value of the Funds’ derivative investments categorized by primary risk exposure at December 31, 2011:
| Asset Derivative Investments Value | ||||||||||||||||||||||||
Fund | Futures Equity Contracts* | Swaps Equity Contracts | Futures Currency Contracts* | Swaps Currency Contracts | Futures Interest Rate Contracts* | Total Value at December 31, 2011 | ||||||||||||||||||
Nova Fund | $ | 140,418 | $ | 3,568 | $ | — | $ | — | $ | — | $ | 143,986 | ||||||||||||
Inverse S&P 500 Strategy Fund | — | 39,369 | — | — | — | 39,369 | ||||||||||||||||||
NASDAQ-100® Fund | — | — | — | — | — | — | ||||||||||||||||||
Inverse NASDAQ-100® Strategy Fund | 6,477 | 18,092 | — | — | — | 24,569 | ||||||||||||||||||
S&P 500 2x Strategy Fund | 12,024 | — | — | — | — | 12,024 | ||||||||||||||||||
NASDAQ-100 2x Strategy Fund | 22,768 | — | — | — | — | 22,768 | ||||||||||||||||||
Mid-Cap 1.5x Strategy Fund | 80,659 | — | — | — | — | 80,659 | ||||||||||||||||||
Inverse Mid-Cap Strategy Fund | 1,377 | 7,980 | — | — | — | 9,357 | ||||||||||||||||||
Russell 2000® 2x Strategy Fund | 53,026 | — | — | — | — | 53,026 | ||||||||||||||||||
Russell 2000® 1.5x Strategy Fund | 4,136 | — | — | — | — | 4,136 | ||||||||||||||||||
Inverse Russell 2000® Strategy Fund | 3,671 | 20,139 | — | — | — | 23,810 | ||||||||||||||||||
Dow 2x Strategy Fund | 46,052 | — | — | — | — | 46,052 | ||||||||||||||||||
Inverse Dow 2x Strategy Fund | — | 74,407 | — | — | — | 74,407 | ||||||||||||||||||
Europe 1.25x Strategy Fund | 81,187 | — | — | — | — | 81,187 | ||||||||||||||||||
Japan 2x Strategy Fund | — | — | 28,005 | — | — | 28,005 | ||||||||||||||||||
Strengthening Dollar 2x Strategy Fund | — | — | 150,666 | 6,524 | — | 157,190 | ||||||||||||||||||
Weakening Dollar 2x Strategy Fund | — | — | — | — | — | — | ||||||||||||||||||
Government Long Bond 1.2x Strategy Fund | — | — | — | — | 329,660 | 329,660 | ||||||||||||||||||
Inverse Government Long Bond Strategy Fund | — | — | — | — | — | — | ||||||||||||||||||
| Liability Derivative Investments Value | ||||||||||||||||||||||||
Fund | Futures Equity Contracts* | Swaps Equity Contracts | Futures Currency Contracts* | Swaps Currency Contracts | Futures Interest Rate Contracts* | Total Value at December 31, 2011 | ||||||||||||||||||
Nova Fund | $ | — | $ | 26,795 | $ | — | $ | — | $ | — | $ | 26,795 | ||||||||||||
Inverse S&P 500 Strategy Fund | 12,588 | 2,995 | — | — | — | 15,583 | ||||||||||||||||||
NASDAQ-100® Fund | 11 | 16,175 | — | — | — | 16,186 | ||||||||||||||||||
Inverse NASDAQ-100® Strategy Fund | — | — | — | — | — | — | ||||||||||||||||||
S&P 500 2x Strategy Fund | — | 130,330 | — | — | — | 130,330 | ||||||||||||||||||
NASDAQ-100® 2x Strategy Fund | — | 145,217 | — | — | — | 145,217 | ||||||||||||||||||
Mid-Cap 1.5x Strategy Fund | — | 21,274 | — | — | — | 21,274 | ||||||||||||||||||
Inverse Mid-Cap Strategy Fund | — | — | — | — | — | — | ||||||||||||||||||
Russell 2000® 2x Strategy Fund | — | 57,254 | — | — | — | 57,254 | ||||||||||||||||||
Russell 2000® 1.5x Strategy Fund | — | 72,922 | — | — | — | 72,922 | ||||||||||||||||||
Inverse Russell 2000® Strategy Fund | — | — | — | — | — | — | ||||||||||||||||||
Dow 2x Strategy Fund | — | 85,088 | — | — | — | 85,088 | ||||||||||||||||||
Inverse Dow 2x Strategy Fund | 2,154 | — | — | — | — | 2,154 | ||||||||||||||||||
Europe 1.25x Strategy Fund | — | — | 82,084 | — | — | 82,084 | ||||||||||||||||||
Japan 2x Strategy Fund | 75,953 | — | — | — | — | 75,953 | ||||||||||||||||||
Strengthening Dollar 2x Strategy Fund | — | — | — | — | — | — | ||||||||||||||||||
Weakening Dollar 2x Strategy Fund | — | — | 20,515 | 49,341 | — | 69,856 | ||||||||||||||||||
Government Long Bond 1.2x Strategy Fund | — | — | — | — | — | — | ||||||||||||||||||
Inverse Government Long Bond Strategy Fund | — | — | — | — | 20,465 | 20,465 | ||||||||||||||||||
| * | Includes cumulative appreciation (depreciation) of futures contracts as reported on the Schedules of Investments. Only current day’s variation margin is reported within the Statements of Assets and Liabilities. |
| THE RYDEX FUNDSANNUALREPORT | 255 |
NOTES TO FINANCIAL STATEMENTS (continued)
The following is a summary of the location of derivative investments on the Funds’ Statements of Operations for the year ended December 31, 2011:
Derivative Investment Type | Location of Gain (Loss) on Derivatives | |
Equity/currency contracts | Net realized gain (loss) on futures contracts and swap agreements | |
| Net change in unrealized appreciation (depreciation) on futures contracts and swap agreements | ||
Interest Rate contracts | Net realized gain (loss) on futures contracts | |
| Net change in unrealized appreciation (depreciation) on futures contracts | ||
The following is a summary of the Funds’ realized gain (loss) and change in unrealized appreciation (depreciation) on derivative investments recognized on the Statements of Operations categorized by primary risk exposure for the year ended December 31, 2011:
Realized Gain (Loss) on Derivative Investments Recognized on the Statements of Operations
Fund | Futures Equity Contracts | Swaps Equity Contracts | Futures Currency Contracts | Swaps Currency Contracts | Futures Interest Rate Contracts | Total | ||||||||||||||||||
Nova Fund | $ | (884,300 | ) | $ | 380,653 | $ | — | $ | — | $ | — | $ | (503,647 | ) | ||||||||||
Inverse S&P 500 Strategy Fund | (531,825 | ) | (3,208,304 | ) | — | — | — | (3,740,129 | ) | |||||||||||||||
NASDAQ-100® Fund | (981,982 | ) | (258,099 | ) | — | — | — | (1,240,081 | ) | |||||||||||||||
Inverse NASDAQ-100® Strategy Fund | (717,404 | ) | (564,650 | ) | — | — | — | (1,282,054 | ) | |||||||||||||||
S&P 500 2x Strategy Fund | (159,005 | ) | (1,444,729 | ) | — | — | — | (1,603,734 | ) | |||||||||||||||
NASDAQ-100® 2x Strategy Fund | (720,564 | ) | (1,582,554 | ) | — | — | — | (2,303,118 | ) | |||||||||||||||
Mid-Cap 1.5x Strategy Fund | 243,794 | (718,909 | ) | — | — | — | (475,115 | ) | ||||||||||||||||
Inverse Mid-Cap Strategy Fund | (3,413 | ) | (364,548 | ) | — | — | — | (367,961 | ) | |||||||||||||||
Russell 2000® 2x Strategy Fund | (147,647 | ) | (877,802 | ) | — | — | — | (1,025,449 | ) | |||||||||||||||
Russell 2000® 1.5x Strategy Fund | (516,184 | ) | (1,742,191 | ) | — | — | — | (2,258,375 | ) | |||||||||||||||
Inverse Russell 2000® Strategy Fund | 3,393 | (82,194 | ) | — | — | — | (78,801 | ) | ||||||||||||||||
Dow 2x Strategy Fund | (81,532 | ) | 518,416 | — | — | — | 436,884 | |||||||||||||||||
Inverse Dow 2x Strategy Fund | (681,714 | ) | (3,244,871 | ) | — | — | — | (3,926,585 | ) | |||||||||||||||
Europe 1.25x Strategy Fund | (699,939 | ) | — | 256,620 | — | (443,319 | ) | |||||||||||||||||
Japan 2x Strategy Fund | (2,339,747 | ) | — | 808,101 | — | — | (1,531,646 | ) | ||||||||||||||||
Strengthening Dollar 2x Strategy Fund | — | — | (546,043 | ) | (120,576 | ) | — | (666,619 | ) | |||||||||||||||
Weakening Dollar 2x Strategy Fund | — | — | 59,710 | (89,557 | ) | — | (29,847 | ) | ||||||||||||||||
Government Long Bond 1.2x Strategy Fund | — | — | — | — | 4,557,141 | 4,557,141 | ||||||||||||||||||
Inverse Government Long Bond Strategy Fund | — | — | — | — | (1,530,371 | ) | (1,530,371 | ) | ||||||||||||||||
Change in Unrealized Appreciation (Depreciation) on Derivative Investments Recognized on the Statements of Operations
Fund | Futures Equity Contracts | Swaps Equity Contracts | Futures Currency Contracts | Swaps Currency Contracts | Futures Interest Rate Contracts | Total | ||||||||||||||||||
Nova Fund | $ | 19,426 | $ | (27,593 | ) | $ | — | $ | — | $ | — | $ | (8,167 | ) | ||||||||||
Inverse S&P 500 Strategy Fund | (11,268 | ) | 41,838 | — | — | — | 30,570 | |||||||||||||||||
NASDAQ-100® Fund | (19,611 | ) | 51,996 | — | — | — | 32,385 | |||||||||||||||||
Inverse NASDAQ-100® Strategy Fund | 5,409 | (17,977 | ) | — | — | — | (12,568 | ) | ||||||||||||||||
S&P 500 2x Strategy Fund | (56,376 | ) | (135,059 | ) | — | — | — | (191,435 | ) | |||||||||||||||
NASDAQ-100® 2x Strategy Fund | (44,577 | ) | 76,560 | — | — | — | 31,983 | |||||||||||||||||
Mid-Cap 1.5x Strategy Fund | (16,542 | ) | 23,582 | — | — | — | 7,040 | |||||||||||||||||
Inverse Mid-Cap Strategy Fund | 845 | (1,933 | ) | — | — | — | (1,088 | ) | ||||||||||||||||
Russell 2000® 2x Strategy Fund | 34,600 | 20,946 | — | — | — | 55,546 | ||||||||||||||||||
Russell 2000® 1.5x Strategy Fund | (16,011 | ) | 107,550 | — | — | — | 91,539 | |||||||||||||||||
Inverse Russell 2000® Strategy Fund | (3,077 | ) | (463 | ) | — | — | — | (3,540 | ) | |||||||||||||||
Dow 2x Strategy Fund | 17,087 | (105,275 | ) | — | — | — | (88,188 | ) | ||||||||||||||||
Inverse Dow 2x Strategy Fund | (1,981 | ) | 134,166 | — | — | — | 132,185 | |||||||||||||||||
Europe 1.25x Strategy Fund | 147,049 | — | (155,807 | ) | — | — | (8,758 | ) | ||||||||||||||||
Japan 2x Strategy Fund | (32,750 | ) | — | (312,213 | ) | — | — | (344,963 | ) | |||||||||||||||
Strengthening Dollar 2x Strategy Fund | — | — | 288,304 | 16,298 | — | 304,602 | ||||||||||||||||||
Weakening Dollar 2x Strategy Fund | — | — | (85,736 | ) | (62,731 | ) | — | (148,467 | ) | |||||||||||||||
Government Long Bond 1.2x Strategy Fund | — | — | — | — | 108,642 | 108,642 | ||||||||||||||||||
Inverse Government Long Bond Strategy Fund | — | — | — | — | 20,584 | 20,584 | ||||||||||||||||||
| 256 | THE RYDEX FUNDSANNUALREPORT |
NOTES TO FINANCIAL STATEMENTS (continued)
| 7. | Federal Income Tax Information |
The Funds intend to comply with the provisions of Subchapter M of the Internal Revenue Code applicable to regulated investment companies and will distribute substantially all taxable net investment income and capital gains sufficient to relieve them from all, or substantially all, federal income, excise and state income taxes. Therefore, no provision for federal or state income tax is required.
Tax positions taken or expected to be taken in the course of preparing the Funds’ tax returns are evaluated to determine whether the tax positions are “more-likely-than-not” of being sustained by the applicable tax authority. Tax positions not deemed to meet the more-likely-than-not threshold would be recorded as a tax benefit or expense in the current year. Management has analyzed the Funds’ tax positions taken on Federal income tax returns for all open tax years (fiscal years 2008-2011), and has concluded that no provision for income tax is required in the Funds’ financial statements.
The RIC Modernization Act of 2010 was signed into law on December 22, 2010 and seeks to simplify some of the tax provisions applicable to regulated investment companies and the tax reporting to their shareholders, and to improve the tax efficiency of certain fund structures. The changes are generally effective for taxable years beginning after the date of enactment.
One of the more prominent changes addresses capital loss carryforwards. Funds will be permitted to carry forward capital losses incurred in taxable years beginning after December 22, 2010 for an unlimited period. However, any losses incurred during those future taxable years will be required to be utilized prior to the losses incurred in pre-enactment taxable years. Under pre-enactment law, capital losses could be carried forward for eight years, and carried forward as short-term capital, irrespective of the character of the original loss. As a result of this ordering rule, pre-enactment capital carryforwards may potentially expire unused. Additionally, post-enactment capital losses that are carried forward will retain their character as either short-term or long-term capital losses rather than being considered all short-term as under previous law.
Tax basis capital losses in excess of capital gains are carried forward to offset future net capital gains. For the year ended December 31, 2011, the following capital loss carryforward amounts expired, were used, or were permanently lost due to loss limitation rules in Section 382 of the Internal Revenue Code:
Fund | Amount | |||
Nova Fund | $ | 357,779 | ||
Inverse S&P 500 Strategy Fund | 24,399,810 | |||
NASDAQ-100® Fund | 10,118,266 | |||
Dow 2x Strategy Fund | 2,153,621 | |||
S&P 500 Pure Growth Fund | 1,499,394 | |||
S&P 500 Pure Value Fund | 931,522 | |||
S&P SmallCap 600 Pure Value Fund | 171,233 | |||
Real Estate Fund | 358,939 | |||
Weakening Dollar 2x Strategy Fund | 1,707,744 | |||
Government Long Bond 1.2x Strategy Fund | 6,803,899 | |||
The tax character of distributions paid during the year ended December 31, 2011 was as follows:
Fund | Ordinary Income | Long-Term Capital Gain | Total Distributions | |||||||||
Nova Fund | $ | 12,745 | $ | — | $ | 12,745 | ||||||
Inverse S&P 500 Strategy Fund | — | — | — | |||||||||
NASDAQ-100® Fund | — | — | — | |||||||||
Inverse NASDAQ-100® Strategy Fund | — | — | — | |||||||||
S&P 500 2x Strategy Fund | — | — | — | |||||||||
NASDAQ-100® 2x Strategy Fund | 896,442 | 2,665,434 | 3,561,876 | |||||||||
Mid-Cap 1.5x Strategy Fund | — | — | — | |||||||||
Inverse Mid-Cap Strategy Fund | — | — | — | |||||||||
Russell 2000® 2x Strategy Fund | 290,396 | 197,452 | 487,848 | |||||||||
Russell 2000® 1.5x Strategy Fund | — | — | — | |||||||||
Inverse Russell 2000® Strategy Fund | — | — | — | |||||||||
Dow 2x Strategy Fund | — | — | — | |||||||||
Inverse Dow 2x Strategy Fund | — | — | — | |||||||||
S&P 500 Pure Growth Fund | — | — | — | |||||||||
S&P 500 Pure Value Fund | 8,103 | — | 8,103 | |||||||||
S&P MidCap 400 Pure Growth Fund | — | 1,787,658 | 1,787,658 | |||||||||
S&P MidCap 400 Pure Value Fund | — | — | — | |||||||||
S&P SmallCap 600 Pure Growth Fund | — | — | — | |||||||||
S&P SmallCap 600 Pure Value Fund | — | — | — | |||||||||
Europe 1.25x Strategy Fund | — | — | — | |||||||||
| THE RYDEX FUNDSANNUALREPORT | 257 |
NOTES TO FINANCIAL STATEMENTS (continued)
Fund | Ordinary Income | Long-Term Capital Gain | Total Distributions | |||||||||
Japan 2x Strategy Fund | $ | — | $ | — | $ | — | ||||||
Strengthening Dollar 2x Strategy Fund | — | — | — | |||||||||
Weakening Dollar 2x Strategy Fund | — | — | — | |||||||||
Real Estate Fund | 469,840 | — | 469,840 | |||||||||
Government Long Bond 1.2x Strategy Fund | 666,150 | — | 666,150 | |||||||||
Inverse Government Long Bond Strategy Fund | — | — | — | |||||||||
U.S. Government Money Market Fund | 7,356 | — | 7,356 | |||||||||
The tax character of distributions paid during the year ended December 31, 2010 was as follows:
Fund | Ordinary Income | Long-Term Capital Gain | Total Distributions | |||||||||
Nova Fund | $ | 74,019 | $ | — | $ | 74,019 | ||||||
Inverse S&P 500 Strategy Fund | — | — | — | |||||||||
NASDAQ-100® Fund | — | — | — | |||||||||
Inverse NASDAQ-100® Strategy Fund | — | — | — | |||||||||
S&P 500 2x Strategy Fund | — | — | — | |||||||||
NASDAQ-100® 2x Strategy Fund | — | — | — | |||||||||
Mid-Cap 1.5x Strategy Fund | — | — | — | |||||||||
Inverse Mid-Cap Strategy Fund | — | — | — | |||||||||
Russell 2000® 2x Strategy Fund | — | — | — | |||||||||
Russell 2000® 1.5x Strategy Fund | — | — | — | |||||||||
Inverse Russell 2000® Strategy Fund | — | — | — | |||||||||
Dow 2x Strategy Fund | 74,124 | — | 74,124 | |||||||||
Inverse Dow 2x Strategy Fund | — | — | — | |||||||||
S&P 500 Pure Growth Fund | — | — | — | |||||||||
S&P 500 Pure Value Fund | 184,518 | — | 184,518 | |||||||||
S&P MidCap 400 Pure Growth Fund | — | — | — | |||||||||
S&P MidCap 400 Pure Value Fund | 141,797 | — | 141,797 | |||||||||
S&P SmallCap 600 Pure Growth Fund | — | — | — | |||||||||
S&P SmallCap 600 Pure Value Fund | — | — | — | |||||||||
Europe 1.25x Strategy Fund | 169,256 | — | 169,256 | |||||||||
Japan 2x Strategy Fund | — | — | — | |||||||||
Strengthening Dollar 2x Strategy Fund | — | — | — | |||||||||
Weakening Dollar 2x Strategy Fund | — | — | — | |||||||||
Real Estate Fund | 575,246 | — | 575,246 | |||||||||
Government Long Bond 1.2x Strategy Fund | 1,069,767 | — | 1,069,767 | |||||||||
Inverse Government Long Bond Strategy Fund | — | — | — | |||||||||
U.S. Government Money Market Fund | 21,279 | — | 21,279 | |||||||||
Note: For federal income tax purposes, short term capital gain distributions are treated as ordinary income distributions.
The tax character of distributable earnings/(accumulated losses) at December 31, 2011 was as follows:
Fund | Undistributed Ordinary Income | Undistributed Long-Term Capital Gain | Net Unrealized Appreciation (Depreciation) | Capital Loss Carryforward | ||||||||||||
Nova Fund | $ | — | $ | — | $ | 1,870,477 | $ | (24,787,650 | )1 | |||||||
Inverse S&P 500 Strategy Fund | — | — | 36,356 | (13,595,652 | )1 | |||||||||||
NASDAQ-100® Fund | — | — | 14,182,984 | (11,116,761 | )1 | |||||||||||
Inverse NASDAQ-100® Strategy Fund | — | — | 18,073 | (23,681,884 | )1 | |||||||||||
S&P 500 2x Strategy Fund | — | — | 869,729 | (23,671,385 | )1 | |||||||||||
NASDAQ-100® 2x Strategy Fund | — | — | 3,819,428 | (5,426,685 | )1 | |||||||||||
Mid-Cap 1.5x Strategy Fund | — | — | 675,715 | (7,209,370 | )1 | |||||||||||
Inverse Mid-Cap Strategy Fund | — | — | 7,979 | (2,979,467 | )1 | |||||||||||
Russell 2000® 2x Strategy Fund | — | — | 4,268 | (1,878,679 | )1 | |||||||||||
Russell 2000® 1.5x Strategy Fund | — | — | (191,838 | ) | (9,556,753 | )1 | ||||||||||
Inverse Russell 2000® Strategy Fund | — | — | 20,172 | (15,315,986 | )1 | |||||||||||
Dow 2x Strategy Fund | — | — | 310,531 | (24,252,397 | )1 | |||||||||||
Inverse Dow 2x Strategy Fund | — | — | 74,407 | (26,481,619 | )1 | |||||||||||
S&P 500 Pure Growth Fund | — | 245,727 | 1,650,278 | (752,038 | )1 | |||||||||||
S&P 500 Pure Value Fund | 113,232 | — | (3,775,121 | ) | (3,259,830 | )1 | ||||||||||
| 258 | THE RYDEX FUNDSANNUALREPORT |
NOTES TO FINANCIAL STATEMENTS (continued)
Fund | Undistributed Ordinary Income | Undistributed Long-Term Capital Gain | Net Unrealized Appreciation (Depreciation) | Capital Loss Carryforward | ||||||||||||
S&P MidCap 400 Pure Growth Fund | $ | — | $ | 4,252,045 | $ | 3,187,746 | $ | — | ||||||||
S&P MidCap 400 Pure Value Fund | — | — | (759,007 | ) | (2,826,778 | )1 | ||||||||||
S&P SmallCap 600 Pure Growth Fund | — | — | 1,018,323 | (5,701,366 | )1 | |||||||||||
S&P SmallCap 600 Pure Value Fund | — | — | (646,396 | ) | (4,168,598 | )1 | ||||||||||
Europe 1.25x Strategy Fund | 80,825 | — | (460,660 | ) | (6,754,736 | )1 | ||||||||||
Japan 2x Strategy Fund | — | — | — | (8,614,545 | )1 | |||||||||||
Strengthening Dollar 2x Strategy Fund | — | — | — | (3,812,488 | )1 | |||||||||||
Weakening Dollar 2x Strategy Fund | — | — | 22 | (828,962 | )1 | |||||||||||
Real Estate Fund | 276,241 | — | 838,398 | (9,922,378 | )1 | |||||||||||
Government Long Bond 1.2x Strategy Fund | 7,081,768 | 2,799,469 | 314,863 | — | ||||||||||||
Inverse Government Long Bond Strategy Fund | — | — | (391,432 | ) | (16,649,337 | )1 | ||||||||||
U.S. Government Money Market Fund | 3,764 | — | — | — | ||||||||||||
Capital Loss Carryforward amounts may be limited due to Federal income tax regulations.
| 1 | A summary of the expiration of the aforementioned Capital Loss Carryforward is as follows: |
| Expires in | Expires in | Expires in | Expires in | Expires in | Expires in | Expires in | Unlimited | Total Capital Loss | ||||||||||||||||||||||||||||||||
Fund | 2012 | 2013 | 2014 | 2015 | 2016 | 2017 | 2018 | Short Term | Long Term | Carryforward | ||||||||||||||||||||||||||||||
Nova Fund | $ | — | $ | — | $ | — | $ | — | $ | (24,787,650 | ) | $ | — $ | — | $ | — | $ | — | $ | (24,787,650 | ) | |||||||||||||||||||
Inverse S&P 500 Strategy Fund | — | (180,774 | ) | (4,358,737 | ) | (1,326,171 | ) | — | (2,652,342 | ) | (1,326,171 | ) | (3,425,541 | ) | (325,856 | ) | (13,595,652 | ) | ||||||||||||||||||||||
NASDAQ-100® Fund | (305,933 | ) | — | — | — | — | (10,810,828 | ) | — | — | — | (11,116,761 | ) | |||||||||||||||||||||||||||
Inverse NASDAQ-100® Strategy Fund | — | (2,149,850 | ) | (1,494,971 | ) | (5,330,554 | ) | — | (9,292,387 | ) | (4,137,477 | ) | (849,448 | ) | (427,197 | ) | (23,681,884 | ) | ||||||||||||||||||||||
S&P 500 2x Strategy Fund | — | — | — | — | (21,924,622 | ) | (90,449 | ) | — | (1,656,314 | ) | — | (23,671,385 | ) | ||||||||||||||||||||||||||
NASDAQ-100® 2x Strategy Fund | — | — | — | — | (4,670,652 | ) | — | — | (756,033 | ) | — | (5,426,685 | ) | |||||||||||||||||||||||||||
Mid-Cap 1.5x Strategy Fund | — | — | — | — | (5,813,586 | ) | (972,016 | ) | — | (423,768 | ) | — | (7,209,370 | ) | ||||||||||||||||||||||||||
Inverse Mid-Cap Strategy Fund | — | — | (472,652 | ) | (118,163 | ) | — | (236,326 | ) | (1,520,415 | ) | (603,538 | ) | (28,373 | ) | (2,979,467 | ) | |||||||||||||||||||||||
Russell 2000® 2x Strategy Fund | — | — | — | — | (810,636 | ) | (135,107 | ) | — | (921,452 | ) | (11,484 | ) | (1,878,679 | ) | |||||||||||||||||||||||||
Russell 2000® 1.5x Strategy Fund | — | — | — | — | (7,777,778 | ) | — | — | (1,778,975 | ) | — | (9,556,753 | ) | |||||||||||||||||||||||||||
Inverse Russell 2000® Strategy Fund | (295,607 | ) | (955,067 | ) | (3,912,378 | ) | (371,570 | ) | — | (5,019,104 | ) | (4,109,170 | ) | (540,561 | ) | (112,529 | ) | (15,315,986 | ) | |||||||||||||||||||||
Dow 2x Strategy Fund | — | — | — | — | (16,292,174 | ) | (7,960,223 | ) | — | — | — | (24,252,397 | ) | |||||||||||||||||||||||||||
Inverse Dow 2x Strategy Fund | — | — | — | — | — | (13,703,764 | ) | (7,083,951 | ) | (4,938,464 | ) | (755,440 | ) | (26,481,619 | ) | |||||||||||||||||||||||||
S&P 500 Pure Growth Fund | — | — | — | — | — | (752,038 | ) | — | — | — | (752,038 | ) | ||||||||||||||||||||||||||||
S&P 500 Pure Value Fund | — | — | — | — | (287,087 | ) | (2,972,743 | ) | — | — | — | (3,259,830 | ) | |||||||||||||||||||||||||||
S&P MidCap 400 Pure Value Fund | — | — | — | — | — | (2,752,831 | ) | — | (73,947 | ) | — | (2,826,778 | ) | |||||||||||||||||||||||||||
S&P SmallCap 600 Pure Growth Fund | — | — | — | — | — | (5,301,076 | ) | — | (400,290 | ) | — | (5,701,366 | ) | |||||||||||||||||||||||||||
S&P SmallCap 600 Pure Value Fund | — | — | — | (56,233 | ) | (1,438,380 | ) | (2,673,985 | ) | — | — | — | (4,168,598 | ) | ||||||||||||||||||||||||||
Europe 1.25x Strategy Fund | — | — | — | — | (3,560,618 | ) | — | (1,734,902 | ) | (1,025,705 | ) | (433,511 | ) | (6,754,736 | ) | |||||||||||||||||||||||||
Japan 2x Strategy Fund | — | — | — | (1,212,352 | ) | (5,525,584 | ) | — | — | (750,643 | ) | (1,125,966 | ) | (8,614,545 | ) | |||||||||||||||||||||||||
Strengthening Dollar 2x Strategy Fund | — | — | — | — | — | (2,779,638 | ) | (670,834 | ) | (144,806 | ) | (217,210 | ) | (3,812,488 | ) | |||||||||||||||||||||||||
Weakening Dollar 2x Strategy Fund | — | — | — | — | (196,851 | ) | — | (196,737 | ) | (174,149 | ) | (261,225 | ) | (828,962 | ) | |||||||||||||||||||||||||
Real Estate Fund | — | — | — | — | (3,125,480 | ) | (6,796,898 | ) | — | — | — | (9,922,378 | ) | |||||||||||||||||||||||||||
Inverse Government Long Bond Strategy Fund | (2,139,643 | ) | (2,319,251 | ) | (986,005 | ) | (1,974,960 | ) | (4,794,104 | ) | — | (1,130,953 | ) | (2,398,548 | ) | (905,873 | ) | (16,649,337 | ) | |||||||||||||||||||||
| THE RYDEX FUNDSANNUALREPORT | 259 |
NOTES TO FINANCIAL STATEMENTS (continued)
Net investment income and net realized gains (losses) may differ for financial statement and tax purposes because of temporary or permanent book/tax differences. These differences are primarily due to post-October losses, losses deferred due to wash sales, foreign currency gains and losses, and the “mark-to-market” of certain passive foreign investment companies (PFICs) for tax purposes. Additional differences may result from tax treatment of net investment losses and expired capital loss carryforwards. To the extent these differences are permanent, reclassifications are made to the appropriate equity accounts in the period that the differences arise. These reclassifications have no effect on net assets or NAV per share.
On the Statements of Assets and Liabilities, the following reclassifications were made for permanent book/tax differences:
Fund | Paid In Capital | Undistributed Net Investment Income | Accumulated Net Realized Gain (Loss) | |||||||||
Nova Fund | $ | (195,812 | ) | $ | 32,642 | $ | 163,170 | |||||
Inverse S&P 500 Strategy Fund | (24,774,584 | ) | 374,774 | 24,399,810 | ||||||||
NASDAQ-100® Fund | (3,900,703 | ) | 492,844 | 3,407,859 | ||||||||
Inverse NASDAQ-100® Strategy Fund | (146,189 | ) | 146,189 | — | ||||||||
S&P 500 2x Strategy Fund | (130,590 | ) | 129,808 | 782 | ||||||||
NASDAQ-100® 2x Strategy Fund | (351,330 | ) | 351,330 | — | ||||||||
Mid-Cap 1.5x Strategy Fund | (140,493 | ) | 132,623 | 7,870 | ||||||||
Inverse Mid-Cap Strategy Fund | (115,459 | ) | 30,735 | 84,724 | ||||||||
Russell 2000® 2x Strategy Fund | (74,489 | ) | 74,470 | 19 | ||||||||
Russell 2000® 1.5x Strategy Fund | 14,828 | 194,787 | (209,615 | ) | ||||||||
Inverse Russell 2000® Strategy Fund | (118,485 | ) | 118,485 | — | ||||||||
Dow 2x Strategy Fund | (21,497 | ) | 21,497 | — | ||||||||
Inverse Dow 2x Strategy Fund | (199,004 | ) | 199,004 | — | ||||||||
S&P 500 Pure Growth Fund | (332,648 | ) | 382,369 | (49,721 | ) | |||||||
S&P 500 Pure Value Fund | (31 | ) | — | 31 | ||||||||
S&P MidCap 400 Pure Growth Fund | (471,348 | ) | 564,881 | (93,533 | ) | |||||||
S&P MidCap 400 Pure Value Fund | (2,337 | ) | 2,336 | 1 | ||||||||
S&P SmallCap 600 Pure Growth Fund | (272,195 | ) | 268,886 | 3,309 | ||||||||
S&P SmallCap 600 Pure Value Fund | (91,010 | ) | 86,128 | 4,882 | ||||||||
Europe 1.25x Strategy Fund | 1 | (11,572 | ) | 11,571 | ||||||||
Japan 2x Strategy Fund | (81,237 | ) | 81,237 | — | ||||||||
Strengthening Dollar 2x Strategy Fund | (84,604 | ) | 84,604 | — | ||||||||
Weakening Dollar 2x Strategy Fund | (1,774,106 | ) | 66,362 | 1,707,744 | ||||||||
Real Estate Fund | (181,700 | ) | (27,533 | ) | 209,233 | |||||||
Government Long Bond 1.2x Strategy Fund | — | 133 | (133 | ) | ||||||||
Inverse Government Long Bond Strategy Fund | (745,235 | ) | 745,235 | — | ||||||||
U.S. Government Money Market Fund | — | — | — | |||||||||
At December 31, 2011, the cost of securities for Federal income tax purposes, the aggregate gross unrealized gain for all securities for which there was an excess of value over tax cost and the aggregate gross unrealized loss for all securities for which there was an excess of tax cost over value, were as follows:
Fund | Tax Cost | Tax Unrealized Gain | Tax Unrealized Loss | Net Unrealized Gain (Loss) | ||||||||||||
Nova Fund | $ | 19,715,557 | $ | 1,992,668 | $ | (98,964 | ) | $ | 1,893,704 | |||||||
Inverse S&P 500 Strategy Fund | 14,504,323 | — | (18 | ) | (18 | ) | ||||||||||
NASDAQ-100® Fund | 30,222,939 | 14,902,665 | (703,506 | ) | 14,199,159 | |||||||||||
Inverse NASDAQ-100® Strategy Fund | 7,143,183 | — | (19 | ) | (19 | ) | ||||||||||
S&P 500 2x Strategy Fund | 16,526,815 | 1,070,984 | (70,924 | ) | 1,000,060 | |||||||||||
NASDAQ-100® 2x Strategy Fund | 17,551,842 | 4,557,882 | (593,237 | ) | 3,964,645 | |||||||||||
Mid-Cap 1.5x Strategy Fund | 15,114,374 | 953,980 | (256,991 | ) | 696,989 | |||||||||||
Inverse Mid-Cap Strategy Fund | 1,054,445 | — | (1 | ) | (1 | ) | ||||||||||
Russell 2000® 2x Strategy Fund | 5,736,700 | 240,738 | (179,216 | ) | 61,522 | |||||||||||
Russell 2000® 1.5x Strategy Fund | 13,157,910 | 359,882 | (478,797 | ) | (118,915 | ) | ||||||||||
Inverse Russell 2000® Strategy Fund | 3,918,413 | 33 | — | 33 | ||||||||||||
Dow 2x Strategy Fund | 15,717,717 | 509,203 | (113,663 | ) | 395,620 | |||||||||||
Inverse Dow 2x Strategy Fund | 6,855,458 | — | — | — | ||||||||||||
S&P 500 Pure Growth Fund | 36,559,689 | 1,880,012 | (229,734 | ) | 1,650,278 | |||||||||||
S&P 500 Pure Value Fund | 35,280,969 | — | (3,775,121 | ) | (3,775,121 | ) | ||||||||||
S&P MidCap 400 Pure Growth Fund | 24,264,055 | 3,344,613 | (156,867 | ) | 3,187,746 | |||||||||||
S&P MidCap 400 Pure Value Fund | 23,739,237 | — | (759,007 | ) | (759,007 | ) | ||||||||||
S&P SmallCap 600 Pure Growth Fund | 22,088,877 | 1,352,097 | (333,774 | ) | 1,018,323 | |||||||||||
S&P SmallCap 600 Pure Value Fund | 13,445,203 | — | (646,396 | ) | (646,396 | ) | ||||||||||
| 260 | THE RYDEX FUNDSANNUALREPORT |
NOTES TO FINANCIAL STATEMENTS (continued)
Fund | Tax Cost | Tax Unrealized Gain | Tax Unrealized Loss | Net Unrealized Gain (Loss) | ||||||||||||
Europe 1.25x Strategy Fund | $ | 4,309,666 | $ | — | $ | (541,411 | ) | $ | (541,411 | ) | ||||||
Japan 2x Strategy Fund | 1,622,153 | — | — | — | ||||||||||||
Strengthening Dollar 2x Strategy Fund | 7,395,489 | — | — | — | ||||||||||||
Weakening Dollar 2x Strategy Fund | 2,128,116 | 27 | (5 | ) | 22 | |||||||||||
Real Estate Fund | 14,191,201 | 888,322 | (49,924 | ) | 838,398 | |||||||||||
Government Long Bond 1.2x Strategy Fund | 39,023,661 | 314,935 | (72 | ) | 314,863 | |||||||||||
Inverse Government Long Bond Strategy Fund | 14,618,767 | — | (441,636 | ) | (441,636 | ) | ||||||||||
U.S. Government Money Market Fund | 198,458,110 | — | — | — | ||||||||||||
| 8. | Securities Transactions |
For the year ended December 31, 2011, the cost of purchases and proceeds from sales of investment securities, excluding government securities and short-term investments, were:
| Purchases | Sales | |||||||
Nova Fund | $ | 28,085,099 | $ | 33,268,337 | ||||
Inverse S&P 500 Strategy Fund | — | — | ||||||
NASDAQ-100® Fund | 27,765,341 | 23,980,403 | ||||||
Inverse NASDAQ-100® Strategy Fund | — | — | ||||||
S&P 500 2x Strategy Fund | 20,313,318 | 20,787,142 | ||||||
NASDAQ-100® 2x Strategy Fund | 6,862,890 | 2,925,229 | ||||||
Mid-Cap 1.5x Strategy Fund | 23,239,741 | 23,103,487 | ||||||
Inverse Mid-Cap Strategy Fund | — | — | ||||||
Russell 2000® 2x Strategy Fund | 1,648,805 | 157,862 | ||||||
Russell 2000® 1.5x Strategy Fund | 6,077,623 | 1,785,621 | ||||||
Inverse Russell 2000® Strategy Fund | — | — | ||||||
Dow 2x Strategy Fund | 51,610,883 | 49,175,393 | ||||||
Inverse Dow 2x Strategy Fund | — | — | ||||||
S&P 500 Pure Growth Fund | 202,844,232 | 211,160,004 | ||||||
S&P 500 Pure Value Fund | 245,539,438 | 239,680,639 | ||||||
S&P MidCap 400 Pure Growth Fund | 93,254,650 | 127,657,183 | ||||||
S&P MidCap 400 Pure Value Fund | 64,352,689 | 55,883,952 | ||||||
S&P SmallCap 600 Pure Growth Fund | 82,511,829 | 86,292,670 | ||||||
S&P SmallCap 600 Pure Value Fund | 51,134,990 | 55,396,856 | ||||||
Europe 1.25x Strategy Fund | 22,573,671 | 23,657,038 | ||||||
Japan 2x Strategy Fund | — | — | ||||||
Strengthening Dollar 2x Strategy Fund | — | — | ||||||
Weakening Dollar 2x Strategy Fund | — | — | ||||||
Real Estate Fund | 76,595,079 | 84,682,237 | ||||||
Government Long Bond 1.2x Strategy Fund | — | — | ||||||
Inverse Government Long Bond Strategy Fund | — | — | ||||||
U.S. Government Money Market Fund | — | — | ||||||
For the period ended December 31, 2011, the cost of purchases and proceeds from sales of government securities were:
| Purchases | Sales | |||||||
Government Long Bond 1.2x Strategy Fund | $ | 561,710,076 | $ | 561,616,565 | ||||
Inverse Government Long Bond Strategy Fund | 238,220,078 | 252,350,409 | ||||||
| 9. | Line of Credit |
The Trust, along with other affiliated trusts, has secured an uncommitted, $75,000,000 line of credit with U.S. Bank, N.A. for emergency or temporary purposes. Borrowings, if any, under this arrangement bear interest equal to the Prime Rate, minus 2%, which shall be paid monthly, averaging 1.25% for the year ended December 31, 2011. At December 31, 2011, the Funds did not have any borrowings under this agreement, which expires on June 15, 2012, but the following table illustrates average daily balances borrowed:
Fund | Average Daily Balance | |||
Nova Fund | $ | 14,523 | ||
S&P 500 2x Strategy Fund | 22,181 | |||
NASDAQ-100® 2x Strategy Fund | 15,975 | |||
Mid-Cap 1.5x Strategy Fund | 9,649 | |||
Dow 2x Strategy Fund | 25,088 | |||
S&P 500 Pure Growth Fund | 4,553 | |||
| THE RYDEX FUNDSANNUALREPORT | 261 |
NOTES TO FINANCIAL STATEMENTS (concluded)
Fund | Average Daily Balance | |||
S&P 500 Pure Value Fund | $ | 2,055 | ||
S&P MidCap 400 Pure Growth Fund | 5,956 | |||
S&P MidCap 400 Pure Value Fund | 4,518 | |||
S&P SmallCap 600 Pure Growth Fund | 5,605 | |||
S&P SmallCap 600 Pure Value Fund | 16,022 | |||
Real Estate Fund | 9,458 | |||
Government Long Bond 1.2x Strategy Fund | 108,419 | |||
| 10. | Reverse Share Splits |
Effective December 2, 2011, Strengthening Dollar 2x Strategy Fund and Government Long Bond 1.2x Strategy Fund underwent a one-for-two reverse share split. The effect of these transactions was to divide the number of outstanding shares of the Funds by two, resulting in a corresponding increase in the net asset value per share. The capital share activity presented in the statements of changes in net assets for each of the two years in the period then ended, and the per share data in the financial highlights for each of the years in the five-year period then ended have been given retroactive effect to reflect these reverse share splits. There were no changes in net assets, results of operations or total return as a result of these transactions.
| 11. | Legal Proceedings |
| Tribune | Company |
Rydex Variable Trust has been named as a defendant and a putative member of the proposed defendant class of shareholders in the case entitled Official Committee of Unsecured Creditors of Tribune Co. v. FitzSimons (In re Tribune Co.), Adv. Pro. No. 10-54010 (Bankr. D. Del.), as a result of ownership of shares in the Tribune Company (“Tribune”) in 2007 by certain series of the Rydex Variable Trust when Tribune effected a leveraged buyout transaction (“LBO”) by which Tribune converted to a privately-held company. In its complaint, the Unsecured Creditors Committee (the “UCC”) has alleged that, in connection with the LBO, insiders and major shareholders were overpaid for their Tribune stock using financing that the insiders knew would, and ultimately did, leave the Tribune insolvent. The UCC has asserted claims against certain insiders, major shareholders, professional advisers, and others involved in the LBO, and is attempting to obtain from these individuals and entities the proceeds paid out in connection with the LBO. This adversary proceeding in the Bankruptcy Court has been stayed pending further order of the Bankruptcy Court.
In June 2011, a group of Tribune creditors, not including the UCC, filed multiple actions involving state law constructive fraudulent conveyance claims against former Tribune shareholders. Rydex Variable Trust also has been named as a defendant in one or more of these suits. These cases have been consolidated in a multidistrict litigation proceeding in the United States District Court for the Southern District of New York and have been stayed pending further order of that court or of the Bankruptcy Court.
None of these lawsuits allege any wrongdoing on the part of Rydex Variable Trust. The following series of Rydex Variable Trust held shares of Tribune and tendered these shares as part of Tribune’s LBO: Nova Fund, S&P 500 2x Strategy Fund, Multi-Cap Core Equity Fund, S&P 500 Pure Value Fund, Hedged Equity Fund and Multi-Hedge Strategies Fund (the “Funds”). The value of the proceeds received by the foregoing Funds was $12,580, $2,380, $1,360, $148,376, $2,720, and $119,034, respectively. At this stage of the proceedings, Rydex Variable Trust is not able to make a reliable predication as to the outcome of these lawsuits or the effect, if any, on a Fund’s net asset value.
Lyondell Chemical Company
In December 2011, Rydex Variable Trust was named as a defendant in Weisfelner, as Trustee of the LB Creditor Trust, v. Fund 1 (In re Lyondell Chemical Co.), Adv. Pro. No. 10-4609 (Bankr. S.D.N.Y.).
Similar to the claims made in the Tribune matter, the Weisfelner complaint seeks to have set aside and recovered as fraudulent transfers from former Lyondell Chemical Company (“Lyondell”) shareholders the consideration paid to them pursuant to the cash out merger of Lyondell shareholders in connection with the combination of Lyondell and Basell AF in 2007. Lyondell filed for bankruptcy in 2008.
This lawsuit does not allege any wrongdoing on the part of Rydex Variable Trust. The following series of Rydex Variable Trust received cash proceeds from the cash out merger in the following amounts: Basic Materials Fund - $1,235,952; U.S. Long Short Momentum Fund - $523,200; Multi-Cap Core Equity Fund - $5,760; Hedged Equity Fund - $480; and Multi-Hedge Strategies Fund - $112,848. At this stage of the proceedings, Rydex Variable Trust is not able to make a reliable predication as to the outcome of these lawsuits or the effect, if any, on a Fund’s net asset value.
| 262 | THE RYDEX FUNDSANNUALREPORT |
REPORT OF INDEPENDENT REGISTERED PUBLIC ACCOUNTING FIRM
To the Board of Trustees and Shareholders
of the Rydex Variable Trust:
We have audited the accompanying statements of assets and liabilities, including the schedules of investments, of Nova Fund, Inverse S&P 500 Strategy Fund, NASDAQ-100® Fund, Inverse NASDAQ-100® Strategy Fund, S&P 500 2x Strategy Fund, NASDAQ-100 2x Strategy Fund, Mid-Cap 1.5x Strategy Fund, Inverse Mid-Cap Strategy Fund, Russell 2000® 2x Strategy Fund, Russell 2000® 1.5x Strategy Fund, Inverse Russell 2000® Strategy Fund, Dow 2x Strategy Fund, Inverse Dow 2x Strategy Fund, S&P 500 Pure Growth Fund, S&P 500 Pure Value Fund, S&P MidCap 400 Pure Growth Fund, S&P MidCap 400 Pure Value Fund, S&P SmallCap 600 Pure Growth Fund, S&P SmallCap 600 Pure Value Fund, Europe 1.25x Strategy Fund, Japan 2x Strategy Fund, Strengthening Dollar 2x Strategy Fund, Weakening Dollar 2x Strategy Fund, Real Estate Fund, Government Long Bond 1.2x Strategy Fund, Inverse Government Long Bond Strategy Fund, and U.S. Government Money Market Fund (twenty-seven of the series constituting the Rydex Variable Trust) (the “Funds”) as of December 31, 2011, and the related statements of operations for the year then ended, the statements of changes in net assets for each of the two years in the period then ended, and the financial highlights for each of the four years in the period then ended. These financial statements and financial highlights are the responsibility of the Funds’ management. Our responsibility is to express an opinion on these financial statements and financial highlights based on our audits. The financial highlights for the year ended December 31, 2007 were audited by other auditors, whose report dated February 26, 2008 expressed an unqualified opinion on those financial highlights.
We conducted our audits in accordance with the standards of the Public Company Accounting Oversight Board (United States). Those standards require that we plan and perform the audit to obtain reasonable assurance about whether the financial statements and financial highlights are free of material misstatement. We were not engaged to perform an audit of the Funds’ internal control over financial reporting. Our audits included consideration of internal control over financial reporting as a basis for designing audit procedures that are appropriate in the circumstances, but not for the purpose of expressing an opinion on the effectiveness of the Funds’ internal control over financial reporting. Accordingly, we express no such opinion. An audit also includes examining, on a test basis, evidence supporting the amounts and disclosures in the financial statements and financial highlights, assessing the accounting principles used and significant estimates made by management, as well as evaluating the overall financial statement presentation. Our procedures included confirmation of securities owned as of December 31, 2011, by correspondence with the custodian and brokers or by other appropriate auditing procedures where replies from brokers were not received. We believe that our audits provide a reasonable basis for our opinion.
In our opinion, the financial statements and financial highlights referred to above present fairly, in all material respects, the financial position of the above listed Funds at December 31, 2011, the results of their operations for the year then ended, the changes in their net assets for each of the two years in the period then ended, and their financial highlights for each of the four years in the period then ended, in conformity with U.S. generally accepted accounting principles.

McLean, Virginia
February 28, 2012
THE RYDEX FUNDSANNUALREPORT | 263
Tax Information
This information is being provided as required by the Internal Revenue Code. Amounts shown may differ from those elsewhere in the report because of differences in tax and financial reporting practice.
Of the ordinary income distributions paid during the year, the following funds had the corresponding percentages qualify for the dividends received deduction for corporations:
Fund | % Qualifying | |||
Nova Fund | 100.00 | % | ||
NASDAQ-100® 2x Strategy Fund | 15.38 | % | ||
S&P 500 Pure Value Fund | 100.00 | % | ||
With respect to the taxable year ended December 31, 2011, the Funds hereby designate as capital gain dividends the amounts listed below, or, if subsequently determined to be different, the net capital gain of such year:
| S&P MidCap 400 Pure Growth Fund | NASDAQ-100® 2x Strategy Fund | Russell 2000® 2x Strategy Fund | ||||||||||
From long-term capital gains, subject to the 15% rate gains category: | $ | 1,787,658 | $ | 2,665,434 | $ | 197,452 | ||||||
Proxy Voting Information
A description of the policies and procedures that the Trust uses to determine how to vote proxies relating to securities held in the Funds’ portfolios is available, without charge and upon request, by calling 1.800.820.0888. This information is also available from the EDGAR database on the SEC’s website at http://www.sec.gov.
Information regarding how the Funds voted proxies relating to portfolio securities during the most recent 12-month period ended June 30 is available without charge, upon request, by calling 1.800.820.0888. This information is also available from the EDGAR database on the SEC’s website at http://www.sec.gov.
At a special meeting of shareholders held on November 22, 2011, the shareholders of the Funds voted on whether to approve a new investment advisory agreement between Rydex Variable Trust and Security Investors, LLC. A description of the number of shares voted is as follows:
Fund | Shares For | Shares Against | Shares Abstained | |||||||||
Nova Fund | 266,420 | 8,068 | 12,100 | |||||||||
Inverse S&P 500 Strategy Fund | 841,193 | 126,980 | 64,109 | |||||||||
NASDAQ-100® Fund | 1,652,987 | 113,688 | 82,181 | |||||||||
Inverse NASDAQ-100® Strategy Fund | 815,466 | 2,530 | 13,803 | |||||||||
S&P 500 2x Strategy Fund | 87,553 | 194 | 1,563 | |||||||||
NASDAQ-100® 2x Strategy Fund | 837,753 | 10,095 | 10,111 | |||||||||
Mid-Cap 1.5x Strategy Fund | 314,158 | 11,682 | 32,782 | |||||||||
Inverse Mid-Cap Strategy Fund | 90,070 | — | 1,169 | |||||||||
Russell 2000® 2x Strategy Fund | 30,152 | — | — | |||||||||
Russell 2000® 1.5x Strategy Fund | 176,561 | 4,162 | 7,595 | |||||||||
Inverse Russell 2000® Strategy Fund | 346,927 | 84,086 | 11,430 | |||||||||
Dow 2x Strategy Fund | 139,694 | 6,835 | 10,117 | |||||||||
Inverse Dow 2x Strategy Fund | 689,746 | 81,096 | 2,773 | |||||||||
S&P 500 Pure Growth Fund | 1,066,022 | 45,072 | 74,139 | |||||||||
S&P 500 Pure Value Fund | 332,916 | 8,931 | 24,043 | |||||||||
S&P MidCap 400 Pure Growth Fund | 688,085 | 11,737 | 29,029 | |||||||||
S&P MidCap 400 Pure Value Fund | 139,242 | 1,440 | 10,692 | |||||||||
S&P SmallCap 600 Pure Growth Fund | 377,385 | 17,671 | 8,309 | |||||||||
S&P SmallCap 600 Pure Value Fund | 68,387 | 993 | 4,418 | |||||||||
Europe 1.25x Strategy Fund | 404,562 | 1,620 | 13,727 | |||||||||
Japan 2x Strategy Fund | 133,548 | — | 4,414 | |||||||||
Strengthening Dollar 2x Strategy Fund | 1,336,319 | 2,698 | 124,836 | |||||||||
Weakening Dollar 2x Strategy Fund | 74,312 | 6,217 | 11,655 | |||||||||
Real Estate Fund | 568,342 | 25,005 | 12,795 | |||||||||
Government Long Bond 1.2x Strategy Fund | 3,513,298 | 31,767 | 94,538 | |||||||||
Inverse Government Long Bond Strategy Fund | 737,090 | 25,299 | 39,302 | |||||||||
U.S. Government Money Market Fund | 286,278,080 | 14,815,467 | 11,694,027 | |||||||||
264 | THE RYDEX FUNDSANNUALREPORT
OTHER INFORMATION (Unaudited) (continued)
At a special meeting of shareholders held on November 22, 2011, the shareholders of the Trust also voted on whether to approve the election of nominees to the Board of Trustees. A description of the number of shares voted is as follows:
Donald C. Cacciapaglia | Corey A. Colehour | J. Kenneth Dalton | ||||||||||||||
For | 343,022,995 | For | 339,263,789 | For | 342,726,825 | |||||||||||
Withhold | 18,549,008 | Withhold | 22,308,214 | Withhold | 18,845,178 | |||||||||||
Total | 361,572,003 | Total | 361,572,003 | Total | 361,572,003 | |||||||||||
John O. Demaret | Richard M. Goldman | Werner E. Keller | ||||||||||||||
For | 338,940,641 | For | 342,766,477 | For | 342,532,565 | |||||||||||
Withhold | 22,631,362 | Withhold | 18,805,526 | Withhold | 19,039,438 | |||||||||||
Total | 361,572,003 | Total | 361,572,003 | Total | 361,572,003 | |||||||||||
Thomas F. Lydon | Patrick T. McCarville | Roger Somers | ||||||||||||||
For | 343,159,833 | For | 339,367,739 | For | 343,007,265 | |||||||||||
Withhold | 18,412,170 | Withhold | 22,204,264 | Withhold | 18,564,738 | |||||||||||
Total | 361,572,003 | Total | 361,572,003 | Total | 361,572,003 | |||||||||||
At a special meeting of shareholders held on November 22, 2011, the shareholders of the Funds also voted on whether to approve a “manager of managers” arrangement for each of the Funds. A description of the number of shares voted is as follows:
Fund | Shares For | Shares Against | Shares Abstained | |||||||||
Nova Fund | 268,503 | 9,463 | 8,621 | |||||||||
Inverse S&P 500 Strategy Fund | 793,896 | 179,767 | 58,616 | |||||||||
NASDAQ-100® Fund | 1,638,917 | 135,071 | 74,869 | |||||||||
Inverse NASDAQ-100® Strategy Fund | 807,577 | 6,297 | 17,923 | |||||||||
S&P 500 2x Strategy Fund | 87,352 | 194 | 1,763 | |||||||||
NASDAQ-100® 2x Strategy Fund | 836,384 | 10,095 | 11,479 | |||||||||
Mid-Cap 1.5x Strategy Fund | 313,762 | 1,375 | 43,486 | |||||||||
Inverse Mid-Cap Strategy Fund | 90,041 | 29 | 1,169 | |||||||||
Russell 2000® 2x Strategy Fund | 29,974 | — | 179 | |||||||||
Russell 2000® 1.5x Strategy Fund | 183,390 | 4,472 | 456 | |||||||||
Inverse Russell 2000® Strategy Fund | 346,890 | 55,202 | 40,349 | |||||||||
Dow 2x Strategy Fund | 115,929 | 6,906 | 33,813 | |||||||||
Inverse Dow 2x Strategy Fund | 606,237 | 140,939 | 26,438 | |||||||||
S&P 500 Pure Growth Fund | 1,104,962 | 41,476 | 38,795 | |||||||||
S&P 500 Pure Value Fund | 325,941 | 12,152 | 27,797 | |||||||||
S&P MidCap 400 Pure Growth Fund | 685,624 | 13,831 | 29,395 | |||||||||
S&P MidCap 400 Pure Value Fund | 139,991 | 2,261 | 9,124 | |||||||||
S&P SmallCap 600 Pure Growth Fund | 375,360 | 17,671 | 10,334 | |||||||||
S&P SmallCap 600 Pure Value Fund | 68,033 | 993 | 4,772 | |||||||||
Europe 1.25x Strategy Fund | 396,757 | 12,188 | 10,963 | |||||||||
Japan 2x Strategy Fund | 133,535 | 12 | 4,414 | |||||||||
Strengthening Dollar 2x Strategy Fund | 1,144,151 | 199,599 | 120,102 | |||||||||
Weakening Dollar 2x Strategy Fund | 75,399 | 5,130 | 11,655 | |||||||||
Real Estate Fund | 541,834 | 28,491 | 35,817 | |||||||||
Government Long Bond 1.2x Strategy Fund | 3,512,034 | 54,699 | 72,870 | |||||||||
Inverse Government Long Bond Strategy Fund | 701,489 | 48,111 | 52,091 | |||||||||
U.S. Government Money Market Fund | 285,151,587 | 15,938,909 | 11,697,077 | |||||||||
At a special meeting of shareholders held on November 22, 2011, the shareholders of the Funds also voted on whether to approve the Elimination of the Fundamental Investment Policy on Investing in Other Investment Companies. A description of the number of shares voted is as follows:
Fund | Shares For | Shares Against | Shares Abstained | |||||||||
U.S. Government Money Market Fund | 284,649,158 | 15,744,471 | 12,393,944 | |||||||||
Quarterly Portfolio Schedules Information
The Trust files its complete schedule of portfolio holdings with the SEC for the first and third quarters of each fiscal year on Form N-Q; which are available on the SEC’s website at http://www.sec.gov. The Funds’ Forms N-Q may be reviewed and copied at the SEC’s Public Reference Room in Washington, DC, and that information on the operation of the Public Reference Room may be obtained by calling 1-800-SEC-0330. Copies of the portfolio holdings are also available to shareholders, without charge and upon request, by calling 1.800.820.0888.
| THE RYDEX FUNDSANNUALREPORT | 265 |
OTHER INFORMATION (Unaudited) (continued)
Office Locations
The offices of Guggenheim Investments can be found in the following locations:
40 East 52nd Street
16th Floor
New York, NY 10022
(Headquarters)
Four Irvington Centre
805 King Farm Boulevard
Suite 600
Rockville, MD 20850
9401 Indian Creek Parkway
40 Corporate Woods
Suite 850
Overland Park, KS 66210
Guggenheim Transaction
On September 20, 2011, Guggenheim Capital, LLC agreed to purchase the indirect holding company of Security Investors, LLC, the Fund’s investment manager (the “Investment Manager”) (the “Transaction”). Guggenheim Capital, LLC’s subsidiary, Guggenheim Partners, LLC (“Guggenheim”), is a global, independent, privately-held, diversified financial services firm with more than 1,500 dedicated professionals.
The Transaction should not result in material changes to the day-to-day management and operation of the Funds or any increase in fees. The parties expect the Transaction to be completed in early 2012. However, it is subject to various conditions, and could be delayed or even terminated due to unforeseen circumstances.
In anticipation of the Transaction, the Board of Trustees of the Funds (the “Board”) called a special meeting of shareholders (the “Meeting”), at which shareholders of the Funds of record as of October 3, 2011 were asked to consider the approval of a new investment management agreement between the Funds and the Investment Manager (the “New Agreement”). This approval was necessary because, under the Investment Company Act of 1940 (the “1940 Act”), the Transaction could result in the termination of the Funds’ current investment management agreement with the Investment Manager (the “Current Agreement”). The Funds’ shareholders approved the New Agreement, the terms of which are substantially identical to the corresponding Current Agreement, except with respect to the date of execution, and the New Agreement will take effect if the Transaction is completed.
Election of Board Members
The Board also approved a proposal to elect nine individuals to the Board. The Board proposed the election of the following nominees: Donald C. Cacciapaglia, Corey A. Colehour, J. Kenneth Dalton, John O. Demaret, Richard M. Goldman, Werner E. Keller, Thomas F. Lydon, Patrick T. McCarville and Roger Somers. Each of the nominees, other than Mr. Cacciapaglia, currently serves as a Trustee. In connection with the Transaction, the Board believes that expanding the Board to include Mr. Cacciapaglia, who is a member of senior management of Guggenheim’s investment management business, and who would serve on other board in the Guggenheim Investments family of funds, would be appropriate. The Trusts’ shareholders ultimately approved the aforementioned proposal.
Board Considerations in Approving the Investment Advisory Agreements
At an in-person meeting of the Trust’s Board of Trustees held August 16-17, 2011, called for the purpose of, among other things, voting on the approval of the investment advisory agreements applicable to the series of the Trust (collectively, the “Funds”), the Trust’s Board of Trustees, including the independent Trustees, unanimously approved the investment advisory agreement between the Trust and Security Investors, LLC (referred to herein as the “Adviser”).
At the meeting of August 16-17, 2011, the Trust’s Board of Trustees also considered new investment advisory agreements that were required as a result of a proposed change in the corporate ownership structure of the Adviser (the “Transaction”). The Investment Company Act of 1940 (the “1940 Act”), the law that regulates mutual funds, including the Funds, requires that a fund’s investment advisory agreement terminate whenever there is deemed to be a “change in control” of the investment adviser. The change in the corporate ownership structure of the Adviser could potentially be deemed to constitute a “change in control” (as this term is used for regulatory purposes) of the Adviser. Before an investment advisory agreement terminates, a new investment advisory agreement must be in effect in order for the investment adviser to continue to manage the fund’s investments. For that reason, the Board of Trustees was asked to approve new investment advisory agreements for the Funds.
| 266 | THE RYDEX FUNDSANNUALREPORT |
OTHER INFORMATION (Unaudited) (continued)
At the meeting of August 16-17, 2011, the Board considered the new investment advisory agreements, pursuant to which, subject to approval by each Fund’s shareholders of the new agreements, the Adviser would continue to serve each Fund as investment adviser after the completion of the Transaction. At a special meeting of the Board held on September 14, 2011, the Board considered further information about the Transaction and voted in favor of the new investment advisory agreements.
In reaching the conclusion to approve the new investment advisory agreements, the Trustees requested and obtained from the Adviser such information as the Trustees deemed reasonably necessary to evaluate the proposed agreements. The Trustees carefully evaluated this information and were advised by legal counsel with respect to their deliberations.
Prior to the Board meetings in August and September 2011, representatives of Guggenheim Capital informed the Board of the Transaction. With respect to the Transaction, the Board reviewed materials received from Guggenheim Capital, including information relating to the terms of the Transaction. The Board also reviewed information regarding Guggenheim Capital, including, but not limited to: (a) certain representations concerning Guggenheim Capital’s financial condition, (b) information regarding the new proposed ownership structure and its possible effect on shareholders, (c) information regarding the consideration to be paid by Guggenheim Capital, and (d) potential conflicts of interest.
In considering the new investment advisory agreements, the Board determined that the agreements would enable shareholders of the Funds to continue to obtain high quality services at a cost that is appropriate, reasonable, and in the best interests of their shareholders. The Board, including the independent Trustees, unanimously approved the new agreements. In reaching their decision, the Trustees carefully considered information that they had received throughout the year as part of their regular oversight of the Funds, including, in particular, information from the Adviser that the Board had received relating to the current investment advisory agreements at the Board meeting of August 16-17, 2011. The Trustees noted that, at the meeting, they had obtained and reviewed a wide variety of information, including certain comparative information regarding performance of the Funds relative to performance of other comparable mutual funds. They also considered the evolution of the Rydex|SGI family of funds and the Adviser since the change in control of the Adviser in 2010 and Guggenheim Capital’s commitment to the success of the Adviser and the Funds.
In addition, as a part of their required consideration of the renewal of the current investment advisory agreements at the meeting of August 16-17, 2011, the Trustees, including the independent Trustees, had evaluated a number of considerations, including among others: (a) the quality of the Adviser’s investment advisory and other services; (b) the Adviser’s investment management personnel; (c) the Adviser’s operations and financial condition; (d) the Adviser’s brokerage practices (including any soft dollar arrangements) and investment strategies; (e) the level of the fees that the Adviser charges compared with the fees charged to comparable mutual funds or accounts; (f) each Fund’s overall fees and operating expenses compared with similar mutual funds; (g) the level of the Adviser’s profitability from its Fund-related operations; (h) the Adviser’s compliance systems; (i) the Adviser’s policies on and compliance procedures for personal securities transactions; (j) the Adviser’s reputation, expertise and resources in the financial markets; and (k) Fund performance compared with similar mutual funds. Based on the Board’s deliberations at the meetings of August 16-17, 2011 and September 14, 2011, and its evaluation of the information regarding the Transaction and the fact that the Transaction is not expected to change the level and quality of services rendered by the Adviser to any of the Funds, the Board, including all of the independent Trustees, unanimously: (a) concluded that terms of the current and new investment advisory agreements are fair and reasonable; (b) concluded that the Adviser’s fees were reasonable in light of the services provided to the Funds; and (c) agreed to approve the current investment advisory agreements and, subject to shareholder approval, the new investment advisory agreements, based upon the following considerations, among others:
| • | Nature, Extent and Quality of Services Provided by the Adviser. At the meeting of August 16-17, 2011, the Board reviewed the scope of services to be provided by the Adviser under the current investment advisory agreements, and, at the meetings of August 16-17, 2011 and September 14, 2011, noted that there would be no significant differences between the scope of services required to be provided by the Adviser under the current investment advisory agreements and the scope of services required to be provided by the Adviser under the new investment advisory agreements. The Board noted that the key investment and management personnel of the Adviser servicing the Funds are expected to remain the same following the Transaction. The Trustees also considered Guggenheim Capital’s representations to the Board that the Adviser would continue to provide investment and related services that were of materially the same quality and quantity as services provided to the Funds in the past, and that these services are appropriate in scope and extent in light of the Funds’ operations, the competitive landscape of the investment company business and investor needs. |
| • | Fund Expenses and Performance of the Funds. At the meeting of August 16-17, 2011, the Board had reviewed statistical information prepared by the Adviser regarding the expense ratio components and performance of each Fund. Based on the representations made by Guggenheim Capital at the meeting that the Adviser would continue to operate following the closing of the Transaction in much the same manner as it currently operates, the Board concluded that the investment performance of the Adviser was not expected to be affected by the Transaction. |
| THE RYDEX FUNDSANNUALREPORT | 267 |
OTHER INFORMATION (Unaudited) (concluded)
| • | Costs of Services Provided to the Funds and Profits Realized by the Adviser and its Affiliates. At the meeting of August 16-17, 2011, the Board had reviewed information about the profitability of the Funds to the Adviser based on the advisory fees payable under the current investment advisory agreements. At that meeting, the Board had also analyzed the Funds’ expenses, including the investment advisory fees paid to the Adviser. The Board also had reviewed reports comparing the expense ratios to those of other comparable mutual funds. At the Board meeting, the Board considered the fact that the fee rates payable to the Adviser would be the same under each Fund’s new investment advisory agreements as they are under such Fund’s current agreements. With respect to anticipated profitability, the Board noted that it was too early to predict how the Transaction would affect the Adviser’s profitability with respect to the Funds, but noted that this matter would be given further consideration on an ongoing basis. |
| • | Economies of Scale. In connection with its review of the Funds’ profitability analysis at the meeting of August 16-17, 2011, the Board reviewed information regarding economies of scale or other efficiencies that may result from increases in the Funds’ asset levels. The Trustees noted that the fees would not change under the new investment advisory agreements, and that no additional economies of scale would be directly realized as a result of the Transaction. They also noted that they will have the opportunity to again review the appropriateness of the fees payable to the Adviser under the new agreements when the renewal of the new agreements next comes before the Board. |
| • | Other Benefits to the Adviser and/or its Affiliates. In addition to evaluating the services provided by the Adviser, the Board had considered the nature, extent, quality and cost of the distribution services performed by the Funds’ Distributor under a separate agreement at the meeting of August 16-17, 2011. The Board reviewed information regarding potential economies of scale arising from the integration of the asset management businesses of Guggenheim Capital. The Board also considered the terms of the Transaction and the changes to the corporate ownership structure of the Adviser, noting that the Adviser would no longer be a subsidiary of Security Benefit Corporation. In this regard, the Board noted that, under the corporate structure after the Transaction, the Adviser would be more closely controlled by Guggenheim Capital, which could benefit Guggenheim Capital. The Board also noted that the costs associated with the Transaction would be borne by Guggenheim Capital (or its affiliates) and not the Funds. |
On the basis of the information provided to it and its evaluation of that information, the Board, including the independent Trustees, concluded that the terms of the investment advisory agreements for the Funds were reasonable, and that approval of the current and new investment advisory agreements were in the best interests of the Funds.
268 | THE RYDEX FUNDSANNUALREPORT
INFORMATION ON BOARD OF TRUSTEES AND OFFICERS (Unaudited)
A Board of Trustees oversees the Trust, as well as other trusts of RI, in which its members have no stated term of service, and continue to serve after election until resignation. The Statement of Additional Information includes further information about Fund Trustees and Officers, and can be obtained without charge by calling 800.820.0888.
All Trustees and Officers may be reached c/o Guggenheim Investments, 805 King Farm Boulevard, Suite 600, Rockville, MD 20850.
INDEPENDENT TRUSTEES
Name, Position and Year of Birth | Length of Service As Trustee (Year Began) | Number of | ||
Corey A. Colehour | Rydex Series Funds – 1993 | 150 | ||
Trustee (1945) | Rydex Variable Trust – 1998 | |||
| Rydex Dynamic Funds – 1999 | ||||
| Rydex ETF Trust – 2003 | ||||
Principal Occupations During Past Five Years: Retired; Member of the Audit, Governance and Nominating Committees (1995 to present)
| ||||
| J. Kenneth Dalton | Rydex Series Funds – 1995 | 150 | ||
Trustee (1941) | Rydex Variable Trust – 1998 | |||
| Rydex Dynamic Funds – 1999 | ||||
| Rydex ETF Trust – 2003 | ||||
Principal Occupations During Past Five Years: Retired; Member of the Governance and Nominating Committees (1995 to present); Chairman of the Audit Committee (1997 to present); Member of the Risk Oversight Committee (2010 to present)
| ||||
| John O. Demaret | Rydex Series Funds – 1997 | 150 | ||
Trustee, Chairman of the | Rydex Variable Trust – 1998 | |||
Board (1940) | Rydex Dynamic Funds – 1999 | |||
| Rydex ETF Trust – 2003 | ||||
Principal Occupations During Past Five Years: Retired; Member of the Audit Committee (1997 to present); Member of the Risk Oversight Committee (2010 to present)
| ||||
| Werner E. Keller | Rydex Series Funds – 2005 | 150 | ||
Trustee (1940) | Rydex Variable Trust – 2005 | |||
| Rydex Dynamic Funds – 2005 | ||||
| Rydex ETF Trust – 2005 | ||||
Principal Occupations During Past Five Years: Founder and President of Keller Partners, LLC (registered investment adviser) (2005 to present); Member of the Audit, Governance and Nominating Committees (2005 to present); Chairman and Member of the Risk Oversight Committee (2010 to present)
| ||||
| Thomas F. Lydon, Jr. | Rydex Series Funds – 2005 | 150 | ||
Trustee (1960) | Rydex Variable Trust – 2005 | |||
| Rydex Dynamic Funds – 2005 | ||||
| Rydex ETF Trust – 2005 | ||||
Principal Occupations During Past Five Years: President, Global Trends Investments (1996 to present); Member of the Audit, Governance and Nominating Committees (2005 to present)
| ||||
| Patrick T. McCarville | Rydex Series Funds – 1997 | 150 | ||
Trustee (1942) | Rydex Variable Trust – 1998 | |||
| Rydex Dynamic Funds – 1999 | ||||
| Rydex ETF Trust – 2003 | ||||
Principal Occupations During Past Five Years: CEO, Par Industries, Inc., d/b/a Par Leasing (1977 to 2010); Chairman of the Governance and Nominating Committees (1997 to present); Member of the Audit Committee (1997 to present)
| ||||
| Roger Somers | Rydex Series Funds – 1993 | 150 | ||
Trustee (1944) | Rydex Variable Trust – 1998 | |||
| Rydex Dynamic Funds – 1999 | ||||
| Rydex ETF Trust – 2003 | ||||
Principal Occupations During Past Five Years: Founder and CEO of Arrow Limousine (1965 to present); Member of the Audit, Governance and Nominating Committees (1995 to present)
THE RYDEX FUNDSANNUALREPORT | 269
INFORMATION ON BOARD OF TRUSTEES AND OFFICERS (Unaudited) (continued)
EXECUTIVE OFFICERS
Name, Positionand Year of Birth | Principal Occupations During Past Five Years | |
Richard M. Goldman* President (1961) | Current: Senior Vice President, Security Benefit Corporation; CEO, Security Benefit Asset Management Holdings, LLC; CEO, President and Manager Representative, Security Investors, LLC; CEO and Manager, Rydex Holdings, LLC; CEO, President and Manager, Rydex Distributors, LLC; Manager, Rydex Fund Services, LLC; President and Trustee, Rydex Series Funds, Rydex ETF Trust, Rydex Dynamic Funds and Rydex Variable Trust | |
| Previous: Director, First Security Benefit Life Insurance Company (2007-2010); President and Director, Security Global Investors (2010-2011); CEO and Director, Rydex Advisors, LLC and Rydex Advisors II, LLC (2010); Director, Security Distributors, Inc. (2007-2009); Managing Member, R.M. Goldman Partners, LLC (2006-2007) | ||
Michael P. Byrum* Vice President (1970) | Current: President, Security Benefit Asset Management Holdings, LLC; Senior Vice President, Security Investors, LLC; President and Chief Investment Officer, Rydex Holdings, LLC; Director and Chairman of the Board, Advisor Research Center, Inc.; Manager, Rydex Specialized Products, LLC | |
| Previous: Rydex Distributors, LLC (f/k/a Rydex Distributors, Inc.), Vice President (2009); Rydex Fund Services, LLC, Director (2009-2010), Secretary (2002- 2010), Executive Vice President (2002-2006); Rydex Advisors, LLC (f/k/a PADCO Advisors, Inc.), Director (2008-2010), Chief Investment Officer (2006-2010), President (2004-2010), Secretary (2002-2010); Rydex Advisors II, LLC (f/k/a PADCO Advisors II, Inc.), Director (2008-2010), Chief Investment Officer (2006-2010), President (2004-2010), Secretary (2002-2010); Rydex Capital Partners, LLC, President and Secretary (2003-2007); Rydex Capital Partners II, LLC, (2003-2007); Rydex Holdings, LLC (f/k/a Rydex Holdings, Inc.), Secretary (2005-2008), Executive Vice President (2005-2006); Advisor Research Center, Inc., Secretary (2006-2009), Executive Vice President (2006); Rydex Specialized Products, LLC, Secretary (2005-2008) | ||
Nikolaos Bonos* Vice President and Treasurer (1963) | Current: Senior Vice President, Security Investors, LLC; Chief Executive Officer and Manager, Rydex Specialized Products, LLC; Chief Executive Officer and President, Rydex Fund Services, LLC; Vice President, Rydex Holdings, LLC; Treasurer, SBL Fund; Security Equity Fund; Security Income Fund; Security Large Cap Value Fund and Security Mid Cap Growth Fund; Vice President, Security Benefit Asset Management Holdings, LLC | |
| Previous: Security Global Investors, LLC, Senior Vice President (2010-2011); Rydex Advisors, LLC (f/k/a PADCO Advisors, Inc.) Senior Vice President (2006-2011); Rydex Fund Services, LLC (f/k/a Rydex Fund Services, Inc.), Director (2009); Senior Vice President (2003-2006); Rydex Specialized Products, LLC, Chief Financial Officer (2005-2009) | ||
270 | THE RYDEX FUNDSANNUALREPORT
INFORMATION ON BOARD OF TRUSTEES AND OFFICERS (Unaudited) (continued)
EXECUTIVE OFFICERS (continued)
Name, Position and Year of Birth | Principal Occupations During Past Five Years | |
Joanna M. Haigney* Chief Compliance Officer and Secretary (1966) | Current: Chief Compliance Officer and Secretary, SBL Fund; Security Equity Fund; Security Income Fund; Security Large Cap Value Fund and Security Mid Cap Growth Fund; Vice President, Rydex Holdings, LLC; Vice President, Security Benefit Asset Management Holdings, LLC; Senior Vice President and Chief Compliance Officer, Security Investors, LLC | |
| Previous: Security Global Investors, LLC, Senior Vice President (2010-2011); Rydex Advisors, LLC (f/k/a PADCO Advisors, Inc.) and Rydex Advisors II, LLC (f/k/a PADCO Advisors II, Inc.), Chief Compliance Officer and Senior Vice President (2010-2011); Rydex Capital Partners I, LLC and Rydex Capital Partners II, LLC, Chief Compliance Officer (2006-2007); Rydex Fund Services, LLC (f/k/a Rydex Fund Services, Inc.), Vice President (2001-2006) | ||
Keith Fletcher* Vice President (1958) | Current: Senior Vice President, Security Investors, LLC; Vice President, Rydex Holdings, LLC; Vice President, Rydex Specialized Products, LLC; Vice President, Rydex Distributors, LLC; Vice President, Rydex Fund Services, LLC; Vice President and Director, Advisor Research Center, Inc.; Vice President, SBL Fund; Security Equity Fund; Security Income Fund; Security Large Cap Value Fund and Security Mid Cap Growth Fund | |
| Previous: Security Global Investors, LLC, Vice President (2010-2011); Rydex Advisors, LLC (f/k/a PADCO Advisors, Inc.) and Rydex Advisors II, LLC (f/k/a PADCO Advisors II, Inc.), Vice President (2009-2011); Lyster Watson and Company, Managing Director (2007-2008); Fletcher Financial Group, Inc., Chief Executive Officer (2004-2007) | ||
Amy J. Lee* Vice President and Assistant Secretary (1960) | Current: Senior Vice President and Secretary, Security Investors, LLC; Secretary and Chief Compliance Officer, Security Distributors, Inc.; Vice President, Associate General Counsel and Assistant Secretary, Security Benefit Life Insurance Company and Security Benefit Corporation; Associate General Counsel, First Security Benefit Life Insurance and Annuity of New York; Vice President and Secretary, SBL Fund; Security Equity Fund; Security Income Fund; Security Large Cap Value Fund and Security Mid Cap Growth Fund; Vice President and Secretary, Rydex Holdings, LLC; Secretary, Advisor Research Center, Inc., Rydex Specialized Products, LLC, Rydex Distributors, LLC and Rydex Fund Services, LLC; Assistant Secretary, Security Benefit Clinic and Hospital | |
| Previous: Security Global Investors, LLC, Senior Vice President and Secretary (2007- 2011); Rydex Advisors, LLC (f/k/a PADCO Advisors, Inc.) and Rydex Advisors II, LLC (f/k/a PADCO Advisors II, Inc.), Senior Vice President and Secretary (2010- 2011); Brecek and Young Advisors, Inc., Director (2004-2008) | ||
THE RYDEX FUNDSANNUALREPORT | 271
INFORMATION ON BOARD OF TRUSTEES AND OFFICERS (Unaudited) (concluded)
EXECUTIVE OFFICERS (concluded)
Name, Position and Year of Birth | Principal Occupations During Past Five Years | |
Joseph Arruda* Assistant Treasurer (1966) | Current: Assistant Treasurer, SBL Fund; Security Equity Fund; Security Income Fund; Security Large Cap Value Fund and Security Mid Cap Growth Fund; Vice President, Security Investors, LLC; Chief Financial Officer and Manager, Rydex Specialized Products, LLC | |
| Previous: Security Global Investors, LLC, Vice President (2010-2011); Rydex Advisors, LLC (f/k/a PADCO Advisors, Inc.) and Rydex Advisors II, LLC (f/k/a PADCO Advisors II, Inc.), Vice President (2004-2011) | ||
| * | Officers of the Funds are deemed to be “interested persons” of the Trust, within the meaning of Section 2(a) (19) of the 1940 Act, inasmuch as this person is affiliated with Security Investors. |
272 | THE RYDEX FUNDSANNUALREPORT
GUGGENHEIM INVESTMENTS PRIVACY POLICIES
Rydex Funds, Guggenheim Funds, Rydex Investments, Rydex Distributors, Inc., Security Investors, LLC, Security Distributors, Inc. and Rydex Advisory Services (Collectively “Guggenheim Investments”)
Our Commitment to You
When you become a Guggenheim Investments investor, you entrust us with not only your hard-earned money but also with personal and financial information about you. We recognize that your relationship with us is based on trust and that you expect us to act responsibly and in your best interests. Because we have access to this private information about you, we hold ourselves to the highest standards in its safekeeping and use. This means, most importantly, that we do not sell client information to anyone—whether it is your personal information or if you are a current or former Guggenheim Investments client.
The Information We Collect About You
In the course of doing business with shareholders and investors, we collect nonpublic personal information about you. You typically provide personal information when you complete a Guggenheim Investments account application or when you request a transaction that involves Rydex and Guggenheim Investments funds or one of the Guggenheim Investments affiliated companies. “Nonpublic personal information” is personally identifiable private information about you. For example, it includes information regarding your name and address, Social Security or taxpayer identification number, assets, income, account balance, bank account information and investment activity (e.g., purchase and redemption history).
How We Handle Your Personal Information
As emphasized above, we do not sell information about current or former clients or their accounts to third parties. Nor do we share such information, except when necessary to complete transactions at your request or to make you aware of related investment products and services that we offer. Additional details about how we handle your personal information are provided below. To complete certain transactions or account changes that you direct, it may be necessary to provide identifying information to companies, individuals or groups that are not affiliated with Guggenheim Investments. For example, if you ask to transfer assets from another financial institution to Guggenheim Investments, we will need to provide certain information about you to that company to complete the transaction. To alert you to other Guggenheim Investments investment products and services, we may share your information within the Guggenheim Investments family of affiliated companies. This would include, for example, sharing your information within Guggenheim Investments so we can make you aware of new Rydex and Guggenheim Investments funds or the services offered through another Guggenheim Investments affiliated company. In certain instances, we may contract with nonaffiliated companies to perform services for us. Where necessary, we will disclose information we have about you to these third parties. In all such cases, we provide the third party with only the information necessary to carry out its assigned responsibilities and only for that purpose. And we require these third parties to treat your private information with the same high degree of confidentiality that we do. In certain instances, we may share information with other financial institutions regarding individuals and entities in response to the U.S.A. Patriot Act. Finally, we will release information about you if you direct us to do so, if we are compelled by law to do so or in other circumstances permitted by law.
Opt Out Provisions
We do not sell your personal information to anyone. The law allows you to “opt out” of only certain kinds of information sharing with third parties. The firm does not share personal information about you with any third parties that triggers this opt-out right. This means YOU ARE ALREADY OPTED OUT.
How We Protect Privacy Online
Our concern for the privacy of our shareholders also extends to those who use our web site, www.rydex-sgi.com. Our web site uses some of the most secure forms of online communication available, including encryption technology, Secure Socket Layer (SSL) protocol, firewalls and user names and passwords. These technologies provide a high level of security and privacy when you access your account information or initiate online transactions. The Guggenheim Investments web site offers customized features that require our use of “http cookies”—tiny pieces of information that we ask your browser to store. However, we make very limited use of these cookies. We only use cookies for session management and security features on the Guggenheim Investments web site. We do not use them to pull data from your hard drive, to learn your email address, or to view data in cookies created by other web sites. We will not share the information in our cookies or give others access to it. See the legal information area on our web site for more details about web site security and privacy features.
How We Safeguard Your Personal Information
We restrict access to nonpublic personal information about shareholders to our employees and in some cases to third parties (for example, the service providers described above) as permitted by law. We maintain strict physical, electronic and procedural safeguards that comply with federal standards to guard your nonpublic personal information.
We’ll Keep You Informed
As required by federal law, we will notify shareholders of our privacy policy annually. We reserve the right to modify this policy at any time, but rest assured that if we do change it, we will tell you promptly. You will also be able to access our privacy policy from our web site at www.rydex-sgi.com. Should you have any questions regarding our privacy policy, contact us at 800.820.0888 or 301.296.5100.
THE RYDEX FUNDSANNUALREPORT | 273
This page intentionally left blank.
This page intentionally left blank.
This page intentionally left blank.
This page intentionally left blank.

805 King Farm Boulevard, Suite 600
Rockville, MD 20850
www.rydex-sgi.com
800.820.0888
RVABENF-ANN-2-1211x1212
DECEMBER 31, 2011
RYDEX FUNDS
RYDEX VARIABLE TRUST ANNUAL REPORT
SECTOR FUNDS
BANKING FUND
BASIC MATERIALS FUND
BIOTECHNOLOGY FUND
CONSUMER PRODUCTS FUND
ELECTRONICS FUND
ENERGY FUND
ENERGY SERVICES FUND
FINANCIAL SERVICES FUND
HEALTH CARE FUND
INTERNET FUND
LEISURE FUND
PRECIOUS METALS FUND
RETAILING FUND
TECHNOLOGY FUND
TELECOMMUNICATIONS FUND
TRANSPORTATION FUND
UTILITIES FUND
This report and the financial statements contained herein are submitted for the general information of our shareholders. The report is not authorized for distribution to prospective investors unless preceded or accompanied by an effective prospectus.
Distributed by Rydex Distributors, LLC.
| 2 | ||||
| 4 | ||||
| 6 | ||||
| 12 | ||||
| 20 | ||||
| 26 | ||||
| 34 | ||||
| 40 | ||||
| 48 | ||||
| 54 | ||||
| 62 | ||||
| 70 | ||||
| 76 | ||||
| 84 | ||||
| 90 | ||||
| 98 | ||||
| 106 | ||||
| 112 | ||||
| 118 | ||||
| 124 | ||||
| 132 | ||||
| 133 | ||||
| 138 | ||||
| 142 | ||||
| THE RYDEX FUNDSANNUALREPORT | 1 |
To Our Shareholders:
Financial markets endured a lot of turbulence in 2011, due to a variety of events: concerns about debt in the eurozone and in the U.S., which lost its triple-A credit rating, a tsunami-induced Japanese nuclear-plant disaster that disrupted automobile production around the globe, Mideast social unrest that led to a jump in oil prices and weak growth in many of the world’s developed economies. Reflecting the volatility in the stock market was the S&P 500 Index*, which finished the year up about 2%, but only after an 8% rise in the first few months of 2011, then a bearish 19% drop by early October, followed by a 12% fourth-quarter rebound spurred by improved economic data.
The U.S. Federal Reserve was a major factor in the markets for most of 2011, from its winding down of a second asset-purchase program (quantitative easing) in June to August’s “operation twist,” which shifted $400 billion in holdings from short-term to long-term Treasuries. The Fed said it would keep short-term interest rates near zero at least until mid-2013, and late in the year, some analysts were speculating that a third round of quantitative easing might be needed in 2012 to boost subpar growth.
While late-year improvements in economic measures may have dampened concern that the U.S. could slip back into recession, Europe’s recession fears were rising, as high unemployment and austerity measures weighed on weaker members of the euro zone, and threatened the economic engines of Germany and France. The Stoxx Europe 600 Index* was down about 11% for the year, with most individual country indices posting declines in double digits. Many investors continued to brace for a solution to Greece’s debt situation that would prevent financial problems from spreading to other weak countries or to banks, and stabilize the sliding euro, the year’s worst-performing major currency.
Even though they were not at the eye of the sovereign debt storm, many emerging market economies performed poorly in 2011, with those having the strongest links to the eurozone suffering the most. The MSCI Emerging Markets Index* was off by almost 20%, despite pockets of growth. China is facing slowing industrial production, sliding property values and the potential for a hard landing of the economy if housing and banks collapse.
While the market forces play out, many investors have been driven to the sidelines or to safe havens. Gold reached a record high of near $1,900 an ounce in August amid the U.S. debt downgrade, but then lost ground to the rising dollar amid continuing debate over Europe’s debt woes. Still, gold added 10% for the year, while the dollar ended the year within about 3% from where it began against the currencies of most major markets, including the euro, the pound, Canadian dollar and Swiss franc.
Sluggish economic data, concern over European financial weakness and the Fed’s policy efforts also drove investors into U.S. government debt over the course of 2011, despite the country’s lowered credit rating. The 30% total return of the Barclays Capital Long U.S. Treasury Index* made it one of the best-performing of the year, and it gave a lift to indices for corporate bonds, high yield bonds and municipals, which all grew by mid-to-high single digits.
The U.S. economy had momentum heading into 2012, as data showed the world’s largest economy to be maintaining a sustainable, if modest, expansion. Consumer confidence was improving, employment rising and monetary policy remained accommodative. We finished 2011 on a positive note, especially when compared to other countries, and so far continue to be insulated from the worst aspects of the economic troubles in Europe and China.
| 2 | THE RYDEX FUNDSANNUALREPORT |
LETTER TO OUR SHAREHOLDERS (concluded) | ||
We look forward to continuing our service to you. Thank you for investing in our funds.
| Sincerely, |
 |
| Michael Byrum |
| President and Chief Investment Officer |
*Indices are defined as follows:
S&P 500® Index is a capitalization-weighted index covering 500 industrial, utility, transportation and financial companies of the U.S. markets (mostly NYSE Euronext issues).
The STOXX Europe 600 Index is derived from the STOXX Europe Total Market Index (TMI) and is a subset of the STOXX Global 1800 Index. With a fixed number of 600 components, the STOXX Europe 600 Index represents large-, mid- and small-capitalization companies across 18 countries of the European region: Austria, Belgium, Denmark, Finland, France, Germany, Greece, Iceland, Ireland, Italy, Luxembourg, the Netherlands, Norway, Portugal, Spain, Sweden, Switzerland and the United Kingdom.
The Barclays Capital Long U.S. Treasury Index includes publicly issued U.S. Treasury securities that have a remaining maturity of 10 or more years, are rated investment grade, and have $250 million or more of outstanding face value. In addition, the securities must be denominated in U.S. dollars and must be fixed rate and non convertible. Excluded from the Long U.S. Treasury Index are certain special issues, such as flower bonds, TINs, state and local government series bonds, TIPS, and coupon issues that have been stripped from bonds included in the index. The Long U.S. Treasury Index is market capitalization weighted and the securities in the index are updated on the last business day of each month.
MSCI Emerging Markets Index is a free float-adjusted market capitalization index that is designed to measure equity market performance in the global emerging markets.
Performance displayed represents past performance which is no guarantee of future results. Of course, fund performance is subject to daily market volatility and may be better or worse since the end of the last quarter. For up-to-date fund performance, call us at 800.820.0888 or visit www.rydex-sgi.com.
Read each fund’s prospectus and summary prospectus (if available) carefully before investing. It contains the fund’s investment objectives, risks, charges, expenses and other information, which should be considered carefully before investing. Obtain a prospectus and summary prospectus (if available) at www.rydex-sgi.com or call 800.820.0888.
The referenced funds are distributed by Rydex Distributors, LLC (RDL). Guggenheim Investments represents the investment management business of Guggenheim Partners, LLC, which includes Security Investors, LLC (d.b.a., Security Global Investors and Rydex Investments), the investment advisor to the referenced funds. Rydex Distributors, LLC, is affiliated with Guggenheim Partners, LLC and Security Investors, LLC.
| THE RYDEX FUNDSANNUALREPORT | 3 |
ABOUT SHAREHOLDERS’ FUND EXPENSES (Unaudited)
All mutual funds have operating expenses and it is important for our shareholders to understand the impact of costs on their investments. Shareholders of a Fund incur two types of costs: (i) transaction costs, including sales charges (loads) on purchase payments, reinvested dividends, or other distributions; and exchange fees; and (ii) ongoing costs, including management fees, administrative services, and shareholder reports, among others. These ongoing costs, or operating expenses, are deducted from a fund’s gross income and reduce the investment return of the fund.
A fund’s expenses are expressed as a percentage of its average net assets, which is known as the expense ratio. The following examples are intended to help investors understand the ongoing costs (in dollars) of investing in a Fund and to compare these costs with the ongoing costs of investing in other mutual funds.
The examples are based on an investment of $1,000 made at the beginning of the period and held for the entire six-month period beginning June 30, 2011 and ending December 31, 2011.
The following tables illustrate a Fund’s costs in two ways:
Table 1. Based on actual Fund return. This section helps investors estimate the actual expenses paid over the period. The “Ending Account Value” shown is derived from the Fund’s actual return, and the fourth column shows the dollar amount that would have been paid by an investor who started with $1,000 in the Fund. Investors may use the information here, together with the amount invested, to estimate the expenses paid over the period. Simply divide the Fund’s account value by $1,000 (for example, an $8,600 account value divided by $1,000 = 8.6), then multiply the result by the number provided under the heading “Expenses Paid During Period.”
Table 2. Based on hypothetical 5% return. This section is intended to help investors compare a Fund’s cost with those of other mutual funds. The table provides information about hypothetical account values and hypothetical expenses based on the Fund’s actual expense ratio and an assumed rate of return of 5% per year before expenses, which is not the Fund’s actual return. The hypothetical account values and expenses may not be used to estimate the actual ending account balance or expenses paid during the period. The example is useful in making comparisons because the U.S. Securities and Exchange Commission (the “SEC”) requires all mutual funds to calculate expenses based on the 5% return. Investors can assess a Fund’s costs by comparing this hypothetical example with the hypothetical examples that appear in shareholder reports of other funds.
The calculations illustrated above assume no shares were bought or sold during the period. Actual costs may have been higher or lower, depending on the amount of investment and the timing of any purchases or redemptions.
Please note that the expenses shown in the table are meant to highlight your ongoing costs only and do not reflect any transactional costs, such as sales charges (loads) on purchase payments, and contingent deferred sales charges (“CDSC”) on redemptions, if any. Therefore, the second table is useful in comparing ongoing costs only, and will not help you determine the relative total costs of owning different funds. In addition, if these transactional costs were included, your costs would have been higher.
More information about a Fund’s expenses, including annual expense ratios for the past five years, can be found in the Financial Highlights section of this report. For additional information on operating expenses and other shareholder costs, please refer to the appropriate Fund prospectus.
| 4 | THE RYDEX FUNDSANNUALREPORT |
ABOUT SHAREHOLDERS’ FUND EXPENSES (Unaudited) (concluded) | ||
| Expense Ratio1 | Fund Return | Beginning Account Value June 30, 2011 | Ending Account Value December 31, 2011 | Expenses Paid During Period2 | ||||||||||||||||
Table 1. Based on actual Fund return3 |
| |||||||||||||||||||
Banking Fund | 1.66 | % | (17.82 | )% | $ | 1,000.00 | $ | 821.80 | $ | 7.62 | ||||||||||
Basic Materials Fund | 1.66 | % | (15.40 | )% | 1,000.00 | 846.00 | 7.72 | |||||||||||||
Biotechnology Fund | 1.66 | % | (5.36 | )% | 1,000.00 | 946.40 | 8.14 | |||||||||||||
Consumer Products Fund | 1.66 | % | 1.74 | % | 1,000.00 | 1,017.40 | �� | 8.44 | ||||||||||||
Electronics Fund | 1.66 | % | (17.97 | )% | 1,000.00 | 820.30 | 7.62 | |||||||||||||
Energy Fund | 1.66 | % | (12.98 | )% | 1,000.00 | 870.20 | 7.83 | |||||||||||||
Energy Services Fund | 1.66 | % | (18.14 | )% | 1,000.00 | 818.60 | 7.61 | |||||||||||||
Financial Services Fund | 1.66 | % | (15.15 | )% | 1,000.00 | 848.50 | 7.73 | |||||||||||||
Health Care Fund | 1.66 | % | (7.96 | )% | 1,000.00 | 920.40 | 8.04 | |||||||||||||
Internet Fund | 1.66 | % | (13.93 | )% | 1,000.00 | 860.70 | 7.79 | |||||||||||||
Leisure Fund | 1.66 | % | (6.15 | )% | 1,000.00 | 938.50 | 8.11 | |||||||||||||
Precious Metals Fund | 1.56 | % | (13.58 | )% | 1,000.00 | 864.20 | 7.33 | |||||||||||||
Retailing Fund | 1.67 | % | (1.04 | )% | 1,000.00 | 989.60 | 8.37 | |||||||||||||
Technology Fund | 1.66 | % | (10.94 | )% | 1,000.00 | 890.60 | 7.91 | |||||||||||||
Telecommunications Fund | 1.66 | % | (11.68 | )% | 1,000.00 | 883.20 | 7.88 | |||||||||||||
Transportation Fund | 1.66 | % | (14.12 | )% | 1,000.00 | 858.80 | 7.78 | |||||||||||||
Utilities Fund | 1.66 | % | 6.19 | % | 1,000.00 | 1,061.90 | 8.63 | |||||||||||||
| Table 2. Based on hypothetical 5% return (before expenses) | ||||||||||||||||||||
Banking Fund | 1.66 | % | 5.00 | % | $ | 1,000.00 | $ | 1,016.84 | $ | 8.44 | ||||||||||
Basic Materials Fund | 1.66 | % | 5.00 | % | 1,000.00 | 1,016.84 | 8.44 | |||||||||||||
Biotechnology Fund | 1.66 | % | 5.00 | % | 1,000.00 | 1,016.84 | 8.44 | |||||||||||||
Consumer Products Fund | 1.66 | % | 5.00 | % | 1,000.00 | 1,016.84 | 8.44 | |||||||||||||
Electronics Fund | 1.66 | % | 5.00 | % | 1,000.00 | 1,016.84 | 8.44 | |||||||||||||
Energy Fund | 1.66 | % | 5.00 | % | 1,000.00 | 1,016.84 | 8.44 | |||||||||||||
Energy Services Fund | 1.66 | % | 5.00 | % | 1,000.00 | 1,016.84 | 8.44 | |||||||||||||
Financial Services Fund | 1.66 | % | 5.00 | % | 1,000.00 | 1,016.84 | 8.44 | |||||||||||||
Health Care Fund | 1.66 | % | 5.00 | % | 1,000.00 | 1,016.84 | 8.44 | |||||||||||||
Internet Fund | 1.66 | % | 5.00 | % | 1,000.00 | 1,016.84 | 8.44 | |||||||||||||
Leisure Fund | 1.66 | % | 5.00 | % | 1,000.00 | 1,016.84 | 8.44 | |||||||||||||
Precious Metals Fund | 1.56 | % | 5.00 | % | 1,000.00 | 1,017.34 | 7.93 | |||||||||||||
Retailing Fund | 1.67 | % | 5.00 | % | 1,000.00 | 1,016.79 | 8.49 | |||||||||||||
Technology Fund | 1.66 | % | 5.00 | % | 1,000.00 | 1,016.84 | 8.44 | |||||||||||||
Telecommunications Fund | 1.66 | % | 5.00 | % | 1,000.00 | 1,016.84 | 8.44 | |||||||||||||
Transportation Fund | 1.66 | % | 5.00 | % | 1,000.00 | 1,016.84 | 8.44 | |||||||||||||
Utilities Fund | 1.66 | % | 5.00 | % | 1,000.00 | 1,016.84 | 8.44 | |||||||||||||
| 1 | Annualized. |
| 2 | Expenses are equal to the Fund’s annualized expense ratio, net of any applicable fee waivers, multiplied by the average account value over the period, multiplied by 184/365 (to reflect the one-half year period). Expenses shown do not include fees charged by insurance companies. |
| 3 | Actual cumulative return at net asset value for the period June 30, 2011 to December 31, 2011. |
| THE RYDEX FUNDSANNUALREPORT | 5 |
| PERFORMANCE REPORT AND FUND PROFILE (Unaudited) | December 31, 2011 | |||
OBJECTIVE: Seeks to provide capital appreciation by investing in companies that are involved in the banking sector, including commercial banks (and their holding companies) and savings and loan institutions (“Banking Companies”).
The Financials sector, like many others, experienced considerable volatility over 2011, mostly due to fears of contagion related to the troubles of European banks and that region’s sovereign debt crisis. In the U.S., investors in the sector are still cautious about the impact of housing issues, regulations around proprietary trading and limits on credit card fees. Nonetheless, the U.S. economy is displaying resilience in surveys of employment, consumer credit and manufacturing, all of which are supporting growth in loan demand. Capital market activity remains subdued.
For the year ended December 31, 2011, Banking Fund returned -22.23% compared with the S&P 500® Index*, which gained 2.11%.
Within the sector, all industries detracted from return. The largest component of the fund, commercial banks, accounted for most of the negative performance, followed by diversified financial services.
Ocwen Financial Corp., Texas Capital Bancshares, Inc. and Signature Bank were the best-performing stocks in the Fund for the year. The worst-performing holdings for the period were Bank of America Corp., Citigroup, Inc. and Bank of New York Mellon Corp.
| * | Standard & Poor’s 500 Index (S&P 500®) – a capitalization-weighted index covering 500 industrial, utility, transportation and financial companies of the U.S. markets (mostly NYSE Euronext issues). |
Performance displayed represents past performance which is no guarantee of future results.
Industry Diversification (Market Exposure as % of Net Assets)
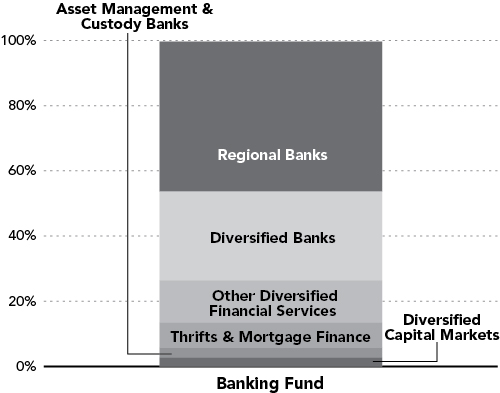
“Industry Diversification (Market Exposure as % of Net Assets)” excludes any temporary cash investments.
Inception Date: May 2, 2001
Ten Largest Holdings (% of Total Net Assets) | ||||
Wells Fargo & Co. | 4.1 | % | ||
U.S. Bancorp | 4.0 | % | ||
JPMorgan Chase & Co. | 4.0 | % | ||
Bank of America Corp. | 4.0 | % | ||
Citigroup, Inc. | 3.8 | % | ||
PNC Financial Services Group, Inc. | 3.5 | % | ||
Bank of New York Mellon Corp. | 3.1 | % | ||
BB&T Corp. | 2.7 | % | ||
Fifth Third Bancorp | 2.2 | % | ||
M&T Bank Corp. | 2.0 | % | ||
|
| |||
Top Ten Total | 33.4 | % | ||
|
| |||
“Ten Largest Holdings” exclude any temporary cash or derivative investments.
| 6 | THE RYDEX FUNDSANNUALREPORT |
| PERFORMANCE REPORT AND FUND PROFILE (Unaudited) (concluded) | ||
Cumulative Fund Performance*
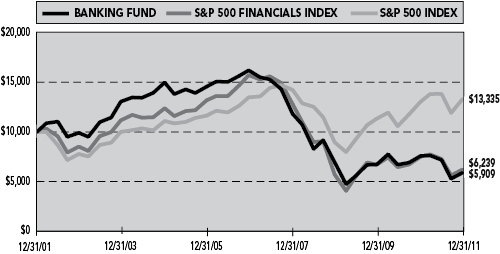
Average Annual Returns*
Periods Ended 12/31/11
| 1 Year | 5 Year | 10 Year | ||||||||||
Banking Fund | -22.23 | % | -18.29 | % | -5.13 | % | ||||||
|
|
|
|
|
| |||||||
S&P 500 Financials Index | -17.06 | % | -16.90 | % | -4.61 | % | ||||||
|
|
|
|
|
| |||||||
S&P 500 Index | 2.11 | % | -0.25 | % | 2.92 | % | ||||||
|
|
|
|
|
| |||||||
| * | The performance data represents past performance that is not predictive of future results. The investment return and principal value of an investment in the Fund will fluctuate so that an investor’s shares, when redeemed, may be worth more or less than their original cost. Returns are historical and include changes in principal and reinvested dividends and capital gains and do not reflect the effect of taxes. The S&P 500 Index and the S&P Financials Index are unmanaged indices and, unlike the Fund, have no management fees or operating expenses to reduce their reported return. Returns do not reflect the impact of any additional fees charged by insurance companies. |
| THE RYDEX FUNDSANNUALREPORT | 7 |
| SCHEDULE OF INVESTMENTS | December 31, 2011 | |
| BANKING FUND | ||
| SHARES | VALUE | |||||||
COMMON STOCKS† - 99.6% |
| |||||||
REGIONAL BANKS - 46.0% |
| |||||||
PNC Financial Services Group, Inc. | 1,582 | $ | 91,234 | |||||
BB&T Corp. | 2,776 | 69,872 | ||||||
Fifth Third Bancorp | 4,410 | 56,095 | ||||||
M&T Bank Corp. | 670 | 51,148 | ||||||
SunTrust Banks, Inc. | 2,871 | 50,817 | ||||||
KeyCorp | 5,844 | 44,940 | ||||||
CIT Group, Inc.* | 1,235 | 43,064 | ||||||
Huntington Bancshares, Inc. | 6,592 | 36,190 | ||||||
Commerce Bancshares, Inc. | 792 | 30,191 | ||||||
Cullen | 552 | 29,206 | ||||||
Zions Bancorporation | 1,764 | 28,718 | ||||||
East West Bancorp, Inc. | 1,438 | 28,401 | ||||||
First Niagara Financial Group, Inc. | 3,212 | 27,720 | ||||||
Signature Bank* | 453 | 27,175 | ||||||
Hancock Holding Co. | 839 | 26,823 | ||||||
City National Corp. | 570 | 25,183 | ||||||
First Republic Bank* | 800 | 24,488 | ||||||
First Horizon National Corp. | 3,006 | 24,048 | ||||||
Valley National Bancorp | 1,912 | 23,651 | ||||||
Bank of Hawaii Corp. | 531 | 23,624 | ||||||
SVB Financial Group* | 490 | 23,368 | ||||||
Associated Banc-Corp. | 2,090 | 23,345 | ||||||
Capital Source, Inc. | 3,445 | 23,082 | ||||||
Fulton Financial Corp. | 2,345 | 23,004 | ||||||
Prosperity Bancshares, Inc. | 560 | 22,596 | ||||||
Webster Financial Corp. | 1,089 | 22,205 | ||||||
FirstMerit Corp. | 1,401 | 21,197 | ||||||
TCF Financial Corp. | 2,014 | 20,784 | ||||||
Trustmark Corp. | 849 | 20,622 | ||||||
Iberiabank Corp. | 395 | 19,474 | ||||||
FNB Corp. | 1,710 | 19,340 | ||||||
Susquehanna Bancshares, Inc. | 2,290 | 19,190 | ||||||
United Bankshares, Inc. | 670 | 18,941 | ||||||
Umpqua Holdings Corp. | 1,522 | 18,858 | ||||||
Cathay General Bancorp | 1,233 | 18,409 | ||||||
National Penn Bancshares, Inc. | 2,160 | 18,230 | ||||||
Westamerica Bancorporation | 411 | 18,043 | ||||||
Texas Capital Bancshares, Inc.* | 580 | 17,754 | ||||||
Old National Bancorp | 1,446 | 16,846 | ||||||
Wintrust Financial Corp. | 579 | 16,241 | ||||||
BancorpSouth, Inc. | 1,439 | 15,858 | ||||||
UMB Financial Corp. | 370 | 13,783 | ||||||
|
| |||||||
Total Regional Banks | 1,193,758 | |||||||
|
| |||||||
DIVERSIFIED BANKS - 27.1% |
| |||||||
Wells Fargo & Co. | 3,824 | 105,389 | ||||||
U.S. Bancorp | 3,863 | 104,494 | ||||||
Itau Unibanco Holding S.A. ADR | 2,323 | 43,115 | ||||||
Banco Bradesco S.A. ADR | 2,302 | 38,397 | ||||||
Comerica, Inc. | 1,414 | 36,481 | ||||||
Royal Bank of Canada | 713 | 36,334 | ||||||
HSBC Holdings plc ADR | 941 | 35,852 | ||||||
ICICI Bank Ltd. ADR | 1,349 | 35,654 | ||||||
Toronto-Dominion Bank | 474 | 35,460 | ||||||
Credicorp Ltd. | 315 | 34,483 | ||||||
Bank of Nova Scotia | 690 | 34,369 | ||||||
Bank of Montreal | 623 | 34,147 | ||||||
Banco Santander Brasil S.A. ADR | 4,090 | 33,293 | ||||||
Banco Santander S.A. ADR | 4,360 | 32,787 | ||||||
HDFC Bank Ltd. ADR | 1,235 | 32,456 | ||||||
Barclays plc ADR | 2,951 | 32,432 | ||||||
|
| |||||||
Total Diversified Banks | 705,143 | |||||||
|
| |||||||
OTHER DIVERSIFIED FINANCIAL SERVICES - 13.1% |
| |||||||
JPMorgan Chase & Co. | 3,137 | 104,305 | ||||||
Bank of America Corp. | 18,454 | 102,604 | ||||||
Citigroup, Inc. | 3,700 | 97,347 | ||||||
ING Groep N.V. ADR* | 4,590 | 32,910 | ||||||
|
| |||||||
Total Other Diversified Financial Services | 337,166 | |||||||
|
| |||||||
THRIFTS & MORTGAGE FINANCE - 7.6% |
| |||||||
New York Community Bancorp, Inc. | 3,038 | 37,580 | ||||||
People’s United Financial, Inc. | 2,680 | 34,438 | ||||||
Hudson City Bancorp, Inc. | 4,829 | 30,181 | ||||||
Ocwen Financial Corp.* | 1,560 | 22,589 | ||||||
Capitol Federal Financial, Inc. | 1,942 | 22,411 | ||||||
Washington Federal, Inc. | 1,432 | 20,034 | ||||||
Northwest Bancshares, Inc. | 1,325 | 16,483 | ||||||
Astoria Financial Corp. | 1,709 | 14,509 | ||||||
|
| |||||||
Total Thrifts & Mortgage Finance | 198,225 | |||||||
|
| |||||||
ASSET MANAGEMENT & CUSTODY BANKS - 3.1% |
| |||||||
Bank of New York Mellon Corp. | 4,077 | 81,173 | ||||||
|
| |||||||
DIVERSIFIED CAPITAL MARKETS – 2.7% |
| |||||||
Deutsche Bank AG | 975 | 36,914 | ||||||
UBS AG* | 2,788 | 32,982 | ||||||
|
| |||||||
Total Diversified Capital Markets | 69,896 | |||||||
|
| |||||||
Total Common Stocks | 2,585,361 | |||||||
|
| |||||||
| FACE AMOUNT | ||||||||
REPURCHASE AGREEMENT††,1 - 0.6% |
| |||||||
Credit Suisse Group issued 12/30/11 at 0.00% due 01/03/12 | $ | 14,922 | 14,922 | |||||
|
| |||||||
Total Repurchase Agreement | 14,922 | |||||||
|
| |||||||
Total Investments – 100.2% | $ | 2,600,283 | ||||||
|
| |||||||
Liabilities & Other Assets - (0.2)% | (5,248 | ) | ||||||
|
| |||||||
Total Net Assets – 100.0% | $ | 2,595,035 | ||||||
| * | Non-income producing security. |
| † | Value determined based on Level 1 inputs — See Note 4. |
| †† | Value determined based on Level 2 inputs — See Note 4. |
| 1 | Repurchase Agreement — See Note 5. |
ADR — American Depositary Receipt
plc — Public Limited Company
| 8 | THE RYDEX FUNDSANNUALREPORT | See Notes to Financial Statements. |
BANKING FUND
STATEMENT OF ASSETS AND LIABILITIES
December 31, 2011
ASSETS: | ||||
Investments, at value | $ | 2,585,361 | ||
Repurchase agreements, at value | 14,922 | |||
|
| |||
Total Investments | 2,600,283 | |||
Receivables: | ||||
Fund shares sold | 491,277 | |||
Dividends | 3,589 | |||
Foreign taxes reclaim | 90 | |||
|
| |||
Total assets | 3,095,239 | |||
|
| |||
LIABILITIES: | ||||
Payable for: | ||||
Securities purchased | 455,281 | |||
Fund shares redeemed | 36,790 | |||
Management fees | 1,497 | |||
Transfer agent and administrative fees | 440 | |||
Investor service fees | 440 | |||
Portfolio accounting fees | 176 | |||
Miscellaneous | 5,580 | |||
|
| |||
Total liabilities | 500,204 | |||
|
| |||
NETASSETS | $ | 2,595,035 | ||
|
| |||
NETASSETSCONSISTOF: | ||||
Paid in capital | $ | 4,185,469 | ||
Undistributed net investment income | 18,626 | |||
Accumulated net realized loss on investments | (2,094,012 | ) | ||
Net unrealized appreciation on investments | 484,952 | |||
|
| |||
Net assets | $ | 2,595,035 | ||
|
| |||
Capital shares outstanding | 239,816 | |||
Net asset value per share | $ | 10.82 | ||
|
| |||
STATEMENT OF OPERATIONS
Year Ended December 31, 2011
INVESTMENT INCOME: | ||||
Dividends | $ | 73,067 | ||
Interest | 10 | |||
|
| |||
Total investment income | 73,077 | |||
|
| |||
EXPENSES: | ||||
Management fees | 27,000 | |||
Transfer agent and administrative fees | 7,941 | |||
Investor service fees | 7,941 | |||
Portfolio accounting fees | 3,176 | |||
Custodian fees | 800 | |||
Trustees’ fees* | 345 | |||
Miscellaneous | 7,248 | |||
|
| |||
Total expenses | 54,451 | |||
|
| |||
Net investment income | 18,626 | |||
|
| |||
NET REALIZEDAND UNREALIZED GAIN (LOSS): |
| |||
Net realized gain (loss) on: | ||||
Investments | 186,223 | |||
|
| |||
Net realized gain | 186,223 | |||
|
| |||
Net change in unrealized appreciation (depreciation) on: | ||||
Investments | (887,862 | ) | ||
|
| |||
Net change in unrealized appreciation (depreciation) | (887,862 | ) | ||
|
| |||
Net realized and unrealized loss | (701,639 | ) | ||
|
| |||
Net decrease in net assets resulting from operations | $ | (683,013 | ) | |
|
| |||
| * | Relates to Trustees not deemed “interested persons” within the meaning of Section 2(a)(19) of the 1940 Act. |
| See Notes to Financial Statements. | THE RYDEX FUNDSANNUALREPORT | 9 |
BANKING FUND
STATEMENTS OF CHANGES IN NET ASSETS
| Year Ended December 31, 2011 | Year Ended December 31, 2010 | |||||||
INCREASE (DECREASE) IN NET ASSETS FROM OPERATIONS: | ||||||||
Net investment income | $ | 18,626 | $ | 8,767 | ||||
Net realized gain on investments | 186,223 | 44,948 | ||||||
Net change in unrealized appreciation (depreciation) on investments | (887,862 | ) | 206,243 | |||||
|
|
|
| |||||
Net increase (decrease) in net assets resulting from operations | (683,013 | ) | 259,958 | |||||
|
|
|
| |||||
DISTRIBUTIONSTOSHAREHOLDERSFROM: | ||||||||
Net investment income | (8,767 | ) | (78,777 | ) | ||||
|
|
|
| |||||
Total distributions to shareholders | (8,767 | ) | (78,777 | ) | ||||
|
|
|
| |||||
CAPITALSHARETRANSACTIONS: | ||||||||
Proceeds from sale of shares | 56,722,061 | 84,205,602 | ||||||
Distributions reinvested | 8,767 | 78,777 | ||||||
Cost of shares redeemed | (58,906,900 | ) | (83,641,681 | ) | ||||
|
|
|
| |||||
Net increase (decrease) from capital share transactions | (2,176,072 | ) | 642,698 | |||||
|
|
|
| |||||
Net increase (decrease) in net assets | (2,867,852 | ) | 823,879 | |||||
NETASSETS: | ||||||||
Beginning of year | 5,462,887 | 4,639,008 | ||||||
|
|
|
| |||||
End of year | $ | 2,595,035 | $ | 5,462,887 | ||||
|
|
|
| |||||
Undistributed net investment income at end of year | $ | 18,626 | $ | 8,767 | ||||
|
|
|
| |||||
CAPITALSHAREACTIVITY: | ||||||||
Shares sold | 4,508,490 | 6,248,914 | ||||||
Shares issued from reinvestment of distributions | 829 | 6,093 | ||||||
Shares redeemed | (4,660,345 | ) | (6,234,738 | ) | ||||
|
|
|
| |||||
Net increase (decrease) in shares | (151,026 | ) | 20,269 | |||||
|
|
|
| |||||
| 10 | THE RYDEX FUNDSANNUALREPORT | See Notes to Financial Statements. |
BANKING FUND
FINANCIAL HIGHLIGHTS
This table is presented to show selected data for a share outstanding throughout each period and to assist shareholders in evaluating a Fund’s performance for the periods presented.
| Year Ended | Year Ended | Year Ended | Year Ended | Year Ended | ||||||||||||||||
| December 31, | December 31, | December 31, | December 31, | December 31, | ||||||||||||||||
| 2011 | 2010 | 2009 | 2008 | 2007 | ||||||||||||||||
Per Share Data | ||||||||||||||||||||
Net asset value, beginning of period | $ | 13.98 | $ | 12.52 | $ | 13.40 | $ | 22.80 | $ | 32.44 | ||||||||||
|
|
|
|
|
|
|
|
|
| |||||||||||
Income (loss) from investment operations: | ||||||||||||||||||||
Net investment incomea | .07 | .02 | .08 | .48 | .56 | |||||||||||||||
Net gain (loss) on investments (realized and unrealized) | (3.18 | ) | 1.60 | (.54 | ) | (9.86 | ) | (9.32 | ) | |||||||||||
|
|
|
|
|
|
|
|
|
| |||||||||||
Total from investment operations | (3.11 | ) | 1.62 | (.46 | ) | (9.38 | ) | (8.76 | ) | |||||||||||
|
|
|
|
|
|
|
|
|
| |||||||||||
Less distributions from: | ||||||||||||||||||||
Net investment income | (.05 | ) | (.16 | ) | (.42 | ) | (.02 | ) | (.88 | ) | ||||||||||
|
|
|
|
|
|
|
|
|
| |||||||||||
Total distributions | (.05 | ) | (.16 | ) | (.42 | ) | (.02 | ) | (.88 | ) | ||||||||||
|
|
|
|
|
|
|
|
|
| |||||||||||
Net asset value, end of period | $ | 10.82 | $ | 13.98 | $ | 12.52 | $ | 13.40 | $ | 22.80 | ||||||||||
|
|
|
|
|
|
|
|
|
| |||||||||||
Total Returnb | (22.23 | %) | 13.04 | % | (3.43 | %) | (41.16 | %) | (27.08 | %) | ||||||||||
|
|
|
|
|
|
|
|
|
| |||||||||||
Ratios/Supplemental Data | ||||||||||||||||||||
Net assets, end of period (in thousands) | $ | 2,595 | $ | 5,463 | $ | 4,639 | $ | 22,968 | $ | 9,186 | ||||||||||
|
|
|
|
|
|
|
|
|
| |||||||||||
Ratios to average net assets: | ||||||||||||||||||||
Net investment income | 0.59 | % | 0.12 | % | 0.70 | % | 2.87 | % | 1.85 | % | ||||||||||
Total expenses | 1.71 | % | 1.64 | % | 1.66 | % | 1.63 | % | 1.59 | % | ||||||||||
|
|
|
|
|
|
|
|
|
| |||||||||||
Portfolio turnover rate | 1,518 | % | 1,119 | % | 731 | % | 521 | % | 405 | % | ||||||||||
| a | Net investment income per share was computed using average shares outstanding throughout the period. |
| b | Total return does not reflect the impact of any additional fees charged by insurance companies and has not been annualized. |
| See Notes to Financial Statements. | THE RYDEX FUNDSANNUALREPORT | 11 |
| PERFORMANCE REPORT AND FUND PROFILE (Unaudited) | December 31, 2011 |
OBJECTIVE: Seeks to provide capital appreciation by investing in companies engaged in the mining, manufacture, or sale of basic materials, such as lumber, steel, iron, aluminum, concrete, chemicals and other basic building and manufacturing materials (“Basic Materials Companies”).
For the year ended December 31, 2011, Basic Materials Fund returned -16.46% compared with a gain of 2.11% for the S&P 500® Index*.
Materials sector performance shadowed sentiment about the economy over the course of 2011, and lately has been affected by expectations of slowing global growth. The sector has benefited from loose monetary policy, especially in the U.S. and more recently in China, the world’s two largest economies. Developing countries continue to be a strong source of demand.
Within the sector, the lightly weighted paper and forest products industry was the main contributor to performance. The two largest industries, metals and mining, and chemicals, both detracted from Fund return.
The top-performing holdings were Praxair, Inc., Ecolab Inc. and Temple-Inland, Inc. The worst-performing holdings included Freeport-McMoRan Copper & Gold, Inc., Vale S.A. ADR and Agnico-Eagle Mines Ltd.
| * | Standard & Poor’s 500 Index (S&P 500®) – a capitalization-weighted index covering 500 industrial, utility, transportation and financial companies of the U.S. markets (mostly NYSE Euronext issues). |
Performance displayed represents past performance which is no guarantee of future results.
Industry Diversification (Market Exposure as % of Net Assets)
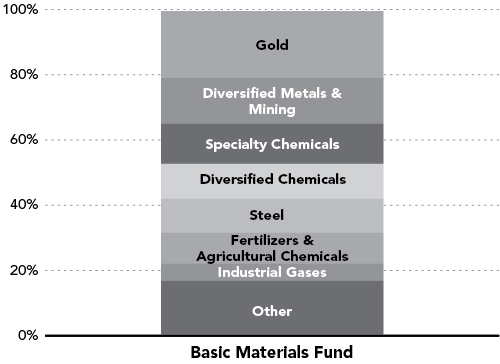
“Industry Diversification (Market Exposure as % of Net Assets)” excludes any temporary cash investments.
Inception Date: May 2, 2001
Ten Largest Holdings | ||||
(% of Total Net Assets) | ||||
EI du Pont de Nemours & Co. | 2.7 | % | ||
Barrick Gold Corp. | 2.7 | % | ||
Monsanto Co. | 2.5 | % | ||
Dow Chemical Co. | 2.5 | % | ||
Goldcorp, Inc. | 2.4 | % | ||
Freeport-McMoRan Copper & Gold, Inc. | 2.4 | % | ||
Praxair, Inc. | 2.3 | % | ||
Vale S.A. — ADR | 2.3 | % | ||
Newmont Mining Corp. | 2.1 | % | ||
Southern Copper Corp. | 2.0 | % | ||
|
| |||
| Top Ten Total | 23.9 | % | ||
|
| |||
“Ten Largest Holdings” exclude any temporary cash or derivative investments.
| 12 | THE RYDEX FUNDSANNUALREPORT |
| PERFORMANCE REPORT AND FUND PROFILE (Unaudited) (concluded) |
Cumulative Fund Performance*
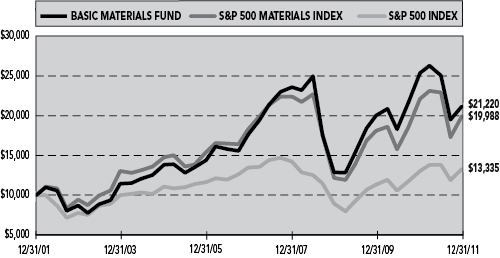
Average Annual Returns*
Periods Ended 12/31/11
| 1 Year | 5 Year | 10 Year | ||||||||||
Basic Materials Fund | -16.46 | % | 3.77 | % | 7.81 | % | ||||||
|
|
|
|
|
| |||||||
S&P 500 Materials Index | -9.75 | % | 1.76 | % | 7.17 | % | ||||||
|
|
|
|
|
| |||||||
S&P 500 Index | 2.11 | % | -0.25 | % | 2.92 | % | ||||||
|
|
|
|
|
| |||||||
| * | The performance data represents past performance that is not predictive of future results. The investment return and principal value of an investment in the Fund will fluctuate so that an investor’s shares, when redeemed, may be worth more or less than their original cost. Returns are historical and include changes in principal and reinvested dividends and capital gains and do not reflect the effect of taxes. The S&P 500 Index and the S&P 500 Materials Index are unmanaged indices and, unlike the Fund, have no management fees or operating expenses to reduce their reported returns. Returns do not reflect the impact of any additional fees charged by insurance companies. |
| THE RYDEX FUNDSANNUALREPORT | 13 |
SCHEDULE OF INVESTMENTS | December 31, 2011 | |||
BASIC MATERIALS FUND |
| SHARES | VALUE | |||||||
COMMON STOCKS† - 99.5% |
| |||||||
GOLD - 20.3% |
| |||||||
Barrick Gold Corp. | 9,440 | $ | 427,160 | |||||
Goldcorp, Inc. | 8,475 | 375,019 | ||||||
Newmont Mining Corp. | 5,649 | 338,997 | ||||||
AngloGold Ashanti Ltd. ADR | 6,039 | 256,356 | ||||||
Kinross Gold Corp. | 19,624 | 223,714 | ||||||
Gold Fields Ltd. ADR | 13,945 | 212,661 | ||||||
Yamana Gold, Inc. | 14,312 | 210,243 | ||||||
Cia de Minas Buenaventura S.A. ADR | 5,479 | 210,065 | ||||||
Randgold Resources Ltd. ADR | 1,913 | 195,317 | ||||||
Eldorado Gold Corp. | 12,178 | 166,960 | ||||||
Agnico-Eagle Mines Ltd. | 4,147 | 150,619 | ||||||
IAMGOLD Corp. | 9,322 | 147,754 | ||||||
Harmony Gold Mining Company Ltd. ADR | 11,947 | 139,063 | ||||||
Royal Gold, Inc. | 1,743 | 117,530 | ||||||
New Gold, Inc.* | 6,750 | 68,040 | ||||||
|
| |||||||
Total Gold | 3,239,498 | |||||||
|
| |||||||
DIVERSIFIED METALS & MINING - 14.3% |
| |||||||
Freeport-McMoRan Copper & Gold, Inc. | 10,192 | 374,964 | ||||||
Vale S.A.ADR | 16,784 | 360,017 | ||||||
Southern Copper Corp. | 10,486 | 316,467 | ||||||
BHP Billiton Ltd. ADR | 3,594 | 253,844 | ||||||
Ivanhoe Mines Ltd.* | 12,400 | 219,728 | ||||||
Rio Tinto plc ADR | 4,440 | 217,205 | ||||||
Teck Resources Ltd. — Class B | 5,551 | 195,340 | ||||||
Walter Energy, Inc. | 2,032 | 123,058 | ||||||
Titanium Metals Corp. | 6,934 | 103,871 | ||||||
Molycorp, Inc.* | 3,340 | 80,093 | ||||||
|
| |||||||
Total Diversified Metals & Mining | 2,244,587 | |||||||
|
| |||||||
SPECIALTY CHEMICALS - 12.3% |
| |||||||
LyondellBasell Industries N.V. — Class A | 8,640 | 280,714 | ||||||
Ecolab, Inc. | 4,748 | 274,482 | ||||||
Sherwin-Williams Co. | 2,260 | 201,750 | ||||||
Sigma-Aldrich Corp. | 2,823 | 176,325 | ||||||
Celanese Corp. — Class A | 3,941 | 174,468 | ||||||
Albemarle Corp. | 2,725 | 140,365 | ||||||
International Flavors & Fragrances, Inc. | 2,539 | 133,094 | ||||||
Valspar Corp. | 3,281 | 127,861 | ||||||
WR Grace & Co.* | 2,682 | 123,157 | ||||||
RPM International, Inc. | 4,840 | 118,822 | ||||||
Rockwood Holdings, Inc.* | 2,874 | 113,149 | ||||||
Cytec Industries, Inc. | 2,135 | 95,328 | ||||||
|
| |||||||
Total Specialty Chemicals | 1,959,515 | |||||||
|
| |||||||
DIVERSIFIED CHEMICALS - 10.7% |
| |||||||
EI du Pont de Nemours & Co. | 9,405 | 430,561 | ||||||
Dow Chemical Co. | 13,753 | 395,536 | ||||||
PPG Industries, Inc. | 2,790 | 232,937 | ||||||
FMC Corp. | 1,880 | 161,755 | ||||||
Eastman Chemical Co. | 3,976 | 155,303 | ||||||
Ashland, Inc. | 2,470 | 141,185 | ||||||
Huntsman Corp. | 10,064 | 100,640 | ||||||
Olin Corp. | 4,090 | 80,369 | ||||||
|
| |||||||
Total Diversified Chemicals | 1,698,286 | |||||||
|
| |||||||
STEEL - 10.4% |
| |||||||
Nucor Corp. | 5,760 | 227,923 | ||||||
ArcelorMittal | 11,044 | 200,890 | ||||||
Gerdau S.A. ADR | 25,240 | 197,124 | ||||||
Cliffs Natural Resources, Inc. | 3,002 | 187,175 | ||||||
Cia Siderurgica Nacional S.A. ADR | 21,007 | 171,837 | ||||||
Allegheny Technologies, Inc. | 3,146 | 150,379 | ||||||
United States Steel Corp. | 4,879 | 129,098 | ||||||
Reliance Steel & Aluminum Co. | 2,594 | 126,302 | ||||||
Steel Dynamics, Inc. | 8,535 | 112,235 | ||||||
Carpenter Technology Corp. | 1,920 | 98,842 | ||||||
AK Steel Holding Corp. | 7,650 | 63,189 | ||||||
|
| |||||||
Total Steel | 1,664,994 | |||||||
|
| |||||||
FERTILIZERS & AGRICULTURAL CHEMICALS - 9.5% |
| |||||||
Monsanto Co. | 5,729 | 401,431 | ||||||
Mosaic Co. | 6,164 | 310,851 | ||||||
Potash Corporation of Saskatchewan, Inc. | 7,077 | 292,139 | ||||||
CF Industries Holdings, Inc. | 1,401 | 203,117 | ||||||
Agrium, Inc. | 2,861 | 192,002 | ||||||
Scotts Miracle-Gro Co. — Class A | 2,395 | 111,823 | ||||||
|
| |||||||
Total Fertilizers & Agricultural Chemicals |
| 1,511,363 | ||||||
|
| |||||||
INDUSTRIAL GASES - 5.1% |
| |||||||
Praxair, Inc. | 3,482 | 372,226 | ||||||
Air Products & Chemicals, Inc. | 3,303 | 281,383 | ||||||
Airgas, Inc. | 2,031 | 158,580 | ||||||
|
| |||||||
Total Industrial Gases | 812,189 | |||||||
|
| |||||||
PAPER PRODUCTS - 3.1% |
| |||||||
International Paper Co. | 8,099 | 239,730 | ||||||
MeadWestvaco Corp. | 4,995 | 149,600 | ||||||
Domtar Corp. | 1,385 | 110,745 | ||||||
|
| |||||||
Total Paper Products | 500,075 | |||||||
|
| |||||||
PAPER PACKAGING - 3.0% |
| |||||||
Rock-Tenn Co. — Class A | 2,300 | 132,710 | ||||||
Temple-Inland, Inc. | 3,764 | 119,356 | ||||||
Sealed Air Corp. | 6,773 | 116,563 | ||||||
Bemis Company, Inc. | 3,840 | 115,507 | ||||||
|
| |||||||
Total Paper Packaging | 484,136 | |||||||
|
| |||||||
| 14 | THE RYDEX FUNDSANNUALREPORT | See Notes to Financial Statements. |
| SCHEDULE OF INVESTMENTS (concluded) | December 31, 2011 | |
| BASIC MATERIALS FUND |
| SHARES | VALUE | |||||||
CONSTRUCTION MATERIALS - 2.8% |
| |||||||
Cemex SAB de CV ADR* | 34,670 | $ | 186,871 | |||||
Vulcan Materials Co. | 3,446 | 135,600 | ||||||
Martin Marietta Materials, Inc. | 1,570 | 118,394 | ||||||
|
| |||||||
Total Construction Materials | 440,865 | |||||||
|
| |||||||
PRECIOUS METALS & MINERALS - 2.8% |
| |||||||
Silver Wheaton Corp. | 6,851 | 198,405 | ||||||
Coeur d’Alene Mines Corp.* | 3,744 | 90,380 | ||||||
Hecla Mining Co. | 13,712 | 71,714 | ||||||
Stillwater Mining Co.* | 6,540 | 68,408 | ||||||
|
| |||||||
Total Precious Metals & Minerals | 428,907 | |||||||
|
| |||||||
METAL & GLASS CONTAINERS - 2.6% |
| |||||||
Ball Corp. | 4,446 | 158,767 | ||||||
Crown Holdings, Inc.* | 4,405 | 147,920 | ||||||
Owens-Illinois, Inc.* | 6,064 | 117,520 | ||||||
|
| |||||||
Total Metal & Glass Containers | 424,207 | |||||||
|
| |||||||
FOREST PRODUCTS - 1.4% |
| |||||||
Weyerhaeuser Co. | 11,638 | 217,281 | ||||||
|
| |||||||
ALUMINUM - 1.2% |
| |||||||
Alcoa, Inc. | 21,935 | 189,738 | ||||||
|
| |||||||
Total Common Stocks | 15,815,641 | |||||||
|
| |||||||
| FACE AMOUNT | ||||||||
REPURCHASE AGREEMENT††,1 - 0.7% |
| |||||||
Credit Suisse Group issued 12/30/11 at 0.00% due 01/03/12 | $ | 117,139 | 117,139 | |||||
|
| |||||||
Total Repurchase Agreement | 117,139 | |||||||
|
| |||||||
Total Investments – 100.2% | $ | 15,932,780 | ||||||
|
| |||||||
Liabilities & Other Assets – (0.2)% | (39,254 | ) | ||||||
|
| |||||||
Total Net Assets – 100.0% | $ | 15,893,526 | ||||||
| * | Non-income producing security. |
| † | Value determined based on Level 1 inputs — See Note 4. |
| †† | Value determined based on Level 2 inputs — See Note 4. |
| 1 | Repurchase Agreement — See Note 5. |
ADR — American Depositary Receipt
plc — Public Limited Company
| See Notes to Financial Statements. | THE RYDEX FUNDSANNUALREPORT | 15 |
BASIC MATERIALS FUND
STATEMENT OF ASSETS AND LIABILITIES
December 31, 2011
ASSETS: | ||||
Investments, at value | $ | 15,815,641 | ||
Repurchase agreements, at value | 117,139 | |||
|
| |||
Total Investments | 15,932,780 | |||
Receivables: | ||||
Fund shares sold | 869,661 | |||
Dividends | 17,110 | |||
|
| |||
Total assets | 16,819,551 | |||
|
| |||
LIABILITIES: | ||||
Payable for: | ||||
Securities purchased | 854,998 | |||
Management fees | 11,334 | |||
Transfer agent and administrative fees | 3,333 | |||
Investor service fees | 3,333 | |||
Portfolio accounting fees | 1,334 | |||
Fund shares redeemed | 463 | |||
Miscellaneous | 51,230 | |||
|
| |||
Total liabilities | 926,025 | |||
|
| |||
NETASSETS | $ | 15,893,526 | ||
|
| |||
NETASSETSCONSISTOF: | ||||
Paid in capital | $ | 11,362,032 | ||
Undistributed net investment income | — | |||
Accumulated net realized loss on investments | (2,398,006 | ) | ||
Net unrealized appreciation on investments | 6,929,500 | |||
|
| |||
Net assets | $ | 15,893,526 | ||
|
| |||
Capital shares outstanding | 612,576 | |||
Net asset value per share | $ | 25.95 | ||
|
| |||
STATEMENT OF OPERATIONS
Year Ended December 31, 2011
INVESTMENTINCOME: | ||||
Dividends (net of foreign withholding tax of $17,764) | $ | 501,774 | ||
Interest | 65 | |||
|
| |||
Total investment income | 501,839 | |||
|
| |||
EXPENSES: | ||||
Management fees | 258,710 | |||
Transfer agent and administrative fees | 76,091 | |||
Investor service fees | 76,091 | |||
Portfolio accounting fees | 30,436 | |||
Custodian fees | 7,371 | |||
Trustees’ fees* | 3,292 | |||
Miscellaneous | 68,851 | |||
|
| |||
Total expenses | 520,842 | |||
|
| |||
Net investment loss | (19,003 | ) | ||
|
| |||
NET REALIZEDAND UNREALIZED GAIN (LOSS): | ||||
Net realized gain (loss) on: | ||||
Investments | 4,053,105 | |||
Foreign currency | 364 | |||
|
| |||
Net realized gain | 4,053,469 | |||
|
| |||
Net change in unrealized appreciation | ||||
Investments | (9,549,818 | ) | ||
|
| |||
Net change in unrealized appreciation | (9,549,818 | ) | ||
|
| |||
Net realized and unrealized loss | (5,496,349 | ) | ||
|
| |||
Net decrease in net assets resulting from operations | $ | (5,515,352 | ) | |
|
| |||
| * | Relates to Trustees not deemed “interested persons” within the meaning of Section 2(a)(19) of the 1940 Act. |
| 16 | THE RYDEX FUNDSANNUALREPORT | See Notes to Financial Statements. |
BASIC MATERIALS FUND
STATEMENTS OF CHANGES IN NET ASSETS
| Year Ended December 31, 2011 | Year Ended December 31, 2010 | |||||||
INCREASE (DECREASE) IN NET ASSETS FROM OPERATIONS: | ||||||||
Net investment loss | $ | (19,003 | ) | $ | (75,796 | ) | ||
Net realized gain on investments and foreign currency | 4,053,469 | 5,083,403 | ||||||
Net change in unrealized appreciation (depreciation) on investments and foreign currency | (9,549,818 | ) | 763,261 | |||||
|
|
|
| |||||
Net increase (decrease) in net assets resulting from operations | (5,515,352 | ) | 5,770,868 | |||||
|
|
|
| |||||
DISTRIBUTIONSTOSHAREHOLDERSFROM: | ||||||||
Net investment income | — | (231,949 | ) | |||||
Net realized gains | (2,783,814 | ) | — | |||||
|
|
|
| |||||
Total distributions to shareholders | (2,783,814 | ) | (231,949 | ) | ||||
|
|
|
| |||||
CAPITALSHARETRANSACTIONS: | ||||||||
Proceeds from sale of shares | 80,491,877 | 178,635,157 | ||||||
Distributions reinvested | 2,783,814 | 231,949 | ||||||
Cost of shares redeemed | (108,214,179 | ) | (181,796,720 | ) | ||||
|
|
|
| |||||
Net decrease from capital share transactions | (24,938,488 | ) | (2,929,614 | ) | ||||
|
|
|
| |||||
Net increase (decrease) in net assets | (33,237,654 | ) | 2,609,305 | |||||
NETASSETS: | ||||||||
Beginning of year | 49,131,180 | 46,521,875 | ||||||
|
|
|
| |||||
End of year | $ | 15,893,526 | $ | 49,131,180 | ||||
|
|
|
| |||||
Undistributed net investment income at end of year | $ | — | $ | — | ||||
|
|
|
| |||||
CAPITALSHAREACTIVITY: | ||||||||
Shares sold | 2,286,655 | 5,804,562 | ||||||
Shares issued from reinvestment of distributions | 100,101 | 6,879 | ||||||
Shares redeemed | (3,108,300 | ) | (6,069,612 | ) | ||||
|
|
|
| |||||
Net decrease in shares | (721,544 | ) | (258,171 | ) | ||||
|
|
|
| |||||
| See Notes to Financial Statements. | THE RYDEX FUNDSANNUALREPORT | 17 |
BASIC MATERIALS FUND
FINANCIAL HIGHLIGHTS
This table is presented to show selected data for a share outstanding throughout each period and to assist shareholders in evaluating a Fund’s performance for the periods presented.
| Year Ended December 31, 2011 | Year Ended December 31, 2010 | Year Ended December 31, 2009 | Year Ended December 31, 2008 | Year Ended December 31, 2007 | ||||||||||||||||
Per Share Data | ||||||||||||||||||||
Net asset value, beginning of period | $ | 36.83 | $ | 29.22 | $ | 19.38 | $ | 41.66 | $ | 33.33 | ||||||||||
|
|
|
|
|
|
|
|
|
| |||||||||||
Income (loss) from investment operations: | ||||||||||||||||||||
Net investment income (loss)a | (.02 | ) | (.07 | ) | .17 | .06 | .11 | |||||||||||||
Net gain (loss) on investments (realized and unrealized) | (5.69 | ) | 7.86 | 10.58 | (19.38 | ) | 11.21 | |||||||||||||
|
|
|
|
|
|
|
|
|
| |||||||||||
Total from investment operations | (5.71 | ) | 7.79 | 10.75 | (19.32 | ) | 11.32 | |||||||||||||
|
|
|
|
|
|
|
|
|
| |||||||||||
Less distributions from: | ||||||||||||||||||||
Net investment income | — | (.18 | ) | (.06 | ) | (.27 | ) | (.05 | ) | |||||||||||
Net realized gains | (5.17 | ) | — | (.85 | ) | (2.69 | ) | (2.94 | ) | |||||||||||
|
|
|
|
|
|
|
|
|
| |||||||||||
Total distributions | (5.17 | ) | (.18 | ) | (.91 | ) | (2.96 | ) | (2.99 | ) | ||||||||||
|
|
|
|
|
|
|
|
|
| |||||||||||
Net asset value, end of period | $ | 25.95 | $ | 36.83 | $ | 29.22 | $ | 19.38 | $ | 41.66 | ||||||||||
|
|
|
|
|
|
|
|
|
| |||||||||||
Total Returnb | (16.46 | %) | 26.67 | % | 55.46 | % | (45.40 | %) | 33.97 | % | ||||||||||
|
|
|
|
|
|
|
|
|
| |||||||||||
Ratios/Supplemental Data | ||||||||||||||||||||
Net assets, end of period (in thousands) | $ | 15,894 | $ | 49,131 | $ | 46,522 | $ | 23,788 | $ | 95,591 | ||||||||||
|
|
|
|
|
|
|
|
|
| |||||||||||
Ratios to average net assets: | ||||||||||||||||||||
Net investment income (loss) | (0.06 | %) | (0.22 | %) | 0.69 | % | 0.15 | % | 0.28 | % | ||||||||||
Total expenses | 1.71 | % | 1.66 | % | 1.65 | % | 1.60 | % | 1.58 | % | ||||||||||
|
|
|
|
|
|
|
|
|
| |||||||||||
Portfolio turnover rate | 193 | % | 418 | % | 377 | % | 191 | % | 244 | % | ||||||||||
| a | Net investment income (loss) per share was computed using average shares outstanding throughout the period. |
| b | Total return does not reflect the impact of any additional fees charged by insurance companies and has not been annualized. |
| 18 | THE RYDEX FUNDSANNUALREPORT | See Notes to Financial Statements. |
This page intentionally left blank.
| THE RYDEX FUNDSANNUALREPORT | 19 |
| PERFORMANCE REPORT AND FUND PROFILE (Unaudited) | December 31, 2011 |
OBJECTIVE: Seeks to provide capital appreciation by investing in companies that are involved in the biotechnology industry, including companies involved in research and development, genetic or other biological engineering, and in the design, manufacture, or sale of related biotechnology products or services (“Biotechnology Companies”).
The Biotechnology industry had good performance in 2011, as the U.S. Food and Drug Administration approved new drugs at the highest level in seven years. Analysts said better safety data from pharmaceutical companies may have contributed to the pickup in the pace of approvals, which jumped to 30 from 21 in 2010. The approvals help companies replace products whose patents are expiring in the coming months. The leading acquisition for the year was Gilead’s purchase of Pharmasset for almost $11 billion.
For the year ended December 31, 2011, Biotechnology Fund gained 10.59% compared with the S&P 500® Index*, which rose 2.11%.
The best-performing stocks in the Fund were Pharmasset, Inc., Biogen Idec, Inc. and Alexion Pharmaceuticals, Inc. The worst-performing stocks in the Fund included Dendreon Corp., Human Genome Sciences, Inc. and InterMune Inc.
| * | Standard & Poor’s 500 Index (S&P 500®) – a capitalization-weighted index covering 500 industrial, utility, transportation and financial companies of the U.S. markets (mostly NYSE Euronext issues). |
Performance displayed represents past performance which is no guarantee of future results.
Industry Diversification (Market Exposure as % of Net Assets)
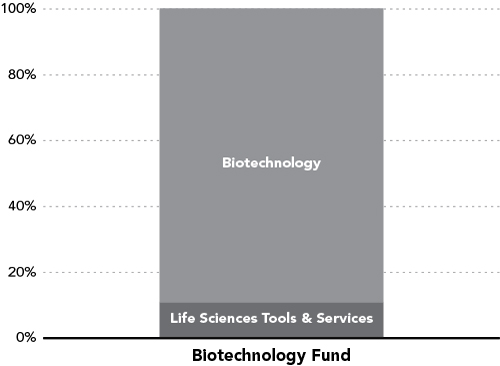
“Industry Diversification (Market Exposure as % of Net Assets)” excludes any temporary cash investments.
Inception Date: May 2, 2001
Ten Largest Holdings (% of Total Net Assets) | ||||
Amgen, Inc. | 10.7 | % | ||
Gilead Sciences, Inc. | 7.6 | % | ||
Celgene Corp. | 7.5 | % | ||
Biogen Idec, Inc. | 6.9 | % | ||
Alexion Pharmaceuticals, Inc. | 5.1 | % | ||
Pharmasset, Inc. | 4.2 | % | ||
Vertex Pharmaceuticals, Inc. | 3.7 | % | ||
Life Technologies Corp. | 3.6 | % | ||
Regeneron Pharmaceuticals, Inc. | 3.1 | % | ||
Illumina, Inc. | 2.8 | % | ||
|
| |||
Top Ten Total | 55.2 | % | ||
|
| |||
“Ten Largest Holdings” exclude any temporary cash or derivative investments.
| 20 | THE RYDEX FUNDSANNUALREPORT |
| PERFORMANCE REPORT AND FUND PROFILE (Unaudited) (concluded) | ||
Cumulative Fund Performance*
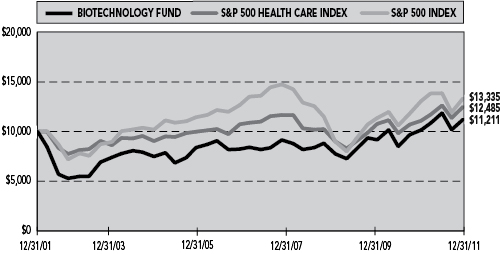
Average Annual Returns* | ||||||
| Periods Ended 12/31/11 | ||||||
| 1 Year | 5 Year | 10 Year | ||||
| Biotechnology Fund | 10.59% | 5.94% | 1.15% | |||
|
|
| ||||
| S&P 500 Health Care Index | 12.73% | 2.81% | 2.24% | |||
|
|
| ||||
| S&P 500 Index | 2.11% | -0.25% | 2.92% | |||
|
|
| ||||
| * | The performance data represents past performance that is not predictive of future results. The investment return and principal value of an investment in the Fund will fluctuate so that an investor’s shares, when redeemed, may be worth more or less than their original cost. Returns are historical and include changes in principal and reinvested dividends and capital gains and do not reflect the effect of taxes. The S&P 500 Index and the S&P 500 Health Care Index are unmanaged indices and, unlike the Fund, have no management fees or operating expenses to reduce their reported returns. Returns do not reflect the impact of any additional fees charged by insurance companies. |
| THE RYDEX FUNDSANNUALREPORT | | 21 | |
| SCHEDULE OF INVESTMENTS | December 31, 2011 | |
| BIOTECHNOLOGY FUND |
| SHARES | VALUE | |||||||
COMMON STOCKS† - 99.9% |
| |||||||
BIOTECHNOLOGY - 89.3% |
| |||||||
Amgen, Inc. | 19,759 | $ | 1,268,725 | |||||
Gilead Sciences, Inc.* | 21,868 | 895,057 | ||||||
Celgene Corp.* | 13,146 | 888,670 | ||||||
Biogen Idec, Inc.* | 7,474 | 822,514 | ||||||
Alexion Pharmaceuticals, Inc.* | 8,403 | 600,815 | ||||||
Pharmasset, Inc.* | 3,842 | 492,544 | ||||||
Vertex Pharmaceuticals, Inc.* | 13,285 | 441,195 | ||||||
Regeneron Pharmaceuticals, Inc.* | 6,604 | 366,060 | ||||||
BioMarin Pharmaceutical, Inc.* | 9,330 | 320,765 | ||||||
Onyx Pharmaceuticals, Inc.* | 6,493 | 285,367 | ||||||
United Therapeutics Corp.* | 5,912 | 279,342 | ||||||
Cubist Pharmaceuticals, Inc.* | 6,474 | 256,500 | ||||||
Alkermes plc* | 14,501 | 251,737 | ||||||
Cepheid, Inc.* | 7,043 | 242,350 | ||||||
Seattle Genetics, Inc.* | 13,242 | 221,340 | ||||||
Incyte Corporation Ltd.* | 14,445 | 216,819 | ||||||
Myriad Genetics, Inc.* | 10,350 | 216,729 | ||||||
Ariad Pharmaceuticals, Inc.* | 17,320 | 212,170 | ||||||
Amylin Pharmaceuticals, Inc.* | 18,507 | 210,610 | ||||||
Medivation, Inc.* | 4,313 | 198,872 | ||||||
Human Genome Sciences, Inc.* | 26,347 | 194,704 | ||||||
Theravance, Inc.* | 8,800 | 194,480 | ||||||
Dendreon Corp.* | 22,758 | 172,961 | ||||||
Pharmacyclics, Inc.* | 11,490 | 170,282 | ||||||
Amarin Corporation plc ADR* | 21,950 | 164,406 | ||||||
Acorda Therapeutics, Inc.* | 6,717 | 160,133 | ||||||
Momenta Pharmaceuticals, Inc.* | 9,000 | 156,510 | ||||||
PDL BioPharma, Inc. | 24,037 | 149,029 | ||||||
Spectrum Pharmaceuticals, Inc.* | 10,040 | 146,885 | ||||||
Immunogen, Inc.* | 12,670 | 146,719 | ||||||
NPS Pharmaceuticals, Inc.* | 18,790 | 123,826 | ||||||
InterMune, Inc.* | 9,276 | 116,878 | ||||||
|
| |||||||
Total Biotechnology | 10,584,994 | |||||||
|
| |||||||
LIFE SCIENCES TOOLS & SERVICES - 10.6% |
| |||||||
Life Technologies Corp.* | 10,880 | 423,341 | ||||||
Illumina, Inc.* | 11,000 | 335,280 | ||||||
Charles River Laboratories International, Inc.* | 6,780 | 185,297 | ||||||
Bio-Rad Laboratories, Inc. — Class A* | 1,920 | 184,397 | ||||||
Techne Corp. | 1,746 | 119,182 | ||||||
|
| |||||||
Total Life Sciences Tools & Services | 1,247,497 | |||||||
|
| |||||||
Total Common Stocks | 11,832,491 | |||||||
|
| |||||||
RIGHTS - 0.0% |
| |||||||
Clinical Data, Inc. Expires 12/31/20*,†††,1 | 4,730 | — | ||||||
|
| |||||||
Total Rights | — | |||||||
|
| |||||||
| FACE AMOUNT | ||||||||
REPURCHASE AGREEMENT††,2 - 0.7% |
| |||||||
Credit Suisse Group issued 12/30/11 at 0.00% due 01/03/12 | $ | 88,286 | 88,286 | |||||
|
| |||||||
Total Repurchase Agreement | 88,286 | |||||||
|
| |||||||
Total Investments – 100.6% | $ | 11,920,777 | ||||||
|
| |||||||
Liabilities & Other Assets – (0.6)% | (75,208 | ) | ||||||
|
| |||||||
Total Net Assets – 100.0% | $ | 11,845,569 | ||||||
| * | Non-income producing security. |
| † | Value determined based on Level 1 inputs — See Note 4. |
| †† | Value determined based on Level 2 inputs — See Note 4. |
| ††† | Value determined based on Level 3 inputs — See Note 4. |
| 1 | Illiquid security. |
| 2 | Repurchase Agreement — See Note 5. |
ADR — American Depositary Receipt
plc — Public Limited Company
| 22 | THE RYDEX FUNDSANNUALREPORT | See Notes to Financial Statements. |
BIOTECHNOLOGY FUND
| STATEMENT OF ASSETS AND LIABILITIES | ||||
December 31, 2011 | ||||
ASSETS: | ||||
Investments, at value | $ | 11,832,491 | ||
Repurchase agreements, at value | 88,286 | |||
|
| |||
Total Investments | 11,920,777 | |||
|
| |||
Total assets | 11,920,777 | |||
|
| |||
LIABILITIES: | ||||
Payable for: | ||||
Fund shares redeemed | 37,615 | |||
Management fees | 7,551 | |||
Transfer agent and administrative fees | 2,221 | |||
Investor service fees | 2,221 | |||
Portfolio accounting fees | 889 | |||
Miscellaneous | 24,711 | |||
|
| |||
Total liabilities | 75,208 | |||
|
| |||
NETASSETS | $ | 11,845,569 | ||
|
| |||
NETASSETSCONSISTOF: | ||||
Paid in capital | $ | 21,610,450 | ||
Accumulated net investment loss | (11,910 | ) | ||
Accumulated net realized loss on investments | (14,225,141 | ) | ||
Net unrealized appreciation on investments | 4,472,170 | |||
|
| |||
Net assets | $ | 11,845,569 | ||
|
| |||
Capital shares outstanding | 429,563 | |||
Net asset value per share | $ | 27.58 | ||
|
| |||
STATEMENT OF OPERATIONS |
| |||
Year Ended December 31, 2011 | ||||
INVESTMENT INCOME: | ||||
Dividends | $ | 29,573 | ||
Interest | 23 | |||
|
| |||
Total investment income | 29,596 | |||
|
| |||
EXPENSES: | ||||
Management fees | 126,119 | |||
Transfer agent and administrative fees | 37,094 | |||
Investor service fees | 37,094 | |||
Portfolio accounting fees | 14,837 | |||
Custodian fees | 4,864 | |||
Trustees’ fees* | 1,598 | |||
Miscellaneous | 31,394 | |||
|
| |||
Total expenses | 253,000 | |||
|
| |||
Net investment loss | (223,404 | ) | ||
|
| |||
NET REALIZEDAND UNREALIZED GAIN (LOSS): | ||||
Net realized gain (loss) on: | ||||
Investments | (393,880 | ) | ||
|
| |||
Net realized loss | (393,880 | ) | ||
|
| |||
Net change in unrealized appreciation (depreciation) on: | ||||
Investments | (274,698 | ) | ||
|
| |||
Net change in unrealized appreciation (depreciation) | (274,698 | ) | ||
|
| |||
Net realized and unrealized loss | (668,578 | ) | ||
|
| |||
Net decrease in net assets resulting from operations | $ | (891,982 | ) | |
|
| |||
| * | Relates to Trustees not deemed “interested persons” within the meaning of Section 2(a)(19) of the 1940 Act. |
| See Notes to Financial Statements. | THE RYDEX FUNDSANNUALREPORT | 23 |
| BIOTECHNOLOGY FUND |
| STATEMENTS OF CHANGES IN NET ASSETS |
| Year Ended December 31, 2011 | Year Ended December 31, 2010 | |||||||
INCREASE (DECREASE) IN NET ASSETS FROM OPERATIONS: | ||||||||
Net investment loss | $ | (223,404 | ) | $ | (231,247 | ) | ||
Net realized gain (loss) on investments | (393,880 | ) | 685,066 | |||||
Net change in unrealized appreciation (depreciation) on investments | (274,698 | ) | 765,162 | |||||
|
|
|
| |||||
Net increase (decrease) in net assets resulting from operations | (891,982 | ) | 1,218,981 | |||||
|
|
|
| |||||
CAPITALSHARETRANSACTIONS: | ||||||||
Proceeds from sale of shares | 81,146,101 | 86,929,077 | ||||||
Cost of shares redeemed | (82,251,545 | ) | (87,449,125 | ) | ||||
|
|
|
| |||||
Net decrease from capital share transactions | (1,105,444 | ) | (520,048 | ) | ||||
|
|
|
| |||||
Net increase (decrease) in net assets | (1,997,426 | ) | 698,933 | |||||
NETASSETS: | ||||||||
Beginning of year | 13,842,995 | 13,144,062 | ||||||
|
|
|
| |||||
End of year | $ | 11,845,569 | $ | 13,842,995 | ||||
|
|
|
| |||||
Accumulated net investment loss at end of year | $ | (11,910 | ) | $ | — | |||
|
|
|
| |||||
CAPITALSHAREACTIVITY: | ||||||||
Shares sold | 2,980,609 | 3,708,311 | ||||||
Shares redeemed | (3,106,249 | ) | (3,736,720 | ) | ||||
|
|
|
| |||||
Net decrease in shares | (125,640 | ) | (28,409 | ) | ||||
|
|
|
| |||||
| 24 | THE RYDEX FUNDSANNUALREPORT | See Notes to Financial Statements. |
BIOTECHNOLOGY FUND
FINANCIAL HIGHLIGHTS
This table is presented to show selected data for a share outstanding throughout each period and to assist shareholders in evaluating a Fund’s performance for the periods presented.
| Year Ended December 31, 2011 | Year Ended December 31, 2010 | Year Ended December 31, 2009 | Year Ended December 31, 2008 | Year Ended December 31, 2007 | ||||||||||||||||
Per Share Data | ||||||||||||||||||||
Net asset value, beginning of period | $ | 24.93 | $ | 22.52 | $ | 19.03 | $ | 21.57 | $ | 20.66 | ||||||||||
|
|
|
|
|
|
|
|
|
| |||||||||||
Income (loss) from investment operations: | ||||||||||||||||||||
Net investment lossa | (.41 | ) | (.33 | ) | (.25 | ) | (.26 | ) | (.26 | ) | ||||||||||
Net gain (loss) on investments (realized and unrealized) | 3.06 | 2.74 | 3.74 | (2.28 | ) | 1.17 | ||||||||||||||
|
|
|
|
|
|
|
|
|
| |||||||||||
Total from investment operations | 2.65 | 2.41 | 3.49 | (2.54 | ) | .91 | ||||||||||||||
|
|
|
|
|
|
|
|
|
| |||||||||||
Net asset value, end of period | $ | 27.58 | $ | 24.93 | $ | 22.52 | $ | 19.03 | $ | 21.57 | ||||||||||
|
|
|
|
|
|
|
|
|
| |||||||||||
Total Returnb | 10.59 | % | 10.70 | % | 18.34 | % | (11.78 | %) | 4.40 | % | ||||||||||
|
|
|
|
|
|
|
|
|
| |||||||||||
Ratios/Supplemental Data | ||||||||||||||||||||
Net assets, end of period (in thousands) | $ | 11,846 | $ | 13,843 | $ | 13,144 | $ | 35,296 | $ | 13,927 | ||||||||||
|
|
|
|
|
|
|
|
|
| |||||||||||
Ratios to average net assets: | ||||||||||||||||||||
Net investment loss | (1.51 | %) | (1.40 | %) | (1.25 | %) | (1.25 | %) | (1.20 | %) | ||||||||||
Total expenses | 1.71 | % | 1.65 | % | 1.68 | % | 1.63 | % | 1.59 | % | ||||||||||
|
|
|
|
|
|
|
|
|
| |||||||||||
Portfolio turnover rate | 502 | % | 509 | % | 388 | % | 351 | % | 660 | % | ||||||||||
| a | Net investment loss per share was computed using average shares outstanding throughout the period. |
| b | Total return does not reflect the impact of any additional fees charged by insurance companies and has not been annualized. |
| See Notes to Financial Statements. | THE RYDEX FUNDSANNUALREPORT | 25 |
PERFORMANCE REPORT AND FUND PROFILE (Unaudited) | December 31, 2011 | |||||
OBJECTIVE: Seeks to provide capital appreciation by investing in companies engaged in manufacturing finished goods and services both domestically and internationally (“Consumer Products Companies”).
Continuing uneven economic recovery was a positive for the group in 2011, as earnings from Consumer Staples stocks tend to hold up in tough economic times. Investors may lose interest in the defensive characteristics of the sector’s stocks as the economy continues to improve. Company fundamentals remain solid and the sector’s higher exposure to emerging markets compared with other sectors has benefited performance.
For the year ended December 31, 2011, Consumer Products Fund rose 13.76%, compared with a gain of 2.11% for the S&P 500® Index*.
All industries contributed to Fund return for the year. Within the sector, the food products and tobacco industries were the biggest contributors to Fund performance. The personal products industry was the smallest contributor to Fund performance.
Fund performance for the year got the biggest boost from Philip Morris International, Inc., Altria Group, Inc. and Estee Lauder Companies, Inc., Class A. Among the Fund’s weakest performers during the year were Avon Products, Inc., Diamond Foods, Inc. and Central European Distribution Corp.
| * | Standard & Poor’s 500 Index (S&P 500®) – a capitalization-weighted index covering 500 industrial, utility, transportation and financial companies of the U.S. markets (mostly NYSE Euronext issues). |
Performance displayed represents past performance which is no guarantee of future results.
Industry Diversification (Market Exposure as % of Net Assets)
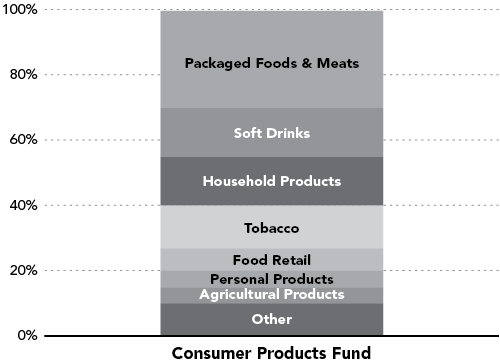
“Industry Diversification (Market Exposure as % of Net Assets)” excludes any temporary cash investments.
Inception Date: May 29, 2001
Ten Largest Holdings (% of Total Net Assets) | ||||
Procter & Gamble Co. | 6.1 | % | ||
Coca-Cola Co. | 5.7 | % | ||
Philip Morris International, Inc. | 5.2 | % | ||
PepsiCo, Inc. | 4.5 | % | ||
Kraft Foods, Inc. — Class A | 3.6 | % | ||
Altria Group, Inc. | 3.5 | % | ||
Colgate-Palmolive Co. | 3.0 | % | ||
Kimberly-Clark Corp. | 2.4 | % | ||
General Mills, Inc. | 2.2 | % | ||
Reynolds American, Inc. | 2.2 | % | ||
|
| |||
Top Ten Total | 38.4 | % | ||
|
| |||
“Ten Largest Holdings” exclude any temporary cash or derivative investments.
| 26 | THE RYDEX FUNDSANNUALREPORT |
| PERFORMANCE REPORT AND FUND PROFILE (Unaudited) (concluded) | ||
Cumulative Fund Performance*
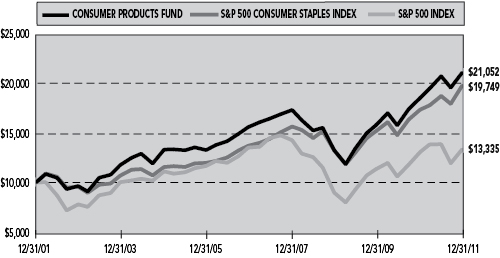
| Average Annual Returns* | ||||||||||||
| Periods Ended 12/31/11 | ||||||||||||
| 1 Year | 5 Year | 10 Year | ||||||||||
Consumer Products Fund | 13.76 | % | 6.22 | % | 7.73 | % | ||||||
|
|
|
|
|
| |||||||
S&P 500 Consumer Staples Index | 13.99 | % | 7.61 | % | 7.04 | % | ||||||
|
|
|
|
|
| |||||||
S&P 500 Index | 2.11 | % | -0.25 | % | 2.92 | % | ||||||
|
|
|
|
|
| |||||||
| * | The performance data represents past performance that is not predictive of future results. The investment return and principal value of an investment in the Fund will fluctuate so that an investor’s shares, when redeemed, may be worth more or less than their original cost. Returns are historical and include changes in principal and reinvested dividends and capital gains and do not reflect the effect of taxes. The S&P 500 Index and S&P 500 Consumer Staples Index are unmanaged indices and, unlike the Fund, have no management fees or operating expenses to reduce their reported returns. Returns do not reflect the impact of any additional fees charged by insurance companies. |
| THE RYDEX FUNDSANNUALREPORT | 27 |
| SCHEDULE OF INVESTMENTS | December 31, 2011 | |
| CONSUMER PRODUCTS FUND |
| SHARES | VALUE | |||||||
COMMON STOCKS† - 99.5% |
| |||||||
PACKAGED FOODS & MEATS - 29.6% |
| |||||||
Kraft Foods, Inc. — Class A | 22,291 | $ | 832,792 | |||||
General Mills, Inc. | 12,829 | 518,420 | ||||||
Kellogg Co. | 8,687 | 439,302 | ||||||
HJ Heinz Co. | 7,907 | 427,294 | ||||||
Hershey Co. | 6,184 | 382,048 | ||||||
Mead Johnson Nutrition Co. — Class A | 5,399 | 371,073 | ||||||
Sara Lee Corp. | 18,131 | 343,039 | ||||||
ConAgra Foods, Inc. | 12,933 | 341,431 | ||||||
Campbell Soup Co. | 10,040 | 333,730 | ||||||
JM Smucker Co. | 3,992 | 312,055 | ||||||
Tyson Foods, Inc. — Class A | 13,923 | 287,371 | ||||||
Hormel Foods Corp. | 9,726 | 284,875 | ||||||
Unilever N.V. | 7,873 | 270,595 | ||||||
McCormick & Company, Inc. | 5,195 | 261,932 | ||||||
Green Mountain Coffee Roasters, Inc.* | 5,292 | 237,346 | ||||||
Ralcorp Holdings, Inc.* | 2,580 | 220,590 | ||||||
Smithfield Foods, Inc.* | 8,440 | 204,923 | ||||||
Flowers Foods, Inc. | 8,601 | 163,247 | ||||||
TreeHouse Foods, Inc.* | 2,407 | 157,370 | ||||||
Dean Foods Co.* | 13,380 | 149,856 | ||||||
Hain Celestial Group, Inc.* | 3,530 | 129,410 | ||||||
Sanderson Farms, Inc. | 2,080 | 104,270 | ||||||
Diamond Foods, Inc. | 3,035 | 97,939 | ||||||
|
| |||||||
Total Packaged Foods & Meats | 6,870,908 | |||||||
|
| |||||||
SOFT DRINKS - 15.1% |
| |||||||
Coca-Cola Co. | 18,671 | 1,306,410 | ||||||
PepsiCo, Inc. | 15,739 | 1,044,283 | ||||||
Dr Pepper Snapple Group, Inc. | 7,594 | 299,811 | ||||||
Coca-Cola Enterprises, Inc. | 11,217 | 289,174 | ||||||
Hansen Natural Corp.* | 3,053 | 281,303 | ||||||
Fomento Economico Mexicano SAB de CV ADR | 3,551 | 247,540 | ||||||
|
| |||||||
Total Soft Drinks | 3,468,521 | |||||||
|
| |||||||
HOUSEHOLD PRODUCTS - 14.9% |
| |||||||
Procter & Gamble Co. | 20,959 | 1,398,175 | ||||||
Colgate-Palmolive Co. | 7,398 | 683,501 | ||||||
Kimberly-Clark Corp. | 7,583 | 557,805 | ||||||
Clorox Co. | 4,649 | 309,437 | ||||||
Church & Dwight Company, Inc. | 5,606 | 256,531 | ||||||
Energizer Holdings, Inc.* | 3,030 | 234,764 | ||||||
|
| |||||||
Total Household Products | 3,440,213 | |||||||
|
| |||||||
TOBACCO - 13.2% |
| |||||||
Philip Morris International, Inc. | 15,375 | 1,206,630 | ||||||
Altria Group, Inc. | 26,903 | 797,674 | ||||||
Reynolds American, Inc. | 12,152 | 503,336 | ||||||
Lorillard, Inc. | 3,548 | 404,472 | ||||||
Universal Corp. | 2,330 | 107,087 | ||||||
|
| |||||||
Total Tobacco | 3,019,199 | |||||||
|
| |||||||
FOOD RETAIL - 6.9% |
| |||||||
Kroger Co. | 15,591 |
| 377,614 |
| ||||
Whole Foods Market, Inc. | 5,316 | 369,887 | ||||||
Safeway, Inc. | 12,837 | 270,090 | ||||||
Ruddick Corp. | 3,590 | 153,078 | ||||||
Casey’s General Stores, Inc. | 2,830 | 145,773 | ||||||
SUPERVALU, Inc. | 17,075 | 138,649 | ||||||
Fresh Market, Inc.* | 3,459 | 138,014 | ||||||
|
| |||||||
Total Food Retail | 1,593,105 | |||||||
|
| |||||||
PERSONAL PRODUCTS - 5.2% |
| |||||||
Estee Lauder Companies, Inc. - Class A | 4,349 | 488,480 | ||||||
Avon Products, Inc. | 16,304 | 284,831 | ||||||
Herbalife Ltd. | 4,844 | 250,289 | ||||||
Nu Skin Enterprises, Inc. — Class A | 3,608 | 175,241 | ||||||
|
| |||||||
Total Personal Products | 1,198,841 | |||||||
|
| |||||||
AGRICULTURAL PRODUCTS - 4.7% |
| |||||||
Archer-Daniels-Midland Co. | 15,695 | 448,877 | ||||||
Bunge Ltd. | 5,069 | 289,947 | ||||||
Corn Products International, Inc. | 4,084 | 214,778 | ||||||
Darling International, Inc.* | 9,727 | 129,272 | ||||||
|
| |||||||
Total Agricultural Products | 1,082,874 | |||||||
|
| |||||||
BREWERS - 3.8% | ||||||||
Cia de Bebidas das Americas ADR | 8,577 | 309,544 | ||||||
Molson Coors Brewing Co. — Class B | 6,813 | 296,638 | ||||||
Anheuser-Busch InBev N.V. ADR | 4,442 | 270,918 | ||||||
|
| |||||||
Total Brewers | 877,100 | |||||||
|
| |||||||
DISTILLERS & VINTNERS - 3.7% |
| |||||||
Brown-Forman Corp. — Class B | 4,451 | 358,350 | ||||||
Beam, Inc. | 5,540 | 283,814 | ||||||
Constellation Brands, Inc. — Class A* | 10,623 | 219,577 | ||||||
|
| |||||||
Total Distillers & Vintners | 861,741 | |||||||
|
| |||||||
FOOD DISTRIBUTORS - 2.4% |
| |||||||
Sysco Corp. | 14,345 | 420,739 | ||||||
United Natural Foods, Inc.* | 3,640 | 145,636 | ||||||
|
| |||||||
Total Food Distributors | 566,375 | |||||||
|
| |||||||
Total Common Stocks | 22,978,877 | |||||||
|
| |||||||
WARRANTS†† - 0.0% | ||||||||
Krispy Kreme Doughnuts, Inc. $ 12.21, 03/02/12* | 17 | — | ||||||
|
| |||||||
Total Warrants | — | |||||||
|
| |||||||
| 28 | THE RYDEX FUNDSANNUALREPORT | See Notes to Financial Statements. |
| SCHEDULE OF INVESTMENTS (concluded) | December 31, 2011 | |
| CONSUMER PRODUCTS FUND |
| FACE | ||||||||
| AMOUNT | VALUE | |||||||
REPURCHASE AGREEMENT†† ,1 - 0.4% |
| |||||||
Credit Suisse Group issued 12/30/11 at 0.00% due 01/03/12 | $ | 96,744 | $ | 96,744 | ||||
|
| |||||||
Total Repurchase Agreement | 96,744 | |||||||
|
| |||||||
Total Investments – 99.9% | $ | 23,075,621 | ||||||
|
| |||||||
Other Assets, Less Liabilities – 0.1% | 15,897 | |||||||
|
| |||||||
Total Net Assets – 100.0% | $ | 23,091,518 | ||||||
| * | Non-income producing security. |
| † | Value determined based on Level 1 inputs — See Note 4. |
| †† | Value determined based on Level 2 inputs — See Note 4. |
| 1 | Repurchase Agreement — See Note 5. |
ADR — American Depositary Receipt
| See Notes to Financial Statements. | THE RYDEX FUNDSANNUALREPORT | 29 |
CONSUMER PRODUCTS FUND
STATEMENT OF ASSETS AND LIABILITIES
December 31, 2011
ASSETS: | ||||
Investments, at value | $ | 22,978,877 | ||
Repurchase agreements, at value | 96,744 | |||
|
| |||
Total Investments | 23,075,621 | |||
Receivables: | ||||
Fund shares sold | 258,095 | |||
Dividends | 63,200 | |||
Foreign taxes reclaim | 259 | |||
|
| |||
Total assets | 23,397,175 | |||
|
| |||
LIABILITIES: | ||||
Payable for: | ||||
Securities purchased | 249,609 | |||
Management fees | 15,478 | |||
Transfer agent and administrative fees | 4,552 | |||
Investor service fees | 4,552 | |||
Portfolio accounting fees | 1,821 | |||
Fund shares redeemed | 253 | |||
Miscellaneous | 29,392 | |||
|
| |||
Total liabilities | 305,657 | |||
|
| |||
NETASSETS | $ | 23,091,518 | ||
|
| |||
NETASSETSCONSISTOF: | ||||
Paid in capital | $ | 21,270,824 | ||
Undistributed net investment income | 186,253 | |||
Accumulated net realized loss on investments | (4,903,023 | ) | ||
Net unrealized appreciation on investments | 6,537,464 | |||
|
| |||
Net assets | $ | 23,091,518 | ||
|
| |||
Capital shares outstanding | 552,134 | |||
Net asset value per share | $ | 41.82 | ||
|
| |||
STATEMENT OF OPERATIONS
Year Ended December 31, 2011
INVESTMENT INCOME: | ||||
Dividends (net of foreign withholding tax of $ 608) | $ | 495,714 | ||
Interest | 27 | |||
|
| |||
Total investment income | 495,741 | |||
|
| |||
EXPENSES: | ||||
Management fees | 155,208 | |||
Transfer agent and administrative fees | 45,650 | |||
Investor service fees | 45,650 | |||
Portfolio accounting fees | 18,260 | |||
Custodian fees | 4,590 | |||
Trustees’ fees* | 1,833 | |||
Miscellaneous | 38,297 | |||
|
| |||
Total expenses | 309,488 | |||
|
| |||
Net investment income | 186,253 | |||
|
| |||
NET REALIZEDAND UNREALIZED GAIN (LOSS): | ||||
Net realized gain (loss) on: | ||||
Investments | 153,916 | |||
|
| |||
Net realized gain | 153,916 | |||
|
| |||
Net change in unrealized appreciation (depreciation) on: | ||||
Investments | 1,560,743 | |||
|
| |||
Net change in unrealized appreciation (depreciation) | 1,560,743 | |||
|
| |||
Net realized and unrealized gain | 1,714,659 | |||
|
| |||
Net increase in net assets resulting from operations | $ | 1,900,912 | ||
|
| |||
| * | Relates to Trustees not deemed “interested persons” within the meaning of Section 2(a)(19) of the 1940 Act. |
| 30 | THE RYDEX FUNDSANNUALREPORT | See Notes to Financial Statements. |
CONSUMER PRODUCTS FUND
STATEMENTS OF CHANGES IN NET ASSETS
| Year Ended December 31, 2011 | Year Ended December 31, 2010 | |||||||
INCREASE (DECREASE) IN NET ASSETS FROM OPERATIONS: | ||||||||
Net investment income | $ | 186,253 | $ | 320,376 | ||||
Net realized gain on investments | 153,916 | 2,017,347 | ||||||
Net change in unrealized appreciation (depreciation) on investments | 1,560,743 | 428,639 | ||||||
|
|
|
| |||||
Net increase in net assets resulting from operations | 1,900,912 | 2,766,362 | ||||||
|
|
|
| |||||
DISTRIBUTIONSTOSHAREHOLDERSFROM: | ||||||||
Net investment income | (320,376 | ) | (242,595 | ) | ||||
|
|
|
| |||||
Total distributions to shareholders | (320,376 | ) | (242,595 | ) | ||||
|
|
|
| |||||
CAPITALSHARETRANSACTIONS: | ||||||||
Proceeds from sale of shares | 86,314,154 | 89,104,867 | ||||||
Distributions reinvested | 320,376 | 242,595 | ||||||
Cost of shares redeemed | (80,382,121 | ) | (97,864,840 | ) | ||||
|
|
|
| |||||
Net increase (decrease) from capital share transactions | 6,252,409 | (8,517,378 | ) | |||||
|
|
|
| |||||
Net increase (decrease) in net assets | 7,832,945 | (5,993,611 | ) | |||||
NETASSETS: | ||||||||
Beginning of year | 15,258,573 | 21,252,184 | ||||||
|
|
|
| |||||
End of year | $ | 23,091,518 | $ | 15,258,573 | ||||
|
|
|
| |||||
Undistributed net investment income at end of year | $ | 186,253 | $ | 320,376 | ||||
|
|
|
| |||||
CAPITALSHAREACTIVITY: | ||||||||
Shares sold | 2,151,169 | 2,576,242 | ||||||
Shares issued from reinvestment of distributions | 7,938 | 6,702 | ||||||
Shares redeemed | (2,015,735 | ) | (2,833,190 | ) | ||||
|
|
|
| |||||
Net increase (decrease) in shares | 143,372 | (250,246 | ) | |||||
|
|
|
| |||||
| See Notes to Financial Statements. | THE RYDEX FUNDSANNUALREPORT | 31 |
CONSUMER PRODUCTS FUND
FINANCIAL HIGHLIGHTS
This table is presented to show selected data for a share outstanding throughout each period and to assist shareholders in evaluating a Fund’s performance for the periods presented.
| Year Ended December 31, 2011 | Year Ended December 31, 2010 | Year Ended December 31, 2009 | Year Ended December 31, 2008 | Year Ended December 31, 2007 | ||||||||||||||||
Per Share Data | ||||||||||||||||||||
Net asset value, beginning of period | $ | 37.33 | $ | 32.25 | $ | 27.51 | $ | 37.02 | $ | 36.55 | ||||||||||
|
|
|
|
|
|
|
|
|
| |||||||||||
Income (loss) from investment operations: | ||||||||||||||||||||
Net investment incomea | .41 | .60 | .41 | .40 | .42 | |||||||||||||||
Net gain (loss) on investments (realized and unrealized) | 4.70 | 4.96 | 4.85 | (9.09 | ) | 3.69 | ||||||||||||||
|
|
|
|
|
|
|
|
|
| |||||||||||
Total from investment operations | 5.11 | 5.56 | 5.26 | (8.69 | ) | 4.11 | ||||||||||||||
|
|
|
|
|
|
|
|
|
| |||||||||||
Less distributions from: | ||||||||||||||||||||
Net investment income | (.62 | ) | (.48 | ) | (.52 | ) | (.06 | ) | (.69 | ) | ||||||||||
Net realized gains | — | — | — | (.76 | ) | (2.95 | ) | |||||||||||||
Total distributions | (.62 | ) | (.48 | ) | (.52 | ) | (.82 | ) | (3.64 | ) | ||||||||||
|
|
|
|
|
|
|
|
|
| |||||||||||
Net asset value, end of period | $ | 41.82 | $ | 37.33 | $ | 32.25 | $ | 27.51 | $ | 37.02 | ||||||||||
|
|
|
|
|
|
|
|
|
| |||||||||||
Total Returnb | 13.76% | 17.28% | 19.12% | (23.39% | ) | 11.08% | ||||||||||||||
|
|
|
|
|
|
|
|
|
| |||||||||||
Ratios/Supplemental Data | ||||||||||||||||||||
Net assets, end of period (in thousands) | $ | 23,092 | $ | 15,259 | $ | 21,252 | $ | 24,833 | $ | 40,847 | ||||||||||
|
|
|
|
|
|
|
|
|
| |||||||||||
Ratios to average net assets: | ||||||||||||||||||||
Net investment income | 1.02% | 1.76% | 1.43% | 1.21% | 1.10% | |||||||||||||||
Total expenses | 1.69% | 1.65% | 1.66% | 1.61% | 1.59% | |||||||||||||||
|
|
|
|
|
|
|
|
|
| |||||||||||
Portfolio turnover rate | 368% | 442% | 259% | 297% | 260% | |||||||||||||||
| a | Net investment income per share was computed using average shares outstanding throughout the period. |
| b | Total return does not reflect the impact of any additional fees charged by insurance companies and has not been annualized. |
| 32 | THE RYDEX FUNDSANNUALREPORT | See Notes to Financial Statements. |
This page intentionally left blank.
| THE RYDEX FUNDSANNUALREPORT | 33 |
| PERFORMANCE REPORT AND FUND PROFILE (Unaudited) | December 31, 2011 |
OBJECTIVE: Seeks to provide capital appreciation by investing in companies that are involved in the electronics sector, including semiconductor manufacturers and distributors, and makers and vendors of other electronic components and devices (“Electronics Companies”).
The semiconductor industry had a difficult 2011, impacted by a weak global economy, lower demand and supply-chain disruptions caused by natural disasters in Japan and Thailand.
For the year ended December 31, 2011, Electronics Fund returned -16.49%, compared with a gain of 2.11% for the S&P 500® Index*. The semiconductors and semiconductor equipment stocks that make up most of the Fund were responsible for most of the Fund’s negative performance.
For the year, Fund performance got the biggest boost from Intel Corp., National Semiconductor Corp. and NetLogic Microsystems, Inc. Stocks providing the least to Fund performance for the period were FirstSolar, Inc., Cree, Inc. and Trina Solar Ltd. ADR.
| * | Standard & Poor’s 500 Index (S&P 500®) – a capitalization-weighted index covering 500 industrial, utility, transportation and financial companies of the U.S. markets (mostly NYSE Euronext issues). |
Performance displayed represents past performance which is no guarantee of future results.
Industry Diversification (Market Exposure as % of Net Assets)
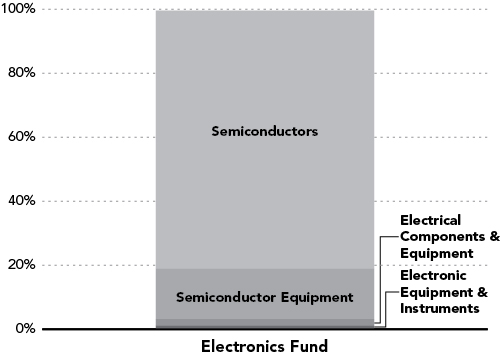
“Industry Diversification (Market Exposure as % of Net Assets)” excludes any temporary cash investments.
| Inception Date: August 3, 2001 | ||||
Ten Largest Holdings (% of Total Net Assets) | ||||
Intel Corp. | 11.1 | % | ||
Texas Instruments, Inc. | 5.7 | % | ||
Broadcom Corp. — Class A | 4.0 | % | ||
Applied Materials, Inc. | 3.8 | % | ||
Altera Corp. | 3.5 | % | ||
Analog Devices, Inc. | 3.2 | % | ||
NVIDIA Corp. | 2.9 | % | ||
Xilinx, Inc. | 2.9 | % | ||
KLA-Tencor Corp. | 2.9 | % | ||
Marvell Technology Group Ltd. | 2.8 | % | ||
|
| |||
Top Ten Total | 42.8 | % | ||
|
| |||
“Ten Largest Holdings” exclude any temporary cash or derivative investments.
| 34 | THE RYDEX FUNDSANNUALREPORT |
PERFORMANCE REPORT AND FUND PROFILE (Unaudited) (concluded) | ||
Cumulative Fund Performance*
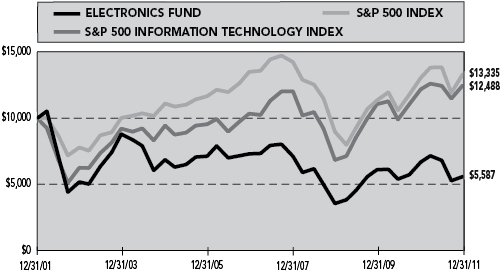
| Average Annual Returns* | ||||||||||||
| Periods Ended 12/31/11 | ||||||||||||
| 1 Year | 5 Year | 10 Year | ||||||||||
Electronics Fund | -16.49 | % | -5.22 | % | -5.66 | % | ||||||
|
|
|
|
|
| |||||||
S&P 500 Information Technology Index | 2.41 | % | 3.83 | % | 2.25 | % | ||||||
|
|
|
|
|
| |||||||
S&P 500 Index | 2.11 | % | -0.25 | % | 2.92 | % | ||||||
|
|
|
|
|
| |||||||
| * | The performance data represents past performance that is not predictive of future results. The investment return and principal value of an investment in the Fund will fluctuate so that an investor’s shares, when redeemed, may be worth more or less than their original cost. Returns are historical and include changes in principal and reinvested dividends and capital gains and do not reflect the effect of taxes. The S&P 500 Index and S&P 500 Information Technology Index are unmanaged indices and, unlike the Fund, have no management fees or operating expenses to reduce their reported returns. Returns do not reflect the impact of any additional fees charged by insurance companies. |
| THE RYDEX FUNDSANNUALREPORT | 35 |
| SCHEDULE OF INVESTMENTS | December 31, 2011 |
ELECTRONICS FUND
| SHARES | VALUE | |||||||
COMMON STOCKS† - 99.5% |
| |||||||
SEMICONDUCTORS - 80.6% |
| |||||||
Intel Corp. | 14,004 | $ | 339,597 | |||||
Texas Instruments, Inc. | 5,941 | 172,943 | ||||||
Broadcom Corp. — Class A* | 4,137 | 121,462 | ||||||
Altera Corp. | 2,897 | 107,479 | ||||||
Analog Devices, Inc. | 2,760 | 98,753 | ||||||
NVIDIA Corp.* | 6,464 | 89,591 | ||||||
Xilinx, Inc. | 2,728 | 87,460 | ||||||
Marvell Technology Group Ltd.* | 6,279 | 86,964 | ||||||
Maxim Integrated Products, Inc. | 3,173 | 82,625 | ||||||
Microchip Technology, Inc. | 2,217 | 81,209 | ||||||
Avago Technologies Ltd. | 2,790 | 80,519 | ||||||
Linear Technology Corp. | 2,628 | 78,919 | ||||||
Micron Technology, Inc.* | 12,508 | 78,675 | ||||||
Taiwan Semiconductor Manufacturing Company Ltd. ADR | 5,941 | 76,698 | ||||||
Advanced Micro Devices, Inc.* | 11,302 | 61,031 | ||||||
Atmel Corp.* | 7,230 | 58,563 | ||||||
ARM Holdings plc ADR | 2,114 | 58,494 | ||||||
ON Semiconductor Corp.* | 7,549 | 58,278 | ||||||
Skyworks Solutions, Inc.* | 3,425 | 55,553 | ||||||
Netlogic Microsystems, Inc.* | 1,107 | 54,874 | ||||||
Cypress Semiconductor Corp.* | 2,966 | 50,096 | ||||||
Cree, Inc.* | 2,181 | 48,069 | ||||||
LSI Corp.* | 8,005 | 47,630 | ||||||
Silicon Laboratories, Inc.* | 891 | 38,687 | ||||||
Fairchild Semiconductor International, Inc. — Class A* | 3,184 | 38,335 | ||||||
RF Micro Devices, Inc.* | 6,998 | 37,789 | ||||||
Cavium, Inc.* | 1,306 | 37,130 | ||||||
PMC - Sierra, Inc.* | 6,420 | 35,374 | ||||||
Intersil Corp. — Class A | 3,276 | 34,201 | ||||||
Cirrus Logic, Inc.* | 1,993 | 31,589 | ||||||
Microsemi Corp.* | 1,753 | 29,363 | ||||||
Rambus, Inc.* | 3,683 | 27,807 | ||||||
Semtech Corp.* | 1,113 | 27,625 | ||||||
Omnivision Technologies, Inc.* | 2,159 | 26,415 | ||||||
Hittite Microwave Corp.* | 481 | 23,752 | ||||||
|
| |||||||
Total Semiconductors | 2,463,549 | |||||||
|
| |||||||
SEMICONDUCTOR EQUIPMENT - 15.7% |
| |||||||
Applied Materials, Inc. | 10,752 | 115,154 | ||||||
KLA-Tencor Corp. | 1,808 | 87,236 | ||||||
Lam Research Corp.* | 1,833 | 67,858 | ||||||
ASML Holding N.V. ADR | 1,367 | 57,127 | ||||||
Teradyne, Inc.* | 3,601 | 49,082 | ||||||
Novellus Systems, Inc.* | 1,151 | 47,525 | ||||||
GT Advanced Technologies, Inc.* | 4,226 | 30,596 | ||||||
Veeco Instruments, Inc.* | 1,213 | 25,230 | ||||||
|
| |||||||
Total Semiconductor Equipment | 479,808 | |||||||
|
| |||||||
ELECTRICAL COMPONENTS & EQUIPMENT - 2.1% |
| |||||||
First Solar, Inc.* | 1,872 | 63,199 | ||||||
| �� |
|
| ||||||
ELECTRONIC EQUIPMENT & INSTRUMENTS - 1.1% |
| |||||||
FEI Co.* | 819 | 33,399 | ||||||
|
| |||||||
Total Common Stocks | 3,039,955 | |||||||
|
| |||||||
| FACE AMOUNT | ||||||||
REPURCHASE AGREEMENT††,1 - 0.9% |
| |||||||
Credit Suisse Group issued 12/30/11 at 0.00% due 01/03/12 | $ | 26,683 | 26,683 | |||||
|
| |||||||
Total Repurchase Agreement | 26,683 | |||||||
|
| |||||||
Total Investments – 100.4% | $ | 3,066,638 | ||||||
|
| |||||||
Liabilities & Other Assets – (0.4)% | (13,435 | ) | ||||||
|
| |||||||
Total Net Assets – 100.0% | $ | 3,053,203 | ||||||
| * | Non-income producing security. |
| † | Value determined based on Level 1 inputs — See Note 4. |
| †† | Value determined based on Level 2 inputs — See Note 4. |
| 1 | Repurchase Agreement — See Note 5. |
ADR — American Depositary Receipt
| plc | — Public Limited Company |
| 36 | THE RYDEX FUNDSANNUALREPORT | See Notes to Financial Statements. |
ELECTRONICS FUND
STATEMENT OF ASSETS AND LIABILITIES
December 31, 2011
ASSETS: | ||||
Investments, at value | $ | 3,039,955 | ||
Repurchase agreements, at value | 26,683 | |||
|
| |||
Total Investments | 3,066,638 | |||
Receivables: | ||||
Fund shares sold | 4,782 | |||
Dividends | 380 | |||
|
| |||
Total assets | 3,071,800 | |||
|
| |||
| LIABILITIES: | ||||
Payable for: | ||||
Management fees | 2,640 | |||
Transfer agent and administrative fees | 777 | |||
Investor service fees | 777 | |||
Portfolio accounting fees | 310 | |||
Fund shares redeemed | 39 | |||
Miscellaneous | 14,054 | |||
|
| |||
Total liabilities | 18,597 | |||
|
| |||
NET ASSETS | $ | 3,053,203 | ||
|
| |||
NET ASSETS CONSISTOF: | ||||
Paid in capital | $ | 6,561,848 | ||
Undistributed net investment income | 1 | |||
Accumulated net realized loss on investments | (4,817,018 | ) | ||
Net unrealized appreciation on investments | 1,308,372 | |||
|
| |||
Net assets | $ | 3,053,203 | ||
|
| |||
Capital shares outstanding | 1,070,473 | |||
Net asset value per share | $ | 2.85 | ||
|
|
STATEMENT OF OPERATIONS
Year Ended December 31, 2011
INVESTMENT INCOME: | ||||
Dividends (net of foreign withholding tax of $ 58) | $ | 85,979 | ||
Interest | 21 | |||
|
| |||
Total investment income | 86,000 | |||
|
| |||
EXPENSES: | ||||
Management fees | 70,185 | |||
Transfer agent and administrative fees | 20,642 | |||
Investor service fees | 20,642 | |||
Portfolio accounting fees | 8,257 | |||
Trustees’ fees* | 772 | |||
Custodian fees | 2,077 | |||
Miscellaneous | 19,305 | |||
|
| |||
Total expenses | 141,880 | |||
|
| |||
Net investment loss | (55,880 | ) | ||
|
| |||
NET REALIZEDAND UNREALIZED GAIN (LOSS): | ||||
Net realized gain (loss) on: | ||||
Investments | 196,056 | |||
|
| |||
Net realized gain | 196,056 | |||
|
| |||
Net change in unrealized appreciation (depreciation) on: | ||||
Investments | (1,419,617 | ) | ||
|
| |||
Net change in unrealized appreciation (depreciation) | (1,419,617 | ) | ||
|
| |||
Net realized and unrealized loss | (1,223,561 | ) | ||
|
| |||
Net decrease in net assets resulting from operations | $ | (1,279,441 | ) | |
|
| |||
| * | Relates to Trustees not deemed “interested persons” within the meaning of Section 2(a)(19) of the 1940 Act. |
| See Notes to Financial Statements. | THE RYDEX FUNDSANNUALREPORT | 37 |
ELECTRONICS FUND
STATEMENTS OF CHANGES IN NET ASSETS
| Year Ended December 31, 2011 | Year Ended December 31, 2010 | |||||||
INCREASE (DECREASE) IN NET ASSETS FROM OPERATIONS: | ||||||||
Net investment loss | $ | (55,880 | ) | $ | (56,906 | ) | ||
Net realized gain on investments | 196,056 | 2,944,930 | ||||||
Net change in unrealized appreciation (depreciation) on investments | (1,419,617 | ) | (4,689,536 | ) | ||||
|
|
|
| |||||
Net decrease in net assets resulting from operations | (1,279,441 | ) | (1,801,512 | ) | ||||
|
|
|
| |||||
DISTRIBUTIONS TO SHAREHOLDERS FROM: | ||||||||
Net realized gains | (2,395,856 | ) | (1,609,036 | ) | ||||
|
|
|
| |||||
Total distributions to shareholders | (2,395,856 | ) | (1,609,036 | ) | ||||
|
|
|
| |||||
CAPITAL SHARE TRANSACTIONS: | ||||||||
Proceeds from sale of shares | 73,680,860 | 137,613,070 | ||||||
Distributions reinvested | 2,395,856 | 1,609,036 | ||||||
Cost of shares redeemed | (78,586,680 | ) | (151,602,331 | ) | ||||
|
|
|
| |||||
Net decrease from capital share transactions | (2,509,964 | ) | (12,380,225 | ) | ||||
|
|
|
| |||||
Net decrease in net assets | (6,185,261 | ) | (15,790,773 | ) | ||||
NET ASSETS: | ||||||||
Beginning of year | 9,238,464 | 25,029,237 | ||||||
|
|
|
| |||||
End of year | $ | 3,053,203 | $ | 9,238,464 | ||||
|
|
|
| |||||
Undistributed net investment income at end of year | $ | 1 | $ | — | ||||
|
|
|
| |||||
CAPITAL SHARE ACTIVITY: | ||||||||
Shares sold | 8,879,944 | 12,576,972 | ||||||
Shares issued from reinvestment of distributions | 788,110 | 183,890 | ||||||
Shares redeemed | (9,576,853 | ) | (13,916,768 | ) | ||||
|
|
|
| |||||
Net increase (decrease) in shares | 91,201 | (1,155,906 | ) | |||||
|
|
|
| |||||
| 38 | THE RYDEX FUNDSANNUALREPORT | See Notes to Financial Statements. |
ELECTRONICS FUND
FINANCIAL HIGHLIGHTS
This table is presented to show selected data for a share outstanding throughout each period and to assist shareholders in evaluating a Fund’s performance for the periods presented.
| Year Ended December 31, 2011 | Year Ended December 31, 2010 | Year Ended December 31, 2009 | Year Ended December 31, 2008 | Year Ended December 31, 2007 | ||||||||||||||||
Per Share Data | ||||||||||||||||||||
Net asset value, beginning of period | $ | 9.43 | $ | 11.72 | $ | 6.82 | $ | 13.67 | $ | 14.02 | ||||||||||
|
|
|
|
|
|
|
|
|
| |||||||||||
Income (loss) from investment operations: | ||||||||||||||||||||
Net investment lossa | (.06 | ) | (.05 | ) | (.02 | ) | (.02 | ) | (.11 | ) | ||||||||||
Net gain (loss) on investments (realized and unrealized) | (1.16 | ) | .92 | 4.92 | (6.83 | ) | (.24 | ) | ||||||||||||
|
|
|
|
|
|
|
|
|
| |||||||||||
Total from investment operations | (1.22 | ) | .87 | 4.90 | (6.85 | ) | (.35 | ) | ||||||||||||
|
|
|
|
|
|
|
|
|
| |||||||||||
Less distributions from: | ||||||||||||||||||||
Net realized gains | (5.36 | ) | (3.16 | ) | — | — | — | |||||||||||||
|
|
|
|
|
|
|
|
|
| |||||||||||
Total distributions | (5.36 | ) | (3.16 | ) | — | — | — | |||||||||||||
|
|
|
|
|
|
|
|
|
| |||||||||||
Net asset value, end of period | $ | 2.85 | $ | 9.43 | $ | 11.72 | $ | 6.82 | $ | 13.67 | ||||||||||
|
|
|
|
|
|
|
|
|
| |||||||||||
Total Returnb | (16.49 | %) | 9.55 | % | 71.85 | % | (50.11 | %) | (2.50 | %) | ||||||||||
|
|
|
|
|
|
|
|
|
| |||||||||||
Ratios/Supplemental Data | ||||||||||||||||||||
Net assets, end of period (in thousands) | $ | 3,053 | $ | 9,238 | $ | 25,029 | $ | 1,877 | $ | 2,943 | ||||||||||
|
|
|
|
|
|
|
|
|
| |||||||||||
Ratios to average net assets: | ||||||||||||||||||||
Net investment loss | (0.68 | %) | (0.46 | %) | (0.19 | %) | (0.15 | %) | (0.73 | %) | ||||||||||
Total expenses | 1.72 | % | 1.64 | % | 1.64 | % | 1.61 | % | 1.59 | % | ||||||||||
|
|
|
|
|
|
|
|
|
| |||||||||||
Portfolio turnover rate | 859 | % | 958 | % | 445 | % | 940 | % | 1,009 | % | ||||||||||
| a | Net investment loss per share was computed using average shares outstanding throughout the period. |
| b | Total return does not reflect the impact of any additional fees charged by insurance companies and has not been annualized. |
| See Notes to Financial Statements. | THE RYDEX FUNDSANNUALREPORT | 39 |
| PERFORMANCE REPORT AND FUND PROFILE (Unaudited) | December 31, 2011 |
OBJECTIVE: Seeks to provide capital appreciation by investing in companies involved in the energy field, including the exploration, production, and development of oil, gas, coal and alternative sources of energy (“Energy Companies”).
Better growth expectations in high-demand countries like the U.S. and China pushed the price of oil higher in 2011—rising above $100 per barrel in the spring for the first time in more than two years after the Mid East uprisings, then falling abruptly after debt woes began to hamper expectations for economic growth. For the year, the price of a barrel of oil rose about 8%. The price of natural gas was also pushed down by plentiful supply and a milder start to winter. The sector is expected to remain volatile as global political uncertainties affect supply and concerns remain about the strength of the global economy.
For the year ended December 31, 2011, Energy Fund returned -5.85%, compared with the 2.11% increase in the S&P 500® Index*. Within the sector, the segment most sensitive to changes in the price of oil, Energy Equipment & Services, accounted for only about 25% of the holdings, but was the leading detractor from return.
Exxon Mobil Corp., El Paso Corp. and Chevron Corp. were the most significant positive contributors to Fund performance for the year. Stocks detracting most from performance were Alpha Natural Resources, Inc., Petrobras Petroleo Brasileiro and Peabody Energy Corp.
| * | Standard & Poor’s 500 Index (S&P 500®) – a capitalization-weighted index covering 500 industrial, utility, transportation and financial companies of the U.S. markets (mostly NYSE Euronext issues). |
Performance displayed represents past performance which is no guarantee of future results.
Industry Diversification (Market Exposure as % of Net Assets)
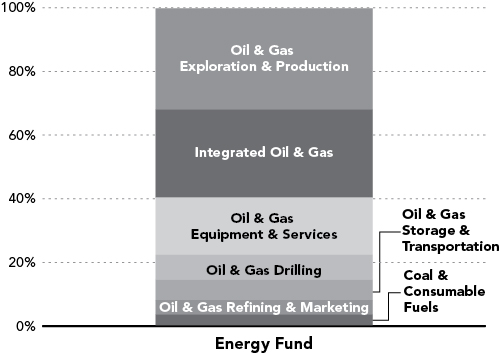
“Industry Diversification (Market Exposure as % of Net Assets)” excludes any temporary cash investments.
Inception Date: May 29, 2001
Ten Largest Holdings (% of Total Net Assets) | ||||
Exxon Mobil Corp. | 6.1 | % | ||
Chevron Corp. | 4.4 | % | ||
ConocoPhillips | 3.0 | % | ||
Schlumberger Ltd. | 2.8 | % | ||
Occidental Petroleum Corp. | 2.7 | % | ||
Anadarko Petroleum Corp. | 1.9 | % | ||
Apache Corp. | 1.8 | % | ||
Halliburton Co. | 1.7 | % | ||
National Oilwell Varco, Inc. | 1.6 | % | ||
Kinder Morgan, Inc. | 1.6 | % | ||
|
| |||
Top Ten Total | 27.6 | % | ||
|
| |||
“Ten Largest Holdings” exclude any temporary cash or derivative investments.
| 40 | THE RYDEX FUNDSANNUALREPORT |
| PERFORMANCE REPORT AND FUND PROFILE (Unaudited) (concluded) | ||
Cumulative Fund Performance*
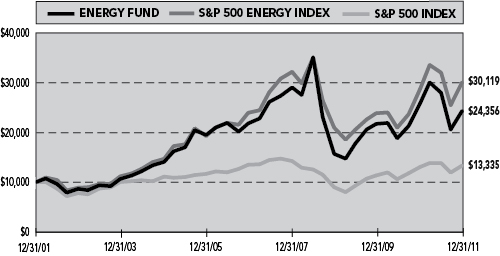
| Average Annual Returns* | ||||||||||||
| Periods Ended 12/31/11 | ||||||||||||
| 1 Year | 5 Year | 10 Year | ||||||||||
Energy Fund | -5.85 | % | 2.22 | % | 9.31 | % | ||||||
|
|
|
|
|
| |||||||
S&P 500 Energy Index | 4.72 | % | 4.68 | % | 11.66 | % | ||||||
|
|
|
|
|
| |||||||
S&P 500 Index | 2.11 | % | -0.25 | % | 2.92 | % | ||||||
|
|
|
|
|
| |||||||
| * | The performance data represents past performance that is not predictive of future results. The investment return and principal value of an investment in the Fund will fluctuate so that an investor’s shares, when redeemed, may be worth more or less than their original cost. Returns are historical and include changes in principal and reinvested dividends and capital gains and do not reflect the effect of taxes. The S&P 500 Index and S&P 500 Energy Index are unmanaged indices and, unlike the Fund, have no management fees or operating expenses to reduce their reported returns. Returns do not reflect the impact of any additional fees charged by insurance companies. |
| THE RYDEX FUNDSANNUALREPORT | 41 |
SCHEDULE OF INVESTMENTS | December 31, 2011 | |
ENERGY FUND |
| SHARES | VALUE | |||||||
COMMON STOCKS† - 99.7% |
| |||||||
OIL & GAS EXPLORATION & PRODUCTION - 31.8% |
| |||||||
Anadarko Petroleum Corp. | 7,112 | $ | 542,859 | |||||
Apache Corp. | 5,707 | 516,940 | ||||||
EOG Resources, Inc. | 4,577 | 450,880 | ||||||
Devon Energy Corp. | 7,075 | 438,650 | ||||||
Marathon Oil Corp. | 13,984 | 409,312 | ||||||
Noble Energy, Inc. | 3,895 | 367,649 | ||||||
Chesapeake Energy Corp. | 14,545 | 324,208 | ||||||
Continental Resources, Inc.* | 4,618 | 308,067 | ||||||
Pioneer Natural Resources Co. | 3,362 | 300,832 | ||||||
Southwestern Energy Co.* | 8,776 | 280,305 | ||||||
Range Resources Corp. | 4,476 | 277,243 | ||||||
Canadian Natural Resources Ltd. | 7,268 | 271,605 | ||||||
Concho Resources, Inc.* | 2,884 | 270,375 | ||||||
Cabot Oil & Gas Corp. | 3,338 | 253,354 | ||||||
Equities Corp. | 4,576 | 250,719 | ||||||
Talisman Energy, Inc. | 18,831 | 240,095 | ||||||
Nexen, Inc. | 15,016 | 238,905 | ||||||
Encana Corp. | 12,759 | 236,424 | ||||||
Penn West Petroleum Ltd. | 10,926 | 216,335 | ||||||
Denbury Resources, Inc.* | 13,891 | 209,754 | ||||||
Whiting Petroleum Corp.* | 4,475 | 208,938 | ||||||
Plains Exploration & Production Co.* | 5,625 | 206,550 | ||||||
QEP Resources, Inc. | 6,792 | 199,006 | ||||||
Cimarex Energy Co. | 3,182 | 196,966 | ||||||
Newfield Exploration Co.* | 5,165 | 194,875 | ||||||
SM Energy Co. | 2,664 | 194,738 | ||||||
CNOOC Ltd. ADR | 1,107 | 193,371 | ||||||
Ultra Petroleum Corp.* | 6,166 | 182,699 | ||||||
Energen Corp. | 3,429 | 171,450 | ||||||
Oasis Petroleum, Inc.* | 4,991 | 145,188 | ||||||
Energy XXI Bermuda Ltd.* | 4,428 | 141,165 | ||||||
Berry Petroleum Co. — Class A | 3,350 | 140,767 | ||||||
Kodiak Oil & Gas Corp.* | 14,810 | 140,695 | ||||||
Rosetta Resources, Inc.* | 3,210 | 139,635 | ||||||
EXCO Resources, Inc. | 12,699 | 132,705 | ||||||
McMoRan Exploration Co.* | 9,110 | 132,550 | ||||||
Forest Oil Corp.* | 7,576 | 102,655 | ||||||
|
| |||||||
Total Oil & Gas Exploration & Production | 9,228,464 | |||||||
|
| |||||||
INTEGRATED OIL & GAS - 27.7% |
| |||||||
Exxon Mobil Corp. | 21,109 | 1,789,199 | ||||||
Chevron Corp. | 11,962 | 1,272,757 | ||||||
ConocoPhillips | 11,861 | 864,311 | ||||||
Occidental Petroleum Corp. | 8,325 | 780,052 | ||||||
Petroleo Brasileiro S.A. ADR | 16,562 | 411,566 | ||||||
Hess Corp. | 6,931 | 393,681 | ||||||
BP plc ADR | 7,914 | 338,244 | ||||||
Suncor Energy, Inc. | 10,732 | 309,404 | ||||||
Murphy Oil Corp. | 5,367 | 299,157 | ||||||
Total S.A. ADR | 5,657 | 289,129 | ||||||
Royal Dutch Shell plc ADR | 3,927 | 287,024 | ||||||
PetroChina Company Ltd. ADR | 1,839 | 228,606 | ||||||
Statoil ASA ADR | 8,430 | 215,892 | ||||||
Cenovus Energy, Inc. | 6,465 | 214,638 | ||||||
ENI SpA ADR | 5,020 | 207,175 | ||||||
SandRidge Energy, Inc.* | 20,695 | 168,871 | ||||||
|
| |||||||
Total Integrated Oil & Gas | 8,069,706 | |||||||
|
| |||||||
OIL & GAS EQUIPMENT & SERVICES - 18.0% |
| |||||||
Schlumberger Ltd. | 11,862 | 810,293 | ||||||
Halliburton Co. | 14,718 | 507,918 | ||||||
National Oilwell Varco, Inc. | 6,910 | 469,811 | ||||||
Baker Hughes, Inc. | 8,458 | 411,397 | ||||||
FMC Technologies, Inc.* | 6,192 | 323,408 | ||||||
Cameron International Corp.* | 6,309 | 310,340 | ||||||
Weatherford International Ltd.* | 20,319 | 297,470 | ||||||
Tenaris S.A. ADR | 6,126 | 227,765 | ||||||
Core Laboratories N.V. | 1,828 | 208,301 | ||||||
Oceaneering International, Inc. | 4,256 | 196,329 | ||||||
Oil States International, Inc.* | 2,353 | 179,699 | ||||||
Dresser-Rand Group, Inc.* | 3,285 | 163,954 | ||||||
McDermott International, Inc.* | 12,880 | 148,249 | ||||||
Complete Production | ||||||||
Services, Inc.* | 4,373 | 146,758 | ||||||
Dril-Quip, Inc.* | 2,152 | 141,645 | ||||||
Key Energy Services, Inc.* | 9,140 | 141,396 | ||||||
Tidewater, Inc. | 2,840 | 140,012 | ||||||
Superior Energy Services, Inc.* | 4,792 | 136,284 | ||||||
CARBO Ceramics, Inc. | 1,078 | 132,950 | ||||||
Lufkin Industries, Inc. | 1,870 | 125,870 | ||||||
|
| |||||||
Total Oil & Gas Equipment & Services |
| 5,219,849 | ||||||
|
| |||||||
OIL & GAS DRILLING - 7.8% |
| |||||||
Seadrill Ltd. | 10,211 | 338,801 | ||||||
Transocean Ltd. | 8,259 | 317,063 | ||||||
Ensco plc ADR | 5,219 | 244,875 | ||||||
Diamond Offshore Drilling, Inc. | 4,364 | 241,155 | ||||||
Noble Corp.* | 7,934 | 239,765 | ||||||
Helmerich & Payne, Inc. | 3,845 | 224,394 | ||||||
Nabors Industries Ltd.* | 11,214 | 194,451 | ||||||
Rowan Companies, Inc.* | 5,605 | 170,000 | ||||||
Patterson-UTI Energy, Inc. | 7,990 | 159,640 | ||||||
Atwood Oceanics, Inc.* | 3,576 | 142,289 | ||||||
|
| |||||||
Total Oil & Gas Drilling | 2,272,433 | |||||||
|
| |||||||
| 42 | THE RYDEX FUNDSANNUALREPORT | See Notes to Financial Statements. |
| SCHEDULE OF INVESTMENTS (concluded) | December 31, 2011 | |
| ENERGY FUND |
| SHARES | VALUE | |||||||
OIL & GAS STORAGE & TRANSPORTATION - 6.4% |
| |||||||
Kinder Morgan, Inc. | 14,200 | $ | 456,814 | |||||
El Paso Corp. | 15,172 | 403,120 | ||||||
Spectra Energy Corp. | 12,827 | 394,430 | ||||||
Williams Companies, Inc. | 11,797 | 389,537 | ||||||
Southern Union Co. | 4,799 | 202,086 | ||||||
|
| |||||||
Total Oil & Gas Storage & Transportation | 1,845,987 | |||||||
|
| |||||||
OIL & GAS REFINING & MARKETING - 4.4% |
| |||||||
Valero Energy Corp. | 14,216 | 299,247 | ||||||
Marathon Petroleum Corp. | 8,897 | 296,181 | ||||||
HollyFrontier Corp. | 8,604 | 201,334 | ||||||
Sunoco, Inc. | 4,648 | 190,661 | ||||||
Tesoro Corp.* | 6,964 | 162,679 | ||||||
World Fuel Services Corp. | 3,601 | 151,170 | ||||||
|
| |||||||
Total Oil & Gas Refining & Marketing | 1,301,272 | |||||||
|
| |||||||
COAL & CONSUMABLE FUELS - 3.6% |
| |||||||
Peabody Energy Corp. | 7,925 | 262,397 | ||||||
Consol Energy, Inc. | 6,938 | 254,625 | ||||||
Cameco Corp. | 11,865 | 214,163 | ||||||
Alpha Natural Resources, Inc.* | 9,260 | 189,182 | ||||||
Arch Coal, Inc. | 10,444 | 151,542 | ||||||
|
| |||||||
Total Coal & Consumable Fuels | 1,071,909 | |||||||
|
| |||||||
Total Common Stocks | ||||||||
(Cost $ 17,099,947) | 29,009,620 | |||||||
|
| |||||||
| FACE AMOUNT | ||||||||
REPURCHASE AGREEMENT††,1 - 0.2% |
| |||||||
Credit Suisse Group issued 12/30/11 at 0.00% due 01/03/12 | $ | 53,047 | 53,047 | |||||
|
| |||||||
Total Repurchase Agreement | ||||||||
(Cost $ 53,047) | 53,047 | |||||||
|
| |||||||
Total Investments – 99.9% | ||||||||
(Cost $ 17,152,994) | $ | 29,062,667 | ||||||
|
| |||||||
Other Assets, Less Liabilities – 0.1% | 22,567 | |||||||
|
| |||||||
Total Net Assets – 100.0% | $ | 29,085,234 | ||||||
|
| |||||||
| * | Non-income producing security. |
| † | Value determined based on Level 1 inputs — See Note 4. |
| †† | Value determined based on Level 2 inputs — See Note 4. |
| 1 | Repurchase Agreement — See Note 5. |
| ADR | — American Depositary Receipt |
| plc | — Public Limited Company |
| See Notes to Financial Statements. | THE RYDEX FUNDSANNUALREPORT | 43 |
ENERGY FUND
STATEMENT OF ASSETS AND LIABILITIES
December 31, 2011
ASSETS: | ||||
Investments, at value | $ | 29,009,620 | ||
Repurchase agreements, at value | ||||
(cost $ 53,047) | 53,047 | |||
|
| |||
Total Investments | 29,062,667 | |||
Receivables: | ||||
Securities sold | 612,506 | |||
Dividends | 21,382 | |||
Fund shares sold | 3,732 | |||
Foreign taxes reclaim | 775 | |||
|
| |||
Total assets | 29,701,062 | |||
|
| |||
LIABILITIES: | ||||
Payable for: | ||||
Fund shares redeemed | 513,390 | |||
Management fees | 20,715 | |||
Transfer agent and administrative fees | 6,093 | |||
Investor service fees | 6,093 | |||
Portfolio accounting fees | 2,437 | |||
Miscellaneous | 67,100 | |||
|
| |||
Total liabilities | 615,828 | |||
|
| |||
NET ASSETS | $ | 29,085,234 | ||
|
| |||
NET ASSETS CONSISTOF: | ||||
Paid in capital | $ | 18,284,576 | ||
Undistributed net investment income | — | |||
Accumulated net realized loss on investments | (1,109,015 | ) | ||
Net unrealized appreciation on investments | 11,909,673 | |||
|
| |||
Net assets | $ | 29,085,234 | ||
|
| |||
Capital shares outstanding | 994,699 | |||
Net asset value per share | $ | 29.24 | ||
|
| |||
STATEMENT OF OPERATIONS
Year Ended December 31, 2011
INVESTMENT INCOME: | ||||
Dividends (net of foreign withholding tax of $ 14,239) | $ | 581,875 | ||
Interest | 86 | |||
|
| |||
Total investment income | 581,961 | |||
|
| |||
EXPENSES: | ||||
Management fees | 356,598 | |||
Transfer agent and administrative fees | 104,882 | |||
Investor service fees | 104,882 | |||
Portfolio accounting fees | 41,952 | |||
Custodian fees | 10,738 | |||
Trustees’ fees* | 4,197 | |||
Miscellaneous | 94,002 | |||
|
| |||
Total expenses | 717,251 | |||
|
| |||
Net investment loss | (135,290 | ) | ||
|
| |||
NET REALIZEDAND UNREALIZED GAIN (LOSS): | ||||
Net realized gain (loss) on: | ||||
Investments | 2,854,215 | |||
|
| |||
Net realized gain | 2,854,215 | |||
|
| |||
Net change in unrealized appreciation (depreciation) on: | ||||
Investments | (5,949,151 | ) | ||
|
| |||
Net change in unrealized appreciation (depreciation) | (5,949,151 | ) | ||
|
| |||
Net realized and unrealized loss | (3,094,936 | ) | ||
|
| |||
Net decrease in net assets resulting from operations | $ | (3,230,226 | ) | |
|
|
| * | Relates to Trustees not deemed “interested persons” within the meaning of Section 2(a)(19) of the 1940 Act. |
| 44 | THE RYDEX FUNDSANNUALREPORT | See Notes to Financial Statements. |
ENERGY FUND
STATEMENTS OF CHANGES IN NET ASSETS
| Year Ended December 31, 2011 | Year Ended December 31, 2010 | |||||||
INCREASE (DECREASE) IN NET ASSETS FROM OPERATIONS: | ||||||||
Net investment loss | $ | (135,290 | ) | $ | (68,475 | ) | ||
Net realized gain on investments | 2,854,215 | 2,318,529 | ||||||
Net change in unrealized appreciation (depreciation) on investments | (5,949,151 | ) | 2,393,456 | |||||
|
|
|
| |||||
Net increase (decrease) in net assets resulting from operations | (3,230,226 | ) | 4,643,510 | |||||
|
|
|
| |||||
DISTRIBUTIONSTOSHAREHOLDERSFROM: | ||||||||
Net investment income | — | (171,009 | ) | |||||
Net realized gains | (185,047 | ) | — | |||||
|
|
|
| |||||
Total distributions to shareholders | (185,047 | ) | (171,009 | ) | ||||
|
|
|
| |||||
CAPITALSHARETRANSACTIONS: | ||||||||
Proceeds from sale of shares | 105,623,486 | 88,163,634 | ||||||
Distributions reinvested | 185,047 | 171,009 | ||||||
Cost of shares redeemed | (115,720,648 | ) | (89,747,360 | ) | ||||
|
|
|
| |||||
Net decrease from capital share transactions | (9,912,115 | ) | (1,412,717 | ) | ||||
|
|
|
| |||||
Net increase (decrease) in net assets | (13,327,388 | ) | 3,059,784 | |||||
NETASSETS: | ||||||||
Beginning of year | 42,412,622 | 39,352,838 | ||||||
|
|
|
| |||||
End of year | $ | 29,085,234 | $ | 42,412,622 | ||||
|
|
|
| |||||
Undistributed net investment income at end of year | $ | — | $ | — | ||||
|
|
|
| |||||
CAPITALSHAREACTIVITY: | ||||||||
Shares sold | 3,266,516 | 3,291,280 | ||||||
Shares issued from reinvestment of distributions | 6,036 | 5,981 | ||||||
Shares redeemed | (3,635,324 | ) | (3,432,168 | ) | ||||
|
|
|
| |||||
Net decrease in shares | (362,772 | ) | (134,907 | ) | ||||
|
|
|
| |||||
| See Notes to Financial Statements. | THE RYDEX FUNDSANNUALREPORT | 45 |
ENERGY FUND
FINANCIAL HIGHLIGHTS
This table is presented to show selected data for a share outstanding throughout each period and to assist shareholders in evaluating a Fund’s performance for the periods presented.
| Year Ended December 31, 2011 | Year Ended December 31, 2010 | Year Ended December 31, 2009 | Year Ended December 31, 2008 | Year Ended December 31, 2007 | ||||||||||||||||
Per Share Data | ||||||||||||||||||||
Net asset value, beginning of period | $ | 31.24 | $ | 26.37 | $ | 20.49 | $ | 39.83 | $ | 33.14 | ||||||||||
|
|
|
|
|
|
|
|
|
| |||||||||||
Income (loss) from investment operations: | ||||||||||||||||||||
Net investment income (loss)a | (.10 | ) | (.05 | ) | .11 | (.03 | ) | (.11 | ) | |||||||||||
Net gain (loss) on investments (realized and unrealized) | (1.72 | ) | 5.06 | 7.73 | (18.29 | ) | 11.01 | |||||||||||||
|
|
|
|
|
|
|
|
|
| |||||||||||
Total from investment operations | (1.82 | ) | 5.01 | 7.84 | (18.32 | ) | 10.90 | |||||||||||||
|
|
|
|
|
|
|
|
|
| |||||||||||
Less distributions from: | ||||||||||||||||||||
Net investment income | — | (.14 | ) | — | — | — | ||||||||||||||
Net realized gains | (.18 | ) | — | (1.96 | ) | (1.02 | ) | (4.21 | ) | |||||||||||
|
|
|
|
|
|
|
|
|
| |||||||||||
Total distributions | (.18 | ) | (.14 | ) | (1.96 | ) | (1.02 | ) | (4.21 | ) | ||||||||||
|
|
|
|
|
|
|
|
|
| |||||||||||
Net asset value, end of period | $ | 29.24 | $ | 31.24 | $ | 26.37 | $ | 20.49 | $ | 39.83 | ||||||||||
|
|
|
|
|
|
|
|
|
| |||||||||||
Total Returnb | (5.85 | %) | 19.05 | % | 38.50 | % | (46.03 | %) | 33.22 | % | ||||||||||
|
|
|
|
|
|
|
|
|
| |||||||||||
Ratios/Supplemental Data | ||||||||||||||||||||
Net assets, end of period (in thousands) | $ | 29,085 | $ | 42,413 | $ | 39,353 | $ | 30,843 | $ | 101,458 | ||||||||||
|
|
|
|
|
|
|
|
|
| |||||||||||
Ratios to average net assets: | ||||||||||||||||||||
Net investment income (loss) | (0.32 | %) | (0.20 | %) | 0.48 | % | (0.08 | %) | (0.27 | %) | ||||||||||
Total expenses | 1.71 | % | 1.65 | % | 1.65 | % | 1.60 | % | 1.58 | % | ||||||||||
|
|
|
|
|
|
|
|
|
| |||||||||||
Portfolio turnover rate | 197 | % | 224 | % | 206 | % | 154 | % | 217 | % | ||||||||||
| a | Net investment income (loss) per share was computed using average shares outstanding throughout the period. |
| b | Total return does not reflect the impact of any additional fees charged by insurance companies and has not been annualized. |
| 46 | THE RYDEX FUNDSANNUALREPORT | See Notes to Financial Statements. |
This page intentionally left blank.
| THE RYDEX FUNDSANNUALREPORT | 47 |
| PERFORMANCE REPORT AND FUND PROFILE (Unaudited) | December 31, 2011 |
OBJECTIVE: Seeks to provide capital appreciation by investing in companies that are involved in the energy services field, including those that provide services and equipment in the areas of oil, coal, and gas exploration and production (“Energy Services Companies”).
Better growth expectations in high-demand countries like the U.S. and China pushed the price of oil higher in 2011—rising above $100 per barrel in the spring for the first time in more than two years after the Mid East uprisings, then falling abruptly after debt woes began to hamper expectations for economic growth. For the year, the price of a barrel of oil rose about 8%. The sector is expected to remain volatile as global political uncertainties affect supply and concerns remain about the strength of the global economy.
For the year ended December 31, 2011, Energy Services Fund returned -9.29%, compared with the S&P 500® Index*, which gained 2.11%. The energy equipment and services holdings in this Fund, which makes up 98% of the portfolio and typically are particularly sensitive to the price of oil, accounted for most of the Fund’s return for the period.
FMC Technologies, Inc., Oceaneering International, Inc. and Pride International were the Fund’s best-performing stocks for the year. The Fund’s worst-performing holdings included Transocean Ltd., Schlumberger Ltd. and Weatherford International Ltd.
| * | Standard & Poor’s 500 Index (S&P 500®) – a capitalization-weighted index covering 500 industrial, utility, transportation and financial companies of the U.S. markets (mostly NYSE Euronext issues). |
Performance displayed represents past performance which is no guarantee of future results.
Industry Diversification (Market Exposure as % of Net Assets)
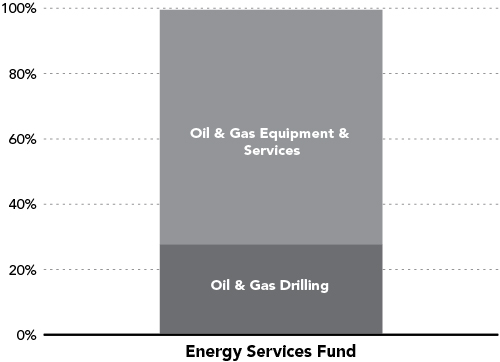
“Industry Diversification (Market Exposure as % of Net Assets)” excludes any temporary cash investments.
Inception Date: May 2, 2001
Ten Largest Holdings (% of Total Net Assets) | ||||
Schlumberger Ltd. | 9.4 | % | ||
Halliburton Co. | 5.9 | % | ||
National Oilwell Varco, Inc. | 5.3 | % | ||
Tenaris S.A. ADR | 4.8 | % | ||
Baker Hughes, Inc. | 4.6 | % | ||
Seadrill Ltd. | 3.9 | % | ||
FMC Technologies, Inc. | 3.6 | % | ||
Transocean Ltd. | 3.6 | % | ||
Cameron International Corp. | 3.5 | % | ||
Weatherford International Ltd. | 3.4 | % | ||
|
| |||
Top Ten Total | 48.0 | % | ||
|
| |||
“Ten Largest Holdings” exclude any temporary cash or derivative investments.
| 48 | THE RYDEX FUNDSANNUALREPORT |
| PERFORMANCE REPORT AND FUND PROFILE (Unaudited) (concluded) |
Cumulative Fund Performance*
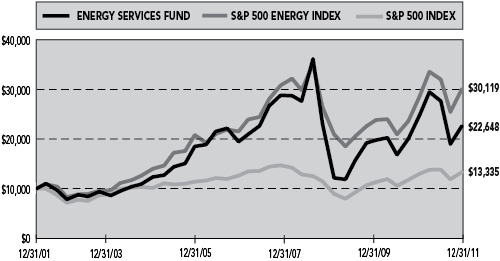
Average Annual Returns*
Periods Ended 12/31/11
| 1 Year | 5 Year | 10 Year | ||||||||||
Energy Services Fund | -9.29 | % | 1.54 | % | 8.52 | % | ||||||
|
|
|
|
|
| |||||||
S&P 500 Energy Index | 4.72 | % | 4.68 | % | 11.66 | % | ||||||
|
|
|
|
|
| |||||||
S&P 500 Index | 2.11 | % | -0.25 | % | 2.92 | % | ||||||
|
|
|
|
|
| |||||||
| * | The performance data represents past performance that is not predictive of future results. The investment return and principal value of an investment in the Fund will fluctuate so that an investor’s shares, when redeemed, may be worth more or less than their original cost. Returns are historical and include changes in principal and reinvested dividends and capital gains and do not reflect the effect of taxes. The S&P 500 Index and S&P 500 Energy Index are unmanaged indices and, unlike the Fund, have no management fees or operating expenses to reduce their reported returns. Returns do not reflect the impact of any additional fees charged by insurance companies. |
| THE RYDEX FUNDSANNUALREPORT | 49 |
SCHEDULE OF INVESTMENTS | December 31, 2011 | |||
ENERGY SERVICES FUND
| SHARES | VALUE | |||||||
COMMON STOCKS† - 99.5% | ||||||||
OIL & GAS EQUIPMENT & SERVICES - 71.9% |
| |||||||
Schlumberger Ltd. | 28,267 | $ | 1,930,919 | |||||
Halliburton Co. | 35,045 | 1,209,403 | ||||||
National Oilwell Varco, Inc. | 16,067 | 1,092,395 | ||||||
Tenaris S.A. ADR | 26,659 | 991,182 | ||||||
Baker Hughes, Inc. | 19,665 | 956,506 | ||||||
FMC Technologies, Inc.* | 14,401 | 752,164 | ||||||
Cameron International Corp.* | 14,674 | 721,814 | ||||||
Weatherford International Ltd.* | 48,403 | 708,620 | ||||||
Core Laboratories N.V. | 4,166 | 474,716 | ||||||
Oceaneering International, Inc. | 9,904 | 456,871 | ||||||
Oil States International, Inc.* | 5,461 | 417,057 | ||||||
Dresser-Rand Group, Inc.* | 7,641 | 381,362 | ||||||
McDermott International, Inc.* | 30,688 | 353,219 | ||||||
Complete Production Services, Inc.* | 10,162 | 341,037 | ||||||
Key Energy Services, Inc.* | 21,349 | 330,269 | ||||||
Dril-Quip, Inc.* | 4,995 | 328,771 | ||||||
Tidewater, Inc. | 6,610 | 325,873 | ||||||
CARBO Ceramics, Inc. | 2,586 | 318,931 | ||||||
Superior Energy Services, Inc.* | 11,152 | 317,163 | ||||||
RPC, Inc. | 16,951 | 309,356 | ||||||
Lufkin Industries, Inc. | 4,257 | 286,539 | ||||||
SEACOR Holdings, Inc.* | 3,174 | 282,359 | ||||||
Bristow Group, Inc. | 5,769 | 273,393 | ||||||
Helix Energy Solutions Group, Inc.* | 16,612 | 262,470 | ||||||
Hornbeck Offshore Services, Inc.* | 6,632 | 205,725 | ||||||
ION Geophysical Corp.* | 32,188 | 197,312 | ||||||
Basic Energy Services, Inc.* | 9,913 | 195,286 | ||||||
Gulfmark Offshore, Inc. — Class A* | 3,740 | 157,117 | ||||||
Exterran Holdings, Inc.* | 12,913 | 117,508 | ||||||
Newpark Resources, Inc.* | 11,985 | 113,857 | ||||||
|
| |||||||
Total Oil & Gas Equipment & Services | 14,809,194 | |||||||
|
| |||||||
OIL & GAS DRILLING - 27.6% | ||||||||
Seadrill Ltd. | 24,319 | 806,904 | ||||||
Transocean Ltd. | 19,297 | 740,812 | ||||||
Ensco plc ADR | 14,010 | 657,349 | ||||||
Diamond Offshore Drilling, Inc. | 10,160 | 561,442 | ||||||
Noble Corp.* | 18,467 | 558,073 | ||||||
Helmerich & Payne, Inc. | 8,945 | 522,030 | ||||||
Nabors Industries Ltd.* | 26,725 | 463,411 | ||||||
Rowan Companies, Inc.* | 13,032 | 395,260 | ||||||
Patterson-UTI Energy, Inc. | 18,592 | 371,468 | ||||||
Atwood Oceanics, Inc.* | 8,340 | 331,849 | ||||||
Unit Corp.* | 6,643 | 308,235 | ||||||
|
| |||||||
Total Oil & Gas Drilling | 5,716,833 | |||||||
|
| |||||||
Total Common Stocks | 20,526,027 | |||||||
|
| |||||||
| FACE AMOUNT | ||||||||
REPURCHASE AGREEMENT††,1 - 0.8% |
| |||||||
Credit Suisse Group issued 12/30/11 at 0.00% due 01/03/12 | $ | 161,879 | 161,879 | |||||
|
| |||||||
Total Repurchase Agreement | 161,879 | |||||||
|
| |||||||
Total Investments – 100.3% | ||||||||
(Cost $10,598,437) | $ | 20,687,906 | ||||||
|
| |||||||
Liabilities & Other Assets - (0.3)% | (61,082 | ) | ||||||
|
| |||||||
Total Net Assets – 100.0% | $ | 20,626,824 | ||||||
| * | Non-income producing security. |
| † | Value determined based on Level 1 inputs — See Note 4. |
| †† | Value determined based on Level 2 inputs — See Note 4. |
| 1 | Repurchase Agreement — See Note 5. |
| ADR — American Depositary Receipt |
| plc — Public Limited Company |
| 50 | THE RYDEX FUNDSANNUALREPORT | See Notes to Financial Statements. |
ENERGY SERVICES FUND
STATEMENT OF ASSETS AND LIABILITIES
December 31, 2011
ASSETS: | ||||
Investments, at value | $ | 20,526,027 | ||
Repurchase agreements, at value | 161,879 | |||
|
| |||
Total Investments | 20,687,906 | |||
Receivables: | ||||
Fund shares sold | 744,958 | |||
Dividends | 7,120 | |||
|
| |||
Total assets | 21,439,984 | |||
|
| |||
LIABILITIES: | ||||
Payable for: | ||||
Securities purchased | 579,585 | |||
Fund shares redeemed | 149,860 | |||
Management fees | 15,040 | |||
Transfer agent and administrative fees | 4,423 | |||
Investor service fees | 4,423 | |||
Portfolio accounting fees | 1,770 | |||
Miscellaneous | 58,059 | |||
|
| |||
Total liabilities | 813,160 | |||
|
| |||
NET ASSETS | $ | 20,626,824 | ||
|
| |||
NET ASSETS CONSISTOF: | ||||
Paid in capital | $ | 11,539,499 | ||
Undistributed net investment income | — | |||
Accumulated net realized loss on investments | (1,002,144 | ) | ||
Net unrealized appreciation on investments | 10,089,469 | |||
|
| |||
Net assets | $ | 20,626,824 | ||
|
| |||
Capital shares outstanding | 927,913 | |||
Net asset value per share | $ | 22.23 | ||
|
| |||
STATEMENT OF OPERATIONS
Year Ended December 31, 2011
INVESTMENT INCOME: | ||||
Dividends (net of foreign withholding tax of $1,029) | $ | 359,614 | ||
Interest | 80 | |||
|
| |||
Total investment income | 359,694 | |||
|
| |||
EXPENSES: | ||||
Management fees | 304,631 | |||
Transfer agent and administrative fees | 89,597 | |||
Investor service fees | 89,597 | |||
Portfolio accounting fees | 35,839 | |||
Custodian fees | 9,016 | |||
Trustees’ fees* | 3,701 | |||
Miscellaneous | 80,618 | |||
|
| |||
Total expenses | 612,999 | |||
|
| |||
Net investment loss | (253,305 | ) | ||
|
| |||
NET REALIZEDAND UNREALIZED GAIN (LOSS): | ||||
Net realized gain (loss) on: | ||||
Investments | 3,067,467 | |||
|
| |||
Net realized gain | 3,067,467 | |||
|
| |||
Net change in unrealized appreciation | ||||
Investments | (7,053,096 | ) | ||
|
| |||
Net change in unrealized appreciation (depreciation) | (7,053,096 | ) | ||
|
| |||
Net realized and unrealized loss | (3,985,629 | ) | ||
|
| |||
Net decrease in net assets resulting from operations | $ | (4,238,934 | ) | |
|
| |||
| * | Relates to Trustees not deemed “interested persons” within the meaning of Section 2(a)(19) of the 1940 Act. |
| See Notes to Financial Statements. | THE RYDEX FUNDSANNUALREPORT | 51 |
ENERGY SERVICES FUND
STATEMENTS OF CHANGES IN NET ASSETS
| Year Ended December 31, 2011 | Year Ended December 31, 2010 | |||||||
INCREASE (DECREASE) IN NET ASSETS FROM OPERATIONS: | ||||||||
Net investment loss | $ | (253,305 | ) | $ | (206,473 | ) | ||
Net realized gain on investments | 3,067,467 | 5,650,800 | ||||||
Net change in unrealized appreciation (depreciation) on investments | (7,053,096 | ) | (1,061,538 | ) | ||||
|
|
|
| |||||
Net increase (decrease) in net assets resulting from operations | (4,238,934 | ) | 4,382,789 | |||||
|
|
|
| |||||
DISTRIBUTIONSTOSHAREHOLDERSFROM: | ||||||||
Net realized gains | (2,664,613 | ) | — | |||||
|
|
|
| |||||
Total distributions to shareholders | (2,664,613 | ) | — | |||||
|
|
|
| |||||
CAPITALSHARETRANSACTIONS: | ||||||||
Proceeds from sale of shares | 98,253,456 | 111,238,890 | ||||||
Distributions reinvested | 2,664,613 | — | ||||||
Cost of shares redeemed | (114,857,530 | ) | (115,652,133 | ) | ||||
|
|
|
| |||||
Net decrease from capital share transactions | (13,939,461 | ) | (4,413,243 | ) | ||||
|
|
|
| |||||
Net decrease in net assets | (20,843,008 | ) | (30,454 | ) | ||||
NETASSETS: | ||||||||
Beginning of year | 41,469,832 | 41,500,286 | ||||||
|
|
|
| |||||
End of year | $ | 20,626,824 | $ | 41,469,832 | ||||
|
|
|
| |||||
Undistributed net investment income at end of year | $ | — | $ | — | ||||
|
|
|
| |||||
CAPITALSHAREACTIVITY: | ||||||||
Shares sold | 3,453,798 | 4,873,240 | ||||||
Shares issued from reinvestment of distributions | 112,336 | — | ||||||
Shares redeemed | (4,136,421 | ) | (5,264,620 | ) | ||||
|
|
|
| |||||
Net decrease in shares | (570,287 | ) | (391,380 | ) | ||||
|
|
|
| |||||
| 52 | THE RYDEX FUNDSANNUALREPORT | See Notes to Financial Statements. |
ENERGY SERVICES FUND
FINANCIAL HIGHLIGHTS
This table is presented to show selected data for a share outstanding throughout each period and to assist shareholders in evaluating a Fund’s performance for the periods presented.
| Year Ended December 31, 2011 | Year Ended December 31, 2010 | Year Ended December 31, 2009 | Year Ended December 31, 2008 | Year Ended December 31, 2007 | ||||||||||||||||
Per Share Data | ||||||||||||||||||||
Net asset value, beginning of period | $ | 27.68 | $ | 21.96 | $ | 14.18 | $ | 38.67 | $ | 29.79 | ||||||||||
|
|
|
|
|
|
|
|
|
| |||||||||||
Income (loss) from investment operations: | ||||||||||||||||||||
Net investment lossa | (.20 | ) | (.15 | ) | (.06 | ) | (.28 | ) | (.34 | ) | ||||||||||
Net gain (loss) on investments (realized and unrealized) | (2.18 | ) | 5.87 | 8.89 | (21.79 | ) | 11.37 | |||||||||||||
|
|
|
|
|
|
|
|
|
| |||||||||||
Total from investment operations | (2.38 | ) | 5.72 | 8.83 | (22.07 | ) | 11.03 | |||||||||||||
|
|
|
|
|
|
|
|
|
| |||||||||||
Less distributions from: | ||||||||||||||||||||
Net realized gains | (3.07 | ) | — | (1.05 | ) | (2.42 | ) | (2.15 | ) | |||||||||||
|
|
|
|
|
|
|
|
|
| |||||||||||
Total distributions | (3.07 | ) | — | (1.05 | ) | (2.42 | ) | (2.15 | ) | |||||||||||
|
|
|
|
|
|
|
|
|
| |||||||||||
Net asset value, end of period | $ | 22.23 | $ | 27.68 | $ | 21.96 | $ | 14.18 | $ | 38.67 | ||||||||||
|
|
|
|
|
|
|
|
|
| |||||||||||
Total Returnb | (9.29 | %) | 26.05 | % | 62.42 | % | (57.60 | %) | 37.10 | % | ||||||||||
|
|
|
|
|
|
|
|
|
| |||||||||||
Ratios/Supplemental Data | ||||||||||||||||||||
Net assets, end of period (in thousands) | $ | 20,627 | $ | 41,470 | $ | 41,500 | $ | 21,598 | $ | 95,917 | ||||||||||
|
|
|
|
|
|
|
|
|
| |||||||||||
Ratios to average net assets: | ||||||||||||||||||||
Net investment loss | (0.71 | %) | (0.66 | %) | (0.30 | %) | (0.78 | %) | (0.91 | %) | ||||||||||
Total expenses | 1.71 | % | 1.65 | % | 1.65 | % | 1.60 | % | 1.58 | % | ||||||||||
|
|
|
|
|
|
|
|
|
| |||||||||||
Portfolio turnover rate | 199 | % | 307 | % | 247 | % | 122 | % | 193 | % | ||||||||||
| a | Net investment loss per share was computed using average shares outstanding throughout the period. |
| b | Total return does not reflect the impact of any additional fees charged by insurance companies and has not been annualized. |
| See Notes to Financial Statements. | THE RYDEX FUNDSANNUALREPORT | 53 |
| PERFORMANCE REPORT AND FUND PROFILE (Unaudited) | December 31, 2011 |
OBJECTIVE: Seeks to provide capital appreciation by investing in companies that are involved in the financial services sector (“Financial Services Companies”).
The Financials sector, like many others, experienced considerable volatility over 2011, mostly due to fears of contagion related to the troubles of European banks and that region’s sovereign debt crisis. In the U.S., investors in the sector are still cautious about the impact of housing issues, new regulations around proprietary trading and limits on credit card fees. Nonetheless, the U.S. economy is displaying resilience in surveys of employment, consumer credit and manufacturing, all of which are supporting growth in loan demand. Fears of the impact of lower interest rates and volatile equity markets have checked performance of some insurers, while capital market activity remains subdued. REITs have benefited from slow but steady economic growth and slowly improving fundamentals for U.S. commercial real estate.
For the year ended December 31, 2011, Financial Services Fund returned -14.92%, while the S&P 500® Index* gained 2.11% over the same period. In the sector, the capital markets industry was the largest detractor from return. The REITs industry was the main contributor to return.
Simon Property Group, Inc., Public Storage and Discover Financial Services contributed the most to Fund performance during the year. Bank of America Corp., Goldman Sachs Group, Inc. and Citigroup, Inc. detracted most from Fund performance for the period.
| * | Standard & Poor’s 500 Index (S&P 500®) – a capitalization-weighted index covering 500 industrial, utility, transportation and financial companies of the U.S. markets (mostly NYSE Euronext issues). |
Performance displayed represents past performance which is no guarantee of future results.
Industry Diversification (Market Exposure as % of Net Assets)
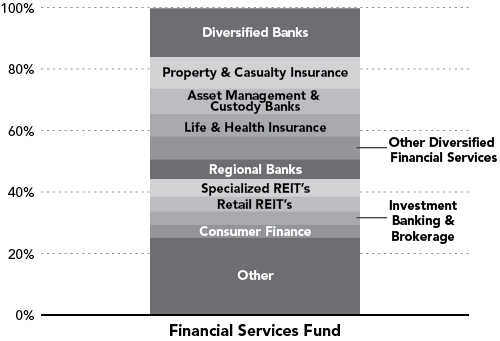
“Industry Diversification (Market Exposure as % of Net Assets)” excludes any temporary cash investments.
Inception Date: July 20, 2001
Ten Largest Holdings (% of Total Net Assets) | ||||
Berkshire Hathaway, Inc. — Class B | 3.2 | % | ||
Wells Fargo & Co. | 2.9 | % | ||
JPMorgan Chase & Co. | 2.7 | % | ||
Citigroup, Inc. | 2.0 | % | ||
Bank of America Corp. | 1.8 | % | ||
American Express Co. | 1.7 | % | ||
U.S. Bancorp | 1.7 | % | ||
American International Group, Inc. | 1.5 | % | ||
Goldman Sachs Group, Inc. | 1.5 | % | ||
Simon Property Group, Inc. | 1.5 | % | ||
|
| |||
Top Ten Total | 20.5 | % | ||
|
| |||
“Ten Largest Holdings” exclude any temporary cash or derivative investments.
| 54 | THE RYDEX FUNDSANNUALREPORT |
| PERFORMANCE REPORT AND FUND PROFILE (Unaudited) (concluded) | ||
Cumulative Fund Performance*
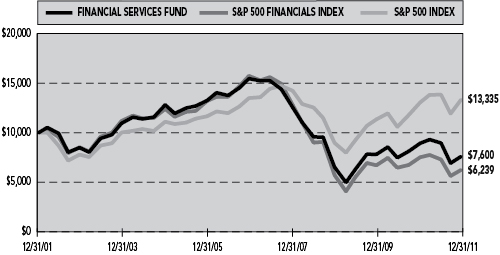
Average Annual Returns*
Periods Ended 12/31/11
| 1 Year | 5 Year | 10 Year | ||||||||||
Financial Services Fund | -14.92 | % | -13.25 | % | -2.71 | % | ||||||
|
|
|
|
|
| |||||||
S&P 500 Financials Index | -17.06 | % | -16.90 | % | -4.61 | % | ||||||
|
|
|
|
|
| |||||||
S&P 500 Index | 2.11 | % | -0.25 | % | 2.92 | % | ||||||
|
|
|
|
|
| |||||||
| * | The performance data represents past performance that is not predictive of future results. The investment return and principal value of an investment in the Fund will fluctuate so that an investor’s shares, when redeemed, may be worth more or less than their original cost. Returns are historical and include changes in principal and reinvested dividends and capital gains and do not reflect the effect of taxes. The S&P 500 Index and S&P 500 Financials Index are unmanaged indices and, unlike the Fund, have no management fees or operating expenses to reduce their reported returns. Returns do not reflect the impact of any additional fees charged by insurance companies. |
| THE RYDEX FUNDSANNUALREPORT | 55 |
| SCHEDULE OF INVESTMENTS | December 31, 2011 |
FINANCIAL SERVICES FUND
| SHARES | VALUE | |||||||
COMMON STOCKS† - 99.5% |
| |||||||
DIVERSIFIED BANKS - 15.8% |
| |||||||
Wells Fargo & Co. | 5,693 | $ | 156,899 | |||||
U.S. Bancorp | 3,423 | 92,592 | ||||||
Itau Unibanco Holding S.A. ADR | 3,053 | 56,664 | ||||||
Banco Bradesco S.A. ADR | 3,020 | 50,374 | ||||||
Royal Bank of Canada | 938 | 47,801 | ||||||
HSBC Holdings plc ADR | 1,243 | 47,358 | ||||||
ICICI Bank Ltd. ADR | 1,781 | 47,072 | ||||||
Toronto-Dominion Bank | 622 | 46,532 | ||||||
Bank of Montreal | 819 | 44,889 | ||||||
Credicorp Ltd. | 410 | 44,883 | ||||||
Banco Santander Brasil S.A. ADR | 5,410 | 44,037 | ||||||
Banco Santander S.A. ADR | 5,756 | 43,285 | ||||||
Barclays plc ADR | 3,902 | 42,883 | ||||||
HDFC Bank Ltd. ADR | 1,630 | 42,836 | ||||||
New York Community Bancorp, Inc. | 2,398 | 29,663 | ||||||
Comerica, Inc. | 1,120 | 28,896 | ||||||
|
| |||||||
Total Diversified Banks | 866,664 | |||||||
|
| |||||||
PROPERTY & CASUALTY INSURANCE - 10.3% |
| |||||||
Berkshire Hathaway, Inc. — Class B* | 2,287 | 174,498 | ||||||
Travelers Companies, Inc. | 1,084 | 64,140 | ||||||
ACE Ltd. | 884 | 61,986 | ||||||
Chubb Corp. | 815 | 56,414 | ||||||
Allstate Corp. | 1,759 | 48,214 | ||||||
Progressive Corp. | 2,329 | 45,439 | ||||||
XL Group plc - Class A | 1,622 | 32,067 | ||||||
Cincinnati Financial Corp. | 939 | 28,602 | ||||||
WR Berkley Corp. | 814 | 27,994 | ||||||
Axis Capital Holdings Ltd. | 830 | 26,527 | ||||||
|
| |||||||
Total Property & Casualty Insurance | 565,881 | |||||||
|
| |||||||
ASSET MANAGEMENT & CUSTODY BANKS - 8.3% |
| |||||||
BlackRock, Inc. — Class A | 409 | 72,900 | ||||||
Bank of New York Mellon Corp. | 3,223 | 64,170 | ||||||
Franklin Resources, Inc. | 603 | 57,924 | ||||||
State Street Corp. | 1,404 | 56,595 | ||||||
T. Rowe Price Group, Inc. | 860 | 48,977 | ||||||
Ameriprise Financial, Inc. | 901 | 44,726 | ||||||
Northern Trust Corp. | 993 | 39,382 | ||||||
Invesco Ltd. | 1,919 | 38,553 | ||||||
Affiliated Managers Group, Inc.* | 304 | 29,169 | ||||||
|
| |||||||
Total Asset Management & Custody Banks | 452,396 | |||||||
|
| |||||||
LIFE & HEALTH INSURANCE - 7.4% |
| |||||||
MetLife, Inc. | 2,347 | 73,180 | ||||||
Prudential Financial, Inc. | 1,275 | 63,903 | ||||||
Aflac, Inc. | 1,322 | 57,190 | ||||||
Manulife Financial Corp. | 4,118 | 43,733 | ||||||
China Life Insurance Company Ltd. ADR | 1,160 | 42,885 | ||||||
Principal Financial Group, Inc. | 1,447 | 35,596 | ||||||
Unum Group | 1,498 | 31,563 | ||||||
Lincoln National Corp. | 1,613 | 31,325 | ||||||
Torchmark Corp. | 612 | 26,555 | ||||||
|
| |||||||
Total Life & Health Insurance | 405,930 | |||||||
|
| |||||||
OTHER DIVERSIFIED FINANCIAL SERVICES - 7.3% |
| |||||||
JPMorgan Chase & Co. | 4,403 | 146,400 | ||||||
Citigroup, Inc. | 4,230 | 111,291 | ||||||
Bank of America Corp. | 17,563 | 97,650 | ||||||
ING Groep N.V. ADR* | 6,070 | 43,522 | ||||||
|
| |||||||
Total Other Diversified Financial Services | 398,863 | |||||||
|
| |||||||
REGIONAL BANKS - 6.4% | ||||||||
PNC Financial Services Group, Inc. | 1,249 | 72,030 | ||||||
BB&T Corp. | 2,195 | 55,248 | ||||||
Fifth Third Bancorp | 3,490 | 44,393 | ||||||
M&T Bank Corp. | 528 | 40,308 | ||||||
SunTrust Banks, Inc. | 2,270 | 40,179 | ||||||
KeyCorp | 4,619 | 35,520 | ||||||
CIT Group, Inc.* | 975 | 33,998 | ||||||
Huntington Bancshares, Inc. | 5,214 | 28,625 | ||||||
|
| |||||||
Total Regional Banks | 350,301 | |||||||
|
| |||||||
SPECIALIZED REIT’S - 5.8% | ||||||||
Public Storage | 475 | 63,869 | ||||||
HCP, Inc. | 1,311 | 54,315 | ||||||
Ventas, Inc. | 950 | 52,374 | ||||||
Health Care REIT, Inc. | 778 | 42,424 | ||||||
Host Hotels & Resorts, Inc. | 2,838 | 41,917 | ||||||
Plum Creek Timber Company, Inc. | 863 | 31,551 | ||||||
Rayonier, Inc. | 690 | 30,795 | ||||||
|
| |||||||
Total Specialized REIT’s | 317,245 | |||||||
|
| |||||||
RETAIL REIT’S - 4.7% | ||||||||
Simon Property Group, Inc. | 626 | 80,717 | ||||||
General Growth Properties, Inc. | 3,265 | 49,040 | ||||||
Macerich Co. | 662 | 33,497 | ||||||
Kimco Realty Corp. | 2,058 | 33,422 | ||||||
Federal Realty Investment Trust | 339 | 30,764 | ||||||
Realty Income Corp. | 795 | 27,793 | ||||||
|
| |||||||
Total Retail REIT’s | 255,233 | |||||||
|
| |||||||
INVESTMENT BANKING & BROKERAGE - 4.3% |
| |||||||
Goldman Sachs Group, Inc. | 922 | 83,377 | ||||||
Morgan Stanley | 4,595 | 69,522 | ||||||
Charles Schwab Corp. | 4,179 | 47,056 | ||||||
TD Ameritrade Holding Corp. | 2,354 | 36,840 | ||||||
|
| |||||||
Total Investment Banking & Brokerage | 236,795 | |||||||
|
| |||||||
| 56 | THE RYDEX FUNDSANNUALREPORT | See Notes to Financial Statements. |
| SCHEDULE OF INVESTMENTS (concluded) | December 31, 2011 | |
| FINANCIAL SERVICES FUND |
| SHARES | VALUE | |||||||
CONSUMER FINANCE - 4.2% |
| |||||||
American Express Co. | 1,980 | $ | 93,397 | |||||
Capital One Financial Corp. | 1,284 | 54,300 | ||||||
Discover Financial Services | 1,915 | 45,960 | ||||||
SLM Corp. | 2,525 | 33,835 | ||||||
|
| |||||||
Total Consumer Finance | 227,492 | |||||||
|
| |||||||
SPECIALIZED FINANCE - 3.7% |
| |||||||
CME Group, Inc. — Class A | 201 | 48,978 | ||||||
IntercontinentalExchange, Inc.* | 313 | 37,732 | ||||||
Moody’s Corp. | 1,025 | 34,522 | ||||||
NYSE Euronext | 1,237 | 32,286 | ||||||
NASDAQ OMX Group, Inc.* | 1,074 | 26,324 | ||||||
MSCI, Inc. — Class A* | 760 | 25,027 | ||||||
|
| |||||||
Total Specialized Finance | 204,869 | |||||||
|
| |||||||
RESIDENTIAL REIT’S - 3.4% |
| |||||||
Equity Residential | 945 | 53,893 | ||||||
AvalonBay Communities, Inc. | 358 | 46,755 | ||||||
UDR, Inc. | 1,230 | 30,873 | ||||||
Essex Property Trust, Inc. | 200 | 28,102 | ||||||
Camden Property Trust | 450 | 28,008 | ||||||
|
| |||||||
Total Residential REIT’s | 187,631 | |||||||
|
| |||||||
MULTI-LINE INSURANCE - 3.1% |
| |||||||
American International Group, Inc.* | 3,647 | 84,610 | ||||||
Loews Corp. | 1,299 | 48,907 | ||||||
Hartford Financial Services Group, Inc. | 2,125 | 34,531 | ||||||
|
| |||||||
Total Multi-Line Insurance | 168,048 | |||||||
|
| |||||||
OFFICE REIT’S - 2.6% |
| |||||||
Boston Properties, Inc. | 502 | 49,999 | ||||||
Digital Realty Trust, Inc. | 511 | 34,068 | ||||||
SL Green Realty Corp. | 466 | 31,054 | ||||||
Alexandria Real Estate Equities, Inc. | 397 | 27,381 | ||||||
|
| |||||||
Total Office REIT’s | 142,502 | |||||||
|
| |||||||
DIVERSIFIED CAPITAL MARKETS - 2.5% |
| |||||||
Deutsche Bank AG | 1,284 | 48,612 | ||||||
Credit Suisse Group AG ADR | 1,888 | 44,330 | ||||||
UBS AG* | 3,681 | 43,546 | ||||||
|
| |||||||
Total Diversified Capital Markets | 136,488 | |||||||
|
| |||||||
INSURANCE BROKERS - 1.9% |
| |||||||
Marsh & McLennan Companies, Inc. | 1,683 | 53,217 | ||||||
Aon Corp. | 1,073 | 50,216 | ||||||
|
| |||||||
Total Insurance Brokers | 103,433 | |||||||
|
| |||||||
REINSURANCE - 1.5% |
| |||||||
Arch Capital Group Ltd.* | 770 | 28,667 | ||||||
Everest Re Group Ltd. | 328 | 27,582 | ||||||
PartnerRe Ltd. | 415 | 26,647 | ||||||
|
| |||||||
Total Reinsurance | 82,896 | |||||||
|
| |||||||
MORTGAGE REIT’S - 1.5% |
| |||||||
Annaly Capital Management, Inc. | 3,077 | 49,109 | ||||||
American Capital Agency Corp. | 1,118 | 31,393 | ||||||
|
| |||||||
Total Mortgage REIT’s | 80,502 | |||||||
|
| |||||||
DIVERSIFIED REIT’S - 0.9% |
| |||||||
Vornado Realty Trust | 643 | 49,421 | ||||||
|
| |||||||
INDUSTRIAL REIT’S - 0.9% |
| |||||||
ProLogis, Inc. | 1,656 | 47,345 | ||||||
|
| |||||||
FOREST PRODUCTS - 0.8% |
| |||||||
Weyerhaeuser Co. | 2,287 | 42,698 | ||||||
|
| |||||||
REAL ESTATE OPERATING COMPANIES - 0.7% |
| |||||||
Brookfield Office Properties, Inc. | 2,300 | 35,972 | ||||||
|
| |||||||
MULTI-SECTOR HOLDINGS - 0.5% |
| |||||||
Leucadia National Corp. | 1,319 | 29,994 | ||||||
|
| |||||||
REAL ESTATE SERVICES - 0.5% |
| |||||||
CBRE Group, Inc. — Class A* | 1,865 | 28,385 | ||||||
|
| |||||||
THRIFTS & MORTGAGE FINANCE - 0.5% |
| |||||||
People’s United Financial, Inc. | 2,122 | 27,268 | ||||||
|
| |||||||
Total Common Stocks | 5,444,252 | |||||||
|
| |||||||
| FACE | ||||||||
| AMOUNT | ||||||||
REPURCHASE AGREEMENT††,1 - 0.5% |
| |||||||
Credit Suisse Group issued 12/30/11 at 0.00% due 01/03/12 | $ | 25,773 | 25,773 | |||||
|
| |||||||
Total Repurchase Agreement | 25,773 | |||||||
|
| |||||||
Total Investments - 100.0% | $ | 5,470,025 | ||||||
|
| |||||||
Liabilities, Less Cash & Other Assets – 0.0% | (1,279 | ) | ||||||
|
| |||||||
Total Net Assets – 100.0% | $ | 5,468,746 | ||||||
| * | Non-income producing security. |
| † | Value determined based on Level 1 inputs — See Note 4. |
| †† | Value determined based on Level 2 inputs — See Note 4. |
| 1 | Repurchase Agreement — See Note 5. |
| ADR | — American Depositary Receipt |
| plc | — Public Limited Company |
| REIT | — Real Estate Investment Trust |
| See Notes to Financial Statements. | THE RYDEX FUNDSANNUALREPORT | 57 |
FINANCIAL SERVICES FUND
STATEMENT OF ASSETS AND LIABILITIES
December 31, 2011
ASSETS: | ||||
Investments, at value | $ | 5,444,252 | ||
Repurchase agreements, at value | 25,773 | |||
|
| |||
Total Investments | 5,470,025 | |||
Cash | 15,120 | |||
Receivables: | ||||
Fund shares sold | 223,280 | |||
Dividends | 12,231 | |||
Foreign taxes reclaim | 100 | |||
|
| |||
Total assets | 5,720,756 | |||
|
| |||
LIABILITIES: | ||||
Payable for: | ||||
Securities purchased | 235,227 | |||
Management fees | 3,449 | |||
Transfer agent and administrative fees | 1,015 | |||
Investor service fees | 1,015 | |||
Portfolio accounting fees | 406 | |||
Fund shares redeemed | 278 | |||
Miscellaneous | 10,620 | |||
|
| |||
Total liabilities | 252,010 | |||
|
| |||
NETASSETS | $ | 5,468,746 | ||
|
| |||
NETASSETSCONSISTOF: | ||||
Paid in capital | $ | 13,015,181 | ||
Undistributed net investment income | 16,526 | |||
Accumulated net realized loss on investments | (8,580,584 | ) | ||
Net unrealized appreciation on investments | 1,017,623 | |||
|
| |||
Net assets | $ | 5,468,746 | ||
|
| |||
Capital shares outstanding | 423,591 | |||
Net asset value per share | $ | 12.91 | ||
|
|
STATEMENT OF OPERATIONS
Year Ended December 31, 2011
INVESTMENT INCOME: | ||||
Dividends | $ | 126,463 | ||
Interest | 15 | |||
|
| |||
Total investment income | 126,478 | |||
|
| |||
EXPENSES: | ||||
Management fees | 54,640 | |||
Transfer agent and administrative fees | 16,070 | |||
Investor service fees | 16,070 | |||
Portfolio accounting fees | 6,428 | |||
Custodian fees | 1,595 | |||
Trustees’ fees* | 677 | |||
Miscellaneous | 14,471 | |||
|
| |||
Total expenses | 109,951 | |||
|
| |||
Net investment income | 16,527 | |||
|
| |||
NET REALIZEDAND UNREALIZED GAIN (LOSS): | ||||
Net realized gain (loss) on: | ||||
Investments | 1,183,704 | |||
|
| |||
Net realized gain | 1,183,704 | |||
|
| |||
Net change in unrealized appreciation (depreciation) on: | ||||
Investments | (1,829,377 | ) | ||
|
| |||
Net change in unrealized appreciation (depreciation) | (1,829,377 | ) | ||
|
| |||
Net realized and unrealized loss | (645,673 | ) | ||
|
| |||
Net decrease in net assets resulting from operations | $ | (629,146 | ) | |
|
| |||
| * | Relates to Trustees not deemed “interested persons” within the meaning of Section 2(a)(19) of the 1940 Act. |
| 58 | THE RYDEX FUNDSANNUALREPORT | See Notes to Financial Statements. |
FINANCIAL SERVICES FUND
STATEMENTS OF CHANGES IN NET ASSETS
| Year | Year | |||||||
| Ended | Ended | |||||||
| December 31, | December 31, | |||||||
| 2011 | 2010 | |||||||
INCREASE (DECREASE) IN NET ASSETS FROM OPERATIONS: | ||||||||
Net investment income | $ | 16,527 | $ | 9,373 | ||||
Net realized gain on investments | 1,183,704 | 1,334,873 | ||||||
Net change in unrealized appreciation (depreciation) on investments | (1,829,377 | ) | (1,424,557 | ) | ||||
|
|
|
| |||||
Net decrease in net assets resulting from operations | (629,146 | ) | (80,311 | ) | ||||
|
|
|
| |||||
DISTRIBUTIONSTOSHAREHOLDERSFROM: | ||||||||
Net investment income | (4,742 | ) | (72,499 | ) | ||||
|
|
|
| |||||
Total distributions to shareholders | (4,742 | ) | (72,499 | ) | ||||
|
|
|
| |||||
CAPITALSHARETRANSACTIONS: | ||||||||
Proceeds from sale of shares | 37,530,772 | 74,034,490 | ||||||
Distributions reinvested | 4,742 | 72,499 | ||||||
Cost of shares redeemed | (39,328,618 | ) | (83,221,418 | ) | ||||
|
|
|
| |||||
Net decrease from capital share transactions | (1,793,104 | ) | (9,114,429 | ) | ||||
|
|
|
| |||||
Net decrease in net assets | (2,426,992 | ) | (9,267,239 | ) | ||||
NETASSETS: | ||||||||
Beginning of year | 7,895,738 | 17,162,977 | ||||||
|
|
|
| |||||
End of year | $ | 5,468,746 | $ | 7,895,738 | ||||
|
|
|
| |||||
Undistributed net investment income at end of year | $ | 16,526 | $ | 9,374 | ||||
|
|
|
| |||||
CAPITALSHAREACTIVITY: | ||||||||
Shares sold | 2,649,675 | 5,212,942 | ||||||
Shares issued from reinvestment of distributions | 367 | 5,038 | ||||||
Shares redeemed | (2,746,295 | ) | (5,974,984 | ) | ||||
|
|
|
| |||||
Net decrease in shares | (96,253 | ) | (757,004 | ) | ||||
|
|
|
| |||||
| See Notes to Financial Statements. | THE RYDEX FUNDSANNUALREPORT | 59 |
FINANCIAL SERVICES FUND
FINANCIAL HIGHLIGHTS
This table is presented to show selected data for a share outstanding throughout each period and to assist shareholders in evaluating a Fund’s performance for the periods presented.
| Year Ended | Year Ended | Year Ended | Year Ended | Year Ended | ||||||||||||||||
| December 31, | December 31, | December 31, | December 31, | December 31, | ||||||||||||||||
| 2011 | 2010 | 2009 | 2008 | 2007 | ||||||||||||||||
Per Share Data | ||||||||||||||||||||
Net asset value, beginning of period | $ | 15.19 | $ | 13.44 | $ | 11.41 | $ | 21.96 | $ | 32.18 | ||||||||||
|
|
|
|
|
|
|
|
|
| |||||||||||
Income (loss) from investment operations: | ||||||||||||||||||||
Net investment incomea | .04 | .01 | .06 | .32 | .28 | |||||||||||||||
Net gain (loss) on investments (realized and unrealized) | (2.31 | ) | 1.91 | 2.19 | (10.87 | ) | (6.23 | ) | ||||||||||||
|
|
|
|
|
|
|
|
|
| |||||||||||
Total from investment operations | (2.27 | ) | 1.92 | 2.25 | (10.55 | ) | (5.95 | ) | ||||||||||||
|
|
|
|
|
|
|
|
|
| |||||||||||
Less distributions from: | ||||||||||||||||||||
Net investment income | (.01 | ) | (.17 | ) | (.22 | ) | — | (.66 | ) | |||||||||||
Net realized gains | — | — | — | — | (3.61 | ) | ||||||||||||||
|
|
|
|
|
|
|
|
|
| |||||||||||
Total distributions | (.01 | ) | (.17 | ) | (.22 | ) | — | (4.27 | ) | |||||||||||
|
|
|
|
|
|
|
|
|
| |||||||||||
Net asset value, end of period | $ | 12.91 | $ | 15.19 | $ | 13.44 | $ | 11.41 | $ | 21.96 | ||||||||||
|
|
|
|
|
|
|
|
|
| |||||||||||
Total Returnb | (14.92 | %) | 14.36 | % | 19.68 | % | (48.04 | %) | (18.80 | %) | ||||||||||
|
|
|
|
|
|
|
|
|
| |||||||||||
Ratios/Supplemental Data | ||||||||||||||||||||
Net assets, end of period (in thousands) | $ | 5,469 | $ | 7,896 | $ | 17,163 | $ | 8,307 | $ | 17,508 | ||||||||||
|
|
|
|
|
|
|
|
|
| |||||||||||
Ratios to average net assets: | ||||||||||||||||||||
Net investment income | 0.26 | % | 0.09 | % | 0.54 | % | 1.87 | % | 0.90 | % | ||||||||||
Total expenses | 1.71 | % | 1.64 | % | 1.64 | % | 1.61 | % | 1.59 | % | ||||||||||
|
|
|
|
|
|
|
|
|
| |||||||||||
Portfolio turnover rate | 528 | % | 617 | % | 357 | % | 422 | % | 525 | % | ||||||||||
| a | Net investment income per share was computed using average shares outstanding throughout the period. |
| b | Total return does not reflect the impact of any additional fees charged by insurance companies and has not been annualized. |
| 60 | THE RYDEX FUNDSANNUALREPORT | See Notes to Financial Statements. |
This page intentionally left blank.
| THE RYDEX FUNDSANNUALREPORT | 61 |
| PERFORMANCE REPORT AND FUND PROFILE (Unaudited) | December 31, 2011 |
OBJECTIVE: Seeks to provide capital appreciation by investing in companies that are involved in the health care industry (“Health Care Companies”).
Legislative and judicial action, or absence of it, in Washington continued to affect performance of the health care sector. Some of the more important coming events are possible deficit reduction, the Supreme Court’s review of the individual mandate, a key part of the 2010 health care law, and the 2012 presidential election. As a traditionally defensive sector, health care has benefited from concern over the strength of the U.S. and global recovery. It is also being supported by the solid balance sheets and growing dividends of many companies in the sector, as well as cash balances that could help increase the level of mergers and acquisitions.
For the year ended December 31, 2011, Health Care Fund rose 4.69%, compared with a 2.11% gain for the S&P 500® Index*.
The biggest positive contributors to Fund performance included pharmaceuticals and biotechnology. Life sciences tools industry was the largest detractor from Fund return.
The year’s top-performing holdings were Pfizer, Inc., Bristol-Myers Squibb Co. and UnitedHealth Group, Inc., while Human Genome Sciences, Inc., Dendreon Corp. and Hospira, Inc. were the Fund’s weakest performers for the period.
| * | Standard & Poor’s 500 Index (S&P 500®) – a capitalization-weighted index covering 500 industrial, utility, transportation and financial companies of the U.S. markets (mostly NYSE Euronext issues). |
Performance displayed represents past performance which is no guarantee of future results.
Industry Diversification (Market Exposure as % of Net Assets)
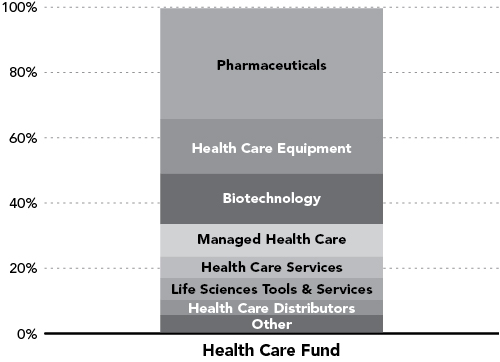
“Industry Diversification (Market Exposure as % of Net Assets)” excludes any temporary cash investments.
Inception Date: June 19, 2001 | ||
Ten Largest Holdings (% of Total Net Assets) | ||||
Johnson & Johnson | 4.1 | % | ||
Pfizer, Inc. | 4.0 | % | ||
Merck & Company, Inc. | 3.4 | % | ||
Abbott Laboratories | 2.9 | % | ||
Amgen, Inc. | 2.4 | % | ||
Bristol-Myers Squibb Co. | 2.4 | % | ||
UnitedHealth Group, Inc. | 2.3 | % | ||
Eli Lilly & Co. | 2.2 | % | ||
Medtronic, Inc. | 2.0 | % | ||
Teva Pharmaceutical Industries Ltd. ADR | 1.9 | % | ||
|
| |||
Top Ten Total | 27.6 | % | ||
|
| |||
“Ten Largest Holdings” exclude any temporary cash or derivative investments.
| 62 | THE RYDEX FUNDSANNUALREPORT |
PERFORMANCE REPORT AND FUND PROFILE (Unaudited) (concluded)
Cumulative Fund Performance*
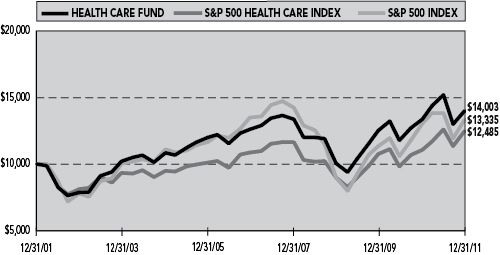
Average Annual Returns*
Periods Ended 12/31/11
| 1 Year | 5 Year | 10 Year | ||||||||||
Health Care Fund | 4.69 | % | 2.11 | % | 3.42 | % | ||||||
|
|
|
|
|
| |||||||
S&P 500 Health Care Index | 12.73 | % | 2.81 | % | 2.24 | % | ||||||
|
|
|
|
|
| |||||||
S&P 500 Index | 2.11 | % | -0.25 | % | 2.92 | % | ||||||
|
|
|
|
|
| |||||||
| * | The performance data represents past performance that is not predictive of future results. The investment return and principal value of an investment in the Fund will fluctuate so that an investor’s shares, when redeemed, may be worth more or less than their original cost. Returns are historical and include changes in principal and reinvested dividends and capital gains and do not reflect the effect of taxes. The S&P 500 Index and S&P 500 Health Care Index are unmanaged indices and, unlike the Fund, have no management fees or operating expenses to reduce their reported returns. Returns do not reflect the impact of any additional fees charged by insurance companies. |
| THE RYDEX FUNDSANNUALREPORT | 63 |
| SCHEDULE OF INVESTMENTS | December 31, 2011 | |
| HEALTH CARE FUND |
| SHARES | VALUE | |||||||
COMMON STOCKS† - 99.6% |
| |||||||
PHARMACEUTICALS - 33.9% |
| |||||||
Johnson & Johnson | 10,050 | $ | 659,079 | |||||
Pfizer, Inc. | 29,631 | 641,215 | ||||||
Merck & Company, Inc. | 14,154 | 533,606 | ||||||
Abbott Laboratories | 8,168 | 459,287 | ||||||
Bristol-Myers Squibb Co. | 10,917 | 384,715 | ||||||
Eli Lilly & Co. | 8,312 | 345,447 | ||||||
Teva Pharmaceutical Industries Ltd. ADR | 7,272 | 293,498 | ||||||
Allergan, Inc. | 2,949 | 258,745 | ||||||
Novartis AG ADR | 2,622 | 149,900 | ||||||
Mylan, Inc.* | 6,981 | 149,812 | ||||||
GlaxoSmithKline plc ADR | 3,225 | 147,157 | ||||||
Sanofi ADR | 4,012 | 146,598 | ||||||
Perrigo Co. | 1,486 | 144,588 | ||||||
Valeant Pharmaceuticals International, Inc.* | 3,044 | 142,124 | ||||||
Forest Laboratories, Inc.* | 4,617 | 139,710 | ||||||
AstraZeneca plc ADR | 2,939 | 136,046 | ||||||
Watson Pharmaceuticals, Inc.* | 2,195 | 132,446 | ||||||
Hospira, Inc.* | 3,706 | 112,551 | ||||||
Warner Chilcott plc — Class A* | 6,319 | 95,606 | ||||||
Endo Pharmaceuticals Holdings, Inc.* | 2,655 | 91,677 | ||||||
Salix Pharmaceuticals Ltd.* | 1,773 | 84,838 | ||||||
Questcor Pharmaceuticals, Inc.* | 1,850 | 76,923 | ||||||
Medicis Pharmaceutical Corp. — Class A | 2,130 | 70,823 | ||||||
|
| |||||||
Total Pharmaceuticals | 5,396,391 | |||||||
|
| |||||||
HEALTH CARE EQUIPMENT - 16.7% |
| |||||||
Medtronic, Inc. | 8,347 | 319,273 | ||||||
Baxter International, Inc. | 5,152 | 254,921 | ||||||
Covidien plc | 5,121 | 230,496 | ||||||
Stryker Corp. | 4,372 | 217,332 | ||||||
Intuitive Surgical, Inc.* | 459 | 212,522 | ||||||
Becton Dickinson and Co. | 2,622 | 195,916 | ||||||
Zimmer Holdings, Inc.* | 2,962 | 158,230 | ||||||
St. Jude Medical, Inc. | 4,610 | 158,123 | ||||||
Boston Scientific Corp.* | 25,560 | 136,490 | ||||||
Edwards Lifesciences Corp.* | 1,921 | 135,815 | ||||||
Varian Medical Systems, Inc.* | 1,997 | 134,059 | ||||||
CR Bard, Inc. | 1,538 | 131,499 | ||||||
CareFusion Corp.* | 4,640 | 117,902 | ||||||
Hologic, Inc.* | 6,060 | 106,111 | ||||||
ResMed, Inc.* | 3,748 | 95,199 | ||||||
MAKO Surgical Corp.* | 1,930 | 48,655 | ||||||
|
| |||||||
Total Health Care Equipment | 2,652,543 | |||||||
|
| |||||||
BIOTECHNOLOGY - 15.5% |
| |||||||
Amgen, Inc. | 6,026 | 386,929 | ||||||
Gilead Sciences, Inc.* | 6,667 | 272,880 | ||||||
Celgene Corp.* | 4,008 | 270,941 | ||||||
Biogen Idec, Inc.* | 2,284 | 251,354 | ||||||
Alexion Pharmaceuticals, Inc.* | 2,566 | 183,469 | ||||||
Pharmasset, Inc.* | 1,230 | 157,686 | ||||||
Vertex Pharmaceuticals, Inc.* | 4,051 | 134,534 | ||||||
Regeneron Pharmaceuticals, Inc.* | 2,010 | 111,414 | ||||||
BioMarin Pharmaceutical, Inc.* | 2,850 | 97,983 | ||||||
Onyx Pharmaceuticals, Inc.* | 1,980 | 87,021 | ||||||
United Therapeutics Corp.* | 1,806 | 85,334 | ||||||
Cubist Pharmaceuticals, Inc.* | 1,970 | 78,051 | ||||||
Cepheid, Inc.* | 2,150 | 73,982 | ||||||
Seattle Genetics, Inc.* | 4,040 | 67,529 | ||||||
Ariad Pharmaceuticals, Inc.* | 5,280 | 64,680 | ||||||
Human Genome Sciences, Inc.* | 8,038 | 59,401 | ||||||
Dendreon Corp.* | 6,940 | 52,744 | ||||||
InterMune, Inc.* | 2,830 | 35,658 | ||||||
|
| |||||||
Total Biotechnology | 2,471,590 | |||||||
|
| |||||||
MANAGED HEALTH CARE - 9.9% |
| |||||||
UnitedHealth Group, Inc. | 7,204 | 365,099 | ||||||
WellPoint, Inc. | 3,536 | 234,260 | ||||||
Aetna, Inc. | 4,627 | 195,213 | ||||||
Humana, Inc. | 2,089 | 183,017 | ||||||
Cigna Corp. | 3,959 | 166,278 | ||||||
Coventry Health Care, Inc.* | 3,298 | 100,160 | ||||||
Healthspring, Inc.* | 1,700 | 92,718 | ||||||
AMERIGROUP Corp.* | 1,450 | 85,666 | ||||||
Centene Corp.* | 1,820 | 72,054 | ||||||
WellCare Health Plans, Inc.* | 1,350 | 70,875 | ||||||
|
| |||||||
Total Managed Health Care | 1,565,340 | |||||||
|
| |||||||
HEALTH CARE SERVICES - 6.6% |
| |||||||
Express Scripts, Inc.* | 5,016 | 224,165 | ||||||
Medco Health Solutions, Inc.* | 4,006 | 223,935 | ||||||
Quest Diagnostics, Inc. | 2,579 | 149,737 | ||||||
Laboratory Corporation of America Holdings* | 1,681 | 144,516 | ||||||
DaVita, Inc.* | 1,730 | 131,151 | ||||||
Omnicare, Inc. | 2,848 | 98,114 | ||||||
HMS Holdings Corp.* | 2,520 | 80,590 | ||||||
|
| |||||||
Total Health Care Services | 1,052,208 | |||||||
|
| |||||||
LIFE SCIENCES TOOLS & SERVICES - 6.6% |
| |||||||
Thermo Fisher Scientific, Inc.* | 4,428 | 199,127 | ||||||
Agilent Technologies, Inc.* | 4,990 | 174,301 | ||||||
Life Technologies Corp.* | 3,320 | 129,181 | ||||||
Waters Corp.* | 1,688 | 124,996 | ||||||
Mettler-Toledo International, Inc.* | 700 | 103,397 | ||||||
Illumina, Inc.* | 3,360 | 102,413 | ||||||
Covance, Inc.* | 1,789 | 81,793 | ||||||
PerkinElmer, Inc. | 3,806 | 76,120 | ||||||
Charles River Laboratories International, Inc.* | 2,070 | 56,573 | ||||||
|
| |||||||
Total Life Sciences Tools & Services | 1,047,901 | |||||||
|
| |||||||
| 64 | THE RYDEX FUNDSANNUALREPORT | See Notes to Financial Statements. |
| SCHEDULE OF INVESTMENTS (concluded) | December 31, 2011 | |
| HEALTH CARE FUND |
| SHARES | VALUE | |||||||
HEALTH CARE DISTRIBUTORS - 4.7% |
| |||||||
McKesson Corp. | 2,674 | $ | 208,331 | |||||
Cardinal Health, Inc. | 4,443 | 180,430 | ||||||
AmerisourceBergen Corp. - Class A | 4,110 | 152,851 | ||||||
Henry Schein, Inc.* | 1,840 | 118,551 | ||||||
Patterson Companies, Inc. | 2,997 | 88,471 | ||||||
|
| |||||||
Total Health Care Distributors | 748,634 | |||||||
|
| |||||||
HEALTH CARE TECHNOLOGY - 2.4% |
| |||||||
Cerner Corp.* | 2,616 | 160,230 | ||||||
Allscripts Healthcare Solutions, Inc.* | 4,955 | 93,848 | ||||||
Quality Systems, Inc. | 1,970 | 72,870 | ||||||
athenahealth, Inc.* | 1,180 | 57,962 | ||||||
|
| |||||||
Total Health Care Technology | 384,910 | |||||||
|
| |||||||
HEALTH CARE FACILITIES - 2.0% |
| |||||||
HCA Holdings, Inc.* | 7,240 | 159,497 | ||||||
Universal Health Services, Inc. - Class B | 2,486 | 96,606 | ||||||
Community Health Systems, Inc.* | 3,500 | 61,075 | ||||||
|
| |||||||
Total Health Care Facilities | 317,178 | |||||||
|
| |||||||
HEALTH CARE SUPPLIES - 1.3% |
| |||||||
DENTSPLY International, Inc. | 3,042 | 106,440 | ||||||
Cooper Companies, Inc. | 1,290 | 90,971 | ||||||
|
| |||||||
Total Health Care Supplies | 197,411 | |||||||
|
| |||||||
Total Common Stocks | 15,834,106 | |||||||
|
| |||||||
| FACE AMOUNT | ||||||||
REPURCHASE AGREEMENT††,1 – 0.7% |
| |||||||
Credit Suisse Group issued 12/30/11 at 0.00% due 01/03/12 | $ | 112,126 | 112,126 | |||||
|
| |||||||
Total Repurchase Agreement | 112,126 | |||||||
|
| |||||||
Total Investments – 100.3% | $ | 15,946,232 | ||||||
|
| |||||||
Liabilities & Other Assets – (0.3)% | (44,818 | ) | ||||||
|
| |||||||
Total Net Assets – 100.0% | $ | 15,901,414 | ||||||
| * | Non-income producing security. |
| † | Value determined based on Level 1 inputs — See Note 4. |
| †† | Value determined based on Level 2 inputs — See Note 4. |
| 1 | Repurchase Agreement — See Note 5. |
| ADR — American Depositary Receipt |
| plc — Public Limited Company |
| See Notes to Financial Statements. | THE RYDEX FUNDSANNUALREPORT | 65 |
HEALTH CARE FUND
STATEMENT OF ASSETS AND LIABILITIES |
| |||
December 31, 2011
| ||||
ASSETS: | ||||
Investments, at value | $ | 15,834,106 | ||
Repurchase agreements, at value | 112,126 | |||
|
| |||
Total Investments | 15,946,232 | |||
Receivables: | ||||
Securities sold | 715,056 | |||
Dividends | 14,117 | |||
Foreign taxes reclaim | 592 | |||
|
| |||
Total assets | 16,675,997 | |||
|
| |||
LIABILITIES: | ||||
Payable for: | ||||
Fund shares redeemed | 727,465 | |||
Management fees | 11,314 | |||
Transfer agent and administrative fees | 3,327 | |||
Investor service fees | 3,327 | |||
Portfolio accounting fees | 1,331 | |||
Miscellaneous | 27,819 | |||
|
| |||
Total liabilities | 774,583 | |||
|
| |||
NETASSETS | $ | 15,901,414 | ||
|
| |||
NETASSETSCONSISTOF: | ||||
Paid in capital | $ | 22,012,012 | ||
Undistributed net investment income | — | |||
Accumulated net realized loss on investments | (10,875,609 | ) | ||
Net unrealized appreciation on investments | 4,765,011 | |||
|
| |||
Net assets | $ | 15,901,414 | ||
|
| |||
Capital shares outstanding | 539,302 | |||
Net asset value per share | $ | 29.49 | ||
|
| |||
STATEMENT OF OPERATIONS |
| |||
Year Ended December 31, 2011
| ||||
INVESTMENT INCOME: | ||||
Dividends | $ | 235,059 | ||
Interest | 23 | |||
|
| |||
Total investment income | 235,082 | |||
|
| |||
EXPENSES: | ||||
Management fees | 150,173 | |||
Transfer agent and administrative fees | 44,168 | |||
Investor service fees | 44,168 | |||
Portfolio accounting fees | 17,667 | |||
Printing expenses | 16,105 | |||
Professional fees | 15,872 | |||
Custodian fees | 4,642 | |||
Trustees’ fees* | 1,759 | |||
Miscellaneous | 5,124 | |||
|
| |||
Total expenses | 299,678 | |||
|
| |||
Net investment loss | (64,596 | ) | ||
|
| |||
NET REALIZED AND UNREALIZED GAIN (LOSS): | ||||
Net realized gain (loss) on: | ||||
Investments | (1,549,036 | ) | ||
|
| |||
Net realized loss | (1,549,036 | ) | ||
|
| |||
Net change in unrealized appreciation (depreciation) on: | ||||
Investments | 903,682 | |||
|
| |||
Net change in unrealized appreciation (depreciation) | 903,682 | |||
|
| |||
Net realized and unrealized loss | (645,354 | ) | ||
|
| |||
Net decrease in net assets resulting from operations | $ | (709,950 | ) | |
|
| |||
* Relates to Trustees not deemed “interested persons” within the meaning of Section 2(a)(19) of the 1940 Act. |
| |||
| 66 | THE RYDEX FUNDSANNUALREPORT | See Notes to Financial Statements. |
HEALTH CARE FUND
STATEMENTS OF CHANGES IN NET ASSETS
| Year Ended December 31, 2011 | Year Ended December 31, 2010 | |||||||
INCREASE (DECREASE) IN NET ASSETS FROM OPERATIONS: | ||||||||
Net investment loss | $ | (64,596 | ) | $ | (29,554 | ) | ||
Net realized gain (loss) on investments | (1,549,036 | ) | 2,801,248 | |||||
Net change in unrealized appreciation (depreciation) on investments | 903,682 | (2,390,384 | ) | |||||
|
|
|
| |||||
Net increase (decrease) in net assets resulting from operations | (709,950 | ) | 381,310 | |||||
|
|
|
| |||||
DISTRIBUTIONSTOSHAREHOLDERSFROM: | ||||||||
Net investment income | — | (41,798 | ) | |||||
Total distributions to shareholders | — | (41,798 | ) | |||||
CAPITALSHARETRANSACTIONS: | ||||||||
Proceeds from sale of shares | 79,291,791 | 92,694,576 | ||||||
Distributions reinvested | — | 41,798 | ||||||
Cost of shares redeemed | (74,008,811 | ) | (108,643,765 | ) | ||||
|
|
|
| |||||
Net increase (decrease) from capital share transactions | 5,282,980 | (15,907,391 | ) | |||||
|
|
|
| |||||
Net increase (decrease) in net assets | 4,573,030 | (15,567,879 | ) | |||||
NETASSETS: | ||||||||
Beginning of year | 11,328,384 | 26,896,263 | ||||||
|
|
|
| |||||
End of year | $ | 15,901,414 | $ | 11,328,384 | ||||
|
|
|
| |||||
Undistributed net investment income at end of year | $ | — | $ | — | ||||
|
|
|
| |||||
CAPITALSHAREACTIVITY: | ||||||||
Shares sold | 2,625,350 | 3,454,463 | ||||||
Shares issued from reinvestment of distributions | — | 1,534 | ||||||
Shares redeemed | (2,488,334 | ) | (4,070,687 | ) | ||||
|
|
|
| |||||
Net increase (decrease) in shares | 137,016 | (614,690 | ) | |||||
|
|
|
| |||||
| See Notes to Financial Statements. | THE RYDEX FUNDSANNUALREPORT | 67 |
HEALTH CARE FUND
FINANCIAL HIGHLIGHTS
This table is presented to show selected data for a share outstanding throughout each period and to assist shareholders in evaluating a Fund’s performance for the periods presented.
| Year Ended December 31, 2011 | Year Ended December 31, 2010 | Year Ended December 31, 2009 | Year Ended December 31, 2008 | Year Ended December 31, 2007 | ||||||||||||||||
Per Share Data | ||||||||||||||||||||
Net asset value, beginning of period | $ | 28.16 | $ | 26.45 | $ | 21.22 | $ | 29.61 | $ | 28.41 | ||||||||||
|
|
|
|
|
|
|
|
|
| |||||||||||
Income (loss) from investment operations: | ||||||||||||||||||||
Net investment income (loss)a | (.11 | ) | (.04 | ) | .04 | — | b | (.01 | ) | |||||||||||
Net gain (loss) on investments (realized and unrealized) | 1.44 | 1.83 | 5.19 | (7.40 | ) | 1.73 | ||||||||||||||
|
|
|
|
|
|
|
|
|
| |||||||||||
Total from investment operations | 1.33 | 1.79 | 5.23 | (7.40 | ) | 1.72 | ||||||||||||||
|
|
|
|
|
|
|
|
|
| |||||||||||
Less distributions from: | ||||||||||||||||||||
Net investment income | — | (.08 | ) | — | — | — | ||||||||||||||
Net realized gains | — | — | — | (.99 | ) | (.52 | ) | |||||||||||||
|
|
|
|
|
|
|
|
|
| |||||||||||
Total distributions | — | (.08 | ) | — | (.99 | ) | (.52 | ) | ||||||||||||
|
|
|
|
|
|
|
|
|
| |||||||||||
Net asset value, end of period | $ | 29.49 | $ | 28.16 | $ | 26.45 | $ | 21.22 | $ | 29.61 | ||||||||||
|
|
|
|
|
|
|
|
|
| |||||||||||
Total Returnc | 4.69 | % | 6.77 | % | 24.65 | % | (24.86 | %) | 6.02 | % | ||||||||||
|
|
|
|
|
|
|
|
|
| |||||||||||
Ratios/Supplemental Data | ||||||||||||||||||||
Net assets, end of period (in thousands) | $ | 15,901 | $ | 11,328 | $ | 26,896 | $ | 35,778 | $ | 37,521 | ||||||||||
|
|
|
|
|
|
|
|
|
| |||||||||||
Ratios to average net assets: | ||||||||||||||||||||
Net investment income (loss) | (0.37 | %) | (0.15 | %) | 0.17 | % | (0.01 | %) | (0.02 | %) | ||||||||||
Total expenses | 1.70 | % | 1.64 | % | 1.67 | % | 1.62 | % | 1.59 | % | ||||||||||
|
|
|
|
|
|
|
|
|
| |||||||||||
Portfolio turnover rate | 358 | % | 455 | % | 301 | % | 266 | % | 424 | % | ||||||||||
| a | Net investment income (loss) per share was computed using average shares outstanding throughout the period. |
| b | Net investment income is less than $0.01 per share. |
| c | Total return does not reflect the impact of any additional fees charged by insurance companies and has not been annualized. |
| 68 | THE RYDEX FUNDSANNUALREPORT | See Notes to Financial Statements. |
This page intentionally left blank.
| THE RYDEX FUNDSANNUALREPORT | 69 |
| PERFORMANCE REPORT AND FUND PROFILE (Unaudited) | December 31, 2011 |
OBJECTIVE: Seeks to provide capital appreciation by investing in companies that provide products or services designed for or related to the Internet (“Internet Companies”).
For the year ended December 31, 2011, Internet Fund returned -11.92%, compared with a gain of 2.11% for the S&P 500® Index*. Within the sector, communications equipment and internet software and services were the biggest detractors from Fund performance. Only the media segment contributed to performance.
Google, Inc. Time Warner, Inc. and Baidu, Inc. added the most to Fund performance for the year, while Research in Motion Ltd., Netflix, Inc. and Juniper Networks, Inc. detracted most from Fund performance for the year.
| * | Standard & Poor’s 500 Index (S&P 500®) – a capitalization-weighted index covering 500 industrial, utility, transportation and financial companies of the U.S. markets (mostly NYSE Euronext issues). |
Performance displayed represents past performance which is no guarantee of future results.
Industry Diversification (Market Exposure as % of Net Assets)
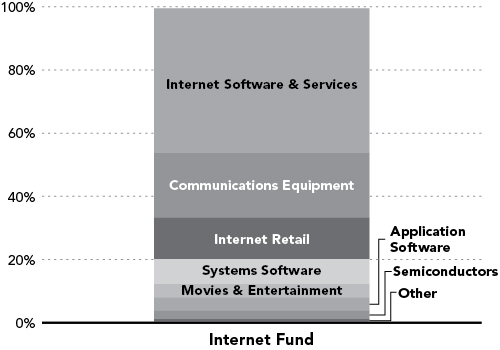
“Industry Diversification (Market Exposure as % of Net Assets)” excludes any temporary cash investments.
Inception Date: May 24, 2001
Ten Largest Holdings (% of Total Net Assets) | ||||
Google, Inc. — Class A | 10.0 | % | ||
Cisco Systems, Inc. | 6.7 | % | ||
QUALCOMM, Inc. | 6.6 | % | ||
Amazon.com, Inc. | 6.0 | % | ||
Baidu, Inc. ADR | 4.7 | % | ||
eBay, Inc. | 4.2 | % | ||
Time Warner, Inc. | 4.2 | % | ||
Priceline.com, Inc. | 3.4 | % | ||
Yahoo!, Inc. | 3.2 | % | ||
Broadcom Corp. — Class A | 2.8 | % | ||
|
| |||
Top Ten Total | 51.8 | % | ||
|
| |||
“Ten Largest Holdings” exclude any temporary cash or derivative investments.
| 70 | THE RYDEX FUNDSANNUALREPORT |
| PERFORMANCE REPORT AND FUND PROFILE (Unaudited) (concluded) | ||
Cumulative Fund Performance*
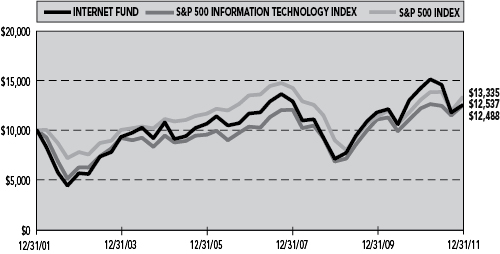
Average Annual Returns*
Periods Ended 12/31/11
| 1 Year | 5 Year | 10 Year | ||||||||||
Internet Fund | -11.92 | % | 1.43 | % | 2.29 | % | ||||||
|
|
|
|
|
| |||||||
S&P 500 Information Technology Index | 2.41 | % | 3.83 | % | 2.25 | % | ||||||
|
|
|
|
|
| |||||||
S&P 500 Index | 2.11 | % | -0.25 | % | 2.92 | % | ||||||
|
|
|
|
|
| |||||||
| * | The performance data represents past performance that is not predictive of future results. The investment return and principal value of an investment in the Fund will fluctuate so that an investor’s shares, when redeemed, may be worth more or less than their original cost. Returns are historical and include changes in principal and reinvested dividends and capital gains and do not reflect the effect of taxes. The S&P 500 Index and S&P 500 Information Technology Index are unmanaged indices and, unlike the Fund, have no management fees or operating expenses to reduce their reported returns. Returns do not reflect the impact of any additional fees charged by insurance companies. |
| THE RYDEX FUNDSANNUALREPORT | 71 |
| SCHEDULE OF INVESTMENTS | December 31, 2011 | |
| INTERNET FUND |
| SHARES | VALUE | |||||||
COMMON STOCKS† - 99.5% |
| |||||||
INTERNET SOFTWARE & SERVICES - 45.7% |
| |||||||
Google, Inc. — Class A* | 771 | $ | 497,989 | |||||
Baidu, Inc. ADR* | 2,013 | 234,454 | ||||||
eBay, Inc.* | 7,007 | 212,522 | ||||||
Yahoo!, Inc.* | 9,914 | 159,913 | ||||||
Akamai Technologies, Inc.* | 2,823 | 91,126 | ||||||
LinkedIn Corp. — Class A* | 1,366 | 86,072 | ||||||
VeriSign, Inc. | 2,257 | 80,620 | ||||||
Rackspace Hosting, Inc.* | 1,839 | 79,095 | ||||||
Equinix, Inc.* | 757 | 76,760 | ||||||
Sina Corp.* | 1,412 | 73,424 | ||||||
IAC/InterActiveCorp. | 1,510 | 64,326 | ||||||
MercadoLibre, Inc. | 798 | 63,473 | ||||||
Sohu.com, Inc.* | 1,005 | 50,250 | ||||||
WebMD Health Corp. — Class A* | 1,247 | 46,825 | ||||||
AOL, Inc.* | 2,849 | 43,020 | ||||||
j2 Global, Inc. | 1,459 | 41,056 | ||||||
ValueClick, Inc.* | 2,483 | 40,448 | ||||||
RightNow Technologies, Inc.* | 941 | 40,209 | ||||||
Open Text Corp.* | 777 | 39,736 | ||||||
VistaPrint N.V.* | 1,181 | 36,139 | ||||||
Ancestry.com, Inc.* | 1,524 | 34,991 | ||||||
Monster Worldwide, Inc.* | 4,243 | 33,647 | ||||||
Youku, Inc. ADR* | 2,133 | 33,424 | ||||||
OpenTable, Inc.* | 761 | 29,778 | ||||||
Constant Contact, Inc.* | 1,216 | 28,223 | ||||||
Digital River, Inc.* | 1,720 | 25,834 | ||||||
Earthlink, Inc. | 3,670 | 23,635 | ||||||
Travelzoo, Inc.* | 798 | 19,615 | ||||||
|
| |||||||
Total Internet Software & Services | 2,286,604 | |||||||
|
| |||||||
COMMUNICATIONS EQUIPMENT - 20.6% |
| |||||||
Cisco Systems, Inc. | 18,436 | 333,323 | ||||||
QUALCOMM, Inc. | 6,070 | 332,029 | ||||||
Juniper Networks, Inc.* | 5,814 | 118,664 | ||||||
Research In Motion Ltd.* | 7,325 | 106,213 | ||||||
F5 Networks, Inc.* | 941 | 99,859 | ||||||
Ciena Corp.* | 3,302 | 39,954 | ||||||
|
| |||||||
Total Communications Equipment | 1,030,042 | |||||||
|
| |||||||
INTERNET RETAIL - 13.1% |
| |||||||
Amazon.com, Inc.* | 1,723 | 298,251 | ||||||
Priceline.com, Inc.* | 365 | 170,714 | ||||||
Netflix, Inc.* | 949 | 65,756 | ||||||
Expedia, Inc. | 1,662 | 48,231 | ||||||
TripAdvisor, Inc.* | 1,662 | 41,899 | ||||||
Shutterfly, Inc.* | 1,335 | 30,385 | ||||||
|
| |||||||
Total Internet Retail | 655,236 | |||||||
|
| |||||||
SYSTEMS SOFTWARE - 7.9% |
| |||||||
Symantec Corp.* | 7,421 | 116,139 | ||||||
Check Point Software Technologies Ltd.* | 2,123 | 111,542 | ||||||
Red Hat, Inc.* | 2,170 | 89,599 | ||||||
BMC Software, Inc.* | 2,407 | 78,902 | ||||||
|
| |||||||
Total Systems Software | 396,182 | |||||||
|
| |||||||
MOVIES & ENTERTAINMENT - 4.2% |
| |||||||
Time Warner, Inc. | 5,768 | 208,456 | ||||||
|
| |||||||
APPLICATION SOFTWARE - 4.1% | ||||||||
Intuit, Inc. | 2,565 | 134,893 | ||||||
TIBCO Software, Inc.* | 2,916 | 69,722 | ||||||
|
| |||||||
Total Application Software | 204,615 | |||||||
|
| |||||||
SEMICONDUCTORS - 2.8% |
| |||||||
Broadcom Corp. — Class A* | 4,734 | 138,990 | ||||||
|
| |||||||
INVESTMENT BANKING & BROKERAGE - 1.1% |
| |||||||
E*Trade Financial Corp.* | 6,792 | 54,064 | ||||||
|
| |||||||
Total Common Stocks | 4,974,189 | |||||||
|
| |||||||
| FACE AMOUNT | ||||||||
REPURCHASE AGREEMENT††,1 - 0.9% |
| |||||||
Credit Suisse Group issued 12/30/11 at 0.00% due 01/03/12 | $ | 42,947 | 42,947 | |||||
|
| |||||||
Total Repurchase Agreement | 42,947 | |||||||
|
| |||||||
Total Investments – 100.4% | $ | 5,017,136 | ||||||
|
| |||||||
Liabilities & Other Assets – (0.4)% | (18,684 | ) | ||||||
|
| |||||||
Total Net Assets – 100.0% | $ | 4,998,452 | ||||||
| * | Non-income producing security. |
| † | Value determined based on Level 1 inputs — See Note 4. |
| †† | Value determined based on Level 2 inputs — See Note 4. |
| 1 | Repurchase Agreement — See Note 5. |
ADR — American Depositary Receipt
| 72 | THE RYDEX FUNDSANNUALREPORT | See Notes to Financial Statements. |
INTERNET FUND
STATEMENT OF ASSETS AND LIABILITIES
December 31, 2011
ASSETS: | ||||
Investments, at value | $ | 4,974,189 | ||
Repurchase agreements, at value | 42,947 | |||
|
| |||
Total Investments | 5,017,136 | |||
Receivables: | ||||
Fund shares sold | 261,614 | |||
Dividends | 69 | |||
|
| |||
Total assets | 5,278,819 | |||
|
| |||
LIABILITIES: | ||||
Payable for: | ||||
Securities purchased | 257,318 | |||
Management fees | 3,736 | |||
Transfer agent and administrative fees | 1,099 | |||
Investor service fees | 1,099 | |||
Portfolio accounting fees | 439 | |||
Fund shares redeemed | 63 | |||
Miscellaneous | 16,613 | |||
|
| |||
Total liabilities | 280,367 | |||
|
| |||
NET ASSETS | $ | 4,998,452 | ||
|
| |||
NET ASSETS CONSIST OF: | ||||
Paid in capital | $ | 2,626,160 | ||
Undistributed net investment income | — | |||
Accumulated net realized gain on investments | 185,288 | |||
Net unrealized appreciation on investments | 2,187,004 | |||
|
| |||
Net assets | $ | 4,998,452 | ||
|
| |||
Capital shares outstanding | 287,828 | |||
Net asset value per share | $ | 17.37 | ||
|
| |||
STATEMENT OF OPERATIONS
Year Ended December 31, 2011
INVESTMENT INCOME: | ||||
Dividends (net of foreign withholding tax of $73) | $ | 32,554 | ||
Interest | 26 | |||
|
| |||
Total investment income | 32,580 | |||
|
| |||
EXPENSES: | ||||
Management fees | 81,968 | |||
Transfer agent and administrative fees | 24,108 | |||
Investor service fees | 24,108 | |||
Portfolio accounting fees | 9,643 | |||
Custodian fees | 2,331 | |||
Trustees’ fees* | 1,023 | |||
Miscellaneous | 22,063 | |||
|
| |||
Total expenses | 165,244 | |||
|
| |||
Net investment loss | (132,664 | ) | ||
|
| |||
NET REALIZED AND UNREALIZED GAIN (LOSS): | ||||
Net realized gain (loss) on: | ||||
Investments | 2,360,224 | |||
|
| |||
Net realized gain | 2,360,224 | |||
|
| |||
Net change in unrealized appreciation (depreciation) on: | ||||
Investments | (3,423,162 | ) | ||
|
| |||
Net change in unrealized appreciation (depreciation) | (3,423,162 | ) | ||
|
| |||
Net realized and unrealized loss | (1,062,938 | ) | ||
|
| |||
Net decrease in net assets resulting from operations | $ | (1,195,602 | ) | |
|
| |||
| * | Relates to Trustees not deemed “interested persons” within the meaning of Section 2(a)(19) of the 1940 Act. |
| See Notes to Financial Statements. | THE RYDEX FUNDSANNUALREPORT | 73 |
INTERNET FUND
STATEMENTS OF CHANGES IN NET ASSETS
| Year Ended December 31, 2011 | Year Ended December 31, 2010 | |||||||
INCREASE (DECREASE) IN NET ASSETS FROM OPERATIONS: | ||||||||
Net investment loss | $ | (132,664 | ) | $ | (171,105 | ) | ||
Net realized gain on investments | 2,360,224 | 4,259,443 | ||||||
Net change in unrealized appreciation (depreciation) on investments | (3,423,162 | ) | (2,874,173 | ) | ||||
|
|
|
| |||||
Net increase (decrease) in net assets resulting from operations | (1,195,602 | ) | 1,214,165 | |||||
|
|
|
| |||||
CAPITALSHARETRANSACTIONS: | ||||||||
Proceeds from sale of shares | 33,417,673 | 59,419,024 | ||||||
Cost of shares redeemed | (44,009,352 | ) | (74,207,349 | ) | ||||
|
|
|
| |||||
Net decrease from capital share transactions | (10,591,679 | ) | (14,788,325 | ) | ||||
|
|
|
| |||||
Net decrease in net assets | (11,787,281 | ) | (13,574,160 | ) | ||||
NETASSETS: | ||||||||
Beginning of year | 16,785,733 | 30,359,893 | ||||||
|
|
|
| |||||
End of year | $ | 4,998,452 | $ | 16,785,733 | ||||
|
|
|
| |||||
Undistributed net investment income at end of year | $ | — | $ | — | ||||
|
|
|
| |||||
CAPITALSHAREACTIVITY: | ||||||||
Shares sold | 1,701,066 | 3,439,213 | ||||||
Shares redeemed | (2,264,933 | ) | (4,448,309 | ) | ||||
|
|
|
| |||||
Net decrease in shares | (563,867 | ) | (1,009,096 | ) | ||||
|
|
|
| |||||
| 74 | THE RYDEX FUNDSANNUALREPORT | See Notes to Financial Statements. |
INTERNET FUND
FINANCIAL HIGHLIGHTS
This table is presented to show selected data for a share outstanding throughout each period and to assist shareholders in evaluating a Fund’s performance for the periods presented.
| Year Ended December 31, 2011 | Year Ended December 31, 2010 | Year Ended December 31, 2009 | Year Ended December 31, 2008 | Year Ended December 31, 2007 | ||||||||||||||||
Per Share Data | ||||||||||||||||||||
Net asset value, beginning of period | $ | 19.71 | $ | 16.32 | $ | 9.84 | $ | 17.85 | $ | 16.17 | ||||||||||
|
|
|
|
|
|
|
|
|
| |||||||||||
Income (loss) from investment operations: | ||||||||||||||||||||
Net investment lossa | (.27 | ) | (.19 | ) | (.19 | ) | (.16 | ) | (.05 | ) | ||||||||||
Net gain (loss) on investments (realized and unrealized) | (2.07 | ) | 3.58 | 6.67 | (7.85 | ) | 1.73 | |||||||||||||
|
|
|
|
|
|
|
|
|
| |||||||||||
Total from investment operations | (2.34 | ) | 3.39 | 6.48 | (8.01 | ) | 1.68 | |||||||||||||
|
|
|
|
|
|
|
|
|
| |||||||||||
Net asset value, end of period | $ | 17.37 | $ | 19.71 | $ | 16.32 | $ | 9.84 | $ | 17.85 | ||||||||||
|
|
|
|
|
|
|
|
|
| |||||||||||
Total Returnb | (11.92 | %) | 20.77 | % | 65.85 | % | (44.87 | %) | 10.39 | % | ||||||||||
|
|
|
|
|
|
|
|
|
| |||||||||||
Ratios/Supplemental Data | ||||||||||||||||||||
Net assets, end of period (in thousands) | $ | 4,998 | $ | 16,786 | $ | 30,360 | $ | 2,405 | $ | 24,937 | ||||||||||
|
|
|
|
|
|
|
|
|
| |||||||||||
Ratios to average net assets: | ||||||||||||||||||||
Net investment loss | (1.38 | %) | (1.15 | %) | (1.36 | %) | (1.07 | %) | (0.29 | %) | ||||||||||
Total expenses | 1.71 | % | 1.66 | % | 1.64 | % | 1.60 | % | 1.54 | % | ||||||||||
|
|
|
|
|
|
|
|
|
| |||||||||||
Portfolio turnover rate | 321 | % | 401 | % | 274 | % | 341 | % | 432 | % | ||||||||||
| a | Net investment loss per share was computed using average shares outstanding throughout the period. |
| b | Total return does not reflect the impact of any additional fees charged by insurance companies and has not been annualized. |
| See Notes to Financial Statements. | THE RYDEX FUNDSANNUALREPORT | 75 |
| PERFORMANCE REPORT AND FUND PROFILE (Unaudited) | December 31, 2011 |
OBJECTIVE: Seeks to provide capital appreciation by investing in companies engaged in leisure and entertainment businesses (“Leisure Companies”).
Positive, yet slow, economic growth helped this sector, along with an accommodative Federal Reserve and easing commodity prices, all of which gave a boost to spending and stemmed fears of another recession. Retailers are also benefiting from some pricing power due to lean inventories. Continuing weakness in job and housing markets could eventually impact spending.
For the year ended December 31, 2011, Leisure Fund rose 2.45%, compared with a gain of 2.11% for the S&P 500® Index*. Within the sector, the media industry contributed most of the Fund’s return for the year. Electronic equipment and instruments was the weakest segment.
Among the stocks that contributed the most to the Fund’s annual performance were McDonald’s Corp., Starbucks Corp. and News Corp. Royal Caribbean Cruises Ltd., Carnival Corp. and WMS Industries, Inc. were the Fund’s weakest holdings for the period.
| * | Standard & Poor’s 500 Index (S&P 500®) – a capitalization-weighted index covering 500 industrial, utility, transportation and financial companies of the U.S. markets (mostly NYSE Euronext issues). |
Performance displayed represents past performance which is no guarantee of future results.
Industry Diversification (Market Exposure as % of Net Assets)
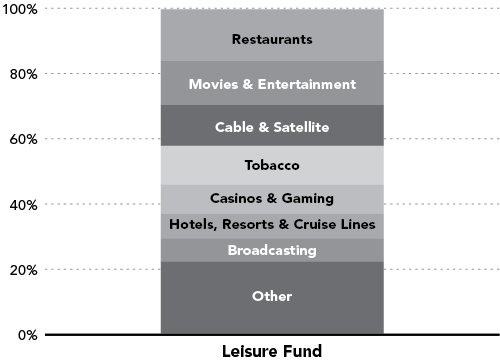
“Industry Diversification (Market Exposure as % of Net Assets)” excludes any temporary cash investments.
Inception Date: May 22, 2001
| Ten Largest Holdings | ||||
(% of Total Net Assets) | ||||
Philip Morris International, Inc. | 4.9 | % | ||
McDonald’s Corp. | 4.3 | % | ||
Walt Disney Co. | 3.6 | % | ||
Altria Group, Inc. | 3.3 | % | ||
Comcast Corp. — Class A | 3.2 | % | ||
News Corp. — Class A | 2.9 | % | ||
Time Warner, Inc. | 2.6 | % | ||
Las Vegas Sands Corp. | 2.6 | % | ||
Starbucks Corp. | 2.5 | % | ||
DIRECTV — Class A | 2.3 | % | ||
|
| |||
Top Ten Total | 32.2 | % | ||
|
| |||
“Ten Largest Holdings” exclude any temporary cash or derivative investments.
| 76 | THE RYDEX FUNDSANNUALREPORT |
| PERFORMANCE REPORT AND FUND PROFILE (Unaudited) (concluded) | ||
Cumulative Fund Performance*
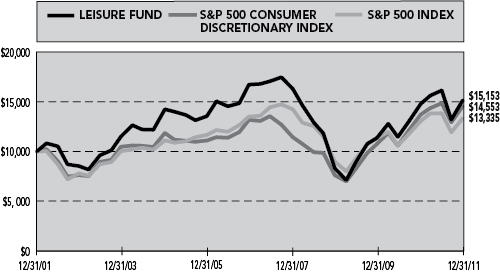
Average Annual Returns*
Periods Ended 12/31/11
| 1 Year | 5 Year | 10 Year | ||||||||||
Leisure Fund | 2.45 | % | -1.96 | % | 4.24 | % | ||||||
|
|
|
|
|
| |||||||
S&P 500 Consumer Discretionary Index | 6.13 | % | 2.02 | % | 3.82 | % | ||||||
|
|
|
|
|
| |||||||
S&P 500 Index | 2.11 | % | -0.25 | % | 2.92 | % | ||||||
|
|
|
|
|
| |||||||
| * | The performance data represents past performance that is not predictive of future results. The investment return and principal value of an investment in the Fund will fluctuate so that an investor’s shares, when redeemed, may be worth more or less than their original cost. Returns are historical and include changes in principal and reinvested dividends and capital gains and do not reflect the effect of taxes. The S&P 500 Index and S&P 500 Consumer Discretionary Index are unmanaged indices and, unlike the Fund, have no management fees or operating expenses to reduce their reported returns. Returns do not reflect the impact of any additional fees charged by insurance companies. |
| THE RYDEX FUNDSANNUALREPORT | 77 |
| SCHEDULE OF INVESTMENTS | December 31, 2011 |
LEISURE FUND
| SHARES | VALUE | |||||||
COMMON STOCKS† - 99.5% | ||||||||
RESTAURANTS - 15.8% |
| |||||||
McDonald’s Corp. | 2,467 | $ | 247,514 | |||||
Starbucks Corp. | 3,150 | 144,932 | ||||||
Yum! Brands, Inc. | 2,152 | 126,990 | ||||||
Chipotle Mexican Grill, Inc. — Class A* | 253 | 85,448 | ||||||
Darden Restaurants, Inc. | 1,336 | 60,895 | ||||||
Panera Bread Co. — Class A* | 364 | 51,488 | ||||||
Brinker International, Inc. | 1,372 | 36,715 | ||||||
Wendy’s Co. | 6,630 | 35,537 | ||||||
Domino’s Pizza, Inc.* | 1,024 | 34,765 | ||||||
Cheesecake Factory, Inc.* | 1,080 | 31,698 | ||||||
Buffalo Wild Wings, Inc.* | 420 | 28,354 | ||||||
BJ’s Restaurants, Inc.* | 609 | 27,600 | ||||||
|
| |||||||
Total Restaurants | 911,936 | |||||||
|
| |||||||
MOVIES & ENTERTAINMENT - 13.4% |
| |||||||
Walt Disney Co. | 5,493 | 205,988 | ||||||
News Corp. — Class A | 9,468 | 168,909 | ||||||
Time Warner, Inc. | 4,132 | 149,330 | ||||||
Viacom, Inc. — Class B | 2,749 | 124,832 | ||||||
Cinemark Holdings, Inc. | 2,025 | 37,442 | ||||||
Regal Entertainment Group — Class A | 2,716 | 32,429 | ||||||
Live Nation Entertainment, Inc.* | 3,708 | 30,813 | ||||||
DreamWorks Animation SKG, Inc. — Class A* | 1,689 | 28,029 | ||||||
|
| |||||||
Total Movies & Entertainment | 777,772 | |||||||
|
| |||||||
CABLE & SATELLITE - 12.5% |
| |||||||
Comcast Corp. — Class A | 7,914 | 187,641 | ||||||
DIRECTV — Class A* | 3,151 | 134,737 | ||||||
Time Warner Cable, Inc. | 1,732 | 110,103 | ||||||
DISH Network Corp. — Class A | 3,121 | 88,886 | ||||||
Liberty Global, Inc. — Class A* | 2,008 | 82,388 | ||||||
Virgin Media, Inc. | 2,778 | 59,394 | ||||||
Cablevision Systems Corp. — Class A | 4,087 | 58,117 | ||||||
|
| |||||||
Total Cable & Satellite | 721,266 | |||||||
|
| |||||||
TOBACCO - 11.9% |
| |||||||
Philip Morris International, Inc. | 3,626 | 284,569 | ||||||
Altria Group, Inc. | 6,340 | 187,981 | ||||||
Reynolds American, Inc. | 2,874 | 119,041 | ||||||
Lorillard, Inc. | 845 | 96,330 | ||||||
|
| |||||||
Total Tobacco | 687,921 | |||||||
|
| |||||||
CASINOS & GAMING - 8.8% |
| |||||||
Las Vegas Sands Corp.* | 3,464 | 148,017 | ||||||
Wynn Resorts Ltd. | 839 | 92,701 | ||||||
Melco Crown Entertainment Ltd. ADR* | 7,965 | 76,623 | ||||||
MGM Resorts International* | 5,666 | 59,096 | ||||||
International Game Technology | 3,346 | 57,551 | ||||||
Penn National Gaming, Inc.* | 1,129 | 42,981 | ||||||
Bally Technologies, Inc.* | 820 | 32,439 | ||||||
|
| |||||||
Total Casinos & Gaming | 509,408 | |||||||
|
| |||||||
HOTELS, RESORTS & CRUISE LINES - 7.6% |
| |||||||
Carnival Corp. | 3,759 | 122,694 | ||||||
Starwood Hotels & Resorts Worldwide, Inc. | 1,618 | 77,615 | ||||||
Marriott International, Inc. — Class A | 2,648 | 77,242 | ||||||
Wyndham Worldwide Corp. | 1,623 | 61,398 | ||||||
Royal Caribbean Cruises Ltd. | 2,237 | 55,411 | ||||||
Ctrip.com International Ltd. ADR* | 1,885 | 44,109 | ||||||
|
| |||||||
Total Hotels, Resorts & Cruise Lines | 438,469 | |||||||
|
| |||||||
BROADCASTING - 7.2% |
| |||||||
CBS Corp. — Class B | 4,054 | 110,026 | ||||||
Discovery Communications, Inc. — Class A* | 2,457 | 100,663 | ||||||
Liberty Media Corp. — Liberty Capital — Class A* | 983 | 76,723 | ||||||
Grupo Televisa SAB ADR | 3,207 | 67,539 | ||||||
Scripps Networks Interactive, Inc. — Class A | 1,487 | 63,079 | ||||||
|
| |||||||
Total Broadcasting | 418,030 | |||||||
|
| |||||||
PUBLISHING - 5.2% |
| |||||||
Thomson Reuters Corp. | 4,352 | 116,068 | ||||||
McGraw-Hill Companies, Inc. | 1,997 | 89,805 | ||||||
Gannett Company, Inc. | 3,259 | 43,573 | ||||||
Meredith Corp. | 899 | 29,352 | ||||||
Valassis Communications, Inc.* | 1,168 | 22,461 | ||||||
|
| |||||||
Total Publishing | 301,259 | |||||||
|
| |||||||
BREWERS - 3.8% |
| |||||||
Cia de Bebidas das | ||||||||
Americas ADR | 2,154 | 77,738 | ||||||
Anheuser-Busch InBev N.V. ADR | 1,228 | 74,896 | ||||||
Molson Coors Brewing Co. — Class B | 1,585 | 69,011 | ||||||
|
| |||||||
Total Brewers | 221,645 | |||||||
|
| |||||||
DISTILLERS & VINTNERS - 3.6% |
| |||||||
Brown-Forman Corp. — Class B | 1,036 | 83,408 | ||||||
Beam, Inc. | 1,376 | 70,493 | ||||||
Constellation Brands, Inc. — Class A* | 2,502 | 51,716 | ||||||
|
| |||||||
Total Distillers & Vintners | 205,617 | |||||||
|
| |||||||
LEISURE PRODUCTS - 3.5% |
| |||||||
Mattel, Inc. | 2,676 | 74,286 | ||||||
Hasbro, Inc. | 1,517 | 48,377 | ||||||
| 78 | THE RYDEX FUNDSANNUALREPORT | See Notes to Financial Statements. |
| SCHEDULE OF INVESTMENTS (concluded) | December 31, 2011 | |
| LEISURE FUND |
| SHARES | VALUE | |||||||
Polaris Industries, Inc. | 838 | $ | 46,911 | |||||
Brunswick Corp. | 1,795 | 32,418 | ||||||
|
| |||||||
Total Leisure Products | 201,992 | |||||||
|
| |||||||
HOME ENTERTAINMENT SOFTWARE - 3.1% |
| |||||||
Activision Blizzard, Inc. | 7,526 | 92,720 | ||||||
Electronic Arts, Inc.* | 3,040 | 62,624 | ||||||
Take-Two Interactive Software, Inc.* | 1,909 | 25,867 | ||||||
|
| |||||||
Total Home Entertainment Software | 181,211 | |||||||
|
| |||||||
LEISURE FACILITIES - 1.8% |
| |||||||
Six Flags Entertainment Corp. | 909 | 37,487 | ||||||
Life Time Fitness, Inc.* | 741 | 34,642 | ||||||
Vail Resorts, Inc. | 704 | 29,821 | ||||||
|
| |||||||
Total Leisure Facilities | 101,950 | |||||||
|
| |||||||
MOTORCYCLE MANUFACTURERS - 1.3% |
| |||||||
Harley-Davidson, Inc. | 1,923 | 74,747 | ||||||
|
| |||||||
Total Common Stocks (Cost $3,971,734) | 5,753,223 | |||||||
|
| |||||||
WARRANTS†† - 0.0% | ||||||||
Krispy Kreme Doughnuts, Inc. $12.21, 03/02/12* | 311 | 6 | ||||||
|
| |||||||
Total Warrants (Cost $—) | 6 | |||||||
|
| |||||||
| FACE AMOUNT | ||||||||
REPURCHASE AGREEMENT††,1 - 0.7% |
| |||||||
Credit Suisse Group issued 12/30/11 at 0.00% due 01/03/12 | $ | 37,676 | 37,676 | |||||
|
| |||||||
Total Repurchase Agreement (Cost $37,676) | 37,676 | |||||||
|
| |||||||
Total Investments - 100.2% (Cost $4,009,410) | $ | 5,790,905 | ||||||
|
| |||||||
Liabilities & Other Assets - (0.2)% | (10,464 | ) | ||||||
|
| |||||||
Total Net Assets - 100.0% | $ | 5,780,441 | ||||||
| * | Non-income producing security. |
| † | Value determined based on Level 1 inputs — See Note 4. |
| †† | Value determined based on Level 2 inputs — See Note 4. |
| 1 | Repurchase Agreement — See Note 5. |
| ADR — American Depositary Receipt |
| See Notes to Financial Statements. | THE RYDEX FUNDSANNUALREPORT | 79 |
LEISURE FUND
STATEMENT OF ASSETS AND LIABILITIES
December 31, 2011
ASSETS: |
| |||
Investments, at value | $ | 5,753,229 | ||
Repurchase agreements, at value | 37,676 | |||
|
| |||
Total Investments | 5,790,905 | |||
Receivables: | ||||
Securities sold | 372,039 | |||
Dividends | 13,005 | |||
|
| |||
Total assets | 6,175,949 | |||
|
| |||
LIABILITIES: |
| |||
Payable for: | ||||
Fund shares redeemed | 375,482 | |||
Management fees | 4,004 | |||
Transfer agent and administrative fees | 1,178 | |||
Investor service fees | 1,178 | |||
Portfolio accounting fees | 471 | |||
Miscellaneous | 13,195 | |||
|
| |||
Total liabilities | 395,508 | |||
|
| |||
NETASSETS | $ | 5,780,441 | ||
|
| |||
NETASSETSCONSISTOF: | ||||
Paid in capital | $ | 6,124,271 | ||
Undistributed net investment income | — | |||
Accumulated net realized loss on investments | (2,125,325 | ) | ||
Net unrealized appreciation on investments | 1,781,495 | |||
|
| |||
Net assets | $ | 5,780,441 | ||
|
| |||
Capital shares outstanding | 104,001 | |||
Net asset value per share | $ | 55.58 | ||
|
| |||
STATEMENT OF OPERATIONS
Year Ended December 31, 2011
INVESTMENT INCOME: |
| |||
Dividends (net of foreign withholding tax of $886) | $ | 113,903 | ||
Interest | 17 | |||
|
| |||
Total investment income | 113,920 | |||
|
| |||
EXPENSES: | ||||
Management fees | 64,065 | |||
Transfer agent and administrative fees | 18,843 | |||
Investor service fees | 18,843 | |||
Portfolio accounting fees | 7,537 | |||
Custodian fees | 1,813 | |||
Trustees’ fees* | 788 | |||
Miscellaneous | 16,761 | |||
|
| |||
Total expenses | 128,650 | |||
|
| |||
Net investment loss | (14,730 | ) | ||
|
| |||
NET REALIZEDAND UNREALIZED GAIN (LOSS): |
| |||
Net realized gain (loss) on: |
| |||
Investments | 1,929,662 | |||
|
| |||
Net realized gain | 1,929,662 | |||
|
| |||
Net change in unrealized appreciation (depreciation) on: | ||||
Investments | (1,983,276 | ) | ||
|
| |||
Net change in unrealized appreciation (depreciation) | (1,983,276 | ) | ||
|
| |||
Net realized and unrealized loss | (53,614 | ) | ||
|
| |||
Net decrease in net assets resulting from operations | $ | (68,344 | ) | |
|
| |||
| * | Relates to Trustees not deemed “interested persons” within the meaning of Section 2(a)(19) of the 1940 Act. |
| 80 | THE RYDEX FUNDSANNUALREPORT | See Notes to Financial Statements. |
LEISURE FUND
STATEMENTS OF CHANGES IN NET ASSETS
| Year Ended December 31, 2011 | Year Ended December 31, 2010 | |||||||
INCREASE (DECREASE) IN NET ASSETS FROM OPERATIONS: | ||||||||
Net investment loss | $ | (14,730 | ) | $ | (40,585 | ) | ||
Net realized gain (loss) on investments | 1,929,662 | (1,009,911 | ) | |||||
Net change in unrealized appreciation (depreciation) on investments | (1,983,276 | ) | 1,621,887 | |||||
|
|
|
| |||||
Net increase (decrease) in net assets resulting from operations | (68,344 | ) | 571,391 | |||||
|
|
|
| |||||
DISTRIBUTIONSTOSHAREHOLDERSFROM: | ||||||||
Net investment income | — | (10,939 | ) | |||||
|
|
|
| |||||
Total distributions to shareholders | — | (10,939 | ) | |||||
|
|
|
| |||||
CAPITALSHARETRANSACTIONS: | ||||||||
Proceeds from sale of shares | 19,529,796 | 69,465,152 | ||||||
Distributions reinvested | — | 10,939 | ||||||
Cost of shares redeemed | (26,622,629 | ) | (68,816,762 | ) | ||||
|
|
|
| |||||
Net increase (decrease) from capital share transactions | (7,092,833 | ) | 659,329 | |||||
|
|
|
| |||||
Net increase (decrease) in net assets | (7,161,177 | ) | 1,219,781 | |||||
NETASSETS: | ||||||||
Beginning of year | 12,941,618 | 11,721,837 | ||||||
|
|
|
| |||||
End of year | $ | 5,780,441 | $ | 12,941,618 | ||||
|
|
|
| |||||
Undistributed net investment income at end of year | $ | — | $ | — | ||||
|
|
|
| |||||
CAPITALSHAREACTIVITY: | ||||||||
Shares sold | 343,829 | 1,466,653 | ||||||
Shares issued from reinvestment of distributions | — | 209 | ||||||
Shares redeemed | (478,364 | ) | (1,509,693 | ) | ||||
|
|
|
| |||||
Net decrease in shares | (134,535 | ) | (42,831 | ) | ||||
|
|
|
| |||||
| See Notes to Financial Statements. | THE RYDEX FUNDSANNUALREPORT | 81 |
LEISURE FUND
FINANCIAL HIGHLIGHTS
This table is presented to show selected data for a share outstanding throughout each period and to assist shareholders in evaluating a Fund’s performance for the periods presented.
| Year Ended December 31, 2011 | Year Ended December 31, 2010 | Year Ended December 31, 2009 | Year Ended December 31, 2008c | Year Ended December 31, 2007c | ||||||||||||||||
Per Share Data | ||||||||||||||||||||
Net asset value, beginning of period | $ | 54.25 | $ | 41.66 | $ | 30.47 | $ | 636.60 | $ | 785.70 | ||||||||||
|
|
|
|
|
|
|
|
|
| |||||||||||
Income (loss) from investment operations: | ||||||||||||||||||||
Net investment income (loss)a | (.11 | ) | (.14 | ) | .06 | (1.07 | ) | (1.20 | ) | |||||||||||
Net gain (loss) on investments (realized and unrealized) | 1.44 | 12.78 | 11.13 | (347.66 | ) | (15.30 | ) | |||||||||||||
|
|
|
|
|
|
|
|
|
| |||||||||||
Total from investment operations | 1.33 | 12.64 | 11.19 | (348.73 | ) | (16.50 | ) | |||||||||||||
|
|
|
|
|
|
|
|
|
| |||||||||||
Less distributions from: | ||||||||||||||||||||
Net investment income | — | (.05 | ) | — | — | — | ||||||||||||||
Net realized gains | — | — | — | (257.40 | ) | (132.60 | ) | |||||||||||||
|
|
|
|
|
|
|
|
|
| |||||||||||
Total distributions | — | (.05 | ) | — | (257.40 | ) | (132.60 | ) | ||||||||||||
Net asset value, end of period | $ | 55.58 | $ | 54.25 | $ | 41.66 | $ | 30.47 | $ | 636.60 | ||||||||||
|
|
|
|
|
|
|
|
|
| |||||||||||
Total Returnb | 2.45 | % | 30.34 | % | 36.72 | % | (49.09 | %) | (2.54 | %) | ||||||||||
|
|
|
|
|
|
|
|
|
| |||||||||||
Ratios/Supplemental Data | ||||||||||||||||||||
Net assets, end of period (in thousands) | $ | 5,780 | $ | 12,942 | $ | 11,722 | $ | 1,601 | $ | 15,311 | ||||||||||
|
|
|
|
|
|
|
|
|
| |||||||||||
Ratios to average net assets: | ||||||||||||||||||||
Net investment income (loss) | (0.20 | %) | (0.30 | %) | 0.17 | % | (0.26 | %) | (0.14 | %) | ||||||||||
Total expenses | 1.71 | % | 1.65 | % | 1.64 | % | 1.61 | % | 1.59 | % | ||||||||||
|
|
|
|
|
|
|
|
|
| |||||||||||
Portfolio turnover rate | 227 | % | 468 | % | 316 | % | 255 | % | 171 | % | ||||||||||
| a | Net investment income (loss) per share was computed using average shares outstanding throughout the period. |
| b | Total return does not reflect the impact of any additional fees charged by insurance companies and has not been annualized. |
| c | Per share amounts for the year ended December 31, 2007 and the period January 1, 2008 through December 7, 2008 have been restated to reflect a 1:30 reverse split, effective December 8, 2008. |
| 82 | THE RYDEX FUNDSANNUALREPORT | See Notes to Financial Statements. |
This page intentionally left blank.
| THE RYDEX FUNDSANNUALREPORT | 83 |
PERFORMANCE REPORT AND FUND PROFILE (Unaudited) | December 31, 2011 |
OBJECTIVE: Seeks to provide capital appreciation by investing in U.S. and foreign companies that are involved in the precious metals sector, including exploration, mining, production and development, and other precious metals related services (“Precious Metals Companies”).
Volatility in the precious metals markets defined much of 2011. Gold was around $1,300 an ounce at the beginning of 2011, when the global economy appeared to be strengthening. Then it jumped to almost $1,900 in August after the U.S. lost its triple-A credit rating on the heels of a congressional battle over debt and spending. Many investors, including hedge funds meeting redemptions and banks reducing holdings, sold gold later in the year, perhaps disappointed by its performance amid the continuing sovereign debt crisis in Europe. Still, the price of an ounce of gold finished 10% higher in 2011, completing 11 straight years of gains. Silver was also volatile, rising more than 80% in the first four months of the year to challenge the prior record price set in 1980. Prices then fell, and finished about 10% lower for the year.
For the year ended December 31, 2011, Precious Metals Fund returned -24.16%, compared with the 2.11% increase in the S&P 500® Index*. Metals and mining companies account for nearly all the portfolio.
Randgold Resources Ltd. ADS, Yamana Gold, Inc. and Pilot Gold, Inc. added the most to Fund performance during the year. Freeport-McMoRan Copper & Gold, Inc., Agnico-Eagle Mines Ltd. and Silver Wheaton Corp. detracted most from Fund performance.
| * | Standard & Poor’s 500 Index (S&P 500®) – a capitalization-weighted index covering 500 industrial, utility, transportation and financial companies of the U.S. markets (mostly NYSE Euronext issues). |
Performance displayed represents past performance which is no guarantee of future results.
Industry Diversification (Market Exposure as % of Net Assets)
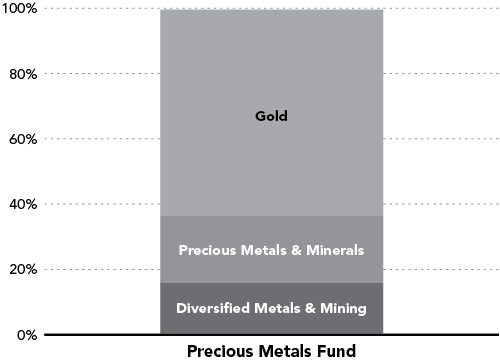
“Industry Diversification (Market Exposure as % of Net Assets)” excludes any temporary cash investments.
Inception Date: May 29, 1997
Ten Largest Holdings (% of Total Net Assets) | ||||
Freeport-McMoRan Copper & Gold, Inc. | 10.5 | % | ||
Newmont Mining Corp. | 7.3 | % | ||
Barrick Gold Corp. | 6.9 | % | ||
Goldcorp, Inc. | 5.7 | % | ||
Silver Wheaton Corp. | 5.2 | % | ||
Yamana Gold, Inc. | 4.5 | % | ||
Agnico-Eagle Mines Ltd. | 3.8 | % | ||
Kinross Gold Corp. | 3.6 | % | ||
AngloGold Ashanti Ltd. ADR | 3.4 | % | ||
Southern Copper Corp. | 3.2 | % | ||
|
| |||
Top Ten Total | 54.1 | % | ||
|
| |||
“Ten Largest Holdings” exclude any temporary cash or derivative investments.
| 84 | THE RYDEX FUNDSANNUALREPORT |
| PERFORMANCE REPORT AND FUND PROFILE (Unaudited) (concluded) | ||
Cumulative Fund Performance*
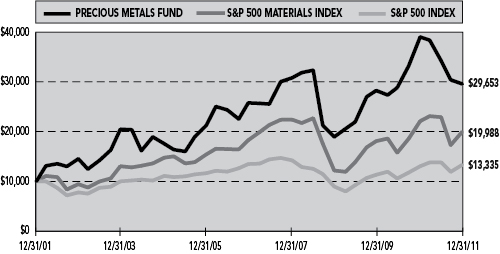
Average Annual Returns*
Periods Ended 12/31/11
| 1 Year | 5 Year | 10 Year | ||||||||||
Precious Metals Fund | -24.16 | % | 2.80 | % | 11.48 | % | ||||||
|
|
|
|
|
| |||||||
S&P 500 Materials Index | -9.75 | % | 1.76 | % | 7.17 | % | ||||||
|
|
|
|
|
| |||||||
S&P 500 Index | 2.11 | % | -0.25 | % | 2.92 | % | ||||||
|
|
|
|
|
| |||||||
| * | The performance data represents past performance that is not predictive of future results. The investment return and principal value of an investment in the Fund will fluctuate so that an investor’s shares, when redeemed, may be worth more or less than their original cost. Returns are historical and include changes in principal and reinvested dividends and capital gains and do not reflect the effect of taxes. The S&P 500 Index and S&P 500 Materials Index are unmanaged indices and, unlike the Fund, have no management fees or operating expenses to reduce their reported returns. Returns do not reflect the impact of any additional fees charged by insurance companies. |
| THE RYDEX FUNDSANNUALREPORT | 85 |
| SCHEDULE OF INVESTMENTS | December 31, 2011 | |
| PRECIOUS METALS FUND |
| SHARES | VALUE | |||||||
COMMON STOCKS† - 99.6% |
| |||||||
GOLD - 63.3% |
| |||||||
Newmont Mining Corp. | 68,833 | $ | 4,130,668 | |||||
Barrick Gold Corp. | 86,535 | 3,915,709 | ||||||
Goldcorp, Inc. | 73,037 | 3,231,887 | ||||||
Yamana Gold, Inc. | 175,656 | 2,580,387 | ||||||
Agnico-Eagle Mines Ltd. | 58,803 | 2,135,725 | ||||||
Kinross Gold Corp. | 182,104 | 2,075,986 | ||||||
AngloGold Ashanti Ltd. ADR | 45,540 | 1,933,173 | ||||||
Randgold Resources Ltd. ADR | 17,853 | 1,822,791 | ||||||
Gold Fields Ltd. ADR | 107,021 | 1,632,070 | ||||||
Royal Gold, Inc. | 23,867 | 1,609,352 | ||||||
Eldorado Gold Corp. | 111,651 | 1,530,735 | ||||||
IAMGOLD Corp. | 86,313 | 1,368,061 | ||||||
Cia de Minas Buenaventura S.A. ADR | 34,072 | 1,306,321 | ||||||
Harmony Gold Mining Company Ltd. ADR | 96,394 | 1,122,026 | ||||||
Allied Nevada Gold Corp.* | 34,768 | 1,052,775 | ||||||
AuRico Gold, Inc.* | 122,606 | 982,074 | ||||||
New Gold, Inc.* | 85,986 | 866,739 | ||||||
Jaguar Mining, Inc.* | 128,356 | 818,911 | ||||||
US Gold Corp.* | 225,625 | 758,100 | ||||||
Novagold Resources, Inc.* | 78,169 | 662,873 | ||||||
Seabridge Gold, Inc.* | 16,900 | 272,259 | ||||||
Golden Star Resources Ltd.* | 157,780 | 260,337 | ||||||
|
| |||||||
Total Gold | 36,068,959 | |||||||
|
| |||||||
PRECIOUS METALS & MINERALS - 20.5% |
| |||||||
Silver Wheaton Corp. | 102,825 | 2,977,812 | ||||||
Coeur d’Alene Mines Corp.* | 57,744 | 1,393,940 | ||||||
Hecla Mining Co. | 261,995 | 1,370,234 | ||||||
Stillwater Mining Co.* | 118,884 | 1,243,527 | ||||||
Silver Standard Resources, Inc.* | 86,405 | 1,194,117 | ||||||
Pan American Silver Corp. | 52,103 | 1,136,367 | ||||||
Endeavour Silver Corp.* | 101,624 | 986,769 | ||||||
Silvercorp Metals, Inc. | 151,543 | 969,875 | ||||||
North American Palladium Ltd.* | 83,697 | 213,427 | ||||||
Gold Resource Corp. | 8,717 | 185,236 | ||||||
|
| |||||||
Total Precious Metals & Minerals | 11,671,304 | |||||||
|
| |||||||
DIVERSIFIED METALS & MINING - 15.8% |
| |||||||
Freeport-McMoRan Copper & Gold, Inc. | 162,481 | 5,977,676 | ||||||
Southern Copper Corp. | 60,827 | 1,835,759 | ||||||
Titanium Metals Corp. | 80,289 | 1,202,729 | ||||||
|
| |||||||
Total Diversified Metals & Mining | 9,016,164 | |||||||
|
| |||||||
Total Common Stocks | 56,756,427 | |||||||
|
| |||||||
FACE AMOUNT | VALUE | |||||||
|
|
|
| |||||
REPURCHASE AGREEMENT††,1 - 0.7% |
| |||||||
Credit Suisse Group | $ | 412,230 | $ | 412,230 | ||||
|
| |||||||
Total Repurchase Agreement | 412,230 | |||||||
|
| |||||||
Total Investments – 100.3% | $ | 57,168,657 | ||||||
|
| |||||||
Liabilities & Other Assets – (0.3)% | (186,622 | ) | ||||||
|
| |||||||
Total Net Assets – 100.0% | $ | 56,982,035 | ||||||
| * | Non-income producing security. |
| † | Value determined based on Level 1 inputs — See Note 4. |
| †† | Value determined based on Level 2 inputs — See Note 4. |
| 1 | Repurchase Agreement — See Note 5. |
| ADR — American Depositary Receipt |
| 86 | THE RYDEX FUNDSANNUALREPORT | See Notes to Financial Statements. |
PRECIOUS METALS FUND
STATEMENT OF ASSETS AND LIABILITIES |
| December 31, 2011 |
ASSETS: | ||||
Investments, at value | $ | 56,756,427 | ||
Repurchase agreements, at value | 412,230 | |||
|
| |||
Total Investments | 57,168,657 | |||
Receivables: | ||||
Securities sold | 492,527 | |||
Dividends | 24,232 | |||
Fund shares sold | 3,859 | |||
Interest | 17 | |||
|
| |||
Total assets | 57,689,292 | |||
|
| |||
LIABILITIES: | ||||
Payable for: | ||||
Fund shares redeemed | 490,939 | |||
Management fees | 41,167 | |||
Transfer agent and administrative fees | 13,722 | |||
Investor service fees | 13,722 | |||
Portfolio accounting fees | 5,489 | |||
Miscellaneous | 142,218 | |||
|
| |||
Total liabilities | 707,257 | |||
|
| |||
NETASSETS | $ | 56,982,035 | ||
|
| |||
NETASSETSCONSISTOF: | ||||
Paid in capital | $ | 34,365,449 | ||
Accumulated net investment loss | (434,262 | ) | ||
Accumulated net realized loss on investments | (4,741,618 | ) | ||
Net unrealized appreciation on investments | 27,792,466 | |||
|
| |||
Net assets | $ | 56,982,035 | ||
|
| |||
Capital shares outstanding | 3,948,542 | |||
Net asset value per share | $ | 14.43 | ||
|
|
STATEMENT OF OPERATIONS Year Ended December 31, 2011 |
INVESTMENT INCOME: | ||||
Dividends (net of foreign withholding tax of $41,265) | $ | 939,211 | ||
Interest | 190 | |||
|
| |||
Total investment income | 939,401 | |||
|
| |||
EXPENSES: | ||||
Management fees | 649,891 | |||
Transfer agent and administrative fees | 216,631 | |||
Investor service fees | 216,631 | |||
Portfolio accounting fees | 86,651 | |||
Custodian fees | 21,156 | |||
Trustees’ fees* | 8,923 | |||
Miscellaneous | 190,727 | |||
|
| |||
Total expenses | 1,390,610 | |||
|
| |||
Net investment loss | (451,209 | ) | ||
|
| |||
NET REALIZEDAND UNREALIZED GAIN (LOSS): | ||||
Net realized gain (loss) on: | ||||
Investments | 10,473,734 | |||
Foreign currency | 216 | |||
|
| |||
Net realized gain | 10,473,950 | |||
|
| |||
Net change in unrealized appreciation (depreciation) on: | ||||
Investments | (34,488,253 | ) | ||
Foreign currency | 10 | |||
|
| |||
Net change in unrealized appreciation (depreciation) | (34,488,243 | ) | ||
|
| |||
Net realized and unrealized loss | (24,014,293 | ) | ||
|
| |||
Net decrease in net assets resulting from operations | $ | (24,465,502 | ) | |
|
| |||
| * | Relates to Trustees not deemed “interested persons” within the meaning of Section 2(a)(19) of the 1940 Act. |
| See Notes to Financial Statements. | THE RYDEX FUNDSANNUALREPORT | 87 |
PRECIOUS METALS FUND
STATEMENTS OF CHANGES IN NET ASSETS
| Year Ended December 31, 2011 | Year Ended December 31, 2010 | |||||||
INCREASE (DECREASE) IN NET ASSETS FROM OPERATIONS: | ||||||||
Net investment loss | $ | (451,209 | ) | $ | (552,838 | ) | ||
Net realized gain on investments and foreign currency | 10,473,950 | 5,270,919 | ||||||
Net change in unrealized appreciation (depreciation) on investments and foreign currency | (34,488,243 | ) | 22,955,321 | |||||
|
|
|
| |||||
Net increase (decrease) in net assets resulting from operations | (24,465,502 | ) | 27,673,402 | |||||
|
|
|
| |||||
DISTRIBUTIONSTOSHAREHOLDERSFROM: | ||||||||
Net investment income | (57,336 | ) | (4,015 | ) | ||||
|
|
|
| |||||
Total distributions to shareholders | (57,336 | ) | (4,015 | ) | ||||
|
|
|
| |||||
CAPITALSHARETRANSACTIONS: | ||||||||
Proceeds from sale of shares | 183,853,930 | 240,075,819 | ||||||
Distributions reinvested | 57,336 | 4,015 | ||||||
Cost of shares redeemed | (219,905,170 | ) | (236,527,238 | ) | ||||
|
|
|
| |||||
Net increase (decrease) from capital share transactions | (35,993,904 | ) | 3,552,596 | |||||
|
|
|
| |||||
Net increase (decrease) in net assets | (60,516,742 | ) | 31,221,983 | |||||
NETASSETS: | ||||||||
Beginning of year | 117,498,777 | 86,276,794 | ||||||
|
|
|
| |||||
End of year | $ | 56,982,035 | $ | 117,498,777 | ||||
|
|
|
| |||||
Accumulated net investment loss at end of year | $ | (434,262 | ) | $ | (430,852 | ) | ||
|
|
|
| |||||
CAPITALSHAREACTIVITY: | ||||||||
Shares sold | 10,728,850 | 15,772,167 | ||||||
Shares issued from reinvestment of distributions | 3,387 | 228 | ||||||
Shares redeemed | (12,955,325 | ) | (15,859,244 | ) | ||||
|
|
|
| |||||
Net decrease in shares | (2,223,088 | ) | (86,849 | ) | ||||
|
|
|
| |||||
| 88 | THE RYDEX FUNDSANNUALREPORT | See Notes to Financial Statements. |
PRECIOUS METALS FUND
FINANCIAL HIGHLIGHTS
This table is presented to show selected data for a share outstanding throughout each period and to assist shareholders in evaluating a Fund’s performance for the periods presented.
| Year Ended December 31, 2011 | Year Ended December 31, 2010 | Year Ended December 31, 2009 | Year Ended December 31, 2008 | Year Ended December 31, 2007 | ||||||||||||||||
Per Share Data | ||||||||||||||||||||
Net asset value, beginning of period | $ | 19.04 | $ | 13.79 | $ | 9.24 | $ | 15.04 | $ | 12.58 | ||||||||||
|
|
|
|
|
|
|
|
|
| |||||||||||
Income (loss) from investment operations: | ||||||||||||||||||||
Net investment lossa | (.09 | ) | (.10 | ) | (.13 | ) | (.09 | ) | (.10 | ) | ||||||||||
Net gain (loss) on investments (realized and unrealized) | (4.51 | ) | 5.35 | 4.68 | (5.71 | ) | 2.56 | |||||||||||||
|
|
|
|
|
|
|
|
|
| |||||||||||
Total from investment operations | (4.60 | ) | 5.25 | 4.55 | (5.80 | ) | 2.46 | |||||||||||||
|
|
|
|
|
|
|
|
|
| |||||||||||
Less distributions from: | ||||||||||||||||||||
Net investment income | (.01 | ) | — | c | — | — | — | |||||||||||||
|
|
|
|
|
|
|
|
|
| |||||||||||
Total distributions | (.01 | ) | — | — | — | — | ||||||||||||||
|
|
|
|
|
|
|
|
|
| |||||||||||
Net asset value, end of period | $ | 14.43 | $ | 19.04 | $ | 13.79 | $ | 9.24 | $ | 15.04 | ||||||||||
|
|
|
|
|
|
|
|
|
| |||||||||||
Total Returnb | (24.16 | %) | 38.08 | % | 49.24 | % | (38.56 | %) | 19.55 | % | ||||||||||
|
|
|
|
|
|
|
|
|
| |||||||||||
Ratios/Supplemental Data | ||||||||||||||||||||
Net assets, end of period (in thousands) | $ | 56,982 | $ | 117,499 | $ | 86,277 | $ | 61,025 | $ | 91,613 | ||||||||||
|
|
|
|
|
|
|
|
|
| |||||||||||
Ratios to average net assets: | ||||||||||||||||||||
Net investment loss | (0.52 | %) | (0.66 | %) | (1.14 | %) | (0.66 | %) | (0.71 | %) | ||||||||||
Total expenses | 1.60 | % | 1.56 | % | 1.55 | % | 1.50 | % | 1.45 | % | ||||||||||
|
|
|
|
|
|
|
|
|
| |||||||||||
Portfolio turnover rate | 199 | % | 234 | % | 253 | % | 228 | % | 268 | % | ||||||||||
| a | Net investment loss per share was computed using average shares outstanding throughout the period. |
| b | Total return does not reflect the impact of any additional fees charged by insurance companies and has not been annualized. |
| c | Less than $0.01 per share. |
| See Notes to Financial Statements. | THE RYDEX FUNDSANNUALREPORT | 89 |
PERFORMANCE REPORT AND FUND PROFILE (Unaudited) | December 31, 2011 |
OBJECTIVE: Seeks to provide capital appreciation by investing in companies engaged in merchandising finished goods and services, including department stores, mail order operations and other companies involved in selling products to consumers (“Retailing Companies”).
Positive, yet slow, economic growth helped this sector, along with an accommodative Federal Reserve and easing commodity prices, all of which gave a boost to spending and stemmed fears of another recession. Retail sales rose 6.5% from November 2010 through November 2011, but momentum slowed in December 2011, a reaction to stagnating wage growth, economists said. Consumers have been dipping into savings to support spending since the summer, but that may not continue without more growth of jobs and wages.
For the year ended December 31, 2011, Retailing Fund rose 5.30%, compared with a gain of 2.11% for the S&P 500® Index*. Within the sector, heavily weighted specialty retail contributed most of the performance. Internet and catalog retail was the only industry detracting from performance.
Fund performance for the year benefited most from Wal-Mart Stores, Inc., TJX Companies, Inc. and Home Depot, Inc. Netflix, Inc., Staples, Inc. and Sears Holdings Corp. were the largest detractors from the Fund’s performance for the period.
| * | Standard & Poor’s 500 Index (S&P 500V) – a capitalization-weighted index covering 500 industrial, utility, transportation and financial companies of the U.S. markets (mostly NYSE Euronext issues). |
Performance displayed represents past performance which is no guarantee of future results.
Industry Diversification (Market Exposure as % of Net Assets)
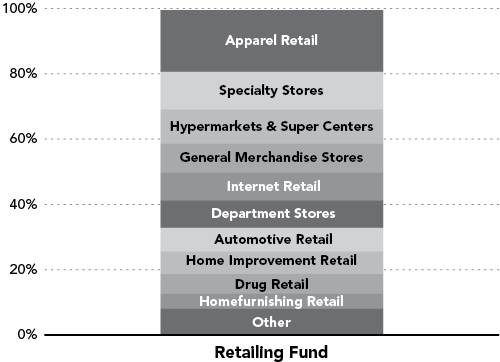
“Industry Diversification (Market Exposure as % of Net Assets)” excludes any temporary cash investments.
Inception Date: July 23, 2001
Ten Largest Holdings (% of Total Net Assets) | ||||
Wal-Mart Stores, Inc. | 7.0 | % | ||
Amazon.com, Inc. | 4.1 | % | ||
Home Depot, Inc. | 4.0 | % | ||
CVS Caremark Corp. | 3.6 | % | ||
Costco Wholesale Corp. | 2.9 | % | ||
Lowe’s Companies, Inc. | 2.8 | % | ||
Target Corp. | 2.8 | % | ||
Walgreen Co. | 2.6 | % | ||
TJX Companies, Inc. | 2.4 | % | ||
Priceline.com, Inc. | 2.3 | % | ||
|
| |||
Top Ten Total | 34.5 | % | ||
|
| |||
“Ten Largest Holdings” exclude any temporary cash or derivative investments.
| 90 | THE RYDEX FUNDSANNUALREPORT |
| PERFORMANCE REPORT AND FUND PROFILE (Unaudited) (concluded) | ||
Cumulative Fund Performance*
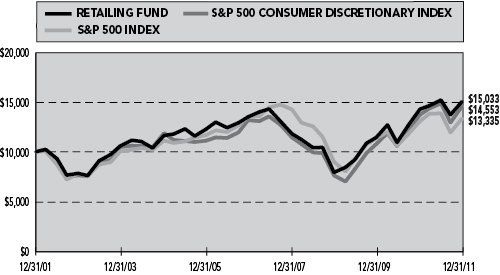
Average Annual Returns*
Periods Ended 12/31/11
| 1 Year | 5 Year | 10 Year | ||||||||||
Retailing Fund | 5.30 | % | 2.18 | % | 4.16 | % | ||||||
|
|
|
|
|
| |||||||
S&P 500 Consumer Discretionary Index | 6.13 | % | 2.02 | % | 3.82 | % | ||||||
|
|
|
|
|
| |||||||
S&P 500 Index | 2.11 | % | -0.25 | % | 2.92 | % | ||||||
|
|
|
|
|
| |||||||
| * | The performance data represents past performance that is not predictive of future results. The investment return and principal value of an investment in the Fund will fluctuate so that an investor’s shares, when redeemed, may be worth more or less than their original cost. Returns are historical and include changes in principal and reinvested dividends and capital gains and do not reflect the effect of taxes. The S&P 500 Index and S&P Consumer Discretionary Index are unmanaged indices and, unlike the Fund, have no management fees or operating expenses to reduce their reported returns. Returns do not reflect the impact of any additional fees charged by insurance companies. |
| THE RYDEX FUNDSANNUALREPORT | 91 |
| SCHEDULE OF INVESTMENTS | December 31, 2011 | |
| RETAILING FUND |
| SHARES | VALUE | |||||||
COMMON STOCKS† - 99.5% |
| |||||||
APPAREL RETAIL - 18.9% |
| |||||||
TJX Companies, Inc. | 4,918 | $ | 317,457 | |||||
Limited Brands, Inc. | 5,435 | 219,302 | ||||||
Ross Stores, Inc. | 4,432 | 210,653 | ||||||
The Gap, Inc. | 10,222 | 189,618 | ||||||
Urban Outfitters, Inc.* | 4,820 | 132,839 | ||||||
Abercrombie & Fitch Co. — Class A | 2,664 | 130,110 | ||||||
Foot Locker, Inc. | 4,929 | 117,507 | ||||||
American Eagle Outfitters, Inc. | 7,246 | 110,791 | ||||||
Guess?, Inc. | 3,653 | 108,932 | ||||||
Ascena Retail Group, Inc.* | 3,337 | 99,176 | ||||||
Buckle, Inc. | 2,194 | 89,669 | ||||||
Chico’s FAS, Inc. | 7,805 | 86,948 | ||||||
DSW, Inc. — Class A | 1,907 | 84,308 | ||||||
Men’s Wearhouse, Inc. | 2,541 | 82,354 | ||||||
Express, Inc.* | 4,080 | 81,355 | ||||||
Genesco, Inc.* | 1,270 | 78,410 | ||||||
ANN, Inc.* | 2,958 | 73,299 | ||||||
Jos A. Bank Clothiers, Inc.* | 1,476 | 71,970 | ||||||
Childrens Place Retail Stores, Inc.* | 1,319 | 70,065 | ||||||
Aeropostale, Inc.* | 4,401 | 67,115 | ||||||
Finish Line, Inc. — Class A | 3,130 | 60,362 | ||||||
|
| |||||||
Total Apparel Retail | 2,482,240 | |||||||
|
| |||||||
SPECIALTY STORES - 11.5% |
| |||||||
Staples, Inc. | 13,787 | 191,501 | ||||||
Tiffany & Co. | 2,745 | 181,884 | ||||||
PetSmart, Inc. | 3,027 | 155,255 | ||||||
Tractor Supply Co. | 1,971 | 138,266 | ||||||
Dick’s Sporting Goods, Inc. | 3,586 | 132,252 | ||||||
Sally Beauty Holdings, Inc.* | 6,094 | 128,766 | ||||||
Signet Jewelers Ltd. | 2,826 | 124,231 | ||||||
Ulta Salon Cosmetics & Fragrance, Inc.* | 1,860 | 120,751 | ||||||
GNC Holdings, Inc. — Class A* | 3,850 | 111,458 | ||||||
Cabela’s, Inc.* | 3,383 | 85,996 | ||||||
Vitamin Shoppe, Inc.* | 1,780 | 70,986 | ||||||
Hibbett Sports, Inc.* | 1,502 | 67,860 | ||||||
|
| |||||||
Total Specialty Stores | 1,509,206 | |||||||
|
| |||||||
HYPERMARKETS & SUPER CENTERS - 10.6% |
| |||||||
Wal-Mart Stores, Inc. | 15,399 | 920,244 | ||||||
Costco Wholesale Corp. | 4,544 | 378,606 | ||||||
Pricesmart, Inc. | 1,332 | 92,694 | ||||||
|
| |||||||
Total Hypermarkets & Super Centers | 1,391,544 | |||||||
|
| |||||||
GENERAL MERCHANDISE STORES - 8.7% |
| |||||||
Target Corp. | 7,091 | 363,201 | ||||||
Dollar General Corp.* | 5,662 | 232,935 | ||||||
Dollar Tree, Inc.* | 2,392 | 198,799 | ||||||
Family Dollar Stores, Inc. | 2,860 | 164,908 | ||||||
Big Lots, Inc.* | 2,650 | 100,064 | ||||||
99 Cents Only Stores* | 3,600 | 79,020 | ||||||
|
| |||||||
Total General Merchandise Stores | 1,138,927 | |||||||
|
| |||||||
INTERNET RETAIL - 8.6% |
| |||||||
Amazon.com, Inc.* | 3,133 | 542,322 | ||||||
Priceline.com, Inc.* | 655 | 306,350 | ||||||
Netflix, Inc.* | 1,662 | 115,160 | ||||||
Expedia, Inc. | 3,068 | 89,019 | ||||||
TripAdvisor, Inc.* | 3,068 | 77,332 | ||||||
|
| |||||||
Total Internet Retail | 1,130,183 | |||||||
|
| |||||||
DEPARTMENT STORES - 8.4% |
| |||||||
Macy’s, Inc. | 7,244 | 233,112 | ||||||
Kohl’s Corp. | 4,430 | 218,621 | ||||||
Nordstrom, Inc. | 4,156 | 206,595 | ||||||
JC Penney Company, Inc. | 5,109 | 179,581 | ||||||
Dillard’s, Inc. — Class A | 2,117 | 95,011 | ||||||
Sears Holdings Corp.* | 2,757 | 87,617 | ||||||
Saks, Inc.* | 8,266 | 80,594 | ||||||
|
| |||||||
Total Department Stores | 1,101,131 | |||||||
|
| |||||||
AUTOMOTIVE RETAIL - 7.2% |
| |||||||
AutoZone, Inc.* | 689 | 223,904 | ||||||
O’Reilly Automotive, Inc.* | 2,522 | 201,634 | ||||||
CarMax, Inc.* | 5,426 | 165,384 | ||||||
AutoNation, Inc.* | 3,914 | 144,309 | ||||||
Advance Auto Parts, Inc. | 2,065 | 143,786 | ||||||
Group 1 Automotive, Inc. | 1,340 | 69,412 | ||||||
|
| |||||||
Total Automotive Retail | 948,429 | |||||||
|
| |||||||
HOME IMPROVEMENT RETAIL - 6.8% |
| |||||||
Home Depot, Inc. | 12,449 | 523,356 | ||||||
Lowe’s Companies, Inc. | 14,339 | 363,924 | ||||||
Orchard Supply Hardware Stores Corp. — Class A*,†††,1 | 119 | 897 | ||||||
|
| |||||||
Total Home Improvement Retail | 888,177 | |||||||
|
| |||||||
DRUG RETAIL - 6.2% |
| |||||||
CVS Caremark Corp. | 11,726 | 478,186 | ||||||
Walgreen Co. | 10,235 | 338,369 | ||||||
|
| |||||||
Total Drug Retail | 816,555 | |||||||
|
| |||||||
HOMEFURNISHING RETAIL - 4.5% |
| |||||||
Bed Bath & Beyond, Inc.* | 3,988 | 231,184 | ||||||
Williams-Sonoma, Inc. | 3,259 | 125,472 | ||||||
Aaron’s, Inc. | 3,337 | 89,031 | ||||||
Pier 1 Imports, Inc.* | 5,617 | 78,245 | ||||||
Select Comfort Corp.* | 3,340 | 72,445 | ||||||
|
| |||||||
Total Homefurnishing Retail | 596,377 | |||||||
|
| |||||||
COMPUTER & ELECTRONICS RETAIL - 3.3% |
| |||||||
Best Buy Company, Inc. | 7,195 | 168,147 | ||||||
GameStop Corp. — Class A* | 4,655 | 112,325 | ||||||
Rent-A-Center, Inc. | 2,563 | 94,831 | ||||||
RadioShack Corp. | 5,998 | 58,241 | ||||||
|
| |||||||
Total Computer & Electronics Retail | 433,544 | |||||||
|
| |||||||
| 92 | THE RYDEX FUNDSANNUALREPORT | See Notes to Financial Statements. |
| SCHEDULE OF INVESTMENTS (concluded) | December 31, 2011 | |
| RETAILING FUND |
| SHARES | VALUE | |||||||
DISTRIBUTORS - 2.5% |
| |||||||
Genuine Parts Co. | 3,261 | $ | 199,573 | |||||
LKQ Corp.* | 4,414 | 132,773 | ||||||
|
| |||||||
Total Distributors | 332,346 | |||||||
|
| |||||||
CATALOG RETAIL - 2.3% |
| |||||||
Liberty Interactive Corp. — Class A* | 12,421 | 201,407 | ||||||
HSN, Inc. | 2,570 | 93,188 | ||||||
|
| |||||||
Total Catalog Retail | 294,595 | |||||||
|
| |||||||
Total Common Stocks | 13,063,254 | |||||||
|
| |||||||
PREFERRED STOCKS†† - 0.0% |
| |||||||
Orchard Supply Hardware — Class A*,†††,1,2 | 119 | — | ||||||
|
| |||||||
Total Preferred Stocks | — | |||||||
|
| |||||||
| FACE AMOUNT | ||||||||
REPURCHASE AGREEMENT††,3 - 0.7% |
| |||||||
Credit Suisse Group issued 12/30/11 at 0.00% due 01/03/12 | $ | 95,139 | 95,139 | |||||
|
| |||||||
Total Repurchase Agreement | 95,139 | |||||||
|
| |||||||
Total Investments - 100.2% | $ | 13,158,393 | ||||||
|
| |||||||
Liabilities & Other Assets - (0.2)% | (24,567 | ) | ||||||
|
| |||||||
Total Net Assets - 100.0% | $ | 13,133,826 | ||||||
| * | Non-income producing security. |
| † | Value determined based on Level 1 inputs, except otherwise noted — See Note 4. |
| †† | Value determined based on Level 2 inputs — See Note 4. |
| ††† | Value determined based on Level 3 inputs — See Note 4. |
| 1 | Illiquid security. |
| 2 | Perpetual maturity. |
| 3 | Repurchase Agreement — See Note 5. |
| See Notes to Financial Statements. | THE RYDEX FUNDSANNUALREPORT | 93 |
RETAILING FUND
STATEMENT OF ASSETS AND LIABILITIES
December 31, 2011
ASSETS: | ||||
Investments, at value | $ | 13,063,254 | ||
Repurchase agreements, at value | 95,139 | |||
|
| |||
Total Investments | 13,158,393 | |||
Receivables: | ||||
Securities sold | 550,424 | |||
Fund shares sold | 31,273 | |||
Dividends | 14,106 | |||
|
| |||
Total assets | 13,754,196 | |||
|
| |||
LIABILITIES: | ||||
Overdraft due to custodian bank | 453 | |||
Payable for: | ||||
Fund shares redeemed | 591,240 | |||
Management fees | 8,958 | |||
Transfer agent and administrative fees | 2,634 | |||
Investor service fees | 2,634 | |||
Portfolio accounting fees | 1,054 | |||
Miscellaneous | 13,397 | |||
|
| |||
Total liabilities | 620,370 | |||
|
| |||
NETASSETS | $ | 13,133,826 | ||
|
| |||
NETASSETSCONSISTOF: | ||||
Paid in capital | $ | 12,153,154 | ||
Undistributed net investment income | — | |||
Accumulated net realized loss on investments | (2,225,932 | ) | ||
Net unrealized appreciation on investments | 3,206,604 | |||
|
| |||
Net assets | $ | 13,133,826 | ||
|
| |||
Capital shares outstanding | 917,554 | |||
Net asset value per share | $ | 14.31 | ||
|
| |||
STATEMENT OF OPERATIONS
Year Ended December 31, 2011
INVESTMENT INCOME: | ||||
Dividends | $ | 122,511 | ||
Interest | 14 | |||
|
| |||
Total investment income | 122,525 | |||
|
| |||
EXPENSES: | ||||
Management fees | 69,945 | |||
Transfer agent and administrative fees | 20,572 | |||
Investor service fees | 20,572 | |||
Portfolio accounting fees | 8,229 | |||
Custodian fees | 2,065 | |||
Trustees’ fees* | 784 | |||
Miscellaneous | 17,189 | |||
|
| |||
Total expenses | 139,356 | |||
|
| |||
Net investment loss | (16,831 | ) | ||
|
| |||
NET REALIZEDAND UNREALIZED GAIN (LOSS): | ||||
Net realized gain (loss) on: | ||||
Investments | (21,705 | ) | ||
|
| |||
Net realized loss | (21,705 | ) | ||
|
| |||
Net change in unrealized appreciation (depreciation) on: | ||||
Investments | 20,796 | |||
|
| |||
Net change in unrealized appreciation (depreciation) | 20,796 | |||
|
| |||
Net realized and unrealized loss | (909 | ) | ||
|
| |||
Net decrease in net assets resulting from operations | $ | (17,740 | ) | |
|
|
| * | Relates to Trustees not deemed “interested persons” within the meaning of Section 2(a)(19) of the 1940 Act. |
| 94 | THE RYDEX FUNDSANNUALREPORT | See Notes to Financial Statements. |
RETAILING FUND
STATEMENTS OF CHANGES IN NET ASSETS
| Year Ended December 31, 2011 | Year Ended December 31, 2010 | |||||||
INCREASE (DECREASE) IN NET ASSETS FROM OPERATIONS: | ||||||||
Net investment loss | $ | (16,831 | ) | $ | (29,541 | ) | ||
Net realized gain (loss) on investments | (21,705 | ) | 2,072,295 | ) | ||||
Net change in unrealized appreciation (depreciation) on investments | 20,796 | (1,447,985 | ) | |||||
|
|
|
| |||||
Net increase (decrease) in net assets resulting from operations | (17,740 | ) | 594,769 | |||||
|
|
|
| |||||
CAPITALSHARETRANSACTIONS: | ||||||||
Proceeds from sale of shares | 68,024,037 | 82,623,625 | ||||||
Cost of shares redeemed | (64,349,394 | ) | (89,229,867 | ) | ||||
|
|
|
| |||||
Net increase (decrease) from capital share transactions | 3,674,643 | (6,606,242 | ) | |||||
|
|
|
| |||||
Net increase (decrease) in net assets | 3,656,903 | (6,011,473 | ) | |||||
NETASSETS: | ||||||||
Beginning of year | 9,476,923 | 15,488,396 | ||||||
|
|
|
| |||||
End of year | $ | 13,133,826 | $ | 9,476,923 | ||||
|
|
|
| |||||
Undistributed net investment income at end of year | $ | — | $ | — | ||||
|
|
|
| |||||
CAPITALSHAREACTIVITY: | ||||||||
Shares sold | 4,836,611 | 6,993,103 | ||||||
Shares redeemed | (4,616,407 | ) | (7,722,176 | ) | ||||
|
|
|
| |||||
Net increase (decrease) in shares | 220,204 | (729,073 | ) | |||||
|
|
|
| |||||
| See Notes to Financial Statements. | THE RYDEX FUNDSANNUALREPORT | 95 |
RETAILING FUND
FINANCIAL HIGHLIGHTS
This table is presented to show selected data for a share outstanding throughout each period and to assist shareholders in evaluating a Fund’s performance for the periods presented.
| Year Ended December 31, 2011 | Year Ended December 31, 2010 | Year Ended December 31, 2009 | Year Ended December 31, 2008 | Year Ended December 31, 2007 | ||||||||||||||||
Per Share Data | ||||||||||||||||||||
Net asset value, beginning of period | $ | 13.59 | $ | 10.86 | $ | 7.53 | $ | 11.27 | $ | 29.78 | ||||||||||
|
|
|
|
|
|
|
|
|
| |||||||||||
Income (loss) from investment operations: | ||||||||||||||||||||
Net investment lossa | (.03 | ) | (.03 | ) | (.02 | ) | (.02 | ) | (.24 | ) | ||||||||||
Net gain (loss) on investments (realized and unrealized) | .75 | 2.76 | 3.35 | (3.70 | ) | (2.95 | ) | |||||||||||||
|
|
|
|
|
|
|
|
|
| |||||||||||
Total from investment operations | .72 | 2.73 | 3.33 | (3.72 | ) | (3.19 | ) | |||||||||||||
|
|
|
|
|
|
|
|
|
| |||||||||||
Less distributions from: | ||||||||||||||||||||
Net realized gains | — | — | — | (.02 | ) | (15.32 | ) | |||||||||||||
|
|
|
|
|
|
|
|
|
| |||||||||||
Total distributions | — | — | — | (.02 | ) | (15.32 | ) | |||||||||||||
|
|
|
|
|
|
|
|
|
| |||||||||||
Net asset value, end of period | $ | 14.31 | $ | 13.59 | $ | 10.86 | $ | 7.53 | $ | 11.27 | ||||||||||
|
|
|
|
|
|
|
|
|
| |||||||||||
Total Returnb | 5.30 | % | 25.14 | % | 44.22 | % | (32.95 | %) | (12.60 | %) | ||||||||||
Ratios/Supplemental Data | ||||||||||||||||||||
Net assets, end of period (in thousands) | $ | 13,134 | $ | 9,477 | $ | 15,488 | $ | 13,621 | $ | 4,651 | ||||||||||
|
|
|
|
|
|
|
|
|
| |||||||||||
Ratios to average net assets: | ||||||||||||||||||||
Net investment loss | (0.20 | %) | (0.24 | %) | (0.19 | %) | (0.17 | %) | (0.81 | %) | ||||||||||
Total expenses | 1.69 | % | 1.65 | % | 1.65 | % | 1.62 | % | 1.60 | % | ||||||||||
|
|
|
|
|
|
|
|
|
| |||||||||||
Portfolio turnover rate | 621 | % | 616 | % | 470 | % | 460 | % | 182 | % | ||||||||||
| a | Net investment loss per share was computed using average shares outstanding throughout the period. |
| b | Total return does not reflect the impact of any additional fees charged by insurance companies and has not been annualized. |
| 96 | THE RYDEX FUNDSANNUALREPORT | See Notes to Financial Statements. |
This page intentionally left blank.
| THE RYDEX FUNDSANNUALREPORT | 97 |
| PERFORMANCE REPORT AND FUND PROFILE (Unaudited) | December 31, 2011 |
OBJECTIVE: Seeks to provide capital appreciation by investing in companies that are involved in the technology sector, including computer software and service companies, semiconductor manufacturers, networking and telecommunications equipment manufacturers, PC hardware and peripherals companies (“Technology Companies”).
Technology stocks underperformed the broader market due a range of factors, including inventory worries, management turnover and supply chain concerns in Japan and Thailand. In addition, demand in consumer-related electronics and public-sector spending has been weak. The sector could benefit if investors focus on fundamentals, as companies in the sector offer healthy balance sheets and growing dividends.
For the year ended December 31, 2011, Technology Fund returned -9.20%, compared with a gain of 2.11% for the S&P 500® Index*. Within the sector, software, semiconductors and communications equipment accounted for most all the loss for the year. IT services was the largest contributor to return.
Top-contributing stocks were Apple, Inc., International Business Machines Corp. and MasterCard, Inc., while Research in Motion Ltd., Hewlett-Packard Co. and First Solar, Inc. were the weakest-performing technology stocks for the period.
| * | Standard & Poor’s 500 Index (S&P 500®) – a capitalization-weighted index covering 500 industrial, utility, transportation and financial companies of the U.S. markets (mostly NYSE Euronext issues). |
Performance displayed represents past performance which is no guarantee of future results.
Industry Diversification (Market Exposure as % of Net Assets)

“Industry Diversification (Market Exposure as % of Net Assets)” excludes any temporary cash investments.
Inception Date: May 2, 2001
Ten Largest Holdings (% of Total Net Assets) | ||||
Apple, Inc. | 4.9 | % | ||
International Business Machines Corp. | 3.6 | % | ||
Google, Inc. — Class A | 3.6 | % | ||
Microsoft Corp. | 3.6 | % | ||
Intel Corp. | 2.8 | % | ||
Oracle Corp. | 2.6 | % | ||
Cisco Systems, Inc. | 2.4 | % | ||
QUALCOMM, Inc. | 2.4 | % | ||
Visa, Inc. — Class A | 2.1 | % | ||
Hewlett-Packard Co. | 1.7 | % | ||
|
| |||
Top Ten Total | 29.7 | % | ||
|
| |||
“Ten Largest Holdings” exclude any temporary cash or derivative investments.
| 98 | THE RYDEX FUNDSANNUALREPORT |
PERFORMANCE REPORT AND FUND PROFILE (Unaudited) (concluded)
Cumulative Fund Performance*
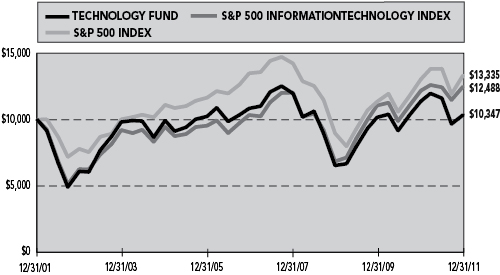
Average Annual Returns* Periods Ended 12/31/11
| ||||||||||||
| 1 Year | 5 Year | 10 Year | ||||||||||
Technology Fund | -9.20 | % | -0.94 | % | 0.34 | % | ||||||
|
|
|
|
|
| |||||||
S&P 500 Information Technology Index | 2.41 | % | 3.83 | % | 2.25 | % | ||||||
|
|
|
|
|
| |||||||
S&P 500 Index | 2.11 | % | -0.25 | % | 2.92 | % | ||||||
|
|
|
|
|
| |||||||
| * | The performance data represents past performance that is not predictive of future results. The investment return and principal value of an investment in the Fund will fluctuate so that an investor’s shares, when redeemed, may be worth more or less than their original cost. Returns are historical and include changes in principal and reinvested dividends and capital gains and do not reflect the effect of taxes. The S&P 500 Index and S&P 500 Information Technology Index are unmanaged indices and, unlike the Fund, have no management fees or operating expenses to reduce their reported returns. Returns do not reflect the impact of any additional fees charged by insurance companies. |
| THE RYDEX FUNDSANNUALREPORT | 99 |
| SCHEDULE OF INVESTMENTS | December 31, 2011 |
TECHNOLOGY FUND
| SHARES | VALUE | |||||||
COMMON STOCKS† - 99.7% |
| |||||||
SEMICONDUCTORS - 15.6% |
| |||||||
Intel Corp. | 11,358 | $ | 275,431 | |||||
Texas Instruments, Inc. | 4,827 | 140,514 | ||||||
Taiwan Semiconductor Manufacturing Company Ltd. ADR | 8,641 | 111,555 | ||||||
ARM Holdings plc ADR | 3,893 | 107,719 | ||||||
Broadcom Corp. — Class A* | 3,358 | 98,591 | ||||||
Altera Corp. | 2,346 | 87,037 | ||||||
Analog Devices, Inc. | 2,237 | 80,040 | ||||||
NVIDIA Corp.* | 5,238 | 72,599 | ||||||
Xilinx, Inc. | 2,209 | 70,821 | ||||||
Marvell Technology Group Ltd.* | 5,096 | 70,580 | ||||||
Maxim Integrated Products, Inc. | 2,571 | 66,949 | ||||||
Microchip Technology, Inc. | 1,796 | 65,787 | ||||||
Avago Technologies Ltd. | 2,264 | 65,339 | ||||||
Linear Technology Corp. | 2,140 | 64,264 | ||||||
Micron Technology, Inc.* | 10,139 | 63,774 | ||||||
Advanced Micro Devices, Inc.* | 9,160 | 49,464 | ||||||
Atmel Corp.* | 5,857 | 47,442 | ||||||
|
| |||||||
Total Semiconductors | 1,537,906 | |||||||
|
| |||||||
INTERNET SOFTWARE & SERVICES - 11.9% |
| |||||||
Google, Inc. — Class A* | 544 | 351,370 | ||||||
Baidu, Inc. ADR* | 1,427 | 166,203 | ||||||
eBay, Inc.* | 4,975 | 150,892 | ||||||
Yahoo!, Inc.* | 7,021 | 113,249 | ||||||
Akamai Technologies, Inc.* | 1,991 | 64,269 | ||||||
LinkedIn Corp. — Class A* | 963 | 60,679 | ||||||
VeriSign, Inc. | 1,597 | 57,045 | ||||||
Rackspace Hosting, Inc.* | 1,294 | 55,655 | ||||||
Equinix, Inc.* | 538 | 54,553 | ||||||
Sina Corp.* | 999 | 51,948 | ||||||
Youku, Inc. ADR* | 2,768 | 43,375 | ||||||
|
| |||||||
Total Internet Software & Services | 1,169,238 | |||||||
|
| |||||||
COMMUNICATIONS EQUIPMENT - 11.7% |
| |||||||
Cisco Systems, Inc. | 13,053 | 235,998 | ||||||
QUALCOMM, Inc. | 4,293 | 234,827 | ||||||
Nokia Oyj ADR | 21,588 | 104,054 | ||||||
Motorola Solutions, Inc. | 2,012 | 93,135 | ||||||
Juniper Networks, Inc.* | 4,125 | 84,191 | ||||||
Motorola Mobility Holdings, Inc.* | 2,107 | 81,752 | ||||||
Research In Motion Ltd.* | 5,222 | 75,719 | ||||||
F5 Networks, Inc.* | 662 | 70,251 | ||||||
Telefonaktiebolaget LM Ericsson — Class B ADR | 6,858 | 69,472 | ||||||
Harris Corp. | 1,402 | 50,528 | ||||||
Riverbed Technology, Inc.* | 2,050 | 48,175 | ||||||
|
| |||||||
Total Communications Equipment | 1,148,102 | |||||||
|
| |||||||
COMPUTER HARDWARE - 11.5% |
| |||||||
Apple, Inc.* | 1,195 | 483,975 | ||||||
International Business Machines Corp. | 1,937 | 356,176 | ||||||
Hewlett-Packard Co. | 6,686 | 172,231 | ||||||
Dell, Inc.* | 8,317 | 121,678 | ||||||
|
| |||||||
Total Computer Hardware | 1,134,060 | |||||||
|
| |||||||
SYSTEMS SOFTWARE - 11.3% |
| |||||||
Microsoft Corp. | 13,487 | 350,122 | ||||||
Oracle Corp. | 10,087 | 258,732 | ||||||
VMware, Inc. — Class A* | 1,778 | 147,912 | ||||||
Symantec Corp.* | 5,260 | 82,319 | ||||||
Check Point Software Technologies Ltd.* | 1,504 | 79,020 | ||||||
CA, Inc. | 3,813 | 77,080 | ||||||
Red Hat, Inc.* | 1,548 | 63,917 | ||||||
BMC Software, Inc.* | 1,716 | 56,250 | ||||||
|
| |||||||
Total Systems Software | 1,115,352 | |||||||
|
| |||||||
DATA PROCESSING & OUTSOURCED SERVICES - 10.1% |
| |||||||
Visa, Inc. — Class A | 2,003 | 203,365 | ||||||
Mastercard, Inc. — Class A | 460 | 171,497 | ||||||
Automatic Data Processing, Inc. | 2,335 | 126,113 | ||||||
Western Union Co. | 4,440 | 81,074 | ||||||
Paychex, Inc. | 2,641 | 79,520 | ||||||
Fiserv, Inc.* | 1,189 | 69,842 | ||||||
Fidelity National Information Services, Inc. | 2,581 | 68,629 | ||||||
Alliance Data Systems Corp.* | 523 | 54,308 | ||||||
VeriFone Systems, Inc.* | 1,380 | 49,018 | ||||||
Total System Services, Inc. | 2,480 | 48,509 | ||||||
Computer Sciences Corp. | 1,844 | 43,703 | ||||||
|
| |||||||
Total Data Processing & Outsourced Services | 995,578 | |||||||
|
| |||||||
APPLICATION SOFTWARE - 7.4% |
| |||||||
Intuit, Inc. | 1,824 | 95,924 | ||||||
SAP AG ADR | 1,807 | 95,681 | ||||||
Salesforce.com, Inc.* | 901 | 91,415 | ||||||
Adobe Systems, Inc.* | 3,126 | 88,372 | ||||||
Citrix Systems, Inc.* | 1,324 | 80,393 | ||||||
Nuance Communications, Inc.* | 2,650 | 66,674 | ||||||
Autodesk, Inc.* | 2,067 | 62,692 | ||||||
TIBCO Software, Inc.* | 2,063 | 49,326 | ||||||
Factset Research Systems, Inc. | 560 | 48,877 | ||||||
Informatica Corp.* | 1,250 | 46,162 | ||||||
|
| |||||||
Total Application Software | 725,516 | |||||||
|
| |||||||
IT CONSULTING & OTHER SERVICES - 5.1% |
| |||||||
Accenture plc — Class A | 2,857 | 152,078 | ||||||
Infosys Ltd. ADR | 2,570 | 132,047 | ||||||
Cognizant Technology Solutions Corp. - Class A* | 1,644 | 105,726 | ||||||
| 100 | THE RYDEX FUNDSANNUALREPORT | See Notes to Financial Statements. |
| SCHEDULE OF INVESTMENTS (concluded) | December 31, 2011 | |
| TECHNOLOGY FUND |
| SHARES | VALUE | |||||||
Teradata Corp.* | 1,432 | $ | 69,466 | |||||
SAIC, Inc.* | 4,000 | 49,160 | ||||||
|
| |||||||
Total IT Consulting & Other Services | 508,477 | |||||||
|
| |||||||
COMPUTER STORAGE & PERIPHERALS - 4.7% |
| |||||||
EMC Corp.* | 7,332 | 157,931 | ||||||
NetApp, Inc.* | 2,386 | 86,540 | ||||||
SanDisk Corp.* | 1,699 | 83,608 | ||||||
Seagate Technology plc | 4,040 | 66,256 | ||||||
Western Digital Corp.* | 2,099 | 64,964 | ||||||
|
| |||||||
Total Computer Storage & Peripherals | 459,299 | |||||||
|
| |||||||
SEMICONDUCTOR EQUIPMENT - 3.3% |
| |||||||
ASML Holding N.V. ADR | 2,537 | 106,021 | ||||||
Applied Materials, Inc. | 8,736 | 93,563 | ||||||
KLA-Tencor Corp. | 1,468 | 70,831 | ||||||
Lam Research Corp.* | 1,485 | 54,975 | ||||||
|
| |||||||
Total Semiconductor Equipment | 325,390 | |||||||
|
| |||||||
ELECTRONIC COMPONENTS - 1.8% |
| |||||||
Corning, Inc. | 8,418 | 109,266 | ||||||
Amphenol Corp. — Class A | 1,539 | 69,855 | ||||||
|
| |||||||
Total Electronic Components | 179,121 | |||||||
|
| |||||||
HOME ENTERTAINMENT SOFTWARE - 1.5% |
| |||||||
Activision Blizzard, Inc. | 7,454 | 91,833 | ||||||
Electronic Arts, Inc.* | 3,011 | 62,027 | ||||||
|
| |||||||
Total Home Entertainment Software | 153,860 | |||||||
|
| |||||||
ELECTRONIC MANUFACTURING SERVICES - 1.4% |
| |||||||
TE Connectivity Ltd. | 2,890 | 89,041 | ||||||
Jabil Circuit, Inc. | 2,480 | 48,757 | ||||||
|
| |||||||
Total Electronic Manufacturing Services | 137,798 | |||||||
|
| |||||||
OFFICE ELECTRONICS - 0.8% |
| |||||||
Xerox Corp. | 10,048 | 79,982 | ||||||
|
| |||||||
TECHNOLOGY DISTRIBUTORS - 0.6% |
| |||||||
Avnet, Inc.* | 1,746 | 54,283 | ||||||
|
| |||||||
ELECTRICAL COMPONENTS & EQUIPMENT - 0.5% |
| |||||||
First Solar, Inc.* | 1,513 | 51,079 | ||||||
|
| |||||||
ELECTRONIC EQUIPMENT & INSTRUMENTS - 0.5% |
| |||||||
FLIR Systems, Inc. | 1,872 | 46,931 | ||||||
|
| |||||||
Total Common Stocks | 9,821,972 | |||||||
|
| |||||||
| FACE AMOUNT | VALUE | |||||||
REPURCHASE AGREEMENT††,1 - 0.8% |
| |||||||
Credit Suisse Group issued 12/30/11 at 0.00%due 01/03/12 | 85,852 | 85,852 | ||||||
|
| |||||||
Total Repurchase Agreement | 85,852 | |||||||
|
| |||||||
Total Investments - 100.5% | $ | 9,907,824 | ||||||
|
| |||||||
Liabilities & Other Assets - (0.5)% | (54,000 | ) | ||||||
|
| |||||||
Total Net Assets - 100.0% | $ | 9,853,824 | ||||||
| * | Non-income producing security. |
| † | Value determined based on Level 1 inputs — See Note 4. |
| †† | Value determined based on Level 2 inputs — See Note 4. |
| 1 | Repurchase Agreement — See Note 5. |
| ADR — American Depositary Receipt |
| plc — Public Limited Company |
| See Notes to Financial Statements. | THE RYDEX FUNDSANNUALREPORT | 101 |
TECHNOLOGY FUND
STATEMENT OF ASSETS AND LIABILITIES
December 31, 2011
ASSETS: | ||||
Investments, at value | $ | 9,821,972 | ||
Repurchase agreements, at value | 85,852 | |||
|
| |||
Total Investments | 9,907,824 | |||
Receivables: | ||||
Securities sold | 723,986 | |||
Dividends | 3,865 | |||
|
| |||
Total assets | 10,635,675 | |||
|
| |||
LIABILITIES: | ||||
Payable for: | ||||
Fund shares redeemed | 742,855 | |||
Management fees | 8,083 | |||
Transfer agent and administrative fees | 2,378 | |||
Investor service fees | 2,378 | |||
Portfolio accounting fees | 951 | |||
Miscellaneous | 25,206 | |||
|
| |||
Total liabilities | 781,851 | |||
|
| |||
NETASSETS | $ | 9,853,824 | ||
|
| |||
NETASSETSCONSISTOF: | ||||
Paid in capital | $ | 8,088,907 | ||
Undistributed net investment income | 1 | |||
Accumulated net realized loss on investments | (2,091,199 | ) | ||
Net unrealized appreciation on investments | 3,856,115 | |||
|
| |||
Net assets | $ | 9,853,824 | ||
|
| |||
Capital shares outstanding | 925,932 | |||
Net asset value per share | $ | 10.64 | ||
|
|
STATEMENT OF OPERATIONS
Year Ended December 31, 2011
INVESTMENT INCOME: | ||||
Dividends (net of foreign withholding tax of $2,062) | $ | 138,686 | ||
Interest | 37 | |||
|
| |||
Total investment income | 138,723 | |||
|
| |||
EXPENSES: | ||||
Management fees | 125,144 | |||
Transfer agent and administrative fees | 36,807 | |||
Investor service fees | 36,807 | |||
Portfolio accounting fees | 14,723 | |||
Custodian fees | 3,562 | |||
Trustees’ fees* | 1,471 | |||
Miscellaneous | 33,674 | |||
|
| |||
Total expenses | 252,188 | |||
|
| |||
Net investment loss | (113,465 | ) | ||
|
| |||
NET REALIZEDAND UNREALIZED GAIN (LOSS): | ||||
Net realized gain (loss) on: | ||||
Investments | 2,878,361 | |||
|
| |||
Net realized gain | 2,878,361 | |||
|
| |||
Net change in unrealized appreciation (depreciation) on: | ||||
Investments | (3,593,757 | ) | ||
|
| |||
Net change in unrealized appreciation (depreciation) | (3,593,757 | ) | ||
|
| |||
Net realized and unrealized loss | (715,396 | ) | ||
|
| |||
Net decrease in net assets resulting from operations | $ | (828,861 | ) | |
|
|
| * | Relates to Trustees not deemed “interested persons” within the meaning of Section 2(a)(19) of the 1940 Act. |
| 102 | THE RYDEX FUNDSANNUALREPORT | See Notes to Financial Statements. |
TECHNOLOGY FUND
STATEMENTS OF CHANGES IN NET ASSETS
| Year Ended December 31, 2011 | Year Ended December 31, 2010 | |||||||
INCREASE (DECREASE) IN NET ASSETS FROM OPERATIONS: | ||||||||
Net investment loss | $ | (113,465 | ) | $ | (175,615 | ) | ||
Net realized gain on investments | 2,878,361 | 3,361,174 | ||||||
Net change in unrealized appreciation (depreciation) on investments | (3,593,757 | ) | (2,800,102 | ) | ||||
|
|
|
| |||||
Net increase (decrease) in net assets resulting from operations | (828,861 | ) | 385,457 | |||||
|
|
|
| |||||
DISTRIBUTIONSTO SHAREHOLDERS FROM: | ||||||||
Net realized gains | (598,420 | ) | — | |||||
|
|
|
| |||||
Total distributions to shareholders | (598,420 | ) | — | |||||
|
|
|
| |||||
CAPITAL SHARE TRANSACTIONS: | ||||||||
Proceeds from sale of shares | 63,506,888 | 95,797,480 | ||||||
Distributions reinvested | 598,420 | — | ||||||
Cost of shares redeemed | (74,292,022 | ) | (114,681,744 | ) | ||||
|
|
|
| |||||
Net decrease from capital share transactions | (10,186,714 | ) | (18,884,264 | ) | ||||
|
|
|
| |||||
Net decrease in net assets | (11,613,995 | ) | (18,498,807 | ) | ||||
Net assets: | ||||||||
Beginning of year | 21,467,819 | 39,966,626 | ||||||
|
|
|
| |||||
End of year | $ | 9,853,824 | $ | 21,467,819 | ||||
|
|
|
| |||||
Undistributed net investment income at end of year | $ | 1 | $ | — | ||||
|
|
|
| |||||
CAPITALSHAREACTIVITY: | ||||||||
Shares sold | 5,214,557 | 8,653,254 | ||||||
Shares issued from reinvestment of distributions | 53,098 | — | ||||||
Shares redeemed | (6,087,893 | ) | (10,550,362 | ) | ||||
|
|
|
| |||||
Net decrease in shares | (820,238 | ) | (1,897,108 | ) | ||||
|
|
|
| |||||
| See Notes to Financial Statements. | THE RYDEX FUNDSANNUALREPORT | 103 |
TECHNOLOGY FUND
FINANCIAL HIGHLIGHTS
This table is presented to show selected data for a share outstanding throughout each period and to assist shareholders in evaluating a Fund’s performance for the periods presented.
| Year Ended December 31, 2011 | Year Ended December 31, 2010 | Year Ended December 31, 2009 | Year Ended December 31, 2008 | Year Ended December 31, 2007 | ||||||||||||||||
Per Share Data | ||||||||||||||||||||
Net asset value, beginning of period | $ | 12.29 | $ | 10.97 | $ | 7.05 | $ | 16.27 | $ | 14.74 | ||||||||||
Income (loss) from investment operations: | ||||||||||||||||||||
Net investment lossa | (.09 | ) | (.08 | ) | (.06 | ) | (.08 | ) | (.15 | ) | ||||||||||
Net gain (loss) on investments (realized and unrealized) | (1.01 | ) | 1.40 | 3.98 | (7.39 | ) | 1.68 | |||||||||||||
|
|
|
|
|
|
|
|
|
| |||||||||||
Total from investment operations | (1.10 | ) | 1.32 | 3.92 | (7.47 | ) | 1.53 | |||||||||||||
Less distributions from: | ||||||||||||||||||||
Net realized gains | (.55 | ) | — | — | (1.75 | ) | — | |||||||||||||
|
|
|
|
|
|
|
|
|
| |||||||||||
Total distributions | (.55 | ) | — | — | (1.75 | ) | — | |||||||||||||
|
|
|
|
|
|
|
|
|
| |||||||||||
Net asset value, end of period | $ | 10.64 | $ | 12.29 | $ | 10.97 | $ | 7.05 | $ | 16.27 | ||||||||||
|
|
|
|
|
|
|
|
|
| |||||||||||
Total Returnb | (9.20 | %) | 12.03 | % | 55.60 | % | (45.41 | %) | 10.38 | % | ||||||||||
Ratios/Supplemental Data | ||||||||||||||||||||
Net assets, end of period (in thousands) | $ | 9,854 | $ | 21,468 | $ | 39,967 | $ | 7,238 | $ | 33,123 | ||||||||||
|
|
|
|
|
|
|
|
|
| |||||||||||
Ratios to average net assets: | ||||||||||||||||||||
Net investment loss | (0.77 | %) | (0.74 | %) | (0.68 | %) | (0.63 | %) | (0.91 | %) | ||||||||||
Total expenses | 1.71 | % | 1.65 | % | 1.65 | % | 1.60 | % | 1.56 | % | ||||||||||
|
|
|
|
|
|
|
|
|
| |||||||||||
Portfolio turnover rate | 363 | % | 357 | % | 252 | % | 277 | % | 584 | % | ||||||||||
| a | Net investment loss per share was computed using average shares outstanding throughout the period. |
| b | Total return does not reflect the impact of any additional fees charged by insurance companies and has not been annualized. |
| 104 | THE RYDEX FUNDSANNUALREPORT | See Notes to Financial Statements. |
This page intentionally left blank.
| THE RYDEX FUNDSANNUALREPORT | 105 |
| PERFORMANCE REPORT AND FUND PROFILE (Unaudited) | December 31, 2011 |
OBJECTIVE: Seeks to provide capital appreciation by investing in companies engaged in the development, manufacture, or sale of communications services or communications equipment (“Telecommunications Companies”).
The sector has benefited from overall growth involving the shift to the wireless world, and relatively high dividends. But these have not overcome the squeeze in net profits resulting from competition and the cost of servicing high amounts of debt. A big news story was the government’s blocking of the proposed AT&T/T-Mobile merger, suggesting that industry consolidation may not serve as a path to growth for the present.
For the year ended December 31, 2011, Telecommunications Fund returned -14.40%, compared with a gain of 2.11% for the S&P 500® Index*. The industries contributing most to the loss were communications equipment and wireless telecommunications services segments. REITs, a segment with only one holding (American Tower, operating as a REIT), was the main segment contributing to return.
Verizon Communications, Inc., Vodafone Group PLC ADR and Motorola Mobility Holdings, Inc. were the strongest performers for the year. Research in Motion Ltd., Juniper Networks, Inc. and NII Holdings, Inc. detracted most from performance during the year.
| * | Standard & Poor’s 500 Index (S&P 500®) – a capitalization-weighted index covering 500 industrial, utility, transportation and financial companies of the U.S. markets (mostly NYSE Euronext issues). |
Performance displayed represents past performance which is no guarantee of future results.
Industry Diversification (Market Exposure as % of Net Assets)
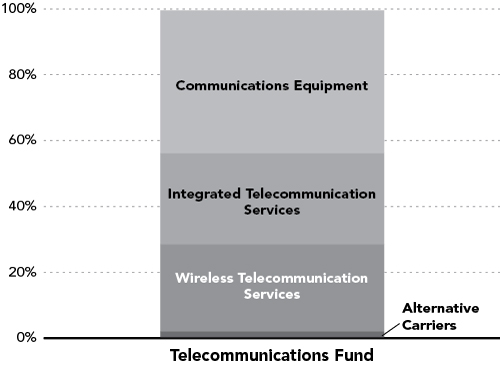
“Industry Diversification (Market Exposure as % of Net Assets)” excludes any temporary cash investments.
Inception Date: July 27, 2001
Ten Largest Holdings (% of Total Net Assets) | ||||
AT&T, Inc. | 9.0 | % | ||
Vodafone Group plc ADR | 8.0 | % | ||
Verizon Communications, Inc. | 7.2 | % | ||
Cisco Systems, Inc. | 6.5 | % | ||
QUALCOMM, Inc. | 6.3 | % | ||
American Tower Corp. — Class A | 3.3 | % | ||
CenturyLink, Inc. | 3.2 | % | ||
Motorola Solutions, Inc. | 2.6 | % | ||
Crown Castle International Corp. | 2.4 | % | ||
Motorola Mobility Holdings, Inc. | 2.3 | % | ||
|
| |||
Top Ten Total | 50.8 | % | ||
|
| |||
“Ten Largest Holdings” exclude any temporary cash or derivative investments.
| 106 | THE RYDEX FUNDSANNUALREPORT |
| PERFORMANCE REPORT AND FUND PROFILE (Unaudited) (concluded) |
Cumulative Fund Performance*
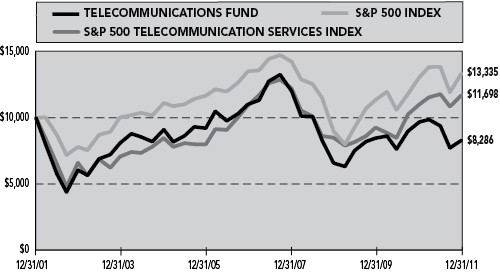
Average Annual Returns* Periods Ended 12/31/11
| ||||||||||||
| 1 Year | 5 Year | 10 Year | ||||||||||
Telecommunications Fund | -14.40 | % | -5.51 | % | -1.86 | % | ||||||
|
|
|
|
|
| |||||||
S&P 500 Telecommunication Services Index | 6.26 | % | 1.39 | % | 1.58 | % | ||||||
|
|
|
|
|
| |||||||
S&P 500 Index | 2.11 | % | -0.25 | % | 2.92 | % | ||||||
|
|
|
|
|
| |||||||
| * | The performance data represents past performance that is not predictive of future results. The investment return and principal value of an investment in the Fund will fluctuate so that an investor’s shares, when redeemed, may be worth more or less than their original cost. Returns are historical and include changes in principal and reinvested dividends and capital gains and do not reflect the effect of taxes. The S&P 500 Index and S&P 500 Telecommunication Services Index are unmanaged indices and, unlike the Fund, have no management fees or operating expenses to reduce their reported returns. Returns do not reflect the impact of any additional fees charged by insurance companies. |
| THE RYDEX FUNDSANNUALREPORT | 107 |
| SCHEDULE OF INVESTMENTS | December 31, 2011 |
TELECOMMUNICATIONS FUND
| SHARES | VALUE | |||||||
COMMON STOCKS† - 99.5% |
| |||||||
COMMUNICATIONS EQUIPMENT - 43.4% |
| |||||||
Cisco Systems, Inc. | 15,656 | $ | 283,059 | |||||
QUALCOMM, Inc. | 5,063 | 276,946 | ||||||
Motorola Solutions, Inc. | 2,414 | 111,744 | ||||||
Motorola Mobility Holdings, Inc.* | 2,540 | 98,552 | ||||||
Juniper Networks, Inc.* | 4,698 | 95,886 | ||||||
F5 Networks, Inc.* | 774 | 82,137 | ||||||
Research In Motion Ltd.* | 5,218 | 75,661 | ||||||
Nokia Oyj ADR | 14,662 | 70,671 | ||||||
Harris Corp. | 1,654 | 59,610 | ||||||
Telefonaktiebolaget LM Ericsson - Class B ADR | 5,394 | 54,641 | ||||||
Riverbed Technology, Inc.* | 2,276 | 53,486 | ||||||
Polycom, Inc.* | 3,003 | 48,949 | ||||||
JDS Uniphase Corp.* | 4,297 | 44,861 | ||||||
Brocade Communications Systems, Inc.* | 8,608 | 44,676 | ||||||
InterDigital, Inc. | 972 | 42,350 | ||||||
ADTRAN, Inc. | 1,354 | 40,837 | ||||||
Acme Packet, Inc.* | 1,299 | 40,152 | ||||||
Viasat, Inc.* | 855 | 39,433 | ||||||
Aruba Networks, Inc.* | 2,066 | 38,262 | ||||||
Finisar Corp.* | 2,203 | 36,889 | ||||||
Plantronics, Inc. | 1,019 | 36,317 | ||||||
Arris Group, Inc.* | 3,113 | 33,683 | ||||||
Ciena Corp.* | 2,671 | 32,319 | ||||||
Netgear, Inc.* | 941 | 31,589 | ||||||
Blue Coat Systems, Inc.* | 1,187 | 30,209 | ||||||
Tekelec* | 2,295 | 25,084 | ||||||
Infinera Corp.* | 3,715 | 23,330 | ||||||
Comtech Telecommunications Corp. | 756 | 21,637 | ||||||
Emulex Corp.* | 3,154 | 21,636 | ||||||
|
| |||||||
Total Communications Equipment | 1,894,606 | |||||||
|
| |||||||
INTEGRATED TELECOMMUNICATION SERVICES - 27.5% |
| |||||||
AT&T, Inc. | 13,020 | 393,725 | ||||||
Verizon Communications, Inc. | 7,832 | 314,220 | ||||||
CenturyLink, Inc. | 3,790 | 140,988 | ||||||
Windstream Corp. | 6,475 | 76,017 | ||||||
Frontier Communications Corp. | 12,720 | 65,508 | ||||||
Telefonica S.A. ADR | 3,177 | 54,613 | ||||||
China Unicom Hong Kong Ltd. ADR | 2,538 | 53,628 | ||||||
Telefonica Brasil S.A. ADR | 1,951 | 53,321 | ||||||
BCE, Inc. | 1,235 | 51,462 | ||||||
|
| |||||||
Total Integrated | ||||||||
Telecommunication Services | 1,203,482 | |||||||
|
| |||||||
WIRELESS TELECOMMUNICATION SERVICES - 26.5% |
| |||||||
Vodafone Group plc ADR | 12,410 | 347,852 | ||||||
American Tower Corp. — Class A | 2,376 | 142,584 | ||||||
Crown Castle International Corp.* | 2,345 | 105,056 | ||||||
America Movil SAB de CV ADR | 3,781 | 85,451 | ||||||
China Mobile Ltd. ADR | 1,375 | 66,674 | ||||||
SBA Communications Corp. — Class A* | 1,500 | 64,440 | ||||||
NII Holdings, Inc.* | 2,738 | 58,319 | ||||||
Mobile TeleSystems ADR | 3,942 | 57,869 | ||||||
Tim Participacoes S.A. ADR | 2,093 | 53,999 | ||||||
MetroPCS Communications, Inc.* | 6,027 | 52,314 | ||||||
SK Telecom Company Ltd. ADR | 3,631 | 49,418 | ||||||
Telephone & Data Systems, Inc. | 1,826 | 47,275 | ||||||
Leap Wireless International, Inc.* | 2,864 | 26,607 | ||||||
|
| |||||||
Total Wireless Telecommunication Services | 1,157,858 | |||||||
|
| |||||||
ALTERNATIVE CARRIERS - 2.1% |
| |||||||
Level 3 Communications, Inc.* | 3,121 | 53,026 | ||||||
AboveNet, Inc.* | 572 | 37,186 | ||||||
|
| |||||||
Total Alternative Carriers | 90,212 | |||||||
|
| |||||||
Total Common Stocks | 4,346,158 | |||||||
|
| |||||||
| FACE | ||||||||
| AMOUNT | ||||||||
REPURCHASE AGREEMENT††,1 - 0.7% |
| |||||||
Credit Suisse Group issued 12/30/11 at 0.00% due 01/03/12 | $ | 30,499 | 30,499 | |||||
|
| |||||||
Total Repurchase Agreement | 30,499 | |||||||
|
| |||||||
Total Investments - 100.2% | $ | 4,376,657 | ||||||
|
| |||||||
Liabilities & Other Assets - (0.2)% | (9,628 | ) | ||||||
|
| |||||||
Total Net Assets - 100.0% | $ | 4,367,029 | ||||||
| * | Non-income producing security. |
| † | Value determined based on Level 1 inputs — See Note 4. |
| †† | Value determined based on Level 2 inputs — See Note 4. |
| 1 | Repurchase Agreement — See Note 5. |
ADR — American Depositary Receipt
plc — Public Limited Company
| 108 | THE RYDEX FUNDSANNUALREPORT | See Notes to Financial Statements. |
TELECOMMUNICATIONS FUND
STATEMENT OF ASSETS AND LIABILITIES
December 31, 2011
| ||||
ASSETS: | ||||
Investments, at value | $ | 4,346,158 | ||
Repurchase agreements, at value (cost $30,499) | 30,499 | |||
|
| |||
Total Investments | 4,376,657 | |||
Receivables: | ||||
Fund shares sold | 30,148 | |||
Dividends | 14,255 | |||
Foreign taxes reclaim | 42 | |||
|
| |||
Total assets | 4,421,102 | |||
|
| |||
LIABILITIES: | ||||
Payable for: | ||||
Securities purchased | 42,739 | |||
Management fees | 2,232 | |||
Transfer agent and administrative fees | 657 | |||
Investor service fees | 657 | |||
Portfolio accounting fees | 262 | |||
Fund shares redeemed | 145 | |||
Miscellaneous | 7,381 | |||
|
| |||
Total liabilities | 54,073 | |||
|
| |||
NETASSETS | $ | 4,367,029 | ||
|
| |||
NETASSETSCONSISTOF: | ||||
Paid in capital | $ | 6,268,218 | ||
Undistributed net investment income | 63,031 | |||
Accumulated net realized loss on investments | (2,829,759 | ) | ||
Net unrealized appreciation on investments | 865,539 | |||
|
| |||
Net assets | $ | 4,367,029 | ||
|
| |||
Capital shares outstanding | 485,445 | |||
Net asset value per share | $ | 9.00 | ||
|
| |||
STATEMENT OF OPERATIONS
Year Ended December 31, 2011
INVESTMENTINCOME: | ||||
Dividends (net of foreign withholding tax of $3,458) | $ | 135,406 | ||
Interest | 8 | |||
|
| |||
Total investment income | 135,414 | |||
|
| |||
EXPENSES: | ||||
Management fees | 35,956 | |||
Transfer agent and administrative fees | 10,575 | |||
Investor service fees | 10,575 | |||
Portfolio accounting fees | 4,230 | |||
Trustees’ fees* | 454 | |||
Custodian fees | 1,085 | |||
Miscellaneous | 9,507 | |||
|
| |||
Total expenses | 72,382 | |||
|
| |||
Net investment income | 63,032 | |||
|
| |||
NET REALIZED AND UNREALIZED GAIN (LOSS): | ||||
Net realized gain (loss) on: | ||||
Investments | 380,774 | |||
|
| |||
Net realized gain | 380,774 | |||
|
| |||
Net change in unrealized appreciation (depreciation) on: | ||||
Investments | (972,799 | ) | ||
|
| |||
Net change in unrealized appreciation (depreciation) | (972,799 | ) | ||
|
| |||
Net realized and unrealized loss | (592,025 | ) | ||
|
| |||
Net decrease in net assets resulting from operations | $ | (528,993 | ) | |
|
|
| * | Relates to Trustees not deemed “interested persons” within the meaning of Section 2(a)(19) of the 1940 Act. |
| See Notes to Financial Statements. | THE RYDEX FUNDSANNUALREPORT | 109 |
TELECOMMUNICATIONS FUND
STATEMENTS OF CHANGES IN NET ASSETS
| Year Ended December 31, 2011 | Year Ended December 31, 2010 | |||||||
INCREASE (DECREASE) IN NET ASSETSFROM OPERATIONS: | ||||||||
Net investment income | $ | 63,032 | $ | 44,331 | ||||
Net realized gain on investments | 380,774 | 438,730 | ||||||
Net change in unrealized appreciation (depreciation) on investments | (972,799 | ) | 534,651 | |||||
|
|
|
| |||||
Net increase (decrease) in net assets resulting from operations | (528,993 | ) | 1,017,712 | |||||
|
|
|
| |||||
DISTRIBUTIONSTOSHAREHOLDERSFROM: | ||||||||
Net investment income | (44,331 | ) | (124,808 | ) | ||||
Net realized gains | (125,844 | ) | — | |||||
|
|
|
| |||||
Total distributions to shareholders | (170,175 | ) | (124,808 | ) | ||||
|
|
|
| |||||
CAPITALSHARETRANSACTIONS: | ||||||||
Proceeds from sale of shares | 56,225,186 | 90,677,324 | ||||||
Distributions reinvested | 170,175 | 124,808 | ||||||
Cost of shares redeemed | (59,405,962 | ) | (89,366,201 | ) | ||||
|
|
|
| |||||
Net increase (decrease) from capital share transactions | (3,010,601 | ) | 1,435,931 | |||||
|
|
|
| |||||
Net increase (decrease) in net assets | (3,709,769 | ) | 2,328,835 | |||||
NETASSETS: | ||||||||
Beginning of year | 8,076,798 | 5,747,963 | ||||||
|
|
|
| |||||
End of year | $ | 4,367,029 | $ | 8,076,798 | ||||
|
|
|
| |||||
Undistributed net investment income at end of year | $ | 63,031 | $ | 44,330 | ||||
|
|
|
| |||||
CAPITALSHAREACTIVITY: | ||||||||
Shares sold | 5,369,428 | 9,055,491 | ||||||
Shares issued from reinvestment of distributions | 18,477 | 11,853 | ||||||
Shares redeemed | (5,633,871 | ) | (8,922,688 | ) | ||||
|
|
|
| |||||
Net increase (decrease) in shares | (245,966 | ) | 144,656 | |||||
|
|
|
| |||||
| 110 | THE RYDEX FUNDSANNUALREPORT | See Notes to Financial Statements. |
TELECOMMUNICATIONS FUND
FINANCIAL HIGHLIGHTS
This table is presented to show selected data for a share outstanding throughout each period and to assist shareholders in evaluating a Fund’s performance for the periods presented.
| Year Ended | Year Ended | Year Ended | Year Ended | Year Ended | ||||||||||||||||
| December 31, | December 31, | December 31, | December 31, | December 31, | ||||||||||||||||
| 2011 | 2010 | 2009 | 2008 | 2007 | ||||||||||||||||
Per Share Data | ||||||||||||||||||||
Net asset value, beginning of period | $ | 11.04 | $ | 9.80 | $ | 7.94 | $ | 23.89 | $ | 21.91 | ||||||||||
|
|
|
|
|
|
|
|
|
| |||||||||||
Income (loss) from investment operations: | ||||||||||||||||||||
Net investment incomea | .16 | .06 | .18 | .24 | .05 | |||||||||||||||
Net gain (loss) on investments (realized and unrealized) | (1.74 | ) | 1.35 | 2.08 | (11.49 | ) | 1.97 | |||||||||||||
|
|
|
|
|
|
|
|
|
| |||||||||||
Total from investment operations | (1.58 | ) | 1.41 | 2.26 | (11.25 | ) | 2.02 | |||||||||||||
|
|
|
|
|
|
|
|
|
| |||||||||||
Less distributions from: | ||||||||||||||||||||
Net investment income | (.12 | ) | (.17 | ) | (.40 | ) | (.05 | ) | (.04 | ) | ||||||||||
Net realized gains | (.34 | ) | — | — | (4.65 | ) | — | |||||||||||||
|
|
|
|
|
|
|
|
|
| |||||||||||
Total distributions | (.46 | ) | (.17 | ) | (.40 | ) | (4.70 | ) | (.04 | ) | ||||||||||
|
|
|
|
|
|
|
|
|
| |||||||||||
Net asset value, end of period | $ | 9.00 | $ | 11.04 | $ | 9.80 | $ | 7.94 | $ | 23.89 | ||||||||||
|
|
|
|
|
|
|
|
|
| |||||||||||
Total Returnb | (14.40 | %) | 14.51 | % | 28.68 | % | (45.34 | %) | 9.23 | % | ||||||||||
|
|
|
|
|
|
|
|
|
| |||||||||||
Ratios/Supplemental Data | ||||||||||||||||||||
Net assets, end of period (in thousands) | $ | 4,367 | $ | 8,077 | $ | 5,748 | $ | 8,754 | $ | 31,781 | ||||||||||
|
|
|
|
|
|
|
|
|
| |||||||||||
Ratios to average net assets: | ||||||||||||||||||||
Net investment income | 1.49 | % | 0.66 | % | 2.03 | % | 1.34 | % | 0.20 | % | ||||||||||
Total expenses | 1.71 | % | 1.67 | % | 1.66 | % | 1.61 | % | 1.58 | % | ||||||||||
|
|
|
|
|
|
|
|
|
| |||||||||||
Portfolio turnover rate | 1,100 | % | 1,276 | % | 694 | % | 341 | % | 295 | % | ||||||||||
| a | Net investment income per share was computed using average shares outstanding throughout the period. |
| b | Total return does not reflect the impact of any additional fees charged by insurance companies and has not been annualized. |
| See Notes to Financial Statements. | THE RYDEX FUNDSANNUALREPORT | 111 |
| PERFORMANCE REPORT AND FUND PROFILE (Unaudited) | December 31, 2011 |
OBJECTIVE: Seeks to provide capital appreciation by investing in companies engaged in providing transportation services or companies engaged in the design, manufacture, distribution, or sale of transportation equipment (“Transportation Companies”).
The Industrials sector was affected by slowing economic growth domestically and abroad for much of the past 12 months. Inventory levels at many manufacturers remains low, and any rebuilding would help companies in the sector, as would an improving outlook for the U.S. economy.
Transportation firms trailed the broader equity market in the 2011. The road and rail segment, the largest, contributed to return, while the other two large components, airlines and air freight and logistics, detracted from return.
For the year ended December 31, 2011, Transportation Fund returned -11.12%, compared with a gain of 2.11% for the S&P 500® Index*.
Union Pacific Corp., Kansas City Southern and Dollar Thrifty Automotive Group, Inc. were the biggest contributors to performance for the year. AMR Corp., Southwest Airlines Co. and Delta Air Lines, Inc. detracted most from performance during the year.
| * | Standard & Poor’s 500 Index (S&P 500®) – a capitalization-weighted index covering 500 industrial, utility, transportation and financial companies of the U.S. markets (mostly NYSE Euronext issues). |
Performance displayed represents past performance which is no guarantee of future results.
Industry Diversification (Market Exposure as % of Net Assets)
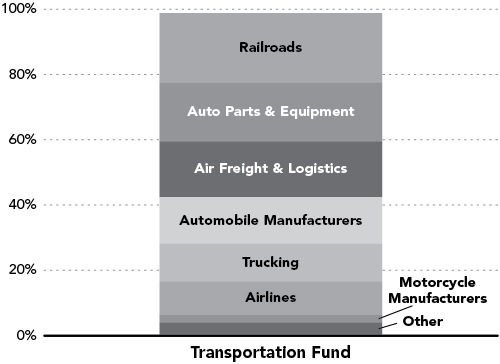
“Industry Diversification (Market Exposure as % of Net Assets)” excludes any temporary cash investments.
Inception Date: June 11, 2001
| Ten Largest Holdings | ||||
(% of Total Net Assets) | ||||
| United Parcel Service, Inc. — Class B | 6.9% | |||
| Union Pacific Corp. | 5.9% | |||
| Ford Motor Co. | 5.1% | |||
| General Motors Co. | 4.5% | |||
| FedEx Corp. | 4.2% | |||
| Norfolk Southern Corp. | 4.0% | |||
| CSX Corp. | 3.8% | |||
| Johnson Controls, Inc. | 3.7% | |||
| CH Robinson Worldwide, Inc. | 2.8% | |||
| Harley-Davidson, Inc. | 2.4% | |||
|
| |||
| Top Ten Total | 43.3% | |||
|
| |||
“Ten Largest Holdings” exclude any temporary cash or derivative investments.
| 112 | THE RYDEX FUNDSANNUALREPORT |
| PERFORMANCE REPORT AND FUND PROFILE (Unaudited) (concluded) | ||
Cumulative Fund Performance*
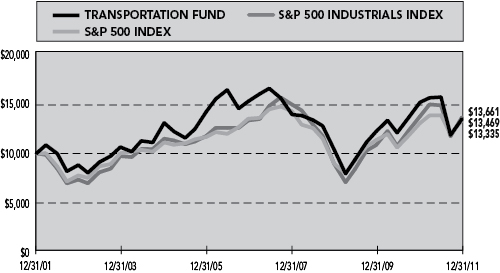
Average Annual Returns*
Periods Ended 12/31/11
| 1 Year | 5 Year | 10 Year | ||||||||||
Transportation Fund | -11.12 | % | -2.45 | % | 3.02 | % | ||||||
|
|
|
|
|
| |||||||
S&P 500 Industrials Index | -0.59 | % | 0.50 | % | 3.17 | % | ||||||
|
|
|
|
|
| |||||||
S&P 500 Index | 2.11 | % | -0.25 | % | 2.92 | % | ||||||
|
|
|
|
|
| |||||||
| * | The performance data represents past performance that is not predictive of future results. The investment return and principal value of an investment in the Fund will fluctuate so that an investor’s shares, when redeemed, may be worth more or less than their original cost. Returns are historical and include changes in principal and reinvested dividends and capital gains and do not reflect the effect of taxes. The S&P 500 Index and S&P 500 Industrials Index are unmanaged indices and, unlike the Fund, have no management fees or operating expenses to reduce their reported returns. Returns do not reflect the impact of any additional fees charged by insurance companies. |
| THE RYDEX FUNDSANNUALREPORT | 113 |
| SCHEDULE OF INVESTMENTS | December 31, 2011 |
TRANSPORTATION FUND
| SHARES | VALUE | |||||||
COMMON STOCKS† - 99.0% |
| |||||||
RAILROADS - 21.2% |
| |||||||
Union Pacific Corp. | 3,105 | $ | 328,944 | |||||
Norfolk Southern Corp. | 3,030 | 220,766 | ||||||
CSX Corp. | 10,086 | 212,411 | ||||||
Kansas City Southern* | 1,842 | 125,274 | ||||||
Canadian Pacific Railway Ltd. | 1,654 | 111,926 | ||||||
Canadian National Railway Co. | 1,402 | 110,141 | ||||||
Genesee & Wyoming, Inc. — Class A* | 1,189 | 72,030 | ||||||
|
| |||||||
Total Railroads | 1,181,492 | |||||||
|
| |||||||
AUTO PARTS & EQUIPMENT - 18.1% |
| |||||||
Johnson Controls, Inc. | 6,600 | 206,316 | ||||||
BorgWarner, Inc.* | 1,800 | 114,732 | ||||||
Autoliv, Inc. | 1,870 | 100,026 | ||||||
Gentex Corp. | 3,100 | 91,729 | ||||||
Lear Corp. | 2,300 | 91,540 | ||||||
TRW Automotive Holdings Corp.* | 2,760 | 89,976 | ||||||
Magna International, Inc. | 2,510 | 83,608 | ||||||
Visteon Corp.* | 1,399 | 69,866 | ||||||
Dana Holding Corp.* | 5,060 | 61,479 | ||||||
Tenneco, Inc.* | 2,050 | 61,049 | ||||||
American Axle & Manufacturing Holdings, Inc.* | 4,020 | 39,758 | ||||||
|
| |||||||
Total Auto Parts & Equipment | 1,010,079 | |||||||
|
| |||||||
AIR FREIGHT & LOGISTICS - 17.1% |
| |||||||
United Parcel Service, Inc. — Class B | 5,238 | 383,369 | ||||||
FedEx Corp. | 2,802 | 233,995 | ||||||
CH Robinson Worldwide, Inc. | 2,204 | 153,795 | ||||||
Expeditors International of Washington, Inc. | 3,220 | 131,891 | ||||||
HUB Group, Inc. — Class A* | 1,550 | 50,266 | ||||||
|
| |||||||
Total Air Freight & Logistics | 953,316 | |||||||
|
| |||||||
AUTOMOBILE MANUFACTURERS - 14.3% |
| |||||||
Ford Motor Co.* | 26,570 | 285,893 | ||||||
General Motors Co.* | 12,320 | 249,726 | ||||||
Tata Motors Ltd. ADR | 5,610 | 94,809 | ||||||
Toyota Motor Corp. ADR | 1,320 | 87,292 | ||||||
Tesla Motors, Inc.* | 2,630 | 75,113 | ||||||
|
| |||||||
Total Automobile Manufacturers |
| 792,833 | ||||||
|
| |||||||
TRUCKING - 11.6% |
| |||||||
J.B. Hunt Transport Services, Inc. | 2,300 | 103,661 | ||||||
Hertz Global Holdings, Inc.* | 8,662 | 101,519 | ||||||
Ryder System, Inc. | 1,396 | 74,183 | ||||||
Old Dominion Freight Line, Inc.* | 1,708 | 69,225 | ||||||
Landstar System, Inc. | 1,416 | 67,855 | ||||||
Dollar Thrifty Automotive Group, Inc.* | 910 | 63,937 | ||||||
Werner Enterprises, Inc. | 2,490 | 60,009 | ||||||
Con-way, Inc. | 1,964 | 57,270 | ||||||
Knight Transportation, Inc. | 3,236 | 50,611 | ||||||
|
| |||||||
Total Trucking | 648,270 | |||||||
|
| |||||||
AIRLINES - 10.3% |
| |||||||
Southwest Airlines Co. | 13,542 | 115,919 | ||||||
Delta Air Lines, Inc.* | 14,062 | 113,762 | ||||||
United Continental Holdings, Inc.* | 5,597 | 105,615 | ||||||
Alaska Air Group, Inc.* | 996 | 74,790 | ||||||
Copa Holdings S.A. — Class A | 1,196 | 70,169 | ||||||
JetBlue Airways Corp.* | 10,720 | 55,744 | ||||||
US Airways Group, Inc.* | 7,553 | 38,294 | ||||||
|
| |||||||
Total Airlines | 574,293 | |||||||
|
| |||||||
MOTORCYCLE MANUFACTURERS - 2.5% |
| |||||||
Harley-Davidson, Inc. | 3,500 | 136,045 | ||||||
|
| |||||||
MARINE - 1.6% | ||||||||
Kirby Corp.* | 1,320 | 86,909 | ||||||
|
| |||||||
TIRES & RUBBER - 1.5% | ||||||||
Goodyear Tire & Rubber Co.* | 5,880 | 83,320 | ||||||
|
| |||||||
DIVERSIFIED COMMERCIAL & PROFESSIONAL SERVICES - 0.8% |
| |||||||
Avis Budget Group, Inc.* | 4,337 | 46,493 | ||||||
|
| |||||||
Total Common Stocks | 5,513,050 | |||||||
|
| |||||||
| FACE AMOUNT | ||||||||
REPURCHASE AGREEMENT††,1 - 0.9% |
| |||||||
Credit Suisse Group issued 12/30/11 at 0.00% due 01/03/12 | $ | 51,791 | 51,791 | |||||
|
| |||||||
Total Repurchase Agreement (Cost $51,791) | 51,791 | |||||||
|
| |||||||
Total Investments – 99.9% (Cost $3,848,929) | $ | 5,564,841 | ||||||
|
| |||||||
Other Assets, Less Liabilities – 0.1% |
| 5,353 | ||||||
|
| |||||||
Total Net Assets – 100.0% | $ | 5,570,194 | ||||||
| * | Non-income producing security. |
| † | Value determined based on Level 1 inputs — See Note 4. |
| †† | Value determined based on Level 2 inputs — See Note 4. |
| 1 | Repurchase Agreement — See Note 5. |
ADR — American Depositary Receipt
| 114 | THE RYDEX FUNDSANNUALREPORT | See Notes to Financial Statements. |
TRANSPORTATION FUND
STATEMENT OF ASSETS AND LIABILITIES
December 31, 2011
ASSETS: | ||||
Investments, at value (cost $3,797,138) | $ | 5,513,050 | ||
Repurchase agreements, at value (cost $51,791) | 51,791 | |||
|
| |||
Total Investments (cost $3,848,929) | 5,564,841 | |||
Receivables: | ||||
Securities sold | 1,604,784 | |||
Dividends | 5,421 | |||
Fund shares sold | 438 | |||
|
| |||
Total assets | 7,175,484 | |||
|
| |||
LIABILITIES: | ||||
Payable for: | ||||
Fund shares redeemed | 1,585,183 | |||
Management fees | 4,374 | |||
Transfer agent and administrative fees | 1,286 | |||
Investor service fees | 1,286 | |||
Portfolio accounting fees | 515 | |||
Miscellaneous | 12,646 | |||
|
| |||
Total liabilities | 1,605,290 | |||
|
| |||
NETASSETS | $ | 5,570,194 | ||
|
| |||
NETASSETSCONSISTOF: | ||||
Paid in capital | $ | 14,738,272 | ||
Undistributed net investment income | — | |||
Accumulated net realized loss on investments | (10,883,990 | ) | ||
Net unrealized appreciation on investments | 1,715,912 | |||
|
| |||
Net assets | $ | 5,570,194 | ||
|
| |||
Capital shares outstanding | 398,008 | |||
Net asset value per share | $ | 14.00 | ||
|
|
STATEMENT OF OPERATIONS
Year Ended December 31, 2011
INVESTMENT INCOME: | ||||
Dividends (net of foreign withholding tax of $642) | $ | 78,038 | ||
Interest | 16 | |||
|
| |||
Total investment income | 78,054 | |||
|
| |||
EXPENSES: | ||||
Management fees | 62,523 | |||
Transfer agent and administrative fees | 18,389 | |||
Investor service fees | 18,389 | |||
Portfolio accounting fees | 7,355 | |||
Custodian fees | 1,835 | |||
Trustees’ fees* | 808 | |||
Miscellaneous | 16,279 | |||
|
| |||
Total expenses | 125,578 | |||
|
| |||
Net investment loss | (47,524 | ) | ||
|
| |||
NET REALIZEDAND UNREALIZED GAIN (LOSS): |
| |||
Net realized gain (loss) on: | ||||
Investments | 1,199,506 | |||
|
| |||
Net realized gain | 1,199,506 | |||
|
| |||
Net change in unrealized appreciation (depreciation) on: | ||||
Investments | (2,044,769 | ) | ||
|
| |||
Net change in unrealized appreciation (depreciation) | (2,044,769 | ) | ||
|
| |||
Net realized and unrealized loss | (845,263 | ) | ||
|
| |||
Net decrease in net assets resulting from operations | $ | (892,787 | ) | |
|
| |||
| * | Relates to Trustees not deemed “interested persons” within the meaning of Section 2(a)(19) of the 1940 Act. |
| See Notes to Financial Statements. | THE RYDEX FUNDSANNUALREPORT | 115 |
TRANSPORTATION FUND
STATEMENTS OF CHANGES IN NET ASSETS
| Year Ended December 31, 2011 | Year Ended December 31, 2010 | |||||||
INCREASE (DECREASE) IN NET ASSETS FROM OPERATIONS: | ||||||||
Net investment loss | $ | (47,524 | ) | $ | (38,829 | ) | ||
Net realized gain (loss) on investments | 1,199,506 | (2,130,692 | ) | |||||
Net change in unrealized appreciation (depreciation) on investments | (2,044,769 | ) | 2,028,821 | |||||
|
|
|
| |||||
Net decrease in net assets resulting from operations | (892,787 | ) | (140,700 | ) | ||||
|
|
|
| |||||
CAPITALSHARETRANSACTIONS: | ||||||||
Proceeds from sale of shares | 58,229,131 | 96,743,746 | ||||||
Cost of shares redeemed | (64,856,518 | ) | (91,975,038 | ) | ||||
|
|
|
| |||||
Net increase (decrease) from capital share transactions | (6,627,387 | ) | 4,768,708 | |||||
|
|
|
| |||||
Net increase (decrease) in net assets | (7,520,174 | ) | 4,628,008 | |||||
NETASSETS: | ||||||||
Beginning of year | 13,090,368 | 8,462,360 | ||||||
|
|
|
| |||||
End of year | $ | 5,570,194 | $ | 13,090,368 | ||||
|
|
|
| |||||
Undistributed net investment income at end of year | $ | — | $ | — | ||||
|
|
|
| |||||
CAPITALSHAREACTIVITY: | ||||||||
Shares sold | 3,793,794 | 6,942,538 | ||||||
Shares redeemed | (4,227,318 | ) | (6,778,440 | ) | ||||
|
|
|
| |||||
Net increase (decrease) in shares | (433,524 | ) | 164,098 | |||||
|
|
|
| |||||
| 116 | THE RYDEX FUNDSANNUALREPORT | See Notes to Financial Statements. |
TRANSPORTATION FUND
FINANCIAL HIGHLIGHTS
This table is presented to show selected data for a share outstanding throughout each period and to assist shareholders in evaluating a Fund’s performance for the periods presented.
| Year Ended December 31, 2011 | Year Ended December 31, 2010 | Year Ended December 31, 2009 | Year Ended December 31, 2008 | Year Ended December 31, 2007 | ||||||||||||||||
Per Share Data | ||||||||||||||||||||
Net asset value, beginning of period | $ | 15.74 | $ | 12.68 | $ | 10.91 | $ | 14.85 | $ | 35.05 | ||||||||||
|
|
|
|
|
|
|
|
|
| |||||||||||
Income (loss) from investment operations: | ||||||||||||||||||||
Net investment income (loss)a | (.10 | ) | (.04 | ) | (.03 | ) | .04 | (.04 | ) | |||||||||||
Net gain (loss) on investments (realized and unrealized) | (1.64 | ) | 3.10 | 1.92 | (3.80 | ) | (2.24 | ) | ||||||||||||
|
|
|
|
|
|
|
|
|
| |||||||||||
Total from investment operations | (1.74 | ) | 3.06 | 1.89 | (3.76 | ) | (2.28 | ) | ||||||||||||
|
|
|
|
|
|
|
|
|
| |||||||||||
Less distributions from: | ||||||||||||||||||||
Net investment income | — | — | (.12 | ) | — | — | ||||||||||||||
Net realized gains | — | — | — | (.18 | ) | (17.92 | ) | |||||||||||||
|
|
|
|
|
|
|
|
|
| |||||||||||
Total distributions | — | — | (.12 | ) | (.18 | ) | (17.92 | ) | ||||||||||||
|
|
|
|
|
|
|
|
|
| |||||||||||
Net asset value, end of period | $ | 14.00 | $ | 15.74 | $ | 12.68 | $ | 10.91 | $ | 14.85 | ||||||||||
|
|
|
|
|
|
|
|
|
| |||||||||||
Total Returnb | (11.12 | %) | 24.13 | % | 17.39 | % | (25.26 | %) | (8.75 | %) | ||||||||||
|
|
|
|
|
|
|
|
|
| |||||||||||
Ratios/Supplemental Data | ||||||||||||||||||||
Net assets, end of period (in thousands) | $ | 5,570 | $ | 13,090 | $ | 8,462 | $ | 21,509 | $ | 8,513 | ||||||||||
|
|
|
|
|
|
|
|
|
| |||||||||||
Ratios to average net assets: | ||||||||||||||||||||
Net investment income (loss) | (0.65 | %) | (0.32 | %) | (0.29 | %) | 0.27 | % | (0.12 | %) | ||||||||||
Total expenses | 1.71 | % | 1.65 | % | 1.67 | % | 1.62 | % | 1.60 | % | ||||||||||
|
|
|
|
|
|
|
|
|
| |||||||||||
Portfolio turnover rate | 711 | % | 693 | % | 857 | % | 544 | % | 284 | % | ||||||||||
| a | Net investment income (loss) per share was computed using average shares outstanding throughout the period. |
| b | Total return does not reflect the impact of any additional fees charged by insurance companies and has not been annualized. |
| See Notes to Financial Statements. | THE RYDEX FUNDSANNUALREPORT | 117 |
| PERFORMANCE REPORT AND FUND PROFILE (Unaudited) | December 31, 2011 | |||
OBJECTIVE: Seeks to provide capital appreciation by investing in companies that operate public utilities (“Utilities Companies”).
Utilities outperformed the broad market by more than 14%, the best relative outperformance among S&P sectors since technology in 2000. Investors flocked to this more defensive, low-beta sector during the economic uncertainty of 2011.
For the year ended December 31, 2011, Utilities Fund rose 16.29%, compared with a gain of 2.11% for the S&P 500® Index*. Electric utilities, which accounted for most of the weight in the sector, was the largest contributor to return, followed by the multi-utilities segment. No segment detracted from return.
Southern Co., Duke Energy Corp. and Dominion Resources, Inc. were the best-performing stocks over the one-year period, while PG&E Corp., Dynegy, Inc. and Companhia de Saneamento Basico do Estado de Sao Paulo ADR were detractors.
| * | Standard & Poor’s 500 Index (S&P 500®) – a capitalization-weighted index covering 500 industrial, utility, transportation and financial companies of the U.S. markets (mostly NYSE Euronext issues). |
Performance displayed represents past performance which is no guarantee of future results.
Industry Diversification (Market Exposure as % of Net Assets)
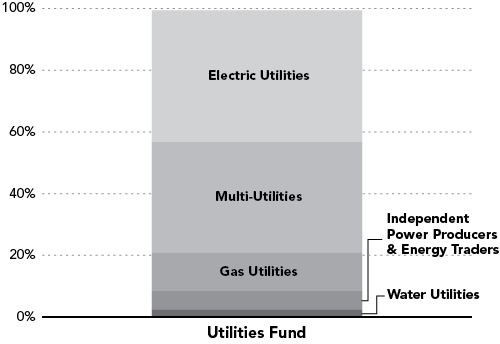
“Industry Diversification (Market Exposure as % of Net Assets)” excludes any temporary cash investments.
Inception Date: May 2, 2001
Ten Largest Holdings (% of Total Net Assets) | ||||
Southern Co. | 3.6 | % | ||
Dominion Resources, Inc. | 3.2 | % | ||
Duke Energy Corp. | 3.1 | % | ||
Exelon Corp. | 3.0 | % | ||
NextEra Energy, Inc. | 2.9 | % | ||
American Electric Power Company, Inc. | 2.6 | % | ||
Consolidated Edison, Inc. | 2.4 | % | ||
FirstEnergy Corp. | 2.4 | % | ||
PG&E Corp. | 2.4 | % | ||
Public Service Enterprise Group, Inc. | 2.3 | % | ||
|
| |||
Top Ten Total | 27.9 | % | ||
|
| |||
“Ten Largest Holdings” exclude any temporary cash or derivative investments.
| 118 | THE RYDEX FUNDSANNUALREPORT |
| PERFORMANCE REPORT AND FUND PROFILE (Unaudited) (concluded) | ||
Cumulative Fund Performance*
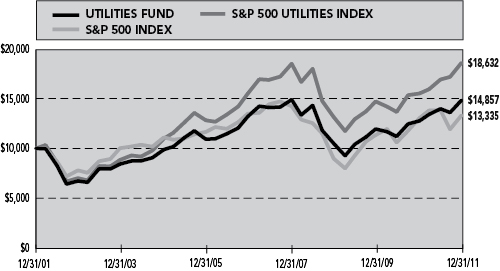
Average Annual Returns* |
| |||||||||||
Periods Ended 12/31/11 | ||||||||||||
| 1 Year | 5 Year | 10 Year | ||||||||||
Utilities Fund | 16.29 | % | 2.37 | % | 4.04 | % | ||||||
|
|
|
|
|
| |||||||
S&P 500 Utilities Index | 19.91 | % | 3.71 | % | 6.42 | % | ||||||
|
|
|
|
|
| |||||||
S&P 500 Index | 2.11 | % | -0.25 | % | 2.92 | % | ||||||
|
|
|
|
|
| |||||||
| * | The performance data represents past performance that is not predictive of future results. The investment return and principal value of an investment in the Fund will fluctuate so that an investor’s shares, when redeemed, may be worth more or less than their original cost. Returns are historical and include changes in principal and reinvested dividends and capital gains and do not reflect the effect of taxes. The S&P 500 Index and S&P 500 Utilities Index are unmanaged indices and, unlike the Fund, have no management fees or operating expenses to reduce their reported returns. Returns do not reflect the impact of any additional fees charged by insurance companies. |
| THE RYDEX FUNDSANNUALREPORT | 119 |
| SCHEDULE OF INVESTMENTS | December 31, 2011 | |
| UTILITIES FUND |
| SHARES | VALUE | |||||||
COMMON STOCKS† - 99.4% |
| |||||||
ELECTRIC UTILITIES - 42.7% |
| |||||||
Southern Co. | 24,736 | $ | 1,145,029 | |||||
Duke Energy Corp. | 45,140 | 993,080 | ||||||
Exelon Corp. | 22,023 | 955,138 | ||||||
NextEra Energy, Inc. | 15,258 | 928,907 | ||||||
American Electric Power Company, Inc. | 19,657 | 812,031 | ||||||
FirstEnergy Corp. | 17,292 | 766,036 | ||||||
PPL Corp. | 25,082 | 737,912 | ||||||
Progress Energy, Inc. | 13,154 | 736,887 | ||||||
Edison International | 16,143 | 668,320 | ||||||
Entergy Corp. | 8,826 | 644,739 | ||||||
Northeast Utilities | 12,700 | 458,089 | ||||||
Pinnacle West Capital Corp. | 8,576 | 413,192 | ||||||
Pepco Holdings, Inc. | 19,121 | 388,156 | ||||||
ITC Holdings Corp. | 4,751 | 360,506 | ||||||
N.V. Energy, Inc. | 22,023 | 360,076 | ||||||
Westar Energy, Inc. | 11,646 | 335,172 | ||||||
Cia Energetica de Minas Gerais ADR | 17,813 | 316,893 | ||||||
Great Plains Energy, Inc. | 14,248 | 310,321 | ||||||
Hawaiian Electric Industries, Inc. | 10,796 | 285,878 | ||||||
Cleco Corp. | 7,273 | 277,101 | ||||||
IDACORP, Inc. | 6,220 | 263,790 | ||||||
Portland General Electric Co. | 9,862 | 249,410 | ||||||
UIL Holdings Corp. | 6,781 | 239,844 | ||||||
PNM Resources, Inc. | 12,485 | 227,602 | ||||||
Allete, Inc. | 5,346 | 224,425 | ||||||
El Paso Electric Co. | 6,197 | 214,664 | ||||||
Unisource Energy Corp. | 5,564 | 205,423 | ||||||
|
| |||||||
Total Electric Utilities | 13,518,621 | |||||||
|
| |||||||
MULTI-UTILITIES - 35.8% |
| |||||||
Dominion Resources, Inc. | 18,861 | 1,001,141 | ||||||
Consolidated Edison, Inc. | 12,498 | 775,251 | ||||||
PG&E Corp. | 18,247 | 752,141 | ||||||
Public Service Enterprise | ||||||||
Group, Inc. | 22,489 | 742,362 | ||||||
Xcel Energy, Inc. | 24,165 | 667,921 | ||||||
Sempra Energy | 12,063 | 663,465 | ||||||
DTE Energy Co. | 10,101 | 550,000 | ||||||
CenterPoint Energy, Inc. | 26,375 | 529,874 | ||||||
Wisconsin Energy Corp. | 14,923 | 521,708 | ||||||
Ameren Corp. | 15,479 | 512,819 | ||||||
NiSource, Inc. | 20,181 | 480,510 | ||||||
SCANA Corp. | 9,736 | 438,704 | ||||||
CMS Energy Corp. | 19,641 | 433,673 | ||||||
OGE Energy Corp. | 7,627 | 432,527 | ||||||
Alliant Energy Corp. | 9,145 | 403,386 | ||||||
NSTAR | 8,481 | 398,268 | ||||||
Integrys Energy Group, Inc. | 6,981 | 378,231 | ||||||
TECO Energy, Inc. | 19,349 | 370,340 | ||||||
MDU Resources Group, Inc. | 16,850 | 361,601 | ||||||
Vectren Corp. | 9,508 | 287,427 | ||||||
Avista Corp. | 8,496 | 218,772 | ||||||
Black Hills Corp. | 6,193 | 207,961 | ||||||
NorthWestern Corp. | 5,806 | 207,797 | ||||||
|
| |||||||
Total Multi-Utilities | 11,335,879 | |||||||
|
| |||||||
GAS UTILITIES - 12.5% |
| |||||||
ONEOK, Inc. | 6,286 | 544,933 | ||||||
AGL Resources, Inc. | 12,080 | 510,501 | ||||||
National Fuel Gas Co. | 6,788 | 377,277 | ||||||
Questar Corp. | 17,157 | 340,738 | ||||||
UGI Corp. | 11,541 | 339,305 | ||||||
Atmos Energy Corp. | 9,410 | 313,824 | ||||||
Piedmont Natural Gas Company, Inc. | 8,340 | 283,393 | ||||||
WGL Holdings, Inc. | 6,242 | 276,021 | ||||||
New Jersey Resources Corp. | 5,297 | 260,612 | ||||||
Southwest Gas Corp. | 6,027 | 256,087 | ||||||
South Jersey Industries, Inc. | 4,181 | 237,523 | ||||||
Northwest Natural Gas Co. | 4,272 | 204,757 | ||||||
|
| |||||||
Total Gas Utilities | 3,944,971 | |||||||
|
| |||||||
INDEPENDENT POWER PRODUCERS & |
| |||||||
ENERGY TRADERS - 6.1% |
| |||||||
AES Corp.* | 45,419 | 537,761 | ||||||
Calpine Corp.* | 31,976 | 522,168 | ||||||
Constellation Energy Group, Inc. | 12,816 | 508,411 | ||||||
NRG Energy, Inc.* | 20,127 | 364,701 | ||||||
|
| |||||||
Total Independent Power Producers & Energy Traders | 1,933,041 | |||||||
|
| |||||||
WATER UTILITIES - 2.3% |
| |||||||
American Water Works Company, Inc. | 13,279 | 423,069 | ||||||
Aqua America, Inc. | 14,175 | 312,559 | ||||||
|
| |||||||
Total Water Utilities | 735,628 | |||||||
|
| |||||||
Total Common Stocks (Cost $24,753,700) | 31,468,140 | |||||||
|
| |||||||
| FACE | ||||||||
| AMOUNT | ||||||||
REPURCHASE AGREEMENT††,1 - 0.4% |
| |||||||
Credit Suisse Group issued 12/30/11 at 0.00% due 01/03/12 | $ | 115,377 | 115,377 | |||||
|
| |||||||
Total Repurchase Agreement (Cost $115,377) | 115,377 | |||||||
|
| |||||||
Total Investments – 99.8% (Cost $24,869,077) | $ | 31,583,517 | ||||||
|
| |||||||
Other Assets, Less Liabilities - 0.2% | 75,062 | |||||||
|
| |||||||
Total Net Assets - 100.0% | $ | 31,658,579 | ||||||
| * | Non-income producing security. |
| † | Value determined based on Level 1 inputs — See Note 4. |
| †† | Value determined based on Level 2 inputs — See Note 4. |
| 1 | Repurchase Agreement — See Note 5. |
ADR — American Depositary Receipt
| 120 | THE RYDEX FUNDSANNUALREPORT | See Notes to Financial Statements. |
| UTILITIES FUND |
STATEMENT OF ASSETS AND LIABILITIES
December 31, 2011
ASSETS: | ||||
Investments, at value (cost $24,753,700) | $ | 31,468,140 | ||
Repurchase agreements, at value (cost $115,377) | 115,377 | |||
|
| |||
Total Investments (cost $24,869,077) | 31,583,517 | |||
Receivables: | ||||
Fund shares sold | 1,900,297 | |||
Dividends | 81,807 | |||
|
| |||
Total assets | 33,565,621 | |||
|
| |||
LIABILITIES: | ||||
Payable for: | ||||
Securities purchased | 1,842,422 | |||
Management fees | 19,551 | |||
Transfer agent and administrative fees | 5,751 | |||
Investor service fees | 5,751 | |||
Portfolio accounting fees | 2,300 | |||
Fund shares redeemed | 14 | |||
Miscellaneous | 31,253 | |||
|
| |||
Total liabilities | 1,907,042 | |||
|
| |||
NETASSETS | $ | 31,658,579 | ||
|
| |||
NETASSETSCONSISTOF: | ||||
Paid in capital | $ | 29,866,851 | ||
Undistributed net investment income | 459,947 | |||
Accumulated net realized loss on investments | (5,382,659 | ) | ||
Net unrealized appreciation on investments | 6,714,440 | |||
|
| |||
Net assets | $ | 31,658,579 | ||
|
| |||
Capital shares outstanding | 1,623,237 | |||
Net asset value per share | $ | 19.50 | ||
|
| |||
STATEMENT OF OPERATIONS
Year Ended December 31, 2011
INVESTMENT INCOME: | ||||
Dividends (net of foreign withholding tax of $2,203) | $ | 790,178 | ||
Interest | 24 | |||
|
| |||
Total investment income | 790,202 | |||
|
| |||
EXPENSES: | ||||
Management fees | 165,839 | |||
Transfer agent and administrative fees | 48,776 | |||
Investor service fees | 48,776 | |||
Portfolio accounting fees | 19,510 | |||
Professional fees | 17,020 | |||
Custodian fees | 4,938 | |||
Trustees’ fees* | 1,866 | |||
Miscellaneous | 23,531 | |||
|
| |||
Total expenses | 330,256 | |||
|
| |||
Net investment income | 459,946 | |||
|
| |||
NET REALIZEDAND UNREALIZED GAIN (LOSS): | ||||
Net realized gain (loss) on: | ||||
Investments | (496,232 | ) | ||
|
| |||
Net realized loss | (496,232 | ) | ||
|
| |||
Net change in unrealized appreciation (depreciation) on: | ||||
Investments | 2,475,063 | |||
|
| |||
Net change in unrealized appreciation (depreciation) | 2,475,063 | |||
|
| |||
Net realized and unrealized gain | 1,978,831 | |||
|
| |||
Net increase in net assets resulting from operations | $ | 2,438,777 | ||
|
| |||
| * | Relates to Trustees not deemed “interested persons” within the meaning of Section 2(a)(19) of the 1940 Act. |
| See Notes to Financial Statements. | THE RYDEX FUNDSANNUALREPORT | 121 |
UTILITIES FUND
STATEMENTS OF CHANGES IN NET ASSETS
| Year Ended December 31, 2011 | Year Ended December 31, 2010 | |||||||
INCREASE (DECREASE) IN NET ASSETS FROM OPERATIONS: | ||||||||
Net investment income | $ | 459,946 | $ | 439,333 | ||||
Net realized loss on investments | (496,232 | ) | (4,038 | ) | ||||
Net change in unrealized appreciation (depreciation) on investments | 2,475,063 | 691,999 | ||||||
|
|
|
| |||||
Net increase in net assets resulting from operations | 2,438,777 | 1,127,294 | ||||||
|
|
|
| |||||
DISTRIBUTIONSTOSHAREHOLDERSFROM: | ||||||||
Net investment income | (439,333 | ) | (552,285 | ) | ||||
|
|
|
| |||||
Total distributions to shareholders | (439,333 | ) | (552,285 | ) | ||||
|
|
|
| |||||
CAPITALSHARETRANSACTIONS: | ||||||||
Proceeds from sale of shares | 104,328,412 | 112,771,956 | ||||||
Distributions reinvested | 439,333 | 552,285 | ||||||
Cost of shares redeemed | (90,529,587 | ) | (114,292,141 | ) | ||||
|
|
|
| |||||
Net increase (decrease) from capital share transactions | 14,238,158 | (967,900 | ) | |||||
|
|
|
| |||||
Net increase (decrease) in net assets | 16,237,602 | (392,891 | ) | |||||
NETASSETS: | ||||||||
Beginning of year | 15,420,977 | 15,813,868 | ||||||
|
|
|
| |||||
End of year | $ | 31,658,579 | $ | 15,420,977 | ||||
|
|
|
| |||||
Undistributed net investment income at end of year | $ | 459,947 | $ | 439,334 | ||||
|
|
|
| |||||
CAPITALSHAREACTIVITY: | ||||||||
Shares sold | 5,701,293 | 6,859,200 | ||||||
Shares issued from reinvestment of distributions | 23,394 | 32,660 | ||||||
Shares redeemed | (5,006,339 | ) | (6,950,576 | ) | ||||
|
|
|
| |||||
Net increase (decrease) in shares | 718,348 | (58,716 | ) | |||||
|
|
|
| |||||
| 122 | THE RYDEX FUNDSANNUALREPORT | See Notes to Financial Statements. |
UTILITIES FUND
FINANCIAL HIGHLIGHTS
This table is presented to show selected data for a share outstanding throughout each period and to assist shareholders in evaluating a Fund’s performance for the periods presented.
| Year Ended December 31, 2011 | Year Ended December 31, 2010 | Year Ended December 31, 2009 | Year Ended December 31, 2008 | Year Ended December 31, 2007 | ||||||||||||||||
Per Share Data | ||||||||||||||||||||
Net asset value, beginning of period | $ | 17.04 | $ | 16.41 | $ | 15.41 | $ | 22.29 | $ | 22.38 | ||||||||||
|
|
|
|
|
|
|
|
|
| |||||||||||
Income (loss) from investment operations: | ||||||||||||||||||||
Net investment incomea | .43 | .41 | .41 | .37 | .32 | |||||||||||||||
Net gain (loss) on investments (realized and unrealized) | 2.33 | .72 | 1.65 | (6.97 | ) | 2.59 | ||||||||||||||
|
|
|
|
|
|
|
|
|
| |||||||||||
Total from investment operations | 2.76 | 1.13 | 2.06 | (6.60 | ) | 2.91 | ||||||||||||||
|
|
|
|
|
|
|
|
|
| |||||||||||
Less distributions from: | ||||||||||||||||||||
Net investment income | (.30 | ) | (.50 | ) | (1.06 | ) | (.08 | ) | (.39 | ) | ||||||||||
Net realized gains | — | — | — | (.20 | ) | (2.61 | ) | |||||||||||||
|
|
|
|
|
|
|
|
|
| |||||||||||
Total distributions | (.30 | ) | (.50 | ) | (1.06 | ) | (.28 | ) | (3.00 | ) | ||||||||||
|
|
|
|
|
|
|
|
|
| |||||||||||
Net asset value, end of period | $ | 19.50 | $ | 17.04 | $ | 16.41 | $ | 15.41 | $ | 22.29 | ||||||||||
|
|
|
|
|
|
|
|
|
| |||||||||||
Total Returnb | 16.29 | % | 6.88 | % | 13.80 | % | (29.57 | %) | 12.86 | % | ||||||||||
|
|
|
|
|
|
|
|
|
| |||||||||||
Ratios/Supplemental Data | ||||||||||||||||||||
Net assets, end of period (in thousands) | $ | 31,659 | $ | 15,421 | $ | 15,814 | $ | 34,343 | $ | 65,532 | ||||||||||
|
|
|
|
|
|
|
|
|
| |||||||||||
Ratios to average net assets: | ||||||||||||||||||||
Net investment income | 2.36 | % | 2.48 | % | 2.69 | % | 1.90 | % | 1.32 | % | ||||||||||
Total expenses | 1.69 | % | 1.66 | % | 1.67 | % | 1.61 | % | 1.58 | % | ||||||||||
|
|
|
|
|
|
|
|
|
| |||||||||||
Portfolio turnover rate | 369 | % | 561 | % | 309 | % | 293 | % | 244 | % | ||||||||||
| a | Net investment income per share was computed using average shares outstanding throughout the period. |
| b | Total return does not reflect the impact of any additional fees charged by insurance companies and has not been annualized. |
| See Notes to Financial Statements. | THE RYDEX FUNDSANNUALREPORT | 123 |
1. Organization and Significant Accounting Policies
Organization
The Rydex Variable Trust (the “Trust”), a Delaware business trust, is registered with the SEC under the Investment Company Act of 1940 (the “1940 Act”) as a non-diversified, open-ended investment company and is authorized to issue an unlimited number of no par value shares. The Trust offers shares of the Funds to insurance companies for their variable annuity and variable life insurance contracts.
At December 31, 2011, the Trust consisted of fifty-seven separate funds. This report covers the Sector Funds (the “Funds”), while the other funds are contained in separate reports.
Rydex Investments (“RI”) provides advisory services, and Rydex Fund Services, LLC (“RFS”) provides transfer agent, administrative, and accounting services to the Trust. Rydex Distributors, LLC (“RDL”) acts as principal underwriter for the Trust. RI, RFS and RDL are affiliated entities.
The Funds invest in a specific industry sector. To the extent that investments are concentrated in a single sector, the Funds are subject to legislative or regulatory changes, adverse market conditions and/or increased competition affecting such sector.
The Funds seek capital appreciation and invest substantially all of their assets in equity securities of companies involved in their sector.
The Funds are designed and operated to accommodate frequent trading by shareholders and, unlike most mutual funds, offer unlimited exchange privileges with no minimum holding periods or transactions fees, which may cause the Funds to experience high portfolio turnover.
Significant Accounting Policies
The following significant accounting policies are in conformity with U.S. generally accepted accounting principles and are consistently followed by the Trust. This requires management to make estimates and assumptions that affect the reported amount of assets and liabilities and disclosure of contingent assets and liabilities at the date of the financial statements and the reported amounts of revenues and expenses during the reporting period. Actual results could differ from these estimates. All time references are based on Eastern Time.
A. Equity securities listed on an exchange (New York Stock Exchange (“NYSE”) or American Stock Exchange) are valued at the last quoted sales price as of the close of business on the NYSE on the valuation date. Equity securities listed on the NASDAQ market system are valued at the NASDAQ Official Closing Price on the valuation date.
Short-term debt securities with a maturity of 60 days or less at acquisition and repurchase agreements are valued at amortized cost, which approximates market value.
Investments for which market quotations are not readily available are fair valued as determined in good faith by
SI under the direction of the Board of Trustees using methods established or ratified by the Board of Trustees. These methods include, but are not limited to: (i) using general information as to how these securities and assets trade; and (ii) using other information and considerations, including current values in related markets.
B. Security transactions are recorded on the trade date for financial reporting purposes. Realized gains and losses from securities transactions are recorded using the identified cost basis. Proceeds from lawsuits related to investment holdings are recorded as realized gains. Dividend income is recorded on the ex-dividend date, net of applicable taxes withheld by foreign countries. Taxable non-cash dividends are recorded as dividend income. Interest income, including amortization of premiums and accretion of discount, is accrued on a daily basis. Distributions received from investments in REITs are recorded as dividend income on the ex-dividend date, subject to reclassification upon notice of the character of such distribution by the issuer.
C. Distributions of net investment income and net realized gains, if any, are declared and paid at least annually. Distributions are recorded on the ex-dividend date and are determined in accordance with income tax regulations which may differ from U.S. generally accepted accounting principles.
D. The Funds may leave cash overnight in their cash account with the custodian, U.S. Bank. Periodically, a Fund may have cash due to the custodian bank as an overdraft balance. A fee is incurred on this overdraft, calculated by multiplying the overdraft by a rate based on the federal funds rate.
E. Throughout the normal course of business, the Funds enter into contracts that contain a variety of representations and warranties which provide general indemnifications. The Funds’ maximum exposure under these arrangements is unknown, as this would involve future claims that may be made against the Funds and/or their affiliates that have not yet occurred. However, based on experience, the Funds expect the risk of loss to be remote.
2. Fees and Other Transactions with Affiliates
Under the terms of an investment advisory contract, the Trust pays RI investment advisory fees calculated at the annualized rates below, based on the average daily net assets of the Funds for the year ended December 31, 2011:
| Management | ||||
| Fees (as a % of | ||||
Fund | Net Assets) | |||
Banking Fund | 0.85 | % | ||
Basic Materials Fund | 0.85 | % | ||
Biotechnology Fund | 0.85 | % | ||
Consumer Products Fund | 0.85 | % | ||
Electronics Fund | 0.85 | % | ||
Energy Fund | 0.85 | % | ||
| 124 | THE RYDEX FUNDSANNUALREPORT |
| NOTES TO FINANCIAL STATEMENTS (continued) | ||
| Management | ||||
| Fees (as a % of | ||||
Fund | Net Assets) | |||
Energy Services Fund | 0.85 | % | ||
Financial Services Fund | 0.85 | % | ||
Health Care Fund | 0.85 | % | ||
Internet Fund | 0.85 | % | ||
Leisure Fund | 0.85 | % | ||
Precious Metals Fund | 0.75 | % | ||
Retailing Fund | 0.85 | % | ||
Technology Fund | 0.85 | % | ||
Telecommunications Fund | 0.85 | % | ||
Transportation Fund | 0.85 | % | ||
Utilities Fund | 0.85 | % | ||
RFS provides transfer agent and administrative services to the Funds calculated at an annual percentage rate of 0.25% of the average daily net assets of each Fund.
RFS also provides accounting services to the Funds for fees calculated at annualized rates below, based on the average daily net assets each Fund.
| (as a % of | ||||
Fund Accounting | Net Assets) | |||
On the first $250 million | 0.10 | % | ||
On the next $250 million | 0.075 | % | ||
On the next $250 million | 0.05 | % | ||
Over $750 million | 0.03 | % | ||
RFS engages external service providers to perform other necessary services for the Trust, such as audit related services, legal services, printing and mailing, etc., on a pass-through basis. Such expenses are allocated to various Funds within the complex based on relative net assets. Organizational and setup costs for new Funds are paid by the Trust.
The Trust has adopted an Investor Services Plan for which RDL and other firms that provide investor services (“Service Providers”) may receive compensation. The Funds will pay investor service fees at an annual rate not to exceed 0.25% of average daily net assets. RDL, in turn, will compensate Service Providers for providing such services, while retaining a portion of such payments to compensate itself for investor services it performs.
Certain officers and trustees of the Trust are also officers of RI, RFS and RDL.
3. Federal Income Tax Information
The Funds intend to comply with the provisions of Subchapter M of the Internal Revenue Code applicable to regulated investment companies and will distribute substantially all taxable net investment income and capital gains sufficient to relieve them from all, or substantially all, federal income, excise and state income taxes. Therefore, no provision for federal or state income tax is required.
Tax positions taken or expected to be taken in the course of preparing the Funds’ tax returns are evaluated to determine whether the tax positions are “more-likely-than-not” of being sustained by the applicable tax authority. Tax positions not deemed to meet the more-likely-than-not threshold would be recorded as a tax benefit or expense in the current year. Management has analyzed the Funds’ tax positions taken on Federal income tax returns for all open tax years (fiscal years 2008-2011), and has concluded that no provision for income tax is required in the Funds’ financial statements.
The RIC Modernization Act of 2010 was signed into law on December 22, 2010 and seeks to simplify some of the tax provisions applicable to regulated investment companies and the tax reporting to their shareholders, and to improve the tax efficiency of certain fund structures. The changes are generally effective for taxable years beginning after the date of enactment.
One of the more prominent changes addresses capital loss carryforwards. Funds will be permitted to carryforward capital losses incurred in taxable years beginning after December 22, 2010 for an unlimited period. However, any losses incurred during those future taxable years will be required to be utilized prior to the losses incurred in pre-enactment taxable years. Under pre-enactment law, capital losses could be carried forward for eight years, and carried forward as short-term capital, irrespective of the character of the original loss. As a result of this ordering rule, pre-enactment capital loss carryforwards may potentially expire unused. Additionally, post-enactment capital losses that are carried forward will retain their character as either short-term or long-term capital losses rather than being considered all short-term as under previous law.
Tax basis capital losses in excess of capital gains are carried forward to offset future net capital gains. For the year ended December 31, 2011, the following capital loss carryforward amounts expired, were used, or were permanently lost due to loss limitation rules in Section 382 of the Internal Revenue Code:
Fund | Amount | |||
Banking Fund | $ | 9,595,061 | ||
Consumer Products Fund | 468,857 | |||
Financial Services Fund | 80,961 | |||
Internet Fund | 1,084,825 | |||
Leisure Fund | 1,169,995 | |||
Precious Metals Fund | 2,269,240 | |||
Retailing Fund | 451,648 | |||
Technology Fund | 620,605 | |||
Telecommunications Fund | 149,466 | |||
| THE RYDEX FUNDSANNUALREPORT | 125 |
| NOTES TO FINANCIAL STATEMENTS (continued) | ||
The tax character of distributions paid during the year ended December 31, 2011 was as follows:
| Ordinary | Long-Term | Total | ||||||||||
Fund | Income | Capital Gain | Distributions | |||||||||
Banking Fund | $ | 8,767 | $ | — | $ | 8,767 | ||||||
Basic Materials Fund | — | 2,783,814 | 2,783,814 | |||||||||
Biotechnology Fund | — | — | — | |||||||||
Consumer Products Fund | 320,376 | — | 320,376 | |||||||||
Electronics Fund | — | 2,395,856 | 2,395,856 | |||||||||
Energy Fund | — | 185,047 | 185,047 | |||||||||
Energy Services Fund | — | 2,664,613 | 2,664,613 | |||||||||
Financial Services Fund | 4,742 | — | 4,742 | |||||||||
Health Care Fund | — | — | — | |||||||||
Internet Fund | — | — | — | |||||||||
Leisure Fund | — | — | — | |||||||||
Precious Metals Fund | 57,336 | — | 57,336 | |||||||||
Retailing Fund | — | — | — | |||||||||
Technology Fund | — | 598,420 | 598,420 | |||||||||
Telecommunications Fund | 86,624 | 83,551 | 170,175 | |||||||||
Transportation Fund | — | — | — | |||||||||
Utilities Fund | 439,333 | — | 439,333 | |||||||||
The tax character of distributions paid during the year ended December 31, 2010 was as follows:
| Ordinary | Long-Term | Total | ||||||||||
Fund | Income | Capital Gain | Distributions | |||||||||
Banking Fund | $ | 78,777 | $ | — | $ | 78,777 | ||||||
Basic Materials Fund | 231,949 | — | 231,949 | |||||||||
Biotechnology Fund | — | — | — | |||||||||
Consumer Products Fund | 242,595 | — | 242,595 | |||||||||
Electronics Fund | 1,405,357 | 203,679 | 1,609,036 | |||||||||
Energy Fund | 171,009 | — | 171,009 | |||||||||
Energy Services Fund | — | — | — | |||||||||
Financial Services Fund | 72,499 | — | 72,499 | |||||||||
Health Care Fund | 41,798 | — | 41,798 | |||||||||
Internet Fund | — | — | — | |||||||||
Leisure Fund | 10,939 | — | 10,939 | |||||||||
Precious Metals Fund | 4,015 | — | 4,015 | |||||||||
Retailing Fund | — | — | — | |||||||||
Technology Fund | — | — | — | |||||||||
Telecommunications Fund | 124,808 | — | 124,808 | |||||||||
Transportation Fund | — | — | — | |||||||||
Utilities Fund | 552,285 | — | 552,285 | |||||||||
Note: For federal income tax purposes, short term capital gain distributions are treated as ordinary income distributions.
The tax character of distributable earnings/(accumulated losses) at December 31, 2011 was as follows:
| Undistributed | Undistributed | Net Unrealized | ||||||||||||||
| Ordinary | Long-Term | Appreciation/ | Capital Loss | |||||||||||||
Fund | Income | Capital Gain | (Depreciation) | Carryforward | ||||||||||||
Banking Fund | $ | 21,221 | $ | 8,644 | $ | (729,204 | ) | $ | (891,095 | ) | ||||||
Basic Materials Fund | 567,991 | 785,306 | 3,178,197 | — | ||||||||||||
Biotechnology Fund | — | — | 1,990,646 | (11,755,527 | )1 | |||||||||||
Consumer Products Fund | 186,253 | — | 3,806,166 | (2,171,725 | )1 | |||||||||||
Electronics Fund | — | — | (186,031 | ) | (3,322,614 | )1 | ||||||||||
Energy Fund | 773,033 | 2,635,813 | 7,391,812 | — | ||||||||||||
Energy Services Fund | 47,149 | 2,568,873 | 6,471,303 | — | ||||||||||||
Financial Services Fund | 16,526 | — | (1,424,484 | ) | (6,138,477 | )1 | ||||||||||
Health Care Fund | — | — | 779,130 | (6,889,728 | )1 | |||||||||||
Internet Fund | — | 1,259,155 | 1,113,137 | — | ||||||||||||
Leisure Fund | — | — | 1,153,900 | (1,497,730 | )1 | |||||||||||
| 126 | THE RYDEX FUNDSANNUALREPORT |
| NOTES TO FINANCIAL STATEMENTS (continued) | ||
| Undistributed | Undistributed | Net Unrealized | ||||||||||||||
| Ordinary | Long-Term | Appreciation/ | Capital Loss | |||||||||||||
Fund | Income | Capital Gain | (Depreciation) | Carryforward | ||||||||||||
Precious Metals Fund | $ | — | $ | 5,322,508 | $ | 17,294,078 | $ | — | ||||||||
Retailing Fund | — | — | 1,180,652 | (199,980 | )1 | |||||||||||
Technology Fund | — | 1,504,765 | 1,480,568 | (1,220,416 | )1 | |||||||||||
Telecommunications Fund | 63,032 | — | (403,445 | ) | (1,560,776 | )1 | ||||||||||
Transportation Fund | — | — | 756,641 | (9,924,719 | )1 | |||||||||||
Utilities Fund | 459,947 | — | 2,886,096 | (1,554,315 | )1 | |||||||||||
Capital Loss Carryforward amounts may be limited due to Federal income tax regulations.
| 1 | A summary of the expiration of the aforementioned Capital Loss Carryforward is as follows: |
| Total | ||||||||||||||||||||||||||||||||||||||||
| Expires in | Expires in | Expires in | Expires in | Expires in | Expires in | Expires in | Unlimited | Capital Loss | ||||||||||||||||||||||||||||||||
Fund | 2012 | 2013 | 2014 | 2015 | 2016 | 2017 | 2018 | Short Term | Long Term | Carryforward | ||||||||||||||||||||||||||||||
Banking Fund | $ | — | $ | — | $ | — | $ | — | $ | — | $ | — | $ | — | $ | — | $ | — | $ | (891,095 | )* | |||||||||||||||||||
Biotechnology Fund | (1,880,980 | ) | (739,559 | ) | (1,048,743 | ) | (717,792 | ) | (239,044 | ) | (5,635,438 | ) | (116,485 | ) | (1,377,486 | ) | — | (11,755,527 | ) | |||||||||||||||||||||
Consumer Products Fund | — | — | — | — | — | (2,171,725 | ) | — | — | — | (2,171,725 | ) | ||||||||||||||||||||||||||||
Electronics Fund | (504,508 | ) | (484,274 | ) | (329,594 | ) | (329,594 | ) | (329,594 | ) | (67,626 | ) | (591,562 | ) | (685,862 | ) | — | (3,322,614 | ) | |||||||||||||||||||||
Financial Services Fund | — | — | — | (1,035,063 | ) | (2,376,570 | ) | (2,453,589 | ) | (273,255 | ) | — | — | (6,138,477 | ) | |||||||||||||||||||||||||
Health Care Fund | — | — | — | — | (1,097,466 | ) | (5,000,785 | ) | — | (646,402 | ) | (145,075 | ) | (6,889,728 | ) | |||||||||||||||||||||||||
Leisure Fund | — | — | — | — | (1,496,602 | ) | — | (1,128 | ) | — | — | (1,497,730 | ) | |||||||||||||||||||||||||||
Retailing Fund | — | — | — | — | — | (199,980 | ) | — | — | — | (199,980 | ) | ||||||||||||||||||||||||||||
Technology Fund | — | — | — | — | (1,220,416 | ) | — | — | — | — | (1,220,416 | ) | ||||||||||||||||||||||||||||
Telecommunications Fund | — | — | — | — | (501,247 | ) | (1,059,529 | ) | — | — | — | (1,560,776 | ) | |||||||||||||||||||||||||||
Transportation Fund | — | — | — | — | (593,525 | ) | (8,058,463 | ) | (1,120,067 | ) | (152,664 | ) | — | (9,924,719 | ) | |||||||||||||||||||||||||
Utilities Fund | — | — | — | — | (704,929 | ) | (847,739 | ) | — | (1,647 | ) | — | (1,554,315 | ) | ||||||||||||||||||||||||||
| * | In accordance with Section 382 of the Internal Revenue Code, a portion of certain Fund losses are subject to an annual limitation. Note, this annual limitation is generally applicable to all of the capital loss carryovers shown with respect to each Fund. This limitation does not relate only to the loss shown on the first column of each Fund. |
Net investment income and net realized gains (losses) may differ for financial statement and tax purposes because of temporary or permanent book/tax differences. These differences are primarily due to post-October losses, losses deferred due to wash sales, foreign currency gains and losses, and the “mark-to-market” of certain passive foreign investment companies (PFICs) for tax purposes. Additional differences may result from the tax treatment of net investment losses and expired capital loss carryforwards. To the extent these differences are permanent, reclassifications are made to the appropriate equity accounts in the period that the differences arise. These reclassifications have no effect on net assets or NAV per share.
On the Statements of Assets and Liabilities, the following reclassifications were made for permanent book/tax differences:
| Undistributed | Accumulated | |||||||||||
| Paid In | Net Investment | Net Realized | ||||||||||
Fund | Capital | Income | Gain (Loss) | |||||||||
Banking Fund | $ | (9,595,176 | ) | $ | — | $ | (9,595,176 | ) | ||||
Basic Materials Fund | (1,825 | ) | 19,003 | (17,178 | ) | |||||||
Biotechnology Fund | (194,907 | ) | 211,494 | (16,587 | ) | |||||||
Consumer Products Fund | — | — | — | |||||||||
Electronics Fund | (55,880 | ) | 55,881 | (1 | ) | |||||||
Energy Fund | (1 | ) | 135,290 | (135,289 | ) | |||||||
Energy Services Fund | — | 253,305 | (253,305 | ) | ||||||||
Financial Services Fund | (5,633 | ) | (4,633 | ) | 10,266 | |||||||
Health Care Fund | (64,596 | ) | 64,596 | — | ||||||||
Internet Fund | (132,664 | ) | 132,664 | — | ||||||||
Leisure Fund | 90,365 | 14,730 | (105,095 | ) | ||||||||
Precious Metals Fund | (452,129 | ) | 505,135 | (53,006 | ) | |||||||
Retailing Fund | (16,830 | ) | 16,831 | (1 | ) | |||||||
Technology Fund | (3,306 | ) | 113,466 | (110,160 | ) | |||||||
Telecommunications Fund | — | — | — | |||||||||
Transportation Fund | (47,525 | ) | 47,524 | 1 | ||||||||
Utilities Fund | — | — | — | |||||||||
| THE RYDEX FUNDSANNUALREPORT | 127 |
| NOTES TO FINANCIAL STATEMENTS (continued) | ||
At December 31, 2011, the cost of securities for Federal income tax purposes, the aggregate gross unrealized gain for all securities for which there was an excess of value over tax cost and the aggregate gross unrealized loss for all securities for which there was an excess of tax cost over value, were as follows:
| Tax | Tax | Net | ||||||||||||||
| Tax | Unrealized | Unrealized | Unrealized | |||||||||||||
Fund | Cost | Gain | Loss | Gain (Loss) | ||||||||||||
Banking Fund | $ | 3,329,487 | $ | — | $ | (729,204 | ) | $ | (729,204 | ) | ||||||
Basic Materials Fund | 12,754,582 | 3,381,915 | (203,718 | ) | 3,178,197 | |||||||||||
Biotechnology Fund | 9,930,131 | 2,042,646 | (52,000 | ) | 1,990,646 | |||||||||||
Consumer Products Fund | 19,269,455 | 3,955,988 | (149,822 | ) | 3,806,166 | �� | ||||||||||
Electronics Fund | 3,252,670 | — | (186,031 | ) | (186,031 | ) | ||||||||||
Energy Fund | 21,670,855 | 7,810,001 | (418,189 | ) | 7,391,812 | |||||||||||
Energy Services Fund | 14,216,603 | 6,598,997 | (127,694 | ) | 6,471,303 | |||||||||||
Financial Services Fund | 6,894,508 | — | (1,424,484 | ) | (1,424,484 | ) | ||||||||||
Health Care Fund | 15,167,102 | 955,834 | (176,704 | ) | 779,130 | |||||||||||
Internet Fund | 3,903,998 | 1,202,753 | (89,616 | ) | 1,113,137 | |||||||||||
Leisure Fund | 4,637,005 | 1,208,815 | (54,915 | ) | 1,153,900 | |||||||||||
Precious Metals Fund | 39,874,597 | 18,174,835 | (880,775 | ) | 17,294,060 | |||||||||||
Retailing Fund | 11,977,741 | 1,370,191 | (189,539 | ) | 1,180,652 | |||||||||||
Technology Fund | 8,427,256 | 1,606,366 | (125,798 | ) | 1,480,568 | |||||||||||
Telecommunications Fund | 4,780,101 | — | (403,445 | ) | (403,445 | ) | ||||||||||
Transportation Fund | 4,808,200 | 831,121 | (74,480 | ) | 756,641 | |||||||||||
Utilities Fund | 28,697,421 | 2,933,904 | (47,808 | ) | 2,886,096 | |||||||||||
4. Fair Value Measurement
In accordance with U.S. generally accepted accounting principles, fair value is defined as the price that the Fund would receive to sell an investment or pay to transfer a liability in an orderly transaction with an independent buyer in the principal market, or in the absence of a principal market the most advantageous market for the investment or liability. A three-tier hierarchy is utilized to distinguish between (1) inputs that reflect the assumptions market participants would use in pricing an asset or liability developed based on market data obtained from sources independent of the reporting entity (observable inputs) and (2) inputs that reflect the reporting entity’s own assumptions about the assumptions market participants would use in pricing an asset or liability developed based on the best information available in the circumstances (unobservable inputs) and to establish classification of fair value measurements for disclosure purposes. Various inputs are used in determining the value of the Funds’ investments. The inputs are summarized in the three broad levels listed below:
| Level 1 — | quoted prices in active markets for identical securities. | |
| Level 2 — | other significant observable inputs (including quoted prices for similar securities, interest rates, prepayment speeds, credit risk, etc.). | |
| Level 3 — | significant unobservable inputs (including the fund’s own assumptions used to determine the fair value of investments). | |
The inputs or methodologies used for valuing securities are not necessarily an indication of the risk associated with investing in those securities.
The following table summarizes the inputs used to value the Funds’ net assets at December 31, 2011:
| Level 1 | Level 2 | Level 3 | ||||||||||||||
| Investments | Investments | Investments | ||||||||||||||
| In Securities | In Securities | In Securities | Total | |||||||||||||
Assets | ||||||||||||||||
Banking Fund | $ | 2,585,361 | $ | 14,922 | $ | — | $ | 2,600,283 | ||||||||
Basic Materials Fund | 15,815,641 | 117,139 | — | 15,932,780 | ||||||||||||
Biotechnology Fund | 11,832,491 | 88,286 | — | 11,920,777 | ||||||||||||
Consumer Products Fund | 22,978,877 | 96,744 | — | 23,075,621 | ||||||||||||
Electronics Fund | 3,039,955 | 26,683 | — | 3,066,638 | ||||||||||||
Energy Fund | 29,009,620 | 53,047 | — | 29,062,667 | ||||||||||||
Energy Services Fund | 20,526,027 | 161,879 | — | 20,687,906 | ||||||||||||
Financial Services Fund | 5,444,252 | 25,773 | — | 5,470,025 | ||||||||||||
Health Care Fund | 15,834,106 | 112,126 | — | 15,946,232 | ||||||||||||
Internet Fund | 4,974,189 | 42,947 | — | 5,017,136 | ||||||||||||
Leisure Fund | 5,753,223 | 37,682 | — | 5,790,905 | ||||||||||||
Precious Metals Fund | 56,756,427 | 412,230 | — | 57,168,657 | ||||||||||||
| 128 | THE RYDEX FUNDSANNUALREPORT |
NOTES TO FINANCIAL STATEMENTS (continued) | ||
| Level 1 | Level 2 | Level 3 | ||||||||||||||
| Investments | Investments | Investments | ||||||||||||||
| In Securities | In Securities | In Securities | Total | |||||||||||||
Retailing Fund | $ | 13,062,357 | $ | 95,139 | $ | 897 | $ | 13,158,393 | ||||||||
Technology Fund | 9,821,972 | 85,852 | — | 9,907,824 | ||||||||||||
Telecommunications Fund | 4,346,158 | 30,499 | — | 4,376,657 | ||||||||||||
Transportation Fund | 5,513,050 | 51,791 | — | 5,564,841 | ||||||||||||
Utilities Fund | 31,468,140 | 115,377 | — | 31,583,517 | ||||||||||||
For the year ended December 31, 2011, there were no transfers between levels.
Following is a reconciliation of Level 3 assets for which significant unobservable inputs were used to determine for the year ended December 31, 2011:
LEVEL 3 – Fair value measurement using significant unobservable inputs
| Securities | ||||
Retailing | ||||
Assets: | ||||
Beginning Balance | $ | — | ||
Total realized gains or losses included in earnings | — | |||
Total unrealized gains or losses included in earnings | (11,366 | ) | ||
Issuances | 12,263 | |||
|
| |||
Ending Balance | $ | 897 | ||
|
| |||
5. Repurchase Agreements
The Funds transfer uninvested cash balances into a single joint account, the daily aggregate balance of which is invested in one or more repurchase agreements collateralized by obligations of the U.S. Treasury and U.S. Government Agencies. The collateral is in the possession of the Funds’ custodian and is evaluated to ensure that its market value exceeds, at a minimum, 102% of the original face amount of the repurchase agreements. Each Fund holds a pro rata share of the collateral based on the dollar amount of the repurchase agreement entered into by each Fund.
At December 31, 2011, the collateral for the repurchase agreements in the joint account was as follows:
| Repurchase | ||||||||||||||||||||
Counterparty and Terms of Agreement | Face Value | Price | Collateral | Par Value | Fair Value | |||||||||||||||
Credit Suisse Group | U.S. Treasury Note | |||||||||||||||||||
0.00% | 1.75 | % | ||||||||||||||||||
Due 01/03/12 | $ | 17,568,327 | $ | 17,568,327 | 05/31/16 | $ | 17,100,400 | $ | 17,919,794 | |||||||||||
In the event of counterparty default, the Funds have the right to collect the collateral to offset losses incurred. There is potential loss to the Funds in the event the Funds are delayed or prevented from exercising their rights to dispose of the collateral securities, including the risk of a possible decline in the value of the underlying securities during the period while the Funds seek to assert their rights. The Funds’ investment advisor, acting under the supervision of the Board of Trustees, reviews the value of the collateral and the creditworthiness of those banks and dealers with which the Funds enter into repurchase agreements to evaluate potential risks.
6. Securities Transactions
For the year ended December 31, 2011, the cost of purchases and proceeds from sales of investment securities, excluding short-term investments, were:
| Purchases | Sales | |||||||
Banking Fund | $ | 48,077,514 | $ | 50,211,578 | ||||
Basic Materials Fund | 60,458,986 | 88,091,430 | ||||||
Biotechnology Fund | 76,518,287 | 77,735,640 | ||||||
Consumer Products Fund | 73,834,170 | 67,739,418 | ||||||
Electronics Fund | 67,549,281 | 72,479,940 | ||||||
Energy Fund | 82,738,424 | 92,871,482 | ||||||
Energy Services Fund | 73,592,585 | 90,370,795 | ||||||
Financial Services Fund | 34,759,155 | 36,482,132 | ||||||
Health Care Fund | 67,919,088 | 62,686,322 | ||||||
Internet Fund | 31,400,439 | 42,042,242 | ||||||
Leisure Fund | 18,196,248 | 25,261,659 | ||||||
Precious Metals Fund | 174,752,146 | 210,987,030 | ||||||
| THE RYDEX FUNDSANNUALREPORT | 129 |
NOTES TO FINANCIAL STATEMENTS (continued) | ||
| Purchases | Sales | |||||||
Retailing Fund | $ | 57,647,096 | $ | 54,022,163 | ||||
Technology Fund | 53,424,044 | 64,246,072 | ||||||
Telecommunications Fund | 54,041,513 | 57,118,714 | ||||||
Transportation Fund | 55,010,199 | 61,680,534 | ||||||
Utilities Fund | 88,693,835 | 74,549,830 | ||||||
7. Line of Credit
The Trust, along with other affiliated trusts, has secured an uncommitted, $75,000,000 line of credit with U.S. Bank, N.A. for emergency or temporary purposes. Borrowings, if any, under this arrangement bear interest equal to the Prime Rate, minus 2%, which shall be paid monthly, averaging 1.25% for the year ended December 31, 2011. At December 31, 2011, the Funds did not have any borrowings under this agreement, which expires on June 15, 2012, but the following table illustrates average daily balances borrowed:
| Average | ||||
| Daily | ||||
Fund | Balance | |||
Banking Fund | $ | 3,162 | ||
Basic Materials Fund | 6,877 | |||
Biotechnology Fund | 95,959 | |||
Consumer Products Fund | 3,962 | |||
Electronics Fund | 6,548 | |||
Energy Fund | 37,740 | |||
Energy Services Fund | 23,951 | |||
Financial Services Fund | 2,819 | |||
Health Care Fund | 18,726 | |||
Internet Fund | 3,975 | |||
Leisure Fund | 970 | |||
Precious Metals Fund | 7,085 | |||
Retailing Fund | 2,129 | |||
Technology Fund | 2,619 | |||
Telecommunications Fund | 5,970 | |||
Transportation Fund | 5,893 | |||
Utilities Fund | 4,529 | |||
8. Legal Proceedings
Tribune Company
Rydex Variable Trust has been named as a defendant and a putative member of the proposed defendant class of shareholders in the case entitled Official Committee of Unsecured Creditors of Tribune Co. v. FitzSimons (In re Tribune Co.), Adv. Pro. No. 10-54010 (Bankr. D. Del.), as a result of ownership of shares in the Tribune Company (“Tribune”) in 2007 by certain series of the Rydex Variable Trust when Tribune effected a leveraged buyout transaction (“LBO”) by which Tribune converted to a privately-held company. In its complaint, the Unsecured Creditors Committee (the “UCC”) has alleged that, in connection with the LBO, insiders and major shareholders were overpaid for their Tribune stock using financing that the insiders knew would, and ultimately did, leave the Tribune insolvent. The UCC has asserted claims against certain insiders, major shareholders, professional advisers, and others involved in the LBO, and is attempting to obtain from these individuals and entities the proceeds paid out in connection with the LBO. This adversary proceeding in the Bankruptcy Court has been stayed pending further order of the Bankruptcy Court.
In June 2011, a group of Tribune creditors, not including the UCC, filed multiple actions involving state law constructive fraudulent conveyance claims against former Tribune shareholders. Rydex Variable Trust also has been named as a defendant in one or more of these suits. These cases have been consolidated in a multidistrict litigation proceeding in the United States District Court for the Southern District of New York and have been stayed pending further order of that court or of the Bankruptcy Court.
None of these lawsuits allege any wrongdoing on the part of Rydex Variable Trust. The following series of Rydex Variable Trust held shares of Tribune and tendered these shares as part of Tribune’s LBO: Nova Fund, S&P 500 2x Strategy Fund, Multi-Cap Core Equity Fund, S&P 500 Pure Value Fund, Hedged Equity Fund and Multi-Hedge Strategies Fund (the “Funds”). The value of the proceeds received by the foregoing Funds was $12,580, $2,380, $1,360, $148,376, $2,720, and $119,034, respectively. At this stage of the proceedings, Rydex Variable Trust is not able to make a reliable predication as to the outcome of these lawsuits or the effect, if any, on a Fund’s net asset value.
| 130 | THE RYDEX FUNDSANNUALREPORT |
NOTES TO FINANCIAL STATEMENTS (concluded)
Lyondell Chemical Company
In December 2011, Rydex Variable Trust was named as a defendant in Weisfelner, as Trustee of the LB Creditor Trust, v. Fund 1 (In re Lyondell Chemical Co.), Adv. Pro. No. 10-4609 (Bankr. S.D.N.Y.).
Similar to the claims made in the Tribune matter, the Weisfelner complaint seeks to have set aside and recovered as fraudulent transfers from former Lyondell Chemical Company (“Lyondell”) shareholders the consideration paid to them pursuant to the cash out merger of Lyondell shareholders in connection with the combination of Lyondell and Basell AF in 2007. Lyondell filed for bankruptcy in 2008.
This lawsuit does not allege any wrongdoing on the part of Rydex Variable Trust. The following series of Rydex Variable Trust received cash proceeds from the cash out merger in the following amounts: Basic Materials Fund - $1,235,952; U.S. Long Short Momentum Fund - $523,200; Multi-Cap Core Equity Fund - $5,760; Hedged Equity Fund - $480; and Multi-Hedge Strategies Fund - $112,848. At this stage of the proceedings, Rydex Variable Trust is not able to make a reliable predication as to the outcome of these lawsuits or the effect, if any, on a Fund’s net asset value.
| THE RYDEX FUNDSANNUALREPORT | 131 |
REPORT OF INDEPENDENT REGISTERED PUBLIC ACCOUNTING FIRM
To the Board of Trustees and Shareholders of Rydex Variable Trust:
We have audited the accompanying statements of assets and liabilities, including the schedules of investments, of Banking Fund, Basic Materials Fund, Biotechnology Fund, Consumer Products Fund, Electronics Fund, Energy Fund, Energy Services Fund, Financial Services Fund, Health Care Fund, Internet Fund, Leisure Fund, Precious Metals Fund, Retailing Fund, Technology Fund, Telecommunications Fund, Transportation Fund and Utilities Fund (seventeen of the series constituting the Rydex Variable Trust) (the “Funds”) as of December 31, 2011, and the related statements of operations for the year then ended, the statements of changes in net assets for each of the two years in the period then ended, and the financial highlights for each of the four years in the period then ended. These financial statements and financial highlights are the responsibility of the Funds’ management. Our responsibility is to express an opinion on these financial statements and financial highlights based on our audits. The financial highlights for the year ended December 31, 2007 were audited by other auditors, whose report dated February 25, 2008 expressed an unqualified opinion on those financial highlights.
We conducted our audits in accordance with the standards of the Public Company Accounting Oversight Board (United States). Those standards require that we plan and perform the audit to obtain reasonable assurance about whether the financial statements and financial highlights are free of material misstatement. We were not engaged to perform an audit of the Funds’ internal control over financial reporting. Our audits included consideration of internal control over financial reporting as a basis for designing audit procedures that are appropriate in the circumstances, but not for the purpose of expressing an opinion on the effectiveness of the Funds’ internal control over financial reporting. Accordingly, we express no such opinion. An audit also includes examining, on a test basis, evidence supporting the amounts and disclosures in the financial statements and financial highlights, assessing the accounting principles used and significant estimates made by management, as well as evaluating the overall financial statement presentation. Our procedures included confirmation of securities owned as of December 31, 2011, by correspondence with the custodian and brokers or by other appropriate auditing procedures where replies from brokers were not received. We believe that our audits provide a reasonable basis for our opinion.
In our opinion, the financial statements and financial highlights referred to above present fairly, in all material respects, the financial position of the above listed Funds at December 31, 2011, the results of their operations for the year then ended, the changes in their net assets for each of the two years in the period then ended, and their financial highlights for each of the four years in the period then ended, in conformity with U.S. generally accepted accounting principles.

McLean, Virginia
February 28, 2011
| 132 | THE RYDEX FUNDSANNUALREPORT |
Tax Information
This information is being provided as required by the Internal Revenue Code. Amounts shown may differ from those elsewhere in the report because of differences in tax and financial reporting practice.
Of the ordinary income distributions paid during the year, the following funds had the corresponding percentages qualify for the dividends received deduction for corporations:
Fund | % Qualifying | |||
Banking Fund | 100 | % | ||
Consumer Products Fund | 100 | % | ||
Financial Services Fund | 100 | % | ||
Precious Metals Fund | 100 | % | ||
Telecommunications Fund | 100 | % | ||
Utilities Fund | 100 | % | ||
With respect to the taxable year ended December 31, 2011, the Funds hereby designate as capital gain dividends the amounts listed below, or, if subsequently determined to be different, the net capital gain of such year:
| Basic | Energy | |||||||||||||||||||||||
| Materials | Electronics | Energy | Services | Technology | Telecommunications | |||||||||||||||||||
| Fund | Fund | Fund | Fund | Fund | Fund | |||||||||||||||||||
From long-term capital gains,subject to the 15% rate gains category: | $ | 2,783,814 | $ | 2,395,856 | $ | 185,047 | $ | 2,664,613 | $ | 598,420 | $ | 83,551 | ||||||||||||
Proxy Voting Information
A description of the policies and procedures that the Trust uses to determine how to vote proxies relating to securities held in the Funds’ portfolios is available, without charge and upon request, by calling 1.800.820.0888. This information is also available from the EDGAR database on the SEC’s website at http://www.sec.gov.
Information regarding how the Funds voted proxies relating to portfolio securities during the most recent 12-month period ended June 30 is available without charge, upon request, by calling 1.800.820.0888. This information is also available from the EDGAR database on the SEC’s website at http://www.sec.gov.
At a special meeting of shareholders held on November 22, 2011, the shareholders of the Funds voted on whether to approve a new investment advisory agreement between Rydex Variable Trust and Security Investors, LLC. A description of the number of shares voted is as follows:
Fund | Shares For | Shares Against | Shares Abstained | |||||||||
Banking Fund | 137,168 | 717 | — | |||||||||
Basic Materials Fund | 514,363 | 20,810 | 19,066 | |||||||||
Biotechnology Fund | 328,986 | 15,671 | 29,496 | |||||||||
Consumer Products Fund | 378,295 | 20,304 | 9,366 | |||||||||
Electronics Fund | 387,909 | 13,412 | 10,998 | |||||||||
Energy Fund | 741,966 | 4,942 | 48,317 | |||||||||
Energy Services Fund | 857,439 | 4,019 | 80,609 | |||||||||
Financial Services Fund | 298,608 | 22,745 | 16,012 | |||||||||
Health Care Fund | 541,680 | 31,189 | 16,176 | |||||||||
Internet Fund | 248,918 | 14,115 | 19,712 | |||||||||
Leisure Fund | 82,379 | 2,069 | 4,783 | |||||||||
Precious Metals Fund | 4,443,904 | 27,984 | 249,162 | |||||||||
Retailing Fund | 527,593 | 37,627 | 11,678 | |||||||||
Technology Fund | 755,581 | 6,544 | 5,028 | |||||||||
Telecommunications Fund | 327,226 | 7,908 | 12,254 | |||||||||
Transportation Fund | 297,567 | 6,760 | 13,524 | |||||||||
Utilities Fund | 1,127,453 | 37,138 | 43,567 | |||||||||
| THE RYDEX FUNDSANNUALREPORT | 133 |
| OTHER INFORMATION (Unaudited) (continued) | ||
At a special meeting of shareholders held on November 22, 2011, the shareholders of the Trust also voted on whether to approved the election of nominees to the Board of Trustees. A description of the number of shares voted is as follows:
Donald C. Cacciapaglia | Corey A. Colehour | J. Kenneth Dalton | ||||||||
For | 343,022,995 | For | 339,263,789 | For | 342,726,825 | |||||
Withhold | 18,549,008 | Withhold | 22,308,214 | Withhold | 18,845,178 | |||||
Total | 361,572,003 | Total | 361,572,003 | Total | 361,572,003 |
John O. Demaret | Richard M. Goldman | Werner E. Keller | ||||||||
For | 338,940,641 | For | 342,766,477 | For | 342,532,565 | |||||
Withhold | 22,631,362 | Withhold | 18,805,526 | Withhold | 19,039,438 | |||||
Total | 361,572,003 | Total | 361,572,003 | Total | 361,572,003 |
Thomas F. Lydon | Patrick T. McCarville | Roger Somers | ||||||||
For | 343,159,833 | For | 339,367,739 | For | 343,007,265 | |||||
Withhold | 18,412,170 | Withhold | 22,204,264 | Withhold | 18,564,738 | |||||
Total | 361,572,003 | Total | 361,572,003 | Total | 361,572,003 |
At a special meeting of shareholders held on November 22, 2011, the shareholders of the Funds also voted on whether to approve a “manager of managers” arrangement for each of the Funds. A description of the number of shares voted is as follows:
Fund | Shares For | Shares Against | Shares Abstained | |||||||||
Banking Fund | 136,687 | 1,198 | — | |||||||||
Basic Materials Fund | 512,979 | 24,355 | 16,900 | |||||||||
Biotechnology Fund | 330,248 | 17,642 | 26,263 | |||||||||
Consumer Products Fund | 374,292 | 24,360 | 9,312 | |||||||||
Electronics Fund | 387,909 | 10,454 | 13,956 | |||||||||
Energy Fund | 726,086 | 18,184 | 50,956 | |||||||||
Energy Services Fund | 852,181 | 7,663 | 82,222 | |||||||||
Financial Services Fund | 253,891 | 35,518 | 47,956 | |||||||||
Health Care Fund | 535,949 | 38,493 | 14,602 | |||||||||
Internet Fund | 246,296 | 14,916 | 21,533 | |||||||||
Leisure Fund | 81,150 | 2,706 | 5,376 | |||||||||
Precious Metals Fund | 4,232,568 | 226,700 | 261,782 | |||||||||
Retailing Fund | 528,461 | 40,426 | 8,011 | |||||||||
Technology Fund | 745,786 | 16,339 | 5,028 | |||||||||
Telecommunications Fund | 327,573 | 6,883 | 12,933 | |||||||||
Transportation Fund | 296,026 | 8,474 | 13,351 | |||||||||
Utilities Fund | 1,090,939 | 73,654 | 43,567 | |||||||||
Quarterly Portfolio Schedules Information
The Trust files its complete schedule of portfolio holdings with the SEC for the first and third quarters of each fiscal year on Form N-Q; which are available on the SEC’s website at http://www.sec.gov. The Funds’ Forms N-Q may be reviewed and copied at the SEC’s Public Reference Room in Washington, DC, and that information on the operation of the Public Reference Room may be obtained by calling 1-800-SEC-0330. Copies of the portfolio holdings are also available to shareholders, without charge and upon request, by calling 1.800.820.0888.
Office Locations
The offices of Guggenheim Investments can be found in the following locations:
40 East 52nd Street
16th Floor
New York, NY 10022
(Headquarters)
Four Irvington Centre
805 King Farm Boulevard
Suite 600
Rockville, MD 20850
9401 Indian Creek Parkway
40 Corporate Woods
Suite 850
Overland Park, KS 66210
| 134 | THE RYDEX FUNDSANNUALREPORT |
| OTHER INFORMATION (Unaudited) (continued) | ||
Guggenheim Transaction
On September 20, 2011, Guggenheim Capital, LLC agreed to purchase the indirect holding company of Security Investors, LLC, the Funds’ investment manager (the “Investment Manager”) (the “Transaction”). Guggenheim Capital, LLC’s subsidiary, Guggenheim Partners, LLC (“Guggenheim”), is a global, independent, privately-held, diversified financial services firm with more than 1,500 dedicated professionals.
The Transaction should not result in material changes to the day-to-day management and operations of the Funds or any increase in fees. The parties expect the Transaction to be completed early 2012. However, it is subject to various conditions, and could be delayed or even terminated due to unforeseen circumstances.
In anticipation of the Transaction, the Board of Trustees of the Funds (the “Board”) called special meetings of shareholders (the “Meeting”), at which shareholders of record of each of the Funds as of October 3, 2011 were asked to consider the approval of new investment advisory agreements between the Funds and the Investment Manager (the “New Agreement”). This approval was necessary because, under the Investment Company Act of 1940 (the “1940 Act”), the Transaction could have resulted in the termination of the Funds’ current investment advisory agreements with the Investment Manager (the “Current Agreement”). The Funds’ shareholders approved the New Agreement, the terms of which are substantially identical to the corresponding Current Agreement, except with respect to the date of execution, and the New Agreement will take effect if the Transaction is completed.
Election of Board Members
The Board also approved a proposal to elect nine individuals to the Board. The Board proposed the election of the following nominees: Donald C. Cacciapaglia, Corey A. Colehour, J. Kenneth Dalton, John O. Demaret, Richard M. Goldman, Werner E. Keller, Thomas F. Lydon, Patrick T. McCarville and Roger Somers. Each of the nominees, other than Mr. Cacciapaglia, currently serves as a Trustee. In connection with the Transaction, the Board believes that expanding the Board to include Mr. Cacciapaglia, who is a member of senior management of Guggenheim’s investment management business, and who would serve on other board in the Guggenheim Investments family of funds, would be appropriate. The Trusts’ shareholders ultimately approved the aforementioned proposal.
Board Considerations in Approving the Investment Advisory Agreement
At an in-person meeting of the Trust’s Board of Trustees held August 16-17, 2011, called for the purpose of, among other things, voting on the approval of investment advisory agreement applicable to the series of the Trust (collectively, the “Funds”), the Trust’s Board of Trustees, including the independent Trustees, unanimously approved the investment advisory agreement between the Trust and Guggenheim Investments (referred to herein as the “Adviser”).
At the meeting of August 16-17, 2011, the Trust’s Board of Trustees also considered a new investment advisory agreement that was required as a result of a proposed change in the corporate ownership structure of the Adviser (the “Transaction”). The Investment Company Act of 1940 (the “1940 Act”), the law that regulates mutual funds, including the Funds, requires that a fund’s investment advisory agreement terminate whenever there is deemed to be a “change in control” of the investment adviser. The change in the corporate ownership structure of the Adviser could potentially be deemed to constitute a “change in control” (as this term is used for regulatory purposes) of the Adviser. Before an investment advisory agreement terminates, a new investment advisory agreement must be in effect in order for the investment adviser to continue to manage the fund’s investments. For that reason, the Board of Trustees was asked to approve a new investment advisory agreement for the Funds.
At the meeting of August 16-17, 2011, the Board considered the new investment advisory agreement, pursuant to which, subject to approval by each Fund’s shareholders of the new agreement, the Adviser would continue to serve each Fund as investment adviser after the completion of the Transaction. At a special meeting of the Board held on September 14, 2011, the Board considered further information about the Transaction and voted in favor of the new investment advisory agreement.
In reaching the conclusion to approve the new investment advisory agreement, the Trustees requested and obtained from the Adviser such information as the Trustees deemed reasonably necessary to evaluate the proposed agreements. The Trustees carefully evaluated this information and were advised by legal counsel with respect to their deliberations.
Prior to the Board meetings in August and September 2011, representatives of Guggenheim Capital informed the Board of the Transaction. With respect to the Transaction, the Board reviewed materials received from Guggenheim Capital, including information relating to the terms of the Transaction. The Board also reviewed information regarding Guggenheim Capital, including, but not limited to: (a) certain representations concerning Guggenheim Capital’s financial condition, (b) information regarding the new proposed ownership structure and its possible effect on shareholders, (c) information regarding the consideration to be paid by Guggenheim Capital, and (d) potential conflicts of interest.
In considering the new investment advisory agreement, the Board determined that the agreement would enable shareholders of the Funds to continue to obtain high quality services at a cost that is appropriate, reasonable, and in the best interests of their
| THE RYDEX FUNDSANNUALREPORT | 135 |
| OTHER INFORMATION (Unaudited) (continued) | ||
shareholders. The Board, including the independent Trustees, unanimously approved the new agreement. In reaching their decision, the Trustees carefully considered information that they had received throughout the year as part of their regular oversight of the Funds, including, in particular, information from the Adviser that the Board had received relating to the current investment advisory agreement at the Board meeting of August 16-17, 2011. The Trustees noted that, at the meeting, they had obtained and reviewed a wide variety of information, including certain comparative information regarding performance of the Funds relative to performance of other comparable mutual funds. They also considered the evolution of the Rydex family of funds and the Adviser since the change in control of the Investment Adviser in 2010 and Guggenheim Capital’s commitment to the success of the Adviser and the Funds.
In addition, as a part of their required consideration of the renewal of the current investment advisory agreement at the meeting of August 16-17, 2011, the Trustees, including the independent Trustees, had evaluated a number of considerations, including among others: (a) the quality of the Adviser’s investment advisory and other services; (b) the Adviser’s investment management personnel; (c) the Adviser’s operations and financial condition; (d) the Adviser’s brokerage practices (including any soft dollar arrangements) and investment strategies; (e) the level of the fees that the Adviser charges compared with the fees charged to comparable mutual funds or accounts; (f) each Fund’s overall fees and operating expenses compared with similar mutual funds; (g) the level of the Adviser’s profitability from its Fund-related operations; (h) the Adviser’s compliance systems; (i) the Adviser’s policies on and compliance procedures for personal securities transactions; (j) the Adviser’s reputation, expertise and resources in the financial markets; and (k) Fund performance compared with similar mutual funds. Based on the Board’s deliberations at the meetings of August 16-17, 2011 and September 14, 2011, and its evaluation of the information regarding the Transaction and the fact that the Transaction is not expected to change the level and quality of services rendered by the Adviser to any of the Funds, the Board, including all of the independent Trustees, unanimously: (a) concluded that terms of the current and new investment advisory agreements are fair and reasonable; (b) concluded that the Adviser’s fees were reasonable in light of the services provided to the Funds; and (c) agreed to approve the current investment advisory agreement and, subject to shareholder approval, the new investment advisory agreement, based upon the following considerations, among others:
| • | Nature, Extent and Quality of Services Provided by the Adviser. At the meeting of August 16-17, 2011, the Board reviewed the scope of services to be provided by the Adviser under the current investment advisory agreement, and, at the meetings of August 16-17, 2011 and September 14, 2011, noted that there would be no significant differences between the scope of services required to be provided by the Adviser under the current investment advisory agreement and the scope of services required to be provided by the Adviser under the new investment advisory agreement. The Board noted that the key investment and management personnel of the Adviser servicing the Funds are expected to remain the same following the Transaction. The Trustees also considered Guggenheim Capital’s representations to the Board that the Adviser would continue to provide investment and related services that were of materially the same quality and quantity as services provided to the Funds in the past, and that these services are appropriate in scope and extent in light of the Funds’ operations, the competitive landscape of the investment company business and investor needs. |
| • | Fund Expenses and Performance of the Funds. At the meeting of August 16-17, 2011, the Board had reviewed statistical information prepared by the Adviser regarding the expense ratio components and performance of each Fund. Based on the representations made by Guggenheim Capital at the meeting that the Adviser would continue to operate following the closing of the Transaction in much the same manner as it currently operates, the Board concluded that the investment performance of the Adviser was not expected to be affected by the Transaction. |
| • | Costs of Services Provided to the Funds and Profits Realized by the Adviser and its Affiliates. At the meeting of August 16-17, 2011, the Board had reviewed information about the profitability of the Funds to the Adviser based on the advisory fees payable under the current investment advisory agreement. At that meeting, the Board had also analyzed the Funds’ expenses, including the investment advisory fees paid to the Adviser. The Board also had reviewed reports comparing the expense ratios to those of other comparable mutual funds. At the Board meeting, the Board considered the fact that the fee rates payable to the Adviser would be the same under each Fund’s new investment advisory agreement as they are under such Fund’s current agreement. With respect to anticipated profitability, the Board noted that it was too early to predict how the Transaction would affect the Adviser’s profitability with respect to the Funds, but noted that this matter would be given further consideration on an ongoing basis. |
| • | Economies of Scale. In connection with its review of the Funds’ profitability analysis at the meeting of August 16-17, 2011, the Board reviewed information regarding economies of scale or other efficiencies that may result from increases in the Funds’ asset levels. The Trustees noted that the fees would not change under the new investment advisory agreement, and that no additional economies of scale would be directly realized as a result of the Transaction. They also noted that they will have the opportunity to again review the appropriateness of the fee payable to the Adviser under the new agreement when the renewal of the new agreement next comes before the Board. |
| • | Other Benefits to the Adviser and/or their Affiliates. In addition to evaluating the services provided by the Adviser, the Board had considered the nature, extent, quality and cost of the distribution services performed by the Funds’ Distributor |
| 136 | THE RYDEX FUNDSANNUALREPORT |
OTHER INFORMATION (Unaudited) (concluded)
under a separate agreement at the meeting of August 16-17, 2011. The Board reviewed information regarding potential economies of scale arising from the integration of the asset management businesses of Guggenheim Capital. The Board also considered the terms of the Transaction and the changes to the corporate ownership structure of the Adviser, noting that the Adviser would no longer be a subsidiary of Security Benefit Corporation. In this regard, the Board noted that, under the corporate structure after the Transaction, the Adviser would be more closely controlled by Guggenheim Capital, which could benefit Guggenheim Capital. The Board also noted that the costs associated with the Transaction would be borne by Guggenheim Capital (or its affiliates) and not the Funds. |
On the basis of the information provided to it and its evaluation of that information, the Board, including the independent Trustees, concluded that the terms of the investment advisory agreement for the Funds was reasonable, and that approval of the current and new investment advisory agreements was in the best interests of the Funds.
| THE RYDEX FUNDSANNUALREPORT | 137 |
INFORMATION ON BOARD OF TRUSTEES AND OFFICERS (Unaudited)
A Board of Trustees oversees the Trust, as well as other trusts of RI, in which its members have no stated term of service, and continue to serve after election until resignation. The Statement of Additional Information includes further information about Fund Trustees and Officers, and can be obtained without charge by calling 800.820.0888.
All Trustees and Officers may be reached c/o Guggenheim Investments, 805 King Farm Boulevard, Suite 600, Rockville, MD 20850.
INDEPENDENT TRUSTEES
Name, Position and Year of Birth | Length of Service as Trustee (Year Began) | Number of Funds Overseen | ||
Corey A. Colehour Trustee (1945) | Rydex Series Funds –1993 Rydex Variable Trust –1998 Rydex Dynamic Funds – 1999 Rydex ETF Trust – 2003 | 150 | ||
Principal Occupations During Past Five Years: Retired; Member of the Audit and Governance and Nominating Committees (1995 to present)
| ||||
| ||||
J. Kenneth Dalton Trustee (1941) | Rydex Series Funds –1995 Rydex Variable Trust –1998 Rydex Dynamic Funds –1999 Rydex ETF Trust – 2003
| 150 | ||
Principal Occupations During Past Five Years: Retired; Member of the Governance and Nominating Committees (1995 to present); Chairman of the Audit Committee (1997 to present); Member of the Risk Oversight Committee (2010 to present)
| ||||
| ||||
John O. Demaret Trustee, Chairman of the Board (1940) | Rydex Series Funds – 1997 Rydex Variable Trust – 1998 Rydex Dynamic Funds – 1999 Rydex ETF Trust – 2003
| 150 | ||
Principal Occupations During Past Five Years: Retired; Member of the Audit Committee (1997 to present); Member of the Risk Oversight Committee (2010 to present)
| ||||
| ||||
Werner E. Keller Trustee (1940) | Rydex Series Funds – 2005 Rydex Variable Trust – 2005 Rydex Dynamic Funds – 2005 Rydex ETF Trust – 2005 | 150 | ||
Principal Occupations During Past Five Years: Founder and President of Keller Partners, LLC (registered investment adviser) (2005 to present); Member of the Audit, Governance and Nominating Committees (2005 to present); Chairman and Member of the Risk Oversight Committee (2010 to present)
| ||||
| ||||
Thomas F. Lydon, Jr. Trustee (1960) | Rydex Series Funds – 2005 Rydex Variable Trust – 2005 Rydex Dynamic Funds – 2005 Rydex ETF Trust – 2005 | 150 | ||
Principal Occupations During Past Five Years: President, Global Trends Investments (1996 to present); Member of the Audit, Governance and Nominating Committees (2005 to present)
| ||||
| ||||
Patrick T. McCarville Trustee (1942) | Rydex Series Funds – 1997 Rydex Variable Trust – 1998 Rydex Dynamic Funds – 1999 Rydex ETF Trust – 2003 | 150 | ||
| Principal Occupations During Past Five Years: CEO, Par Industries, Inc., d/b/a Par Leasing (1977 to 2010); Chairman of the Governance and Nominating Committees (1997 to present); Member of the Audit Committee (1997 to present) | ||||
| 138 | THE RYDEX FUNDSANNUALREPORT |
INFORMATION ON BOARD OF TRUSTEES AND OFFICERS (Unaudited) (continued)
INDEPENDENT TRUSTEES (continued)
Name, Position and Year of Birth | Length of Service as Trustee (Year Began) | Number of Funds Overseen | ||
Roger Somers | Rydex Series Funds – 1993 | 150 | ||
Trustee (1944) | Rydex Variable Trust – 1998 | |||
| Rydex Dynamic Funds – 1999 | ||||
| Rydex ETF Trust – 2003 |
Principal Occupations During Past Five Years: Founder and CEO of Arrow Limousine (1965 to present); Member of the Audit, Governance and Nominating Committees (1995 to present)
EXECUTIVE OFFICERS
Name, Position and Year of Birth | Principal Occupations During Past Five Years | |
Richard M. Goldman* President (1961) | Current: Senior Vice President, Security Benefit Corporation; CEO, Security Benefit Asset Management Holdings, LLC; CEO, President and Manager Representative, Security Investors, LLC; CEO and Manager, Rydex Holdings, LLC; CEO, President and Manager, Rydex Distributors, LLC; Manager, Rydex Fund Services, LLC; President and Trustee, Rydex Series Funds, Rydex ETF Trust, Rydex Dynamic Funds and Rydex Variable Trust | |
| Previous: Director, First Security Benefit Life Insurance Company (2007–2010); President and Director, Security Global Investors (2010–2011); CEO and Director, Rydex Advisors, LLC and Rydex Advisor II, LLC (2010); Director, Security Distributors, Inc. (2007-2009); Managing Member, R M Goldman Partners, LLC (2006-2007) | ||
Michael P. Byrum* Vice President (1970) | Current: President, Security Benefit Asset Management Holdings, LLC; Senior Vice President, Security Investors, LLC; President and Chief Investment Officer, Rydex Holdings, LLC; Director and Chairman of the Board, Advisor Research Center, Inc.; Manager, Rydex Specialized Products, LLC | |
| Previous: Rydex Distributors, LLC (f/k/a Rydex Distributors, Inc.), Vice President (2009); Rydex Fund Services, LLC, Director (2009-2010), Secretary (2002-2010), Executive Vice President (2002-2006); Rydex Advisors, LLC (f/k/a PADCO Advisors, Inc.), Director (2008-2010), Chief Investment Officer (2006-2010), President (2004-2010); Secretary (2002-2010); Rydex Advisors II, LLC (f/k/a PADCO Advisors II, Inc.), Director (2008-2010), Chief Investment Officer (2006-2010), President (2004-2010), Secretary (2002-2010); Rydex Capital Partners, LLC, (President and Secretary 2003-2007); Rydex Capital Partners II, LLC, (2003-2007); Rydex Holdings, LLC (f/k/a Rydex Holdings, Inc.), Secretary 2005-2008), Executive Vice President (2005-2006); Advisor Research Center, Inc., Secretary (2006-2009), Executive Vice President (2006); Rydex Specialized Products, LLC, Secretary (2005-2008) | ||
| THE RYDEX FUNDSANNUALREPORT | 139 |
INFORMATION ON BOARD OF TRUSTEES AND OFFICERS (Unaudited) (continued)
EXECUTIVE OFFICERS (continued)
Name, Position and Year of Birth | Principal Occupations During Past Five Years | |
Nikolaos Bonos* Vice President and Treasurer (1963) | Current: Senior Vice President, Security Investors, LLC; Chief Executive Officer and Manager, Rydex Specialized Products, LLC; Chief Executive Officer and President, Rydex Fund Services, LLC; Vice President, Rydex Holdings, LLC; Treasurer, SBL Fund; Security Equity Fund; Security Income Fund; Security Large Cap Value Fund and Security Mid Cap Growth Fund; Vice President, Security Benefit Asset Management Holdings, LLC | |
| Previous: Security Global Investors, LLC, Senior Vice President (2010-2011); Rydex Advisors, LLC (f/k/a PADCO Advisors, Inc.) Senior Vice President (2006-2011); Rydex Fund Services, LLC (f/k/a Rydex Fund Services, Inc.), Director (2009) and Senior Vice President (2003-2006); Rydex Specialized Products, LLC, Chief Financial Officer (2005-2009) | ||
Joanna M. Haigney* Chief Compliance Officer and Secretary (1966) | Current: Chief Compliance Officer and Secretary, SBL Fund; Security Equity Fund; Security Income Fund; Security Large Cap Value Fund and Security Mid Cap Growth Fund; Vice President, Rydex Holdings, LLC; Vice President, Security Benefit Asset Management Holdings, LLC; Senior Vice President and Chief Compliance Officer, Security Investors, LLC | |
| Previous: Security Global Investors, LLC, Senior Vice President (2010-2011); Rydex Advisors, LLC (f/k/a PADCO Advisors, Inc.) and Rydex Advisors II, LLC (f/k/a PADCO Advisors II, Inc.), Chief Compliance Officer and Senior Vice President (2010-2011); Rydex Capital Partners I, LLC and Rydex Capital Partners II, LLC, Chief Compliance Officer (2006-2007); Rydex Fund Services, LLC (f/k/a Rydex Fund Services, Inc.), Vice President (2001-2006) | ||
Keith A. Fletcher* Vice President (1958) | Current: Senior Vice President, Security Investors, LLC; Vice President, Rydex Holdings, LLC; Vice President, Rydex Specialized Products, LLC; Vice President, Rydex Distributors, LLC; Vice President, Rydex Fund Services, LLC; Vice President and Director, Advisor Research Center, Inc.; Vice President, SBL Fund; Security Equity Fund; Security Income Fund; Security Large Cap Value Fund and Security Mid Cap Growth Fund | |
| Previous: Security Global Investors, LLC, Vice President (2010- 2011); Rydex Advisors, LLC (f/k/a PADCO Advisors, Inc.) and Rydex Advisors II, LLC (f/k/a PADCO Advisors II, Inc.), Vice President (2009-2011); Lyster Watson and Company, Managing Director (2007-2008); Fletcher Financial Group, Inc., Chief Executive Officer (2004-2007) | ||
| 140 | THE RYDEX FUNDSANNUALREPORT |
INFORMATION ON BOARD OF TRUSTEES AND OFFICERS (Unaudited) (concluded)
EXECUTIVE OFFICERS (concluded)
Name, Position and Year of Birth | Principal Occupations During Past Five Years | |
Amy J. Lee* Vice President and Assistant Secretary (1960) | Current: Senior Vice President and Secretary, Security Investors, LLC; Secretary and Chief Compliance Officer, Security Distributors, Inc.; Vice President, Associate General Counsel and Assistant Secretary, Security Benefit Life Insurance Company and Security Benefit Corporation; Associate General Counsel, First Security Benefit Life Insurance and Annuity of New York; Vice President and Secretary, SBL Fund; Security Equity Fund; Security Income Fund; Security Large Cap Value Fund and Security Mid Cap Growth Fund; Vice President and Secretary, Rydex Holdings, LLC Secretary, Advisor Research Center, Inc., Rydex Specialized Products, LLC, Rydex Distributors, LLC and Rydex Fund Services, LLC; Assistant Secretary, Security Benefit Clinic and Hospital | |
| Previous: Security Global Investors, LLC, Senior Vice President and Secretary (2007- 2011); Rydex Advisors, LLC (f/k/a PADCO Advisors, Inc.) and Rydex Advisors II, LLC (f/k/a PADCO Advisors II, Inc.), Senior Vice President and Secretary (2010- 2011); Brecek and Young Advisors, Inc., Director (2004- 2008) | ||
Joseph M. Arruda* Assistant Treasurer (1966) | Current: Assistant Treasurer, SBL Fund, Security Equity Fund, Security Income Fund, Security Large Cap Value Fund, and Security Mid Cap Growth Fund; Vice President, Security Investors, LLC; Chief Financial Officer and Manager, Rydex Specialized Products, LLC | |
| Previous: Security Global Investors, LLC, Vice President (2010-2011); Rydex Advisors, LLC (f/k/a PADCO Advisors, Inc.) and Rydex Advisors II, LLC (f/k/a PADCO Advisors II, Inc.), Vice President (2004-2011) | ||
| * | Officers of the Funds are deemed to be “interested persons” of the Trust, within the meaning of Section 2(a) (19) of the 1940 Act, inasmuch as this person is affiliated with Security Investors. |
| THE RYDEX FUNDSANNUALREPORT | 141 |
GUGGENHEIM INVESTMENTS PRIVACY POLICIES
Rydex Funds, Guggenheim Funds, Rydex Investments, Rydex Distributors, Inc., Security Investors, LLC, Security Distributors, Inc. and Rydex Advisory Services (Collectively “Guggenheim Investments”)
Our Commitment to You
When you become a Guggenheim Investments investor, you entrust us with not only your hard-earned money but also with personal and financial information about you. We recognize that your relationship with us is based on trust and that you expect us to act responsibly and in your best interests. Because we have access to this private information about you, we hold ourselves to the highest standards in its safekeeping and use. This means, most importantly, that we do not sell client information to anyone—whether it is your personal information or if you are a current or former Guggenheim Investments client.
The Information We Collect About You
In the course of doing business with shareholders and investors, we collect nonpublic personal information about you. You typically provide personal information when you complete a Guggenheim Investments account application or when you request a transaction that involves Rydex and Guggenheim Investments funds or one of the Guggenheim Investments affiliated companies. “Nonpublic personal information” is personally identifiable private information about you. For example, it includes information regarding your name and address, Social Security or taxpayer identification number, assets, income, account balance, bank account information and investment activity (e.g., purchase and redemption history).
How We Handle Your Personal Information
As emphasized above, we do not sell information about current or former clients or their accounts to third parties. Nor do we share such information, except when necessary to complete transactions at your request or to make you aware of related investment products and services that we offer. Additional details about how we handle your personal information are provided below. To complete certain transactions or account changes that you direct, it may be necessary to provide identifying information to companies, individuals or groups that are not affiliated with Guggenheim Investments. For example, if you ask to transfer assets from another financial institution to Guggenheim Investments, we will need to provide certain information about you to that company to complete the transaction. To alert you to other Guggenheim Investments investment products and services, we may share your information within the Guggenheim Investments family of affiliated companies. This would include, for example, sharing your information within Guggenheim Investments so we can make you aware of new Rydex and Guggenheim Investments funds or the services offered through another Guggenheim Investments affiliated company. In certain instances, we may contract with nonaffiliated companies to perform services for us. Where necessary, we will disclose information we have about you to these third parties. In all such cases, we provide the third party with only the information necessary to carry out its assigned responsibilities and only for that purpose. And we require these third parties to treat your private information with the same high degree of confidentiality that we do. In certain instances, we may share information with other financial institutions regarding individuals and entities in response to the U.S.A. Patriot Act. Finally, we will release information about you if you direct us to do so, if we are compelled by law to do so or in other circumstances permitted by law.
Opt Out Provisions
We do not sell your personal information to anyone. The law allows you to “opt out” of only certain kinds of information sharing with third parties. The firm does not share personal information about you with any third parties that triggers this opt-out right. This means YOU ARE ALREADY OPTED OUT.
How We Protect Privacy Online
Our concern for the privacy of our shareholders also extends to those who use our web site, www.rydex-sgi.com. Our web site uses some of the most secure forms of online communication available, including encryption technology, Secure Socket Layer (SSL) protocol, firewalls and user names and passwords. These technologies provide a high level of security and privacy when you access your account information or initiate online transactions. The Guggenheim Investments web site offers customized features that require our use of “http cookies”—tiny pieces of information that we ask your browser to store. However, we make very limited use of these cookies. We only use cookies for session management and security features on the Guggenheim Investments web site. We do not use them to pull data from your hard drive, to learn your email address, or to view data in cookies created by other web sites. We will not share the information in our cookies or give others access to it. See the legal information area on our web site for more details about web site security and privacy features.
How We Safeguard Your Personal Information
We restrict access to nonpublic personal information about shareholders to our employees and in some cases to third parties (for example, the service providers described above) as permitted by law. We maintain strict physical, electronic and procedural safeguards that comply with federal standards to guard your nonpublic personal information.
We’ll Keep You Informed
As required by federal law, we will notify shareholders of our privacy policy annually. We reserve the right to modify this policy at any time, but rest assured that if we do change it, we will tell you promptly. You will also be able to access our privacy policy from our web site at www.rydex-sgi.com. Should you have any questions regarding our privacy policy, contact us at 800.820.0888 or 301.296.5100.
| 142 | THE RYDEX FUNDSANNUALREPORT |
This page intentionally left blank.
This page intentionally left blank.
This page intentionally left blank.
This page intentionally left blank.
This page intentionally left blank.
This page intentionally left blank.
This page intentionally left blank.

805 King Farm Boulevard, Suite 600
Rockville, MD 20850
www.rydex-sgi.com
800.820.0888
RVASECF-2-1211x1212
CLS ADVISORONE FUNDS
AMERIGO FUND
CLERMONT FUND
SELECT ALLOCATION FUND
This report and the financial statements contained herein are submitted for the general information of our shareholders. The report is not authorized for distribution to prospective investors unless preceded or accompanied by an effective prospectus.
Distributed by Rydex Distributors, LLC.
| 2 | ||||
| 4 | ||||
| 6 | ||||
| 12 | ||||
| 20 | ||||
| 27 | ||||
| 32 | ||||
| 33 | ||||
| 37 | ||||
| 40 | ||||
THE GUGGENHEIM FUNDSANNUALREPORT | 1
To Our Shareholders:
Financial markets endured a lot of turbulence in 2011, due to a variety of events: concerns about debt in the eurozone and in the U.S., which lost its triple-A credit rating, a tsunami-induced Japanese nuclear-plant disaster that disrupted automobile production around the globe, Mideast social unrest that led to a jump in oil prices and weak growth in many of the world’s developed economies. Reflecting the volatility in the stock market was the S&P 500 Index*, which finished the year up about 2%, but only after an 8% rise in the first few months of 2011, then a bearish 19% drop by early October, followed by a 12% fourth-quarter rebound spurred by improved economic data.
The U.S. Federal Reserve was a major factor in the markets for most of 2011, from its winding down of a second asset-purchase program (quantitative easing) in June to August’s “operation twist,” which shifted $400 billion in holdings from short-term to long-term Treasuries. The Fed said it would keep short-term interest rates near zero at least until mid-2013, and late in the year, some analysts were speculating that a third round of quantitative easing might be needed in 2012 to boost subpar growth.
While late-year improvements in economic measures may have dampened concern that the U.S. could slip back into recession, Europe’s recession fears were rising, as high unemployment and austerity measures weighed on weaker members of the euro zone, and threatened the economic engines of Germany and France. The Stoxx Europe 600 Index* was down about 11% for the year, with most individual country indices posting declines in double digits. Many investors continued to brace for a solution to Greece’s debt situation that would prevent financial problems from spreading to other weak countries or to banks, and stabilize the sliding euro, the year’s worst-performing major currency.
Even though they were not at the eye of the sovereign debt storm, many emerging market economies performed poorly in 2011, with those having the strongest links to the eurozone suffering the most. The MSCI Emerging Markets Index* was off by almost 20%, despite pockets of growth. China is facing slowing industrial production, sliding property values and the potential for a hard landing of the economy if housing and banks collapse.
While the market forces play out, many investors have been driven to the sidelines or to safe havens. Gold reached a record high of near $1,900 an ounce in August amid the U.S. debt downgrade, but then lost ground to the rising dollar amid continuing debate over Europe’s debt woes. Still, gold added 10% for the year, while the dollar ended the year within about 3% from where it began against the currencies of most major markets, including the euro, the pound, Canadian dollar and Swiss franc.
Sluggish economic data, concern over European financial weakness and the Fed’s policy efforts also drove investors into U.S. government debt over the course of 2011, despite the country’s lowered credit rating. The 30% total return of the Barclays Capital Long U.S. Treasury Index* made it one of the best-performing of the year, and it gave a lift to indices for corporate bonds, high yield bonds and municipals, which all grew by mid-to-high single digits.
The U.S. economy had momentum heading into 2012, as data showed the world’s largest economy to be maintaining a sustainable, if modest, expansion. Consumer confidence was improving, employment rising and monetary policy remained accommodative. We finished 2011 on a positive note, especially when compared to other countries, and so far continue to be insulated from the worst aspects of the economic troubles in Europe and China.
2 | THE GUGGENHEIM FUNDSANNUALREPORT
LETTER TO OUR SHAREHOLDERS (concluded)
We look forward to continuing our service to you. Thank you for investing in our funds.
Sincerely,

Michael Byrum
President and Chief Investment Officer
| * | Indices are defined as follows: |
S&P 500® Index is a capitalization-weighted index covering 500 industrial, utility, transportation and financial companies of the U.S. markets (mostly NYSE Euronext issues).
The STOXX Europe 600 Index is derived from the STOXX Europe Total Market Index (TMI) and is a subset of the STOXX Global 1800 Index. With a fixed number of 600 components, the STOXX Europe 600 Index represents large-, mid- and small-capitalization companies across 18 countries of the European region: Austria, Belgium, Denmark, Finland, France, Germany, Greece, Iceland, Ireland, Italy, Luxembourg, the Netherlands, Norway, Portugal, Spain, Sweden, Switzerland and the United Kingdom.
The Barclays Capital Long U.S. Treasury Index includes publicly issued U.S. Treasury securities that have a remaining maturity of 10 or more years, are rated investment grade, and have $250 million or more of outstanding face value. In addition, the securities must be denominated in U.S. dollars and must be fixed rate and non convertible. Excluded from the Long U.S. Treasury Index are certain special issues, such as flower bonds, TINs, state and local government series bonds, TIPS, and coupon issues that have been stripped from bonds included in the index. The Long U.S. Treasury Index is market capitalization weighted and the securities in the index are updated on the last business day of each month.
MSCI Emerging Markets Index is a free float-adjusted market capitalization index that is designed to measure equity market performance in the global emerging markets.
Performance displayed represents past performance which is no guarantee of future results. Of course, fund performance is subject to daily market volatility and may be better or worse since the end of the last quarter. For up-to-date fund performance, call us at 800.820.0888 or visit www.rydex-sgi.com.
Read each fund’s prospectus and summary prospectus (if available) carefully before investing. It contains the fund’s investment objectives, risks, charges, expenses and other information, which should be considered carefully before investing. Obtain a prospectus and summary prospectus (if available) at www.rydex-sgi.com or call 800.820.0888.
The referenced funds are distributed by Rydex Distributors, LLC (RDL). Guggenheim Investments represents the investment management business of Guggenheim Partners, LLC, which includes Security Investors, LLC and Guggenheim Partners Asset Management, the investment advisor to the referenced funds. Rydex Distributors, LLC, is affiliated with Guggenheim Partners, LLC and Security Investors, LLC.
THE GUGGENHEIM FUNDSANNUALREPORT | 3
ABOUT SHAREHOLDERS’ FUND EXPENSES (Unaudited)
All mutual funds have operating expenses and it is important for our shareholders to understand the impact of costs on their investments. Shareholders of a Fund incur two types of costs: (i) transaction costs, including sales charges (loads) on purchase payments, reinvested dividends, or other distributions; and exchange fees; and (ii) ongoing costs, including management fees, administrative services, and shareholder reports, among others. These ongoing costs, or operating expenses, are deducted from a fund’s gross income and reduce the investment return of the fund.
A fund’s expenses are expressed as a percentage of its average net assets, which is known as the expense ratio. The following examples are intended to help investors understand the ongoing costs (in dollars) of investing in a Fund and to compare these costs with the ongoing costs of investing in other mutual funds.
The examples are based on an investment of $1,000 made at the beginning of the period and held for the entire six-month period beginning June 30, 2011 and ending December 31, 2011.
The following tables illustrate a Fund’s costs in two ways:
Table 1. Based on actual Fund return. This section helps investors estimate the actual expenses paid over the period. The “Ending Account Value” shown is derived from the Fund’s actual return, and the fourth column shows the dollar amount that would have been paid by an investor who started with $1,000 in the Fund. Investors may use the information here, together with the amount invested, to estimate the expenses paid over the period. Simply divide the Fund’s account value by $1,000 (for example, an $8,600 account value divided by $1,000 = 8.6), then multiply the result by the number provided under the heading “Expenses Paid During Period.”
Table 2. Based on hypothetical 5% return. This section is intended to help investors compare a Fund’s cost with those of other mutual funds. The table provides information about hypothetical account values and hypothetical expenses based on the Fund’s actual expense ratio and an assumed rate of return of 5% per year before expenses, which is not the Fund’s actual return. The hypothetical account values and expenses may not be used to estimate the actual ending account balance or expenses paid during the period. The example is useful in making comparisons because the U.S. Securities and Exchange Commission (the “SEC”) requires all mutual funds to calculate expenses based on the 5% return. Investors can assess a Fund’s costs by comparing this hypothetical example with the hypothetical examples that appear in shareholder reports of other funds.
The calculations illustrated above assume no shares were bought or sold during the period. Actual costs may have been higher or lower, depending on the amount of investment and the timing of any purchases or redemptions.
Please note that the expenses shown in the table are meant to highlight your ongoing costs only and do not reflect any transactional costs, such as sales charges (loads) on purchase payments, and contingent deferred sales charges (“CDSC”) on redemptions, if any. Therefore, the second table is useful in comparing ongoing costs only, and will not help you determine the relative total costs of owning different funds. In addition, if these transactional costs were included, your costs would have been higher.
More information about a Fund’s expenses, including annual expense ratios for the past five years, can be found in the Financial Highlights section of this report. For additional information on operating expenses and other shareholder costs, please refer to the appropriate Fund prospectus.
4 | THE GUGGENHEIM FUNDSANNUALREPORT
ABOUT SHAREHOLDERS’ FUND EXPENSES (Unaudited) (concluded)
| Expense Ratio1 | Fund Return | Beginning Account Value June 30, 2011 | Ending Account Value December 31, 2011 | Expenses Paid During Periods2 | ||||||||||||||||
Table 1. Based on actual Fund return3 | ||||||||||||||||||||
Amerigo Fund | 1.71 | % | (11.14 | )% | $ | 1,000.00 | $ | 888.60 | $ | 8.14 | ||||||||||
Clermont Fund | 1.71 | % | (3.77 | )% | 1,000.00 | 962.30 | 8.46 | |||||||||||||
Select Allocation Fund | 1.71 | % | (7.65 | )% | 1,000.00 | 923.50 | 8.29 | |||||||||||||
Table 2. Based on hypothetical 5% return (before expenses) |
| |||||||||||||||||||
Amerigo Fund | 1.71 | % | 5.00 | % | $ | 1,000.00 | $ | 1,016.59 | $ | 8.69 | ||||||||||
Clermont Fund | 1.71 | % | 5.00 | % | 1,000.00 | 1,016.59 | 8.69 | |||||||||||||
Select Allocation Fund | 1.71 | % | 5.00 | % | 1,000.00 | 1,016.59 | 8.69 | |||||||||||||
| 1 | Annualized and excludes expenses of the underlying funds in which the Funds invest. |
| 2 | Expenses are equal to the Fund’s annualized expense ratio, net of any applicable fee waivers, multiplied by the average account value over the period, multiplied by 184/365 (to reflect the one-half year period). Expenses shown do not include fees charged by insurance companies. |
| 3 | Actual cumulative return at net asset value for the period June 30, 2011 to December 31, 2011. |
THE GUGGENHEIM FUNDSANNUALREPORT | 5
| PERFORMANCE REPORT AND FUND PROFILE (Unaudited) | December 31, 2011 | |
OBJECTIVE: Seeks to provide long-term growth of capital without regard to current income.
Amerigo Fund returned -7.30% for the year ended December 31, 2011, trailing its benchmark, the S&P 500® Index*, which gained 2.11%.
As the year began, we reduced the Fund’s international exposure. Increased uncertainty in emerging markets resulted from protests in Tunisia and Egypt, later morphing into what became known as the Arab Spring as protests spread across the Middle East and North Africa (MENA). The Fund’s domestic allocations to large- and mid-caps were increased.
Global growth was lower than expected, but appeared to be stabilizing, when the earthquake and tsunami hit Japan in March. Complications about the nuclear power plant, property destruction and supply disruptions to manufacturing and distribution around the world led to talk of the U.S. entering a recession, which brought more uneasiness to the market.
During the summer, markets were moving higher when U.S. politicians debated the debt ceiling and threatened to not pay on the Treasury debt. The market moved sharply lower on the news and confidence in the economy evaporated.
The rest of the year was dominated by news from Europe, as investors grew increasingly uncomfortable with the ability of the eurozone to address its sovereign debt crisis.
As the year ended, the markets for large U.S. companies managed to finish about flat, while international and smaller companies finished in negative territory.
Looking forward, we will monitor the trends for new leadership to develop. The U.S. economy has continued to grow, and corporations have built up their balance sheets, positioning themselves for a strong 2012. However, we expect the U.S. elections and the potential for Mid East civil unrest to lead to continued market volatility.
| * | Standard & Poor’s 500 Index (S&P 500®) - a capitalization-weighted index covering 500 industrial, utility, transportation and financial companies of the U.S. markets (mostly NYSE Euronext issues). |
Performance displayed represents past performance which is no guarantee of future results.
Holdings Diversification (Market Exposure as % of Net Assets)
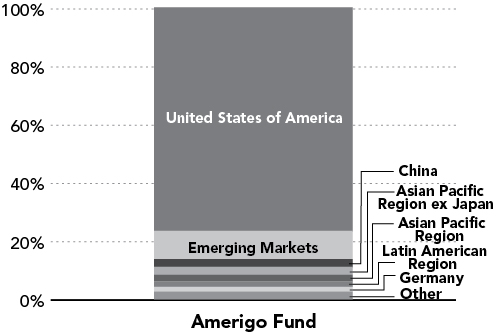
“Holdings Diversification (Market Exposure as % of Net Assets)” excludes any temporary cash investments.
| Inception Date: July 1, 2003 | ||||
Ten Largest Holdings (% of Total Net Assets) | ||||
Vanguard Mid-Capital ETF | 7.9 | % | ||
iShares Russell Midcap Index Fund | 5.8 | % | ||
Energy Select Sector SPDR Fund | 4.9 | % | ||
Vanguard Small-Capital ETF | 4.7 | % | ||
iShares Russell 1000 Growth Index Fund | 4.6 | % | ||
SPDR S&P 500 ETF Trust | 4.4 | % | ||
Vanguard MSCI Emerging Markets ETF | 4.4 | % | ||
SPDR S&P MidCap 400 ETF Trust | 4.2 | % | ||
Vanguard Extended Market ETF | 3.4 | % | ||
Vanguard Large-Capital ETF | 3.4 | % | ||
|
| |||
Top Ten Total | 47.7 | % | ||
|
| |||
“Ten Largest Holdings” exclude any temporary cash or derivative investments.
| 6 | THE GUGGENHEIM FUNDSANNUALREPORT |
PERFORMANCE REPORT AND FUND PROFILE (Unaudited) (concluded)
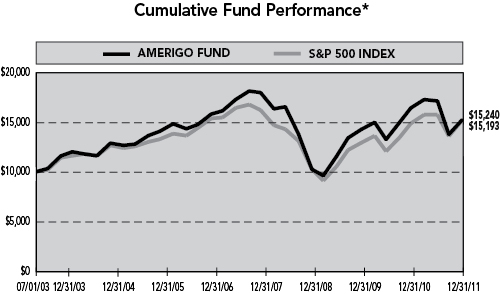
Average Annual Returns*
Periods Ended 12/31/11
| 1 Year | 5 Year | Since Inception (07/01/03) | ||||||||||
Amerigo Fund | -7.30 | % | -0.74 | % | 5.08 | % | ||||||
S&P 500 Index | 2.11 | % | -0.25 | % | 5.04 | % | ||||||
| * | The performance data represents past performance that is not predictive of future results. The investment return and principal value of an investment in the Fund will fluctuate so that an investor’s shares, when redeemed, may be worth more or less than their original cost. Returns are historical and include changes in principal and reinvested dividends and capital gains and do not reflect the effect of taxes. The S&P 500 Index is an unmanaged index and, unlike the Fund, has no management fees or operating expenses to reduce its reported return. Returns do not reflect the impact of any additional fees charged by insurance companies. |
THE GUGGENHEIM FUNDSANNUALREPORT | 7
| SCHEDULE OF INVESTMENTS | December 31, 2011 | |
| AMERIGO FUND | ||
| SHARES | VALUE | |||||||
EXCHANGE TRADED FUNDS† - 99.6% |
| |||||||
UNITED STATES OF AMERICA - 76.3% |
| |||||||
Vanguard Mid-Capital ETF | 157,300 | $ | 11,316,162 | |||||
iShares Russell Midcap Index Fund | 85,300 | 8,395,226 | ||||||
Energy Select Sector SPDR Fund | 103,100 | 7,127,303 | ||||||
Vanguard Small-Capital ETF | 97,700 | 6,806,759 | ||||||
iShares Russell 1000 Growth Index Fund | 114,200 | 6,599,618 | ||||||
SPDR S&P 500 ETF Trust | 50,400 | 6,325,200 | ||||||
SPDR S&P MidCap 400 ETF Trust | 38,000 | 6,062,520 | ||||||
Vanguard Extended Market ETF | 94,500 | 4,898,880 | ||||||
Vanguard Large-Capital ETF | 85,200 | 4,882,812 | ||||||
iShares Russell 2000 Index Fund | 61,500 | 4,531,935 | ||||||
iShares Russell Midcap Growth Index Fund | 78,300 | 4,310,415 | ||||||
Vanguard Total Stock Market ETF | 62,200 | 3,999,460 | ||||||
Powershares QQQ Trust Series 1 | 69,800 | 3,896,934 | ||||||
Health Care Select Sector SPDR Fund | 107,300 | 3,722,237 | ||||||
Technology Select Sector SPDR Fund | 86,800 | 2,209,060 | ||||||
iShares S&P MidCap 400 Index Fund | 23,900 | 2,093,879 | ||||||
Consumer Staples Select Sector SPDR Fund | 63,400 | 2,059,866 | ||||||
IShares S&P Nasdaq Biotechnology Index Fund | 19,100 | 1,993,085 | ||||||
RevenueShares Large Capital ETF | 85,200 | 1,982,604 | ||||||
iShares High Dividend Equity Fund | 31,500 | 1,748,250 | ||||||
iShares S&P 500 Index Fund | 12,900 | 1,624,884 | ||||||
iShares Dow Jones US Pharmaceuticals Index Fund | 19,100 | 1,460,195 | ||||||
Vanguard Value ETF | 25,900 | 1,359,491 | ||||||
SPDR S&P Biotech ETF | 19,100 | 1,268,240 | ||||||
iShares S&P 100 Index Fund | 20,700 | 1,180,521 | ||||||
SPDR S&P Pharmaceuticals ETF | 22,200 | 1,139,526 | ||||||
PowerShares DB Gold Fund* | 19,000 | 1,034,550 | ||||||
Vanguard Dividend Appreciation ETF | 18,800 | 1,027,232 | ||||||
PowerShares DB Precious Metals Fund* | 19,000 | 1,023,720 | ||||||
iShares Morningstar Large Value Index Fund | 15,900 | 939,531 | ||||||
Barclays ETN+long C Leveraged ETN Linked to S&P 500*1 | 6,300 | 845,964 | ||||||
SPDR Dow Jones Industrial Average ETF Trust | 6,200 | 755,470 | ||||||
iShares iBoxx $ High Yield Corporate Bond Fund | 6,300 | 563,409 | ||||||
United States Commodity Index Fund* | 7,900 | 461,123 | ||||||
Vanguard Mega Capital 300 ETF | 3,100 | 133,318 | ||||||
Financial Select Sector SPDR Fund | 7,900 | 102,700 | ||||||
PowerShares DB Agriculture Fund* | 3,200 | 92,416 | ||||||
|
| |||||||
Total United States of America |
| 109,974,495 | ||||||
|
| |||||||
EMERGING MARKETS - 9.7% |
| |||||||
Vanguard MSCI Emerging Markets ETF | 165,000 | 6,304,650 | ||||||
iShares MSCI Emerging Markets Index Fund | 120,300 | 4,564,182 | ||||||
SPDR S&P BRIC 40 ETF | 57,000 | 1,249,440 | ||||||
Vanguard FTSE All-World ex-US ETF — Class U | 23,800 | 943,670 | ||||||
iShares MSCI BRIC Index Fund | 25,500 | 924,885 | ||||||
|
| |||||||
Total Emerging Markets | 13,986,827 | |||||||
|
| |||||||
CHINA - 2.8% |
| |||||||
SPDR S&P China ETF | 53,600 | 3,339,280 | ||||||
iShares S&P Asia 50 Index Fund | 16,800 | 657,720 | ||||||
|
| |||||||
Total China | 3,997,000 | |||||||
|
| |||||||
ASIAN PACIFIC REGION EX JAPAN - 2.7% |
| |||||||
iShares MSCI All Country Asia ex-Japan Index Fund | 54,000 | 2,694,600 | ||||||
iShares MSCI Pacific ex-Japan Index Fund | 31,700 | 1,234,081 | ||||||
|
| |||||||
Total Asian Pacific Region ex Japan | 3,928,681 | |||||||
|
| |||||||
ASIAN PACIFIC REGION - 2.2% |
| |||||||
SPDR S&P Emerging Asia Pacific ETF | 47,600 | 3,141,124 | ||||||
|
| |||||||
LATIN AMERICAN REGION - 1.9% |
| |||||||
iShares S&P Latin America 40 Index Fund | 63,700 | 2,711,709 | ||||||
|
| |||||||
GERMANY -1.7% |
| |||||||
iShares MSCI Germany Index Fund | 126,900 | 2,439,018 | ||||||
|
| |||||||
GLOBAL - 0.9% |
| |||||||
iShares S&P Global 100 Index Fund | 22,400 | 1,297,856 | ||||||
|
| |||||||
CANADA - 0.7% |
| |||||||
iShares MSCI Canada Index Fund | 41,300 | 1,098,580 | ||||||
|
| |||||||
SWEDEN - 0.4% |
| |||||||
iShares MSCI Sweden Index Fund | 25,300 | 636,042 | ||||||
|
| |||||||
EUROPE - 0.3% | ||||||||
Vanguard MSCI European ETF | 12,600 | 522,018 | ||||||
|
| |||||||
Total Exchange Traded Funds | 143,733,350 | |||||||
|
| |||||||
SHORT TERM INVESTMENTS†† - 0. 8% |
| |||||||
First American Treasury Obligations Fund | 1,111,960 | 1,111,960 | ||||||
|
| |||||||
Total Short Term Investments | 1,111,960 | |||||||
|
| |||||||
Total Investments – 100.4% | $ | 144,845,310 | ||||||
|
| |||||||
Liabilities & Other Assets – (0.4)% |
| (635,407 | ) | |||||
|
| |||||||
Total Net Assets – 100.0% | $ | 144,209,903 | ||||||
|
| |||||||
| * | Non-income producing security. |
| † | Value determined based on Level 1 inputs — See Note 4. |
| †† | Value determined based on Level 2 inputs — See Note 4. |
| 1 | Affiliated Security — See Note 7. |
| 8 | THE GUGGENHEIM FUNDSANNUALREPORT | See Notes to Financial Statements. |
| AMERIGO FUND |
STATEMENT OF ASSETS AND LIABILITIES
December 31, 2011
ASSETS: | ||||
Investments in unaffiliated issuers, at value | $ | 143,999,346 | ||
Investments in affiliated issuers, at value | 845,964 | |||
|
| |||
Total Investments | 144,845,310 | |||
Receivables: | ||||
Dividends | 74,565 | |||
|
| |||
Total assets | 144,919,875 | |||
|
| |||
LIABILITIES: | ||||
Payable for: | ||||
Fund shares redeemed | 249,696 | |||
Management fees | 110,626 | |||
Transfer agent and administrative fees | 30,730 | |||
Investor service fees | 30,730 | |||
Portfolio accounting fees | 12,292 | |||
Miscellaneous | 275,898 | |||
|
| |||
Total liabilities | 709,972 | |||
|
| |||
NETASSETS | $ | 144,209,903 | ||
|
| |||
NETASSETSCONSISTOF: | ||||
Paid in capital | $ | 173,954,228 | ||
Accumulated net investment loss | (296,654 | ) | ||
Accumulated net realized loss on investments | (30,780,136 | ) | ||
Net unrealized appreciation on investments | 1,332,465 | |||
|
| |||
Net assets | $ | 144,209,903 | ||
Capital shares outstanding | 4,505,775 | |||
Net asset value per share | $ | 32.01 | ||
|
|
STATEMENT OF OPERATIONS
Year Ended December 31, 2011
INVESTMENT INCOME: | ||||
Dividends | $ | 2,809,324 | ||
|
| |||
Total investment income | 2,809,324 | |||
|
| |||
EXPENSES: | ||||
Management fees | 1,515,168 | |||
Transfer agent and administrative fees | 420,879 | |||
Investor service fees | 420,879 | |||
Portfolio accounting fees | 168,351 | |||
Custodian fees | 43,781 | |||
Trustees’ fees* | 17,082 | |||
Miscellaneous | 368,702 | |||
|
| |||
Total expenses | 2,954,842 | |||
|
| |||
Net investment loss | (145,518 | ) | ||
|
| |||
NET REALIZEDAND UNREALIZED GAIN (LOSS): |
| |||
Net realized gain (loss) on: | ||||
Investments | 16,832,957 | |||
Realized gain distributions received from investment company shares | 45,439 | |||
|
| |||
Net realized gain | 16,878,396 | |||
|
| |||
Net change in unrealized appreciation (depreciation) on: | ||||
Investments in unaffiliated issuers | (27,408,950 | ) | ||
Investments in affiliated issuers | (34,305 | ) | ||
|
| |||
Net change in unrealized appreciation (depreciation) | (27,443,255 | ) | ||
|
| |||
Net realized and unrealized loss | (10,564,859 | ) | ||
|
| |||
Net decrease in net assets resulting from operations | $ | (10,710,377 | ) | |
|
| |||
| * | Relates to Trustees not deemed “interested persons” within the meaning of Section 2(a)(19) of the 1940 Act. |
| See Notes to Financial Statements. | THE GUGGENHEIM FUNDSANNUALREPORT | 9 |
AMERIGO FUND
| ||
STATEMENTS OF CHANGES IN NET ASSETS | ||
| Year Ended December 31, 2011 | Year Ended December 31, 2010 | |||||||
INCREASE (DECREASE) IN NET ASSETS FROM OPERATIONS: | ||||||||
Net investment loss | $ | (145,518 | ) | $ | (247,130 | ) | ||
Net realized gain on investments | 16,878,396 | 6,364,965 | ||||||
Net change in unrealized appreciation (depreciation) on investments | (27,443,255 | ) | 20,547,500 | |||||
|
|
|
| |||||
Net increase (decrease) in net assets resulting from operations | (10,710,377 | ) | 26,665,335 | |||||
|
|
|
| |||||
DISTRIBUTIONSTOSHAREHOLDERSFROM: | ||||||||
Net investment income | — | (179,331 | ) | |||||
|
|
|
| |||||
Total distributions to shareholders | — | (179,331 | ) | |||||
|
|
|
| |||||
CAPITALSHARETRANSACTIONS: | ||||||||
Proceeds from sale of shares | 23,889,719 | 29,504,404 | ||||||
Distributions reinvested | — | 179,331 | ||||||
Cost of shares redeemed | (68,456,792 | ) | (69,754,821 | ) | ||||
|
|
|
| |||||
Net decrease from capital share transactions | (44,567,073 | ) | (40,071,086 | ) | ||||
|
|
|
| |||||
Net decrease in net assets | (55,277,450 | ) | (13,585,082 | ) | ||||
NETASSETS: | ||||||||
Beginning of year | 199,487,353 | 213,072,435 | ||||||
|
|
|
| |||||
End of year | $ | 144,209,903 | $ | 199,487,353 | ||||
|
|
|
| |||||
Accumulated net investment loss at end of year | $ | (296,654 | ) | $ | (386,274 | ) | ||
|
|
|
| |||||
CAPITALSHAREACTIVITY: | ||||||||
Shares sold | 744,890 | 967,466 | ||||||
Shares issued from reinvestment of distributions | — | 5,441 | ||||||
Shares redeemed | (2,016,845 | ) | (2,294,722 | ) | ||||
|
|
|
| |||||
Net decrease in shares | (1,271,955 | ) | (1,321,815 | ) | ||||
|
|
|
| |||||
| 10 | THE GUGGENHEIM FUNDSANNUALREPORT | See Notes to Financial Statements. |
| AMERIGO FUND | ||
| FINANCIAL HIGHLIGHTS | ||
This table is presented to show selected data for a share outstanding throughout each period and to assist shareholders in evaluating a Fund’s performance for the periods presented.
| Year Ended December 31, 2011 | Year Ended December 31, 2010 | Year Ended December 31, 2009 | Year Ended December 31, 2008 | Year Ended December 31, 2007 | ||||||||||||||||
Per Share Data | ||||||||||||||||||||
Net asset value, beginning of period | $ | 34.53 | $ | 30.01 | $ | 21.64 | $ | 39.13 | $ | 35.83 | ||||||||||
|
|
|
|
|
|
|
|
|
| |||||||||||
Income (loss) from investment operations: | ||||||||||||||||||||
Net investment income (loss)a | (.03 | ) | (.04 | ) | .03 | .12 | .12 | |||||||||||||
Net gain (loss) on investments (realized and unrealized) | (2.49 | ) | 4.59 | 8.49 | (17.01 | ) | 4.85 | |||||||||||||
|
|
|
|
|
|
|
|
|
| |||||||||||
Total from investment operations | (2.52 | ) | 4.55 | 8.52 | (16.89 | ) | 4.97 | |||||||||||||
|
|
|
|
|
|
|
|
|
| |||||||||||
Less distributions from: | ||||||||||||||||||||
Net investment income | — | (.03 | ) | (.15 | ) | (.10 | ) | (.14 | )d | |||||||||||
Net realized gains | — | — | — | (.50 | ) | (1.53 | )d | |||||||||||||
|
|
|
|
|
|
|
|
|
| |||||||||||
Total distributions | — | (.03 | ) | (.15 | ) | (.60 | ) | (1.67 | ) | |||||||||||
|
|
|
|
|
|
|
|
|
| |||||||||||
Net asset value, end of period | $ | 32.01 | $ | 34.53 | $ | 30.01 | $ | 21.64 | $ | 39.13 | ||||||||||
|
|
|
|
|
|
|
|
|
| |||||||||||
Total Returnb | (7.30 | %) | 15.13 | % | 39.41 | % | (43.09 | %) | 13.77 | % | ||||||||||
|
|
|
|
|
|
|
|
|
| |||||||||||
Ratios/Supplemental Data | ||||||||||||||||||||
Net assets, end of period (in thousands) | $ | 144,210 | $ | 199,487 | $ | 213,072 | $ | 204,878 | $ | 364,693 | ||||||||||
|
|
|
|
|
|
|
|
|
| |||||||||||
Ratios to average net assets: | ||||||||||||||||||||
Net investment income (loss) | (0.09 | %) | (0.13 | %) | 0.12 | % | 0.36 | % | 0.32 | % | ||||||||||
Total expensesc | 1.76 | % | 1.70 | % | 1.71 | % | 1.65 | % | 1.63 | % | ||||||||||
|
|
|
|
|
|
|
|
|
| |||||||||||
Portfolio turnover rate | 48 | % | 77 | % | 102 | % | 103 | % | 88 | % | ||||||||||
| a | Net investment income (loss) per share was computed using average shares outstanding throughout the period. |
| b | Total return does not reflect the impact of any additional fees charged by insurance companies and has not been annualized. |
| c | Does not include expenses of the underlying funds in which the Fund invests. |
| d | For financial reporting purposes certain distributions from net investment income for federal tax purposes have been reclassified to distributions from realized gains. |
| See Notes to Financial Statements. | THE GUGGENHEIM FUNDSANNUALREPORT | 11 |
| PERFORMANCE REPORT AND FUND PROFILE (Unaudited) | December 31, 2011 | |
OBJECTIVE: Seeks a combination of current income and growth of capital.
Clermont Fund returned -0.28% for the year ended December 31, 2011, underperforming its blended benchmark, consisting of 45% S&P 500® Index* and 55% Barclay’s Capital U.S. Credit Index*, which gained 5.78%.
As the year began, we reduced the Fund’s international exposure. Increased uncertainty in emerging markets resulted from protests in Tunisia and Egypt, later morphing into what became known as the Arab Spring as protests spread across the Middle East and North Africa (MENA). The Fund’s domestic allocation to large caps was increased.
Global growth was lower than expected, but appeared to be stabilizing, when the earthquake and tsunami hit Japan in March. Complications about the nuclear power plant, property destruction and supply disruptions to manufacturing and distribution around the world led to talk of the U.S. entering a recession, which brought more uneasiness to the market.
During the summer, markets were moving higher when U.S. politicians debated the debt ceiling and threatened to not pay on the Treasury debt. The market moved sharply lower on the news and confidence in the economy evaporated.
The rest of the year was dominated by news from Europe, as investors grew increasingly uncomfortable with the ability of the eurozone to address its sovereign debt crisis.
As the year ended, the markets for large U.S. companies managed to finish about flat, while international and smaller companies finished in negative territory.
Looking forward, we will monitor the trends for new leadership to develop. The U.S. economy has continued to grow, and corporations have built up their balance sheets, positioning themselves for a strong 2012. However, we expect the U.S. elections and the potential for Mid East civil unrest to lead to continued market volatility.
The Fund’s fixed-income allocations toward shorter duration and corporate bonds did not help our performance, as the high-yield sector sold off strongly during the U.S. debt ceiling debates in the summer. The U.S. Treasury yields managed to move even lower, despite the headlines and the downgrade in the credit rating. With such paltry yields, investors moved into large dividend-paying stocks as an alternative to bonds.
| * | Standard & Poor’s 500 Index (S&P 500®) — a capitalization-weighted index covering 500 industrial, utility, transportation and financial companies of the U.S. markets (mostly NYSE Euronext issues). |
| * | The Barclays Capital U.S. Credit Index comprises the Barclays Capital U.S. Corporate Index and a non-corporate component that includes foreign agencies, sovereigns, supranationals and local authorities. It is a subset of the Barclays Capital U.S. Government/Credit Index and Barclays Capital U.S. Aggregate Index. |
Performance displayed represents past performance which is no guarantee of future results.
Holdings Diversification (Market Exposure as % of Net Assets)
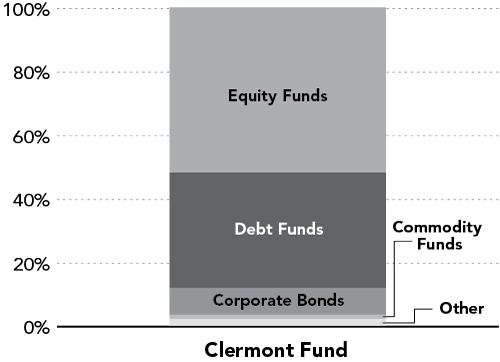
“Holdings Diversification (Market Exposure as % of Net Assets)” excludes any temporary cash investments.
| Inception Date: July 1, 2003 | ||||
Ten Largest Holdings (% of Total Net Assets) | ||||
iShares Barclays Credit Bond Fund | 11.7 | % | ||
SPDR S&P 500 ETF Trust | 7.9 | % | ||
iShares iBoxx $ High Yield Corporate Bond Fund | 7.9 | % | ||
iShares iBoxx Investment Grade Corporate Bond Fund | 6.6 | % | ||
SPDR Barclays Capital High Yield Bond ETF | 4.6 | % | ||
SPDR S&P MidCap 400 ETF Trust | 3.0 | % | ||
Vanguard MSCI Emerging Markets ETF | 3.0 | % | ||
Vanguard Total Stock Market ETF | 3.0 | % | ||
Vanguard Total Bond Market ETF | 3.0 | % | ||
iShares S&P 500 Index Fund | 2.6 | % | ||
|
| |||
Top Ten Total | 53.3 | % | ||
|
| |||
“Ten Largest Holdings” exclude any temporary cash or derivative investments.
| 12 | THE GUGGENHEIM FUNDSANNUALREPORT |
PERFORMANCE REPORT AND FUND PROFILE (Unaudited) (concluded)
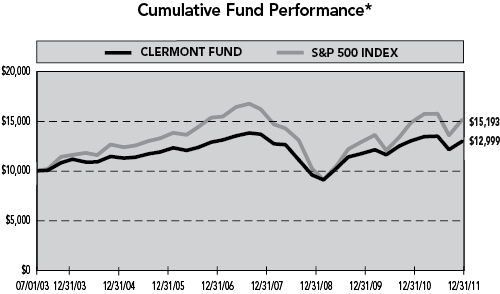
Average Annual Returns*
Periods Ended 12/31/11
| 1 Year | 5 Year | Since Inception (07/01/03) | ||||||||||
Clermont Fund | -0.28 | % | 0.15 | % | 3.13 | % | ||||||
S&P 500 Index | 2.11 | % | -0.25 | % | 5.04 | % | ||||||
Synthetic Balanced Benchmark† | 5.78 | % | 3.96 | % | 5.55 | % | ||||||
| † | Benchmark reflects a 45/55 ratio of the performance of the S&P 500 Index and the Barclays Capital U.S. Credit Index. |
| * | The performance data represents past performance that is not predictive of future results. The investment return and principal value of an investment in the Fund will fluctuate so that an investor’s shares, when redeemed, may be worth more or less than their original cost. Returns are historical and include changes in principal and reinvested dividends and capital gains and do not reflect the effect of taxes. The S&P 500 Index is an unmanaged index and, unlike the Fund, has no management fees or operating expenses to reduce its reported return. Returns do not reflect the impact of any additional fees charged by insurance companies. |
THE GUGGENHEIM FUNDSANNUALREPORT | 13
| SCHEDULE OF INVESTMENTS | December 31, 2011 | |
| CLERMONT FUND | ||
| SHARES | VALUE | |||||||
COMMON STOCKS† - 0.5% |
| |||||||
FINANCIALS - 0.5% | ||||||||
Berkshire Hathaway, Inc. — Class B* | 4,500 | $ | 343,350 | |||||
|
| |||||||
Total Common Stocks | 343,350 | |||||||
|
| |||||||
EXCHANGE TRADED FUNDS† - 90.0% |
| |||||||
UNITED STATES OF AMERICA - 80.0% |
| |||||||
iShares Barclays Credit Bond Fund | 81,000 | 8,821,710 | ||||||
SPDR S&P 500 ETF Trust | 47,300 | 5,936,150 | ||||||
iShares iBoxx $ High Yield Corporate Bond Fund | 66,300 | 5,929,209 | ||||||
iShares iBoxx Investment Grade Corporate Bond Fund | 43,800 | 4,982,688 | ||||||
SPDR Barclays Capital High Yield Bond ETF | 90,300 | 3,472,035 | ||||||
SPDR S&P MidCap 400 ETF Trust | 14,400 | 2,297,376 | ||||||
Vanguard Total Stock Market ETF | 35,400 | 2,276,220 | ||||||
Vanguard Total Bond Market ETF | 27,100 | 2,263,934 | ||||||
iShares S&P 500 Index Fund | 15,400 | 1,939,784 | ||||||
Vanguard Mid-Capital ETF | 25,000 | 1,798,500 | ||||||
Vanguard Small-Capital ETF | 21,700 | 1,511,839 | ||||||
iShares High Dividend Equity Fund | 27,000 | 1,498,500 | ||||||
Vanguard Large-Capital ETF | 26,100 | 1,495,791 | ||||||
SPDR Dow Jones Industrial Average ETF Trust | 12,000 | 1,462,200 | ||||||
Vanguard Extended Market ETF | 25,000 | 1,296,000 | ||||||
iShares Russell Midcap Index Fund | 12,300 | 1,210,566 | ||||||
Powershares QQQ Trust Series 1 | 18,000 | 1,004,940 | ||||||
iShares Morningstar Large Value Index Fund | 15,700 | 927,713 | ||||||
Energy Select Sector SPDR Fund | 12,300 | 850,299 | ||||||
Vanguard Dividend Appreciation ETF | 15,400 | 841,456 | ||||||
Consumer Staples Select Sector SPDR Fund | 24,600 | 799,254 | ||||||
Health Care Select Sector SPDR Fund | 21,000 | 728,490 | ||||||
Vanguard Value ETF | 13,700 | 719,113 | ||||||
iShares Russell 1000 Growth Index Fund | 12,300 | 710,817 | ||||||
Vanguard Intermediate-Term Corporate Bond ETF | 7,600 | 626,012 | ||||||
RevenueShares Large Capital ETF | 21,500 | 500,305 | ||||||
iShares Barclays Intermediate Credit Bond Fund | 4,500 | 482,310 | ||||||
iShares Dow Jones US Pharmaceuticals Index Fund | 6,100 | 466,345 | ||||||
iShares Russell 2000 Index Fund | 6,100 | 449,509 | ||||||
PowerShares DB Gold Fund* | 7,600 | 413,820 | ||||||
PowerShares DB Precious Metals Fund* | 7,600 | 409,488 | ||||||
iShares S&P MidCap 400 Index Fund | 4,600 | 403,006 | ||||||
iShares S&P 100 Index Fund | 6,100 | 347,883 | ||||||
SPDR S&P Pharmaceuticals ETF | 6,100 | 313,113 | ||||||
iShares Diversified Alternatives Trust* | 4,600 | 224,250 | ||||||
SPDR Barclays Capital Intermediate Term Corporate Bond ETF | 6,300 | 209,223 | ||||||
United States Commodity Index Fund* | 3,100 | 180,947 | ||||||
PIMCO Enhanced Short Maturity Strategy Fund | 1,300 | 130,208 | ||||||
iShares Barclays 1-3 Year Credit Bond Fund | 900 | 93,780 | ||||||
Vanguard Intermediate-Term Bond ETF | 1,000 | 86,970 | ||||||
PowerShares DB Commodity Index Tracking Fund* | 3,000 | 80,520 | ||||||
Vanguard Short-Term Corporate | ||||||||
Bond ETF | 900 | 70,074 | ||||||
iShares Barclays 3-7 Year Treasury Bond Fund | 300 | 36,612 | ||||||
iShares Barclays Aggregate Bond Fund | 300 | 33,075 | ||||||
iShares Barclays 7-10 Year Treasury Bond Fund | 300 | 31,671 | ||||||
SPDR Barclays Capital Short Term Corporate Bond ETF | 900 | 27,099 | ||||||
Vanguard Long-Term Corporate Bond ETF | 300 | 26,082 | ||||||
iShares S&P 500 Growth Index Fund | 300 | 20,226 | ||||||
iShares 10+ Year Credit Bond Fund | 300 | 17,706 | ||||||
SPDR Barclays Capital Aggregate Bond ETF | 300 | 17,367 | ||||||
iShares S&P 500 Value Index Fund | 300 | 17,349 | ||||||
SPDR Barclays Capital Long Term | ||||||||
Credit Bond ETF | 300 | 11,847 | ||||||
|
| |||||||
Total United States of America | 60,501,381 | |||||||
|
| |||||||
EMERGING MARKETS - 5.3% |
| |||||||
Vanguard MSCI Emerging Markets ETF | 60,100 | 2,296,421 | ||||||
Vanguard FTSE All-World ex-US ETF — Class U | 18,200 | 721,630 | ||||||
iShares MSCI Emerging Markets Index Fund | 12,200 | 462,868 | ||||||
SPDR S&P BRIC 40 ETF | 9,200 | 201,664 | ||||||
Vanguard Total World Stock Index Fund ETF | 4,600 | 198,628 | ||||||
Vanguard Short-Term Bond ETF | 1,500 | 121,260 | ||||||
|
| |||||||
Total Emerging Markets | 4,002,471 | |||||||
|
| |||||||
ASIAN PACIFIC REGION - 1.4% |
| |||||||
SPDR S&P Emerging Asia Pacific ETF | 12,300 | 811,677 | ||||||
Vanguard MSCI Pacific ETF | 4,600 | 218,914 | ||||||
|
| |||||||
Total Asian Pacific Region | 1,030,591 | |||||||
|
| |||||||
GLOBAL - 1.3% | ||||||||
iShares S&P Global 100 Index Fund | 16,700 | 967,598 | ||||||
|
| |||||||
| 14 | THE GUGGENHEIM FUNDSANNUALREPORT | See Notes to Financial Statements. |
| SCHEDULE OF INVESTMENTS (concluded) | December 31, 2011 | |
| CLERMONT FUND | ||
| SHARES | VALUE | |||||||
ASIAN PACIFIC REGION EX JAPAN - 0.8% |
| |||||||
iShares MSCI All Country Asia ex-Japan Index Fund | 12,300 | $ | 613,770 | |||||
|
| |||||||
GERMANY - 0.7% |
| |||||||
iShares MSCI Germany Index Fund | 24,300 | 467,046 | ||||||
|
| |||||||
LATIN AMERICAN REGION - 0.3% |
| |||||||
iShares S&P Latin America 40 Index Fund | 6,100 | 259,677 | ||||||
|
| |||||||
EUROPE - 0.2% | ||||||||
Vanguard MSCI European ETF | 4,500 | 186,435 | ||||||
|
| |||||||
Total Exchange Traded Funds | 68,028,969 | |||||||
|
| |||||||
SHORT TERM INVESTMENTS†† - 1.0% |
| |||||||
First American Treasury Obligations Fund | 743,253 | 743,253 | ||||||
|
| |||||||
Total Short Term Investments | 743,253 | |||||||
|
| |||||||
| FACE AMOUNT | ||||||||
CORPORATE BONDS†† - 8.3% | ||||||||
FINANCIALS - 2.7% | ||||||||
Mutual of Omaha Insurance Co. | ||||||||
6.80% due 06/15/361,2 | $ | 725,000 | 773,267 | |||||
HSBC Finance Corp. | ||||||||
7.00% due 05/15/12 | 482,000 | 490,987 | ||||||
Goldman Sachs Group, Inc. | ||||||||
5.95% due 01/15/27 | 482,000 | 451,794 | ||||||
Morgan Stanley | ||||||||
5.50% due 09/30/173 | 400,000 | 348,238 | ||||||
|
| |||||||
Total Financials | 2,064,286 | |||||||
|
| |||||||
MATERIALS - 1.8% | ||||||||
Alcoa, Inc. | ||||||||
5.87% due 02/23/22 | 793,000 | 798,775 | ||||||
Chevron Phillips Chemical Company LLC | ||||||||
8.25% due 06/15/191,2 | 416,000 | 526,644 | ||||||
Freeport-McMoRan Copper & Gold, Inc. | ||||||||
8.38% due 04/01/17 | 50,000 | 53,125 | ||||||
|
| |||||||
Total Materials | 1,378,544 | |||||||
|
| |||||||
ENERGY - 1.3% | ||||||||
Enogex LLC | ||||||||
6.25% due 03/15/201,2 | 520,000 | 588,506 | ||||||
Sunoco, Inc. | ||||||||
4.88% due 10/15/14 | 376,000 | 383,443 | ||||||
|
| |||||||
Total Energy | 971,949 | |||||||
|
| |||||||
HEALTH CARE - 0.9% |
| |||||||
Agilent Technologies, Inc. | ||||||||
6.50% due 11/01/17 | 577,000 | 668,192 | ||||||
|
| |||||||
UTILITIES - 0.7% | ||||||||
Westar Energy, Inc. | ||||||||
6.00% due 07/01/14 | 468,000 | 513,135 | ||||||
|
| |||||||
CONSUMER STAPLES - 0.5% |
| |||||||
Bunge Ltd. Finance Corp. | ||||||||
8.50% due 06/15/19 | 274,000 | 333,524 | ||||||
|
| |||||||
INDUSTRIALS - 0.4% | ||||||||
Timken Co. | ||||||||
6.00% due 09/15/14 | 300,000 | 324,661 | ||||||
|
| |||||||
Total Corporate Bonds | 6,254,291 | |||||||
|
| |||||||
U.S. GOVERNMENT SECURITIES† - 0.2% |
| |||||||
U.S. Treasury Notes | ||||||||
0.88% due 02/29/12 | 100,000 | 100,133 | ||||||
0.88% due 01/31/12 | 100,000 | 100,062 | ||||||
|
| |||||||
Total U.S. Government Securities | 200,195 | |||||||
|
| |||||||
Total Investments – 100.0% | $ | 75,570,058 | ||||||
|
| |||||||
Cash & Other Assets, Less Liabilities – 0.0% | 14,649 | |||||||
|
| |||||||
Total Net Assets – 100.0% | $ | 75,584,707 | ||||||
| * | Non-income producing security. |
| † | Value determined based on Level 1 inputs — See Note 4. |
| †† | Value determined based on Level 2 inputs — See Note 4. |
| 1 | Security was acquired through a private placement. |
| 2 | Security is a 144A or Section 4(2) security. The total market value of 144A or Section 4(2) securities is $1,888,417 (cost $1,581,827), or 2.5% of total net assets. |
| 3 | Variable rate security. Rate indicated is rate effective at December 31, 2011. |
| See Notes to Financial Statements. | THE GUGGENHEIM FUNDSANNUALREPORT | 15 |
| CLERMONT FUND | ||
STATEMENT OF ASSETS AND LIABILITIES
| December 31, 2011 | ||||
ASSETS: |
| |||
Investments, at value | $ | 75,570,058 | ||
Cash | 855 | |||
Receivables: | ||||
Dividends | 177,300 | |||
Interest | 80,132 | |||
|
| |||
Total assets | 75,828,345 | |||
|
| |||
LIABILITIES: | ||||
Payable for: | ||||
Management fees | 57,394 | |||
Fund shares redeemed | 24,262 | |||
Transfer agent and administrative fees | 15,943 | |||
Investor service fees | 15,943 | |||
Portfolio accounting fees | 6,377 | |||
Miscellaneous | 123,719 | |||
|
| |||
Total liabilities | 243,638 | |||
|
| |||
NETASSETS | $ | 75,584,707 | ||
|
| |||
NETASSETSCONSISTOF: | ||||
Paid in capital | $ | 78,192,688 | ||
Undistributed net investment income | 1,147,422 | |||
Accumulated net realized loss on investments | (7,123,665 | ) | ||
Net unrealized appreciation on investments | 3,368,262 | |||
|
| |||
Net assets | $ | 75,584,707 | ||
Capital shares outstanding | 3,257,636 | |||
Net asset value per share | $ | 23.20 | ||
|
| |||
STATEMENT OF OPERATIONS
Year Ended December 31, 2011
INVESTMENT INCOME: |
| |||
Dividends | $ | 2,162,651 | ||
Interest | 353,916 | |||
|
| |||
Total investment income | 2,516,567 | |||
|
| |||
EXPENSES: | ||||
Management fees | 696,279 | |||
Transfer agent and administrative fees | 193,411 | |||
Investor service fees | 193,411 | |||
Portfolio accounting fees | 77,363 | |||
Custodian fees | 19,654 | |||
Trustees’ fees* | 7,696 | |||
Miscellaneous | 166,020 | |||
|
| |||
Total expenses | 1,353,834 | |||
|
| |||
Net investment income | 1,162,733 | |||
|
| |||
NET REALIZEDAND UNREALIZED GAIN (Loss): |
| |||
Net realized gain (loss) on: | ||||
Investments | 2,204,531 | |||
Realized gain distributions received from investment company shares | 32,859 | |||
|
| |||
Net realized gain | 2,237,390 | |||
|
| |||
Net change in unrealized appreciation (depreciation) on: | ||||
Investments | (4,135,929 | ) | ||
|
| |||
Net change in unrealized appreciation (depreciation) | (4,135,929 | ) | ||
|
| |||
Net realized and unrealized loss | (1,898,539 | ) | ||
|
| |||
Net decrease in net assets resulting from operations | $ | (735,806 | ) | |
|
| |||
| * | Relates to Trustees not deemed “interested persons” within the meaning of Section 2(a)(19) of the 1940 Act. |
| 16 | THE GUGGENHEIM FUNDSANNUALREPORT | See Notes to Financial Statements. |
CLERMONT FUND
| ||
| STATEMENTS OF CHANGES IN NET ASSETS | ||
| Year Ended December 31, 2011 | Year Ended December 31, 2010 | |||||||
INCREASE (DECREASE) IN NET ASSETS FROM OPERATIONS: | ||||||||
Net investment income | $ | 1,162,733 | $ | 1,358,889 | ||||
Net realized gain on investments | 2,237,390 | 1,278,127 | ||||||
Net change in unrealized appreciation (depreciation) on investments | (4,135,929 | ) | 4,885,068 | |||||
|
|
|
| |||||
Net increase (decrease) in net assets resulting from operations | (735,806 | ) | 7,522,084 | |||||
|
|
|
| |||||
DISTRIBUTIONSTOSHAREHOLDERSFROM: | ||||||||
Net investment income | (1,375,700 | ) | (1,293,571 | ) | ||||
|
|
|
| |||||
Total distributions to shareholders | (1,375,700 | ) | (1,293,571 | ) | ||||
|
|
|
| |||||
CAPITALSHARETRANSACTIONS: | ||||||||
Proceeds from sale of shares | 31,171,764 | 26,286,130 | ||||||
Distributions reinvested | 1,375,700 | 1,293,571 | ||||||
Cost of shares redeemed | (28,899,474 | ) | (26,563,162 | ) | ||||
|
|
|
| |||||
Net increase from capital share transactions | 3,647,990 | 1,016,539 | ||||||
|
|
|
| |||||
Net increase in net assets | 1,536,484 | 7,245,052 | ||||||
NETASSETS: | ||||||||
Beginning of year | 74,048,223 | 66,803,171 | ||||||
|
|
|
| |||||
End of year | $ | 75,584,707 | $ | 74,048,223 | ||||
|
|
|
| |||||
Undistributed net investment income at end of year | $ | 1,147,422 | $ | 1,304,882 | ||||
|
|
|
| |||||
CAPITALSHAREACTIVITY: | ||||||||
Shares sold | 1,302,885 | 1,175,728 | ||||||
Shares issued from reinvestment of distributions | 59,374 | 55,902 | ||||||
Shares redeemed | (1,230,385 | ) | (1,180,776 | ) | ||||
|
|
|
| |||||
Net increase in shares | 131,874 | 50,854 | ||||||
|
|
|
| |||||
| See Notes to Financial Statements. | THE GUGGENHEIM FUNDSANNUALREPORT | 17 |
| CLERMONT FUND | ||
| FINANCIAL HIGHLIGHTS | ||
This table is presented to show selected data for a share outstanding throughout each period and to assist shareholders in evaluating a Fund’s performance for the periods presented.
| Year Ended December 31, 2011 | Year Ended December 31, 2010 | Year Ended December 31, 2009 | Year Ended December 31, 2008 | Year Ended December 31, 2007 | ||||||||||||||||
Per Share Data | ||||||||||||||||||||
Net asset value, beginning of period | $ | 23.69 | $ | 21.73 | $ | 18.09 | $ | 26.79 | $ | 29.90 | ||||||||||
|
|
|
|
|
|
|
|
|
| |||||||||||
Income (loss) from investment operations: | ||||||||||||||||||||
Net investment incomea | .36 | .44 | .47 | .51 | .53 | |||||||||||||||
Net gain (loss) on investments (realized and unrealized) | (.43 | ) | 1.94 | 3.61 | (8.60 | ) | 1.40 | |||||||||||||
|
|
|
|
|
|
|
|
|
| |||||||||||
Total from investment operations | (.07 | ) | 2.38 | 4.08 | (8.09 | ) | 1.93 | |||||||||||||
|
|
|
|
|
|
|
|
|
| |||||||||||
Less distributions from: | ||||||||||||||||||||
Net investment income | (.42 | ) | (.42 | ) | (.44 | ) | (.25 | ) | (.61 | )d | ||||||||||
Net realized gains | — | — | — | (.36 | ) | (4.43 | )d | |||||||||||||
|
|
|
|
|
|
|
|
|
| |||||||||||
Total distributions | (.42 | ) | (.42 | ) | (.44 | ) | (.61 | ) | (5.04 | ) | ||||||||||
|
|
|
|
|
|
|
|
|
| |||||||||||
Net asset value, end of period | $ | 23.20 | $ | 23.69 | $ | 21.73 | $ | 18.09 | $ | 26.79 | ||||||||||
|
|
|
|
|
|
|
|
|
| |||||||||||
Total Returnb | (0.28 | %) | 10.99 | % | 22.58 | % | (30.07 | %) | 6.23 | % | ||||||||||
|
|
|
|
|
|
|
|
|
| |||||||||||
Ratios/Supplemental Data | ||||||||||||||||||||
Net assets, end of period (in thousands) | $ | 75,585 | $ | 74,048 | $ | 66,803 | $ | 47,259 | $ | 62,264 | ||||||||||
|
|
|
|
|
|
|
|
|
| |||||||||||
Ratios to average net assets: | ||||||||||||||||||||
Net investment income | 1.50 | % | 1.97 | % | 2.41 | % | 2.19 | % | 1.73 | % | ||||||||||
Total expensesc | 1.75 | % | 1.71 | % | 1.70 | % | 1.66 | % | 1.64 | % | ||||||||||
|
|
|
|
|
|
|
|
|
| |||||||||||
Portfolio turnover rate | 28 | % | 68 | % | 128 | % | 149 | % | 163 | % | ||||||||||
| a | Net investment income per share was computed using average shares outstanding throughout the period. |
| b | Total return does not reflect the impact of any additional fees charged by insurance companies and has not been annualized. |
| c | Does not include expenses of the underlying funds in which the Fund invests. |
| d | For financial reporting purposes, certain distributions from net investment income for federal tax purposes have been reclassified to distributions from realized gains. |
| 18 | THE GUGGENHEIM FUNDSANNUALREPORT | See Notes to Financial Statements. |
This page intentionally left blank.
THE GUGGENHEIM FUNDSANNUALREPORT | 19
| PERFORMANCE REPORT AND FUND PROFILE (Unaudited) | December 31, 2011 | |
OBJECTIVE: Seeks to provide growth of capital and total return.
Select Allocation Fund returned -4.21% for the year ended December 31, 2011, underperforming its blended benchmark, 75% S&P 500® Index* and 25% Barclay’s Capital U.S. Credit Index*, which gained 3.85%.
As the year began, we reduced the Fund’s international exposure. Increased uncertainty in emerging markets resulted from protests in Tunisia and Egypt, later morphing into what became known as the Arab Spring as protests spread across the Middle East and North Africa (MENA). The Fund’s domestic allocations to large and mid caps were increased.
Global growth was lower than expected, but appeared to be stabilizing, when the earthquake and tsunami hit Japan in March. Complications about the nuclear power plant, property destruction and supply disruptions to manufacturing and distribution around the world led to talk of the U.S. entering a recession, which brought more uneasiness to the market.
During the summer, markets were moving higher when U.S. politicians debated the debt ceiling and threatened to not pay on the Treasury debt. The market moved sharply lower on the news and confidence in the economy evaporated.
The rest of the year was dominated by news from Europe, as investors grew increasingly uncomfortable with the ability of the eurozone to address its sovereign debt crisis.
As the year ended, the markets for large U.S. companies managed to finish about flat, while international and smaller companies finished in negative territory.
Looking forward, we will monitor the trends for new leadership to develop. The U.S. economy has continued to grow, and corporations have built up their balance sheets, positioning themselves for a strong 2012. However, we expect the U.S. elections and the potential for Mid East civil unrest to lead to continued market volatility.
The Fund’s fixed-income allocations toward shorter duration and corporate bonds did not help our performance, as the high-yield sector sold off strongly during the U.S. debt ceiling debates in the summer. The U.S. Treasury yields managed to move even lower, despite the headlines and the downgrade in the credit rating. With such paltry yields, investors moved into large dividend-paying stocks as an alternative source of income.
| * | Standard & Poor’s 500 Index (S&P 500®) – a capitalization-weighted index covering 500 industrial, utility, transportation and financial companies of the U.S. markets (mostly NYSE Euronext issues). |
| * | The Barclays Capital U.S. Credit Index comprises the Barclays Capital U.S. Corporate Index and a non-corporate component that includes foreign agencies, sovereigns, supranationals and local authorities. It is a subset of the Barclays Capital U.S. Government/Credit Index and Barclays Capital U.S. Aggregate Index. |
Performance displayed represents past performance which is no guarantee of future results.
Holdings Diversification (Market Exposure as % of Net Assets)
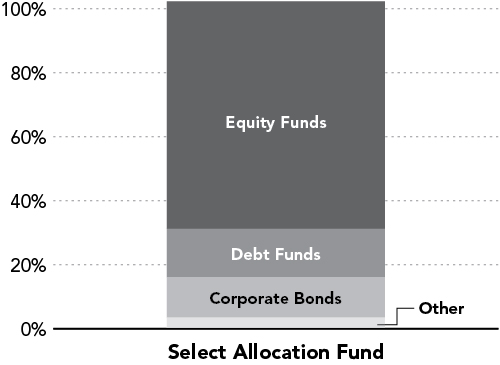
“Holdings Diversification (Market Exposure as % of Net Assets)” excludes any temporary cash investments.
Inception Date: November 10, 2006
Ten Largest Holdings (% of Total Net Assets) | ||||||
SPDR S&P 500 ETF Trust | 9.7 | % | ||||
iShares iBoxx $ High Yield Corporate Bond Fund | 7.1 | % | ||||
SPDR Barclays Capital High Yield Bond ETF | 6.2 | % | ||||
SPDR S&P MidCap 400 ETF Trust | 5.4 | % | ||||
Vanguard MSCI Emerging Markets ETF | 4.5 | % | ||||
iShares S&P 500 Index Fund | 3.9 | % | ||||
Vanguard Total Stock Market ETF | 3.6 | % | ||||
Vanguard Mid-Capital ETF | 3.3 | % | ||||
Vanguard Large-Capital ETF | 3.3 | % | ||||
Vanguard Small-Capital ETF | 3.2 | % | ||||
|
| |||||
Top Ten Total | 50.2 | % | ||||
|
| |||||
“Ten Largest Holdings” exclude any temporary cash or derivative investments.
| 20 | THE GUGGENHEIM FUNDSANNUALREPORT |
| PERFORMANCE REPORT AND FUND PROFILE (Unaudited) (concluded) | ||
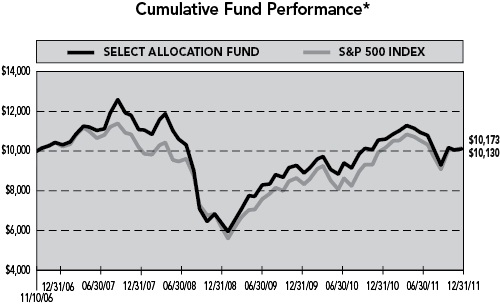
Average Annual Returns*
Periods Ended 12/31/11
| 1 Year | 5 Year | Since Inception (11/10/06) | ||||||||||
Select Allocation Fund | -4.21 | % | 0.32 | % | 0.25 | % | ||||||
S&P 500 Index | 2.11 | % | -0.25 | % | 0.33 | % | ||||||
Synthetic Balanced Benchmark† | 3.85 | % | 1.76 | % | 2.15 | % | ||||||
| † | Benchmark reflects a 75/25 ratio of the performance of the S&P 500 Index and the Barclays Capital U.S. Credit Index. |
| * | The performance data represents past performance that is not predictive of future results. The investment return and principal value of an investment in the Fund will fluctuate so that an investor’s shares, when redeemed, may be worth more or less than their original cost. Returns are historical and include changes in principal and reinvested dividends and capital gains and do not reflect the effect of taxes. The S&P 500 Index is an unmanaged index and, unlike the Fund, has no management fees or operating expenses to reduce its reported return. Returns do not reflect the impact of any additional fees charged by insurance companies. |
| THE GUGGENHEIM FUNDSANNUALREPORT | 21 |
| SCHEDULE OF INVESTMENTS | December 31, 2011 | |
SELECT ALLOCATION FUND | ||
SHARES | VALUE | |||||
COMMON STOCKS† - 1.9% |
| |||||
ENERGY - 1.9% |
| |||||
Exxon Mobil Corp. | 4,000 | $ | 339,040 | |||
ConocoPhillips | 4,500 | 327,915 | ||||
|
| |||||
Total Energy | 666,955 | |||||
|
| |||||
Total Common Stocks | 666,955 | |||||
|
| |||||
EXCHANGE TRADED FUNDS† - 84.7% |
| |||||
UNITED STATES OF AMERICA - 69.2% |
| |||||
SPDR S&P 500 ETF Trust | 27,100 | 3,401,050 | ||||
iShares iBoxx $ High Yield Corporate Bond Fund | 27,700 | 2,477,211 | ||||
SPDR Barclays Capital High Yield Bond ETF | 56,600 | 2,176,270 | ||||
SPDR S&P MidCap 400 ETF Trust | 11,800 | 1,882,572 | ||||
iShares S&P 500 Index Fund | 10,700 | 1,347,772 | ||||
Vanguard Total Stock Market ETF | 19,800 | 1,273,140 | ||||
Vanguard Mid-Capital ETF | 16,000 | 1,151,040 | ||||
Vanguard Large-Capital ETF | 20,000 | 1,146,200 | ||||
Vanguard Small-Capital ETF | 16,000 | 1,114,720 | ||||
iShares Russell 2000 Index Fund | 12,400 | 913,756 | ||||
Vanguard Extended Market ETF | 16,000 | 829,440 | ||||
Vanguard Growth ETF | 10,400 | 642,304 | ||||
Powershares QQQ Trust Series 1 | 11,300 | 630,879 | ||||
iShares Russell Midcap Index Fund | 5,800 | 570,836 | ||||
iShares Barclays Credit Bond Fund | 4,900 | 533,659 | ||||
iShares Morningstar Large Value Index Fund | 8,700 | 514,083 | ||||
Industrial Select Sector SPDR Fund | 15,000 | 506,250 | ||||
iShares Russell 1000 Growth Index Fund | 8,700 | 502,773 | ||||
SPDR S&P Biotech ETF* | 6,700 | 444,880 | ||||
Technology Select Sector SPDR Fund | 17,400 | 442,830 | ||||
Vanguard Value ETF | 8,000 | 419,920 | ||||
iShares S&P MidCap 400 Index Fund | 4,400 | 385,484 | ||||
RevenueShares Large Capital ETF | 16,400 | 381,628 | ||||
iShares High Dividend Equity Fund | 5,100 | 283,050 | ||||
SPDR S&P Dividend ETF | 1,700 | 91,579 | ||||
iShares Dow Jones Select Dividend Index Fund | 1,700 | 91,375 | ||||
|
| |||||
Total United States of America | 24,154,701 | |||||
|
| |||||
EMERGING MARKETS - 8.5% | ||||||
Vanguard MSCI Emerging Markets ETF | 41,100 | 1,570,431 | ||||
iShares MSCI Emerging Markets Index Fund | 25,900 | 982,646 | ||||
SPDR S&P BRIC 40 ETF | 18,600 | 407,712 | ||||
|
| |||||
Total Emerging Markets | 2,960,789 | |||||
|
| |||||
LATIN AMERICAN REGION - 2.7% |
| |||||
iShares S&P Latin America 40 Index Fund | 22,400 | 953,568 | ||||
|
| |||||
ASIAN PACIFIC REGION EX JAPAN - 1.7% |
| |||||
iShares MSCI Pacific ex-Japan Index Fund | 15,200 | 591,736 | ||||
|
| |||||
GLOBAL - 1.6% |
| |||||
iShares S&P Global Energy Sector Index Fund | 7,800 | 297,882 | ||||
iShares S&P Global Materials Sector Index Fund | 4,500 | 257,400 | ||||
|
| |||||
Total Global | 555,282 | |||||
|
| |||||
CANADA - 1.0% |
| |||||
iShares MSCI Canada Index Fund | 13,300 | 353,780 | ||||
|
| |||||
Total Exchange Traded Funds |
| |||||
(Cost $28,941,878) | 29,569,856 | |||||
|
| |||||
SHORT TERM INVESTMENTS†† - 1.0% |
| |||||
First American Treasury Obligations Fund | 354,892 | 354,892 | ||||
|
| |||||
Total Short Term Investments |
| |||||
(Cost $354,892) | 354,892 | |||||
|
| |||||
FACE | ||||||
CORPORATE BONDS†† - 12.4% |
| |||||
MATERIALS - 4.0% | ||||||
Alcoa, Inc. | ||||||
5.87% due 02/23/22 | $626,000 | 630,558 | ||||
6.75% due 07/15/18 | 257,000 | 283,701 | ||||
Chevron Phillips Chemical Company LLC | ||||||
8.25% due 06/15/191,2 | 352,000 | 445,622 | ||||
Freeport-McMoRan Copper & Gold, Inc. | ||||||
8.38% due 04/01/17 | 45,000 | 47,813 | ||||
|
| |||||
Total Materials | 1,407,694 | |||||
|
| |||||
FINANCIALS - 3.2% |
| |||||
Mutual of Omaha Insurance Co. | ||||||
6.80% due 06/15/361,2 | 460,000 | 490,625 | ||||
HSBC Finance Corp. | ||||||
7.00% due 05/15/12 | 310,000 | 315,780 | ||||
Goldman Sachs Group, Inc. | ||||||
5.95% due 01/15/27 | 310,000 | 290,573 | ||||
|
| |||||
Total Financials | 1,096,978 | |||||
|
| |||||
CONSUMER DISCRETIONARY - 2.3% |
| |||||
Nordstrom, Inc. | ||||||
7.00% due 01/15/38 | 593,000 | 788,514 | ||||
|
| |||||
| 22 | THE GUGGENHEIM FUNDSANNUALREPORT | See Notes to Financial Statements. |
| SCHEDULE OF INVESTMENTS (concluded) | December 31, 2011 | |
| SELECT ALLOCATION FUND | ||
| FACE AMOUNT | VALUE | |||||||
HEALTH CARE - 1.2% |
| |||||||
Agilent Technologies, Inc. 6.50% due 11/01/17 | $ | 368,000 | $ | 426,161 | ||||
|
| |||||||
INFORMATION TECHNOLOGY - 0.9% |
| |||||||
Corning, Inc. 7.25% due 08/15/36 | 270,000 | 325,717 | ||||||
|
| |||||||
CONSUMER STAPLES - 0.8% |
| |||||||
Bunge Ltd. Finance Corp. 8.50% due 06/15/19 | 235,000 | 286,051 | ||||||
|
| |||||||
Total Corporate Bonds | 4,331,115 | |||||||
|
| |||||||
U.S. GOVERNMENT SECURITIES† - 0.1% |
| |||||||
U.S. Treasury Notes 0.88% due 02/29/12 | 50,000 | 50,066 | ||||||
|
| |||||||
Total U.S. Government Securities |
| 50,066 | ||||||
|
| |||||||
Total Investments – 100.1 % |
| $ | 34,972,884 | |||||
|
| |||||||
Liabilities & Other Assets – (0.1)% |
| (46,993 | ) | |||||
|
| |||||||
Total Net Assets – 100.0% | $ | 34,925,891 | ||||||
| † | Value determined based on Level 1 inputs — See Note 4. |
| †† | Value determined based on Level 2 inputs — See Note 4. |
| 1 | Security was acquired through a private placement. |
| 2 | Security is a 144A or Section 4(2) security. The total market value of 144A or Section 4(2) securities is $936,247 (cost $762,937), or 2.7% of total net assets. |
| See Notes to Financial Statements. | THE GUGGENHEIM FUNDSANNUALREPORT | 23 |
| SELECT ALLOCATION FUND | ||
STATEMENT OF ASSETS AND LIABILITIES
December 31, 2011
Assets: | ||||
Investments, at value | $ | 34,972,884 | ||
Receivables: | ||||
Dividends | 72,807 | |||
Interest | 67,821 | |||
|
| |||
Total assets | 35,113,512 | |||
|
| |||
LIABILITIES: | ||||
Payable for: | ||||
Fund shares redeemed | 80,659 | |||
Management fees | 26,731 | |||
Transfer agent and administrative fees | 7,425 | |||
Investor service fees | 7,425 | |||
Portfolio accounting fees | 2,970 | |||
Miscellaneous | 62,411 | |||
|
| |||
Total liabilities | 187,621 | |||
|
| |||
NETASSETS | $ | 34,925,891 | ||
|
| |||
NETASSETSCONSISTOF: | ||||
Paid in capital | $ | 42,998,230 | ||
Undistributed net investment income | 327,428 | |||
Accumulated net realized loss on investments | (10,038,336 | ) | ||
Net unrealized appreciation on investments | 1,638,569 | |||
|
| |||
Net assets | $ | 34,925,891 | ||
Capital shares outstanding | 1,547,968 | |||
Net asset value per share | $ | 22.56 | ||
|
|
STATEMENT OF OPERATIONS
Year Ended December 31, 2011 |
| |||
INVESTMENT INCOME: | ||||
Dividends | $ | 769,016 | ||
Interest | 277,115 | |||
|
| |||
Total investment income | 1,046,131 | |||
|
| |||
EXPENSES: | ||||
Management fees | 345,783 | |||
Transfer agent and administrative fees | 96,051 | |||
Investor service fees | 96,051 | |||
Portfolio accounting fees | 38,420 | |||
Custodian fees | 9,741 | |||
Trustees’ fees* | 3,869 | |||
Miscellaneous | 83,519 | |||
|
| |||
Total expenses | 673,434 | |||
|
| |||
Net investment income | 372,697 | |||
|
| |||
NET REALIZEDAND UNREALIZED GAIN (Loss): |
| |||
Net realized gain (loss) on: | ||||
Investments | 1,431,484 | |||
Realized gain distributions received from investment company shares | 11,176 | |||
|
| |||
Net realized gain | 1,442,660 | |||
|
| |||
Net change in unrealized appreciation (depreciation) on: | ||||
Investments | (3,338,934 | ) | ||
|
| |||
Net change in unrealized appreciation (depreciation) | (3,338,934 | ) | ||
|
| |||
Net realized and unrealized loss | 1,896,274 | |||
|
| |||
Net decrease in net assets resulting from operations | $ | (1,523,577 | ) | |
|
| |||
| 24 | THE GUGGENHEIM FUNDSANNUALREPORT | See Notes to Financial Statements. |
| STATEMENTS OF CHANGES IN NET ASSETS |
| Year Ended December 31, 2011 | Year Ended December 31, 2010 | |||||||
INCREASE (DECREASE) IN NET ASSETS FROM OPERATIONS: | ||||||||
Net investment income | $ | 372,697 | $ | 538,976 | ||||
Net realized gain on investments | 1,442,660 | 1,272,923 | ||||||
Net change in unrealized appreciation (depreciation) on investments | (3,338,934 | ) | 3,456,806 | |||||
|
|
|
| |||||
Net increase (decrease) in net assets resulting from operations | (1,523,577 | ) | 5,268,705 | |||||
|
|
|
| |||||
DISTRIBUTIONSTOSHAREHOLDERSFROM: | ||||||||
Net investment income | (549,241 | ) | (699,942 | ) | ||||
|
|
|
| |||||
Total distributions to shareholders | (549,241 | ) | (699,942 | ) | ||||
|
|
|
| |||||
CAPITALSHARETRANSACTIONS: | ||||||||
Proceeds from sale of shares | 6,808,365 | 8,982,102 | ||||||
Distributions reinvested | 549,241 | 699,942 | ||||||
Cost of shares redeemed | (12,386,422 | ) | (15,765,460 | ) | ||||
|
|
|
| |||||
Net decrease from capital share transactions | (5,028,816 | ) | (6,083,416 | ) | ||||
|
|
|
| |||||
Net decrease in net assets | (7,101,634 | ) | (1,514,653 | ) | ||||
NETASSETS: | ||||||||
Beginning of year | 42,027,525 | 43,542,178 | ||||||
|
|
|
| |||||
End of year | $ | 34,925,891 | $ | 42,027,525 | ||||
|
|
|
| |||||
Undistributed net investment income at end of year | $ | 327,428 | $ | 294,393 | ||||
|
|
|
| |||||
CAPITALSHAREACTIVITY: | ||||||||
Shares sold | 291,061 | 408,680 | ||||||
Shares issued from reinvestment of distributions | 24,324 | 30,327 | ||||||
Shares redeemed | (524,001 | ) | (717,667 | ) | ||||
|
|
|
| |||||
Net decrease in shares | (208,616 | ) | (278,660 | ) | ||||
|
|
|
| |||||
| See Notes to Financial Statements. | THE GUGGENHEIM FUNDSANNUALREPORT | 25 |
SELECT ALLOCATION FUND FINANCIAL HIGHLIGHTS | ||
This table is presented to show selected data for a share outstanding throughout each period and to assist shareholders in evaluating a Fund’s performance for the periods presented.
| Year Ended December 31, 2011 | Year Ended December 31, 2010 | Year Ended December 31, 2009 | Year Ended December 31, 2008 | Year Ended December 31, 2007 | ||||||||||||||||
Per Share Data | ||||||||||||||||||||
Net asset value, beginning of period | $ | 23.93 | $ | 21.39 | $ | 16.11 | $ | 28.98 | $ | 25.55 | ||||||||||
|
|
|
|
|
|
|
|
|
| |||||||||||
Income (loss) from investment operations: | ||||||||||||||||||||
Net investment incomea | .23 | .28 | .31 | .32 | .34 | |||||||||||||||
Net gain (loss) on investments (realized and unrealized) | (1.25 | ) | 2.66 | 5.45 | (12.56 | ) | 3.48 | |||||||||||||
|
|
|
|
|
|
|
|
|
| |||||||||||
Total from investment operations | (1.02 | ) | 2.94 | 5.76 | (12.24 | ) | 3.82 | |||||||||||||
|
|
|
|
|
|
|
|
|
| |||||||||||
Less distributions from: | ||||||||||||||||||||
Net investment income | (.35 | ) | (.40 | ) | (.48 | ) | (.31 | ) | — | |||||||||||
Net realized gains | — | — | — | (.32 | ) | (.39 | ) | |||||||||||||
|
|
|
|
|
|
|
|
|
| |||||||||||
Total distributions | (.35 | ) | (.40 | ) | (.48 | ) | (.63 | ) | (.39 | ) | ||||||||||
|
|
|
|
|
|
|
|
|
| |||||||||||
Net asset value, end of period | $ | 22.56 | $ | 23.93 | $ | 21.39 | $ | 16.11 | $ | 28.98 | ||||||||||
|
|
|
|
|
|
|
|
|
| |||||||||||
Total Returnb | (4.21 | %) | 13.75 | % | 35.79 | % | (42.14 | %) | 14.91 | % | ||||||||||
|
|
|
|
|
|
|
|
|
| |||||||||||
Ratios/Supplemental Data | ||||||||||||||||||||
Net assets, end of period (in thousands) | $ | 34,926 | $ | 42,028 | $ | 43,542 | $ | 43,391 | $ | 84,921 | ||||||||||
|
|
|
|
|
|
|
|
|
| |||||||||||
Ratios to average net assets: | ||||||||||||||||||||
Net investment income | 0.97 | % | 1.31 | % | 1.70 | % | 1.32 | % | 1.22 | % | ||||||||||
Total expensesc | 1.75 | % | 1.70 | % | 1.71 | % | 1.66 | % | 1.62 | % | ||||||||||
|
|
|
|
|
|
|
|
|
| |||||||||||
Portfolio turnover rate | 35 | % | 61 | % | 131 | % | 120 | % | 171 | % | ||||||||||
| a | Net investment income per share was computed using average shares outstanding throughout the period. |
| b | Total return does not reflect the impact of any additional fees charged by insurance companies and has not been annualized. |
| c | Does not include expenses of the underlying funds in which the Fund invests. |
| 26 | THE GUGGENHEIM FUNDSANNUALREPORT | See Notes to Financial Statements. |
| 1. | Organization and Significant Accounting Policies |
Organization
The Rydex Variable Trust (the “Trust”), a Delaware business trust, is registered with the SEC under the Investment Company Act of 1940 (the “1940 Act”) as a non-diversified, open-ended investment company and is authorized to issue an unlimited number of no par value shares. The Trust offers shares of the funds to insurance companies for their variable annuity and variable life insurance contracts.
At December 31, 2011, the Trust consisted of fifty-seven separate funds. This report covers the CLS AdvisorOne Funds (the “Funds”), while the other funds are contained in separate reports.
Guggenheim Investments (“Gl”) provides advisory services, and Rydex Fund Services, LLC (“RFS”) provides transfer agent, administrative, and accounting services to the Trust. Rydex Distributors, LLC (“RDL”) acts as principal underwriter for the Trust. Gl, RFS and RDL are affiliated entities.
Each Fund invests primarily in Exchange Traded Funds (“ETFs”) (“underlying funds”), acting similar to a “fund of funds”.
CLS Investments, LLC serves as investment sub-advisor (the “Sub-Advisor”) to the Funds and is responsible for the day-to-day management of each Fund’s portfolio.
Significant Accounting Policies
The following significant accounting policies are in conformity with U.S. generally accepted accounting principles and are consistently followed by the Trust. This requires management to make estimates and assumptions that affect the reported amount of assets and liabilities and disclosure of contingent assets and liabilities at the date of the financial statements and the reported amounts of revenues and expenses during the reporting period. Actual results could differ from these estimates. All time references are based on Eastern Time.
A. Open-end investment companies (“Mutual Funds”) are valued at their NAV as of the close of business on the valuation date. Exchange Traded Funds (“ETFs”) and closed-end investment companies are valued at the last quoted sales price.
Equity securities listed on an exchange (New York Stock Exchange (“NYSE”) or American Stock Exchange) are valued at the last quoted sales price as of the close of business on the NYSE on the valuation date. Equity securities listed on the NASDAQ market system are valued at the NASDAQ Official Closing Price on the valuation date.
Debt securities with a maturity of greater than 60 days at acquisition are valued at prices that reflect broker/dealer-supplied valuations or are obtained from independent pricing services, which may consider the trade activity, treasury spreads, yield or price of bonds of comparable quality, coupon, maturity, and type, as well as prices quoted by dealers who make markets in such securities. Short-term debt securities with a maturity of 60 days or less at acquisition and repurchase agreements are valued at amortized cost, which approximates market value.
Investments for which market quotations are not readily available are fair valued as determined in good faith by Gl under the direction of the Board of Trustees using methods established or ratified by the Board of Trustees. These methods include, but are not limited to: (i) using general information as to how these securities and assets trade; (ii) using other information and considerations, including current values in related markets.
B. Security transactions are recorded on the trade date for financial reporting purposes. Realized gains and losses from securities transactions are recorded using the identified cost basis. Proceeds from lawsuits related to investment holdings are recorded as realized gains. Dividend income is recorded on the ex-dividend date, net of applicable taxes withheld by foreign countries. Taxable non-cash dividends are recorded as dividend income. Interest income, including amortization of premiums and accretion of discount, is accrued on a daily basis.
C. Distributions of net investment income and net realized gains, if any, are declared and paid at least annually. Distributions are recorded on the ex-dividend date and are determined in accordance with income tax regulations which may differ from U.S. generally accepted accounting principles.
D. The Funds may leave cash overnight in their cash account with the custodian, U.S. Bank. Periodically, a Fund may have cash due to the custodian bank as an overdraft balance. A fee is incurred on this overdraft, calculated by multiplying the overdraft by a rate based on the federal funds rate.
E. Throughout the normal course of business, the Funds enter into contracts that contain a variety of representations and warranties which provide general indemnifications. The Funds’ maximum exposure under these arrangements is unknown, as this would involve future claims that may be made against the Funds and/or their affiliates that have not yet occurred. However, based on experience, the Funds expect the risk of loss to be remote.
| 2. | Financial Instruments |
The Funds invest to a significant extent in shares of ETFs to gain exposure to their investment objectives. ETFs are pooled investment vehicles, which may be managed or unmanaged, that generally seek to track the performance of a specific index. Although individual shares of an ETF are traded on an exchange (such as the NYSE, AMEX, or NASDAQ), large blocks of shares of ETFs are redeemable at net asset value. This ability to redeem large blocks of shares has historically resulted in the market price of individual shares of ETFs being at or near the net asset value of the ETF’s underlying investments. However, shares of ETFs may trade below their NAV. The NAV of shares will fluctuate with changes in the market value of the ETF’s holdings. The trading prices of shares will fluctuate in accordance with
THE GUGGENHEIM FUNDSANNUALREPORT | 27
NOTES TO FINANCIAL STATEMENTS (continued)
changes in NAV as well as market supply and demand. The difference between the bid price and ask price, commonly referred to as the “spread,” will also vary for an ETF depending on the ETF’s trading volume and market liquidity. Generally, the greater the trading volume and market liquidity, the smaller the spread is and vice versa. Any of these factors may lead to an ETF’s shares trading at a premium or a discount to NAV. The Funds, from time to time, may invest in ETFs that are not registered pursuant to the 1940 Act. Such ETFs may include commodity pools that are registered pursuant to the Securities Act of 1933 and the Commodity Exchange Act.
| 3. | Fees and Other Transactions with Affiliates |
Under the terms of an investment advisory contract, the Funds pay Gl investment advisory fees calculated at an annual percentage rate of 0.90% of the average daily net assets of each Fund.
Gl pays the Sub-Advisor out of the advisory fees it receives. In addition, SI bears all of its own costs associated with providing these services and the expenses of the Trustees that are affiliated with Gl. Gl may make payments from its own resources to broker-dealers and other financial institutions in connection with the sale of Fund shares.
Each Fund indirectly bears a proportionate share of the total operating expenses (including investment management, shareholder servicing, custody, transfer agency, audit and other expenses) of the underlying funds in which the Fund invests.
RFS provides transfer agent and administrative services to the Funds for fees calculated at an annual percentage rate of 0.25% of the average daily net assets of each Fund.
RFS also provides accounting services to the Funds for fees calculated at annualized rates below, based on the average daily net assets each Fund.
Fund Accounting | (as a % of net assets) | |||
On the first $250 million | 0.10 | % | ||
On the next $250 million | 0.075 | % | ||
On the next $250 million | 0.05 | % | ||
Over $750 million | 0.03 | % | ||
RFS engages external service providers to perform other necessary services for the Trust, such as audit related services, legal services, printing and mailing, etc., on a pass-through basis. Such expenses are allocated to various Funds within the complex based on relative net assets. Organizational and setup costs for new funds are paid by the Trust.
The Trust has adopted an Investor Services Plan for which RDL and other firms that provide investor services (“Service Providers”) may receive compensation. The Funds will pay investor service fees to RDL at an annual rate not to exceed 0.25% of average daily net assets. RDL, in turn, will compensate Service Providers for providing such services, while retaining a portion of such payments to compensate itself for investor services it performs.
The Board approved the use of a Distribution Plan for which RDL and other Service Providers may receive compensation. If a Service Provider provides distribution services, the Trust will pay distribution fees to RDL at an annual rate not to exceed 0.25% of average daily net assets, pursuant to Rule 12b-1 of the 1940 Act. RDL, in turn, will pay the Service Provider out of its fees. RDL may, at its discretion, retain a portion of such payments to compensate itself for distribution services. Although approved, for the year ended December 31, 2011, this plan was not utilized.
Certain officers and trustees of the Trust are also officers of Gl, RFS and RDL.
| 4. | Fair Value Measurement |
In accordance with U.S. generally accepted accounting principles, fair value is defined as the price that the Fund would receive to sell an investment or pay to transfer a liability in an orderly transaction with an independent buyer in the principal market, or in the absence of a principal market the most advantageous market for the investment or liability. A three-tier hierarchy is utilized to distinguish between (1) inputs that reflect the assumptions market participants would use in pricing an asset or liability developed based on market data obtained from sources independent of the reporting entity (observable inputs) and (2) inputs that reflect the reporting entity’s own assumptions about the assumptions market participants would use in pricing an asset or liability developed based on the best information available in the circumstances (unobservable inputs) and to establish classification of fair value measurements for disclosure purposes. Various inputs are used in determining the value of the Funds’ investments. The inputs are summarized in the three broad levels listed below:
| Level 1 — | quoted prices in active markets for identical securities. | |
| Level 2 — | other significant observable inputs (including quoted prices for similar securities, interest rates, prepayment speeds, credit risk, etc.). | |
| Level 3 — | significant unobservable inputs (including the fund’s own assumptions used to determine the fair value of investments). | |
The inputs or methodologies used for valuing securities are not necessarily an indication of the risk associated with investing in those securities.
28 | THE GUGGENHEIM FUNDSANNUALREPORT
NOTES TO FINANCIAL STATEMENTS (continued)
The following table summarizes the inputs used to value the Funds’ net assets at December 31, 2011:
Fund | Level 1 Investments In Securities | Level 2 Investments In Securities | Level 3 Investments In Securities | Total | ||||||||||||
Assets | ||||||||||||||||
Amerigo Fund | $ | 143,733,350 | $ | 1,111,960 | $ | — | $ | 144,845,310 | ||||||||
Clermont Fund | 68,572,514 | 6,997,544 | — | 75,570,058 | ||||||||||||
Select Allocation Fund | 30,286,877 | 4,686,007 | — | 34,972,884 | ||||||||||||
For the year ended December 31, 2011, there were no transfers between levels.
| 5. | Federal Income Tax Information |
The Funds intend to comply with the provisions of Subchapter M of the Internal Revenue Code applicable to regulated investment companies and will distribute substantially all taxable net investment income and capital gains sufficient to relieve them from all, or substantially all, federal income, excise and state income taxes. Therefore, no provision for federal or state income tax is required.
Tax positions taken or expected to be taken in the course of preparing the Funds’ tax returns are evaluated to determine whether the tax positions are “more-likely-than-not” of being sustained by the applicable tax authority. Tax positions not deemed to meet the more-likely-than-not threshold would be recorded as a tax benefit or expense in the current year. Management has analyzed the Funds’ tax positions taken on Federal income tax returns for all open tax years (fiscal years 2008-2011), and has concluded that no provision for income tax is required in the Funds’ financial statements.
Income and capital gain distributions are determined in accordance with Federal income tax regulations, which may differ from U.S. generally accepted accounting principles. These differences are primarily due to differing treatments for losses deferred due to wash sales.
The RIC Modernization Act of 2010 was signed into law on December 22, 2010 and seeks to simplify some of the tax provisions applicable to regulated investment companies and the tax reporting to their shareholders, and to improve the tax efficiency of certain fund structures. The changes are generally effective for taxable years beginning after the date of enactment.
One of the more prominent changes addresses capital loss carryforwards. Funds will be permitted to carryforward capital losses incurred in taxable years beginning after December 22, 2010 for an unlimited period. However, any losses incurred during those future taxable years will be required to be utilized prior to the losses incurred in pre-enactment taxable years. Under pre-enactment law, capital losses could be carried forward for eight years, and carried forward as short-term capital, irrespective of the character of the original loss. As a result of this ordering rule, pre-enactment capital loss carryforwards may potentially expire unused. Additionally, post-enactment capital losses that are carried forward will retain their character as either short-term or long-term capital losses rather than being considered all short-term as under previous law.
Tax basis capital losses in excess of capital gains are carried forward to offset future net capital gains. For the year ended December 31, 2011, the following capital loss carryforward amounts expired, were used, or were permanently lost due to loss limitation rules in Section 382 of the Internal Revenue Code:
Fund | Amount | |||
Amerigo Fund | $ | 8,010,139 | ||
Clermont Fund | 2,160,946 | |||
Select Allocation Fund | 1,388,920 | |||
The tax character of distributions paid during 2011 was as follows:
Fund | Ordinary Income | Long-Term Capital Gain | Total Distributions | |||||||||
Amerigo Fund | $ | — | $ | — | $ | — | ||||||
Clermont Fund | 1,375,700 | — | 1,375,700 | |||||||||
Select Allocation Fund | 549,241 | — | 549,241 | |||||||||
The tax character of distributions paid during 2010 was as follows:
Fund | Ordinary Income | Long-Term Capital Gain | Total Distributions | |||||||||
Amerigo Fund | $ | 179,331 | $ | — | $ | 179,331 | ||||||
Clermont Fund | 1,293,571 | — | 1,293,571 | |||||||||
Select Allocation Fund | 699,942 | — | 699,942 | |||||||||
Note: For federal income tax purposes, short term capital gain distributions are treated as ordinary income distributions.
THE GUGGENHEIM FUNDSANNUALREPORT | 29
NOTES TO FINANCIAL STATEMENTS (continued)
The tax character of distributable earnings/(accumulated losses) at December 31, 2011, was as follows:
Fund | Undistributed Ordinary Income | Undistributed Long-Term Capital Gain | Net Unrealized Appreciation | Capital Loss Carryforward | ||||||||||||
Amerigo Fund | $ | — | $ | 8,283,202 | $ | 883,930 | $ | (38,911,457 | ) | |||||||
Clermont Fund | 1,163,090 | — | 3,101,323 | (6,872,394 | ) | |||||||||||
Select Allocation Fund | 372,699 | — | 1,513,681 | (9,958,719 | ) | |||||||||||
Capital Loss Carryforward amounts may be limited due to Federal income tax regulations. A summary of the expiration of the aforementioned Capital Loss Carryforward is as follows:
Fund | Expires in 2016 | Expires in 2017 | Total Capital Loss Carryforward | |||||||||
Amerigo Fund | $ | (19,462,117 | ) | $ | (19,449,340 | ) | $ | (38,911,457 | ) | |||
Clermont Fund | (3,871,205 | ) | (3,001,189 | ) | (6,872,394 | ) | ||||||
Select Allocation Fund | (4,989,658 | ) | (4,969,061 | ) | (9,958,719 | ) | ||||||
Net investment income and net realized gains (losses) may differ for financial statement and tax purposes because of temporary or permanent book/tax differences. These differences are primarily due to post-October losses, losses deferred due to wash sales, foreign currency gains and losses, and the “mark-to-market” of certain passive foreign investment companies (PFICs) for tax purposes. Additional differences may result from the tax treatment of net investment losses and expired capital loss carryforwards. To the extent these differences are permanent, reclassifications are made to the appropriate equity accounts in the period that the differences arise. These reclassifications have no effect on net assets or NAV per share.
On the Statements of Assets and Liabilities, the following reclassifications were made for permanent book/tax differences:
Fund | Paid In Capital | Undistributed Net Investment Income | Accumulated Net Realized Gain (Loss) | |||||||||
Amerigo Fund | $ | (169,168 | ) | $ | 235,138 | $ | (65,970 | ) | ||||
Clermont Fund | — | 55,507 | (55,507 | ) | ||||||||
Select Allocation Fund | (121,153 | ) | 209,579 | (88,426 | ) | |||||||
At December 31, 2011, the cost of securities for Federal income tax purposes, the aggregate gross unrealized gain for all securities for which there was an excess of value over tax cost and the aggregate gross unrealized loss for all securities for which there was an excess of tax cost over value, were as follows:
Fund | Tax Cost | Tax Unrealized Gain | Tax Unrealized Loss | Net Unrealized Gain | ||||||||||||
Amerigo Fund | $ | 143,961,380 | $ | 8,219,391 | $ | (7,335,461 | ) | $ | 883,930 | |||||||
Clermont Fund | 72,468,735 | 5,473,731 | (2,372,408 | ) | 3,101,323 | |||||||||||
Select Allocation Fund | 33,459,203 | 2,787,347 | (1,273,666 | ) | 1,513,681 | |||||||||||
| 6. | Securities Transactions |
For the year ended December 31, 2011, the cost of purchases and proceeds from sales of investment securities, excluding short-term investments, were:
| Purchases | Sales | |||||||
Amerigo Fund | $ | 81,379,113 | $ | 125,326,277 | ||||
Clermont Fund | 25,200,770 | 21,206,428 | ||||||
Select Allocation Fund | 13,336,651 | 18,579,739 | ||||||
| 7. | Affiliated Transactions |
Investments representing 5% or more of the outstanding voting shares of a portfolio company of a fund, or control of or by, or common control under Select SGI or Guggenheim Partners, LLC, result in that portfolio company being considered an affiliated company of such fund, as defined in the 1940 Act. Transactions for the year ended December 31, 2011 in which the portfolio company is an “affiliated person” are as follows:
Fund | Security | Value 12/31/10 | Additions | Reductions | Value 12/31/11 | Shares 12/31/11 | Investment Income | |||||||||||||||||||
Amerigo | Exchange Traded Fund: | |||||||||||||||||||||||||
Barclays ETN+long C Leveraged ETN Linked to S&P 500 | $ | — | $ | 880,269 | $ | — | $ | 845,964 | 6,300 | $ | — | |||||||||||||||
30 | THE GUGGENHEIM FUNDSANNUALREPORT
NOTES TO FINANCIAL STATEMENTS (concluded)
| 8. | Line of Credit |
The Trust, along with other affiliated trusts, has secured an uncommitted, $75,000,000 line of credit with U.S. Bank, N.A. for emergency or temporary purposes. Borrowings, if any, under this arrangement bear interest equal to the Prime Rate, minus 2%, which shall be paid monthly, averaging 1.25% for the year ended December 31, 2011. At December 31, 2011, the Funds did not have any borrowings under this agreement, which expires on June 15, 2012, but the following table illustrates average daily balances borrowed:
Fund | Average Daily Balance | |||
Amerigo Fund | $ | 208,118 | ||
Clermont Fund | 42,014 | |||
Select Allocation Fund | 24,392 | |||
THE GUGGENHEIM FUNDSANNUALREPORT | 31
REPORT OF INDEPENDENT REGISTERED PUBLIC ACCOUNTING FIRM
To the Board of Trustees and Shareholders
of the Rydex Variable Trust:
We have audited the accompanying statements of assets and liabilities, including the schedules of investments, of Amerigo Fund, Clermont Fund and Select Allocation Fund (three of the series constituting the Rydex Variable Trust) (the “Funds”) as of December 31, 2011, and the related statements of operations for the year then ended, the statements of changes in net assets for each of the two years in the period then ended, and the financial highlights for each of the four years in the period then ended. These financial statements and financial highlights are the responsibility of the Funds’ management. Our responsibility is to express an opinion on these financial statements and financial highlights based on our audits. The financial highlights for the year ended December 31, 2007 were audited by other auditors, whose report dated February 25, 2008 expressed an unqualified opinion on those financial highlights.
We conducted our audits in accordance with the standards of the Public Company Accounting Oversight Board (United States). Those standards require that we plan and perform the audit to obtain reasonable assurance about whether the financial statements and financial highlights are free of material misstatement. We were not engaged to perform an audit of the Funds’ internal control over financial reporting. Our audits included consideration of internal control over financial reporting as a basis for designing audit procedures that are appropriate in the circumstances, but not for the purpose of expressing an opinion on the effectiveness of the Funds’ internal control over financial reporting. Accordingly, we express no such opinion. An audit also includes examining, on a test basis, evidence supporting the amounts and disclosures in the financial statements and financial highlights, assessing the accounting principles used and significant estimates made by management, as well as evaluating the overall financial statement presentation. Our procedures included confirmation of securities owned as of December 31, 2011, by correspondence with the custodian and brokers. We believe that our audits provide a reasonable basis for our opinion.
In our opinion, the financial statements and financial highlights referred to above present fairly, in all material respects, the financial position of the above listed Funds at December 31, 2011, the results of their operations for the year then ended, the changes in their net assets for each of the two years in the period then ended, and their financial highlights for each of the four years in the period then ended, in conformity with U.S. generally accepted accounting principles.

McLean, Virginia
February 28, 2012
32 | THE GUGGENHEIM FUNDSANNUALREPORT
Proxy Voting Information
A description of the policies and procedures that the Trust uses to determine how to vote proxies relating to securities held in the Funds’ portfolios is available, without charge and upon request, by calling 1.800.820.0888. This information is also available from the EDGAR database on the SEC’s website at http://www.sec.gov.
Information regarding how the Funds voted proxies relating to portfolio securities during the most recent 12-month period ended December 31 is available without charge, upon request, by calling 1.800.820.0888. This information is also available from the EDGAR database on the SEC’s website at http://www.sec.gov.
At a special meeting of shareholders held on November 22, 2011, the shareholders of the Funds voted on whether to approve a new investment advisory agreement between Rydex Variable Trust and Security Investors, LLC. A description of the number of shares voted is as follows:
Fund | Shares For | Shares Against | Shares Abstained | |||||||||
Amerigo Fund | 4,485,696 | 114,841 | 116,309 | |||||||||
Clermont Fund | 2,836,790 | 162,915 | 254,752 | |||||||||
Select Allocation Fund | 1,433,679 | 88,966 | 60,633 | |||||||||
At a special meeting of shareholders held on November 22, 2011, the shareholders of the Funds voted on whether to approve a new sub-advisory agreement between Security Investors, LLC and CLS Investments, LLC. A description of the number of shares voted is as follows:
Fund | Shares For | Shares Against | Shares Abstained | |||||||||
Amerigo Fund | 4,485,406 | 114,841 | 116,597 | |||||||||
Clermont Fund | 2,836,396 | 163,188 | 254,872 | |||||||||
Select Allocation Fund | 1,436,956 | 89,486 | 56,836 | |||||||||
At a special meeting of shareholders held on November 22, 2011, the shareholders of the Trust also voted on whether to approve the election of nominees to the Board of Trustees. A description of the number of shares voted is as follows:
Donald C. Cacciapaglia | Corey A. Colehour | J. Kenneth Dalton | ||||||||||||||
For | 343,022,995 | For | 339,263,789 | For | 342,726,825 | |||||||||||
Withhold | 18,549,008 | Withhold | 22,308,214 | Withhold | 18,845,178 | |||||||||||
Total | 361,572,003 | Total | 361,572,003 | Total | 361,572,003 | |||||||||||
John O. Demaret | Richard M. Goldman | Werner E. Keller | ||||||||||||||
For | 338,940,641 | For | 342,766,477 | For | 342,532,565 | |||||||||||
Withhold | 22,631,362 | Withhold | 18,805,526 | Withhold | 19,039,438 | |||||||||||
Total | 361,572,003 | Total | 361,572,003 | Total | 361,572,003 | |||||||||||
Thomas F. Lydon | Patrick T. McCarville | Roger Somers | ||||||||||||||
For | 343,159,833 | For | 339,367,739 | For | 343,007,265 | |||||||||||
Withhold | 18,412,170 | Withhold | 22,204,264 | Withhold | 18,564,738 | |||||||||||
Total | 361,572,003 | Total | 361,572,003 | Total | 361,572,003 | |||||||||||
At a special meeting of shareholders held on November 22, 2011, the shareholders of the Funds also voted on whether to approve a “manager of managers” arrangement for each of the Funds. A description of the number of shares voted is as follows:
Fund | Shares For | Shares Against | Shares Abstained | |||||||||
Amerigo Fund | 4,486,109 | 116,322 | 114,415 | |||||||||
Clermont Fund | 2,862,693 | 138,089 | 253,675 | |||||||||
Select Allocation Fund | 1,434,070 | 77,021 | 72,186 | |||||||||
Quarterly Portfolio Schedules Information
The Trust files its complete schedule of portfolio holdings with the SEC for the first and third quarters of each fiscal year on Form N-Q; which are available on the SEC’s website at http://www.sec.gov. The Funds’ Forms N-Q may be reviewed and copied at the SEC’s Public Reference Room in Washington, DC, and that information on the operation of the Public Reference Room may be obtained by calling 1-800-SEC-0330. Copies of the portfolio holdings are also available to shareholders, without charge and upon request, by calling 1.800.820.0888.
Office Locations
The offices of Guggenheim Investments can be found in the following locations:
40 East 52nd Street
16th Floor
New York, NY 10022
(Headquarters)
THE GUGGENHEIM FUNDSANNUALREPORT | 33
OTHER INFORMATION (Unaudited) continued
Four Irvington Centre
805 King Farm Boulevard
Suite 600
Rockville, MD 20850
9401 Indian Creek Parkway
40 Corporate Woods
Suite 850
Overland Park, KS 66210
Guggenheim Transaction
On September 20, 2011, Guggenheim Capital, LLC agreed to purchase the indirect holding company of Security Investors, LLC, the Funds’ investment adviser (the “Investment Adviser”) (the “Transaction”). Guggenheim Capital, LLC’s subsidiary, Guggenheim Partners, LLC (“Guggenheim”), is a global, independent, privately-held, diversified financial services firm with more than 1,500 dedicated professionals.
The Transaction should not result in material changes to the day-to-day management and operations of the Funds or any increase in fees. The parties expect the Transaction to be completed in early 2012. However, it is subject to various conditions, and could be delayed or even terminated due to unforeseen circumstances.
In anticipation of the Transaction, the Board of Trustees of the Funds (the “Board”) called special meetings of shareholders (the “Meeting”), at which shareholders of record of each of the Funds as of October 3, 2011 were asked to consider the approval of a new investment advisory agreement between the Funds and the Investment Manager (the “New Agreement”). This approval was necessary because, under the Investment Company Act of 1940 (the “1940 Act”), the Transaction could have resulted in the termination of the Funds’ current investment advisory agreement with the Investment Manager (the “Current Agreement”). The Funds’ shareholders approved the New Agreement, the terms of which are substantially identical to the corresponding Current Agreement, except with respect to the date of execution, and the New Agreement will take effect if the Transaction is completed.
Election of Board Members
The Board also approved a proposal to elect nine individuals to the Board. The Board proposed the election of the following nominees: Donald C. Cacciapaglia, Corey A. Colehour, J. Kenneth Dalton, John O. Demaret, Richard M. Goldman, Werner E. Keller, Thomas F. Lydon, Patrick T. McCarville and Roger Somers. Each of the nominees, other than Mr. Cacciapaglia, currently serves as a Trustee. In connection with the Transaction, the Board believes that expanding the Board to include Mr. Cacciapaglia, who is a member of senior management of Guggenheim’s investment management business, and who would serve on other board in the Guggenheim Investments family of funds, would be appropriate. The Trusts’ shareholders ultimately approved the aforementioned proposal.
Board Considerations in Approving the Investment Advisory and Investment Sub-Advisory Agreements
At an in-person meeting of the Trust’s Board of Trustees held August 16-17, 2011, called for the purpose of, among other things, voting on the approval of investment advisory agreements applicable to the series of the Trust, the Trust’s Board of Trustees, including the independent Trustees, unanimously approved the investment advisory agreement between the Trust and Security Investors, LLC (referred to herein as the “Adviser”) and the investment sub-advisory agreements between the Adviser and CLS Investments, LLC (“CLS”) with respect to the CLS Amerigo Fund, CLS Select Allocation Fund and CLS Clermont Fund (the “Funds”).
At the meeting of August 16-17, 2011, the Trust’s Board of Trustees also considered new investment advisory and investment sub-advisory agreements that were required as a result of a proposed change in the corporate ownership structure of the Adviser (the “Transaction”). The Investment Company Act of 1940 (the “1940 Act”), the law that regulates mutual funds, including the Funds, requires that a fund’s investment advisory agreement terminate whenever there is deemed to be a “change in control” of the investment adviser. The change in the corporate ownership structure of the Adviser could potentially be deemed to constitute a “change in control” (as this term is used for regulatory purposes) of the Adviser. Before an investment advisory agreement terminates, a new investment advisory agreement must be in effect in order for the investment adviser to continue to manage the fund’s investments. For that reason, the Board of Trustees was asked to approve new investment advisory agreements for the Funds and a new investment sub-advisory agreement for each of the CLS Amerigo Fund, CLS Select Allocation Fund, and CLS Clermont Fund.
At the meeting of August 16-17, 2011, the Board considered the new investment advisory and investment sub-advisory agreements, pursuant to which, subject to approval by each Fund’s shareholders of the new agreements, the Adviser would continue to serve each Fund as investment adviser (and CLS would continue to serve as sub-investment adviser to CLS Amerigo
34 | THE GUGGENHEIM FUNDSANNUALREPORT
OTHER INFORM AT ION (Unaudited) continued
Fund, CLS Select Allocation Fund and CLS Clermont Fund) after the completion of the Transaction. At a special meeting of the Board held on September 14, 2011, the Board considered further information about the Transaction and voted in favor of the new investment advisory agreement and new investment sub-advisory agreements.
In reaching the conclusion to approve the new investment advisory and investment sub-advisory agreements, the Trustees requested and obtained from the Adviser such information as the Trustees deemed reasonably necessary to evaluate the proposed agreements. The Trustees carefully evaluated this information and were advised by legal counsel with respect to their deliberations.
Prior to the Board meetings in August and September 2011, representatives of Guggenheim Capital informed the Board of the Transaction. With respect to the Transaction, the Board reviewed materials received from Guggenheim Capital, including information relating to the terms of the Transaction. The Board also reviewed information regarding Guggenheim Capital, including, but not limited to: (a) certain representations concerning Guggenheim Capital’s financial condition, (b) information regarding the new proposed ownership structure and its possible effect on shareholders, (c) information regarding the consideration to be paid by Guggenheim Capital, and (d) potential conflicts of interest.
In considering the new investment advisory and investment sub-advisory agreements, the Board determined that the agreements would enable shareholders of the Funds to continue to obtain high quality services at a cost that is appropriate, reasonable, and in the best interests of their shareholders. The Board, including the independent Trustees, unanimously approved the new agreements. In reaching their decision, the Trustees carefully considered information that they had received throughout the year as part of their regular oversight of the Funds, including, in particular, information from the Adviser and CLS (collectively, the “Advisers”) that the Board had received relating to the current investment advisory and investment sub-advisory agreements at the Board meeting of August 16-17, 2011. The Trustees noted that, at the meeting, they had obtained and reviewed a wide variety of information, including certain comparative information regarding performance of the Funds relative to performance of other comparable mutual funds. They also considered the evolution of the Rydex|SGI family of funds and the Adviser since the change in control of the Investment Adviser in 2010 and Guggenheim Capital’s commitment to the success of the Adviser and the Funds.
In addition, as a part of their required consideration of the renewal of the current investment advisory and investment sub-advisory agreements at the meeting of August 16-17, 2011, the Trustees, including the independent Trustees, had evaluated a number of considerations, including among others: (a) the quality of the Advisers’ investment advisory and other services; (b) the Advisers’ investment management personnel; (c) the Advisers’ operations and financial condition; (d) the Advisers’ brokerage practices (including any soft dollar arrangements) and investment strategies; (e) the level of the fees that the Adviser charges compared with the fees charged to comparable mutual funds or accounts; (f) each Fund’s overall fees and operating expenses compared with similar mutual funds; (g) the level of the Adviser’s profitability from its Fund-related operations; (h) the Advisers’ compliance systems; (i) the Advisers’ policies on and compliance procedures for personal securities transactions; (j) the Advisers’ reputation, expertise and resources in the financial markets; and (k) Fund performance compared with similar mutual funds. Based on the Board’s deliberations at the meetings of August 16-17, 2011 and September 14, 2011, and its evaluation of the information regarding the Transaction and the fact that the Transaction is not expected to change the level and quality of services rendered by the Advisers to any of the Funds, the Board, including all of the independent Trustees, unanimously: (a) concluded that terms of the current and new investment advisory and investment sub-advisory agreements are fair and reasonable; (b) concluded that the Advisers’ fees were reasonable in light of the services provided to the Funds; and (c) agreed to approve the current investment advisory and investment sub-advisory agreements and, subject to shareholder approval, the new investment advisory and investment sub-advisory agreements, based upon the following considerations, among others:
| • | Nature, Extent and Quality of Services Provided by the Advisers. At the meeting of August 16-17, 2011, the Board reviewed the scope of services to be provided by the Advisers under the current investment advisory and investment sub-advisory agreements, and, at the meetings of August 16-17, 2011 and September 14, 2011, noted that there would be no significant differences between the scope of services required to be provided by the Advisers under the current investment advisory and investment sub-advisory agreements and the scope of services required to be provided by the Advisers under the new investment advisory and investment sub-advisory agreements. The Board noted that the key investment and management personnel of the Advisers servicing the Funds are expected to remain the same following the Transaction. The Trustees also considered Guggenheim Capital’s representations to the Board that the Adviser would continue to provide investment and related services that were of materially the same quality and quantity as services provided to the Funds in the past, and that these services are appropriate in scope and extent in light of the Funds’ operations, the competitive landscape of the investment company business and investor needs. |
THE GUGGENHEIM FUNDSANNUALREPORT | 35
OTHER INFORMATION (Unaudited) concluded
| • | Fund Expenses and Performance of the Funds. At the meeting of August 16-17, 2011, the Board had reviewed statistical information prepared by the Adviser regarding the expense ratio components and performance of each Fund. Based on the representations made by Guggenheim Capital at the meeting that the Adviser would continue to operate following the closing of the Transaction in much the same manner as it currently operates, the Board concluded that the investment performance of the Adviser was not expected to be affected by the Transaction. |
| • | Costs of Services Provided to the Funds and Profits Realized by the Adviser and its Affiliates. At the meeting of August 16-17, 2011, the Board had reviewed information about the profitability of the Funds to the Adviser based on the advisory fees payable under the current investment advisory and investment sub-advisory agreements. At that meeting, the Board had also analyzed the Funds’ expenses, including the investment advisory fees paid to the Advisers. The Board also had reviewed reports comparing the expense ratios to those of other comparable mutual funds. At the Board meeting, the Board considered the fact that the fee rates payable to the Advisers would be the same under each Fund’s new investment advisory and investment sub-advisory agreements as they are under such Fund’s current agreements. With respect to anticipated profitability, the Board noted that it was too early to predict how the Transaction would affect the Adviser’s profitability with respect to the Funds, but noted that this matter would be given further consideration on an ongoing basis. |
| • | Economies of Scale. In connection with its review of the Funds’ profitability analysis at the meeting of August 16- 17, 2011, the Board reviewed information regarding economies of scale or other efficiencies that may result from increases in the Funds’ asset levels. The Trustees noted that the fees would not change under the new investment advisory and investment sub-advisory agreements, and that no additional economies of scale would be directly realized as a result of the Transaction. They also noted that they will have the opportunity to again review the appropriateness of the fees payable to the Advisers under the new agreements when the renewal of the new agreements next comes before the Board. |
| • | Other Benefits to the Advisers and/or their Affiliates. In addition to evaluating the services provided by the Advisers, the Board had considered the nature, extent, quality and cost of the distribution services performed by the Funds’ Distributor under a separate agreement at the meeting of August 16-17, 2011. The Board reviewed information regarding potential economies of scale arising from the integration of the asset management businesses of Guggenheim Capital. The Board also considered the terms of the Transaction and the changes to the corporate ownership structure of the Adviser, noting that the Adviser would no longer be a subsidiary of Security Benefit Corporation. In this regard, the Board noted that, under the corporate structure after the Transaction, the Adviser would be more closely controlled by Guggenheim Capital, which could benefit Guggenheim Capital. The Board also noted that the costs associated with the Transaction would be borne by Guggenheim Capital (or its affiliates) and not the Funds. |
On the basis of the information provided to it and its evaluation of that information, the Board, including the independent Trustees, concluded that the terms of the investment advisory and investment sub-advisory agreements for the Funds were reasonable, and that approval of the current and new investment advisory and investment sub-advisory agreements were in the best interests of the Funds.
36 | THE GUGGENHEIM FUNDSANNUALREPORT
INFORMATION ON BOARD OF TRUSTEES AND OFFICERS (Unaudited)
A Board of Trustees oversees the Trust, as well as other trusts of Gl, in which its members have no stated term of service, and continue to serve after election until resignation. The Statement of Additional Information includes further information about Fund Trustees and Officers, and can be obtained without charge by calling 800.820.0888.
All Trustees and Officers may be reached c/o Guggenheim Investments, 805 King Farm Boulevard, Suite 600, Rockville, MD 20850.
INDEPENDENT TRUSTEES
Name, Position and Year of Birth | Length of Service As Trustee (Year Began) | Number of Funds Overseen | ||
Corey A. Colehour Trustee (1945) | Rydex Series Funds – 1993 Rydex Variable Trust – 1998 Rydex Dynamic Funds – 1999 Rydex ETF Trust – 2003 | 150 |
Principal Occupations During Past Five Years: Retired; Member of the Audit and Governance and Nominating Committees (1995 to present)
| ||||
J. Kenneth Dalton Trustee (1941) | Rydex Series Funds – 1995 Rydex Variable Trust – 1998 Rydex Dynamic Funds – 1999 Rydex ETF Trust – 2003 | 150 |
Principal Occupations During Past Five Years: Retired; Member of the Governance and Nominating Committees (1995 to present); Chairman of the Audit Committee (1997 to present); Member of the Risk Oversight Committee (2010 to present)
| ||||
John O. Demaret Trustee, Chairman of the Board (1940) | Rydex Series Funds – 1997 Rydex Variable Trust – 1998 Rydex Dynamic Funds – 1999 Rydex ETF Trust – 2003 | 150 |
Principal Occupations During Past Five Years: Retired; Member of the Audit Committee (1997 to present); Member of the Risk Oversight Committee (2010 to present)
| ||||
Werner E. Keller Trustee (1940) | Rydex Series Funds – 2005 Rydex Variable Trust – 2005 Rydex Dynamic Funds – 2005 Rydex ETF Trust – 2005 | 150 |
Principal Occupations During Past Five Years: Founder and President of Keller Partners, LLC (registered investment adviser) (2005 to present); Member of the Audit, Governance and Nominating Committees (2005 to present); Chairman and Member of the Risk Oversight Committee (2010 to present)
| ||||
Thomas F. Lydon, Jr. Trustee (1960) | Rydex Series Funds – 2005 Rydex Variable Trust – 2005 Rydex Dynamic Funds – 2005 Rydex ETF Trust – 2005 | 150 |
Principal Occupations During Past Five Years: President, Global Trends Investments (1996 to present); Member of the Audit, Governance and Nominating Committees (2005 to present)
| ||||
Patrick T. McCarville Trustee (1942) | Rydex Series Funds – 1997 Rydex Variable Trust – 1998 Rydex Dynamic Funds – 1999 Rydex ETF Trust – 2003 | 150 |
Principal Occupations During Past Five Years: CEO, Par Industries, Inc., d/b/a Par Leasing (1977 to 2010); Chairman of the Governance and Nominating Committees (1997 to present); Member of the Audit Committee (1997 to present)
|
THE GUGGENHEIM FUNDSANNUALREPORT | 37
INFORMATION ON BOARD OF TRUSTEES AND OFFICERS (Unaudited) (concluded)
INDEPENDENT TRUSTEES – continued
Name, Position and Year of Birth | Length of Service As Trustee (Year Began) | Number of Funds Overseen | ||
Roger Somers Trustee (1944) | Rydex Series Funds - 1993 Rydex Variable Trust - 1998 Rydex Dynamic Funds - 1999 Rydex ETF Trust - 2003 | 150 |
Principal Occupations During Past Five Years: Founder and CEO of Arrow Limousine (1965 to present); Member of the Audit, Governance and Nominating Committees (1995 to present)
EXECUTIVE OFFICERS
Name, Position and Year of Birth | Principal Occupations During Past Five Years | |
Richard M. Goldman* President (1961) | Current: Senior Vice President, Security Benefit Corporation; CEO, Security Benefit Asset Management Holdings, LLC; CEO, President and Manager Representative, Security Investors, LLC; CEO and Manager, Rydex Holdings, LLC; CEO, President and Manager, Rydex Distributors, LLC; Manager, Rydex Fund Services, LLC; President and Trustee, Rydex Series Funds, Rydex ETF Trust, Rydex Dynamic Funds and Rydex Variable Trust
Previous: Director, First Security Benefit Life Insurance Company (2007-2010); President and Director, Security Global Investors (2010-2011); CEO and Director, Rydex Advisors, LLC and Rydex Advisor II, LLC (2010); Director, Security Distributors, Inc. (2007-2009); Managing Member, R M Goldman Partners, LLC (2006-2007) | |
Michael P. Byrum* Vice President (1970) | Current: President, Security Benefit Asset Management Holdings, LLC; Senior Vice President, Security Investors, LLC; President and Chief Investment Officer, Rydex Holdings, LLC; Director and Chairman of the Board, Advisor Research Center, Inc.; Manager, Rydex Specialized Products, LLC
Previous: Rydex Distributors, LLC (f/k/a Rydex Distributors, Inc.), Vice President (2009); Rydex Fund Services, LLC, Director (2009-2010),Secretary (2002-2010), Executive Vice President (2002-2006); Rydex Advisors, LLC (f/k/a PADCO Advisors, Inc.), Director (2008-2010), Chief Investment Officer (2006-2010), President (2004-2010); Secretary (2002-2010); Rydex Advisors II, LLC (f/k/a PADCO Advisors II, Inc.), Director (2008-2010), Chief Investment Officer (2006-2010), President (2004-2010), Secretary (2002-2010); Rydex Capital Partners, LLC, (President and Secretary 2003-2007); Rydex Capital Partners II, LLC, (2003-2007); Rydex Holdings, LLC (f/k/a Rydex Holdings, Inc.), Secretary 2005-2008), Executive Vice President (2005-2006); Advisor Research Center, Inc., Secretary (2006-2009), Executive Vice President (2006); Rydex Specialized Products, LLC, Secretary (2005-2008) | |
Nikolaos Bonos* Vice President and Treasurer (1963) | Current: Senior Vice President, Security Investors, LLC; Chief Executive Officer and Manager, Rydex Specialized Products, LLC; Chief Executive Officer and President, Rydex Fund Services, LLC; Vice President, Rydex Holdings, LLC; Treasurer, SBL Fund; Security Equity Fund; Security Income Fund; Security Large Cap Value Fund and Security Mid Cap Growth Fund; Vice President, Security Benefit Asset Management Holdings, LLC
Previous: Security Global Investors, LLC, Senior Vice President (2010-2011); Rydex Advisors, LLC (f/k/a PADCO Advisors, Inc.) Senior Vice President (2006-2011); Rydex Fund Services, LLC (f/k/a Rydex Fund Services, Inc.), Director (2009) and Senior Vice President (2003-2006); Rydex Specialized Products, LLC, Chief Financial Officer (2005-2009) | |
38 | THE GUGGENHEIM FUNDSANNUALREPORT
INFORMATION ON BOARD OF TRUSTEES AND OFFICERS (Unaudited) (concluded)
EXECUTIVE OFFICERS – concluded
Name, Position and Year of Birth | Principal Occupations During Past Five Years | |
Joanna M. Haigney* Chief Compliance Officer and Secretary (1966) | Current: Chief Compliance Officer and Secretary, SBL Fund; Security Equity Chief Compliance Officer and Fund; Security Income Fund; Security Large Cap Value Fund and Security Mid Cap Growth Fund; Vice President, Rydex Holdings, LLC; Vice President, Security Benefit Asset Management Holdings, LLC; Senior Vice President and Chief Compliance Officer, Security Investors, LLC
Previous: Security Global Investors, LLC, Senior Vice President (2010-2011); Rydex Advisors, LLC (f/k/a PADCO Advisors, Inc.) and Rydex Advisors II, LLC (f/k/a PADCO Advisors II, Inc.), Chief Compliance Officer and Senior Vice President (2010-2011); Rydex Capital Partners I, LLC and Rydex Capital Partners II, LLC, Chief Compliance Officer (2006-2007); Rydex Fund Services, LLC (f/k/a Rydex Fund Services, Inc.), Vice President (2001-2006) | |
Keith A. Fletcher* Vice President (1958) | Current: Senior Vice President, Security Investors, LLC; Vice President, Rydex Holdings, LLC; Vice President, Rydex Specialized Products, LLC; Vice President, Rydex Distributors, LLC; Vice President, Rydex Fund Services, LLC; Vice President and Director, Advisor Research Center, Inc.; Vice President, SBL Fund; Security Equity Fund; Security Income Fund; Security Large Cap Value Fund and Security Mid Cap Growth Fund
Previous: Security Global Investors, LLC, Vice President (2010-2011); Rydex Advisors, LLC (f/k/a PADCO Advisors, Inc.) and Rydex Advisors II, LLC (f/k/a PADCO Advisors II, Inc.), Vice President (2009-2011); Lyster Watson and Company, Managing Director (2007-2008); Fletcher Financial Group, Inc., Chief Executive Officer (2004-2007) | |
Amy J. Lee* Vice President and Assistant Secretary (1960) | Current: Senior Vice President and Secretary, Security Investors, LLC; Secretary and Chief Compliance Officer, Security Distributors, Inc.; Vice President, Associate General Counsel and Assistant Secretary, Security Benefit Life Insurance Company and Security Benefit Corporation; Associate General Counsel, First Security Benefit Life Insurance and Annuity of New York; Vice President and Secretary, SBL Fund; Security Equity Fund; Security Income Fund; Security Large Cap Value Fund and Security Mid Cap Growth Fund; Vice President and Secretary, Rydex Holdings, LLC Secretary, Advisor Research Center, Inc., Rydex Specialized Products, LLC, Rydex Distributors, LLC and Rydex Fund Services, LLC; Assistant Secretary, Security Benefit Clinic and Hospital
Previous: Security Global Investors, LLC, Senior Vice President and Secretary (2007-2011); Rydex Advisors, LLC (f/k/a PADCO Advisors, Inc.) and Rydex Advisors II, LLC (f/k/a PADCO Advisors II, Inc.), Senior Vice President and Secretary (2010-2011); Brecek and Young Advisors, Inc., Director (2004-2008) | |
Joseph M. Arruda* Assistant Treasurer (1966) | Current: Assistant Treasurer, SBL Fund, Security Equity Fund, Security Income Fund, Security Large Cap Value Fund, and Security Mid Cap Growth Fund; Vice President, Security Investors, LLC; Chief Financial Officer and Manager, Rydex Specialized Products, LLC
Previous: Security Global Investors, LLC, Vice President (2010-2011); Rydex Advisors, LLC (f/k/a PADCO Advisors, Inc.) and Rydex Advisors II, LLC (f/k/a PADCO Advisors II, Inc.), Vice President (2004-2011) | |
| * | Officers of the Funds are deemed to be “interested persons” of the Trust, within the meaning of Section 2(a) (19) of the 1940 Act, inasmuch as this person is affiliated with Security Investors. |
THE GUGGENHEIM FUNDSANNUALREPORT | 39
GUGGENHEIM INVESTMENTS PRIVACY POLICIES
Rydex Funds, Guggenheim Funds, Rydex Investments, Rydex Distributors, Inc., Security Investors, LLC, Security Distributors, Inc. and Rydex Advisory Services (Collectively “Guggenheim Investments”)
Our Commitment to You
When you become a Guggenheim Investments investor, you entrust us with not only your hard-earned money but also with personal and financial information about you. We recognize that your relationship with us is based on trust and that you expect us to act responsibly and in your best interests. Because we have access to this private information about you, we hold ourselves to the highest standards in its safekeeping and use. This means, most importantly, that we do not sell client information to anyone—whether it is your personal information or if you are a current or former Guggenheim Investments client.
The Information We Collect About You
In the course of doing business with shareholders and investors, we collect nonpublic personal information about you. You typically provide personal information when you complete a Guggenheim Investments account application or when you request a transaction that involves Rydex and Guggenheim Investments funds or one of the Guggenheim Investments affiliated companies. “Nonpublic personal information” is personally identifiable private information about you. For example, it includes information regarding your name and address, Social Security or taxpayer identification number, assets, income, account balance, bank account information and investment activity (e.g., purchase and redemption history).
How We Handle Your Personal Information
As emphasized above, we do not sell information about current or former clients or their accounts to third parties. Nor do we share such information, except when necessary to complete transactions at your request or to make you aware of related investment products and services that we offer. Additional details about how we handle your personal information are provided below. To complete certain transactions or account changes that you direct, it may be necessary to provide identifying information to companies, individuals or groups that are not affiliated with Guggenheim Investments. For example, if you ask to transfer assets from another financial institution to Guggenheim Investments, we will need to provide certain information about you to that company to complete the transaction. To alert you to other Guggenheim Investments investment products and services, we may share your information within the Guggenheim Investments family of affiliated companies. This would include, for example, sharing your information within Guggenheim Investments so we can make you aware of new Rydex and Guggenheim Investments funds or the services offered through another Guggenheim Investments affiliated company. In certain instances, we may contract with nonaffiliated companies to perform services for us. Where necessary, we will disclose information we have about you to these third parties. In all such cases, we provide the third party with only the information necessary to carry out its assigned responsibilities and only for that purpose. And we require these third parties to treat your private information with the same high degree of confidentiality that we do. In certain instances, we may share information with other financial institutions regarding individuals and entities in response to the U.S.A. Patriot Act. Finally, we will release information about you if you direct us to do so, if we are compelled by law to do so or in other circumstances permitted by law.
Opt Out Provisions
We do not sell your personal information to anyone. The law allows you to “opt out” of only certain kinds of information sharing with third parties. The firm does not share personal information about you with any third parties that triggers this opt-out right. This means YOU ARE ALREADY OPTED OUT.
How We Protect Privacy Online
Our concern for the privacy of our shareholders also extends to those who use our web site, www.rydex-sgi.com. Our web site uses some of the most secure forms of online communication available, including encryption technology, Secure Socket Layer (SSL) protocol, firewalls and user names and passwords. These technologies provide a high level of security and privacy when you access your account information or initiate online transactions. The Guggenheim Investments web site offers customized features that require our use of “http cookies”—tiny pieces of information that we ask your browser to store. However, we make very limited use of these cookies. We only use cookies for session management and security features on the Guggenheim Investments web site. We do not use them to pull data from your hard drive, to learn your email address, or to view data in cookies created by other web sites. We will not share the information in our cookies or give others access to it. See the legal information area on our web site for more details about web site security and privacy features.
How We Safeguard Your Personal Information
We restrict access to nonpublic personal information about shareholders to our employees and in some cases to third parties (for example, the service providers described above) as permitted by law. We maintain strict physical, electronic and procedural safeguards that comply with federal standards to guard your nonpublic personal information.
We’ll Keep You Informed
As required by federal law, we will notify shareholders of our privacy policy annually. We reserve the right to modify this policy at any time, but rest assured that if we do change it, we will tell you promptly. You will also be able to access our privacy policy from our web site at www.rydex-sgi.com. Should you have any questions regarding our privacy policy, contact us at 800.820.0888 or 301.296.5100.
40 | THE GUGGENHEIM FUNDSANNUALREPORT
This page intentionally left blank.
This page intentionally left blank.
This page intentionally left blank.
This page intentionally left blank.
This page intentionally left blank.

805 King Farm Boulevard, Suite 600
Rockville, MD 20850
www.rydex-sgi.com
800.820.0888
RVAAO-2-1211x1212
GUGGENHEIM ALTERNATIVES FUNDS
GUGGENHEIM U.S. LONG SHORT MOMENTUM FUND
GUGGENHEIM ALTERNATIVE STRATEGIES ALLOCATION FUND
GUGGENHEIM MANAGED FUTURES STRATEGY FUND
GUGGENHEIM MULTI-HEDGE STRATEGIES FUND
RYDEX SPECIALTY FUND
RYDEX COMMODITIES STRATEGY FUND
This report and the financial statements contained herein are submitted for the general information of our shareholders. The report is not authorized for distribution to prospective investors unless preceded or accompanied by an effective prospectus.
Distributed by Rydex Distributors, LLC.
| 2 | ||||
| 4 | ||||
| 6 | ||||
| 14 | ||||
| 20 | ||||
| 28 | ||||
| 44 | ||||
| 50 | ||||
| 61 | ||||
| 62 | ||||
| 66 | ||||
| 70 | ||||
THE GUGGENHEIM FUNDSANNUALREPORT | 1
To Our Shareholders:
Financial markets endured a lot of turbulence in 2011, due to a variety of events: concerns about debt in the eurozone and in the U.S., which lost its triple-A credit rating, a tsunami-induced Japanese nuclear-plant disaster that disrupted automobile production around the globe, Mideast social unrest that led to a jump in oil prices and weak growth in many of the world’s developed economies. Reflecting the volatility in the stock market was the S&P 500 Index*, which finished the year up about 2%, but only after an 8% rise in the first few months of 2011, then a bearish 19% drop by early October, followed by a 12% fourth-quarter rebound spurred by improved economic data.
The U.S. Federal Reserve was a major factor in the markets for most of 2011, from its winding down of a second asset-purchase program (quantitative easing) in June to August’s “operation twist,” which shifted $400 billion in holdings from short-term to long-term Treasuries. The Fed said it would keep short-term interest rates near zero at least until mid-2013, and late in the year, some analysts were speculating that a third round of quantitative easing might be needed in 2012 to boost subpar growth.
While late-year improvements in economic measures may have dampened concern that the U.S. could slip back into recession, Europe’s recession fears were rising, as high unemployment and austerity measures weighed on weaker members of the euro zone, and threatened the economic engines of Germany and France. The Stoxx Europe 600 Index* was down about 11% for the year, with most individual country indices posting declines in double digits. Many investors continued to brace for a solution to Greece’s debt situation that would prevent financial problems from spreading to other weak countries or to banks, and stabilize the sliding euro, the year’s worst-performing major currency.
Even though they were not at the eye of the sovereign debt storm, many emerging market economies performed poorly in 2011, with those having the strongest links to the eurozone suffering the most. The MSCI Emerging Markets Index* was off by almost 20%, despite pockets of growth. China is facing slowing industrial production, sliding property values and the potential for a hard landing of the economy if housing and banks collapse.
While the market forces play out, many investors have been driven to the sidelines or to safe havens. Gold reached a record high of near $1,900 an ounce in August amid the U.S. debt downgrade, but then lost ground to the rising dollar amid continuing debate over Europe’s debt woes. Still, gold added 10% for the year, while the dollar ended the year within about 3% from where it began against the currencies of most major markets, including the euro, the pound, Canadian dollar and Swiss franc.
Sluggish economic data, concern over European financial weakness and the Fed’s policy efforts also drove investors into U.S. government debt over the course of 2011, despite the country’s lowered credit rating. The 30% total return of the Barclays Capital Long U.S. Treasury Index* made it one of the best-performing of the year, and it gave a lift to indices for corporate bonds, high yield bonds and municipals, which all grew by mid-to-high single digits.
The U.S. economy had momentum heading into 2012, as data showed the world’s largest economy to be maintaining a sustainable, if modest, expansion. Consumer confidence was improving, employment rising and monetary policy remained accommodative. We finished 2011 on a positive note, especially when compared to other countries, and so far continue to be insulated from the worst aspects of the economic troubles in Europe and China.
| 2 | THE GUGGENHEIM FUNDSANNUALREPORT |
LETTER TO OUR SHAREHOLDERS (concluded)
We look forward to continuing our service to you. Thank you for investing in our funds.
Sincerely, |
|
| Michael Byrum |
| President and Chief Investment Officer |

| * | S&P 500® Index is a capitalization-weighted index covering 500 industrial, utility, transportation and financial companies of the U.S. markets (mostly NYSE Euronext issues). |
| * | The STOXX Europe 600 Index is derived from the STOXX Europe Total Market Index (TMI) and is a subset of the STOXX Global 1800 Index. With a fixed number of 600 components, the STOXX Europe 600 Index represents large-, mid- and small-capitalization companies across 18 countries of the European region: Austria, Belgium, Denmark, Finland, France, Germany, Greece, Iceland, Ireland, Italy, Luxembourg, the Netherlands, Norway, Portugal, Spain, Sweden, Switzerland and the United Kingdom. |
| * | The Barclays Capital Long U.S. Treasury Index includes all publicly issued U.S. Treasury securities that have a remaining maturity of 10 or more years, are rated investment grade, and have $250 million or more of outstanding face value. In addition, the securities must be denominated in U.S. dollars and must be fixed rate and non convertible. Excluded from the Long U.S. Treasury Index are certain special issues, such as flower bonds, TINs, state and local government series bonds, TIPS, and coupon issues that have been stripped from bonds included in the index. The Long U.S. Treasury Index is market capitalization weighted and the securities in the index are updated on the last business day of each month. |
| * | MSCI Emerging Markets Index is a free float-adjusted market capitalization index that is designed to measure equity market performance in the global emerging markets. |
Performance displayed represents past performance which is no guarantee of future results. Of course, fund performance is subject to daily market volatility and may be better or worse since the end of the last quarter. For up-to-date fund performance, call us at 800.820.0888 or visit www.rydex-sgi.com.
Read each fund’s prospectus and summary prospectus (if available) carefully before investing. It contains the fund’s investment objectives, risks, charges, expenses and other information, which should be considered carefully before investing. Obtain a prospectus and summary prospectus (if available) at www.rydex-sgi.com or call 800.820.0888.
The referenced fund(s) are distributed by Rydex Distributors, LLC (RDL). Guggenheim Investments represents the investment management businesses of Guggenheim Partners, LLC which includes Security Investors, LLC (d.b.a., Security Global Investors and Rydex Investments), the investment advisor to the referenced funds. Rydex Distributors, LLC is affiliated with Guggenheim Partners, LLC and Security Investors, LLC.
THE GUGGENHEIM FUNDSANNUALREPORT | 3
ABOUT SHAREHOLDERS’ FUND EXPENSES (Unaudited)
All mutual funds have operating expenses and it is important for our shareholders to understand the impact of costs on their investments. Shareholders of a Fund incur two types of costs: (i) transaction costs, including sales charges (loads) on purchase payments, reinvested dividends, or other distributions; and exchange fees; and (ii) ongoing costs, including management fees, administrative services, and shareholder reports, among others. These ongoing costs, or operating expenses, are deducted from a fund’s gross income and reduce the investment return of the fund.
A fund’s expenses are expressed as a percentage of its average net assets, which is known as the expense ratio. The following examples are intended to help investors understand the ongoing costs (in dollars) of investing in a Fund and to compare these costs with the ongoing costs of investing in other mutual funds.
The examples are based on an investment of $1,000 made at the beginning of the period and held for the entire six-month period beginning June 30, 2011 and ending December 31, 2011.
The following tables illustrate a Fund’s costs in two ways:
Table 1. Based on actual Fund return. This section helps investors estimate the actual expenses paid over the period. The “Ending Account Value” shown is derived from the Fund’s actual return, and the fourth column shows the dollar amount that would have been paid by an investor who started with $1,000 in the Fund. Investors may use the information here, together with the amount invested, to estimate the expenses paid over the period. Simply divide the Fund’s account value by $1,000 (for example, an $8,600 account value divided by $1,000 = 8.6), then multiply the result by the number provided under the heading “Expenses Paid During Period.”
Table 2. Based on hypothetical 5% return. This section is intended to help investors compare a Fund’s cost with those of other mutual funds. The table provides information about hypothetical account values and hypothetical expenses based on the Fund’s actual expense ratio and an assumed rate of return of 5% per year before expenses, which is not the Fund’s actual return. The hypothetical account values and expenses may not be used to estimate the actual ending account balance or expenses paid during the period. The example is useful in making comparisons because the U.S. Securities and Exchange Commission (the “SEC”) requires all mutual funds to calculate expenses based on the 5% return. Investors can assess a Fund’s costs by comparing this hypothetical example with the hypothetical examples that appear in shareholder reports of other funds.
The calculations illustrated above assume no shares were bought or sold during the period. Actual costs may have been higher or lower, depending on the amount of investment and the timing of any purchases or redemptions.
Please note that the expenses shown in the table are meant to highlight your ongoing costs only and do not reflect any transactional costs, such as sales charges (loads) on purchase payments, and contingent deferred sales charges (“CDSC”) on redemptions, if any. Therefore, the second table is useful in comparing ongoing costs only, and will not help you determine the relative total costs of owning different funds. In addition, if these transactional costs were included, your costs would have been higher.
More information about a Fund’s expenses, including annual expense ratios for the past five years, can be found in the Financial Highlights section of this report. For additional information on operating expenses and other shareholder costs, please refer to the appropriate Fund prospectus.
| 4 | THE GUGGENHEIM FUNDSANNUALREPORT |
ABOUT SHAREHOLDERS’ FUND EXPENSES (Unaudited) (concluded)
| Expense Ratio1,4 | Fund Return | Beginning Account Value June 30, 2011 | Ending Account Value December 31, 2011 | Expenses Paid During Period2 | ||||||||||||||||
Table 1. Based on actual Fund return3 | ||||||||||||||||||||
U.S. Long Short Momentum Fund | 1.72 | % | (11.47 | %) | $ | 1,000.00 | $ | 885.30 | $ | 8.17 | ||||||||||
Alternative Strategies Allocation Fund | 0.00 | % | (3.22 | %) | 1,000.00 | 967.80 | — | |||||||||||||
Managed Futures Strategy Fund | 2.09 | % | (7.30 | %) | 1,000.00 | 927.00 | 10.15 | |||||||||||||
Multi-Hedge Strategies Fund 5/8 | 2.37 | % | 1.24 | % | 1,000.00 | 1,012.40 | 12.02 | |||||||||||||
Commodities Strategy Fund | 1.57 | % | (6.37 | %) | 1,000.00 | 936.30 | 7.66 | |||||||||||||
Table 2. Based on hypothetical 5% return (before expenses) | ||||||||||||||||||||
U.S. Long Short Momentum Fund | 1.72 | % | 5.00 | % | $ | 1,000.00 | $ | 1,016.53 | $ | 8.74 | ||||||||||
Alternative Strategies Allocation Fund | 0.00 | % | 5.00 | % | 1,000.00 | 1,025.21 | — | |||||||||||||
Managed Futures Strategy Fund | 2.09 | % | 5.00 | % | 1,000.00 | 1,014.67 | 10.61 | |||||||||||||
Multi-Hedge Strategies Fund | 2.37 | % | 5.00 | % | 1,000.00 | 1,013.26 | 12.03 | |||||||||||||
Commodities Strategy Fund | 1.57 | % | 5.00 | % | 1,000.00 | 1,017.29 | 7.98 | |||||||||||||
| 1 | Annualized and excludes expenses of the underlying funds in which the Funds invest. |
| 2 | Expenses are equal to the Fund's annualized expense ratio, net of any applicable fee waivers, multiplied by the average account value over the period, multiplied by 184/365 (to reflect the one-half year period). Expenses shown do not include fees charged by insurance companies. |
| 3 | Actual cumulative return at net asset value for the period June 30, 2011 to December 31, 2011. |
| 4 | This ratio represents annualized net expense which includes dividend and interest expense related to securities sold short. Excluding short dividend expense and prime broker interest expense, the operating expense ratio would be 1.21% lower in the Multi-Hedge Strategies Fund. |
THE GUGGENHEIM FUNDSANNUALREPORT | 5
| PERFORMANCE REPORT AND FUND PROFILE (Unaudited) | December 31, 2011 |
U.S. LONG SHORT MOMENTUM FUND
OBJECTIVE: Seeks long-term capital appreciation.
For the year ended December 31, 2011, the Fund returned -6.56% as opposed to its benchmark, the Russell 3000® Index*, which rose 1.03%. The performance differential for the Fund can be attributed to three major sources of relative returns: core momentum strategy, defensive hedge and transaction costs/fees.
Momentum strategies performed in line with equity markets for much of the year. October was the stand-out exception as the market experienced a strong counter-trend rally. For the full calendar year, the Fund’s core momentum model trailed the Russell 3000 Index by -3.6%. October alone accounted for benchmark relative performance of -4.3%. We saw negative performance for momentum strategies from both intermediate (3-months) and long-term (12-months) models in 2011. This behavior was distinct from our 2010 experience when positive performance from the long-term model roughly offset negative performance from the intermediate model.
The defensive hedging model served the role of dampening fund volatility but also suffered from October’s strong counter-trend rally. After being up on the year through the third quarter, the defensive hedge surrendered -3.3% of fund performance in October. For the year, the defensive hedge cost the fund -2.0%. The hedge resulted in a reduction of annualized fund volatility to 12.9% versus 15.6% for the core model and 16.0% for the S&P 500 Index*.
For the year, transaction costs, which are estimated at 48bps, were relatively low given the turnover level of the momentum strategy, which approximated 96% per side in 2011. Combined with management fees, these operational costs reduced Fund performance
by -2.2% versus the Russell 3000 Index benchmark.
Within the core momentum model, large overweight positions of Trading Companies & Distributors and Tobacco industries contributed positively to benchmark relative return, with the two industry allocations generating alpha of 1.6% and 1.4%, respectively. A large underweight of the Diversified Financial Service industry also contributed positively to benchmark relative return, producing 1.2% of alpha for the Fund. The three biggest detractors from Fund performance were overweight positions in the Healthcare Technology, Energy Equipment & Services, and Auto Component industries. These allocations cost the Fund -1.6%,
-1.4%, and -1.3% of relative return, respectively.
Derivatives in the Fund are used for various purposes, including hedging and for speculation.
| * | Russell 3000® Index measures the performance of the largest 3000 U.S. companies, representing approximately 98% of the investable U.S. equity market. |
| * | Standard & Poor’s 500 Index (S&P 500®) — a capitalization-weighted index covering 500 industrial, utility, transportation and financial companies of the U.S. markets (mostly NYSE Euronext issues). |
Performance displayed represents past performance which is no guarantee of future results.
Holdings Diversification (Market Exposure as % of Net Assets)
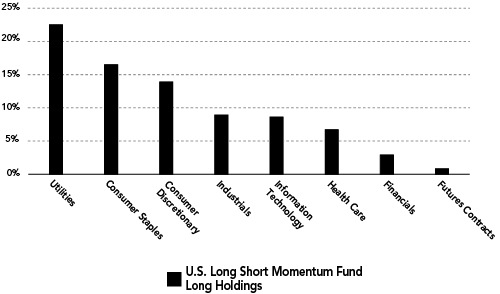
“Holdings Diversification (Market Exposure as % of Net Assets)” excludes any temporary cash investments.
Inception Date: May 1, 2002
Ten Largest Holdings | ||||
Philip Morris International, Inc. | 3.6 | % | ||
Altria Group, Inc. | 2.4 | % | ||
International Business Machines Corp. | 1.8 | % | ||
NIKE, Inc. — Class B | 1.7 | % | ||
Cerner Corp. | 1.6 | % | ||
Reynolds American, Inc. | 1.5 | % | ||
WW Grainger, Inc. | 1.3 | % | ||
Fastenal Co. | 1.3 | % | ||
Lorillard, Inc. | 1.2 | % | ||
Coach, Inc. | 1.1 | % | ||
|
| |||
Top Ten Total | 17.5 | % | ||
|
| |||
“Ten Largest Holdings” exclude any temporary cash or derivative investments.
6 | THE GUGGENHEIM FUNDSANNUALREPORT
PERFORMANCE REPORT AND FUND PROFILE (Unaudited) (concluded)
U.S. LONG SHORT MOMENTUM FUND
Cumulative Fund Performance*
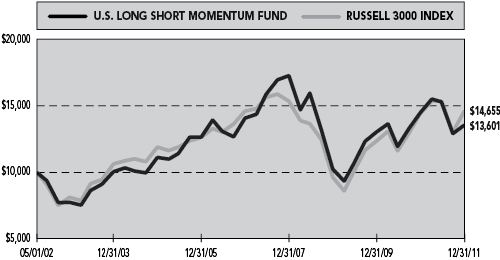
Average Annual Returns*
Periods Ended 12/31/11
| 1 Year | 5 Year | Since Inception (05/01/02) | ||||||||||
U.S. Long Short Momentum Fund | -6.56 | % | -0.77 | % | 3.23 | % | ||||||
Russell 3000 Index | 1.03 | % | -0.01 | % | 4.03 | % | ||||||
| * | The performance data represents past performance that is not predictive of future results. The investment return and principal value of an investment in the Fund will fluctuate so that an investor’s shares, when redeemed, may be worth more or less than their original cost. Returns are historical and include changes in principal and reinvested dividends and capital gains and do not reflect the effect of taxes. The Russell 3000 Index is an unmanaged index and, unlike the Fund, has no management fees or operating expenses to reduce its reported return. Returns do not reflect the impact of any additional fees charged by insurance companies. |
THE GUGGENHEIM FUNDSANNUALREPORT | 7
| SCHEDULE OF INVESTMENTS | December 31, 2011 |
U.S. LONG SHORT MOMENTUM FUND
| SHARES | VALUE | |||||||
COMMON STOCKS† - 79.9% |
| |||||||
UTILITIES - 22.5% |
| |||||||
Southern Co. | 8,371 | $ | 387,494 | |||||
Dominion Resources, Inc. | 7,281 | 386,475 | ||||||
Duke Energy Corp. | 15,256 | 335,632 | ||||||
ONEOK, Inc. | 3,742 | 324,394 | ||||||
Exelon Corp. | 7,259 | 314,823 | ||||||
NextEra Energy, Inc. | 5,124 | 311,949 | ||||||
Consolidated Edison, Inc. | 4,927 | 305,622 | ||||||
AGL Resources, Inc. | 6,652 | 281,114 | ||||||
Public Service Enterprise Group, Inc. | 8,364 | 276,096 | ||||||
PG&E Corp. | 6,622 | 272,959 | ||||||
American Electric Power Company, Inc. | 6,570 | 271,407 | ||||||
Xcel Energy, Inc. | 9,594 | 265,178 | ||||||
Sempra Energy | 4,734 | 260,370 | ||||||
Progress Energy, Inc. | 4,456 | 249,625 | ||||||
FirstEnergy Corp. | 5,623 | 249,099 | ||||||
PPL Corp. | 8,258 | 242,950 | ||||||
Edison International | 5,401 | 223,601 | ||||||
DTE Energy Co. | 4,017 | 218,726 | ||||||
Entergy Corp. | 2,994 | 218,712 | ||||||
Wisconsin Energy Corp. | 5,953 | 208,117 | ||||||
CenterPoint Energy, Inc. | 10,181 | 204,536 | ||||||
National Fuel Gas Co. | 3,656 | 203,200 | ||||||
Ameren Corp. | 6,095 | 201,927 | ||||||
Questar Corp. | 9,474 | 188,154 | ||||||
NiSource, Inc. | 7,810 | 185,956 | ||||||
UGI Corp. | 6,083 | 178,840 | ||||||
OGE Energy Corp. | 3,095 | 175,517 | ||||||
SCANA Corp. | 3,863 | 174,067 | ||||||
CMS Energy Corp. | 7,777 | 171,716 | ||||||
Atmos Energy Corp. | 5,092 | 169,818 | ||||||
Piedmont Natural Gas Company, Inc. | 4,750 | 161,405 | ||||||
NSTAR | 3,267 | 153,418 | ||||||
WGL Holdings, Inc. | 3,466 | 153,267 | ||||||
Northeast Utilities | 4,175 | 150,592 | ||||||
Southwest Gas Corp. | 3,454 | 146,760 | ||||||
New Jersey Resources Corp. | 2,882 | 141,794 | ||||||
Pinnacle West Capital Corp. | 2,913 | 140,348 | ||||||
South Jersey Industries, Inc. | 2,370 | 134,640 | ||||||
Pepco Holdings, Inc. | 6,366 | 129,230 | ||||||
ITC Holdings Corp. | 1,519 | 115,262 | ||||||
Northwest Natural Gas Co. | 2,370 | 113,594 | ||||||
|
| |||||||
Total Utilities | 8,998,384 | |||||||
|
| |||||||
CONSUMER STAPLES - 16.5% |
| |||||||
Philip Morris International, Inc. | 18,220 | 1,429,906 | ||||||
Altria Group, Inc. | 32,557 | 965,315 | ||||||
Reynolds American, Inc. | 14,917 | 617,862 | ||||||
Lorillard, Inc. | 4,226 | 481,764 | ||||||
Kraft Foods, Inc. — Class A | 10,260 | 383,314 | ||||||
Unilever N.V. | 10,550 | 362,603 | ||||||
General Mills, Inc. | 5,780 | 233,570 | ||||||
HJ Heinz Co. | 3,570 | 192,923 | ||||||
Archer-Daniels-Midland Co. | 6,450 | 184,470 | ||||||
Kellogg Co. | 3,640 | 184,075 | ||||||
Mead Johnson Nutrition Co. — Class A | 2,540 | 174,574 | ||||||
Hershey Co. | 2,520 | 155,686 | ||||||
ConAgra Foods, Inc. | 5,810 | 153,384 | ||||||
Sara Lee Corp. | 7,950 | 150,414 | ||||||
Campbell Soup Co. | 4,370 | 145,259 | ||||||
JM Smucker Co. | 1,780 | 139,143 | ||||||
Vector Group Ltd. | 7,774 | 138,066 | ||||||
Universal Corp. | 2,824 | 129,791 | ||||||
Hormel Foods Corp. | 4,320 | 126,533 | ||||||
Bunge Ltd. | 2,040 | 116,688 | ||||||
Green Mountain Coffee Roasters, Inc.* | 2,060 | 92,391 | ||||||
Star Scientific, Inc.* | 23,049 | 50,247 | ||||||
|
| |||||||
Total Consumer Staples | 6,607,978 | |||||||
|
| |||||||
CONSUMER DISCRETIONARY - 13.9% |
| |||||||
NIKE, Inc. — Class B | 6,929 | 667,748 | ||||||
Coach, Inc. | 7,276 | 444,127 | ||||||
VF Corp. | 3,274 | 415,765 | ||||||
Ralph Lauren Corp. | 2,298 | 317,308 | ||||||
PVH Corp. | 3,309 | 233,251 | ||||||
Home Depot, Inc. | 4,672 | 196,411 | ||||||
Fossil, Inc.* | 2,451 | 194,511 | ||||||
Carter’s, Inc.* | 4,481 | 178,389 | ||||||
Under Armour, Inc. — Class A* | 2,483 | 178,255 | ||||||
Deckers Outdoor Corp.* | 2,098 | 158,546 | ||||||
Warnaco Group, Inc.* | 3,089 | 154,574 | ||||||
Wolverine World Wide, Inc. | 3,880 | 138,283 | ||||||
Lowe’s Companies, Inc. | 5,438 | 138,016 | ||||||
Hanesbrands, Inc.* | 6,078 | 132,865 | ||||||
Target Corp. | 2,456 | 125,796 | ||||||
Columbia Sportswear Co. | 2,701 | 125,732 | ||||||
TJX Companies, Inc. | 1,784 | 115,157 | ||||||
Iconix Brand Group, Inc.* | 5,991 | 97,593 | ||||||
Dollar General Corp.* | 2,008 | 82,609 | ||||||
Crocs, Inc.* | 5,582 | 82,446 | ||||||
Bed Bath & Beyond, Inc.* | 1,416 | 82,086 | ||||||
Macy’s, Inc. | 2,537 | 81,641 | ||||||
AutoZone, Inc.* | 249 | 80,918 | ||||||
Ross Stores, Inc. | 1,620 | 76,999 | ||||||
Limited Brands, Inc. | 1,890 | 76,261 | ||||||
Kohl’s Corp. | 1,505 | 74,272 | ||||||
O’Reilly Automotive, Inc.* | 926 | 74,034 | ||||||
Dollar Tree, Inc.* | 849 | 70,560 | ||||||
Nordstrom, Inc. | 1,400 | 69,594 | ||||||
Staples, Inc. | 4,952 | 68,783 | ||||||
The Gap, Inc. | 3,634 | 67,411 | ||||||
CarMax, Inc.* | 2,015 | 61,417 | ||||||
JC Penney Company, Inc. | 1,734 | 60,950 | ||||||
Tiffany & Co. | 918 | 60,827 | ||||||
Best Buy Company, Inc. | 2,596 | 60,669 | ||||||
| 8 | THE GUGGENHEIM FUNDSANNUALREPORT | See Notes to Financial Statements. |
| SCHEDULE OF INVESTMENTS (continued) | December 31, 2011 |
U.S. LONG SHORT MOMENTUM FUND
| SHARES | VALUE | |||||||
PetSmart, Inc. | 1,100 | $ | 56,419 | |||||
Family Dollar Stores, Inc. | 955 | 55,065 | ||||||
AutoNation, Inc.* | 1,390 | 51,249 | ||||||
Big Lots, Inc.* | 862 | 32,549 | ||||||
Dillard’s, Inc. — Class A | 642 | 28,813 | ||||||
99 Cents Only Stores* | 1,225 | 26,889 | ||||||
Saks, Inc.* | 2,658 | 25,915 | ||||||
Sears Holdings Corp.* | 815 | 25,901 | ||||||
Fred’s, Inc. — Class A | 1,220 | 17,788 | ||||||
Orchard Supply Hardware Stores Corp. — Class A*,3,††† | 37 | 277 | ||||||
|
| |||||||
Total Consumer Discretionary | 5,564,669 | |||||||
|
| |||||||
INDUSTRIALS - 8.9% |
| |||||||
WW Grainger, Inc. | 2,884 | 539,856 | ||||||
Fastenal Co. | 12,360 | 539,020 | ||||||
MSC Industrial Direct Co., Inc. — Class A | 3,767 | 269,529 | ||||||
RSC Holdings, Inc.* | 14,184 | 262,404 | ||||||
Air Lease Corp. — Class A* | 9,277 | 219,958 | ||||||
WESCO International, Inc.* | 4,141 | 219,514 | ||||||
United Rentals, Inc.* | 7,245 | 214,090 | ||||||
GATX Corp. | 4,901 | 213,978 | ||||||
Watsco, Inc. | 3,012 | 197,768 | ||||||
Applied Industrial Technologies, Inc. | 4,998 | 175,780 | ||||||
Textainer Group Holdings Ltd. | 5,961 | 173,584 | ||||||
TAL International Group, Inc. | 5,071 | 145,994 | ||||||
Beacon Roofing Supply, Inc.* | 7,014 | 141,893 | ||||||
Aircastle Ltd. | 11,151 | 141,841 | ||||||
Kaman Corp. | 3,867 | 105,646 | ||||||
|
| |||||||
Total Industrials | 3,560,855 | |||||||
|
| |||||||
INFORMATION TECHNOLOGY - 8.5% |
| |||||||
International Business Machines Corp. | 3,926 | 721,913 | ||||||
Visa, Inc. — Class A | 3,689 | 374,544 | ||||||
Mastercard, Inc. — Class A | 900 | 335,538 | ||||||
Accenture plc — Class A | 5,079 | 270,355 | ||||||
Automatic Data Processing, Inc. | 4,782 | 258,276 | ||||||
Infosys Ltd. ADR | 4,797 | 246,470 | ||||||
Cognizant Technology Solutions Corp. — Class A* | 3,212 | 206,564 | ||||||
Western Union Co. | 9,111 | 166,367 | ||||||
Paychex, Inc. | 5,443 | 163,889 | ||||||
Fiserv, Inc.* | 2,402 | 141,093 | ||||||
Fidelity National Information Services, Inc. | 4,945 | 131,488 | ||||||
Teradata Corp.* | 2,605 | 126,369 | ||||||
Amdocs Ltd.* | 3,820 | 108,985 | ||||||
SAIC, Inc.* | 7,370 | 90,577 | ||||||
Computer Sciences Corp. | 3,297 | 78,139 | ||||||
|
| |||||||
Total Information Technology | 3,420,567 | |||||||
|
| |||||||
HEALTH CARE - 6.7% |
| |||||||
Cerner Corp.* | 10,138 | 620,952 | ||||||
SXC Health Solutions Corp.* | 7,186 | 405,865 | ||||||
Allscripts Healthcare Solutions, Inc.* | 20,976 | 397,285 | ||||||
Quality Systems, Inc. | 7,294 | 269,805 | ||||||
athenahealth, Inc.* | 4,965 | 243,881 | ||||||
Medidata Solutions, Inc.* | 8,151 | 177,284 | ||||||
Omnicell, Inc.* | 10,198 | 168,471 | ||||||
MedAssets, Inc.* | 15,704 | 145,262 | ||||||
Computer Programs & Systems, Inc. | 2,664 | 136,157 | ||||||
Merge Healthcare, Inc.* | 24,711 | 119,848 | ||||||
|
| |||||||
Total Health Care | 2,684,810 | |||||||
|
| |||||||
FINANCIALS - 2.9% | ||||||||
American Express Co. | 6,769 | 319,294 | ||||||
Capital One Financial Corp. | 4,394 | 185,822 | ||||||
Discover Financial Services | 6,688 | 160,512 | ||||||
SLM Corp. | 8,521 | 114,181 | ||||||
Credit Acceptance Corp.* | 832 | 68,457 | ||||||
Ezcorp, Inc. — Class A* | 1,840 | 48,521 | ||||||
Cash America International, Inc. | 1,027 | 47,889 | ||||||
World Acceptance Corp.* | 647 | 47,554 | ||||||
Nelnet, Inc. — Class A | 1,828 | 44,731 | ||||||
First Cash Financial Services, Inc.* | 1,181 | 41,441 | ||||||
Green Dot Corp. — Class A* | 1,274 | 39,774 | ||||||
Advance America Cash Advance Centers, Inc. | 3,638 | 32,560 | ||||||
|
| |||||||
Total Financials | 1,150,736 | |||||||
|
| |||||||
Total Common Stocks | 31,987,999 | |||||||
|
| |||||||
PREFERRED STOCKS††† - 0.0% |
| |||||||
Orchard Supply Hardware2,3 | 37 | — | ||||||
|
| |||||||
Total Preferred Stocks | — | |||||||
|
| |||||||
| FACE AMOUNT | ||||||||
REPURCHASE AGREEMENT††,1 - 19.8% |
| |||||||
Credit Suisse Group | ||||||||
issued 12/30/11 at 0.00% due 01/03/12 | $ | 7,918,458 | 7,918,458 | |||||
|
| |||||||
Total Repurchase Agreement | 7,918,458 | |||||||
|
| |||||||
Total Investments - 99.7% | $ | 39,906,457 | ||||||
|
| |||||||
Cash & Other Assets, Less Liabilities - 0.3% | 130,748 | |||||||
|
| |||||||
Total Net Assets - 100.0% | $ | 40,037,205 | ||||||
| See Notes to Financial Statements. | THE GUGGENHEIM FUNDSANNUALREPORT | 9 |
| SCHEDULE OF INVESTMENTS (concluded) | December 31, 2011 |
U.S. LONG SHORT MOMENTUM FUND
| CONTRACTS | UNREALIZED LOSS | |||||||
FUTURES CONTRACTS PURCHASED† |
| |||||||
March 2012 S&P 500 Index Mini |
| |||||||
Futures Contracts | ||||||||
(Aggregate Value of Contracts $312,875) | 5 | $ | (168 | ) | ||||
|
| |||||||
| * | Non-income producing security. |
| † | Value determined based on Level 1 inputs, except as noted — See Note 4. |
| †† | Value determined based on Level 2 inputs — See Note 4. |
| ††† | Value determined based on Level 3 inputs — See Note 4. |
| 1 | Repurchase Agreement — See Note 5. |
| 2 | Perpetual Maturity. |
| 3 | Illiquid security. |
ADR — American Depositary Receipt
plc — Public Limited Company
| 10 | THE GUGGENHEIM FUNDSANNUALREPORT | See Notes to Financial Statements. |
U.S. LONG SHORT MOMENTUM FUND
STATEMENT OF ASSETS AND LIABILITIES
December 31, 2011
ASSETS: |
| |||
Investments, at value | $ | 31,987,999 | ||
Repurchase agreements, at value | 7,918,458 | |||
|
| |||
Total investments | 39,906,457 | |||
Segregated cash with broker | 216,000 | |||
Receivables: | ||||
Dividends | 80,986 | |||
Variation margin | 13,949 | |||
Fund shares sold | 10,120 | |||
|
| |||
Total assets | 40,227,512 | |||
|
| |||
LIABILITIES: |
| |||
Overdraft due to custodian bank | 178 | |||
Payable for: | ||||
Fund shares redeemed | 59,265 | |||
Management fees | 30,547 | |||
Transfer agent and administrative fees | 8,485 | |||
Investor service fees | 8,485 | |||
Portfolio accounting fees | 3,394 | |||
Miscellaneous | 79,953 | |||
|
| |||
Total Liabilities | 190,307 | |||
|
| |||
NET ASSETS | $ | 40,037,205 | ||
|
| |||
NET ASSETS CONSISTOF: |
| |||
Paid in capital | $ | 58,766,561 | ||
Accumulated net investment loss | (16,062 | ) | ||
Accumulated net realized loss on investments | (20,120,933 | ) | ||
Net unrealized appreciation on investments | 1,407,639 | |||
|
| |||
Net assets | $ | 40,037,205 | ||
Capital shares outstanding | 3,346,879 | |||
Net asset value per share | $ | 11.96 | ||
|
| |||
STATEMENT OF OPERATIONS
Year Ended December 31, 2011
INVESTMENT INCOME: |
| |||
Dividends (net of foreign withholding tax of $4,567) | $ | 706,245 | ||
Interest | 353 | |||
|
| |||
Total investment income | 706,598 | |||
|
| |||
EXPENSES: | ||||
Management fees | 423,146 | |||
Transfer agent and administrative fees | 117,541 | |||
Investor service fees | 117,541 | |||
Portfolio accounting fees | 47,016 | |||
Custodian fees | 12,663 | |||
Trustees’ fees* | 4,803 | |||
Miscellaneous | 105,262 | |||
|
| |||
Total expenses | 827,972 | |||
|
| |||
Net investment loss | (121,374 | ) | ||
|
| |||
NET REALIZEDAND UNREALIZED GAIN (LOSS): | ||||
Net realized gain (loss) on: | ||||
Investments | 2,846,996 | |||
Futures contracts | (572,401 | ) | ||
Realized gain distributions received from investment company shares | 1,499 | |||
|
| |||
Net realized gain | 2,276,094 | |||
|
| |||
Net change in unrealized appreciation (depreciation) on: | ||||
Investments | (4,846,878 | ) | ||
Futures contracts | 54,928 | |||
|
| |||
Net change in unrealized appreciation (depreciation) | (4,791,950 | ) | ||
|
| |||
Net realized and unrealized loss | (2,515,856 | ) | ||
|
| |||
Net decrease in net assets resulting from operations | $ | (2,637,230 | ) | |
|
| |||
| * | Relates to Trustees not deemed “interested persons” within the meaning of Section 2(a)(19) of the 1940 Act. |
| See Notes to Financial Statements. | THE GUGGENHEIM FUNDSANNUALREPORT | 11 |
U.S. LONG SHORT MOMENTUM FUND
STATEMENTS OF CHANGES IN NET ASSETS
| Year Ended December 31, 2011 | Year Ended December 31, 2010 | |||||||
INCREASE (DECREASE) IN NET ASSETS FROM OPERATIONS: | ||||||||
Net investment loss | $ | (121,374 | ) | $ | (276,364 | ) | ||
Net realized gain on investments | 2,276,094 | 10,708,056 | ||||||
Net change in unrealized appreciation (depreciation) on investments | (4,791,950 | ) | (5,445,222 | ) | ||||
|
|
|
| |||||
Net increase (decrease) in net assets resulting from operations | (2,637,230 | ) | 4,986,470 | |||||
|
|
|
| |||||
CAPITAL SHARE TRANSACTIONS: | ||||||||
Proceeds from sale of shares | 8,286,523 | 26,692,398 | ||||||
Cost of shares redeemed | (21,654,946 | ) | (43,982,754 | ) | ||||
|
|
|
| |||||
Net decrease from capital share transactions | (13,368,423 | ) | (17,290,356 | ) | ||||
|
|
|
| |||||
Net decrease in net assets | (16,005,653 | ) | (12,303,886 | ) | ||||
NET ASSETS: | ||||||||
Beginning of year | 56,042,858 | 68,346,744 | ||||||
|
|
|
| |||||
End of year | $ | 40,037,205 | $ | 56,042,858 | ||||
|
|
|
| |||||
Accumulated net investment loss at end of year | $ | (16,062 | ) | $ | (16,432 | ) | ||
|
|
|
| |||||
CAPITAL SHARE ACTIVITY: | ||||||||
Shares sold | 645,364 | 2,270,757 | ||||||
Shares redeemed | (1,676,673 | ) | (3,832,859 | ) | ||||
|
|
|
| |||||
Net decrease in shares | (1,031,309 | ) | (1,562,102 | ) | ||||
|
|
|
| |||||
| 12 | THE GUGGENHEIM FUNDSANNUALREPORT | See Notes to Financial Statements. |
U.S. LONG SHORT MOMENTUM FUND
FINANCIAL HIGHLIGHTS
This table is presented to show selected data for a share outstanding throughout each period and to assist shareholders in evaluating a Fund’s performance for the periods presented.
| Year Ended December 31, 2011 | Year Ended December 31, 2010 | Year Ended December 31, 2009 | Year Ended December 31, 2008 | Year Ended December 31, 2007 | ||||||||||||||||
Per Share Data | ||||||||||||||||||||
Net asset value, beginning of period | $ | 12.80 | $ | 11.51 | $ | 9.05 | $ | 15.33 | $ | 13.47 | ||||||||||
|
|
|
|
|
|
|
|
|
| |||||||||||
Income (loss) from investment operations: | ||||||||||||||||||||
Net investment income (loss)a | (.03 | ) | (.05 | ) | (.03 | ) | .01 | (.02 | ) | |||||||||||
Net gain (loss) on investments (realized and unrealized) | (.81 | ) | 1.34 | 2.50 | (6.25 | ) | 3.10 | |||||||||||||
|
|
|
|
|
|
|
|
|
| |||||||||||
Total from investment operations | (.84 | ) | 1.29 | 2.47 | (6.24 | ) | 3.08 | |||||||||||||
|
|
|
|
|
|
|
|
|
| |||||||||||
Less distributions from: | ||||||||||||||||||||
Net investment income | — | — | (.01 | ) | — | — | ||||||||||||||
Net realized gains | — | — | — | (.04 | ) | (1.22 | ) | |||||||||||||
|
|
|
|
|
|
|
|
|
| |||||||||||
Total distributions | — | — | (.01 | ) | (.04 | ) | (1.22 | ) | ||||||||||||
|
|
|
|
|
|
|
|
|
| |||||||||||
Net asset value, end of period | $ | 11.96 | $ | 12.80 | $ | 11.51 | $ | 9.05 | $ | 15.33 | ||||||||||
|
|
|
|
|
|
|
|
|
| |||||||||||
Total Returnb | (6.56 | %) | 11.21 | % | 27.29 | % | (40.73 | %) | 22.75 | % | ||||||||||
|
|
|
|
|
|
|
|
|
| |||||||||||
Ratios/Supplemental Data | ||||||||||||||||||||
Net assets, end of period (in thousands) | $ | 40,037 | $ | 56,043 | $ | 68,347 | $ | 72,439 | $ | 130,166 | ||||||||||
|
|
|
|
|
|
|
|
|
| |||||||||||
Ratios to average net assets: | ||||||||||||||||||||
Net investment income (loss) | (0.26 | %) | (0.47 | %) | (0.33 | %) | 0.05 | % | (0.15 | %) | ||||||||||
Total expenses | 1.76 | % | 1.72 | % | 1.71 | % | 1.67 | % | 1.61 | % | ||||||||||
Operating expensesc | 1.76 | % | 1.71 | % | 1.71 | % | 1.67 | % | 1.61 | % | ||||||||||
|
|
|
|
|
|
|
|
|
| |||||||||||
Portfolio turnover rate | 167 | % | 314 | % | 379 | % | 463 | % | 277 | % | ||||||||||
| a | Net investment income (loss) per share was computed using average shares outstanding throughout the period. |
| b | Total return does not reflect the impact of any additional fees charged by insurance companies and has not been annualized. |
| c | Operating expenses exclude interest and dividend expense from securities sold short. |
| See Notes to Financial Statements. | THE GUGGENHEIM FUNDSANNUALREPORT | 13 |
| PERFORMANCE REPORT AND FUND PROFILE (Unaudited) | December 31, 2011 |
ALTERNATIVE STRATEGIES ALLOCATION FUND
OBJECTIVE: Seeks to deliver a return that has a low correlation to the returns of traditional stock and bond asset classes as well as provide capital appreciation.
The markets entered 2011 underestimating global impacts of risks and, in some cases, unexpected events. To name a few: the European debt crisis surprised the market with more problems yet few tangible solutions looming; an earthquake and tsunami occurred in Japan, with much more tragic consequences than usual; and China’s rising inflation forced its government to tighten monetary policy more strictly than expected.
The S&P 500® Index* ended 2011 close to its level at the end of 2010, yet it was one of the best-performing equity markets anywhere in the world. But there was intra-year volatility, and it once reached levels seen in early 2009. Bonds had another great year, with fixed-income investments generally rising 6.25%, and an index of long-term Treasury bonds was up almost 30%. For the past 30 years, long governments have risen 11.5% annually, compared with a 10.8% rise in the S&P 500 Index — the first time that has occurred since before the Civil War.
Our dynamically managed tactical overlay made a positive contribution to performance, but not enough to permit the portfolio to overcome the tumult in the market. For the year ended December 31, 2011, the Alternative Strategies Allocation Fund returned
-3.08%. Equities, as represented by the S&P 500® Index*, returned 2.11%. The Barclays Capital Aggregate Bond Index* rose 7.84%.
In the period, the Real Estate Fund, the Long Short Equity Strategy Fund and PowerShares DB G10 Currency Harvest Fund were the best performers. Long Short Interest Rate Strategy Fund, RVT Managed Futures Strategy Fund and Commodities Strategy Fund were the worst performers.
Derivatives in the Fund are used to provide the most efficient exposure to additional return sources, as well as to provide liquidity.
| * | Standard & Poor’s 500 Index (S&P 500®) — a capitalization-weighted index covering 500 industrial, utility, transportation and financial companies of the U.S. markets (mostly NYSE Euronext issues). |
| * | The Barclays Capital U.S. Aggregate Bond Index measures performance of the U.S. investment-grade bond market, including investment-grade U.S. government bonds, investment-grade corporate bonds, mortgage pass-through securities and asset-backed securities. |
Performance displayed represents past performance which is no guarantee of future results.
Holdings Diversification (Market Exposure as % of Net Assets)
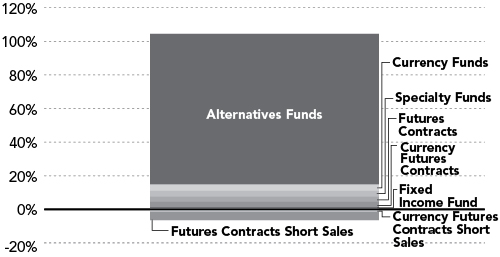
Alternative Strategies Allocation Fund
“Holdings Diversification (Market Exposure as % of Net Assets)” excludes any temporary cash investments.
Inception Date: May 1, 2008
Ten Largest Holdings (% of Total Net Assets) | ||||
RVT — Multi-Hedge Strategies Fund | 15.5 | % | ||
RSF — Event Driven and Distressed Strategies Fund — H Class | 15.4 | % | ||
RSF — Long Short Equity Strategy Fund — H Class | 13.6 | % | ||
RVT — Managed Futures Strategy Fund | 13.1 | % | ||
RSF — Long Short Interest Rate Strategy Fund — H Class | 11.1 | % | ||
RSF — Alternative Strategies Fund — H Class | 9.4 | % | ||
RSF — Long/Short Commodities Strategy Fund — H Class | 8.1 | % | ||
PowerShares DB G10 Currency Harvest Fund | 3.6 | % | ||
RVT — Commodities Strategy Fund | 3.4 | % | ||
RVT — Real Estate Fund | 3.4 | % | ||
|
| |||
Top Ten Total | 96.6 | % | ||
|
| |||
“Ten Largest Holdings” exclude any temporary cash or derivative investments.
| 14 | THE GUGGENHEIM FUNDSANNUALREPORT |
PERFORMANCE REPORT AND FUND PROFILE (Unaudited) (concluded)
ALTERNATIVE STRATEGIES ALLOCATION FUND
Cumulative Fund Performance*
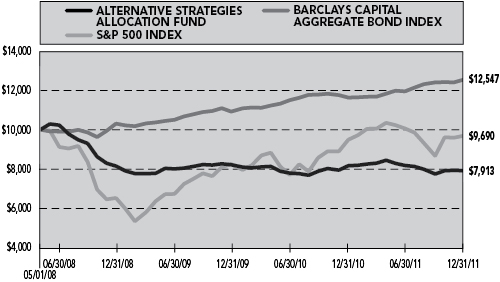
Average Annual Returns*
Periods Ended 12/31/11
| 1 Year | Since Inception (05/01/08) | |||||||
Alternative Strategies Allocation Fund | -3.08 | % | -6.18 | % | ||||
S&P 500 Index | 2.11 | % | 10.02 | % | ||||
Barclays Capital Aggregate Bond Index | 7.84 | % | 6.38 | % | ||||
| * | The performance data represents past performance that is not predictive of future results. The investment return and principal value of an investment in the Fund will fluctuate so that an investor’s shares, when redeemed, may be worth more or less than their original cost. Returns are historical and include changes in principal and reinvested dividends and capital gains and do not reflect the effect of taxes. The S&P 500 Index and the Barclays Capital Aggregate Bond Index are unmanaged indices and, unlike the Fund, have no management fees or operating expenses to reduce their reported returns. Returns do not reflect the impact of any additional fees charged by insurance companies. |
THE GUGGENHEIM FUNDSANNUALREPORT | 15
| SCHEDULE OF INVESTMENTS | December 31, 2011 |
| ALTERNATIVE STRATEGIES ALLOCATION FUND |
| SHARES | VALUE | |||||||
CURRENCY EXCHANGE TRADED FUNDS† - 3.6% | ||||||||
PowerShares DB G10 Currency Harvest Fund* | 9,639 | $ | 229,022 | |||||
|
| |||||||
Total Currency Exchange Traded Funds | 229,022 | |||||||
|
| |||||||
EXCHANGE TRADED FUNDS† - 1.3% | ||||||||
iShares Barclays Aggregate Bond Fund | 727 | 80,152 | ||||||
|
| |||||||
Total Exchange Traded Funds | 80,152 | |||||||
|
| |||||||
MUTUAL FUNDS†,1 - 93.0% |
| |||||||
ALTERNATIVES FUNDS - 89.6% |
| |||||||
RVT — Multi-Hedge Strategies Fund* | 44,614 | 982,405 | ||||||
RSF — Event Driven and Distressed Strategies Fund — H Class* | 39,371 | 975,210 | ||||||
RSF — Long Short Equity Strategy Fund — H Class* | 33,685 | 858,980 | ||||||
RVT — Managed Futures Strategy Fund* | 40,482 | 827,461 | ||||||
RSF — Long Short Interest Rate Strategy Fund — H Class* | 29,830 | 703,988 | ||||||
RSF — Alternative Strategies Fund — H Class | 24,890 | 595,612 | ||||||
RSF — Long/Short Commodities Strategy Fund — H Class | 21,248 | 510,594 | ||||||
RVT — Commodities Strategy Fund | 19,028 | 216,350 | ||||||
|
| |||||||
Total Alternatives Funds | 5,670,600 | |||||||
|
| |||||||
SPECIALTY FUNDS - 3.4% |
| |||||||
RVT— Real Estate Fund | 8,233 | 213,243 | ||||||
|
| |||||||
Total Mutual Funds |
| 5,883,843 | ||||||
|
| |||||||
| FACE AMOUNT | ||||||||
REPURCHASE AGREEMENT††,2 - 1.3% |
| |||||||
Credit Suisse Group | ||||||||
issued 12/30/11 at 0.00% due 01/03/12 | $ | 85,621 | 85,621 | |||||
|
| |||||||
Total Repurchase Agreement |
| 85,621 | ||||||
|
| |||||||
Total Investments - 99.2% |
| $ | 6,278,638 | |||||
|
| |||||||
Cash & Other Assets, Less Liabilities - 0.8% | 48,161 | |||||||
|
| |||||||
Total Net Assets - 100.0% | $ | 6,326,799 | ||||||
| ||||||||
| CONTRACTS | UNREALIZED GAIN (LOSS) | |||||||
CURRENCY FUTURES CONTRACTS PURCHASED† |
| |||||||
March 2012 Australian Dollar | ||||||||
Futures Contracts | ||||||||
(Aggregate Value of Contracts $101,390) | 1 | $ | 773 | |||||
March 2012 Canadian Dollar | ||||||||
Futures Contracts | ||||||||
(Aggregate Value of Contracts $98,000) | 1 | 227 | ||||||
|
| |||||||
(Total Aggregate Value of Contracts $199,390) | $ | 1,000 | ||||||
|
| |||||||
FUTURES CONTRACTS PURCHASED† |
| |||||||
March 2012 S&P 500 Index | ||||||||
Mini Futures Contracts | ||||||||
(Aggregate Value of Contracts $62,575) | 1 | 1,061 | ||||||
March 2012 Nikkei-225 Stock Average |
| |||||||
Index Futures Contracts | ||||||||
(Aggregate Value of Contracts $42,225) | 1 | (783 | ) | |||||
March 2012 SPI 200 Index | ||||||||
Futures Contracts | ||||||||
(Aggregate Value of Contracts $104,127) | 1 | (4,518 | ) | |||||
|
| |||||||
(Total Aggregate Value of Contracts $208,927) | $ | (4,240 | ) | |||||
|
| |||||||
CURRENCY FUTURES CONTRACTS SOLD SHORT† |
| |||||||
March 2012 British Pound | ||||||||
Futures Contracts | ||||||||
(Aggregate Value of Contracts $97,006) | 1 | $ | 660 | |||||
|
| |||||||
FUTURES CONTRACTS SOLD SHORT† |
| |||||||
January 2012 CAC 40 Euro | ||||||||
Futures Contracts | ||||||||
(Aggregate Value of Contracts $81,747) | 2 | (189 | ) | |||||
March 2012 MSCI EAFE Index | ||||||||
Mini Futures Contracts | ||||||||
(Aggregate Value of Contracts $70,330) | 1 | (270 | ) | |||||
March 2012 FTSE 100 Index | ||||||||
Futures Contracts | ||||||||
(Aggregate Value of Contracts $85,983) | 1 | (770 | ) | |||||
March 2012 Russell 2000 Index | ||||||||
Mini Futures Contracts | ||||||||
(Aggregate Value of Contracts $73,640) | 1 | (1,749 | ) | |||||
|
| |||||||
(Total Aggregate Value of Contracts $311,700) | $ | (2,978 | ) | |||||
|
| |||||||
| * | Non-income producing security. |
| † | Value determined based on Level 1 inputs — See Note 4. |
| †† | Value determined based on Level 2 inputs — See Note 4. |
| 1 | Affiliated funds. |
| 2 | Repurchase Agreement — See Note 5. |
RSF — Rydex Series Funds
RVT — Rydex Variable Trust
| 16 | THE GUGGENHEIM FUNDSANNUALREPORT | See Notes to Financial Statements. |
ALTERNATIVE STRATEGIES ALLOCATION FUND
STATEMENT OF ASSETS AND LIABILITIES
December 31, 2011
ASSETS: | ||||
Investments in unaffiliated issuers, at value | $ | 309,174 | ||
Investments in affiliated issuers, at value | 5,883,843 | |||
Repurchase agreements, at value | 85,621 | |||
|
| |||
Total investments | 6,278,638 | |||
Segregated cash with broker | 48,961 | |||
Due from broker | 7,157 | |||
Receivables: | ||||
Fund shares sold | 752 | |||
Variation margin | 118 | |||
Dividends | 20 | |||
|
| |||
Total assets | 6,335,646 | |||
|
| |||
LIABILITIES: | ||||
Due to broker | 7,201 | |||
Payable for: | ||||
Fund shares redeemed | 1,646 | |||
|
| |||
Total liabilities | 8,847 | |||
|
| |||
NET ASSETS | $ | 6,326,799 | ||
|
| |||
NET ASSETS CONSISTOF: | ||||
Paid in capital | $ | 7,175,611 | ||
Undistributed net investment income | 87,712 | |||
Accumulated net realized loss on investments | (989,024 | ) | ||
Net unrealized appreciation on investments | 52,500 | |||
|
| |||
Net assets | $ | 6,326,799 | ||
Capital shares outstanding | 335,028 | |||
Net asset value per share | $ | 18.88 | ||
|
|
STATEMENT OF OPERATIONS
Year Ended December 31, 2011
INVESTMENT INCOME: | ||||
Dividends from securities of affiliated issuers | $ | 56,889 | ||
Dividends from securities of unaffiliated issuers | 552 | |||
Interest | 59 | |||
|
| |||
Total investment income | 57,500 | |||
|
| |||
EXPENSES: | ||||
Custodian fees | 13 | |||
|
| |||
Total expenses | 13 | |||
|
| |||
Net investment income | 57,487 | |||
|
| |||
NET REALIZEDAND UNREALIZED GAIN (LOSS): |
| |||
Net realized gain (loss) on: | ||||
Investments in unaffiliated issuers | 6,211 | |||
Investments in affiliated issuers | (176,385 | ) | ||
Futures contracts | 22,352 | |||
Foreign currency | 387 | |||
Realized gain distributions received from unaffiliated issuers | 59 | |||
Realized gain distributions received from affiliated issuers | 65,942 | |||
|
| |||
Net realized loss | (81,434 | ) | ||
|
| |||
Net change in unrealized appreciation (depreciation) on: | ||||
Investments in unaffiliated issuers | (199,136 | ) | ||
Investments in affiliated issuers | 21,270 | |||
Futures contracts | (5,558 | ) | ||
Foreign currency | 113 | |||
|
| |||
Net change in unrealized appreciation (depreciation) | (183,311 | ) | ||
|
| |||
Net realized and unrealized loss | (264,745 | ) | ||
|
| |||
Net decrease in net assets resulting from operations | $ | (207,258 | ) | |
|
| |||
| See Notes to Financial Statements. | THE GUGGENHEIM FUNDSANNUALREPORT | 17 |
ALTERNATIVE STRATEGIES ALLOCATION FUND
STATEMENTS OF CHANGES IN NET ASSETS
| Year Ended December 31, 2011 | Year Ended December 31, 2010 | |||||||
INCREASE (DECREASE) IN NET ASSETS FROM OPERATIONS: | ||||||||
Net investment income | $ | 57,487 | $ | 64,823 | ||||
Net realized loss on investments and foreign currency | (81,434 | ) | (130,680 | ) | ||||
Net change in unrealized appreciation (depreciation) on investments and foreign currency | (183,311 | ) | 118,212 | |||||
|
|
|
| |||||
Net increase (decrease) in net assets resulting from operations | (207,258 | ) | 52,355 | |||||
|
|
|
| |||||
DISTRIBUTIONSTO SHAREHOLDERSFROM: | ||||||||
Net investment income | (141,405 | ) | (12,042 | )a | ||||
Net realized gains | — | (5,793 | )a | |||||
|
|
|
| |||||
Total distributions to shareholders | (141,405 | ) | (17,835 | ) | ||||
|
|
|
| |||||
CAPITAL SHARE TRANSACTIONS: | ||||||||
Proceeds from sale of shares | 1,460,756 | 6,967,747 | ||||||
Distributions reinvested | 141,405 | 17,835 | ||||||
Cost of shares redeemed | (2,436,650 | ) | (4,631,477 | ) | ||||
|
|
|
| |||||
Net increase (decrease) from capital share transactions | (834,489 | ) | 2,354,105 | |||||
|
|
|
| |||||
Net increase (decrease) in net assets | (1,183,152 | ) | 2,388,625 | |||||
NET ASSETS: | ||||||||
Beginning of year | 7,509,951 | 5,121,326 | ||||||
|
|
|
| |||||
End of year | $ | 6,326,799 | $ | 7,509,951 | ||||
|
|
|
| |||||
Undistributed net investment income at end of year | $ | 87,712 | $ | 111,513 | ||||
|
|
|
| |||||
CAPITAL SHARE ACTIVITY: | ||||||||
Shares sold | 73,782 | 357,589 | ||||||
Shares issued from reinvestment of distributions | 7,482 | 912 | ||||||
Shares redeemed | (123,301 | ) | (236,359 | ) | ||||
|
|
|
| |||||
Net increase (decrease) in shares | (42,037 | ) | 122,142 | |||||
|
|
|
| |||||
| a | For financial reporting purposes, certain distributions from net investment income for federal income tax purposes have been reclassified to distributions from realized gains. |
| 18 | THE GUGGENHEIM FUNDSANNUALREPORT | See Notes to Financial Statements. |
ALTERNATIVE STRATEGIES ALLOCATION FUND
FINANCIAL HIGHLIGHTS
This table is presented to show selected data for a share outstanding throughout each period and to assist shareholders in evaluating a Fund’s performance for the periods presented.
| Year Ended December 31, 2011 | Year Ended December 31, 2010 | Year Ended December 31, 2009 | Period Ended December 31, 2008a | |||||||||||||
Per Share Data | ||||||||||||||||
Net asset value, beginning of period | $ | 19.92 | $ | 20.09 | $ | 19.92 | $ | 25.00 | ||||||||
|
|
|
|
|
|
|
| |||||||||
Income (loss) from investment operations: | ||||||||||||||||
Net investment incomeb | .16 | .19 | .07 | .38 | ||||||||||||
Net gain (loss) on investments (realized and unrealized) | (.77 | ) | (.31 | ) | .10 | (5.02 | ) | |||||||||
|
|
|
|
|
|
|
| |||||||||
Total from investment operations | (.61 | ) | (.12 | ) | .17 | (4.64 | ) | |||||||||
|
|
|
|
|
|
|
| |||||||||
Less distributions from: | ||||||||||||||||
Net investment income | (.43 | ) | (.03 | )e | — | (.39 | )e | |||||||||
Net realized gains | — | (.02 | )e | — | (.05 | )e | ||||||||||
|
|
|
|
|
|
|
| |||||||||
Total distributions | (.43 | ) | (.05 | ) | — | (.44 | ) | |||||||||
|
|
|
|
|
|
|
| |||||||||
Net asset value, end of period | $ | 18.88 | $ | 19.92 | $ | 20.09 | $ | 19.92 | ||||||||
|
|
|
|
|
|
|
| |||||||||
Total Returnc | (3.08 | %) | (0.61 | %) | 0.85 | % | (18.55 | %) | ||||||||
|
|
|
|
|
|
|
| |||||||||
Ratios/Supplemental Data | ||||||||||||||||
Net assets, end of period (in thousands) | $ | 6,327 | $ | 7,510 | $ | 5,121 | $ | 3,138 | ||||||||
|
|
|
|
|
|
|
| |||||||||
Ratios to average net assets: | ||||||||||||||||
Net investment income | 0.82 | % | 1.01 | % | 0.38 | % | 2.47 | % | ||||||||
Total expensesd | — | f | — | f | — | f | — | f | ||||||||
Portfolio turnover rate | 105 | % | 165 | % | 149 | % | 33 | % | ||||||||
|
|
|
|
|
|
|
| |||||||||
| a | Since commencement of operations: May 1, 2008. Percentage amounts for the period, except total return and portfolio turnover rate, have been annualized. |
| b | Net investment income per share was computed using average shares outstanding throughout the period. |
| c | Total return does not reflect the impact of any additional fees charged by insurance companies and has not been annualized. |
| d | Does not include expenses of the underlying funds in which the Fund invests. |
| e | For financial reporting purposes, certain distributions from net investment income for federal income tax purposes have been reclassified to distributions from realized gains. |
| f | Less than .01%. |
| See Notes to Financial Statements. | THE GUGGENHEIM FUNDSANNUALREPORT | 19 |
| PERFORMANCE REPORT AND FUND PROFILE (Unaudited) | December 31, 2011 |
MANAGED FUTURES STRATEGY FUND
OBJECTIVE: Seeks to achieve positive absolute returns.
For the year ended December 31, 2011, the Fund returned -8.63%, compared with a return of -5.58% for its benchmark comparison, the Standard & Poor’s Diversified Trends Indicator® (S&P DTI)*. The Fund also underperformed the 0.10% return of the Bank of America Merrill Lynch 3-Month U.S. Treasury Bill Index*. Effective July 11, the Fund’s investment objective changed from seeking to track the performance of a benchmark to seeking to achieve positive absolute returns.
U.S. Treasury long bonds, reformulated gasoline blendstock for oxygen blending (gasoline RBOB) and the 10-year U.S. Treasury note were the leading positive contributors to Fund performance during the year, while corn, wheat and soybeans contributed negatively to Fund performance. The negative contribution for the year came almost exclusively from commodities, as financials provided a slight positive return.
Derivatives in the Fund are used to help provide desired exposure in the most efficient manner, as well as to provide liquidity.
| * | The Standard & Poor’s Diversified Trends Indicator® is an investable long/short strategy that can benefit from trends (in either direction) in the global futures markets. It consists of 24 futures contracts, with a 50% weighting in financial futures and 50% weighting in commodities futures. S&P Indices also offers financials-only and commodities-only subsets of the S&P DTI, providing a flexible way to tailor exposure to these respective asset classes. |
| * | Bank of America Merrill Lynch 3-Month U.S. Treasury Bill Index is an unmanaged market index of U.S. Treasury securities maturing in 90 days that assumes reinvestment of all income. |
Performance displayed represents past performance which is no guarantee of future results.
Consolidated Holdings Diversification (Market Exposure as % of Net Assets)
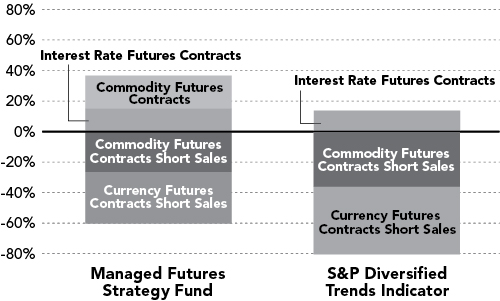
“Consolidated Holdings Diversification (Market Exposure as % of Net Assets)” excludes any temporary cash investments.
Inception Date: November 7, 2008
The Fund invests principally in derivative investments such as futures contracts.
20 | THE GUGGENHEIM FUNDSANNUALREPORT
PERFORMANCE REPORT AND FUND PROFILE (Unaudited) (concluded)
Cumulative Fund Performance*
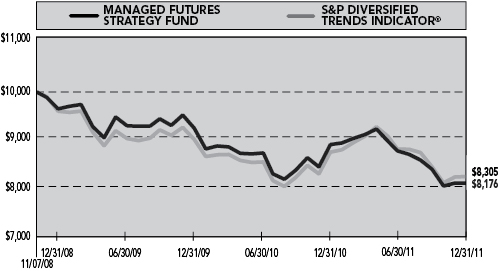
Average Annual Returns*
Periods Ended 12/31/11
| 1 Year | Since Inception (11/07/08) | |||||||
Managed Futures Strategy Fund | -8.63 | % | -6.20 | % | ||||
S&P Diversified Trends Indicator | -5.58 | % | -5.73 | % | ||||
| * | The performance data represents past performance that is not predictive of future results. The investment return and principal value of an investment in the Fund will fluctuate so that an investor’s shares, when redeemed, may be worth more or less than their original cost. Returns are historical and include changes in principal and reinvested dividends and capital gains and do not reflect the effect of taxes. The S&P Diversified Trends Indicator is an unmanaged index and, unlike the Fund, has no management fees or operating expenses to reduce its reported return. Returns do not reflect the impact of any additional fees charged by insurance companies. |
THE GUGGENHEIM FUNDSANNUALREPORT | 21
| CONSOLIDATED SCHEDULE OF INVESTMENTS | December 31, 2011 |
| MANAGED FUTURES STRATEGY FUND |
| FACE AMOUNT | VALUE | |||||||
FEDERAL AGENCY DISCOUNT NOTES†† - 20.7% |
| |||||||
Farmer Mac1 | ||||||||
0.01% due 01/04/12 | $ | 1,000,000 | $ | 999,999 | ||||
Federal Home Loan Bank1 | ||||||||
0.01% due 01/04/12 | 1,000,000 | 999,999 | ||||||
Fannie Mae2 | ||||||||
0.02% due 02/13/12 | 1,000,000 | 999,982 | ||||||
|
| |||||||
Total Federal Agency Discount Notes |
| 2,999,980 | ||||||
|
| |||||||
REPURCHASE AGREEMENTS††,3 - 75.5% |
| |||||||
Mizuho Financial Group, Inc. | ||||||||
issued 12/30/11 at 0.00% due 01/03/12 | 2,833,806 | 2,833,806 | ||||||
HSBC Group | ||||||||
issued 12/30/11 at 0.00% due 01/03/12 | 2,712,693 | 2,712,693 | ||||||
Deutsche Bank | ||||||||
issued 12/30/11 at 0.00% due 01/03/12 | 2,712,693 | 2,712,693 | ||||||
Credit Suisse Group | ||||||||
issued 12/30/11 at 0.00% due 01/03/12 | 2,712,693 | 2,712,693 | ||||||
|
| |||||||
Total Repurchase Agreements |
| 10,971,885 | ||||||
|
| |||||||
Total Investments - 96.2% |
| $ | 13,971,865 | |||||
|
| |||||||
Cash & Other Assets, Less Liabilities - 3.8% | 558,467 | |||||||
|
| |||||||
Total Net Assets - 100.0% | $ | 14,530,332 | ||||||
| CONTRACTS | UNREALIZED GAIN (LOSS) | |||||||
INTEREST RATE FUTURES CONTRACTS PURCHASED† |
| |||||||
March 2012 U.S. Treasury | ||||||||
Long Bond Futures Contracts | ||||||||
(Aggregate Value of Contracts $1,157,000) | 8 | $ | 29,476 | |||||
March 2012 U.S. Treasury | ||||||||
10 Year Note Futures Contracts | ||||||||
(Aggregate Value of Contracts $1,048,750) | 8 | 12,161 | ||||||
|
| |||||||
(Total Aggregate Value of Contracts $2,205,750) | $ | 41,637 | ||||||
|
| |||||||
COMMODITY FUTURES CONTRACTS PURCHASED† |
| |||||||
March 2012 RBOB Gasoline | ||||||||
Futures Contracts | ||||||||
(Aggregate Value of Contracts $558,033) | 5 | 13,667 | ||||||
February 2012 Live Cattle | ||||||||
Futures Contracts | ||||||||
(Aggregate Value of Contracts $97,580) | 2 | (2,899 | ) | |||||
February 2012 Live Cattle | ||||||||
Futures Contracts | ||||||||
(Aggregate Value of Contracts $146,370) | 3 | (3,784 | ) | |||||
March 2012 Heating Oil | ||||||||
Futures Contracts | ||||||||
(Aggregate Value of Contracts $489,048) | 4 | (14,154 | ) | |||||
February 2012 Lean Hogs | ||||||||
Futures Contracts | ||||||||
(Aggregate Value of Contracts $270,160) | 8 | (14,500 | ) | |||||
March 2012 WTI Crude | ||||||||
Futures Contracts | ||||||||
(Aggregate Value of Contracts $1,288,170) | 13 | (17,439 | ) | |||||
March 2012 Natural Gas | ||||||||
Futures Contracts | ||||||||
(Aggregate Value of Contracts $270,630) | 9 | (57,632 | ) | |||||
|
| |||||||
(Total Aggregate Value of |
| $ | (96,741 | ) | ||||
|
| |||||||
COMMODITY FUTURES CONTRACTS SOLD SHORT† |
| |||||||
March 2012 Cocoa | ||||||||
Futures Contracts | ||||||||
(Aggregate Value of Contracts $126,420) | 6 | 35,134 | ||||||
March 2012 Copper | ||||||||
Futures Contracts | ||||||||
(Aggregate Value of Contracts $685,900) | 8 | 26,139 | ||||||
March 2012 Silver | ||||||||
Futures Contracts | ||||||||
(Aggregate Value of Contracts $138,225) | 1 | 25,541 | ||||||
March 2012 Sugar #11 | ||||||||
Futures Contracts | ||||||||
(Aggregate Value of Contracts $130,536) | 5 | 9,071 | ||||||
March 2012 Cotton #2 | ||||||||
Futures Contracts | ||||||||
(Aggregate Value of Contracts $137,070) | 3 | 8,820 | ||||||
March 2012 Corn | ||||||||
Futures Contracts | ||||||||
(Aggregate Value of Contracts $711,975) | 22 | 7,849 | ||||||
March 2012 Coffee ‘C’ | ||||||||
Futures Contracts | ||||||||
(Aggregate Value of Contracts $169,875) | 2 | 5,312 | ||||||
February 2012 Lean Hogs | ||||||||
Futures Contracts | ||||||||
(Aggregate Value of Contracts $236,390) | 7 | 4,714 | ||||||
| 22 | THE GUGGENHEIM FUNDSANNUALREPORT | See Notes to Financial Statements. |
| CONSOLIDATED SCHEDULE OF INVESTMENTS (concluded) | December 31, 2011 |
MANAGED FUTURES STRATEGY FUND
| CONTRACTS | UNREALIZED GAIN (LOSS) | |||||||
March 2012 Wheat | ||||||||
Futures Contracts | ||||||||
(Aggregate Value of Contracts $293,963) | 9 | $ | 2,095 | |||||
June 2012 Gold 100 Oz | ||||||||
Futures Contracts | ||||||||
(Aggregate Value of Contracts $470,970) | 3 | 1,923 | ||||||
March 2012 Soybean | ||||||||
Futures Contracts | ||||||||
(Aggregate Value of Contracts $727,350) | 12 | (14,296 | ) | |||||
|
| |||||||
(Total Aggregate Value of Contracts $3,828,674) | $ | 112,302 | ||||||
|
| |||||||
CURRENCY FUTURES CONTRACTS SOLD SHORT† |
| |||||||
March 2012 Euro | ||||||||
Futures Contracts | ||||||||
(Aggregate Value of Contracts $1,780,487) | 11 | 58,977 | ||||||
March 2012 Swiss Franc | ||||||||
Futures Contracts | ||||||||
(Aggregate Value of Contracts $266,625) | 2 | 3,831 | ||||||
March 2012 British Pound | ||||||||
Futures Contracts | ||||||||
(Aggregate Value of Contracts $679,044) | 7 | 3,429 | ||||||
March 2012 Australian Dollar | ||||||||
Futures Contracts | ||||||||
(Aggregate Value of Contracts $304,170) | 3 | 168 | ||||||
March 2012 Canadian Dollar | ||||||||
Futures Contracts | ||||||||
(Aggregate Value of Contracts $98,000) | 1 | (235 | ) | |||||
March 2012 Japanese Yen | ||||||||
Futures Contracts | ||||||||
(Aggregate Value of Contracts $1,788,875) | 11 | (14,926 | ) | |||||
|
| |||||||
(Total Aggregate Value of Contracts $4,917,201) | $ | 51,244 | ||||||
|
| |||||||
| † | Value determined based on Level 1 inputs — See Note 4. |
| †† | Value determined based on Level 2 inputs — See Note 4. |
| 1 | The issuer operates under a Congressional charter; its securities are neither issued nor guaranteed by the U.S. Government. |
| 2 | On September 7, 2008, the issuer was placed in conservatorship by the Federal Housing Finance Agency (FHFA). As conservator, the FHFA has full powers to control the assets and operations of the firm. |
| 3 | Repurchase Agreements — See Note 5. |
| See Notes to Financial Statements. | THE GUGGENHEIM FUNDSANNUALREPORT | 23 |
MANAGED FUTURES STRATEGY FUND
CONSOLIDATED STATEMENT OF ASSETS AND LIABILITIES
December 31, 2011
ASSETS: |
| |||
Investments, at value | $ | 2,999,980 | ||
Repurchase agreements, at value | 10,971,885 | |||
|
| |||
Total investments | 13,971,865 | |||
Segregated cash with broker | 676,675 | |||
Receivables: | ||||
Fund shares sold | 944 | |||
|
| |||
Total assets | 14,649,484 | |||
|
| |||
LIABILITIES: | ||||
Payable for: | ||||
Variation margin | 85,228 | |||
Management fees | 11,164 | |||
Fund shares redeemed | 4,101 | |||
Transfer agent and administrative fees | 3,102 | |||
Investor service fees | 3,102 | |||
Portfolio accounting fees | 1,241 | |||
Miscellaneous | 11,214 | |||
|
| |||
Total liabilities | 119,152 | |||
|
| |||
NET ASSETS | $ | 14,530,332 | ||
|
| |||
NET ASSETS CONSISTOF: | ||||
Paid in capital | $ | 15,334,374 | ||
Undistributed net investment income | — | |||
Accumulated net realized loss on investments | (912,484 | ) | ||
Net unrealized appreciation on investments | 108,442 | |||
|
| |||
Net assets | $ | 14,530,332 | ||
Capital shares outstanding | 710,734 | |||
Net asset value per share | $ | 20.44 | ||
|
| |||
CONSOLIDATED STATEMENT OF OPERATIONS
Year Ended December 31, 2011
INVESTMENT INCOME: |
| |||
Interest | $ | 7,482 | ||
|
| |||
Total investment income | 7,482 | |||
|
| |||
EXPENSES: | ||||
Management fees | 155,184 | |||
Transfer agent and administrative fees | 38,416 | |||
Investor service fees | 38,416 | |||
Portfolio accounting fees | 15,366 | |||
Licensing fees | 57,625 | |||
Custodian fees | 3,885 | |||
Trustees’ fees* | 2,697 | |||
Miscellaneous | 35,993 | |||
|
| |||
Total expenses | 347,582 | |||
Less: | ||||
Expenses waived by Advisor | (16,887 | ) | ||
|
| |||
Net expenses | 330,695 | |||
|
| |||
Net investment loss | (323,213 | ) | ||
|
| |||
NET REALIZEDAND UNREALIZED GAIN (LOSS): |
| |||
Net realized gain (loss) on: | ||||
Futures contracts | (513,807 | ) | ||
Options written | 747 | |||
|
| |||
Net realized loss | (513,060 | ) | ||
|
| |||
Net change in unrealized appreciation (depreciation) on: | ||||
Investments | (88 | ) | ||
Futures contracts | (618,038 | ) | ||
|
| |||
Net change in unrealized appreciation (depreciation) | (618,126 | ) | ||
|
| |||
Net realized and unrealized loss | (1,131,186 | ) | ||
|
| |||
Net decrease in net assets resulting from operations | $ | (1,454,399 | ) | |
|
| |||
| * | Relates to Trustees not deemed “interested persons” within the meaning of Section 2(a)(19) of the 1940 Act. |
| 24 | THE GUGGENHEIM FUNDSANNUALREPORT | See Notes to Financial Statements. |
MANAGED FUTURES STRATEGY FUND
CONSOLIDATED STATEMENTS OF CHANGES IN NET ASSETS
| Year Ended December 31, 2011 | Year Ended December 31, 2010 | |||||||
INCREASE (DECREASE) IN NET ASSETS FROM OPERATIONS: | ||||||||
Net investment loss | $ | (323,213 | ) | $ | (424,969 | ) | ||
Net realized loss on investments | (513,060 | ) | (2,106,588 | ) | ||||
Net change in unrealized appreciation (depreciation) on investments | (618,126 | ) | 974,968 | |||||
|
|
|
| |||||
Net decrease in net assets resulting from operations | (1,454,399 | ) | (1,556,589 | ) | ||||
|
|
|
| |||||
CAPITAL SHARE TRANSACTIONS: | ||||||||
Proceeds from sale of shares | 11,007,071 | 19,457,158 | ||||||
Cost of shares redeemed | (10,655,298 | ) | (30,900,254 | ) | ||||
|
|
|
| |||||
Net increase (decrease) from capital share transactions | 351,773 | (11,443,096 | ) | |||||
|
|
|
| |||||
Net decrease in net assets | (1,102,626 | ) | (12,999,685 | ) | ||||
NET ASSETS: | ||||||||
Beginning of year | 15,632,958 | 28,632,643 | ||||||
|
|
|
| |||||
End of year | $ | 14,530,332 | $ | 15,632,958 | ||||
|
|
|
| |||||
Undistributed net investment income at end of year | $ | — | $ | — | ||||
|
|
|
| |||||
CAPITAL SHARE ACTIVITY: | ||||||||
Shares sold | 498,365 | 881,807 | ||||||
Shares redeemed | (486,344 | ) | (1,417,904 | ) | ||||
|
|
|
| |||||
Net increase (decrease) in shares | 12,021 | (536,097 | ) | |||||
|
|
|
| |||||
| See Notes to Financial Statements. | THE GUGGENHEIM FUNDSANNUALREPORT | 25 |
MANAGED FUTURES STRATEGY FUND
FINANCIAL HIGHLIGHTS
This table is presented to show selected data for a share outstanding throughout each period and to assist shareholders in evaluating a Fund’s performance for the periods presented.
| Year Ended December 31, 2011a | Year Ended December 31, 2010a | Year Ended December 31, 2009a | Period Ended December 31, 2008a,b | |||||||||||||
Per Share Data | ||||||||||||||||
Net asset value, beginning of period | $ | 22.37 | $ | 23.19 | $ | 24.10 | $ | 25.00 | ||||||||
|
|
|
|
|
|
|
| |||||||||
Income (loss) from investment operations: | ||||||||||||||||
Net investment lossc | (.46 | ) | (.43 | ) | (.49 | ) | (.08 | ) | ||||||||
Net loss on investments (realized and unrealized) | (1.47 | ) | (.39 | ) | (.42 | ) | (.82 | ) | ||||||||
|
|
|
|
|
|
|
| |||||||||
Total from investment operations | (1.93 | ) | (.82 | ) | (.91 | ) | (.90 | ) | ||||||||
|
|
|
|
|
|
|
| |||||||||
Net asset value, end of period | $ | 20.44 | $ | 22.37 | $ | 23.19 | $ | 24.10 | ||||||||
|
|
|
|
|
|
|
| |||||||||
Total Returnd | (8.63 | %) | (3.54 | %) | (3.78 | %) | (3.60 | %) | ||||||||
|
|
|
|
|
|
|
| |||||||||
Ratios/Supplemental Data | ||||||||||||||||
Net assets, end of period (in thousands) | $ | 14,530 | $ | 15,633 | $ | 28,633 | $ | 6,413 | ||||||||
|
|
|
|
|
|
|
| |||||||||
Ratios to average net assets: | ||||||||||||||||
Net investment loss | (2.10 | %) | (1.96 | %) | (2.08 | %) | (2.09 | %) | ||||||||
Total expenses | 2.26 | % | 2.19 | % | 2.32 | % | 2.21 | % | ||||||||
Net expensese | 2.15 | % | 2.09 | % | 2.20 | % | 2.21 | % | ||||||||
|
|
|
|
|
|
|
| |||||||||
Portfolio turnover rate | — | — | — | — | ||||||||||||
| a | Consolidated. |
| b | Since commencement of operations: November 7, 2008. Percentage amounts for the period, except total return and portfolio turnover rate, have been annualized. |
| c | Net investment loss per share was computed using average shares outstanding throughout the period. |
| d | Total return does not reflect the impact of any additional fees charged by insurance companies and has not been annualized. |
| e | Net expense information reflects the expense ratios after expense waivers. |
| 26 | THE GUGGENHEIM FUNDSANNUALREPORT | See Notes to Financial Statements. |
This page intentionally left blank.
THE GUGGENHEIM FUNDSANNUALREPORT | 27
| PERFORMANCE REPORT AND FUND PROFILE (Unaudited) | December 31, 2011 |
MULTI-HEDGE STRATEGIES FUND
OBJECTIVE: Seeks long-term capital appreciation with less risk than traditional equity funds.
2011 was the second full calendar year of performance since the Fund’s objective was changed from hedge fund replication to capital appreciation. The results for 2011 were strong for a second year as the Fund generated a 3.38% return with only 4.3% annualized risk, for a Sharpe ratio* approximating 0.8. In addition to generating a strong Sharpe ratio, the Fund generated a correlation of -4% to the S&P 500® Index** over the course of the year and demonstrated an ability to preserve and grow capital during the tumultuous months of August and September.
While no longer a replication product, the Fund still maintains the HFRX Global Hedge Fund Index** as its benchmark comparison, which was down -8.92% for the year. All five of the hedge fund styles (global macro, long/short equity, equity market neutral, merger arbitrage and fixed income strategies) employed by the Fund contributed positive returns to the Fund.
Merger Arbitrage contributed the most to return, 2.1%, as we increased our allocation to the strategy early in the year and the model continued to generate very attractive risk-adjusted returns. Our strategy realized a return of 6.2% with 3.1% annualized volatility, significantly better than the -2.1% loss with 5.8% annualized volatility reported for the HFRX Merger Arbitrage Index**.
Global Macro strategies contributed the second most, adding 1.4% to Fund return. Our trend-based and relative-value commodity models contributed approximately equally to this result. The trend model did very well in the first quarter of the calendar year while the relative-value strategy picked up steam in the second and third quarters.
Equity Market Neutral contributed 1.2% to Fund return. Our quantitative model generated a 5.9% return with 2.8% annualized volatility. In contrast, the HFRX Equity Market Neutral Index** lost -2.9% during the calendar year.
Fixed Income strategies contributed 1.1% to Fund return. Tactically allocating to a Treasury flattener trade performed well during the last three quarters of the year as market stress rose during European and U.S. budget discussions. Approximately half of the flattener strategy’s return was generated in the months of August and September alone, a period when we opportunistically increased our exposure to the strategy.
Long/Short Equity contributed 0.9% to Fund return. The industry rotation and size models contributed approximately equal positive amounts to this result while the country rotation model detracted from fund performance. For the full year, small caps underperformed large caps. Prior to 2011, this would have led to negative performance from our size model; however, enhancements allowed us to profit from shifting trends in the relative performance of stocks in different market capitalization categories.
Derivatives in the Fund are used for various purposes, including hedging, producing income and for speculation.
| * | Sharpe Ratio: a risk-adjusted measure calculated using standard deviation and excess return to determine reward per unit of risk. The higher the Sharpe ratio, the better the fund’s historical risk-adjusted performance. |
| ** | Standard & Poor’s 500 Index (S&P 500®) — a capitalization-weighted index covering 500 industrial, utility, transportation and financial companies of the U.S. markets (mostly NYSE Euronext issues). |
| ** | HFRX Global Hedge Fund Index is designed to be representative of the overall composition of the hedge fund universe. It is comprised of all eligible hedge fund strategies, including, but not limited to, convertible arbitrage, distressed securities, equity hedge, equity market neutral, event driven, macro, merger arbitrage and relative-value arbitrage. The strategies are asset weighted based on the distribution of assets in the hedge fund industry. |
| ** | HFRX Merger Arbitrage Index is designed to measure merger arbitrage strategies which employ an investment process primarily focused on opportunities in equity and equity related instruments of companies currently engaged in a corporate transaction. Merger arbitrage strategies typically have over 75% of positions in announced transactions over a given market cycle. |
| ** | HFRX Equity Market Neutral Index is designed to measure equity market neutral strategies which employ sophisticated quantitative techniques of analyzing price data to ascertain information about future price movement and relationships between securities, select securities for purchase and sale. Equity market neutral strategies typically maintain characteristic net equity market exposure no greater than 10% long or short. |
Performance displayed represents past performance which is no guarantee of future results.
28 | THE GUGGENHEIM FUNDSANNUALREPORT
PERFORMANCE REPORT AND FUND PROFILE (Unaudited) (concluded)
Consolidated Holdings Diversification (Market Exposure as % of Net Assets)
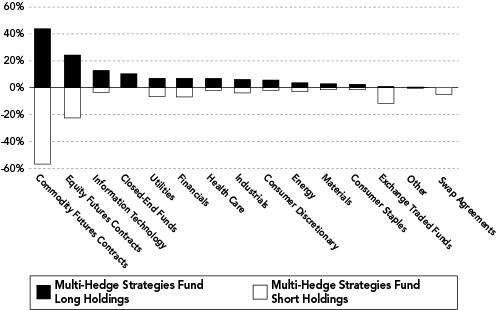
“Consolidated Holdings Diversification (Market Exposure as % of Net Assets)” excludes any temporary cash investments.
Cumulative Fund Performance*
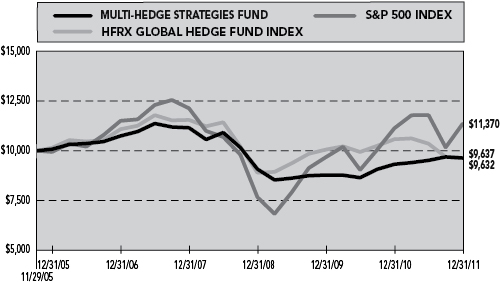
Inception Date: November 29, 2005
Ten Largest Long Holdings (% of Total Net Assets) | ||||
Progress Energy, Inc. | 2.5 | % | ||
99 Cents Only Stores | 2.2 | % | ||
Transatlantic Holdings, Inc. | 2.1 | % | ||
Constellation Energy Group, Inc. | 1.9 | % | ||
RightNow Technologies, Inc. | 1.9 | % | ||
Healthspring, Inc. | 1.9 | % | ||
Goodrich Corp. | 1.8 | % | ||
Netlogic Microsystems, Inc. | 1.8 | % | ||
Temple-Inland, Inc. | 1.7 | % | ||
Motorola Mobility Holdings, Inc. | 1.3 | % | ||
|
| |||
Top Ten Total | 19.1 | % | ||
|
| |||
“Ten Largest Holdings” exclude any temporary cash or derivative investments.
Average Annual Returns*
Periods Ended 12/31/11
| 1 Year | 5 Year | Since Inception (11/29/05) | ||||||||||
Multi-Hedge Strategies Fund | 3.38 | % | -2.17 | % | -0.61 | % | ||||||
HFRX Global Hedge Fund Index | -8.92 | % | -2.77 | % | -0.61 | % | ||||||
S&P 500 Index | 2.11 | % | -0.25 | % | 2.13 | % | ||||||
| * | The performance data represents past performance that is not predictive of future results. The investment return and principal value of an investment in the Fund will fluctuate so that an investor’s shares, when redeemed, may be worth more or less than their original cost. Returns are historical and include changes in principal and reinvested dividends and capital gains and do not reflect the effect of taxes. The HFRX Global Hedge Fund Index and the S&P 500 Index are unmanaged indices and, unlike the Fund, have no management fees or operating expenses to reduce their reported returns. Returns do not reflect the impact of any additional fees charged by insurance companies. |
THE GUGGENHEIM FUNDSANNUALREPORT | 29
| CONSOLIDATED SCHEDULE OF INVESTMENTS | December 31, 2011 |
MULTI-HEDGE STRATEGIES FUND
| SHARES | VALUE | |||||||
COMMON STOCKS† - 54.8% |
| |||||||
INFORMATION TECHNOLOGY - 12.9% |
| |||||||
RightNow Technologies, Inc.*,1 | 8,347 | $ | 356,667 | |||||
Netlogic Microsystems, Inc.*,1 | 6,716 | 332,912 | ||||||
Motorola Mobility Holdings, Inc.*,1 | 6,135 | 238,038 | ||||||
Blue Coat Systems, Inc.* | 7,770 | 197,747 | ||||||
SuccessFactors, Inc.* | 3,939 | 157,048 | ||||||
Magma Design Automation, Inc.*,1 | 21,798 | 156,510 | ||||||
LoopNet, Inc.*,1 | 7,216 | 131,909 | ||||||
Tekelec* | 7,379 | 80,652 | ||||||
Novellus Systems, Inc.*,1 | 1,949 | 80,474 | ||||||
DemandTec, Inc.* | 5,956 | 78,441 | ||||||
Fidelity National Information Services, Inc.1 | 1,492 | 39,672 | ||||||
IAC/InterActiveCorp.1 | 920 | 39,192 | ||||||
Activision Blizzard, Inc.1 | 2,801 | 34,508 | ||||||
Alliance Data Systems Corp.*,1 | 322 | 33,437 | ||||||
Analog Devices, Inc.1 | 894 | 31,987 | ||||||
Avnet, Inc.*,1 | 996 | 30,966 | ||||||
CA, Inc.1 | 1,454 | 29,393 | ||||||
AVX Corp.1 | 2,250 | 28,710 | ||||||
Fairchild Semiconductor International, Inc.*,1 | 2,301 | 27,704 | ||||||
Jabil Circuit, Inc.1 | 1,326 | 26,069 | ||||||
Equinix, Inc.*,1 | 246 | 24,944 | ||||||
DST Systems, Inc.1 | 517 | 23,534 | ||||||
S1 Corp.*,1 | 1,878 | 17,972 | ||||||
Dell, Inc.*,1 | 1,216 | 17,790 | ||||||
SanDisk Corp.*,1 | 347 | 17,076 | ||||||
EchoStar Corp. — Class A*,1 | 695 | 14,553 | ||||||
Tech Data Corp.*,1 | 293 | 14,477 | ||||||
eBay, Inc.*,1 | 458 | 13,891 | ||||||
Apple, Inc.*,1 | 32 | 12,960 | ||||||
Microchip Technology, Inc.1 | 322 | 11,795 | ||||||
Motorola Solutions, Inc.1 | 250 | 11,573 | ||||||
Teradyne, Inc.*,1 | 835 | 11,381 | ||||||
Harris Corp.1 | 310 | 11,172 | ||||||
Avago Technologies Ltd.1 | 369 | 10,649 | ||||||
Xilinx, Inc.1 | 301 | 9,650 | ||||||
Compuware Corp.*,1 | 883 | 7,347 | ||||||
Molex, Inc.1 | 267 | 6,371 | ||||||
Maxim Integrated Products, Inc.1 | 242 | 6,302 | ||||||
Xerox Corp.1 | 537 | 4,275 | ||||||
Vishay Intertechnology, Inc.*,1 | 439 | 3,947 | ||||||
Synopsys, Inc.*,1 | 119 | 3,237 | ||||||
Polycom, Inc.*,1 | 123 | 2,005 | ||||||
Solera Holdings, Inc.1 | 21 | 935 | ||||||
Atmel Corp.*,1 | 70 | 567 | ||||||
Altera Corp. | 4 | 148 | ||||||
NVIDIA Corp.* | 5 | 69 | ||||||
Electronic Arts, Inc.* | 2 | 41 | ||||||
|
| |||||||
Total Information Technology | 2,390,697 | |||||||
|
| |||||||
UTILITIES - 7.0% |
| |||||||
Progress Energy, Inc.1 | 8,256 | 462,501 | ||||||
Constellation Energy Group, Inc.1 | 9,071 | 359,847 | ||||||
Central Vermont Public Service Corp.1 | 2,101 | 73,745 | ||||||
Atmos Energy Corp.1 | 1,345 | 44,856 | ||||||
NiSource, Inc.1 | 1,746 | 41,572 | ||||||
American Electric Power Company, Inc.1 | 996 | 41,145 | ||||||
Alliant Energy Corp.1 | 925 | 40,802 | ||||||
Consolidated Edison, Inc.1 | 657 | 40,754 | ||||||
DTE Energy Co.1 | 737 | 40,130 | ||||||
N.V. Energy, Inc.1 | 2,411 | 39,420 | ||||||
Pennichuck Corp.1 | 1,282 | 36,960 | ||||||
NRG Energy, Inc.*,1 | 1,288 | 23,339 | ||||||
ONEOK, Inc.1 | 268 | 23,233 | ||||||
Ameren Corp.1 | 373 | 12,358 | ||||||
Entergy Corp.1 | 147 | 10,738 | ||||||
CenterPoint Energy, Inc.1 | 314 | 6,308 | ||||||
CMS Energy Corp.1 | 229 | 5,056 | ||||||
Westar Energy, Inc.1 | 148 | 4,259 | ||||||
Great Plains Energy, Inc.1 | 83 | 1,808 | ||||||
|
| |||||||
Total Utilities | 1,308,831 | |||||||
|
| |||||||
FINANCIALS - 6.9% |
| |||||||
Transatlantic Holdings, Inc.1 | 7,067 | 386,777 | ||||||
Harleysville Group, Inc.1 | 1,559 | 88,193 | ||||||
Annaly Capital Management, Inc.1 | 2,985 | 47,641 | ||||||
Delphi Financial Group, Inc. — Class A | 918 | 40,667 | ||||||
Torchmark Corp.1 | 937 | 40,656 | ||||||
Fidelity National Financial, Inc. — Class A1 | 2,538 | 40,430 | ||||||
SL Green Realty Corp.1 | 576 | 38,385 | ||||||
American Financial Group, Inc.1 | 1,030 | 37,997 | ||||||
Commerce Bancshares, Inc.1 | 990 | 37,739 | ||||||
NASDAQ OMX Group, Inc.*,1 | 1,521 | 37,280 | ||||||
Capital One Financial Corp.1 | 863 | 36,496 | ||||||
Leucadia National Corp.1 | 1,415 | 32,177 | ||||||
Reinsurance Group of America, Inc.1 | 572 | 29,887 | ||||||
Weyerhaeuser Co.1 | 1,584 | 29,573 | ||||||
Huntington Bancshares, Inc.1 | 5,355 | 29,399 | ||||||
Endurance Specialty Holdings Ltd.1 | 750 | 28,688 | ||||||
CapitalSource, Inc.1 | 4,239 | 28,401 | ||||||
Discover Financial Services1 | 1,127 | 27,048 | ||||||
Marsh & McLennan Companies, Inc.1 | 817 | 25,834 | ||||||
BlackRock, Inc.1 | 137 | 24,419 | ||||||
Bank of New York Mellon Corp.1 | 1,136 | 22,618 | ||||||
American Capital Ltd.*,1 | 3,253 | 21,893 | ||||||
East West Bancorp, Inc.1 | 932 | 18,407 | ||||||
Hospitality Properties Trust1 | 730 | 16,775 | ||||||
MetLife, Inc.1 | 520 | 16,214 | ||||||
New York Community Bancorp, Inc.1 | 1,095 | 13,545 | ||||||
30 | THE GUGGENHEIM FUNDSANNUALREPORT | See Notes to Financial Statements. |
| CONSOLIDATED SCHEDULE OF INVESTMENTS (continued) | December 31, 2011 |
MULTI-HEDGE STRATEGIES FUND
| SHARES | VALUE | |||||||
Taubman Centers, Inc.1 | 208 | $ | 12,917 | |||||
Piedmont Office Realty Trust, Inc. — Class A1 | 753 | 12,831 | ||||||
CommonWealth REIT1 | 765 | 12,730 | ||||||
Washington Federal, Inc.1 | 742 | 10,381 | ||||||
Unum Group1 | 432 | 9,102 | ||||||
Interactive Brokers Group, Inc. — Class A1 | 559 | 8,351 | ||||||
E*Trade Financial Corp.*,1 | 699 | 5,564 | ||||||
Prudential Financial, Inc.1 | 105 | 5,263 | ||||||
ACE Ltd.1 | 38 | 2,665 | ||||||
Simon Property Group, Inc.1 | 17 | 2,192 | ||||||
Liberty Property Trust1 | 58 | 1,791 | ||||||
First Niagara Financial Group, Inc.1 | 199 | 1,717 | ||||||
Rayonier, Inc.1 | 38 | 1,696 | ||||||
Citigroup, Inc.1 | 56 | 1,473 | ||||||
UDR, Inc.1 | 38 | 954 | ||||||
Principal Financial Group, Inc.1 | 28 | 689 | ||||||
|
| |||||||
Total Financials | 1,287,455 | |||||||
|
| |||||||
HEALTH CARE - 6.7% |
| |||||||
Healthspring, Inc.*,1 | 6,536 | 356,473 | ||||||
Pharmasset, Inc.*,1 | 1,538 | 197,172 | ||||||
SonoSite, Inc.* | 1,827 | 98,402 | ||||||
Medco Health Solutions, Inc.*,1 | 1,292 | 72,223 | ||||||
Synovis Life Technologies, Inc.* | 2,129 | 59,250 | ||||||
Amgen, Inc.1 | 851 | 54,643 | ||||||
SXC Health Solutions Corp.*,1 | 627 | 35,413 | ||||||
Coventry Health Care, Inc.*,1 | 1,153 | 35,017 | ||||||
LifePoint Hospitals, Inc.*,1 | 915 | 33,992 | ||||||
Cooper Companies, Inc.1 | 470 | 33,144 | ||||||
Forest Laboratories, Inc.*,1 | 835 | 25,267 | ||||||
Agilent Technologies, Inc.*,1 | 665 | 23,228 | ||||||
Endo Pharmaceuticals Holdings, Inc.*,1 | 576 | 19,889 | ||||||
American Dental Partners, Inc.*,1 | 987 | 18,585 | ||||||
Celgene Corp.*,1 | 253 | 17,103 | ||||||
AmerisourceBergen Corp.1 | 441 | 16,401 | ||||||
Gilead Sciences, Inc.*,1 | 398 | 16,290 | ||||||
Pfizer, Inc.1 | 746 | 16,143 | ||||||
Bio-Rad Laboratories, Inc. — Class A*,1 | 165 | 15,847 | ||||||
Cerner Corp.*,1 | 242 | 14,823 | ||||||
Biogen Idec, Inc.*,1 | 131 | 14,417 | ||||||
Perrigo Co.1 | 141 | 13,719 | ||||||
Alexion Pharmaceuticals, Inc.*,1 | 144 | 10,296 | ||||||
McKesson Corp.1 | 127 | 9,895 | ||||||
Aetna, Inc.1 | 191 | 8,058 | ||||||
United Therapeutics Corp.*,1 | 148 | 6,993 | ||||||
Henry Schein, Inc.*,1 | 85 | 5,477 | ||||||
ResMed, Inc.*,1 | 191 | 4,851 | ||||||
Humana, Inc.1 | 30 | 2,628 | ||||||
Myriad Genetics, Inc.*,1 | 124 | 2,597 | ||||||
UnitedHealth Group, Inc.1 | 51 | 2,585 | ||||||
AMERIGROUP Corp.*,1 | 42 | 2,481 | ||||||
WellPoint, Inc.1 | 34 | 2,253 | ||||||
Hill-Rom Holdings, Inc.1 | 62 | 2,089 | ||||||
Edwards Lifesciences Corp.*,1 | 23 | 1,626 | ||||||
Boston Scientific Corp.*,1 | 165 | 881 | ||||||
Cigna Corp.1 | 17 | 714 | ||||||
|
| |||||||
Total Health Care | 1,250,865 | |||||||
|
| |||||||
INDUSTRIALS - 6.1% |
| |||||||
Goodrich Corp.1 | 2,700 | 333,990 | ||||||
RSC Holdings, Inc.* | 7,986 | 147,741 | ||||||
Stanley Black & Decker, Inc.1 | 593 | 40,087 | ||||||
Kennametal, Inc.1 | 1,009 | 36,849 | ||||||
Towers Watson & Co. — Class A1 | 602 | 36,078 | ||||||
Northrop Grumman Corp.1 | 572 | 33,451 | ||||||
Republic Services, Inc.1 | 979 | 26,971 | ||||||
KBR, Inc.1 | 966 | 26,922 | ||||||
Tyco International Ltd.1 | 542 | 25,317 | ||||||
Union Pacific Corp.1 | 236 | 25,002 | ||||||
Dover Corp.1 | 411 | 23,859 | ||||||
FedEx Corp.1 | 284 | 23,717 | ||||||
Corrections Corporation of America*,1 | 1,034 | 21,063 | ||||||
Ryder System, Inc.1 | 386 | 20,512 | ||||||
WESCO International, Inc.*,1 | 385 | 20,409 | ||||||
WCA Waste Corp.* | 3,124 | 20,337 | ||||||
Caterpillar, Inc.1 | 210 | 19,026 | ||||||
GATX Corp.1 | 411 | 17,944 | ||||||
WW Grainger, Inc.1 | 93 | 17,409 | ||||||
AGCO Corp.*,1 | 403 | 17,317 | ||||||
Nordson Corp.1 | 419 | 17,254 | ||||||
Air Lease Corp. — Class A*,1 | 723 | 17,142 | ||||||
MSC Industrial Direct Co., Inc. — Class A1 | 206 | 14,739 | ||||||
L-3 Communications Holdings, Inc.1 | 212 | 14,136 | ||||||
General Electric Co.1 | 725 | 12,985 | ||||||
Emerson Electric Co.1 | 272 | 12,672 | ||||||
CSX Corp.1 | 559 | 11,773 | ||||||
Donaldson Company, Inc.1 | 167 | 11,369 | ||||||
Parker Hannifin Corp.1 | 144 | 10,980 | ||||||
Kansas City Southern*,1 | 144 | 9,793 | ||||||
Cummins, Inc.1 | 110 | 9,682 | ||||||
URS Corp.*,1 | 271 | 9,518 | ||||||
Armstrong World Industries, Inc.*,1 | 160 | 7,019 | ||||||
Gardner Denver, Inc.1 | 89 | 6,858 | ||||||
Chicago Bridge & Iron Company N.V.1 | 180 | 6,804 | ||||||
Hubbell, Inc. — Class B1 | 93 | 6,218 | ||||||
Norfolk Southern Corp.1 | 80 | 5,829 | ||||||
CNH Global N.V.*,1 | 155 | 5,578 | ||||||
Fluor Corp.1 | 85 | 4,271 | ||||||
Thomas & Betts Corp.*,1 | 68 | 3,713 | ||||||
Alexander & Baldwin, Inc.1 | 68 | 2,776 | ||||||
RR Donnelley & Sons Co.1 | 148 | 2,136 | ||||||
Eaton Corp.1 | 25 | 1,088 | ||||||
Kirby Corp.* | 10 | 658 | ||||||
|
| |||||||
Total Industrials | 1,138,992 | |||||||
|
| |||||||
| See Notes to Financial Statements. | THE GUGGENHEIM FUNDSANNUALREPORT | 31 |
| CONSOLIDATED SCHEDULE OF INVESTMENTS (continued) | December 31, 2011 |
MULTI-HEDGE STRATEGIES FUND
| SHARES | VALUE | |||||||
CONSUMER DISCRETIONARY - 5.8% |
| |||||||
99 Cents Only Stores*,1 | 18,961 | $ | 416,194 | |||||
Wyndham Worldwide Corp.1 | 983 | 37,187 | ||||||
McCormick & Schmick’s Seafood Restaurants, Inc.* | 4,252 | 37,163 | ||||||
Foot Locker, Inc.1 | 1,547 | 36,880 | ||||||
Comcast Corp. — Class A1 | 1,492 | 35,375 | ||||||
Limited Brands, Inc.1 | 809 | 32,643 | ||||||
O’Reilly Automotive, Inc.*,1 | 373 | 29,821 | ||||||
Brinker International, Inc.1 | 992 | 26,546 | ||||||
Jarden Corp.1 | 788 | 23,545 | ||||||
MGM Resorts International*,1 | 2,246 | 23,426 | ||||||
Dillard’s, Inc. — Class A1 | 428 | 19,209 | ||||||
Time Warner Cable, Inc.1 | 298 | 18,944 | ||||||
Darden Restaurants, Inc.1 | 412 | 18,779 | ||||||
Autoliv, Inc.1 | 343 | 18,347 | ||||||
Mattel, Inc.1 | 633 | 17,572 | ||||||
NIKE, Inc. — Class B1 | 177 | 17,058 | ||||||
Target Corp.1 | 316 | 16,186 | ||||||
Coach, Inc.1 | 261 | 15,931 | ||||||
VF Corp.1 | 124 | 15,747 | ||||||
Kohl’s Corp.1 | 300 | 14,805 | ||||||
Interpublic Group of Companies, Inc.1 | 1,496 | 14,556 | ||||||
Fossil, Inc.*,1 | 179 | 14,205 | ||||||
Genuine Parts Co.1 | 206 | 12,607 | ||||||
JC Penney Company, Inc.1 | 348 | 12,232 | ||||||
Family Dollar Stores, Inc.1 | 206 | 11,878 | ||||||
Deckers Outdoor Corp.*,1 | 153 | 11,562 | ||||||
Service Corporation International1 | 1,081 | 11,513 | ||||||
Polaris Industries, Inc.1 | 203 | 11,364 | ||||||
DISH Network Corp. — Class A1 | 360 | 10,253 | ||||||
Hanesbrands, Inc.*,1 | 462 | 10,099 | ||||||
TRW Automotive Holdings Corp.*,1 | 288 | 9,389 | ||||||
Career Education Corp.*,1 | 1,100 | 8,767 | ||||||
CBS Corp. — Class B1 | 294 | 7,979 | ||||||
Virgin Media, Inc.1 | 367 | 7,846 | ||||||
Big Lots, Inc.*,1 | 169 | 6,381 | ||||||
Liberty Interactive Corp. — Class A*,1 | 369 | 5,983 | ||||||
Under Armour, Inc. — Class A*,1 | 70 | 5,025 | ||||||
Royal Caribbean Cruises Ltd.1 | 178 | 4,409 | ||||||
Hasbro, Inc.1 | 138 | 4,401 | ||||||
Priceline.com, Inc.* | 8 | 3,742 | ||||||
GameStop Corp. — Class A*,1 | 136 | 3,282 | ||||||
Aaron’s, Inc.1 | 106 | 2,828 | ||||||
DeVry, Inc.1 | 68 | 2,615 | ||||||
LKQ Corp.*,1 | 56 | 1,685 | ||||||
Tupperware Brands Corp.1 | 30 | 1,679 | ||||||
The Gap, Inc.1 | 22 | 408 | ||||||
|
| |||||||
Total Consumer Discretionary | 1,068,046 | |||||||
|
| |||||||
ENERGY - 3.7% |
| |||||||
Complete Production Services, Inc.*,1 | 6,966 | 233,779 | ||||||
El Paso Corp.1 | 5,091 | 135,268 | ||||||
Marathon Oil Corp.1 | 1,427 | 41,768 | ||||||
Tesoro Corp.*,1 | 1,360 | 31,770 | ||||||
Valero Energy Corp.1 | 1,504 | 31,659 | ||||||
Spectra Energy Corp.1 | 803 | 24,692 | ||||||
Chevron Corp.1 | 203 | 21,599 | ||||||
Patterson-UTI Energy, Inc.1 | 945 | 18,881 | ||||||
Unit Corp.*,1 | 403 | 18,699 | ||||||
Hess Corp.1 | 309 | 17,551 | ||||||
ConocoPhillips1 | 237 | 17,270 | ||||||
Chesapeake Energy Corp.1 | 716 | 15,960 | ||||||
SEACOR Holdings, Inc.*,1 | 150 | 13,344 | ||||||
National Oilwell Varco, Inc.1 | 171 | 11,626 | ||||||
QEP Resources, Inc.1 | 361 | 10,577 | ||||||
RPC, Inc.1 | 564 | 10,293 | ||||||
Murphy Oil Corp.1 | 162 | 9,030 | ||||||
Oil States International, Inc.*,1 | 106 | 8,095 | ||||||
Occidental Petroleum Corp.1 | 80 | 7,496 | ||||||
SM Energy Co.1 | 42 | 3,070 | ||||||
Cimarex Energy Co.1 | 21 | 1,300 | ||||||
Atwood Oceanics, Inc.* | 13 | 517 | ||||||
|
| |||||||
Total Energy | 684,244 | |||||||
|
| |||||||
MATERIALS - 2.9% |
| |||||||
Temple-Inland, Inc.1 | 9,843 | 312,122 | ||||||
Westlake Chemical Corp.1 | 668 | 26,880 | ||||||
Cabot Corp.1 | 826 | 26,548 | ||||||
LyondellBasell Industries N.V. — Class A1 | 750 | 24,368 | ||||||
Cliffs Natural Resources, Inc.1 | 354 | 22,072 | ||||||
Domtar Corp.1 | 237 | 18,951 | ||||||
CF Industries Holdings, Inc.1 | 123 | 17,833 | ||||||
Freeport-McMoRan Copper & Gold, Inc.1 | 453 | 16,666 | ||||||
MeadWestvaco Corp.1 | 480 | 14,376 | ||||||
Alcoa, Inc.1 | 1,500 | 12,975 | ||||||
Bemis Company, Inc.1 | 403 | 12,122 | ||||||
Newmont Mining Corp.1 | 185 | 11,102 | ||||||
Packaging Corporation of America1 | 381 | 9,616 | ||||||
Rockwood Holdings, Inc.*,1 | 206 | 8,110 | ||||||
International Paper Co.1 | 72 | 2,131 | ||||||
Dow Chemical Co.1 | 59 | 1,697 | ||||||
EI du Pont de Nemours & Co.1 | 34 | 1,557 | ||||||
Ball Corp.1 | 42 | 1,500 | ||||||
Walter Energy, Inc. | 4 | 242 | ||||||
|
| |||||||
Total Materials | 540,868 | |||||||
|
| |||||||
CONSUMER STAPLES - 2.5% |
| |||||||
Winn-Dixie Stores, Inc.* | 8,554 | 80,237 | ||||||
Smithfield Foods, Inc.*,1 | 1,708 | 41,470 | ||||||
Tyson Foods, Inc. — Class A1 | 1,996 | 41,197 | ||||||
Kroger Co.1 | 1,623 | 39,309 | ||||||
Hormel Foods Corp.1 | 1,322 | 38,721 | ||||||
Coca-Cola Enterprises, Inc.1 | 1,445 | 37,252 | ||||||
ConAgra Foods, Inc.1 | 1,331 | 35,138 | ||||||
Lorillard, Inc.1 | 219 | 24,966 | ||||||
Philip Morris International, Inc.1 | 255 | 20,012 | ||||||
Herbalife Ltd.1 | 364 | 18,808 | ||||||
Reynolds American, Inc.1 | 429 | 17,769 | ||||||
| 32 | THE GUGGENHEIM FUNDSANNUALREPORT | See Notes to Financial Statements. |
| CONSOLIDATED SCHEDULE OF INVESTMENTS (continued) | December 31, 2011 |
MULTI-HEDGE STRATEGIES FUND
| SHARES | VALUE | |||||||
Kimberly-Clark Corp.1 | 225 | $ | 16,551 | |||||
Energizer Holdings, Inc.*,1 | 203 | 15,728 | ||||||
Estee Lauder Companies, Inc. — Class A1 | 106 | 11,906 | ||||||
Corn Products International, Inc.1 | 216 | 11,359 | ||||||
Whole Foods Market, Inc.1 | 71 | 4,940 | ||||||
Costco Wholesale Corp.1 | 47 | 3,916 | ||||||
Avon Products, Inc.1 | 216 | 3,774 | ||||||
|
| |||||||
Total Consumer Staples | 463,053 | |||||||
|
| |||||||
TELECOMMUNICATION SERVICES - 0.3% |
| |||||||
Verizon Communications, Inc.1 | 750 | 30,090 | ||||||
MetroPCS Communications, Inc.*,1 | 1,053 | 9,140 | ||||||
Frontier Communications Corp.1 | 1,059 | 5,454 | ||||||
Telephone & Data Systems, Inc.1 | 80 | 2,071 | ||||||
AT&T, Inc.1 | 42 | 1,270 | ||||||
|
| |||||||
Total Telecommunication Services | 48,025 | |||||||
|
| |||||||
Total Common Stocks | 10,181,076 | |||||||
|
| |||||||
EXCHANGE TRADED FUNDS† - 0.9% |
| |||||||
iShares MSCI United Kingdom Index Fund1 | 5,428 | 87,716 | ||||||
iShares MSCI South Korea Index Fund1 | 546 | 28,534 | ||||||
iShares MSCI Singapore Index Fund1 | 1,241 | 13,440 | ||||||
Vanguard MSCI Emerging Markets ETF1 | 293 | 11,196 | ||||||
iShares MSCI France Index Fund1 | 485 | 9,496 | ||||||
iShares MSCI Sweden Index Fund1 | 348 | 8,749 | ||||||
iShares MSCI Spain Index Fund1 | 141 | 4,268 | ||||||
iShares MSCI Malaysia Index Fund1 | 293 | 3,926 | ||||||
iShares MSCI Australia Index Fund1 | 157 | 3,366 | ||||||
|
| |||||||
Total Exchange Traded Funds |
| 170,691 | ||||||
|
| |||||||
CLOSED-END FUNDS† - 10.3% | ||||||||
Gabelli Dividend & Income Trust1 | 6,522 | 100,569 | ||||||
Eaton Vance Risk-Managed Diversified Equity Income Fund1 | 9,125 | 95,356 | ||||||
Calamos Strategic Total Return Fund1 | 11,141 | 93,027 | ||||||
Royce Value Trust, Inc.1 | 7,528 | 92,369 | ||||||
CBRE Clarion Global Real Estate Income Fund1 | 13,100 | 89,604 | ||||||
Eaton Vance Enhanced Equity Income Fund II1 | 7,874 | 80,393 | ||||||
Western Asset/Claymore Inflation-Linked Opportunities & Income Fund1,4 | 6,070 | 76,543 | ||||||
BlackRock Enhanced Capital and Income Fund, Inc.1 | 5,889 | 72,435 | ||||||
Clough Global Opportunities Fund1 | 6,688 | 70,692 | ||||||
Liberty All Star Equity Fund1 | 14,914 | 62,937 | ||||||
Eaton Vance Enhanced Equity Income Fund1 | 6,033 | 61,416 | ||||||
Advent Claymore Convertible Securities and Income Fund1,4 | 3,920 | 57,742 | ||||||
Zweig Total Return Fund, Inc.1 | 18,419 | 55,810 | ||||||
Blackrock Credit Allocation Income Trust IV1 | 4,214 | 51,200 | ||||||
Adams Express Co.1 | 4,904 | 47,277 | ||||||
BlackRock Credit Allocation Income Trust II, Inc.1 | 4,672 | 45,926 | ||||||
AGIC Equity & Convertible Income Fund1 | 2,810 | 43,836 | ||||||
John Hancock Bank and Thrift Opportunity Fund1 | 3,139 | 43,004 | ||||||
Eaton Vance Tax-Managed Diversified Equity Income Fund1 | 4,817 | 42,727 | ||||||
H&Q Healthcare Investors1 | 2,970 | 41,907 | ||||||
Tri-Continental Corp.1 | 2,896 | 41,210 | ||||||
General American Investors Company, Inc.1 | 1,386 | 34,537 | ||||||
BlackRock Strategic Equity Dividend Trust1 | 3,347 | 32,801 | ||||||
Source Capital, Inc.1 | 619 | 29,081 | ||||||
GDL Fund1 | 2,442 | 28,816 | ||||||
Clough Global Equity Fund1 | 2,296 | 27,621 | ||||||
First Trust Enhanced Equity Income Fund1 | 2,503 | 27,107 | ||||||
Zweig Fund, Inc.1 | 9,328 | 27,051 | ||||||
Madison/Claymore Covered Call & Equity Strategy Fund1,4 | 3,563 | 26,616 | ||||||
Royce Micro-Capital Trust, Inc.1 | 2,724 | 23,887 | ||||||
Blackrock Credit Allocation Income Trust III, Inc.1 | 2,177 | 22,946 | ||||||
Japan Smaller Capitalization Fund, Inc.1 | 3,166 | 22,732 | ||||||
Nuveen Diversified Dividend and Income Fund1 | 2,046 | 20,992 | ||||||
Thai Fund, Inc.1 | 1,601 | 19,628 | ||||||
Clough Global Allocation Fund1 | 1,363 | 17,378 | ||||||
Nuveen Tax-Advantaged Total Return Strategy Fund1 | 1,751 | 16,739 | ||||||
Nuveen Multi-Strategy Income and Growth Fund1 | 2,072 | 16,597 | ||||||
Cohen & Steers Dividend Majors Fund, Inc.1 | 1,349 | 16,336 | ||||||
Lazard Global Total Return and Income Fund, Inc.1 | 1,133 | 15,171 | ||||||
LMP Capital and Income Fund, Inc.1 | 1,216 | 15,030 | ||||||
Gabelli Global Multimedia Trust, Inc.1 | 2,249 | 14,034 | ||||||
Swiss Helvetia Fund, Inc.1 | 1,371 | 13,641 | ||||||
LMP Real Estate Income Fund, Inc.1 | 1,375 | 12,719 | ||||||
DWS High Income Opportunities Fund, Inc.1 | 736 | 10,201 | ||||||
Royce Focus Trust, Inc.1 | 1,526 | 9,617 | ||||||
Madison Strategic Sector Premium Fund1 | 812 | 8,640 | ||||||
Liberty All Star Growth Fund, Inc.1 | 1,999 | 7,616 | ||||||
| See Notes to Financial Statements. | THE GUGGENHEIM FUNDSANNUALREPORT | 33 |
| CONSOLIDATED SCHEDULE OF INVESTMENTS (continued) | December 31, 2011 |
MULTI-HEDGE STRATEGIES FUND
| SHARES | VALUE | |||||||
Ellsworth Fund Ltd.1 | 1,115 | $ | 7,314 | |||||
Neuberger Berman Real Estate Securities Income Fund, Inc.1 | 1,579 | 5,921 | ||||||
Bancroft Fund Ltd.1 | 375 | 5,670 | ||||||
Gabelli Healthcare & WellnessRx Trust*,1 | 667 | 4,762 | ||||||
Diamond Hill Financial Trends Fund, Inc.1 | 512 | 4,234 | ||||||
Petroleum & Resources Corp.1 | 88 | 2,161 | ||||||
|
| |||||||
Total Closed-End Funds |
| 1,913,576 | ||||||
|
| |||||||
| FACE AMOUNT | ||||||||
REPURCHASE AGREEMENTS††,2 - 23.9% |
| |||||||
Mizuho Financial Group, Inc. | ||||||||
issued 12/30/11 at 0.00% due 01/03/12 | $ | 1,150,788 | 1,150,788 | |||||
HSBC Group | ||||||||
issued 12/30/11 at 0.00% due 01/03/12 | 1,101,604 | 1,101,604 | ||||||
Deutsche Bank | ||||||||
issued 12/30/11 at 0.00% due 01/03/12 | 1,101,604 | 1,101,604 | ||||||
Credit Suisse Group | ||||||||
issued 12/30/11 at 0.00% due 01/03/12 | 1,101,604 | 1,101,604 | ||||||
|
| |||||||
Total Repurchase Agreements |
| 4,455,600 | ||||||
|
| |||||||
Total Long Investments - 89.9% |
| $ | 16,720,943 | |||||
|
| |||||||
| SHARES | ||||||||
COMMON STOCKS SOLD SHORT† - (30.7)% |
| |||||||
TELECOMMUNICATION SERVICES - (0.4)% |
| |||||||
Crown Castle International Corp.* | 8 | (358 | ) | |||||
NII Holdings, Inc.* | 129 | (2,748 | ) | |||||
Sprint Nextel Corp.* | 2,310 | (5,405 | ) | |||||
tw telecom, Inc.* | 545 | (10,562 | ) | |||||
American Tower Corp. — Class A | 329 | (19,743 | ) | |||||
SBA Communications Corp. — Class A* | 916 | (39,351 | ) | |||||
|
| |||||||
Total Telecommunication Services | (78,167 | ) | ||||||
|
| |||||||
CONSUMER STAPLES - (1.3)% |
| |||||||
Altria Group, Inc. | 65 | (1,927 | ) | |||||
Clorox Co. | 38 | (2,529 | ) | |||||
Procter & Gamble Co. | 44 | (2,935 | ) | |||||
Brown-Forman Corp. — Class B | 47 | (3,784 | ) | |||||
Campbell Soup Co. | 190 | (6,316 | ) | |||||
Hansen Natural Corp.* | 76 | (7,003 | ) | |||||
PepsiCo, Inc. | 131 | (8,692 | ) | |||||
Bunge Ltd. | 254 | (14,529 | ) | |||||
Colgate-Palmolive Co. | 158 | (14,598 | ) | |||||
McCormick & Company, Inc. | 326 | (16,437 | ) | |||||
HJ Heinz Co. | 309 | (16,698 | ) | |||||
SUPERVALU, Inc. | 2,102 | (17,068 | ) | |||||
Mead Johnson Nutrition Co. | 254 | (17,457 | ) | |||||
Archer-Daniels-Midland Co. | 668 | (19,105 | ) | |||||
Hershey Co. | 317 | (19,584 | ) | |||||
Kellogg Co. | 389 | (19,672 | ) | |||||
Sara Lee Corp. | 1,040 | (19,677 | ) | |||||
Sysco Corp. | 693 | (20,326 | ) | |||||
Dean Foods Co.* | 1,966 | (22,019 | ) | |||||
|
| |||||||
Total Consumer Staples | (250,356 | ) | ||||||
|
| |||||||
MATERIALS - (1.4)% |
| |||||||
Kronos Worldwide, Inc. | 33 | (595 | ) | |||||
Molycorp, Inc.* | 94 | (2,254 | ) | |||||
Huntsman Corp. | 269 | (2,690 | ) | |||||
Solutia, Inc.* | 182 | (3,145 | ) | |||||
Compass Minerals International, Inc. | 51 | (3,511 | ) | |||||
Celanese Corp. — Class A | 87 | (3,852 | ) | |||||
Owens-Illinois, Inc.* | 266 | (5,155 | ) | |||||
Sonoco Products Co. | 224 | (7,383 | ) | |||||
Vulcan Materials Co. | 203 | (7,988 | ) | |||||
Intrepid Potash, Inc.* | 403 | (9,120 | ) | |||||
FMC Corp. | 110 | (9,464 | ) | |||||
Southern Copper Corp. | 465 | (14,034 | ) | |||||
Steel Dynamics, Inc. | 1,142 | (15,017 | ) | |||||
Valspar Corp. | 419 | (16,328 | ) | |||||
WR Grace & Co.* | 401 | (18,414 | ) | |||||
AK Steel Holding Corp. | 2,245 | (18,544 | ) | |||||
Titanium Metals Corp. | 1,273 | (19,070 | ) | |||||
Praxair, Inc. | 195 | (20,846 | ) | |||||
Commercial Metals Co. | 1,516 | (20,966 | ) | |||||
Scotts Miracle-Gro Co. — Class A | 452 | (21,104 | ) | |||||
Airgas, Inc. | 271 | (21,160 | ) | |||||
Martin Marietta Materials, Inc. | 388 | (29,259 | ) | |||||
|
| |||||||
Total Materials | (269,899 | ) | ||||||
|
| |||||||
HEALTH CARE - (2.0)% |
| |||||||
Patterson Companies, Inc. | 20 | (590 | ) | |||||
Allscripts Healthcare Solutions, Inc.* | 119 | (2,254 | ) | |||||
DENTSPLY International, Inc. | 97 | (3,394 | ) | |||||
DaVita, Inc.* | 47 | (3,563 | ) | |||||
Regeneron Pharmaceuticals, Inc.* | 76 | (4,213 | ) | |||||
Techne Corp. | 76 | (5,188 | ) | |||||
Brookdale Senior Living, Inc.* | 452 | (7,860 | ) | |||||
Human Genome Sciences, Inc.* | 1,422 | (10,509 | ) | |||||
Hologic, Inc.* | 617 | (10,804 | ) | |||||
Community Health Systems, Inc.* | 623 | (10,871 | ) | |||||
Covance, Inc.* | 250 | (11,430 | ) | |||||
Vertex Pharmaceuticals, Inc.* | 378 | (12,553 | ) | |||||
Charles River Laboratories International, Inc.* | 469 | (12,818 | ) | |||||
CareFusion Corp.* | 537 | (13,645 | ) | |||||
Amylin Pharmaceuticals, Inc.* | 1,274 | (14,498 | ) | |||||
Lincare Holdings, Inc. | 600 | (15,426 | ) | |||||
Quest Diagnostics, Inc. | 275 | (15,967 | ) | |||||
| 34 | THE GUGGENHEIM FUNDSANNUALREPORT | See Notes to Financial Statements. |
| CONSOLIDATED SCHEDULE OF INVESTMENTS (continued) | December 31, 2011 |
MULTI-HEDGE STRATEGIES FUND
| SHARES | VALUE | |||||||
Laboratory Corporation of America Holdings* | 186 | $ | (15,990 | ) | ||||
Warner Chilcott plc — Class A* | 1,112 | (16,825 | ) | |||||
Alere, Inc.* | 753 | (17,387 | ) | |||||
Health Net, Inc.* | 573 | (17,431 | ) | |||||
VCA Antech, Inc.* | 909 | (17,953 | ) | |||||
Bruker Corp.* | 1,446 | (17,959 | ) | |||||
Hospira, Inc.* | 609 | (18,495 | ) | |||||
Dendreon Corp.* | 2,452 | (18,635 | ) | |||||
Allergan, Inc. | 228 | (20,005 | ) | |||||
Express Scripts, Inc.* | 1,150 | (51,394 | ) | |||||
|
| |||||||
Total Health Care | (367,657 | ) | ||||||
|
| |||||||
CONSUMER DISCRETIONARY - (2.0)% |
| |||||||
Sirius XM Radio, Inc.* | 75 | (137 | ) | |||||
Best Buy Company, Inc. | 6 | (140 | ) | |||||
RadioShack Corp. | 25 | (243 | ) | |||||
Clear Channel Outdoor Holdings, Inc. — Class A* | 21 | (264 | ) | |||||
Weight Watchers International, Inc. | 6 | (330 | ) | |||||
Gannett Company, Inc. | 35 | (468 | ) | |||||
Marriott Vacations Worldwide Corp.* | 63 | (1,085 | ) | |||||
Wynn Resorts Ltd. | 11 | (1,215 | ) | |||||
Leggett & Platt, Inc. | 55 | (1,267 | ) | |||||
Scripps Networks Interactive, Inc. — Class A | 34 | (1,442 | ) | |||||
Hyatt Hotels Corp. — Class A* | 42 | (1,581 | ) | |||||
Dollar Tree, Inc.* | 25 | (2,078 | ) | |||||
McDonald’s Corp. | 21 | (2,107 | ) | |||||
Yum! Brands, Inc. | 38 | (2,242 | ) | |||||
Starwood Hotels & Resorts Worldwide, Inc. | 51 | (2,446 | ) | |||||
Tempur-Pedic International, Inc.* | 78 | (4,097 | ) | |||||
H&R Block, Inc. | 271 | (4,425 | ) | |||||
Johnson Controls, Inc. | 148 | (4,626 | ) | |||||
Guess?, Inc. | 169 | (5,040 | ) | |||||
WMS Industries, Inc.* | 294 | (6,033 | ) | |||||
Las Vegas Sands Corp.* | 148 | (6,324 | ) | |||||
Choice Hotels International, Inc. | 172 | (6,545 | ) | |||||
Tiffany & Co. | 102 | (6,759 | ) | |||||
Ross Stores, Inc. | 160 | (7,605 | ) | |||||
American Eagle Outfitters, Inc. | 541 | (8,272 | ) | |||||
Toll Brothers, Inc.* | 558 | (11,394 | ) | |||||
Ford Motor Co.* | 1,061 | (11,416 | ) | |||||
Home Depot, Inc. | 300 | (12,612 | ) | |||||
NVR, Inc.* | 20 | (13,720 | ) | |||||
Urban Outfitters, Inc.* | 507 | (13,973 | ) | |||||
DreamWorks Animation SKG, Inc. — Class A* | 846 | (14,039 | ) | |||||
Lamar Advertising Co. — Class A* | 533 | (14,658 | ) | |||||
Apollo Group, Inc. — Class A* | 283 | (15,245 | ) | |||||
Regal Entertainment Group — Class A | 1,353 | (16,155 | ) | |||||
International Game Technology | 1,013 | (17,424 | ) | |||||
Morningstar, Inc. | 300 | (17,835 | ) | |||||
Newell Rubbermaid, Inc. | 1,112 | (17,959 | ) | |||||
Marriott International, Inc. — Class A | 632 | (18,435 | ) | |||||
Goodyear Tire & Rubber Co.* | 1,383 | (19,597 | ) | |||||
Madison Square Garden Co. — Class A* | 693 | (19,848 | ) | |||||
CarMax, Inc.* | 672 | (20,483 | ) | |||||
TJX Companies, Inc. | 326 | (21,043 | ) | |||||
Bally Technologies, Inc.* | 541 | (21,402 | ) | |||||
|
| |||||||
Total Consumer Discretionary | (374,009 | ) | ||||||
|
| |||||||
ENERGY - (2.9)% |
| |||||||
Denbury Resources, Inc.* | 25 | (378 | ) | |||||
EXCO Resources, Inc. | 321 | (3,354 | ) | |||||
Noble Energy, Inc. | 42 | (3,964 | ) | |||||
Cabot Oil & Gas Corp. | 55 | (4,175 | ) | |||||
Schlumberger Ltd. | 80 | (5,465 | ) | |||||
Consol Energy, Inc. | 241 | (8,845 | ) | |||||
Energen Corp. | 199 | (9,950 | ) | |||||
Diamond Offshore Drilling, Inc. | 186 | (10,278 | ) | |||||
Ultra Petroleum Corp.* | 372 | (11,022 | ) | |||||
Sunoco, Inc. | 281 | (11,527 | ) | |||||
Southwestern Energy Co.* | 381 | (12,169 | ) | |||||
Alpha Natural Resources, Inc.* | 668 | (13,647 | ) | |||||
Newfield Exploration Co.* | 393 | (14,828 | ) | |||||
EOG Resources, Inc. | 152 | (14,974 | ) | |||||
Dresser-Rand Group, Inc.* | 313 | (15,622 | ) | |||||
Range Resources Corp. | 279 | (17,281 | ) | |||||
Cameron International Corp.* | 376 | (18,495 | ) | |||||
Teekay Corp. | 729 | (19,486 | ) | |||||
Cobalt International Energy, Inc.* | 1,268 | (19,679 | ) | |||||
Continental Resources, Inc.* | 300 | (20,013 | ) | |||||
FMC Technologies, Inc.* | 419 | (21,884 | ) | |||||
Kinder Morgan, Inc. | 2,218 | (71,353 | ) | |||||
Superior Energy Services, Inc.* | 7,237 | (205,820 | ) | |||||
|
| |||||||
Total Energy | (534,209 | ) | ||||||
|
| |||||||
INFORMATION TECHNOLOGY - (3.5)% |
| |||||||
Acme Packet, Inc.* | 9 | (278 | ) | |||||
Teradata Corp.* | 6 | (291 | ) | |||||
Amphenol Corp. — Class A | 17 | (772 | ) | |||||
Accenture plc — Class A | 17 | (905 | ) | |||||
Corning, Inc. | 89 | (1,155 | ) | |||||
Western Digital Corp.* | 42 | (1,300 | ) | |||||
IPG Photonics Corp.* | 58 | (1,964 | ) | |||||
Juniper Networks, Inc.* | 97 | (1,980 | ) | |||||
Yahoo!, Inc.* | 137 | (2,210 | ) | |||||
AOL, Inc.* | 271 | (4,092 | ) | |||||
ACI Worldwide, Inc.* | 220 | (6,301 | ) | |||||
Lender Processing Services, Inc. | 643 | (9,690 | ) | |||||
Citrix Systems, Inc.* | 161 | (9,776 | ) | |||||
CoreLogic, Inc.* | 774 | (10,008 | ) | |||||
Genpact Ltd.* | 693 | (10,360 | ) | |||||
NetApp, Inc.* | 352 | (12,767 | ) | |||||
QLogic Corp.* | 853 | (12,795 | ) | |||||
Micron Technology, Inc.* | 2,106 | (13,247 | ) | |||||
| See Notes to Financial Statements. | THE GUGGENHEIM FUNDSANNUALREPORT | 35 |
| CONSOLIDATED SCHEDULE OF INVESTMENTS (continued) | December 31, 2011 |
MULTI-HEDGE STRATEGIES FUND
| SHARES | VALUE | |||||||
Rovi Corp.* | 541 | $ | (13,298 | ) | ||||
Brocade Communications Systems, Inc.* | 2,576 | (13,369 | ) | |||||
Cognizant Technology Solutions Corp. — Class A* | 220 | (14,148 | ) | |||||
Salesforce.com, Inc.* | 140 | (14,204 | ) | |||||
Factset Research Systems, Inc. | 165 | (14,401 | ) | |||||
Cree, Inc.* | 668 | (14,723 | ) | |||||
Tellabs, Inc. | 3,648 | (14,738 | ) | |||||
National Instruments Corp. | 575 | (14,921 | ) | |||||
Western Union Co. | 846 | (15,448 | ) | |||||
LSI Corp.* | 2,603 | (15,488 | ) | |||||
Paychex, Inc. | 541 | (16,290 | ) | |||||
PMC - Sierra, Inc.* | 2,960 | (16,310 | ) | |||||
Ciena Corp.* | 1,488 | (18,005 | ) | |||||
Akamai Technologies, Inc.* | 561 | (18,109 | ) | |||||
Diebold, Inc. | 609 | (18,313 | ) | |||||
Dolby Laboratories, Inc. — Class A* | 605 | (18,459 | ) | |||||
MICROS Systems, Inc.* | 397 | (18,492 | ) | |||||
Itron, Inc.* | 526 | (18,815 | ) | |||||
FLIR Systems, Inc. | 753 | (18,878 | ) | |||||
ANSYS, Inc.* | 330 | (18,902 | ) | |||||
Advanced Micro Devices, Inc.* | 3,556 | (19,202 | ) | |||||
Trimble Navigation Ltd.* | 461 | (20,007 | ) | |||||
Silicon Laboratories, Inc.* | 461 | (20,017 | ) | |||||
Broadridge Financial Solutions, Inc. | 889 | (20,047 | ) | |||||
VeriSign, Inc. | 596 | (21,289 | ) | |||||
WebMD Health Corp. — Class A* | 596 | (22,380 | ) | |||||
Zebra Technologies Corp. — Class A* | 872 | (31,200 | ) | |||||
Lam Research Corp.* | 1,958 | (72,485 | ) | |||||
|
| |||||||
Total Information Technology | (651,829 | ) | ||||||
|
| |||||||
INDUSTRIALS - (3.8)% |
| |||||||
Owens Corning* | 22 | (632 | ) | |||||
Avery Dennison Corp. | 38 | (1,090 | ) | |||||
Equifax, Inc. | 34 | (1,317 | ) | |||||
GrafTech International Ltd.* | 118 | (1,611 | ) | |||||
WABCO Holdings, Inc.* | 40 | (1,736 | ) | |||||
Stericycle, Inc.* | 25 | (1,948 | ) | |||||
Copa Holdings S.A. — Class A | 34 | (1,995 | ) | |||||
3M Co. | 25 | (2,043 | ) | |||||
Polypore International, Inc.* | 56 | (2,463 | ) | |||||
Cooper Industries plc | 56 | (3,032 | ) | |||||
UTI Worldwide, Inc. | 248 | (3,296 | ) | |||||
United Technologies Corp. | 47 | (3,435 | ) | |||||
Fastenal Co. | 133 | (5,800 | ) | |||||
Terex Corp.* | 561 | (7,579 | ) | |||||
Ingersoll-Rand plc | 292 | (8,897 | ) | |||||
Spirit Aerosystems Holdings, Inc. — Class A* | 431 | (8,956 | ) | |||||
CH Robinson Worldwide, Inc. | 144 | (10,048 | ) | |||||
Deere & Co. | 135 | (10,442 | ) | |||||
Regal-Beloit Corp. | 209 | (10,653 | ) | |||||
PACCAR, Inc. | 285 | (10,679 | ) | |||||
Southwest Airlines Co. | 1,255 | (10,743 | ) | |||||
First Solar, Inc.* | 355 | (11,985 | ) | |||||
United Parcel Service, Inc. — Class B | 173 | (12,662 | ) | |||||
Covanta Holding Corp. | 934 | (12,786 | ) | |||||
Oshkosh Corp.* | 609 | (13,020 | ) | |||||
Expeditors International of Washington, Inc. | 326 | (13,353 | ) | |||||
Illinois Tool Works, Inc. | 296 | (13,826 | ) | |||||
Con-way, Inc. | 478 | (13,938 | ) | |||||
Graco, Inc. | 363 | (14,843 | ) | |||||
Carlisle Companies, Inc. | 342 | (15,151 | ) | |||||
Lennox International, Inc. | 452 | (15,255 | ) | |||||
Robert Half International, Inc. | 538 | (15,311 | ) | |||||
Valmont Industries, Inc. | 173 | (15,707 | ) | |||||
United Continental Holdings, Inc.* | 864 | (16,304 | ) | |||||
Iron Mountain, Inc. | 537 | (16,540 | ) | |||||
Masco Corp. | 1,638 | (17,166 | ) | |||||
AECOM Technology Corp.* | 841 | (17,299 | ) | |||||
Manitowoc Company, Inc. | 1,887 | (17,342 | ) | |||||
Manpower, Inc. | 495 | (17,696 | ) | |||||
J.B. Hunt Transport Services, Inc. | 393 | (17,713 | ) | |||||
Shaw Group, Inc.* | 675 | (18,158 | ) | |||||
Flowserve Corp. | 195 | (19,367 | ) | |||||
CoStar Group, Inc.* | 294 | (19,619 | ) | |||||
Crane Co. | 431 | (20,132 | ) | |||||
Toro Co. | 334 | (20,260 | ) | |||||
Quanta Services, Inc.* | 973 | (20,958 | ) | |||||
Boeing Co. | 292 | (21,418 | ) | |||||
Dun & Bradstreet Corp. | 287 | (21,476 | ) | |||||
Landstar System, Inc. | 464 | (22,235 | ) | |||||
Delta Air Lines, Inc.* | 3,122 | (25,257 | ) | |||||
Jacobs Engineering Group, Inc.* | 760 | (30,841 | ) | |||||
United Rentals, Inc.* | 2,223 | (65,690 | ) | |||||
|
| |||||||
Total Industrials | (701,703 | ) | ||||||
|
| |||||||
UTILITIES - (6.6)% |
| |||||||
UGI Corp. | 58 | (1,705 | ) | |||||
PG&E Corp. | 67 | (2,762 | ) | |||||
PPL Corp. | 106 | (3,119 | ) | |||||
AGL Resources, Inc. | 88 | (3,719 | ) | |||||
Hawaiian Electric Industries, Inc. | 305 | (8,076 | ) | |||||
TECO Energy, Inc. | 592 | (11,331 | ) | |||||
AES Corp.* | 1,090 | (12,906 | ) | |||||
National Fuel Gas Co. | 245 | (13,617 | ) | |||||
FirstEnergy Corp. | 347 | (15,372 | ) | |||||
Aqua America, Inc. | 727 | (16,030 | ) | |||||
GenOn Energy, Inc.* | 6,241 | (16,289 | ) | |||||
Public Service Enterprise Group, Inc. | 562 | (18,552 | ) | |||||
Calpine Corp.* | 1,146 | (18,714 | ) | |||||
NextEra Energy, Inc. | 317 | (19,299 | ) | |||||
Wisconsin Energy Corp. | 562 | (19,648 | ) | |||||
Dominion Resources, Inc. | 371 | (19,693 | ) | |||||
Questar Corp. | 1,002 | (19,900 | ) | |||||
Vectren Corp. | 664 | (20,073 | ) | |||||
| 36 | THE GUGGENHEIM FUNDSANNUALREPORT | See Notes to Financial Statements. |
| CONSOLIDATED SCHEDULE OF INVESTMENTS (continued) | December 31, 2011 |
MULTI-HEDGE STRATEGIES FUND
| SHARES | VALUE | |||||||
Integrys Energy Group, Inc. | 372 | $ | (20,155 | ) | ||||
MDU Resources Group, Inc. | 942 | (20,215 | ) | |||||
Southern Co. | 440 | (20,368 | ) | |||||
Exelon Corp. | 9,275 | (402,257 | ) | |||||
Duke Energy Corp. | 23,713 | (521,686 | ) | |||||
|
| |||||||
Total Utilities | (1,225,486 | ) | ||||||
|
| |||||||
FINANCIALS - (6.8)% | ||||||||
Regions Financial Corp. | 42 | (181 | ) | |||||
Hartford Financial Services Group, Inc. | 40 | (650 | ) | |||||
Invesco Ltd. | 34 | (683 | ) | |||||
BBCN Bancorp, Inc.* | 73 | (690 | ) | |||||
U.S. Bancorp | 27 | (730 | ) | |||||
Boston Properties, Inc. | 8 | (797 | ) | |||||
IntercontinentalExchange, Inc.* | 8 | (964 | ) | |||||
CNA Financial Corp. | 42 | (1,124 | ) | |||||
Moody’s Corp. | 35 | (1,179 | ) | |||||
First Horizon National Corp. | 155 | (1,240 | ) | |||||
Wells Fargo & Co. | 53 | (1,461 | ) | |||||
Arthur J Gallagher & Co. | 47 | (1,572 | ) | |||||
Associated Banc-Corp. | 143 | (1,597 | ) | |||||
SunTrust Banks, Inc. | 96 | (1,699 | ) | |||||
Raymond James Financial, Inc. | 58 | (1,796 | ) | |||||
Lincoln National Corp. | 111 | (2,156 | ) | |||||
KeyCorp | 331 | (2,545 | ) | |||||
TD Ameritrade Holding Corp. | 169 | (2,645 | ) | |||||
Aflac, Inc. | 64 | (2,769 | ) | |||||
Janus Capital Group, Inc. | 458 | (2,890 | ) | |||||
Affiliated Managers Group, Inc.* | 32 | (3,070 | ) | |||||
City National Corp. | 70 | (3,093 | ) | |||||
Allstate Corp. | 182 | (4,989 | ) | |||||
Zions Bancorporation | 337 | (5,486 | ) | |||||
Fulton Financial Corp. | 561 | (5,503 | ) | |||||
Plum Creek Timber Company, Inc. | 156 | (5,703 | ) | |||||
Digital Realty Trust, Inc. | 93 | (6,200 | ) | |||||
RenaissanceRe Holdings Ltd. | 93 | (6,916 | ) | |||||
Jefferies Group, Inc. | 505 | (6,944 | ) | |||||
Host Hotels & Resorts, Inc. | 512 | (7,562 | ) | |||||
CBOE Holdings, Inc. | 313 | (8,094 | ) | |||||
HCP, Inc. | 203 | (8,410 | ) | |||||
BOK Financial Corp. | 165 | (9,063 | ) | |||||
BRE Properties, Inc. | 182 | (9,187 | ) | |||||
Popular, Inc.* | 6,733 | (9,359 | ) | |||||
Waddell & Reed Financial, Inc. — Class A | 409 | (10,131 | ) | |||||
Forest City Enterprises, Inc. — Class A* | 865 | (10,224 | ) | |||||
American Express Co. | 241 | (11,368 | ) | |||||
Assured Guaranty Ltd. | 913 | (11,997 | ) | |||||
Everest Re Group Ltd. | 152 | (12,782 | ) | |||||
Hudson City Bancorp, Inc. | 2,050 | (12,813 | ) | |||||
BB&T Corp. | 511 | (12,862 | ) | |||||
Synovus Financial Corp. | 9,209 | (12,985 | ) | |||||
TCF Financial Corp. | 1,260 | (13,003 | ) | |||||
Brandywine Realty Trust | 1,387 | (13,177 | ) | |||||
Cullen | 251 | (13,280 | ) | |||||
Franklin Resources, Inc. | 140 | (13,448 | ) | |||||
Mack-Cali Realty Corp. | 537 | (14,333 | ) | |||||
Vornado Realty Trust | 190 | (14,603 | ) | |||||
Regency Centers Corp. | 397 | (14,935 | ) | |||||
Brown & Brown, Inc. | 665 | (15,049 | ) | |||||
Howard Hughes Corp.* | 344 | (15,195 | ) | |||||
Jones Lang LaSalle, Inc. | 250 | (15,315 | ) | |||||
Corporate Office Properties Trust | 748 | (15,903 | ) | |||||
Protective Life Corp. | 710 | (16,018 | ) | |||||
Goldman Sachs Group, Inc. | 182 | (16,458 | ) | |||||
Genworth Financial, Inc. — Class A* | 2,569 | (16,827 | ) | |||||
T. Rowe Price Group, Inc. | 297 | (16,914 | ) | |||||
Bank of America Corp. | 3,104 | (17,258 | ) | |||||
Northern Trust Corp. | 440 | (17,450 | ) | |||||
Eaton Vance Corp. | 761 | (17,990 | ) | |||||
Green Dot Corp. — Class A* | 588 | (18,357 | ) | |||||
PartnerRe Ltd. | 287 | (18,428 | ) | |||||
MSCI, Inc. — Class A* | 566 | (18,638 | ) | |||||
SLM Corp. | 1,416 | (18,974 | ) | |||||
Greenhill & Company, Inc. | 524 | (19,058 | ) | |||||
JPMorgan Chase & Co. | 585 | (19,451 | ) | |||||
Markel Corp.* | 47 | (19,490 | ) | |||||
Progressive Corp. | 1,002 | (19,549 | ) | |||||
Aspen Insurance Holdings Ltd. | 740 | (19,610 | ) | |||||
Capitol Federal Financial, Inc. | 1,708 | (19,710 | ) | |||||
State Street Corp. | 489 | (19,712 | ) | |||||
CIT Group, Inc.* | 566 | (19,736 | ) | |||||
General Growth Properties, Inc. | 1,332 | (20,007 | ) | |||||
Ventas, Inc. | 364 | (20,067 | ) | |||||
Cincinnati Financial Corp. | 676 | (20,591 | ) | |||||
Mercury General Corp. | 452 | (20,620 | ) | |||||
Health Care REIT, Inc. | 381 | (20,776 | ) | |||||
First Citizens BancShares, Inc. — Class A | 119 | (20,824 | ) | |||||
SEI Investments Co. | 1,201 | (20,837 | ) | |||||
PNC Financial Services Group, Inc. | 374 | (21,569 | ) | |||||
Old Republic International Corp. | 2,330 | (21,599 | ) | |||||
Bank of Hawaii Corp. | 492 | (21,889 | ) | |||||
TFS Financial Corp.* | 3,167 | (28,376 | ) | |||||
Alleghany Corp.* | 1,025 | (292,422 | ) | |||||
|
| |||||||
Total Financials | (1,261,555 | ) | ||||||
|
| |||||||
Total Common Stock Sold Short |
| (5,714,870 | ) | |||||
|
| |||||||
EXCHANGE TRADED FUNDS SOLD SHORT† - (11.7)% |
| |||||||
iShares MSCI Taiwan Index Fund | 154 | (1,803 | ) | |||||
iShares MSCI South Africa Index Fund | 43 | (2,626 | ) | |||||
iShares MSCI Austria Investable Market Index Fund | 211 | (3,000 | ) | |||||
iShares FTSE China 25 Index Fund | 92 | (3,208 | ) | |||||
| See Notes to Financial Statements. | THE GUGGENHEIM FUNDSANNUALREPORT | 37 |
| CONSOLIDATED SCHEDULE OF INVESTMENTS (continued) | December 31, 2011 |
MULTI-HEDGE STRATEGIES FUND
| SHARES | VALUE | |||||||
iShares MSCI Belgium Investable Market Index Fund | 365 | $ | (3,865 | ) | ||||
iShares MSCI Turkey Index Fund | 96 | (3,949 | ) | |||||
iShares MSCI Emerging Markets Index Fund | 112 | (4,249 | ) | |||||
iShares iBoxx Investment Grade Corporate Bond Fund | 39 | (4,437 | ) | |||||
iShares Barclays 7-10 Year Treasury Bond Fund | 75 | (7,918 | ) | |||||
Market Vectors Russia ETF | 329 | (8,768 | ) | |||||
iShares MSCI Germany Index Fund | 554 | (10,648 | ) | |||||
iShares MSCI EMU Index Fund | 484 | (13,504 | ) | |||||
iPath MSCI India Index ETN* | 332 | (15,478 | ) | |||||
iShares MSCI Italy Index Fund | 1,340 | (16,067 | ) | |||||
iShares MSCI Hong Kong Index Fund | 1,230 | (19,028 | ) | |||||
Market Vectors Gold Miners ETF | 392 | (20,161 | ) | |||||
iShares MSCI Chile Investable Market Index Fund | 354 | (20,429 | ) | |||||
iShares Barclays 20+ Year Treasury Bond Fund | 179 | (21,704 | ) | |||||
iShares Barclays 3-7 Year Treasury Bond Fund | 197 | (24,042 | ) | |||||
iShares MSCI BRIC Index Fund | 746 | (27,057 | ) | |||||
iShares MSCI Brazil Index Fund | 522 | (29,958 | ) | |||||
iShares MSCI Netherlands Investable Market Index Fund | 1,863 | (32,099 | ) | |||||
iShares MSCI Canada Index Fund | 1,313 | (34,926 | ) | |||||
iShares Barclays TIPS Bond Fund | 367 | (42,825 | ) | |||||
iShares MSCI Mexico Investable Market Index Fund | 835 | (44,890 | ) | |||||
Powershares QQQ Trust Series 1 | 824 | (46,004 | ) | |||||
iShares MSCI Switzerland Index Fund | 2,074 | (46,914 | ) | |||||
iShares MSCI EAFE Index Fund | 985 | (48,787 | ) | |||||
iShares MSCI Japan Index Fund | 6,089 | (55,471 | ) | |||||
iShares Barclays Aggregate Bond Fund | 553 | (60,968 | ) | |||||
iShares Dow Jones US Real Estate Index Fund | 1,541 | (87,513 | ) | |||||
SPDR Barclays Capital High Yield Bond ETF | 3,667 | (140,996 | ) | |||||
iShares Russell 2000 Index Fund | 3,111 | (229,250 | ) | |||||
SPDR S&P 500 ETF Trust | 1,978 | (248,239 | ) | |||||
iShares Russell 1000 Growth Index Fund | 5,490 | (317,267 | ) | |||||
iShares Russell 1000 Value Index Fund | 7,514 | (476,989 | ) | |||||
|
| |||||||
Total Exchange Traded Funds Sold Short |
| (2,175,037 | ) | |||||
|
| |||||||
Total Securities Sold Short - (42.4)% |
| $ | (7,889,907 | ) | ||||
|
| |||||||
Cash & Other Assets, Less Liabilities - 52.5% | 9,776,935 | |||||||
|
| |||||||
Total Net Assets - 100.0% | $ | 18,607,971 | ||||||
| ||||||||
| CONTRACTS | UNREALIZED GAIN (LOSS) | |||||||
COMMODITY FUTURES CONTRACTS PURCHASED† |
| |||||||
December 2012 Wheat |
| |||||||
Futures Contracts | ||||||||
(Aggregate Value of Contracts $648,900) | 18 | $ | 42,017 | |||||
May 2012 Feeder Cattle |
| |||||||
Futures Contracts | ||||||||
(Aggregate Value of Contracts $603,900) | 8 | 25,477 | ||||||
June 2012 Live Cattle |
| |||||||
Futures Contracts | ||||||||
(Aggregate Value of Contracts $599,520) | 12 | 16,905 | ||||||
May 2012 RBOB Gasoline |
| |||||||
Futures Contracts | ||||||||
(Aggregate Value of Contracts $698,166) | 6 | 8,811 | ||||||
May 2012 ICE Gas Oil |
| |||||||
Futures Contracts | ||||||||
(Aggregate Value of Contracts $634,375) | 7 | 4,477 | ||||||
April 2012 Heating Oil |
| |||||||
Futures Contracts | ||||||||
(Aggregate Value of Contracts $607,068) | 5 | 972 | ||||||
August 2012 Lean Hogs |
| |||||||
Futures Contracts | ||||||||
(Aggregate Value of Contracts $151,040) | 4 | (3,574 | ) | |||||
February 2012 Lean Hogs |
| |||||||
Futures Contracts | ||||||||
(Aggregate Value of Contracts $67,540) | 2 | (5,267 | ) | |||||
July 2012 WTI Crude |
| |||||||
Futures Contracts | ||||||||
(Aggregate Value of Contracts $596,580) | 6 | (8,207 | ) | |||||
August 2012 Lean Hogs |
| |||||||
Futures Contracts | ||||||||
(Aggregate Value of Contracts $453,120) | 12 | (11,741 | ) | |||||
September 2012 Soybean Oil |
| |||||||
Futures Contracts | ||||||||
(Aggregate Value of Contracts $668,304) | 21 | (35,194 | ) | |||||
July 2012 Sugar #11 |
| |||||||
Futures Contracts | ||||||||
(Aggregate Value of Contracts $557,603) | 22 | (49,685 | ) | |||||
September 2012 Corn |
| |||||||
Futures Contracts | ||||||||
(Aggregate Value of Contracts $705,238) | 23 | (49,973 | ) | |||||
| 38 | THE GUGGENHEIM FUNDSANNUALREPORT | See Notes to Financial Statements. |
| CONSOLIDATED SCHEDULE OF INVESTMENTS (continued) | December 31, 2011 |
MULTI-HEDGE STRATEGIES FUND
| CONTRACTS | UNREALIZED GAIN (LOSS) | |||||||
November 2012 Soybean |
| |||||||
Futures Contracts | ||||||||
(Aggregate Value of Contracts $604,000) | 10 | $ | (50,884 | ) | ||||
September 2012 Natural Gas |
| |||||||
Futures Contracts | ||||||||
(Aggregate Value of Contracts $555,220) | 17 | (95,217 | ) | |||||
|
| |||||||
(Total Aggregate Value of Contracts $8,150,574) | $ | (211,083 | ) | |||||
|
| |||||||
FUTURES CONTRACTS PURCHASED† |
| |||||||
March 2012 S&P 500 Index Mini |
| |||||||
Futures Contracts | ||||||||
(Aggregate Value of Contracts $2,878,450) | 46 | 48,815 | ||||||
February 2012 Volatility Index |
| |||||||
Futures Contracts | ||||||||
(Aggregate Value of Contracts $1,650,050) | 61 | (302,013 | ) | |||||
|
| |||||||
(Total Aggregate Value of Contracts $4,528,500) | $ | (253,198 | ) | |||||
|
| |||||||
COMMODITY FUTURES CONTRACTS SOLD SHORT† |
| |||||||
December 2012 Natural Gas |
| |||||||
Futures Contracts | ||||||||
(Aggregate Value of Contracts $747,600) | 20 | 83,255 | ||||||
March 2012 Cocoa |
| |||||||
Futures Contracts | ||||||||
(Aggregate Value of Contracts $210,700) | 10 | 64,292 | ||||||
February 2012 Heating Oil |
| |||||||
Futures Contracts | ||||||||
(Aggregate Value of Contracts $612,990) | 5 | 26,550 | ||||||
April 2012 Lean Hogs |
| |||||||
Futures Contracts | ||||||||
(Aggregate Value of Contracts $597,210) | 17 | 26,398 | ||||||
March 2012 Silver |
| |||||||
Futures Contracts | ||||||||
(Aggregate Value of Contracts $138,225) | 1 | 20,372 | ||||||
March 2013 Sugar #11 |
| |||||||
Futures Contracts | ||||||||
(Aggregate Value of Contracts $654,080) | 25 | 18,604 | ||||||
August 2012 ICE Gas Oil |
| |||||||
Futures Contracts | ||||||||
(Aggregate Value of Contracts $629,475) | 7 | 17,723 | ||||||
March 2012 WTI Crude |
| |||||||
Futures Contracts | ||||||||
(Aggregate Value of Contracts $594,540) | 6 | 13,552 | ||||||
January 2012 LME Lead |
| |||||||
Futures Contracts | ||||||||
(Aggregate Value of Contracts $151,346) | 3 | 12,700 | ||||||
July 2012 Soybean |
| |||||||
Futures Contracts | ||||||||
(Aggregate Value of Contracts $738,450) | 12 | 3,903 | ||||||
March 2012 Copper |
| |||||||
Futures Contracts | ||||||||
(Aggregate Value of Contracts $85,738) | 1 | 3,147 | ||||||
February 2012 Lean Hogs |
| |||||||
Futures Contracts | ||||||||
(Aggregate Value of Contracts $67,540) | 2 | 3,088 | ||||||
April 2012 RBOB Gasoline |
| |||||||
Futures Contracts | ||||||||
(Aggregate Value of Contracts $700,661) | 6 | 3,021 | ||||||
May 2012 Coffee ‘C’ |
| |||||||
Futures Contracts | ||||||||
(Aggregate Value of Contracts $258,750) | 3 | 2,465 | ||||||
July 2012 Cotton #2 |
| |||||||
Futures Contracts | ||||||||
(Aggregate Value of Contracts $227,125) | 5 | 1,520 | ||||||
March 2012 LME Zinc |
| |||||||
Futures Contracts | ||||||||
(Aggregate Value of Contracts $138,296) | 3 | (51 | ) | |||||
March 2012 LME Nickel |
| |||||||
Futures Contracts | ||||||||
(Aggregate Value of Contracts $112,284) | 1 | (4,906 | ) | |||||
March 2012 LME Primary Aluminum |
| |||||||
Futures Contracts | ||||||||
(Aggregate Value of Contracts $302,738) | 6 | (4,946 | ) | |||||
March 2012 Feeder Cattle |
| |||||||
Futures Contracts | ||||||||
(Aggregate Value of Contracts $595,200) | 8 | (7,476 | ) | |||||
April 2012 Live Cattle |
| |||||||
Futures Contracts | ||||||||
(Aggregate Value of Contracts $804,640) | 16 | (11,140 | ) | |||||
| See Notes to Financial Statements. | THE GUGGENHEIM FUNDSANNUALREPORT | 39 |
| CONSOLIDATED SCHEDULE OF INVESTMENTS (concluded) | December 31, 2011 |
MULTI-HEDGE STRATEGIES FUND
| CONTRACTS | UNREALIZED GAIN (LOSS) | |||||||
March 2012 Soybean Oil | ||||||||
Futures Contracts | ||||||||
(Aggregate Value of Contracts $786,150) | 25 | $ | (39,247 | ) | ||||
May 2012 Corn | ||||||||
Futures Contracts | ||||||||
(Aggregate Value of Contracts $688,275) | 21 | (44,220 | ) | |||||
May 2012 Wheat | ||||||||
Futures Contracts | ||||||||
(Aggregate Value of Contracts $772,800) | 23 | (54,402 | ) | |||||
|
| |||||||
(Total Aggregate Value of Contracts $10,614,813) | $ | 134,202 | ||||||
|
| |||||||
FUTURES CONTRACTS SOLD SHORT† |
| |||||||
March 2012 S&P MidCap 400 Index | ||||||||
Mini Futures Contracts | ||||||||
(Aggregate Value of Contracts $1,311,600) | 15 | 20,647 | ||||||
March 2012 Russell 2000 Index | ||||||||
Mini Futures Contracts | ||||||||
(Aggregate Value of Contracts $1,472,800) | 20 | (34,976 | ) | |||||
January 2012 Volatility Index | ||||||||
Futures Contracts | ||||||||
(Aggregate Value of Contracts $1,401,850) | 53 | (153,790 | ) | |||||
|
| |||||||
(Total Aggregate Value of Contracts $4,186,250) | $ | (168,119 | ) | |||||
|
| |||||||
CREDIT DEFAULT SWAPS PROTECTION SOLD††,3
INDEX | COUNTERPARTY | PROTECTION PREMIUM RATE | MATURITY DATE | NOTIONAL PRINCIPAL | NOTIONAL VALUE | UPFRONT PAYMENTS RECEIVED | UNREALIZED APPRECIATION | |||||||||||||||||||
CDX.NA.HY-17 Index | Barclays Bank plc | 5.00 | % | 12/20/16 | $ | 980,000 | $ | (911,400 | ) | $ | (77,407 | ) | $ | 8,807 | ||||||||||||
| * | Non-income producing security. |
| † | Value determined based on Level 1 inputs — See Note 4. |
| †† | Value determined based on Level 2 inputs — See Note 4. |
| 1 | All or a portion of this security is pledged as short security collateral at December 31, 2011. |
| 2 | Repurchase Agreements — See Note 5. |
| 3 | Credit Default Swaps — See Note 6. |
| 4 | Investment in a product that pays a management fee to a party related to the advisor. |
plc — Public Limited Company
REIT — Real Estate Investment Trust
| 40 | THE GUGGENHEIM FUNDSANNUALREPORT | See Notes to Financial Statements. |
MULTI-HEDGE STRATEGIES FUND
CONSOLIDATED STATEMENT OF ASSETS AND LIABILITIES
December 31, 2011
ASSETS: |
| |||
Investments, at value | $ | 12,265,343 | ||
Repurchase agreements, at value | 4,455,600 | |||
|
| |||
Total investments | 16,720,943 | |||
Segregated cash with broker | 10,057,536 | |||
Unrealized appreciation on swap agreements | 8,807 | |||
Cash | 866 | |||
Receivables: | ||||
Dividends | 17,847 | |||
Interest | 1,633 | |||
Securities sold | 855 | |||
Fund shares sold | 571 | |||
|
| |||
Total assets | 26,809,058 | |||
|
| |||
LIABILITIES: |
| |||
Securities sold short, at value | 7,889,907 | |||
Unamortized upfront premiums received on credit default swaps | 77,407 | |||
Payable for: | ||||
Securities purchased | 99,467 | |||
Fund shares redeemed | 89,872 | |||
Management fees | 18,468 | |||
Variation margin | 12,745 | |||
Miscellaneous | 13,221 | |||
|
| |||
Total liabilities | 8,201,087 | |||
|
| |||
NET ASSETS | $ | 18,607,971 | ||
|
| |||
NET ASSETS CONSISTOF: | ||||
Paid in capital | $ | 27,989,507 | ||
Accumulated net investment loss | (145,166 | ) | ||
Accumulated net realized loss on investments | (9,235,793 | ) | ||
Net unrealized depreciation on investments | (577 | ) | ||
|
| |||
Net assets | $ | 18,607,971 | ||
Capital shares outstanding | 845,668 | |||
Net asset value per share | $ | 22.00 | | |
|
| |||
CONSOLIDATED STATEMENT OF OPERATIONS
Year Ended December 31, 2011
INVESTMENT INCOME: | ||||
Dividends (net of foreign withholding tax of $565) | $ | 262,963 | ||
Interest | 1,659 | |||
|
| |||
Total investment income | 264,622 | |||
|
| |||
EXPENSES: | ||||
Management fees | 225,256 | |||
Short sales dividend expense | 174,709 | |||
Prime broker interest expense | 52,524 | |||
Trustees’ fees* | 2,765 | |||
Custodian fees | 123 | |||
Miscellaneous | 330 | |||
|
| |||
Total expenses | 455,707 | |||
Less Expenses waived by Advisor | (20,116 | ) | ||
|
| |||
Net expenses | 435,591 | |||
|
| |||
Net investment loss | (170,969 | ) | ||
|
| |||
NET REALIZEDAND UNREALIZED GAIN (LOSS): |
| |||
Net realized gain (loss) on: | ||||
Investments | (169,069 | ) | ||
Swap agreements | (286 | ) | ||
Futures contracts | 1,122,962 | |||
Securities sold short | 988,055 | |||
Realized gain distributions received from investment company shares | 14,689 | |||
|
| |||
Net realized gain | 1,956,351 | |||
|
| |||
Net change in unrealized appreciation (depreciation) on: | ||||
Investments | (1,429,537 | ) | ||
Securities sold short | 1,115,656 | |||
Swap agreements | 8,807 | |||
Futures contracts | (898,307 | ) | ||
|
| |||
Net change in unrealized appreciation (depreciation) | (1,203,381 | ) | ||
|
| |||
Net realized and unrealized gain | 752,970 | |||
|
| |||
Net increase in net assets resulting from operations | $ | 582,001 | ||
|
| |||
| * | Relates to Trustees not deemed “interested persons” within the meaning of Section 2(a)(19) of the 1940 Act. |
| See Notes to Financial Statements. | THE GUGGENHEIM FUNDSANNUALREPORT | 41 |
MULTI-HEDGE STRATEGIES FUND
CONSOLIDATED STATEMENTS OF CHANGES IN NET ASSETS
| Year Ended December 31, 2011 | Year Ended December 31, 2010 | |||||||
INCREASE (DECREASE) IN NET ASSETS FROM OPERATIONS: | ||||||||
Net investment loss | $ | (170,969 | ) | $ | (393,676 | ) | ||
Net realized gain on investments | 1,956,351 | 660,077 | ||||||
Net change in unrealized appreciation (depreciation) on investments | (1,203,381 | ) | 758,669 | |||||
|
|
|
| |||||
Net increase in net assets resulting from operations | 582,001 | 1,025,070 | ||||||
|
|
|
| |||||
CAPITAL SHARE TRANSACTIONS: | ||||||||
Proceeds from sale of shares | 13,784,351 | 17,748,501 | ||||||
Cost of shares redeemed | (13,395,324 | ) | (26,699,449 | ) | ||||
|
|
|
| |||||
Net increase (decrease) from capital share transactions | 389,027 | (8,950,948 | ) | |||||
|
|
|
| |||||
Net increase (decrease) in net assets | 971,028 | (7,925,878 | ) | |||||
NET ASSETS: | ||||||||
Beginning of year | 17,636,943 | 25,562,821 | ||||||
|
|
|
| |||||
End of year | $ | 18,607,971 | $ | 17,636,943 | ||||
|
|
|
| |||||
Undistributed/(Accumulated) net investment income/(loss) at end of year | $ | (145,166 | ) | $ | 226 | |||
|
|
|
| |||||
CAPITAL SHARE ACTIVITY: | ||||||||
Shares sold | 635,625 | 883,835 | ||||||
Shares redeemed | (617,928 | ) | (1,330,182 | ) | ||||
|
|
|
| |||||
Net increase (decrease) in shares | 17,697 | (446,347 | ) | |||||
|
|
|
| |||||
| 42 | THE GUGGENHEIM FUNDSANNUALREPORT | See Notes to Financial Statements. |
MULTI-HEDGE STRATEGIES FUND
FINANCIAL HIGHLIGHTS
This table is presented to show selected data for a share outstanding throughout each period and to assist shareholders in evaluating a Fund’s performance for the periods presented.
| Year Ended December 31, 2011a | Year Ended December 31, 2010a | Year Ended December 31, 2009a | Year Ended December 31, 2008 | Year Ended December 31, 2007 | ||||||||||||||||
Per Share Data | ||||||||||||||||||||
Net asset value, beginning of period | $ | 21.30 | $ | 20.06 | $ | 20.97 | $ | 25.95 | $ | 26.20 | ||||||||||
|
|
|
|
|
|
|
|
|
| |||||||||||
Income (loss) from investment operations: | ||||||||||||||||||||
Net investment income (loss)b | (.21 | ) | (.37 | ) | (.19 | ) | .16 | .74 | ||||||||||||
Net gain (loss) on investments (realized and unrealized) | .91 | 1.61 | (.50 | ) | (5.02 | ) | .27 | |||||||||||||
|
|
|
|
|
|
|
|
|
| |||||||||||
Total from investment operations | .70 | 1.24 | (.69 | ) | (4.86 | ) | 1.01 | |||||||||||||
|
|
|
|
|
|
|
|
|
| |||||||||||
Less distributions from: | ||||||||||||||||||||
Net investment income | — | — | (.22 | ) | (.12 | ) | (1.00 | ) | ||||||||||||
Net realized gains | — | — | — | — | (.26 | ) | ||||||||||||||
|
|
|
|
|
|
|
|
|
| |||||||||||
Total distributions | — | — | (.22 | ) | (.12 | ) | (1.26 | ) | ||||||||||||
|
|
|
|
|
|
|
|
|
| |||||||||||
Net asset value, end of period | $ | 22.00 | $ | 21.30 | $ | 20.06 | $ | 20.97 | $ | 25.95 | ||||||||||
|
|
|
|
|
|
|
|
|
| |||||||||||
Total Returnc | 3.38 | % | 6.18 | % | (3.28 | %) | (18.72 | %) | 3.84 | % | ||||||||||
|
|
|
|
|
|
|
|
|
| |||||||||||
Ratios/Supplemental Data | ||||||||||||||||||||
Net assets, end of period (in thousands) | $ | 18,608 | $ | 17,637 | $ | 25,563 | $ | 33,022 | $ | 31,437 | ||||||||||
|
|
|
|
|
|
|
|
|
| |||||||||||
Ratios to average net assets: | ||||||||||||||||||||
Net investment income (loss) | (0.96 | %) | (1.83 | %) | (0.95 | %) | 0.67 | % | 2.72 | % | ||||||||||
Total expensesd | 2.55 | % | 3.39 | % | 1.87 | % | 1.81 | % | 1.69 | % | ||||||||||
Net expensese | 2.44 | % | 3.26 | % | 1.84 | % | 1.81 | % | 1.69 | % | ||||||||||
Operating expensesf | 1.17 | % | 1.17 | % | 1.15 | % | 1.15 | % | 1.17 | % | ||||||||||
|
|
|
|
|
|
|
|
|
| |||||||||||
Portfolio turnover rate | 397 | % | 845 | % | 1,074 | % | 1,447 | % | 421 | % | ||||||||||
| a | Consolidated. |
| b | Net investment income (loss) per share was computed using average shares outstanding throughout the period. |
| c | Total return does not reflect the impact of any additional fees charged by insurance companies and has not been annualized. |
| d | Does not include expenses of the underlying funds in which the Fund invests. |
| e | Net expense information reflects the expense ratios after expense waivers. |
| f | Operating expenses exclude interest and dividend expense from securities sold short. |
| See Notes to Financial Statements. | THE GUGGENHEIM FUNDSANNUALREPORT | 43 |
| PERFORMANCE REPORT AND FUND PROFILE (Unaudited) | December 31, 2011 |
COMMODITIES STRATEGY FUND
OBJECTIVE: Seeks to provide investment results that correlate, before fees and expenses, to the performance of a benchmark for commodities. The Fund’s current benchmark is the S&P GSCI™ Commodity Index (the “underlying index”).
For the year ended December 31, 2011, the Fund returned -6.64%, compared with a return of -1.17% for its benchmark, the S&P Goldman Sachs Commodity Index (S&P GSCI®)*. The S&P GSCI represents an unleveraged, long-only investment in commodity futures that is broadly diversified across the spectrum of commodities. It provides exposure to tangible assets, such as oil, metals and agricultural products.
The index had its first decline since a 46% drop in 2008, with the commodities market experiencing a volatile year. The index rose 16% through April before falling 15% when investors worried whether the European debt crisis and a slowing Chinese economy could impact commodities’ growth. The strengthening dollar late in the year also corresponded with falling commodity prices.
Oil and gold were the only major commodities to post a significant increase for the year. Gold benefited from safe-haven buying, and rose about 10%, after hitting highs in September. Brent crude, unleaded gasoline, heating oil and gas oil all rose by more than 10%. Prices of many industrial metals, particularly those closely tied to Chinese production, fell. Copper, which is often regarded as a key indicator of the health of the global economy, dropped 22%. Aluminum, lead and nickel also dropped.
All the soft commodities (cotton, cocoa, coffee and sugar) posted negative double-digit returns.
Derivatives in the Fund are used to help provide exposure to the composition of the benchmark in the most efficient manner, as well as to provide liquidity.
| * | The S&P GSCI®, a benchmark for investment performance in the commodity markets, measures investable commodity price movements and inflation in the world economy. The index is calculated primarily on a world production weighted basis and is comprised of the principal physical commodities that are the subject of active, liquid futures markets. |
Performance displayed represents past performance which is no guarantee of future results.
Consolidated Holdings Diversification (Market Exposure as % of Net Assets)
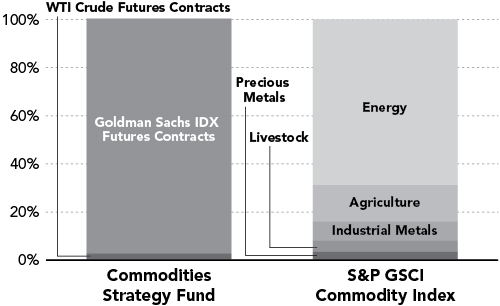
“Consolidated Holdings Diversification (Market Exposure as % of Net Assets)” excludes any temporary cash investments.
Inception Date: September 30, 2005
The Fund invests principally in derivative investments such as futures contracts.
44 | THE RYDEX FUNDANNUALREPORT
PERFORMANCE REPORT AND FUND PROFILE (Unaudited) (concluded)
Cumulative Fund Performance*
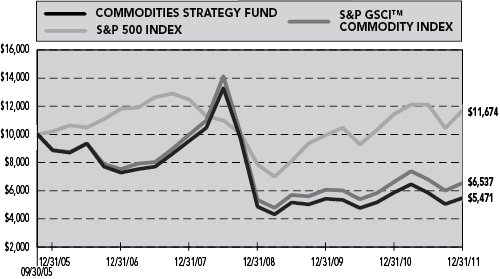
Average Annual Returns*
Periods Ended 12/31/11
| 1 Year | 5 Year | Since Inception (09/30/05) | ||||||||||
Commodities Strategy Fund | -6.64 | % | -5.55 | % | -9.20 | % | ||||||
S&P Goldman Sachs Commodity Index | -1.17 | % | -2.79 | % | -6.57 | % | ||||||
S&P 500 Index | 2.11 | % | -0.25 | % | 2.51 | % | ||||||
| * | The performance data represents past performance that is not predictive of future results. The investment return and principal value of an investment in the Fund will fluctuate so that an investor’s shares, when redeemed, may be worth more or less than their original cost. Returns are historical and include changes in principal and reinvested dividends and capital gains and do not reflect the effect of taxes. The S&P Goldman Sachs Commodity Index and the S&P 500 Index are unmanaged indices and, unlike the Fund, have no management fees or operating expenses to reduce their reported returns. Returns do not reflect the impact of any additional fees charged by insurance companies. |
THE RYDEX FUNDANNUALREPORT | 45
| CONSOLIDATED SCHEDULE OF INVESTMENTS | December 31, 2011 |
COMMODITIES STRATEGY FUND
| FACE AMOUNT | VALUE | |||||||
FEDERAL AGENCY DISCOUNT NOTES†† - 27.9% |
| |||||||
Federal Home Loan Bank1 | ||||||||
0.01% due 01/04/12 | $ | 1,000,000 | $ | 999,999 | ||||
Farmer Mac1 | ||||||||
0.01% due 01/04/12 | 1,000,000 | 999,999 | ||||||
Fannie Mae2 | ||||||||
0.02% due 02/13/12 | 1,000,000 | 999,982 | ||||||
|
| |||||||
Total Federal Agency Discount Notes |
| 2,999,980 | ||||||
|
| |||||||
REPURCHASE AGREEMENTS††,3 - 73.3% |
| |||||||
Mizuho Financial Group, Inc. | ||||||||
issued 12/30/11 at 0.00% due 01/03/12 | $ | 2,036,403 | 2,036,403 | |||||
HSBC Group | ||||||||
issued 12/30/11 at 0.00% due 01/03/12 | 1,949,369 | 1,949,369 | ||||||
Deutsche Bank | ||||||||
issued 12/30/11 at 0.00% due 01/03/12 | 1,949,369 | 1,949,369 | ||||||
Credit Suisse Group | ||||||||
issued 12/30/11 at 0.00% due 01/03/12 | 1,949,369 | 1,949,369 | ||||||
|
| |||||||
Total Repurchase Agreements |
| 7,884,510 | ||||||
|
| |||||||
Total Investments - 101.2% |
| $ | 10,884,490 | |||||
|
| |||||||
Liabilities, Less Cash & Other Assets - (1.2)% | (132,060 | ) | ||||||
|
| |||||||
Total Net Assets - 100.0% | $ | 10,752,430 | ||||||
| ||||||||
| CONTRACTS | UNREALIZED GAIN (LOSS) | |||||||
COMMODITY FUTURES CONTRACTS PURCHASED† |
| |||||||
February 2012 WTI Crude |
| |||||||
Futures Contracts | ||||||||
(Aggregate Value of Contracts $296,820) | 3 | $ | 15,451 | |||||
January 2012 Goldman Sachs IDX |
| |||||||
Futures Contracts | ||||||||
(Aggregate Value of Contracts $10,481,250) | 65 | (107,423 | ) | |||||
|
| |||||||
(Total Aggregate Market Value of Contracts $10,778,070) | $ | (91,972 | ) | |||||
|
| |||||||
| † | Value determined based on Level 1 inputs — See Note 4. |
| †† | Value determined based on Level 2 inputs — See Note 4. |
| 1 | The issuer operates under a Congressional charter; its securities are neither issued nor guaranteed by the U.S. Government. |
| 2 | On September 7, 2008, the issuer was placed in conservatorship by the Federal Housing Finance Agency (FHFA). As conservator, the FHFA has full powers to control the assets and operations of the firm. |
| 3 | Repurchase Agreements — See Note 5. |
| 46 | THE RYDEX FUNDANNUALREPORT | See Notes to Financial Statements. |
COMMODITIES STRATEGY FUND
CONSOLIDATED STATEMENT OF ASSETS AND LIABILITIES December 31, 2011
| ||||
ASSETS: | ||||
Investments, at value | $ | 2,999,980 | ||
Repurchase agreements, at value | 7,884,510 | |||
|
| |||
Total investments | 10,884,490 | |||
Segregated cash with broker | 768,600 | |||
Receivables: | ||||
Fund shares sold | 4,407 | |||
|
| |||
Total assets | 11,657,497 | |||
|
| |||
LIABILITIES: | ||||
Payable for: | ||||
Fund shares redeemed | 844,208 | |||
Variation margin | 22,911 | |||
Management fees | 6,926 | |||
Transfer agent and administrative fees | 2,309 | |||
Investor service fees | 2,309 | |||
Portfolio accounting fees | 923 | |||
Miscellaneous | 25,481 | |||
|
| |||
Total liabilities | 905,067 | |||
|
| |||
NET ASSETS | $ | 10,752,430 | ||
|
| |||
NET ASSETS CONSISTOF: | ||||
Paid in capital | $ | 29,673,752 | ||
Distributions in excess of net investment income | (1,734,738 | ) | ||
Accumulated net realized loss on investments | (17,094,612 | ) | ||
Net unrealized depreciation on investments | (91,972 | ) | ||
|
| |||
Net assets | $ | 10,752,430 | ||
Capital shares outstanding | 945,904 | |||
Net asset value per share | $ | 11.37 | ||
|
| |||
CONSOLIDATED STATEMENT OF OPERATIONS Year Ended December 31, 2011
| ||||
INVESTMENT INCOME: | ||||
Interest | $ | 7,723 | ||
|
| |||
Total investment income | 7,723 | |||
|
| |||
EXPENSES: | ||||
Management fees | 134,356 | |||
Transfer agent and administrative fees | 38,783 | |||
Investor service fees | 38,783 | |||
Portfolio accounting fees | 15,513 | |||
Professional fees | 15,062 | |||
Custodian fees | 3,920 | |||
Trustees’ fees* | 3,151 | |||
Miscellaneous | 22,958 | |||
|
| |||
Total expenses | 272,526 | |||
Less: | ||||
Expenses waived by Advisor | (18,268 | ) | ||
|
| |||
Net expenses | 254,258 | |||
|
| |||
Net investment loss | (246,535 | ) | ||
|
| |||
NET REALIZEDAND UNREALIZED GAIN (LOSS): | ||||
Net realized gain (loss) on: | ||||
Futures contracts | (707,206 | ) | ||
|
| |||
Net realized loss | (707,206 | ) | ||
|
| |||
Net change in unrealized appreciation (depreciation) on: | ||||
Investments | (49 | ) | ||
Futures contracts | (806,114 | ) | ||
|
| |||
Net change in unrealized appreciation (depreciation) | (806,163 | ) | ||
|
| |||
Net realized and unrealized loss | (1,513,369 | ) | ||
|
| |||
Net decrease in net assets resulting from operations | $ | (1,759,904 | ) | |
|
| |||
| * | Relates to Trustees not deemed “interested persons” within the meaning of Section 2(a)(19) of the 1940 Act. |
| See Notes to Financial Statements. | THE RYDEX FUNDANNUALREPORT | 47 |
COMMODITIES STRATEGY FUND
CONSOLIDATED STATEMENTS OF CHANGES IN NET ASSETS
| Year Ended December 31, 2011 | Year Ended December 31, 2010 | |||||||
INCREASE (DECREASE)IN NET ASSETSFROM OPERATIONS: | ||||||||
Net investment loss | $ | (246,535 | ) | $ | (226,691 | ) | ||
Net realized gain (loss) on investments | (707,206 | ) | 3,382,295 | |||||
Net change in unrealized appreciation (depreciation) on investments | (806,163 | ) | (2,751,943 | ) | ||||
|
|
|
| |||||
Net increase (decrease) in net assets resulting from operations | (1,759,904 | ) | 403,661 | |||||
|
|
|
| |||||
DISTRIBUTIONSTO SHAREHOLDERSFROM: | ||||||||
Net investment income | (1,290,600 | ) | — | |||||
|
|
|
| |||||
Total distributions to shareholders | (1,290,600 | ) | — | |||||
|
|
|
| |||||
CAPITAL SHARE TRANSACTIONS: | ||||||||
Proceeds from sale of shares | 56,637,342 | 25,577,179 | ||||||
Distributions reinvested | 1,290,600 | — | ||||||
Cost of shares redeemed | (60,130,934 | ) | (31,361,210 | ) | ||||
|
|
|
| |||||
Net decrease from capital share transactions | (2,202,992 | ) | (5,784,031 | ) | ||||
|
|
|
| |||||
Net decrease in net assets | (5,253,496 | ) | (5,380,370 | ) | ||||
NET ASSETS: | ||||||||
Beginning of year | 16,005,926 | 21,386,296 | ||||||
|
|
|
| |||||
End of year | $ | 10,752,430 | $ | 16,005,926 | ||||
|
|
|
| |||||
Distributions in excess of net investment income at end of year | $ | (1,734,738 | ) | $ | (316,416 | ) | ||
|
|
|
| |||||
CAPITAL SHARE ACTIVITY: | ||||||||
Shares sold | 4,150,818 | 2,072,547 | ||||||
Shares issued from reinvestment of distributions | 110,402 | — | ||||||
Shares redeemed | (4,492,928 | ) | (2,595,020 | ) | ||||
|
|
|
| |||||
Net decrease in shares | (231,708 | ) | (522,473 | ) | ||||
|
|
|
| |||||
| 48 | THE RYDEX FUNDANNUALREPORT | See Notes to Financial Statements. |
COMMODITIES STRATEGY FUND
FINANCIAL HIGHLIGHTS
This table is presented to show selected data for a share outstanding throughout each period and to assist shareholders in evaluating a Fund’s performance for the periods presented.
| Year Ended December 31, 2011a | Year Ended December 31, 2010a | Year Ended December 31, 2009a | Year Ended December 31, 2008 | Year Ended December 31, 2007 | ||||||||||||||||
Per Share Data | ||||||||||||||||||||
Net asset value, beginning of period | $ | 13.59 | $ | 12.58 | $ | 11.47 | $ | 23.78 | $ | 18.15 | ||||||||||
|
|
|
|
|
|
|
|
|
| |||||||||||
Income (loss) from investment operations: | ||||||||||||||||||||
Net investment income (loss)b | (.22 | ) | (.17 | ) | (.13 | ) | .15 | .71 | ||||||||||||
Net gain (loss) on investments (realized and unrealized) | (.65 | ) | 1.18 | 1.45 | (11.69 | ) | 4.92 | |||||||||||||
|
|
|
|
|
|
|
|
|
| |||||||||||
Total from investment operations | (.87 | ) | 1.01 | 1.32 | (11.54 | ) | 5.63 | |||||||||||||
|
|
|
|
|
|
|
|
|
| |||||||||||
Less distributions from: | ||||||||||||||||||||
Net investment income | (1.35 | ) | — | (.21 | ) | (.77 | ) | — | ||||||||||||
|
|
|
|
|
|
|
|
|
| |||||||||||
Total distributions | (1.35 | ) | — | (.21 | ) | (.77 | ) | — | ||||||||||||
|
|
|
|
|
|
|
|
|
| |||||||||||
Net asset value, end of period | $ | 11.37 | $ | 13.59 | $ | 12.58 | $ | 11.47 | $ | 23.78 | ||||||||||
|
|
|
|
|
|
|
|
|
| |||||||||||
Total Returnc | (6.64 | %) | 8.03 | % | 11.56 | % | (49.02 | %) | 31.02 | % | ||||||||||
|
|
|
|
|
|
|
|
|
| |||||||||||
Ratios/Supplemental Data | ||||||||||||||||||||
Net assets, end of period (in thousands) | $ | 10,752 | $ | 16,006 | $ | 21,386 | $ | 15,781 | $ | 43,624 | ||||||||||
|
|
|
|
|
|
|
|
|
| |||||||||||
Ratios to average net assets: | ||||||||||||||||||||
Net investment income (loss) | (1.59 | %) | (1.46 | %) | (1.10 | %) | 0.56 | % | 3.52 | % | ||||||||||
Total expenses | 1.76 | % | 1.67 | % | 1.58 | % | 1.50 | % | 1.48 | % | ||||||||||
Net expensesd | 1.64 | % | 1.58 | % | 1.46 | % | 1.29 | % | 1.28 | % | ||||||||||
|
|
|
|
|
|
|
|
|
| |||||||||||
Portfolio turnover rate | — | 69 | % | 359 | % | 427 | % | 346 | % | |||||||||||
| a | Consolidated. |
| b | Net investment income (loss) per share was computed using average shares outstanding throughout the period. |
| c | Total return does not reflect the impact of any additional fees charged by insurance companies and has not been annualized. |
| d | Net expense information reflects the expense ratios after expense waivers. |
| See Notes to Financial Statements. | THE RYDEX FUNDANNUALREPORT | 49 |
1. Organization, Consolidation of Subsidiary, and Significant Accounting Policies
Organization
The Rydex Variable Trust (the “Trust”), a Delaware business trust, is registered with the SEC under the Investment Company Act of 1940 (the “1940 Act”) as a non-diversified, open-ended investment company and is authorized to issue an unlimited number of no par value shares. The Trust offers shares of the funds to insurance companies for their variable annuity and variable life insurance contracts.
At December 31, 2011, the Trust consisted of fifty-seven separate funds. This report covers the Alternative Funds (the “Funds”), while the other funds are contained in separate reports.
Guggenheim Investments (“GI”) provides advisory services, and Rydex Fund Services, LLC (“RFS”) provides transfer agent, administrative, and accounting services to the Trust. Rydex Distributors, LLC (“RDL”) acts as principal underwriter for the Trust. GI, RFS and RDL are affiliated entities.
The Alternative Strategies Allocation Fund is a “fund of funds,” which means that the Fund seeks to achieve its investment objective by investing principally in a diversified portfolio of affiliated and unaffiliated funds (the “underlying funds”) instead of individual securities.
Consolidation of Subsidiary
The consolidated financial statements of the Managed Futures Strategy Fund, the Multi-Hedge Strategies Fund and the Commodities Strategy Fund include the accounts of a wholly-owned and controlled Cayman Islands subsidiary (the “Subsidiary”). Significant inter-company accounts and transactions have been eliminated in consolidation for the Funds.
Each Fund may invest up to 25% of its total assets in its Subsidiary which acts as an investment vehicle in order to effect certain investments consistent with the Fund’s investment objectives and policies.
A summary of each Fund’s investment in its respective Subsidiary is as follows:
| Inception Date of Subsidiary | Subsidiary Net Assets at December 31, 2011 | % of Total Net Assets of the Fund at December 31, 2011 | ||||||||||
Managed Futures Strategy Fund | 11/07/08 | $ | 1,107,577 | 7.6 | % | |||||||
Multi-Hedge Strategies Fund | 04/15/09 | 1,709,542 | 9.2 | % | ||||||||
Commodities Strategy Fund | 07/21/09 | 1,595,666 | 14.8 | % | ||||||||
Significant Accounting Policies
The following significant accounting policies are in conformity with U.S. generally accepted accounting principles and are consistently followed by the Trust. This requires management to make estimates and assumptions that affect the reported amount of assets and liabilities and disclosure of contingent assets and liabilities at the date of the financial statements and the reported amounts of revenues and expenses during the reporting period. Actual results could differ from these estimates. All time references are based on Eastern Time.
A. Equity securities listed on an exchange (New York Stock Exchange (“NYSE”) or American Stock Exchange) are valued at the last quoted sales price as of the close of business on the NYSE on the valuation date. Equity securities listed on the NASDAQ market system are valued at the NASDAQ Official Closing Price on the valuation date.
Listed options held by the Trust are valued at the Official Settlement Price listed by the exchange, usually as of 4:00 p.m. Long options are valued using the bid price and short options are valued using the ask price. In the event that a settlement price is not available, fair valuation is enacted. Over-the-counter options held by the Trust are valued using the average bid price (for long options), or average ask price (for short options) obtained from one or more security dealers.
The value of futures contracts purchased and sold by the Funds is accounted for using the unrealized gain or loss on the contracts that is determined by marking the contracts to their current realized settlement prices. Financial futures contracts are valued at the 4:00 p.m. price on the valuation date. In the event that the exchange for a specific futures contract closes earlier than 4:00 p.m., the futures contract is valued at the Official Settlement Price of the exchange. However, the underlying securities from which the futures contract value is derived are monitored until 4:00 p.m. to determine if fair valuation would provide a more accurate valuation.
Debt securities with a maturity of greater than 60 days at acquisition are valued at prices that reflect broker/dealer-supplied valuations or are obtained from independent pricing services, which may consider the trade activity, treasury spreads, yield or price of bonds of comparable quality, coupon, maturity, and type, as well as prices quoted by dealers who make markets in such securities. Short-term debt securities with a maturity of 60 days or less at acquisition and repurchase agreements are valued at amortized cost, which approximates market value.
Open-end investment companies (“Mutual Funds”) are valued at their NAV as of the close of business on the valuation date. Exchange Traded Funds (“ETFs”) and closed-end investment companies are valued at the last quoted sales price.
The value of credit default swap agreements entered into by a Fund is accounted for using the unrealized gain or loss on the agreements that is determined by marking the agreements to the last quoted value of the index that the swap pertains to at the close of the NYSE. The swap’s market value is then adjusted to include dividends accrued, financing charges and/or interest associated with the swap agreements.
50 | THE GUGGENHEIM FUNDSANNUALREPORT
NOTES TO FINANCIAL STATEMENTS (continued)
Investments for which market quotations are not readily available are fair valued as determined in good faith by GI under the direction of the Board of Trustees using methods established or ratified by the Board of Trustees. These methods include, but are not limited to: (i) general information as to how these securities and assets trade; (ii) in connection with futures contracts and options thereupon, and other derivative investments, information as to how (a) these contracts and other derivative investments trade in the futures or other derivative markets, respectively, and (b) the securities underlying these contracts and other derivative investments trade in the cash market; and (iii) other information and considerations, including current values in related markets.
B. Security transactions are recorded on the trade date for financial reporting purposes. Realized gains and losses from securities transactions are recorded using the identified cost basis. Proceeds from lawsuits related to investment holdings are recorded as realized gains. Dividend income is recorded on the ex-dividend date, net of applicable taxes withheld by foreign countries. Taxable non-cash dividends are recorded as dividend income. Interest income, including amortization of premiums and accretion of discount, is accrued on a daily basis. Distributions received from investments in REITs are recorded as dividend income on the ex-dividend date, subject to reclassification upon notice of the character of such distribution by the issuer.
C. Distributions of net investment income and net realized gains, if any, are declared and paid at least annually. Distributions are recorded on the ex-dividend date and are determined in accordance with income tax regulations which may differ from U.S. generally accepted accounting principles.
D. When a Fund engages in a short sale of a security, an amount equal to the proceeds is reflected as an asset and an equivalent liability. The amount of the liability is subsequently marked-to-market to reflect the market value of the short sale. The Fund maintains a segregated account of cash and/or securities as collateral for short sales. The Fund is exposed to market risk based on the amount, if any, that the market value of the security exceeds the market value of the securities in the segregated account.
Fees, if any, paid to brokers to borrow securities in connection with short sales are recorded as interest expense. In addition, the Fund must pay out the dividend rate of the equity or coupon rate of the treasury obligation to the lender and record this as an expense. Short dividend or interest expense is a cost associated with the investment objective of short sales transactions, rather than an operational cost associated with the day-to-day management of any mutual fund. The Funds may also receive rebate income from the broker resulting from the investment of the proceeds from securities sold short.
E. Upon the purchase of an option, the premium paid is recorded as an investment, the value of which is marked-to-market daily. If a purchased option expires, the Fund realizes a loss in the amount of the cost of the option. When the Fund enters into a closing sale transaction, it realizes a gain or loss depending on whether the proceeds from the closing sale transaction are greater or less than the cost of the option. If the Fund exercises a put option, it realizes a gain or loss from the sale of the underlying security and the proceeds from such sale will be decreased by the premium originally paid. When the Fund exercises a call option, the cost of the security purchased by the Fund upon exercise increases by the premium originally paid.
When the Fund writes (sells) an option, an amount equal to the premium received is entered in that Fund’s accounting records as an asset and equivalent liability. The amount of the liability is subsequently marked-to-market to reflect the current value of the option written. When a written option expires, or if the Fund enters into a closing purchase transaction, it realizes a gain (or loss if the cost of a closing purchase transaction exceeds the premium received when the option was sold).
F. Upon entering into a futures contract, a Fund deposits and maintains as collateral such initial margin as required by the exchange on which the transaction is affected. Pursuant to the contract, the Fund agrees to receive from or pay to the broker an amount of cash equal to the daily fluctuation in value of the contract. Such receipts or payments are known as variation margin and are recorded by the Fund as unrealized gains or losses. When the contract is closed, the Fund records a realized gain or loss equal to the difference between the value of the contract at the time it was opened and the value at the time it was closed.
G. Credit default swap agreements are marked-to-market daily and the change, if any, is recorded as unrealized gain or loss. Upfront payments received or made by a Fund are amortized over the expected life of the agreement. Periodic payments received or paid by a Fund are recorded as realized gains or losses. Payments received or made as a result of a credit event or termination of the contract are recognized, net of a proportional amount of the upfront payment, as realized gains or losses.
H. Investment securities and other assets and liabilities denominated in foreign currencies are translated into U.S. dollar amounts at the date of valuation. Purchases and sales of investment securities and income and expense items denominated in foreign currencies are translated into U.S. dollar amounts on the respective dates of such transactions. The Funds do not isolate that portion of the results of operations resulting from changes in foreign exchange rates on investments from the fluctuations arising from changes in market prices of securities held. Such fluctuations are included with the net realized and unrealized gain and loss from investments.
Reported net realized foreign exchange gains or losses arise from sales of foreign currencies and currency gains or losses realized between the trade and settlement dates on investment transactions. Net unrealized exchange gains and losses arise from changes in the fair values of assets and liabilities other than investments in securities at the fiscal period end, resulting from changes in exchange rates.
THE GUGGENHEIM FUNDSANNUALREPORT | 51
NOTES TO FINANCIAL STATEMENTS (continued)
I. Certain U.S. Government and Agency Obligations are traded on a discount basis; the interest rates shown on the Schedules of Investments reflect the effective rates paid at the time of purchase by the Funds. Other securities bear interest at the rates shown, payable at fixed dates through maturity.
J. The Funds may leave cash overnight in their cash account with the custodian, U.S. Bank. Periodically, a Fund may have cash due to the custodian bank as an overdraft balance. A fee is incurred on this overdraft, calculated by multiplying the overdraft by a rate based on the federal funds rate. Segregated cash with the broker is held as collateral for investments in derivative instruments such as futures contracts or swap agreements.
K. Throughout the normal course of business, the Funds enter into contracts that contain a variety of representations and warranties which provide general indemnifications. The Funds’ maximum exposure under these arrangements is unknown, as this would involve future claims that may be made against the Funds and/or their affiliates that have not yet occurred. However, based on experience, the Funds expect the risk of loss to be remote.
2. Financial Instruments
As part of their investment strategies, the Funds and certain underlying funds utilize short sales and a variety of derivative instruments, including options, futures and swap agreements. These investments involve, to varying degrees, elements of market risk and risks in excess of the amounts recognized in the Statements of Assets and Liabilities. A short sale is a transaction in which a Fund sells a security it does not own. If the security sold short decreases in price between the time the Fund sells the security and closes its short position, that Fund will realize a gain on the transaction. Conversely, if the security increases in price during the period, that Fund will realize a loss on the transaction. The risk of such price increases is the principal risk of engaging in short sales.
An option on a security gives the purchaser of the option the right to sell, and the writer of the option the obligation to buy, the underlying security (put option) or the purchaser of the option the right to buy, and the writer of the option the obligation to sell, the underlying security (call option) at any time during the option period. The risk associated with purchasing options is limited to the premium originally paid. The risk in writing a call option is that a Fund may incur a loss if the market price of the underlying security increases and the option is exercised. The risk in writing a put option is that a Fund may incur a loss if the market price of the underlying security decreases and the option is exercised. In addition, there may be an imperfect correlation between the movement in prices of options and the underlying securities and a Fund may not be able to enter into a closing transaction because of an illiquid secondary market or, for over-the-counter options, because of the counterparty’s inability to perform.
A futures contract is an agreement to purchase (long) or sell (short) an agreed amount of securities or other instruments at a set price for delivery at a future date. There are significant risks associated with a Fund’s or an underlying fund’s use of futures contracts and related options, including (i) there may be an imperfect or no correlation between the changes in market value of the underlying asset and the prices of futures contracts; (ii) there may not be a liquid secondary market for a futures contract; (iii) trading restrictions or limitations may be imposed by an exchange; and (iv) government regulations may restrict trading in futures contracts. When investing in futures, there is minimal counterparty credit risk to the Fund because futures are exchange-traded and the exchange’s clearinghouse, as counterparty to all exchange-traded futures, guarantees against default.
A swap is an agreement that obligates two parties to exchange a series of cash flows at specified intervals based upon or calculated by reference to changes in specified prices or rates for a specified amount of an underlying asset. A credit default swap enables a Fund to buy or sell protection against a defined credit event of an issuer or a basket of securities. Generally, the seller of credit protection against an issuer or basket of securities receives a periodic payment from the buyer to compensate against potential default events. If a default event occurs, the seller must pay the buyer the full notional value of the reference obligation in exchange for the reference obligation. If no default occurs, the counterparty will pay the stream of payments and have no further obligations to the Fund selling the credit protection. A Fund or an underlying fund bears the risk of loss of the amount expected to be received under a swap agreement in the event of the default or bankruptcy of a swap agreement counterparty, or in the case of a credit default swap in which the Fund is selling credit protection, the default of a third party issuer. Additionally, there is no guarantee that a Fund or an underlying fund could eliminate its exposure under an outstanding swap agreement by entering into an offsetting swap agreement with the same or another party.
In conjunction with the use of short sales, written options, futures and swap agreements, the Funds are required to maintain collateral in various forms. The Funds use, where appropriate, depending on the financial instrument utilized and the broker involved, margin deposits at the broker, cash and/or securities segregated at the custodian bank, discount notes, or the repurchase agreements allocated to each Fund.
The Trust has established counterparty credit guidelines and enters into transactions only with financial institutions of investment grade or better. The Trust monitors the counterparty credit risk.
52 | THE GUGGENHEIM FUNDSANNUALREPORT
NOTES TO FINANCIAL STATEMENTS (continued)
3. Fees and Other Transactions with Affiliates
Under the terms of an investment advisory contract, the Funds pay GI investment advisory fees calculated at the annualized rates below, based on the average daily net assets of the Funds for the year:
Fund | Management Fees (as a % of Net Assets) | |||
U.S. Long Short Momentum Fund | 0.90 | % | ||
Alternative Strategies Allocation Fund | — | |||
Managed Futures Strategy Fund | 0.90 | % | ||
Multi-Hedge Strategies Fund | 1.15 | % | ||
Commodities Strategy Fund | 0.75 | % | ||
GI has contractually agreed to waive the management fee it receives from each Subsidiary. This undertaking will continue in effect for so long as each Fund invests in the Subsidiary, and may not be terminated by GI unless GI obtains the prior approval of the Fund’s Board of Trustees for such termination. In any event, this undertaking will continue through April 30, 2012.
As part of its agreement with the Trust, GI will pay all expenses of the Multi-Hedge Strategies Fund, including the cost of transfer agency, custody, fund administration, legal, audit and other services, except interest expense, taxes (expected to be de minimis), brokerage commissions and other expenses connected with execution of portfolio transactions, short dividend expenses, and extraordinary expenses.
GI manages the investment and reinvestment of the assets of the Alternative Strategies Allocation Fund in accordance with the investment objectives, policies, and limitations of the Fund. As part of its agreement with the Trust, GI will pay all expenses of the Fund, including the cost of transfer agency, fund administration, audit and other services, excluding interest expense, taxes (expected to be de minimis), brokerage commissions and other expenses connected with the execution of portfolio transactions, short dividend expenses, and extraordinary expenses. The Fund indirectly bears a proportionate share of the total operating expenses (including investment management, shareholder servicing, custody, transfer agency, audit and other underlying fund expenses) of the underlying funds in which the Fund invests.
RFS provides transfer agent and administrative services to the Funds for fees calculated at an annualized rate of 0.25% of the average daily net assets of each Fund. Fees related to the Multi-Hedge Strategies and Alternative Strategies Allocation Funds are paid by GI, as previously noted.
RFS also provides accounting services to the Funds for fees calculated at annualized rates below, based on the average daily net assets each Fund. Fees related to the Multi-Hedge Strategies and Alternative Strategies Allocation Funds are paid by GI, as previously noted.
Fund Accounting Fees | (as a % of Net Assets) | |||
On the first $250 million | 0.10 | % | ||
On the next $250 million | 0.075 | % | ||
On the next $250 million | 0.05 | % | ||
Over $750 million | 0.03 | % | ||
GI engages external service providers to perform other necessary services for the Trust, such as audit and accounting related services, legal services, custody, printing and mailing, etc., on a pass-through basis. Such expenses are allocated to the various funds within the complex based on relative net assets. Certain expenses allocated to the Multi-Hedge Strategies and Alternative Strategies Allocation Funds are paid by GI, as previously noted.
The Trust has adopted an Investor Services Plan for which RDL and other firms that provide investor services (“Service Providers”) may receive compensation. The Funds will pay investor service fees to RDL at an annual rate not to exceed 0.25% of average daily net assets. RDL, in turn, will compensate Service Providers for providing such services, while retaining a portion of such payments to compensate itself for investor services it performs.
Certain officers and trustees of the Trust are also officers of GI, RFS and RDL.
4. Fair Value Measurement
In accordance with U.S. generally accepted accounting principles, fair value is defined as the price that the Fund would receive to sell an investment or pay to transfer a liability in an orderly transaction with an independent buyer in the principal market, or in the absence of a principal market the most advantageous market for the investment or liability. A three-tier hierarchy is utilized to distinguish between (1) inputs that reflect the assumptions market participants would use in pricing an asset or liability developed based on market data obtained from sources independent of the reporting entity (observable inputs) and (2) inputs that reflect the reporting entity’s own assumptions about the assumptions market participants would use in pricing an asset or liability developed based on the best information available in the circumstances (unobservable inputs) and to establish classification of fair value measurements for disclosure purposes. Various inputs are used in determining the value of the Funds’ investments.
THE GUGGENHEIM FUNDSANNUALREPORT | 53
| NOTES TO FINANCIAL STATEMENTS (continued) |
The inputs are summarized in the three broad levels listed below:
| Level 1 — | quoted prices in active markets for identical securities. | |
| Level 2 — | other significant observable inputs (including quoted prices for similar securities, interest rates, prepayment speeds, credit risk, etc.). | |
| Level 3 — | significant unobservable inputs (including the fund’s own assumptions used to determine the fair value of investments). | |
The inputs or methodologies used for valuing securities are not necessarily an indication of the risk associated with investing in those securities.
The following table summarizes the inputs used to value the Funds’ net assets at December 31, 2011:
| Level 1 Investments In Securities | Level 1 Other Financial Instruments* | Level 2 Investments In Securities | Level 2 Other Financial Instruments* | Level 3 Investments In Securities | Total | |||||||||||||||||||
Assets | ||||||||||||||||||||||||
U.S. Long Short Momentum Fund | $ | 31,987,722 | $ | — | $ | 7,918,458 | $ | — | $ | 277 | $ | 39,906,457 | ||||||||||||
Alternative Strategies Allocation Fund | 6,193,017 | 2,721 | 85,621 | — | — | 6,281,359 | ||||||||||||||||||
Managed Futures Strategy Fund | — | 248,307 | 13,971,865 | — | — | 14,220,172 | ||||||||||||||||||
Multi-Hedge Strategies Fund | 12,265,343 | 468,711 | 4,455,600 | 8,807 | — | 17,198,461 | ||||||||||||||||||
Commodities Strategy Fund | — | 15,451 | 10,884,490 | — | — | 10,899,941 | ||||||||||||||||||
Liabilities | ||||||||||||||||||||||||
U.S. Long Short Momentum Fund | $ | — | $ | 168 | $ | — | $ | — | $ | — | $ | 168 | ||||||||||||
Alternative Strategies Allocation Fund | — | 8,279 | — | — | — | 8,279 | ||||||||||||||||||
Managed Futures Strategy Fund | — | 139,865 | — | — | — | 139,865 | ||||||||||||||||||
Multi-Hedge Strategies Fund | 7,889,907 | 966,909 | — | — | — | 8,856,816 | ||||||||||||||||||
Commodities Strategy Fund | — | 107,423 | — | — | — | 107,423 | ||||||||||||||||||
| * | Other financial instruments include futures contracts and/or swaps, which are reported as unrealized gain/loss at period end. |
Transfers between investment levels may occur as the markets fluctuate and/or the availability of data used in an investment’s valuation changes. The funds recognize transfers between the levels as of the beginning of the period. During the year ended December 31, 2011, U.S. Long Short Momentum Fund had securities transfer from Level 3 to Level 1 as a result of quoted prices in an active market becoming available.
Following is a reconciliation of Level 3 assets for which significant unobservable inputs were used to determine fair value for the year ended December 31, 2011.
LEVEL 3 — Fair value measurement using significant unobservable inputs
| Securities | ||||
U.S. Long Short Momentum Fund | ||||
ASSETS: | ||||
Beginning Balance | $ | 8,000 | ||
Total realized gains or losses included in earnings | — | |||
Total unrealized gains or losses included in earnings | (2,545 | ) | ||
Issuances | 2,822 | |||
Transfers out of Level 3 | (8,000 | ) | ||
|
| |||
Ending Balance | $ | 277 | ||
|
| |||
5. Repurchase Agreements
The Funds transfer uninvested cash balances into a single joint account, the daily aggregate balance of which is invested in one or more repurchase agreements collateralized by obligations of the U.S. Treasury and U.S. Government Agencies. The collateral is in the possession of the Funds’ custodian and is evaluated to ensure that its market value exceeds, at a minimum, 102% of the original face amount of the repurchase agreements. Each Fund holds a pro rata share of the collateral based on the dollar amount of the repurchase agreement entered into by each Fund.
54 | THE GUGGENHEIM FUNDSANNUALREPORT
NOTES TO FINANCIAL STATEMENTS (continued)
At December 31, 2011, the collateral for the repurchase agreements in the joint account was as follows:
Counterparty and Terms of Agreement | Face Value | Repurchase Price | Collateral | Par Value | Fair Value | |||||||||||||
Mizuho Financial Group, Inc. | U.S. Treasury Note | |||||||||||||||||
0.00% | 0.25% - 1.50% | |||||||||||||||||
due 01/03/12 | $ | 54,060,482 | $ | 54,060,482 | 10/31/13 - 07/31/16 | $ | 53,866,200 | $ | 55,141,700 | |||||||||
Credit Suisse Group | U.S. Treasury Note | |||||||||||||||||
0.00% | 1.75% | |||||||||||||||||
due 01/03/12 | 69,318,327 | 69,318,327 | 05/31/16 | 67,471,800 | 70,704,824 | |||||||||||||
HSBC Group | U.S. Treasury STRIPS | |||||||||||||||||
0.00% | 0.00% | |||||||||||||||||
due 01/03/12 | 51,750,000 | 51,750,000 | 02/15/13 - 05/15/14 | 52,817,100 | 52,679,331 | |||||||||||||
U.S. Treasury Note | ||||||||||||||||||
2.63% | ||||||||||||||||||
06/30/14 | 100,000 | 105,740 | ||||||||||||||||
Deutsche Bank | U.S. Treasury Note | |||||||||||||||||
0.00% | 2.63% | |||||||||||||||||
due 01/03/12 | 51,750,000 | 51,750,000 | 11/15/20 | 48,930,100 | 52,785,053 | |||||||||||||
In the event of counterparty default, the Funds have the right to collect the collateral to offset losses incurred. There is potential loss to the Funds in the event the Funds are delayed or prevented from exercising their rights to dispose of the collateral securities, including the risk of a possible decline in the value of the underlying securities during the period while the Funds seek to assert their rights. The Funds’ investment advisor, acting under the supervision of the Board of Trustees, reviews the value of the collateral and the creditworthiness of those banks and dealers with which the Funds enter into repurchase agreements to evaluate potential risks.
6. Disclosures about Credit Derivatives
In accordance with its investment strategy, the Multi-Hedge Strategies Fund enters into credit default swaps as a seller of protection primarily to gain exposure similar to the high yield bond market. Credit default swaps are instruments which allow for the full or partial transfer of third party credit risk, with respect to a particular entity or entities, from one counterparty to the other. A seller of credit default swaps is selling credit protection or assuming credit risk with respect to the underlying entity or entities. If a credit event occurs, as defined under the terms of the swap agreement, the Fund will either (i) pay to the buyer of protection an amount equal to the notional amount of the swap and take delivery of the referenced obligation or underlying securities comprising the referenced index or (ii) pay a net settlement amount in the form of cash or securities equal to the notional amount of the swap less the recovery value of the referenced obligation or underlying securities comprising the referenced index. The Notional Principal reflects the maximum potential amount the Fund could be required to make as a seller of credit protection if a credit event occurs. As the seller of protection, the Fund receives periodic premium payments from the counterparty and may also receive or pay an upfront premium that serves as an adjustment to the stated periodic premium.
The quoted market prices and resulting market values for credit default swap agreements on securities and credit indices serve as an indicator of the current status of the payment/performance risk and represent the likelihood of an expected liability (or profit) for the credit derivative had the notional amount of the swap agreement been closed/sold as of the period end. Increasing market values, in absolute terms when compared to the notional amount of the swap, represent a deterioration of the referenced entity’s credit soundness and a greater likelihood or risk of default or other credit event occurring as defined under the terms of the agreement.
The table on page 40 included in the Schedule of Investments summarizes the information with regard to sold protection on credit default swap contracts as of December 31, 2011.
7. Derivative Investment Holdings Categorized by Risk Exposure
U.S. generally accepted accounting principles requires disclosures to enable investors to better understand how and why the Funds use derivative instruments, how these derivatives instruments are accounted for and their effects on the Funds’ financial position and results of operations.
The Funds invested in derivative instruments, including options, credit default swap agreements and futures for the following purposes:
Fund | Index Exposure | Liquidity | Hedging | Income | Speculation | |||||
U.S. Long Short Momentum Fund | X | X | X | |||||||
Alternative Strategies Allocation Fund | X | X | ||||||||
Managed Futures Strategy Fund | X | X | ||||||||
Multi-Hedge Strategies Fund | X | X | X | |||||||
Commodities Strategy Fund | X | X |
THE GUGGENHEIM FUNDSANNUALREPORT | 55
NOTES TO FINANCIAL STATEMENTS (continued)
The following table represents the notional amount of derivative instruments outstanding, as an approximate percentage of the Funds’ net assets on a daily basis, while the risk to the Fund is limited to the profit earned on such derivatives.
| Approximate percentage of Fund’s net assets on a daily basis | ||||||||
Fund | Long | Short | ||||||
U.S. Long Short Momentum Fund | 5 | % | 0 | % | ||||
Alternative Strategies Allocation Fund | 5 | % | 5 | % | ||||
Managed Futures Strategy Fund | 35 | % | 60 | % | ||||
Multi-Hedge Strategies Fund | 70 | % | 80 | % | ||||
Commodities Strategy Fund | 100 | % | 0 | % | ||||
The following is a summary of the location of derivative investments on the Funds’ Statements of Assets and Liabilities as of December 31, 2011:
Location on the Statements of Assets and Liabilities
Derivative Investments Type | Asset Derivatives | Liability Derivatives | ||
Equity/Currency/Commodity/Interest Rate contracts | Variation margin | Variation margin | ||
Credit Contracts | Unrealized appreciation on swap agreements | Unrealized depreciation on swap agreements |
The following table sets forth the fair value of the Funds’ derivative investments categorized by primary risk exposure at December 31, 2011:
Asset Derivative Investments Value | ||||||||||||||||||||||||
Fund | Futures Equity Contracts* | Futures Currency Contracts* | Futures Commodity Contracts* | Futures Interest Rate Contracts* | Swaps Credit Default Contracts | Total Value at December 31, 2011 | ||||||||||||||||||
U.S. Long Short Momentum Fund | $ | — | $ | — | $ | — | $ | — | $ | — | $ | — | ||||||||||||
Alternative Strategies Allocation Fund | 1,061 | 1,660 | — | — | — | 2,721 | ||||||||||||||||||
Managed Futures Strategy Fund | — | 66,405 | 140,265 | 41,637 | — | 248,307 | ||||||||||||||||||
Multi-Hedge Strategies Fund | 69,462 | — | 399,249 | — | 8,807 | 468,711 | ||||||||||||||||||
Commodities Strategy Fund | — | — | 15,451 | — | — | 15,451 | ||||||||||||||||||
Liability Derivative Investments Value | ||||||||||||||||||||||||
Fund | Futures Equity Contracts* | Futures Currency Contracts* | Futures Commodity Contracts* | Futures Interest Rate Contracts* | Swaps Credit Default Contracts | Total Value at December 31, 2011 | ||||||||||||||||||
U.S. Long Short Momentum Fund | $ | 168 | $ | — | $ | — | $ | — | $ | — | $ | 168 | ||||||||||||
Alternative Strategies Allocation Fund | 8,279 | — | — | — | — | 8,279 | ||||||||||||||||||
Managed Futures Strategy Fund | — | 15,161 | 124,704 | — | — | 139,865 | ||||||||||||||||||
Multi-Hedge Strategies Fund | 490,779 | — | 476,130 | — | — | 966,909 | ||||||||||||||||||
Commodities Strategy Fund | — | — | 107,423 | — | — | 107,423 | ||||||||||||||||||
| * | Includes cumulative appreciation (depreciation) of futures contracts as reported on the Schedule of Investments. Only current day’s variation margin is reported within the Statement of Assets and Liabilities. |
The following is a summary of the location of derivative investments on the Funds’ Statements of Operations for the year ended December 31, 2011:
Derivative Investment Type | Location of Gain (Loss) on Derivatives | |
Equity/Currency/Commodity/Interest Rate contracts | Net realized gain (loss) on futures contracts | |
Net change in unrealized appreciation (depreciation) on futures contracts | ||
Net realized gain (loss) on options written | ||
Credit Contracts | Net realized gain (loss) on swap agreements | |
Net change in unrealized appreciation (depreciation) on swap agreements |
56 | THE GUGGENHEIM FUNDSANNUALREPORT
NOTES TO FINANCIAL STATEMENTS (continued)
The following is a summary of the Funds’ realized gain (loss) and change in unrealized appreciation (depreciation) on derivative investments recognized on the Statements of Operations categorized by primary risk exposure for the year ended December 31, 2011:
Realized Gain (Loss) on Derivative Investments Recognized on the Statements of Operations | ||||||||||||||||||||||||||||
Fund | Futures Equity Contracts | Written Options Contracts | Futures Currency Contracts | Futures Commodity Contracts | Futures Interest Rate Contracts | Swaps Credit Default Contracts | Total | |||||||||||||||||||||
U.S. Long Short Momentum Fund | $ | (572,401 | ) | $ | — | $ | — | $ | — | $ | — | $ | — | $ | (572,401 | ) | ||||||||||||
Alternative Strategies Allocation Fund | 6,910 | — | 1,962 | — | 13,480 | — | 22,352 | |||||||||||||||||||||
Managed Futures Strategy Fund | — | 747 | (301,705 | ) | (596,708 | ) | 384,606 | — | (513,060 | ) | ||||||||||||||||||
Multi-Hedge Strategies Fund | 254,472 | — | (14,513 | ) | 702,434 | 180,569 | (286 | ) | 1,122,676 | |||||||||||||||||||
Commodities Strategy Fund | — | — | — | (707,206 | ) | — | — | (707,206 | ) | |||||||||||||||||||
Change in Unrealized Appreciation (Depreciation) on Derivative Investments Recognized on the Statements of Operations | ||||||||||||||||||||||||||||
Fund | Futures Equity Contracts | Written Options Contracts | Futures Currency Contracts | Futures Commodity Contracts | Futures Interest Rate Contracts | Swaps Credit Default Contracts | Total | |||||||||||||||||||||
U.S. Long Short Momentum Fund | $ | 54,928 | $ | — | $ | — | $ | — | $ | — | $ | — | $ | 54,928 | ||||||||||||||
Alternative Strategies Allocation Fund | (7,218 | ) | — | 1,660 | — | — | (5,558 | ) | ||||||||||||||||||||
Managed Futures Strategy Fund | — | — | 53,882 | (658,830 | ) | (13,090 | ) | — | (618,038 | ) | ||||||||||||||||||
Multi-Hedge Strategies Fund | (373,791 | ) | — | 622 | (525,138 | ) | — | 8,807 | (889,500 | ) | ||||||||||||||||||
Commodities Strategy Fund | — | — | — | (806,114 | ) | — | — | (806,114 | ) | |||||||||||||||||||
8. Call Options Written
Transactions in options written during the year ended December 31, 2011 were as follows:
| Managed Futures Strategy Fund | ||||||||
| Number of Contracts | Premium Amount | |||||||
Options outstanding at December 31, 2010 | — | $ | — | |||||
Options written | 10 | 16,266 | ||||||
Options terminated in closing purchase transactions | (10 | ) | (16,266 | ) | ||||
Options expired | — | — | ||||||
Options exercised | — | — | ||||||
|
|
|
| |||||
Options outstanding at December 31, 2011 | — | $ | — | |||||
9. Federal Income Tax Information
The Funds intend to comply with the provisions of Subchapter M of the Internal Revenue Code applicable to regulated investment companies and distribute substantially all taxable net investment income and capital gains sufficient to relieve it from all, or substantially all, federal income, excise and state income taxes. Therefore, no provision for federal or state income tax is required.
Tax positions taken or expected to be taken in the course of preparing the Funds’ tax returns are evaluated to determine whether the tax positions are “more-likely-than-not” of being sustained by the applicable tax authority. Tax positions not deemed to meet the more-likely-than-not threshold would be recorded as a tax benefit or expense in the current year. Management has analyzed the Funds’ tax positions taken on Federal income tax returns for all open tax years (fiscal years 2008-2011), and has concluded that no provision for income tax is required in the Funds’ financial statements.
The Managed Futures Strategy Fund, the Multi-Hedge Strategies Fund, and the Commodities Strategy Fund intend to invest up to 25% of their assets in the Subsidiary which is expected to provide the Funds with exposure to the commodities markets within the limitations of the federal tax requirements under Subchapter M of the Internal Revenue Code. The Managed Futures Strategy Fund, the Multi-Hedge Strategies Fund, and the Commodities Strategy Fund have received a private letter ruling from the IRS that concludes that the income the Funds receive from the Subsidiary will constitute qualifying income for purposes of Subchapter M of the Internal Revenue Code. The Subsidiary will be classified as a corporation for U.S. federal income tax purposes. A foreign corporation, such as the Subsidiary, will generally not be subject to U.S. federal income taxation unless it is deemed to be engaged in a U.S. trade or business.
THE GUGGENHEIM FUNDSANNUALREPORT | 57
NOTES TO FINANCIAL STATEMENTS (continued)
The RIC Modernization Act of 2010 was signed into law on December 22, 2010 and seeks to simplify some of the tax provisions applicable to regulated investment companies and the tax reporting to their shareholders, and to improve the tax efficiency of certain fund structures. The changes are generally effective for taxable years beginning after the date of enactment.
One of the more prominent changes addresses capital loss carryforwards. Funds will be permitted to carryforward capital losses incurred in taxable years beginning after December 22, 2010 for an unlimited period. However, any losses incurred during those future taxable years will be required to be utilized prior to the losses incurred in pre-enactment taxable years. Under pre-enactment law, capital losses could be carried forward for eight years, and carried forward as short-term capital, irrespective of the character of the original loss. As a result of this ordering rule, pre-enactment capital loss carryforwards may potentially expire unused. Additionally, post-enactment capital losses that are carried forward will retain their character as either short-term or long-term capital losses rather than being considered all short-term as under previous law.
Tax basis capital losses in excess of capital gains are carried forward to offset future net capital gains. For the year ended December 31, 2011, the following capital loss carryforward amounts expired, were used, or were permanently lost due to loss limitation rules in Section 382 of the Internal Revenue Code:
Fund | Amount | |||
U.S. Long Short Momentum Fund | $ | 2,227,180 | ||
Multi-Hedge Strategies Fund | 827,713 | |||
The tax character of distributions paid during the year ended December 31, 2011 was as follows:
Fund | Ordinary Income | Long-Term Capital Gain | Total Distributions | |||||||||
U.S. Long Short Momentum Fund | $ | — | $ | — | $ | — | ||||||
Alternative Strategies Allocation Fund | 141,405 | — | 141,405 | |||||||||
Managed Futures Strategy Fund | — | — | — | |||||||||
Multi-Hedge Strategies Fund | — | — | — | |||||||||
Commodities Strategy Fund | 1,290,600 | — | 1,290,600 | |||||||||
The tax character of distributions paid during the year ended December 31, 2010 was as follows:
Fund | Ordinary Income | Long-Term Capital Gain | Total Distributions | |||||||||
U.S. Long Short Momentum Fund | $ | — | $ | — | $ | — | ||||||
Alternative Strategies Allocation Fund | 17,835 | — | 17,835 | |||||||||
Managed Futures Strategy Fund | — | — | — | |||||||||
Multi-Hedge Strategies Fund | — | — | — | |||||||||
Commodities Strategy Fund | — | — | — | |||||||||
Note: For federal income tax purposes, short term capital gain distributions are treated as ordinary income distributions.
The tax character of distributable earnings/(accumulated losses) at December 31, 2011 was as follows:
Fund | Undistributed Ordinary Income | Undistributed Long-Term Capital Gain | Net Unrealized Appreciation (Depreciation) | Capital Loss Carryforward1 | ||||||||||||
U.S. Long Short Momentum Fund | $ | — | $ | — | $ | 1,385,704 | $ | (20,115,060 | ) | |||||||
Alternative Strategies Allocation Fund | 100,597 | — | (190,696 | ) | (758,713 | ) | ||||||||||
Managed Futures Strategy Fund | — | — | 15,562 | (819,604 | ) | |||||||||||
Multi-Hedge Strategies Fund | 166,398 | — | 47,450 | (9,590,588 | ) | |||||||||||
Commodities Strategy Fund | — | — | (1,826,710 | ) | (17,094,612 | ) | ||||||||||
Capital Loss Carryforward amounts may be limited due to Federal income tax regulations.
| 1 | A summary of the expiration of the aforementioned Capital Loss Carryforward is as follows: |
Fund | Expires in 2014 | Expires in 2015 | Expires in 2016 | Expires in 2017 | Expires in 2018 | Unlimited | Total Capital Loss Carryforward | |||||||||||||||||||||||||
| Short Term | Long Term | |||||||||||||||||||||||||||||||
U.S. Long Short Momentum Fund | $ | — | $ | — | $ | (20,115,060 | ) | $ | — | $ | — | $ | — | $ | — | $ | (20,115,060 | ) | ||||||||||||||
Alternative Strategies Allocation Fund | — | — | (8,821 | ) | (360,763 | ) | (218,950 | ) | — | (170,179 | ) | (758,713 | ) | |||||||||||||||||||
Managed Futures Strategy Fund | — | — | — | (321,144 | ) | (369,399 | ) | (51,625 | ) | (77,436 | ) | (819,604 | ) | |||||||||||||||||||
Multi-Hedge Strategies Fund | — | (1,258,216 | ) | (5,142,097 | ) | (3,190,275 | ) | — | — | — | (9,590,588 | ) | ||||||||||||||||||||
Commodities Strategy Fund | (2,783,728 | ) | — | (4,932,556 | ) | (9,377,788 | ) | — | — | (540 | ) | (17,094,612 | ) | |||||||||||||||||||
58 | THE GUGGENHEIM FUNDSANNUALREPORT
NOTES TO FINANCIAL STATEMENTS (continued)
Net investment income and net realized gains (losses) may differ for financial statement and tax purposes because of temporary or permanent book/tax differences. These differences are primarily due to post-October losses, losses deferred due to wash sales, foreign currency gains and losses, and the “mark-to-market” of certain passive foreign investment companies (PFICs) for tax purposes. Additional differences may result from the tax treatment of net investment losses and expired capital loss carryforwards. To the extent these differences are permanent, reclassifications are made to the appropriate equity accounts in the period that the differences arise. These reclassifications have no effect on net assets or NAV per share.
On the Statements of Assets and Liabilities, the following reclassifications were made for permanent book/tax differences:
Fund | Paid In Capital | Undistributed Net Investment Income | Accumulated Net Realized Gain (Loss) | |||||||||
U.S. Long Short Momentum Fund | $ | (75,446 | ) | $ | 121,744 | $ | (46,298 | ) | ||||
Alternative Strategies Allocation Fund | — | 60,117 | (60,117 | ) | ||||||||
Managed Futures Strategy Fund | (919,175 | ) | 323,213 | 595,962 | ||||||||
Multi-Hedge Strategies Fund | 649,429 | 25,577 | (675,006 | ) | ||||||||
Commodities Strategy Fund | (827,334 | ) | 118,813 | 708,521 | ||||||||
At December 31, 2011, the cost of securities for Federal income tax purposes, the aggregate gross unrealized gain for all securities for which there was an excess of value over tax cost and the aggregate gross unrealized loss for all securities for which there was an excess of tax cost over value, were as follows:
Fund | Tax Cost | Tax Unrealized Gain | Tax Unrealized Loss | Net Unrealized Gain (Loss) | ||||||||||||
U.S. Long Short Momentum Fund | $ | 38,520,753 | $ | 2,646,688 | $ | (1,260,984 | ) | $ | 1,385,704 | |||||||
Alternative Strategies Allocation Fund | 6,464,928 | 6,042 | (192,332 | ) | (186,290 | ) | ||||||||||
Managed Futures Strategy Fund | 13,971,865 | — | — | — | ||||||||||||
Multi-Hedge Strategies Fund | 16,689,704 | 499,727 | (468,488 | ) | 31,239 | |||||||||||
Commodities Strategy Fund | 12,619,228 | — | (1,734,738 | ) | (1,734,738 | ) | ||||||||||
10. Securities Transactions
For the year ended December 31, 2011, the cost of purchases and proceeds from sales of investment securities, excluding government securities and short-term investments, were:
| Purchases | Sales | |||||||
U.S. Long Short Momentum Fund | $ | 74,358,734 | $ | 95,419,766 | ||||
Alternative Strategies Allocation Fund | 7,157,791 | 8,015,045 | ||||||
Managed Futures Strategy Fund | — | — | ||||||
Multi-Hedge Strategies Fund | 18,503,019 | 19,740,058 | ||||||
Commodities Strategy Fund | — | — | ||||||
11. Line of Credit
The Trust, along with other affiliated trusts, has secured an uncommitted, $75,000,000 line of credit with U.S. Bank, N.A. for emergency or temporary purposes. Borrowings, if any, under this arrangement bear interest equal to the Prime Rate, minus 2%, which shall be paid monthly, averaging 1.25% for the year ended December 31, 2011. At December 31, 2011, the Funds did not have any borrowings under this agreement, which expires on June 15, 2012, but the following table illustrates average daily balances borrowed:
Fund | Average Daily Balance | |||
U.S. Long Short Momentum Fund | $ | 92,819 | ||
Alternative Strategies Allocation Fund | 1,044 | |||
Multi-Hedge Strategies Fund | 11,079 | |||
12. Legal Proceedings
Tribune Company
In November 2010, Rydex Variable Trust was named as a defendant and a putative member of the proposed defendant class of shareholders in the case entitled The Official Committee of Unsecured Creditors of Tribune Company, on behalf of Tribune Company, et al., Plaintiff v. Dennis J. Fitzsimons, et al. (In re Tribune Company) as a result of ownership of shares in the Tribune Company (“Tribune”) in 2007 by certain series of the Rydex Variable Trust when Tribune effected a leveraged buyout transaction (“LBO”) by which Tribune converted to a privately-held company. In its complaint, the Unsecured Creditors Committee (the “UCC”) has alleged that, in connection with the LBO, insiders and major shareholders were overpaid for their Tribune stock using financing that the insiders knew would, and ultimately did, leave the Tribune insolvent. The UCC has asserted claims against
THE GUGGENHEIM FUNDSANNUALREPORT | 59
NOTES TO FINANCIAL STATEMENTS (concluded)
certain insiders, major shareholders, professional advisers, and others involved in the LBO, and is attempting to obtain from these individuals and entities the proceeds paid out in connection with the LBO. This adversary proceeding in the Bankruptcy Court has been stayed pending further order of the Bankruptcy Court.
In June 2011, another group of Tribune creditors, not including the UCC, filed multiple actions involving state law constructive fraudulent conveyance claims against former Tribune shareholders. Rydex Variable Trust also has been named in one or more of these suits.
None of these lawsuits allege any wrongdoing on the part of Rydex Variable Trust. The following series of Rydex Variable Trust held shares of Tribune and tendered these shares as part of Tribune’s LBO: Nova Fund, S&P 500 2x Strategy Fund, Multi Cap Core Equity Fund, Large Cap Value Fund, Hedged Equity Fund and Absolute Returns Strategies Fund (the “Funds”). The value of the proceeds received by the foregoing Funds was $12,580, $2,380, $1,360, $148,376, $2,720, and $119,034, respectively. At this stage of the proceedings, Rydex Variable Trust is not able to make a reliable predication as to the outcome of these lawsuits or the effect, if any, on a Fund’s net asset value.
Lyondell Chemical Company
In October 2011, Rydex Variable Trust was named as a defendant in two cases: Edward S. Weisfelner, as Trustee of the LB Creditor Trust, v. Morgan Stanley & Co., Inc., et al. and Edward S. Weisfelner, as Litigation Trustee of the LB Litigation Trust, v. A. Holmes & H. Holmes TTEE, et al. Both cases are related to the bankruptcy of Lyondell Chemical Company (In re Lyondell Chemical Company, et al.).
Similar to the claims made in the Tribune matter, the Weisfelner complaints seek to have set aside and recovered as fraudulent transfers from former Lyondell Chemical Company (“Lyondell”) shareholders the consideration paid to them pursuant to the cash out merger of Lyondell shareholders in connection with the combination of Lyondell and Basell AF in 2007. Lyondell filed for bankruptcy in 2008.
None of these lawsuits allege any wrongdoing on the part of Rydex Variable Trust. The following series of Rydex Variable Trust received cash proceeds from the cash out merger in the following amounts: Basic Materials Fund — $ 1,235,952; U.S. Long Short Momentum Fund — $523,200; Multi-Cap Core Equity Fund — $5,760; Hedged Equity Fund — $480; and Multi-Hedge Strategies Fund — $112,848. At this stage of the proceedings, Rydex Variable Trust is not able to make a reliable predication as to the outcome of these lawsuits or the effect, if any, on a Fund’s net asset value.
60 | THE GUGGENHEIM FUNDSANNUALREPORT
REPORT OF INDEPENDENT REGISTERED PUBLIC ACCOUNTING FIRM
To the Board of Trustees and Shareholders
of the Rydex Variable Trust:
We have audited the accompanying statements of assets and liabilities, including the schedules of investments, of U.S. Long Short Momentum Fund, Alternative Strategies Allocation Fund, Managed Futures Strategy Fund (consolidated), Multi-Hedge Strategies Fund (consolidated), and Commodities Strategy Fund (consolidated) (five of the series constituting the Rydex Variable Trust) (the “Funds”) as of December 31, 2011, and the related statements of operations for the year then ended, the statements of changes in net assets for each of the two years in the period then ended, and the financial highlights for each of the years or periods presented in the four-year period then ended. These financial statements and financial highlights are the responsibility of the Funds’ management. Our responsibility is to express an opinion on these financial statements and financial highlights based on our audits. The financial highlights for the year ended December 31, 2007 were audited by other auditors, whose report dated February 26, 2008 expressed an unqualified opinion on those financial highlights.
We conducted our audits in accordance with the standards of the Public Company Accounting Oversight Board (United States). Those standards require that we plan and perform the audit to obtain reasonable assurance about whether the financial statements and financial highlights are free of material misstatement. We were not engaged to perform an audit of the Funds’ internal control over financial reporting. Our audits included consideration of internal control over financial reporting as a basis for designing audit procedures that are appropriate in the circumstances, but not for the purpose of expressing an opinion on the effectiveness of the Funds’ internal control over financial reporting. Accordingly, we express no such opinion. An audit also includes examining, on a test basis, evidence supporting the amounts and disclosures in the financial statements and financial highlights, assessing the accounting principles used and significant estimates made by management, as well as evaluating the overall financial statement presentation. Our procedures included confirmation of securities owned as of December 31, 2011, by correspondence with the custodian, transfer agent, and brokers or by other appropriate auditing procedures where replies from brokers were not received. We believe that our audits provide a reasonable basis for our opinion.
In our opinion, the financial statements and financial highlights referred to above present fairly, in all material respects, the financial position of the above listed Funds at December 31, 2011, the results of their operations for the year then ended, the changes in their net assets for each of the two years in the period then ended, and their financial highlights for each of the years or periods presented in the four-year period then ended, in conformity with U.S. generally accepted accounting principles.

McLean, Virginia
February 28, 2012
THE GUGGENHEIM FUNDSANNUALREPORT | 61
Proxy Voting Information
A description of the policies and procedures that the Trust uses to determine how to vote proxies relating to securities held in the Funds’ portfolios is available, without charge and upon request, by calling 1.800.820.0888. This information is also available from the EDGAR database on the SEC’s website at http://www.sec.gov.
Information regarding how the Funds voted proxies relating to portfolio securities during the most recent 12-month period ended June 30 is available without charge, upon request, by calling 1.800.820.0888. The proxy statement information is also available from the EDGAR database on the SEC’s website at http://www.sec.gov.
At a special meeting of shareholders held on November 22, 2011, the shareholders of the Funds voted on whether to approve a new investment advisory agreement between Rydex Variable Trust and Security Investors, LLC. A description of the number of shares voted is as follows:
Fund | Shares For | Shares Against | Shares Abstained | |||||||||
U.S. Long Short Momentum Fund | 2,891,044 | 21,203 | 135,114 | |||||||||
Alternative Strategies Allocation Fund | 309,176 | — | 22,254 | |||||||||
Managed Futures Strategy Fund | 576,519 | — | 37,024 | |||||||||
Multi-Hedge Strategies Fund | 595,817 | 42,342 | 10,096 | |||||||||
Commodities Strategy Fund | 894,144 | 17,540 | 142,594 | |||||||||
At a special meeting of shareholders held on November 22, 2011, the shareholders of the Trust also voted on whether to approve the election of nominees to the Board of Trustees. A description of the number of shares voted is as follows:
Donald C. Cacciapaglia | Corey A. Colehour | J. Kenneth Dalton | ||||||||||||||
For | 343,022,995 | For | 339,263,789 | For | 342,726,825 | |||||||||||
Withhold | 18,549,008 | Withhold | 22,308,214 | Withhold | 18,845,178 | |||||||||||
Total | 361,572,003 | Total | 361,572,003 | Total | 361,572,003 | |||||||||||
John O. Demaret | Richard M. Goldman | Werner E. Keller | ||||||||||||||
For | 338,940,641 | For | 342,766,477 | For | 342,532,565 | |||||||||||
Withhold | 22,631,362 | Withhold | 18,805,526 | Withhold | 19,039,438 | |||||||||||
Total | 361,572,003 | Total | 361,572,003 | Total | 361,572,003 | |||||||||||
Thomas F. Lydon | Patrick T. McCarville | Roger Somers | ||||||||||||||
For | 343,159,833 | For | 339,367,739 | For | 343,007,265 | |||||||||||
Withhold | 18,412,170 | Withhold | 22,204,264 | Withhold | 18,564,738 | |||||||||||
Total | 361,572,003 | Total | 361,572,003 | Total | 361,572,003 | |||||||||||
At a special meeting of shareholders held on November 22, 2011, the shareholders of the Funds also voted on whether to approve a “manager of managers” arrangement for each of the Funds. A description of the number of shares voted is as follows:
Fund | Shares For | Shares Against | Shares Abstained | |||||||||
U.S. Long Short Momentum Fund | 2,875,812 | 29,032 | 142,517 | |||||||||
Alternative Strategies Allocation Fund | 315,434 | 8,775 | 7,221 | |||||||||
Managed Futures Strategy Fund | 575,358 | 2,102 | 36,083 | |||||||||
Multi-Hedge Strategies Fund | 591,039 | 47,210 | 10,006 | |||||||||
Commodities Strategy Fund | 891,718 | 36,594 | 125,967 | |||||||||
Quarterly Portfolio Schedules Information
The Trust files its complete schedule of portfolio holdings with the SEC for the first and third quarters of each fiscal year on Form N-Q; which are available on the SEC’s website at http://www.sec.gov. The Funds’ Forms N-Q may be reviewed and copied at the SEC’s Public Reference Room in Washington, DC, and that information on the operation of the Public Reference Room may be obtained by calling 1-800-SEC-0330. Copies of the portfolio holdings are also available to shareholders, without charge and upon request, by calling 1.800.820.0888.
62 | THE GUGGENHEIM FUNDSANNUALREPORT
OTHER INFORMATION (Unaudited) (continued)
Office Locations
The offices of Guggenheim Investments can be found in the following locations:
40 East 52nd Street
16th Floor
New York, NY 10022
(Headquarters)
Four Irvington Centre
805 King Farm Boulevard
Suite 600
Rockville, MD 20850
9401 Indian Creek Parkway
40 Corporate Woods
Suite 850
Overland Park, KS 66210
Guggenheim Transaction
On September 20, 2011, Guggenheim Capital, LLC agreed to purchase the indirect holding company of Security Investors, LLC, the Fund’s investment manager (the “Investment Manager”) (the “Transaction”). Guggenheim Capital, LLC’s subsidiary, Guggenheim Partners, LLC (“Guggenheim”), is a global, independent, privately-held, diversified financial services firm with more than 1,500 dedicated professionals.
The Transaction should not result in material changes to the day-to-day management and operation of the Funds or any increase in fees. The parties expect the Transaction to be completed in early 2012. However, it is subject to various conditions, and could be delayed or even terminated due to unforeseen circumstances.
In anticipation of the Transaction, the Board of Trustees of the Funds (the “Board”) called a special meeting of shareholders (the “Meeting”), at which shareholders of the Funds of record as of October 3, 2011 were asked to consider the approval of a new investment management agreement between the Funds and the Investment Manager (the “New Agreement”). This approval was necessary because, under the Investment Company Act of 1940 (the “1940 Act”), the Transaction could have resulted in the termination of the Funds’ current investment management agreement with the Investment Manager (the “Current Agreement”). The Funds’ shareholders approved the New Agreement, the terms of which are substantially identical to the corresponding Current Agreement, except with respect to the date of execution, and the New Agreement will take effect if the Transaction is completed.
Election of Board Members
The Board also approved a proposal to elect nine individuals to the Board. The Board proposed the election of the following nominees: Donald C. Cacciapaglia, Corey A. Colehour, J. Kenneth Dalton, John O. Demaret, Richard M. Goldman, Werner E. Keller, Thomas F. Lydon, Patrick T. McCarville and Roger Somers. Each of the nominees, other than Mr. Cacciapaglia, currently serves as a Trustee. In connection with the Transaction, the Board believes that expanding the Board to include Mr. Cacciapaglia, who is a member of senior management of Guggenheim’s investment management business, and who would serve on other board in the Guggenheim Investments family of funds, would be appropriate. The Trusts’ shareholders ultimately approved the aforementioned proposal.
Board Considerations in Approving the Investment Advisory Agreements
At an in-person meeting of the Trust’s Board of Trustees held August 16-17, 2011, called for the purpose of, among other things, voting on the approval of the investment advisory agreements applicable to the series of the Trust (collectively, the “Funds”), the Trust’s Board of Trustees, including the independent Trustees, unanimously approved the investment advisory agreement between the Trust and Security Investors, LLC (referred to herein as the “Adviser”).
At the meeting of August 16-17, 2011, the Trust’s Board of Trustees also considered new investment advisory agreements that were required as a result of a proposed change in the corporate ownership structure of the Adviser (the “Transaction”). The Investment Company Act of 1940 (the “1940 Act”), the law that regulates mutual funds, including the Funds, requires that a fund’s investment advisory agreement terminate whenever there is deemed to be a “change in control” of the investment adviser. The change in the corporate ownership structure of the Adviser could potentially be deemed to constitute a “change in control” (as this term is used for regulatory purposes) of the Adviser. Before an investment advisory agreement terminates, a new investment advisory agreement must be in effect in order for the investment adviser to continue to manage the fund’s investments. For that reason, the Board of Trustees was asked to approve new investment advisory agreements for the Funds.
THE GUGGENHEIM FUNDSANNUALREPORT | 63
OTHER INFORMATION (Unaudited) (continued)
At the meeting of August 16-17, 2011, the Board considered the new investment advisory agreements, pursuant to which, subject to approval by each Fund’s shareholders of the new agreements, the Adviser would continue to serve each Fund as investment adviser after the completion of the Transaction. At a special meeting of the Board held on September 14, 2011, the Board considered further information about the Transaction and voted in favor of the new investment advisory agreements.
In reaching the conclusion to approve the new investment advisory agreements, the Trustees requested and obtained from the Adviser such information as the Trustees deemed reasonably necessary to evaluate the proposed agreements. The Trustees carefully evaluated this information and were advised by legal counsel with respect to their deliberations.
Prior to the Board meetings in August and September 2011, representatives of Guggenheim Capital informed the Board of the Transaction. With respect to the Transaction, the Board reviewed materials received from Guggenheim Capital, including information relating to the terms of the Transaction. The Board also reviewed information regarding Guggenheim Capital, including, but not limited to: (a) certain representations concerning Guggenheim Capital’s financial condition, (b) information regarding the new proposed ownership structure and its possible effect on shareholders, (c) information regarding the consideration to be paid by Guggenheim Capital, and (d) potential conflicts of interest.
In considering the new investment advisory agreements, the Board determined that the agreements would enable shareholders of the Funds to continue to obtain high quality services at a cost that is appropriate, reasonable, and in the best interests of their shareholders. The Board, including the independent Trustees, unanimously approved the new agreements. In reaching their decision, the Trustees carefully considered information that they had received throughout the year as part of their regular oversight of the Funds, including, in particular, information from the Adviser that the Board had received relating to the current investment advisory agreements at the Board meeting of August 16-17, 2011. The Trustees noted that, at the meeting, they had obtained and reviewed a wide variety of information, including certain comparative information regarding performance of the Funds relative to performance of other comparable mutual funds. They also considered the evolution of the Rydex|SGI family of funds and the Adviser since the change in control of the Adviser in 2010 and Guggenheim Capital’s commitment to the success of the Adviser and the Funds.
In addition, as a part of their required consideration of the renewal of the current investment advisory agreements at the meeting of August 16-17, 2011, the Trustees, including the independent Trustees, had evaluated a number of considerations, including among others: (a) the quality of the Adviser’s investment advisory and other services; (b) the Adviser’s investment management personnel; (c) the Adviser’s operations and financial condition; (d) the Adviser’s brokerage practices (including any soft dollar arrangements) and investment strategies; (e) the level of the fees that the Adviser charges compared with the fees charged to comparable mutual funds or accounts; (f) each Fund’s overall fees and operating expenses compared with similar mutual funds; (g) the level of the Adviser’s profitability from its Fund-related operations; (h) the Adviser’s compliance systems; (i) the Adviser’s policies on and compliance procedures for personal securities transactions; (j) the Adviser’s reputation, expertise and resources in the financial markets; and (k) Fund performance compared with similar mutual funds. Based on the Board’s deliberations at the meetings of August 16-17, 2011 and September 14, 2011, and its evaluation of the information regarding the Transaction and the fact that the Transaction is not expected to change the level and quality of services rendered by the Adviser to any of the Funds, the Board, including all of the independent Trustees, unanimously: (a) concluded that terms of the current and new investment advisory agreements are fair and reasonable; (b) concluded that the Adviser’s fees were reasonable in light of the services provided to the Funds; and (c) agreed to approve the current investment advisory agreements and, subject to shareholder approval, the new investment advisory agreements, based upon the following considerations, among others:
| • | Nature, Extent and Quality of Services Provided by the Adviser. At the meeting of August 16-17, 2011, the Board reviewed the scope of services to be provided by the Adviser under the current investment advisory agreements, and, at the meetings of August 16-17, 2011 and September 14, 2011, noted that there would be no significant differences between the scope of services required to be provided by the Adviser under the current investment advisory agreements and the scope of services required to be provided by the Adviser under the new investment advisory agreements. The Board noted that the key investment and management personnel of the Adviser servicing the Funds are expected to remain the same following the Transaction. The Trustees also considered Guggenheim Capital’s representations to the Board that the Adviser would continue to provide investment and related services that were of materially the same quality and quantity as services provided to the Funds in the past, and that these services are appropriate in scope and extent in light of the Funds’ operations, the competitive landscape of the investment company business and investor needs. |
| • | Fund Expenses and Performance of the Funds. At the meeting of August 16-17, 2011, the Board had reviewed statistical information prepared by the Adviser regarding the expense ratio components and performance of each Fund. Based on the representations made by Guggenheim Capital at the meeting that the Adviser would continue to operate following the closing of the Transaction in much the same manner as it currently operates, the Board concluded that the investment performance of the Adviser was not expected to be affected by the Transaction. |
64 | THE GUGGENHEIM FUNDSANNUALREPORT
OTHER INFORMATION (Unaudited) (concluded)
| • | Costs of Services Provided to the Funds and Profits Realized by the Adviser and its Affiliates. At the meeting of August 16-17, 2011, the Board had reviewed information about the profitability of the Funds to the Adviser based on the advisory fees payable under the current investment advisory agreements. At that meeting, the Board had also analyzed the Funds’ expenses, including the investment advisory fees paid to the Adviser. The Board also had reviewed reports comparing the expense ratios to those of other comparable mutual funds. At the Board meeting, the Board considered the fact that the fee rates payable to the Adviser would be the same under each Fund’s new investment advisory agreements as they are under such Fund’s current agreements. With respect to anticipated profitability, the Board noted that it was too early to predict how the Transaction would affect the Adviser’s profitability with respect to the Funds, but noted that this matter would be given further consideration on an ongoing basis. |
| • | Economies of Scale. In connection with its review of the Funds’ profitability analysis at the meeting of August 16-17, 2011, the Board reviewed information regarding economies of scale or other efficiencies that may result from increases in the Funds’ asset levels. The Trustees noted that the fees would not change under the new investment advisory agreements, and that no additional economies of scale would be directly realized as a result of the Transaction. They also noted that they will have the opportunity to again review the appropriateness of the fees payable to the Adviser under the new agreements when the renewal of the new agreements next comes before the Board. |
| • | Other Benefits to the Adviser and/or its Affiliates. In addition to evaluating the services provided by the Adviser, the Board had considered the nature, extent, quality and cost of the distribution services performed by the Funds’ Distributor under a separate agreement at the meeting of August 16-17, 2011. The Board reviewed information regarding potential economies of scale arising from the integration of the asset management businesses of Guggenheim Capital. The Board also considered the terms of the Transaction and the changes to the corporate ownership structure of the Adviser, noting that the Adviser would no longer be a subsidiary of Security Benefit Corporation. In this regard, the Board noted that, under the corporate structure after the Transaction, the Adviser would be more closely controlled by Guggenheim Capital, which could benefit Guggenheim Capital. The Board also noted that the costs associated with the Transaction would be borne by Guggenheim Capital (or its affiliates) and not the Funds. |
On the basis of the information provided to it and its evaluation of that information, the Board, including the independent Trustees, concluded that the terms of the investment advisory agreements for the Funds were reasonable, and that approval of the current and new investment advisory agreements were in the best interests of the Funds.
THE GUGGENHEIM FUNDSANNUALREPORT | 65
INFORMATION ON BOARD OF TRUSTEES AND OFFICERS (Unaudited)
A Board of Trustees oversees the Trust, as well as other trusts of GI, in which its members have no stated term of service, and continue to serve after election until resignation. The Statement of Additional Information includes further information about Fund Trustees and Officers, and can be obtained without charge by calling 800.820.0888.
All Trustees and Officers may be reached c/o Guggenheim Investments, 805 King Farm Boulevard, Suite 600, Rockville, MD 20850.
INDEPENDENT TRUSTEES
Name, Position and Year of Birth | Length of Service as Trustee (Year Began) | Number of Funds Overseen | ||
Corey A. Colehour Trustee (1945) | Rydex Series Funds – 1993 | 150 | ||
| Rydex Variable Trust – 1998 | ||||
| Rydex Dynamic Funds – 1999 | ||||
| Rydex ETF Trust – 2003 | ||||
Principal Occupations During Past Five Years: Retired; Member of the Audit, Governance and Nominating Committees (1995 to present)
J. Kenneth Dalton Trustee (1941) | Rydex Series Funds – 1995 | 150 | ||
| Rydex Variable Trust – 1998 | ||||
| Rydex Dynamic Funds – 1999 | ||||
| Rydex ETF Trust – 2003 |
Principal Occupations During Past Five Years: Retired; Member of the Governance and Nominating Committees (1995 to present); Chairman of the Audit Committee (1997 to present); Member of the Risk Oversight Committee (2010 to present)
John O. Demaret Trustee, Chairman of the Board (1940) | Rydex Series Funds – 1997 | 150 | ||
| Rydex Variable Trust – 1998 | ||||
| Rydex Dynamic Funds – 1999 | ||||
| Rydex ETF Trust – 2003 |
Principal Occupations During Past Five Years: Retired; Member of the Audit Committee (1997 to present); Member of the Risk Oversight Committee (2010 to present)
Werner E. Keller Trustee (1940) | Rydex Series Funds – 2005 | 150 | ||
| Rydex Variable Trust – 2005 | ||||
| Rydex Dynamic Funds – 2005 | ||||
| Rydex ETF Trust – 2005 |
Principal Occupations During Past Five Years: Founder and President of Keller Partners, LLC (registered investment adviser) (2005 to present); Member of the Audit, Governance and Nominating Committees (2005 to present); Chairman and Member of the Risk Oversight Committee (2010 to present)
Thomas F. Lydon, Jr. Trustee (1960) | Rydex Series Funds – 2005 | 150 | ||
| Rydex Variable Trust – 2005 | ||||
| Rydex Dynamic Funds – 2005 | ||||
| Rydex ETF Trust – 2005 |
Principal Occupations During Past Five Years: President, Global Trends Investments (1996 to present); Member of the Audit, Governance and Nominating Committees (2005 to present)
Patrick T. McCarville Trustee (1942) | Rydex Series Funds – 1997 | 150 | ||
| Rydex Variable Trust – 1998 | ||||
| Rydex Dynamic Funds – 1999 | ||||
| Rydex ETF Trust – 2003 | ||||
Principal Occupations During Past Five Years: CEO, Par Industries, Inc., d/b/a Par Leasing (1977 to 2010); Chairman of the Governance and Nominating Committees (1997 to present); Member of the Audit Committee (1997 to present)
Roger Somers Trustee (1944) | Rydex Series Funds – 1993 | 150 | ||
| Rydex Variable Trust – 1998 | ||||
| Rydex Dynamic Funds – 1999 | ||||
| Rydex ETF Trust – 2003 |
Principal Occupations During Past Five Years: Founder and CEO of Arrow Limousine (1965 to present); Member of the Audit, Governance and Nominating Committees (1995 to present)
66 | THE GUGGENHEIM FUNDSANNUALREPORT
INFORMATION ON BOARD OF TRUSTEES AND OFFICERS (Unaudited) (continued)
EXECUTIVE OFFICERS
Name, Position and Year of Birth | Principal Occupations During Past Five Years | |
Richard M. Goldman* President (1961) | Current: Senior Vice President, Security Benefit Corporation; CEO, Security Benefit Asset Management Holdings, LLC; CEO, President and Manager Representative, Security Investors, LLC; CEO and Manager, Rydex Holdings, LLC; CEO, President and Manager, Rydex Distributors, LLC; Manager, Rydex Fund Services, LLC; President and Trustee, Rydex Series Funds, Rydex ETF Trust, Rydex Dynamic Funds and Rydex Variable Trust | |
| Previous: Director, First Security Benefit Life Insurance Company (2007–2010); President and Director, Security Global Investors (2010–2011); CEO and Director, Rydex Advisors, LLC and Rydex Advisors II, LLC (2010); Director, Security Distributors, Inc. (2007–2009); Managing Member, R.M. Goldman Partners, LLC (2006–2007) | ||
Michael P. Byrum* Vice President (1970) | Current: President, Security Benefit Asset Management Holdings, LLC; Senior Vice President, Security Investors, LLC; President and Chief Investment Officer, Rydex Holdings, LLC; Director and Chairman of the Board, Advisor Research Center, Inc.; Manager, Rydex Specialized Products, LLC | |
| Previous: Rydex Distributors, LLC (f/k/a Rydex Distributors, Inc.), Vice President (2009); Rydex Fund Services, LLC, Director (2009–2010), Secretary (2002–2010), Executive Vice President (2002–2006); Rydex Advisors, LLC (f/k/a PADCO Advisors, Inc.), Director (2008–2010), Chief Investment Officer (2006–2010), President (2004–2010), Secretary (2002–2010); Rydex Advisors II, LLC (f/k/a PADCO Advisors II, Inc.), Director (2008–2010), Chief Investment Officer (2006–2010), President (2004–2010), Secretary (2002–2010); Rydex Capital Partners, LLC, President and Secretary (2003–2007); Rydex Capital Partners II, LLC, (2003–2007); Rydex Holdings, LLC (f/k/a Rydex Holdings, Inc.), Secretary (2005–2008), Executive Vice President (2005–2006); Advisor Research Center, Inc., Secretary (2006–2009), Executive Vice President (2006); Rydex Specialized Products, LLC, Secretary (2005–2008) | ||
Nikolaos Bonos* Vice President and Treasurer (1963) | Current: Senior Vice President, Security Investors, LLC; Chief Executive Officer and Manager, Rydex Specialized Products, LLC; Chief Executive Officer and President, Rydex Fund Services, LLC; Vice President, Rydex Holdings, LLC; Treasurer, SBL Fund; Security Equity Fund; Security Income Fund; Security Large Cap Value Fund and Security Mid Cap Growth Fund; Vice President, Security Benefit Asset Management Holdings, LLC | |
| Previous: Security Global Investors, LLC, Senior Vice President (2010–2011); Rydex Advisors, LLC (f/k/a PADCO Advisors, Inc.) Senior Vice President (2006–2011); Rydex Fund Services, LLC (f/k/a Rydex Fund Services, Inc.), Director (2009), Senior Vice President (2003–2006); Rydex Specialized Products, LLC, Chief Financial Officer (2005–2009) | ||
THE GUGGENHEIM FUNDSANNUALREPORT | 67
INFORMATION ON BOARD OF TRUSTEES AND OFFICERS (Unaudited) (continued)
EXECUTIVE OFFICERS (continued)
Name, Position and Year of Birth | Principal Occupations During Past Five Years | |
Joanna Haigney* Chief Compliance Officer and Secretary (1966) | Current: Chief Compliance Officer and Secretary, SBL Fund; Security Equity Fund; Security Income Fund; Security Large Cap Value Fund and Security Mid Cap Growth Fund; Vice President, Rydex Holdings, LLC; Vice President, Security Benefit Asset Management Holdings, LLC; Senior Vice President and Chief Compliance Officer, Security Investors, LLC | |
| Previous: Security Global Investors, LLC, Senior Vice President (2010–2011); Rydex Advisors, LLC (f/k/a PADCO Advisors, Inc.) and Rydex Advisors II, LLC (f/k/a PADCO Advisors II, Inc.), Chief Compliance Officer and Senior Vice President (2010–2011); Rydex Capital Partners I, LLC and Rydex Capital Partners II, LLC, Chief Compliance Officer (2006–2007); Rydex Fund Services, LLC (f/k/a Rydex Fund Services, Inc.), Vice President (2001–2006) | ||
Keith A. Fletcher* Vice President (1958) | Current: Senior Vice President, Security Investors, LLC; Vice President, Rydex Holdings, LLC; Vice President, Rydex Specialized Products, LLC; Vice President, Rydex Distributors, LLC; Vice President, Rydex Fund Services, LLC; Vice President and Director, Advisor Research Center, Inc.; Vice President, SBL Fund; Security Equity Fund; Security Income Fund; Security Large Cap Value Fund and Security Mid Cap Growth Fund | |
| Previous: Security Global Investors, LLC, Vice President (2010–2011); Rydex Advisors, LLC (f/k/a PADCO Advisors, Inc.) and Rydex Advisors II, LLC (f/k/a PADCO Advisors II, Inc.), Vice President (2009–2011); Lyster Watson and Company, Managing Director (2007–2008); Fletcher Financial Group, Inc., Chief Executive Officer (2004–2007) | ||
Amy J. Lee* Vice President and Assistant Secretary (1960) | Current: Senior Vice President and Secretary, Security Investors, LLC; Secretary and Chief Compliance Officer, Security Distributors, Inc.; Vice President, Associate General Counsel and Assistant Secretary, Security Benefit Life Insurance Company and Security Benefit Corporation; Associate General Counsel, First Security Benefit Life Insurance and Annuity of New York; Vice President and Secretary, SBL Fund; Security Equity Fund; Security Income Fund; Security Large Cap Value Fund and Security Mid Cap Growth Fund; Vice President and Secretary, Rydex Holdings, LLC; Secretary, Advisor Research Center, Inc., Rydex Specialized Products, LLC, Rydex Distributors, LLC and Rydex Fund Services, LLC; Assistant Secretary, Security Benefit Clinic and Hospital | |
| Previous: Security Global Investors, LLC, Senior Vice President and Secretary (2007–2011); Rydex Advisors, LLC (f/k/a PADCO Advisors, Inc.) and Rydex Advisors II, LLC (f/k/a PADCO Advisors II, Inc.), Senior Vice President and Secretary (2010–2011); Brecek and Young Advisors, Inc., Director (2004–2008) | ||
68 | THE GUGGENHEIM FUNDSANNUALREPORT
INFORMATION ON BOARD OF TRUSTEES AND OFFICERS (Unaudited) (concluded)
EXECUTIVE OFFICERS (concluded)
Name, Position and Year of Birth | Principal Occupations During Past Five Years | |
Joseph M. Arruda* Assistant Treasurer (1966) | Current: Assistant Treasurer, SBL Fund; Security Equity Fund; Security Income Fund; Security Large Cap Value Fund; and Security Mid Cap Growth Fund; Vice President, Security Investors, LLC; Chief Financial Officer and Manager, Rydex Specialized Products, LLC | |
| Previous: Security Global Investors, LLC, Vice President (2010–2011); Rydex Advisors, LLC (f/k/a PADCO Advisors, Inc.) and Rydex Advisors II, LLC (f/k/a PADCO Advisors II, Inc.), Vice President (2004–2011) | ||
| * | Officers of the Funds are deemed to be “interested persons” of the Trust, within the meaning of Section 2(a) (19) of the 1940 Act, inasmuch as this person is affiliated with Guggenheim Investments. |
THE GUGGENHEIM FUNDSANNUALREPORT | 69
GUGGENHEIM INVESTMENTS PRIVACY POLICIES
Rydex Funds, Guggenheim Funds, Rydex Investments, Rydex Distributors, Inc., Security Investors, LLC, Security Distributors, Inc. and Rydex Advisory Services (Collectively “Guggenheim Investments”)
Our Commitment to You
When you become a Guggenheim Investments investor, you entrust us with not only your hard-earned money but also with personal and financial information about you. We recognize that your relationship with us is based on trust and that you expect us to act responsibly and in your best interests. Because we have access to this private information about you, we hold ourselves to the highest standards in its safekeeping and use. This means, most importantly, that we do not sell client information to anyone — whether it is your personal information or if you are a current or former Guggenheim Investments client.
The Information We Collect About You
In the course of doing business with shareholders and investors, we collect nonpublic personal information about you. You typically provide personal information when you complete a Guggenheim Investments account application or when you request a transaction that involves Rydex and Guggenheim Investments funds or one of the Guggenheim Investments affiliated companies. “Nonpublic personal information” is personally identifiable private information about you. For example, it includes information regarding your name and address, Social Security or taxpayer identification number, assets, income, account balance, bank account information and investment activity (e.g., purchase and redemption history).
How We Handle Your Personal Information
As emphasized above, we do not sell information about current or former clients or their accounts to third parties. Nor do we share such information, except when necessary to complete transactions at your request or to make you aware of related investment products and services that we offer. Additional details about how we handle your personal information are provided below. To complete certain transactions or account changes that you direct, it may be necessary to provide identifying information to companies, individuals or groups that are not affiliated with Guggenheim Investments. For example, if you ask to transfer assets from another financial institution to Guggenheim Investments, we will need to provide certain information about you to that company to complete the transaction. To alert you to other Guggenheim Investments investment products and services, we may share your information within the Guggenheim Investments family of affiliated companies. This would include, for example, sharing your information within Guggenheim Investments so we can make you aware of new Rydex and Guggenheim Investments funds or the services offered through another Guggenheim Investments affiliated company. In certain instances, we may contract with nonaffiliated companies to perform services for us. Where necessary, we will disclose information we have about you to these third parties. In all such cases, we provide the third party with only the information necessary to carry out its assigned responsibilities and only for that purpose. And we require these third parties to treat your private information with the same high degree of confidentiality that we do. In certain instances, we may share information with other financial institutions regarding individuals and entities in response to the U.S.A. Patriot Act. Finally, we will release information about you if you direct us to do so, if we are compelled by law to do so or in other circumstances permitted by law.
Opt Out Provisions
We do not sell your personal information to anyone. The law allows you to “opt out” of only certain kinds of information sharing with third parties. The firm does not share personal information about you with any third parties that triggers this opt-out right. This means YOU ARE ALREADY OPTED OUT.
How We Protect Privacy Online
Our concern for the privacy of our shareholders also extends to those who use our web site, www.rydex-sgi.com. Our web site uses some of the most secure forms of online communication available, including encryption technology, Secure Socket Layer (SSL) protocol, firewalls and user names and passwords. These technologies provide a high level of security and privacy when you access your account information or initiate online transactions. The Guggenheim Investments web site offers customized features that require our use of “http cookies” — tiny pieces of information that we ask your browser to store. However, we make very limited use of these cookies. We only use cookies for session management and security features on the Guggenheim Investments web site. We do not use them to pull data from your hard drive, to learn your email address, or to view data in cookies created by other web sites. We will not share the information in our cookies or give others access to it. See the legal information area on our web site for more details about web site security and privacy features.
How We Safeguard Your Personal Information
We restrict access to nonpublic personal information about shareholders to our employees and in some cases to third parties (for example, the service providers described above) as permitted by law. We maintain strict physical, electronic and procedural safeguards that comply with federal standards to guard your nonpublic personal information.
We’ll Keep You Informed
As required by federal law, we will notify shareholders of our privacy policy annually. We reserve the right to modify this policy at any time, but rest assured that if we do change it, we will tell you promptly. You will also be able to access our privacy policy from our web site at www.rydex-sgi.com. Should you have any questions regarding our privacy policy, contact us at 800.820.0888 or 301.296.5100.
70 | THE GUGGENHEIM FUNDSANNUALREPORT
This page intentionally left blank.
This page intentionally left blank.
This page intentionally left blank.
This page intentionally left blank.
This page intentionally left blank.
This page intentionally left blank.
This page intentionally left blank.

805 King Farm Boulevard, Suite 600
Rockville, MD 20850
www.rydex-sgi.com
800.820.0888
RVALTS-ANN-2-1211x1212
ASSET ALLOCATION FUNDS
ALL-ASSET CONSERVATIVE STRATEGY FUND
ALL-ASSET MODERATE STRATEGY FUND
ALL-ASSET AGGRESSIVE STRATEGY FUND
This report and the financial statements contained herein are submitted for the general information of our shareholders. The report is not authorized for distribution to prospective investors unless preceded or accompanied by an effective prospectus.
Distributed by Rydex Distributors, LLC.
TABLE OF CONTENTS
| 2 | ||||
| 4 | ||||
| 6 | ||||
| 14 | ||||
| 22 | ||||
| 28 | ||||
| 34 | ||||
| 35 | ||||
| 39 | ||||
| 43 | ||||
THE GUGGENHEIM FUNDSANNUALREPORT | 1
To Our Shareholders:
Financial markets endured a lot of turbulence in 2011, due to a variety of events: concerns about debt in the eurozone and in the U.S., which lost its triple-A credit rating, a tsunami-induced Japanese nuclear-plant disaster that disrupted automobile production around the globe, Mideast social unrest that led to a jump in oil prices and weak growth in many of the world’s developed economies. Reflecting the volatility in the stock market was the S&P 500 Index*, which finished the year up about 2%, but only after an 8% rise in the first few months of 2011, then a bearish 19% drop by early October, followed by a 12% fourth-quarter rebound spurred by improved economic data.
The U.S. Federal Reserve was a major factor in the markets for most of 2011, from its winding down of a second asset-purchase program (quantitative easing) in June to August’s “operation twist,” which shifted $400 billion in holdings from short-term to long-term Treasuries. The Fed said it would keep short-term interest rates near zero at least until mid-2013, and late in the year, some analysts were speculating that a third round of quantitative easing might be needed in 2012 to boost subpar growth.
While late-year improvements in economic measures may have dampened concern that the U.S. could slip back into recession, Europe’s recession fears were rising, as high unemployment and austerity measures weighed on weaker members of the euro zone, and threatened the economic engines of Germany and France. The Stoxx Europe 600 Index* was down about 11% for the year, with most individual country indices posting declines in double digits. Many investors continued to brace for a solution to Greece’s debt situation that would prevent financial problems from spreading to other weak countries or to banks, and stabilize the sliding euro, the year’s worst-performing major currency.
Even though they were not at the eye of the sovereign debt storm, many emerging market economies performed poorly in 2011, with those having the strongest links to the eurozone suffering the most. The MSCI Emerging Markets Index* was off by almost 20%, despite pockets of growth. China is facing slowing industrial production, sliding property values and the potential for a hard landing of the economy if housing and banks collapse.
While the market forces play out, many investors have been driven to the sidelines or to safe havens. Gold reached a record high of near $1,900 an ounce in August amid the U.S. debt downgrade, but then lost ground to the rising dollar amid continuing debate over Europe’s debt woes. Still, gold added 10% for the year, while the dollar ended the year within about 3% from where it began against the currencies of most major markets, including the euro, the pound, Canadian dollar and Swiss franc.
Sluggish economic data, concern over European financial weakness and the Fed’s policy efforts also drove investors into U.S. government debt over the course of 2011, despite the country’s lowered credit rating. The 30% total return of the Barclays Capital Long U.S. Treasury Index* made it one of the best-performing of the year, and it gave a lift to indices for corporate bonds, high yield bonds and municipals, which all grew by mid-to-high single digits.
The U.S. economy had momentum heading into 2012, as data showed the world’s largest economy to be maintaining a sustainable, if modest, expansion. Consumer confidence was improving, employment rising and monetary policy remained accommodative. We finished 2011 on a positive note, especially when compared to other countries, and so far continue to be insulated from the worst aspects of the economic troubles in Europe and China.
2 | THE GUGGENHEIM FUNDSANNUALREPORT
LETTER TO OUR SHAREHOLDERS (concluded)
We look forward to continuing our service to you. Thank you for investing in our funds.
Sincerely,

Michael Byrum
President and Chief Investment Officer
| * | Indices are defined as follows: |
S&P 500® Index is a capitalization-weighted index covering 500 industrial, utility, transportation and financial companies of the U.S. markets (mostly NYSE Euronext issues).
The STOXX Europe 600 Index is derived from the STOXX Europe Total Market Index (TMI) and is a subset of the STOXX Global 1800 Index. With a fixed number of 600 components, the STOXX Europe 600 Index represents large-, mid- and small-capitalization companies across 18 countries of the European region: Austria, Belgium, Denmark, Finland, France, Germany, Greece, Iceland, Ireland, Italy, Luxembourg, the Netherlands, Norway, Portugal, Spain, Sweden, Switzerland and the United Kingdom.
The Barclays Capital Long U.S. Treasury Index includes publicly issued U.S. Treasury securities that have a remaining maturity of 10 or more years, are rated investment grade, and have $250 million or more of outstanding face value. In addition, the securities must be denominated in U.S. dollars and must be fixed rate and non convertible. Excluded from the Long U.S. Treasury Index are certain special issues, such as flower bonds, TINs, state and local government series bonds, TIPS, and coupon issues that have been stripped from bonds included in the index. The Long U.S. Treasury Index is market capitalization weighted and the securities in the index are updated on the last business day of each month.
MSCI Emerging Markets Index is a free float-adjusted market capitalization index that is designed to measure equity market performance in the global emerging markets.
Performance displayed represents past performance which is no guarantee of future results. Of course, fund performance is subject to daily market volatility and may be better or worse since the end of the last quarter. For up-to-date fund performance, call us at 800.820.0888 or visit www.rydex-sgi.com.
Read each fund’s prospectus and summary prospectus (if available) carefully before investing. It contains the fund’s investment objectives, risks, charges, expenses and other information, which should be considered carefully before investing. Obtain a prospectus and summary prospectus (if available) at www.rydex-sgi.com or call 800.820.0888.
The referenced funds are distributed by Rydex Distributors, LLC (RDL). Guggenheim Investments represents the investment management business of Guggenheim Partners, LLC, which includes Security Investors, LLC and Guggenheim Partners Asset Management, the investment advisor to the referenced funds. Rydex Distributors, LLC, is affiliated with Guggenheim Partners, LLC and Security Investors, LLC.
THE GUGGENHEIM FUNDSANNUALREPORT | 3
ABOUT SHAREHOLDERS’ FUND EXPENSES (Unaudited)
All mutual funds have operating expenses and it is important for our shareholders to understand the impact of costs on their investments. Shareholders of a Fund incur two types of costs: (i) transaction costs, including sales charges (loads) on purchase payments, reinvested dividends, or other distributions; and exchange fees; and (ii) ongoing costs, including management fees, administrative services, and shareholder reports, among others. These ongoing costs, or operating expenses, are deducted from a fund’s gross income and reduce the investment return of the fund.
A fund’s expenses are expressed as a percentage of its average net assets, which is known as the expense ratio. The following examples are intended to help investors understand the ongoing costs (in dollars) of investing in a Fund and to compare these costs with the ongoing costs of investing in other mutual funds.
The examples are based on an investment of $1,000 made at the beginning of the period and held for the entire six-month period beginning June 30, 2011 and ending December 31, 2011.
The following tables illustrate a Fund’s costs in two ways:
Table 1. Based on actual Fund return. This section helps investors estimate the actual expenses paid over the period. The “Ending Account Value” shown is derived from the Fund’s actual return, and the fourth column shows the dollar amount that would have been paid by an investor who started with $1,000 in the Fund. Investors may use the information here, together with the amount invested, to estimate the expenses paid over the period. Simply divide the Fund’s account value by $1,000 (for example, an $8,600 account value divided by $1,000 = 8.6), then multiply the result by the number provided under the heading “Expenses Paid During Period.”
Table 2. Based on hypothetical 5% return. This section is intended to help investors compare a Fund’s cost with those of other mutual funds. The table provides information about hypothetical account values and hypothetical expenses based on the Fund’s actual expense ratio and an assumed rate of return of 5% per year before expenses, which is not the Fund’s actual return. The hypothetical account values and expenses may not be used to estimate the actual ending account balance or expenses paid during the period. The example is useful in making comparisons because the U.S. Securities and Exchange Commission (the “SEC”) requires all mutual funds to calculate expenses based on the 5% return. Investors can assess a Fund’s costs by comparing this hypothetical example with the hypothetical examples that appear in shareholder reports of other funds.
The calculations illustrated above assume no shares were bought or sold during the period. Actual costs may have been higher or lower, depending on the amount of investment and the timing of any purchases or redemptions.
Please note that the expenses shown in the table are meant to highlight your ongoing costs only and do not reflect any transactional costs, such as sales charges (loads) on purchase payments, and contingent deferred sales charges (“CDSC”) on redemptions, if any. Therefore, the second table is useful in comparing ongoing costs only, and will not help you determine the relative total costs of owning different funds. In addition, if these transactional costs were included, your costs would have been higher.
More information about a Fund’s expenses, including annual expense ratios for the past five years, can be found in the Financial Highlights section of this report. For additional information on operating expenses and other shareholder costs, please refer to the appropriate Fund prospectus.
4 | THE GUGGENHEIM FUNDSANNUALREPORT
ABOUT SHAREHOLDERS’ FUND EXPENSES (Unaudited) (concluded)
| Expense Ratio1 | Fund Return | Beginning Account Value June 30, 2011 | Ending Account Value December 31, 2011 | Expenses Paid During Period2 | ||||||||||||||||
Table 1. Based on actual Fund return3 | ||||||||||||||||||||
All-Asset Conservative Strategy Fund | 0.00 | % | (3.64 | )% | $ | 1,000.00 | $ | 963.60 | $ | — | ||||||||||
All-Asset Moderate Strategy Fund | 0.00 | % | (5.27 | )% | 1,000.00 | 947.30 | — | |||||||||||||
All-Asset Aggressive Strategy Fund | 0.00 | % | (6.85 | )% | 1,000.00 | 931.50 | — | |||||||||||||
Table 2. Based on hypothetical 5% return (before expenses) |
| |||||||||||||||||||
All-Asset Conservative Strategy Fund | 0.00 | % | 5.00 | % | $ | 1,000.00 | $ | 1,025.21 | $ | — | ||||||||||
All-Asset Moderate Strategy Fund | 0.00 | % | 5.00 | % | 1,000.00 | 1,025.21 | — | |||||||||||||
All-Asset Aggressive Strategy Fund | 0.00 | % | 5.00 | % | 1,000.00 | 1,025.21 | — | |||||||||||||
| 1 | Annualized and excludes expenses of the underlying funds in which the Funds invest. |
| 2 | Expenses are equal to the Fund’s annualized expense ratio, net of any applicable fee waivers, multiplied by the average account value over the period, multiplied by 184/365 (to reflect the one-half year period). Expenses shown do not include fees charged by insurance companies. |
| 3 | Actual cumulative return at net asset value for the period June 30, 2011 to December 31, 2011. |
THE GUGGENHEIM FUNDSANNUALREPORT | 5
PERFORMANCE REPORT AND FUND PROFILE (Unaudited) | December 31, 2011 |
ALL-ASSET CONSERVATIVE STRATEGY FUND
OBJECTIVE: Seeks to primarily provide preservation of capital and, secondarily, long-term growth of capital.
The markets entered 2011 underestimating global impacts of risks and, in some cases, unexpected events. To name a few: the European debt crisis surprised the market with more problems yet few tangible solutions looming; an earth-quake and tsunami occurred in Japan, with much more tragic consequences than usual; and China’s rising inflation forced its government to tighten monetary policy more strictly than expected.
The S&P 500® Index* ended 2011 close to its level at the end of 2010, yet it was one of the best-performing equity markets anywhere in the world. But there was intra-year volatility, and it once reached levels seen in early 2009. Bonds had another great year, with fixed-income investments generally rising 6.25%, and an index of long-term Treasury bonds was up almost 30%. For the past 30 years, long governments have risen 11.5% annually, compared with a 10.8% rise in the S&P 500 Index*—the first time that has occurred since before the Civil War.
Our dynamically managed tactical overlay made a positive contribution to performance, but not enough to permit the portfolio to overcome the tumult in the market. For the year ended December 31, 2011, the All-Asset Conservative Strategy Fund returned -1.30%, compared with its benchmark (32% Russell 3000® Index*, 8% MSCI EAFE Index* and 60% Barclays Capital U.S. Aggregate Bond Index*), which rose 3.97%.
In the period, the U.S. Intermediate Bond Series, the Multi-Hedge Strategies Fund and the U.S. Long Short Momentum Fund contributed to performance.
The MSCI EAFE Equal Weight Fund, the Long Short Interest Rate Strategy Fund and the Mid-Cap Value Fund detracted from performance.
Derivatives in the Fund are used to provide the most efficient exposure to the components of the blended benchmark, as well as to provide liquidity.
| * | Standard & Poor’s 500 Index (S&P 500®) – a capitalization-weighted index covering 500 industrial, utility, transportation and financial companies of the U.S markets (mostly NYSE Euronext issues). |
| * | The MSCI EAFE Index (Europe, Australasia, Far East) is a free float-adjusted market capitalization index that is designed to measure the equity market performance of developed markets, excluding the US & Canada. The MSCI EAFE Index consists of the following 22 developed market country indices: Australia, Austria, Belgium, Denmark, Finland, France, Germany, Greece, Hong Kong, Ireland, Israel, Italy, Japan, the Netherlands, New Zealand, Norway, Portugal, Singapore, Spain, Sweden, Switzerland, and the United Kingdom. |
| * | The Russell 3000® Index measures the performance of the largest 3,000 U.S. companies, representing approximately 98% of the investable U.S. equity market. |
| * | The Barclays Capital U.S. Aggregate Bond Index measures performance of the U.S. investment-grade bond market, including investment-grade U.S. government bonds, investment-grade corporate bonds, mortgage pass-through securities and asset-backed securities. |
Performance displayed represents past performance which is no guarantee of future results.
Holdings Diversification (Market Exposure as % of Net Assets)
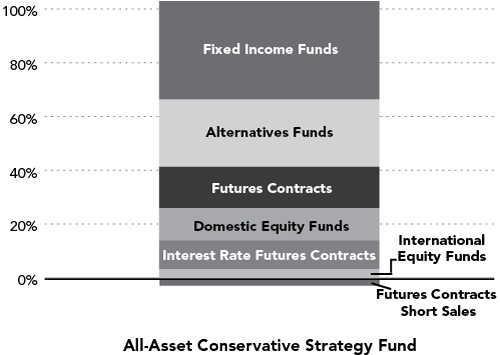
“Holdings Diversification (Market Exposure as % of Net Assets)” excludes any temporary cash in vestments.
Inception: October 27, 2006
Ten Largest Holdings | ||||
SBL Fund — Series E | 18.2 | % | ||
iShares Barclays Aggregate Bond Fund | 12.6 | % | ||
RVT — U.S. Long Short Momentum Fund | 10.4 | % | ||
RVT — Multi-Hedge | 6.4 | % | ||
SBL Fund — Series P | 5.8 | % | ||
SBL Fund — Series B | 4.6 | % | ||
SBL Fund — Series Y | 4.6 | % | ||
SBL Fund — Series D | 3.2 | % | ||
RSF — Long Short Interest Rate | 2.3 | % | ||
RVT — Managed Futures Strategy Fund | 1.4 | % | ||
|
| |||
Top Ten Total | 69.5 | % | ||
|
| |||
“Ten Largest Holdings” exclude any temporary cash or derivative in vestments.
RSF – Rydex Series Funds
RVT – Rydex Variable Trust
SBL – Security Benefit Life
6 | THE GUGGENHEIM FUNDSANNUALREPORT
PERFORMANCE REPORT AND FUND PROFILE (Unaudited) (concluded)

Average Annual Returns*
Periods Ended 12/31/11
| 1 Year | 5 Year | Since Inception (10/27/06) | ||||||||||
All-Asset Conservative Strategy Fund | -1.30 | % | 1.12 | % | 1.41 | % | ||||||
S&P 500 Index | 2.11 | % | -0.25 | % | 0.40 | % | ||||||
Synthetic All-Asset Conservative Strategy Benchmark† | 3.97 | % | 3.94 | % | 4.17 | % | ||||||
| † | Benchmark reflects 32% Russell 3000® Index, 8% MSCI EAFE Index®, and 60% Barclays Capital U.S. Aggregate Bond Index. |
| * | The performance data represents past performance that is not predictive of future results. The investment return and principal value of an investment in the Fund will fluctuate so that an investor’s shares, when redeemed, may be worth more or less than their original cost. Returns are historical and include changes in principal and reinvested dividends and capital gains and do not reflect the effect of taxes. The S&P 500 Index, Barclays Capital U.S. Aggregate Bond Index, Russell 3000 Index, and the MSCI EAFE Index are unmanaged indices and, unlike the Fund, have no management fees or operating expenses to reduce their reported returns. Returns do not reflect the impact of any additional fees charged by insurance companies. |
THE GUGGENHEIM FUNDSANNUALREPORT | 7
| SCHEDULE OF INVESTMENTS | December 31, 2011 | |
| ALL-ASSET CONSERVATIVE STRATEGY FUND | ||
| SHARES | VALUE | |||||||
EXCHANGE TRADED | ||||||||
iShares Barclays Aggregate Bond Fund | 13,079 | $ | 1,441,960 | |||||
|
| |||||||
Total Exchange Traded Fund | 1,441,960 | |||||||
|
| |||||||
MUTUAL FUNDS†,1 - 64.2% | ||||||||
Alternatives Funds - 25.0% | ||||||||
RVT - U.S. Long Short Momentum Fund* | 99,787 | 1,193,453 | ||||||
RVT - Multi-Hedge Strategies Fund* | 33,604 | 739,957 | ||||||
RSF - Long Short Interest Rate Strategy Fund - H Class* | 11,374 | 268,425 | ||||||
RVT - Managed Futures Strategy Fund* | 7,909 | 161,656 | ||||||
RSF - Event Driven and Distressed Strategies Fund - H Class* | 6,436 | 159,416 | ||||||
RSF - Long/Short Commodities Strategy Fund - H Class | 5,426 | 130,394 | ||||||
RSF - Long Short Equity Strategy Fund - H Class* | 4,302 | 109,700 | ||||||
RSF - Alternative Strategies | 4,561 | 109,157 | ||||||
|
| |||||||
Total Alternatives Funds | 2,872,158 | |||||||
|
| |||||||
Fixed Income Funds - 24.0% | ||||||||
SBL Fund — Series E (U.S. Intermediate Bond Series) | 152,706 | 2,084,443 | ||||||
SBL Fund — Series P (High Yield Series) | 25,029 | 670,015 | ||||||
|
| |||||||
Total Fixed Income Funds | 2,754,458 | |||||||
|
| |||||||
Domestic Equity Funds - 12.0% | ||||||||
SBL Fund — Series B (Large Cap Value Series) | 21,485 | 532,612 | ||||||
SBL Fund — Series Y (Large Cap Concentrated Growth Series) | 55,601 | 529,318 | ||||||
SBL Fund — Series V (Mid Cap Value Series) | 2,541 | 135,814 | ||||||
SBL Fund — Series J (Mid Cap Growth Series) | 4,682 | 134,602 | ||||||
SBL Fund — Series Q (Small Cap Value Series) | 715 | 22,928 | ||||||
SBL Fund — Series X (Small Cap Growth Series) | 1,231 | 22,791 | ||||||
|
| |||||||
Total Domestic Equity Funds | 1,378,065 | |||||||
|
| |||||||
International Equity Funds - 3.2% | ||||||||
SBL Fund — Series D (MSCI EAFE Equal Weight Series) | 43,181 | 372,652 | ||||||
|
| |||||||
Total Mutual Funds | 7,377,333 | |||||||
|
| |||||||
| FACE AMOUNT | VALUE | |||||||
REPURCHASE AGREEMENT††,2 - 21.7% | ||||||||
Credit Suisse Group issued 12/30/11 at 0.00% due 01/03/12 | $ | 2,494,723 | $ | 2,494,723 | ||||
|
| |||||||
Total Repurchase Agreement | 2,494,723 | |||||||
|
| |||||||
Total Investments - 98.5% | $ | 11,314,016 | ||||||
|
| |||||||
Cash & Other Assets, Less Liabilities - 1.5% | 177,549 | |||||||
|
| |||||||
Total Net Assets - 100.0% | $ | 11,491,565 | ||||||
| ||||||||
| CONTRACTS | UNREALIZED GAIN (LOSS) | |||||||
FUTURES CONTRACTS PURCHASED† | ||||||||
March 2012 S&P 500 Index Mini Futures Contracts (Aggregate Value of Contracts $625,750) | 10 | $ | 10,612 | |||||
March 2012 MSCI EAFE Index Mini Futures Contracts (Aggregate Value of Contracts $703,300) | 10 | 5,412 | ||||||
March 2012 S&P/Toronto Stock Exchange 60 Index Futures Contracts (Aggregate Value of Contracts $133,386) | 1 | (12 | ) | |||||
January 2012 Hang Seng Index Futures Contracts (Aggregate Value of Contracts $119,047) | 1 | (649 | ) | |||||
March 2012 Nikkei-225 Stock Average Index Futures Contracts (Aggregate Value of Contracts $84,450) | 2 | (1,565 | ) | |||||
March 2012 SPI 200 Index Futures Contracts (Aggregate Value of Contracts $104,127) | 1 | (4,518 | ) | |||||
|
| |||||||
(Total Aggregate Value of Contracts $1,770,060) | $ | 9,280 | ||||||
|
| |||||||
INTEREST RATE FUTURES CONTRACTS PURCHASED† | ||||||||
March 2012 U.S. Treasury 5 Year Note Futures Contracts (Aggregate Value of Contracts $1,232,734) | 10 | $ | 5,923 | |||||
|
| |||||||
| 8 | THE GUGGENHEIM FUNDSANNUALREPORT | See Notes to Financial Statements. |
| SCHEDULE OF INVESTMENTS (concluded) | December 31, 2011 | |
| ALL-ASSET CONSERVATIVE STRATEGY FUND | ||
| CONTRACTS | UNREALIZED GAIN (LOSS) | |||||||
CURRENCY FUTURES CONTRACTS PURCHASED† | ||||||||
March 2012 Australian Dollar Futures Contracts (Aggregate Value of Contracts $101,390) | 1 | $ | 773 | |||||
March 2012 Canadian Dollar Futures Contracts (Aggregate Value of Contracts $98,000) | 1 | 227 | ||||||
|
| |||||||
(Total Aggregate Value of Contracts $199,390) | $ | 1,000 | ||||||
|
| |||||||
CURRENCY FUTURES CONTRACTS SOLD SHORT† | ||||||||
March 2012 British Pound Futures Contracts (Aggregate Value of Contracts $97,006) | 1 | $ | 660 | |||||
|
| |||||||
FUTURES CONTRACTS SOLD SHORT† | ||||||||
January 2012 CAC 40 Euro Futures Contracts (Aggregate Value of Contracts $122,620) | 3 | $ | (284 | ) | ||||
March 2012 FTSE 100 Index Futures Contracts (Aggregate Value of Contracts $85,983) | 1 | (770 | ) | |||||
March 2012 Russell 2000 Index Mini Futures Contracts (Aggregate Value of Contracts $147,280) | 2 | (3,497 | ) | |||||
|
| |||||||
(Total Aggregate Value of Contracts $355,883) | $ | (4,551 | ) | |||||
|
| |||||||
| * | Non-income producing security. |
| † | Value determined based on Level 1 inputs — See Note 4. |
| †† | Value determined based on Level 2 inputs — See Note 4. |
| 1 | Affiliated funds. |
| 2 | Repurchase Agreement — See Note 5. |
RSF — Rydex Series Funds
RVT — Rydex Variable Trust
SBL — Security Benefit Life
| See Notes to Financial Statements. | THE GUGGENHEIM FUNDSANNUALREPORT | 9 |
| ALL-ASSET CONSERVATIVE STRATEGY FUND | ||
STATEMENT OF ASSETS AND LIABILITIES
December 31, 2011
ASSETS: | ||||
Investments in unaffiliated issuers, at value | $ | 1,441,960 | ||
Investments in affiliated issuers, at value | 7,377,333 | |||
Repurchase agreements, at value | 2,494,723 | |||
|
| |||
Total Investments | 11,314,016 | |||
Segregated cash with broker | 183,971 | |||
Cash | 3 | |||
Receivables: | ||||
Fund shares sold | 16,223 | |||
Variation margin | 4,522 | |||
Dividends | 362 | |||
Investment Advisor | 4,930 | |||
|
| |||
Total assets | 11,524,027 | |||
|
| |||
LIABILITIES: | ||||
Payable for: | ||||
Fund shares redeemed | 27,532 | |||
Tax Expense | 4,930 | |||
|
| |||
Total liabilities | 32,462 | |||
|
| |||
NET ASSETS | $ | 11,491,565 | ||
|
| |||
NET ASSETS CONSISTOF: | ||||
Paid in capital | $ | 12,907,779 | ||
Undistributed net investment income | 26,588 | |||
Accumulated net realized loss on investments | (2,338,337 | ) | ||
Net unrealized appreciation on investments | 895,535 | |||
|
| |||
Net assets | $ | 11,491,565 | ||
Capital shares outstanding | 488,816 | |||
Net asset value per share | $ | 23.51 | ||
|
|
STATEMENT OF OPERATIONS
Year Ended December 31, 2011
INVESTMENT INCOME: | ||||
Dividends from securities of affiliated issuers | $ | 7,308 | ||
Dividends from securities of unaffiliated issuers | 10,378 | |||
Interest | 732 | |||
|
| |||
Total investment income | 18,418 | |||
|
| |||
EXPENSES: | ||||
Tax Expense | 4,930 | |||
|
| |||
Total expenses | 4,930 | |||
|
| |||
LESS: | ||||
Expenses reimbursed by Advisor | (4,930 | ) | ||
|
| |||
Net Expenses | — | |||
|
| |||
Net investment income | 18,418 | |||
|
| |||
NET REALIZEDAND UNREALIZED GAIN (LOSS): | ||||
Net realized gain (loss) on: | ||||
Investments in unaffiliated issuers | (58 | ) | ||
Investments in affiliated issuers | 110,182 | |||
Futures contracts | (7,203 | ) | ||
Foreign currency | 74 | |||
Realized gain distributions received from affiliated funds | 11,175 | |||
Realized gain distributions received from unaffiliated funds | 1,104 | |||
|
| |||
Net realized gain | 115,274 | |||
|
| |||
Net change in unrealized appreciation (depreciation) on: | ||||
Investments in unaffiliated issuers | 11,428 | |||
Investments in affiliated issuers | (308,676 | ) | ||
Futures contracts | 27,182 | |||
Foreign currency | 3 | |||
|
| |||
Net change in unrealized appreciation (depreciation) | (270,063 | ) | ||
|
| |||
Net realized and unrealized loss | (154,789 | ) | ||
|
| |||
Net decrease in net assets resulting from operations | $ | (136,371 | ) | |
|
|
| 10 | THE GUGGENHEIM FUNDSANNUALREPORT | See Notes to Financial Statements. |
ALL-ASSET CONSERVATIVE STRATEGY FUND
| ||
| STATEMENTS OF CHANGES IN NET ASSETS | ||
| Year Ended December 31, 2011 | Year Ended December 31, 2010 | |||||||
INCREASE (DECREASE) IN NET ASSETS FROM OPERATIONS: | ||||||||
Net investment income | $ | 18,418 | $ | 20,098 | ||||
Net realized gain on investments | 115,274 | 95,163 | ||||||
Net change in unrealized appreciation (depreciation) on investments | (270,063 | ) | 685,485 | |||||
|
|
|
| |||||
Net increase (decrease) in net assets resulting from operations | (136,371 | ) | 800,746 | |||||
|
|
|
| |||||
DISTRIBUTIONS TO SHAREHOLDERS FROM: | ||||||||
Net investment income | (20,098 | )a | (286,468 | )a | ||||
Net realized gains | (25,169 | )a | (4,516 | )a | ||||
|
|
|
| |||||
Total distributions to shareholders | (45,267 | ) | (290,984 | ) | ||||
|
|
|
| |||||
CAPITAL SHARE TRANSACTIONS: | ||||||||
Proceeds from sale of shares | 12,997,889 | 9,656,031 | ||||||
Distributions reinvested | 45,267 | 290,984 | ||||||
Cost of shares redeemed | (12,654,474 | ) | (7,343,088 | ) | ||||
|
|
|
| |||||
Net increase from capital share transactions | 388,682 | 2,603,927 | ||||||
|
|
|
| |||||
Net increase in net assets | 207,044 | 3,113,689 | ||||||
NET ASSETS: | ||||||||
Beginning of year | 11,284,521 | 8,170,832 | ||||||
|
|
|
| |||||
End of year | $ | 11,491,565 | $ | 11,284,521 | ||||
|
|
|
| |||||
Undistributed net investment income at end of year | $ | 26,588 | $ | (71,029 | ) | |||
|
|
|
| |||||
CAPITAL SHARE ACTIVITY: | ||||||||
Shares sold | 540,708 | 417,702 | ||||||
Shares issued from reinvestment of distributions | 1,927 | 12,388 | ||||||
Shares redeemed | (525,815 | ) | (315,960 | ) | ||||
|
|
|
| |||||
Net increase in shares | 16,820 | 114,130 | ||||||
|
|
|
| |||||
| a | For financial reporting purposes, certain distributions from net investment income for federal income tax purposes have been reclassified to distributions from realized gains. |
| See Notes to Financial Statements. | THE GUGGENHEIM FUNDSANNUALREPORT | 11 |
ALL-ASSET CONSERVATIVE STRATEGY FUND
| ||
FINANCIAL HIGHLIGHTS | ||
This table is presented to show selected data for a share outstanding throughout each period and to assist shareholders in evaluating a Fund’s performance for the periods presented.
| Year Ended December 31, 2011 | Year Ended December 31, 2010 | Year Ended December 31, 2009 | Year Ended December 31, 2008 | Year Ended December 31, 2007 | ||||||||||||||||
Per Share Data | ||||||||||||||||||||
Net asset value, beginning of period | $ | 23.91 | $ | 22.83 | $ | 21.73 | $ | 25.68 | $ | 25.09 | ||||||||||
|
|
|
|
|
|
|
|
|
| |||||||||||
Income (loss) from investment operations: | ||||||||||||||||||||
Net investment incomea | .04 | .05 | .40 | .89 | .61 | |||||||||||||||
Net gain (loss) on investments (realized and unrealized) | (.35 | ) | 1.63 | .70 | (3.67 | ) | 1.00 | |||||||||||||
|
|
|
|
|
|
|
|
|
| |||||||||||
Total from investment operations | (.31 | ) | 1.68 | 1.10 | (2.78 | ) | 1.61 | |||||||||||||
|
|
|
|
|
|
|
|
|
| |||||||||||
Less distributions from: | ||||||||||||||||||||
Net investment income | (.04 | )c | (.59 | )c | (— | )b | (.91 | ) | (.33 | )c | ||||||||||
Net realized gains | (.05 | )c | (.01 | )c | — | (.26 | ) | (.69 | )c | |||||||||||
|
|
|
|
|
|
|
|
|
| |||||||||||
Total distributions | (.09 | ) | (.60 | ) | (— | ) | (1.17 | ) | (1.02 | ) | ||||||||||
|
|
|
|
|
|
|
|
|
| |||||||||||
Net asset value, end of period | $ | 23.51 | $ | 23.91 | $ | 22.83 | $ | 21.73 | $ | 25.68 | ||||||||||
|
|
|
|
|
|
|
|
|
| |||||||||||
Total Returnd | (1.30 | %) | 7.40 | % | 5.06 | % | (10.83 | %) | 6.45 | % | ||||||||||
|
|
|
|
|
|
|
|
|
| |||||||||||
Ratios/Supplemental Data | ||||||||||||||||||||
Net assets, end of period (in thousands) | $ | 11,492 | $ | 11,285 | $ | 8,171 | $ | 11,022 | $ | 5,439 | ||||||||||
|
|
|
|
|
|
|
|
|
| |||||||||||
Ratios to average net assets: | ||||||||||||||||||||
Net investment income | 0.16 | % | 0.20 | % | 1.86 | % | 3.72 | % | 2.33 | % | ||||||||||
Total expensese | 0.04 | % | — | — | f | 0.01 | % | 0.03 | % | |||||||||||
Net Expenses | — | g | — | — | f | 0.01 | % | 0.03 | % | |||||||||||
|
|
|
|
|
|
|
|
|
| |||||||||||
Portfolio turnover rate | 148 | % | 165 | % | 291 | % | 314 | % | 395 | % | ||||||||||
| a | Net investment income per share was computed using average shares outstanding throughout the period. |
| b | Less than $.01 per share. |
| c | For financial reporting purposes, certain distributions from net investment income for federal income tax purposes have been reclassified to distributions from realized gains. |
| d | Total return does not reflect the impact of any additional fees charged by insurance companies and has not been annualized. |
| e | Does not include expenses of the underlying funds in which the Fund invests. |
| f | Less than .01%. |
| g | Net expense information reflects the expense ratios after waivers. |
| 12 | THE GUGGENHEIM FUNDSANNUALREPORT | See Notes to Financial Statements. |
This page intentionally left blank.
THE GUGGENHEIM FUNDSANNUALREPORT | 13
| PERFORMANCE REPORT AND FUND PROFILE (Unaudited) | December 31, 2011 |
ALL-ASSET MODERATE STRATEGY FUND
OBJECTIVE: Seeks to primarily provide growth of capital and, secondarily, preservation of capital.
The markets entered 2011 underestimating global impacts of risks and, in some cases, unexpected events. To name a few: the European debt crisis surprised the market with more problems yet few tangible solutions looming; an earthquake and tsunami occurred in Japan, with much more tragic consequences than usual; and China’s rising inflation forced its government to tighten monetary policy more strictly than expected.
The S&P 500® Index* ended 2011 close to its level at the end of 2010, yet it was one of the best-performing equity markets anywhere in the world. But there was intra-year volatility, and it once reached levels seen in early 2009. Bonds had another great year, with fixed-income investments generally rising 6.25%, and an index of long-term Treasury bonds was up almost 30%. For the past 30 years, long governments have risen 11.5% annually, compared with a 10.8% rise in the S&P 500—the first time that has occurred since before the Civil War.
Our dynamically managed tactical overlay made a positive contribution to performance, but not enough to permit the portfolio to overcome the tumult in the market. For the year ended December 31, 2011, the All- Asset Moderate Strategy Fund returned -2.81%, compared with its benchmark (48% Russell 3000® Index*, 12% MSCI EAFE Index* and 40% Barclays Capital U.S. Aggregate Bond Index*), which rose 2.48%.
In the period, the U.S. Intermediate Bond Series, the Multi- Hedge Strategies Fund and the U.S. Long Short Momentum Fund contributed to performance.
The MSCI EAFE Equal Weight Fund, the Long Short Interest Rate Strategy Fund and the Mid-Cap Value Fund detracted from performance.
Derivatives in the Fund are used to provide the most efficient exposure to the components of the blended benchmark, as well as to provide liquidity.
| * | Standard & Poor’s 500 Index (S&P 500®) – a capitalization-weighted index covering 500 industrial, utility, transportation and financial companies of the U.S markets (mostly NYSE Euronext issues). |
| * | The MSCI EAFE Index (Europe, Australasia, Far East) is a free float-adjusted market capitalization index that is designed to measure the equity market performance of developed markets, excluding the US & Canada. The MSCI EAFE Index consists of the following 22 developed market country indices: Australia, Austria, Belgium, Denmark, Finland, France, Germany, Greece, Hong Kong, Ireland, Israel, Italy, Japan, the Netherlands, New Zealand, Norway, Portugal, Singapore, Spain, Sweden, Switzerland, and the United Kingdom. |
| * | The Russell 3000® Index measures the performance of the largest 3,000 U.S. companies, representing approximately 98% of the investable U.S. equity market. |
| * | The Barclays Capital U.S. Aggregate Bond Index measures performance of the U.S. investment-grade bond market, including investment-grade U.S. government bonds, investment-grade corporate bonds, mortgage pass-through securities and asset-backed securities. |
Performance displayed represents past performance which is no guarantee of future results.
Holdings Diversification (Market Exposure as % of Net Assets)
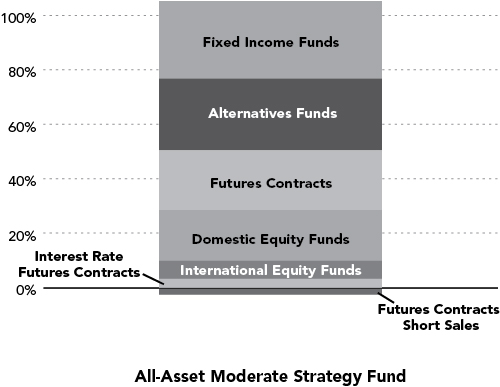
“Holdings Diversification (Market Exposure as % of Net Assets)” excludes any temporary cash investments.
Inception Date: October 27, 2006
Ten Largest Holdings (% of Total Net Assets) | ||||
SBL Fund — Series E | 18.1 | % | ||
RVT — U.S. Long Short Momentum Fund | 11.3 | % | ||
iShares Barclays Aggregate Bond Fund | 9.6 | % | ||
SBL Fund — Series B | 6.9 | % | ||
SBL Fund — Series Y | 6.8 | % | ||
SBL Fund — Series D | 6.7 | % | ||
RVT — Multi-Hedge Strategies Fund | 5.5 | % | ||
RSF — Long Short Interest | 2.9 | % | ||
SBL Fund — Series V | 1.9 | % | ||
SBL Fund — Series J | 1.9 | % | ||
|
| |||
Top Ten Total | 71.6 | % | ||
|
| |||
“Ten Largest Holdings” exclude any temporary cash or derivative investments.
RSF – Rydex Series Funds
RVT – Rydex Variable Trust
SBL – Security Benefit Life
14 | THE GUGGENHEIM FUNDSANNUALREPORT
PERFORMANCE REPORT AND FUND PROFILE (Unaudited) (concluded)
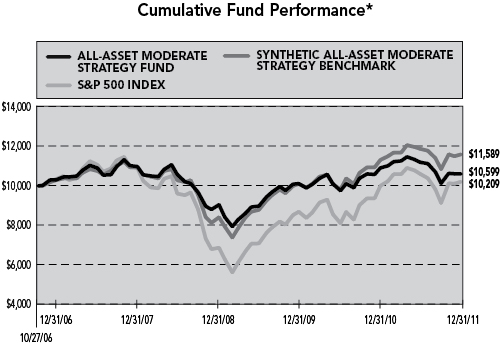
Average Annual Returns*
Periods Ended 12/31/11
| 1 Year | 5 Year | Since Inception (10/27/06) | ||||||||||
All-Asset Moderate Strategy Fund | -2.81 | % | 0.58 | % | 1.13 | % | ||||||
S&P 500 Index | 2.11 | % | -0.25 | % | 0.40 | % | ||||||
Synthetic All-Asset Moderate Strategy Benchmark† | 2.48 | % | 2.42 | % | 2.89 | % | ||||||
| † | Benchmark reflects 48% Russell 3000® Index, 12% MSCI EAFE Index®, and 40% Barclays Capital U.S. Aggregate Bond Index. |
| * | The performance data represents past performance that is not predictive of future results. The investment return and principal value of an investment in the Fund will fluctuate so that an investor’s shares, when redeemed, may be worth more or less than their original cost. Returns are historical and include changes in principal and reinvested dividends and capital gains and do not reflect the effect of taxes. The S&P 500 Index, Barclays Capital U.S. Aggregate Bond Index, Russell 3000 Index, and the MSCI EAFE Index are unmanaged indices and, unlike the Fund, have no management fees or operating expenses to reduce their reported returns. Returns do not reflect the impact of any additional fees charged by insurance companies. |
THE GUGGENHEIM FUNDSANNUALREPORT | 15
| SCHEDULE OF INVESTMENT | December 31, 2011 | |
| ALL-ASSET MODERATE STRATEGY FUND | ||
| SHARES | VALUE | |||||||
EXCHANGE TRADED FUND† - 9.6% |
| |||||||
iShares Barclays Aggregate Bond Fund | 16,731 | $ | 1,844,593 | |||||
|
| |||||||
Total Exchange Traded Fund | 1,844,593 | |||||||
|
| |||||||
MUTUAL FUNDS†,1 - 70.5% | ||||||||
Alternatives Funds - 26.4% | ||||||||
RVT - U.S. Long Short Momentum Fund* | 181,850 | 2,174,920 | ||||||
RVT - Multi-Hedge Strategies Fund* | 47,874 | 1,054,175 | ||||||
RSF - Long Short Interest Rate Strategy Fund - H Class* | 23,392 | 552,045 | ||||||
RSF - Long/Short Commodities Strategy Fund - H Class | 14,883 | 357,633 | ||||||
RSF - Event Driven and Distressed Strategies Fund - H Class* | 13,174 | 326,309 | ||||||
RSF - Long Short Equity Strategy Fund - H Class* | 8,401 | 214,227 | ||||||
RVT - Managed Futures Strategy Fund* | 9,886 | 202,068 | ||||||
RSF - Alternative Strategies Fund - H Class* | 7,735 | 185,102 | ||||||
|
| |||||||
Total Alternatives Funds | 5,066,479 | |||||||
|
| |||||||
Fixed Income Funds - 18.9% | ||||||||
SBL Fund — Series E (U.S. Intermediate Bond Series) | 254,994 | 3,480,665 | ||||||
SBL Fund — Series P (High Yield Series) | 5,804 | 155,373 | ||||||
|
| |||||||
Total Fixed Income Funds | 3,636,038 | |||||||
|
| |||||||
Domestic Equity Funds - 18.5% | ||||||||
SBL Fund — Series B (Large Cap Value Series) | 53,602 | 1,328,795 | ||||||
SBL Fund — Series Y (Large Cap Concentrated Growth Series) | 137,627 | 1,310,205 | ||||||
SBL Fund — Series V (Mid Cap Value Series) | 6,869 | 367,153 | ||||||
SBL Fund — Series J (Mid Cap Growth Series) | 12,534 | 360,364 | ||||||
SBL Fund — Series Q (Small Cap Value Series) | 2,980 | 95,638 | ||||||
SBL Fund — Series X (Small Cap Growth Series) | 5,125 | 94,909 | ||||||
|
| |||||||
Total Domestic Equity Funds | 3,557,064 | |||||||
|
| |||||||
International Equity Funds - 6.7% |
| |||||||
SBL Fund — Series D | 148,117 | 1,278,252 | ||||||
|
| |||||||
Total Mutual Funds | 13,537,833 | |||||||
|
| |||||||
| FACE AMOUNT | VALUE | |||||||
REPURCHASE AGREEMENT††,2 - 17.4% |
| |||||||
Credit Suisse Group issued 12/30/11 at 0.00% due 01/03/12 | $ | 3,337,059 | $ | 3,337,059 | ||||
|
| |||||||
Total Repurchase Agreement | 3,337,059 | |||||||
|
| |||||||
Total Investments - 97.5% | $ | 18,719,485 | ||||||
|
| |||||||
Cash & Other Assets, Less |
| 476,330 | ||||||
|
| |||||||
Total Net Assets - 100.0% | $ | 19,195,815 | ||||||
| ||||||||
| CONTRACTS | UNREALIZED GAIN (LOSS) | |||||||
FUTURES CONTRACTS PURCHASED† | ||||||||
March 2012 S&P 500 Index Mini Futures Contracts (Aggregate Value of Contracts $2,002,400) | 32 | $ | 33,958 | |||||
March 2012 MSCI EAFE Index Mini Futures Contracts (Aggregate Value of Contracts $1,547,260) | 22 | 11,907 | ||||||
March 2012 S&P/Toronto Stock Exchange 60 Index Futures Contracts (Aggregate Value of Contracts $133,386) | 1 | (12 | ) | |||||
January 2012 Hang Seng Index Futures Contracts (Aggregate Value of Contracts $119,047) | 1 | (649 | ) | |||||
March 2012 DAX Index Futures Contracts (Aggregate Value of Contracts $190,877) | 1 | (821 | ) | |||||
March 2012 Nikkei-225 Stock Average Index Futures Contracts (Aggregate Value of Contracts $126,675) | 3 | (2,348 | ) | |||||
March 2012 SPI 200 Index Futures Contracts (Aggregate Value of Contracts $104,127) | 1 | (4,518 | ) | |||||
|
| |||||||
(Total Aggregate Value of Contracts $4,223,772) | $ | 37,517 | ||||||
|
| |||||||
| 16 | THE GUGGENHEIM FUNDSANNUALREPORT | See Notes to Financial Statements. |
| SCHEDULE OF INVESTMENTS (concluded) | December 31, 2011 | |
| ALL-ASSET MODERATE STRATEGY FUND | ||
| CONTRACTS | UNREALIZED GAIN (LOSS) | |||||||
INTEREST RATE FUTURES CONTRACTS PURCHASED† |
| |||||||
March 2012 U. S. Treasury 5 Year Note | 5 | $ | 2,962 | |||||
|
| |||||||
CURRENCY FUTURES CONTRACTS PURCHASED† |
| |||||||
March 2012 Australian Dollar Futures Contracts (Aggregate Value of Contracts $101,390) | 1 | $ | 772 | |||||
March 2012 Canadian Dollar Futures Contracts (Aggregate Value of Contracts $196,000) | 2 | 455 | ||||||
|
| |||||||
(Total Aggregate Value of Contracts $297,390) | $ | 1,227 | ||||||
|
| |||||||
CURRENCY FUTURES CONTRACTS SOLD SHORT† |
| |||||||
March 2012 British Pound Futures Contracts (Aggregate Value of Contracts $194,012) | 2 | $ | 1,321 | |||||
|
| |||||||
FUTURES CONTRACTS SOLD SHORT† |
| |||||||
January 2012 CAC 40 Euro Futures Contracts (Aggregate Value of Contracts $204,367) | 5 | $ | (473 | ) | ||||
March 2012 FTSE 100 Index Futures Contracts (Aggregate Value of Contracts $171,966) | 2 | (1,540 | ) | |||||
March 2012 Russell 2000 Index Mini Futures Contracts (Aggregate Value of Contracts $147,280) | 2 | (3,497 | ) | |||||
|
| |||||||
(Total Aggregate Value of Contracts $523,613) | $ | (5,510 | ) | |||||
|
| |||||||
| * | Non-income producing security. |
| † | Value determined based on Level 1 inputs — See Note 4. |
| †† | Value determined based on Level 2 inputs — See Note 4. |
| 1 | Affiliated funds. |
| 2 | Repurchase Agreement — See Note 5. |
RSF — Rydex Series Funds
RVT — Rydex Variable Trust
SBL — Security Benefit Life
| See Notes to Financial Statements. | THE GUGGENHEIM FUNDSANNUALREPORT | 17 |
| ALL-ASSET MODERATE STRATEGY FUND | ||
STATEMENT OF ASSETS AND LIABILITIES
December 31, 2011
ASSETS: | ||||
Investments in unaffiliated issuers, at value | $ | 1,844,593 | ||
Investments in affiliated issuers, at value | 13,537,833 | |||
Repurchase agreements, at value | 3,337,059 | |||
|
| |||
Total Investments | 18,719,485 | |||
Segregated cash with broker | 375,053 | |||
Cash | 16 | |||
Receivables: | ||||
Fund shares sold | 101,216 | |||
Dividends | 464 | |||
Investment Advisor | 9,102 | |||
|
| |||
Total assets | 19,205,336 | |||
|
| |||
LIABILITIES: | ||||
Payable for: | ||||
Fund shares redeemed | 264 | |||
Variation margin | 155 | |||
Tax Expense | 9,102 | |||
|
| |||
Total liabilities | 9,521 | |||
|
| |||
NET ASSETS | $ | 19,195,815 | ||
|
| |||
NET ASSETS CONSISTOF: | ||||
Paid in capital | $ | 21,984,671 | ||
Undistributed net investment income | 46,785 | |||
Accumulated net realized loss on investments | (4,578,699 | ) | ||
Net unrealized appreciation on investments | 1,743,058 | |||
|
| |||
Net assets | $ | 19,195,815 | ||
Capital shares outstanding | 807,493 | |||
Net asset value per share | $ | 23.77 | ||
|
|
STATEMENT OF OPERATIONS
Year Ended December 31, 2011
INVESTMENT INCOME: | ||||
Dividends from securities of affiliated issuers | $ | 18,800 | ||
Dividends from securities of unaffiliated issuers | 12,636 | |||
Interest | 1,246 | |||
|
| |||
Total investment income | 32,682 | |||
|
| |||
EXPENSES: | ||||
Tax Expense | 9,102 | |||
|
| |||
Total expenses | 9,102 | |||
|
| |||
LESS: | ||||
Expenses reimbursed by Advisor | (9,102 | ) | ||
|
| |||
Net Expenses | — | |||
|
| |||
Net investment income | 32,682 | |||
|
| |||
NET REALIZED AND UNREALIZED GAIN (LOSS): | ||||
Net realized gain (loss) on: | ||||
Investments in unaffiliated issuers | (444 | ) | ||
Investments in affiliated issuers | 570,526 | |||
Futures contracts | (232,139 | ) | ||
Foreign currency | (267 | ) | ||
Realized gain distributions received from affiliated funds | 19,872 | |||
Realized gain distributions received from unaffiliated funds | 1,344 | |||
|
| |||
Net realized gain | 358,892 | |||
|
| |||
Net change in unrealized appreciation (depreciation) on: | ||||
Investments in unaffiliated issuers | 14,318 | |||
Investments in affiliated issuers | (1,022,072 | ) | ||
Futures contracts | 38,374 | |||
Foreign currency | 33 | |||
|
| |||
Net change in unrealized appreciation (depreciation) | (969,347 | ) | ||
|
| |||
Net realized and unrealized loss | (610,455 | ) | ||
|
| |||
Net decrease in net assets resulting from operations | $ | (577,773 | ) | |
|
|
| 18 | THE GUGGENHEIM FUNDSANNUALREPORT | See Notes to Financial Statements. |
| ALL-ASSET MODERATE STRATEGY FUND | ||
STATEMENTS OF CHANGES IN NET ASSETS | ||
| Year Ended December 31, 2011 | Year Ended December 31, 2010 | |||||||
INCREASE (DECREASE) IN NET ASSETS FROM OPERATIONS: | ||||||||
Net investment income | $ | 32,682 | $ | 40,301 | ||||
Net realized gain on investments | 358,892 | 214,650 | ||||||
Net change in unrealized appreciation (depreciation) on investments | (969,347 | ) | 1,160,008 | |||||
|
|
|
| |||||
Net increase (decrease) in net assets resulting from operations | (577,773 | ) | 1,414,959 | |||||
|
|
|
| |||||
DISTRIBUTIONSTOSHAREHOLDERSFROM: | ||||||||
Net investment income | (40,301 | )a | (388,005 | )a | ||||
Net realized gains | (41,167 | )a | (10,849 | )a | ||||
|
|
|
| |||||
Total distributions to shareholders | (81,468 | ) | (398,854 | ) | ||||
|
|
|
| |||||
CAPITALSHARETRANSACTIONS: | ||||||||
Proceeds from sale of shares | 9,199,143 | 15,525,622 | ||||||
Distributions reinvested | 81,468 | 398,854 | ||||||
Cost of shares redeemed | (10,546,739 | ) | (14,495,251 | ) | ||||
|
|
|
| |||||
Net increase (decrease) from capital share transactions | (1,266,128 | ) | 1,429,225 | |||||
|
|
|
| |||||
Net increase (decrease) in net assets | (1,925,369 | ) | 2,445,330 | |||||
NETASSETS: | ||||||||
Beginning of year | 21,121,184 | 18,675,854 | ||||||
|
|
|
| |||||
End of year | $ | 19,195,815 | $ | 21,121,184 | ||||
|
|
|
| |||||
Undistributed net investment income at end of year | $ | 46,785 | $ | (83,473 | ) | |||
|
|
|
| |||||
CAPITALSHAREACTIVITY: | ||||||||
Shares sold | 372,015 | 664,745 | ||||||
Shares issued from reinvestment of distributions | 3,416 | 16,675 | ||||||
Shares redeemed | (427,909 | ) | (625,448 | ) | ||||
|
|
|
| |||||
Net increase (decrease) in shares | (52,478 | ) | 55,972 | |||||
|
|
|
| |||||
| a | For financial reporting purposes, certain distributions from net investment income for federal income tax purposes have been reclassified to distributions from realized gains. |
| See Notes to Financial Statements. | THE GUGGENHEIM FUNDSANNUALREPORT | 19 |
ALL-ASSET MODERATE STRATEGY FUND
FINANCIAL HIGHLIGHTS | ||
This table is presented to show selected data for a share outstanding throughout each period and to assist shareholders in evaluating a Fund’s performance for the periods presented.
| Year Ended December 31, 2011 | Year Ended December 31, 2010 | Year Ended December 31, 2009 | Year Ended December 31, 2008 | Year Ended December 31, 2007 | ||||||||||||||||
Per Share Data | ||||||||||||||||||||
Net asset value, beginning of period | $ | 24.56 | $ | 23.23 | $ | 20.78 | $ | 25.96 | $ | 25.01 | ||||||||||
|
|
|
|
|
|
|
|
|
| |||||||||||
Income (loss) from investment operations: | ||||||||||||||||||||
Net investment incomea | .04 | .05 | .26 | .47 | .36 | |||||||||||||||
Net gain (loss) on investments (realized and unrealized) | (.73 | ) | 1.76 | 2.19 | (5.04 | ) | 1.27 | |||||||||||||
|
|
|
|
|
|
|
|
|
| |||||||||||
Total from investment operations | (.69 | ) | 1.81 | 2.45 | (4.57 | ) | 1.63 | |||||||||||||
|
|
|
|
|
|
|
|
|
| |||||||||||
Less distributions from: | ||||||||||||||||||||
Net investment income | (.05 | )c | (.47 | )c | (— | )b | (.44 | ) | (.22 | )c | ||||||||||
Net realized gains | (.05 | )c | (.01 | )c | — | (.17 | ) | (.46 | )c | |||||||||||
|
|
|
|
|
|
|
|
|
| |||||||||||
Total distributions | (.10 | ) | (.48 | ) | (— | ) | (.61 | ) | (.68 | ) | ||||||||||
|
|
|
|
|
|
|
|
|
| |||||||||||
Net asset value, end of period | $ | 23.77 | $ | 24.56 | $ | 23.23 | $ | 20.78 | $ | 25.96 | ||||||||||
|
|
|
|
|
|
|
|
|
| |||||||||||
Total Returnd | (2.81 | %) | 7.86 | % | 11.79 | % | (17.58 | %) | 6.56 | % | ||||||||||
|
|
|
|
|
|
|
|
|
| |||||||||||
Ratios/Supplemental Data | ||||||||||||||||||||
Net assets, end of period (in thousands) | $ | 19,196 | $ | 21,121 | $ | 18,676 | $ | 19,841 | $ | 14,285 | ||||||||||
|
|
|
|
|
|
|
|
|
| |||||||||||
Ratios to average net assets: | ||||||||||||||||||||
Net investment income | 0.16 | % | 0.20 | % | 1.25 | % | 1.99 | % | 1.36 | % | ||||||||||
Total expensese | 0.04 | % | — | f | — | f | — | f | 0.01 | % | ||||||||||
Net Expenses | — | g | — | f | — | f | — | f | 0.01 | % | ||||||||||
|
|
|
|
|
|
|
|
|
| |||||||||||
Portfolio turnover rate | 108 | % | 187 | % | 256 | % | 232 | % | 269 | % | ||||||||||
| a | Net investment income per share was computed using average shares outstanding throughout the period. |
| b | Distributions from net investment income are less than $0.01 per share. |
| c | For financial reporting purposes, certain distributions from net investment income for federal income tax purposes have been reclassified to distributions from realized gains. |
| d | Total return does not reflect the impact of any additional fees charged by insurance companies and has not been annualized. |
| e | Does not include expenses of the underlying funds in which the Fund invests. |
| f | Less than .01%. |
| g | Net expense information reflects the expense ratios after waivers. |
| 20 | THE GUGGENHEIM FUNDSANNUALREPORT | See Notes to Financial Statements. |
This page intentionally left blank.
THE GUGGENHEIM FUNDSANNUALREPORT | 21
| PERFORMANCE REPORT AND FUND PROFILE (Unaudited) | December 31, 2011 |
ALL-ASSET AGGRESSIVE STRATEGY FUND
OBJECTIVE: Seeks to primarily provide growth of capital.
The markets entered 2011 underestimating global impacts of risks and, in some cases, unexpected events. To name a few: the European debt crisis surprised the market with more problems yet few tangible solutions looming; an earthquake and tsunami occurred in Japan, with much more tragic consequences than usual; and China’s rising inflation forced its government to tighten monetary policy more strictly than expected.
The S&P 500® Index* ended 2011 close to its level at the end of 2010, yet it was one of the best-performing equity markets anywhere in the world. But there was intra-year volatility, and it once reached levels seen in early 2009. Bonds had another great year, with fixed-income investments generally rising 6.25%, and an index of long-term Treasury bonds was up almost 30%. For the past 30 years, long governments have risen 11.5% annually, compared with a 10.8% rise in the S&P 500 Index*—the first time that has occurred since before the Civil War.
Our dynamically managed tactical overlay made a positive contribution to performance, but not enough to permit the portfolio to overcome the tumult in the market. For the year ended December 31, 2011, the All-Asset Aggressive Strategy Fund returned-4.29%, compared with its benchmark (64% Russell 3000® Index*, 16% MSCI EAFE Index* and 20% Barclays Capital U.S. Aggregate Bond Index*), which rose 0.00%.
In the period, the U.S. Intermediate Bond Series, the Multi-Hedge Strategies Fund and the U.S. Long Short Momentum Fund contributed to performance.
The MSCI EAFE Equal Weight Fund, the Long Short Interest Rate Strategy Fund and the Mid-Cap Value Fund detracted from performance.
Derivatives in the Fund are used to provide the most efficient exposure to the components of the blended benchmark, as well as to provide liquidity.
| * | Standard & Poor’s 500 Index (S&P 500®) – a capitalization-weighted index covering 500 industrial, utility, transportation and financial companies of the U.S markets (mostly NYSE Euronext issues). |
| * | The MSCI EAFE Index (Europe, Australasia, Far East) is a free float-adjusted market capitalization index that is designed to measure the equity market performance of developed markets, excluding the US & Canada. The MSCI EAFE Index consists of the following 22 developed market country indices: Australia, Austria, Belgium, Denmark, Finland, France, Germany, Greece, Hong Kong, Ireland, Israel, Italy, Japan, the Netherlands, New Zealand, Norway, Portugal, Singapore, Spain, Sweden, Switzerland, and the United Kingdom. |
| * | The Russell 3000® Index measures the performance of the largest 3,000 U.S. companies, representing approximately 98% of the investable U.S. equity market. |
| * | The Barclays Capital U.S. Aggregate Bond Index measures performance of the U.S. investment-grade bond market, including investment-grade U.S. government bonds, investment-grade corporate bonds, mortgage pass-through securities and asset-backed securities. Performance displayed represents past performance which is no guarantee of future results. |
Holdings Diversification (Market Exposure as % of Net Assets)

“Holdings Diversification (Market Exposure as % of Net Assets)” excludes any temporary cash investments.
Inception: October 27, 2006
Ten Largest Holdings (% of Total Net Assets) | ||||
RVT - U.S. Long Short Momentum Fund | 14.2 | % | ||
SBL Fund — Series B | 9.1 | % | ||
SBL Fund — Series Y (Large Cap | 8.9 | % | ||
SBL Fund — Series E | 8.4 | % | ||
SBL Fund — Series D (M SCI EAFE Equal Weight Series) | 7.6 | % | ||
iShares Barclays Aggregate Bond Fund | 6.8 | % | ||
RVT - Multi-Hedge Strategies Fund | 3.9 | % | ||
RSF - Long Short Interest Rate | 3.4 | % | ||
RSF - Long/Short Commodities | 2.4 | % | ||
SBL Fund — Series V (M id Cap Value Series) | 2.3 | % | ||
|
| |||
Top Ten Total | 67.0 | % | ||
|
| |||
“Ten Largest Holdings” exclude any temporary cash or derivative investments.
RSF – Rydex Series Funds
RVT – Rydex Variable Trust
SBL – Security Benefit Life
22 | THE GUGGENHEIM FUNDSANNUALREPORT
PERFORMANCE REPORT AND FUND PROFILE (Unaudited) (concluded)
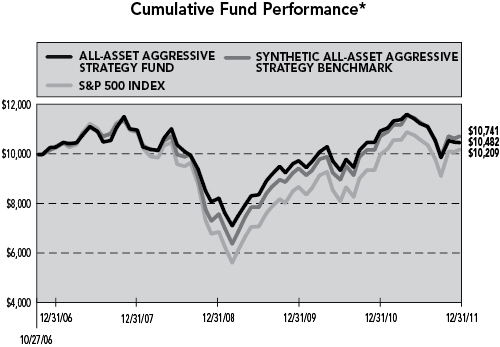
Average Annual Returns*
Periods Ended 12/31/11
| 1 Year | 5 Year | Since Inception (10/27/06) | ||||||||||
All-Asset Aggressive Strategy Fund | -4.29 | % | 0.35 | % | 0.91 | % | ||||||
S&P 500 Index | 2.11 | % | -0.25 | % | 0.40 | % | ||||||
Synthetic All-Asset Aggressive Strategy Benchmark† | 0.00 | % | 0.89 | % | 1.39 | % | ||||||
| † | Benchmark reflects 64% Russell 3000® Index, 16% MSCI EAFE Index®, and 20% Barclays Capital U.S. Aggregate Bond Index. |
| * | The performance data represents past performance that is not predictive of future results. The investment return and principal value of an investment in the Fund will fluctuate so that an investor’s shares, when redeemed, may be worth more or less than their original cost. Returns are historical and include changes in principal and reinvested dividends and capital gains and do not reflect the effect of taxes. The S&P 500 Index, Barclays Capital U.S. Aggregate Bond Index, Russell 3000 Index, and the MSCI EAFE Index are unmanaged indices and, unlike the Fund, have no management fees or operating expenses to reduce their reported returns. Returns do not reflect the impact of any additional fees charged by insurance companies. |
THE GUGGENHEIM FUNDSANNUALREPORT | 23
| SCHEDULE OF INVESTMENTS | December 31, 2011 | |
| ALL-ASSET AGGRESSIVE STRATEGY FUND | ||
| SHARES | VALUE | |||||||
EXCHANGE TRADED FUND† - 6.8% |
| |||||||
iShares Barclays Aggregate Bond Fund | 2,821 | $ | 311,015 | |||||
|
| |||||||
Total Exchange Traded Fund | 311,015 | |||||||
|
| |||||||
MUTUAL FUNDS†,1 - 70.4% | ||||||||
Alternatives Funds - 29.5% | ||||||||
RVT - U.S. Long Short Momentum Fund* | 54,322 | 649,690 | ||||||
RVT - Multi-Hedge Strategies Fund* | 8,140 | 179,245 | ||||||
RSF - Long Short Interest Rate Strategy Fund - H Class* | 6,599 | 155,736 | ||||||
RSF - Long/Short Commodities Strategy Fund - H Class | 4,562 | 109,620 | ||||||
RVT - Managed Futures Strategy Fund* | 4,528 | 92,550 | ||||||
RSF - Long Short Equity Strategy Fund - H Class* | 2,386 | 60,839 | ||||||
RSF - Event Driven and Distressed Strategies Fund - H Class* | 2,395 | 59,332 | ||||||
RSF - Alternative Strategies Fund - H Class* | 1,816 | 43,468 | ||||||
|
| |||||||
Total Alternatives Funds | 1,350,480 | |||||||
|
| |||||||
Domestic Equity Funds - 24.7% | ||||||||
SBL Fund — Series B (Large Cap Value Series) | 16,939 | 419,925 | ||||||
SBL Fund — Series Y | 42,686 | 406,368 | ||||||
SBL Fund — Series V | 1,947 | 104,050 | ||||||
SBL Fund — Series J | 3,586 | 103,084 | ||||||
SBL Fund — Series Q (Small Cap Value Series) | 1,566 | 50,242 | ||||||
SBL Fund — Series X | 2,690 | 49,828 | ||||||
|
| |||||||
Total Domestic Equity Funds | 1,133,497 | |||||||
|
| |||||||
Fixed Income Funds - 8.6% | ||||||||
SBL Fund — Series E | 28,236 | 385,421 | ||||||
SBL Fund — Series P | 267 | 7,153 | ||||||
|
| |||||||
Total Fixed Income Funds | 392,574 | |||||||
|
| |||||||
International Equity Funds - 7.6% |
| |||||||
SBL Fund — Series D (MSCI EAFE Equal Weight Series) | 40,191 | 346,845 | ||||||
|
| |||||||
Total Mutual Funds | 3,223,396 | |||||||
|
| |||||||
| FACE AMOUNT | ||||||||
REPURCHASE AGREEMENT††,2 - 20.9% |
| |||||||
Credit Suisse Group issued 12/30/11 at 0.00% due 01/03/12 | $ | 957,522 | 957,522 | |||||
Total Repurchase Agreement |
| 957,522 | ||||||
Total In vestments - 98.1% |
| $ | 4,491,933 | |||||
|
| |||||||
Cash & Other Assets, Less |
| 86,189 | ||||||
|
| |||||||
Total Net Assets - 100.0% |
| $ | 4,578,122 | |||||
| CONTRACTS | UNREALIZED GAIN (LOSS) | |||||||
FUTURES CONTRACTS PURCHASED† |
| |||||||
March 2012 S&P 500 Index Mini Futures Contracts (Aggregate Value of Contracts $688,325) | 11 | $ | 11,673 | |||||
March 2012 MSCI EAFE Index Mini Futures Contracts (Aggregate Value of Contracts $421,980) | 6 | 3,247 | ||||||
March 2012 Nikkei-225 Stock Average Index Futures Contracts (Aggregate Value of Contracts $42,225) | 1 | (782 | ) | |||||
|
| |||||||
(Total Aggregate Value of Contracts $1,152,530) | $ | 14,138 | ||||||
|
| |||||||
FUTURES CONTRACTS SOLD SHORT† |
| |||||||
January 2012 CAC 40 Euro Futures Contracts (Aggregate Value of Contracts $40,873) | 1 | $ | (95 | ) | ||||
|
| |||||||
| * | Non-income producing security. |
| † | Value determined based on Level 1 inputs — See Note 4. |
| †† | Value determined based on Level 2 inputs — See Note 4. |
| 1 | Affiliated funds. |
| 2 | Repurchase Agreement — See Note 5. |
RSF — Rydex Series Funds
RVT — Rydex Variable Trust
SBL — Security Benefit Life
| 24 | THE GUGGENHEIM FUNDSANNUALREPORT | See Notes to Financial Statements. |
ALL-ASSET AGGRESSIVE STRATEGY FUND
STATEMENT OF ASSETS AND LIABILITIES |
| |||
December 31, 2011 | ||||
ASSETS: | ||||
Investments in unaffiliated issuers, at value | $ | 311,015 | ||
Investments in affiliated issuers, at value | 3,223,396 | |||
Repurchase agreements, at value | 957,522 | |||
|
| |||
Total Investments | 4,491,933 | |||
Segregated cash with broker | 88,641 | |||
Cash | 1 | |||
Receivables: | ||||
Dividends | 78 | |||
Fund shares sold | 59 | |||
Investment Advisor | 5,379 | |||
|
| |||
Total assets | 4,586,091 | |||
|
| |||
LIABILITIES: | ||||
Payable for: | ||||
Variation margin | 2,459 | |||
Fund shares redeemed | 131 | |||
Tax Expense | 5,379 | |||
|
| |||
Total liabilities | 7,969 | |||
|
| |||
NET ASSETS | $ | 4,578,122 | ||
|
| |||
NET ASSETS CONSIST OF: | ||||
Paid in capital | $ | 5,268,581 | ||
Undistributed net investment income | 10,982 | |||
Accumulated net realized loss on investments | (1,160,616 | ) | ||
Net unrealized appreciation on investments | 459,175 | |||
|
| |||
Net assets | $ | 4,578,122 | ||
Capital shares outstanding | 201,566 | |||
Net asset value per share | $ | 22.71 | ||
|
| |||
STATEMENT OF OPERATIONS |
| |||
Year Ended December 31, 2011 | ||||
INVESTMENT INCOME: | ||||
Dividends from securities of affiliated issuers | $ | 5,740 | ||
Dividends from securities of unaffiliated issuers | 1,942 | |||
Interest | 455 | |||
|
| |||
Total investment income | 8,137 | |||
|
| |||
EXPENSES: | ||||
Custodian fees | 26 | |||
Tax Expense | 5,379 | |||
|
| |||
Total expenses | 5,405 | |||
|
| |||
LESS: | ||||
Expenses reimbursed by Advisor | (5,379 | ) | ||
|
| |||
Net Expenses | 26 | |||
|
| |||
Net investment income | 8,111 | |||
|
| |||
NET REALIZEDAND UNREALIZED GAIN (LOSS): | ||||
Net realized gain (loss) on: | ||||
Investments in affiliated issuers | 800,754 | |||
Futures contracts | (118,146 | ) | ||
Foreign currency | 12 | |||
Realized gain distributions received from affiliated funds | 4,361 | |||
Realized gain distributions received from unaffiliated funds | 207 | |||
|
| |||
Net realized gain | 687,188 | |||
|
| |||
Net change in unrealized appreciation (depreciation) on: | ||||
Investments in unaffiliated issuers | 1,097 | |||
Investments in affiliated issuers | (1,034,509 | ) | ||
Futures contracts | (2,956 | ) | ||
Foreign currency | (2 | ) | ||
|
| |||
Net change in unrealized appreciation (depreciation) | (1,036,370 | ) | ||
|
| |||
Net realized and unrealized loss | (349,182 | ) | ||
|
| |||
Net decrease in net assets resulting from operations | $ | (3 41,071 | ) | |
|
| |||
| See Notes to Financial Statements. | THE GUGGENHEIM FUNDSANNUALREPORT | 25 |
| ALL-ASSET AGGRESSIVE STRATEGY FUND | ||
| STATEMENTS OF CHANGES IN NET ASSETS | ||
| Year Ended December 31, 2011 | Year Ended December 31, 2010 | |||||||
INCREASE (DECREASE) IN NET ASSETS FROM OPERATIONS: | ||||||||
Net investment income | $ | 8,111 | $ | 23,761 | ||||
Net realized gain on investments | 687,188 | 348,563 | ||||||
Net change in unrealized appreciation (depreciation) on investments | (1,036,370 | ) | 789,279 | |||||
|
|
|
| |||||
Net increase (decrease) in net assets resulting from operations | (3 41,071 | ) | 1,161,603 | |||||
|
|
|
| |||||
DISTRIBUTIONSTOSHAREHOLDERSFROM: | ||||||||
Net investment income | (23,761 | )a | (83,6 73 | )a | ||||
Net realized gains | (2 3,447 | )a | (4,727 | )a | ||||
|
|
|
| |||||
Total distributions to shareholders | (4 7,208 | ) | (88,400 | ) | ||||
|
|
|
| |||||
CAPITAL SHARE TRANSACTIONS: | ||||||||
Proceeds from sale of shares | 4,467,442 | 9,080,933 | ||||||
Distributions reinvested | 47,208 | 88,400 | ||||||
Cost of shares redeemed | (11,836,574 | ) | (5,927,949 | ) | ||||
|
|
|
| |||||
Net increase (decrease) from capital share transactions | (7,321,924 | ) | 3,241,384 | |||||
|
|
|
| |||||
Net increase (decrease) in net assets | (7,710,203 | ) | 4,314,587 | |||||
NETASSETS : | ||||||||
Beginning of year | 12,288,325 | 7,973,7 38 | ||||||
|
|
|
| |||||
End of year | $ | 4,578,122 | $ | 12,288,325 | ||||
|
|
|
| |||||
Undistributed net investment income at end of year | $ | 10,982 | $ | 3,916 | ||||
|
|
|
| |||||
CAPITALSHAREACTIVITY: | ||||||||
Shares sold | 182,503 | 406,964 | ||||||
Shares issued from reinvestment of distributions | 2,065 | 3,824 | ||||||
Shares redeemed | (495,292 | ) | (269,193 | ) | ||||
|
|
|
| |||||
Net increase (decrease) in shares | (310,724 | ) | 141,595 | |||||
|
|
|
| |||||
| a | For financial reporting purposes, certain distributions from net investment income for federal income tax purposes have been reclassified to distributions from realized gains. |
| 26 | THE GUGGENHEIM FUNDSANNUALREPORT | See Notes to Financial Statements. |
| ALL-ASSET AGGRESSIVE STRATEGY FUND | ||
| FINANCIAL HIGHLIGHTS | ||
This table is presented to show selected data for a share outstanding throughout each period and to assist shareholders in evaluating a Fund’s performance for the periods presented.
| Year Ended December 31, 2011 | Year Ended December 31, 2010 | Year Ended December 31, 2009 | Year Ended December 31, 2008 | Year Ended December 31, 2007 | ||||||||||||||||
Per Share Data | ||||||||||||||||||||
Net asset value, beginning of period | $ | 23.99 | $ | 21.51 | $ | 18.17 | $ | 25.21 | $ | 24.48 | ||||||||||
Income (loss) from investment operations: | ||||||||||||||||||||
Net investment incomea | .03 | .06 | .11 | .25 | .29 | |||||||||||||||
Net gain (loss) on investments | (1.06 | ) | 2.59 | 3.23 | (6.57 | ) | 1.32 | |||||||||||||
|
|
|
|
|
|
|
|
|
| |||||||||||
Total from investment operations | (1.03 | ) | 2.65 | 3.34 | (6.32 | ) | 1.61 | |||||||||||||
|
|
|
|
|
|
|
|
|
| |||||||||||
Less distributions from: | ||||||||||||||||||||
Net investment income | (0.13 | )c | (.16 | )c | (— | )b | (.24 | ) | (.17 | )c | ||||||||||
Net realized gains | (0.12 | )c | (. 01 | )c | — | (.48 | ) | (.71 | )c | |||||||||||
|
|
|
|
|
|
|
|
|
| |||||||||||
Total distributions | (.25 | ) | (.17 | ) | (— | ) | (.72 | ) | (.88 | ) | ||||||||||
|
|
|
|
|
|
|
|
|
| |||||||||||
Net asset value, end of period | $ | 22.71 | $ | 23.99 | $ | 21.51 | $ | 18.17 | $ | 25.21 | ||||||||||
|
|
|
|
|
|
|
|
|
| |||||||||||
Total Returnd | (4.29 | %) | 12.34 | % | 18.38 | % | (25.04 | %) | 6.64 | % | ||||||||||
|
|
|
|
|
|
|
|
|
| |||||||||||
Ratios/Supple mental Data | ||||||||||||||||||||
Net assets, end of period (in thousands) | $ | 4,578 | $ | 12,288 | $ | 7,974 | $ | 6,636 | $ | 6,874 | ||||||||||
|
|
|
|
|
|
|
|
|
| |||||||||||
Ratios to average net assets: | ||||||||||||||||||||
Net investment income | 0.12 | % | 0.27 | % | 0.56 | % | 1.11 | % | 1.12 | % | ||||||||||
Total expensese | 0.80 | % | — | f | — | f | — | f | 0.01 | % | ||||||||||
Net Expenses | — | g | — | f | — | f | — | f | 0.01 | % | ||||||||||
|
|
|
|
|
|
|
|
|
| |||||||||||
Portfolio turnover rate | 109 | % | 168 | % | 307 | % | 308 | % | 300 | % | ||||||||||
| a | Net investment income per share was computed using average shares outstanding throughout the period. |
| b | Distributions from net investment income are less than $0.01 per share. |
| c | For financial reporting purposes, certain distributions from net investment income for federal income tax purposes have been reclassified to distributions from realized gains. |
| d | Total return does not reflect the impact of any additional fees charged by insurance companies and has not been annualized. |
| e | Does not include expenses of the underlying funds in which the Fund invests. |
| f | Less than .01%. |
| g | Net expense information reflects the expense ratios after waivers. |
| See Notes to Financial Statements. | THE GUGGENHEIM FUNDSANNUALREPORT | 27 |
| 1. | Organization and Significant Accounting Policies |
Organization
The Rydex Variable Trust (the “Trust”), a Delaware business trust, is registered with the SEC under the Investment Company Act of 1940 (the “1940 Act”) as a non-diversified, open-ended investment company and is authorized to issue an unlimited number of no par value shares. The Trust offers shares of the funds to insurance companies for their variable annuity and variable life insurance contracts.
At December 31, 2011, the Trust consisted of fifty-seven separate funds. This report covers the Asset Allocation Funds (the “Funds”), while the other funds are contained in separate reports.
Guggenheim Investments (“GI”) provides advisory services, and Rydex Fund Services, LLC (“RFS”) provides transfer agent, administrative, and accounting services to the Trust. Rydex Distributors, LLC (“RDL”) acts as principal underwriter for the Trust. GI, RFS and RDL are affiliated entities.
Each Fund is a “fund of funds,” which means that each Fund seeks to achieve its investment objective by investing primarily in a combination of mutual funds (the “underlying funds”), within the same group of affiliated investment companies, and exchange-traded funds (“ETFs”), instead of in individual securities. The underlying funds are advised by GI.
Significant Accounting Policies
The following significant accounting policies are in conformity with U.S. generally accepted accounting principles and are consistently followed by the Trust. This requires management to make estimates and assumptions that affect the reported amount of assets and liabilities and disclosure of contingent assets and liabilities at the date of the financial statements and the reported amounts of revenues and expenses during the reporting period. Actual results could differ from these estimates. All time references are based on Eastern Time.
A. The open-end investment companies (“Mutual Funds”) are valued at their NAV as of the close of business, usually 4:00 p.m. on the valuation date. ETFs are valued at the last quoted sales price. Short-term securities with a maturity of 60 days or less are valued at amortized cost, which approximates market value.
B. The value of futures contracts purchased and sold by the Trust is accounted for using the unrealized gain or loss on the contracts that is determined by marking the contracts to their current realized settlement prices.
Financial futures contracts are valued at the 4:00 p.m. price on the valuation date. In the event that the exchange for a specific futures contract closes earlier than 4:00 p.m., the futures contract is valued at the Official Settlement Price of the exchange. However, the underlying securities from which the futures contract value is derived are monitored until 4:00 p.m. to determine if fair valuation would provide a more accurate valuation.
C. Security transactions are recorded on the trade date for financial reporting purposes. Realized gains and losses from securities transactions are recorded using the identified cost basis. Proceeds from lawsuits related to investment holdings are recorded as realized gains. Dividend income is recorded on the ex-dividend date, net of applicable taxes withheld by foreign countries. Taxable non-cash dividends are recorded as dividend income. Interest income, including amortization of premiums and accretion of discount, is accrued on a daily basis.
D. Upon entering into a futures contract, a Fund deposits and maintains as collateral such initial margin as required by the exchange on which the transaction is affected. Pursuant to the contract, the Fund agrees to receive from or pay to the broker an amount of cash equal to the daily fluctuation in value of the contract. Such receipts or payments are known as variation margin and are recorded by the Fund as unrealized gains or losses. When the contract is closed, the Fund records a realized gain or loss equal to the difference between the value of the contract at the time it was opened and the value at the time it was closed.
E. Distributions of net investment income and net realized gains, if any, are declared and paid at least annually. Distributions are recorded on the ex-dividend date and are determined in accordance with income tax regulations which may differ from U.S. generally accepted accounting principles.
F. Throughout the normal course of business, the Funds enter into contracts that contain a variety of representations and warranties which provide general indemnifications. The Funds’ maximum exposure under these arrangements is unknown, as this would involve future claims that may be made against the Funds and/or their affiliates that have not yet occurred. However, based on experience, the Funds expect the risk of loss to be remote.
28 | THE GUGGENHEIM FUNDSANNUALREPORT
NOTES TO FINANCIAL STATEMENTS (continued)
| 2. | Financial Instruments |
As part of their investment strategies, the underlying funds may utilize short sales and a variety of derivative instruments including options, futures, options on futures, structured notes, and swap agreements. These investments involve, to varying degrees, elements of market risk and risks in excess of the amounts reflected in the underlying funds’ NAVs.
As part of their investment strategies, the Funds also utilized futures contracts. These investments involve, to varying degrees, elements of market risk and risks in excess of the amounts recognized in the Statements of Assets and Liabilities.
A futures contract is an agreement to purchase (long) or sell (short) an agreed amount of securities or other instruments at a set price for delivery at a future date. There are significant risks associated with a fund’s use of futures contracts and related options, including (i) there may be an imperfect or no correlation between the changes in market value of the underlying asset and the prices of futures contracts; (ii) there may not be a liquid secondary market for a futures contract; (iii) trading restrictions or limitations may be imposed by an exchange; and (iv) government regulations may restrict trading in futures contracts. When investing in futures, there is minimal counterparty credit risk to the Fund because futures are exchange-traded and the exchange’s clearinghouse, as counterparty to all exchange-traded futures, guarantees against default.
In conjunction with the use of futures, the Funds are required to maintain collateral in various forms. The Funds use, where appropriate, depending on the financial instrument utilized and the broker involved, margin deposits at the broker, cash and/or securities segregated at the custodian bank, discount notes, or the repurchase agreements allocated to each Fund.
| 3. | Fees and Other Transactions with Affiliates |
GI manages the investment and reinvestment of the assets of each of the Funds in accordance with the investment objectives, policies, and limitations of each Fund, however, the Funds do not pay GI a management fee. As part of its agreement with the Trust, GI will pay all expenses of the Funds, including the cost of transfer agency, fund administration, audit and other services, excluding interest expense, taxes (expected to be de minimis), brokerage commissions and other expenses connected with the execution of portfolio transactions, short dividend expenses, and extraordinary expenses.
At December 31, 2011, GI voluntarily waived tax expenses incurred by the Funds.
Each Fund indirectly bears a proportionate share of the total operating expenses (including investment management, shareholder servicing, custody, transfer agency, audit and other expenses) of the underlying funds and ETF’s in which the Fund invests.
Certain officers and trustees of the Trust are also officers of GI, RFS and RDL.
| 4. | Fair Value Measurement |
In accordance with U.S. generally accepted accounting principles, fair value is defined as the price that the Fund would receive to sell an investment or pay to transfer a liability in an orderly transaction with an independent buyer in the principal market, or in the absence of a principal market the most advantageous market for the investment or liability. A three-tier hierarchy is utilized to distinguish between (1) inputs that reflect the assumptions market participants would use in pricing an asset or liability developed based on market data obtained from sources independent of the reporting entity (observable inputs) and (2) inputs that reflect the reporting entity’s own assumptions about the assumptions market participants would use in pricing an asset or liability developed based on the best information available in the circumstances (unobservable inputs) and to establish classification of fair value measurements for disclosure purposes. Various inputs are used in determining the value of the Funds’ investments. The inputs are summarized in the three broad levels listed below:
| Level 1 | — quoted prices in active markets for identical securities. |
| Level 2 | — other significant observable inputs (including quoted prices for similar securities, interest rates, prepayment speeds, credit |
risk, etc.).
| Level 3 | — significant unobservable inputs (including the fund’s own assumptions used to determine the fair value of investments). |
The inputs or methodologies used for valuing securities are not necessarily an indication of the risk associated with investing in those securities.
THE GUGGENHEIM FUNDSANNUALREPORT | 29
NOTES TO FINANCIAL STATEMENTS (continued)
The following table summarizes the inputs used to value the Funds’ net assets at December 31, 2011:
| Level 1 Investments In Securities | Level 1 Other Financial Instruments* | Level 2 Investments In Securities | Level 3 Investments In Securities | Total | ||||||||||||||||
Assets | ||||||||||||||||||||
All-Asset Conservative Strategy Fund | $ | 8,819,293 | $ | 23,607 | $ | 2,494,723 | $ | — | $ | 11,337,623 | ||||||||||
All-Asset Moderate Strategy Fund | 15,382,426 | 51,375 | 3,337,059 | — | 18,770,860 | |||||||||||||||
All-Asset Aggressive Strategy Fund | 3,534,411 | 14,920 | 957,522 | — | 4,506,853 | |||||||||||||||
Liabilities | ||||||||||||||||||||
All-Asset Conservative Strategy Fund | $ | — | $ | 11,295 | $ | — | $ | — | $ | 11,295 | ||||||||||
All-Asset Moderate Strategy Fund | — | 13,858 | — | — | 13,858 | |||||||||||||||
All-Asset Aggressive Strategy Fund | — | 877 | — | — | 877 | |||||||||||||||
| * | Other financial instruments includes futures contracts which are reported as unrealized gain/loss at period end. |
For the year ended December 31, 2011, there were no transfers between levels.
| 5. | Repurchase Agreements |
The Funds transfer uninvested cash balances into a single joint account, the daily aggregate balance of which is invested in one or more repurchase agreements collateralized by obligations of the U.S. Treasury and U.S. Government Agencies. The collateral is in the possession of the Funds’ custodian and is evaluated to ensure that its market value exceeds, at a minimum, 102% of the original face amount of the repurchase agreements. Each Fund holds a pro rata share of the collateral based on the dollar amount of the repurchase agreement entered into by each Fund.
At December 31, 2011, the collateral for the repurchase agreements in the joint account was as follows:
Counterparty and Terms of Agreement | Face Value | Repurchase Price | Collateral | Par Value | Fair Value | |||||||||||||
Credit Suisse Group | $ | 17,568,327 | $ | 17,568,327 | U.S. Treasury Note 1.75% 05/31/16 | $ | 17,100,400 | $ | 17,919,794 | |||||||||
In the event of counterparty default, the Funds have the right to collect the collateral to offset losses incurred. There is potential loss to the Funds in the event the Funds are delayed or prevented from exercising their rights to dispose of the collateral securities, including the risk of a possible decline in the value of the underlying securities during the period while the Funds seek to assert their rights. The Funds’ investment advisor, acting under the supervision of the Board of Trustees, reviews the value of the collateral and the creditworthiness of those banks and dealers with which the Funds enter into repurchase agreements to evaluate potential risks.
| 6. | Derivative Investment Holdings Categorized by Risk Exposure |
U.S. generally accepted accounting principles requires disclosures to enable investors to better understand how and why the Funds use derivative instruments, how these derivatives instruments are accounted for and their effects on the Funds’ financial position and results of operations. None of the derivatives currently held by the Funds are being used as hedging instruments.
During the year ended December 31, 2011, the Funds sought to gain exposure to their respective investment strategies by investing in currency and financial-linked derivative instruments. The following table represents the notional amount of derivative instruments outstanding, as an approximate percentage of the Funds’ net assets on a daily basis, while the risk to the Fund is limited to the profit earned on such derivatives.
Fund | Approximate percentage of Fund’s net assets on a daily basis | |||
All-Asset Conservative Strategy Fund | 30 | % | ||
All-Asset Moderate Strategy Fund | 30 | % | ||
All-Asset Aggressive Strategy Fund | 25 | % | ||
30 | THE GUGGENHEIM FUNDSANNUALREPORT
NOTES TO FINANCIAL STATEMENTS (continued)
The following is a summary of the location of derivative investments on the Funds’ Statements of Assets and Liabilities as of December 31, 2011:
| Location on the Statements of Assets and Liabilities | ||||
Derivative Investments Type | Asset Derivatives | Liability Derivatives | ||
Equity/Interest rate/Currency contracts | Variation margin | Variation margin | ||
The following table sets forth the fair value of the Funds’ derivative investments categorized by primary risk exposure at December 31, 2011:
| Asset Derivative Investments Value | ||||||||||||||||
Fund | Futures Equity Contracts* | Futures Interest Rate Contracts* | Futures Currency Contracts* | Total Value at December 31, 2011 | ||||||||||||
All-Asset Conservative Strategy Fund | $ | 16,024 | $ | 5,923 | $ | 1,660 | $ | 23,607 | ||||||||
All-Asset Moderate Strategy Fund | 45,865 | 2,962 | 2,548 | 51,375 | ||||||||||||
All-Asset Aggressive Strategy Fund | 14,920 | — | — | 14,920 | ||||||||||||
| Liability Derivative Investments Value | ||||||||||||||||
Fund | Futures Equity Contracts* | Futures Interest Rate Contracts* | Futures Currency Contracts* | Total Value at December 31, 2011 | ||||||||||||
All-Asset Conservative Strategy Fund | $ | 11,295 | $ | — | $ | — | $ | 11,295 | ||||||||
All-Asset Moderate Strategy Fund | 13,858 | — | — | 13,858 | ||||||||||||
All-Asset Aggressive Strategy Fund | 877 | — | — | 877 | ||||||||||||
| * | Includes cumulative appreciation (depreciation) of futures contracts as reported on the Schedule of Investments. Only current day’s variation margin is reported within the Statement of Assets and Liabilities. |
The following is a summary of the location of derivative investments on the Funds’ Statements of Operations for the year ended December 31, 2011:
Derivative Investment Type | Location of Gain (Loss) on Derivatives | |
Equity/Interest rate/Currency contracts | Net realized gain (loss) on futures contracts | |
Net change in unrealized appreciation (depreciation) on futures contracts |
The following is a summary of the Funds’ realized gain (loss) and change in unrealized appreciation (depreciation) on derivative investments recognized on the Statements of Operations categorized by primary risk exposure for the year ended December 31, 2011:
| Realized Gain (Loss) on Derivative Investments Recognized in the Statement of Operations | ||||||||||||||||
Fund | Futures Equity Contracts | Futures Interest Rate Contracts | Futures Currency Contracts* | Total | ||||||||||||
All-Asset Conservative Strategy Fund | $ | (44,776 | ) | $ | 24,245 | $ | 13,328 | $ | (7,203 | ) | ||||||
All-Asset Moderate Strategy Fund | (275,887 | ) | 25,018 | 18,730 | (232,139 | ) | ||||||||||
All-Asset Aggressive Strategy Fund | (114,844 | ) | (3,302 | ) | — | (118,146 | ) | |||||||||
| Change in Unrealized Appreciation (Depreciation) on Derivative Investments Recognized in the Statement of Operations | ||||||||||||||||
Fund | Futures Equity Contracts | Futures Interest Rate Contracts | Futures Currency Contracts* | Total | ||||||||||||
All-Asset Conservative Strategy Fund | $ | (10,808 | ) | $ | 36,330 | $ | 1,660 | $ | 27,182 | |||||||
All-Asset Moderate Strategy Fund | (93 | ) | 35,919 | 2,548 | 38,374 | |||||||||||
All-Asset Aggressive Strategy Fund | (10,330 | ) | 7,374 | — | (2,956 | ) | ||||||||||
| 7. | Federal Income Tax Information |
The Funds intend to comply with the provisions of Subchapter M of the Internal Revenue Code applicable to regulated investment companies and will distribute substantially all taxable net investment income and capital gains sufficient to relieve it from all, or substantially all, federal income, excise and state income taxes. Therefore, no provision for federal or state income tax is required.
THE GUGGENHEIM FUNDSANNUALREPORT | 31
NOTES TO FINANCIAL STATEMENTS (continued)
Tax positions taken or expected to be taken in the course of preparing the Funds’ tax returns are evaluated to determine whether the tax positions are “more-likely-than-not” of being sustained by the applicable tax authority. Tax positions not deemed to meet the more-likely-than-not threshold would be recorded as a tax benefit or expense in the current year. Management has analyzed the Funds’ tax positions taken on Federal income tax returns for all open tax years (fiscal years 2008-2011), and has concluded that no provision for income tax is required in the Funds’ financial statements.
The RIC Modernization Act of 2010 was signed into law on December 22, 2010 and seeks to simplify some of the tax provisions applicable to regulated investment companies and the tax reporting to their shareholders, and to improve the tax efficiency of certain fund structures. The changes are generally effective for taxable years beginning after the date of enactment.
One of the more prominent changes addresses capital loss carryforwards. Funds will be permitted to carryforward capital losses incurred in taxable years beginning after December 22, 2010 for an unlimited period. However, any losses incurred during those future taxable years will be required to be utilized prior to the losses incurred in pre-enactment taxable years. Under pre-enactment law, capital losses could be carried forward for eight years, and carried forward as short-term capital, irrespective of the character of the original loss. As a result of this ordering rule, pre-enactment capital loss carryforwards may potentially expire unused. Additionally, post-enactment capital losses that are carried forward will retain their character as either short-term or long-term capital losses rather than being considered all short-term as under previous law.
Tax basis capital losses in excess of capital gains are carried forward to offset future net capital gains. For the year ended December 31, 2011, the following capital loss carryforward amounts were used:
Fund | Amount | |||
All-Asset Conservative Strategy Fund | $ | 50,952 | ||
All-Asset Moderate Strategy Fund | 43,043 | |||
All-Asset Aggressive Strategy Fund | 230,937 | |||
The tax character of distributions paid during 2011 was as follows:
Fund | Ordinary Income | Long-Term Capital Gain | Total Distributions | |||||||||
All-Asset Conservative Strategy Fund | $ | 45,267 | $ | — | $ | 45,267 | ||||||
All-Asset Moderate Strategy Fund | 81,468 | — | 81,468 | |||||||||
All-Asset Aggressive Strategy Fund | 47,208 | — | 47,208 | |||||||||
The tax character of distributions paid during 2010 was as follows:
Fund | Ordinary Income | Long-Term Capital Gain | Total Distributions | |||||||||
All-Asset Conservative Strategy Fund | $ | 290,984 | $ | — | $ | 290,984 | ||||||
All-Asset Moderate Strategy Fund | 398,854 | — | 398,854 | |||||||||
All-Asset Aggressive Strategy Fund | 88,400 | — | 88,400 | |||||||||
Note: For federal income tax purposes, short term capital gain distributions are treated as ordinary income distributions.
The tax character of distributable earnings/(accumulated losses) at December 31, 2011, was as follows:
Fund | Undistributed Ordinary Income | Undistributed Long-Term Capital Gain | Net Unrealized Appreciation | Capital Loss Carryforward1 | ||||||||||||
All-Asset Conservative Strategy Fund | $ | 26,588 | $ | — | $ | 373,996 | $ | (1,816,798 | ) | |||||||
All-Asset Moderate Strategy Fund | 46,784 | — | 910,717 | (3,746,357 | ) | |||||||||||
All-Asset Aggressive Strategy Fund | 10,982 | — | 214,910 | (916,351 | ) | |||||||||||
Capital Loss Carryforward amounts may be limited due to Federal income tax regulations.
| 1 | A summary of the expiration of the aforementioned Capital Loss Carryforward is as follows: |
| Expires in 2016 | Expires in 2017 | Expires in 2018 | Unlimited | Total Capital Loss Carryforward | ||||||||||||||||||||
Fund | Short Term | LongTerm | ||||||||||||||||||||||
All-Asset Conservative Strategy Fund | $ | (561,767 | ) | $ | (1,211,730 | ) | $ | (43,301 | ) | $ | — | $ | — | $ | (1,816,798 | ) | ||||||||
All-Asset Moderate Strategy Fund | (1,773,841 | ) | (1,613,664 | ) | (358,852 | ) | — | — | (3,746,357 | ) | ||||||||||||||
All-Asset Aggressive Strategy Fund | (270,770 | ) | (645,581 | ) | — | — | — | (916,351 | ) | |||||||||||||||
32 | THE GUGGENHEIM FUNDSANNUALREPORT
NOTES TO FINANCIAL STATEMENTS (concluded)
Net investment income and net realized gains (losses) may differ for financial statement and tax purposes because of temporary or permanent book/tax differences. These differences are primarily due to post -October losses, losses deferred due to wash sales, foreign currency gains and losses, and the “mark-to-market” of certain passive foreign investment companies ( PFICs) for tax purposes. Additional differences may result from the tax treatment of consent dividends, net investment losses and expired capital loss carryforwards. To the extent these differences are permanent, reclassifications are made to the appropriate equity accounts in the period that the differences arise. These reclassifications have no effect on net assets or NAV per share.
On the Statements of Assets and Liabilities, the following reclassifications were made for perm anent book/tax differences:
Fund | Paid In Capital | Undistributed Net Investment Income | Accumulated Net Realized Loss | |||||||||
All-Asset Conservative Strategy Fund | $ | 202,696 | $ | 99,297 | $ | (301,993 | ) | |||||
All-Asset Moderate Strategy Fund | 374,274 | 137,877 | (512,151 | ) | ||||||||
All-Asset Aggressive Strategy Fund | 221,162 | 22,716 | (243,878 | ) | ||||||||
At December 31, 2011, the cost of securities for Federal income tax purposes, the aggregate gross unrealized gain for all securities for which there was an excess of value over tax cost and the aggregate gross unrealized loss for all securities for which there was an excess of tax cost over value, were as follows:
Fund | Tax Cost | Tax Unrealized Gain | Tax Unrealized Loss | Net Unrealized Gain | ||||||||||||
All-Asset Conservative Strategy Fund | $ | 10,934,857 | $ | 492,010 | $ | (112,851 | ) | $ | 379,159 | |||||||
All-Asset Moderate Strategy Fund | 17,802,813 | 1,006,177 | (89,505 | ) | 916,672 | |||||||||||
All-Asset Aggressive Strategy Fund | 4,277,022 | 241,485 | (26,574 | ) | 214,911 | |||||||||||
| 8. | Securities Transactions |
For the year ended December 31, 2011, the cost of purchases and proceeds from sales of investment securities, excluding government securities and short- term investments, were:
| Purchases | Sales | |||||||
All-Asset Conservative Strategy Fund | $ | 13,685,649 | $ | 13,440,429 | ||||
All-Asset Moderate Strategy Fund | 18,029,173 | 19,703,969 | ||||||
All-Asset Aggressive Strategy Fund | 6,423,606 | 13,173,371 | ||||||
| 9. | Line of Credit |
The Trust, along with other affiliated trusts, has secured an uncommitted, $75,000,000 line of credit with U.S. Bank, N.A. for emergency or temporary purposes. Borrowings, if any, under this arrangement bear interest equal to the Prime Rate, minus 2%, which shall be paid monthly, averaging 1.25% for the year ended December 31, 2011. At December 31, 2011, the Funds did not have any borrowings under this agreement, which expires on June 15, 2012, and did not participate in borrowing during the year.
THE GUGGENHEIM FUNDSANNUALREPORT | 33
REPORT OF INDEPENDENT REGISTERED PUBLIC ACCOUNTING FIRM
To the Board of Trustees and Shareholders
of the Rydex Variable Trust:
We have audited the accompanying statements of assets and liabilities, including the schedules of investments, of All-Asset Conservative Strategy Fund, All-Asset Moderate Strategy Fund, and All-Asset Aggressive Strategy Fund (three of the series constituting the Rydex Variable Trust) (the “Funds”) as of December 31, 2011, and the related statements of operations for the year then ended, the statements of changes in net assets for each of the two years in the period then ended, and the financial highlights for each of the four years in the period then ended. These financial statements and financial highlights are the responsibility of the Funds’ management. Our responsibility is to express an opinion on these financial statements and financial highlights based on our audits. The financial highlights for the year ended December 31, 2007 were audited by other auditors, whose report dated February 25, 2008 expressed an unqualified opinion on those financial highlights.
We conducted our audits in accordance with the standards of the Public Company Accounting Oversight Board (United States). Those standards require that we plan and perform the audit to obtain reasonable assurance about whether the financial statements and financial highlights are free of material misstatement. We were not engaged to perform an audit of the Funds’ internal control over financial reporting. Our audits included consideration of internal control over financial reporting as a basis for designing audit procedures that are appropriate in the circumstances, but not for the purpose of expressing an opinion on the effectiveness of the Funds’ internal control over financial reporting. Accordingly, we express no such opinion. An audit also includes examining, on a test basis, evidence supporting the amounts and disclosures in the financial statements and financial highlights, assessing the accounting principles used and significant estimates made by management, as well as evaluating the overall financial statement presentation. Our procedures included confirmation of securities owned as of December 31, 2011, by correspondence with the custodian, the transfer agent of underlying funds and brokers or by other appropriate auditing procedures where replies from brokers were not received. We believe that our audits provide a reasonable basis for our opinion.
In our opinion, the financial statements and financial highlights referred to above present fairly, in all material respects, the financial position of the above listed Funds at December 31, 2011, the results of their operations for the year then ended, the changes in their net assets for each of the two years in the period then ended, and their financial highlights for each of the four years in the period then ended, in conformity with U.S. generally accepted accounting principles.

McLean, Virginia
February 28, 2012
34 | THE GUGGENHEIM FUNDSANNUALREPORT
Proxy Voting Information
A description of the policies and procedures that the Trust uses to determine how to vote proxies relating to securities held in the Funds’ portfolios is available, without charge and upon request, by calling 1.800.820.0888. This information is also available from the EDGAR database on the SEC’s website at http://www.sec.gov.
Information regarding how the Funds voted proxies relating to portfolio securities during the most recent 12-month period ended June 30 is available without charge, upon request, by calling 1.800.820.0888. This information is also available from the EDGAR database on the SEC’s website at http://www.sec.gov.
At a special meeting of shareholders held on November 22, 2011, the shareholders of the Funds voted on whether to approve a new investment advisory agreement between Rydex Variable Trust and Security Investors, LLC. A description of the number of shares voted is as follows:
Fund | Shares For | Shares Against | Shares Abstained | |||||||||
All-Asset Conservative Strategy Fund | 438,045 | 11,294 | 12,992 | |||||||||
All-Asset Moderate Strategy Fund | 758,161 | 4,541 | 3,872 | |||||||||
All-Asset Aggressive Strategy Fund | 272,419 | — | 13,045 | |||||||||
At a special meeting of shareholders held on November 22, 2011, the shareholders of the Trust also voted on whether to approve the election of nominees to the Board of Trustees. A description of the number of shares voted is as follows:
Donald C. Cacciapaglia | Corey A. Colehour | J. Kenneth Dalton | ||||||||||||
For | 343,022,995 | For | 339,263,789 | For | 342,726,825 | |||||||||
Withhold | 18,549,008 | Withhold | 22,308,214 | Withhold | 18,845,178 | |||||||||
Total | 361,572,003 | Total | 361,572,003 | Total | 361,572,003 | |||||||||
John O. Demaret | Richard M. Goldman | Werner E. Keller | ||||||||||||
For | 338,940,641 | For | 342,766,477 | For | 342,532,565 | |||||||||
Withhold | 22,631,362 | Withhold | 18,805,526 | Withhold | 19,039,438 | |||||||||
Total | 361,572,003 | Total | 361,572,003 | Total | 361,572,003 | |||||||||
Thomas F. Lydon | Patrick T. McCarville | Roger Somers | ||||||||||||
For | 343,159,833 | For | 339,367,739 | For | 343,007,265 | |||||||||
Withhold | 18,412,170 | Withhold | 22,204,264 | Withhold | 18,564,738 | |||||||||
Total | 361,572,003 | Total | 361,572,003 | Total | 361,572,003 | |||||||||
At a special meeting of shareholders held on November 22, 2011, the shareholders of the Funds also voted on whether to approve a “manager of managers” arrangement for each of the Funds. A description of the number of shares voted is as follows:
Fund | Shares For | Shares Against | Shares Abstained | |||||||||
All-Asset Conservative Strategy Fund | 431,525 | 11,294 | 19,512 | |||||||||
All-Asset Moderate Strategy Fund | 758,161 | 4,541 | 3,872 | |||||||||
All-Asset Aggressive Strategy Fund | 192,919 | 79,499 | 13,045 | |||||||||
Quarterly Portfolio Schedules Information
The Trust files its complete schedule of portfolio holdings with the SEC for the first and third quarters of each fiscal year on Form N-Q; which are available on the SEC’s website at http://www.sec.gov. The Funds’ Forms N-Q may be reviewed and copied at the SEC’s Public Reference Room in Washington, DC, and that information on the operation of the Public Reference Room may be obtained by calling 1-800-SEC-0330. Copies of the portfolio holdings are also available to shareholders, without charge and upon request, by calling 1.800.820.0888.
Office Locations
The offices of Guggenheim Investments can be found in the following locations:
40 East 52nd Street
16th Floor
New York, NY 10022
(Headquarters)
THE GUGGENHEIM FUNDSANNUALREPORT | 35
OTHER INFORMATION (Unaudited) (continued)
Four Irvington Centre
805 King Farm Boulevard
Suite 600
Rockville, MD 20850
9401 Indian Creek Parkway
40 Corporate Woods
Suite 850
Overland Park, KS 66210
Guggenheim Transaction
On September 20, 2011, Guggenheim Capital, LLC agreed to purchase the indirect holding company of Security Investors, LLC, the Funds’ investment manager (the “Investment Manager”) (the “Transaction”). Guggenheim Capital, LLC’s subsidiary, Guggenheim Partners, LLC (“Guggenheim”), is a global, independent, privately-held, diversified financial services firm with more than 1,500 dedicated professionals.
The Transaction should not result in material changes to the day-to-day management and operations of the Funds or any increase in fees. The parties expect the Transaction to be completed in early 2012. However, it is subject to various conditions, and could be delayed or even terminated due to unforeseen circumstances.
In anticipation of the Transaction, the Board of Trustees of the Funds (the “Board”) called a special meeting of shareholders (the “Meeting”), at which shareholders of record of each of the Funds as of October 3, 2011 were asked to consider the approval of a new investment management agreement between the Fund and the Investment Manager (the “New Agreement”). This approval was necessary because, under the Investment Company Act of 1940 (the “1940 Act”), the Transaction could have resulted in the termination of the Funds’ current investment management agreement with the Investment Manager (the “Current Agreement”). The Funds’ shareholders approved the New Agreement, the terms of which are substantially identical to the corresponding Current Agreement, except with respect to the date of execution, and the New Agreements will take effect if the Transaction is completed.
Election of Board Members
The Board also approved a proposal to elect nine individuals to the Board. The Board proposed the election of the following nominees: Donald C. Cacciapaglia, Corey A. Colehour, J. Kenneth Dalton, John O. Demaret, Richard M. Goldman, Werner E. Keller, Thomas F. Lydon, Patrick T. McCarville and Roger Somers. Each of the nominees, other than Mr. Cacciapaglia, currently serves as a Trustee. In connection with the Transaction, the Board believes that expanding the Board to include Mr. Cacciapaglia, who is a member of senior management of Guggenheim’s investment management business, and who would serve on other board in the Guggenheim Investments family of funds, would be appropriate. The Trusts’ shareholders ultimately approved the aforementioned proposal.
Board Considerations in Approving the Investment Advisory Agreement
At an in-person meeting of the Trust’s Board of Trustees held August 16-17, 2011, called for the purpose of, among other things, voting on the approval of investment advisory agreement applicable to the series of the Trust (collectively, the “Funds”), the Trust’s Board of Trustees, including the independent Trustees, unanimously approved the investment advisory agreement between the Trust and Guggenheim Investments (referred to herein as the “Adviser”).
At the meeting of August 16-17, 2011, the Trust’s Board of Trustees also considered a new investment advisory agreement that was required as a result of a proposed change in the corporate ownership structure of the Adviser (the “Transaction”). The Investment Company Act of 1940 (the “1940 Act”), the law that regulates mutual funds, including the Funds, requires that a fund’s investment advisory agreement terminate whenever there is deemed to be a “change in control” of the investment adviser. The change in the corporate ownership structure of the Adviser could potentially be deemed to constitute a “change in control” (as this term is used for regulatory purposes) of the Adviser. Before an investment advisory agreement terminates, a new investment advisory agreement must be in effect in order for the investment adviser to continue to manage the fund’s investments. For that reason, the Board of Trustees was asked to approve a new investment advisory agreement for the Funds.
36 | THE GUGGENHEIM FUNDSANNUALREPORT
OTHER INFORMATION (Unaudited) (continued)
At the meeting of August 16-17, 2011, the Board considered the new investment advisory agreement, pursuant to which, subject to approval by each Fund’s shareholders of the new agreement, the Adviser would continue to serve each Fund as investment adviser after the completion of the Transaction. At a special meeting of the Board held on September 14, 2011, the Board considered further information about the Transaction and voted in favor of the new investment advisory agreement.
In reaching the conclusion to approve the new investment advisory agreement, the Trustees requested and obtained from the Adviser such information as the Trustees deemed reasonably necessary to evaluate the proposed agreements. The Trustees carefully evaluated this information and were advised by legal counsel with respect to their deliberations.
Prior to the Board meetings in August and September 2011, representatives of Guggenheim Capital informed the Board of the Transaction. With respect to the Transaction, the Board reviewed materials received from Guggenheim Capital, including information relating to the terms of the Transaction. The Board also reviewed information regarding Guggenheim Capital, including, but not limited to: (a) certain representations concerning Guggenheim Capital’s financial condition, (b) information regarding the new proposed ownership structure and its possible effect on shareholders, (c) information regarding the consideration to be paid by Guggenheim Capital, and (d) potential conflicts of interest.
In considering the new investment advisory agreement, the Board determined that the agreement would enable shareholders of the Funds to continue to obtain high quality services at a cost that is appropriate, reasonable, and in the best interests of their shareholders. The Board, including the independent Trustees, unanimously approved the new agreement. In reaching their decision, the Trustees carefully considered in formation that they had received throughout the year as part of their regular oversight of the Funds, including, in particular, information from the Adviser that the Board had received relating to the current investment advisory agreement at the Board meeting of August 16-17, 2011. The Trustees noted that, at the meeting, they had obtained and reviewed a wide variety of information, including certain comparative information regarding performance of the Funds relative to performance of other comparable mutual funds. They also considered the evolution of the Rydex family of funds and the Adviser since the change in control of the Investment Adviser in 2010 and Guggenheim Capital’s commitment to the success of the Adviser and the Funds.
In addition, as a part of their required consideration of the renewal of the current investment advisory agreement at the meeting of August 16-17, 2011, the Trustees, including the independent Trustees, had evaluated a number of considerations, including among others: (a) the quality of the Adviser’s investment advisory and other services; (b) the Adviser’s investment management personnel; (c) the Adviser’s operations and financial condition; (d) the Adviser’s brokerage practices (including any soft dollar arrangements) and investment strategies; (e) the level of the fees that the Adviser charges compared with the fees charged to comparable mutual funds or accounts; (f) each Fund’s overall fees and operating expenses compared with similar mutual funds; (g) the level of the Adviser’s profitability from its Fund-related operations; (h) the Adviser’s compliance systems; (i) the Adviser’s policies on and compliance procedures for personal securities transactions; (j) the Adviser’s reputation, expertise and resources in the financial markets; and (k) Fund performance compared with similar mutual funds. Based on the Board’s deliberations at the meetings of August 16-17, 2011 and September 14, 2011, and its evaluation of the information regarding the Transaction and the fact that the Transaction is not expected to change the level and quality of services rendered by the Adviser to any of the Funds, the Board, including all of the independent Trustees, unanimously: (a) concluded that terms of the current and new investment advisory agreements are fair and reasonable; (b) concluded that the Adviser’s fees were reasonable in light of the services provided to the Funds; and (c) agreed to approve the current investment advisory agreement and, subject to shareholder approval, the new investment advisory agreement, based upon the following considerations, among others:
| • | Nature, Extent and Quality of Services Provided by the Adviser. At the meeting of August 16-17, 2011, the Board reviewed the scope of services to be provided by the Adviser under the current investment advisory agreement, and, at the meetings of August 16-17, 2011 and September 14, 2011, noted that there would be no significant differences between the scope of services required to be provided by the Adviser under the current investment advisory agreement and the scope of services required to be provided by the Adviser under the new investment advisory agreement. The Board noted that the key investment and management personnel of the Adviser servicing the Funds are expected to remain the same following the Transaction. The Trustees also considered Guggenheim Capital’s representations to the Board that the Adviser would continue to provide investment and related services that were of materially the same quality and quantity as services provided to the Funds in the past, and that these services are appropriate in scope and extent in light of the Funds’ operations, the competitive landscape of the investment company business and investor needs. |
THE GUGGENHEIM FUNDSANNUALREPORT | 37
OTHER INFORMATION (Unaudited) (concluded)
| • | Fund Expenses and Performance of the Funds. At the meeting of August 16-17, 2011, the Board had reviewed statistical information prepared by the Adviser regarding the expense ratio components and performance of each Fund. Based on the representations made by Guggenheim Capital at the meeting that the Adviser would continue to operate following the closing of the Transaction in much the same manner as it currently operates, the Board concluded that the investment performance of the Adviser was not expected to be affected by the Transaction. |
| • | Costs of Services Provided to the Funds and Profits Realized by the Adviser and its Affiliates. At the meeting of August 16-17, 2011, the Board had reviewed information about the profitability of the Funds to the Adviser based on the advisory fees payable under the current investment advisory agreement. At that meeting, the Board had also analyzed the Funds’ expenses, including the investment advisory fees paid to the Adviser. The Board also had reviewed reports comparing the expense ratios to those of other comparable mutual funds. At the Board meeting, the Board considered the fact that the fee rates payable to the Adviser would be the same under each Fund’s new investment advisory agreement as they are under such Fund’s current agreement. With respect to anticipated profitability, the Board noted that it was too early to predict how the Transaction would affect the Adviser’s profitability with respect to the Funds, but noted that this matter would be given further consideration on an ongoing basis . |
| • | Economies of Scale. In connection with its review of the Funds’ profitability analysis at the meeting of August 16-17, 2011, the Board reviewed information regarding economies of scale or other efficiencies that may result from increases in the Funds’ asset levels. The Trustees noted that the fees would not change under the new investment advisory agreement, and that no additional economies of scale would be directly realized as a result of the Transaction. They also noted that they will have the opportunity to again review the appropriateness of the fee payable to the Adviser under the new agreement when the renewal of the new agreement next comes before the Board. |
| • | Other Benefits to the Adviser and/or their Affiliates. In addition to evaluating the services provided by the Adviser, the Board had considered the nature, extent, quality and cost of the distribution services performed by the Funds’ Distributor under a separate agreement at the meeting of August 16-17, 2011. The Board reviewed information regarding potential economies of scale arising from the integration of the asset management businesses of Guggenheim Capital. The Board also considered the terms of the Transaction and the changes to the corporate ownership structure of the Adviser, noting that the Adviser would no longer be a subsidiary of Security Benefit Corporation. In this regard, the Board noted that, under the corporate structure after the Transaction, the Adviser would be more closely controlled by Guggenheim Capital, which could benefit Guggenheim Capital. The Board also noted that the costs associated with the Transaction would be borne by Guggenheim Capital (or its affiliates) and not the Funds. |
On the basis of the information provided to it and its evaluation of that information, the Board, including the independent Trustees, concluded that the terms of the investment advisory agreement for the Funds was reasonable, and that approval of the current and new investment advisory agreements was in the best interests of the Funds.
38 | THE GUGGENHEIM FUNDSANNUALREPORT
INFORMATION ON BOARD OF TRUSTEES AND OFFICERS (Unaudited)
A Board of Trustees oversees the Trust, as well as other trusts of GI, in which its members have no stated term of service, and continue to serve after election until resignation. The Statement of Additional Information includes further information about Fund Trustees and Officers , and can be obtained without charge by calling 800.820.0888.
All Trustees and Officers may be reached c/o Guggenheim Investments, 805 King Farm Boulevard, Suite 600, Rockville, MD 20850.
INDEPENDENT TRUSTEES
Name, Position and Year of Birth | Length of Service As Trustee (Year Began) | Number of Funds Overseen | ||||
Corey A. Colehour | Rydex Series Funds – 1993 | 150 | ||||
Trustee (1945) | Rydex Variable Trust – 1998 | |||||
| Rydex Dynamic Funds – 1999 | ||||||
| Rydex ETF Trust – 2003 |
Principal Occupations During Past Five Years: Retired; Member of the Audit, Governance and Nominating Committees (1995 to present)
| ||||||
J. Kenneth Dalton | Rydex Series Funds – 1995 | 150 | ||||
Trustee (1941) | Rydex Variable Trust – 1998 | |||||
| Rydex Dynamic Funds – 1999 | ||||||
| Rydex ETF Trust – 2003 | ||||||
Principal Occupations During Past Five Years: Retired; Member of the Governance and Nominating Commit tees (1995 to present); Chairman of the Audit Committee (1997 to present); Member of the Risk Oversight Committee (2010 to present)
| ||||||
John O. Demaret | Rydex Series Funds – 1997 | 150 | ||||
Trustee, Chairman of the | Rydex Variable Trust – 1998 | |||||
Board (1940) | Rydex Dynamic Funds – 1999 | |||||
| Rydex ETF Trust – 2003 | ||||||
Principal Occupations During Past Five Years: Retired; Member of the Audit Committee (1997 to present); Member of the Risk Oversight Committee (2010 to present)
| ||||||
Werner E. Keller | Rydex Series Funds – 2005 | 150 | ||||
Trustee (1940) | Rydex Variable Trust – 2005 | |||||
| Rydex Dynamic Funds – 2005 | ||||||
| Rydex ETF Trust – 2005 | ||||||
Principal Occupations During Past Five Years: Founder and President of Keller Partners, LLC (registered investment adviser) (2005 to present); Member of the Audit, Governance and Nominating Committees (2005 to present); Chairman and Member of the Risk Oversight Committee (2010 to present)
| ||||||
Thomas F. Lydon, Jr. | Rydex Series Funds – 2005 | 150 | ||||
Trustee (1960) | Rydex Variable Trust – 2005 | |||||
| Rydex Dynamic Funds – 2005 | ||||||
| Rydex ETF Trust – 2005 | ||||||
Principal Occupations During Past Five Years: President, Global Trends Investments (1996 to present); Member of the Audit, Governance and Nominating Committees (2005 to present)
| ||||||
Patrick T. McCarville | Rydex Series Funds – 1997 | 150 | ||||
Trustee (1942) | Rydex Variable Trust – 1998 | |||||
| Rydex Dynamic Funds – 1999 | ||||||
| Rydex ETF Trust – 2003 | ||||||
Principal Occupations During Past Five Years: CEO, Par Industries, Inc., d/b/a Par Leasing (1977 to 2010); Chairman of the Governance and Nominating Committees (1997 to present); Member of the Audit Committee (1997 to present)
|
THE GUGGENHEIM FUNDSANNUALREPORT | 39
INFORMATION ON BOARD OF TRUSTEES AND OFFICERS (Unaudited) (continued)
| INDEPENDENT TRUSTEES – continued | ||||||
Name, Position and Year of Birth | Length of Service As Trustee (Year Began) | Number of Funds Overseen | ||||
Roger Somers | Rydex Series Funds – 1993 | 150 | ||||
Trustee (1944) | Rydex Variable Trust – 1998 | |||||
| Rydex Dynamic Funds – 1999 | ||||||
| Rydex ETF Trust – 2003 | ||||||
Principal Occupations During Past Five Years: Founder and CEO of Arrow Limousine (1965 to present); Member of the Audit, Governance and Nominating Committees (1995 to present)
EXECUTIVE OFFICERS
Name, Position and Year of Birth | Principal Occupations During Past Five Years | |
Richard M. Goldman* President (1961) | Current: Senior Vice President, Security Benefit Corporation; CEO, Security Benefit Asset Management Holdings, LLC; CEO, President and Manager Representative, Security Investors, LLC; CEO and Manager, Rydex Holdings, LLC; CEO, President and Manager, Rydex Distributors, LLC; Manager, Rydex Fund Services, LLC; President and Trustee, Rydex Series Funds, Rydex ETF Trust, Rydex Dynamic Funds and Rydex Variable Trust
Previous: Director, First Security Benefit Life Insurance Company (2007-2010); President and Director, Security Global Investors (2010-2011); CEO and Director, Rydex Advisors, LLC and Rydex Advisor II, LLC (2010); Director, Security Distributors, Inc. (2007- 2009); Managing Member, R M Goldman Partners, LLC (2006-2007) | |
Michael P. Byrum* Vice President (1970) | Current: President, Security Benefit Asset Management Holdings, LLC; Senior Vice President, Security Investors, LLC; President and Chief Investment Officer, Rydex Holdings, LLC; Director and Chairman of the Board, Advisor Research Center, Inc.; Manager, Rydex Specialized Products, LLC
Previous: Rydex Distributors, LLC (f/k/a Rydex Distributors, Inc.), Vice President (2009); Rydex Fund Services, LLC, Director (2009- 2010), Secretary (2002-2010), Executive Vice President (2002-2006); Rydex Advisors, LLC (f/k/a PADCO Advisors, Inc.) , Director (2008-2010), Chief Investment Officer (2006-2010), President (2004-2010); Secretary (2002- 2010); Rydex Advisors II, LLC (f /k/a PADCO Advisors II, Inc.), Director (2008-2010), Chief Investment Officer (2006-2 010), President (2004-2010), Secretary (2002-2010); Rydex Capital Partners, LLC, (President and Secretary 2003-2007); Rydex Capital Partners II, LLC, (2003-2007); Rydex Holdings, LLC (f/k/a Rydex Holdings, Inc.), Secretary (2005-2008), Executive Vice President (2005 -2006); Advisor Research Center, Inc., Secretary (2006-2009), Executive Vice President (2006); Rydex Specialized Products, LLC, Secretary (2005-2008) | |
40 | THE GUGGENHEIM FUNDSANNUALREPORT
INFORMATION ON BOARD OF TRUSTEES AND OFFICERS (Unaudited) (continued)
| EXECUTIVE OFFICERS – continued | ||
Name, Position and Year of Birth | Principal Occupations During Past Five Years | |
Nikolaos Bonos* Vice President and Treasurer (1963) | Current: Senior Vice President, Security Investors, LLC; Chief Executive Officer and Manager, Rydex Specialized Products, LLC; Chief Executive Officer and President, Rydex Fund Services, LLC; Vice President, Rydex Holdings, LLC; Treasurer, SBL Fund; Security Equity Fund; Security Income Fund; Security Large Cap Value Fund and Security Mid Cap Growth Fund; Vice President, Security Benefit Asset Management Holdings, LLC
Previous: Security Global Investors, LLC, Senior Vice President (2010-2011); Rydex Advisors, LLC (f/k/a PADCO Advisors, Inc.) Senior Vice President (2006-2011); Rydex Fund Services, LLC (f/k/a Rydex Fund Services, Inc.), Director (2009) and Senior Vice President (2003-2006); Rydex Specialized Products, LLC, Chief Financial Officer (2005-2009) | |
Joanna M. Haigney* Chief Compliance Officer and Secretary (1966) | Current: Chief Compliance Officer and Secretary, SBL Fund; Security Equity Chief Compliance Officer and Fund; Security Income Fund; Security Large Cap Value Fund and Security Mid Cap Growth Fund; Vice President, Rydex Holdings, LLC; Vice President, Security Benefit Asset Management Holdings, LLC; Senior Vice President and Chief Compliance Officer, Security Investors, LLC
Previous: Security Global Investors, LLC, Senior Vice President (2010-2011); Rydex Advisors, LLC (f/k/a PADCO Advisors, Inc.) and Rydex Advisors I , LLC (f/k/a PADCO Advisors I , Inc.), Chief Compliance Officer and Senior Vice President (2010-2011); Rydex Capital Partners I, LLC and Rydex Capital Partners II, LLC, Chief Compliance Officer (2 006-2007); Rydex Fund Services, LLC (f /k/a Rydex Fund Services, Inc.), Vice President (2001-2006) | |
Keith A. Fletcher* Vice President (1958) | Current: Senior Vice President, Security Investors, LLC; Vic e President, Rydex Holdings, LLC; Vice President, Rydex Specialized Products, LLC; Vice President, Rydex Distributors, LLC; Vice President, Rydex Fund Services, LLC; Vice President and Director, Advisor Research Center, Inc.; Vice President, SBL Fund; Security Equity Fund; Security Income Fund; Security Large Cap Value Fund and Security Mid Cap Growth Fund
Previous: Security Global Investors, LLC, Vice President (2010-2011); Rydex Advisors II, LLC (f/k/a PADCO Advisors II, Inc .) and Rydex Advisors II, LLC (f /k/a PADCO Advisors I , Inc .), Vice President (2009-2011); Lyster Watson and Company, Managing Director (2007-2008); Fletcher Financial Group, Inc., Chief Executive Officer (2004-2007) | |
THE GUGGENHEIM FUNDSANNUALREPORT | 41
INFORMATION ON BOARD OF TRUSTEES AND OFFICERS (Unaudited) (concluded)
| EXECUTIVE OFFICERS – continued | ||
Name, Position and Year of Birth | Principal Occupations During Past Five Years | |
Amy J. Lee* Vice President and Assistant Secretary (1960) | Current: Senior Vice President and Secretary, Security Investors, LLC; Secretary and Chief Compliance Officer, Security Distributors, Inc.; Vice President, Associate General Counsel and Assistant Secretary, Security Benefit Life Insurance Company and Security Benefit Corporation; Associate General Counsel, First Security Benefit Life Insurance and Annuity of New York; Vice President and Secretary, SBL Fund; Security Equity Fund; Security In come Fund; Security Large Cap Value Fund and Security Mid Cap Growth Fund; Vice President and Secretary, Rydex Holdings, LLC Secretary, Advisor Research Center, Inc., Rydex Specialized Products, LLC, Rydex Distributors, LLC and Rydex Fund Services, LLC; Assistant Secretary, Security Benefit Clinic and Hospital
Previous: Security Global Investors, LLC, Senior Vice President and Secretary (2007-2011); Rydex Advisors, LLC (f/k/a PADCO Advisors, Inc.) and Rydex Advisors I, LLC (f/k/a PADCO Advisors II , Inc.), Senior Vice President and Secretary (2010-2011); Brecek and Young Advisors, Inc., Director (2004-2008) | |
Joseph M. Arruda* Assistant Treasurer (1966) | Current: Assistant Treasurer, SBL Fund, Security Equity Fund, Security Income Fund, Security Large Cap Value Fund, and Security Mid Cap Growth Fund; Vice President, Security Investors, LLC; Chief Financial Officer and Manager, Rydex Specialized Products, LLC
Previous: Security Global Investors, LLC, Vice President (2010-2011); Rydex Advisors, LLC (f/k/a PADCO Advisors II, Inc.) and Rydex Advisors II, LLC (f/k/a PADCO Advisors II, Inc.), Vice President (2004-2011) | |
| * | Officers of the Funds are deemed to be “interested persons” of the Trust, within the meaning of Section 2(a) (19) of the 1940 Act, inasmuch as this person is affiliated with Security Investors. |
42 | THE GUGGENHEIM FUNDSANNUALREPORT
GUGGENHEIM INVESTMENTS PRIVACY POLICIES
Rydex Funds, Guggenheim Funds, Rydex Investments, Rydex Distributors, Inc., Security Investors, LLC, Security Distributors, Inc. and Rydex Advisory Services (Collectively “Guggenheim Investments”)
Our Commitment to You
When you become a Guggenheim Investments investor, you entrust us with not only your hard-earned money but also with personal and financial information about you. We recognize that your relationship with us is based on trust and that you expect us to act responsibly and in your best interests. Because we have access to this private information about you, we hold ourselves to the highest standards in its safekeeping and use. This means, most importantly, that we do not sell client information to anyone—whether it is your personal information or if you are a current or former Guggenheim Investments client.
The Information We Collect About You
In the course of doing business with shareholders and investors, we collect nonpublic personal information about you. You typically provide personal information when you complete a Guggenheim Investments account application or when you request a transaction that involves Rydex and Guggenheim Investments funds or one of the Guggenheim Investments affiliated companies. “Nonpublic personal information” is personally identifiable private information about you. For example, it includes information regarding your name and address, Social Security or taxpayer identification number, assets, income, account balance, bank account information and investment activity (e.g., purchase and redemption history).
How We Handle Your Personal Information
As emphasized above, we do not sell information about current or former clients or their accounts to third parties. Nor do we share such information, except when necessary to complete transactions at your request or to make you aware of related investment products and services that we offer. Additional details about how we handle your personal information are provided below. To complete certain transactions or account changes that you direct, it may be necessary to provide identifying information to companies, individuals or groups that are not affiliated with Guggenheim Investments. For example, if you ask to transfer assets from another financial institution to Guggenheim Investments, we will need to provide certain information about you to that company to complete the transaction. To alert you to other Guggenheim Investments investment products and services, we may share your information within the Guggenheim Investments family of affiliated companies. This would include, for example, sharing your information within Guggenheim Investments so we can make you aware of new Rydex and Guggenheim Investments funds or the services offered through another Guggenheim Investments affiliated company. In certain instances, we may contract with nonaffiliated companies to perform services for us. Where necessary, we will disclose information we have about you to these third parties. In all such cases, we provide the third party with only the information necessary to carry out its assigned responsibilities and only for that purpose. And we require these third parties to treat your private information with the same high degree of confidentiality that we do. In certain instances, we may share information with other financial institutions regarding individuals and entities in response to the U.S.A. Patriot Act. Finally, we will release information about you if you direct us to do so, if we are compelled by law to do so or in other circumstances permitted by law.
Opt Out Provisions
We do not sell your personal information to anyone. The law allows you to “opt out” of only certain kinds of information sharing with third parties. The firm does not share personal information about you with any third parties that triggers this opt-out right. This means YOU ARE ALREADY OPTED OUT.
How We Protect Privacy Online
Our concern for the privacy of our shareholders also extends to those who use our web site, www.rydex-sgi.com. Our web site uses some of the most secure forms of online communication available, including encryption technology, Secure Socket Layer (SSL) protocol, firewalls and user names and passwords. These technologies provide a high level of security and privacy when you access your account information or initiate online transactions. The Guggenheim Investments web site offers customized features that require our use of “http cookies”—tiny pieces of information that we ask your browser to store. However, we make very limited use of these cookies. We only use cookies for session management and security features on the Guggenheim Investments web site. We do not use them to pull data from your hard drive, to learn your email address, or to view data in cookies created by other web sites. We will not share the information in our cookies or give others access to it. See the legal information area on our web site for more details about web site security and privacy features.
How We Safeguard Your Personal Information
We restrict access to nonpublic personal information about shareholders to our employees and in some cases to third parties (for example, the service providers described above) as permitted by law. We maintain strict physical, electronic and procedural safeguards that comply with federal standards to guard your nonpublic personal information.
We’ll Keep You Informed
As required by federal law, we will notify shareholders of our privacy policy annually. We reserve the right to modify this policy at any time, but rest assured that if we do change it, we will tell you promptly. You will also be able to access our privacy policy from our web site at www.rydex-sgi.com. Should you have any questions regarding our privacy policy, contact us at 800.820.0888 or 301.296.5100.
THE GUGGENHEIM FUNDSANNUALREPORT | 43
This page intentionally left blank.
This page intentionally left blank.

805 King Farm Blvd, Suite 600
Rockville, MD 20850
www.rydex-sgi.com
800.820.0888
RVAEP-2-1211x1212
DWA FLEXIBLE ALLOCATION FUND
DWA SECTOR ROTATION FUND
This report and the financial statements contained herein are submitted for the general information of our shareholders. The report is not authorized for distribution to prospective investors unless preceded or accompanied by an effective prospectus.
Distributed by Rydex Distributors, LLC.
| 2 | ||||
| 4 | ||||
| 6 | ||||
| 12 | ||||
| 18 | ||||
| 24 | ||||
| 25 | ||||
| 29 | ||||
| 33 | ||||
| THE GUGGENHEIM FUNDSANNUALREPORT | 1 |
To Our Shareholders:
Financial markets endured a lot of turbulence in 2011, due to a variety of events: concerns about debt in the eurozone and in the U.S., which lost its triple-A credit rating, a tsunami-induced Japanese nuclear-plant disaster that disrupted automobile production around the globe, Mideast social unrest that led to a jump in oil prices and weak growth in many of the world’s developed economies. Reflecting the volatility in the stock market was the S&P 500 Index*, which finished the year up about 2%, but only after an 8% rise in the first few months of 2011, then a bearish 19% drop by early October, followed by a 12% fourth-quarter rebound spurred by improved economic data.
The U.S. Federal Reserve was a major factor in the markets for most of 2011, from its winding down of a second asset-purchase program (quantitative easing) in June to August’s “operation twist,” which shifted $400 billion in holdings from short-term to long-term Treasuries. The Fed said it would keep short-term interest rates near zero at least until mid-2013, and late in the year, some analysts were speculating that a third round of quantitative easing might be needed in 2012 to boost subpar growth.
While late-year improvements in economic measures may have dampened concern that the U.S. could slip back into recession, Europe’s recession fears were rising, as high unemployment and austerity measures weighed on weaker members of the euro zone, and threatened the economic engines of Germany and France. The Stoxx Europe 600 Index* was down about 11% for the year, with most individual country indices posting declines in double digits. Many investors continued to brace for a solution to Greece’s debt situation that would prevent financial problems from spreading to other weak countries or to banks, and stabilize the sliding euro, the year’s worst-performing major currency.
Even though they were not at the eye of the sovereign debt storm, many emerging market economies performed poorly in 2011, with those having the strongest links to the eurozone suffering the most. The MSCI Emerging Markets Index* was off by almost 20%, despite pockets of growth. China is facing slowing industrial production, sliding property values and the potential for a hard landing of the economy if housing and banks collapse.
While the market forces play out, many investors have been driven to the sidelines or to safe havens. Gold reached a record high of near $1,900 an ounce in August amid the U.S. debt downgrade, but then lost ground to the rising dollar amid continuing debate over Europe’s debt woes. Still, gold added 10% for the year, while the dollar ended the year within about 3% from where it began against the currencies of most major markets, including the euro, the pound, Canadian dollar and Swiss franc.
Sluggish economic data, concern over European financial weakness and the Fed’s policy efforts also drove investors into U.S. government debt over the course of 2011, despite the country’s lowered credit rating. The 30% total return of the Barclays Capital Long U.S. Treasury Index* made it one of the best-performing of the year, and it gave a lift to indices for corporate bonds, high yield bonds and municipals, which all grew by mid-to-high single digits.
| 2 | THE GUGGENHEIM FUNDSANNUALREPORT |
LETTER TO OUR SHAREHOLDERS (concluded)
The U.S. economy had momentum heading into 2012, as data showed the world’s largest economy to be maintaining a sustainable, if modest, expansion. Consumer confidence was improving, employment rising and monetary policy remained accommodative. We finished 2011 on a positive note, especially when compared to other countries, and so far continue to be insulated from the worst aspects of the economic troubles in Europe and China.
We look forward to continuing our service to you. Thank you for investing in our funds.
Sincerely,

| Michael Byrum |
| President and Chief Investment Officer |
| * | lndices are defined as follows: |
S&P 500® Index is a capitalization-weighted index covering 500 industrial, utility, transportation and financial companies of the U.S. markets (mostly NYSE Euronext issues).
The STOXX Europe 600 Index is derived from the STOXX Europe Total Market Index (TMI) and is a subset of the STOXX Global 1800 Index. With a fixed number of 600 components, the STOXX Europe 600 Index represents large-, mid- and small-capitalization companies across 18 countries of the European region: Austria, Belgium, Denmark, Finland, France, Germany, Greece, Iceland, Ireland, Italy, Luxembourg, the Netherlands, Norway, Portugal, Spain, Sweden, Switzerland and the United Kingdom.
The Barclays Capital Long U.S. Treasury Index includes all publicly issued U.S. Treasury securities that have a remaining maturity of 10 or more years, are rated investment grade, and have $250 million or more of outstanding face value. In addition, the securities must be denominated in U.S. dollars and must be fixed rate and non convertible. Excluded from the Long U.S. Treasury Index are certain special issues, such as flower bonds, TINs, state and local government series bonds, TIPS, and coupon issues that have been stripped from bonds included in the index. The Long U.S. Treasury Index is market capitalization weighted and the securities in the index are updated on the last business day of each month.
MSCI Emerging Markets Index is a free float-adjusted market capitalization index that is designed to measure equity market performance in the global emerging markets.
Performance displayed represents past performance which is no guarantee of future results. Of course, fund performance is subject to daily market volatility and may be better or worse since the end of the last quarter. For up-to-date fund performance, call us at 800.820.0888 or visit www.rydex-sgi.com.
Read each funds’ prospectus and summary prospectus (if available) carefully before investing. It contains the fund’s investment objectives, risks, charges, expenses and other information, which should be considered carefully before investing. Obtain a prospectus and summary prospectus (if available) at www.rydex-sgi.com or call 800.820.0888.
The referenced fund(s) are distributed by Rydex Distributors, LLC (RDL). Guggenheim Investments represents the investment management businesses of Guggenheim Partners, LLC, which includes Security Investors, LLC and Guggenheim Partners Asset Management, the investment advisor to the referenced funds. Rydex Distributors, LLC, is affiliated with Guggenheim Partners, LLC and Security Investors, LLC.
| THE GUGGENHEIM FUNDSANNUALREPORT | 3 |
ABOUT SHAREHOLDERS’ FUND EXPENSES (Unaudited)
All mutual funds have operating expenses and it is important for our shareholders to understand the impact of costs on their investments. Shareholders of a Fund incur two types of costs: (i) transaction costs, including sales charges (loads) on purchase payments, reinvested dividends, or other distributions; and exchange fees; and (ii) ongoing costs, including management fees, administrative services, and shareholder reports, among others. These ongoing costs, or operating expenses, are deducted from a fund’s gross income and reduce the investment return of the fund.
A fund’s expenses are expressed as a percentage of its average net assets, which is known as the expense ratio. The following examples are intended to help investors understand the ongoing costs (in dollars) of investing in a Fund and to compare these costs with the ongoing costs of investing in other mutual funds.
The examples are based on an investment of $1,000 made at the beginning of the period and held for the entire six-month period beginning June 30, 2011 and ending December 31, 2011.
The following tables illustrate a Fund’s costs in two ways:
Table 1. Based on actual Fund return. This section helps investors estimate the actual expenses paid over the period. The “Ending Account Value” shown is derived from the Fund’s actual return, and the fourth column shows the dollar amount that would have been paid by an investor who started with $1,000 in the Fund. Investors may use the information here, together with the amount invested, to estimate the expenses paid over the period. Simply divide the Fund’s account value by $1,000 (for example, an $8,600 account value divided by $1,000 = 8.6), then multiply the result by the number provided under the heading “Expenses Paid During Period.”
Table 2. Based on hypothetical 5% return. This section is intended to help investors compare a Fund’s cost with those of other mutual funds. The table provides information about hypothetical account values and hypothetical expenses based on the Fund’s actual expense ratio and an assumed rate of return of 5% per year before expenses, which is not the Fund’s actual return. The hypothetical account values and expenses may not be used to estimate the actual ending account balance or expenses paid during the period. The example is useful in making comparisons because the U.S. Securities and Exchange Commission (the “SEC”) requires all mutual funds to calculate expenses based on the 5% return. Investors can assess a Fund’s costs by comparing this hypothetical example with the hypothetical examples that appear in shareholder reports of other funds.
The calculations illustrated above assume no shares were bought or sold during the period. Actual costs may have been higher or lower, depending on the amount of investment and the timing of any purchases or redemptions.
Please note that the expenses shown in the table are meant to highlight your ongoing costs only and do not reflect any transactional costs, such as sales charges (loads) on purchase payments, and contingent deferred sales charges (“CDSC”) on redemptions, if any. Therefore, the second table is useful in comparing ongoing costs only, and will not help you determine the relative total costs of owning different funds. In addition, if these transactional costs were included, your costs would have been higher.
More information about a Fund’s expenses, including annual expense ratios for the past five years, can be found in the Financial Highlights section of this report. For additional information on operating expenses and other shareholder costs, please refer to the appropriate Fund prospectus.
| 4 | THE GUGGENHEIM FUNDSANNUALREPORT |
ABOUT SHAREHOLDERS’ FUND EXPENSES (Unaudited) (concluded)
| Expense Ratio1 | Fund Return | Beginning Account Value June 30, 2011 | Ending Account Value December 31, 2011 | Expenses Paid During Period2 | ||||||||||||||||
Table 1. Based on actual Fund return3 |
| |||||||||||||||||||
DWA Flexible Allocation Fund | 1.81 | % | (11.86 | %) | $ | 1,000.00 | $ | 881.40 | $ | 8.58 | ||||||||||
DWA Sector Rotation Fund | 1.81 | % | (9.69 | %) | 1,000.00 | 903.10 | 8.68 | |||||||||||||
Table 2. Based on hypothetical 5% return (before expenses) |
| |||||||||||||||||||
DWA Flexible Allocation Fund | 1.81 | % | 5.00 | % | $ | 1,000.00 | $ | 1,016.08 | $ | 9.20 | ||||||||||
DWA Sector Rotation Fund | 1.81 | % | 5.00 | % | 1,000.00 | 1,016.08 | 9.20 | |||||||||||||
| 1 | Annualized and excludes expenses of the underlying funds in which the Funds invest. |
| 2 | Expenses are equal to the Fund’s annualized expense ratio, net of any applicable fee waivers, multiplied by the average account value over the period, multiplied by 184/365 (to reflect the one-half year period). Expenses shown do not include fees charged by insurance companies. |
| 3 | Actual cumulative return at net asset value for the period June 30, 2011 to December 31, 2011. |
| THE GUGGENHEIM FUNDSANNUALREPORT | 5 |
| PERFORMANCE REPORT AND FUND PROFILE (Unaudited) | December 31, 2011 |
OBJECTIVE: Seeks to provide capital appreciation with capital preservation as a secondary objective.
Inception Date: April 28, 2010
Performance for the DWA Flexible Allocation Fund for the year ended December 31, 2011, was -11.14%, behind the performance of the S&P 500® Index*, which rose 2.11%.
The Fund lagged the market this year, primarily due to a choppy market environment. Although the broad market was little changed over the course of the year, there was a tremendous amount of volatility.
All changes in our portfolios are a consequence of relative strength, rather than a response to specific global or domestic events. Significant portfolio shifts were driven by relative strength over the course of 2011.
Early in the year, the portfolio was dominated by economically sensitive equities, such as those in basic materials, and small- and mid-cap growth. As the market had repeated corrections, the portfolio emphasis became much more conservative, with exposure to fixed income and consumer staples. The strongest performances were in consumer staples and fixed income. Precious metals have not performed well, as inflation and dollar weakness have become less of a concern. The biggest negative factor in portfolio performance this year was simply a very choppy market environment. In the Fund, by the time a trend was established and entered, the trend often turned out to be nearly over. Numerous transactions were exited at losses this year as a result.
Another negative factor this year was the portfolio hedging transactions. Although hedging can be extraordinarily valuable in strongly trending years like 2008, it can create underperformance during choppy market environments. The net result of several partial hedges and two complete hedges this year was not a positive. In the case of both complete hedges, the hedging occurred at a point that turned out to be nearer the end of the declines than the beginning. The subsequent reversals created significant opportunity cost.
Our investment process relies on market action rather than economic forecasts. If the indications provided by relative strength are accurate, global economic growth may be muted going forward. Given that, the portfolio still has significant exposure to fixed income and consumer staples. Recent additions to holdings in technology and consumer cyclicals suggest that the economic outlook is not completely bleak, however. Investor sentiment tied to concerns about political and economic developments in the U.S. and Europe is probably the major risk to an otherwise positive outlook. Our investment philosophy is firmly grounded in a rotational process driven by relative strength, so we expect to be able to adapt to a wide variety of market conditions as they continue to present themselves.
| * | Standard & Poor’s 500 Index (S&P 500®) – a capitalization-weighted index covering 500 industrial, utility, transportation and financial companies of the U.S. markets (mostly NYSE Euronext issues). |
| Performance displayed represents past performance which is no guarantee of future results. |
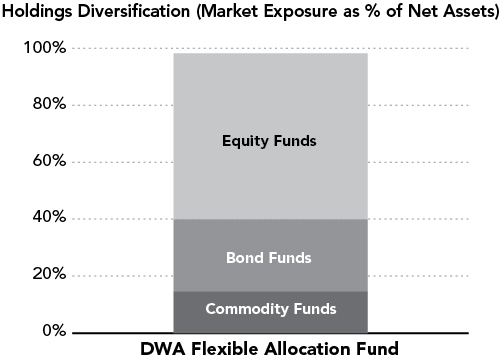
“Holdings Diversification (Market Exposure as % of Net Assets)” excludes any temporary cash investments.
Ten Largest Holdings (% of Total Net Assets) | ||||
Vanguard Consumer Staples ETF | 8.8 | % | ||
Consumer Staples Select Sector SPDR Fund | 8.6 | % | ||
iShares Barclays TIPS Bond Fund | 8.5 | % | ||
iShares Dow Jones US Consumer Goods Sector Index Fund | 8.5 | % | ||
iShares Barclays Aggregate Bond Fund | 8.5 | % | ||
iShares JPMorgan USD Emerging Markets Bond Fund | 8.3 | % | ||
Consumer Discretionary Select Sector SPDR Fund | 8.2 | % | ||
Powershares QQQ Trust Series 1 | 8.1 | % | ||
Technology Select Sector SPDR Fund | 8.1 | % | ||
iShares Dow Jones US Technology Sector Index Fund | 8.0 | % | ||
|
| |||
Top Ten Total | 83.6 | % | ||
|
| |||
“Ten Largest Holdings” exclude any temporary cash or derivative investments.
| 6 | THE GUGGENHEIM FUNDSANNUALREPORT |
PERFORMANCE REPORT AND FUND PROFILE (Unaudited) (concluded)
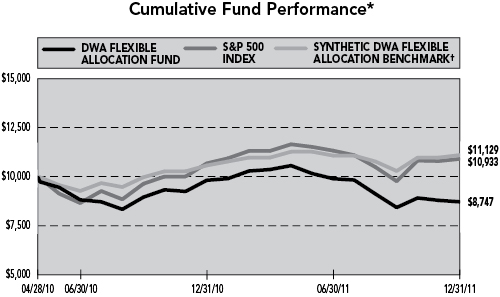
Average Annual Returns*
Periods Ended 12/31/11
| 1 Year | Since Inception (04/28/10) | |||||||
DWA Flexible Allocation Fund | -11.14 | % | -7.67 | % | ||||
|
|
|
| |||||
S&P 500 Index | 2.11 | % | 5.47 | % | ||||
|
|
|
| |||||
Synthetic DWA Flexible Allocation Benchmark† | 4.72 | % | 6.42 | % | ||||
|
|
|
| |||||
| † | Benchmark reflects 60% S&P 500 Index and 40% Barclays Aggregate Bond Index. |
| * | The performance data represents past performance that is not predictive of future results. The investment return and principal value of an investment in the Fund will fluctuate so that an investor’s shares, when redeemed, may be worth more or less than their original cost. Returns are historical and include changes in principal and reinvested dividends and capital gains and do not reflect the effect of taxes. The S&P 500 Index and Barclays Aggregate Bond Index are unmanaged indices and, unlike the Fund, have no management fees or operating expenses to reduce their reported returns. Returns do not reflect the impact of any additional fees charged by insurance companies. |
| THE GUGGENHEIM FUNDSANNUALREPORT | 7 |
| SCHEDULE OF INVESTMENTS | December 31, 2011 | |||
DWA FLEXIBLE ALLOCATION FUND
|
| SHARES | VALUE | |||||||
EXCHANGE TRADED FUNDS† - 98.2% | ||||||||
EQUITY FUNDS - 58.3% | ||||||||
Vanguard Consumer Staples ETF | 18,608 | $ | 1,515,622 | |||||
Consumer Staples Select Sector SPDR Fund | 45,679 | 1,484,111 | ||||||
iShares Dow Jones US Consumer Goods Sector Index Fund | 21,336 | 1,461,089 | ||||||
Consumer Discretionary Select Sector SPDR Fund | 35,985 | 1,404,135 | ||||||
Powershares QQQ Trust Series 1 | 24,955 | 1,393,238 | ||||||
Technology Select Sector SPDR Fund | 54,338 | 1,382,902 | ||||||
iShares Dow Jones US Technology Sector Index Fund | 21,547 | 1,376,853 | ||||||
|
| |||||||
Total Equity Funds | 10,017,950 | |||||||
|
| |||||||
BOND FUNDS - 25.3% | ||||||||
iShares Barclays TIPS Bond Fund | 12,529 | 1,462,009 | ||||||
iShares Barclays Aggregate Bond Fund | 13,252 | 1,461,033 | ||||||
iShares JPMorgan USD Emerging Markets Bond Fund | 12,965 | 1,422,909 | ||||||
|
| |||||||
Total Bond Funds | 4,345,951 | |||||||
|
| |||||||
COMMODITY FUNDS - 14.6% | ||||||||
PowerShares DB Gold Fund* | 23,693 | 1,290,084 | ||||||
PowerShares DB Precious Metals Fund* | 22,747 | 1,225,608 | ||||||
|
| |||||||
Total Commodity Funds | 2,515,692 | |||||||
|
| |||||||
Total Exchange Traded Funds | 16,879,593 | |||||||
|
| |||||||
| FACE AMOUNT | ||||||||
REPURCHASE AGREEMENTS††,1 - 2.2% | ||||||||
Mizuho Financial Group, Inc. | $ | 96,790 | 96,790 | |||||
HSBC Group | 92,653 | 92,653 | ||||||
Deutsche Bank | 92,653 | 92,653 | ||||||
Credit Suisse Group | 92,653 | 92,653 | ||||||
|
| |||||||
Total Repurchase Agreements | 374,749 | |||||||
|
| |||||||
Total Investments - 100.4% | $ | 17,254,342 | ||||||
|
| |||||||
Liabilities & Other Assets - (0.4)% | (69,175 | ) | ||||||
|
| |||||||
Total Net Assets - 100.0% | $ | 17,185,167 | ||||||
| * | Non-income producing security. |
| † | Value determined based on Level 1 inputs — See Note 4. |
| †† | Value determined based on Level 2 inputs — See Note 4. |
| 1 | Repurchase Agreements — See Note 5. |
| 8 | THE GUGGENHEIM FUNDSANNUALREPORT | See Notes to Financial Statements. |
DWA FLEXIBLE ALLOCATION FUND
STATEMENT OF ASSETS AND LIABILITIES
December 31, 2011
ASSETS: | ||||
Investments, at value | $ | 16,879,593 | ||
Repurchase agreements, at value | 374,749 | |||
|
| |||
Total investments | 17,254,342 | |||
Receivables: | ||||
Dividends | 6,005 | |||
|
| |||
Total assets | 17,260,347 | |||
|
| |||
LIABILITIES: | ||||
Payable for: | ||||
Fund shares redeemed | 15,839 | |||
Management fees | 15,465 | |||
Transfer agent and administrative fees | 3,866 | |||
Investor service fees | 3,866 | |||
Portfolio accounting fees | 1,547 | |||
Miscellaneous | 34,597 | |||
|
| |||
Total liabilities | 75,180 | |||
|
| |||
NETASSETS | $ | 17,185,167 | ||
|
| |||
NETASSETSCONSISTOF: | ||||
Paid in capital | $ | 18,557,887 | ||
Accumulated net investment loss | (388,074 | ) | ||
Accumulated net realized loss on investments | (836,474 | ) | ||
Net unrealized depreciation on investments | (148,172 | ) | ||
|
| |||
Net assets | $ | 17,185,167 | ||
Capital shares outstanding | 807,079 | |||
Net asset value per share | $ | 21.29 | ||
|
|
STATEMENT OF OPERATIONS
Year Ended December 31, 2011
INVESTMENT INCOME: | ||||
Dividends | $ | 190,757 | ||
Interest | 847 | |||
|
| |||
Total investment income | 191,604 | |||
|
| |||
EXPENSES: | ||||
Management fees | 217,034 | |||
Transfer agent and administrative fees | 54,258 | |||
Investor service fees | 54,258 | |||
Portfolio accounting fees | 21,703 | |||
Custodian fees | 5,365 | |||
Trustees’ fees* | 2,168 | |||
Miscellaneous | 47,076 | |||
|
| |||
Total expenses | 401,862 | |||
|
| |||
Net investment loss | (210,258 | ) | ||
|
| |||
NET REALIZEDAND UNREALIZED GAIN (LOSS): | ||||
Net realized gain (loss) on: | ||||
Investments | (784,552 | ) | ||
Realized gain distribution from investment company shares | 1,893 | |||
|
| |||
Net realized loss | (782,659 | ) | ||
|
| |||
Net change in unrealized appreciation (depreciation) on: | ||||
Investments | (1,579,249 | ) | ||
|
| |||
Net change in unrealized appreciation (depreciation) | (1,579,249 | ) | ||
|
| |||
Net realized and unrealized loss | (2,361,908 | ) | ||
|
| |||
Net decrease in net assets resulting from operations | $ | (2,572,166 | ) | |
|
|
| * | Relates to Trustees not deemed “interested persons” within the meaning of Section 2(a)(19) of the 1940 Act. |
| See Notes to Financial Statements. | THE GUGGENHEIM FUNDSANNUALREPORT | 9 |
DWA FLEXIBLE ALLOCATION FUND
STATEMENTS OF CHANGES IN NET ASSETS
| Year Ended December 31, 2011 | Period Ended December 31, 2010a | |||||||
INCREASE (DECREASE) IN NET ASSETS FROM OPERATIONS: | ||||||||
Net investment income (loss) | $ | (210,258 | ) | $ | 90,587 | |||
Net realized loss on investments | (782,659 | ) | (23,698 | ) | ||||
Net change in unrealized appreciation (depreciation) on investments | (1,579,249 | ) | 1,431,077 | |||||
|
|
|
| |||||
Net increase (decrease) in net assets resulting from operations | (2,572,166 | ) | 1,497,966 | |||||
|
|
|
| |||||
DISTRIBUTIONS TO SHAREHOLDERS FROM: | ||||||||
Net investment income | (86,536 | ) | — | |||||
Net realized gains | (420,821 | ) | — | |||||
|
|
|
| |||||
Total distributions to shareholders | (507,357 | ) | — | |||||
|
|
|
| |||||
CAPITAL SHARE TRANSACTIONS: | ||||||||
Proceeds from sale of shares | 5,404,839 | 23,846,705 | ||||||
Distributions reinvested | 507,357 | — | ||||||
Cost of shares redeemed | (6,697,960 | ) | (4,294,217 | ) | ||||
|
|
|
| |||||
Net increase (decrease) from capital share transactions | (785,764 | ) | 19,552,488 | |||||
|
|
|
| |||||
Net increase (decrease) in net assets | (3,865,287 | ) | 21,050,454 | |||||
NET ASSETS: | ||||||||
Beginning of period | 21,050,454 | — | ||||||
|
|
|
| |||||
End of period | $ | 17,185,167 | $ | 21,050,454 | ||||
|
|
|
| |||||
Undistributed/(Accumulated) net investment income (loss) at end of period | $ | (388,074 | ) | $ | 90,587 | |||
|
|
|
| |||||
CAPITAL SHARE ACTIVITY: | ||||||||
Shares sold | 220,759 | 1,043,463 | ||||||
Shares issued from reinvestment of distributions | 23,348 | — | ||||||
Shares redeemed | (292,347 | ) | (188,144 | ) | ||||
|
|
|
| |||||
Net increase (decrease) in shares | (48,240 | ) | 855,319 | |||||
|
|
|
| |||||
| a | Since commencement of operations: April 28, 2010. |
| 10 | THE GUGGENHEIM FUNDSANNUALREPORT | See Notes to Financial Statements. |
DWA FLEXIBLE ALLOCATION FUND
FINANCIAL HIGHLIGHTS
This table is presented to show selected data for a share outstanding throughout each period and to assist shareholders in evaluating a Fund’s performance for the periods presented.
| Year Ended December 31, 2011e | Period Ended December 31, 2010a,e | |||||||
Per Share Data | ||||||||
Net asset value, beginning of period | $ | 24.61 | $ | 25.00 | ||||
|
|
|
| |||||
Income (loss) from investment operations: | ||||||||
Net investment income (loss)b | (.23 | ) | .12 | |||||
Net loss on investments (realized and unrealized) | (2.50 | ) | (.51 | ) | ||||
|
|
|
| |||||
Total from investment operations | (2.73 | ) | (.39 | ) | ||||
|
|
|
| |||||
Less distributions from: | ||||||||
Net investment income | (.10 | ) | — | |||||
Net realized gains | (.49 | ) | — | |||||
|
|
|
| |||||
Total distributions | (.59 | ) | — | |||||
|
|
|
| |||||
Net asset value, end of period | $ | 21.29 | $ | 24.61 | ||||
|
|
|
| |||||
Total Returnc | (11.14 | %) | (1.56 | %) | ||||
|
|
|
| |||||
Ratios/Supplemental Data | ||||||||
Net assets, end of period (in thousands) | $ | 17,185 | $ | 21,050 | ||||
|
|
|
| |||||
Ratios to average net assets: | ||||||||
Net investment income (loss) | (0.97 | %) | 0.83 | % | ||||
Total expensesd | 1.85 | % | 1.84 | % | ||||
|
|
|
| |||||
Portfolio turnover rate | 356 | % | 305 | % | ||||
| a | Since commencement of operations: April 28, 2010. Percentage amounts for the period, except total return and portfolio turnover rate, have been annualized. |
| b | Net investment income (loss) per share was computed using average shares outstanding throughout the period. |
| c | Total return does not reflect the impact of any additional fees charged by insurance companies and has not been annualized. |
| d | Does not include expenses of the underlying funds in which the Fund invests. |
| e | Guggenheim Investments directly managed the Fund effective November 14, 2011. Prior to November 14, 2011, Dorsey Wright sub-advised the Fund. |
| See Notes to Financial Statements. | THE GUGGENHEIM FUNDSANNUALREPORT | 11 |
| PERFORMANCE REPORT AND FUND PROFILE (Unaudited) | December 31, 2011 |
OBJECTIVE: Seeks to provide long-term capital appreciation.
Inception Date: April 28, 2010
Performance for the Sector Rotation Fund for the year ended December 31, 2011, was -7.31%, behind the performance of the S&P 500® Index*, which rose 2.11%.
The Fund lagged the market this year, primarily due to a choppy market environment. Dependable trends were rare and the level of volatility was high.
All changes in our portfolios are a consequence of relative strength, rather than a response to specific global or domestic events. Relative strength drove significant portfolio changes over the course of 2011.
Early in the year, there was heavy exposure to economically sensitive areas like basic materials, energy, and consumer cyclicals. By Q3, less economically sensitive sectors like consumer staples, healthcare, and utilities dominated the portfolio. Real estate was also a significant weight from summer through autumn, but is now out of the portfolio.
The strongest performances were in healthcare and utilities. Energy and basic materials performed well until mid-year, when they fell off sharply and were removed from the portfolio. The biggest negative factor in the portfolio performance this year was simply a very choppy market environment. In the Fund, by the time a trend was established and entered, the trend often turned out to be nearly over. Numerous transactions were exited at losses this year as a result.
Another negative factor this year was the portfolio hedging transactions. Although hedging can be extraordinarily valuable in strongly trending years like 2008, it can create underperformance during choppy market environments. The net result this year of two hedging transactions was not a positive, as the hedging occurred at a point that turned out to be nearer the end of the declines than the beginning. The reversals created significant opportunity cost. (Using the S&P 500 price as an approximation, the total cost was 3-4%.)
Our investment process relies on market action rather than economic forecasts. Given the large sector allocations in consumer staples, healthcare and utilities, global economic growth may be muted going forward, if the indications provided by relative strength are correct. Sector holdings in consumer cyclicals—specifically, retailers—suggest that the economic outlook is not completely bleak, however. The major risk to the current positive outlook for the equity market may be investor sentiment tied to concerns about political and economic developments in the U.S. and Europe. Our investment philosophy is firmly grounded in a rotational process driven by relative strength, so we expect to be able to adapt to market conditions as they continue to change.
| * | Standard & Poor’s 500 Index (S&P 500®) – a capitalization-weighted index covering 500 industrial, utility, transportation and financial companies of the U.S. markets (mostly NYSE Euronext issues). |
Performance displayed represents past performance which is no guarantee of future results.
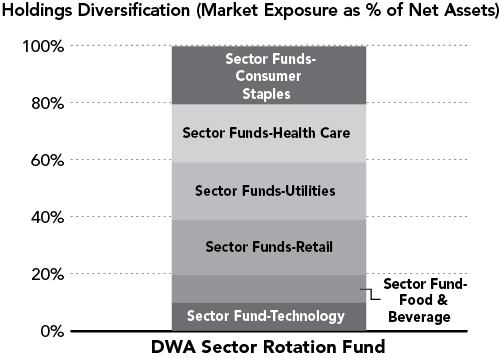
“Holdings Diversification (Market Exposure as % of Net Assets)” excludes any temporary cash investments.
Ten Largest Holdings (% of Total Net Assets) | ||||
PowerShares Dynamic Pharmaceuticals Portfolio | 10.5 | % | ||
PowerShares Dynamic Consumer Staples Sector Portfolio | 10.4 | % | ||
PowerShares Dynamic Utilities Portfolio | 10.1 | % | ||
iShares S&P Global Consumer Staples Sector Index Fund | 10.1 | % | ||
Utilities Select Sector SPDR Fund | 10.0 | % | ||
Powershares Dynamic Food & Beverage Portfolio | 9.9 | % | ||
SPDR S&P Retail ETF | 9.8 | % | ||
Technology Select Sector SPDR Fund | 9.7 | % | ||
iShares Dow Jones US Pharmaceuticals Index Fund | 9.7 | % | ||
PowerShares Dynamic Retail Portfolio | 9.5 | % | ||
|
| |||
Top Ten Total | 99.7 | % | ||
|
| |||
“Ten Largest Holdings” exclude any temporary cash or derivative investments.
| 12 | THE GUGGENHEIM FUNDSANNUALREPORT |
PERFORMANCE REPORT AND FUND PROFILE (Unaudited) (concluded)
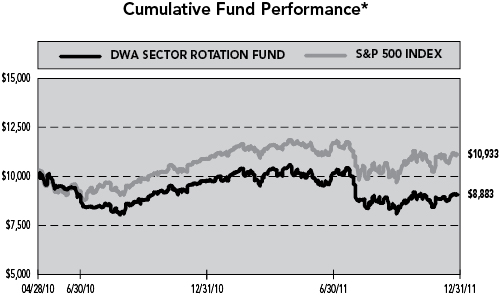
Average Annual Returns*
Periods Ended 12/31/11
| 1 Year | Since Inception (04/28/10) | |||||||
DWA Sector Rotation Fund | -7.31 | % | -6.82 | % | ||||
|
|
|
| |||||
S&P 500 Index | 2.11 | % | 5.47 | % | ||||
|
|
|
| |||||
| * | The performance data represents past performance that is not predictive of future results. The investment return and principal value of an investment in the Fund will fluctuate so that an investor’s shares, when redeemed, may be worth more or less than their original cost. Returns are historical and include changes in principal and reinvested dividends and capital gains and do not reflect the effect of taxes. The S&P 500 Index is an unmanaged index and, unlike the Fund, has no management fees or operating expenses to reduce its reported return. Returns do not reflect the impact of any additional fees charged by insurance companies. |
| THE GUGGENHEIM FUNDSANNUALREPORT | 13 |
SCHEDULE OF INVESTMENTS | December 31, 2011 | |||
DWA SECTOR ROTATION FUND |
| SHARES | VALUE | |||||||
EXCHANGE TRADED FUNDS† - 99.7% | ||||||||
SECTOR FUNDS-CONSUMER STAPLES - 20.5% | ||||||||
PowerShares Dynamic Consumer Staples Sector Portfolio2 | 79,183 | $ | 2,464,175 | |||||
iShares S&P Global Consumer Staples Sector Index Fund | 35,738 | 2,378,721 | ||||||
|
| |||||||
Total Sector Fund-Consumer Staples | 4,842,896 | |||||||
|
| |||||||
SECTOR FUNDS-HEALTH CARE - 20.2% | ||||||||
PowerShares Dynamic Pharmaceuticals Portfolio | 87,658 | 2,470,202 | ||||||
iShares Dow Jones US Pharmaceuticals Index Fund | 30,119 | 2,302,598 | ||||||
|
| |||||||
Total Sector Fund-Health Care | 4,772,800 | |||||||
|
| |||||||
SECTOR FUNDS-UTILITIES - 20.1% | ||||||||
PowerShares Dynamic Utilities Portfolio2 | 147,613 | 2,398,652 | ||||||
Utilities Select Sector SPDR Fund | 65,814 | 2,367,988 | ||||||
|
| |||||||
Total Sector Fund-Utilities | 4,766,640 | |||||||
|
| |||||||
SECTOR FUNDS-RETAIL - 19.3% | ||||||||
SPDR S&P Retail ETF | 44,295 | 2,327,703 | ||||||
PowerShares Dynamic Retail Portfolio2 | 102,444 | 2,249,670 | ||||||
|
| |||||||
Total Sector Fund-Retail | 4,577,373 | |||||||
|
| |||||||
SECTOR FUND-FOOD & BEVERAGE - 9.9% |
| |||||||
Powershares Dynamic Food & Beverage Portfolio | 121,522 | 2,329,577 | ||||||
|
| |||||||
SECTOR FUND-TECHNOLOGY - 9.7% |
| |||||||
Technology Select Sector SPDR Fund | 90,563 | 2,304,828 | ||||||
|
| |||||||
Total Exchange Traded Funds | 23,594,114 | |||||||
|
| |||||||
| FACE AMOUNT | ||||||||
REPURCHASE AGREEMENTS††,1 - 0.6% | ||||||||
Mizuho Financial Group, Inc. issued 12/30/11 at 0.00% due 01/03/12 | $ | 41,031 | 41,031 | |||||
HSBC Group issued 12/30/11 at 0.00% due 01/03/12 | 39,279 | 39,279 | ||||||
Deutsche Bank issued 12/30/11 at 0.00% due 01/03/12 | 39,279 | 39,279 | ||||||
Credit Suisse Group issued 12/30/11 at 0.00% due 01/03/12 | 39,279 | 39,279 | ||||||
|
| |||||||
Total Repurchase Agreements |
| 158,868 | ||||||
|
| |||||||
Total Investments - 100.3% |
| $ | 23,752,982 | |||||
|
| |||||||
Liabilities & Other Assets - (0.3)% |
| (82,204 | ) | |||||
|
| |||||||
Total Net Assets - 100.0% |
| $ | 23,670,778 | |||||
| † | Value determined based on Level 1 inputs — See Note 4. |
| †† | Value determined based on Level 2 inputs — See Note 4. |
| 1 | Repurchase Agreements — See Note 5. |
| 2 | Affiliated security. |
| 14 | THE GUGGENHEIM FUNDSANNUALREPORT | See Notes to Financial Statements. |
DWA SECTOR ROTATION FUND
STATEMENT OF ASSETS AND LIABILITIES
December 31, 2011
ASSETS: | ||||
Investments, at value | $ | 23,594,114 | ||
Repurchase agreements, at value | 158,868 | |||
|
| |||
Total investments | 23,752,982 | |||
|
| |||
Total assets | 23,752,982 | |||
|
| |||
LIABILITIES: | ||||
Payable for: | ||||
Management fees | 20,110 | |||
Transfer agent and administrative fees | 5,027 | |||
Investor service fees | 5,027 | |||
Portfolio accounting fees | 2,011 | |||
Fund shares redeemed | 453 | |||
Miscellaneous | 49,576 | |||
|
| |||
Total liabilities | 82,204 | |||
|
| |||
NETASSETS | $ | 23,670,778 | ||
|
| |||
NETASSETSCONSISTOF: | ||||
Paid in capital | $ | 24,466,083 | ||
Accumulated net investment loss | — | |||
Accumulated net realized loss on investments | (1,513,193 | ) | ||
Net unrealized appreciation on investments | 717,888 | |||
|
| |||
Net assets | $ | 23,670,778 | ||
Capital shares outstanding | 1,067,818 | |||
Net asset value per share | $ | 22.17 | ||
|
|
STATEMENT OF OPERATIONS
Year Ended December 31, 2011
INVESTMENT INCOME: | ||||
Dividends from securities of affiliated issuer | $ | 87,716 | ||
Dividends from securities of unaffiliated issuer | 239,358 | |||
Interest | 73 | |||
|
| |||
Total investment income | 327,147 | |||
|
| |||
EXPENSES: | ||||
Management fees | 304,803 | |||
Transfer agent and administrative fees | 76,201 | |||
Investor service fees | 76,201 | |||
Portfolio accounting fees | 30,480 | |||
Custodian fees | 8,467 | |||
Trustees’ fees* | 3,118 | |||
Miscellaneous | 66,774 | |||
|
| |||
Total expenses | 566,044 | |||
|
| |||
Net investment loss | (238,897 | ) | ||
|
| |||
NET REALIZEDAND UNREALIZED GAIN (LOSS): | ||||
Net realized gain (loss) on: | ||||
Investments in unaffiliated issuers | 840,267 | |||
Investments in affiliated issuers | (165,566 | ) | ||
|
| |||
Net realized gain | 674,701 | |||
|
| |||
Net change in unrealized appreciation (depreciation) on: | ||||
Investments | (2,684,447 | ) | ||
|
| |||
Net change in unrealized appreciation (depreciation) | (2,684,447 | ) | ||
|
| |||
Net realized and unrealized loss | (2,009,746 | ) | ||
|
| |||
Net decrease in net assets resulting from operations | $ | (2,248,643 | ) | |
|
|
| * | Relates to Trustees not deemed “interested persons” within the meaning of Section 2(a)(19) of the 1940 Act. |
| See Notes to Financial Statements. | THE GUGGENHEIM FUNDSANNUALREPORT | 15 |
DWA SECTOR ROTATION FUND
STATEMENTS OF CHANGES IN NET ASSETS
| Year Ended December 31, 2011 | Period Ended December 31, 2010a | |||||||
INCREASE (DECREASE) IN NET ASSETS FROM OPERATIONS: | ||||||||
Net investment income (loss) | $ | (238,897 | ) | $ | 42,734 | |||
Net realized gain (loss) on investments | 674,701 | (2,187,894 | ) | |||||
Net change in unrealized appreciation (depreciation) on investments | (2,684,447 | ) | 3,402,335 | |||||
|
|
|
| |||||
Net increase (decrease) in net assets resulting from operations | (2,248,643 | ) | 1,257,175 | |||||
|
|
|
| |||||
DISTRIBUTIONS TO SHAREHOLDERS FROM: | ||||||||
Net investment income | (42,734 | ) | — | |||||
|
|
|
| |||||
Total distributions to shareholders | (42,734 | ) | — | |||||
|
|
|
| |||||
CAPITAL SHARE TRANSACTIONS: | ||||||||
Proceeds from sale of shares | 4,213,685 | 44,340,023 | ||||||
Distributions reinvested | 42,734 | — | ||||||
Cost of shares redeemed | (13,849,319 | ) | (10,042,143 | ) | ||||
|
|
|
| |||||
Net increase (decrease) from capital share transactions | (9,592,900 | ) | 34,297,880 | |||||
|
|
|
| |||||
Net increase (decrease) in net assets | (11,884,277 | ) | 35,555,055 | |||||
NET ASSETS: | ||||||||
Beginning of period | 35,555,055 | — | ||||||
|
|
|
| |||||
End of period | $ | 23,670,778 | $ | 35,555,055 | ||||
|
|
|
| |||||
Undistributed/(Accumulated) net investment income (loss) at end of period | $ | — | $ | 42,734 | ||||
|
|
|
| |||||
CAPITAL SHARE ACTIVITY: | ||||||||
Shares sold | 175,540 | 1,957,608 | ||||||
Shares issued from reinvestment of distributions | 1,952 | — | ||||||
Shares redeemed | (593,516 | ) | (473,766 | ) | ||||
|
|
|
| |||||
Net increase (decrease) in shares | (416,024 | ) | 1,483,842 | |||||
|
|
|
| |||||
| a | Since commencement of operations: April 28, 2010. |
| 16 | THE GUGGENHEIM FUNDSANNUALREPORT | See Notes to Financial Statements. |
DWA SECTOR ROTATION FUND
FINANCIAL HIGHLIGHTS
This table is presented to show selected data for a share outstanding throughout each period and to assist shareholders in evaluating a Fund’s performance for the periods presented.
| Year Ended December 31, 2011e | Period Ended December 31, 2010a,e | |||||||
Per Share Data | ||||||||
Net asset value, beginning of period | $ | 23.96 | $ | 25.00 | ||||
|
|
|
| |||||
Income (loss) from investment operations: | ||||||||
Net investment income (loss)b | (.18 | ) | .03 | |||||
Net loss on investments (realized and unrealized) | (1.57 | ) | (1.07 | ) | ||||
|
|
|
| |||||
Total from investment operations | (1.75 | ) | (1.04 | ) | ||||
|
|
|
| |||||
Less distributions from: | ||||||||
Net investment income | (.04 | ) | — | |||||
|
|
|
| |||||
Total distributions | (.04 | ) | — | |||||
|
|
|
| |||||
Net asset value, end of period | $ | 22.17 | $ | 23.96 | ||||
|
|
|
| |||||
Total Returnc | (7.31 | %) | (4.16 | %) | ||||
|
|
|
| |||||
Ratios/Supplemental Data | ||||||||
Net assets, end of period (in thousands) | $ | 23,671 | $ | 35,555 | ||||
|
|
|
| |||||
Ratios to average net assets: | ||||||||
Net investment income (loss) | (0.78 | %) | 0.22 | % | ||||
Total expensesd | 1.86 | % | 1.84 | % | ||||
|
|
|
| |||||
Portfolio turnover rate | 307 | % | 312 | % | ||||
| a | Since commencement of operations: April 28, 2010. Percentage amounts for the period, except total return and portfolio turnover rate, have been annualized. |
| b | Net investment income (loss) per share was computed using average shares outstanding throughout the period. |
| c | Total return does not reflect the impact of any additional fees charged by insurance companies and has not been annualized. |
| d | Does not include expenses of the underlying funds in which the Fund invests. |
| e | Guggenheim Investments directly managed the Fund effective November 14, 2011. Prior to November 14, 2011, Dorsey Wright sub-advised the Fund. |
| See Notes to Financial Statements. | THE GUGGENHEIM FUNDSANNUALREPORT | 17 |
| 1. | Organization and Significant Accounting Policies Organization |
The Rydex Variable Trust (the “Trust”), a Delaware business trust, is registered with the SEC under the Investment Company Act of 1940 (the “1940 Act”) as a non-diversified, open-ended investment company and is authorized to issue an unlimited number of no par value shares. The Trust offers shares of the funds to insurance companies for their variable annuity and variable life insurance contracts.
At December 31, 2011, the Trust consisted of fifty-seven separate funds. This report covers the Dorsey Wright & Associates, Inc. (“DWA”) Funds (the “Funds”), while the other funds are contained in separate reports.
Guggenheim Investments (“GI”) provides advisory services, and Rydex Fund Services, LLC (“RFS”) provides transfer agent, administrative, and accounting services to the Trust. Rydex Distributors, LLC (“RDL”) acts as principal underwriter for the Trust. GI, RFS and RDL are affiliated entities.
Each Fund, a “fund of funds,” seeks to achieve its investment objective by investing primarily in a portfolio of exchange-traded funds (“ETFs”) (“underlying funds”) or other exchange-traded products (“ETPs”) to allocate its investment exposure to market segments, including domestic equity, international equity, fixed income and alternative assets.
GI makes investment decisions for the assets of the Funds based on investment management strategies generated by Dorsey Wright (the “Sub-Adviser”), and continuously reviews, supervises, and administers each Funds’ investment program. The Board of Trustees of the Trust supervises GI and establishes policies that GI must follow in its day-to-day management activities.
Effective November 14, 2011, Dorsey Wright underwent a change of control that terminated the agreement between Dorsey Wright and GI. Accordingly, GI now directly manages the Funds.
Significant Accounting Policies
The following significant accounting policies are in conformity with U.S. generally accepted accounting principles and are consistently followed by the Trust. This requires management to make estimates and assumptions that affect the reported amount of assets and liabilities and disclosure of contingent assets and liabilities at the date of the financial statements and the reported amounts of revenues and expenses during the reporting period. Actual results could differ from these estimates. All time references are based on Eastern Time.
A. Open-end investment companies (“Mutual Funds”) are valued at their NAV as of the close of business on the valuation date. Exchange Traded Funds (“ETFs”) and closed-end investment companies are valued at the last quoted sales price.
Equity securities listed on an exchange (New York Stock Exchange (“NYSE”) or American Stock Exchange) are valued at the last quoted sales price as of the close of business on the NYSE on the valuation date. Equity securities listed on the NASDAQ market system are valued at the NASDAQ Official Closing Price on the valuation date.
Short-term debt securities with a maturity of 60 days or less at acquisition and repurchase agreements are valued at amortized cost, which approximates market value.
Investments for which market quotations are not readily available are fair valued as determined in good faith by GI under the direction of the Board of Trustees using methods established or ratified by the Board of Trustees. These methods include, but are not limited to: (i) using general information as to how these securities and assets trade; and (ii) using other information and considerations, including current values in related markets.
B. Security transactions are recorded on the trade date for financial reporting purposes. Realized gains and losses from securities transactions are recorded using the identified cost basis. Proceeds from lawsuits related to investment holdings are recorded as realized gains. Dividend income is recorded on the ex-dividend date, net of applicable taxes withheld by foreign countries. Taxable non-cash dividends are recorded as dividend income. Interest income, including amortization of premiums and accretion of discount, is accrued on a daily basis.
C. Distributions of net investment income and net realized gains, if any, are declared and paid at least annually. Distributions are recorded on the ex-dividend date and are determined in accordance with income tax regulations which may differ from U.S. generally accepted accounting principles.
D. The Funds may leave cash overnight in their cash account with the custodian, U.S. Bank. Periodically, a Fund may have cash due to the custodian bank as an overdraft balance. A fee is incurred on this overdraft, calculated by multiplying the overdraft by a rate based on the federal funds rate.
| 18 | THE GUGGENHEIM FUNDSANNUALREPORT |
NOTES TO FINANCIAL STATEMENTS (continued)
E. Throughout the normal course of business, the Funds enter into contracts that contain a variety of representations and warranties which provide general indemnifications. The Funds’ maximum exposure under these arrangements is unknown, as this would involve future claims that may be made against the Funds and/or their affiliates that have not yet occurred. However, based on experience, the Funds expect the risk of loss to be remote.
| 2. | Financial Instruments |
The Funds invest to a significant extent in shares of ETFs to gain exposure to their investment objectives. ETFs are pooled investment vehicles, which may be managed or unmanaged, that generally seek to track the performance of a specific index. Although individual shares of an ETF are traded on an exchange (such as the NYSE, AMEX, or NASDAQ), large blocks of shares of ETFs are redeemable at net asset value. This ability to redeem large blocks of shares has historically resulted in the market price of individual shares of ETFs being at or near the net asset value of the ETF’s underlying investments. However, shares of ETFs may trade below their NAV. The NAV of shares will fluctuate with changes in the market value of the ETF’s holdings. The trading prices of shares will fluctuate in accordance with changes in NAV as well as market supply and demand. The difference between the bid price and ask price, commonly referred to as the “spread,” will also vary for an ETF depending on the ETF’s trading volume and market liquidity. Generally, the greater the trading volume and market liquidity, the smaller the spread is and vice versa. Any of these factors may lead to an ETF’s shares trading at a premium or a discount to NAV. The Funds, from time to time, may invest in ETFs that are not registered pursuant to the Investment Company Act of 1940. Such ETFs may include commodity pools that are registered pursuant to the Securities Act of 1933 and the Commodity Exchange Act.
| 3. | Fees and Other Transactions with Affiliates |
Under the terms of an investment advisory contract, the Trust pays GI investment advisory fees calculated at an annual percentage rate of 1.00% of the average daily net assets of each Fund.
GI pays the Sub-Advisor out of the advisory fees it receives. In addition, GI bears all of its own costs associated with providing these services and the expenses of the Trustees that are affiliated with GI. GI may make payments from its own resources to broker-dealers and other financial institutions in connection with the sale of Fund shares.
Each Fund indirectly bears a proportionate share of the total operating expenses (including investment management, shareholder servicing, custody, transfer agency, audit and other expenses) of the underlying funds in which the Fund invests.
RFS provides transfer agent and administrative services to the Funds for fees calculated at an annual percentage rate of 0.25% of the average daily net assets of each Fund.
RFS also provides accounting services to the Funds for fees calculated at annualized rates below, based on the average daily net assets of each Fund.
Fund Accounting | (as a % of net assets) | |||
On the first $250 million | 0.10 | % | ||
On the next $250 million | 0.075 | % | ||
On the next $250 million | 0.05 | % | ||
Over $750 million | 0.03 | % | ||
RFS engages external service providers to perform other necessary services for the Trust, such as audit related services, legal services, printing and mailing, etc., on a pass-through basis. Such expenses are allocated to various funds within the complex based on relative net assets.
The Trust has adopted an Investor Services Plan for which RDL and other firms that provide investor services (“Service Providers”) may receive compensation. The Funds will pay investor service fees to RDL at an annual rate not to exceed 0.25% of average daily net assets. RDL, in turn, will compensate Service Providers for providing such services, while retaining a portion of such payments to compensate itself for investor services it performs.
Certain officers and trustees of the Trust are also officers of GI, RFS and RDL.
| 4. | Fair Value Measurement |
In accordance with U.S. generally accepted accounting principles, fair value is defined as the price that the Fund would receive to sell an investment or pay to transfer a liability in an orderly transaction with an independent buyer in the principal market, or in the absence of a principal market the most advantageous market for the investment or liability. A three-tier hierarchy is utilized to distinguish between (1) inputs that reflect the assumptions market participants would use in pricing an asset or liability developed based on market data obtained from sources independent of the reporting entity (observable inputs) and (2) inputs that reflect the reporting entity’s own assumptions about the assumptions market participants would use in pricing an asset or liability developed
| THE GUGGENHEIM FUNDSANNUALREPORT | 19 |
NOTES TO FINANCIAL STATEMENTS (continued)
based on the best information available in the circumstances (unobservable inputs) and to establish classification of fair value measurements for disclosure purposes. Various inputs are used in determining the value of the Funds’ investments. The inputs are summarized in the three broad levels listed below:
| Level 1 | — | quoted prices in active markets for identical securities. | ||
| Level 2 | — | other significant observable inputs (including quoted prices for similar securities, interest rates, prepayment speeds, credit risk, etc.). | ||
| Level 3 | — | significant unobservable inputs (including the fund’s own assumptions used to determine the fair value of investments). | ||
The inputs or methodologies used for valuing securities are not necessarily an indication of the risk associated with investing in those securities.
The following table summarizes the inputs used to value the Funds’ net assets at December 31, 2011:
| Level 1 Investments In Securities | Level 2 Investments In Securities | Level 3 Investments In Securities | Total | |||||||||||||
Assets | ||||||||||||||||
DWA Flexible Allocation Fund | $ | 16,879,593 | $ | 374,749 | $ | — | $ | 17,254,342 | ||||||||
DWA Sector Rotation Fund | 23,594,114 | 158,868 | — | 23,752,982 | ||||||||||||
For the year ended December 31, 2011, there were no transfers between levels.
| 5. | Repurchase Agreements |
The Funds transfer uninvested cash balances into a single joint account, the daily aggregate balance of which is invested in one or more repurchase agreements collateralized by obligations of the U.S. Treasury and U.S. Government Agencies. The collateral is in the possession of the Funds’ custodian and is evaluated to ensure that its market value exceeds, at a minimum, 102% of the original face amount of the repurchase agreements. Each Fund holds a pro rata share of the collateral based on the dollar amount of the repurchase agreement entered into by each Fund.
At December 31, 2011, the collateral for the repurchase agreements in the joint account was as follows:
Counterparty and Terms of Agreement | Face Value | Repurchase Price | Collateral | Par Value | Fair Value | |||||||||||||
Mizuho Financial Group, Inc. | U.S. Treasury Notes | |||||||||||||||||
0.00% | 0.25% - 1.50% | |||||||||||||||||
Due 01/03/12 | $ | 54,060,482 | $ | 54,060,482 | 10/31/13 - 07/31/16 | $ | 53,866,200 | $ | 55,141,700 | |||||||||
Credit Suisse Group | U.S. Treasury Note | |||||||||||||||||
0.00% | 1.75% | |||||||||||||||||
Due 01/03/12 | 51,750,000 | 51,750,000 | 05/31/16 | 50,371,400 | 52,785,030 | |||||||||||||
HSBC Group | U.S. Treasury STRIPS | |||||||||||||||||
0.00% | 0.00% | |||||||||||||||||
Due 01/03/12 | 51,750,000 | 51,750,000 | 02/15/13 - 05/15/14 | 52,817,100 | 52,679,331 | |||||||||||||
| U.S. Treasury Note | ||||||||||||||||||
| 2.63% | ||||||||||||||||||
| 06/30/14 | 100,000 | 105,740 | ||||||||||||||||
Deutsche Bank | U.S. Treasury Note | |||||||||||||||||
0.00% | 2.63% | |||||||||||||||||
Due 01/03/12 | 51,750,000 | 51,750,000 | 11/15/20 | 48,930,100 | 52,785,053 | |||||||||||||
In the event of counterparty default, the Funds have the right to collect the collateral to offset losses incurred. There is potential loss to the Funds in the event the Funds are delayed or prevented from exercising their rights to dispose of the collateral securities, including the risk of a possible decline in the value of the underlying securities during the period while the Funds seek to assert their rights. The Funds’ investment advisor, acting under the supervision of the Board of Trustees, reviews the value of the collateral and the creditworthiness of those banks and dealers with which the Funds enter into repurchase agreements to evaluate potential risks.
| 20 | THE GUGGENHEIM FUNDSANNUALREPORT |
NOTES TO FINANCIAL STATEMENTS (continued)
| 6. | Federal Income Tax Information |
The Funds intend to comply with the provisions of Subchapter M of the Internal Revenue Code applicable to regulated investment companies and distribute substantially all taxable net investment income and capital gains sufficient to relieve it from all or substantially all, federal income, excise and state income taxes. Therefore, no provision for federal or state income tax is required.
Tax positions taken or expected to be taken in the course of preparing the Funds’ tax returns are evaluated to determine whether the tax positions are “more-likely-than-not” of being sustained by the applicable tax authority. Tax positions not deemed to meet the more-likely-than-not threshold would be recorded as a tax benefit or expense in the current year. Management has analyzed the Funds’ tax positions taken on Federal income tax returns for all open tax years (fiscal years 2008-2011), and has concluded that no provision for income tax is required in the Funds’ financial statements.
The RIC Modernization Act of 2010 was signed into law on December 22, 2010 and seeks to simplify some of the tax provisions applicable to regulated investment companies and the tax reporting to their shareholders, and to improve the tax efficiency of certain fund structures. The changes are generally effective for taxable years beginning after the date of enactment.
One of the most prominent changes addresses capital loss carryforwards. Funds will be permitted to carryforward capital losses incurred in taxable years beginning after December 22, 2010 for an unlimited period. However, any losses incurred during those future taxable years will be required to be utilized prior to the losses incurred in pre-enactment taxable years. Under pre-enactment law, capital losses could be carried forward for eight years, and carried forward as short-term capital, irrespective of the character of the original loss. As a result of this ordering rule, pre-enactment capital loss carryforwards may potentially expire unused. Additionally, post-enactment capital losses that are carried forward will retain their character as either short-term or long-term capital losses rather than being considered all short-term as under previous law.
Tax basis capital losses in excess of capital gains are carried forward to offset future net capital gains. For the year ended December 31, 2011, the following capital loss carryforward amounts expired, were used, or were permanently lost due to loss limitation rules in Section 382 of the Internal Revenue Code:
Fund | Amount | |||
DWA Sector Rotation Fund | $ | 667,967 | ||
The tax character of distributions paid during 2011 was as follows:
Fund | Ordinary Income | Long-Term Capital Gain | Total Distributions | |||||||||
DWA Flexible Allocation Fund | $ | 266,145 | $ | 241,212 | $ | 507,357 | ||||||
DWA Sector Rotation Fund | 42,734 | — | 42,734 | |||||||||
The tax character of distributions paid during 2010 was as follows:
Fund | Ordinary Income | Long-Term Capital Gain | Total Distributions | |||||||||
DWA Flexible Allocation Fund | $ | — | $ | — | $ | — | ||||||
DWA Sector Rotation Fund | — | — | — | |||||||||
Note: For federal income tax purposes, short term capital gain distributions are treated as ordinary income distributions. The tax character of distributable earnings/(accumulated losses) at December 31, 2011, was as follows:
Fund | Undistributed Ordinary Income | Undistributed Long-Term Capital Gain | Net Unrealized Appreciation (Depreciation) | Capital Loss Carryforward | ||||||||||||
DWA Flexible Allocation Fund | $ | — | $ | — | $ | (563,043 | ) | $ | (809,677 | )1 | ||||||
DWA Sector Rotation Fund | — | — | 384,629 | (1,179,934 | )1 | |||||||||||
| 1 | A summary of the expiration of the aforementioned capital loss carryforward is as follows: |
| THE GUGGENHEIM FUNDSANNUALREPORT | 21 |
NOTES TO FINANCIAL STATEMENTS (continued)
Capital loss carryforward amounts may be limited due to Federal income tax regulations.
| Expires in | Unlimited | Total Capital Loss | ||||||||||||||
Fund | 2018 | Short Term | Long Term | Carryforward | ||||||||||||
DWA Flexible Allocation Fund | $ | — | $ | (804,359 | ) | $ | (5,318 | ) | $ | (809,677 | ) | |||||
DWA Sector Rotation Fund | (1,179,934 | ) | — | — | (1,179,934 | ) | ||||||||||
Net investment income and net realized gains (losses) may differ for financial statement and tax purposes because of temporary or permanent book/tax differences. These differences are primarily due to post-October losses, losses deferred due to wash sales, foreign currency gains and losses, and the “mark-to-market” of certain passive foreign investment companies (PFICs) for tax purposes. Additional differences may result from tax treatment of net investment losses and expired capital loss carryforwards. To the extent these differences are permanent, reclassifications are made to the appropriate equity accounts in the period that the differences arise. These reclassifications have no effect on net assets or NAV per share.
On the Statements of Assets and Liabilities, the following reclassifications were made for permanent book/tax differences:
Fund | Paid In Capital | Undistributed Net Investment Income | Accumulated Net Realized Gain (Loss) | |||||||||
DWA Flexible Allocation Fund | $ | (208,837 | ) | $ | (181,867 | ) | $ | 390,704 | ||||
DWA Sector Rotation Fund | (238,897 | ) | 238,897 | — | ||||||||
At December 31, 2011, the cost of securities for Federal income tax purposes, the aggregate gross unrealized gain for all securities for which there was an excess of value over tax cost and the aggregate gross unrealized loss for all securities for which there was an excess of tax cost over value, were as follows:
Fund | Tax Cost | Tax Unrealized Gain | Tax Unrealized Loss | Net Unrealized Gain (Loss) | ||||||||||||
DWA Flexible Allocation Fund | $ | 17,817,384 | $ | 92,642 | $ | (655,685 | ) | $ | (563,043 | ) | ||||||
DWA Sector Rotation Fund | 23,368,353 | 461,044 | (76,415 | ) | 384,629 | |||||||||||
| 7. | Securities Transactions |
For the year ended December 31, 2011, the cost of purchases and proceeds from sales of investment securities, excluding short-term investments, were:
| Purchases | Sales | |||||||
DWA Flexible Allocation Fund | $ | 71,747,090 | $ | 73,190,912 | ||||
DWA Sector Rotation Fund | 94,696,900 | 104,688,886 | ||||||
| 8. | Affiliated Transactions |
Investments representing 5% or more of the outstanding voting shares of a portfolio company of a fund, or control of or by, or common control under GI, result in that portfolio company being considered an affiliated company of such fund, as defined in the 1940 Act. Transactions during the year ended December 31, 2011 in which the portfolio company is an “affiliated person” are as follows:
Fund | Security | Value 12/31/10 | Additions | Reductions | Value 12/31/11 | Shares 12/31/11 | Investment Income | |||||||||||||||||||
DWA Sector | ||||||||||||||||||||||||||
Rotation Fund | Exchange Traded Funds: | |||||||||||||||||||||||||
PowerShares Dynamic Leisure & Entertainment Portfolio | $ | 3,715,481 | $ | 155,388 | $ | 3,978,729 | $ | — | — | $ | — | |||||||||||||||
PowerShares Dynamic Semiconductors Portfolio | 2,888,868 | 327,443 | 3,296,831 | — | — | — | ||||||||||||||||||||
SPDR S&P International Materials Sector ETF | 3,712,800 | 171,797 | 3,909,159 | — | — | 2,828 | ||||||||||||||||||||
SPDR S&P International Consumer Discretionary Sector ETF | 3,684,897 | 195,577 | 4,122,646 | — | — | 9,955 | ||||||||||||||||||||
SPDR S&P International Industrials Sector ETF | 3,702,561 | 23,090 | 3,517,337 | — | — | — | ||||||||||||||||||||
PowerShares Dynamic Consumer Staples Sector Portfolio | — | 3,895,097 | 1,578,537 | 2,464,175 | 79,183 | 23,002 | ||||||||||||||||||||
PowerShares Dynamic Utilities Portfolio | — | 5,525,946 | 2,989,263 | 2,398,652 | 147,613 | 44,302 | ||||||||||||||||||||
PowerShares Dynamic Retail Portfolio | — | 2,242,926 | 28,828 | 2,249,670 | 102,444 | 7,629 | ||||||||||||||||||||
|
|
|
|
|
|
|
|
|
|
|
| |||||||||||||||
Total | $ | 17,704,607 | $ | 12,537,264 | $ | 23,421,330 | $ | 7,112,497 | 329,240 | $ | 87,716 | |||||||||||||||
| 22 | THE GUGGENHEIM FUNDSANNUALREPORT |
NOTES TO FINANCIAL STATEMENTS (concluded)
| 9. | Line of Credit |
The Trust, along with other affiliated trusts, has secured an uncommitted, $75,000,000 line of credit with U.S. Bank, N.A. for emergency or temporary purposes. Borrowings, if any, under this arrangement bear interest equal to the Prime Rate, minus 2%, which shall be paid monthly, averaging 1.25% for the year ended December 31, 2011. At December 31, 2011, the Funds did not have any borrowings under this agreement, which expires on June 15, 2012, but the following table illustrates average daily balances borrowed:
Fund | Average Daily Balance | |||
DWA Flexible Allocation Fund | $ | 1,441 | ||
DWA Sector Rotation Fund | 80,540 | |||
| THE GUGGENHEIM FUNDSANNUALREPORT | 23 |
REPORT OF INDEPENDENT REGISTERED PUBLIC
ACCOUNTING FIRM
To the Board of Trustees and Shareholders
of the Rydex Variable Trust:
We have audited the accompanying statements of assets and liabilities, including the schedules of investments, of DWA Flexible Allocation Fund and DWA Sector Rotation Fund (two of the series constituting the Rydex Variable Trust) (the “Funds”) as of December 31, 2011, and the related statements of operations for the year then ended, and statements of changes in net assets and financial highlights for the year then ended and for the period from April 28, 2010 (commencement of operations) through December 31, 2010. These financial statements and financial highlights are the responsibility of the Funds’ management. Our responsibility is to express an opinion on these financial statements and financial highlights based on our audits.
We conducted our audits in accordance with the standards of the Public Company Accounting Oversight Board (United States). Those standards require that we plan and perform the audit to obtain reasonable assurance about whether the financial statements and financial highlights are free of material misstatement. We were not engaged to perform an audit of the Funds’ internal control over financial reporting. Our audits included consideration of internal control over financial reporting as a basis for designing audit procedures that are appropriate in the circumstances, but not for the purpose of expressing an opinion on the effectiveness of the Funds’ internal control over financial reporting. Accordingly, we express no such opinion. An audit also includes examining, on a test basis, evidence supporting the amounts and disclosures in the financial statements and financial highlights, assessing the accounting principles used and significant estimates made by management, as well as evaluating the overall financial statement presentation. Our procedures included confirmation of securities owned as of December 31, 2011, by correspondence with the custodian and brokers or by other appropriate auditing procedures where replies from brokers were not received. We believe that our audits provide a reasonable basis for our opinion.
In our opinion, the financial statements and financial highlights referred to above present fairly, in all material respects, the financial position of the above listed Funds at December 31, 2011, the results of their operations for the year then ended, and the changes in their net assets and their financial highlights for the year then ended and for the period from April 28, 2010 (commencement of operations) through December 31, 2010, in conformity with U.S. generally accepted accounting principles.

McLean, Virginia
February 28, 2012
| 24 | THE GUGGENHEIM FUNDSANNUALREPORT |
Tax Information
This information is being provided as required by the Internal Revenue Code. Amounts shown may differ from those elsewhere in the report because of differences in tax and financial reporting practice.
Of the ordinary income distributions paid during the year, the following funds had the corresponding percentages qualify for the dividends received deduction for corporations:
Fund | % Qualifying | |||
DWA Flexible Allocation Fund | 0 | % | ||
DWA Sector Rotation Fund | 0 | % | ||
With respect to the taxable year ended December 31, 2011, the Funds hereby designate as capital gain dividends the amounts listed below, or, if subsequently determined to be different, the net capital gain of such year:
| DWA Flexible Allocation Fund | ||||
From long-term capital gains, subject to the 15% rate gains category: | $ | 241,212 | ||
Proxy Voting Information
A description of the policies and procedures that the Trust uses to determine how to vote proxies relating to securities held in the Funds’ portfolios is available, without charge and upon request, by calling 1.800.820.0888. This information is also available from the EDGAR database on the SEC’s website at http://www.sec.gov.
Information regarding how the Funds voted proxies relating to portfolio securities during the most recent 12-month period ended June 30 is available without charge, upon request, by calling 1.800.820.0888. The proxy statement information is also available from the EDGAR database on the SEC’s website at http://www.sec.gov.
At a special meeting of shareholders held on November 22, 2011, the shareholders of the Trust voted on whether to approve a new investment advisory agreement between Rydex Variable Trust and Security Investors, LLC. A description of the number of shares voted is as follows:
Fund | Shares For | Shares Against | Shares Abstained | |||||||||
DWA Flexible Allocation Fund | 902,529 | 3,211 | 2,556 | |||||||||
DWA Sector Rotation Fund | 1,159,528 | — | 34,334 | |||||||||
At a special meeting of shareholders held on November 22, 2011, the shareholders of the Funds voted to approve a new sub-advisory agreement between Security Investors, LLC and Dorsey, Wright & Associates, Inc. A description of the number of shares voted is as follows:
Fund | Shares For | Shares Against | Shares Abstained | |||||||||
DWA Flexible Allocation Fund | 902,529 | 3,211 | 2,556 | |||||||||
DWA Sector Rotation Fund | 1,114,857 | 2,192 | 76,813 | |||||||||
At a special meeting of shareholders held on November 22, 2011, the shareholders of the Trust also approved the election of nominees to the Board of Trustees. A description of the number of shares voted is as follows:
Donald C. Cacciapaglia | Corey A. Colehour | J. Kenneth Dalton | ||||||||
For | 343,022,995 | For | 339,263,789 | For | 342,726,825 | |||||
Withhold | 18,549,008 | Withhold | 22,308,214 | Withhold | 18,845,178 | |||||
Total | 361,572,003 | Total | 361,572,003 | Total | 361,572,003 | |||||
John O. Demaret | Richard M. Goldman | Werner E. Keller | ||||||||
For | 338,940,641 | For | 342,766,477 | For | 342,532,565 | |||||
Withhold | 22,631,362 | Withhold | 18,805,526 | Withhold | 19,039,438 | |||||
Total | 361,572,003 | Total | 361,572,003 | Total | 361,572,003 | |||||
Thomas F. Lydon | Patrick T. McCarville | Roger Somers | ||||||||
For | 343,159,833 | For | 339,367,739 | For | 343,007,265 | |||||
Withhold | 18,412,170 | Withhold | 22,204,264 | Withhold | 18,564,738 | |||||
Total | 361,572,003 | Total | 361,572,003 | Total | 361,572,003 | |||||
At a special meeting of shareholders held on November 22, 2011, the shareholders of the Funds also approved a “manager of managers” arrangement for each of the Funds. A description of the number of shares voted is as follows:
Fund | Shares For | Shares Against | Shares Abstained | |||||||||
DWA Flexible Allocation Fund | 875,915 | 6,946 | 25,435 | |||||||||
DWA Sector Rotation Fund | 1,159,528 | — | 34,334 | |||||||||
| THE GUGGENHEIM FUNDSANNUALREPORT | 25 |
OTHER INFORMATION (Unaudited) (continued)
Quarterly Portfolio Schedules Information
The Trust files its complete schedule of portfolio holdings with the SEC for the first and third quarters of each fiscal year on Form N-Q; which are available on the SEC’s website at http://www.sec.gov. The Funds’ Forms N-Q may be reviewed and copied at the SEC’s Public Reference Room in Washington, DC, and that information on the operation of the Public Reference Room may be obtained by calling 1-800-SEC-0330. Copies of the portfolio holdings are also available to shareholders, without charge and upon request, by calling 1.800.820.0888.
Office Locations
The offices of Guggenheim Investments can be found in the following locations:
40 East 52nd Street
16th Floor
New York, NY 10022
(Headquarters)
Four Irvington Centre
805 King Farm Boulevard
Suite 600
Rockville, MD 20850
9401 Indian Creek Parkway
40 Corporate Woods
Suite 850
Overland Park, KS 66210
Guggenheim Transaction
On September 20, 2011, Guggenheim Capital, LLC agreed to purchase the indirect holding company of Security Investors, LLC, the Fund’s investment manager (the “Investment Manager”) (the “Transaction”). Guggenheim Capital, LLC’s subsidiary, Guggenheim Partners, LLC (“Guggenheim”), is a global, independent, privately-held, diversified financial services firm with more than 1,500 dedicated professionals.
The Transaction should not result in material changes to the day-to-day management and operation of the Fund or any increase in fees. The parties expect the Transaction to be completed in early 2012. However, it is subject to various conditions, and could be delayed or even terminated due to unforeseen circumstances.
In anticipation of the Transaction, the Board of Trustees of the Funds (the “Board”) called a special meeting of shareholders (the “Meeting”), at which shareholders of the Fund of record as of October 3, 2011 were asked to consider the approval of a new investment management agreement between the Funds and the Investment Manager (the “New Agreement”). This approval was necessary because, under the Investment Company Act of 1940 (the “1940 Act”), the Transaction could have resulted in the termination of the Funds’ current investment management agreement with the Investment Manager (the “Current Agreement”). The Funds’ shareholders approved the New Agreement, the terms of which are substantially identical to the corresponding Current Agreement, except with respect to the date of execution, and the New Agreement will take effect if the Transaction is completed.
Election of Board Members
The Board also approved a proposal to elect nine individuals to the Board. The Board proposed the election of the following nominees: Donald C. Cacciapaglia, Corey A. Colehour, J. Kenneth Dalton, John O. Demaret, Richard M. Goldman, Werner E. Keller, Thomas F. Lydon, Patrick T. McCarville and Roger Somers. Each of the nominees, other than Mr. Cacciapaglia, currently serves as a Trustee. In connection with the Transaction, the Board believes that expanding the Board to include Mr. Cacciapaglia, who is a member of senior management of Guggenheim’s investment management business, and who would serve on other board in the Guggenheim Investments family of funds, would be appropriate. The Trusts’ shareholders ultimately approved the aforementioned proposal.
Board Considerations in Approving the Investment Advisory and Investment Sub-Advisory Agreements
At an in-person meeting of the Trust’s Board of Trustees held August 16-17, 2011, called for the purpose of, among other things, voting on the approval of investment advisory agreements applicable to the series of the Trust, the Trust’s Board of Trustees, including the independent Trustees, unanimously approved the investment advisory agreement between the Trust and Security Investors, LLC (referred to herein as the “Adviser”) and the investment sub-advisory agreement between the Adviser and Dorsey Wright & Associates, Inc. (“DWA”) with respect to the DWA Flexible Allocation Fund and DWA Sector Rotation Fund (the “Funds”).
| 26 | THE GUGGENHEIM FUNDSANNUALREPORT |
OTHER INFORMATION (Unaudited) (continued)
At the meeting of August 16-17, 2011, the Trust’s Board of Trustees also considered new investment advisory and investment sub-advisory agreements that were required as a result of a proposed change in the corporate ownership structure of the Adviser (the “Transaction”). The Investment Company Act of 1940 (the “1940 Act”), the law that regulates mutual funds, including the Funds, requires that a fund’s investment advisory agreement terminate whenever there is deemed to be a “change in control” of the investment adviser. The change in the corporate ownership structure of the Adviser could potentially be deemed to constitute a “change in control” (as this term is used for regulatory purposes) of the Adviser. Before an investment advisory agreement terminates, a new investment advisory agreement must be in effect in order for the investment adviser to continue to manage the fund’s investments. For that reason, the Board of Trustees was asked to approve new investment advisory agreements for the Funds and a new investment sub-advisory agreement for each of the DWA Flexible Allocation Fund and DWA Sector Rotation Fund.
At the meeting of August 16-17, 2011, the Board considered the new investment advisory and investment sub-advisory agreements, pursuant to which, subject to approval by each Fund’s shareholders of the new agreements, the Adviser would continue to serve each Fund as investment adviser (and DWA would continue to serve as sub-investment adviser to DWA Flexible Allocation Fund and DWA Sector Rotation Fund) after the completion of the Transaction. At a special meeting of the Board held on September 14, 2011, the Board considered further information about the Transaction and voted in favor of the new investment advisory agreement and new investment sub-advisory agreement.
In reaching the conclusion to approve the new investment advisory and investment sub-advisory agreements, the Trustees requested and obtained from the Adviser such information as the Trustees deemed reasonably necessary to evaluate the proposed agreements. The Trustees carefully evaluated this information and were advised by legal counsel with respect to their deliberations.
Prior to the Board meetings in August and September 2011, representatives of Guggenheim Capital informed the Board of the Transaction. With respect to the Transaction, the Board reviewed materials received from Guggenheim Capital, including information relating to the terms of the Transaction. The Board also reviewed information regarding Guggenheim Capital, including, but not limited to: (a) certain representations concerning Guggenheim Capital’s financial condition, (b) information regarding the new proposed ownership structure and its possible effect on shareholders, (c) information regarding the consideration to be paid by Guggenheim Capital, and (d) potential conflicts of interest.
In considering the new investment advisory and investment sub-advisory agreements, the Board determined that the agreements would enable shareholders of the Funds to continue to obtain high quality services at a cost that is appropriate, reasonable, and in the best interests of their shareholders. The Board, including the independent Trustees, unanimously approved the new agreements. In reaching their decision, the Trustees carefully considered information that they had received throughout the year as part of their regular oversight of the Funds, including, in particular, information from the Adviser and DWA (collectively, the “Advisers”) that the Board had received relating to the current investment advisory and investment sub-advisory agreements at the Board meeting of August 16-17, 2011. The Trustees noted that, at the meeting, they had obtained and reviewed a wide variety of information, including certain comparative information regarding performance of the Funds relative to performance of other comparable mutual funds. They also considered the evolution of the Rydex|SGI family of funds and the Adviser since the change in control of the Investment Adviser in 2010 and Guggenheim Capital’s commitment to the success of the Adviser and the Funds.
In addition, as a part of their required consideration of the renewal of the current investment advisory and investment sub-advisory agreements at the meeting of August 16-17, 2011, the Trustees, including the independent Trustees, had evaluated a number of considerations, including among others: (a) the quality of the Advisers’ investment advisory and other services; (b) the Advisers’ investment management personnel; (c) the Advisers’ operations and financial condition; (d) the Advisers’ brokerage practices (including any soft dollar arrangements) and investment strategies; (e) the level of the fees that the Adviser charges compared with the fees charged to comparable mutual funds or accounts; (f) each Fund’s overall fees and operating expenses compared with similar mutual funds; (g) the level of the Adviser’s profitability from its Fund-related operations; (h) the Advisers’ compliance systems; (i) the Advisers’ policies on and compliance procedures for personal securities transactions; (j) the Advisers’ reputation, expertise and resources in the financial markets; and (k) Fund performance compared with similar mutual funds. Based on the Board’s deliberations at the meetings of August 16-17, 2011 and September 14, 2011, and its evaluation of the information regarding the Transaction and the fact that the Transaction is not expected to change the level and quality of services rendered by the Advisers to any of the Funds, the Board, including all of the independent Trustees, unanimously: (a) concluded that terms of the current and new investment advisory and investment sub-advisory agreements are fair and reasonable; (b) concluded that the Advisers’ fees were reasonable in light of the services provided to the Funds; and (c) agreed to approve the current investment advisory and investment sub-advisory agreements and, subject to shareholder approval, the new investment advisory and investment sub-advisory agreements, based upon the following considerations, among others:
| THE GUGGENHEIM FUNDSANNUALREPORT | 27 |
OTHER INFORMATION (Unaudited) (concluded)
| • | Nature, Extent and Quality of Services Provided by the Advisers. At the meeting of August 16-17, 2011, the Board reviewed the scope of services to be provided by the Advisers under the current investment advisory and investment sub-advisory agreements, and, at the meetings of August 16-17, 2011 and September 14, 2011, noted that there would be no significant differences between the scope of services required to be provided by the Advisers under the current investment advisory and investment sub-advisory agreements and the scope of services required to be provided by the Advisers under the new investment advisory and investment sub-advisory agreements. The Board noted that the key investment and management personnel of the Advisers servicing the Funds are expected to remain the same following the Transaction. The Trustees also considered Guggenheim Capital’s representations to the Board that the Adviser would continue to provide investment and related services that were of materially the same quality and quantity as services provided to the Funds in the past, and that these services are appropriate in scope and extent in light of the Funds’ operations, the competitive landscape of the investment company business and investor needs. |
| • | Fund Expenses and Performance of the Funds. At the meeting of August 16-17, 2011, the Board had reviewed statistical information prepared by the Adviser regarding the expense ratio components and performance of each Fund. Based on the representations made by Guggenheim Capital at the meeting that the Adviser would continue to operate following the closing of the Transaction in much the same manner as it currently operates, the Board concluded that the investment performance of the Adviser was not expected to be affected by the Transaction. |
| • | Costs of Services Provided to the Funds and Profits Realized by the Adviser and its Affiliates. At the meeting of August 16-17, 2011, the Board had reviewed information about the profitability of the Funds to the Adviser based on the advisory fees payable under the current investment advisory and investment sub-advisory agreements. At that meeting, the Board had also analyzed the Funds’ expenses, including the investment advisory fees paid to the Advisers. The Board also had reviewed reports comparing the expense ratios to those of other comparable mutual funds. At the Board meeting, the Board considered the fact that the fee rates payable to the Advisers would be the same under each Fund’s new investment advisory and investment sub-advisory agreements as they are under such Fund’s current agreements. With respect to anticipated profitability, the Board noted that it was too early to predict how the Transaction would affect the Adviser’s profitability with respect to the Funds, but noted that this matter would be given further consideration on an ongoing basis. |
| • | Economies of Scale. In connection with its review of the Funds’ profitability analysis at the meeting of August 16-17, 2011, the Board reviewed information regarding economies of scale or other efficiencies that may result from increases in the Funds’ asset levels. The Trustees noted that the fees would not change under the new investment advisory and investment sub-advisory agreements, and that no additional economies of scale would be directly realized as a result of the Transaction. They also noted that they will have the opportunity to again review the appropriateness of the fees payable to the Advisers under the new agreements when the renewal of the new agreements next comes before the Board. |
| • | Other Benefits to the Advisers and/or their Affiliates. In addition to evaluating the services provided by the Advisers, the Board had considered the nature, extent, quality and cost of the distribution services performed by the Funds’ Distributor under a separate agreement at the meeting of August 16-17, 2011. The Board reviewed information regarding potential economies of scale arising from the integration of the asset management businesses of Guggenheim Capital. The Board also considered the terms of the Transaction and the changes to the corporate ownership structure of the Adviser, noting that the Adviser would no longer be a subsidiary of Security Benefit Corporation. In this regard, the Board noted that, under the corporate structure after the Transaction, the Adviser would be more closely controlled by Guggenheim Capital, which could benefit Guggenheim Capital. The Board also noted that the costs associated with the Transaction would be borne by Guggenheim Capital (or its affiliates) and not the Funds. |
On the basis of the information provided to it and its evaluation of that information, the Board, including the independent Trustees, concluded that the terms of the investment advisory and investment sub-advisory agreements for the Funds were reasonable, and that approval of the current and new investment advisory and investment sub-advisory agreements were in the best interests of the Funds. On or about November 14, 2011, the Advisor began directly managing the Funds and DWA stopped serving as sub-adviser to the Funds. The Advisor entered into a licensing agreement with DWA permitting it to use the same technical models currently used in managing the Funds. The termination of DWA as investment sub-adviser to the Funds did not affect the Funds’ respective investment objectives, principal investment strategies, or fees and expenses.
| 28 | THE GUGGENHEIM FUNDSANNUALREPORT |
INFORMATION ON BOARD OF TRUSTEES AND OFFICERS (Unaudited)
A Board of Trustees oversees the Trust, as well as other trusts of Guggenheim Investments, in which its members have no stated term of service, and continue to serve after election until resignation. The Statement of Additional Information includes further information about Fund Trustees and Officers, and can be obtained without charge by calling 800.820.0888.
All Trustees and Officers may be reached c/o Guggenheim Investments, 805 King Farm Boulevard, Suite 600, Rockville, MD 20850.
INDEPENDENT TRUSTEES
Name, Position and Year of Birth | Length of Service As Trustee (Year Began) | Number of Funds Overseen | ||
Corey A. Colehour Trustee (1945) | Rydex Series Funds – 1993 Rydex Variable Trust – 1998 Rydex Dynamic Funds – 1999 Rydex ETF Trust – 2003 | 150 |
Principal Occupations During Past Five Years: Retired; Member of the Audit, Governance and Nominating Committees (1995 to present)
J. Kenneth Dalton Trustee (1941) | Rydex Series Funds – 1995 Rydex Variable Trust – 1998 Rydex Dynamic Funds – 1999 Rydex ETF Trust – 2003 | 150 |
Principal Occupations During Past Five Years: Retired; Member of the Governance and Nominating Committees (1995 to present); Chairman of the Audit Committee (1997 to present); Member of the Risk Oversight Committee (2010 to present)
John O. Demaret Trustee, Chairman of the Board (1940) | Rydex Series Funds – 1997 Rydex Variable Trust – 1998 Rydex Dynamic Funds – 1999 Rydex ETF Trust – 2003 | 150 |
Principal Occupations During Past Five Years: Retired; Member of the Audit Committee (1997 to present); Member of the Risk Oversight Committee (2010 to present)
Werner E. Keller Trustee(1940) | Rydex Series Funds – 2005 | 150 |
Principal Occupations During Past Five Years: Founder and President of Keller Partners, LLC (registered investment adviser) (2005 to present); Member of the Audit, Governance and Nominating Committees (2005 to present); Chairman and Member of the Risk Oversight Committee (2010 to present)
Thomas F. Lydon, Jr. Trustee (1960) | Rydex Series Funds – 2005 | 150 |
Principal Occupations During Past Five Years: President, Global Trends Investments (1996 to present); Member of the Audit, Governance and Nominating Committees (2005 to present)
Patrick T. McCarville Trustee (1942) | Rydex Series Funds – 1997 | 150 |
Principal Occupations During Past Five Years: CEO, Par Industries, Inc., d/b/a Par Leasing (1977 to 2010); Chairman of the Governance and Nominating Committees (1997 to present); Member of the Audit Committee (1997 to present)
| THE GUGGENHEIM FUNDSANNUALREPORT | 29 |
INFORMATION ON BOARD OF TRUSTEES AND OFFICERS (Unaudited) (continued)
INDEPENDENT TRUSTEES – continued
Name, Position and Year of Birth | Length of Service As Trustee (Year Began) | Number of Funds Overseen | ||
Roger Somers Trustee (1944) | Rydex Series Funds – 1993 Rydex Variable Trust – 1998 Rydex Dynamic Funds – 1999 Rydex ETF Trust – 2003 | 150 |
Principal Occupations During Past Five Years: Founder and CEO of Arrow Limousine (1965 to present); Member of the Audit, Governance and Nominating Committees (1995 to present)
EXECUTIVE OFFICERS
Name, Position and Year of Birth | Principal Occupations During Past Five Years | |
Richard M. Goldman* President (1961) | Current: Senior Vice President, Security Benefit Corporation; CEO, Security Benefit Asset Management Holdings, LLC; CEO, President and Manager Representative, Security Investors, LLC; CEO and Manager, Rydex Holdings, LLC; CEO, President and Manager, Rydex Distributors, LLC; Manager, Rydex Fund Services, LLC; President and Trustee, Rydex Series Funds, Rydex ETF Trust, Rydex Dynamic Funds and Rydex Variable Trust | |
| Previous: Director, First Security Benefit Life Insurance Company (2007–2010); President and Director, Security Global Investors (2010–2011); CEO and Director, Rydex Advisors, LLC and Rydex Advisors II, LLC (2010); Director, Security Distributors, Inc. (2007–2009); Managing Member, R.M. Goldman Partners, LLC (2006–2007) | ||
Michael P. Byrum* Vice President (1970) | Current: President, Security Benefit Asset Management Holdings, LLC; Senior Vice President, Security Investors, LLC; President and Chief Investment Officer, Rydex Holdings, LLC; Director and Chairman of the Board, Advisor Research Center, Inc.; Manager, Rydex Specialized Products, LLC | |
| Previous: Rydex Distributors, LLC (f/k/a Rydex Distributors, Inc.), Vice President (2009); Rydex Fund Services, LLC, Director (2009–2010), Secretary (2002–2010), Executive Vice President (2002–2006); Rydex Advisors, LLC (f/k/a PADCO Advisors, Inc.), Director (2008–2010), Chief Investment Officer (2006–2010), President (2004–2010); Secretary (2002–2010); Rydex Advisors II, LLC (f/k/a PADCO Advisors II, Inc.), Director (2008–2010), Chief Investment Officer (2006-2010), President (2004–2010), Secretary (2002–2010); Rydex Capital Partners, LLC, President and Secretary (2003–2007); Rydex Capital Partners II, LLC, (2003–2007); Rydex Holdings, LLC (f/k/a Rydex Holdings, Inc.), Secretary (2005–2008), Executive Vice President (2005–2006); Advisor Research Center, Inc., Secretary (2006–2009), Executive Vice President (2006); Rydex Specialized Products, LLC, Secretary (2005–2008) | ||
| 30 | THE GUGGENHEIM FUNDSANNUALREPORT |
INFORMATION ON BOARD OF TRUSTEES AND OFFICERS (Unaudited) (continued)
EXECUTIVE OFFICERS – continued
Name, Position and Year of Birth | Principal Occupations During Past Five Years | |
Nikolaos Bonos* Vice President and Treasurer (1963) | Current: Senior Vice President, Security Investors, LLC; Chief Executive Officer and Manager, Rydex Specialized Products, LLC; Chief Executive Officer and President, Rydex Fund Services, LLC; Vice President, Rydex Holdings, LLC; Treasurer, SBL Fund; Security Equity Fund; Security Income Fund; Security Large Cap Value Fund and Security Mid Cap Growth Fund; Vice President, Security Benefit Asset Management Holdings, LLC | |
| Previous: Security Global Investors, LLC, Senior Vice President (2010–2011); Rydex Advisors, LLC (f/k/a PADCO Advisors, Inc.) Senior Vice President (2006–2011); Rydex Fund Services, LLC (f/k/a Rydex Fund Services, Inc.), Director (2009) and Senior Vice President (2003–2006); Rydex Specialized Products, LLC, Chief Financial Officer (2005–2009) | ||
Joanna M. Haigney* Chief Compliance Officer and Secretary (1966) | Current: Chief Compliance Officer and Secretary, SBL Fund; Security Equity Fund; Security Income Fund; Security Large Cap Value Fund and Security Mid Cap Growth Fund; Vice President, Rydex Holdings, LLC; Vice President, Security Benefit Asset Management Holdings, LLC; Senior Vice President and Chief Compliance Officer, Security Investors, LLC | |
| Previous: Security Global Investors, LLC, Senior Vice President (2010–2011); Rydex Advisors, LLC (f/k/a PADCO Advisors, Inc.) and Rydex Advisors II, LLC (f/k/a PADCO Advisors II, Inc.), Chief Compliance Officer and Senior Vice President (2010–2011); Rydex Capital Partners I, LLC and Rydex Capital Partners II, LLC, Chief Compliance Officer (2006–2007); Rydex Fund Services, LLC (f/k/a Rydex Fund Services, Inc.), Vice President (2001–2006) | ||
Keith A. Fletcher* Vice President (1958) | Current: Senior Vice President, Security Investors, LLC; Vice President, Rydex Holdings, LLC; Vice President, Rydex Specialized Products, LLC; Vice President, Rydex Distributors, LLC; Vice President, Rydex Fund Services, LLC; Vice President and Director, Advisor Research Center, Inc.; Vice President, SBL Fund; Security Equity Fund; Security Income Fund; Security Large Cap Value Fund and Security Mid Cap Growth Fund | |
| Previous: Security Global Investors, LLC, Vice President (2010–2011); Rydex Advisors, LLC (f/k/a PADCO Advisors, Inc.) and Rydex Advisors II, LLC (f/k/a PADCO Advisors II, Inc.), Vice President (2009–2011); Lyster Watson and Company, Managing Director (2007–2008); Fletcher Financial Group, Inc., Chief Executive Officer (2004–2007) | ||
| THE GUGGENHEIM FUNDSANNUALREPORT | 31 |
INFORMATION ON BOARD OF TRUSTEES AND OFFICERS (Unaudited) (concluded)
EXECUTIVE OFFICERS – concluded
Name, Position and Year of Birth | Principal Occupations During Past Five Years | |
Amy J. Lee* Vice President and Assistant Secretary (1960) | Current: Senior Vice President and Secretary, Security Investors, LLC; Secretary and Chief Compliance Officer, Security Distributors, Inc.; Vice President, Associate General Counsel and Assistant Secretary, Security Benefit Life Insurance Company and Security Benefit Corporation; Associate General Counsel, First Security Benefit Life Insurance and Annuity of New York; Vice President and Secretary, SBL Fund; Security Equity Fund; Security Income Fund; Security Large Cap Value Fund and Security Mid Cap Growth Fund; Vice President and Secretary, Rydex Holdings, LLC; Secretary, Advisor Research Center, Inc., Rydex Specialized Products, LLC, Rydex Distributors, LLC and Rydex Fund Services, LLC; Assistant Secretary, Security Benefit Clinic and Hospital | |
| Previous: Security Global Investors, LLC, Senior Vice President and Secretary (2007–2011); Rydex Advisors, LLC (f/k/a PADCO Advisors, Inc.) and Rydex Advisors II, LLC (f/k/a PADCO Advisors II, Inc.), Senior Vice President and Secretary (2010–2011); Brecek and Young Advisors, Inc., Director (2004–2008) | ||
Joseph M. Arruda* Assistant Treasurer (1966) | Current: Assistant Treasurer, SBL Fund, Security Equity Fund; Security Income Fund: Security Large Cap Value Fund; and Security Mid Cap Growth Fund; Vice President, Security Investors, LLC; Chief Financial Officer and Manager, Rydex Specialized Products, LLC | |
| Previous: Security Global Investors, LLC, Vice President (2010-2011); Rydex Advisors, LLC (f/k/a PADCO Advisors, Inc.) and Rydex Advisors II, LLC (f/k/a PADCO Advisors II, Inc.), Vice President (2004–2011) | ||
| * | Officers of the Funds are deemed to be “interested persons” of the Trust, within the meaning of Section 2(a) (19) of the 1940 Act, in as much as this person is affiliated with Security Investors. |
| 32 | THE GUGGENHEIM FUNDSANNUALREPORT |
GUGGENHEIM INVESTMENTS PRIVACY POLICIES
Rydex Funds, Guggenheim Funds, Rydex Investments, Rydex Distributors, Inc., Security Investors, LLC, Security Distributors, Inc. and Rydex Advisory Services (Collectively “Guggenheim Investments”)
Our Commitment to You
When you become a Guggenheim Investments investor, you entrust us with not only your hard-earned money but also with personal and financial information about you. We recognize that your relationship with us is based on trust and that you expect us to act responsibly and in your best interests. Because we have access to this private information about you, we hold ourselves to the highest standards in its safekeeping and use. This means, most importantly, that we do not sell client information to anyone—whether it is your personal information or if you are a current or former Guggenheim Investments client.
The Information We Collect About You
In the course of doing business with shareholders and investors, we collect nonpublic personal information about you. You typically provide personal information when you complete a Guggenheim Investments account application or when you request a transaction that involves Rydex and Guggenheim Investments funds or one of the Guggenheim Investments affiliated companies. “Nonpublic personal information” is personally identifiable private information about you. For example, it includes information regarding your name and address, Social Security or taxpayer identification number, assets, income, account balance, bank account information and investment activity (e.g., purchase and redemption history).
How We Handle Your Personal Information
As emphasized above, we do not sell information about current or former clients or their accounts to third parties. Nor do we share such information, except when necessary to complete transactions at your request or to make you aware of related investment products and services that we offer. Additional details about how we handle your personal information are provided below. To complete certain transactions or account changes that you direct, it may be necessary to provide identifying information to companies, individuals or groups that are not affiliated with Guggenheim Investments. For example, if you ask to transfer assets from another financial institution to Guggenheim Investments, we will need to provide certain information about you to that company to complete the transaction. To alert you to other Guggenheim Investments investment products and services, we may share your information within the Guggenheim Investments family of affiliated companies. This would include, for example, sharing your information within Guggenheim Investments so we can make you aware of new Rydex and Guggenheim Investments funds or the services offered through another Guggenheim Investments affiliated company. In certain instances, we may contract with nonaffiliated companies to perform services for us. Where necessary, we will disclose information we have about you to these third parties. In all such cases, we provide the third party with only the information necessary to carry out its assigned responsibilities and only for that purpose. And we require these third parties to treat your private information with the same high degree of confidentiality that we do. In certain instances, we may share information with other financial institutions regarding individuals and entities in response to the U.S.A. Patriot Act. Finally, we will release information about you if you direct us to do so, if we are compelled by law to do so or in other circumstances permitted by law.
Opt Out Provisions
We do not sell your personal information to anyone. The law allows you to “opt out” of only certain kinds of information sharing with third parties. The firm does not share personal information about you with any third parties that triggers this opt-out right. This means YOU ARE ALREADY OPTED OUT.
How We Protect Privacy Online
Our concern for the privacy of our shareholders also extends to those who use our web site, www.rydex-sgi.com. Our web site uses some of the most secure forms of online communication available, including encryption technology, Secure Socket Layer (SSL) protocol, firewalls and user names and passwords. These technologies provide a high level of security and privacy when you access your account information or initiate online transactions. The Guggenheim Investments web site offers customized features that require our use of “http cookies”—tiny pieces of information that we ask your browser to store. However, we make very limited use of these cookies. We only use cookies for session management and security features on the Guggenheim Investments web site. We do not use them to pull data from your hard drive, to learn your email address, or to view data in cookies created by other web sites. We will not share the information in our cookies or give others access to it. See the legal information area on our web site for more details about web site security and privacy features.
How We Safeguard Your Personal Information
We restrict access to nonpublic personal information about shareholders to our employees and in some cases to third parties (for example, the service providers described above) as permitted by law. We maintain strict physical, electronic and procedural safeguards that comply with federal standards to guard your nonpublic personal information.
We’ll Keep You Informed
As required by federal law, we will notify shareholders of our privacy policy annually. We reserve the right to modify this policy at any time, but rest assured that if we do change it, we will tell you promptly. You will also be able to access our privacy policy from our web site at www.rydex-sgi.com. Should you have any questions regarding our privacy policy, contact us at 800.820.0888 or 301.296.5100.
| THE GUGGENHEIM FUNDSANNUALREPORT | 33 |
This page intentionally left blank.
This page intentionally left blank.
This page intentionally left blank.
This page intentionally left blank.
GUGGENHEIM INVESTMENTS
805 King Farm Boulevard, Suite 600
Rockville, MD 20850
www.rydex-sgi.com
800.820.0888
RVDWA-2-1211x1212
| Item 2. | Code of Ethics. |
The registrant’s Board of Trustees has adopted a code of ethics that applies to the registrant’s principal executive officer and principal financial officer. No substantive amendments were approved or waivers were granted to the Code during the period covered by this report. The Code is filed as an exhibit to this Form N-CSR.
| Item 3. | Audit Committee Financial Expert. |
The registrant’s Board of Trustees has determined that Werner Keller, an “independent” Trustee serving on the registrant’s audit committee, is an “audit committee financial expert,” as defined in Item 3 of Form N-CSR. Under applicable securities laws, a person who is determined to be an audit committee financial expert will not be deemed an “expert” for any purpose, including without limitation for the purposes of Section 11 of the Securities Act of 1933, as a result of being designated or identified as an audit committee financial expert. The designation or identification of a person as an audit committee financial expert does not impose on such person any duties, obligations, or liabilities that are greater than the duties, obligations, and liabilities imposed on such person as a member of the audit committee and Board of Trustees in the absence of such designation or identification.
| Item 4. | Principal Accountant Fees and Services. |
(a)-(d) The aggregate Audit Fees billed by the Trust’s principal accountant, for the audit of the annual financial statements in connection with statutory and regulatory filings for the fiscal years ended December 31, 2011 and December 31, 2010 were $968,960 and $984,960, respectively. The aggregate Audit Related Fees by the Trust’s principal accountant billed for the fiscal years ended December 31, 2011 and December 31, 2010 were $0 and $21,465, respectively. The aggregate Tax Fees billed by Trust’s principal accountant for professional services rendered for tax compliance, tax advice, and tax planning, including preparation of tax returns and distribution assistance, for the fiscal years ended December 31, 2011 and December 31, 2010 was $8,565 and $0, respectively.
(e) The audit committee has adopted a policy whereby audit and non-audit services performed by the registrant’s principal accountant for the registrant, its investment advisor, and any entity controlling, controlled by, or under common control with the investment advisor that provides ongoing services to the registrant require pre-approval in advance at regularly scheduled audit committee meetings. If such service is required between regularly scheduled audit committee meetings, the chairman of the audit committee, J. Kenneth Dalton, is authorized to pre-approve the service with full committee approval at the next scheduled meeting. There shall be no waivers of the pre-approval process. No services described in (b)-(d) above were approved pursuant to paragraph (c)(7)(i)(C) of Rule 2-01 of Regulation S-X.
(f) Not applicable.
(g) The aggregate non-audit fees billed by the registrant’s accountant for the most recent fiscal year and the preceding fiscal year for services rendered to the registrant, the investment advisor, and any entity controlling, controlled by, or under common control with the advisor that provides ongoing services to the registrant were $38,565 and $0, respectively. These aggregate fees were less than the aggregate fees billed for the same periods by the registrant’s principal accountant for audit services rendered to the registrant, the investment advisor, and any entity controlling, controlled by, or under common control with the advisor that provides ongoing services to the registrant.
(h) All non-audit services rendered in (g) above were pre-approved by the registrant’s audit committee. As such, the audit committee has considered these services in maintaining the principal accountant’s independence.
| Item 5. | Audit Committee of Listed Registrants. |
Not applicable.
| Item 6. | Investments. |
Schedule of Investments is included as part of the report to shareholders filed under Item 1 of this form.
| Item 7. | Disclosure of Proxy Voting Policies and Procedures for Closed-End Management Investment Companies. |
Not applicable.
| Item 8. | Portfolio Managers of Closed-End Management Investment Companies. |
Not applicable.
| Item 9. | Purchases of Equity Securities by Closed-End Management Investment Company and Affiliated Purchasers. |
Not applicable.
| Item 10. | Submission of Matters to a Vote of Security Holders. |
Not applicable.
| Item 11. | Controls and Procedures. |
(a) The registrant’s President (principal executive officer) and Treasurer (principal financial officer) have evaluated the registrant’s disclosure controls and procedures within 90 days of this
filing and have concluded that the registrant’s disclosure controls and procedures were effective as of that date in ensuring that information required to be disclosed by the registrant in this Form N-CSR was recorded, processed, summarized, and reported timely.
(b) The registrant’s principal executive officer and principal financial officer are aware of no change in the registrant’s internal control over financial reporting that occurred during the registrant’s second fiscal quarter covered by this report that has materially affected, or is reasonably likely to materially affect, the registrant’s internal control over financial reporting.
| Item 12. | Exhibits. |
(a)(1) The registrant’s code of ethics pursuant to Item 2 of Form N-CSR is attached.
(a)(2) Separate certifications by the President (principal executive officer) and Treasurer (principal financial officer) of the registrant as required by Rule 30a-2(a) under the Act (17 CFR 270.30a-2(a)) are attached.
(b) A certification by the registrant’s President (principal executive officer) and Treasurer (principal financial officer) as required by Rule 30a-2(b) under the Act (17 CFR 270.30a-2(b)) is attached.
SIGNATURES
Pursuant to the requirements of the Securities Exchange Act of 1934 and the Investment Company Act of 1940, the registrant has duly caused this report to be signed on its behalf by the undersigned, thereunto duly authorized.
| (Registrant) | Rydex Variable Trust | |
| By (Signature and Title)* | /s/ Richard M. Goldman | |
| Richard M. Goldman, President | ||
| Date | March 09, 2012 | |
Pursuant to the requirements of the Securities Exchange Act of 1934 and the Investment Company Act of 1940, this report has been signed below by the following persons on behalf of the registrant and in the capacities and on the dates indicated.
| By (Signature and Title)* | /s/ Richard M. Goldman | |
| Richard M. Goldman, President | ||
| Date | March 09, 2012 | |
| By (Signature and Title)* | /s/ Nikolaols Bonos | |
| Nikolaos Bonos, Vice President and Treasurer | ||
| Date | March 09, 2012 | |
| * | Print the name and title of each signing officer under his or her signature. |