UNITED STATES
SECURITIES AND EXCHANGE COMMISSION
Washington, D.C. 20549
FORM N-CSR
CERTIFIED SHAREHOLDER REPORT OF REGISTERED
MANAGEMENT INVESTMENT COMPANIES
Investment Company Act file number: 811-08837
THE SELECT SECTOR SPDR® TRUST
(Exact name of registrant as specified in charter)
One Iron Street, Boston, Massachusetts 02210
(Address of principal executive offices) (zip code)
Sean O’Malley, Esq.
Senior Vice President and General Counsel
c/o SSGA Funds Management, Inc.
One Iron Street
Boston, Massachusetts 02210
(Name and address of agent for service)
Copy to:
W. John McGuire, Esq.
Morgan, Lewis, & Bockius, LLP
1111 Pennsylvania Avenue, NW
Washington, D.C. 20004
Registrant’s telephone number, including area code: (617) 664-1465
Date of fiscal year end: September 30
Date of reporting period: September 30, 2023
Item 1. Report to Shareholders.
(a) The Reports to Shareholders are attached herewith.
The Select Sector SPDR Trust
Annual Report
September 30, 2023
Select Sector SPDR Funds
The Select Sector SPDR Trust consists of eleven separate investment portfolios (each a “Select Sector SPDR Fund” or a “Fund” and collectively the “Select Sector SPDR Funds” or the “Funds”).
Select Sector SPDR Funds are “index funds” that unbundle the benchmark S&P 500® and give you ownership in particular sectors or groups of industries that are represented by a specified Select Sector Index. Through a single share, investors can buy or sell any of eleven major industry sectors that make up the S&P 500®, in the same way as they would buy or sell a share of stock. Select Sector SPDR Fund shares are different from the shares of conventional mutual funds. Select Sector SPDR Funds trade on NYSE Arca, Inc.
Eleven Select Sector SPDR Funds
Shares are available for exchange trading in the following Funds of The Select Sector SPDR Trust:
| The Communication Services Select Sector SPDR Fund | XLC |
| The Consumer Discretionary Select Sector SPDR Fund | XLY |
| The Consumer Staples Select Sector SPDR Fund | XLP |
| The Energy Select Sector SPDR Fund | XLE |
| The Financial Select Sector SPDR Fund | XLF |
| The Health Care Select Sector SPDR Fund | XLV |
| The Industrial Select Sector SPDR Fund | XLI |
| The Materials Select Sector SPDR Fund | XLB |
| The Real Estate Select Sector SPDR Fund | XLRE |
| The Technology Select Sector SPDR Fund | XLK |
| The Utilities Select Sector SPDR Fund | XLU |
Each of these Funds is designed to, before expenses, correspond generally to the price and yield performance of a Select Sector Index. Each Fund’s portfolio is comprised principally of shares of constituent companies in the S&P 500®. Each stock in the S&P 500® is allocated to one Select Sector Index. The combined companies of the eleven Select Sector Indexes represent all of the companies in the S& P 500®. Each Select Sector SPDR Fund can be expected to move up or down in value with its underlying Select Sector Index. Investors cannot invest directly in an index. Funds focused on a single sector generally experience greater price fluctuations than the overall stock market.
Objective
Select Sector SPDR Funds are designed to provide investors with an affordable way to invest in a portfolio of equity securities in a sector or group of industries in a single trade. Select Sector SPDR Funds allow you to tailor asset allocations to fit your particular investment needs or goals. One Fund may complement another; individual Select Sector SPDR Funds can be used to increase exposure to certain industries that may be outperforming the market or to hedge other holdings in your portfolio. Although an individual Select Sector SPDR Fund may bear a higher level of risk than a broad-market fund, because of less diversification, sector investments may also offer opportunities for returns greater than an investment in the entire constituents of the S&P 500®.
The information contained in this report is intended for the general information of shareholders of the Trust. This report is not authorized for distribution to prospective investors unless preceded or accompanied by a current Trust prospectus which contains important information concerning the Trust. You may obtain a current prospectus from the Distributor, ALPS Portfolio Solutions Distributor, Inc., by calling 1-866-SECTOR-ETF (1-866-732-8673). Please read the prospectus carefully before you invest.
† S&P 500: the Standard & Poor’s composite index of 500 stocks, a widely recognized, unmanaged, index of common stock prices.
[This Page Intentionally Left Blank]
Notes to Performance Summaries (Unaudited)
The performance chart of a Fund’s total return at net asset value (“NAV”), the total return based on market price and its benchmark index is provided for comparative purposes only and represents the periods noted. A Fund’s per share NAV is the value of one share of a Fund and is calculated by dividing the value of total assets less total liabilities by the number of shares outstanding. The NAV return is based on the NAV of a Fund and the market return is based on the market price per share of a Fund. The market price used to calculate the market return is determined by using the midpoint between the highest bid and the lowest offer on the exchange on which the shares of a Fund are listed for trading, as of the time that a Fund’s NAV is calculated. NAV and market returns assume that dividends and capital gain distributions have been reinvested in a Fund at NAV. Market returns do not include brokerage commissions that may be payable on secondary market transactions. If brokerage commissions were included market returns would be lower.
An index is a statistical measure of a specified financial market or sector. An index does not actually hold a portfolio of securities and therefore does not reflect deductions for fees or expenses. In comparison, a Fund’s performance is negatively impacted by these deductions. Index returns reflect all items of income, gain and loss and the reinvestment of dividends and other income.
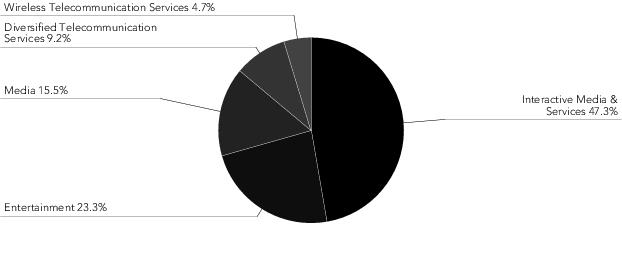
The Communication Services Select Sector Index includes companies that have been identified as Communication Services companies by the Global Industry Classification Standard (GICS® ), including securities of companies from the following industries: diversified telecommunication services; wireless telecommunication services; media; entertainment; and interactive media & services.
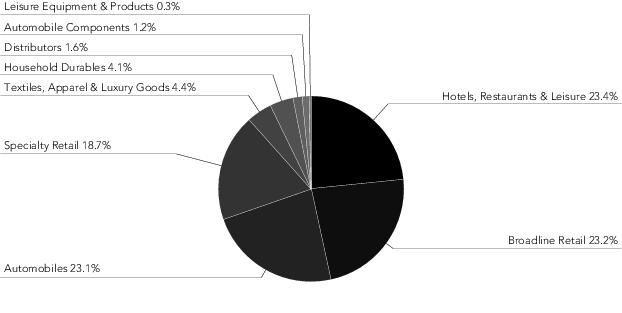
The Consumer Discretionary Select Sector Index seeks to provide an effective representation of the consumer discretionary sector of the S&P 500 Index. The Index includes companies from the following industries: retail (specialty, multiline, internet and direct marketing); hotels, restaurants and leisure; textiles, apparel and luxury goods; household durables; automobiles; auto components; distributors; leisure products; and diversified consumer services.
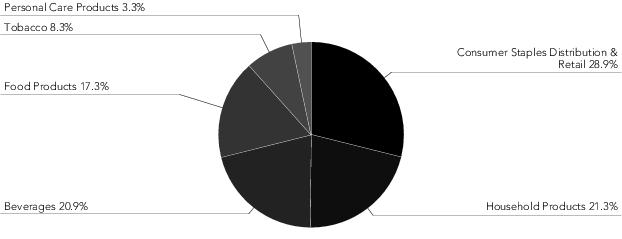
The Consumer Staples Select Sector Index seeks to provide an effective representation of the consumer staple sector of the S&P 500 Index. The Index includes companies from the following industries: food and staples retailing; household products; food products; beverages; tobacco; and personal products.
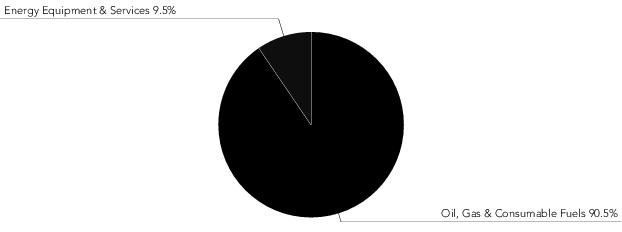
The Energy Select Sector Index seeks to provide an effective representation of the energy sector of the S&P 500 Index. The Index includes companies from the following industries: oil, gas and consumable fuels; and energy equipment and services.
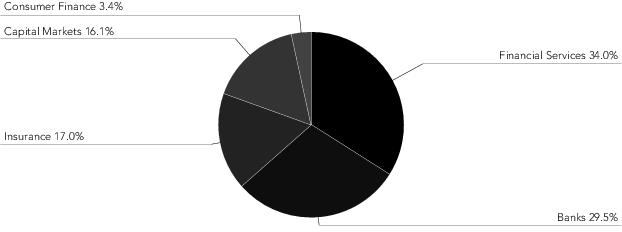
The Financials Select Sector Index seeks to provide an effective representation of the financial sector of the S&P 500 Index. The Index includes companies from the following industries: diversified financial services; insurance; banks; capital markets; mortgage real estate investment trusts ("REITs"); consumer finance; and thrifts and mortgage finance.
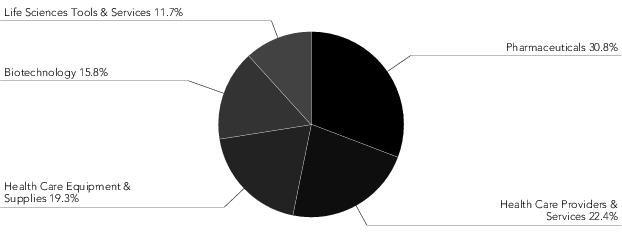
The Health Care Select Sector Index seeks to provide an effective representation of the health care sector of the S&P 500 Index. The Index includes companies from the following industries: pharmaceuticals; health care equipment and supplies; health care providers and services; biotechnology; life sciences tools and services; and health care technology.
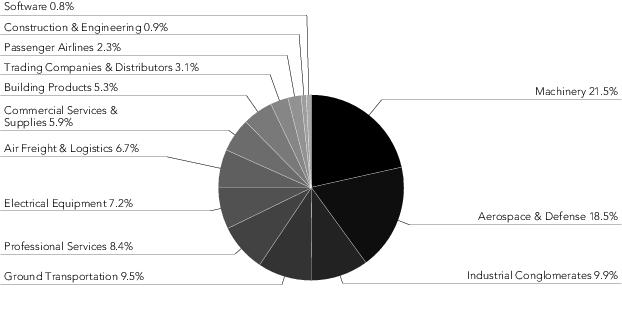
The Industrials Select Sector Index seeks to provide an effective representation of the industrial sector of the S&P 500 Index. The Index includes companies from the following industries: aerospace and defense; industrial conglomerates; marine; transportation infrastructure; machinery; road and rail; air freight and logistics; commercial services and supplies; professional services; electrical equipment; construction and engineering; trading companies and distributors; airlines; and building products.
The Materials Select Sector Index seeks to provide an effective representation of the materials sector of the S&P 500 Index. The Index includes companies from the following industries: chemicals; metals and mining; paper and forest products; containers and packaging; and construction materials.
The Real Estate Select Sector Index seeks to provide an effective representation of the real estate sector of the S&P 500 Index. The Index includes companies from the following industries: real estate management and development and REITs, excluding mortgage REITs.
See accompanying notes to financial statements.
1
Notes to Performance Summaries (Unaudited) (continued)
The Technology Select Sector Index seeks to provide an effective representation of the technology sector of the S&P 500 Index. The Index includes companies from the following industries: technology hardware, storage, and peripherals; software; communications equipment; semiconductors and semiconductor equipment; IT services; and electronic equipment, instruments and components.
The Utilities Select Sector Index seeks to provide an effective representation of the utilities sector of the S&P 500 Index. The Index includes companies from the following industries: electric utilities; water utilities; multi-utilities; independent power producers and renewable electricity producers; and gas utilities.
The S&P 500 Index includes five hundred (500) selected companies, all of which are listed on national stock exchanges and spans over 25 separate industry groups.
See accompanying notes to financial statements.
2
THE COMMUNICATION SERVICES SELECT SECTOR SPDR FUND
MANAGEMENT’S DISCUSSION OF FUND PERFORMANCE (UNAUDITED)
The Communication Services Select Sector SPDR Fund (the “Fund”) seeks to provide investment results that, before expenses, correspond generally to the price and yield performance of publicly traded equity securities of companies in the Communication Services Select Sector Index. The Fund’s benchmark is the Communication Services Select Sector Index (the “Index”).
For the 12-month period ended September 30, 2023 (the “Reporting Period”), the total return for the Fund was 38.24%, and the Index was 38.38%. The Fund and Index returns reflect the reinvestment of dividends and other income. The Fund’s performance reflects the expenses of managing the Fund, including brokerage and advisory expenses. The Index is unmanaged and Index returns do not reflect fees and expenses of any kind, which would have a negative impact on returns. Cash, security misweights, transaction costs and compounding (the exponential growth of outperformance or underperformance) also contributed to the difference between the Fund’s performance and that of the Index.
The Fund started out the Reporting Period in neutral territory the last quarter of 2022. While the overall S&P 500 Index gained over 8% during this period, Communication Services was close to flat with return of 0.43%. The markets were reacting to the latest U.S. Federal Reserve (the “Fed”) rumors, moving back and forth as investors evaluated various indicators. After four consecutive 75 bps rate increases, the Fed tightened by only 50 bps at December’s meeting. The Fund enjoyed a strong shift in the new year with positive returns over 21%. Netflix played a strong role in these returns as they reported the addition of millions of net new global subscribers, in conjunction with announcing they will be cracking down on password sharing and opting people who have been borrowing accounts to create their own.
Despite ongoing market volatility, communication services stocks still performed strongly in the third quarter of the Reporting Period The Fund enjoyed positive returns of over 12%, outperforming the broader S&P 500 Index for the second quarter in a row. The overall U.S. market continued to be driven significantly by a select group of stocks known as the ‘Magnificent Seven”. Two of these seven names include Google, parent of Alphabet Inc. and Facebook, parent of Meta Platforms, Inc. which are the two largest weights in the Communication Services Index. This group of stocks were partly responsible for the majority of the market rally due to optimism around artificial intelligence (AI). Google’s internet search dominance and YouTube unit also continued to remain sources of great interest. While S&P 500 Index finished slightly in the red for the final quarter of the Reporting Period, Communication Services narrowly managed a fourth consecutive quarterly return just over 1%, but was still one of three top sectors to positively impact overall market performance.
The Fund did not invest in derivatives during the Reporting Period.
On an individual security level, the top positive contributors to the Fund’s performance during the Reporting Period were Meta Platforms Inc, Alphabet Inc. Class A, and Alphabet Inc. Class C. The top negative contributors to the Fund’s performance during the Reporting Period were Walt Disney Company, Lumen Technologies, and Match Group, Inc..
The views expressed above reflect those of the Fund’s portfolio manager only through the Reporting Period, and do not necessarily represent the views of the Adviser as a whole. Any such views are subject to change at any time based upon market or other conditions and the Adviser disclaims any responsibility to update such views. These views may not be relied on as investment advice and, because investment decisions for a fund are based on numerous factors, may not be relied on as an indication of trading intent on behalf of any fund.
See accompanying notes to financial statements.
3
The Communication Services Select Sector SPDR Fund
Performance Summary (Unaudited)
Performance as of September 30, 2023
| | | | | | | | | | | | | |
| | | | | Cumulative Total Return | | Average Annual Total Return | | |
| | | | | Net
Asset
Value | Market
Value | Communication Services Select Sector Index | S&P 500 Index | | Net
Asset
Value | Market
Value | Communication Services Select Sector Index | S&P 500 Index | |
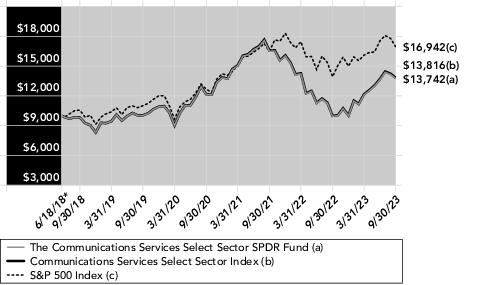
| | | ONE YEAR | | 38.24% | 38.17% | 38.38% | 21.62% | | 38.24% | 38.17% | 38.38% | 21.62% | |
| | | FIVE YEARS | | 39.91% | 39.88% | 40.62% | 60.44% | | 6.95% | 6.94% | 7.05% | 9.92% | |
| | | SINCE INCEPTION (1) | | 37.42% | 37.42% | 38.16% | 69.42% | | 6.20% | 6.20% | 6.31% | 10.49% | |
| | | | | | | | | | | | | |
| (1) | For the period June 18, 2018 to September 30, 2023. |
Comparison of Change in Value of a $10,000 Investment
(Based on Net Asset Value)
Line graph is based on cumulative total return.
* Inception date.
The total expense ratio for The Communication Services Select Sector SPDR Fund as stated in the Fees and Expenses table of the most recent prospectus is 0.10%. Please see the financial highlights for the total expense ratio for the fiscal period ended September 30, 2023.
Performance quoted represents past performance, which is no guarantee of future results. Investment return and principal value will fluctuate, so you may have a gain or loss when shares are sold. Current performance may be higher or lower than that quoted. Visit www.ssga.com for most recent month-end performance. The returns do not reflect the deduction of taxes that a shareholder would pay on Fund distributions or on the redemption or sale of Fund shares. See "Notes to Performance Summaries" on page 1 for more information.
See accompanying notes to financial statements.
4
The Communication Services Select Sector SPDR Fund
Portfolio Statistics (Unaudited)
Top Five Holdings as of September 30, 2023
| | | | |
| | Description | Market Value | % of Net Assets | |
| | Meta Platforms, Inc. Class A | 3,091,791,940 | 23.6% | |
| | Alphabet, Inc. Class A | 1,586,259,010 | 12.1 | |
| | Alphabet, Inc. Class C | 1,359,548,729 | 10.4 | |
| | AT&T, Inc. | 626,081,904 | 4.8 | |
| | Charter Communications, Inc. Class A | 624,925,284 | 4.7 | |
| | TOTAL | 7,288,606,867 | 55.6% | |
(The five largest holdings are subject to change, and there are no guarantees the Fund will continue to remain invested in any particular company.)
Industry Breakdown as of September 30, 2023*
* The Fund’s industry breakdown is expressed as a percentage of total common stock and may change over time.
See accompanying notes to financial statements.
5
THE CONSUMER DISCRETIONARY SELECT SECTOR SPDR FUND
MANAGEMENT’S DISCUSSION OF FUND PERFORMANCE (UNAUDITED)
The Consumer Discretionary Select Sector SPDR Fund (the “Fund”) seeks to provide investment results that, before expenses, correspond generally to the price and yield performance of publicly traded equity securities of companies in the Consumer Discretionary Select Sector Index. The Fund’s benchmark is the Consumer Discretionary Select Sector Index (the “Index”).
For the 12-month period ended September 30, 2023 (the “Reporting Period”), the total return for the Fund was 14.08%, and the Index was 14.16%. The Fund and Index returns reflect the reinvestment of dividends and other income. The Fund’s performance reflects the expenses of managing the Fund, including brokerage and advisory expenses. The Index is unmanaged and Index returns do not reflect fees and expenses of any kind, which would have a negative impact on returns. Cash, security misweights, transaction costs and compounding (the exponential growth of outperformance or underperformance) also contributed to the difference between the Fund’s performance and that of the Index.
The Fund started out the period with negative returns the last quarter of 2022. While the overall S&P 500 Index gained over 8% during this period, Consumer Discretionary was the laggard, underperforming by over 9%. The markets were reacting to the latest U.S. Federal Reserve (the “Fed”) rumors, moving back and forth as investors evaluated various indicators. After four consecutive 75 bps rate increases, the Fed tightened by only 50 bps at December’s meeting. The Fund started out 2023 year strongly with returns over 16% for the first quarter of the calendar year. Employers added more than half a million jobs in January and the U.S. housing markets were showing signs of stabilizing or even rebounding. Consumer’s resiliency was clear as retail sales rose 3% that same month, helping consumer discretionary stocks to even finish January as the top performing sector.
Despite ongoing market volatility, consumer discretionary stocks still performed strongly in the third quarter of the Reporting Period. Higher-income consumers continued to spend on luxury items and middle-income consumers continued to be influenced from internet and social media branding. Travel companies also benefited from continued demand for “revenge travel” bookings post pandemic. In June, the Fed even decided against what would have been an 11th consecutive interest rate increase and went for a hawkish pause. Unfortunately, the final quarter of the Reporting Period resulted in negative returns for the sector once again. A downgrade of the U.S. credit rating combined with record high mortgage interest rates and continued regional bank downgrades had a strong impact on returns. Overall consumer spending continued to fall and consumer confidence declined in September for the second consecutive month.
The Fund did not invest in derivatives during the Reporting Period.
On an individual security level, the top positive contributors to the Fund’s performance during the Reporting Period were Amazon.com, Booking Holdings Inc, and TJX Companies Inc. The top negative contributors to the Fund’s performance during the Reporting Period were Tesla, Inc., Dollar General Corporation, and Advance Auto Parts.
The views expressed above reflect those of the Fund’s portfolio manager only through the Reporting Period, and do not necessarily represent the views of the Adviser as a whole. Any such views are subject to change at any time based upon market or other conditions and the Adviser disclaims any responsibility to update such views. These views may not be relied on as investment advice and, because investment decisions for a fund are based on numerous factors, may not be relied on as an indication of trading intent on behalf of any fund.
See accompanying notes to financial statements.
6
The Consumer Discretionary Select Sector SPDR Fund
Performance Summary (Unaudited)
Performance as of September 30, 2023
| | | | | | | | | | | | | |
| | | | | Cumulative Total Return | | Average Annual Total Return | | |
| | | | | Net
Asset
Value | Market
Value | Consumer Discretionary Select Sector Index | S&P 500 Index | | Net
Asset
Value | Market
Value | Consumer Discretionary Select Sector Index | S&P 500 Index | |
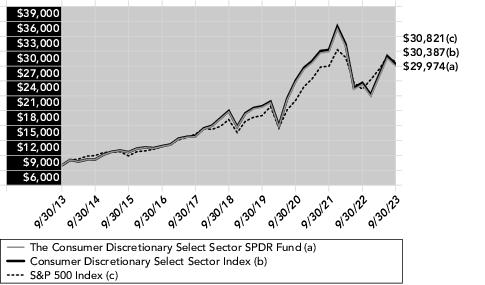
| | | ONE YEAR | | 14.08% | 14.08% | 14.16% | 21.62% | | 14.08% | 14.08% | 14.16% | 21.62% | |
| | | FIVE YEARS | | 44.30% | 44.32% | 45.10% | 60.44% | | 7.61% | 7.61% | 7.73% | 9.92% | |
| | | TEN YEARS | | 199.74% | 199.64% | 203.87% | 208.21% | | 11.60% | 11.60% | 11.76% | 11.91% | |
| | | | | | | | | | | | | |
Comparison of Change in Value of a $10,000 Investment
(Based on Net Asset Value)
Line graph is based on cumulative total return.
The total expense ratio for The Consumer Discretionary Select Sector SPDR Fund as stated in the Fees and Expenses table of the most recent prospectus is 0.10%. Please see the financial highlights for the total expense ratio for the fiscal period ended September 30, 2023.
Performance quoted represents past performance, which is no guarantee of future results. Investment return and principal value will fluctuate, so you may have a gain or loss when shares are sold. Current performance may be higher or lower than that quoted. Visit www.ssga.com for most recent month-end performance. The returns do not reflect the deduction of taxes that a shareholder would pay on Fund distributions or on the redemption or sale of Fund shares. See "Notes to Performance Summaries" on page 1 for more information.
See accompanying notes to financial statements.
7
The Consumer Discretionary Select Sector SPDR Fund
Portfolio Statistics (Unaudited)
Top Five Holdings as of September 30, 2023
| | | | |
| | Description | Market Value | % of Net Assets | |
| | Amazon.com, Inc. | 3,857,223,135 | 22.1% | |
| | Tesla, Inc. | 3,486,766,407 | 20.0 | |
| | McDonald's Corp. | 773,885,822 | 4.5 | |
| | Home Depot, Inc. | 753,991,934 | 4.3 | |
| | Lowe's Cos., Inc. | 696,368,336 | 4.0 | |
| | TOTAL | 9,568,235,634 | 54.9% | |
(The five largest holdings are subject to change, and there are no guarantees the Fund will continue to remain invested in any particular company.)
Industry Breakdown as of September 30, 2023*
* The Fund’s industry breakdown is expressed as a percentage of total common stock and may change over time.
See accompanying notes to financial statements.
8
THE CONSUMER STAPLES SELECT SECTOR SPDR FUND
MANAGEMENT’S DISCUSSION OF FUND PERFORMANCE (UNAUDITED)
The Consumer Staples Select Sector SPDR Fund (the “Fund”) seeks to provide investment results that, before expenses, correspond generally to the price and yield performance of publicly traded equity securities of companies in the Consumer Staples Select Sector Index. The Fund’s benchmark is the Consumer Staples Select Sector Index (the “Index”).
For the 12-month period ended September 30, 2023 (the “Reporting Period”), the total return for the Fund was 5.84%, and the Index was 5.94%. The Fund and Index returns reflect the reinvestment of dividends and other income. The Fund’s performance reflects the expenses of managing the Fund, including brokerage and advisory expenses. The Index is unmanaged and Index returns do not reflect fees and expenses of any kind, which would have a negative impact on returns. Fees, expenses and cash drag contributed to the difference between the Fund’s performance and that of the Index.
The prior twelve months were characterized by a risk on market environment with the U.S. securities markets broadly higher for the most part. The Consumer Staples sector did not do as well in this environment posting a modest gain owing in part to its defensive nature. One of the causes was the rapid rise in the Federal Funds rate which negatively impacted this sector as the sector’s dividend yield was now relatively less attractive. Higher interest rates also contributed to rising input costs which led to profitability challenges for a number of the constituents. Concerns also grew during the Reporting Period regarding the increasingly challenged consumer as pandemic related savings were being eroded. Additionally, several constituents indicated revenue challenges associated with higher degrees of shrinkage. Finally, worries persisted regarding the impact of a stronger Dollar on profitability. On a positive side, continued easing of supply chains helped this sector with expectations of further improvements on the input side. In general, the firms that have pricing power and can pass on higher input costs to the end consumers were the best performing stocks within this sector during this Reporting Period.
The Fund did not invest in derivatives during the Reporting Period.
On an individual security level, the top positive contributors to the Fund’s performance on an absolute basis during the Reporting Period were Molson Coors Beverage Co., Church & Dwight Co., Mondelez International, Inc.. The top negative contributors to the Fund’s performance on an absolute basis during the Reporting Period were Dollar General Corp., Estee lauder Companies Inc, and Target Corp..
The views expressed above reflect those of the Fund’s portfolio manager only through the Reporting Period, and do not necessarily represent the views of the Adviser as a whole. Any such views are subject to change at any time based upon market or other conditions and the Adviser disclaims any responsibility to update such views. These views may not be relied on as investment advice and, because investment decisions for a fund are based on numerous factors, may not be relied on as an indication of trading intent on behalf of any fund.
See accompanying notes to financial statements.
9
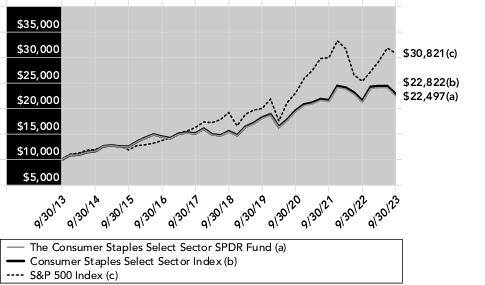
The Consumer Staples Select Sector SPDR Fund
Performance Summary (Unaudited)
Performance as of September 30, 2023
| | | | | | | | | | | | | |
| | | | | Cumulative Total Return | | Average Annual Total Return | | |
| | | | | Net
Asset
Value | Market
Value | Consumer Staples Select Sector Index | S&P 500 Index | | Net
Asset
Value | Market
Value | Consumer Staples Select Sector Index | S&P 500 Index | |
| | | ONE YEAR | | 5.84% | 5.79% | 5.94% | 21.62% | | 5.84% | 5.79% | 5.94% | 21.62% | |
| | | FIVE YEARS | | 45.68% | 45.69% | 46.65% | 60.44% | | 7.82% | 7.82% | 7.96% | 9.92% | |
| | | TEN YEARS | | 124.97% | 124.96% | 128.22% | 208.21% | | 8.45% | 8.44% | 8.60% | 11.91% | |
| | | | | | | | | | | | | |
Comparison of Change in Value of a $10,000 Investment
(Based on Net Asset Value)
Line graph is based on cumulative total return.
The total expense ratio for The Consumer Staples Select Sector SPDR Fund as stated in the Fees and Expenses table of the most recent prospectus is 0.10%. Please see the financial highlights for the total expense ratio for the fiscal period ended September 30, 2023.
Performance quoted represents past performance, which is no guarantee of future results. Investment return and principal value will fluctuate, so you may have a gain or loss when shares are sold. Current performance may be higher or lower than that quoted. Visit www.ssga.com for most recent month-end performance. The returns do not reflect the deduction of taxes that a shareholder would pay on Fund distributions or on the redemption or sale of Fund shares. See "Notes to Performance Summaries" on page 1 for more information.
See accompanying notes to financial statements.
10
The Consumer Staples Select Sector SPDR Fund
Portfolio Statistics (Unaudited)
Top Five Holdings as of September 30, 2023
| | | | |
| | Description | Market Value | % of Net Assets | |
| | Procter & Gamble Co. | 2,354,116,076 | 14.5% | |
| | Costco Wholesale Corp. | 1,714,144,571 | 10.6 | |
| | PepsiCo, Inc. | 1,596,959,123 | 9.8 | |
| | Walmart, Inc. | 1,562,750,397 | 9.7 | |
| | Mondelez International, Inc. Class A | 745,627,423 | 4.6 | |
| | TOTAL | 7,973,597,590 | 49.2% | |
(The five largest holdings are subject to change, and there are no guarantees the Fund will continue to remain invested in any particular company.)
Industry Breakdown as of September 30, 2023*
* The Fund’s industry breakdown is expressed as a percentage of total common stock and may change over time.
See accompanying notes to financial statements.
11
THE ENERGY SELECT SECTOR SPDR FUND
MANAGEMENT’S DISCUSSION OF FUND PERFORMANCE (UNAUDITED)
The Energy Select Sector SPDR Fund (the "Fund") seeks to provide investment results that, before expenses, correspond generally to the price and yield performance of publicly traded equity securities of companies in the Energy Select Sector Index. The Fund’s benchmark is the Energy Select Sector Index (the “Index”).
For the 12-month period ended September 30, 2023 (the “Reporting Period”), the total return for the Fund was 30.31%, and the Index was 30.41%. The Fund and Index returns reflect the reinvestment of dividends and other income. The Fund’s performance reflects the expenses of managing the Fund, including brokerage and advisory expenses. The Index is unmanaged and Index returns do not reflect fees and expenses of any kind, which would have a negative impact on returns. Cumulative security misweights between the fund and the index and fund expenses contributed to the difference between the Fund’s performance and that of the Index.
Oil Prices, inflation, and interest rates were primary drivers of Fund performance during the Reporting Period.
The energy sector is coming off strong performance in the previous reporting period and again delivered strong performance this Reporting Period. Most of the performance came during Q4 2022 and Q3 2023 where the quarterly performance produced double digit returns and proved to be the leading sector in the S&P 500 Index. Entering into this Reporting Period, there was much concern around global inflation and with energy prices. With the backdrop of the continued war in Ukraine, there was concern over supply and the resulting energy prices. However, the mild winter in 2022 helped ease concerns and natural gas prices came down in Q4 2022. However, there was volatility around crude oil prices. In Q4 2022 and Q3 2023, West Texas Intermediate crude oil was up 4.9% and 31.7% (highest since Q1 2022) respectively. In Q3 2023, Crude oil prices were supported by OPEC+ production cuts that squeezed global crude supply. Tighter-than-expected crude supplies in the U.S. also weighed on oil prices. The cuts by OPEC, plus additional voluntary cuts by Saudi Arabia and Russia, was expected to reduce global production by 1.3 million barrels a day through the end of the year. All of this having a boosting effect on crude oil prices which helped drive profits for the large oil companies who were able to pass them on to consumers.
The Fund used equity index futures in order to expose cash and receivables to the market during the Reporting Period. The Fund’s use of futures helped the Fund track the Index.
On an individual security level, the top positive contributors to the Fund’s performance during the Reporting Period were Exxon Mobil Corporation, Chevron Corporation, and Schlumberger N.V. The top negative contributors to the Fund’s performance during the Reporting Period were Devon Energy Corporation, EQT Corporation, and Kinder Morgan Inc.
The views expressed above reflect those of the Fund’s portfolio manager only through the Reporting Period, and do not necessarily represent the views of the Adviser as a whole. Any such views are subject to change at any time based upon market or other conditions and the Adviser disclaims any responsibility to update such views. These views may not be relied on as investment advice and, because investment decisions for a fund are based on numerous factors, may not be relied on as an indication of trading intent on behalf of any fund.
See accompanying notes to financial statements.
12
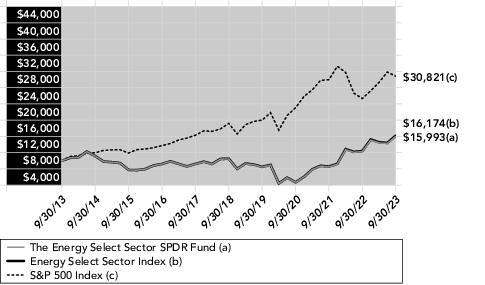
The Energy Select Sector SPDR Fund
Performance Summary (Unaudited)
Performance as of September 30, 2023
| | | | | | | | | | | | | |
| | | | | Cumulative Total Return | | Average Annual Total Return | | |
| | | | | Net
Asset
Value | Market
Value | Energy Select Sector Index | S&P 500 Index | | Net
Asset
Value | Market
Value | Energy Select Sector Index | S&P 500 Index | |
| | | ONE YEAR | | 30.31% | 30.28% | 30.41% | 21.62% | | 30.31% | 30.28% | 30.41% | 21.62% | |
| | | FIVE YEARS | | 53.17% | 53.21% | 53.99% | 60.44% | | 8.90% | 8.91% | 9.02% | 9.92% | |
| | | TEN YEARS | | 59.93% | 59.92% | 61.74% | 208.21% | | 4.81% | 4.81% | 4.93% | 11.91% | |
| | | | | | | | | | | | | |
Comparison of Change in Value of a $10,000 Investment
(Based on Net Asset Value)
Line graph is based on cumulative total return.
The total expense ratio for The Energy Select Sector SPDR Fund as stated in the Fees and Expenses table of the most recent prospectus is 0.10%. Please see the financial highlights for the total expense ratio for the fiscal period ended September 30, 2023.
Performance quoted represents past performance, which is no guarantee of future results. Investment return and principal value will fluctuate, so you may have a gain or loss when shares are sold. Current performance may be higher or lower than that quoted. Visit www.ssga.com for most recent month-end performance. The returns do not reflect the deduction of taxes that a shareholder would pay on Fund distributions or on the redemption or sale of Fund shares. See "Notes to Performance Summaries" on page 1 for more information.
See accompanying notes to financial statements.
13
The Energy Select Sector SPDR Fund
Portfolio Statistics (Unaudited)
Top Five Holdings as of September 30, 2023
| | | | |
| | Description | Market Value | % of Net Assets | |
| | Exxon Mobil Corp. | 9,162,459,596 | 23.5% | |
| | Chevron Corp. | 7,269,975,758 | 18.6 | |
| | EOG Resources, Inc. | 1,793,528,761 | 4.6 | |
| | ConocoPhillips | 1,720,682,848 | 4.4 | |
| | Schlumberger NV | 1,707,840,842 | 4.4 | |
| | TOTAL | 21,654,487,805 | 55.5% | |
(The five largest holdings are subject to change, and there are no guarantees the Fund will continue to remain invested in any particular company.)
Industry Breakdown as of September 30, 2023*
* The Fund’s industry breakdown is expressed as a percentage of total common stock and may change over time.
See accompanying notes to financial statements.
14
THE FINANCIAL SELECT SECTOR SPDR FUND
MANAGEMENT’S DISCUSSION OF FUND PERFORMANCE (UNAUDITED)
The Financial Select Sector SPDR Fund (the “Fund”) seeks to provide investment results that, before expenses, correspond generally to the price and yield performance of publicly traded equity securities of companies in the Financial Select Sector Index. The Fund’s benchmark is the Financial Select Sector Index (the “Index”).
For the 12-month period ended September 30, 2023 (the “Reporting Period”), the total return for the Fund was 11.67%, and the Index was 11.73%. The Fund and Index returns reflect the reinvestment of dividends and other income. The Fund’s performance reflects the expenses of managing the Fund, including brokerage and advisory expenses. The Index is unmanaged and Index returns do not reflect fees and expenses of any kind, which would have a negative impact on returns. Fees, expenses and cash drag contributed to the difference between the Fund’s performance and that of the Index.
There were a number of factors that contributed to this Fund’s return during the Reporting Period. The combination of declining loan growth and an inverted yield curve raised significant worries regarding potential revenue challenges for the banking segment. Additionally, this sector continued to be impacted by a heightened regulatory environment with a particular focus on ESG and lending standards. Recession concerns continued to resonate in the marketplace bringing with it worries regarding an uptick of bad debt being on balance sheets although by some measures firms and consumers were better positioned relative to other sizable market down turns. The dramatic uptick in the Federal Funds rate led to sizable shifts in deposit bases as customers much more aggressively sought yield and safety. This in turn contributed to the collapse of several regional banks, most notably Signature Bank, SVB Financial Group and First Republic Bank, in the first quarter of 2023. Rising interest rates were not a negative for all constituents as there were expectations that insurance companies would be better positioned in regard to revenue and investment returns.
The Fund did not invest in derivatives during the Reporting Period.
On an individual security level, the top positive contributors to the Fund’s performance on an absolute basis during the Reporting Period were Everest group LTD., JP Morgan Chase & Co., and Aflac Inc.. The top negative contributors to the Fund’s performance on an absolute basis during the Reporting Period were Signature Bank, SVB Financial Group, and First Republic Bank.
The views expressed above reflect those of the Fund’s portfolio manager only through the Reporting Period, and do not necessarily represent the views of the Adviser as a whole. Any such views are subject to change at any time based upon market or other conditions and the Adviser disclaims any responsibility to update such views. These views may not be relied on as investment advice and, because investment decisions for a fund are based on numerous factors, may not be relied on as an indication of trading intent on behalf of any fund.
See accompanying notes to financial statements.
15
The Financial Select Sector SPDR Fund
Performance Summary (Unaudited)
Performance as of September 30, 2023
| | | | | | | | | | | | | |
| | | | | Cumulative Total Return | | Average Annual Total Return | | |
| | | | | Net
Asset
Value | Market
Value | Financial Select Sector Index | S&P 500 Index | | Net
Asset
Value | Market
Value | Financial Select Sector Index | S&P 500 Index | |
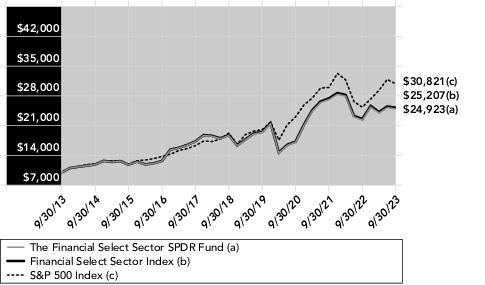
| | | ONE YEAR | | 11.67% | 11.61% | 11.73% | 21.62% | | 11.67% | 11.61% | 11.73% | 21.62% | |
| | | FIVE YEARS | | 33.37% | 33.43% | 34.10% | 60.44% | | 5.93% | 5.94% | 6.04% | 9.92% | |
| | | TEN YEARS | | 149.23% | 149.27% | 152.07% | 208.21% | | 9.56% | 9.56% | 9.69% | 11.91% | |
| | | | | | | | | | | | | |
Comparison of Change in Value of a $10,000 Investment
(Based on Net Asset Value)
Line graph is based on cumulative total return.
The total expense ratio for The Financial Select Sector SPDR Fund as stated in the Fees and Expenses table of the most recent prospectus is 0.10%. Please see the financial highlights for the total expense ratio for the fiscal period ended September 30, 2023.
Performance quoted represents past performance, which is no guarantee of future results. Investment return and principal value will fluctuate, so you may have a gain or loss when shares are sold. Current performance may be higher or lower than that quoted. Visit www.ssga.com for most recent month-end performance. The returns do not reflect the deduction of taxes that a shareholder would pay on Fund distributions or on the redemption or sale of Fund shares. See "Notes to Performance Summaries" on page 1 for more information.
See accompanying notes to financial statements.
16
The Financial Select Sector SPDR Fund
Portfolio Statistics (Unaudited)
Top Five Holdings as of September 30, 2023
| | | | |
| | Description | Market Value | % of Net Assets | |
| | Berkshire Hathaway, Inc. Class B | 4,237,650,561 | 13.9% | |
| | JPMorgan Chase & Co. | 2,795,590,856 | 9.1 | |
| | Visa, Inc. Class A | 2,451,553,995 | 8.0 | |
| | Mastercard, Inc. Class A | 2,185,058,171 | 7.1 | |
| | Bank of America Corp. | 1,255,628,017 | 4.1 | |
| | TOTAL | 12,925,481,600 | 42.2% | |
(The five largest holdings are subject to change, and there are no guarantees the Fund will continue to remain invested in any particular company.)
Industry Breakdown as of September 30, 2023*
* The Fund’s industry breakdown is expressed as a percentage of total common stock and may change over time.
See accompanying notes to financial statements.
17
THE HEALTH CARE SELECT SECTOR SPDR FUND
MANAGEMENT’S DISCUSSION OF FUND PERFORMANCE (UNAUDITED)
The Health Care Select Sector SPDR Fund (the “Fund”) seeks to provide investment results that, before expenses, correspond generally to the price and yield performance of publicly traded equity securities of companies in the Health Care Select Sector Index. The Fund’s benchmark is the Health Care Select Sector Index (the “Index”).
For the 12-month period ended September 30, 2023 (the “Reporting Period”), the total return for the Fund was 8.10%, and the Index was 8.18%. The Fund and Index returns reflect the reinvestment of dividends and other income. The Fund’s performance reflects the expenses of managing the Fund, including brokerage and advisory expenses. The Index is unmanaged and Index returns do not reflect fees and expenses of any kind, which would have a negative impact on returns. Fees, expenses and cash drag contributed to the difference between the Fund’s performance and that of the Index.
During the Reporting Period, the medical impact of the COVID-19 pandemic fortunately waned although this positive outcome did negatively impact the profitability of a number of the constituents. Still, the policy and medical responses to the pandemic continued to have a significant impact on many of the constituents of this Fund. This was most notably manifested on the demand side as the medical community works down the backlog of deferred medical procedures. Additionally, market expectations are for a much higher run rate of government spending on healthcare and research than the historical norm. This change was heavily influenced by the pandemic and the responses to the pandemic. Another positive for this sector was a decline in regulatory concerns during the Reporting Period. Also, secular trends such as the continuing increased health care demands associated with the ongoing aging of the American population continue to make a positive contribution to many of this Fund’s constituents. This demographic trend is anticipated to lead to continued strong growth in the medical products, pharmaceuticals and medical services markets. Additionally, the return for many of the constituents of this Fund were helped by the sector’s continued dramatic innovation success as evidenced by a much quicker than anticipated response to the COVID-19 pandemic. This spirit and success at innovation has positively contributed to the Fund. Although, this has been offset during the Reporting Period by ongoing patent expirations. Finally though slower than recent periods, mergers and acquisitions both completed and anticipated contributed to this Fund’s return. Conversely, the Fund, owing to its defensive nature, was incrementally hurt by a “risk on” market environment.
The Fund did not invest in derivatives during the Reporting Period.
On an individual security level, the top positive contributors to the Fund’s performance on an absolute basis during the Reporting Period were Zimmer Biomet Holdings, Hologic Inc, and Cigna Group. The top negative contributors to the Fund’s performance on an absolute basis during the Reporting Period were Insulet Corp., Catalent Inc., and ResMed Inc..
The views expressed above reflect those of the Fund’s portfolio manager only through the Reporting Period, and do not necessarily represent the views of the Adviser as a whole. Any such views are subject to change at any time based upon market or other conditions and the Adviser disclaims any responsibility to update such views. These views may not be relied on as investment advice and, because investment decisions for a fund are based on numerous factors, may not be relied on as an indication of trading intent on behalf of any fund.
See accompanying notes to financial statements.
18
The Health Care Select Sector SPDR Fund
Performance Summary (Unaudited)
Performance as of September 30, 2023
| | | | | | | | | | | | | |
| | | | | Cumulative Total Return | | Average Annual Total Return | | |
| | | | | Net
Asset
Value | Market
Value | Health Care Select Sector Index | S&P 500 Index | | Net
Asset
Value | Market
Value | Health Care Select Sector Index | S&P 500 Index | |
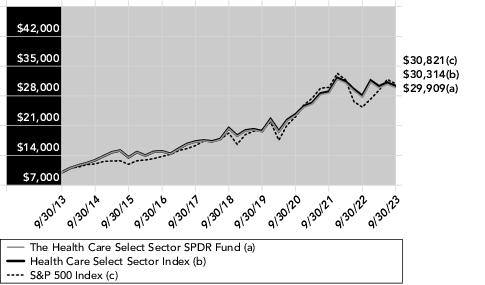
| | | ONE YEAR | | 8.10% | 8.05% | 8.18% | 21.62% | | 8.10% | 8.05% | 8.18% | 21.62% | |
| | | FIVE YEARS | | 47.52% | 47.56% | 48.40% | 60.44% | | 8.09% | 8.09% | 8.21% | 9.92% | |
| | | TEN YEARS | | 199.09% | 199.11% | 203.14% | 208.21% | | 11.58% | 11.58% | 11.73% | 11.91% | |
| | | | | | | | | | | | | |
Comparison of Change in Value of a $10,000 Investment
(Based on Net Asset Value)
Line graph is based on cumulative total return.
The total expense ratio for The Health Care Select Sector SPDR Fund as stated in the Fees and Expenses table of the most recent prospectus is 0.10%. Please see the financial highlights for the total expense ratio for the fiscal period ended September 30, 2023.
Performance quoted represents past performance, which is no guarantee of future results. Investment return and principal value will fluctuate, so you may have a gain or loss when shares are sold. Current performance may be higher or lower than that quoted. Visit www.ssga.com for most recent month-end performance. The returns do not reflect the deduction of taxes that a shareholder would pay on Fund distributions or on the redemption or sale of Fund shares. See "Notes to Performance Summaries" on page 1 for more information.
See accompanying notes to financial statements.
19
The Health Care Select Sector SPDR Fund
Portfolio Statistics (Unaudited)
Top Five Holdings as of September 30, 2023
| | | | |
| | Description | Market Value | % of Net Assets | |
| | UnitedHealth Group, Inc. | 3,662,120,537 | 9.7% | |
| | Eli Lilly & Co. | 3,358,469,780 | 8.9 | |
| | Johnson & Johnson | 2,940,837,858 | 7.8 | |
| | AbbVie, Inc. | 2,063,002,176 | 5.5 | |
| | Merck & Co., Inc. | 2,048,422,917 | 5.4 | |
| | TOTAL | 14,072,853,268 | 37.3% | |
(The five largest holdings are subject to change, and there are no guarantees the Fund will continue to remain invested in any particular company.)
Industry Breakdown as of September 30, 2023*
* The Fund’s industry breakdown is expressed as a percentage of total common stock and may change over time.
See accompanying notes to financial statements.
20
THE INDUSTRIAL SELECT SECTOR SPDR FUND
MANAGEMENT’S DISCUSSION OF FUND PERFORMANCE (UNAUDITED)
The Industrial Select Sector SPDR Fund (the “Fund”) seeks to provide investment results that, before expenses, correspond generally to the price and yield performance of publicly traded equity securities of companies in the Industrial Select Sector Index. The Fund’s benchmark is the Industrial Select Sector Index (the “Index”).
For the 12-month period ended September 30, 2023 (the “Reporting Period”), the total return for the Fund was 24.50%, and the Index was 24.58%. The Fund and Index returns reflect the reinvestment of dividends and other income. The Fund’s performance reflects the expenses of managing the Fund, including brokerage and advisory expenses. The Index is unmanaged and Index returns do not reflect fees and expenses of any kind, which would have a negative impact on returns. Fees and expenses contributed to the difference between the Fund’s performance and that of the Index.
With inflation showing signs of slowing down in the U.S., the Index rallied over the first two months of the Reporting Period (up over 21%), but the momentum came to a premature end in December as investors worried about weakening economic growth amid continued hawkish messaging by central banks. The industrials sector tends to benefit from a stronger economy which can lead to increased demand for capital goods and transportation and like the broad market, has been sensitive to the inflationary environment. The Index showed lackluster performance over the next six months, declining almost 4%, as investor sentiment declined amid evidence of a pullback in consumer spending and increased risk of recession as well as supply chain concerns. The Index gained almost 14% over June and July as the U.S. economy grew at a faster-than-expected pace in the second quarter of 2023, before declining 8% in the following months to end the Reporting Period up about 24.5%.
The Fund used index equity futures in order to equitize cash and dividend receivables during the Reporting Period. The Fund’s use of futures helped the Fund track the Index.
On an individual security level, the top positive contributors to the Fund’s performance on an absolute basis during the Reporting Period were General Electric Company, Caterpillar Inc., and Boeing Company. The top negative contributors to the Fund’s performance on an absolute basis during the Reporting Period were Generac Holdings, 3M Company, and L3Harris Technologies Inc..
The views expressed above reflect those of the Fund’s portfolio manager only through the Reporting Period, and do not necessarily represent the views of the Adviser as a whole. Any such views are subject to change at any time based upon market or other conditions and the Adviser disclaims any responsibility to update such views. These views may not be relied on as investment advice and, because investment decisions for a fund are based on numerous factors, may not be relied on as an indication of trading intent on behalf of any fund.
See accompanying notes to financial statements.
21
The Industrial Select Sector SPDR Fund
Performance Summary (Unaudited)
Performance as of September 30, 2023
| | | | | | | | | | | | | |
| | | | | Cumulative Total Return | | Average Annual Total Return | | |
| | | | | Net
Asset
Value | Market
Value | Industrial Select Sector Index | S&P 500 Index | | Net
Asset
Value | Market
Value | Industrial Select Sector Index | S&P 500 Index | |
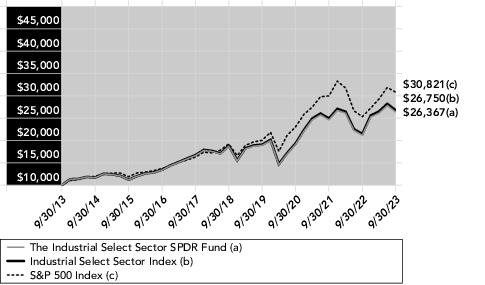
| | | ONE YEAR | | 24.50% | 24.38% | 24.58% | 21.62% | | 24.50% | 24.38% | 24.58% | 21.62% | |
| | | FIVE YEARS | | 41.22% | 41.21% | 42.16% | 60.44% | | 7.15% | 7.15% | 7.29% | 9.92% | |
| | | TEN YEARS | | 163.67% | 163.61% | 167.50% | 208.21% | | 10.18% | 10.18% | 10.34% | 11.91% | |
| | | | | | | | | | | | | |
Comparison of Change in Value of a $10,000 Investment
(Based on Net Asset Value)
Line graph is based on cumulative total return.
The total expense ratio for The Industrial Select Sector SPDR Fund as stated in the Fees and Expenses table of the most recent prospectus is 0.10%. Please see the financial highlights for the total expense ratio for the fiscal period ended September 30, 2023.
Performance quoted represents past performance, which is no guarantee of future results. Investment return and principal value will fluctuate, so you may have a gain or loss when shares are sold. Current performance may be higher or lower than that quoted. Visit www.ssga.com for most recent month-end performance. The returns do not reflect the deduction of taxes that a shareholder would pay on Fund distributions or on the redemption or sale of Fund shares. See "Notes to Performance Summaries" on page 1 for more information.
See accompanying notes to financial statements.
22
The Industrial Select Sector SPDR Fund
Portfolio Statistics (Unaudited)
Top Five Holdings as of September 30, 2023
| | | | |
| | Description | Market Value | % of Net Assets | |
| | Caterpillar, Inc. | 672,267,414 | 4.7% | |
| | Union Pacific Corp. | 599,057,671 | 4.1 | |
| | Honeywell International, Inc. | 592,074,704 | 4.1 | |
| | General Electric Co. | 580,772,767 | 4.0 | |
| | United Parcel Service, Inc. Class B | 544,189,399 | 3.8 | |
| | TOTAL | 2,988,361,955 | 20.7% | |
(The five largest holdings are subject to change, and there are no guarantees the Fund will continue to remain invested in any particular company.)
Industry Breakdown as of September 30, 2023*
* The Fund’s industry breakdown is expressed as a percentage of total common stock and may change over time.
See accompanying notes to financial statements.
23
THE MATERIALS SELECT SECTOR SPDR FUND
MANAGEMENT’S DISCUSSION OF FUND PERFORMANCE (UNAUDITED)
The Materials Select Sector SPDR Fund (the “Fund”) seeks to provide investment results that, before expenses, correspond generally to the price and yield performance of publicly traded equity securities of companies in the Materials Select Sector Index. The Fund’s benchmark is the Materials Select Sector Index (the “Index”).
For the 12-month period ended September 30, 2023 (the “Reporting Period”), the total return for the Fund was 17.97%, and the Index was 18.05%. The Fund and Index returns reflect the reinvestment of dividends and other income. The Fund’s performance reflects the expenses of managing the Fund, including brokerage and advisory expenses. The Index is unmanaged and Index returns do not reflect fees and expenses of any kind, which would have a negative impact on returns. Cumulative security misweights between the Fund and the Index and Fund expenses contributed to the difference between the Fund’s performance and that of the Index.
Inflation, higher interest rates, and recession worries were primary drivers of Fund performance during the Reporting Period.
Companies in the materials sector are cyclical by nature, and in general respond to the state of the economy. In general, they tend to move in the same direction as broader markets. This materials sector is composed of companies in the Chemicals, Construction Materials, Containers & Packaging, and Metals & Mining.
Over the Reporting Period, the U.S. economy remained resilient despite the backdrop of inflation and the growing concerns of a recession. In the U.S., stocks rose with the S&P 500 Index up over 21% during the Reporting Period. Over the same period, materials sector stocks fell in line with the broader U.S. economy and the Index returned over 18%.
This Reporting Period’s market environment was significantly influenced by the U.S. Federal Reserve (the “Fed”), as its efforts to combat the highest U.S. inflation in nearly 40 years took center stage, as did the immediate downstream effects of these large rate increases and speculation on when and if those rate increases would have to be halted, or even reversed.
The Reporting Period began with markets reacting to the latest Fed rumors, moving back and forth as investors evaluated various indicators. When signs appeared that the global economy was beginning to cool, however, markets counterintuitively began to rise again, fueled by speculation that the Fed would have to roll back its tightening measures. A surging energy sector that was benefitting from higher energy prices also helped. After four consecutive 75 bps rate increases, the Fed tightened by only 50 bps at December’s meeting. However, the Fed reiterated that it would maintain its staunchly hawkish stance, capping some market exuberance but maintaining the market’s gains for the quarter.
As 2023 began, markets moved higher as investors interpreted inflation, GDP and headline unemployment numbers as net positives, despite some weakening corporate earnings. But the sudden collapse of Silicon Valley Bank and the deposit vulnerability it exposed in regional banks—driven by depositors chasing higher yields available in money market funds and the like—significantly rattled investors. Fortunately, when regulatory bailouts appeared to limit bank failures and contain the financial contagion, the markets recovered with surprising strength connected to newfound enthusiasm for tech companies and all things AI-related.
Markets continued to climb after June’s U.S. inflation number came in at only 3%, which was its slowest pace in more than two years and which reinvigorated investors on the idea that a soft landing might indeed be possible. But a downgrade of the United States’ credit rating on August 1st put an end to the euphoria. That, combined with record high mortgage interest rates, additional regional bank downgrades and concerns about the Chinese property market and its impact on China’s overall economy, put newfound fear into investor sentiment.
The Fund used equity index futures in order to expose cash and receivables to the market during the Reporting Period. The Fund’s use of futures helped the Fund track the Index.
On an individual security level, the top positive contributors to the Fund’s performance during the Reporting Period were Linde PLC, Freeport-McMoRan, and Air Products and Chemicals. The top negative contributors to the Fund’s performance during the Reporting Period were Albemarle Corp., Mosaic Co., and International Flavors & Fragrances, Inc..
See accompanying notes to financial statements.
24
MANAGEMENT’S DISCUSSION OF FUND PERFORMANCE (UNAUDITED)
THE MATERIALS SELECT SECTOR SPDR FUND (continued)
The views expressed above reflect those of the Fund’s portfolio manager only through the Reporting Period, and do not necessarily represent the views of the Adviser as a whole. Any such views are subject to change at any time based upon market or other conditions and the Adviser disclaims any responsibility to update such views. These views may not be relied on as investment advice and, because investment decisions for a fund are based on numerous factors, may not be relied on as an indication of trading intent on behalf of any fund.
See accompanying notes to financial statements.
25
The Materials Select Sector SPDR Fund
Performance Summary (Unaudited)
Performance as of September 30, 2023
| | | | | | | | | | | | | |
| | | | | Cumulative Total Return | | Average Annual Total Return | | |
| | | | | Net
Asset
Value | Market
Value | Materials Select Sector Index | S&P 500 Index | | Net
Asset
Value | Market
Value | Materials Select Sector Index | S&P 500 Index | |
| | | ONE YEAR | | 17.97% | 17.90% | 18.05% | 21.62% | | 17.97% | 17.90% | 18.05% | 21.62% | |
| | | FIVE YEARS | | 50.37% | 50.41% | 50.84% | 60.44% | | 8.50% | 8.51% | 8.57% | 9.92% | |
| | | TEN YEARS | | 129.00% | 129.00% | 130.95% | 208.21% | | 8.64% | 8.64% | 8.73% | 11.91% | |
| | | | | | | | | | | | | |
Comparison of Change in Value of a $10,000 Investment
(Based on Net Asset Value)
Line graph is based on cumulative total return.
The total expense ratio for The Materials Select Sector SPDR Fund as stated in the Fees and Expenses table of the most recent prospectus is 0.10%. Please see the financial highlights for the total expense ratio for the fiscal period ended September 30, 2023.
Performance quoted represents past performance, which is no guarantee of future results. Investment return and principal value will fluctuate, so you may have a gain or loss when shares are sold. Current performance may be higher or lower than that quoted. Visit www.ssga.com for most recent month-end performance. The returns do not reflect the deduction of taxes that a shareholder would pay on Fund distributions or on the redemption or sale of Fund shares. See "Notes to Performance Summaries" on page 1 for more information.
See accompanying notes to financial statements.
26
The Materials Select Sector SPDR Fund
Portfolio Statistics (Unaudited)
Top Five Holdings as of September 30, 2023
| | | | |
| | Description | Market Value | % of Net Assets | |
| | Linde PLC | 1,017,615,422 | 20.6% | |
| | Air Products & Chemicals, Inc. | 352,602,596 | 7.1 | |
| | Sherwin-Williams Co. | 337,959,613 | 6.8 | |
| | Freeport-McMoRan, Inc. | 299,422,740 | 6.1 | |
| | Ecolab, Inc. | 240,687,586 | 4.9 | |
| | TOTAL | 2,248,287,957 | 45.5% | |
(The five largest holdings are subject to change, and there are no guarantees the Fund will continue to remain invested in any particular company.)
Industry Breakdown as of September 30, 2023*
* The Fund’s industry breakdown is expressed as a percentage of total common stock and may change over time.
See accompanying notes to financial statements.
27
THE REAL ESTATE SELECT SECTOR SPDR FUND
MANAGEMENT’S DISCUSSION OF FUND PERFORMANCE (UNAUDITED)
The Real Estate Select Sector SPDR Fund (the “Fund”) seeks to provide investment results that, before expenses, correspond generally to the price and yield performance of publicly traded equity securities of companies in the Real Estate Select Sector Index. The Fund’s benchmark is the Real Estate Select Sector Index (the “Index”).
For the 12-month period ended September 30, 2023 (the “Reporting Period”), the total return for the Fund was –1.81%, and the Index was –1.84%. The Fund and Index returns reflect the reinvestment of dividends and other income. The Fund’s performance reflects the expenses of managing the Fund, including brokerage and advisory expenses. The Index is unmanaged and Index returns do not reflect fees and expenses of any kind, which would have a negative impact on returns. Fees and expenses and cash drag contributed to the difference between the Fund’s performance and that of the Index.
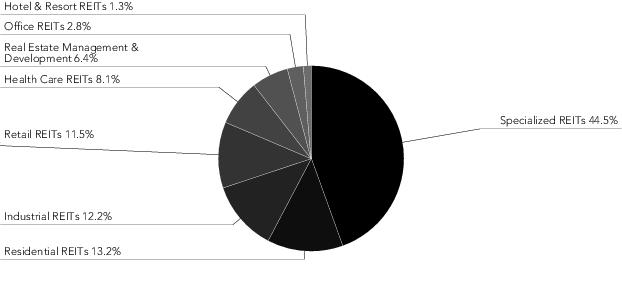
Real estate was one of the worst performing sectors in the S&P 500 Index over the Reporting Period. The market environment was significantly influenced by the U.S. Federal Reserve, as its efforts to combat the highest U.S. inflation in nearly 40 years took center stage. As real estate is capital intensive, the rising interest rate environment has had a profound impact on the sector. Rising interest rates have an adverse impact on the cost of capital; financing costs increase making it more expensive for REITs to take on new debt and to refinance existing debt obligations.
Telecom Tower REITs was the worst performing sub-industry and declined over 20% over the Reporting Period. American Tower Corp (AMT), a leading independent owner, operator and developer of wireless and broadcast communications real estate, was once the largest constituent in the Index but fell second to the industrial REIT Prologis over the course on the Reporting Period as sentiment for AMT declined. Data center REITs advanced over 25% over the Reporting Period and was the top performing sub-industry. Data center REITs such as Equinix (EQIX) continued to report strong fundamentals despite a challenging macroeconomic environment.
The Fund used index equity futures in order to equitize cash and dividend receivables during the Reporting Period. The Fund’s use of futures helped the Fund track the Index.
On an individual security level, the top positive contributors to the Fund’s performance on an absolute basis during the Reporting Period were Equinix, Inc. REIT, Prologis, Inc. REIT and Welltower, Inc. REIT. The top negative contributors to the Fund’s performance on an absolute basis during the Reporting Period were American Tower Corp. REIT, Crown Castle, Inc., and SBA Communications Corp. REIT.
The views expressed above reflect those of the Fund’s portfolio manager only through the Reporting Period, and do not necessarily represent the views of the Adviser as a whole. Any such views are subject to change at any time based upon market or other conditions and the Adviser disclaims any responsibility to update such views. These views may not be relied on as investment advice and, because investment decisions for a fund are based on numerous factors, may not be relied on as an indication of trading intent on behalf of any fund.
See accompanying notes to financial statements.
28
The Real Estate Select Sector SPDR Fund
Performance Summary (Unaudited)
Performance as of September 30, 2023
| | | | | | | | | | | | | |
| | | | | Cumulative Total Return | | Average Annual Total Return | | |
| | | | | Net
Asset
Value | Market
Value | Real Estate Select Sector Index | S&P 500 Index | | Net
Asset
Value | Market
Value | Real Estate Select Sector Index | S&P 500 Index | |
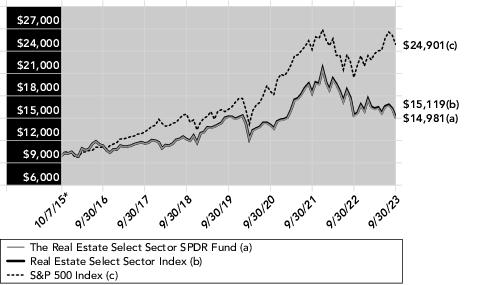
| | | ONE YEAR | | – 1.81% | – 1.82% | – 1.84% | 21.62% | | – 1.81% | – 1.82% | – 1.84% | 21.62% | |
| | | FIVE YEARS | | 23.40% | 23.45% | 24.05% | 60.44% | | 4.30% | 4.30% | 4.40% | 9.92% | |
| | | SINCE INCEPTION (1) | | 49.81% | 49.88% | 51.19% | 149.01% | | 5.19% | 5.20% | 5.32% | 12.11% | |
| | | | | | | | | | | | | |
| (1) | For the period October 7, 2015 to September 30, 2023. |
Comparison of Change in Value of a $10,000 Investment
(Based on Net Asset Value)
Line graph is based on cumulative total return.
* Inception date.
The total expense ratio for The Real Estate Select Sector SPDR Fund as stated in the Fees and Expenses table of the most recent prospectus is 0.10%. Please see the financial highlights for the total expense ratio for the fiscal period ended September 30, 2023.
Performance quoted represents past performance, which is no guarantee of future results. Investment return and principal value will fluctuate, so you may have a gain or loss when shares are sold. Current performance may be higher or lower than that quoted. Visit www.ssga.com for most recent month-end performance. The returns do not reflect the deduction of taxes that a shareholder would pay on Fund distributions or on the redemption or sale of Fund shares. See "Notes to Performance Summaries" on page 1 for more information.
See accompanying notes to financial statements.
29
The Real Estate Select Sector SPDR Fund
Portfolio Statistics (Unaudited)
Top Five Holdings as of September 30, 2023
| | | | |
| | Description | Market Value | % of Net Assets | |
| | Prologis, Inc. REIT | 495,815,594 | 12.1% | |
| | American Tower Corp. REIT | 366,648,511 | 8.9 | |
| | Equinix, Inc. REIT | 325,040,568 | 7.9 | |
| | Welltower, Inc. REIT | 203,242,373 | 5.0 | |
| | Public Storage REIT | 199,441,423 | 4.9 | |
| | TOTAL | 1,590,188,469 | 38.8% | |
(The five largest holdings are subject to change, and there are no guarantees the Fund will continue to remain invested in any particular company.)
Industry Breakdown as of September 30, 2023*
* The Fund’s industry breakdown is expressed as a percentage of total common stock and may change over time.
See accompanying notes to financial statements.
30
THE TECHNOLOGY SELECT SECTOR SPDR FUND
MANAGEMENT’S DISCUSSION OF FUND PERFORMANCE (UNAUDITED)
The Technology Select Sector SPDR Fund (the “Fund”) seeks to provide investment results that, before expenses, correspond generally to the price and yield performance of publicly traded equity securities of companies in the Technology Select Sector Index. The Fund’s benchmark is the Technology Select Sector Index (the “Index”).
For the 12-month period ended September 30, 2023 (the “Reporting Period”), the total return for the Fund was 39.34%, and the Index was 39.46%. The Fund and Index returns reflect the reinvestment of dividends and other income. The Fund’s performance reflects the expenses of managing the Fund, including brokerage and advisory expenses. The Index is unmanaged and Index returns do not reflect fees and expenses of any kind, which would have a negative impact on returns. Management fees, cash drag, and cumulative effects of individual security misweights contributed to the difference between the Fund’s performance and that of the Index.
The Fund had positive performance in three of the four quarters of the Reporting Period. Performance in the first, second and third quarters of the Reporting Period were positive. The positive performance was driven by better optimism around AI, inflation numbers, hopes of a halt in interest rate hikes by the U.S. Federal Reserve, positive corporate earnings, stabilization measures by regulators to head off panic in the banking sector and expectations that inflation could moderate without negative impacts to unemployment. Performance in the fourth quarter of the Reporting Period was negative on the prospects of a high interest rate regime persisting.
The Fund used index futures contracts in order to equitize cash and receivables during the Reporting Period. The Fund’s use of index futures contracts helped the Fund track the Index.
On an individual security level, the top positive contributors to the Fund’s performance on an absolute basis during the Reporting Period were Microsoft Corp., Apple Inc. and NVIDIA Corp.. The top negative contributors to the Fund’s performance on an absolute basis during the Reporting Period were PayPal Holdings, Inc., Fidelity National Information Services, Inc., and Enphase Energy, Inc..
The views expressed above reflect those of the Fund’s portfolio manager only through the Reporting Period, and do not necessarily represent the views of the Adviser as a whole. Any such views are subject to change at any time based upon market or other conditions and the Adviser disclaims any responsibility to update such views. These views may not be relied on as investment advice and, because investment decisions for a fund are based on numerous factors, may not be relied on as an indication of trading intent on behalf of any fund.
See accompanying notes to financial statements.
31
The Technology Select Sector SPDR Fund
Performance Summary (Unaudited)
Performance as of September 30, 2023
| | | | | | | | | | | | | |
| | | | | Cumulative Total Return | | Average Annual Total Return | | |
| | | | | Net
Asset
Value | Market
Value | Technology Select Sector Index | S&P 500 Index | | Net
Asset
Value | Market
Value | Technology Select Sector Index | S&P 500 Index | |
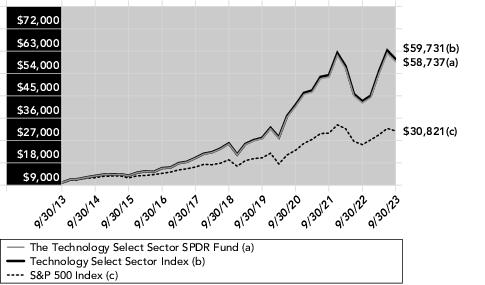
| | | ONE YEAR | | 39.34% | 39.32% | 39.46% | 21.62% | | 39.34% | 39.32% | 39.46% | 21.62% | |
| | | FIVE YEARS | | 129.44% | 129.39% | 131.12% | 60.44% | | 18.07% | 18.06% | 18.24% | 9.92% | |
| | | TEN YEARS | | 487.37% | 487.18% | 497.31% | 208.21% | | 19.37% | 19.36% | 19.57% | 11.91% | |
| | | | | | | | | | | | | |
Comparison of Change in Value of a $10,000 Investment
(Based on Net Asset Value)
Line graph is based on cumulative total return.
The total expense ratio for The Technology Select Sector SPDR Fund as stated in the Fees and Expenses table of the most recent prospectus is 0.10%. Please see the financial highlights for the total expense ratio for the fiscal period ended September 30, 2023.
Performance quoted represents past performance, which is no guarantee of future results. Investment return and principal value will fluctuate, so you may have a gain or loss when shares are sold. Current performance may be higher or lower than that quoted. Visit www.ssga.com for most recent month-end performance. The returns do not reflect the deduction of taxes that a shareholder would pay on Fund distributions or on the redemption or sale of Fund shares. See "Notes to Performance Summaries" on page 1 for more information.
See accompanying notes to financial statements.
32
The Technology Select Sector SPDR Fund
Portfolio Statistics (Unaudited)
Top Five Holdings as of September 30, 2023
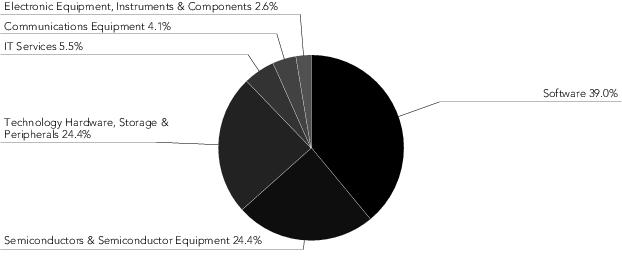
| | | | |
| | Description | Market Value | % of Net Assets | |
| | Apple, Inc. | 11,054,702,518 | 23.2% | |
| | Microsoft Corp. | 10,867,332,256 | 22.9 | |
| | NVIDIA Corp. | 2,148,550,022 | 4.5 | |
| | Broadcom, Inc. | 2,045,046,601 | 4.3 | |
| | Adobe, Inc. | 1,386,651,124 | 2.9 | |
| | TOTAL | 27,502,282,521 | 57.8% | |
(The five largest holdings are subject to change, and there are no guarantees the Fund will continue to remain invested in any particular company.)
Industry Breakdown as of September 30, 2023*
* The Fund’s industry breakdown is expressed as a percentage of total common stock and may change over time.
See accompanying notes to financial statements.
33
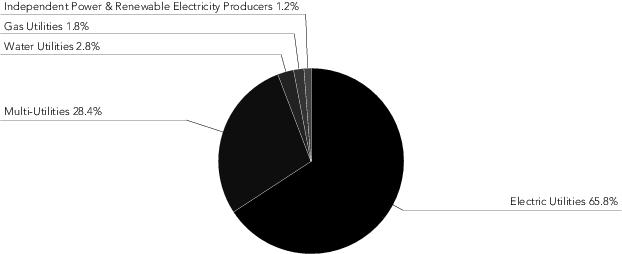
THE UTILITIES SELECT SECTOR SPDR FUND
MANAGEMENT’S DISCUSSION OF FUND PERFORMANCE (UNAUDITED)
The Utilities Select Sector SPDR Fund (the “Fund”) seeks to provide investment results that, before expenses, correspond generally to the price and yield performance of publicly traded equity securities of companies in the Utilities Select Sector Index. The Fund’s benchmark is the Utilities Select Sector Index (the “Index”).
For the 12-month period ended September 30, 2023 (the “Reporting Period”), the total return for the Fund was –7.02%, and the Index was –7.02%. The Fund and Index returns reflect the reinvestment of dividends and other income. The Fund’s performance reflects the expenses of managing the Fund, including brokerage and advisory expenses. The Index is unmanaged and Index returns do not reflect fees and expenses of any kind, which would have a negative impact on returns.
This was a very challenging market environment during the Reporting Period as evidenced by the Fund declining in three of the four quarters. This Fund’s returns were negatively impacted by a general “risk on” market environment as investors became less enamored with the relative defensive nature of this sector. The prior twelve months have been marked by reduced investor appetite for funds with relatively higher dividend yields such as the Utilities Sector which has historically from a sector perspective had one of the higher dividend yields. A primary driver of this was the dramatic increases during the Reporting Period in the Federal Funds rate which has lessened the attractiveness of the sector’s dividend yield. The rise in interest costs has also raised profitability concerns for many of this sector’s constituents as Utilities capital intensive nature tend to be very sensitive to interest rate changes. The Reporting Period was also marked generally by more mild weather conditions which contributed to demand concerns from an energy usage perspective and the accompanying impact on revenue.
The Fund did not invest in derivatives during the Reporting Period.
On an individual security level, the top positive contributors to the Fund’s performance on an absolute basis during the Reporting Period were Constellation Energy Corp., PG & E Corp., and Pinnacle West Capital Corp.. The top negative contributors to the Fund’s performance on an absolute basis during the Reporting Period were Dominion Energy, AES Corp., and NextEra Energy, Inc..
The views expressed above reflect those of the Fund’s portfolio manager only through the Reporting Period, and do not necessarily represent the views of the Adviser as a whole. Any such views are subject to change at any time based upon market or other conditions and the Adviser disclaims any responsibility to update such views. These views may not be relied on as investment advice and, because investment decisions for a fund are based on numerous factors, may not be relied on as an indication of trading intent on behalf of any fund.
See accompanying notes to financial statements.
34
The Utilities Select Sector SPDR Fund
Performance Summary (Unaudited)
Performance as of September 30, 2023
| | | | | | | | | | | | | |
| | | | | Cumulative Total Return | | Average Annual Total Return | | |
| | | | | Net
Asset
Value | Market
Value | Utilities Select Sector Index | S&P 500 Index | | Net
Asset
Value | Market
Value | Utilities Select Sector Index | S&P 500 Index | |
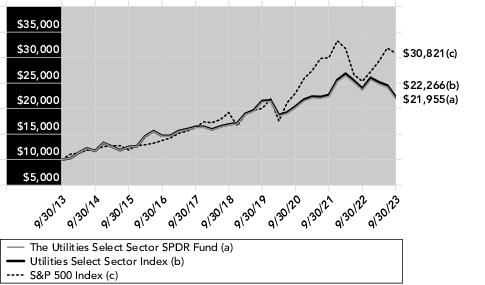
| | | ONE YEAR | | – 7.02% | – 7.09% | – 7.02% | 21.62% | | – 7.02% | – 7.09% | – 7.02% | 21.62% | |
| | | FIVE YEARS | | 30.94% | 30.98% | 31.66% | 60.44% | | 5.54% | 5.55% | 5.66% | 9.92% | |
| | | TEN YEARS | | 119.55% | 119.54% | 122.66% | 208.21% | | 8.18% | 8.18% | 8.33% | 11.91% | |
| | | | | | | | | | | | | |
Comparison of Change in Value of a $10,000 Investment
(Based on Net Asset Value)
Line graph is based on cumulative total return.
The total expense ratio for The Utilities Select Sector SPDR Fund as stated in the Fees and Expenses table of the most recent prospectus is 0.10%. Please see the financial highlights for the total expense ratio for the fiscal period ended September 30, 2023.
Performance quoted represents past performance, which is no guarantee of future results. Investment return and principal value will fluctuate, so you may have a gain or loss when shares are sold. Current performance may be higher or lower than that quoted. Visit www.ssga.com for most recent month-end performance. The returns do not reflect the deduction of taxes that a shareholder would pay on Fund distributions or on the redemption or sale of Fund shares. See "Notes to Performance Summaries" on page 1 for more information.
See accompanying notes to financial statements.
35
The Utilities Select Sector SPDR Fund
Portfolio Statistics (Unaudited)
Top Five Holdings as of September 30, 2023
| | | | |
| | Description | Market Value | % of Net Assets | |
| | NextEra Energy, Inc. | 1,756,955,970 | 13.3% | |
| | Southern Co. | 1,069,587,702 | 8.1 | |
| | Duke Energy Corp. | 1,030,824,285 | 7.8 | |
| | Sempra | 648,777,823 | 4.9 | |
| | American Electric Power Co., Inc. | 587,250,213 | 4.5 | |
| | TOTAL | 5,093,395,993 | 38.6% | |
(The five largest holdings are subject to change, and there are no guarantees the Fund will continue to remain invested in any particular company.)
Industry Breakdown as of September 30, 2023*
* The Fund’s industry breakdown is expressed as a percentage of total common stock and may change over time.
See accompanying notes to financial statements.
36
THE COMMUNICATION SERVICES SELECT SECTOR SPDR FUND
SCHEDULE OF INVESTMENTS
September 30, 2023
| Security Description | | | Shares | | Value |
| COMMON STOCKS — 100.0% | |
| DIVERSIFIED TELECOMMUNICATION SERVICES — 9.2% | |
AT&T, Inc.
| | 41,683,216 | | $ 626,081,904 |
Verizon Communications, Inc.
| | 17,944,307 | | 581,574,990 |
| | | | | | 1,207,656,894 |
| ENTERTAINMENT — 23.3% | |
Activision Blizzard, Inc.
| | 6,515,792 | | 610,073,605 |
Electronic Arts, Inc.
| | 3,744,195 | | 450,801,078 |
Live Nation Entertainment, Inc. (a)
| | 2,153,241 | | 178,805,133 |
Netflix, Inc. (a)
| | 1,355,563 | | 511,860,589 |
Take-Two Interactive Software, Inc. (a)
| | 2,398,816 | | 336,769,778 |
Walt Disney Co. (a)
| | 7,357,698 | | 596,341,423 |
Warner Bros Discovery, Inc. (a)
| | 33,686,033 | | 365,830,318 |
| | | | | | 3,050,481,924 |
| INTERACTIVE MEDIA & SERVICES — 47.3% | |
Alphabet, Inc. Class A (a)
| | 12,121,802 | | 1,586,259,010 |
Alphabet, Inc. Class C (a)
| | 10,311,329 | | 1,359,548,729 |
Match Group, Inc. (a)
| | 4,223,435 | | 165,453,066 |
Meta Platforms, Inc. Class A (a)
| | 10,298,764 | | 3,091,791,940 |
| | | | | | 6,203,052,745 |
| MEDIA — 15.5% | |
Charter Communications, Inc. Class A (a)
| | 1,420,866 | | 624,925,284 |
Comcast Corp. Class A
| | 13,329,729 | | 591,040,184 |
Fox Corp. Class A
| | 3,852,841 | | 120,208,639 |
Fox Corp. Class B
| | 2,003,620 | | 57,864,546 |
Interpublic Group of Cos., Inc.
| | 5,846,142 | | 167,550,430 |
News Corp. Class A
| | 5,785,609 | | 116,059,316 |
| Security Description | | | Shares | | Value |
News Corp. Class B
| | 1,754,322 | | $ 36,612,700 |
Omnicom Group, Inc.
| | 3,000,547 | | 223,480,741 |
Paramount Global Class B (b)
| | 7,323,582 | | 94,474,208 |
| | | | | | 2,032,216,048 |
| WIRELESS TELECOMMUNICATION SERVICES — 4.7% | |
T-Mobile U.S., Inc. (a)
| | 4,361,267 | | 610,795,443 |
TOTAL COMMON STOCKS
(Cost $13,823,439,127)
| | | | | 13,104,203,054 |
| SHORT-TERM INVESTMENT — 0.0% (c) | | | |
State Street Institutional Liquid Reserves Fund, Premier Class 5.45% (d) (e)
(Cost $4,699,324)
| | 4,698,794 | | 4,699,733 |
TOTAL INVESTMENTS — 100.0%
(Cost $13,828,138,451)
| | 13,108,902,787 | |
OTHER ASSETS IN EXCESS OF LIABILITIES — 0.0% (c)
| | 1,414,040 | |
NET ASSETS — 100.0%
| | $ 13,110,316,827 | |
| (a) | Non-income producing security. |
| (b) | All or a portion of the shares of the security are on loan at September 30, 2023. |
| (c) | Amount is less than 0.05% of net assets. |
| (d) | The Fund invested in certain money market funds managed by SSGA Funds Management, Inc. Amounts related to these investments during the year ended September 30, 2023 are shown in the Affiliate Table below. |
| (e) | The rate shown is the annualized seven-day yield at September 30, 2023. |
The following table summarizes the value of the Fund's investments according to the fair value hierarchy as of September 30, 2023.
| Description | | Level 1 –
Quoted Prices | | Level 2 –
Other Significant
Observable Inputs | | Level 3 –
Significant
Unobservable Inputs | | Total |
| ASSETS: | | | | | | | | |
| INVESTMENTS: | | | | | | | | |
Common Stocks
| | $13,104,203,054 | | $— | | $— | | $13,104,203,054 |
Short-Term Investment
| | 4,699,733 | | — | | — | | 4,699,733 |
TOTAL INVESTMENTS
| | $13,108,902,787 | | $— | | $— | | $13,108,902,787 |
Affiliate Table
| | Number of
Shares Held
at
9/30/22 | | Value at
9/30/22 | | Cost of
Purchases | | Proceeds
from
Shares Sold | | Realized
Gain (Loss) | | Change in
Unrealized
Appreciation/
Depreciation | | Number of
Shares Held
at
9/30/23 | | Value at
9/30/23 | | Dividend
Income |
State Street Institutional Liquid Reserves Fund, Premier Class
| 5,928,151 | | $ 5,929,337 | | $199,939,492 | | $201,168,389 | | $(141) | | $(566) | | 4,698,794 | | $4,699,733 | | $352,165 |
State Street Navigator Securities Lending Portfolio II
| 51,992,399 | | 51,992,399 | | 326,268,838 | | 378,261,237 | | — | | — | | — | | — | | 54,022 |
Total
| | | $57,921,736 | | $526,208,330 | | $579,429,626 | | $(141) | | $(566) | | | | $4,699,733 | | $406,187 |
See accompanying notes to financial statements.
37
THE CONSUMER DISCRETIONARY SELECT SECTOR SPDR FUND
SCHEDULE OF INVESTMENTS
September 30, 2023
| Security Description | | | Shares | | Value |
| COMMON STOCKS — 100.0% | |
| AUTOMOBILE COMPONENTS — 1.2% | |
Aptiv PLC (a)
| | 1,618,544 | | $ 159,572,253 |
BorgWarner, Inc.
| | 1,345,176 | | 54,304,755 |
| | | | | | 213,877,008 |
| AUTOMOBILES — 23.1% | |
Ford Motor Co.
| | 22,498,208 | | 279,427,743 |
General Motors Co.
| | 7,873,871 | | 259,601,527 |
Tesla, Inc. (a)
| | 13,934,803 | | 3,486,766,407 |
| | | | | | 4,025,795,677 |
| BROADLINE RETAIL — 23.2% | |
Amazon.com, Inc. (a)
| | 30,343,165 | | 3,857,223,135 |
eBay, Inc.
| | 3,045,370 | | 134,270,363 |
Etsy, Inc. (a)
| | 703,953 | | 45,461,285 |
| | | | | | 4,036,954,783 |
| DISTRIBUTORS — 1.6% | |
Genuine Parts Co.
| | 803,727 | | 116,042,104 |
LKQ Corp.
| | 1,531,189 | | 75,809,167 |
Pool Corp. (b)
| | 223,516 | | 79,594,048 |
| | | | | | 271,445,319 |
| HOTELS, RESTAURANTS & LEISURE — 23.4% | |
Airbnb, Inc. Class A (a)
| | 2,439,958 | | 334,786,637 |
Booking Holdings, Inc. (a)
| | 204,249 | | 629,893,704 |
Caesars Entertainment, Inc. (a)
| | 1,232,072 | | 57,106,537 |
Carnival Corp. (a)
| | 5,764,707 | | 79,091,780 |
Chipotle Mexican Grill, Inc. (a)
| | 157,837 | | 289,130,552 |
Darden Restaurants, Inc.
| | 691,739 | | 99,070,860 |
Domino's Pizza, Inc.
| | 200,846 | | 76,078,456 |
Expedia Group, Inc. (a)
| | 788,868 | | 81,308,625 |
Hilton Worldwide Holdings, Inc.
| | 1,496,575 | | 224,755,634 |
Las Vegas Sands Corp.
| | 1,881,135 | | 86,231,228 |
Marriott International, Inc. Class A
| | 1,433,684 | | 281,804,927 |
McDonald's Corp.
| | 2,937,617 | | 773,885,822 |
MGM Resorts International (a)
| | 1,606,444 | | 59,052,881 |
Norwegian Cruise Line Holdings Ltd. (a) (b)
| | 2,434,569 | | 40,121,697 |
Royal Caribbean Cruises Ltd. (a)
| | 1,348,702 | | 124,269,402 |
Starbucks Corp.
| | 6,554,871 | | 598,263,076 |
Wynn Resorts Ltd.
| | 554,251 | | 51,218,335 |
Yum! Brands, Inc.
| | 1,603,557 | | 200,348,412 |
| | | | | | 4,086,418,565 |
| HOUSEHOLD DURABLES — 4.1% | |
DR Horton, Inc.
| | 1,742,379 | | 187,253,471 |
Garmin Ltd.
| | 876,489 | | 92,206,643 |
Lennar Corp. Class A
| | 1,445,208 | | 162,195,694 |
Mohawk Industries, Inc. (a)
| | 302,458 | | 25,953,921 |
NVR, Inc. (a)
| | 18,667 | | 111,316,921 |
PulteGroup, Inc.
| | 1,255,817 | | 92,993,249 |
Whirlpool Corp.
| | 313,726 | | 41,945,166 |
| | | | | | 713,865,065 |
| Security Description | | | Shares | | Value |
| LEISURE EQUIPMENT & PRODUCTS — 0.3% | |
Hasbro, Inc.
| | 746,367 | | $ 49,364,713 |
| SPECIALTY RETAIL — 18.7% | |
AutoZone, Inc. (a)
| | 103,901 | | 263,907,501 |
Bath & Body Works, Inc.
| | 1,310,015 | | 44,278,507 |
Best Buy Co., Inc.
| | 1,111,425 | | 77,210,695 |
CarMax, Inc. (a)
| | 905,400 | | 64,038,942 |
Home Depot, Inc.
| | 2,495,340 | | 753,991,934 |
Lowe's Cos., Inc.
| | 3,350,502 | | 696,368,336 |
O'Reilly Automotive, Inc. (a)
| | 345,618 | | 314,118,375 |
Ross Stores, Inc.
| | 1,949,504 | | 220,196,477 |
TJX Cos., Inc.
| | 6,576,743 | | 584,540,918 |
Tractor Supply Co. (b)
| | 622,620 | | 126,422,991 |
Ulta Beauty, Inc. (a)
| | 285,013 | | 113,848,443 |
| | | | | | 3,258,923,119 |
| TEXTILES, APPAREL & LUXURY GOODS — 4.4% | |
NIKE, Inc. Class B
| | 7,010,796 | | 670,372,314 |
Ralph Lauren Corp. (b)
| | 231,137 | | 26,832,694 |
Tapestry, Inc.
| | 1,326,524 | | 38,137,565 |
VF Corp. (b)
| | 1,891,592 | | 33,424,431 |
| | | | | | 768,767,004 |
TOTAL COMMON STOCKS
(Cost $19,249,538,579)
| | | | | 17,425,411,253 |
| SHORT-TERM INVESTMENTS — 0.2% | | | |
State Street Institutional Liquid Reserves Fund, Premier Class 5.45% (c) (d)
| | 3,802,669 | | 3,803,429 |
State Street Navigator Securities Lending Portfolio II (e) (f)
| | 32,385,839 | | 32,385,839 |
TOTAL SHORT-TERM INVESTMENTS
(Cost $36,189,238)
| | 36,189,268 | |
TOTAL INVESTMENTS — 100.2%
(Cost $19,285,727,817)
| | 17,461,600,521 | |
LIABILITIES IN EXCESS OF OTHER ASSETS — (0.2)%
| | (29,490,305) | |
NET ASSETS — 100.0%
| | $ 17,432,110,216 | |
| (a) | Non-income producing security. |
| (b) | All or a portion of the shares of the security are on loan at September 30, 2023. |
| (c) | The Fund invested in certain money market funds managed by SSGA Funds Management, Inc. Amounts related to these investments during the year ended September 30, 2023 are shown in the Affiliate Table below. |
| (d) | The rate shown is the annualized seven-day yield at September 30, 2023. |
| (e) | The Fund invested in an affiliated entity. Amounts related to these investments during the year ended September 30, 2023 are shown in the Affiliate Table below. |
| (f) | Investment of cash collateral for securities loaned. |
See accompanying notes to financial statements.
38
THE CONSUMER DISCRETIONARY SELECT SECTOR SPDR FUND
SCHEDULE OF INVESTMENTS (continued)
September 30, 2023
The following table summarizes the value of the Fund's investments according to the fair value hierarchy as of September 30, 2023.
| Description | | Level 1 –
Quoted Prices | | Level 2 –
Other Significant
Observable Inputs | | Level 3 –
Significant
Unobservable Inputs | | Total |
| ASSETS: | | | | | | | | |
| INVESTMENTS: | | | | | | | | |
Common Stocks
| | $17,425,411,253 | | $— | | $— | | $17,425,411,253 |
Short-Term Investments
| | 36,189,268 | | — | | — | | 36,189,268 |
TOTAL INVESTMENTS
| | $17,461,600,521 | | $— | | $— | | $17,461,600,521 |
Affiliate Table
| | Number of
Shares Held
at
9/30/22 | | Value at
9/30/22 | | Cost of
Purchases | | Proceeds
from
Shares Sold | | Realized
Gain (Loss) | | Change in
Unrealized
Appreciation/
Depreciation | | Number of
Shares Held
at
9/30/23 | | Value at
9/30/23 | | Dividend
Income |
State Street Institutional Liquid Reserves Fund, Premier Class
| 17,296,217 | | $ 17,299,677 | | $ 196,451,068 | | $ 209,948,807 | | $3,832 | | $(2,341) | | 3,802,669 | | $ 3,803,429 | | $ 794,998 |
State Street Navigator Securities Lending Portfolio II
| 115,679,767 | | 115,679,767 | | 2,025,927,182 | | 2,109,221,110 | | — | | — | | 32,385,839 | | 32,385,839 | | 294,123 |
Total
| | | $132,979,444 | | $2,222,378,250 | | $2,319,169,917 | | $3,832 | | $(2,341) | | | | $36,189,268 | | $1,089,121 |
See accompanying notes to financial statements.
39
THE CONSUMER STAPLES SELECT SECTOR SPDR FUND
SCHEDULE OF INVESTMENTS
September 30, 2023
| Security Description | | | Shares | | Value |
| COMMON STOCKS — 99.6% | |
| BEVERAGES — 20.8% | |
Brown-Forman Corp. Class B
| | 1,444,928 | | $ 83,357,896 |
Coca-Cola Co.
| | 12,918,831 | | 723,196,160 |
Constellation Brands, Inc. Class A
| | 1,273,898 | | 320,168,784 |
Keurig Dr Pepper, Inc.
| | 7,945,124 | | 250,827,565 |
Molson Coors Beverage Co. Class B
| | 1,465,890 | | 93,215,945 |
Monster Beverage Corp. (a)
| | 5,873,694 | | 311,012,097 |
PepsiCo, Inc.
| | 9,424,924 | | 1,596,959,123 |
| | | | | | 3,378,737,570 |
| CONSUMER STAPLES DISTRIBUTION & RETAIL — 28.8% | |
Costco Wholesale Corp.
| | 3,034,099 | | 1,714,144,571 |
Dollar General Corp.
| | 1,732,194 | | 183,266,125 |
Dollar Tree, Inc. (a)
| | 1,651,425 | | 175,794,191 |
Kroger Co.
| | 5,214,910 | | 233,367,223 |
Sysco Corp.
| | 3,989,127 | | 263,481,838 |
Target Corp.
| | 3,645,129 | | 403,041,914 |
Walgreens Boots Alliance, Inc. (b)
| | 5,658,583 | | 125,846,886 |
Walmart, Inc.
| | 9,771,465 | | 1,562,750,397 |
| | | | | | 4,661,693,145 |
| FOOD PRODUCTS — 17.2% | |
Archer-Daniels-Midland Co.
| | 4,233,883 | | 319,319,456 |
Bunge Ltd.
| | 1,189,682 | | 128,783,077 |
Campbell Soup Co.
| | 1,553,722 | | 63,826,900 |
Conagra Brands, Inc. (b)
| | 3,773,970 | | 103,482,257 |
General Mills, Inc.
| | 4,621,504 | | 295,730,041 |
Hershey Co.
| | 1,183,451 | | 236,784,876 |
Hormel Foods Corp.
| | 2,286,462 | | 86,954,150 |
J M Smucker Co.
| | 806,375 | | 99,111,551 |
Kellogg Co.
| | 2,081,838 | | 123,890,179 |
Kraft Heinz Co.
| | 6,305,309 | | 212,110,595 |
Lamb Weston Holdings, Inc.
| | 1,151,458 | | 106,463,807 |
McCormick & Co., Inc.
| | 1,983,099 | | 150,001,608 |
Mondelez International, Inc. Class A
| | 10,743,911 | | 745,627,423 |
Tyson Foods, Inc. Class A
| | 2,255,156 | | 113,862,827 |
| | | | | | 2,785,948,747 |
| HOUSEHOLD PRODUCTS — 21.3% | |
Church & Dwight Co., Inc.
| | 1,939,862 | | 177,749,555 |
Clorox Co.
| | 977,886 | | 128,161,739 |
| Security Description | | | Shares | | Value |
Colgate-Palmolive Co.
| | 6,528,713 | | $ 464,256,781 |
Kimberly-Clark Corp.
| | 2,670,717 | | 322,756,150 |
Procter & Gamble Co.
| | 16,139,559 | | 2,354,116,076 |
| | | | | | 3,447,040,301 |
| PERSONAL CARE PRODUCTS — 3.3% | |
Estee Lauder Cos., Inc. Class A
| | 1,831,171 | | 264,695,768 |
Kenvue, Inc.
| | 13,610,604 | | 273,300,928 |
| | | | | | 537,996,696 |
| TOBACCO — 8.2% | |
Altria Group, Inc.
| | 14,015,014 | | 589,331,338 |
Philip Morris International, Inc.
| | 8,044,779 | | 744,785,640 |
| | | | | | 1,334,116,978 |
TOTAL COMMON STOCKS
(Cost $18,487,903,448)
| | | | | 16,145,533,437 |
| SHORT-TERM INVESTMENTS — 0.2% | | | |
State Street Institutional Liquid Reserves Fund, Premier Class 5.45% (c) (d)
| | 16,592,825 | | 16,596,143 |
State Street Navigator Securities Lending Portfolio II (e) (f)
| | 5,240,094 | | 5,240,094 |
TOTAL SHORT-TERM INVESTMENTS
(Cost $21,836,237)
| | 21,836,237 | |
TOTAL INVESTMENTS — 99.8%
(Cost $18,509,739,685)
| | 16,167,369,674 | |
OTHER ASSETS IN EXCESS OF LIABILITIES — 0.2%
| | 38,863,638 | |
NET ASSETS — 100.0%
| | $ 16,206,233,312 | |
| (a) | Non-income producing security. |
| (b) | All or a portion of the shares of the security are on loan at September 30, 2023. |
| (c) | The Fund invested in certain money market funds managed by SSGA Funds Management, Inc. Amounts related to these investments during the year ended September 30, 2023 are shown in the Affiliate Table below. |
| (d) | The rate shown is the annualized seven-day yield at September 30, 2023. |
| (e) | The Fund invested in an affiliated entity. Amounts related to these investments during the year ended September 30, 2023 are shown in the Affiliate Table below. |
| (f) | Investment of cash collateral for securities loaned. |
The following table summarizes the value of the Fund's investments according to the fair value hierarchy as of September 30, 2023.
| Description | | Level 1 –
Quoted Prices | | Level 2 –
Other Significant
Observable Inputs | | Level 3 –
Significant
Unobservable Inputs | | Total |
| ASSETS: | | | | | | | | |
| INVESTMENTS: | | | | | | | | |
Common Stocks
| | $16,145,533,437 | | $— | | $— | | $16,145,533,437 |
Short-Term Investments
| | 21,836,237 | | — | | — | | 21,836,237 |
TOTAL INVESTMENTS
| | $16,167,369,674 | | $— | | $— | | $16,167,369,674 |
See accompanying notes to financial statements.
40
THE CONSUMER STAPLES SELECT SECTOR SPDR FUND
SCHEDULE OF INVESTMENTS (continued)
September 30, 2023
Affiliate Table
| | Number of
Shares Held
at
9/30/22 | | Value at
9/30/22 | | Cost of
Purchases | | Proceeds
from
Shares Sold | | Realized
Gain (Loss) | | Change in
Unrealized
Appreciation/
Depreciation | | Number of
Shares Held
at
9/30/23 | | Value at
9/30/23 | | Dividend
Income |
State Street Institutional Liquid Reserves Fund, Premier Class
| 16,130,664 | | $16,133,890 | | $ 730,250,823 | | $ 729,788,774 | | $711 | | $(507) | | 16,592,825 | | $16,596,143 | | $1,361,950 |
State Street Navigator Securities Lending Portfolio II
| 24,693,312 | | 24,693,312 | | 2,102,529,538 | | 2,121,982,756 | | — | | — | | 5,240,094 | | 5,240,094 | | 105,107 |
Total
| | | $40,827,202 | | $2,832,780,361 | | $2,851,771,530 | | $711 | | $(507) | | | | $21,836,237 | | $1,467,057 |
See accompanying notes to financial statements.
41
THE ENERGY SELECT SECTOR SPDR FUND
SCHEDULE OF INVESTMENTS
September 30, 2023
| Security Description | | | Shares | | Value |
| COMMON STOCKS — 99.8% | |
| ENERGY EQUIPMENT & SERVICES — 9.5% | |
Baker Hughes Co.
| | 27,912,804 | | $ 985,880,237 |
Halliburton Co.
| | 24,841,082 | | 1,006,063,821 |
Schlumberger NV
| | 29,294,011 | | 1,707,840,842 |
| | | | | | 3,699,784,900 |
| OIL, GAS & CONSUMABLE FUELS — 90.3% | |
APA Corp.
| | 8,494,649 | | 349,130,074 |
Chevron Corp.
| | 43,114,552 | | 7,269,975,758 |
ConocoPhillips
| | 14,362,962 | | 1,720,682,848 |
Coterra Energy, Inc.
| | 20,940,537 | | 566,441,526 |
Devon Energy Corp.
| | 17,712,750 | | 844,898,175 |
Diamondback Energy, Inc.
| | 4,943,537 | | 765,655,010 |
EOG Resources, Inc.
| | 14,149,012 | | 1,793,528,761 |
EQT Corp. (a)
| | 9,998,372 | | 405,733,936 |
Exxon Mobil Corp.
| | 77,925,324 | | 9,162,459,596 |
Hess Corp.
| | 7,639,817 | | 1,168,892,001 |
Kinder Morgan, Inc.
| | 53,591,683 | | 888,550,104 |
Marathon Oil Corp.
| | 16,744,805 | | 447,923,534 |
Marathon Petroleum Corp.
| | 11,054,079 | | 1,672,924,316 |
Occidental Petroleum Corp.
| | 18,343,410 | | 1,190,120,441 |
ONEOK, Inc.
| | 16,103,050 | | 1,021,416,461 |
Phillips 66
| | 12,310,369 | | 1,479,090,835 |
Pioneer Natural Resources Co.
| | 6,445,365 | | 1,479,533,536 |
Targa Resources Corp.
| | 6,184,737 | | 530,155,656 |
Valero Energy Corp.
| | 9,762,641 | | 1,383,463,856 |
Williams Cos., Inc. (a)
| | 33,629,035 | | 1,132,962,189 |
| | | | | | 35,273,538,613 |
TOTAL COMMON STOCKS
(Cost $36,008,692,769)
| | | | | 38,973,323,513 |
| Security Description | | | Shares | | Value |
| SHORT-TERM INVESTMENTS — 0.2% | | | |
State Street Institutional Liquid Reserves Fund, Premier Class 5.45% (b) (c)
| | 56,611,731 | | $ 56,623,053 |
State Street Navigator Securities Lending Portfolio II (d) (e)
| | 14,004,048 | | 14,004,048 |
TOTAL SHORT-TERM INVESTMENTS
(Cost $70,627,024)
| | 70,627,101 | |
TOTAL INVESTMENTS — 100.0%
(Cost $36,079,319,793)
| | 39,043,950,614 | |
LIABILITIES IN EXCESS OF OTHER ASSETS — (0.0)% (f)
| | (4,300,503) | |
NET ASSETS — 100.0%
| | $ 39,039,650,111 | |
| (a) | All or a portion of the shares of the security are on loan at September 30, 2023. |
| (b) | The Fund invested in certain money market funds managed by SSGA Funds Management, Inc. Amounts related to these investments during the year ended September 30, 2023 are shown in the Affiliate Table below. |
| (c) | The rate shown is the annualized seven-day yield at September 30, 2023. |
| (d) | The Fund invested in an affiliated entity. Amounts related to these investments during the year ended September 30, 2023 are shown in the Affiliate Table below. |
| (e) | Investment of cash collateral for securities loaned. |
| (f) | Amount is less than 0.05% of net assets. |
At September 30, 2023, open futures contracts were as follows:
| Description | | Number of
Contracts | | Expiration
Date | | Notional
Amount | | Value | | Unrealized
Appreciation
(Depreciation) |
| E-mini S&P 500 Energy Select Sector (long) | | 730 | | 12/15/2023 | | $70,852,340 | | $69,753,909 | | $(1,103,249) |
During the year ended September 30, 2023, average notional value related to futures contracts was $161,381,662.
See accompanying notes to financial statements.
42
THE ENERGY SELECT SECTOR SPDR FUND
SCHEDULE OF INVESTMENTS (continued)
September 30, 2023
The following table summarizes the value of the Fund's investments according to the fair value hierarchy as of September 30, 2023.
| Description | | Level 1 –
Quoted Prices | | Level 2 –
Other Significant
Observable Inputs | | Level 3 –
Significant
Unobservable Inputs | | Total |
| ASSETS: | | | | | | | | |
| INVESTMENTS: | | | | | | | | |
Common Stocks
| | $38,973,323,513 | | $— | | $— | | $38,973,323,513 |
Short-Term Investments
| | 70,627,101 | | — | | — | | 70,627,101 |
TOTAL INVESTMENTS
| | $39,043,950,614 | | $— | | $— | | $39,043,950,614 |
| OTHER FINANCIAL INSTRUMENTS: | | | | | | | | |
Futures Contracts - Unrealized Depreciation
| | $ (1,103,249) | | $— | | $— | | $ (1,103,249) |
TOTAL OTHER FINANCIAL INSTRUMENTS:
| | $ (1,103,249) | | $— | | $— | | $ (1,103,249) |
Affiliate Table
| | Number of
Shares Held
at
9/30/22 | | Value at
9/30/22 | | Cost of
Purchases | | Proceeds
from
Shares Sold | | Realized
Gain (Loss) | | Change in
Unrealized
Appreciation/
Depreciation | | Number of
Shares Held
at
9/30/23 | | Value at
9/30/23 | | Dividend
Income |
State Street Institutional Liquid Reserves Fund, Premier Class
| 97,350,272 | | $ 97,369,742 | | $2,082,518,219 | | $2,123,262,665 | | $635 | | $(2,878) | | 56,611,731 | | $56,623,053 | | $4,504,458 |
State Street Navigator Securities Lending Portfolio II
| 32,065,518 | | 32,065,518 | | 3,301,716,399 | | 3,319,777,869 | | — | | — | | 14,004,048 | | 14,004,048 | | 235,128 |
Total
| | | $129,435,260 | | $5,384,234,618 | | $5,443,040,534 | | $635 | | $(2,878) | | | | $70,627,101 | | $4,739,586 |
See accompanying notes to financial statements.
43
THE FINANCIAL SELECT SECTOR SPDR FUND
SCHEDULE OF INVESTMENTS
September 30, 2023
| Security Description | | | Shares | | Value |
| COMMON STOCKS — 99.8% | |
| BANKS — 29.5% | |
Bank of America Corp.
| | 45,859,314 | | $ 1,255,628,017 |
Bank of New York Mellon Corp.
| | 5,167,223 | | 220,382,061 |
Citigroup, Inc.
| | 12,773,924 | | 525,391,494 |
Citizens Financial Group, Inc.
| | 3,133,434 | | 83,976,031 |
Comerica, Inc.
| | 874,167 | | 36,321,639 |
Fifth Third Bancorp
| | 4,517,518 | | 114,428,731 |
Goldman Sachs Group, Inc.
| | 2,186,837 | | 707,594,848 |
Huntington Bancshares, Inc.
| | 9,604,828 | | 99,890,211 |
JPMorgan Chase & Co.
| | 19,277,278 | | 2,795,590,856 |
KeyCorp
| | 6,208,377 | | 66,802,137 |
M&T Bank Corp.
| | 1,100,587 | | 139,169,226 |
Morgan Stanley
| | 8,463,236 | | 691,192,484 |
Northern Trust Corp.
| | 1,373,296 | | 95,416,606 |
PNC Financial Services Group, Inc.
| | 2,642,367 | | 324,403,397 |
Regions Financial Corp.
| | 6,225,617 | | 107,080,612 |
State Street Corp. (a)
| | 2,114,046 | | 141,556,520 |
Truist Financial Corp.
| | 8,837,057 | | 252,828,201 |
U.S. Bancorp
| | 10,329,781 | | 341,502,560 |
Wells Fargo & Co.
| | 24,270,261 | | 991,682,864 |
Zions Bancorp NA
| | 982,923 | | 34,294,184 |
| | | | | | 9,025,132,679 |
| CAPITAL MARKETS — 16.1% | |
Ameriprise Financial, Inc.
| | 680,880 | | 224,472,519 |
BlackRock, Inc.
| | 931,005 | | 601,885,422 |
Blackstone, Inc. (b)
| | 4,707,976 | | 504,412,549 |
Cboe Global Markets, Inc.
| | 700,086 | | 109,360,434 |
Charles Schwab Corp.
| | 9,863,708 | | 541,517,569 |
CME Group, Inc.
| | 2,386,307 | | 477,786,388 |
FactSet Research Systems, Inc.
| | 252,990 | | 110,622,407 |
Franklin Resources, Inc.
| | 1,887,067 | | 46,384,107 |
Intercontinental Exchange, Inc.
| | 3,797,219 | | 417,770,034 |
Invesco Ltd.
| | 2,976,377 | | 43,216,994 |
MarketAxess Holdings, Inc.
| | 249,824 | | 53,372,399 |
Moody's Corp.
| | 1,047,022 | | 331,036,946 |
MSCI, Inc.
| | 524,742 | | 269,234,625 |
Nasdaq, Inc.
| | 2,249,120 | | 109,284,741 |
Raymond James Financial, Inc.
| | 1,246,945 | | 125,230,686 |
S&P Global, Inc.
| | 2,158,594 | | 788,771,834 |
T Rowe Price Group, Inc.
| | 1,488,050 | | 156,051,804 |
| | | | | | 4,910,411,458 |
| CONSUMER FINANCE — 3.4% | |
American Express Co.
| | 3,859,287 | | 575,767,028 |
Capital One Financial Corp.
| | 2,530,730 | | 245,607,347 |
Discover Financial Services
| | 1,658,362 | | 143,663,900 |
Synchrony Financial
| | 2,774,457 | | 84,815,150 |
| | | | | | 1,049,853,425 |
| FINANCIAL SERVICES — 33.9% | |
Berkshire Hathaway, Inc. Class B (c)
| | 12,097,204 | | 4,237,650,561 |
Fidelity National Information Services, Inc.
| | 3,930,837 | | 217,257,361 |
| Security Description | | | Shares | | Value |
Fiserv, Inc. (c)
| | 4,043,747 | | $ 456,781,661 |
FleetCor Technologies, Inc. (c)
| | 490,622 | | 125,275,421 |
Global Payments, Inc.
| | 1,724,938 | | 199,040,596 |
Jack Henry & Associates, Inc.
| | 483,477 | | 73,072,714 |
Mastercard, Inc. Class A
| | 5,519,078 | | 2,185,058,171 |
PayPal Holdings, Inc. (c)
| | 7,284,153 | | 425,831,584 |
Visa, Inc. Class A (b)
| | 10,658,467 | | 2,451,553,995 |
| | | | | | 10,371,522,064 |
| INSURANCE — 16.9% | |
Aflac, Inc.
| | 3,586,502 | | 275,264,029 |
Allstate Corp.
| | 1,735,392 | | 193,340,022 |
American International Group, Inc.
| | 4,723,166 | | 286,223,860 |
Aon PLC Class A
| | 1,345,759 | | 436,321,983 |
Arch Capital Group Ltd. (c)
| | 2,474,406 | | 197,234,902 |
Arthur J Gallagher & Co.
| | 1,429,703 | | 325,872,205 |
Assurant, Inc.
| | 351,760 | | 50,505,701 |
Brown & Brown, Inc.
| | 1,561,779 | | 109,074,645 |
Chubb Ltd.
| | 2,724,552 | | 567,197,235 |
Cincinnati Financial Corp.
| | 1,040,888 | | 106,472,434 |
Everest Group Ltd.
| | 287,300 | | 106,780,791 |
Globe Life, Inc.
| | 576,990 | | 62,736,123 |
Hartford Financial Services Group, Inc.
| | 2,028,978 | | 143,874,830 |
Loews Corp.
| | 1,226,803 | | 77,668,898 |
Marsh & McLennan Cos., Inc.
| | 3,276,638 | | 623,544,211 |
MetLife, Inc.
| | 4,190,879 | | 263,648,198 |
Principal Financial Group, Inc.
| | 1,475,449 | | 106,335,609 |
Progressive Corp.
| | 3,882,778 | | 540,870,975 |
Prudential Financial, Inc.
| | 2,408,364 | | 228,529,660 |
Travelers Cos., Inc.
| | 1,518,981 | | 248,064,787 |
W R Berkley Corp.
| | 1,349,594 | | 85,685,723 |
Willis Towers Watson PLC
| | 695,391 | | 145,308,903 |
| | | | | | 5,180,555,724 |
TOTAL COMMON STOCKS
(Cost $34,607,606,368)
| | | | | 30,537,475,350 |
| SHORT-TERM INVESTMENTS — 1.7% | | | |
State Street Institutional Liquid Reserves Fund, Premier Class 5.45% (d) (e)
| | 42,694,543 | | 42,703,082 |
State Street Navigator Securities Lending Portfolio II (a) (f)
| | 483,314,119 | | 483,314,119 |
TOTAL SHORT-TERM INVESTMENTS
(Cost $526,017,201)
| | 526,017,201 | |
TOTAL INVESTMENTS — 101.5%
(Cost $35,133,623,569)
| | 31,063,492,551 | |
LIABILITIES IN EXCESS OF OTHER ASSETS — (1.5)%
| | (465,183,250) | |
NET ASSETS — 100.0%
| | $ 30,598,309,301 | |
| (a) | The Fund invested in an affiliated entity. Amounts related to these investments during the year ended September 30, 2023 are shown in the Affiliate Table below. |
| (b) | All or a portion of the shares of the security are on loan at September 30, 2023. |
See accompanying notes to financial statements.
44
THE FINANCIAL SELECT SECTOR SPDR FUND
SCHEDULE OF INVESTMENTS (continued)
September 30, 2023
| (c) | Non-income producing security. |
| (d) | The Fund invested in certain money market funds managed by SSGA Funds Management, Inc. Amounts related to these investments during the year ended September 30, 2023 are shown in the Affiliate Table below. |
| (e) | The rate shown is the annualized seven-day yield at September 30, 2023. |
| (f) | Investment of cash collateral for securities loaned. |
The following table summarizes the value of the Fund's investments according to the fair value hierarchy as of September 30, 2023.
| Description | | Level 1 –
Quoted Prices | | Level 2 –
Other Significant
Observable Inputs | | Level 3 –
Significant
Unobservable Inputs | | Total |
| ASSETS: | | | | | | | | |
| INVESTMENTS: | | | | | | | | |
Common Stocks
| | $30,537,475,350 | | $— | | $— | | $30,537,475,350 |
Short-Term Investments
| | 526,017,201 | | — | | — | | 526,017,201 |
TOTAL INVESTMENTS
| | $31,063,492,551 | | $— | | $— | | $31,063,492,551 |
Affiliate Table
| | Number of
Shares Held
at
9/30/22 | | Value at
9/30/22 | | Cost of
Purchases | | Proceeds
from
Shares Sold | | Realized
Gain (Loss) | | Change in
Unrealized
Appreciation/
Depreciation | | Number of
Shares Held
at
9/30/23 | | Value at
9/30/23 | | Dividend
Income |
State Street Corp.
| 2,979,555 | | $181,186,739 | | $ 221,690,258 | | $ 281,343,971 | | $(30,551,942) | | $50,575,436 | | 2,114,046 | | $141,556,520 | | $ 6,318,866 |
State Street Institutional Liquid Reserves Fund, Premier Class
| 62,474,114 | | 62,486,609 | | 954,032,687 | | 973,807,642 | | (2,181) | | (6,391) | | 42,694,543 | | 42,703,082 | | 2,512,228 |
State Street Navigator Securities Lending Portfolio II
| 122,805,648 | | 122,805,648 | | 3,567,000,505 | | 3,206,492,034 | | — | | — | | 483,314,119 | | 483,314,119 | | 1,353,830 |
Total
| | | $366,478,996 | | $4,742,723,450 | | $4,461,643,647 | | $(30,554,123) | | $50,569,045 | | | | $667,573,721 | | $10,184,924 |
See accompanying notes to financial statements.
45
THE HEALTH CARE SELECT SECTOR SPDR FUND
SCHEDULE OF INVESTMENTS
September 30, 2023
| Security Description | | | Shares | | Value |
| COMMON STOCKS — 99.8% | |
| BIOTECHNOLOGY — 15.8% | |
AbbVie, Inc.
| | 13,840,079 | | $ 2,063,002,176 |
Amgen, Inc.
| | 4,193,711 | | 1,127,101,768 |
Biogen, Inc. (a)
| | 1,136,065 | | 291,980,066 |
Gilead Sciences, Inc.
| | 9,770,287 | | 732,185,308 |
Incyte Corp. (a) (b)
| | 1,453,202 | | 83,951,479 |
Moderna, Inc. (a) (b)
| | 2,596,316 | | 268,173,480 |
Regeneron Pharmaceuticals, Inc. (a)
| | 837,019 | | 688,833,156 |
Vertex Pharmaceuticals, Inc. (a)
| | 2,023,801 | | 703,756,560 |
| | | | | | 5,958,983,993 |
| HEALTH CARE EQUIPMENT & SUPPLIES — 19.3% | |
Abbott Laboratories
| | 13,607,305 | | 1,317,867,489 |
Align Technology, Inc. (a)
| | 558,534 | | 170,531,601 |
Baxter International, Inc.
| | 3,970,198 | | 149,835,273 |
Becton Dickinson & Co.
| | 2,274,744 | | 588,089,566 |
Boston Scientific Corp. (a)
| | 11,481,313 | | 606,213,326 |
Cooper Cos., Inc.
| | 388,298 | | 123,482,647 |
DENTSPLY SIRONA, Inc.
| | 1,673,187 | | 57,156,068 |
Dexcom, Inc. (a)
| | 3,042,431 | | 283,858,812 |
Edwards Lifesciences Corp. (a)
| | 4,757,834 | | 329,622,740 |
GE HealthCare Technologies, Inc. (b)
| | 3,069,088 | | 208,820,748 |
Hologic, Inc. (a)
| | 1,920,679 | | 133,295,123 |
IDEXX Laboratories, Inc. (a)
| | 651,557 | | 284,906,329 |
Insulet Corp. (a)
| | 546,885 | | 87,222,689 |
Intuitive Surgical, Inc. (a)
| | 2,755,031 | | 805,268,011 |
Medtronic PLC
| | 10,441,978 | | 818,233,396 |
ResMed, Inc.
| | 1,153,191 | | 170,522,353 |
STERIS PLC (b)
| | 773,620 | | 169,747,700 |
Stryker Corp.
| | 2,651,647 | | 724,615,576 |
Teleflex, Inc.
| | 368,730 | | 72,422,259 |
Zimmer Biomet Holdings, Inc.
| | 1,637,041 | | 183,708,741 |
| | | | | | 7,285,420,447 |
| HEALTH CARE PROVIDERS & SERVICES — 22.4% | |
Cardinal Health, Inc.
| | 1,998,353 | | 173,497,008 |
Cencora, Inc.
| | 1,307,210 | | 235,258,584 |
Centene Corp. (a)
| | 4,245,864 | | 292,455,112 |
Cigna Group
| | 2,322,222 | | 664,318,048 |
CVS Health Corp.
| | 10,062,098 | | 702,535,682 |
DaVita, Inc. (a) (b)
| | 422,278 | | 39,917,939 |
Elevance Health, Inc.
| | 1,847,709 | | 804,529,453 |
HCA Healthcare, Inc.
| | 1,578,181 | | 388,200,962 |
Henry Schein, Inc. (a) (b)
| | 1,028,329 | | 76,353,428 |
Humana, Inc.
| | 971,598 | | 472,701,859 |
Laboratory Corp. of America Holdings
| | 695,376 | | 139,805,345 |
McKesson Corp.
| | 1,057,749 | | 459,962,153 |
Molina Healthcare, Inc. (a) (b)
| | 457,705 | | 150,076,892 |
Quest Diagnostics, Inc.
| | 879,127 | | 107,130,416 |
UnitedHealth Group, Inc.
| | 7,263,374 | | 3,662,120,537 |
Universal Health Services, Inc. Class B
| | 487,346 | | 61,274,013 |
| | | | | | 8,430,137,431 |
| Security Description | | | Shares | | Value |
| LIFE SCIENCES TOOLS & SERVICES — 11.6% | |
Agilent Technologies, Inc.
| | 2,320,845 | | $ 259,516,888 |
Bio-Rad Laboratories, Inc. Class A (a)
| | 163,750 | | 58,696,188 |
Bio-Techne Corp.
| | 1,241,311 | | 84,496,040 |
Charles River Laboratories International, Inc. (a) (b)
| | 401,632 | | 78,711,839 |
Danaher Corp.
| | 5,152,713 | | 1,278,388,095 |
Illumina, Inc. (a)
| | 1,240,832 | | 170,341,417 |
IQVIA Holdings, Inc. (a) (b)
| | 1,435,926 | | 282,518,440 |
Mettler-Toledo International, Inc. (a)
| | 171,451 | | 189,979,710 |
Revvity, Inc.
| | 973,425 | | 107,758,147 |
Thermo Fisher Scientific, Inc.
| | 3,027,383 | | 1,532,370,453 |
Waters Corp. (a) (b)
| | 463,413 | | 127,072,479 |
West Pharmaceutical Services, Inc.
| | 579,154 | | 217,304,372 |
| | | | | | 4,387,154,068 |
| PHARMACEUTICALS — 30.7% | |
Bristol-Myers Squibb Co.
| | 16,381,071 | | 950,757,361 |
Catalent, Inc. (a) (b)
| | 1,413,375 | | 64,350,964 |
Eli Lilly & Co.
| | 6,252,620 | | 3,358,469,780 |
Johnson & Johnson
| | 18,881,784 | | 2,940,837,858 |
Merck & Co., Inc.
| | 19,897,260 | | 2,048,422,917 |
Organon & Co.
| | 2,001,756 | | 34,750,484 |
Pfizer, Inc.
| | 44,271,181 | | 1,468,475,074 |
Viatris, Inc.
| | 9,410,799 | | 92,790,478 |
Zoetis, Inc. (b)
| | 3,609,466 | | 627,974,895 |
| | | | | | 11,586,829,811 |
TOTAL COMMON STOCKS
(Cost $41,721,511,803)
| | | | | 37,648,525,750 |
| SHORT-TERM INVESTMENTS — 0.2% | | | |
State Street Institutional Liquid Reserves Fund, Premier Class 5.45% (c) (d)
| | 33,578,923 | | 33,585,639 |
State Street Navigator Securities Lending Portfolio II (e) (f)
| | 24,295,260 | | 24,295,260 |
TOTAL SHORT-TERM INVESTMENTS
(Cost $57,880,235)
| | 57,880,899 | |
TOTAL INVESTMENTS — 100.0%
(Cost $41,779,392,038)
| | 37,706,406,649 | |
LIABILITIES IN EXCESS OF OTHER ASSETS — (0.0)% (g)
| | (924,083) | |
NET ASSETS — 100.0%
| | $ 37,705,482,566 | |
| (a) | Non-income producing security. |
| (b) | All or a portion of the shares of the security are on loan at September 30, 2023. |
| (c) | The Fund invested in certain money market funds managed by SSGA Funds Management, Inc. Amounts related to these investments during the year ended September 30, 2023 are shown in the Affiliate Table below. |
| (d) | The rate shown is the annualized seven-day yield at September 30, 2023. |
See accompanying notes to financial statements.
46
THE HEALTH CARE SELECT SECTOR SPDR FUND
SCHEDULE OF INVESTMENTS (continued)
September 30, 2023
| (e) | The Fund invested in an affiliated entity. Amounts related to these investments during the year ended September 30, 2023 are shown in the Affiliate Table below. |
| (f) | Investment of cash collateral for securities loaned. |
| (g) | Amount is less than 0.05% of net assets. |
The following table summarizes the value of the Fund's investments according to the fair value hierarchy as of September 30, 2023.
| Description | | Level 1 –
Quoted Prices | | Level 2 –
Other Significant
Observable Inputs | | Level 3 –
Significant
Unobservable Inputs | | Total |
| ASSETS: | | | | | | | | |
| INVESTMENTS: | | | | | | | | |
Common Stocks
| | $37,648,525,750 | | $— | | $— | | $37,648,525,750 |
Short-Term Investments
| | 57,880,899 | | — | | — | | 57,880,899 |
TOTAL INVESTMENTS
| | $37,706,406,649 | | $— | | $— | | $37,706,406,649 |
Affiliate Table
| | Number of
Shares Held
at
9/30/22 | | Value at
9/30/22 | | Cost of
Purchases | | Proceeds
from
Shares Sold | | Realized
Gain (Loss) | | Change in
Unrealized
Appreciation/
Depreciation | | Number of
Shares Held
at
9/30/23 | | Value at
9/30/23 | | Dividend
Income |
State Street Institutional Liquid Reserves Fund, Premier Class
| 40,926,004 | | $ 40,934,189 | | $1,000,876,821 | | $1,008,225,474 | | $4,616 | | $(4,513) | | 33,578,923 | | $33,585,639 | | $2,871,815 |
State Street Navigator Securities Lending Portfolio II
| 158,598,098 | | 158,598,098 | | 2,609,464,187 | | 2,743,767,025 | | — | | — | | 24,295,260 | | 24,295,260 | | 186,623 |
Total
| | | $199,532,287 | | $3,610,341,008 | | $3,751,992,499 | | $4,616 | | $(4,513) | | | | $57,880,899 | | $3,058,438 |
See accompanying notes to financial statements.
47
THE INDUSTRIAL SELECT SECTOR SPDR FUND
SCHEDULE OF INVESTMENTS
September 30, 2023
| Security Description | | | Shares | | Value |
| COMMON STOCKS — 99.9% | |
| AEROSPACE & DEFENSE — 18.5% | |
Axon Enterprise, Inc. (a)
| | 338,959 | | $ 67,449,451 |
Boeing Co. (a)
| | 2,734,050 | | 524,062,704 |
General Dynamics Corp.
| | 1,093,958 | | 241,731,899 |
Howmet Aerospace, Inc.
| | 1,890,207 | | 87,422,074 |
Huntington Ingalls Industries, Inc.
| | 192,651 | | 39,412,542 |
L3Harris Technologies, Inc.
| | 912,903 | | 158,954,670 |
Lockheed Martin Corp.
| | 1,081,860 | | 442,437,466 |
Northrop Grumman Corp.
| | 686,447 | | 302,167,105 |
RTX Corp.
| | 7,025,768 | | 505,644,523 |
Textron, Inc.
| | 956,152 | | 74,713,717 |
TransDigm Group, Inc. (a)
| | 266,378 | | 224,591,283 |
| | | | | | 2,668,587,434 |
| AIR FREIGHT & LOGISTICS — 6.7% | |
CH Robinson Worldwide, Inc.
| | 561,894 | | 48,395,930 |
Expeditors International of Washington, Inc.
| | 713,884 | | 81,832,523 |
FedEx Corp.
| | 1,116,955 | | 295,903,718 |
United Parcel Service, Inc. Class B
| | 3,491,303 | | 544,189,399 |
| | | | | | 970,321,570 |
| BUILDING PRODUCTS — 5.3% | |
A O Smith Corp.
| | 605,631 | | 40,050,378 |
Allegion PLC
| | 424,794 | | 44,263,535 |
Carrier Global Corp.
| | 4,037,175 | | 222,852,060 |
Johnson Controls International PLC
| | 3,283,921 | | 174,737,436 |
Masco Corp.
| | 1,087,172 | | 58,109,343 |
Trane Technologies PLC
| | 1,102,850 | | 223,779,294 |
| | | | | | 763,792,046 |
| COMMERCIAL SERVICES & SUPPLIES — 5.9% | |
Cintas Corp.
| | 417,440 | | 200,792,814 |
Copart, Inc. (a)
| | 4,194,304 | | 180,732,559 |
Republic Services, Inc.
| | 992,936 | | 141,503,309 |
Rollins, Inc.
| | 1,351,250 | | 50,442,163 |
Waste Management, Inc.
| | 1,779,201 | | 271,221,401 |
| | | | | | 844,692,246 |
| CONSTRUCTION & ENGINEERING — 0.9% | |
Quanta Services, Inc.
| | 701,106 | | 131,155,900 |
| ELECTRICAL EQUIPMENT — 7.2% | |
AMETEK, Inc.
| | 1,114,674 | | 164,704,230 |
Eaton Corp. PLC
| | 1,927,336 | | 411,062,222 |
Emerson Electric Co.
| | 2,758,631 | | 266,400,996 |
Generac Holdings, Inc. (a) (b)
| | 301,554 | | 32,857,324 |
Rockwell Automation, Inc.
| | 554,436 | | 158,496,619 |
| | | | | | 1,033,521,391 |
| GROUND TRANSPORTATION — 9.5% | |
CSX Corp.
| | 9,684,480 | | 297,797,760 |
JB Hunt Transport Services, Inc. (b)
| | 394,052 | | 74,286,683 |
Norfolk Southern Corp.
| | 1,095,760 | | 215,788,017 |
Old Dominion Freight Line, Inc.
| | 432,476 | | 176,943,231 |
| Security Description | | | Shares | | Value |
Union Pacific Corp.
| | 2,941,893 | | $ 599,057,671 |
| | | | | | 1,363,873,362 |
| INDUSTRIAL CONGLOMERATES — 9.9% | |
3M Co.
| | 2,664,384 | | 249,439,630 |
General Electric Co.
| | 5,253,485 | | 580,772,767 |
Honeywell International, Inc.
| | 3,204,908 | | 592,074,704 |
| | | | | | 1,422,287,101 |
| MACHINERY — 21.5% | |
Caterpillar, Inc.
| | 2,462,518 | | 672,267,414 |
Cummins, Inc.
| | 683,736 | | 156,206,327 |
Deere & Co.
| | 1,316,117 | | 496,676,233 |
Dover Corp.
| | 675,447 | | 94,231,611 |
Fortive Corp.
| | 1,699,228 | | 126,014,748 |
IDEX Corp.
| | 364,960 | | 75,918,979 |
Illinois Tool Works, Inc.
| | 1,328,317 | | 305,924,688 |
Ingersoll Rand, Inc.
| | 1,953,697 | | 124,489,573 |
Nordson Corp. (b)
| | 259,974 | | 58,018,398 |
Otis Worldwide Corp.
| | 1,987,545 | | 159,619,739 |
PACCAR, Inc.
| | 2,527,234 | | 214,865,435 |
Parker-Hannifin Corp.
| | 619,292 | | 241,226,620 |
Pentair PLC
| | 796,719 | | 51,587,555 |
Snap-on, Inc.
| | 255,656 | | 65,207,619 |
Stanley Black & Decker, Inc.
| | 739,493 | | 61,806,825 |
Westinghouse Air Brake Technologies Corp.
| | 864,676 | | 91,889,119 |
Xylem, Inc.
| | 1,155,562 | | 105,190,809 |
| | | | | | 3,101,141,692 |
| PASSENGER AIRLINES — 2.2% | |
Alaska Air Group, Inc. (a)
| | 617,749 | | 22,906,133 |
American Airlines Group, Inc. (a) (b)
| | 3,153,046 | | 40,390,519 |
Delta Air Lines, Inc.
| | 3,103,901 | | 114,844,337 |
Southwest Airlines Co. (b)
| | 2,873,803 | | 77,793,847 |
United Airlines Holdings, Inc. (a)
| | 1,584,033 | | 67,004,596 |
| | | | | | 322,939,432 |
| PROFESSIONAL SERVICES — 8.4% | |
Automatic Data Processing, Inc.
| | 1,988,597 | | 478,416,666 |
Broadridge Financial Solutions, Inc.
| | 569,899 | | 102,040,416 |
Equifax, Inc.
| | 592,425 | | 108,520,411 |
Jacobs Solutions, Inc.
| | 607,767 | | 82,960,196 |
Leidos Holdings, Inc.
| | 662,429 | | 61,049,457 |
Paychex, Inc.
| | 1,548,877 | | 178,631,984 |
Robert Half, Inc.
| | 520,360 | | 38,131,981 |
Verisk Analytics, Inc.
| | 700,307 | | 165,440,526 |
| | | | | | 1,215,191,637 |
| SOFTWARE — 0.8% | |
Ceridian HCM Holding, Inc. (a) (b)
| | 748,860 | | 50,810,151 |
Paycom Software, Inc.
| | 237,781 | | 61,649,480 |
| | | | | | 112,459,631 |
| TRADING COMPANIES & DISTRIBUTORS — 3.1% | |
Fastenal Co.
| | 2,757,808 | | 150,686,629 |
See accompanying notes to financial statements.
48
THE INDUSTRIAL SELECT SECTOR SPDR FUND
SCHEDULE OF INVESTMENTS (continued)
September 30, 2023
| Security Description | | | Shares | | Value |
United Rentals, Inc.
| | 329,612 | | $ 146,535,607 |
WW Grainger, Inc.
| | 214,788 | | 148,598,930 |
| | | | | | 445,821,166 |
TOTAL COMMON STOCKS
(Cost $16,688,720,962)
| | | | | 14,395,784,608 |
| SHORT-TERM INVESTMENTS — 0.6% | | | |
State Street Institutional Liquid Reserves Fund, Premier Class 5.45% (c) (d)
| | 6,430,670 | | 6,431,956 |
State Street Navigator Securities Lending Portfolio II (e) (f)
| | 76,756,877 | | 76,756,877 |
TOTAL SHORT-TERM INVESTMENTS
(Cost $83,188,829)
| | 83,188,833 | |
TOTAL INVESTMENTS — 100.5%
(Cost $16,771,909,791)
| | 14,478,973,441 | |
LIABILITIES IN EXCESS OF OTHER ASSETS — (0.5)%
| | (66,111,107) | |
NET ASSETS — 100.0%
| | $ 14,412,862,334 | |
| (a) | Non-income producing security. |
| (b) | All or a portion of the shares of the security are on loan at September 30, 2023. |
| (c) | The Fund invested in certain money market funds managed by SSGA Funds Management, Inc. Amounts related to these investments during the year ended September 30, 2023 are shown in the Affiliate Table below. |
| (d) | The rate shown is the annualized seven-day yield at September 30, 2023. |
| (e) | The Fund invested in an affiliated entity. Amounts related to these investments during the year ended September 30, 2023 are shown in the Affiliate Table below. |
| (f) | Investment of cash collateral for securities loaned. |
At September 30, 2023, open futures contracts were as follows:
| Description | | Number of
Contracts | | Expiration
Date | | Notional
Amount | | Value | | Unrealized
Appreciation
(Depreciation) |
| E-mini S&P 500 Industrial Select Sector Index (long) | | 125 | | 12/15/2023 | | $13,418,250 | | $12,877,087 | | $(541,163) |
During the year ended September 30, 2023, average notional value related to futures contracts was $22,884,165.
The following table summarizes the value of the Fund's investments according to the fair value hierarchy as of September 30, 2023.
| Description | | Level 1 –
Quoted Prices | | Level 2 –
Other Significant
Observable Inputs | | Level 3 –
Significant
Unobservable Inputs | | Total |
| ASSETS: | | | | | | | | |
| INVESTMENTS: | | | | | | | | |
Common Stocks
| | $14,395,784,608 | | $— | | $— | | $14,395,784,608 |
Short-Term Investments
| | 83,188,833 | | — | | — | | 83,188,833 |
TOTAL INVESTMENTS
| | $14,478,973,441 | | $— | | $— | | $14,478,973,441 |
| OTHER FINANCIAL INSTRUMENTS: | | | | | | | | |
Futures Contracts - Unrealized Depreciation
| | $ (541,163) | | $— | | $— | | $ (541,163) |
TOTAL OTHER FINANCIAL INSTRUMENTS:
| | $ (541,163) | | $— | | $— | | $ (541,163) |
See accompanying notes to financial statements.
49
THE INDUSTRIAL SELECT SECTOR SPDR FUND
SCHEDULE OF INVESTMENTS (continued)
September 30, 2023
Affiliate Table
| | Number of
Shares Held
at
9/30/22 | | Value at
9/30/22 | | Cost of
Purchases | | Proceeds
from
Shares Sold | | Realized
Gain (Loss) | | Change in
Unrealized
Appreciation/
Depreciation | | Number of
Shares Held
at
9/30/23 | | Value at
9/30/23 | | Dividend
Income |
State Street Institutional Liquid Reserves Fund, Premier Class
| 17,536,831 | | $ 17,540,339 | | $ 359,937,537 | | $ 371,047,177 | | $4,144 | | $(2,887) | | 6,430,670 | | $ 6,431,956 | | $ 766,314 |
State Street Navigator Securities Lending Portfolio II
| 107,539,396 | | 107,539,396 | | 2,096,610,506 | | 2,127,393,025 | | — | | — | | 76,756,877 | | 76,756,877 | | 246,538 |
Total
| | | $125,079,735 | | $2,456,548,043 | | $2,498,440,202 | | $4,144 | | $(2,887) | | | | $83,188,833 | | $1,012,852 |
See accompanying notes to financial statements.
50
THE MATERIALS SELECT SECTOR SPDR FUND
SCHEDULE OF INVESTMENTS
September 30, 2023
| Security Description | | | Shares | | Value |
| COMMON STOCKS — 99.7% | |
| CHEMICALS — 68.6% | |
Air Products & Chemicals, Inc.
| | 1,244,187 | | $ 352,602,596 |
Albemarle Corp. (a)
| | 657,223 | | 111,754,199 |
Celanese Corp. (a)
| | 560,575 | | 70,363,374 |
CF Industries Holdings, Inc.
| | 1,080,679 | | 92,657,417 |
Corteva, Inc.
| | 3,975,285 | | 203,375,581 |
Dow, Inc.
| | 3,937,843 | | 203,035,185 |
DuPont de Nemours, Inc.
| | 2,571,139 | | 191,781,258 |
Eastman Chemical Co.
| | 663,974 | | 50,940,085 |
Ecolab, Inc.
| | 1,420,824 | | 240,687,586 |
FMC Corp.
| | 698,580 | | 46,783,903 |
International Flavors & Fragrances, Inc.
| | 1,429,631 | | 97,457,945 |
Linde PLC
| | 2,732,954 | | 1,017,615,422 |
LyondellBasell Industries NV Class A
| | 1,434,476 | | 135,844,877 |
Mosaic Co.
| | 1,860,998 | | 66,251,529 |
PPG Industries, Inc.
| | 1,319,105 | | 171,219,829 |
Sherwin-Williams Co.
| | 1,325,072 | | 337,959,613 |
| | | | | | 3,390,330,399 |
| CONSTRUCTION MATERIALS — 5.9% | |
Martin Marietta Materials, Inc.
| | 346,117 | | 142,074,106 |
Vulcan Materials Co.
| | 744,185 | | 150,340,254 |
| | | | | | 292,414,360 |
| CONTAINERS & PACKAGING — 9.5% | |
Amcor PLC
| | 8,241,334 | | 75,490,619 |
Avery Dennison Corp.
| | 451,286 | | 82,436,414 |
Ball Corp.
| | 1,764,590 | | 87,841,290 |
International Paper Co.
| | 1,937,921 | | 68,738,058 |
Packaging Corp. of America
| | 503,630 | | 77,332,387 |
Sealed Air Corp.
| | 808,707 | | 26,574,112 |
Westrock Co.
| | 1,435,375 | | 51,386,425 |
| | | | | | 469,799,305 |
| Security Description | | | Shares | | Value |
| METALS & MINING — 15.7% | |
Freeport-McMoRan, Inc.
| | 8,029,572 | | $ 299,422,740 |
Newmont Corp.
| | 4,451,213 | | 164,472,320 |
Nucor Corp.
| | 1,393,081 | | 217,808,214 |
Steel Dynamics, Inc.
| | 872,070 | | 93,503,346 |
| | | | | | 775,206,620 |
TOTAL COMMON STOCKS
(Cost $6,049,034,943)
| | | | | 4,927,750,684 |
| SHORT-TERM INVESTMENTS — 0.9% | | | |
State Street Institutional Liquid Reserves Fund, Premier Class 5.45% (b) (c)
| | 9,052,582 | | 9,054,393 |
State Street Navigator Securities Lending Portfolio II (d) (e)
| | 33,329,188 | | 33,329,188 |
TOTAL SHORT-TERM INVESTMENTS
(Cost $42,383,557)
| | 42,383,581 | |
TOTAL INVESTMENTS — 100.6%
(Cost $6,091,418,500)
| | 4,970,134,265 | |
LIABILITIES IN EXCESS OF OTHER ASSETS — (0.6)%
| | (27,526,703) | |
NET ASSETS — 100.0%
| | $ 4,942,607,562 | |
| (a) | All or a portion of the shares of the security are on loan at September 30, 2023. |
| (b) | The Fund invested in certain money market funds managed by SSGA Funds Management, Inc. Amounts related to these investments during the year ended September 30, 2023 are shown in the Affiliate Table below. |
| (c) | The rate shown is the annualized seven-day yield at September 30, 2023. |
| (d) | The Fund invested in an affiliated entity. Amounts related to these investments during the year ended September 30, 2023 are shown in the Affiliate Table below. |
| (e) | Investment of cash collateral for securities loaned. |
At September 30, 2023, open futures contracts were as follows:
| Description | | Number of
Contracts | | Expiration
Date | | Notional
Amount | | Value | | Unrealized
Appreciation
(Depreciation) |
| E-mini S&P 500 Material Select Sector Index (long) | | 160 | | 12/15/2023 | | $13,981,328 | | $13,435,200 | | $(546,128) |
During the year ended September 30, 2023, average notional value related to futures contracts was $12,443,478.
See accompanying notes to financial statements.
51
THE MATERIALS SELECT SECTOR SPDR FUND
SCHEDULE OF INVESTMENTS (continued)
September 30, 2023
The following table summarizes the value of the Fund's investments according to the fair value hierarchy as of September 30, 2023.
| Description | | Level 1 –
Quoted Prices | | Level 2 –
Other Significant
Observable Inputs | | Level 3 –
Significant
Unobservable Inputs | | Total |
| ASSETS: | | | | | | | | |
| INVESTMENTS: | | | | | | | | |
Common Stocks
| | $4,927,750,684 | | $— | | $— | | $4,927,750,684 |
Short-Term Investments
| | 42,383,581 | | — | | — | | 42,383,581 |
TOTAL INVESTMENTS
| | $4,970,134,265 | | $— | | $— | | $4,970,134,265 |
| OTHER FINANCIAL INSTRUMENTS: | | | | | | | | |
Futures Contracts - Unrealized Depreciation
| | $ (546,128) | | $— | | $— | | $ (546,128) |
TOTAL OTHER FINANCIAL INSTRUMENTS:
| | $ (546,128) | | $— | | $— | | $ (546,128) |
Affiliate Table
| | Number of
Shares Held
at
9/30/22 | | Value at
9/30/22 | | Cost of
Purchases | | Proceeds
from
Shares Sold | | Realized
Gain (Loss) | | Change in
Unrealized
Appreciation/
Depreciation | | Number of
Shares Held
at
9/30/23 | | Value at
9/30/23 | | Dividend
Income |
State Street Institutional Liquid Reserves Fund, Premier Class
| 3,340,392 | | $3,341,060 | | $ 173,553,765 | | $ 167,841,196 | | $1,026 | | $(262) | | 9,052,582 | | $ 9,054,393 | | $439,502 |
State Street Navigator Securities Lending Portfolio II
| — | | — | | 1,141,444,458 | | 1,108,115,270 | | — | | — | | 33,329,188 | | 33,329,188 | | 132,049 |
Total
| | | $3,341,060 | | $1,314,998,223 | | $1,275,956,466 | | $1,026 | | $(262) | | | | $42,383,581 | | $571,551 |
See accompanying notes to financial statements.
52
THE REAL ESTATE SELECT SECTOR SPDR FUND
SCHEDULE OF INVESTMENTS
September 30, 2023
| Security Description | | | Shares | | Value |
| COMMON STOCKS — 99.6% | |
| HEALTH CARE REITs — 8.1% | |
Healthpeak Properties, Inc. REIT
| | 2,616,508 | | $ 48,039,087 |
Ventas, Inc. REIT
| | 1,924,528 | | 81,080,365 |
Welltower, Inc. REIT
| | 2,480,986 | | 203,242,373 |
| | | | | | 332,361,825 |
| HOTEL & RESORT REITs — 1.3% | |
Host Hotels & Resorts, Inc. REIT
| | 3,403,492 | | 54,694,117 |
| INDUSTRIAL REITs — 12.1% | |
Prologis, Inc. REIT
| | 4,418,640 | | 495,815,594 |
| OFFICE REITs — 2.8% | |
Alexandria Real Estate Equities, Inc. REIT
| | 744,822 | | 74,556,682 |
Boston Properties, Inc. REIT
| | 688,873 | | 40,974,166 |
| | | | | | 115,530,848 |
| REAL ESTATE MANAGEMENT & DEVELOPMENT — 6.4% | |
CBRE Group, Inc. Class A (a)
| | 1,481,912 | | 109,454,020 |
CoStar Group, Inc. (a)
| | 1,953,003 | | 150,166,401 |
| | | | | | 259,620,421 |
| RESIDENTIAL REITs — 13.1% | |
AvalonBay Communities, Inc. REIT
| | 679,259 | | 116,655,941 |
Camden Property Trust REIT
| | 510,652 | | 48,297,466 |
Equity Residential REIT
| | 1,649,742 | | 96,856,353 |
Essex Property Trust, Inc. REIT
| | 307,009 | | 65,113,539 |
Invitation Homes, Inc. REIT
| | 2,751,310 | | 87,189,014 |
Mid-America Apartment Communities, Inc. REIT
| | 558,007 | | 71,787,600 |
UDR, Inc. REIT
| | 1,449,731 | | 51,711,905 |
| | | | | | 537,611,818 |
| RETAIL REITs — 11.5% | |
Federal Realty Investment Trust REIT
| | 349,627 | | 31,686,695 |
Kimco Realty Corp. REIT
| | 2,964,796 | | 52,150,761 |
Realty Income Corp. REIT
| | 3,390,037 | | 169,298,448 |
Regency Centers Corp. REIT
| | 783,081 | | 46,546,335 |
| Security Description | | | Shares | | Value |
Simon Property Group, Inc. REIT
| | 1,564,905 | | $ 169,056,687 |
| | | | | | 468,738,926 |
| SPECIALIZED REITs — 44.3% | |
American Tower Corp. REIT
| | 2,229,544 | | 366,648,511 |
Crown Castle, Inc. REIT
| | 2,074,255 | | 190,893,688 |
Digital Realty Trust, Inc. REIT
| | 1,447,800 | | 175,212,756 |
Equinix, Inc. REIT
| | 447,554 | | 325,040,568 |
Extra Space Storage, Inc. REIT
| | 1,010,476 | | 122,853,672 |
Iron Mountain, Inc. REIT
| | 1,395,859 | | 82,983,817 |
Public Storage REIT
| | 756,836 | | 199,441,423 |
SBA Communications Corp. REIT
| | 518,384 | | 103,764,925 |
VICI Properties, Inc. REIT
| | 4,847,080 | | 141,050,028 |
Weyerhaeuser Co. REIT
| | 3,495,044 | | 107,158,049 |
| | | | | | 1,815,047,437 |
TOTAL COMMON STOCKS
(Cost $5,540,890,540)
| | | | | 4,079,420,986 |
| SHORT-TERM INVESTMENT — 0.4% | | | |
State Street Institutional Liquid Reserves Fund, Premier Class 5.45% (b) (c)
(Cost $15,670,291)
| | 15,667,169 | | 15,670,302 |
TOTAL INVESTMENTS — 100.0%
(Cost $5,556,560,831)
| | 4,095,091,288 | |
LIABILITIES IN EXCESS OF OTHER ASSETS — (0.0)% (d)
| | (1,751,922) | |
NET ASSETS — 100.0%
| | $ 4,093,339,366 | |
| (a) | Non-income producing security. |
| (b) | The Fund invested in certain money market funds managed by SSGA Funds Management, Inc. Amounts related to these investments during the year ended September 30, 2023 are shown in the Affiliate Table below. |
| (c) | The rate shown is the annualized seven-day yield at September 30, 2023. |
| (d) | Amount is less than 0.05% of net assets. |
| REIT | Real Estate Investment Trust |
At September 30, 2023, open futures contracts were as follows:
| Description | | Number of
Contracts | | Expiration
Date | | Notional
Amount | | Value | | Unrealized
Appreciation
(Depreciation) |
| E-mini S&P 500 Real Estate Select Sector Index (long) | | 325 | | 12/15/2023 | | $14,161,313 | | $13,661,115 | | $(500,198) |
During the year ended September 30, 2023, average notional value related to futures contracts was $11,327,865.
See accompanying notes to financial statements.
53
THE REAL ESTATE SELECT SECTOR SPDR FUND
SCHEDULE OF INVESTMENTS (continued)
September 30, 2023
The following table summarizes the value of the Fund's investments according to the fair value hierarchy as of September 30, 2023.
| Description | | Level 1 –
Quoted Prices | | Level 2 –
Other Significant
Observable Inputs | | Level 3 –
Significant
Unobservable Inputs | | Total |
| ASSETS: | | | | | | | | |
| INVESTMENTS: | | | | | | | | |
Common Stocks
| | $4,079,420,986 | | $— | | $— | | $4,079,420,986 |
Short-Term Investment
| | 15,670,302 | | — | | — | | 15,670,302 |
TOTAL INVESTMENTS
| | $4,095,091,288 | | $— | | $— | | $4,095,091,288 |
| OTHER FINANCIAL INSTRUMENTS: | | | | | | | | |
Futures Contracts - Unrealized Depreciation
| | $ (500,198) | | $— | | $— | | $ (500,198) |
TOTAL OTHER FINANCIAL INSTRUMENTS:
| | $ (500,198) | | $— | | $— | | $ (500,198) |
Affiliate Table
| | Number of
Shares Held
at
9/30/22 | | Value at
9/30/22 | | Cost of
Purchases | | Proceeds
from
Shares Sold | | Realized
Gain (Loss) | | Change in
Unrealized
Appreciation/
Depreciation | | Number of
Shares Held
at
9/30/23 | | Value at
9/30/23 | | Dividend
Income |
State Street Institutional Liquid Reserves Fund, Premier Class
| 14,197,398 | | $14,200,238 | | $281,808,969 | | $280,337,416 | | $(1,500) | | $11 | | 15,667,169 | | $15,670,302 | | $254,712 |
State Street Navigator Securities Lending Portfolio II
| — | | — | | 24,048,101 | | 24,048,101 | | — | | — | | — | | — | | — |
Total
| | | $14,200,238 | | $305,857,070 | | $304,385,517 | | $(1,500) | | $11 | | | | $15,670,302 | | $254,712 |
See accompanying notes to financial statements.
54
THE TECHNOLOGY SELECT SECTOR SPDR FUND
SCHEDULE OF INVESTMENTS
September 30, 2023
| Security Description | | | Shares | | Value |
| COMMON STOCKS — 99.9% | |
| COMMUNICATIONS EQUIPMENT — 4.1% | |
Arista Networks, Inc. (a)
| | 1,496,130 | | $ 275,183,191 |
Cisco Systems, Inc.
| | 24,313,213 | | 1,307,078,331 |
F5, Inc. (a)
| | 353,813 | | 57,013,427 |
Juniper Networks, Inc.
| | 1,917,328 | | 53,282,545 |
Motorola Solutions, Inc.
| | 996,448 | | 271,273,003 |
| | | | | | 1,963,830,497 |
| ELECTRONIC EQUIPMENT, INSTRUMENTS & COMPONENTS — 2.6% | |
Amphenol Corp. Class A
| | 3,558,634 | | 298,889,670 |
CDW Corp.
| | 799,823 | | 161,372,288 |
Corning, Inc.
| | 4,580,294 | | 139,561,558 |
Keysight Technologies, Inc. (a)
| | 1,064,184 | | 140,802,185 |
TE Connectivity Ltd.
| | 1,873,062 | | 231,379,349 |
Teledyne Technologies, Inc. (a)
| | 280,891 | | 114,766,445 |
Trimble, Inc. (a)
| | 1,481,622 | | 79,800,161 |
Zebra Technologies Corp. Class A (a)
| | 306,267 | | 72,441,334 |
| | | | | | 1,239,012,990 |
| IT SERVICES — 5.5% | |
Accenture PLC Class A
| | 3,763,524 | | 1,155,815,856 |
Akamai Technologies, Inc. (a)
| | 906,852 | | 96,616,012 |
Cognizant Technology Solutions Corp. Class A
| | 3,013,235 | | 204,116,539 |
DXC Technology Co. (a) (b)
| | 1,224,127 | | 25,498,565 |
EPAM Systems, Inc. (a)
| | 345,785 | | 88,413,767 |
Gartner, Inc. (a)
| | 470,337 | | 161,612,496 |
International Business Machines Corp.
| | 5,435,344 | | 762,578,763 |
VeriSign, Inc. (a)
| | 535,388 | | 108,432,132 |
| | | | | | 2,603,084,130 |
| SEMICONDUCTORS & SEMICONDUCTOR EQUIPMENT — 24.4% | |
Advanced Micro Devices, Inc. (a)
| | 9,639,707 | | 991,154,674 |
Analog Devices, Inc.
| | 2,991,588 | | 523,797,143 |
Applied Materials, Inc.
| | 5,010,234 | | 693,666,897 |
Broadcom, Inc.
| | 2,462,191 | | 2,045,046,601 |
Enphase Energy, Inc. (a) (b)
| | 813,560 | | 97,749,234 |
First Solar, Inc. (a)
| | 637,377 | | 102,993,750 |
Intel Corp.
| | 24,987,128 | | 888,292,400 |
KLA Corp.
| | 815,724 | | 374,139,970 |
Lam Research Corp.
| | 795,334 | | 498,491,491 |
Microchip Technology, Inc.
| | 3,247,645 | | 253,478,692 |
Micron Technology, Inc.
| | 6,534,969 | | 444,573,941 |
Monolithic Power Systems, Inc.
| | 285,095 | | 131,713,890 |
NVIDIA Corp.
| | 4,939,309 | | 2,148,550,022 |
NXP Semiconductors NV
| | 1,538,137 | | 307,504,349 |
ON Semiconductor Corp. (a) (b)
| | 2,574,636 | | 239,312,416 |
Qorvo, Inc. (a)
| | 584,185 | | 55,772,142 |
QUALCOMM, Inc.
| | 6,658,444 | | 739,486,791 |
Skyworks Solutions, Inc.
| | 950,982 | | 93,757,315 |
SolarEdge Technologies, Inc. (a) (b)
| | 337,427 | | 43,700,171 |
| Security Description | | | Shares | | Value |
Teradyne, Inc.
| | 918,942 | | $ 92,316,913 |
Texas Instruments, Inc.
| | 5,417,267 | | 861,399,626 |
| | | | | | 11,626,898,428 |
| SOFTWARE — 38.9% | |
Adobe, Inc. (a)
| | 2,719,457 | | 1,386,651,124 |
ANSYS, Inc. (a)
| | 517,787 | | 154,067,522 |
Autodesk, Inc. (a)
| | 1,275,114 | | 263,833,838 |
Cadence Design Systems, Inc. (a)
| | 1,621,580 | | 379,936,194 |
Fair Isaac Corp. (a)
| | 148,317 | | 128,817,764 |
Fortinet, Inc. (a)
| | 3,889,090 | | 228,211,801 |
Gen Digital, Inc.
| | 3,357,283 | | 59,356,763 |
Intuit, Inc.
| | 1,670,944 | | 853,752,127 |
Microsoft Corp.
| | 34,417,521 | | 10,867,332,256 |
Oracle Corp.
| | 9,392,658 | | 994,870,335 |
Palo Alto Networks, Inc. (a)
| | 1,824,797 | | 427,805,409 |
PTC, Inc. (a)
| | 708,977 | | 100,447,861 |
Roper Technologies, Inc.
| | 636,657 | | 308,320,252 |
Salesforce, Inc. (a)
| | 5,811,265 | | 1,178,408,317 |
ServiceNow, Inc. (a)
| | 1,217,159 | | 680,343,195 |
Synopsys, Inc. (a)
| | 907,886 | | 416,692,437 |
Tyler Technologies, Inc. (a)
| | 251,047 | | 96,939,289 |
| | | | | | 18,525,786,484 |
| TECHNOLOGY HARDWARE, STORAGE & PERIPHERALS — 24.4% | |
Apple, Inc.
| | 64,568,089 | | 11,054,702,518 |
Hewlett Packard Enterprise Co.
| | 7,705,703 | | 133,848,061 |
HP, Inc.
| | 5,176,644 | | 133,039,751 |
NetApp, Inc.
| | 1,257,806 | | 95,442,319 |
Seagate Technology Holdings PLC (b)
| | 1,150,752 | | 75,892,095 |
Western Digital Corp. (a)
| | 1,908,851 | | 87,100,871 |
| | | | | | 11,580,025,615 |
TOTAL COMMON STOCKS
(Cost $43,684,482,369)
| | | | | 47,538,638,144 |
| SHORT-TERM INVESTMENTS — 0.2% | | | |
State Street Institutional Liquid Reserves Fund, Premier Class 5.45% (c) (d)
| | 60,139,808 | | 60,151,836 |
State Street Navigator Securities Lending Portfolio II (e) (f)
| | 23,763,431 | | 23,763,431 |
TOTAL SHORT-TERM INVESTMENTS
(Cost $83,907,272)
| | 83,915,267 | |
TOTAL INVESTMENTS — 100.1%
(Cost $43,768,389,641)
| | 47,622,553,411 | |
LIABILITIES IN EXCESS OF OTHER ASSETS — (0.1)%
| | (35,124,605) | |
NET ASSETS — 100.0%
| | $ 47,587,428,806 | |
| (a) | Non-income producing security. |
| (b) | All or a portion of the shares of the security are on loan at September 30, 2023. |
See accompanying notes to financial statements.
55
THE TECHNOLOGY SELECT SECTOR SPDR FUND
SCHEDULE OF INVESTMENTS (continued)
September 30, 2023
| (c) | The Fund invested in certain money market funds managed by SSGA Funds Management, Inc. Amounts related to these investments during the year ended September 30, 2023 are shown in the Affiliate Table below. |
| (d) | The rate shown is the annualized seven-day yield at September 30, 2023. |
| (e) | The Fund invested in an affiliated entity. Amounts related to these investments during the year ended September 30, 2023 are shown in the Affiliate Table below. |
| (f) | Investment of cash collateral for securities loaned. |
At September 30, 2023, open futures contracts were as follows:
| Description | | Number of
Contracts | | Expiration
Date | | Notional
Amount | | Value | | Unrealized
Appreciation
(Depreciation) |
| E-mini S&P 500 Technology Select Sector Index (long) | | 330 | | 12/15/2023 | | $58,160,850 | | $55,056,111 | | $(3,104,739) |
During the year ended September 30, 2023, average notional value related to futures contracts was $67,148,906.
The following table summarizes the value of the Fund's investments according to the fair value hierarchy as of September 30, 2023.
| Description | | Level 1 –
Quoted Prices | | Level 2 –
Other Significant
Observable Inputs | | Level 3 –
Significant
Unobservable Inputs | | Total |
| ASSETS: | | | | | | | | |
| INVESTMENTS: | | | | | | | | |
Common Stocks
| | $47,538,638,144 | | $— | | $— | | $47,538,638,144 |
Short-Term Investments
| | 83,915,267 | | — | | — | | 83,915,267 |
TOTAL INVESTMENTS
| | $47,622,553,411 | | $— | | $— | | $47,622,553,411 |
| OTHER FINANCIAL INSTRUMENTS: | | | | | | | | |
Futures Contracts - Unrealized Depreciation
| | $ (3,104,739) | | $— | | $— | | $ (3,104,739) |
TOTAL OTHER FINANCIAL INSTRUMENTS:
| | $ (3,104,739) | | $— | | $— | | $ (3,104,739) |
Affiliate Table
| | Number of
Shares Held
at
9/30/22 | | Value at
9/30/22 | | Cost of
Purchases | | Proceeds
from
Shares Sold | | Realized
Gain (Loss) | | Change in
Unrealized
Appreciation/
Depreciation | | Number of
Shares Held
at
9/30/23 | | Value at
9/30/23 | | Dividend
Income |
State Street Institutional Liquid Reserves Fund, Premier Class
| 60,823,039 | | $ 60,835,203 | | $ 740,444,521 | | $ 741,112,450 | | $(6,990) | | $(8,448) | | 60,139,808 | | $60,151,836 | | $3,038,190 |
State Street Navigator Securities Lending Portfolio II
| 94,660,055 | | 94,660,055 | | 3,728,869,178 | | 3,799,765,802 | | — | | — | | 23,763,431 | | 23,763,431 | | 541,597 |
Total
| | | $155,495,258 | | $4,469,313,699 | | $4,540,878,252 | | $(6,990) | | $(8,448) | | | | $83,915,267 | | $3,579,787 |
See accompanying notes to financial statements.
56
THE UTILITIES SELECT SECTOR SPDR FUND
SCHEDULE OF INVESTMENTS
September 30, 2023
| Security Description | | | Shares | | Value |
| COMMON STOCKS — 99.7% | |
| ELECTRIC UTILITIES — 65.7% | |
Alliant Energy Corp. (a)
| | 3,829,771 | | $ 185,552,405 |
American Electric Power Co., Inc. (a)
| �� | 7,807,102 | | 587,250,213 |
Constellation Energy Corp.
| | 4,873,500 | | 531,601,380 |
Duke Energy Corp.
| | 11,679,405 | | 1,030,824,285 |
Edison International
| | 5,808,390 | | 367,613,003 |
Entergy Corp. (a)
| | 3,204,444 | | 296,411,070 |
Evergy, Inc.
| | 3,480,928 | | 176,483,050 |
Eversource Energy
| | 5,290,082 | | 307,618,268 |
Exelon Corp.
| | 15,081,728 | | 569,938,501 |
FirstEnergy Corp.
| | 7,819,935 | | 267,285,378 |
NextEra Energy, Inc.
| | 30,667,760 | | 1,756,955,970 |
NRG Energy, Inc. (a)
| | 3,472,040 | | 133,742,981 |
PG&E Corp. (b)
| | 31,691,057 | | 511,176,749 |
Pinnacle West Capital Corp. (a)
| | 1,717,155 | | 126,519,980 |
PPL Corp. (a)
| | 11,170,017 | | 263,165,601 |
Southern Co.
| | 16,526,386 | | 1,069,587,702 |
Xcel Energy, Inc.
| | 8,358,053 | | 478,247,793 |
| | | | | | 8,659,974,329 |
| GAS UTILITIES — 1.8% | |
Atmos Energy Corp. (a)
| | 2,249,849 | | 238,326,505 |
| INDEPENDENT POWER & RENEWABLE ELECTRICITY PRODUCERS — 1.1% | |
AES Corp. (a)
| | 10,147,656 | | 154,244,371 |
| MULTI-UTILITIES — 28.3% | |
Ameren Corp.
| | 3,981,742 | | 297,953,754 |
CenterPoint Energy, Inc. (a)
| | 9,565,080 | | 256,822,398 |
CMS Energy Corp. (a)
| | 4,420,904 | | 234,794,211 |
Consolidated Edison, Inc. (a)
| | 5,226,986 | | 447,064,113 |
Dominion Energy, Inc.
| | 12,680,644 | | 566,444,368 |
DTE Energy Co. (a)
| | 3,124,455 | | 310,195,892 |
NiSource, Inc.
| | 6,262,517 | | 154,558,920 |
Public Service Enterprise Group, Inc.
| | 7,563,617 | | 430,445,443 |
| Security Description | | | Shares | | Value |
Sempra
| | 9,536,643 | | $ 648,777,823 |
WEC Energy Group, Inc.
| | 4,780,145 | | 385,040,680 |
| | | | | | 3,732,097,602 |
| WATER UTILITIES — 2.8% | |
American Water Works Co., Inc. (a)
| | 2,950,087 | | 365,309,273 |
TOTAL COMMON STOCKS
(Cost $16,655,077,351)
| | | | | 13,149,952,080 |
| SHORT-TERM INVESTMENTS — 0.3% | | | |
State Street Institutional Liquid Reserves Fund, Premier Class 5.45% (c) (d)
| | 31,702,123 | | 31,708,463 |
State Street Navigator Securities Lending Portfolio II (e) (f)
| | 7,244,850 | | 7,244,850 |
TOTAL SHORT-TERM INVESTMENTS
(Cost $38,952,535)
| | 38,953,313 | |
TOTAL INVESTMENTS — 100.0%
(Cost $16,694,029,886)
| | 13,188,905,393 | |
LIABILITIES IN EXCESS OF OTHER ASSETS — (0.0)% (g)
| | (2,468,916) | |
NET ASSETS — 100.0%
| | $ 13,186,436,477 | |
| (a) | All or a portion of the shares of the security are on loan at September 30, 2023. |
| (b) | Non-income producing security. |
| (c) | The Fund invested in certain money market funds managed by SSGA Funds Management, Inc. Amounts related to these investments during the year ended September 30, 2023 are shown in the Affiliate Table below. |
| (d) | The rate shown is the annualized seven-day yield at September 30, 2023. |
| (e) | The Fund invested in an affiliated entity. Amounts related to these investments during the year ended September 30, 2023 are shown in the Affiliate Table below. |
| (f) | Investment of cash collateral for securities loaned. |
| (g) | Amount is less than 0.05% of net assets. |
The following table summarizes the value of the Fund's investments according to the fair value hierarchy as of September 30, 2023.
| Description | | Level 1 –
Quoted Prices | | Level 2 –
Other Significant
Observable Inputs | | Level 3 –
Significant
Unobservable Inputs | | Total |
| ASSETS: | | | | | | | | |
| INVESTMENTS: | | | | | | | | |
Common Stocks
| | $13,149,952,080 | | $— | | $— | | $13,149,952,080 |
Short-Term Investments
| | 38,953,313 | | — | | — | | 38,953,313 |
TOTAL INVESTMENTS
| | $13,188,905,393 | | $— | | $— | | $13,188,905,393 |
See accompanying notes to financial statements.
57
THE UTILITIES SELECT SECTOR SPDR FUND
SCHEDULE OF INVESTMENTS (continued)
September 30, 2023
Affiliate Table
| | Number of
Shares Held
at
9/30/22 | | Value at
9/30/22 | | Cost of
Purchases | | Proceeds
from
Shares Sold | | Realized
Gain (Loss) | | Change in
Unrealized
Appreciation/
Depreciation | | Number of
Shares Held
at
9/30/23 | | Value at
9/30/23 | | Dividend
Income |
State Street Institutional Liquid Reserves Fund, Premier Class
| 27,297,775 | | $ 27,303,235 | | $ 772,758,386 | | $ 768,352,739 | | $2,330 | | $(2,749) | | 31,702,123 | | $31,708,463 | | $1,247,383 |
State Street Navigator Securities Lending Portfolio II
| 92,621,035 | | 92,621,035 | | 2,087,835,852 | | 2,173,212,037 | | — | | — | | 7,244,850 | | 7,244,850 | | 179,823 |
Total
| | | $119,924,270 | | $2,860,594,238 | | $2,941,564,776 | | $2,330 | | $(2,749) | | | | $38,953,313 | | $1,427,206 |
See accompanying notes to financial statements.
58
[This Page Intentionally Left Blank]
THE SELECT SECTOR SPDR TRUST
STATEMENTS OF ASSETS AND LIABILITIES
September 30, 2023
| | The Communication Services Select Sector SPDR Fund | | The Consumer Discretionary Select Sector SPDR Fund | | The Consumer Staples Select Sector SPDR Fund |
| ASSETS | | | | | |
Investments in unaffiliated issuers, at value*
| $13,104,203,054 | | $17,425,411,253 | | $16,145,533,437 |
Investments in affiliated issuers, at value
| 4,699,733 | | 36,189,268 | | 21,836,237 |
Total Investments
| 13,108,902,787 | | 17,461,600,521 | | 16,167,369,674 |
Foreign currency, at value
| — | | — | | — |
Net cash at broker
| — | | — | | — |
Cash
| — | | 731,630 | | — |
Receivable for income related to Select Sector SPDR shares in-kind transactions
| 34 | | 32,344 | | — |
Dividends receivable — unaffiliated issuers
| 3,246,108 | | 4,467,948 | | 46,407,949 |
Dividends receivable — affiliated issuers
| 55,363 | | 75,319 | | 123,027 |
Securities lending income receivable — unaffiliated issuers
| 268 | | 8,825 | | 4,234 |
Securities lending income receivable — affiliated issuers
| — | | 26,912 | | 1,218 |
Receivable for foreign taxes recoverable
| — | | — | | — |
Prepaid expenses and other assets
| 31,017 | | 36,285 | | 33,385 |
TOTAL ASSETS
| 13,112,235,577 | | 17,466,979,784 | | 16,213,939,487 |
| LIABILITIES | | | | | |
Due to custodian
| — | | — | | 399 |
Payable upon return of securities loaned
| — | | 32,385,839 | | 5,240,094 |
Payable for investments purchased
| — | | — | | — |
Payable for income related to Select Sector SPDR shares in-kind transactions
| — | | — | | 28,161 |
Payable to broker – accumulated variation margin on open futures contracts
| — | | — | | — |
Advisory and Administration fees payable
| 379,669 | | 527,409 | | 482,074 |
Distribution fees payable
| 330,531 | | 432,793 | | 431,232 |
Unitary fees payable
| 106,144 | | 78,719 | | 132,699 |
Trustees’ fees and expenses payable
| 3,819 | | 6,164 | | 5,989 |
License fee payable
| 844,408 | | 1,057,102 | | 1,053,765 |
Registration and filing fees payable
| 23,202 | | 34,136 | | 40,270 |
Professional fees payable
| 58,436 | | 70,445 | | 75,924 |
Printing and postage fees payable
| 168,965 | | 273,151 | | 212,966 |
Accrued expenses and other liabilities
| 3,576 | | 3,810 | | 2,602 |
TOTAL LIABILITIES
| 1,918,750 | | 34,869,568 | | 7,706,175 |
NET ASSETS
| $13,110,316,827 | | $17,432,110,216 | | $16,206,233,312 |
| NET ASSETS CONSIST OF: | | | | | |
Paid-in capital
| $15,879,042,156 | | $22,857,412,358 | | $20,197,645,835 |
Total distributable earnings (loss)
| (2,768,725,329) | | (5,425,302,142) | | (3,991,412,523) |
NET ASSETS
| $13,110,316,827 | | $17,432,110,216 | | $16,206,233,312 |
| NET ASSET VALUE PER SHARE | | | | | |
Net asset value per share
| $ 65.58 | | $ 160.96 | | $ 68.81 |
Shares outstanding (unlimited amount authorized, $0.01 par value)
| 199,900,000 | | 108,303,252 | | 235,521,809 |
| COST OF INVESTMENTS: | | | | | |
Investments in unaffiliated issuers
| $13,823,439,127 | | $19,249,538,579 | | $18,487,903,448 |
Investments in affiliated issuers
| 4,699,324 | | 36,189,238 | | 21,836,237 |
Total cost of investments
| $13,828,138,451 | | $19,285,727,817 | | $18,509,739,685 |
Foreign currency, at cost
| $ — | | $ — | | $ — |
* Includes investments in securities on loan, at value
| $ 302,376 | | $ 96,691,101 | | $ 5,405,248 |
See accompanying notes to financial statements.
60
| The Energy Select Sector SPDR Fund | | The Financial Select Sector SPDR Fund | | The Health Care Select Sector SPDR Fund | | The Industrial Select Sector SPDR Fund | | The Materials Select Sector SPDR Fund | | The Real Estate Select Sector SPDR Fund | | The Technology Select Sector SPDR Fund |
| | | | | | | | | | | | | |
| $38,973,323,513 | | $30,395,918,830 | | $37,648,525,750 | | $14,395,784,608 | | $ 4,927,750,684 | | $ 4,079,420,986 | | $47,538,638,144 |
| 70,627,101 | | 667,573,721 | | 57,880,899 | | 83,188,833 | | 42,383,581 | | 15,670,302 | | 83,915,267 |
| 39,043,950,614 | | 31,063,492,551 | | 37,706,406,649 | | 14,478,973,441 | | 4,970,134,265 | | 4,095,091,288 | | 47,622,553,411 |
| — | | 1,542 | | — | | — | | — | | — | | — |
| 4,911,391 | | — | | — | | 1,123,201 | | 1,420,785 | | 2,101,721 | | 6,416,803 |
| 11,355 | | 1,611,813 | | 1,286 | | 1,371,563 | | 149,237 | | 802 | | 1,308,225 |
| — | | — | | — | | 2,106 | | — | | 12,673 | | 1,751 |
| 20,746,418 | | 21,075,988 | | 28,623,252 | | 10,704,587 | | 7,293,413 | | 11,247,710 | | 8,091,280 |
| 426,120 | | 310,552 | | 373,129 | | 108,718 | | 38,057 | | 31,428 | | 219,778 |
| 1,538 | | 8,062 | | 249 | | 384 | | 3,285 | | — | | — |
| 7,738 | | 124,147 | | 7,730 | | 14,617 | | 14,715 | | — | | 9,051 |
| — | | — | | — | | — | | — | | 280,832 | | — |
| 62,527 | | 71,156 | | 74,872 | | 33,515 | | 12,253 | | 7,600 | | 106,142 |
| 39,070,117,701 | | 31,086,695,811 | | 37,735,487,167 | | 14,492,332,132 | | 4,979,066,010 | | 4,108,774,054 | | 47,638,706,441 |
| | | | | | | | | | | | | |
| — | | — | | — | | — | | — | | — | | — |
| 14,004,048 | | 483,314,119 | | 24,295,260 | | 76,756,877 | | 33,329,188 | | — | | 23,763,431 |
| — | | — | | — | | — | | 1,736,140 | | 14,286,714 | | 17,445,254 |
| 9,994,715 | | 205,492 | | 29,623 | | — | | 31,903 | | — | | — |
| 1,100,840 | | — | | — | | 540,750 | | 545,600 | | 499,125 | | 3,103,650 |
| 1,069,655 | | 948,786 | | 1,106,942 | | 438,402 | | 142,163 | | 114,425 | | 1,368,913 |
| 971,405 | | 814,533 | | 1,003,705 | | 374,976 | | 141,238 | | 113,367 | | 1,209,401 |
| 377,018 | | 311,441 | | 383,708 | | 91,697 | | 4,736 | | 3,239 | | 494,839 |
| 14,522 | | 13,829 | | 14,514 | | 5,528 | | 2,531 | | 2,040 | | 16,028 |
| 2,223,835 | | 2,021,579 | | 2,427,624 | | 934,682 | | 353,270 | | 274,871 | | 3,008,436 |
| 91,134 | | 73,711 | | 94,446 | | 32,142 | | 13,148 | | 11,191 | | 98,944 |
| 129,786 | | 110,646 | | 127,716 | | 68,638 | | 50,689 | | 48,735 | | 129,364 |
| 488,793 | | 569,060 | | 518,618 | | 222,458 | | 104,494 | | 78,034 | | 635,940 |
| 1,839 | | 3,314 | | 2,445 | | 3,648 | | 3,348 | | 2,947 | | 3,435 |
| 30,467,590 | | 488,386,510 | | 30,004,601 | | 79,469,798 | | 36,458,448 | | 15,434,688 | | 51,277,635 |
| $39,039,650,111 | | $30,598,309,301 | | $37,705,482,566 | | $14,412,862,334 | | $ 4,942,607,562 | | $ 4,093,339,366 | | $47,587,428,806 |
| | | | | | | | | | | | | |
| $44,162,366,265 | | $38,982,903,225 | | $42,987,822,430 | | $17,816,339,987 | | $ 7,049,029,805 | | $ 5,863,234,915 | | $46,692,736,901 |
| (5,122,716,154) | | (8,384,593,924) | | (5,282,339,864) | | (3,403,477,653) | | (2,106,422,243) | | (1,769,895,549) | | 894,691,905 |
| $39,039,650,111 | | $30,598,309,301 | | $37,705,482,566 | | $14,412,862,334 | | $ 4,942,607,562 | | $ 4,093,339,366 | | $47,587,428,806 |
| | | | | | | | | | | | | |
| $ 90.40 | | $ 33.17 | | $ 128.72 | | $ 101.34 | | $ 78.55 | | $ 34.07 | | $ 163.89 |
| 431,874,200 | | 922,395,427 | | 292,915,324 | | 142,226,000 | | 62,923,725 | | 120,150,000 | | 290,355,897 |
| | | | | | | | | | | | | |
| $36,008,692,769 | | $34,407,735,009 | | $41,721,511,803 | | $16,688,720,962 | | $ 6,049,034,943 | | $ 5,540,890,540 | | $43,684,482,369 |
| 70,627,024 | | 725,888,560 | | 57,880,235 | | 83,188,829 | | 42,383,557 | | 15,670,291 | | 83,907,272 |
| $36,079,319,793 | | $35,133,623,569 | | $41,779,392,038 | | $16,771,909,791 | | $ 6,091,418,500 | | $ 5,556,560,831 | | $43,768,389,641 |
| $ — | | $ 1,542 | | $ — | | $ — | | $ — | | $ — | | $ — |
| $ 37,091,364 | | $ 470,009,138 | | $ 26,779,881 | | $ 76,624,257 | | $ 76,117,401 | | $ — | | $ 29,796,589 |
THE SELECT SECTOR SPDR TRUST
STATEMENTS OF ASSETS AND LIABILITIES (continued)
September 30, 2023
| | The Utilities Select Sector SPDR Fund |
| ASSETS | |
Investments in unaffiliated issuers, at value*
| $13,149,952,080 |
Investments in affiliated issuers, at value
| 38,953,313 |
Total Investments
| 13,188,905,393 |
Cash
| 6,303,580 |
Dividends receivable — unaffiliated issuers
| 20,528,276 |
Dividends receivable — affiliated issuers
| 159,208 |
Securities lending income receivable — unaffiliated issuers
| 222 |
Securities lending income receivable — affiliated issuers
| 1,983 |
Prepaid expenses and other assets
| 27,240 |
TOTAL ASSETS
| 13,215,925,902 |
| LIABILITIES | |
Payable upon return of securities loaned
| 7,244,850 |
Payable for investments purchased
| 20,084,038 |
Payable for income related to Select Sector SPDR shares in-kind transactions
| 31,991 |
Advisory and Administration fees payable
| 415,389 |
Distribution fees payable
| 375,212 |
Unitary fees payable
| 103,359 |
Trustees’ fees and expenses payable
| 5,741 |
License fee payable
| 902,072 |
Registration and filing fees payable
| 37,095 |
Professional fees payable
| 72,989 |
Printing and postage fees payable
| 213,912 |
Accrued expenses and other liabilities
| 2,777 |
TOTAL LIABILITIES
| 29,489,425 |
NET ASSETS
| $13,186,436,477 |
| NET ASSETS CONSIST OF: | |
Paid-in capital
| $17,685,945,191 |
Total distributable earnings (loss)
| (4,499,508,714) |
NET ASSETS
| $13,186,436,477 |
| NET ASSET VALUE PER SHARE | |
Net asset value per share
| $ 58.94 |
Shares outstanding (unlimited amount authorized, $0.01 par value)
| 223,724,160 |
| COST OF INVESTMENTS: | |
Investments in unaffiliated issuers
| $16,655,077,351 |
Investments in affiliated issuers
| 38,952,535 |
Total cost of investments
| $16,694,029,886 |
* Includes investments in securities on loan, at value
| $ 7,096,391 |
See accompanying notes to financial statements.
62
[This Page Intentionally Left Blank]
THE SELECT SECTOR SPDR TRUST
STATEMENTS OF OPERATIONS
For the Year Ended September 30, 2023
| | The Communication Services Select Sector SPDR Fund | | The Consumer Discretionary Select Sector SPDR Fund | | The Consumer Staples Select Sector SPDR Fund |
| INVESTMENT INCOME | | | | | |
Dividend income — unaffiliated issuers
| 107,831,070 | | $ 155,405,613 | | $ 456,204,119 |
Dividend income — affiliated issuers
| 352,165 | | 794,998 | | 1,361,950 |
Unaffiliated securities lending income
| 14,039 | | 79,967 | | 22,602 |
Affiliated securities lending income
| 54,022 | | 294,123 | | 105,107 |
Foreign taxes withheld
| — | | — | | — |
TOTAL INVESTMENT INCOME (LOSS)
| 108,251,296 | | 156,574,701 | | 457,693,778 |
| EXPENSES | | | | | |
Advisory and Administration fees
| 3,339,235 | | 4,714,163 | | 5,352,669 |
Distribution fees
| 2,104,037 | | 2,968,028 | | 3,462,176 |
License fees
| 2,687,605 | | 3,826,273 | | 4,351,496 |
Unitary fees
| 839,162 | | 1,186,294 | | 1,347,930 |
Trustees’ fees and expenses
| 107,431 | | 165,189 | | 186,850 |
Registration and filing fees
| 2,955 | | 2,310 | | 25,432 |
Professional fees
| 46,304 | | 56,824 | | 77,827 |
Printing and postage fees
| 508,710 | | 729,872 | | 903,621 |
Insurance expense
| 29,557 | | 47,240 | | 62,682 |
Miscellaneous expenses
| 48,471 | | 68,620 | | 57,180 |
TOTAL EXPENSES
| 9,713,467 | | 13,764,813 | | 15,827,863 |
NET INVESTMENT INCOME (LOSS)
| $ 98,537,829 | | $ 142,809,888 | | $ 441,865,915 |
| REALIZED AND UNREALIZED GAIN (LOSS) | | | | | |
| Net realized gain (loss) on: | | | | | |
Investments — unaffiliated issuers
| (1,086,017,296) | | (1,102,594,477) | | (440,014,325) |
Investments — affiliated issuers
| (141) | | 3,832 | | 711 |
In-kind redemptions — unaffiliated issuers
| 772,960,779 | | 945,498,614 | | 478,828,415 |
In-kind redemptions — affiliated issuers
| — | | — | | — |
Futures contracts
| — | | — | | — |
Net realized gain (loss)
| (313,056,658) | | (157,092,031) | | 38,814,801 |
| Net change in unrealized appreciation/depreciation on: | | | | | |
Investments — unaffiliated issuers
| 3,465,421,591 | | 1,874,124,354 | | 234,189,965 |
Investments — affiliated issuers
| (566) | | (2,341) | | (507) |
Futures contracts
| — | | — | | — |
Net change in unrealized appreciation/depreciation
| 3,465,421,025 | | 1,874,122,013 | | 234,189,458 |
NET REALIZED AND UNREALIZED GAIN (LOSS)
| 3,152,364,367 | | 1,717,029,982 | | 273,004,259 |
NET INCREASE (DECREASE) IN NET ASSETS FROM OPERATIONS
| $ 3,250,902,196 | | $ 1,859,839,870 | | $ 714,870,174 |
See accompanying notes to financial statements.
64
| The Energy Select Sector SPDR Fund | | The Financial Select Sector SPDR Fund | | The Health Care Select Sector SPDR Fund | | The Industrial Select Sector SPDR Fund | | The Materials Select Sector SPDR Fund | | The Real Estate Select Sector SPDR Fund | | The Technology Select Sector SPDR Fund |
| | | | | | | | | | | | | |
| 1,298,361,592 | | $ 643,785,504 | | $ 678,691,872 | | $ 248,367,713 | | $116,732,403 | | $ 154,492,551 | | $ 454,910,901 |
| 4,504,458 | | 8,831,094 | | 2,871,815 | | 766,314 | | 439,502 | | 254,712 | | 3,038,190 |
| 51,696 | | 42,144 | | 3,018,418 | | 821,136 | | 1,490 | | — | | 61,887 |
| 235,128 | | 1,353,830 | | 186,623 | | 246,538 | | 132,049 | | — | | 541,597 |
| — | | — | | (602) | | — | | — | | — | | (806,285) |
| 1,303,152,874 | | 654,012,572 | | 684,768,126 | | 250,201,701 | | 117,305,444 | | 154,747,263 | | 457,746,290 |
| | | | | | | | | | | | | |
| 12,001,201 | | 9,905,534 | | 12,512,608 | | 4,375,647 | | 1,757,378 | | 1,466,962 | | 13,585,080 |
| 7,815,899 | | 6,202,322 | | 8,119,324 | | 2,773,894 | | 1,103,443 | | 935,513 | | 8,658,575 |
| 9,814,132 | | 8,062,522 | | 10,199,656 | | 3,553,393 | | 1,427,473 | | 1,197,377 | | 11,005,207 |
| 3,024,286 | | 2,493,763 | | 3,151,720 | | 1,101,226 | | 442,431 | | 369,577 | | 3,417,344 |
| 428,465 | | 352,807 | | 445,352 | | 151,018 | | 63,824 | | 55,400 | | 463,718 |
| 59,346 | | 8,630 | | 55,857 | | 7,423 | | 2,180 | | 6,248 | | 33,925 |
| 154,554 | | 94,084 | | 150,274 | | 59,044 | | 37,253 | | 37,102 | | 133,779 |
| 2,099,487 | | 1,607,529 | | 2,137,642 | | 692,883 | | 278,398 | | 247,629 | | 2,211,694 |
| 132,066 | | 96,966 | | 145,439 | | 39,938 | | 20,260 | | 21,340 | | 136,486 |
| 85,302 | | 138,726 | | 120,715 | | 65,590 | | 38,935 | | 35,352 | | 144,554 |
| 35,614,738 | | 28,962,883 | | 37,038,587 | | 12,820,056 | | 5,171,575 | | 4,372,500 | | 39,790,362 |
| $1,267,538,136 | | $ 625,049,689 | | $ 647,729,539 | | $ 237,381,645 | | $112,133,869 | | $ 150,374,763 | | $ 417,955,928 |
| | | | | | | | | | | | | |
| | | | | | | | | | | | | |
| (421,153,401) | | (3,178,295,126) | | (175,853,227) | | (435,710,519) | | (58,662,373) | | (164,350,722) | | (1,024,515,488) |
| 635 | | (29,128,191) | | 4,616 | | 4,144 | | 1,026 | | (1,500) | | (6,990) |
| 5,751,515,121 | | 1,112,557,621 | | 2,479,238,745 | | 809,773,018 | | 229,142,420 | | 12,315,730 | | 4,628,413,453 |
| — | | (1,425,932) | | — | | — | | — | | — | | — |
| (30,382,956) | | — | | — | | 145,496 | | (235,473) | | (3,183,234) | | 16,736,370 |
| 5,299,979,399 | | (2,096,291,628) | | 2,303,390,134 | | 374,212,139 | | 170,245,600 | | (155,219,726) | | 3,620,627,345 |
| | | | | | | | | | | | | |
| 2,730,501,346 | | 4,456,137,829 | | (34,221,648) | | 2,013,066,276 | | 529,137,837 | | (44,683,154) | | 9,577,512,291 |
| (2,878) | | 50,569,045 | | (4,513) | | (2,887) | | (262) | | 11 | | (8,448) |
| 7,267,001 | | — | | — | | 2,598,975 | | 232,616 | | 2,491,429 | | 5,689,089 |
| 2,737,765,469 | | 4,506,706,874 | | (34,226,161) | | 2,015,662,364 | | 529,370,191 | | (42,191,714) | | 9,583,192,932 |
| 8,037,744,868 | | 2,410,415,246 | | 2,269,163,973 | | 2,389,874,503 | | 699,615,791 | | (197,411,440) | | 13,203,820,277 |
| $9,305,283,004 | | $ 3,035,464,935 | | $2,916,893,512 | | $2,627,256,148 | | $811,749,660 | | $ (47,036,677) | | $13,621,776,205 |
THE SELECT SECTOR SPDR TRUST
STATEMENTS OF OPERATIONS (continued)
For the Year Ended September 30, 2023
| | The Utilities Select Sector SPDR Fund |
| INVESTMENT INCOME | |
Dividend income — unaffiliated issuers
| $ 473,682,817 |
Dividend income — affiliated issuers
| 1,247,383 |
Unaffiliated securities lending income
| 28,427 |
Affiliated securities lending income
| 179,823 |
TOTAL INVESTMENT INCOME (LOSS)
| 475,138,450 |
| EXPENSES | |
Advisory and Administration fees
| 4,854,809 |
Distribution fees
| 3,159,866 |
License fees
| 3,961,148 |
Unitary fees
| 1,223,333 |
Trustees’ fees and expenses
| 180,176 |
Registration and filing fees
| 23,261 |
Professional fees
| 74,373 |
Printing and postage fees
| 826,859 |
Insurance expense
| 61,177 |
Miscellaneous expenses
| 58,328 |
TOTAL EXPENSES
| 14,423,330 |
NET INVESTMENT INCOME (LOSS)
| $ 460,715,120 |
| REALIZED AND UNREALIZED GAIN (LOSS) | |
| Net realized gain (loss) on: | |
Investments — unaffiliated issuers
| (97,326,114) |
Investments — affiliated issuers
| 2,330 |
In-kind redemptions — unaffiliated issuers
| 226,919,709 |
Net realized gain (loss)
| 129,595,925 |
| Net change in unrealized appreciation/depreciation on: | |
Investments — unaffiliated issuers
| (1,597,726,827) |
Investments — affiliated issuers
| (2,749) |
Net change in unrealized appreciation/depreciation
| (1,597,729,576) |
NET REALIZED AND UNREALIZED GAIN (LOSS)
| (1,468,133,651) |
NET INCREASE (DECREASE) IN NET ASSETS FROM OPERATIONS
| $(1,007,418,531) |
See accompanying notes to financial statements.
66
[This Page Intentionally Left Blank]
THE SELECT SECTOR SPDR TRUST
STATEMENTS OF CHANGES IN NET ASSETS
| | The Communication Services Select Sector SPDR Fund | | The Consumer Discretionary Select Sector SPDR Fund |
| | Year Ended
9/30/23 | | Year Ended
9/30/22(a) | | Year Ended
9/30/23 | | Year Ended
9/30/22(a) |
| INCREASE (DECREASE) IN NET ASSETS FROM OPERATIONS: | | | | | | | |
Net investment income (loss)
| $ 98,537,829 | | $ 102,416,033 | | $ 142,809,888 | | $ 131,815,574 |
Net realized gain (loss)
| (313,056,658) | | 708,706,713 | | (157,092,031) | | 1,459,788,324 |
Net change in unrealized appreciation/depreciation
| 3,465,421,025 | | (6,255,706,911) | | 1,874,122,013 | | (5,746,428,466) |
Net increase (decrease) in net assets resulting from operations
| 3,250,902,196 | | (5,444,584,165) | | 1,859,839,870 | | (4,154,824,568) |
Net equalization credits and charges
| 1,560,533 | | (4,073,365) | | 3,199,990 | | (944,319) |
Distributions to shareholders
| (99,539,151) | | (98,460,012) | | (146,143,540) | | (129,853,122) |
| FROM BENEFICIAL INTEREST TRANSACTIONS: | | | | | | | |
Proceeds from shares sold
| 10,276,721,990 | | 10,323,050,378 | | 16,578,397,409 | | 21,602,723,713 |
Cost of shares redeemed
| (7,895,818,143) | | (12,378,013,156) | | (14,958,622,444) | | (22,853,143,682) |
Net income equalization
| (1,560,533) | | 4,073,365 | | (3,199,990) | | 944,319 |
Net increase (decrease) in net assets from beneficial interest transactions
| 2,379,343,314 | | (2,050,889,413) | | 1,616,574,975 | | (1,249,475,650) |
Net increase (decrease) in net assets during the period
| 5,532,266,892 | | (7,598,006,955) | | 3,333,471,295 | | (5,535,097,659) |
Net assets at beginning of period
| 7,578,049,935 | | 15,176,056,890 | | 14,098,638,921 | | 19,633,736,580 |
NET ASSETS AT END OF PERIOD
| $13,110,316,827 | | $ 7,578,049,935 | | $ 17,432,110,216 | | $ 14,098,638,921 |
| SHARES OF BENEFICIAL INTEREST: | | | | | | | |
Shares sold
| 179,500,000 | | 150,200,000 | | 109,800,000 | | 123,600,000 |
Shares redeemed
| (137,850,000) | | (181,300,000) | | (100,450,000) | | (134,000,000) |
Net increase (decrease) from share transactions
| 41,650,000 | | (31,100,000) | | 9,350,000 | | (10,400,000) |
| | |
| (a) | Beginning with the year ended September 30, 2023, the Fund was audited by Cohen & Company. The year ended September 30, 2022 was audited by another independent registered public accounting firm. |
See accompanying notes to financial statements.
68
| The Consumer Staples Select Sector SPDR Fund | | The Energy Select Sector SPDR Fund | | The Financial Select Sector SPDR Fund |
Year Ended
9/30/23 | | Year Ended
9/30/22(a) | | Year Ended
9/30/23 | | Year Ended
9/30/22(a) | | Year Ended
9/30/23 | | Year Ended
9/30/22(a) |
| | | | | | | | | | | |
| $ 441,865,915 | | $ 364,578,342 | | $ 1,267,538,136 | | $ 1,395,774,120 | | $ 625,049,689 | | $ 720,755,368 |
| 38,814,801 | | 844,454,846 | | 5,299,979,399 | | 8,300,112,401 | | (2,096,291,628) | | 2,844,401,110 |
| 234,189,458 | | (1,725,652,584) | | 2,737,765,469 | | 1,644,500,576 | | 4,506,706,874 | | (10,851,874,431) |
| 714,870,174 | | (516,619,396) | | 9,305,283,004 | | 11,340,387,097 | | 3,035,464,935 | | (7,286,717,953) |
| 795,893 | | 5,281,761 | | (37,006,912) | | (30,219,502) | | (3,966,926) | | (26,262,713) |
| (441,127,478) | | (366,815,541) | | (1,341,480,922) | | (1,446,908,773) | | (620,776,102) | | (694,964,954) |
| | | | | | | | | | | |
| 23,046,682,696 | | 29,214,101,970 | | 27,146,924,381 | | 38,323,878,231 | | 43,299,923,641 | | 49,626,705,184 |
| (21,580,150,154) | | (25,622,285,154) | | (29,602,268,044) | | (39,770,503,382) | | (42,070,236,620) | | (55,103,779,237) |
| (795,893) | | (5,281,761) | | 37,006,912 | | 30,219,502 | | 3,966,926 | | 26,262,713 |
| 1,465,736,649 | | 3,586,535,055 | | (2,418,336,751) | | (1,416,405,649) | | 1,233,653,947 | | (5,450,811,340) |
| 1,740,275,238 | | 2,708,381,879 | | 5,508,458,419 | | 8,446,853,173 | | 3,644,375,854 | | (13,458,756,960) |
| 14,465,958,074 | | 11,757,576,195 | | 33,531,191,692 | | 25,084,338,519 | | 26,953,933,447 | | 40,412,690,407 |
| $ 16,206,233,312 | | $ 14,465,958,074 | | $ 39,039,650,111 | | $ 33,531,191,692 | | $ 30,598,309,301 | | $ 26,953,933,447 |
| | | | | | | | | | | |
| 312,650,000 | | 392,500,000 | | 314,400,000 | | 551,600,000 | | 1,287,000,000 | | 1,339,600,000 |
| (293,950,000) | | (346,500,000) | | (348,350,000) | | (567,100,000) | | (1,253,750,000) | | (1,527,200,000) |
| 18,700,000 | | 46,000,000 | | (33,950,000) | | (15,500,000) | | 33,250,000 | | (187,600,000) |
| | |
| (a) | Beginning with the year ended September 30, 2023, the Fund was audited by Cohen & Company. The year ended September 30, 2022 was audited by another independent registered public accounting firm. |
THE SELECT SECTOR SPDR TRUST
STATEMENTS OF CHANGES IN NET ASSETS (continued)
| | The Health Care Select Sector SPDR Fund | | The Industrial Select Sector SPDR Fund |
| | Year Ended
9/30/23 | | Year Ended
9/30/22(a) | | Year Ended
9/30/23 | | Year Ended
9/30/22(a) |
| INCREASE (DECREASE) IN NET ASSETS FROM OPERATIONS: | | | | | | | |
Net investment income (loss)
| $ 647,729,539 | | $ 532,272,447 | | $ 237,381,645 | | $ 237,312,729 |
Net realized gain (loss)
| 2,303,390,134 | | 3,156,743,791 | | 374,212,139 | | 1,109,082,575 |
Net change in unrealized appreciation/depreciation
| (34,226,161) | | (5,562,711,590) | | 2,015,662,364 | | (3,250,181,327) |
Net increase (decrease) in net assets resulting from operations
| 2,916,893,512 | | (1,873,695,352) | | 2,627,256,148 | | (1,903,786,023) |
Net equalization credits and charges
| 1,559,845 | | 10,937,354 | | (867,162) | | (6,531,041) |
Distributions to shareholders
| (648,808,543) | | (547,486,712) | | (236,264,195) | | (231,405,184) |
| FROM BENEFICIAL INTEREST TRANSACTIONS: | | | | | | | |
Proceeds from shares sold
| 27,182,182,809 | | 36,629,546,954 | | 25,545,625,552 | | 20,377,366,355 |
Cost of shares redeemed
| (27,549,852,253) | | (28,762,153,713) | | (24,628,479,250) | | (24,504,637,390) |
Net income equalization
| (1,559,845) | | (10,937,354) | | 867,162 | | 6,531,041 |
Net increase (decrease) in net assets from beneficial interest transactions
| (369,229,289) | | 7,856,455,887 | | 918,013,464 | | (4,120,739,994) |
Contribution from affiliate (Note 4)
| — | | — | | 4,351 | | — |
Net increase (decrease) in net assets during the period
| 1,900,415,525 | | 5,446,211,177 | | 3,308,142,606 | | (6,262,462,242) |
Net assets at beginning of period
| 35,805,067,041 | | 30,358,855,864 | | 11,104,719,728 | | 17,367,181,970 |
NET ASSETS AT END OF PERIOD
| $ 37,705,482,566 | | $ 35,805,067,041 | | $ 14,412,862,334 | | $ 11,104,719,728 |
| SHARES OF BENEFICIAL INTEREST: | | | | | | | |
Shares sold
| 205,850,000 | | 277,250,000 | | 252,600,000 | | 208,050,000 |
Shares redeemed
| (208,800,000) | | (219,950,000) | | (244,500,000) | | (251,550,000) |
Net increase (decrease) from share transactions
| (2,950,000) | | 57,300,000 | | 8,100,000 | | (43,500,000) |
| | |
| (a) | Beginning with the year ended September 30, 2023, the Fund was audited by Cohen & Company. The year ended September 30, 2022 was audited by another independent registered public accounting firm. |
See accompanying notes to financial statements.
70
| The Materials Select Sector SPDR Fund | | The Real Estate Select Sector SPDR Fund | | The Technology Select Sector SPDR Fund |
Year Ended
9/30/23 | | Year Ended
9/30/22(a) | | Year Ended
9/30/23 | | Year Ended
9/30/22(a) | | Year Ended
9/30/23 | | Year Ended
9/30/22(a) |
| | | | | | | | | | | |
| $ 112,133,869 | | $ 141,752,846 | | $ 150,374,763 | | $ 101,651,228 | | $ 417,955,928 | | $ 370,356,173 |
| 170,245,600 | | 390,596,179 | | (155,219,726) | | 229,318,907 | | 3,620,627,345 | | 7,445,819,258 |
| 529,370,191 | | (1,306,766,807) | | (42,191,714) | | (1,383,235,447) | | 9,583,192,932 | | (16,935,348,705) |
| 811,749,660 | | (774,417,782) | | (47,036,677) | | (1,052,265,312) | | 13,621,776,205 | | (9,119,173,274) |
| (511,811) | | (5,327,250) | | (769,779) | | 3,998,621 | | (831,220) | | (660,883) |
| (113,054,528) | | (140,291,094) | | (165,782,154) | | (165,006,172) | | (413,152,075) | | (369,413,320) |
| | | | | | | | | | | |
| 9,947,647,838 | | 9,286,163,854 | | 3,578,815,569 | | 6,393,738,629 | | 21,083,097,992 | | 31,297,130,714 |
| (10,406,162,353) | | (11,170,933,914) | | (3,884,830,594) | | (4,846,435,169) | | (22,360,823,963) | | (29,174,529,672) |
| 511,811 | | 5,327,250 | | 769,779 | | (3,998,621) | | 831,220 | | 660,883 |
| (458,002,704) | | (1,879,442,810) | | (305,245,246) | | 1,543,304,839 | | (1,276,894,751) | | 2,123,261,925 |
| — | | — | | — | | — | | — | | — |
| 240,180,617 | | (2,799,478,936) | | (518,833,856) | | 330,031,976 | | 11,930,898,159 | | (7,365,985,552) |
| 4,702,426,945 | | 7,501,905,881 | | 4,612,173,222 | | 4,282,141,246 | | 35,656,530,647 | | 43,022,516,199 |
| $ 4,942,607,562 | | $ 4,702,426,945 | | $ 4,093,339,366 | | $ 4,612,173,222 | | $ 47,587,428,806 | | $ 35,656,530,647 |
| | | | | | | | | | | |
| 124,800,000 | | 111,250,000 | | 95,950,000 | | 140,250,000 | | 139,250,000 | | 206,250,000 |
| (131,050,000) | | (136,900,000) | | (103,900,000) | | (108,450,000) | | (149,200,000) | | (194,000,000) |
| (6,250,000) | | (25,650,000) | | (7,950,000) | | 31,800,000 | | (9,950,000) | | 12,250,000 |
| | |
| (a) | Beginning with the year ended September 30, 2023, the Fund was audited by Cohen & Company. The year ended September 30, 2022 was audited by another independent registered public accounting firm. |
THE SELECT SECTOR SPDR TRUST
STATEMENTS OF CHANGES IN NET ASSETS (continued)
| | The Utilities Select Sector SPDR Fund |
| | Year Ended
9/30/23 | | Year Ended
9/30/22(a) |
| INCREASE (DECREASE) IN NET ASSETS FROM OPERATIONS: | | | |
Net investment income (loss)
| $ 460,715,120 | | $ 404,898,424 |
Net realized gain (loss)
| 129,595,925 | | 676,116,079 |
Net change in unrealized appreciation/depreciation
| (1,597,729,576) | | (825,343,425) |
Net increase (decrease) in net assets resulting from operations
| (1,007,418,531) | | 255,671,078 |
Net equalization credits and charges
| 5,411,223 | | 8,627,389 |
Distributions to shareholders
| (497,337,622) | | (430,630,955) |
| FROM BENEFICIAL INTEREST TRANSACTIONS: | | | |
Proceeds from shares sold
| 16,592,246,348 | | 24,428,615,968 |
Cost of shares redeemed
| (18,020,106,465) | | (20,091,272,564) |
Net income equalization
| (5,411,223) | | (8,627,389) |
Net increase (decrease) in net assets from beneficial interest transactions
| (1,433,271,340) | | 4,328,716,015 |
Net increase (decrease) in net assets during the period
| (2,932,616,270) | | 4,162,383,527 |
Net assets at beginning of period
| 16,119,052,747 | | 11,956,669,220 |
NET ASSETS AT END OF PERIOD
| $ 13,186,436,477 | | $ 16,119,052,747 |
| SHARES OF BENEFICIAL INTEREST: | | | |
Shares sold
| 248,600,000 | | 345,250,000 |
Shares redeemed
| (271,100,000) | | (286,200,000) |
Net increase (decrease) from share transactions
| (22,500,000) | | 59,050,000 |
| | |
| (a) | Beginning with the year ended September 30, 2023, the Fund was audited by Cohen & Company. The year ended September 30, 2022 was audited by another independent registered public accounting firm. |
See accompanying notes to financial statements.
72
THE SELECT SECTOR SPDR TRUST
FINANCIAL HIGHLIGHTS
Selected data for a share outstanding throughout each period
| | The Communication Services Select Sector SPDR Fund |
| | Year
Ended
9/30/23 | | Year
Ended
9/30/22(a) | | Year
Ended
9/30/21(a) | | Year
Ended
9/30/20(a) | | Year
Ended
9/30/19(b) |
Net asset value, beginning of period
| $ 47.89 | | $ 80.15 | | $ 59.40 | | $ 49.50 | | $ 48.98 |
| Income (loss) from investment operations: | | | | | | | | | |
Net investment income (loss) (c)
| 0.54 | | 0.58 | | 0.54 | | 0.47 | | 0.44 |
Net realized and unrealized gain (loss) (d)
| 17.68 | | (32.25) | | 20.73 | | 9.88 | | 0.51 |
Total from investment operations
| 18.22 | | (31.67) | | 21.27 | | 10.35 | | 0.95 |
Net equalization credits and charges (c)
| 0.01 | | (0.02) | | (0.00)(e) | | 0.02 | | 0.02 |
| Distributions to shareholders from: | | | | | | | | | |
Net investment income
| (0.54) | | (0.57) | | (0.52) | | (0.47) | | (0.45) |
Net asset value, end of period
| $ 65.58 | | $ 47.89 | | $ 80.15 | | $ 59.40 | | $ 49.50 |
Total return (f)
| 38.24% | | (39.71)% | | 35.88% | | 21.05% | | 2.07% |
| Ratios and Supplemental Data: | | | | | | | | | |
Net assets, end of period (in 000s)
| $13,110,317 | | $7,578,050 | | $15,176,057 | | $10,106,071 | | $6,039,403 |
| Ratios to average net assets: | | | | | | | | | |
Total expenses
| 0.09% | | 0.10% | | 0.11% | | 0.13% | | 0.13% |
Net investment income (loss)
| 0.92% | | 0.88% | | 0.73% | | 0.86% | | 0.93% |
Portfolio turnover rate (g)
| 28% | | 21% | | 15% | | 15% | | 16% |
| (a) | Beginning with the year ended September 30, 2023, the Fund was audited by Cohen & Company. The previous years were audited by another independent registered public accounting firm. |
| (b) | Beginning with the year ended September 30, 2020, the Fund was audited by Ernst & Young LLP. The previous years were audited by another independent registered public accounting firm. |
| (c) | Per share numbers have been calculated using average shares outstanding, which more appropriately presents the per share data for the year. |
| (d) | Amounts shown in this caption for a share outstanding may not accord with the change in aggregate gains and losses in securities for the fiscal period because of the timing of sales and repurchases of Fund shares in relation to fluctuating market values for the Fund. |
| (e) | Amount is less than $0.005 per share. |
| (f) | Total return is calculated assuming a purchase of shares at net asset value on the first day and a sale at net asset value on the last day of each period reported. Distributions are assumed, for the purpose of this calculation, to be reinvested at net asset value per share on the respective payment dates of each distribution. Total returns for periods of less than one year are not annualized. Broker commission charges are not included in this calculation. |
| (g) | Portfolio turnover rate excludes securities received or delivered from in-kind processing of creations or redemptions on Select Sector SPDR shares. |
See accompanying notes to financial statements.
73
THE SELECT SECTOR SPDR TRUST
FINANCIAL HIGHLIGHTS (continued)
Selected data for a share outstanding throughout each period
| | The Consumer Discretionary Select Sector SPDR Fund |
| | Year
Ended
9/30/23 | | Year
Ended
9/30/22(a) | | Year
Ended
9/30/21(a) | | Year
Ended
9/30/20(a) | | Year
Ended
9/30/19(b) |
Net asset value, beginning of period
| $ 142.48 | | $ 179.54 | | $ 146.99 | | $ 120.69 | | $ 117.19 |
| Income (loss) from investment operations: | | | | | | | | | |
Net investment income (loss) (c)
| 1.43 | | 1.23 | | 1.09 | | 1.46 | | 1.58 |
Net realized and unrealized gain (loss) (d)
| 18.46 | | (37.06) | | 32.54 | | 26.34 | | 3.51 |
Total from investment operations
| 19.89 | | (35.83) | | 33.63 | | 27.80 | | 5.09 |
Net equalization credits and charges (c)
| 0.03 | | (0.01) | | 0.01 | | (0.06) | | (0.02) |
| Distributions to shareholders from: | | | | | | | | | |
Net investment income
| (1.44) | | (1.22) | | (1.09) | | (1.44) | | (1.57) |
Net asset value, end of period
| $ 160.96 | | $ 142.48 | | $ 179.54 | | $ 146.99 | | $ 120.69 |
Total return (e)
| 14.08% | | (20.06)% | | 22.93% | | 23.25% | | 4.45% |
| Ratios and Supplemental Data: | | | | | | | | | |
Net assets, end of period (in 000s)
| $17,432,110 | | $14,098,639 | | $19,633,737 | | $15,809,198 | | $13,928,314 |
| Ratios to average net assets: | | | | | | | | | |
Total expenses
| 0.09% | | 0.10% | | 0.11% | | 0.13% | | 0.13% |
Net investment income (loss)
| 0.95% | | 0.70% | | 0.65% | | 1.17% | | 1.40% |
Portfolio turnover rate (f)
| 24% | | 22% | | 23% | | 11% | | 6% |
| (a) | Beginning with the year ended September 30, 2023, the Fund was audited by Cohen & Company. The previous years were audited by another independent registered public accounting firm. |
| (b) | Beginning with the year ended September 30, 2020, the Fund was audited by Ernst & Young LLP. The previous years were audited by another independent registered public accounting firm. |
| (c) | Per share numbers have been calculated using average shares outstanding, which more appropriately presents the per share data for the year. |
| (d) | Amounts shown in this caption for a share outstanding may not accord with the change in aggregate gains and losses in securities for the fiscal period because of the timing of sales and repurchases of Fund shares in relation to fluctuating market values for the Fund. |
| (e) | Total return is calculated assuming a purchase of shares at net asset value on the first day and a sale at net asset value on the last day of each period reported. Distributions are assumed, for the purpose of this calculation, to be reinvested at net asset value per share on the respective payment dates of each distribution. Total returns for periods of less than one year are not annualized. Broker commission charges are not included in this calculation. |
| (f) | Portfolio turnover rate excludes securities received or delivered from in-kind processing of creations or redemptions on Select Sector SPDR shares. |
See accompanying notes to financial statements.
74
THE SELECT SECTOR SPDR TRUST
FINANCIAL HIGHLIGHTS (continued)
Selected data for a share outstanding throughout each period
| | The Consumer Staples Select Sector SPDR Fund |
| | Year
Ended
9/30/23 | | Year
Ended
9/30/22(a) | | Year
Ended
9/30/21(a) | | Year
Ended
9/30/20(a) | | Year
Ended
9/30/19(b) |
Net asset value, beginning of period
| $ 66.72 | | $ 68.83 | | $ 64.13 | | $ 61.41 | | $ 53.92 |
| Income (loss) from investment operations: | | | | | | | | | |
Net investment income (loss) (c)
| 1.90 | | 1.84 | | 1.85 | | 1.66 | | 1.60 |
Net realized and unrealized gain (loss) (d)
| 2.08 | | (2.16) | | 4.67 | | 2.70 | | 7.41 |
Total from investment operations
| 3.98 | | (0.32) | | 6.52 | | 4.36 | | 9.01 |
Net equalization credits and charges (c)
| 0.00(e) | | 0.03 | | (0.01) | | 0.00(e) | | 0.05 |
| Distributions to shareholders from: | | | | | | | | | |
Net investment income
| (1.89) | | (1.82) | | (1.81) | | (1.64) | | (1.57) |
Net asset value, end of period
| $ 68.81 | | $ 66.72 | | $ 68.83 | | $ 64.13 | | $ 61.41 |
Total return (f)
| 5.84% | | (0.63)% | | 10.19% | | 7.32% | | 17.14% |
| Ratios and Supplemental Data: | | | | | | | | | |
Net assets, end of period (in 000s)
| $16,206,233 | | $14,465,958 | | $11,757,576 | | $13,687,240 | | $14,015,004 |
| Ratios to average net assets: | | | | | | | | | |
Total expenses
| 0.09% | | 0.10% | | 0.11% | | 0.13% | | 0.13% |
Net investment income (loss)
| 2.58% | | 2.49% | | 2.71% | | 2.73% | | 2.84% |
Portfolio turnover rate (g)
| 17% | | 11% | | 4% | | 5% | | 10% |
| (a) | Beginning with the year ended September 30, 2023, the Fund was audited by Cohen & Company. The previous years were audited by another independent registered public accounting firm. |
| (b) | Beginning with the year ended September 30, 2020, the Fund was audited by Ernst & Young LLP. The previous years were audited by another independent registered public accounting firm. |
| (c) | Per share numbers have been calculated using average shares outstanding, which more appropriately presents the per share data for the year. |
| (d) | Amounts shown in this caption for a share outstanding may not accord with the change in aggregate gains and losses in securities for the fiscal period because of the timing of sales and repurchases of Fund shares in relation to fluctuating market values for the Fund. |
| (e) | Amount is less than $0.005 per share. |
| (f) | Total return is calculated assuming a purchase of shares at net asset value on the first day and a sale at net asset value on the last day of each period reported. Distributions are assumed, for the purpose of this calculation, to be reinvested at net asset value per share on the respective payment dates of each distribution. Total returns for periods of less than one year are not annualized. Broker commission charges are not included in this calculation. |
| (g) | Portfolio turnover rate excludes securities received or delivered from in-kind processing of creations or redemptions on Select Sector SPDR shares. |
See accompanying notes to financial statements.
75
THE SELECT SECTOR SPDR TRUST
FINANCIAL HIGHLIGHTS (continued)
Selected data for a share outstanding throughout each period
| | The Energy Select Sector SPDR Fund |
| | Year
Ended
9/30/23 | | Year
Ended
9/30/22(a) | | Year
Ended
9/30/21(a) | | Year
Ended
9/30/20(a) | | Year
Ended
9/30/19(b) |
Net asset value, beginning of period
| $ 71.98 | | $ 52.12 | | $ 29.97 | | $ 59.18 | | $ 75.75 |
| Income (loss) from investment operations: | | | | | | | | | |
Net investment income (loss) (c)
| 2.81 | | 2.91 | | 2.11 | | 2.19 | | 4.01 |
Net realized and unrealized gain (loss) (d)
| 18.72 | | 20.07 | | 22.11 | | (27.49) | | (18.36) |
Total from investment operations
| 21.53 | | 22.98 | | 24.22 | | (25.30) | | (14.35) |
Net equalization credits and charges (c)
| (0.08) | | (0.06) | | 0.09 | | 0.08 | | (0.04) |
Contribution from Affiliate
| — | | — | | — | | 0.00(e)(f) | | — |
| Distributions to shareholders from: | | | | | | | | | |
Net investment income
| (3.03) | | (3.06) | | (2.16) | | (3.99) | | (2.18) |
Net asset value, end of period
| $ 90.40 | | $ 71.98 | | $ 52.12 | | $ 29.97 | | $ 59.18 |
Total return (g)
| 30.31% | | 44.34% | | 81.93% | | (44.68)%(h) | | (19.08)% |
| Ratios and Supplemental Data: | | | | | | | | | |
Net assets, end of period (in 000s)
| $39,039,650 | | $33,531,192 | | $25,084,339 | | $8,430,789 | | $10,014,781 |
| Ratios to average net assets: | | | | | | | | | |
Total expenses
| 0.09% | | 0.10% | | 0.11% | | 0.13% | | 0.13% |
Net investment income (loss)
| 3.30% | | 4.14% | | 4.54% | | 5.08% | | 6.25% |
Portfolio turnover rate (i)
| 8% | | 9% | | 14% | | 13% | | 10% |
| (a) | Beginning with the year ended September 30, 2023, the Fund was audited by Cohen & Company. The previous years were audited by another independent registered public accounting firm. |
| (b) | Beginning with the year ended September 30, 2020, the Fund was audited by Ernst & Young LLP. The previous years were audited by another independent registered public accounting firm. |
| (c) | Per share numbers have been calculated using average shares outstanding, which more appropriately presents the per share data for the year. |
| (d) | Amounts shown in this caption for a share outstanding may not accord with the change in aggregate gains and losses in securities for the fiscal period because of the timing of sales and repurchases of Fund shares in relation to fluctuating market values for the Fund. |
| (e) | Amount is less than $0.005 per share. |
| (f) | Contribution paid by an Affiliate in the amount of $290,417. |
| (g) | Total return is calculated assuming a purchase of shares at net asset value on the first day and a sale at net asset value on the last day of each period reported. Distributions are assumed, for the purpose of this calculation, to be reinvested at net asset value per share on the respective payment dates of each distribution. Total returns for periods of less than one year are not annualized. Broker commission charges are not included in this calculation. |
| (h) | The contribution from an Affiliate had no impact on total return. |
| (i) | Portfolio turnover rate excludes securities received or delivered from in-kind processing of creations or redemptions on Select Sector SPDR shares. |
See accompanying notes to financial statements.
76
THE SELECT SECTOR SPDR TRUST
FINANCIAL HIGHLIGHTS (continued)
Selected data for a share outstanding throughout each period
| | The Financial Select Sector SPDR Fund |
| | Year
Ended
9/30/23 | | Year
Ended
9/30/22(a) | | Year
Ended
9/30/21(a) | | Year
Ended
9/30/20(a) | | Year
Ended
9/30/19(b) |
Net asset value, beginning of period
| $ 30.31 | | $ 37.53 | | $ 24.06 | | $ 28.02 | | $ 27.58 |
| Income (loss) from investment operations: | | | | | | | | | |
Net investment income (loss) (c)
| 0.67 | | 0.68 | | 0.61 | | 0.60 | | 0.57 |
Net realized and unrealized gain (loss) (d)
| 2.86 | | (7.21) | | 13.44 | | (3.94) | | 0.46 |
Total from investment operations
| 3.53 | | (6.53) | | 14.05 | | (3.34) | | 1.03 |
Net equalization credits and charges (c)
| 0.00(e) | | (0.02) | | 0.02 | | (0.02) | | (0.03) |
| Distributions to shareholders from: | | | | | | | | | |
Net investment income
| (0.67) | | (0.67) | | (0.60) | | (0.60) | | (0.56) |
Net asset value, end of period
| $ 33.17 | | $ 30.31 | | $ 37.53 | | $ 24.06 | | $ 28.02 |
Total return (f)
| 11.67% | | (17.67)% | | 58.79% | | (11.98)% | | 3.81% |
| Ratios and Supplemental Data: | | | | | | | | | |
Net assets, end of period (in 000s)
| $30,598,309 | | $26,953,933 | | $40,412,690 | | $16,646,404 | | $22,552,204 |
| Ratios to average net assets: | | | | | | | | | |
Total expenses
| 0.09% | | 0.10% | | 0.11% | | 0.13% | | 0.13% |
Net investment income (loss)
| 1.97% | | 1.83% | | 1.80% | | 2.30% | | 2.13% |
Portfolio turnover rate (g)
| 23% | | 4% | | 3% | | 4% | | 4% |
| (a) | Beginning with the year ended September 30, 2023, the Fund was audited by Cohen & Company. The previous years were audited by another independent registered public accounting firm. |
| (b) | Beginning with the year ended September 30, 2020, the Fund was audited by Ernst & Young LLP. The previous years were audited by another independent registered public accounting firm. |
| (c) | Per share numbers have been calculated using average shares outstanding, which more appropriately presents the per share data for the year. |
| (d) | Amounts shown in this caption for a share outstanding may not accord with the change in aggregate gains and losses in securities for the fiscal period because of the timing of sales and repurchases of Fund shares in relation to fluctuating market values for the Fund. |
| (e) | Amount is less than $0.005 per share. |
| (f) | Total return is calculated assuming a purchase of shares at net asset value on the first day and a sale at net asset value on the last day of each period reported. Distributions are assumed, for the purpose of this calculation, to be reinvested at net asset value per share on the respective payment dates of each distribution. Total returns for periods of less than one year are not annualized. Broker commission charges are not included in this calculation. |
| (g) | Portfolio turnover rate excludes securities received or delivered from in-kind processing of creations or redemptions on Select Sector SPDR shares. |
See accompanying notes to financial statements.
77
THE SELECT SECTOR SPDR TRUST
FINANCIAL HIGHLIGHTS (continued)
Selected data for a share outstanding throughout each period
| | The Health Care Select Sector SPDR Fund |
| | Year
Ended
9/30/23 | | Year
Ended
9/30/22(a) | | Year
Ended
9/30/21(a) | | Year
Ended
9/30/20(a) | | Year
Ended
9/30/19(b) |
Net asset value, beginning of period
| $ 121.02 | | $ 127.26 | | $ 105.56 | | $ 90.13 | | $ 95.11 |
| Income (loss) from investment operations: | | | | | | | | | |
Net investment income (loss) (c)
| 2.13 | | 1.95 | | 1.85 | | 1.66 | | 2.29 |
Net realized and unrealized gain (loss) (d)
| 7.69 | | (6.27) | | 21.65 | | 16.08 | | (5.75) |
Total from investment operations
| 9.82 | | (4.32) | | 23.50 | | 17.74 | | (3.46) |
Net equalization credits and charges (c)
| 0.01 | | 0.04 | | 0.01 | | (0.00)(e) | | (0.02) |
| Distributions to shareholders from: | | | | | | | | | |
Net investment income
| (2.13) | | (1.96) | | (1.81) | | (2.31) | | (1.50) |
Net asset value, end of period
| $ 128.72 | | $ 121.02 | | $ 127.26 | | $ 105.56 | | $ 90.13 |
Total return (f)
| 8.10% | | (3.47)% | | 22.37% | | 19.90% | | (3.65)% |
| Ratios and Supplemental Data: | | | | | | | | | |
Net assets, end of period (in 000s)
| $37,705,483 | | $35,805,067 | | $30,358,856 | | $23,873,455 | | $16,818,717 |
| Ratios to average net assets: | | | | | | | | | |
Total expenses
| 0.09% | | 0.10% | | 0.11% | | 0.13% | | 0.13% |
Net investment income (loss)
| 1.62% | | 1.48% | | 1.54% | | 1.67% | | 2.53% |
Portfolio turnover rate (g)
| 3% | | 2% | | 4% | | 3% | | 2% |
| (a) | Beginning with the year ended September 30, 2023, the Fund was audited by Cohen & Company. The previous years were audited by another independent registered public accounting firm. |
| (b) | Beginning with the year ended September 30, 2020, the Fund was audited by Ernst & Young LLP. The previous years were audited by another independent registered public accounting firm. |
| (c) | Per share numbers have been calculated using average shares outstanding, which more appropriately presents the per share data for the year. |
| (d) | Amounts shown in this caption for a share outstanding may not accord with the change in aggregate gains and losses in securities for the fiscal period because of the timing of sales and repurchases of Fund shares in relation to fluctuating market values for the Fund. |
| (e) | Amount is less than $0.005 per share. |
| (f) | Total return is calculated assuming a purchase of shares at net asset value on the first day and a sale at net asset value on the last day of each period reported. Distributions are assumed, for the purpose of this calculation, to be reinvested at net asset value per share on the respective payment dates of each distribution. Total returns for periods of less than one year are not annualized. Broker commission charges are not included in this calculation. |
| (g) | Portfolio turnover rate excludes securities received or delivered from in-kind processing of creations or redemptions on Select Sector SPDR shares. |
See accompanying notes to financial statements.
78
THE SELECT SECTOR SPDR TRUST
FINANCIAL HIGHLIGHTS (continued)
Selected data for a share outstanding throughout each period
| | The Industrial Select Sector SPDR Fund |
| | Year
Ended
9/30/23 | | Year
Ended
9/30/22(a) | | Year
Ended
9/30/21(a) | | Year
Ended
9/30/20(a) | | Year
Ended
9/30/19(b) |
Net asset value, beginning of period
| $ 82.79 | | $ 97.77 | | $ 76.98 | | $ 77.66 | | $ 78.37 |
| Income (loss) from investment operations: | | | | | | | | | |
Net investment income (loss) (c)
| 1.71 | | 1.52 | | 1.27 | | 1.39 | | 1.52 |
Net realized and unrealized gain (loss) (d)
| 18.56 | | (14.94) | | 20.81 | | (0.68) | | (0.63) |
Total from investment operations
| 20.27 | | (13.42) | | 22.08 | | 0.71 | | 0.89 |
Net equalization credits and charges (c)
| (0.01) | | (0.04) | | 0.01 | | 0.02 | | (0.03) |
Contribution from Affiliate (Note 4)
| 0.00(e) | | — | | — | | — | | 0.00(e)(f) |
| Distributions to shareholders from: | | | | | | | | | |
Net investment income
| (1.71) | | (1.52) | | (1.30) | | (1.41) | | (1.57) |
Net asset value, end of period
| $ 101.34 | | $ 82.79 | | $ 97.77 | | $ 76.98 | | $ 77.66 |
Total return (g)
| 24.50%(h) | | (13.95)% | | 28.74% | | 1.12% | | 1.25%(h) |
| Ratios and Supplemental Data: | | | | | | | | | |
Net assets, end of period (in 000s)
| $14,412,862 | | $11,104,720 | | $17,367,182 | | $12,179,734 | | $9,802,368 |
| Ratios to average net assets: | | | | | | | | | |
Total expenses
| 0.09% | | 0.10% | | 0.11% | | 0.13% | | 0.13% |
Net investment income (loss)
| 1.69% | | 1.54% | | 1.33% | | 1.87% | | 2.07% |
Portfolio turnover rate (i)
| 9% | | 7% | | 2% | | 3% | | 3% |
| (a) | Beginning with the year ended September 30, 2023, the Fund was audited by Cohen & Company. The previous years were audited by another independent registered public accounting firm. |
| (b) | Beginning with the year ended September 30, 2020, the Fund was audited by Ernst & Young LLP. The previous years were audited by another independent registered public accounting firm. |
| (c) | Per share numbers have been calculated using average shares outstanding, which more appropriately presents the per share data for the year. |
| (d) | Amounts shown in this caption for a share outstanding may not accord with the change in aggregate gains and losses in securities for the fiscal period because of the timing of sales and repurchases of Fund shares in relation to fluctuating market values for the Fund. |
| (e) | Amount is less than $0.005 per share. |
| (f) | Contribution paid by an Affiliate in the amount of $60,421. |
| (g) | Total return is calculated assuming a purchase of shares at net asset value on the first day and a sale at net asset value on the last day of each period reported. Distributions are assumed, for the purpose of this calculation, to be reinvested at net asset value per share on the respective payment dates of each distribution. Total returns for periods of less than one year are not annualized. Broker commission charges are not included in this calculation. |
| (h) | The contribution from an Affiliate had no impact on total return. |
| (i) | Portfolio turnover rate excludes securities received or delivered from in-kind processing of creations or redemptions on Select Sector SPDR shares. |
See accompanying notes to financial statements.
79
THE SELECT SECTOR SPDR TRUST
FINANCIAL HIGHLIGHTS (continued)
Selected data for a share outstanding throughout each period
| | The Materials Select Sector SPDR Fund |
| | Year
Ended
9/30/23 | | Year
Ended
9/30/22(a) | | Year
Ended
9/30/21(a) | | Year
Ended
9/30/20(a) | | Year
Ended
9/30/19(b) |
Net asset value, beginning of period
| $ 67.98 | | $ 79.11 | | $ 63.62 | | $ 58.17 | | $ 57.92 |
| Income (loss) from investment operations: | | | | | | | | | |
Net investment income (loss) (c)
| 1.59 | | 1.64 | | 1.45 | | 1.23 | | 1.20 |
Net realized and unrealized gain (loss) (d)
| 10.62 | | (11.02) | | 15.43 | | 5.47 | | 0.28 |
Total from investment operations
| 12.21 | | (9.38) | | 16.88 | | 6.70 | | 1.48 |
Net equalization credits and charges (c)
| (0.01) | | (0.06) | | (0.00)(e) | | (0.03) | | (0.03) |
| Distributions to shareholders from: | | | | | | | | | |
Net investment income
| (1.63) | | (1.69) | | (1.39) | | (1.22) | | (1.20) |
Net asset value, end of period
| $ 78.55 | | $ 67.98 | | $ 79.11 | | $ 63.62 | | $ 58.17 |
Total return (f)
| 17.97% | | (12.23)% | | 26.60% | | 11.76% | | 2.64% |
| Ratios and Supplemental Data: | | | | | | | | | |
Net assets, end of period (in 000s)
| $4,942,608 | | $4,702,427 | | $7,501,906 | | $3,917,044 | | $4,201,473 |
| Ratios to average net assets: | | | | | | | | | |
Total expenses
| 0.09% | | 0.10% | | 0.11% | | 0.13% | | 0.13% |
Net investment income (loss)
| 1.99% | | 1.97% | | 1.83% | | 2.15% | | 2.18% |
Portfolio turnover rate (g)
| 3% | | 2% | | 5% | | 4% | | 20% |
| (a) | Beginning with the year ended September 30, 2023, the Fund was audited by Cohen & Company. The previous years were audited by another independent registered public accounting firm. |
| (b) | Beginning with the year ended September 30, 2020, the Fund was audited by Ernst & Young LLP. The previous years were audited by another independent registered public accounting firm. |
| (c) | Per share numbers have been calculated using average shares outstanding, which more appropriately presents the per share data for the year. |
| (d) | Amounts shown in this caption for a share outstanding may not accord with the change in aggregate gains and losses in securities for the fiscal period because of the timing of sales and repurchases of Fund shares in relation to fluctuating market values for the Fund. |
| (e) | Amount is less than $0.005 per share. |
| (f) | Total return is calculated assuming a purchase of shares at net asset value on the first day and a sale at net asset value on the last day of each period reported. Distributions are assumed, for the purpose of this calculation, to be reinvested at net asset value per share on the respective payment dates of each distribution. Total returns for periods of less than one year are not annualized. Broker commission charges are not included in this calculation. |
| (g) | Portfolio turnover rate excludes securities received or delivered from in-kind processing of creations or redemptions on Select Sector SPDR shares. |
See accompanying notes to financial statements.
80
THE SELECT SECTOR SPDR TRUST
FINANCIAL HIGHLIGHTS (continued)
Selected data for a share outstanding throughout each period
| | The Real Estate Select Sector SPDR Fund |
| | Year
Ended
9/30/23 | | Year
Ended
9/30/22(a) | | Year
Ended
9/30/21(a) | | Year
Ended
9/30/20(a) | | Year
Ended
9/30/19(b) |
Net asset value, beginning of period
| $ 36.00 | | $ 44.47 | | $ 35.30 | | $ 39.35 | | $ 32.62 |
| Income (loss) from investment operations: | | | | | | | | | |
Net investment income (loss) (c)
| 1.20 | | 0.86 | | 0.85 | | 0.88 | | 0.95 |
Net realized and unrealized gain (loss) (d)
| (1.79) | | (7.99) | | 9.66 | | (3.78) | | 6.91 |
Total from investment operations
| (0.59) | | (7.13) | | 10.51 | | (2.90) | | 7.86 |
Net equalization credits and charges (c)
| (0.01) | | 0.03 | | 0.05 | | (0.05) | | 0.01 |
| Distributions to shareholders from: | | | | | | | | | |
Net investment income
| (1.33) | | (1.37) | | (1.39) | | (1.10) | | (1.14) |
Net asset value, end of period
| $ 34.07 | | $ 36.00 | | $ 44.47 | | $ 35.30 | | $ 39.35 |
Total return (e)
| (1.81)% | | (16.46)% | | 30.42% | | (7.46)% | | 24.64% |
| Ratios and Supplemental Data: | | | | | | | | | |
Net assets, end of period (in 000s)
| $4,093,339 | | $4,612,173 | | $4,282,141 | | $2,264,406 | | $3,884,273 |
| Ratios to average net assets: | | | | | | | | | |
Total expenses
| 0.09% | | 0.10% | | 0.11% | | 0.13% | | 0.13% |
Net investment income (loss)
| 3.20% | | 1.90% | | 2.05% | | 2.42% | | 2.69% |
Portfolio turnover rate (f)
| 9% | | 11% | | 4% | | 5% | | 3% |
| (a) | Beginning with the year ended September 30, 2023, the Fund was audited by Cohen & Company. The previous years were audited by another independent registered public accounting firm. |
| (b) | Beginning with the year ended September 30, 2020, the Fund was audited by Ernst & Young LLP. The previous years were audited by another independent registered public accounting firm. |
| (c) | Per share numbers have been calculated using average shares outstanding, which more appropriately presents the per share data for the year. |
| (d) | Amounts shown in this caption for a share outstanding may not accord with the change in aggregate gains and losses in securities for the fiscal period because of the timing of sales and repurchases of Fund shares in relation to fluctuating market values for the Fund. |
| (e) | Total return is calculated assuming a purchase of shares at net asset value on the first day and a sale at net asset value on the last day of each period reported. Distributions are assumed, for the purpose of this calculation, to be reinvested at net asset value per share on the respective payment dates of each distribution. Total returns for periods of less than one year are not annualized. Broker commission charges are not included in this calculation. |
| (f) | Portfolio turnover rate excludes securities received or delivered from in-kind processing of creations or redemptions on Select Sector SPDR shares. |
See accompanying notes to financial statements.
81
THE SELECT SECTOR SPDR TRUST
FINANCIAL HIGHLIGHTS (continued)
Selected data for a share outstanding throughout each period
| | The Technology Select Sector SPDR Fund |
| | Year
Ended
9/30/23 | | Year
Ended
9/30/22(a) | | Year
Ended
9/30/21(a) | | Year
Ended
9/30/20(a) | | Year
Ended
9/30/19(b) |
Net asset value, beginning of period
| $ 118.73 | | $ 149.35 | | $ 116.76 | | $ 80.51 | | $ 75.30 |
| Income (loss) from investment operations: | | | | | | | | | |
Net investment income (loss) (c)
| 1.42 | | 1.24 | | 1.11 | | 1.20 | | 1.05 |
Net realized and unrealized gain (loss) (d)
| 45.14 | | (30.62) | | 32.60 | | 36.24 | | 5.18 |
Total from investment operations
| 46.56 | | (29.38) | | 33.71 | | 37.44 | | 6.23 |
Net equalization credits and charges (c)
| — | | (0.00)(e) | | (0.02) | | (0.00)(e) | | 0.01 |
| Distributions to shareholders from: | | | | | | | | | |
Net investment income
| (1.40) | | (1.24) | | (1.10) | | (1.19) | | (1.03) |
Net asset value, end of period
| $ 163.89 | | $ 118.73 | | $ 149.35 | | $ 116.76 | | $ 80.51 |
Total return (f)
| 39.34% | | (19.82)% | | 28.93% | | 46.88% | | 8.44% |
| Ratios and Supplemental Data: | | | | | | | | | |
Net assets, end of period (in 000s)
| $47,587,429 | | $35,656,531 | | $43,022,516 | | $34,095,026 | | $22,417,160 |
| Ratios to average net assets: | | | | | | | | | |
Total expenses
| 0.09% | | 0.10% | | 0.11% | | 0.13% | | 0.13% |
Net investment income (loss)
| 0.96% | | 0.83% | | 0.81% | | 1.24% | | 1.44% |
Portfolio turnover rate (g)
| 19% | | 9% | | 4% | | 3% | | 6% |
| (a) | Beginning with the year ended September 30, 2023, the Fund was audited by Cohen & Company. The previous years were audited by another independent registered public accounting firm. |
| (b) | Beginning with the year ended September 30, 2020, the Fund was audited by Ernst & Young LLP. The previous years were audited by another independent registered public accounting firm. |
| (c) | Per share numbers have been calculated using average shares outstanding, which more appropriately presents the per share data for the year. |
| (d) | Amounts shown in this caption for a share outstanding may not accord with the change in aggregate gains and losses in securities for the fiscal period because of the timing of sales and repurchases of Fund shares in relation to fluctuating market values for the Fund. |
| (e) | Amount is less than $0.005 per share. |
| (f) | Total return is calculated assuming a purchase of shares at net asset value on the first day and a sale at net asset value on the last day of each period reported. Distributions are assumed, for the purpose of this calculation, to be reinvested at net asset value per share on the respective payment dates of each distribution. Total returns for periods of less than one year are not annualized. Broker commission charges are not included in this calculation. |
| (g) | Portfolio turnover rate excludes securities received or delivered from in-kind processing of creations or redemptions on Select Sector SPDR shares. |
See accompanying notes to financial statements.
82
THE SELECT SECTOR SPDR TRUST
FINANCIAL HIGHLIGHTS (continued)
Selected data for a share outstanding throughout each period
| | The Utilities Select Sector SPDR Fund |
| | Year
Ended
9/30/23 | | Year
Ended
9/30/22(a) | | Year
Ended
9/30/21(a) | | Year
Ended
9/30/20(a) | | Year
Ended
9/30/19(b) |
Net asset value, beginning of period
| $ 65.46 | | $ 63.88 | | $ 59.40 | | $ 64.73 | | $ 52.68 |
| Income (loss) from investment operations: | | | | | | | | | |
Net investment income (loss) (c)
| 1.98 | | 1.96 | | 1.86 | | 2.00 | | 1.90 |
Net realized and unrealized gain (loss) (d)
| (6.40) | | 1.61 | | 4.61 | | (5.36) | | 12.01 |
Total from investment operations
| (4.42) | | 3.57 | | 6.47 | | (3.36) | | 13.91 |
Net equalization credits and charges (c)
| 0.02 | | 0.04 | | (0.01) | | (0.02) | | 0.01 |
| Distributions to shareholders from: | | | | | | | | | |
Net investment income
| (2.12) | | (2.03) | | (1.98) | | (1.95) | | (1.87) |
Net asset value, end of period
| $ 58.94 | | $ 65.46 | | $ 63.88 | | $ 59.40 | | $ 64.73 |
Total return (e)
| (7.02)% | | 5.46% | | 10.95% | | (5.12)% | | 26.85% |
| Ratios and Supplemental Data: | | | | | | | | | |
Net assets, end of period (in 000s)
| $13,186,436 | | $16,119,053 | | $11,956,669 | | $11,405,751 | | $11,296,483 |
| Ratios to average net assets: | | | | | | | | | |
Total expenses
| 0.09% | | 0.10% | | 0.11% | | 0.13% | | 0.13% |
Net investment income (loss)
| 2.96% | | 2.76% | | 2.89% | | 3.29% | | 3.30% |
Portfolio turnover rate (f)
| 3% | | 4% | | 3% | | 3% | | 5% |
| (a) | Beginning with the year ended September 30, 2023, the Fund was audited by Cohen & Company. The previous years were audited by another independent registered public accounting firm. |
| (b) | Beginning with the year ended September 30, 2020, the Fund was audited by Ernst & Young LLP. The previous years were audited by another independent registered public accounting firm. |
| (c) | Per share numbers have been calculated using average shares outstanding, which more appropriately presents the per share data for the year. |
| (d) | Amounts shown in this caption for a share outstanding may not accord with the change in aggregate gains and losses in securities for the fiscal period because of the timing of sales and repurchases of Fund shares in relation to fluctuating market values for the Fund. |
| (e) | Total return is calculated assuming a purchase of shares at net asset value on the first day and a sale at net asset value on the last day of each period reported. Distributions are assumed, for the purpose of this calculation, to be reinvested at net asset value per share on the respective payment dates of each distribution. Total returns for periods of less than one year are not annualized. Broker commission charges are not included in this calculation. |
| (f) | Portfolio turnover rate excludes securities received or delivered from in-kind processing of creations or redemptions on Select Sector SPDR shares. |
See accompanying notes to financial statements.
83
THE SELECT SECTOR SPDR TRUST
NOTES TO FINANCIAL STATEMENTS
September 30, 2023
1. Organization
The Select Sector SPDR Trust (the “Trust”), a Massachusetts business trust registered under the Investment Company Act of 1940, as amended (“1940 Act”), is an open-end management investment company.
As of September 30, 2023, the Trust consists of eleven (11) series, each of which represents a separate series of beneficial interest in the Trust. The Declaration of Trust permits the Board of Trustees of the Trust (the “Board”) to authorize the issuance of an unlimited number of shares of beneficial interest at $0.01 par value. The financial statements herein relate to the following series (each a “Fund”, and collectively, the “Funds”):
| The Communication Services Select Sector SPDR Fund |
| The Consumer Discretionary Select Sector SPDR Fund |
| The Consumer Staples Select Sector SPDR Fund |
| The Energy Select Sector SPDR Fund |
| The Financial Select Sector SPDR Fund |
| The Health Care Select Sector SPDR Fund |
| The Industrial Select Sector SPDR Fund |
| The Materials Select Sector SPDR Fund |
| The Real Estate Select Sector SPDR Fund |
| The Technology Select Sector SPDR Fund |
| The Utilities Select Sector SPDR Fund |
Each Fund is classified as a non-diversified investment company under the 1940 Act.
Under the Trust’s organizational documents, its officers and trustees are indemnified against certain liabilities arising out of the performance of their duties to the Trust. The Trust has entered into an Indemnification Agreement with each trustee who is not an “interested person” (as defined in the 1940 Act) (each, an “Independent Trustee”) providing for indemnification of the Independent Trustee by the Trust consistent with the foregoing and providing procedures for seeking and obtaining indemnification advancement of expenses. Additionally, in the normal course of business, the Trust enters into contracts with service providers that contain general indemnification clauses. The Trust’s maximum exposure under these arrangements is unknown as this would involve future claims that may be made against the Trust that have not yet occurred.
2. Summary of Significant Accounting Policies
The following is a summary of significant accounting policies followed by the Trust in the preparation of its financial statements:
The preparation of financial statements in accordance with U.S. generally accepted accounting principles (“U.S. GAAP”) requires management to make estimates and assumptions that affect the reported amounts and disclosures in the financial statements. Actual results could differ from those estimates. Each Fund is an investment company under U.S. GAAP and follows the accounting and reporting guidance applicable to investment companies.
Security Valuation
Each Fund's investments are valued at fair value each day that the New York Stock Exchange (“NYSE”) is open and, for financial reporting purposes, as of the report date should the reporting period end on a day that the NYSE is not open. Fair value is generally defined as the price a fund would receive to sell an asset or pay to transfer a liability in an orderly transaction between market participants at the measurement date. By its nature, a fair value price is a good faith estimate of the valuation in a current sale and may not reflect an actual market price. The investments of each Fund are valued pursuant to the policy and procedures developed by the Oversight Committee (the “Committee”) and approved by the Board. The Committee provides oversight of the valuation of investments for the Funds. The Board has responsibility for overseeing the determination of the fair value of investments.
Valuation techniques used to value each Fund’s investments by major category are as follows:
• Equity investments (including registered investment companies that are exchange-traded funds) traded on a recognized securities exchange for which market quotations are readily available are valued at the last sale price or official closing price, as applicable, on the primary market or exchange on which they trade. Equity investments traded on a recognized exchange for which there were no sales on that day are valued at the last published sale price or at fair value.
• Investments in registered investment companies (including money market funds) or other unitized pooled investment
THE SELECT SECTOR SPDR TRUST
NOTES TO FINANCIAL STATEMENTS (continued)
September 30, 2023
vehicles that are not traded on an exchange are valued at that day’s published net asset value (“NAV”) per share or unit.
• Exchange-traded futures contracts are valued at the closing settlement price on the primary market on which they are traded most extensively. Exchange-traded futures contracts traded on a recognized exchange for which there were no sales on that day are valued at the last reported sale price obtained from independent pricing services or brokers or at fair value.
In the event prices or quotations are not readily available or that the application of these valuation methods results in a price for an investment that is deemed to be not representative of the fair value of such investment, fair value will be determined in good faith by the Committee, in accordance with the valuation policy and procedures approved by the Board.
Fair value pricing could result in a difference between the prices used to calculate a Fund's NAV and the prices used by the Funds' respective Select Sector Index, which in turn could result in a difference between the Fund's performance and the performance of the Fund's respective Select Sector Index. Various inputs are used in determining the value of the Funds' investments.
The Funds value their assets and liabilities at fair value using a fair value hierarchy consisting of three broad levels that prioritize the inputs to valuation techniques giving the highest priority to readily available unadjusted quoted prices in active markets for identical assets or liabilities (Level 1 measurements) and the lowest priority to unobservable inputs (Level 3 measurements) when market prices are not readily available or reliable. The categorization of a value determined for an investment within the hierarchy is based upon the pricing transparency of the investment and is not necessarily an indication of the risk associated with investing in it.
The three levels of the fair value hierarchy are as follows:
• Level 1 – Unadjusted quoted prices in active markets for an identical asset or liability;
• Level 2 – Inputs other than quoted prices included within Level 1 that are observable for the asset or liability either directly or indirectly, including quoted prices for similar assets or liabilities in active markets, quoted prices for identical or similar assets or liabilities in markets that are not considered to be active, inputs other than quoted prices that are observable for the asset or liability (such as exchange rates, financing terms, interest rates, yield curves, volatilities, prepayment speeds, loss severities, credit risks and default rates) or other market-corroborated inputs; and
• Level 3 – Unobservable inputs for the asset or liability, including the Committee’s assumptions used in determining the fair value of investments.
The value of each Fund’s investments according to the fair value hierarchy as of September 30, 2023 is disclosed in each Fund’s respective Schedule of Investments.
Investment Transactions and Income Recognition
Investment transactions are accounted for on trade date for financial reporting purposes. Realized gains and losses from the sale or disposition of investments and foreign exchange transactions, if any, are determined using the identified cost method.
Dividend income and capital gain distributions, if any, are recognized on the ex-dividend date, or when the information becomes available, net of any foreign taxes withheld at source, if any. Non-cash dividends received in the form of stock, if any, are recorded as dividend income at fair value. Distributions received by the Funds may include a return of capital that is estimated by management. Such amounts are recorded as a reduction of the cost of investments or reclassified to capital gains.
Certain Funds invest in real estate investment trusts (“REITs”). REITs determine the tax character of their distributions annually and may characterize a portion of their distributions as a return of capital or capital gain. The Funds' policy is to record all REIT distributions initially as dividend income and re-designate a portion to return of capital or capital gain distributions at year end based on information provided by the REIT and/or SSGA Funds Management, Inc.’s (the “Adviser” or “SSGA FM”) estimates of such re-designations for which actual information has not yet been reported.
THE SELECT SECTOR SPDR TRUST
NOTES TO FINANCIAL STATEMENTS (continued)
September 30, 2023
Expenses
Certain expenses, which are directly identifiable to a specific Fund, are applied to that Fund within the Trust. Other expenses which cannot be attributed to a specific Fund are allocated in such a manner as deemed equitable, taking into consideration the nature and type of expense and the relative net assets of the Funds within the Trust.
Foreign Taxes
The Funds may be subject to foreign taxes (a portion of which may be reclaimable) on income, stock dividends, realized and unrealized capital gains on investments or certain foreign currency transactions. Foreign taxes are recorded in accordance with SSGA FM's understanding of the applicable foreign tax regulations and rates that exist in the foreign jurisdictions in which the Funds invest. These foreign taxes, if any, are paid by the Funds and are reflected in the Statements of Operations, if applicable. Foreign taxes payable or deferred as of September 30, 2023, if any, are disclosed in the Funds' Statements of Assets and Liabilities.
Equalization
The Funds follow the accounting practice known as “Equalization” by which a portion of the proceeds from sales and costs of reacquiring Fund shares, equivalent on a per share basis to the amount of distributable net investment income on the date of the transaction, is credited or charged to undistributed net investment income. As a result, undistributed net investment income per share is unaffected by sales or reacquisition of Fund shares. Amounts related to Equalization can be found on the Statements of Changes in Net Assets.
Distributions
Distributions from net investment income, if any, are declared and paid quarterly. Net realized capital gains, if any, are distributed annually. Dividends may be declared and paid more frequently or at any other times to improve Index tracking or to comply with the distribution requirements of the Internal Revenue Code of 1986, as amended (the “Internal Revenue Code”). The amount and character of income and capital gains to be distributed are determined in accordance with applicable tax regulations which may differ from net investment income and realized gains recognized for U.S. GAAP purposes.
3. Derivative Financial Instruments
Futures Contracts
The Funds may enter into futures contracts to meet Funds' objectives. A futures contract is a standardized, exchange-traded agreement to buy or sell a financial instrument at a set price on a future date. Upon entering into a futures contract, the Fund is required to deposit with the broker, cash or securities in an amount equal to the minimum initial margin requirements of the clearing house. Securities deposited, if any, are designated on the Schedules of Investments and cash deposited, if any, is included in Net cash at broker on the Statements of Assets and Liabilities. Subsequent payments are made or received by Fund equal to the daily change in the contract value, accumulated, exchange rates, and or other transactional fees. The accumulation of those payments are recorded as variation margin receivable or payable with a corresponding offset to unrealized gains or losses. The Fund recognizes a realized gain or loss when the contract is closed.
Losses may arise if the value of a futures contract decreases due to unfavorable changes in the market rates or values of the underlying instrument during the term of the contract or if the counterparty does not perform under the contract. The use of futures contracts also involves the risk that the movements in the price of the futures contracts do not correlate with the movement of the assets underlying such contracts.
THE SELECT SECTOR SPDR TRUST
NOTES TO FINANCIAL STATEMENTS (continued)
September 30, 2023
The Funds in the following tables each entered into futures contracts for cash equitization, to reduce tracking error and to facilitate daily liquidity. The following tables summarize the value of the Fund's derivative instruments as of September 30, 2023, and the related location in the accompanying Statements of Assets and Liabilities and Statements of Operations, presented by primary underlying risk exposure:
| | Liability Derivatives | | | | | |
| | Interest
Rate
Risk | | Foreign
Exchange
Risk | | Credit
Risk | | Equity
Risk | | Commodity
Risk | | Total |
| The Energy Select Sector SPDR Fund | | | | | | | | | | | |
Futures Contracts
| $— | | $— | | $— | | $1,100,840 | | $— | | $1,100,840 |
| The Industrial Select Sector SPDR Fund | | | | | | | | | | | |
Futures Contracts
| — | | — | | — | | 540,750 | | — | | 540,750 |
| The Materials Select Sector SPDR Fund | | | | | | | | | | | |
Futures Contracts
| — | | — | | — | | 545,600 | | — | | 545,600 |
| The Real Estate Select Sector SPDR Fund | | | | | | | | | | | |
Futures Contracts
| — | | — | | — | | 499,125 | | — | | 499,125 |
| The Technology Select Sector SPDR Fund | | | | | | | | | | | |
Futures Contracts
| — | | — | | — | | 3,103,650 | | — | | 3,103,650 |
| | Net Realized Gain (Loss) | | | | | |
| | Interest
Rate
Risk | | Foreign
Exchange
Risk | | Credit
Risk | | Equity
Risk | | Commodity
Risk | | Total |
| The Energy Select Sector SPDR Fund | | | | | | | | | | | |
Futures Contracts
| $— | | $— | | $— | | $(30,382,956) | | $— | | $(30,382,956) |
| The Industrial Select Sector SPDR Fund | | | | | | | | | | | |
Futures Contracts
| — | | — | | — | | 145,496 | | — | | 145,496 |
| The Materials Select Sector SPDR Fund | | | | | | | | | | | |
Futures Contracts
| — | | — | | — | | (235,473) | | — | | (235,473) |
| The Real Estate Select Sector SPDR Fund | | | | | | | | | | | |
Futures Contracts
| — | | — | | — | | (3,183,234) | | — | | (3,183,234) |
| The Technology Select Sector SPDR Fund | | | | | | | | | | | |
Futures Contracts
| — | | — | | — | | 16,736,370 | | — | | 16,736,370 |
| | Net Change in Unrealized Appreciation/Depreciation | | | | | |
| | Interest
Rate
Risk | | Foreign
Exchange
Risk | | Credit
Risk | | Equity
Risk | | Commodity
Risk | | Total |
| The Energy Select Sector SPDR Fund | | | | | | | | | | | |
Futures Contracts
| $— | | $— | | $— | | $7,267,001 | | $— | | $7,267,001 |
| The Industrial Select Sector SPDR Fund | | | | | | | | | | | |
Futures Contracts
| — | | — | | — | | 2,598,975 | | — | | 2,598,975 |
| The Materials Select Sector SPDR Fund | | | | | | | | | | | |
Futures Contracts
| — | | — | | — | | 232,616 | | — | | 232,616 |
| The Real Estate Select Sector SPDR Fund | | | | | | | | | | | |
Futures Contracts
| — | | — | | — | | 2,491,429 | | — | | 2,491,429 |
| The Technology Select Sector SPDR Fund | | | | | | | | | | | |
Futures Contracts
| — | | — | | — | | 5,689,089 | | — | | 5,689,089 |
THE SELECT SECTOR SPDR TRUST
NOTES TO FINANCIAL STATEMENTS (continued)
September 30, 2023
4. Fees and Transactions with Affiliates
Advisory and Administration Fee
The Trust, on behalf of each Fund, has entered into an Investment Advisory Agreement with SSGA FM. For its advisory services to the Funds, each Fund pays the Adviser a fee accrued daily and paid monthly. The advisory fee is calculated based upon the average daily net assets of the Trust and allocated pro rata to each Select Sector SPDR Fund based on the relative net assets of each Fund. The advisory fee is a sliding scale fee calculated as follows: (i) 0.05% of average daily net assets of the Trust up to the first $12.5 billion of net assets; (ii) 0.04% of average daily net assets of the Trust up to the next $17.5 billion of net assets; (iii) 0.035% of average daily net assets of the Trust up to the next $20.0 billion of net assets; (iv) 0.03% of average daily net assets of the Trust up to the next $50.0 billion of net assets; (v) 0.0285% of average daily net assets of the Trust up to the next $50.0 billion of net assets; (vi) 0.0271% of average daily net assets of the Trust up to the next $50.0 billion of net assets; and (vii) 0.0256% of average daily net assets on the remainder of net assets of the Trust. From time to time, the Adviser may waive all or a portion of its fees.
The Trust has also entered into an Administration Agreement with SSGA FM to serve as each Fund's Administrator. For its administration services to the Funds, each Fund pays SSGA FM a fee accrued daily and paid monthly at a rate 0.0006% of its average daily net assets.
Unitary Fee
State Street Bank and Trust Company (“State Street”), an affiliate of the Adviser, serves as custodian, sub-administrator and transfer agent to each Fund of the Trust. A “unitary” fee is paid by each Fund to State Street for custody, sub-administration and transfer agency services provided to the Funds. The unitary fee is calculated based upon the average daily net assets of the Trust and allocated pro rata to each Select Sector SPDR Fund based upon the relative net assets of each Fund. Effective January 1, 2018, the unitary fee structure was amended and is calculated as follows: (i) $0 - $50 billion of net assets of the Trust, 0.015% of average daily net assets; (ii) over $50 billion - $75 billion of net assets of the Trust, 0.0125% of average daily net assets; (iii) over $75 billion - $100 billion of net assets of the Trust, 0.01% of average daily net assets; (iv) over $100 billion - $400 billion of net assets of the Trust, 0.004% of average daily net assets; and (v) over $400 billion of net assets of the Trust, 0.0025% of average daily net assets.
State Street is a wholly-owned subsidiary of State Street Corporation.
Other Transactions with Affiliates - Securities Lending
State Street, an affiliate of the Funds, acts as the securities lending agent for the Funds, pursuant to an amended and restated securities lending authorization agreement dated July 10, 2017, as amended.
Net proceeds collected by State Street on investment of cash collateral or any fee income less rebates payable to borrowers are paid as follows: If the calendar year to date net proceeds are below a specified threshold across participating affiliated funds, each Fund retains eighty five percent (85%) of the net proceeds and fifteen percent (15%) of such net proceeds is payable to State Street. Starting the business day following the date that calendar year to date net proceeds exceeds a specified threshold, each Fund retains ninety percent (90%) of the net proceeds and ten percent (10%) of such net proceeds is payable to State Street.
In addition, cash collateral from lending activities is invested in the State Street Navigator Securities Lending Portfolio II, an affiliated fund, for which SSGA FM serves as investment adviser. See Note 10 for additional information regarding securities lending.
Other Transactions with Affiliates
The Funds may invest in affiliated entities, including securities issued by State Street Corporation, affiliated funds, or entities deemed to be affiliates as a result of the Funds owning more than five percent of the entity’s voting securities or outstanding shares. Amounts relating to these transactions during the year ended September 30, 2023, are disclosed in the Funds' respective Schedules of Investments.
THE SELECT SECTOR SPDR TRUST
NOTES TO FINANCIAL STATEMENTS (continued)
September 30, 2023
During the year ended September 30, 2023, State Street made a contribution of $4,351 to the The Industrial Select Sector SPDR Fund related to an accounting matter.
Due to Custodian
In certain circumstances, the Funds may have cash overdrafts with the custodian due to expense payments, capital transactions, trading of securities, investment operations or derivative transactions. The Due to custodian amount, if any, reflects cash overdrawn with State Street, as custodian, who is an affiliate of the Funds.
5. Additional Expenses
Distributor
ALPS Portfolio Solutions Distributor, Inc. (the “Distributor”) serves as the distributor of the shares of each Fund. Pursuant to a Distribution and Service Plan adopted by each Fund in accordance with Rule 12b-1 under the 1940 Act, each Fund is authorized to pay fees, including fees to the Distributor, at an annualized rate of 0.25% of the average daily net assets of the Fund. Effective February 1, 2022, the Board limited each Fund's 12b-1 fee to an annual rate of 0.02% of its average daily net assets. This limitation is in effect through at least January 31, 2024.
License Fees
S&P Opco, LLC, a subsidiary of S&P Dow Jones Indices LLC and S&P Global (“S&P”), and NYSE Arca, Inc. (either directly or through affiliates) have entered into a license agreement with respect to each Fund's Select Sector Index. Effective January 1, 2022, each Fund pays an annual sub-license fee to S&P based on a percentage of its total expense ratio shown on the financial highlight for the most recent fiscal year. This rate is applied to the Fund’s average daily net assets. Future years’ sub-license fee rate will be based on a schedule of percentages applied to the most recent total expense ratio of a Fund shown in the, then, current annual report and applied to the average daily net assets of that Fund. Prior to January 1, 2022, the Trust paid an annual sub-license fee to S&P equal to 0.06% of the average aggregate net assets of all series of the Trust, subject to certain breakpoints. Each Fund paid its proportionate share of the annual sub-license fees based on the relative net assets of each Fund. Under each scenario, fees to S&P are generally paid quarterly.
6. Trustees’ Fees
The fees and expenses of the Independent Trustees and one interested, non-management trustee are paid directly by the Funds. The Independent Trustees and one interested, non-management trustee are reimbursed for travel and other out-of-pocket expenses in connection with meeting attendance and industry seminars.
7. Investment Transactions
Purchases and sales of investments (excluding in-kind transactions and short term investments) for the year ended September 30, 2023, were as follows:
| | Purchases | | Sales |
The Communication Services Select Sector SPDR Fund
| $2,954,293,037 | | $2,954,734,969 |
The Consumer Discretionary Select Sector SPDR Fund
| 3,723,760,992 | | 3,715,703,483 |
The Consumer Staples Select Sector SPDR Fund
| 2,862,566,121 | | 2,863,756,823 |
The Energy Select Sector SPDR Fund
| 2,988,741,684 | | 2,995,168,225 |
The Financial Select Sector SPDR Fund
| 7,163,266,621 | | 7,139,367,650 |
The Health Care Select Sector SPDR Fund
| 1,116,172,001 | | 1,109,595,093 |
The Industrial Select Sector SPDR Fund
| 1,312,550,089 | | 1,235,443,927 |
The Materials Select Sector SPDR Fund
| 188,971,258 | | 195,438,695 |
The Real Estate Select Sector SPDR Fund
| 422,751,200 | | 409,559,907 |
The Technology Select Sector SPDR Fund
| 8,326,036,965 | | 8,339,812,576 |
The Utilities Select Sector SPDR Fund
| 497,622,966 | | 521,684,455 |
THE SELECT SECTOR SPDR TRUST
NOTES TO FINANCIAL STATEMENTS (continued)
September 30, 2023
For the year ended September 30, 2023, the following Funds had in-kind contributions, redemptions and net realized gains/losses in the amounts as follows:
| | In-kind
Contributions | | In-kind
Redemptions | | In-kind Net
Realized
Gains/(Losses) |
The Communication Services Select Sector SPDR Fund
| $ 8,773,820,057 | | $ 6,393,152,508 | | $ 772,960,779 |
The Consumer Discretionary Select Sector SPDR Fund
| 11,674,104,586 | | 10,054,173,638 | | 945,498,614 |
The Consumer Staples Select Sector SPDR Fund
| 17,341,016,349 | | 15,873,060,997 | | 478,828,415 |
The Energy Select Sector SPDR Fund
| 22,384,433,455 | | 24,837,682,674 | | 5,751,515,121 |
The Financial Select Sector SPDR Fund
| 34,434,179,629 | | 33,203,122,347 | | 1,111,131,689 |
The Health Care Select Sector SPDR Fund
| 19,082,167,571 | | 19,449,842,958 | | 2,479,238,745 |
The Industrial Select Sector SPDR Fund
| 19,436,752,071 | | 18,585,615,157 | | 809,773,018 |
The Materials Select Sector SPDR Fund
| 7,385,289,129 | | 7,843,232,369 | | 229,142,420 |
The Real Estate Select Sector SPDR Fund
| 2,806,535,222 | | 3,112,600,200 | | 12,315,730 |
The Technology Select Sector SPDR Fund
| 15,729,546,836 | | 17,008,400,565 | | 4,628,413,453 |
The Utilities Select Sector SPDR Fund
| 12,377,412,788 | | 13,803,912,560 | | 226,919,709 |
8. Shareholder Transactions
Each Fund issues and redeems its shares, at NAV, by each Fund only in aggregations of a specified number of shares or multiples thereof (“Creation Units”). Except when aggregated in Creation Units, shares of each Fund are not redeemable. Transactions in capital shares for each Fund are disclosed in detail in the Statements of Changes in Net Assets.
The consideration for the purchase of Creation Units of a Fund may consist of the in-kind deposit of a designated portfolio of securities and a specified amount of cash. Investors purchasing and redeeming Creation Units may pay a purchase transaction fee and a redemption transaction fee directly to the Trust and/or custodian, to offset transfer and other transaction costs associated with the issuance and redemption of Creation Units, including Creation Units for cash. An additional variable fee may be charged for certain transactions. Such variable charges, if any, are included in “Other Capital” on the Statements of Changes in Net Assets.
9. Income Tax Information
The Funds have qualified and intend to continue to qualify as regulated investment companies under Subchapter M of the Internal Revenue Code of 1986, as amended. Each Fund will not be subject to federal income taxes to the extent it distributes its taxable income, including any net realized capital gains, for each fiscal year. Therefore, no provision for federal income tax is required.
The Funds file federal and various state and local tax returns as required. No income tax returns are currently under examination. Generally, the federal returns are subject to examination by the Internal Revenue Service for a period of three years from date of filing, while the state returns may remain open for an additional year depending upon jurisdiction. SSGA FM has analyzed the Funds’ tax positions taken on tax returns for all open years and does not believe there are any uncertain tax positions that would require recognition of a tax liability.
Distributions to shareholders are recorded on ex-dividend date. Income dividends and gain distributions are determined in accordance with income tax rules and regulations, which may differ from generally accepted accounting principles.
Certain capital accounts in the financial statements have been adjusted for permanent book-tax differences.These adjustments have no impact on net asset values or results of operations. Temporary book-tax differences will reverse in the future. These book-tax differences are primarily due to differing treatments for in-kind transactions, nontaxable dividend adjustments to income, future contracts, corporate actions, wash sale loss deferrals and distributions in excess of current earnings.
THE SELECT SECTOR SPDR TRUST
NOTES TO FINANCIAL STATEMENTS (continued)
September 30, 2023
The tax character of distributions paid during the year ended September 30, 2023, was as follows:
| | Ordinary
Income | | Long-Term
Capital Gains | | Total |
The Communication Services Select Sector SPDR Fund
| $ 99,539,151 | | $— | | $ 99,539,151 |
The Consumer Discretionary Select Sector SPDR Fund
| 146,143,540 | | — | | 146,143,540 |
The Consumer Staples Select Sector SPDR Fund
| 441,127,478 | | — | | 441,127,478 |
The Energy Select Sector SPDR Fund
| 1,341,480,922 | | — | | 1,341,480,922 |
The Financial Select Sector SPDR Fund
| 620,776,102 | | — | | 620,776,102 |
The Health Care Select Sector SPDR Fund
| 648,808,543 | | — | | 648,808,543 |
The Industrial Select Sector SPDR Fund
| 236,264,195 | | — | | 236,264,195 |
The Materials Select Sector SPDR Fund
| 113,054,528 | | — | | 113,054,528 |
The Real Estate Select Sector SPDR Fund
| 165,782,154 | | — | | 165,782,154 |
The Technology Select Sector SPDR Fund
| 413,152,075 | | — | | 413,152,075 |
The Utilities Select Sector SPDR Fund
| 497,337,622 | | — | | 497,337,622 |
The tax character of distributions paid during the year ended September 30, 2022, was as follows:
| | Ordinary
Income | | Long-Term
Capital Gains | | Total |
The Communication Services Select Sector SPDR Fund
| $ 98,460,012 | | $ — | | $ 98,460,012 |
The Consumer Discretionary Select Sector SPDR Fund
| 129,853,122 | | — | | 129,853,122 |
The Consumer Staples Select Sector SPDR Fund
| 366,815,541 | | — | | 366,815,541 |
The Energy Select Sector SPDR Fund
| 1,446,908,773 | | — | | 1,446,908,773 |
The Financial Select Sector SPDR Fund
| 694,964,954 | | — | | 694,964,954 |
The Health Care Select Sector SPDR Fund
| 547,486,712 | | — | | 547,486,712 |
The Industrial Select Sector SPDR Fund
| 231,405,184 | | — | | 231,405,184 |
The Materials Select Sector SPDR Fund
| 140,291,094 | | — | | 140,291,094 |
The Real Estate Select Sector SPDR Fund
| 165,006,172 | | — | | 165,006,172 |
The Technology Select Sector SPDR Fund
| 369,413,320 | | — | | 369,413,320 |
The Utilities Select Sector SPDR Fund
| 430,630,955 | | — | | 430,630,955 |
At September 30, 2023, the components of distributable earnings on a tax basis were as follows:
| | Undistributed
Ordinary Income | | Capital Loss
Carryforwards | | Undistributed
Long-Term
Capital Gains | | Net Unrealized
Gains (Losses) | | Total |
The Communication Services Select Sector SPDR Fund
| $ 5,099,638 | | $(2,026,955,991) | | $— | | $ (746,868,976) | | $(2,768,725,329) |
The Consumer Discretionary Select Sector SPDR Fund
| 19,117,915 | | (3,593,898,120) | | — | | (1,850,521,937) | | (5,425,302,142) |
The Consumer Staples Select Sector SPDR Fund
| 738,437 | | (1,636,851,068) | | — | | (2,355,299,892) | | (3,991,412,523) |
The Energy Select Sector SPDR Fund
| — | | (8,014,225,896) | | — | | 2,891,509,742 | | (5,122,716,154) |
The Financial Select Sector SPDR Fund
| 59,764,772 | | (4,372,466,748) | | — | | (4,071,891,948) | | (8,384,593,924) |
The Health Care Select Sector SPDR Fund
| 20,263,735 | | (1,200,255,109) | | — | | (4,102,348,490) | | (5,282,339,864) |
The Industrial Select Sector SPDR Fund
| 7,024,995 | | (1,114,240,957) | | — | | (2,296,261,691) | | (3,403,477,653) |
The Materials Select Sector SPDR Fund
| 7,437,906 | | (991,406,853) | | — | | (1,122,453,296) | | (2,106,422,243) |
The Real Estate Select Sector SPDR Fund
| — | | (298,222,276) | | — | | (1,471,673,273) | | (1,769,895,549) |
The Technology Select Sector SPDR Fund
| 14,665,986 | | (2,708,929,640) | | — | | 3,588,955,559 | | 894,691,905 |
The Utilities Select Sector SPDR Fund
| — | | (991,700,217) | | — | | (3,507,808,497) | | (4,499,508,714) |
THE SELECT SECTOR SPDR TRUST
NOTES TO FINANCIAL STATEMENTS (continued)
September 30, 2023
As of September 30, 2023, the following Funds had capital loss carryforwards available to offset future realized capital gains as follows:
| | Non-Expiring
Short Term | | Non-Expiring
Long Term |
The Communication Services Select Sector SPDR Fund
| $ 533,908,049 | | $1,493,047,942 |
The Consumer Discretionary Select Sector SPDR Fund
| 1,337,679,080 | | 2,256,219,040 |
The Consumer Staples Select Sector SPDR Fund
| 337,468,071 | | 1,299,382,997 |
The Energy Select Sector SPDR Fund
| 708,705,876 | | 7,305,520,020 |
The Financial Select Sector SPDR Fund
| 1,093,107,746 | | 3,279,359,002 |
The Health Care Select Sector SPDR Fund
| 219,263,075 | | 980,992,034 |
The Industrial Select Sector SPDR Fund
| 217,318,698 | | 896,922,259 |
The Materials Select Sector SPDR Fund
| 302,779,777 | | 688,627,076 |
The Real Estate Select Sector SPDR Fund
| 120,062,614 | | 178,159,662 |
The Technology Select Sector SPDR Fund
| 806,930,899 | | 1,901,998,741 |
The Utilities Select Sector SPDR Fund
| 222,420,987 | | 769,279,230 |
As of September 30, 2023, gross unrealized appreciation and gross unrealized depreciation of investments and other financial instruments based on cost for federal income tax purposes were as follows:
| | Tax
Cost | | Gross
Unrealized
Appreciation | | Gross
Unrealized
Depreciation | | Net Unrealized
Appreciation
(Depreciation) |
The Communication Services Select Sector SPDR Fund
| $13,855,771,763 | | $ 665,504,804 | | $1,412,373,780 | | $ (746,868,976) |
The Consumer Discretionary Select Sector SPDR Fund
| 19,312,122,458 | | 368,040,349 | | 2,218,562,286 | | (1,850,521,937) |
The Consumer Staples Select Sector SPDR Fund
| 18,522,669,566 | | 84,301,118 | | 2,439,601,010 | | (2,355,299,892) |
The Energy Select Sector SPDR Fund
| 36,151,337,623 | | 3,513,432,542 | | 621,922,800 | | 2,891,509,742 |
The Financial Select Sector SPDR Fund
| 35,135,384,499 | | 751,675,966 | | 4,823,567,914 | | (4,071,891,948) |
The Health Care Select Sector SPDR Fund
| 41,808,755,139 | | 1,789,729,090 | | 5,892,077,580 | | (4,102,348,490) |
The Industrial Select Sector SPDR Fund
| 16,774,693,969 | | 344,635,425 | | 2,640,897,116 | | (2,296,261,691) |
The Materials Select Sector SPDR Fund
| 6,092,041,433 | | 23,683,594 | | 1,146,136,890 | | (1,122,453,296) |
The Real Estate Select Sector SPDR Fund
| 5,566,264,363 | | 9,478,944 | | 1,481,152,217 | | (1,471,673,273) |
The Technology Select Sector SPDR Fund
| 44,030,493,113 | | 5,047,917,071 | | 1,458,961,512 | | 3,588,955,559 |
The Utilities Select Sector SPDR Fund
| 16,696,713,890 | | 119,913,571 | | 3,627,722,068 | | (3,507,808,497) |
10. Securities Lending
Each Fund may lend securities to qualified broker-dealers or institutional investors. The loans are secured at all times by cash, cash equivalents or U.S. government securities in an amount at least equal to the market value of the securities loaned, plus accrued interest and dividends, determined on a daily basis and adjusted accordingly. The value of the collateral with respect to a loaned security may be temporarily more or less than the value of a security due to market fluctuations of securities values. With respect to each loan, if on any U.S. business day the aggregate market value of securities collateral plus cash collateral is less than the aggregate market value of the securities which are subject to the loan, the borrower will be notified to provide additional collateral on the next business day.
The Funds will regain record ownership of loaned securities to exercise certain beneficial rights; however, the Funds may bear the risk of delay in recovery of, or even loss of rights in the securities loaned should the borrower fail financially. In addition, a Fund will bear the risk of loss of any cash collateral that it may invest. Each Fund receives compensation for lending its securities from interest or dividends earned on the cash, cash equivalents or U.S. government securities held as collateral, net of fee rebates paid to the borrower and net of fees paid to State Street as the lending agent. Additionally, a Fund will receive a fee from the borrower for non-cash collateral equal to a percentage of the market value of the loaned securities.
THE SELECT SECTOR SPDR TRUST
NOTES TO FINANCIAL STATEMENTS (continued)
September 30, 2023
The market value of securities on loan as of September 30, 2023, and the value of the invested cash collateral are disclosed in the Funds' Statements of Assets and Liabilities. Non-cash collateral is not disclosed in the Funds’ Statements of Assets and Liabilities as it is held by the lending agent on behalf of the Funds, and the Funds do not have the ability to re-hypothecate those securities. Securities lending income, as disclosed in the Funds’ Statements of Operations, represents the income earned from the non-cash collateral and the investment of cash collateral, net of fee rebates paid to the borrower and net of fees paid to State Street as lending agent.
The following is a summary of each Fund's securities lending agreements and related cash and non-cash collateral received as of September 30, 2023:
| Fund | | Market Value of
Securities on Loan | | Cash
Collateral
Received | | Non-Cash
Collateral
Received* | | Total
Collateral
Received |
The Communication Services Select Sector SPDR Fund
| | $ 302,376 | | $ — | | $ 310,580 | | $ 310,580 |
The Consumer Discretionary Select Sector SPDR Fund
| | 96,691,101 | | 32,385,839 | | 66,007,330 | | 98,393,169 |
The Consumer Staples Select Sector SPDR Fund
| | 5,405,248 | | 5,240,094 | | - | | 5,240,094 |
The Energy Select Sector SPDR Fund
| | 37,091,364 | | 14,004,048 | | 23,722,875 | | 37,726,923 |
The Financial Select Sector SPDR Fund
| | 470,009,138 | | 483,314,119 | | - | | 483,314,119 |
The Health Care Select Sector SPDR Fund
| | 26,779,881 | | 24,295,260 | | 3,045,000 | | 27,340,260 |
The Industrial Select Sector SPDR Fund
| | 76,624,257 | | 76,756,877 | | 1,848,614 | | 78,605,491 |
The Materials Select Sector SPDR Fund
| | 76,117,401 | | 33,329,188 | | 45,324,400 | | 78,653,588 |
The Technology Select Sector SPDR Fund
| | 29,796,589 | | 23,763,431 | | 6,764,712 | | 30,528,143 |
The Utilities Select Sector SPDR Fund
| | 7,096,391 | | 7,244,850 | | - | | 7,244,850 |
| * | The non-cash collateral includes U.S. Treasuries and U.S. Government Agency securities. |
The following table reflects a breakdown of transactions accounted for as secured borrowings, the gross obligation by the type of collateral pledged or securities loaned, and the remaining contractual maturity of those transactions as of September 30, 2023:
| | | | | Remaining Contractual Maturity of the Agreements
as of September 30, 2023 |
| Fund | | Securities
Lending
Transactions | | Overnight
and
Continuous | | <30 Days | | Between
30 & 90
Days | | >90 Days | | Total
Borrowings | | Gross Amount
of Recognized
Liabilities for
Securities Lending Transactions |
The Consumer Discretionary Select Sector SPDR Fund
| | Common Stocks | | $ 32,385,839 | | $— | | $— | | $— | | $ 32,385,839 | | $ 32,385,839 |
The Consumer Staples Select Sector SPDR Fund
| | Common Stocks | | 5,240,094 | | — | | — | | — | | 5,240,094 | | 5,240,094 |
The Energy Select Sector SPDR Fund
| | Common Stocks | | 14,004,048 | | — | | — | | — | | 14,004,048 | | 14,004,048 |
The Financial Select Sector SPDR Fund
| | Common Stocks | | 483,314,119 | | — | | — | | — | | 483,314,119 | | 483,314,119 |
The Health Care Select Sector SPDR Fund
| | Common Stocks | | 24,295,260 | | — | | — | | — | | 24,295,260 | | 24,295,260 |
The Industrial Select Sector SPDR Fund
| | Common Stocks | | 76,756,877 | | — | | — | | — | | 76,756,877 | | 76,756,877 |
The Materials Select Sector SPDR Fund
| | Common Stocks | | 33,329,188 | | — | | — | | — | | 33,329,188 | | 33,329,188 |
The Technology Select Sector SPDR Fund
| | Common Stocks | | 23,763,431 | | — | | — | | — | | 23,763,431 | | 23,763,431 |
The Utilities Select Sector SPDR Fund
| | Common Stocks | | 7,244,850 | | — | | — | | — | | 7,244,850 | | 7,244,850 |
11. Risks
Concentration Risk
As a result of the Funds' ability to invest a large percentage of their assets in obligations of issuers within the same country, state, region, currency or economic sector, an adverse economic, business or political development may affect the value of the Funds' investments more than if the Funds were more broadly diversified.
THE SELECT SECTOR SPDR TRUST
NOTES TO FINANCIAL STATEMENTS (continued)
September 30, 2023
Market Risk
A Fund’s investments are subject to changes in general economic conditions, general market fluctuations and the risks inherent in investment in securities markets. Investment markets can be volatile and prices of investments can change substantially due to various factors including, but not limited to, economic growth or recession, changes in interest rates, changes in the actual or perceived creditworthiness of issuers, and general market liquidity. A Fund is subject to the risk that geopolitical events will disrupt securities markets and adversely affect global economies and markets. Local, regional or global events such as war, acts of terrorism, the spread of infectious illness, such as COVID-19, or other public health issues, or other events could have a significant impact on a Fund and its investments.
12. Change in Audit Firm
On February 9, 2023, upon recommendation by the Audit Committee of The Select Sector SPDR Trust (the “Trust”), the Board of Trustees of the Trust voted to replace Ernst & Young, LLP (“EY”) with Cohen & Company as the independent registered public accounting firm to the Trust for the fiscal year ending September 30, 2023.
The reports of EY on the financial statements for the fiscal years ended September 30, 2022 and 2021 did not contain an adverse opinion or disclaimer of opinion and were not qualified or modified as to uncertainty, audit scope, or accounting principles.
During the fiscal years ended September 30, 2022 and 2021, and in the subsequent interim period through February 9, 2023, there were no disagreements between the Trust and EY on any matter of accounting principles or practices, financial statement disclosure or auditing scope or procedure which, if not resolved to the satisfaction of EY, would have caused it to make reference to the disagreements in its reports on the financial statements. In addition, during the fiscal years ended September 30, 2022 and 2021, and in the subsequent interim period through February 9, 2023, there were no reportable events of the kind described in Item 304(a)(1)(v) of Regulation S-K under the Securities Exchange Act of 1934, as amended.
The Funds requested and EY furnished a letter addressed to the Securities and Exchange Commission stating whether or not EY agreed with the above statements. A copy of such letter is filed as an Exhibit, under Item 13(a)(4), to Form N-CSR for the period ended March 31, 2023.
During the fiscal years ended September 30, 2022 and 2021, and in the subsequent interim period through February 9, 2023, neither the Trust nor anyone on its behalf consulted Cohen & Company concerning (i) the application of accounting principles to a specified transaction, either completed or proposed, or the type of audit opinion that might be rendered on the Trust’s financial statements or (ii) the subject of a disagreement (as defined in paragraph (a)(1)(iv) of Item 304 of Regulation S-K) or reportable events (as described in paragraph (a)(1)(v) of said Item 304).
13. Subsequent Events
Management has evaluated the impact of all subsequent events on the Funds through the date the financial statements were issued and has determined that there were no subsequent events requiring adjustment or disclosure in the financial statements.
THE SELECT SECTOR SPDR TRUST
REPORT OF INDEPENDENT REGISTERED PUBLIC
ACCOUNTING FIRM
To the Shareholders and Board of Trustees of
The Select Sector SPDR® Trust
Opinion on the Financial Statements
We have audited the accompanying statements of assets and liabilities, including the schedules of investments, of The Select Sector SPDR® Trust comprising The Communication Services Select Sector SPDR Fund, The Consumer Discretionary Select Sector SPDR Fund, The Consumer Staples Select Sector SPDR Fund, The Energy Select Sector SPDR Fund, The Financial Select Sector SPDR Fund, The Health Care Select Sector SPDR Fund, The Industrial Select Sector SPDR Fund, The Materials Select Sector SPDR Fund, The Real Estate Select Sector SPDR Fund, The Technology Select Sector SPDR Fund, and The Utilities Select Sector SPDR Fund (the “Funds”) as of September 30, 2023, the related statements of operations and changes in net assets, the related notes, and the financial highlights for the year then ended (collectively referred to as the “financial statements”). In our opinion, the financial statements present fairly, in all material respects, the financial position of each of the Funds as of September 30, 2023, the results of their operations, the changes in net assets, and the financial highlights for the year then ended, in conformity with accounting principles generally accepted in the United States of America.
The Funds’ financial statements and financial highlights for the years ended September 30, 2022, and prior, were audited by other auditors whose report dated November 23, 2022, expressed an unqualified opinion on those financial statements and financial highlights.
Basis for Opinion
These financial statements are the responsibility of the Funds’ management. Our responsibility is to express an opinion on the Funds’ financial statements based on our audits. We are a public accounting firm registered with the Public Company Accounting Oversight Board (United States) (“PCAOB”) and are required to be independent with respect to the Funds in accordance with the U.S. federal securities laws and the applicable rules and regulations of the Securities and Exchange Commission and the PCAOB.
We conducted our audits in accordance with the standards of the PCAOB. Those standards require that we plan and perform the audit to obtain reasonable assurance about whether the financial statements are free of material misstatement whether due to error or fraud.
Our audits included performing procedures to assess the risks of material misstatement of the financial statements, whether due to error or fraud, and performing procedures that respond to those risks. Such procedures included examining, on a test basis, evidence regarding the amounts and disclosures in the financial statements. Our procedures included confirmation of securities owned as of September 30, 2023, by correspondence with the custodians and brokers; when replies were not received from brokers, we performed other auditing procedures. Our audits also included evaluating the accounting principles used and significant estimates made by management, as well as evaluating the overall presentation of the financial statements. We believe that our audits provide a reasonable basis for our opinion.
We have served as the Funds’auditor since 2023.
COHEN & COMPANY, LTD.
Cleveland, Ohio
November 22, 2023
THE SELECT SECTOR SPDR TRUST
OTHER INFORMATION
September 30, 2023 (Unaudited)
Expense Example
As a shareholder of a Fund, you incur two types of costs: (1) transaction costs, including sales charges (loads), if applicable, on purchase payments, reinvested dividends, or other distributions and (2) ongoing costs, including advisory fees and to the extent applicable, distribution (12b-1) and/or service fees; and other Fund expenses. This example is intended to help you understand your ongoing costs (in dollars) of investing in a Fund and to compare these costs with the ongoing costs of investing in other mutual funds. It is based on an investment of $1,000 made at the beginning of the period shown and held for the entire period from April 1, 2023 to September 30, 2023.
The table below illustrates your Fund’s cost in two ways:
Based on actual fund return ——This section helps you to estimate the actual expenses that you paid over the period. The “Ending Account Value” shown is derived from each Fund's actual return, and the third column shows the dollar amount that would have been paid by an investor who started with $1,000 in each Fund. You may use the information here, together with the amount you invested, to estimate the expenses that you paid over the period. To do so, simply divide your account value by $1,000 (for example, an $8,600 account value divided by $1,000 = 8.6), then multiply the result by the number given for the Fund under the heading “Expenses Paid During Period”.
Based on hypothetical 5% return ——This section is intended to help you compare your Fund’s costs with those of other mutual funds. It assumes that the Fund had a yearly return of 5% before expenses, but that the expense ratio is unchanged. In this case, because the return used is not the Fund’s actual return, the results do not apply to your investment. The example is useful in making comparisons because the U.S. Securities and Exchange Commission (the “SEC”) requires all mutual funds to calculate expenses based on a 5% return. You can assess your Fund’s costs by comparing this hypothetical example with the hypothetical examples that appear in shareholder reports of other funds.
Please note that the expenses shown in the table are meant to highlight your ongoing costs only and do not reflect any transaction costs, such as sales load charges (loads). Therefore, the hypothetical 5% return section of the table is useful in comparing ongoing costs only, and will not help you determine the relative total costs of owning different funds. In addition, if these transaction costs were included, your costs would have been higher.
| | | | Actual | | Hypothetical (assuming a 5%
return before expenses) |
| | Annualized
Expense Ratio | | Ending Account
Value | | Expenses Paid
During Period(a) | | Ending Account
Value | | Expenses Paid
During Period(a) |
The Communication Services Select Sector SPDR Fund
| 0.09% | | $1,135.90 | | $0.48 | | $1,024.60 | | $0.46 |
The Consumer Discretionary Select Sector SPDR Fund
| 0.09 | | 1,080.50 | | 0.47 | | 1,024.60 | | 0.46 |
The Consumer Staples Select Sector SPDR Fund
| 0.09 | | 933.80 | | 0.44 | | 1,024.60 | | 0.46 |
The Energy Select Sector SPDR Fund
| 0.09 | | 1,109.90 | | 0.48 | | 1,024.60 | | 0.46 |
The Financial Select Sector SPDR Fund
| 0.09 | | 1,041.10 | | 0.46 | | 1,024.60 | | 0.46 |
The Health Care Select Sector SPDR Fund
| 0.09 | | 1,002.10 | | 0.45 | | 1,024.60 | | 0.46 |
The Industrial Select Sector SPDR Fund
| 0.09 | | 1,009.70 | | 0.45 | | 1,024.60 | | 0.46 |
The Materials Select Sector SPDR Fund
| 0.09 | | 983.70 | | 0.45 | | 1,024.60 | | 0.46 |
The Real Estate Select Sector SPDR Fund
| 0.09 | | 927.90 | | 0.43 | | 1,024.60 | | 0.46 |
The Technology Select Sector SPDR Fund
| 0.09 | | 1,089.90 | | 0.47 | | 1,024.60 | | 0.46 |
The Utilities Select Sector SPDR Fund
| 0.09 | | 884.80 | | 0.43 | | 1,024.60 | | 0.46 |
| (a) | Expenses are equal to the Fund's annualized net expense ratio multiplied by the average account value of the period, multiplied by 183, then divided by 365. |
THE SELECT SECTOR SPDR TRUST
OTHER INFORMATION (continued)
September 30, 2023 (Unaudited)
Tax Information
For federal income tax purposes, the following information is furnished with respect to the distributions of the Trust for its fiscal year ended September 30, 2023.
Dividends Received Deduction
Each Fund reports the maximum amount allowable of its net taxable income as eligible for the corporate dividends received deduction.
Qualified Dividend Income
A portion of dividends distributed by the Funds during the fiscal year ended September 30, 2023 are considered qualified dividend income and are eligible for reduced tax rates. Each Fund reports the maximum amount allowable of its net taxable income as qualified dividend income as provided in the Jobs and Growth Tax Relief Reconciliation Act of 2003.
Qualified Business Income Deduction
Each Fund reports the maximum amount allowable of qualified REIT dividends eligible for the qualified business income deduction under Section 199A.
Premium/Discount Information
Information regarding how often the Shares of each Fund traded on the exchange at a price above (i.e., at a premium) or below (i.e., at a discount) the NAV of the Fund during the past calendar year can be found at www.sectorspdr.com.
Proxy Voting Policies and Procedures and Records
The Funds have adopted the proxy voting policies of the Adviser. A description of the Funds’ proxy voting policies and procedures that are used by the Funds’ investment Adviser to vote proxies relating to Funds’ portfolio of securities are available (i) without charge, upon request, by calling 1-866-Sector-ETF (1-866-732-8673) (toll free) and (ii) on the SEC’s website at www.sec.gov.
Information regarding how the Funds voted for the prior 12-month period ended June 30 is available by August 31 of each year by calling the same number and on the SEC’s website, at www.sec.gov, and on the Funds’ website at www.sectorspdr.com.
Quarterly Portfolio Schedule
Following the Funds' first and third fiscal quarter-ends, complete Schedules of Investments are filed with the SEC as exhibits on Form N-PORT, which can be found on the Funds' website at www.sectorspdr.com and the SEC's website at www.sec.gov. The Funds’ Schedules of Investments are available upon request, without charge, by calling 1-866-Sector-ETF (1-866-732-8673) (toll free).
THE SELECT SECTOR SPDR TRUST
OTHER INFORMATION (continued)
September 30, 2023 (Unaudited)
Advisory Contract Renewal
At a meeting held on May 4, 2023 (the “May Meeting”), the Board of Trustees of The Select Sector SPDR® Trust (the “Trust”) considered the renewal of the Amended and Restated Investment Advisory Agreement dated December 1, 2003, as amended effective June 18, 2018 (the “Agreement”), between the Trust and SSGA Funds Management, Inc. (the “Adviser”) with respect to each series of the Trust (each a “Fund” and collectively, the “Funds”). The Trustees who are not “interested persons” of the Trust within the meaning of the Investment Company Act of 1940, as amended (the “1940 Act”) (the “Independent Trustees”), also met separately with their independent legal counsel prior to a meeting held on April 12, 2023 (the “April Meeting”) to consider the Agreement and the materials provided by the Adviser and State Street Bank and Trust Company (“State Street”) in response to a request from independent legal counsel on their behalf. The April Meeting included a presentation by representatives of the Adviser and State Street during which the Independent Trustees and independent legal counsel were able to pose questions. Following the April Meeting, independent legal counsel on behalf of the Independent Trustees requested certain clarifications and supplements to the materials provided, and those materials were considered at the May Meeting, prior to which the Independent Trustees met separately with their independent legal counsel. In deciding whether to renew the Agreement, the Trustees considered various factors, including, among others, (i) the nature, extent and quality of the services provided by the Adviser under the Agreement, (ii) the investment performance of the Funds, (iii) the costs to the Adviser of its services and the profits and other benefits realized by the Adviser and its affiliate, State Street, from their relationships with the Trust, (iv) the extent to which economies of scale would be realized if and as the Funds grow and whether the fee levels in the Agreement reflect a sharing of any such economies of scale and (v) the fees paid under the Agreement compared to the advisory fees paid by comparable funds.
Nature, Extent and Quality of Services
In considering the nature, extent and quality of the services provided by the Adviser, the Trustees relied on their prior experience as Trustees of the Trust, as well as on the materials provided at their regular quarterly board meetings and those provided specifically for purposes of reviewing the Agreement. They noted that under the Agreement the Adviser is responsible for: (i) managing the investment operations of each of the Funds in accordance with the Fund’s investment objective and policies, applicable legal and regulatory requirements, and the instructions of the Trustees; (ii) providing necessary and appropriate reports and information to the Trustees; (iii) maintaining all necessary books and records pertaining to the Trust’s securities transactions; and (iv) furnishing each Fund with the assistance, cooperation and information necessary for the Fund to meet various legal requirements regarding registration and reporting. They noted the distinctive nature of the Funds, as exchange-traded funds (“ETFs”) investing in sectors of the S&P 500 Index, and the experience and expertise appropriate in an adviser to funds of that nature. The Trustees reviewed the background and experience of the Adviser’s senior management, including those individuals responsible for the investment and compliance operations of the Trust, and the responsibilities of the latter with respect to the Funds. They also considered the resources, operational structures and practices of the Adviser in managing the Funds’ portfolios, in monitoring and securing each Fund’s compliance with its investment objective and policies and with applicable law and regulations, and in seeking best execution of portfolio transactions. Drawing upon the materials provided and their general knowledge of the business of the Adviser and its affiliate, State Street Global Advisors, with which the Adviser shares all of its senior personnel, the Trustees took into account the experience, resources and strength of the Adviser and its affiliates in the areas of indexed products generally, and ETFs in particular. On the basis of this review, the Trustees determined that the nature and extent of the services provided by the Adviser to the Trust were appropriate, had been of high quality during the past year, and could be expected to remain so.
Investment Performance of the Funds
The Trustees noted that, in view of the distinctive investment objective of each Fund, the investment performance of the Funds in absolute terms was not of the importance that normally attaches to the performance of actively managed funds. Of more importance to the Trustees was the extent to which each Fund achieved its objective to provide investment results that, before expenses, correspond generally to the price and yield performance of publicly traded equity securities of companies in its applicable index. Drawing upon information provided at the April Meeting and at the May Meeting, and upon reports provided to the Trustees by the Adviser throughout the preceding year, the Trustees determined that the Funds had tracked their sector indexes within an acceptable range; they further concluded, on the basis of the data available (see discussion in “Comparison of Fees and Expense Ratios” below), that the expense ratio of each Fund was competitive with its peers. Accordingly, they concluded that the performance of each Fund was satisfactory.
THE SELECT SECTOR SPDR TRUST
OTHER INFORMATION (continued)
September 30, 2023 (Unaudited)
Profitability to the Adviser and its Affiliates
The Trustees considered the profitability of the advisory arrangement with the Funds to the Adviser and of the Trust’s relationship with the Adviser’s affiliate, State Street, in its role as Sub-Administrator, Transfer Agent, Custodian, Fund Accountant and Securities Lending Agent. The Trustees received data on the Funds’ profitability to the Adviser for calendar year 2022 as well as 2021 profitability data, along with data on the Trust’s profitability to State Street for the same and prior periods. The Trustees reviewed with representatives from both the Adviser and State Street the methods by which expenses were allocated to the Trust and to each of the Funds. The Trustees noted that advisor profitability increased in 2022 for the Health Care, Energy, Utilities, Consumer Staples and Real Estate Funds, primarily due to flows into the Funds and market appreciation in certain defensive oriented sectors. On the basis of this information and discussions at the April Meeting and the May Meeting, the Trustees concluded that, to the extent that the Adviser’s and State Street’s relationships with the Trust had been profitable to either or both of those entities, the profitability at current asset levels was not such as to render the advisory fee excessive.
Other Benefits to the Adviser or its Affiliates
In considering whether the Adviser benefits in other ways from its relationship with the Trust, the Trustees noted that the Adviser does not currently use the Funds’ assets for, or participate in, third party soft dollar arrangements. It was further noted that the Trust’s brokerage transactions are not effected through the Adviser or any of its affiliates. The Trustees noted that the Adviser serves as Administrator to the Trust and that State Street, an affiliate of the Adviser, serves the Trust as Sub-Administrator, Transfer Agent, Custodian, Fund Accountant and Securities Lending Agent. The Trustees also noted that, based on their review of the arrangements for those services, any benefit the Adviser or the Adviser’s affiliate receives or had received from providing those services appears to be appropriate. The Trustees concluded that, to the extent that the Adviser or its affiliates derive other benefits or will derive other benefits from their relationships with the Trust, those benefits are not such as to render the Adviser’s fees excessive.
Economies of Scale
On the basis of their discussions with management and their analysis of information provided at and prior to the May Meeting, the Trustees determined that the nature of the Funds and their operations is such that the potential exists for the Adviser to realize economies of scale in the management of the Funds as the Funds grow in size. They were also of the view that these economies of scale were being shared with the Funds by virtue of an advisory fee, set at a relatively low level since the inception of the Trust, that subsumed economies of scale in the fee itself. Furthermore, the Trustees took into consideration the fact that, in order to ensure that if and as the Funds grow in size the economies of scale resulting from this growth would be shared with the Funds, the Adviser and State Street had each previously agreed to institute breakpoints in their respective fee schedules.
Comparison of Fees and Expense Ratios
In order better to evaluate the Funds’ advisory fee, the Independent Trustees requested information with respect to expense ratios and advisory fees of comparable funds, and the Adviser provided: (1) comparative data from Broadridge Financial Solutions, Inc. (“Broadridge”) on advisory fees and expense ratios of peer index ETFs with a similar sector investment classification/objective and comparable asset size (with respect to each Fund, a “peer group”), and (2) expense ratios of peer index ETFs with a similar sector investment classification/objective. The Independent Trustees also requested, and the Adviser provided, information on the advisory fees charged to other Adviser clients with comparable investment objectives, and reviewed the differences in services provided to such clients, including the Adviser’s institutional accounts. The Trustees found that, because of the distinctive nature of the Funds, the universe of comparable funds and accounts was limited. Moreover, they noted that because many ETFs pay a unitary advisory fee, encompassing all or virtually all of the ETFs’ operating expenses, while each Fund’s advisory fee covered only advisory services, as reflected in the materials, the Fund’s advisory fee may appear to be low relative to its ETF peers. The Trustees then reviewed comparable expense ratios and noted that the overall expense ratio of each Fund was below the average of its domestic sector ETF peers, but also noted that each Fund (other than The Real Estate Select Sector SPDR® Fund and The Technology Select Sector SPDR® Fund) continued to be larger than all of its ETF sector peers. The Independent Trustees noted that this had prompted them in past years to request that new breakpoints be added to the fee schedules of both the Agreement and the unitary fee payable under the Sub-Administration Agreement, Custodian Agreement and Transfer Agency Agreement. The Trustees noted that at current
THE SELECT SECTOR SPDR TRUST
OTHER INFORMATION (continued)
September 30, 2023 (Unaudited)
asset levels, shareholders are benefiting from breakpoints, and shareholders should continue to benefit in the future with additional growth in assets.
Conclusion
Based on their review, the Trustees, including a majority of the Independent Trustees, as required by the 1940 Act, concluded that the terms of the Agreement are fair and reasonable and that renewal of the Agreement is in the best interests of each Fund. In deciding to approve the renewal of the Agreement, the Board did not identify any single factor or group of factors as all important or controlling and considered all factors together, and the Board did not allot a particular weight to any one factor or group of factors. They reasoned that, considered in themselves, the nature and extent of the services provided by the Adviser were appropriate, that the performance of the Funds had been satisfactory, and that the Adviser could be expected to provide services of high quality. As to the Adviser’s fees for each Fund, the Trustees determined that the fees, considered in relation to the services provided, were fair and reasonable, that the Trust’s relationship with the Adviser and State Street was not so profitable as to render the fees at current asset levels excessive, that any additional benefits to the Adviser and/or State Street were not of a magnitude to materially affect the outcome of the Trustees’ conclusions, and that, especially in light of the breakpoints in the Adviser’s and State Street’s fee schedules, the fees paid reflected a sharing of economies of scale with the Funds.
THE SELECT SECTOR SPDR TRUST
OTHER INFORMATION (continued)
September 30, 2023 (Unaudited)
TRUSTEES AND OFFICERS INFORMATION
Name, Address
and Year of Birth | | Position(s)
with Trust | | Term of
Office and
Length of
Time Served | | Principal
Occupation(s)
During Past
5 Years | | Number of
Portfolios
in Fund
Complex
Overseen
by Trustee† | | Other
Directorships
Held by Trustee
During the
Past 5 Years |
| Independent Trustees | | | | | | | | | | |
ASHLEY T. RABUN
c/o The Select Sector
SPDR Trust
One Iron Street
Boston, MA 02210
1952 | | Trustee, Chair of
the Board;
Member of the
Audit Committee,
Member of the
Nominating and
Governance Committee | | Term: Indefinite
Appointed:
October 2015
Elected: October
2021 | | Retired; President and
Founder,
InvestorReach, Inc., a
financial services
consulting firm (1996
- 2015). | | 11 | | Chairperson of the Board
and Member of the Audit,
Nominating and Valuation Committees,
Investment Managers
Series Trust (2007 -
present). |
ALLISON GRANT WILLIAMS
c/o The Select Sector
SPDR Trust
One Iron Street
Boston, MA 02210
1956 | | Trustee, Member of the Audit Committee, Member of the Nominating and Governance Committee | | Term: Indefinite
Elected: October
2021 | | Retired; Practice
Executive, Global
Strategic Relationship
Management/Asset
Management -
Corporate &
Institutional Services
(C&IS) Division,
Northern Trust
Corporation (2017 -
2021); and Chief
Operating Officer &
Chief Administrative
Officer, Institutional
Investor Group, N.A.,
C&IS Division,
Northern Trust
Corporation (2016 -
2017). | | 11 | | Leadership Advisory
Committee (2019 - present) and
Membership
Committee Chair (2021
- present), Art Institute
of Chicago; Academic Affairs
Chair and
Executive Committee
Member (2018 -
present) and Board of
Trustees and
Investment Committee
Member (2012 -
present), Columbia
College Chicago.
|
SHEILA HARTNETT-DEVLIN
c/o The Select Sector
SPDR Trust
One Iron Street
Boston, MA 02210
1958 | | Trustee, Member of the Audit Committee, Member of the Nominating and Governance Committee | | Term: Indefinite
Elected: October 2021 | | Retired; Senior Vice
President and Head of
the U.S. Institutional
Business American
Century Investments,
Inc. (2008 - 2017). | | 11 | | Director, South Jersey
Industries, Inc. (energy
services) (1999 - present)
and Director, Mannington
Mills (flooring products)
(2005 to present). |
JAMES JESSEE
c/o The Select Sector
SPDR Trust
One Iron Street
Boston, MA 02210
1958 | | Trustee, Member of the Audit Committee, Member of the Nominating and Governance Committee | | Term: Indefinite
Elected: October
2021 | | Retired; Strategic
Advisor, MFS
Investment Management
(2018); and Co-Head,
Global Distribution and
President MFS Fund
Distributors, Inc. (2011 –
2017). | | 11 | | Trustee, Yieldstreet Prism
Fund (investment
company) (2019 -
present);
Trustee, Lanteri Charitable Trust (2018 - present); Director, Regional Board of Directors, BottomLine (charity) (2018 - present); Director, Invest in Others Charitable Foundation (2016 - present); Board Member, Board of Governors, Investment Company Institute (2014 - 2018); Director, Waddell & Reed Financial, Inc. (investment management) (2019 - 2021). |
THE SELECT SECTOR SPDR TRUST
OTHER INFORMATION (continued)
September 30, 2023 (Unaudited)
Name, Address
and Year of Birth | | Position(s)
with Trust | | Term of
Office and
Length of
Time Served | | Principal
Occupation(s)
During Past
5 Years | | Number of
Portfolios
in Fund
Complex
Overseen
by Trustee† | | Other
Directorships
Held by Trustee
During the
Past 5 Years |
TERESA POLLEY
c/o The Select Sector
SPDR Trust
One Iron Street
Boston, MA 02210
1960 | | Trustee, Chair of the Audit Committee, Member of the Nominating and Governance Committee | | Term: Indefinite
Elected: October
2021 | | Terri Polley
Consulting (2019 -
present); President and Chief Executive
Officer of the Financial
Accounting Foundation (FAF)
(2008 - 2019). | | 11 | | Corporator, Fairfield County Bank Corporation (2019 - present); Trustee (2018 to present), Academic Affairs Committee Member (2018 - present), Audit Committee Chair (2021 - present), Executive Committee Member (2021 - present), Finance and Operations Committee Member (2018 - present), St. Francis University; Director (2010 - present), Chair (2015 - 2017), Vice Chair (2013 - 2015), Treasurer (2011 - 2013), Greater Norwalk (CT) Chamber of Commerce; Member (2020 - present), Investment Committee, Connecticut Society of CPAs; Director (2020 - present), Girl Scouts of Connecticut. |
R. CHARLES TSCHAMPION
c/o The Select Sector
SPDR Trust
One Iron Street
Boston, MA 02210
1946 | | Trustee, Member of the Audit Committee, Chair of the Nominating and Governance Committee
| | Term: Indefinite
Elected: October
1998 | | Retired. | | 11 | | Trustee Emeritus of Lehigh University; Director and Member of the Audit and Nominating Committees, db-X Exchange-Traded Funds, Inc. (2007 - 2015).
|
| Interested Trustees | | | | | | | | | | |
JAMES E. ROSS*
c/o The Select Sector SPDR Trust
One Iron Street
Boston, MA 02210
1965 | | Trustee | | Term: Indefinite
Appointed:
November 2005
Elected:
October 2021 | | Non-Executive Chairman, Fusion Acquisition Corp. (June 2020 - present); Retired Chairman and Director, SSGA Funds Management, Inc. (2005 - March 2020); Retired Executive Vice President, State Street Global Advisors (2012 - March 2020); Retired Chief Executive Officer and Manager, State Street Global Advisors Funds Distributors, LLC (May 2017 - March 2020);Director, State Street Global Markets, LLC (2013 - April 2017); President, SSGA Funds Management, Inc. (2005 - 2012); Principal, State Street Global Advisors (2000 - 2005). | | 132 | | SSGA SPDR
ETFs Europe I PLC
(Director)
(November 2016 -
March 2020); SSGA
SPDR ETFs
Europe II PLC
(Director)
(November 2016 -
March 2020); State Street Navigator Securities Lending
Trust (July 2016 - March 2020);
SSGA Funds (January 2014 - March 2020);
State Street Institutional Investment Trust
(February 2007 - March 2020);
State Street Master Funds (February 2007 - March 2020); Elfun Funds (July 2016 - December 2018). |
RORY TOBIN*
c/o The Select Sector
SPDR Trust
One Iron Street
Boston, MA 02210
1965 | | Trustee | | Term: Indefinite
Elected: October
2021 | | Executive Vice
President and Head of
Business EMEA, Head
of Global SPDR ETF,
Member of the SSGA
Global Executive
Management Group. | | 11 | | None |
| † For the purpose of determining the number of portfolios overseen by the Trustees, “Fund Complex” comprises registered investment companies for which SSGA Funds Management, Inc. serves as investment adviser. |
| * Mr. Ross and Mr. Tobin are each an “interested person” of the Trust, as defined in the 1940 Act. Mr. Ross is an “interested person”, because of his former position with the Adviser and ownership interest in an affiliate of the Adviser. Mr. Tobin is an “interested person” because of his position with an affiliate of the Adviser. |
THE SELECT SECTOR SPDR TRUST
OTHER INFORMATION (continued)
September 30, 2023 (Unaudited)
Name, Address
and Year of Birth | | Position(s)
with Trust | | Term of
Office and
Length of
Time Served | | Principal Occupation(s) During the Past 5 Years |
| Officers | | | | | | |
ANN M. CARPENTER
SSGA Funds Management, Inc.
One Iron Street
Boston, MA 02210
1966 | | President and Principal Executive Officer and Deputy Treasurer | | Term: Indefinite
Elected:
May 2023 | | Chief Operating Officer, SSGA Funds Management, Inc. (April 2005 - present)*; Managing Director, State Street Global Advisors (April 2005 - present).* |
MICHAEL P. RILEY
SSGA Funds Management, Inc.
One Iron Street
Boston, MA 02210
1969 | | Vice
President | | Term: Indefinite
Elected:
February 2005 | | Managing Director, State Street Global Advisors (2005 - present).* |
CHAD C. HALLETT
SSGA Funds Management, Inc.
One Iron Street
Boston, MA 02210
1969 | | Treasurer and
Principal Financial Officer | | Term: Indefinite
Elected:
November 2007 | | Vice President, State Street Global Advisors and SSGA Funds Management, Inc. (November 2014 - present); Vice President, State Street Bank and Trust Company (2001 - November 2014).* |
E. GERARD MAIORANA, JR.
SSGA Funds Management, Inc.
One Iron Street
Boston, MA 02210
1971 | | Assistant
Secretary | | Term: Indefinite
Elected:
May 2023 | | Assistant Vice President, State Street Global Advisors (July 2014 - present) |
BRUCE S. ROSENBERG
SSGA Funds Management, Inc.
One Iron Street
Boston, MA 02210
1961 | | Deputy
Treasurer | | Term: Indefinite
Elected:
February 2016 | | Managing Director, State Street Global Advisors and SSGA Funds Management, Inc. (July 2015 - present); Director, Credit Suisse (April 2008 - July 2015). |
DARLENE ANDERSON-VASQUEZ
SSGA Funds Management, Inc.
One Iron Street
Boston, MA 02210
1968 | | Deputy
Treasurer | | Term: Indefinite
Elected:
February 2017 | | Managing Director, State Street Global Advisors and SSGA Funds Management, Inc. (May 2016 - present); Senior Vice President, John Hancock Investments (September 2007 - May 2016). |
ARTHUR A. JENSEN
SSGA Funds Management, Inc.
1600 Summer Street
Stamford, CT 06905
1966 | | Deputy
Treasurer | | Term: Indefinite
Elected:
November 2017 | | Vice President, State Street Global Advisors and SSGA Funds Management, Inc. (July 2016 - present);
Mutual Funds Controller, GE Asset Management Incorporated (April 2011 - July 2016). |
DAVID LANCASTER
SSGA Funds Management, Inc.
One Iron Street
Boston, MA 02210
1971 | | Assistant
Treasurer | | Term: Indefinite
Elected:
November 2020 | | Vice President, State Street Global Advisors and SSGA Funds Management, Inc. (July 2017 - present); Assistant Vice President, State Street Bank and Trust Company (November 2011 - July 2017).* |
| JOHN BETTENCOURT SSGA Funds Management, Inc. One Iron Street Boston, MA 02210 1976 | | Assistant Treasurer | | Term: Indefinite Elected: May 2022 | | Vice President, State Street Global Advisors ( 2007 - present); State Street Bank and Trust (1999 - 2007). |
SEAN O’MALLEY
SSGA Funds Management, Inc.
One Iron Street
Boston, MA 02210
1969 | | Chief
Legal
Officer | | Term: Indefinite
Elected:
August 2019 | | Senior Vice President and Deputy General Counsel, State Street Global Advisors (November 2013 - present). |
DAVID BARR
SSGA Funds Management, Inc.
One Iron Street
Boston, MA 02210
1974 | | Assistant
Secretary | | Term: Indefinite
Elected:
November 2020 | | Vice President and Senior Counsel, State Street Global Advisors (October 2019 - present); Vice President and Council, Eaton Vance Corp. (October 2010 - October 2019). |
THE SELECT SECTOR SPDR TRUST
OTHER INFORMATION (continued)
September 30, 2023 (Unaudited)
Name, Address
and Year of Birth | | Position(s)
with Trust | | Term of
Office and
Length of
Time Served | | Principal Occupation(s) During the Past 5 Years |
DAVID URMAN
SSGA Funds Management, Inc.
One Iron Street
Boston, MA 02210
1985 | | Secretary | | Term: Indefinite
Elected:
August 2019 | | Vice President and Senior Counsel, State Street Global Advisors (April 2019 - present); Vice President and Counsel, State Street Global Advisors (August 2015 - April 2019); Associate, Ropes & Gray LLP (November 2012 - August 2015). |
BRIAN HARRIS
SSGA Funds Management, Inc.
One Iron Street
Boston, MA 02210
1973 | | Chief Compliance
Officer; Anti-
Money
Laundering
Officer and Code of
Ethics
Compliance
Officer | | Term: Indefinite
Elected:
November 2013 | | Managing Director, State Street Global Advisors and SSGA Funds Management, Inc. (June 2013 - present)*. |
| * Served in various capacities and/or with various affiliated entities during the noted time period. |
| The Trust's Statement of Additional Information (SAI) includes additional information about the Funds' Trustees and is available, without charge, upon request and by calling 1-866-787-2257. |
[This Page Intentionally Left Blank]
[This Page Intentionally Left Blank]
TRUSTEES
Allison Grant Williams
Sheila Hartnett-Devlin
James Jessee
Teresa Polley
Ashley T. Rabun, Chairperson
James E. Ross, Interested Non-Management Trustee
Rory Tobin, Interested Trustee
R. Charles Tschampion
INVESTMENT MANAGER AND ADMINISTRATOR
SSGA Funds Management, Inc.
One Iron Street
Boston, MA 02210
DISTRIBUTOR
ALPS Portfolio Solutions Distributor, Inc.
1290 Broadway, Suite 1100
Denver, Colorado 80203
CUSTODIAN, SUB-ADMINISTRATOR AND TRANSFER AGENT
State Street Bank and Trust Company
One Congress Street
Boston, MA 02114
LEGAL COUNSEL
Morgan, Lewis & Bockius LLP
1111 Pennsylvania Avenue, NW
Washington, DC 20004
INDEPENDENT REGISTERED PUBLIC ACCOUNTING FIRM
Cohen & Company
1350 Euclid Ave., Suite 800
Cleveland, OH 44115
The information contained in this report is intended for the general information of shareholders of the Trust. This report is not authorized for distribution to prospective investors unless preceded or accompanied by a current Trust prospectus which contains important information concerning the Trust. You may obtain a current prospectus from the Distributor, ALPS Portfolio Solutions Distributor, Inc., by calling 1-866-SECTOR-ETF (1-866-732-8673). Please read the prospectus carefully before you invest.
Visit www.sectorspdr.com or call 1-866-SECTOR-ETF (1-866-732-8673)
SPDRSSAR
(b) Not applicable.
Item 2. Code of Ethics.
As of the end of the period covered by this report, the registrant has adopted a code of ethics that applies to the registrant’s principal executive officer, principal financial officer, principal accounting officer or controller, or persons performing similar functions, regardless of whether these individuals are employed by the registrant or a third party (the “Code of Ethics”). During the period covered by this report, no substantive amendments were made to the Code of Ethics. During the period covered by this report, the registrant did not grant any waivers, including any implicit waivers, from any provision of the Code of Ethics.
The Code of Ethics is attached hereto as Exhibit 13(a)(1).
Item 3. Audit Committee Financial Expert.
(a)(1) The Board of Trustees of the registrant has determined that the registrant has one Board member serving on the Audit Committee that possesses the attributes identified in Instructions 2(b) of Item 3 to Form N-CSR to qualify as an “audit committee financial expert.”
(2) Teresa S. Polley is the registrant’s audit committee financial expert. The Board has determined that the foregoing person is “independent” in that, (i) other than in her capacity as a member of the Audit Committee and the Board of Trustees of the registrant, she has not accepted, directly or indirectly, any consulting, advisory or other compensatory fee from the registrant, and (ii) she is not an “interested person” of the registrant as defined in Section 2(a)(19) of the Investment Company Act of 1940, as amended (the “1940 Act”).
Item 4. Principal Accountant Fees and Services.
(a) Audit Fees.
For the fiscal year ended September 30, 2023, the aggregate audit fees billed for professional services rendered by Cohen & Company (“Cohen”), the Trust’s principal accountant, for the audit of the Trust’s annual financial statements or services normally provided by Cohen in connection with the Trust’s statutory and regulatory filings and engagements was $207,000.
For the fiscal year ended September 30, 2022, the aggregate audit fees billed for professional services rendered by Ernst & Young LLP (“E&Y”), the Trust’s principal accountant, for the audit of the Trust’s annual financial statements or services normally provided by E&Y in connection with the Trust’s statutory and regulatory filings and engagements was $218,196.
The nature of the services are (1) auditing of the statements of assets and liabilities, related statements of operations and changes in net assets, and the financial highlights of each series of the registrant; (2) auditing and reporting on the financial statements to be included in the amendment to the registrant’s registration statement on Form N-1A to be filed with the Securities and Exchange Commission; (3) review of the amendment to the registration statement; (4) issuance of a Report on Internal Control for inclusion in the registrant’s Form N-CSR and (5) Rule 17f-2 securities counts.
(b) Audit-Related Fees.
For the fiscal years ending September 30, 2023 and September 30, 2022, there were no fees for assurance and related services that were reasonably related to the performance of the audit of the Trust’s financial statements that were not reported under paragraph (a) of this Item.
(c) Tax Fees.
For the fiscal year ended September 30, 2023, the aggregate tax fees billed by Cohen for services related to the review of year-end distribution requirements was $25,000 .
For the fiscal year ended September 30, 2022, the aggregate tax fees billed by E&Y for services related to the review of year-end distribution requirements was $24,024.
(d) All Other Fees.
For the fiscal year ended September 30, 2023, there were no fees billed for professional services rendered by Cohen for products and services provided by Cohen to the Trust, other than the services reported in paragraphs (a) through (c).
For the fiscal years ended September 30, 2023, the aggregate fees for professional services rendered by Cohen for products and services provided by Cohen to the Adviser and any entity controlling, controlled by, or under common control with the Adviser that provides ongoing services to the Trust that (i) relate directly to the operations and financial reporting of the Trust and (ii) were pre-approved by the Audit Committee was $0.
For the fiscal year ended September 30, 2022, there were no fees billed for professional services rendered by E&Y for products and services provided by E&Y to the Trust, other than the services reported in paragraphs (a) through (c).
For the fiscal year ended September 30, 2022, the aggregate fees for professional services rendered by E&Y for products and services provided by E&Y to the Adviser and any entity controlling, controlled by, or under common control with the Adviser that provides ongoing services to the Trust that (i) relate directly to the operations and financial reporting of the Trust and (ii) were pre-approved by the Audit Committee was approximately $9,327,125.
(e)(1) Audit Committee Pre-Approval Policies and Procedures.
The registrant’s Audit Committee Charter states the following with respect to pre-approval procedures:
Before the independent auditors are engaged by the Trust to render audit or non-audit services, either:
| | (a) | The Audit Committee shall pre-approve all auditing services and permissible non-audit services (e.g., tax services) provided to the Trust. The Audit Committee may delegate to one or more of its members the authority to grant pre-approvals. Any decision of any member to whom authority is delegated under this section shall be presented to the full Audit Committee at its next regularly scheduled meeting; or |
| | (b) | The engagement to render the auditing service or permissible non-audit service is entered into pursuant to pre-approval policies and procedures established by the Audit Committee. Any such policies and procedures must (1) be detailed as to the particular service and (2) not involve any delegation of the Audit Committee’s responsibilities to the investment adviser. The Audit Committee must be informed of each service entered into pursuant to the policies and procedures. A copy of any such policies and procedures shall be attached as an exhibit to the Audit Committee Charter. |
| | (c) | De Minimis Exceptions to Pre-Approval Requirements. Pre-Approval for a service provided to the Trust other than audit, review or attest services is not required if: (1) the aggregate amount of all such non-audit services provided to the Trust constitutes not more than 5 percent of the total amount of revenues paid by the Trust to the independent auditors during the fiscal year in which the non-audit services are provided; (2) such services were not recognized by the Trust at the time of the engagement to be non-audit services; and (3) such services are promptly brought to the attention of the Audit Committee and are approved by the Audit Committee or by one or more members of the Audit Committee to whom authority to grant such approvals has been delegated by the Audit Committee prior to the completion of the audit. |
| | (d) | Pre-Approval of Non-Audit Services Provided to the investment adviser and Certain Control Persons. The Audit Committee shall pre-approve any non-audit services proposed to be provided by the independent auditors to (a) the investment adviser and (b) any entity controlling, controlled by, or under common control with the investment adviser that provides ongoing services to the Trust, if the independent auditors’ engagement with the investment adviser or any such control persons relates directly to the operations and financial reporting of the Trust. It shall be the responsibility of the independent auditors to notify the Audit Committee of any non-audit services that need to be pre-approved. |
| | (e) | Application of De Minimis Exception. The De Minimis exception set forth above applies to pre-approvals under this Section as well, except that the “total amount of revenues” calculation is based on the total amount of revenues paid to the independent auditors by the Trust and any other entity that has its services approved under this Section (i.e., the investment adviser or any control person). |
(e)(2) Percentage of Services.
None of the services described in paragraphs (b) through (d) of this Item were performed in reliance on paragraph (c)(7)(i)(C) of Rule 2-01 of Regulation S-X during the period of time for which such rule was effective.
(f) Not applicable.
(g) Total Fees Paid By Adviser and Certain Affiliates
For the fiscal year ended September 30, 2023, the aggregate non-audit fees billed by Cohen and for the fiscal year ended September 30, 2022, the aggregate non-audit fees billed by E&Y, for services rendered to the Trust and the Adviser and any entity controlling, controlled by, or under common control with the Adviser that provided ongoing services to the Trust were as follows:
| | | | | | | | |
| | | FY 2023
(in millions) | | | FY 2022
(in millions) | |
Non audit services billed to: | | | | | | | | |
Registrant: | | | See Item 4 | (c) | | | See Item 4 | (c) |
Investment Adviser: | | | — | | | | — | |
Other entities in the Investment Company Complex (1)(2): | | | | | | | | |
Audit Related Fees | | $ | 0 | | | $ | 18.1 | |
Tax Fees | | $ | 0 | | | $ | 5.4 | |
All Other Fees | | $ | 0 | | | $ | 14.5 | |
| (1) | Information is for the calendar years 2023 and 2022, respectively. |
| (2) | Services under the caption Audit-Related Fees consisted principally of reports on the processing of transactions by servicing organizations, audits of employee benefit plan, non-statutory audits and due diligence procedures. Services under the caption Tax Fees consisted principally of expatriate, compliance and corporate tax advisory services. Services under the caption All Other Fees primarily related to statutory and financial statement audits and the requirement to opine on the design and operating effectiveness of internal control over financial reporting. |
(h) The registrant’s principal accountant notified the registrant’s Audit Committee of all non-audit services that were rendered by the principal accountant to the registrant’s adviser and any entity controlling, controlled by, or under common control with the adviser that provides services to the registrant, which services were not required to be pre-approved pursuant to paragraph (c)(7)(ii) of Rule 2-01 of Regulation S-X, allowing the registrant’s Audit Committee to consider whether such services were compatible with maintaining the principal accountant’s independence.
(i) Not applicable.
(j) Not applicable.
Item 5. Audit Committee of Listed Registrants.
The registrant has an audit committee which was established by the Board of Trustees of the registrant in accordance with Section 3(a)(58)(A) of the Securities Exchange Act of 1934, as amended (the “1934 Act”). The members of the registrant’s audit committee are Ashley T. Rabun, Allison Grant Williams, Sheila Hartnett-Devlin, James Jessee, Teresa Polley and R. Charles Tschampion.
Item 6. Schedule of Investments.
| (a) | The schedule of investments is included as part of the reports to shareholders filed under Item 1 of this Form N-CSR. |
| (b) | Not applicable to the registrant. |
Item 7. Disclosure of Proxy Voting Policies and Procedures for Closed-End Management Investment Companies.
Not applicable to the registrant.
Item 8. Portfolio Managers of Closed-End Management Investment Companies.
Not applicable to the registrant.
Item 9. Purchases of Equity Securities by Closed-End Management Investment Company and Affiliated Purchasers.
Not applicable to the registrant.
Item 10. Submission of Matters to a Vote of Security Holders.
The registrant has not adopted any material changes to the procedures by which shareholders may recommend nominees to the registrant’s Board.
Item 11. Controls and Procedures.
(a) Within 90 days of the filing date of this Form N-CSR, Ann M. Carpenter the registrant’s President and Principal Executive Officer, and Chad C. Hallett, the registrant’s Treasurer and Principal Financial Officer, reviewed the registrant’s disclosure controls and procedures (as defined in Rule 30a-3(c) under the Investment Company Act of 1940, as amended (the “1940 Act”)) and evaluated their effectiveness. Based on their review, Ann M. Carpenter and Mr. Hallett determined that the disclosure controls and procedures adequately ensure that information required to be disclosed by the registrant in its periodic reports is recorded, processed, summarized and reported within the time periods required by the U.S. Securities and Exchange Commission.
(b) There were no changes in the registrant’s internal control over financial reporting (as defined in Rule 30a-3(d) under the 1940 Act) that occurred during the period covered by this report that have materially affected, or are reasonably likely to materially affect, the registrant’s internal control over financial reporting.
Item 12. Disclosure of Securities Lending Activities for Closed-End Management Investment Companies.
(a) Not applicable to the registrant.
(b) Not applicable to the registrant.
Item 13. Exhibits.
(b) A single certification required by Rule 30a-2(b) under the 1940 Act, Rule 13a-14(b) or Rule 15d-14(b) under the Securities Exchange Act of 1934, as amended (the “1934 Act”), and Section 1350 of Chapter 63 of Title 18 of the United States Code for the principal executive officer and principal financial officer of the registrant is attached.
SIGNATURES
Pursuant to the requirements of the Securities Exchange Act of 1934, as amended, and the Investment Company Act of 1940, as amended, the registrant has duly caused this report to be signed on its behalf by the undersigned, thereunto duly authorized.
| | |
| The Select Sector SPDR�� Trust |
| |
| By: | | /s/ Ann M. Carpenter |
| | Ann M. Carpenter |
| | President and Principal Executive Officer |
| |
| Date: | | December 6, 2023 |
Pursuant to the requirements of the Securities Exchange Act of 1934, as amended, and the Investment Company Act of 1940, as amended, this report has been signed below by the following persons on behalf of the registrant and in the capacities and on the dates indicated.
| | |
| By: | | /s/ Ann M. Carpenter |
| | Ann M. Carpenter |
| | President and Principal Executive Officer |
| |
| By: | | /s/ Chad C. Hallett |
| | Chad C. Hallett |
| | Treasurer and Principal Financial Officer |
| |
| Date: | | December 6, 2023 |