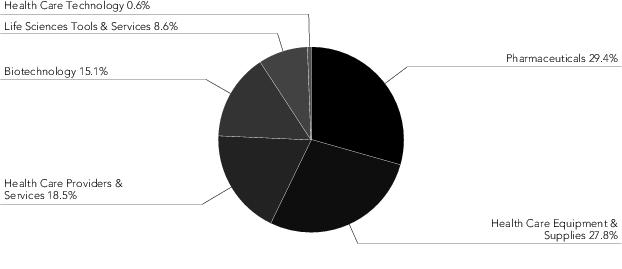
Unitary Fee
State Street Bank and Trust Company (“State Street”), an affiliate of the Adviser, serves as custodian, sub-administrator and transfer agent to each Fund of the Trust. A “unitary” fee is paid by each Fund to State Street for custody, sub-administration and transfer agency services provided to the Funds. The unitary fee is calculated based upon the average daily net assets of the Trust and allocated pro rata to each Select Sector SPDR Fund based upon the relative net assets of each Fund. Effective January 1, 2018, the unitary fee structure was amended and is calculated as follows: (i) $0 - $50 billion of net assets of the Trust, 0.015% of average daily net assets; (ii) over $50 billion - $75 billion of net assets of the Trust, 0.0125% of average daily net assets; (iii) over $75 billion - $100 billion of net assets of the Trust, 0.01% of average daily net assets; (iv) over $100 billion - $400 billion of net assets of the Trust, 0.004% of average daily net assets; and (v) over $400 billion of net assets of the Trust, 0.0025% of average daily net assets.
State Street is a wholly-owned subsidiary of State Street Corporation.
Other Transactions with Affiliates - Securities Lending
State Street, an affiliate of the Funds, acts as the securities lending agent for the Funds, pursuant to an amended and restated securities lending authorization agreement dated July 10, 2017, as amended.
Proceeds collected by State Street on investment of cash collateral or any fee income are allocated as follows (after deduction of such other amounts payable to State Street under the terms of the securities lending agreement): 85% payable to the Fund, and 15% payable to State Street.
In addition, cash collateral from lending activities is invested in the State Street Navigator Securities Lending Portfolio II, an affiliated fund, for which SSGA FM serves as investment adviser. See Note 9 for additional information regarding securities lending.
Other Transactions with Affiliates
The Funds may invest in affiliated entities, including securities issued by State Street Corporation, affiliated funds, or entities deemed to be affiliates as a result of the Funds owning more than five percent of the entity’s voting securities or outstanding shares. Amounts relating to these transactions during the period ended September 30, 2020 are disclosed in the Schedules of Investments.
Contributions from Affiliate
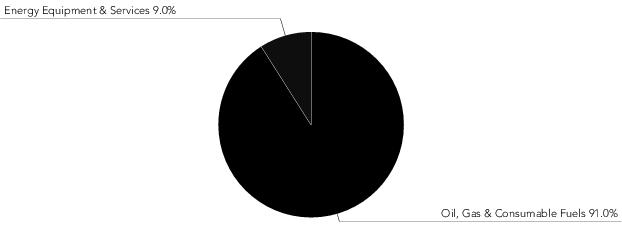
On September 10 and 11, 2020, State Street, an affiliate of the Funds, agreed to make contributions totaling $290,417 to The Energy Select Sector SPDR Fund related to a trade processing matter.
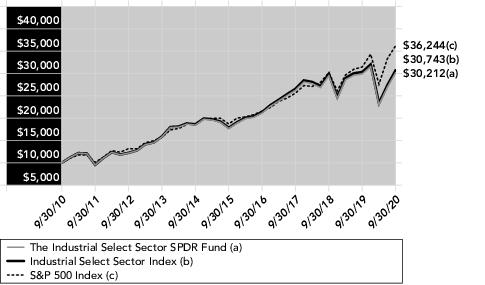
On July 25, 2019, State Street, an affiliate of the Funds, made a contribution of $60,421 to The Industrial Select Sector SPDR Fund in connection with a transfer agency matter.
Due to Custodian
In certain circumstances, the Funds may have cash overdrafts with the custodian due to expense payments, capital transactions, trading of securities, investment operations or derivative transactions. The Due to custodian amount, if any, reflects cash overdrawn with State Street, as custodian, who is an affiliate of the Funds.
5. Additional Expenses
Distributor
ALPS Portfolio Solutions Distributor, Inc. (the “Distributor”) serves as the distributor of the shares of each Fund. Pursuant to a Distribution and Service Plan adopted by each Fund in accordance with Rule 12b-1 under the 1940 Act, each Fund is authorized to pay fees, including fees to the Distributor, at an annualized rate of 0.25% of the average daily net assets of the Fund. Effective January 31, 2018, the Board has limited each Fund’s 12b-1 fee to 0.035% of its average daily net assets through at least January 31, 2021.