Table of Contents
UNITED STATES
SECURITIES AND EXCHANGE COMMISSION
Washington, D.C. 20549
FORM N-CSR
CERTIFIED SHAREHOLDER REPORT OF REGISTERED
MANAGEMENT INVESTMENT COMPANIES
Investment Company Act file number: 811-08837
THE SELECT SECTOR SPDR® TRUST
(Exact name of registrant as specified in charter)
One Lincoln Street, Boston, Massachusetts 02111
(Address of principal executive offices) (zip code)
Joshua A. Weinberg, Esq.
Managing Director and Managing Counsel
SSGA Funds Management, Inc.
One Lincoln Street
Boston, Massachusetts 02111
(Name and address of agent for service)
Copy to:
W. John McGuire, Esq.
Morgan, Lewis & Bockius LLP
1111 Pennsylvania Avenue, N.W.
Washington, D.C. 20004
Registrant’s telephone number, including area code: (617) 664-7037
Date of fiscal year end: September 30
Date of reporting period: September 30, 2017
Table of Contents
| Item 1. | Report to Shareholders. |
Table of Contents

Annual Report
September 30, 2017
Table of Contents

SELECT SECTOR SPDR FUNDS
The Select Sector SPDR Trust consists of ten separate investment portfolios (each a “Select Sector SPDR Fund” or a “Fund” and collectively the “Select Sector SPDR Funds” or the “Funds”).
Select Sector SPDR Funds are “index funds” that unbundle the benchmark S&P 500þ† and give you ownership in particular sectors or groups of industries that are represented by a specified Select Sector Index. Through a single share, investors can buy or sell any of ten major industry sectors that make up the S&P 500þ, in the same way as they would buy or sell a share of stock. Select Sector SPDR Fund shares are different from the shares of conventional mutual funds. Select Sector SPDR Funds trade on NYSE Arca.
TEN SELECT SECTOR SPDR FUNDS
Shares are available for exchange trading in the following Funds of The Select Sector SPDR Trust:
| The Consumer Discretionary Select Sector SPDR Fund | XLY | |
| The Consumer Staples Select Sector SPDR Fund | XLP | |
| The Energy Select Sector SPDR Fund | XLE | |
| The Financial Select Sector SPDR Fund | XLF | |
| The Health Care Select Sector SPDR Fund | XLV | |
| The Industrial Select Sector SPDR Fund | XLI | |
| The Materials Select Sector SPDR Fund | XLB | |
| The Real Estate Select Sector SPDR Fund | XLRE | |
| The Technology Select Sector SPDR Fund | XLK | |
| The Utilities Select Sector SPDR Fund | XLU | |
Each of these Funds is designed to, before expenses, correspond generally to the price and yield performance of a Select Sector Index. Each Fund’s portfolio is comprised principally of shares of constituent companies in the S&P 500þ. Each stock in the S&P 500þ is allocated to one Select Sector Index. The combined companies of the ten Select Sector Indexes represent all of the companies in the S&P 500þ. Each Select Sector SPDR Fund can be expected to move up or down in value with its underlying Select Sector Index. Investors cannot invest directly in an index. Funds focused on a single sector generally experience greater price fluctuations than the overall stock market.
OBJECTIVE
Select Sector SPDR Funds are designed to provide investors with an affordable way to invest in a portfolio of equity securities in a sector or group of industries in a single trade. Select Sector SPDR Funds allow you to tailor asset allocations to fit your particular investment needs or goals. One Fund may complement another; individual Select Sector SPDR Funds can be used to increase exposure to certain industries that may be outperforming the market or to hedge other holdings in your portfolio. Although an individual Select Sector SPDR Fund may bear a higher level of risk than a broad-market fund, because of less diversification, sector investments may also offer opportunities for returns greater than an investment in the entire constituents of the S&P 500þ.
The information contained in this report is intended for the general information of shareholders of the Trust. This report is not authorized for distribution to prospective investors unless preceded or accompanied by a current Trust prospectus which contains important information concerning the Trust. You may obtain a current prospectus from the Distributor, ALPS Portfolio Solutions Distributor, Inc., by calling 1-866-SECTOR-ETF (1-866-732-8673). Please read the prospectus carefully before you invest.
| † | S&P 500: the Standard & Poor’s composite index of 500 stocks, a widely recognized, unmanaged, index of common stock prices. |
Table of Contents
| Management’s Discussion and Analysis of Fund Performance (Unaudited) | ||||
| 1 | ||||
| 5 | ||||
| 9 | ||||
| 13 | ||||
| 17 | ||||
| 21 | ||||
| 25 | ||||
| 29 | ||||
| 33 | ||||
| 37 | ||||
| Schedules of Investments | ||||
| 41 | ||||
| 44 | ||||
| 46 | ||||
| 48 | ||||
| 50 | ||||
| 52 | ||||
| 54 | ||||
| 56 | ||||
| 58 | ||||
| 60 | ||||
| Financial Statements | 62 | |||
| Financial Highlights | 70 | |||
| Notes to Financial Statements | 80 | |||
| Report of Independent Registered Public Accounting Firm | 89 | |||
| Other Information (Unaudited) | 90 | |||
Table of Contents
THE CONSUMER DISCRETIONARY SELECT SECTOR SPDR FUND —
MANAGEMENT’S DISCUSSIONOF FUND PERFORMANCE (UNAUDITED)
The Consumer Discretionary Select Sector SPDR Fund (the “Fund”) seeks to provide investment results that, before expenses, correspond generally to the price and yield performance of publicly traded equity securities of companies in the Consumer Discretionary Select Sector Index. The Fund’s benchmark is the Consumer Discretionary Select Sector Index (the “Index”).
For the 12-month period ended September 30, 2017 (the “Reporting Period”), the total return for the Fund was 14.34%, and for the Index was 14.52%. The Fund and Index returns reflect the reinvestment of dividends and other income. The Fund’s performance reflects the expenses of managing the Fund, including brokerage and advisory expenses. The Index is unmanaged and Index returns do not reflect fees and expenses of any kind, which would have a negative impact on returns. Cash, security misweights, transaction costs and compounding (the exponential growth of outperformance or underperformance) also contributed to the difference between the Fund’s performance and that of the Index.
The Fund enjoyed positive performance for each quarter in the Reporting Period. Positive fund performance was largely driven by strong returns from Amazon, the fund’s largest weighted company. Amazon continued to reap the benefits of increased spending through the holiday season and the remainder of the Reporting Period as consumers enjoyed the convenience of online shopping and low cost shipping. Unfortunately, many retailers felt the brunt of the negative impact from Amazon’s success as consumers choose to avoid physically going to stores to shop, which impacts overall sales. Fund performance in the first half of the Reporting Period was also helped by the surprise presidential election of Donald Trump and the expected favorable environment from his economic agenda, including the proposed tax plan. Even the two interest rate increases during the Reporting Period had minimal impact, allowing the Fund to end the Reporting Period in double digit positive territory.
The Fund did not invest in derivatives during the Reporting Period.
On an individual security level, the top positive contributors to the Fund’s performance were Home Depot, Inc., Amazon.com, Inc., and Netflix, Inc. The top negative contributors to the Fund’s performance were AutoZone, Inc., O’Reilly Automotive, Inc., and L Brands, Inc.
The views expressed above reflect those of the Fund’s portfolio manager only through the Reporting Period, and do not necessarily represent the views of the Adviser as a whole. Any such views are subject to change at any time based upon market or other conditions and the Adviser disclaims any responsibility to update such views. These views may not be relied on as investment advice and, because investment decisions for a fund are based on numerous factors, may not be relied on as an indication of trading intent on behalf of any fund.
1
Table of Contents
THE CONSUMER DISCRETIONARY SELECT SECTOR SPDR FUND —
PERFORMANCE SUMMARY (UNAUDITED)
The following performance chart of the Fund’s total return at net asset value, the total return based on market price and its benchmark index is provided for comparative purposes only and represents the periods noted. The Fund’s per share net asset value (“NAV”) is the value of one share of the Fund and is calculated by dividing the value of total assets less total liabilities by the number of shares outstanding. The NAV return is based on the NAV of the Fund and the market return is based on the market price per share of the Fund. The market price used to calculate the market return is determined by using the midpoint between the highest bid and the lowest offer on the exchange on which the shares of the Fund are listed for trading, as of the time that the Fund’s NAV is calculated. NAV and market returns assume that dividends and capital gain distributions have been reinvested in the Fund at NAV. Market returns do not include brokerage commissions that may be payable by an investor in the Fund on secondary market transactions. If brokerage commissions were included, market returns would be lower.
An index is a statistical measure of a specified financial market or sector. An index does not actually hold a portfolio of securities and therefore does not reflect deductions for fees or expenses. In comparison, the Fund’s performance is negatively impacted by these deductions.
Performance quoted represents past performance and past performance does not guarantee future results. Current performance may be higher or lower than the performance quoted. For the most recent month end performance information visit www.sectorspdrs.com. Investment in the Fund poses investment risk including the possible loss of principal. The investment return and principal value of an investment will fluctuate, so that shares, when redeemed, may be worth more or less than their original cost. The returns do not reflect the deduction of taxes that a shareholder would pay on Fund distributions or on the redemption or sale of Fund shares. The total expense ratio for The Consumer Discretionary Select Sector SPDR Fund as stated in the Fees and Expenses table of the prospectus dated January 31, 2017, as supplemented, is 0.14%. Fund returns at Net Asset Value shown in the table below for Five years and Ten years reflect the impact of a fee waiver and without this waiver returns would have been lower.
PERFORMANCE AS OF SEPTEMBER 30, 2017
| CUMULATIVE TOTAL RETURN | AVERAGE ANNUAL TOTAL RETURN | |||||||||||||||||||||||||||||||||||||
| NET ASSET VALUE | MARKET VALUE | CONSUMER DISCRETIONARY SELECT SECTOR INDEX* | S&P 500 INDEX | NET ASSET VALUE | MARKET VALUE | CONSUMER DISCRETIONARY SELECT SECTOR INDEX* | S&P 500 INDEX** | |||||||||||||||||||||||||||||||
| ONE YEAR | 14.34% | 14.29% | 14.52% | 18.61% | 14.34% | 14.29% | 14.52% | 18.61% | ||||||||||||||||||||||||||||||
| FIVE YEARS | 107.52% | 107.47% | 109.40% | 94.44% | 15.72% | 15.71% | 15.93% | 14.22% | ||||||||||||||||||||||||||||||
| TEN YEARS | 186.87% | 187.33% | 191.52% | 104.88% | 11.11% | 11.13% | 11.29% | 7.44% | ||||||||||||||||||||||||||||||
| * | The Consumer Discretionary Select Sector Index is intended to give investors an efficient, modified market capitalization-based way to track the movements of certain public companies that are components of the S&P 500 and are involved in the development and production of consumer discretionary products. |
| ** | The S&P 500 Index includes five hundred (500) selected companies, all of which are listed on national stock exchanges and spans over 25 separate industry groups. |
2
Table of Contents
THE CONSUMER DISCRETIONARY SELECT SECTOR SPDR FUND —
PERFORMANCE SUMMARY (UNAUDITED) (CONTINUED)
COMPARISON OF CHANGE IN VALUE OF A $10,000 INVESTMENT (BASED ON NET ASSET VALUE)
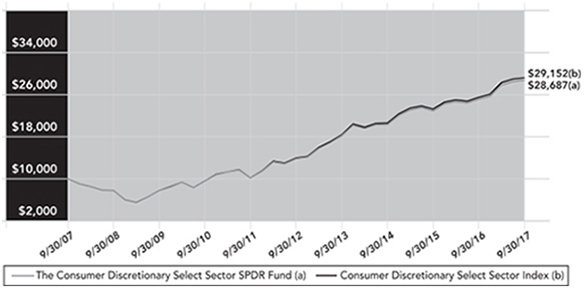
Past performance is no guarantee of future results.
Index returns are unmanaged and do not reflect the deduction of any fees or expenses. Index returns reflect all items of income, gain and loss and the reinvestment of dividends and other income.
Line graph is based on cumulative total return.
3
Table of Contents
THE CONSUMER DISCRETIONARY SELECT SECTOR SPDR FUND —
PORTFOLIO SUMMARY (UNAUDITED)
TOP FIVE HOLDINGS AS OF SEPTEMBER 30, 2017
| \ | DESCRIPTION | AMAZON.COM, INC. | HOME DEPOT, INC. | COMCAST CORP. CLASS A | WALT DISNEY CO. | MCDONALD’S CORP. | TOTAL | |||||||||
| MARKET VALUE | $1,721,987,424 | 866,081,276 | 813,102,564 | 683,617,252 | 570,098,668 | 4,654,887,184 | ||||||||||
| % OF NET ASSETS | 14.9 | 7.5 | 7.1 | 5.9 | 4.9 | 40.3 | ||||||||||
(The five largest holdings are subject to change, and there are no guarantees the Fund will continue to remain invested in any particular company.)
INDUSTRY BREAKDOWN AS OF SEPTEMBER 30, 2017*
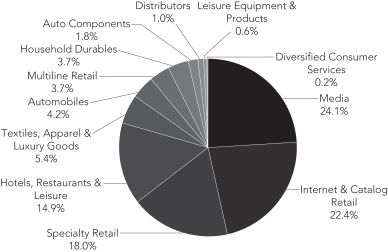
| * | The Fund’s industry breakdown is expressed as a percentage of total common stock and may change over time. |
4
Table of Contents
THE CONSUMER STAPLES SELECT SECTOR SPDR FUND —
MANAGEMENT’S DISCUSSIONOF FUND PERFORMANCE (UNAUDITED)
The Consumer Staples Select Sector SPDR Fund (the “Fund”) seeks to provide investment results that, before expenses, correspond generally to the price and yield performance of publicly traded equity securities of companies in the Consumer Staples Select Sector Index. The Fund’s benchmark is the Consumer Staples Select Sector Index (the “Index”).
For the 12-month period ended September 30, 2017 (the “Reporting Period”), the total return for the Fund was 4.21%, and for the Index was 4.32%. The Fund and Index returns reflect the reinvestment of dividends and other income. The Fund’s performance reflects the expenses of managing the Fund, including brokerage and advisory expenses. The Index is unmanaged and Index returns do not reflect fees and expenses of any kind, which would have a negative impact on returns. Fund expenses contributed to the difference between the Fund’s performance and that of the Index.
The stock market rose sharply in November 2016 following President Trump’s unexpected victory in the U.S. election. However, consumer staples companies did not initially participate in this post-election rally as investors shifted out of defensive sectors and into better growth opportunities. A strengthening dollar and the fear that the new administration would bring more protectionist policies came about as the President threatened to exit the North American Free Trade Agreement (NAFTA) and Trans Pacific Partnership (TPP). These all served as headwinds to the staples sector. However, the hope that tax cuts and a roll back of regulations would help to spur consumer spending led to staples stocks keeping pace with the continued stock market ascent during the first two calendar quarters of 2017. Unfortunately, as the fiscal year started drawing toward a close, many stocks in the sector reported dismal earnings in July along with downward revisions to their outlooks. Contributing factors included stiff competition, price wars, and wage pressures they faced as the economy drew closer to full employment all leading to strained margins. As a result, the consumer staples sector lagged the overall S&P 500 Index by over 5.6% for the quarter ending September 30, 2017 and trailed by nearly 14.3% for the full fiscal year period.
The Fund did not invest in derivatives during the Reporting Period.
On an individual security level, the top positive contributors to the Fund’s performance were Philip Morris International Inc., Reynolds American Inc. and Coca-Cola Company. The top negative contributors to the Fund’s performance were General Mills, Inc., CVS Health Corporation, and Kroger Co.
The views expressed above reflect those of the Fund’s portfolio manager only through the Reporting Period, and do not necessarily represent the views of the Adviser as a whole. Any such views are subject to change at any time based upon market or other conditions and the Adviser disclaims any responsibility to update such views. These views may not be relied on as investment advice and, because investment decisions for a fund are based on numerous factors, may not be relied on as an indication of trading intent on behalf of any fund.
5
Table of Contents
THE CONSUMER STAPLES SELECT SECTOR SPDR FUND —
PERFORMANCE SUMMARY (UNAUDITED)
The following performance chart of the Fund’s total return at net asset value, the total return based on market price and its benchmark index is provided for comparative purposes only and represents the periods noted. The Fund’s per share net asset value (“NAV”) is the value of one share of the Fund and is calculated by dividing the value of total assets less total liabilities by the number of shares outstanding. The NAV return is based on the NAV of the Fund and the market return is based on the market price per share of the Fund. The market price used to calculate the market return is determined by using the midpoint between the highest bid and the lowest offer on the exchange on which the shares of the Fund are listed for trading, as of the time that the Fund’s NAV is calculated. NAV and market returns assume that dividends and capital gain distributions have been reinvested in the Fund at NAV. Market returns do not include brokerage commissions that may be payable by an investor in the Fund on secondary market transactions. If brokerage commissions were included, market returns would be lower.
An index is a statistical measure of a specified financial market or sector. An index does not actually hold a portfolio of securities and therefore does not reflect deductions for fees or expenses. In comparison, the Fund’s performance is negatively impacted by these deductions.
Performance quoted represents past performance and past performance does not guarantee future results. Current performance may be higher or lower than the performance quoted. For the most recent month end performance information visit www.sectorspdrs.com. Investment in the Fund poses investment risk including the possible loss of principal. The investment return and principal value of an investment will fluctuate, so that shares, when redeemed, may be worth more or less than their original cost. The returns do not reflect the deduction of taxes that a shareholder would pay on Fund distributions or on the redemption or sale of Fund shares. The total expense ratio for The Consumer Staples Select Sector SPDR Fund as stated in the Fees and Expenses table of the prospectus dated January 31, 2017, as supplemented, is 0.14%. Fund returns at Net Asset Value shown in the table below for Five years and Ten years reflect the impact of a fee waiver and without this waiver returns would have been lower.
PERFORMANCE AS OF SEPTEMBER 30, 2017
| CUMULATIVE TOTAL RETURN | AVERAGE ANNUAL TOTAL RETURN | |||||||||||||||||||||||||||||||||||
| NET ASSET VALUE | MARKET VALUE | CONSUMER STAPLES SELECT SECTOR INDEX* | S&P 500 INDEX | NET ASSET VALUE | MARKET VALUE | CONSUMER STAPLES SELECT SECTOR INDEX* | S&P 500 INDEX** | |||||||||||||||||||||||||||||
| ONE YEAR | 4.21% | 4.21% | 4.32% | 18.61% | 4.21% | 4.21% | 4.32% | 18.61% | ||||||||||||||||||||||||||||
| FIVE YEARS | 71.94% | 71.93% | 73.51% | 94.44% | 11.45% | 11.45% | 11.65% | 14.22% | ||||||||||||||||||||||||||||
| TEN YEARS | 152.19% | 152.18% | 156.99% | 104.88% | 9.69% | 9.69% | 9.90% | 7.44% | ||||||||||||||||||||||||||||
| * | The Consumer Staples Select Sector Index is intended to give investors an efficient, modified market capitalization-based way to track the movements of certain public companies that are components of the S&P 500 and are involved in the development and production of consumer products. |
| ** | The S&P 500 Index includes five hundred (500) selected companies, all of which are listed on national stock exchanges and spans over 25 separate industry groups. |
6
Table of Contents
THE CONSUMER STAPLES SELECT SECTOR SPDR FUND —
PERFORMANCE SUMMARY (UNAUDITED) (CONTINUED)
COMPARISON OF CHANGE IN VALUE OF A $10,000 INVESTMENT (BASED ON NET ASSET VALUE)
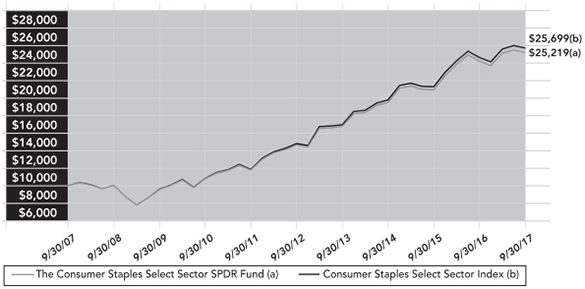
Past performance is no guarantee of future results.
Index returns are unmanaged and do not reflect the deduction of any fees or expenses. Index returns reflect all items of income, gain and loss and the reinvestment of dividends and other income.
Line graph is based on cumulative total return.
7
Table of Contents
THE CONSUMER STAPLES SELECT SECTOR SPDR FUND —
PORTFOLIO SUMMARY (UNAUDITED)
TOP FIVE HOLDINGS AS OF SEPTEMBER 30, 2017
| DESCRIPTION | PROCTER & GAMBLE CO. | COCA-COLA CO. | PHILIP MORRIS INTERNATIONAL, INC. | PEPSICO, INC. | ALTRIA GROUP, INC. | TOTAL | ||||||||||
| MARKET VALUE | $1,145,814,948 | 853,326,946 | 851,471,677 | 786,341,564 | 601,225,596 | 4,238,180,731 | ||||||||||
| % OF NET ASSETS | 13.0 | 9.7 | 9.7 | 8.9 | 6.8 | 48.1 | ||||||||||
(The five largest holdings are subject to change, and there are no guarantees the Fund will continue to remain invested in any particular company.)
INDUSTRY BREAKDOWN AS OF SEPTEMBER 30, 2017*
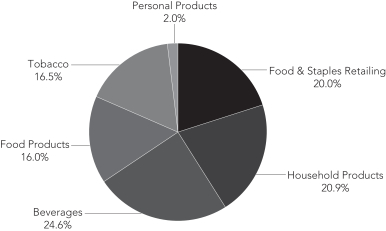
| * | The Fund’s industry breakdown is expressed as a percentage of total common stock and may change over time. |
8
Table of Contents
THE ENERGY SELECT SECTOR SPDR FUND —
MANAGEMENT’S DISCUSSIONOF FUND PERFORMANCE (UNAUDITED)
The Energy Select Sector SPDR Fund (the “Fund”) seeks to provide investment results that, before expenses, correspond generally to the price and yield performance of publicly traded equity securities of companies in the Energy Select Sector Index. The Fund’s benchmark is the Energy Select Sector Index (the “Index”).
For the 12-month period ended September 30, 2017 (the “Reporting Period”), the total return for the Fund was –0.01%, and for the Index was 0.19%. The Fund and Index returns reflect the reinvestment of dividends and other income. The Fund’s performance reflects the expenses of managing the Fund, including brokerage and advisory expenses. The Index is unmanaged and Index returns do not reflect fees and expenses of any kind, which would have a negative impact on returns. Fund expenses and cash drag contributed to the difference between the Fund’s performance and that of the Index.
The energy sector finished off a strong calendar year 2016 (+28%) by climbing an additional 7.2% in the quarter ended December 31, 2016. This occurred largely due to the members of OPEC, along with certain non-OPEC countries, reaching an agreement on oil production cuts which lead to a surge in prices. This coupled with expectations of rising interest rates, an environment that typically bodes well for energy stocks, made this sector a particularly good investment during the three month period. Things did not go quite as well during the first half of calendar year 2017 though as energy stocks trailed the overall market by an astounding 22% over the first six months of the year. The aforementioned agreement to cut production failed to reduce the huge stockpiles of oil around the world as output from countries exempt from the agreement, such as the United States, Nigeria and Libya, continued to cause an increase in overall supply. This led to crude prices dropping nearly 21% after reaching a high in February of about $43 per barrel. But just as all seemed bleak, the volatile ride for energy stocks continued into the 3rd calendar quarter of 2017 as the sector jumped 7% and finished the fiscal year 2017 essentially flat. Reasons for the rebound included a bounce back in crude prices of nearly 20% driven by optimism that growing demand would soak up some of the oversupply. In addition, low levels in the US Strategic Petroleum Reserve inventory, a peak in rig counts, and record U.S. oil and gas exports helped to light a spark in energy stocks to end the period.
The Fund did not invest in derivatives during the Reporting Period.
On an individual security level, the top positive contributors to the Fund’s performance were Chevron Corporation, Valero Energy Corporation, and Marathon Petroleum Corporation. The top negative contributors to the Fund’s performance were Pioneer Natural Resources Company, Anadarko Petroleum Corporation, and Schlumberger, Ltd.
The views expressed above reflect those of the Fund’s portfolio manager only through the Reporting Period, and do not necessarily represent the views of the Adviser as a whole. Any such views are subject to change at any time based upon market or other conditions and the Adviser disclaims any responsibility to update such views. These views may not be relied on as investment advice and, because investment decisions for a fund are based on numerous factors, may not be relied on as an indication of trading intent on behalf of any fund.
9
Table of Contents
THE ENERGY SELECT SECTOR SPDR FUND —
PERFORMANCE SUMMARY (UNAUDITED)
The following performance chart of the Fund’s total return at net asset value, the total return based on market price and its benchmark index is provided for comparative purposes only and represents the periods noted. The Fund’s per share net asset value (“NAV”) is the value of one share of the Fund and is calculated by dividing the value of total assets less total liabilities by the number of shares outstanding. The NAV return is based on the NAV of the Fund and the market return is based on the market price per share of the Fund. The market price used to calculate the market return is determined by using the midpoint between the highest bid and the lowest offer on the exchange on which the shares of the Fund are listed for trading, as of the time that the Fund’s NAV is calculated. NAV and market returns assume that dividends and capital gain distributions have been reinvested in the Fund at NAV. Market returns do not include brokerage commissions that may be payable by an investor in the Fund on secondary market transactions. If brokerage commissions were included, market returns would be lower.
An index is a statistical measure of a specified financial market or sector. An index does not actually hold a portfolio of securities and therefore does not reflect deductions for fees or expenses. In comparison, the Fund’s performance is negatively impacted by these deductions.
Performance quoted represents past performance and past performance does not guarantee future results. Current performance may be higher or lower than the performance quoted. For the most recent month end performance information visit www.sectorspdrs.com. Investment in the Fund poses investment risk including the possible loss of principal. The investment return and principal value of an investment will fluctuate, so that shares, when redeemed, may be worth more or less than their original cost. The returns do not reflect the deduction of taxes that a shareholder would pay on Fund distributions or on the redemption or sale of Fund shares. The total expense ratio for The Energy Select Sector SPDR Fund as stated in the Fees and Expenses table of the prospectus dated January 31, 2017, as supplemented, is 0.14%. Fund returns at Net Asset Value shown in the table below for Five years and Ten years reflect the impact of a fee waiver and without this waiver returns would have been lower.
PERFORMANCE AS OF SEPTEMBER 30, 2017
| CUMULATIVE TOTAL RETURN | AVERAGE ANNUAL TOTAL RETURN | |||||||||||||||||||||||||||||||||||||
| NET ASSET VALUE | MARKET VALUE | ENERGY SELECT SECTOR INDEX* | S&P 500 INDEX | NET ASSET VALUE | MARKET VALUE | ENERGY SELECT SECTOR INDEX* | S&P 500 INDEX** | |||||||||||||||||||||||||||||||
| ONE YEAR | –0.01% | –0.01% | 0.19% | 18.61% | – | 0.01% | – | 0.01% | 0.19% | 18.61% | ||||||||||||||||||||||||||||
| FIVE YEARS | 5.68% | 5.74% | 6.29% | 94.44% | 1.11% | 1.12% | 1.23% | 14.22% | ||||||||||||||||||||||||||||||
| TEN YEARS | 12.42% | 12.56% | 14.08% | 104.88% | 1.18% | 1.19% | 1.33% | 7.44% | ||||||||||||||||||||||||||||||
| * | The Energy Select Sector Index is intended to give investors an efficient, modified market capitalization-based way to track the movements of certain public companies that are components of the S&P 500 and are involved in the development and production of energy products. |
| ** | The S&P 500 Index includes five hundred (500) selected companies, all of which are listed on national stock exchanges and spans over 25 separate industry groups. |
10
Table of Contents
THE ENERGY SELECT SECTOR SPDR FUND —
PERFORMANCE SUMMARY (UNAUDITED) (CONTINUED)
COMPARISON OF CHANGE IN VALUE OF A $10,000 INVESTMENT (BASED ON NET ASSET VALUE)
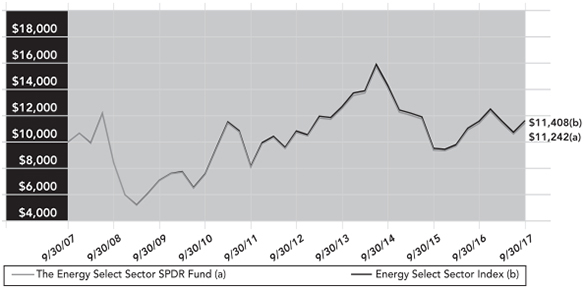
Past performance is no guarantee of future results.
Index returns are unmanaged and do not reflect the deduction of any fees or expenses. Index returns reflect all items of income, gain and loss and the reinvestment of dividends and other income.
Line graph is based on cumulative total return.
11
Table of Contents
THE ENERGY SELECT SECTOR SPDR FUND —
PORTFOLIO SUMMARY (UNAUDITED)
TOP FIVE HOLDINGS AS OF SEPTEMBER 30, 2017
| DESCRIPTION | EXXON MOBIL CORP. | CHEVRON CORP. | SCHLUMBERGER, LTD. | CONOCOPHILLIPS | EOG RESOURCES, INC. | TOTAL | ||||||||||
| MARKET VALUE | $3,840,419,750 | 2,829,671,778 | 1,241,971,951 | 786,828,993 | 723,055,075 | 9,421,947,547 | ||||||||||
| % OF NET ASSETS | 23.1 | 17.0 | 7.5 | 4.7 | 4.4 | 56.7 | ||||||||||
(The five largest holdings are subject to change, and there are no guarantees the Fund will continue to remain invested in any particular company.)
INDUSTRY BREAKDOWN AS OF SEPTEMBER 30, 2017*
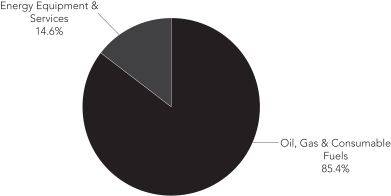
| * | The Fund’s industry breakdown is expressed as a percentage of total common stock and may change over time. |
12
Table of Contents
THE FINANCIAL SELECT SECTOR SPDR FUND —
MANAGEMENT’S DISCUSSIONOF FUND PERFORMANCE (UNAUDITED)
The Financial Select Sector SPDR Fund (the “Fund”) seeks to provide investment results that, before expenses, correspond generally to the price and yield performance of publicly traded equity securities of companies in the Financial Select Sector Index. The Fund’s benchmark is the Financial Select Sector Index (the “Index”).
For the 12-month period ended September 30, 2017 (the “Reporting Period”), the total return for the Fund was 36.01%, and for the Index was 36.21%. The Fund and Index returns reflect the reinvestment of dividends and other income. The Fund’s performance reflects the expenses of managing the Fund, including brokerage and advisory expenses. The Index is unmanaged and Index returns do not reflect fees and expenses of any kind, which would have a negative impact on returns. Fund expenses, income from securities lending, cash drag, trading costs, corporate actions and slight variations between the Fund’s holdings and Index constituents contributed to the difference between the Fund’s performance and that of the Index.
Financials showed significant strength in the beginning of the fiscal year on a much more hawkish interest rate outlook and a sharp steepening in yield curves. Financials were also perceived to benefit from a more benign regulatory environment envisaged under the incoming Trump administration. As the first half came to a close there were signs of hesitation in some of the strong trends that marked the first half, but a firming of expectations for a Fed rate hike in December 2017 benefitted the sector as the fiscal year came to an end.
The Fund did not invest in derivatives during the Reporting Period.
On an individual security level, the top positive contributors to the Fund’s performance were JPMorgan Chase & Co., Bank of America Corporation, and Citigroup Inc. The top negative contributors to the Fund’s performance were Brighthouse Financial, Inc., Legg Mason, Inc., and Everest Re Group, Ltd.
The views expressed above reflect those of the Fund’s portfolio manager only through the Reporting Period, and do not necessarily represent the views of the Adviser as a whole. Any such views are subject to change at any time based upon market or other conditions and the Adviser disclaims any responsibility to update such views. These views may not be relied on as investment advice and, because investment decisions for a fund are based on numerous factors, may not be relied on as an indication of trading intent on behalf of any fund.
13
Table of Contents
THE FINANCIAL SELECT SECTOR SPDR FUND —
PERFORMANCE SUMMARY (UNAUDITED)
The following performance chart of the Fund’s total return at net asset value, the total return based on market price and its benchmark index is provided for comparative purposes only and represents the periods noted. The Fund’s per share net asset value (“NAV”) is the value of one share of the Fund and is calculated by dividing the value of total assets less total liabilities by the number of shares outstanding. The NAV return is based on the NAV of the Fund and the market return is based on the market price per share of the Fund. The market price used to calculate the market return is determined by using the midpoint between the highest bid and the lowest offer on the exchange on which the shares of the Fund are listed for trading, as of the time that the Fund’s NAV is calculated. NAV and market returns assume that dividends and capital gain distributions have been reinvested in the Fund at NAV. Market returns do not include brokerage commissions that may be payable by an investor in the Fund on secondary market transactions. If brokerage commissions were included, market returns would be lower.
An index is a statistical measure of a specified financial market or sector. An index does not actually hold a portfolio of securities and therefore does not reflect deductions for fees or expenses. In comparison, the Fund’s performance is negatively impacted by these deductions.
Performance quoted represents past performance and past performance does not guarantee future results. Current performance may be higher or lower than the performance quoted. For the most recent month end performance information visit www.sectorspdrs.com. Investment in the Fund poses investment risk including the possible loss of principal. The investment return and principal value of an investment will fluctuate, so that shares, when redeemed, may be worth more or less than their original cost. The returns do not reflect the deduction of taxes that a shareholder would pay on Fund distributions or on the redemption or sale of Fund shares. The total expense ratio for The Financial Select Sector SPDR Fund as stated in the Fees and Expenses table of the prospectus dated January 31, 2017, as supplemented, is 0.14%. Fund returns at Net Asset Value shown in the table below for Five years and Ten years reflect the impact of a fee waiver and without this waiver returns would have been lower.
PERFORMANCE AS OF SEPTEMBER 30, 2017
| CUMULATIVE TOTAL RETURN | AVERAGE ANNUAL TOTAL RETURN | |||||||||||||||||||||||||||||||||||||
| NET ASSET VALUE | MARKET VALUE | FINANCIAL SELECT SECTOR INDEX* | S&P 500 INDEX | NET ASSET VALUE | MARKET VALUE | FINANCIAL SELECT SECTOR INDEX* | S&P 500 INDEX** | |||||||||||||||||||||||||||||||
| ONE YEAR | 36.01% | 35.97% | 36.21% | 18.61% | 36.01% | 35.97% | 36.21% | 18.61% | ||||||||||||||||||||||||||||||
| FIVE YEARS | 123.62% | 123.62% | 125.10% | 94.44% | 17.46% | 17.46% | 17.62% | 14.22% | ||||||||||||||||||||||||||||||
| TEN YEARS | 13.58% | 13.76% | 14.43% | 104.88% | 1.28% | 1.30% | 1.36% | 7.44% | ||||||||||||||||||||||||||||||
| * | The Financial Select Sector Index is intended to give investors an efficient, modified market capitalization-based way to track the movements of certain public companies that are components of the S&P 500 and are involved in the development and production of financial products. |
| ** | The S&P 500 Index includes five hundred (500) selected companies, all of which are listed on national stock exchanges and spans over 25 separate industry groups. |
14
Table of Contents
THE FINANCIAL SELECT SECTOR SPDR FUND —
PERFORMANCE SUMMARY (UNAUDITED) (CONTINUED)
COMPARISON OF CHANGE IN VALUE OF A $10,000 INVESTMENT (BASED ON NET ASSET VALUE)
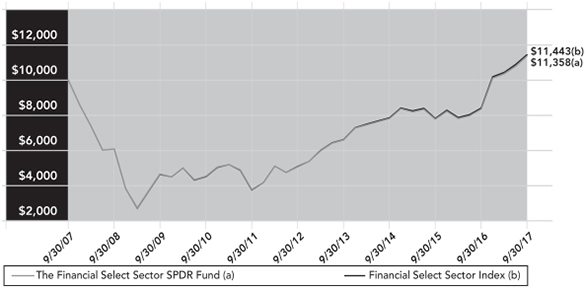
Past performance is no guarantee of future results.
Index returns are unmanaged and do not reflect the deduction of any fees or expenses. Index returns reflect all items of income, gain and loss and the reinvestment of dividends and other income.
Line graph is based on cumulative total return.
15
Table of Contents
THE FINANCIAL SELECT SECTOR SPDR FUND —
PORTFOLIO SUMMARY (UNAUDITED)
TOP FIVE HOLDINGS AS OF SEPTEMBER 30, 2017
| DESCRIPTION | BERKSHIRE HATHAWAY, INC. CLASS B | JPMORGAN CHASE & CO. | BANK OF AMERICA CORP. | WELLS FARGO & CO. | CITIGROUP, INC. | TOTAL | ||||||||||
| MARKET VALUE | $3,063,208,822 | 2,918,668,505 | 2,159,134,889 | 2,139,594,050 | 1,720,998,649 | 12,001,604,915 | ||||||||||
| % OF NET ASSETS | 11.2 | 10.6 | 7.9 | 7.8 | 6.3 | 43.8 | ||||||||||
(The five largest holdings are subject to change, and there are no guarantees the Fund will continue to remain invested in any particular company.)
INDUSTRY BREAKDOWN AS OF SEPTEMBER 30, 2017*
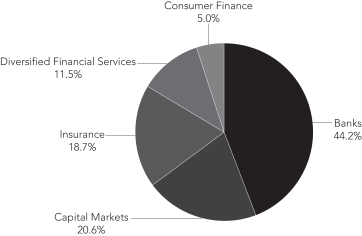
| * | The Fund’s industry breakdown is expressed as a percentage of total common stock and may change over time. |
16
Table of Contents
THE HEALTH CARE SELECT SECTOR SPDR FUND —
MANAGEMENT’S DISCUSSIONOF FUND PERFORMANCE (UNAUDITED)
The Health Care Select Sector SPDR Fund (the “Fund”) seeks to provide investment results that, before expenses, correspond generally to the price and yield performance of publicly traded equity securities of companies in the Health Care Select Sector Index. The Fund’s benchmark is the Health Care Select Sector Index (the “Index”).
For the 12-month period ended September 30, 2017 (the “Reporting Period”), the total return for the Fund was 15.21%, and for the Index was 15.41%. The Fund and Index returns reflect the reinvestment of dividends and other income. The Fund’s performance reflects the expenses of managing the Fund, including brokerage and advisory expenses. The Index is unmanaged and Index returns do not reflect fees and expenses of any kind, which would have a negative impact on returns. Fund expenses, cumulative security misweights and the Fund’s cash position contributed to the difference between the Fund’s performance and that of the Index.
One factor that contributed to this Fund’s return over the Reporting Period revolved around the continued heightened government scrutiny of pharmaceutical pricing. While this has had a negative impact on many of the constituents of this Fund, it has had a more significant impact in general on Biotech stock prices. Also, negatively impacting a number of the Fund’s constituents has been the increased efforts by parts of the government towards repealing the Affordable Care Act. In addition to the repeal efforts, there have been a host of other challenges associated with the Affordable Care Act that have impacted this Fund’s constituents. These have ranged from slowing subscriber growth, ongoing legal challenges, profitability issues and reduced participation in exchanges by a number of insurers in this marketplace. Conversely, increased demand expectations associated with the ongoing aging of the American population is anticipated to lead to continuing growth in the medical products, pharmaceuticals and medical services markets.
The Fund did not invest in derivatives during the Reporting Period.
On an individual security level, the top positive contributors to the Fund’s performance were UnitedHealth Group Incorporated, Johnson & Johnson, and AbbVie, Inc. The top negative contributors to the Fund’s performance were Express Scripts Holding Company, Allergan plc, and Medtronic plc.
The views expressed above reflect those of the Fund’s portfolio manager only through the Reporting Period, and do not necessarily represent the views of the Adviser as a whole. Any such views are subject to change at any time based upon market or other conditions and the Adviser disclaims any responsibility to update such views. These views may not be relied on as investment advice and, because investment decisions for a fund are based on numerous factors, may not be relied on as an indication of trading intent on behalf of any fund.
17
Table of Contents
THE HEALTH CARE SELECT SECTOR SPDR FUND —
PERFORMANCE SUMMARY (UNAUDITED)
The following performance chart of the Fund’s total return at net asset value, the total return based on market price and its benchmark index is provided for comparative purposes only and represents the periods noted. The Fund’s per share net asset value (“NAV”) is the value of one share of the Fund and is calculated by dividing the value of total assets less total liabilities by the number of shares outstanding. The NAV return is based on the NAV of the Fund and the market return is based on the market price per share of the Fund. The market price used to calculate the market return is determined by using the midpoint between the highest bid and the lowest offer on the exchange on which the shares of the Fund are listed for trading, as of the time that the Fund’s NAV is calculated. NAV and market returns assume that dividends and capital gain distributions have been reinvested in the Fund at NAV. Market returns do not include brokerage commissions that may be payable by an investor in the Fund on secondary market transactions. If brokerage commissions were included, market returns would be lower.
An index is a statistical measure of a specified financial market or sector. An index does not actually hold a portfolio of securities and therefore does not reflect deductions for fees or expenses. In comparison, the Fund’s performance is negatively impacted by these deductions.
Performance quoted represents past performance and past performance does not guarantee future results. Current performance may be higher or lower than the performance quoted. For the most recent month end performance information visit www.sectorspdrs.com. Investment in the Fund poses investment risk including the possible loss of principal. The investment return and principal value of an investment will fluctuate, so that shares, when redeemed, may be worth more or less than their original cost. The returns do not reflect the deduction of taxes that a shareholder would pay on Fund distributions or on the redemption or sale of Fund shares. The total expense ratio for The Health Care Select Sector SPDR Fund as stated in the Fees and Expenses table of the prospectus dated January 31, 2017, as supplemented, is 0.14%. Fund returns at Net Asset Value shown in the table below for Five years and Ten years reflect the impact of a fee waiver and without this waiver returns would have been lower.
PERFORMANCE AS OF SEPTEMBER 30, 2017
| CUMULATIVE TOTAL RETURN | AVERAGE ANNUAL TOTAL RETURN | |||||||||||||||||||||||||||||||||||||
| NET ASSET VALUE | MARKET VALUE | HEALTH CARE SELECT SECTOR INDEX* | S&P 500 INDEX | NET ASSET VALUE | MARKET VALUE | HEALTH CARE SELECT SECTOR INDEX* | S&P 500 INDEX** | |||||||||||||||||||||||||||||||
| ONE YEAR | 15.21% | 15.19% | 15.41% | 18.61% | 15.21% | 15.19% | 15.41% | 18.61% | ||||||||||||||||||||||||||||||
| FIVE YEARS | 120.41% | 120.45% | 122.27% | 94.44% | 17.12% | 17.13% | 17.32% | 14.22% | ||||||||||||||||||||||||||||||
| TEN YEARS | 175.57% | 175.98% | 180.31% | 104.88% | 10.67% | 10.68% | 10.86% | 7.44% | ||||||||||||||||||||||||||||||
| * | The Health Care Select Sector Index is intended to give investors an efficient, modified market capitalization-based way to track the movements of certain public companies that are components of the S&P 500 and are health care related firms. |
| ** | The S&P 500 Index includes five hundred (500) selected companies, all of which are listed on national stock exchanges and spans over 25 separate industry groups. |
18
Table of Contents
THE HEALTH CARE SELECT SECTOR SPDR FUND —
PERFORMANCE SUMMARY (UNAUDITED) (CONTINUED)
COMPARISON OF CHANGE IN VALUE OF A $10,000 INVESTMENT (BASED ON NET ASSET VALUE)
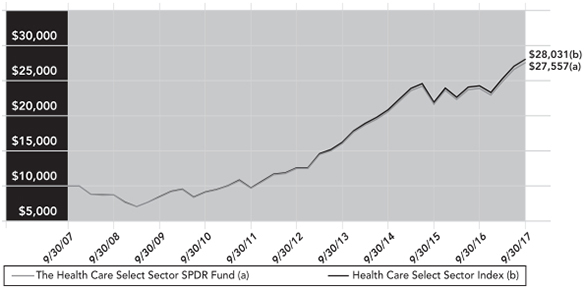
Past performance is no guarantee of future results.
Index returns are unmanaged and do not reflect the deduction of any fees or expenses. Index returns reflect all items of income, gain and loss and the reinvestment of dividends and other income.
Line graph is based on cumulative total return.
19
Table of Contents
THE HEALTH CARE SELECT SECTOR SPDR FUND —
PORTFOLIO SUMMARY (UNAUDITED)
TOP FIVE HOLDINGS AS OF SEPTEMBER 30, 2017
| DESCRIPTION | JOHNSON & JOHNSON | PFIZER, INC. | UNITEDHEALTH GROUP, INC. | MERCK & CO., INC. | ABBVIE, INC. | TOTAL | ||||||||||
| MARKET VALUE | $1,964,988,431 | 1,199,778,325 | 1,075,137,768 | 986,240,580 | 797,814,493 | 6,023,959,597 | ||||||||||
| % OF NET ASSETS | 11.1 | 6.8 | 6.1 | 5.6 | 4.5 | 34.1 | ||||||||||
| �� |
(The five largest holdings are subject to change, and there are no guarantees the Fund will continue to remain invested in any particular company.)
INDUSTRY BREAKDOWN AS OF SEPTEMBER 30, 2017*
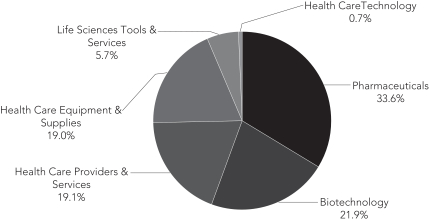
| * | The Fund’s industry breakdown is expressed as a percentage of total common stock and may change over time. |
20
Table of Contents
THE INDUSTRIAL SELECT SECTOR SPDR FUND —
MANAGEMENT’S DISCUSSIONOF FUND PERFORMANCE (UNAUDITED)
The Industrial Select Sector SPDR Fund (the “Fund”) seeks to provide investment results that, before expenses, correspond generally to the price and yield performance of publicly traded equity securities of companies in the Industrial Select Sector Index. The Fund’s benchmark is the Industrial Select Sector Index (the “Index”).
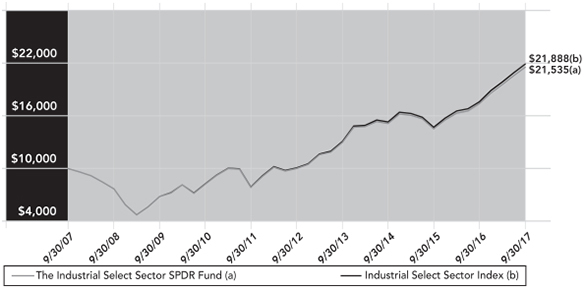
For the 12-month period ended September 30, 2017 (the “Reporting Period”), the total return for the Fund was 24.03%, and for the Index was 24.29%. The Fund and Index returns reflect the reinvestment of dividends and other income. The Fund’s performance reflects the expenses of managing the Fund, including brokerage and advisory expenses. The Index is unmanaged and Index returns do not reflect fees and expenses of any kind, which would have a negative impact on returns. Fund expenses, a slight cash drag, and security misweights contributed to the difference between the Fund’s performance and that of the Index.
The performance of the industrial sector bested the performance of the broader market over the past twelve months. The U.S. Presidential election late last year spurred equities on a significant run as hopeful investors looked ahead to the positive economic growth the new president and his administration might bring. With geopolitical tensions rising between the United States and North Korea, Aerospace and Defense companies have had a particularly strong Reporting Period. Airline stocks also had solid performance over the last year as energy prices have stabilized a bit and passenger traffic continued to increase. Road and railroad traffic increased as well which helped Rail and Logistics companies perform strongly. Machinery companies continued to enjoy solid returns as the demand from mining companies continued at decent levels. Industrial conglomerates did not perform as well as other areas within the Industrials sector, though the group was largely dragged down by the performance of General Electric (GE). GE has languished recently as cash flows and margins have been unfavorable, and efforts to cut costs have not brought the needed relief.
The Fund did not invest in derivatives during the Reporting Period.
On an individual security level, the top positive contributors to the Fund’s performance were Boeing Company, CSX Corporation, and Caterpillar Inc. The top negative contributors to the Fund’s performance were Equifax Inc., Nielsen Holdings Plc, and General Electric Company.
The views expressed above reflect those of the Fund’s portfolio manager only through the Reporting Period, and do not necessarily represent the views of the Adviser as a whole. Any such views are subject to change at any time based upon market or other conditions and the Adviser disclaims any responsibility to update such views. These views may not be relied on as investment advice and, because investment decisions for a fund are based on numerous factors, may not be relied on as an indication of trading intent on behalf of any fund.
21
Table of Contents
THE INDUSTRIAL SELECT SECTOR SPDR FUND —
PERFORMANCE SUMMARY (UNAUDITED)
The following performance chart of the Fund’s total return at net asset value, the total return based on market price and its benchmark index is provided for comparative purposes only and represents the periods noted. The Fund’s per share net asset value (“NAV”) is the value of one share of the Fund and is calculated by dividing the value of total assets less total liabilities by the number of shares outstanding. The NAV return is based on the NAV of the Fund and the market return is based on the market price per share of the Fund. The market price used to calculate the market return is determined by using the midpoint between the highest bid and the lowest offer on the exchange on which the shares of the Fund are listed for trading, as of the time that the Fund’s NAV is calculated. NAV and market returns assume that dividends and capital gain distributions have been reinvested in the Fund at NAV. Market returns do not include brokerage commissions that may be payable by an investor in the Fund on secondary market transactions. If brokerage commissions were included, market returns would be lower.
An index is a statistical measure of a specified financial market or sector. An index does not actually hold a portfolio of securities and therefore does not reflect deductions for fees or expenses. In comparison, the Fund’s performance is negatively impacted by these deductions.
Performance quoted represents past performance and past performance does not guarantee future results. Current performance may be higher or lower than the performance quoted. For the most recent month end performance information visit www.sectorspdrs.com. Investment in the Fund poses investment risk including the possible loss of principal. The investment return and principal value of an investment will fluctuate, so that shares, when redeemed, may be worth more or less than their original cost. The returns do not reflect the deduction of taxes that a shareholder would pay on Fund distributions or on the redemption or sale of Fund shares. The total expense ratio for The Industrial Select Sector SPDR Fund as stated in the Fees and Expenses table of the prospectus dated January 31, 2017, as supplemented, is 0.14%. Fund returns at Net Asset Value shown in the table below for Five years and Ten years reflect the impact of a fee waiver and without this waiver returns would have been lower.
PERFORMANCE AS OF SEPTEMBER 30, 2017
| CUMULATIVE TOTAL RETURN | AVERAGE ANNUAL TOTAL RETURN | |||||||||||||||||||||||||||||||||||||
| NET ASSET VALUE | MARKET VALUE | INDUSTRIAL SELECT SECTOR INDEX* | S&P 500 INDEX | NET ASSET VALUE | MARKET VALUE | INDUSTRIAL SELECT SECTOR INDEX* | S&P 500 INDEX** | |||||||||||||||||||||||||||||||
| ONE YEAR | 24.03% | 24.01% | 24.29% | 18.61% | 24.03% | 24.01% | 24.29% | 18.61% | ||||||||||||||||||||||||||||||
| FIVE YEARS | 115.37% | 115.40% | 117.13% | 94.44% | 16.58% | 16.59% | 16.78% | 14.22% | ||||||||||||||||||||||||||||||
| TEN YEARS | 115.35% | 115.79% | 118.88% | 104.88% | 7.97% | 7.99% | 8.15% | 7.44% | ||||||||||||||||||||||||||||||
| * | The Industrial Select Sector Index is intended to give investors an efficient, modified market capitalization-based way to track the movements of certain public companies that are components of the S&P 500 and are industrials. |
| ** | The S&P 500 Index includes five hundred (500) selected companies, all of which are listed on national stock exchanges and spans over 25 separate industry groups. |
22
Table of Contents
THE INDUSTRIAL SELECT SECTOR SPDR FUND —
PERFORMANCE SUMMARY (UNAUDITED) (CONTINUED)
COMPARISON OF CHANGE IN VALUE OF A $10,000 INVESTMENT (BASED ON NET ASSET VALUE)
Past performance is no guarantee of future results.
Index returns are unmanaged and do not reflect the deduction of any fees or expenses. Index returns reflect all items of income, gain and loss and the reinvestment of dividends and other income.
Line graph is based on cumulative total return.
23
Table of Contents
THE INDUSTRIAL SELECT SECTOR SPDR FUND —
PORTFOLIO SUMMARY (UNAUDITED)
TOP FIVE HOLDINGS AS OF SEPTEMBER 30, 2017
| DESCRIPTION | GENERAL ELECTRIC CO. | BOEING CO. | 3M CO. | HONEYWELL INTERNATIONAL, INC. | UNION PACIFIC CORP. | TOTAL | ||||||||||
| MARKET VALUE | $736,946,990 | 701,218,711 | 610,790,529 | 542,135,515 | 480,239,076 | 3,071,330,821 | ||||||||||
| % OF NET ASSETS | 6.7 | 6.3 | 5.5 | 4.9 | 4.3 | 27.7 | ||||||||||
(The five largest holdings are subject to change, and there are no guarantees the Fund will continue to remain invested in any particular company.)
INDUSTRY BREAKDOWN AS OF SEPTEMBER 30, 2017*
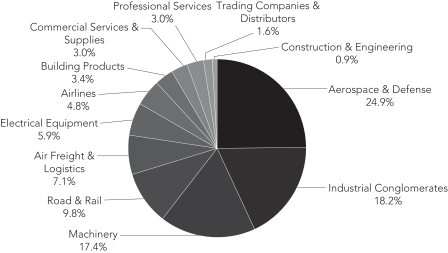
| * | The Fund’s industry breakdown is expressed as a percentage of total common stock and may change over time. |
24
Table of Contents
THE MATERIALS SELECT SECTOR SPDR FUND —
MANAGEMENT’S DISCUSSIONOF FUND PERFORMANCE (UNAUDITED)
The Materials Select Sector SPDR Fund (the “Fund”) seeks to provide investment results that, before expenses, correspond generally to the price and yield performance of publicly traded equity securities of companies in the Materials Select Sector Index (the “Fund”). The Fund’s benchmark is the Materials Select Sector Index (the “Index”).
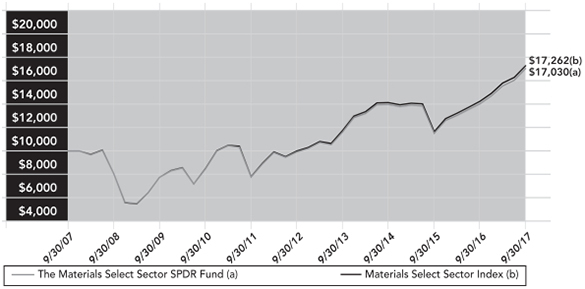
For the 12-month period ended September 30, 2017 (the “Reporting Period”), the total return for the Fund was 21.33%, and for the Index was 21.30%. The Fund and Index returns reflect the reinvestment of dividends and other income. The Fund’s performance reflects the expenses of managing the Fund, including brokerage and advisory expenses. The Index is unmanaged and Index returns do not reflect fees and expenses of any kind, which would have a negative impact on returns. Fund expenses, income from securities lending, cash drag, trading costs, corporate actions, and slight variations between the Fund’s holdings and Index constituents contributed to the difference between the Fund’s performance and that of the Index.
For the Reporting Period, the material sector’s return was above that of the broader S&P 500® Index, which returned 18.61%. Due to its sensitivity to changes in supply and demand of raw materials, the Materials sector was helped by consumer demand. Within the materials sector, the chemicals industry was the strongest performing industry. Despite generating positive performance, the construction materials industry was the weakest performing industry in the sector.
The Fund did not invest in derivatives during the Reporting Period.
On an individual security level, the top positive contributors to the Fund’s performance were Dow Chemical Co., E. I. du Pont de Nemours and Company, and Monsanto Company. The top negative contributors to the Fund’s performance were Sealed Air Corporation, Alcoa Corp., and Newmont Mining Corporation.
The views expressed above reflect those of the Fund’s portfolio manager only through the Reporting Period, and do not necessarily represent the views of the Adviser as a whole. Any such views are subject to change at any time based upon market or other conditions and the Adviser disclaims any responsibility to update such views. These views may not be relied on as investment advice and, because investment decisions for a fund are based on numerous factors, may not be relied on as an indication of trading intent on behalf of any fund.
25
Table of Contents
THE MATERIALS SELECT SECTOR SPDR FUND —
PERFORMANCE SUMMARY (UNAUDITED)
The following performance chart of the Fund’s total return at net asset value, the total return based on market price and its benchmark index is provided for comparative purposes only and represents the periods noted. The Fund’s per share net asset value (“NAV”) is the value of one share of the Fund and is calculated by dividing the value of total assets less total liabilities by the number of shares outstanding. The NAV return is based on the NAV of the Fund and the market return is based on the market price per share of the Fund. The market price used to calculate the market return is determined by using the midpoint between the highest bid and the lowest offer on the exchange on which the shares of the Fund are listed for trading, as of the time that the Fund’s NAV is calculated. NAV and market returns assume that dividends and capital gain distributions have been reinvested in the Fund at NAV. Market returns do not include brokerage commissions that may be payable by an investor in the Fund on secondary market transactions. If brokerage commissions were included, market returns would be lower.
An index is a statistical measure of a specified financial market or sector. An index does not actually hold a portfolio of securities and therefore does not reflect deductions for fees or expenses. In comparison, the Fund’s performance is negatively impacted by these deductions.
Performance quoted represents past performance and past performance does not guarantee future results. Current performance may be higher or lower than the performance quoted. For the most recent month end performance information visit www.sectorspdrs.com. Investment in the Fund poses investment risk including the possible loss of principal. The investment return and principal value of an investment will fluctuate, so that shares, when redeemed, may be worth more or less than their original cost. The returns do not reflect the deduction of taxes that a shareholder would pay on Fund distributions or on the redemption or sale of Fund shares. The total expense ratio for The Materials Select Sector SPDR Fund as stated in the Fees and Expenses table of the prospectus dated January 31, 2017, as supplemented, is 0.14%. Fund returns at Net Asset Value shown in the table below for Five years and Ten years reflect the impact of a fee waiver and without this waiver returns would have been lower.
PERFORMANCE AS OF SEPTEMBER 30, 2017
| CUMULATIVE TOTAL RETURN | AVERAGE ANNUAL TOTAL RETURN | |||||||||||||||||||||||||||||||||||||
| NET ASSET VALUE | MARKET VALUE | MATERIALS SELECT SECTOR INDEX* | S&P 500 INDEX | NET ASSET VALUE | MARKET VALUE | MATERIALS SELECT SECTOR INDEX* | S&P 500 INDEX** | |||||||||||||||||||||||||||||||
| ONE YEAR | 21.33% | 21.29% | 21.30% | 18.61% | 21.33% | 21.29% | 21.30% | 18.61% | ||||||||||||||||||||||||||||||
| FIVE YEARS | 71.73% | 71.77% | 72.97% | 94.44% | 11.42% | 11.43% | 11.58% | 14.22% | ||||||||||||||||||||||||||||||
| TEN YEARS | 70.30% | 70.42% | 72.62% | 104.88% | 5.47% | 5.48% | 5.61% | 7.44% | ||||||||||||||||||||||||||||||
| * | The Materials Select Sector Index is intended to give investors an efficient, modified market capitalization-based way to track the movements of certain public companies that are components of the S&P 500 and are in basic industries. |
| ** | The S&P 500 Index includes five hundred (500) selected companies, all of which are listed on national stock exchanges and spans over 25 separate industry groups. |
26
Table of Contents
THE MATERIALS SELECT SECTOR SPDR FUND —
PERFORMANCE SUMMARY (UNAUDITED) (CONTINUED)
COMPARISON OF CHANGE IN VALUE OF A $10,000 INVESTMENT (BASED ON NET ASSET VALUE)
Past performance is no guarantee of future results.
Index returns are unmanaged and do not reflect the deduction of any fees or expenses. Index returns reflect all items of income, gain and loss and the reinvestment of dividends and other income.
Line graph is based on cumulative total return.
27
Table of Contents
THE MATERIALS SELECT SECTOR SPDR FUND —
PORTFOLIO SUMMARY (UNAUDITED)
TOP FIVE HOLDINGS AS OF SEPTEMBER 30, 2017
| DESCRIPTION | DOWDUPONT, INC. | MONSANTO CO. | PRAXAIR, INC. | ECOLAB, INC. | AIR PRODUCTS & CHEMICALS, INC. | TOTAL | ||||||||||
| MARKET VALUE | $928,638,066 | 334,497,420 | 254,900,573 | 214,135,650 | 210,789,187 | 1,942,960,896 | ||||||||||
| % OF NET ASSETS | 22.9 | 8.3 | 6.3 | 5.3 | 5.2 | 48.0 | ||||||||||
(The five largest holdings are subject to change, and there are no guarantees the Fund will continue to remain invested in any particular company.)
INDUSTRY BREAKDOWN AS OF SEPTEMBER 30, 2017*
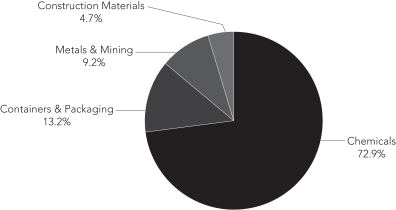
| * | The Fund’s industry breakdown is expressed as a percentage of total common stock and may change over time. |
28
Table of Contents
THE REAL ESTATE SELECT SECTOR SPDR FUND —
MANAGEMENT’S DISCUSSIONOF FUND PERFORMANCE (UNAUDITED)
The Real Estate Select Sector SPDR Fund (the “Fund”) seeks to provide investment results that, before expenses, correspond generally to the price and yield performance of publicly traded equity securities of companies in the Real Estate Select Sector Index. The Fund’s benchmark is the Real Estate Select Sector Index (the “Index”).
For the 12-month period ended September 30, 2017 (the “Reporting Period”), the total return for the Fund was 2.52%, and for the Index was 2.66%. The Fund and Index returns reflect the reinvestment of dividends and other income. The Fund’s performance reflects the expenses of managing the Fund, including brokerage and advisory expenses. The Index is unmanaged and Index returns do not reflect fees and expenses of any kind, which would have a negative impact on returns. Fees and expenses and /cash drag contributed to the difference between the Fund’s performance and that of the Index.
Real estate investment trusts (REITs) stumbled after their debut as a standalone sector in the Global Industry Classification Standard (GICS) structure. Over the first quarter of the Reporting Period, the Fund declined 4.41% compared to a positive 3.82% return for the broader S&P 500 Index. The sector’s sensitivity to rising interest rates contributed to the underperformance, as the 10-year US Treasury yield increased nearly 100 basis points over that quarter. Over the remainder of the Reporting Period, specialty REITs helped drive the Fund’s returns back into positive territory. American Tower Corporation (AMT), an independent owner, operator and developer of wireless and broadcast communications real estate, advanced over 30% on solid earnings and improved guidance in 2017. While retail REITs struggled due to the changing landscape and store closures, AMT surpassed Simon Property Group, a mall REIT, in market capitalization to become the largest weight in the Fund as of the fiscal year-end.
The Fund did not invest in derivatives during the Reporting Period.
On an individual security level, the top positive contributors to the Fund’s performance were American Tower Corporation, Equinix, Inc., and Prologis, Inc. The top negative contributors to the Fund’s performance were General Growth Properties Inc., Kimco Realty Corporation, Simon Property Group, Inc.
The views expressed above reflect those of the Fund’s portfolio manager only through the Reporting Period, and do not necessarily represent the views of the Adviser as a whole. Any such views are subject to change at any time based upon market or other conditions and the Adviser disclaims any responsibility to update such views. These views may not be relied on as investment advice and, because investment decisions for a fund are based on numerous factors, may not be relied on as an indication of trading intent on behalf of any fund.
29
Table of Contents
THE REAL ESTATE SELECT SECTOR SPDR FUND —
PERFORMANCE SUMMARY (UNAUDITED)
The following performance chart of the Fund’s total return at net asset value, the total return based on market price and its benchmark index is provided for comparative purposes only and represents the periods noted. The Fund’s per share net asset value (“NAV”) is the value of one share of the Fund and is calculated by dividing the value of total assets less total liabilities by the number of shares outstanding. The NAV return is based on the NAV of the Fund and the market return is based on the market price per share of the Fund. The market price used to calculate the market return is determined by using the midpoint between the highest bid and the lowest offer on the exchange on which the shares of the Fund are listed for trading, as of the time that the Fund’s NAV is calculated. Since shares of the Fund did not trade in the secondary market until the day after the Fund’s inception, for the period from inception to the first day of market trading in shares of the Fund (10/7/15, 10/8/15, respectively), the NAV of the Fund is used as a proxy for the secondary market trading price to calculate market returns. NAV and market returns assume that dividends and capital gain distributions have been reinvested in the Fund at NAV. Market returns do not include brokerage commissions that may be payable by an investor in the Fund on secondary market transactions. If brokerage commissions were included, market returns would be lower.
An index is a statistical measure of a specified financial market or sector. An index does not actually hold a portfolio of securities and therefore does not reflect deductions for fees or expenses. In comparison, the Fund’s performance is negatively impacted by these deductions.
Performance quoted represents past performance and past performance does not guarantee future results. Current performance may be higher or lower than the performance quoted. For the most recent month end performance information visit www.sectorspdrs.com. Investment in the Fund poses investment risk including the possible loss of principal. The investment return and principal value of an investment will fluctuate, so that shares, when redeemed, may be worth more or less than their original cost. The returns do not reflect the deduction of taxes that a shareholder would pay on Fund distributions or on the redemption or sale of Fund shares. The total expense ratio for The Real Estate Select Sector SPDR Fund as stated in the Fees and Expenses table of the prospectus dated January 31, 2017, as supplemented, is 0.16% (0.14% after fee waiver). Since Inception reflects the impact of an expense limitation agreement. Had the adviser not waived fees and reimbursed certain expenses, returns would have been lower.
PERFORMANCE AS OF SEPTEMBER 30, 2017
| CUMULATIVE TOTAL RETURN | AVERAGE ANNUAL TOTAL RETURN | |||||||||||||||||||||||||||||||||||||
| NET ASSET VALUE | MARKET VALUE | REAL ESTATE SELECT SECTOR INDEX* | S&P 500 INDEX | NET ASSET VALUE | MARKET VALUE | REAL ESTATE SELECT SECTOR INDEX* | S&P 500 INDEX | |||||||||||||||||||||||||||||||
| ONE YEAR | 2.52% | 2.49% | 2.66% | 18.61% | 2.52% | 2.49% | 2.66% | 18.61% | ||||||||||||||||||||||||||||||
| SINCE INCEPTION (1) | 15.76% | 15.75% | 16.13% | 31.63% | 7.65% | 7.64% | 7.84% | 14.86% | ||||||||||||||||||||||||||||||
| * | The Real Estate Select Sector Index is intended to give investors an efficient, modified market capitalization-based way to track the movements of certain public companies that are components of the S&P 500 and are involved in the investment in and/or management and development of real estate. |
| (1) | For the period October 7, 2015 to September 30, 2017. |
30
Table of Contents
THE REAL ESTATE SELECT SECTOR SPDR FUND —
PERFORMANCE SUMMARY (UNAUDITED) (CONTINUED)
COMPARISON OF CHANGE IN VALUE OF A $10,000 INVESTMENT (BASED ON NET ASSET VALUE)
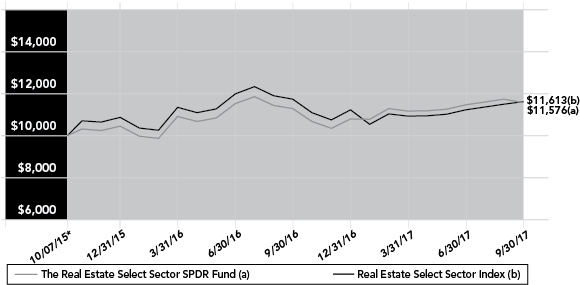
Past performance is no guarantee of future results.
Index returns are unmanaged and do not reflect the deduction of any fees or expenses. Index returns reflect all items of income, gain and loss and the reinvestment of dividends and other income.
Line graph is based on cumulative total return.
* Inception date.
31
Table of Contents
THE REAL ESTATE SELECT SECTOR SPDR FUND —
PORTFOLIO SUMMARY (UNAUDITED)
TOP FIVE HOLDINGS AS OF SEPTEMBER 30, 2017
| DESCRIPTION | AMERICAN TOWER CORP. REIT | SIMON PROPERTY GROUP, INC. REIT | CROWN CASTLE INTERNATIONAL CORP. REIT | EQUINIX, INC. REIT | PROLOGIS, INC. REIT | TOTAL | ||||||||||
| MARKET VALUE | $213,948,758 | 182,545,732 | 148,143,065 | 126,809,004 | 123,102,437 | 794,548,996 | ||||||||||
| % OF NET ASSETS | 9.1 | 7.7 | 6.3 | 5.4 | 5.2 | 33.7 | ||||||||||
(The five largest holdings are subject to change, and there are no guarantees the Fund will continue to remain invested in any particular company.)
INDUSTRY BREAKDOWN AS OF SEPTEMBER 30, 2017*
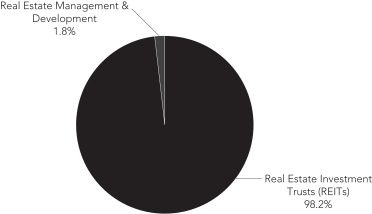
| * | The Fund’s industry breakdown is expressed as a percentage of total common stock and may change over time. |
32
Table of Contents
THE TECHNOLOGY SELECT SECTOR SPDR FUND —
MANAGEMENT’S DISCUSSIONOF FUND PERFORMANCE (UNAUDITED)
The Technology Select Sector SPDR Fund (the “Fund”) seeks to provide investment results that, before expenses, correspond generally to the price and yield performance of publicly traded equity securities of companies in the Technology Select Sector Index. The Fund’s benchmark is the Technology Select Sector Index (the “Index”).
For the 12-month period ended September 30, 2017 (the “Reporting Period”), the total return for the Fund was 25.72%, and for the Index was 25.98%. The Fund and Index returns reflect the reinvestment of dividends and other income. The Fund’s performance reflects the expenses of managing the Fund, including brokerage and advisory expenses. The Index is unmanaged and Index returns do not reflect fees and expenses of any kind, which would have a negative impact on returns. Expenses of the fund, the effects of cash holdings on the fund performance and the cumulative effect of small weight differences between the securities in the Fund and the index contributed to the difference between the Fund’s performance and that of the Index.
Corporate earnings, profitability and company product mix were primary drivers of Fund performance over the Reporting Period. The Fund had positive performance for each quarter in the Reporting Period. Positive Fund performance was partly driven by strong earnings and revenue growth. Additionally Fund performance was aided by increased product diversification as constituent companies moved to broaden their product offerings (for example, integrating cloud-based services with core software products). Ongoing and increasing social media usage also helped performance of fund constituents. Fund performance was also helped by the surprise presidential election of Donald Trump and the expected favorable environment from his economic agenda as well as the proposed tax plan. Solid macroeconomic data and M&A activity also helped Fund performance despite geopolitical and political tensions globally and within the White House (reactions to multiple North Korean missile tests, investigations into Russian meddling with the election, proposed Middle Eastern travel ban and political gridlock) during the Reporting Period.
The Fund did not invest in derivatives during the Reporting Period.
On an individual security level, the top positive contributors to the Fund’s performance were Apple Inc., Microsoft Corporation, and Facebook, Inc. Class A. The top negative contributors to the Fund’s performance were Verizon Communications Inc., CenturyLink, Inc., and QUALCOMM Incorporated.
The views expressed above reflect those of the Fund’s portfolio manager only through the Reporting Period, and do not necessarily represent the views of the Adviser as a whole. Any such views are subject to change at any time based upon market or other conditions and the Adviser disclaims any responsibility to update such views. These views may not be relied on as investment advice and, because investment decisions for a fund are based on numerous factors, may not be relied on as an indication of trading intent on behalf of any fund.
33
Table of Contents
THE TECHNOLOGY SELECT SECTOR SPDR FUND —
PERFORMANCE SUMMARY (UNAUDITED)
The following performance chart of the Fund’s total return at net asset value, the total return based on market price and its benchmark index is provided for comparative purposes only and represents the periods noted. The Fund’s per share net asset value (“NAV”) is the value of one share of the Fund and is calculated by dividing the value of total assets less total liabilities by the number of shares outstanding. The NAV return is based on the NAV of the Fund and the market return is based on the market price per share of the Fund. The market price used to calculate the market return is determined by using the midpoint between the highest bid and the lowest offer on the exchange on which the shares of the Fund are listed for trading, as of the time that the Fund’s NAV is calculated. NAV and market returns assume that dividends and capital gain distributions have been reinvested in the Fund at NAV. Market returns do not include brokerage commissions that may be payable by an investor in the Fund on secondary market transactions. If brokerage commissions were included, market returns would be lower.
An index is a statistical measure of a specified financial market or sector. An index does not actually hold a portfolio of securities and therefore does not reflect deductions for fees or expenses. In comparison, the Fund’s performance is negatively impacted by these deductions.
Performance quoted represents past performance and past performance does not guarantee future results. Current performance may be higher or lower than the performance quoted. For the most recent month end performance information visit www.sectorspdrs.com. Investment in the Fund poses investment risk including the possible loss of principal. The investment return and principal value of an investment will fluctuate, so that shares, when redeemed, may be worth more or less than their original cost. The returns do not reflect the deduction of taxes that a shareholder would pay on Fund distributions or on the redemption or sale of Fund shares. The total expense ratio for The Technology Select Sector SPDR Fund as stated in the Fees and Expenses table of the prospectus dated January 31, 2017, as supplemented, is 0.14%. Fund returns at Net Asset Value shown in the table below for Five years and Ten years reflect the impact of a fee waiver and without this waiver returns would have been lower.
PERFORMANCE AS OF SEPTEMBER 30, 2017
| CUMULATIVE TOTAL RETURN | AVERAGE ANNUAL TOTAL RETURN | |||||||||||||||||||||||||||||||||||||
| NET ASSET VALUE | MARKET VALUE | TECHNOLOGY SELECT SECTOR INDEX* | S&P 500 INDEX | NET ASSET VALUE | MARKET VALUE | TECHNOLOGY SELECT SECTOR INDEX* | S&P 500 INDEX** | |||||||||||||||||||||||||||||||
| ONE YEAR | 25.72% | 25.71% | 25.98% | 18.61% | 25.72% | 25.71% | 25.98% | 18.61% | ||||||||||||||||||||||||||||||
| FIVE YEARS | 110.12% | 110.12% | 112.09% | 94.44% | 16.01% | 16.01% | 16.23% | 14.22% | ||||||||||||||||||||||||||||||
| TEN YEARS | 158.28% | 158.36% | 163.17% | 104.88% | 9.95% | 9.96% | 10.16% | 7.44% | ||||||||||||||||||||||||||||||
| * | The Technology Select Sector Index is intended to give investors an efficient, modified market capitalization-based way to track the movements of certain public companies that are components of the S&P 500 and are involved in the development and production of technology products. |
| ** | The S&P 500 Index includes five hundred (500) selected companies, all of which are listed on national stock exchanges and spans over 25 separate industry groups. |
34
Table of Contents
THE TECHNOLOGY SELECT SECTOR SPDR FUND —
PERFORMANCE SUMMARY (UNAUDITED) (CONTINUED)
COMPARISON OF CHANGE IN VALUE OF A $10,000 INVESTMENT (BASED ON NET ASSET VALUE)

Past performance is no guarantee of future results.
Index returns are unmanaged and do not reflect the deduction of any fees or expenses. Index returns reflect all items of income, gain and loss and the reinvestment of dividends and other income.
Line graph is based on cumulative total return.
35
Table of Contents
THE TECHNOLOGY SELECT SECTOR SPDR FUND —
PORTFOLIO SUMMARY (UNAUDITED)
TOP FIVE HOLDINGS AS OF SEPTEMBER 30, 2017
| DESCRIPTION | APPLE, INC. | MICROSOFT CORP. | FACEBOOK, INC. CLASS A | ALPHABET, INC. CLASS A | ALPHABET, INC. CLASS C | TOTAL | ||||||||||
| MARKET VALUE | $2,577,131,605 | 1,857,265,055 | 1,311,036,812 | 939,358,395 | 937,100,343 | 7,621,892,210 | ||||||||||
| % OF NET ASSETS | 14.5 | 10.4 | 7.3 | 5.3 | 5.2 | 42.7 | ||||||||||
(The five largest holdings are subject to change, and there are no guarantees the Fund will continue to remain invested in any particular company.)
INDUSTRY BREAKDOWN AS OF SEPTEMBER 30, 2017*
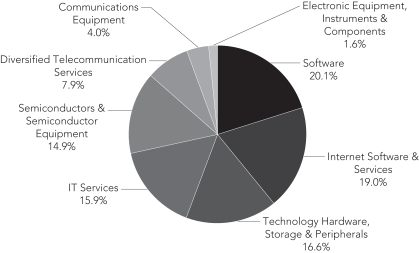
| * | The Fund’s industry breakdown is expressed as a percentage of total common stock and may change over time. |
36
Table of Contents
THE UTILITIES SELECT SECTOR SPDR FUND —
MANAGEMENT’S DISCUSSIONOF FUND PERFORMANCE (UNAUDITED)
The Utilities Select Sector SPDR Fund (the “Fund”) seeks to provide investment results that, before expenses, correspond generally to the price and yield performance of publicly traded equity securities of companies in the Utilities Select Sector Index. The Fund’s benchmark is the Utilities Select Sector Index (the “Index”).
For the 12-month period ended September 30, 2017 (the “Reporting Period”), the total return for the Fund was 11.88%, and for the Index was 12.06%. The Fund and Index returns reflect the reinvestment of dividends and other income. The Fund’s performance reflects the expenses of managing the Fund, including brokerage and advisory expenses. The Index is unmanaged and Index returns do not reflect fees and expenses of any kind, which would have a negative impact on returns. Fund expenses, cumulative security misweights and the Fund’s cash position contributed to the difference between the Fund’s performance and that of the Index.
During the prior twelve month period, the utilities sector was modestly negatively impacted by both the three increases in the Federal Funds rate and the expectations of more rate increases in the near term. These rate increases hurt the utilities sector by making the normally relative high dividend yield marginally less attractive and increasing the borrowing costs for the Fund’s constituent companies. Due to the capital intensive nature of utilities, many of these stocks tend to be more greatly impacted by rising interest rates due to their relatively high debt ratios. Many of this sector’s constituent companies’ returns have also been hurt by reduced electricity demand caused by a relatively mild summer in many part of the United States. Also, the U.S. centric nature of the utilities sector became modestly less appealing to investors as global growth picked up during parts of 2017. Conversely, this sector’s return has been helped by increased demand for energy associated with improvements in the housing market and U.S. economy.
The Fund did not invest in derivatives during the Reporting Period.
On an individual security level, the top positive contributors to the Fund’s performance were NextEra Energy, Inc., Exelon Corporation, and NRG Energy, Inc. The top negative contributors to the Fund’s performance were FirstEnergy Corp., AES Corporation, and SCANA Corporation.
The views expressed above reflect those of the Fund’s portfolio manager only through the Reporting Period, and do not necessarily represent the views of the Adviser as a whole. Any such views are subject to change at any time based upon market or other conditions and the Adviser disclaims any responsibility to update such views. These views may not be relied on as investment advice and, because investment decisions for a fund are based on numerous factors, may not be relied on as an indication of trading intent on behalf of any fund.
37
Table of Contents
THE UTILITIES SELECT SECTOR SPDR FUND —
PERFORMANCE SUMMARY (UNAUDITED)
The following performance chart of the Fund’s total return at net asset value, the total return based on market price and its benchmark index is provided for comparative purposes only and represents the periods noted. The Fund’s per share net asset value (“NAV”) is the value of one share of the Fund and is calculated by dividing the value of total assets less total liabilities by the number of shares outstanding. The NAV return is based on the NAV of the Fund and the market return is based on the market price per share of the Fund. The market price used to calculate the market return is determined by using the midpoint between the highest bid and the lowest offer on the exchange on which the shares of the Fund are listed for trading, as of the time that the Fund’s NAV is calculated. NAV and market returns assume that dividends and capital gain distributions have been reinvested in the Fund at NAV. Market returns do not include brokerage commissions that may be payable by an investor in the Fund on secondary market transactions. If brokerage commissions were included, market returns would be lower.
An index is a statistical measure of a specified financial market or sector. An index does not actually hold a portfolio of securities and therefore does not reflect deductions for fees or expenses. In comparison, the Fund’s performance is negatively impacted by these deductions.
Performance quoted represents past performance and past performance does not guarantee future results. Current performance may be higher or lower than the performance quoted. For the most recent month end performance information visit www.sectorspdrs.com. Investment in the Fund poses investment risk including the possible loss of principal. The investment return and principal value of an investment will fluctuate, so that shares, when redeemed, may be worth more or less than their original cost. The returns do not reflect the deduction of taxes that a shareholder would pay on Fund distributions or on the redemption or sale of Fund shares. The total expense ratio for The Utilities Select Sector SPDR Fund as stated in the Fees and Expenses table of the prospectus dated January 31, 2017, as supplemented, is 0.14%. Fund returns at Net Asset Value shown in the table below for Five years and Ten years reflect the impact of a fee waiver and without this waiver returns would have been lower.
PERFORMANCE AS OF SEPTEMBER 30, 2017
| CUMULATIVE TOTAL RETURN | AVERAGE ANNUAL TOTAL RETURN | |||||||||||||||||||||||||||||||||||||
| NET ASSET VALUE | MARKET VALUE | UTILITIES SELECT SECTOR INDEX* | S&P 500 INDEX | NET ASSET VALUE | MARKET VALUE | UTILITIES SELECT SECTOR INDEX* | S&P 500 INDEX** | |||||||||||||||||||||||||||||||
| ONE YEAR | 11.88% | 11.91% | 12.06% | 18.61% | 11.88% | 11.91% | 12.06% | 18.61% | ||||||||||||||||||||||||||||||
| FIVE YEARS | 74.01% | 74.03% | 75.80% | 94.44% | 11.72% | 11.72% | 11.95% | 14.22% | ||||||||||||||||||||||||||||||
| TEN YEARS | 93.58% | 94.04% | 97.47% | 104.88% | 6.83% | 6.85% | 7.04% | 7.44% | ||||||||||||||||||||||||||||||
| * | The Utilities Select Sector Index is intended to give investors an efficient, modified market capitalization-based way to track the movements of certain public companies that are components of the S&P 500 and are in the utilities industry. |
| ** | The S&P 500 Index includes five hundred (500) selected companies, all of which are listed on national stock exchanges and spans over 25 separate industry groups. |
38
Table of Contents
THE UTILITIES SELECT SECTOR SPDR FUND —
PERFORMANCE SUMMARY (UNAUDITED) (CONTINUED)
COMPARISON OF CHANGE IN VALUE OF A $10,000 INVESTMENT (BASED ON NET ASSET VALUE)
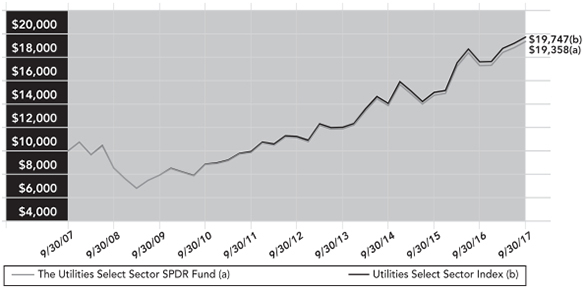
Past performance is no guarantee of future results.
Index returns are unmanaged and do not reflect the deduction of any fees or expenses. Index returns reflect all items of income, gain and loss and the reinvestment of dividends and other income.
Line graph is based on cumulative total return.
39
Table of Contents
THE UTILITIES SELECT SECTOR SPDR FUND —
PORTFOLIO SUMMARY (UNAUDITED)
TOP FIVE HOLDINGS AS OF SEPTEMBER 30, 2017
| DESCRIPTION | NEXTERA ENERGY, INC. | DUKE ENERGY CORP. | DOMINION ENERGY, INC. | SOUTHERN CO. | EXELON CORP. | TOTAL | ||||||||||
| MARKET VALUE | $792,117,991 | 625,491,846 | 571,118,242 | 567,122,234 | 418,027,230 | 2,973,877,543 | ||||||||||
| % OF NET ASSETS | 10.2 | 8.0 | 7.4 | 7.3 | 5.4 | 38.3 | ||||||||||
(The five largest holdings are subject to change, and there are no guarantees the Fund will continue to remain invested in any particular company.)
INDUSTRY BREAKDOWN AS OF SEPTEMBER 30, 2017*
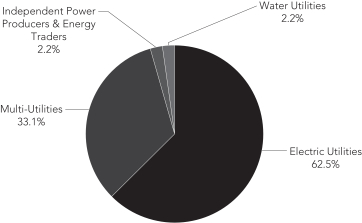
| * | The Fund’s industry breakdown is expressed as a percentage of total common stock and may change over time. |
40
Table of Contents
The Consumer Discretionary Select Sector SPDR Fund
September 30, 2017
Security Description | Shares | Value | ||||||
COMMON STOCKS — 99.8% |
| |||||||
AUTO COMPONENTS — 1.8% |
| |||||||
BorgWarner, Inc | 897,100 | $ | 45,958,433 | |||||
Delphi Automotive PLC | 1,203,781 | 118,452,050 | ||||||
Goodyear Tire & Rubber Co | 1,129,516 | 37,556,407 | ||||||
|
| |||||||
| 201,966,890 | ||||||||
|
| |||||||
AUTOMOBILES — 4.2% | ||||||||
Ford Motor Co | 17,569,729 | 210,309,656 | ||||||
General Motors Co | 5,890,301 | 237,850,354 | ||||||
Harley-Davidson, Inc. (a) | 766,266 | 36,941,684 | ||||||
|
| |||||||
| 485,101,694 | ||||||||
|
| |||||||
DISTRIBUTORS — 1.0% |
| |||||||
Genuine Parts Co | 662,282 | 63,347,273 | ||||||
LKQ Corp. (b) | 1,386,954 | 49,916,475 | ||||||
|
| |||||||
| 113,263,748 | ||||||||
|
| |||||||
DIVERSIFIED CONSUMER SERVICES — 0.2% |
| |||||||
H&R Block, Inc | 927,047 | 24,548,205 | ||||||
|
| |||||||
HOTELS, RESTAURANTS & LEISURE — 14.9% |
| |||||||
Carnival Corp | 1,831,857 | 118,283,007 | ||||||
Chipotle Mexican Grill, Inc. (a) (b) | 112,704 | 34,693,672 | ||||||
Darden Restaurants, Inc | 557,265 | 43,901,337 | ||||||
Hilton Worldwide Holdings, Inc | 915,939 | 63,611,964 | ||||||
Marriott International, Inc. Class A | 1,405,413 | 154,960,837 | ||||||
McDonald’s Corp | 3,638,618 | 570,098,668 | ||||||
MGM Resorts International | 2,326,143 | 75,809,000 | ||||||
Royal Caribbean Cruises, Ltd | 772,974 | 91,628,338 | ||||||
Starbucks Corp | 6,488,526 | 348,498,731 | ||||||
Wyndham Worldwide Corp | 461,746 | 48,672,646 | ||||||
Wynn Resorts, Ltd | 357,871 | 53,294,149 | ||||||
Yum! Brands, Inc | 1,549,044 | 114,025,129 | ||||||
|
| |||||||
| 1,717,477,478 | ||||||||
|
| |||||||
HOUSEHOLD DURABLES — 3.7% |
| |||||||
D.R. Horton, Inc | 1,524,816 | 60,885,903 | ||||||
Garmin, Ltd. (a) | 498,450 | 26,901,347 | ||||||
Leggett & Platt, Inc | 594,218 | 28,362,025 | ||||||
Lennar Corp. Class A | 912,488 | 48,179,366 | ||||||
Mohawk Industries, Inc. (b) | 283,039 | 70,054,983 | ||||||
Newell Brands, Inc | 2,201,790 | 93,950,379 | ||||||
PulteGroup, Inc | 1,246,824 | 34,075,700 | ||||||
Whirlpool Corp | 332,234 | 61,277,239 | ||||||
|
| |||||||
| 423,686,942 | ||||||||
|
| |||||||
INTERNET & CATALOG RETAIL — 22.4% |
| |||||||
Amazon.com, Inc. (b) | 1,791,218 | 1,721,987,424 | ||||||
Expedia, Inc. (a) | 548,913 | 79,010,537 | ||||||
Netflix, Inc. (b) | 1,939,523 | 351,732,496 | ||||||
Priceline Group, Inc. (b) | 220,373 | 403,463,296 | ||||||
TripAdvisor, Inc. (a) (b) | 496,178 | 20,110,095 | ||||||
|
| |||||||
| 2,576,303,848 | ||||||||
|
| |||||||
LEISURE EQUIPMENT & PRODUCTS — 0.6% |
| |||||||
Hasbro, Inc | 511,382 | 49,946,680 | ||||||
Mattel, Inc. (a) | 1,537,512 | 23,800,686 | ||||||
|
| |||||||
| 73,747,366 | ||||||||
|
| |||||||
MEDIA — 24.0% | ||||||||
CBS Corp. Class B | 1,635,336 | $ | 94,849,488 | |||||
Charter Communications, Inc. | 903,382 | 328,307,086 | ||||||
Comcast Corp. Class A | 21,130,524 | 813,102,564 | ||||||
Discovery Communications, Inc. Class A (a) (b) | 686,889 | 14,623,867 | ||||||
Discovery Communications, Inc. Class C (b) | 948,043 | 19,207,351 | ||||||
DISH Network Corp. Class A (b) | 1,018,425 | 55,229,188 | ||||||
Interpublic Group of Cos., Inc | 1,785,531 | 37,121,189 | ||||||
News Corp. Class A | 1,718,596 | 22,788,583 | ||||||
News Corp. Class B | 532,979 | 7,275,163 | ||||||
Omnicom Group, Inc | 1,045,825 | 77,464,258 | ||||||
Scripps Networks Interactive, Inc. | 430,071 | 36,938,798 | ||||||
Time Warner, Inc | 3,494,082 | 357,968,701 | ||||||
Twenty-First Century Fox, Inc. Class A | 4,728,292 | 124,732,343 | ||||||
Twenty-First Century Fox, Inc. Class B | 1,971,978 | 50,857,313 | ||||||
Viacom, Inc. Class B | 1,584,483 | 44,112,007 | ||||||
Walt Disney Co | 6,935,348 | 683,617,252 | ||||||
|
| |||||||
| 2,768,195,151 | ||||||||
|
| |||||||
MULTILINE RETAIL — 3.7% |
| |||||||
Dollar General Corp | 1,170,427 | 94,863,108 | ||||||
Dollar Tree, Inc. (b) | 1,062,734 | 92,266,566 | ||||||
Kohl’s Corp. (a) | 766,139 | 34,974,245 | ||||||
Macy’s, Inc | 1,373,873 | 29,977,909 | ||||||
Nordstrom, Inc. (a) | 522,846 | 24,652,189 | ||||||
Target Corp | 2,453,468 | 144,779,147 | ||||||
|
| |||||||
| 421,513,164 | ||||||||
|
| |||||||
SPECIALTY RETAIL — 18.0% |
| |||||||
Advance Auto Parts, Inc | 332,217 | 32,955,926 | ||||||
AutoZone, Inc. (b) | 126,616 | 75,350,448 | ||||||
Best Buy Co., Inc | 1,192,061 | 67,899,795 | ||||||
CarMax, Inc. (b) | 832,103 | 63,081,728 | ||||||
Foot Locker, Inc | 589,617 | 20,766,311 | ||||||
Gap, Inc | 987,580 | 29,163,237 | ||||||
Home Depot, Inc | 5,295,190 | 866,081,276 | ||||||
L Brands, Inc. (a) | 1,121,190 | 46,652,716 | ||||||
Lowe’s Cos., Inc | 3,792,167 | 303,145,830 | ||||||
O’Reilly Automotive, Inc. (b) | 395,308 | 85,137,484 | ||||||
Ross Stores, Inc | 1,761,298 | 113,727,012 | ||||||
Signet Jewelers, Ltd. (a) | 271,458 | 18,065,530 | ||||||
Tiffany & Co | 458,523 | 42,083,241 | ||||||
TJX Cos., Inc | 2,869,757 | 211,587,184 | ||||||
Tractor Supply Co | 577,833 | 36,571,051 | ||||||
Ulta Salon Cosmetics & Fragrance, Inc. (b) | 262,120 | 59,254,847 | ||||||
|
| |||||||
| 2,071,523,616 | ||||||||
|
| |||||||
TEXTILES, APPAREL & LUXURY GOODS — 5.3% |
| |||||||
Coach, Inc | 1,259,377 | 50,727,705 | ||||||
Hanesbrands, Inc. (a) | 1,636,328 | 40,319,122 | ||||||
Michael Kors Holdings, Ltd. (b) | 700,621 | 33,524,715 | ||||||
NIKE, Inc. Class B | 5,902,398 | 306,039,336 | ||||||
PVH Corp | 350,447 | 44,177,349 | ||||||
Ralph Lauren Corp | 251,182 | 22,176,859 | ||||||
Under Armour, Inc. Class A (a) (b) | 815,292 | 13,436,012 | ||||||
See accompanying notes to financial statements.
41
Table of Contents
The Consumer Discretionary Select Sector SPDR Fund
SCHEDULE OF INVESTMENTS (continued)
September 30, 2017
Security Description | Shares | Value | ||||||
Under Armour, Inc. Class C (a) (b) | 820,298 | $ | 12,320,876 | |||||
VF Corp. (a) | 1,467,756 | 93,305,249 | ||||||
|
| |||||||
| 616,027,223 | ||||||||
|
| |||||||
TOTAL COMMON STOCKS | 11,493,355,325 | |||||||
|
| |||||||
SHORT-TERM INVESTMENTS — 0.4% |
| |||||||
State Street Institutional U.S. Government Money Market Fund, Class G Shares 0.96% (c) (d) | 20,785,167 | 20,785,167 | ||||||
State Street Navigator Securities Lending Government Money Market Portfolio (c) (e) | 24,093,725 | 24,093,725 | ||||||
|
| |||||||
TOTAL SHORT-TERM INVESTMENTS | 44,878,892 | |||||||
|
| |||||||
TOTAL INVESTMENTS — 100.2% | ||||||||
(Cost $11,493,438,730) | 11,538,234,217 | |||||||
LIABILITIES IN EXCESS OF OTHER ASSETS — (0.2)% | (19,649,213 | ) | ||||||
|
| |||||||
NET ASSETS — 100.0% | $ | 11,518,585,004 | ||||||
|
| |||||||
| (a) | All or a portion of the shares of the security are on loan at September 30, 2017. |
| (b) | Non-income producing security. |
| (c) | The Fund invested in certain money market funds managed by SSGA Funds Management, Inc. Amounts related to these transactions during the period ended September 30, 2017 are shown in the Affiliate Table below. |
| (d) | The rate shown is the annualized seven-day yield at September 30, 2017. |
| (e) | Investment of cash collateral for securities loaned. |
The following table summarizes the value of the Fund’s investments according to the fair value hierarchy as of September 30, 2017.
Description | Level 1 — Quoted Prices | Level 2 — Other Significant Observable Inputs | Level 3 — Significant Unobservable Inputs | Total | ||||||||||||
ASSETS: | ||||||||||||||||
INVESTMENTS: | ||||||||||||||||
Common Stocks | ||||||||||||||||
Auto Components | $ | 201,966,890 | $ | — | $ | — | $ | 201,966,890 | ||||||||
Automobiles | 485,101,694 | — | — | 485,101,694 | ||||||||||||
Distributors | 113,263,748 | — | — | 113,263,748 | ||||||||||||
Diversified Consumer Services | 24,548,205 | — | — | 24,548,205 | ||||||||||||
Hotels, Restaurants & Leisure | 1,717,477,478 | — | — | 1,717,477,478 | ||||||||||||
Household Durables. | 423,686,942 | — | — | 423,686,942 | ||||||||||||
Internet & Catalog Retail | 2,576,303,848 | — | — | 2,576,303,848 | ||||||||||||
Leisure Equipment & Products | 73,747,366 | — | — | 73,747,366 | ||||||||||||
Media | 2,768,195,151 | — | — | 2,768,195,151 | ||||||||||||
Multiline Retail | 421,513,164 | — | — | 421,513,164 | ||||||||||||
Specialty Retail | 2,071,523,616 | — | — | 2,071,523,616 | ||||||||||||
Textiles, Apparel & Luxury Goods | 616,027,223 | — | — | 616,027,223 | ||||||||||||
Short-Term Investments | 44,878,892 | — | — | 44,878,892 | ||||||||||||
|
|
|
|
|
|
|
| |||||||||
TOTAL INVESTMENTS | $ | 11,538,234,217 | $ | — | $ | — | $ | 11,538,234,217 | ||||||||
|
|
|
|
|
|
|
| |||||||||
See accompanying notes to financial statements.
42
Table of Contents
The Consumer Discretionary Select Sector SPDR Fund
SCHEDULE OF INVESTMENTS (continued)
September 30, 2017
Affiliate Table
| Number of Shares Held at 9/30/16 | Value At 9/30/16 | Cost of Purchases | Proceeds from Shares Sold | Realized Gain (Loss) | Change in Unrealized Appreciation/ Depreciation | Number of Shares Held at 9/30/17 | Value at 9/30/17 | Dividend Income | ||||||||||||||||||||||||||||
State Street Institutional Liquid Reserves Fund, Premier Class | 28,497,239 | $ | 28,497,239 | $ | 3,877,033 | $ | 32,374,272 | $ | — | $ | — | — | $ | — | $ | 1,090 | ||||||||||||||||||||
State Street Institutional U.S. Government Money Market Fund, Class G Shares | — | — | 140,492,974 | 119,707,807 | — | — | 20,785,167 | 20,785,167 | 95,147 | |||||||||||||||||||||||||||
State Street Institutional U.S. Government Money Market Fund, Premier Class | — | — | 200,127,032 | 200,127,032 | — | — | — | — | 83,432 | |||||||||||||||||||||||||||
State Street Navigator Securities Lending Government Money Market Portfolio* | 50,785,017 | 50,785,017 | 294,684,532 | 321,375,824 | — | — | 24,093,725 | 24,093,725 | 875,559 | |||||||||||||||||||||||||||
|
|
|
|
|
|
|
|
|
|
|
|
|
| |||||||||||||||||||||||
TOTAL | $ | 79,282,256 | $ | 639,181,571 | $ | 673,584,935 | $ | — | $ | — | $ | 44,878,892 | $ | 1,055,228 | ||||||||||||||||||||||
|
|
|
|
|
|
|
|
|
|
|
|
|
| |||||||||||||||||||||||
| * | Effective October 5, 2016, the name of State Street Navigator Securities Lending Prime Portfolio was changed to State Street Navigator Securities Lending Government Money Market Portfolio. |
See accompanying notes to financial statements.
43
Table of Contents
The Consumer Staples Select Sector SPDR Fund
SCHEDULE OF INVESTMENTS
September 30, 2017
Security Description | Shares | Value | ||||||
COMMON STOCKS — 99.7% | ||||||||
BEVERAGES — 24.5% | ||||||||
Brown-Forman Corp. Class B | 1,086,357 | $ | 58,989,185 | |||||
Coca-Cola Co | 18,958,608 | 853,326,946 | ||||||
Constellation Brands, Inc. Class A | 881,417 | 175,798,621 | ||||||
Dr. Pepper Snapple Group, Inc | 970,454 | 85,856,065 | ||||||
Molson Coors Brewing Co. Class B | 990,281 | 80,846,541 | ||||||
Monster Beverage Corp. (a) | 2,165,151 | 119,624,593 | ||||||
PepsiCo, Inc | 7,056,821 | 786,341,564 | ||||||
|
| |||||||
| 2,160,783,515 | ||||||||
|
| |||||||
FOOD & STAPLES RETAILING — 20.0% |
| |||||||
Costco Wholesale Corp | 2,205,638 | 362,364,267 | ||||||
CVS Health Corp | 5,023,762 | 408,532,326 | ||||||
Kroger Co | 4,747,888 | 95,242,633 | ||||||
Sysco Corp | 2,517,016 | 135,793,013 | ||||||
Wal-Mart Stores, Inc | 5,099,867 | 398,503,607 | ||||||
Walgreens Boots Alliance, Inc | 4,628,371 | 357,402,809 | ||||||
|
| |||||||
| 1,757,838,655 | ||||||||
|
| |||||||
FOOD PRODUCTS — 15.9% |
| |||||||
Archer-Daniels-Midland Co | 2,927,071 | 124,429,788 | ||||||
Campbell Soup Co | 1,093,461 | 51,195,844 | ||||||
Conagra Brands, Inc | 2,244,334 | 75,723,829 | ||||||
General Mills, Inc | 2,972,594 | 153,861,466 | ||||||
Hershey Co | 756,952 | 82,636,450 | ||||||
Hormel Foods Corp. (b) | 1,534,943 | 49,333,068 | ||||||
J.M. Smucker Co | 620,746 | 65,134,878 | ||||||
Kellogg Co | 1,328,690 | 82,870,395 | ||||||
Kraft Heinz Co | 3,030,522 | 235,016,981 | ||||||
McCormick & Co., Inc | 653,443 | 67,069,390 | ||||||
Mondelez International, Inc. Class A | 7,605,246 | 309,229,302 | ||||||
Tyson Foods, Inc. Class A | 1,525,504 | 107,471,757 | ||||||
|
| |||||||
| 1,403,973,148 | ||||||||
|
| |||||||
HOUSEHOLD PRODUCTS — 20.9% |
| |||||||
Church & Dwight Co., Inc | 1,364,990 | 66,133,766 | ||||||
Clorox Co | 686,876 | 90,605,813 | ||||||
Colgate-Palmolive Co | 4,439,114 | 323,389,455 | ||||||
Kimberly-Clark Corp | 1,800,225 | $ | 211,850,478 | |||||
Procter & Gamble Co | 12,594,141 | 1,145,814,948 | ||||||
|
| |||||||
| 1,837,794,460 | ||||||||
|
| |||||||
PERSONAL PRODUCTS — 1.9% |
| |||||||
Coty, Inc. Class A (b) | 2,719,884 | 44,959,682 | ||||||
Estee Lauder Cos., Inc. Class A | 1,164,719 | 125,603,297 | ||||||
|
| |||||||
| 170,562,979 | ||||||||
|
| |||||||
TOBACCO — 16.5% |
| |||||||
Altria Group, Inc | 9,480,063 | 601,225,596 | ||||||
Philip Morris International, Inc | 7,670,225 | 851,471,677 | ||||||
|
| |||||||
| 1,452,697,273 | ||||||||
|
| |||||||
TOTAL COMMON STOCKS | 8,783,650,030 | |||||||
|
| |||||||
SHORT-TERM INVESTMENT — 0.1% |
| |||||||
State Street Institutional U.S. Government Money Market Fund, Class G Shares 0.96% (c) (d) | 3,856,474 | 3,856,474 | ||||||
|
| |||||||
TOTAL INVESTMENTS — 99.8% | ||||||||
(Cost $9,362,338,250) | 8,787,506,504 | |||||||
OTHER ASSETS IN EXCESS OF LIABILITIES — 0.2% | 21,396,559 | |||||||
|
| |||||||
NET ASSETS — 100.0% | $ | 8,808,903,063 | ||||||
|
| |||||||
| (a) | Non-income producing security. |
| (b) | All or a portion of the shares of the security are on loan at September 30, 2017. |
| (c) | The Fund invested in certain money market funds managed by SSGA Funds Management, Inc. Amounts related to these transactions during the period ended September 30, 2017 are shown in the Affiliate Table below. |
| (d) | The rate shown is the annualized seven-day yield at September 30, 2017. |
The following table summarizes the value of the Fund’s investments according to the fair value hierarchy as of September 30, 2017.
Description | Level 1 — Quoted Prices | Level 2 — Other Significant Observable Inputs | Level 3 — Significant Unobservable Inputs | Total | ||||||||||||
ASSETS: | ||||||||||||||||
INVESTMENTS: | ||||||||||||||||
Common Stocks | ||||||||||||||||
Beverages | $ | 2,160,783,515 | $ | — | $ | — | $ | 2,160,783,515 | ||||||||
Food & Staples Retailing | 1,757,838,655 | — | — | 1,757,838,655 | ||||||||||||
Food Products | 1,403,973,148 | — | — | 1,403,973,148 | ||||||||||||
Household Products | 1,837,794,460 | — | — | 1,837,794,460 | ||||||||||||
Personal Products | 170,562,979 | — | — | 170,562,979 | ||||||||||||
Tobacco | 1,452,697,273 | — | — | 1,452,697,273 | ||||||||||||
Short-Term Investment | 3,856,474 | — | — | 3,856,474 | ||||||||||||
|
|
|
|
|
|
|
| |||||||||
TOTAL INVESTMENTS | $ | 8,787,506,504 | $ | — | $ | — | $ | 8,787,506,504 | ||||||||
|
|
|
|
|
|
|
| |||||||||
See accompanying notes to financial statements.
44
Table of Contents
The Consumer Staples Select Sector SPDR Fund
SCHEDULE OF INVESTMENTS (continued)
September 30, 2017
Affiliate Table
| Number of Shares Held at 9/30/16 | Value At 9/30/16 | Cost of Purchases | Proceeds from Shares Sold | Realized Gain (Loss) | Change in Unrealized Appreciation/ Depreciation | Number of Shares Held at 9/30/17 | Value at 9/30/17 | Dividend Income | ||||||||||||||||||||||||||||
State Street Institutional Liquid Reserves Fund, Premier Class | 3,120,524 | $ | 3,120,524 | $ | 10,694,524 | $ | 13,815,048 | $ | — | $ | — | — | $ | — | $ | — | ||||||||||||||||||||
State Street Institutional U.S. Government Money Market Fund, Class G Shares | — | — | 477,589,396 | 473,732,922 | — | — | 3,856,474 | 3,856,474 | 89,429 | |||||||||||||||||||||||||||
State Street Institutional U.S. Government Money Market Fund, Premier Class | — | — | 229,410,325 | 229,410,325 | — | — | — | — | 40,840 | |||||||||||||||||||||||||||
State Street Navigator Securities Lending Government Money Market Portfolio* | 180,000,000 | 180,000,000 | 550,258,252 | 730,258,252 | — | — | — | — | 428,907 | |||||||||||||||||||||||||||
|
|
|
|
|
|
|
|
|
|
|
|
|
| |||||||||||||||||||||||
TOTAL | $ | 183,120,524 | $ | 1,267,952,497 | $ | 1,447,216,547 | $ | — | $ | — | $ | 3,856,474 | $ | 559,176 | ||||||||||||||||||||||
|
|
|
|
|
|
|
|
|
|
|
|
|
| |||||||||||||||||||||||
| * | Effective October 5, 2016, the name of State Street Navigator Securities Lending Prime Portfolio was changed to State Street Navigator Securities Lending Government Money Market Portfolio. |
See accompanying notes to financial statements.
45
Table of Contents
The Energy Select Sector SPDR Fund
SCHEDULE OF INVESTMENTS
September 30, 2017
Security Description | Shares | Value | ||||||
COMMON STOCKS — 99.9% |
| |||||||
ENERGY EQUIPMENT & SERVICES — 14.6% |
| |||||||
Baker Hughes a GE Co | 5,883,944 | $ | 215,470,029 | |||||
Halliburton Co | 11,348,174 | 522,356,449 | ||||||
Helmerich & Payne, Inc. (a) | 1,703,526 | 88,770,740 | ||||||
National Oilwell Varco, Inc. (a) | 5,288,801 | 188,968,860 | ||||||
Schlumberger, Ltd | 17,803,497 | 1,241,971,951 | ||||||
TechnipFMC PLC (b) | 6,190,881 | 172,849,397 | ||||||
|
| |||||||
| 2,430,387,426 | ||||||||
|
| |||||||
OIL, GAS & CONSUMABLE FUELS — 85.3% |
| |||||||
Anadarko Petroleum Corp | 7,436,865 | 363,290,855 | ||||||
Andeavor | 1,995,510 | 205,836,857 | ||||||
Apache Corp. (a) | 5,192,896 | 237,834,637 | ||||||
Cabot Oil & Gas Corp | 6,499,774 | 173,868,955 | ||||||
Chesapeake Energy Corp. (a) (b) | 15,468,187 | 66,513,204 | ||||||
Chevron Corp | 24,082,313 | 2,829,671,778 | ||||||
Cimarex Energy Co | 1,356,385 | 154,180,283 | ||||||
Concho Resources, Inc. (b) | 2,011,740 | 264,986,393 | ||||||
ConocoPhillips | 15,720,859 | 786,828,993 | ||||||
Devon Energy Corp | 7,114,820 | 261,185,042 | ||||||
EOG Resources, Inc | 7,474,210 | 723,055,075 | ||||||
EQT Corp. (a) | 2,459,688 | 160,470,045 | ||||||
Exxon Mobil Corp | 46,845,813 | 3,840,419,750 | ||||||
Hess Corp | 3,789,432 | 177,686,466 | ||||||
Kinder Morgan, Inc | 25,160,821 | 482,584,547 | ||||||
Marathon Oil Corp | 12,022,672 | 163,027,432 | ||||||
Marathon Petroleum Corp | 6,713,457 | 376,490,669 | ||||||
Newfield Exploration Co. (b) | 3,109,321 | 92,253,554 | ||||||
Noble Energy, Inc | 6,769,113 | 191,972,045 | ||||||
Occidental Petroleum Corp | 9,927,092 | 637,418,577 | ||||||
ONEOK, Inc | 5,116,644 | 283,513,244 | ||||||
Phillips 66 | 5,618,804 | 514,738,634 | ||||||
Pioneer Natural Resources Co | 2,266,261 | 334,364,148 | ||||||
Range Resources Corp. (a) | 3,717,932 | 72,759,929 | ||||||
Valero Energy Corp | 5,812,001 | $ | 447,117,237 | |||||
Williams Cos., Inc | 11,029,314 | 330,989,713 | ||||||
|
| |||||||
| 14,173,058,062 | ||||||||
|
| |||||||
TOTAL COMMON STOCKS | 16,603,445,488 | |||||||
|
| |||||||
SHORT-TERM INVESTMENTS — 0.3% |
| |||||||
State Street Institutional U.S. Government Money Market Fund, Class G Shares 0.96% (c) (d) | 11,263,378 | 11,263,378 | ||||||
State Street Navigator Securities Lending Government Money Market Portfolio (c) (e) | 42,538,543 | 42,538,543 | ||||||
|
| |||||||
TOTAL SHORT-TERM INVESTMENTS | 53,801,921 | |||||||
|
| |||||||
TOTAL INVESTMENTS — 100.2% | ||||||||
(Cost $19,440,512,998) | 16,657,247,409 | |||||||
LIABILITIES IN EXCESS OF OTHER ASSETS — (0.2)% | (39,412,460 | ) | ||||||
|
| |||||||
NET ASSETS — 100.0% | $ | 16,617,834,949 | ||||||
|
| |||||||
| (a) | All or a portion of the shares of the security are on loan at September 30, 2017. |
| (b) | Non-income producing security. |
| (c) | The Fund invested in certain money market funds managed by SSGA Funds Management, Inc. Amounts related to these transactions during the period ended September 30, 2017 are shown in the Affiliate Table below. |
| (d) | The rate shown is the annualized seven-day yield at September 30, 2017. |
| (e) | Investment of cash collateral for securities loaned. |
The following table summarizes the value of the Fund’s investments according to the fair value hierarchy as of September 30, 2017.
Description | Level 1 — Quoted Prices | Level 2 — Other Significant Observable Inputs | Level 3 — Significant Unobservable Inputs | Total | ||||||||||||
ASSETS: | ||||||||||||||||
INVESTMENTS: | ||||||||||||||||
Common Stocks | ||||||||||||||||
Energy Equipment & Services | $ | 2,430,387,426 | $ | — | $ | — | $ | 2,430,387,426 | ||||||||
Oil, Gas & Consumable Fuels | 14,173,058,062 | — | — | 14,173,058,062 | ||||||||||||
Short-Term Investments | 53,801,921 | — | — | 53,801,921 | ||||||||||||
|
|
|
|
|
|
|
| |||||||||
TOTAL INVESTMENTS | $ | 16,657,247,409 | $ | — | $ | — | $ | 16,657,247,409 | ||||||||
|
|
|
|
|
|
|
| |||||||||
See accompanying notes to financial statements.
46
Table of Contents
The Energy Select Sector SPDR Fund
SCHEDULE OF INVESTMENTS (continued)
September 30, 2017
Affiliate Table
| Number of Shares Held at 9/30/16 | Value At 9/30/16 | Cost of Purchases | Proceeds from Shares Sold | Realized Gain (Loss) | Change in Unrealized Appreciation/ Depreciation | Number of Shares Held at 9/30/17 | Value at 9/30/17 | Dividend Income | ||||||||||||||||||||||||||||
State Street Institutional Liquid Reserves Fund, Premier Class | 4,913,487 | $ | 4,913,487 | $ | 922,513 | $ | 5,836,000 | $ | — | $ | — | — | $ | — | $ | — | ||||||||||||||||||||
State Street Institutional U.S. Government Money Market Fund, Class G Shares | — | — | 451,640,092 | 440,376,714 | — | — | 11,263,378 | 11,263,378 | 140,857 | |||||||||||||||||||||||||||
State Street Institutional U.S. Government Money Market Fund, Premier Class | — | — | 279,156,049 | 279,156,049 | — | — | — | — | 81,771 | |||||||||||||||||||||||||||
State Street Navigator Securities Lending Government Money Market Portfolio* | 110,721,515 | 110,721,515 | 229,398,218 | 297,581,190 | — | — | 42,538,543 | 42,538,543 | 237,014 | |||||||||||||||||||||||||||
|
|
|
|
|
|
|
|
|
|
|
|
|
| |||||||||||||||||||||||
TOTAL | $ | 115,635,002 | $ | 961,116,872 | $ | 1,022,949,953 | $ | — | $ | — | $ | 53,801,921 | $ | 459,642 | ||||||||||||||||||||||
|
|
|
|
|
|
|
|
|
|
|
|
|
| |||||||||||||||||||||||
| * | Effective October 5, 2016, the name of State Street Navigator Securities Lending Prime Portfolio was changed to State Street Navigator Securities Lending Government Money Market Portfolio. |
See accompanying notes to financial statements.
47
Table of Contents
The Financial Select Sector SPDR Fund
SCHEDULE OF INVESTMENTS
September 30, 2017
Security Description | Shares | Value | ||||||
COMMON STOCKS — 99.8% | ||||||||
BANKS — 44.1% | ||||||||
Bank of America Corp | 85,206,586 | $ | 2,159,134,889 | |||||
BB&T Corp | 7,017,409 | 329,397,178 | ||||||
Citigroup, Inc | 23,659,591 | 1,720,998,649 | ||||||
Citizens Financial Group, Inc | 4,347,660 | 164,645,884 | ||||||
Comerica, Inc | 1,527,530 | 116,489,438 | ||||||
Fifth Third Bancorp | 6,397,775 | 179,009,745 | ||||||
Huntington Bancshares, Inc | 9,466,217 | 132,148,389 | ||||||
JPMorgan Chase & Co | 30,558,774 | 2,918,668,505 | ||||||
KeyCorp | 9,444,646 | 177,748,238 | ||||||
M&T Bank Corp | 1,319,148 | 212,435,594 | ||||||
People’s United Financial, Inc. (a) | 2,990,225 | 54,242,682 | ||||||
PNC Financial Services Group, Inc | 4,161,037 | 560,782,956 | ||||||
Regions Financial Corp | 10,378,468 | 158,064,068 | ||||||
SunTrust Banks, Inc | 4,168,162 | 249,131,043 | ||||||
US Bancorp. | 13,800,160 | 739,550,574 | ||||||
Wells Fargo & Co | 38,795,903 | 2,139,594,050 | ||||||
Zions Bancorp | 1,755,870 | 82,841,947 | ||||||
|
| |||||||
| 12,094,883,829 | ||||||||
|
| |||||||
CAPITAL MARKETS — 20.6% |
| |||||||
Affiliated Managers Group, Inc | 486,002 | 92,257,760 | ||||||
Ameriprise Financial, Inc | 1,301,667 | 193,310,566 | ||||||
Bank of New York Mellon Corp | 8,971,670 | 475,677,943 | ||||||
BlackRock, Inc | 1,076,673 | 481,369,732 | ||||||
CBOE Holdings, Inc. (a) | 979,480 | 105,421,432 | ||||||
Charles Schwab Corp | 10,349,158 | 452,672,171 | ||||||
CME Group, Inc | 2,951,518 | 400,461,962 | ||||||
E*TRADE Financial Corp. (b) | 2,388,882 | 104,179,144 | ||||||
Franklin Resources, Inc | 2,857,423 | 127,183,898 | ||||||
Goldman Sachs Group, Inc | 3,124,001 | 740,981,797 | ||||||
Intercontinental Exchange, Inc | 5,110,388 | 351,083,656 | ||||||
Invesco, Ltd | 3,533,522 | 123,814,611 | ||||||
Moody’s Corp | 1,442,925 | 200,869,589 | ||||||
Morgan Stanley | 12,280,262 | 591,540,221 | ||||||
Nasdaq, Inc | 1,014,165 | 78,668,779 | ||||||
Northern Trust Corp | 1,865,123 | 171,460,757 | ||||||
Raymond James Financial, Inc | 1,114,858 | 94,015,975 | ||||||
S&P Global, Inc | 2,231,476 | 348,802,014 | ||||||
State Street Corp. (c) | 3,247,550 | 310,270,927 | ||||||
T Rowe Price Group, Inc | 2,086,866 | 189,174,403 | ||||||
|
| |||||||
| 5,633,217,337 | ||||||||
|
| |||||||
CONSUMER FINANCE — 5.0% |
| |||||||
American Express Co | 6,371,701 | 576,384,072 | ||||||
Capital One Financial Corp | 4,200,312 | 355,598,414 | ||||||
Discover Financial Services | 3,233,898 | 208,521,743 | ||||||
Navient Corp | 2,379,875 | 35,745,722 | ||||||
Synchrony Financial | 6,491,693 | 201,567,068 | ||||||
|
| |||||||
| 1,377,817,019 | ||||||||
|
| |||||||
DIVERSIFIED FINANCIAL SERVICES — 11.4% |
| |||||||
Berkshire Hathaway, Inc. Class B (b) | 16,709,627 | 3,063,208,822 | ||||||
Leucadia National Corp | 2,749,856 | 69,433,864 | ||||||
|
| |||||||
| 3,132,642,686 | ||||||||
|
| |||||||
INSURANCE — 18.7% |
| |||||||
Aflac, Inc | 3,432,217 | $ | 279,348,142 | |||||
Allstate Corp | 3,137,959 | 288,409,812 | ||||||
American International Group, Inc | 7,845,464 | 481,633,035 | ||||||
Aon PLC | 2,208,414 | 322,649,285 | ||||||
Arthur J Gallagher & Co | 1,564,758 | 96,310,855 | ||||||
Assurant, Inc | 467,858 | 44,689,796 | ||||||
Brighthouse Financial, Inc. (b) | 831,786 | 50,572,589 | ||||||
Chubb, Ltd | 4,042,000 | 576,187,100 | ||||||
Cincinnati Financial Corp | 1,295,773 | 99,217,339 | ||||||
Everest Re Group, Ltd | 356,802 | 81,490,009 | ||||||
Hartford Financial Services Group, Inc | 3,163,349 | 175,344,435 | ||||||
Lincoln National Corp | 1,923,950 | 141,371,846 | ||||||
Loews Corp | 2,396,833 | 114,712,427 | ||||||
Marsh & McLennan Cos., Inc | 4,450,835 | 373,024,481 | ||||||
MetLife, Inc | 9,229,379 | 479,466,239 | ||||||
Principal Financial Group, Inc | 2,333,669 | 150,148,264 | ||||||
Progressive Corp | 5,052,898 | 244,661,321 | ||||||
Prudential Financial, Inc | 3,708,126 | 394,247,956 | ||||||
Torchmark Corp | 939,068 | 75,209,956 | ||||||
Travelers Cos., Inc | 2,396,281 | 293,592,348 | ||||||
Unum Group | 1,959,393 | 100,183,764 | ||||||
Willis Towers Watson PLC | 1,166,293 | 179,877,369 | ||||||
XL Group, Ltd | 2,240,293 | 88,379,559 | ||||||
|
| |||||||
| 5,130,727,927 | ||||||||
|
| |||||||
TOTAL COMMON STOCKS | 27,369,288,798 | |||||||
|
| |||||||
SHORT-TERM INVESTMENT — 0.2% |
| |||||||
State Street Institutional U.S. Government Money Market Fund, Class G Shares 0.96% (d) (e) | 39,927,132 | 39,927,132 | ||||||
|
| |||||||
TOTAL INVESTMENTS — 100.0% | ||||||||
(Cost $25,066,184,699) | 27,409,215,930 | |||||||
OTHER ASSETS IN EXCESS OF LIABILITIES — 0.0% (f) | 9,635,786 | |||||||
|
| |||||||
NET ASSETS — 100.0% | $ | 27,418,851,716 | ||||||
|
| |||||||
| (a) | All or a portion of the shares of the security are on loan at September 30, 2017. |
| (b) | Non-income producing security. |
| (c) | The Fund invested in an affiliated entity, State Street Corp. Amounts related to these transactions during the period ended September 30, 2017 are shown in the Affiliate Table below. |
| (d) | The Fund invested in certain money market funds managed by SSGA Funds Management, Inc. Amounts related to these transactions during the period ended September 30, 2017 are shown in the Affiliate Table below. |
| (e) | The rate shown is the annualized seven-day yield at September 30, 2017. |
| (f) | Amount is less than 0.05% of net assets. |
See accompanying notes to financial statements.
48
Table of Contents
The Financial Select Sector SPDR Fund
SCHEDULE OF INVESTMENTS (continued)
September 30, 2017
The following table summarizes the value of the Fund’s investments according to the fair value hierarchy as of September 30, 2017.
Description | Level 1 — Quoted Prices | Level 2 — Other Significant Observable Inputs | Level 3 — Significant Unobservable Inputs | Total | ||||||||||||
ASSETS: | ||||||||||||||||
INVESTMENTS: | ||||||||||||||||
Common Stocks | ||||||||||||||||
Banks | $ | 12,094,883,829 | $ | — | $ | — | $ | 12,094,883,829 | ||||||||
Capital Markets | 5,633,217,337 | — | — | 5,633,217,337 | ||||||||||||
Consumer Finance | 1,377,817,019 | — | — | 1,377,817,019 | ||||||||||||
Diversified Financial Services | 3,132,642,686 | — | — | 3,132,642,686 | ||||||||||||
Insurance | 5,130,727,927 | — | — | 5,130,727,927 | ||||||||||||
Short-Term Investment | 39,927,132 | — | — | 39,927,132 | ||||||||||||
|
|
|
|
|
|
|
| |||||||||
TOTAL INVESTMENTS | $ | 27,409,215,930 | $ | — | $ | — | $ | 27,409,215,930 | ||||||||
|
|
|
|
|
|
|
| |||||||||
Affiliate Table
| Number of Shares Held at 9/30/16 | Value At 9/30/16 | Cost of Purchases | Proceeds from Shares Sold | Realized Gain (Loss) | Change in Unrealized Appreciation/ Depreciation | Number of Shares Held at 9/30/17 | Value at 9/30/17 | Dividend Income | ||||||||||||||||||||||||||||
State Street Corp. | 1,830,359 | $ | 127,447,897 | $ | 292,859,193 | $ | 176,434,498 | $ | 16,619,598 | $ | 49,778,737 | 3,247,550 | $ | 310,270,927 | $ | 4,623,857 | ||||||||||||||||||||
State Street Institutional Liquid Reserves Fund, Premier Class | 13,433,038 | 13,433,038 | 2,992,289 | 16,425,327 | — | — | — | — | | 219 | | |||||||||||||||||||||||||
State Street Institutional U.S. Government Money Market Fund, Class G Shares | — | — | 346,122,500 | 306,195,368 | — | — | 39,927,132 | 39,927,132 | 165,797 | |||||||||||||||||||||||||||
State Street Institutional U.S. Government Money Market Fund, Premier Class | — | — | 423,041,034 | 423,041,034 | — | — | — | — | 99,671 | |||||||||||||||||||||||||||
State Street Navigator Securities Lending Government Money Market Portfolio* | 2,032,880 | 2,032,880 | 11,435 | 2,044,315 | — | — | — | — | — | |||||||||||||||||||||||||||
The Real Estate Select Sector SPDR Fund | 540 | 17,696 | — | 17,039 | (1,013 | ) | 356 | — | — | — | ||||||||||||||||||||||||||
|
|
|
|
|
|
|
|
|
|
|
|
|
| |||||||||||||||||||||||
TOTAL | $ | 142,931,511 | $ | 1,065,026,451 | $ | 924,157,581 | $ | 16,618,585 | $ | 49,779,093 | $ | 350,198,059 | $ | 4,889,544 | ||||||||||||||||||||||
|
|
|
|
|
|
|
|
|
|
|
|
|
| |||||||||||||||||||||||
| * | Effective October 5, 2016, the name of State Street Navigator Securities Lending Prime Portfolio was changed to State Street Navigator Securities Lending Government Money Market Portfolio. |
See accompanying notes to financial statements.
49
Table of Contents
The Health Care Select Sector SPDR Fund
SCHEDULE OF INVESTMENTS
September 30, 2017
Security Description | Shares | Value | ||||||
COMMON STOCKS — 99.8% | ||||||||
BIOTECHNOLOGY — 21.9% | ||||||||
AbbVie, Inc | 8,978,331 | $ | 797,814,493 | |||||
Alexion Pharmaceuticals, Inc. (a) | 1,256,762 | 176,311,141 | ||||||
Amgen, Inc | 4,108,771 | 766,080,353 | ||||||
Biogen, Inc. (a) | 1,217,296 | 381,159,724 | ||||||
Celgene Corp. (a) | 4,404,861 | 642,316,831 | ||||||
Gilead Sciences, Inc | 7,354,111 | 595,830,073 | ||||||
Incyte Corp. (a) | 961,157 | 112,205,468 | ||||||
Regeneron Pharmaceuticals, Inc. (a) | 432,620 | 193,433,054 | ||||||
Vertex Pharmaceuticals, Inc. (a) | 1,419,908 | 215,882,812 | ||||||
|
| |||||||
| 3,881,033,949 | ||||||||
|
| |||||||
HEALTH CARE EQUIPMENT & SUPPLIES — 18.9% |
| |||||||
Abbott Laboratories | 8,297,850 | 442,773,276 | ||||||
Align Technology, Inc. (a) | 406,036 | 75,632,326 | ||||||
Baxter International, Inc | 2,865,471 | 179,808,305 | ||||||
Becton Dickinson and Co | 1,316,750 | 258,017,163 | ||||||
Boston Scientific Corp. (a) | 7,798,321 | 227,477,024 | ||||||
C.R. Bard, Inc | 435,668 | 139,631,594 | ||||||
Cooper Cos., Inc | 275,113 | 65,232,043 | ||||||
Danaher Corp | 3,445,937 | 295,592,476 | ||||||
DENTSPLY SIRONA, Inc | 1,292,452 | 77,301,554 | ||||||
Edwards Lifesciences Corp. (a) | 1,183,411 | 129,358,656 | ||||||
Hologic, Inc. (a) | 1,587,063 | 58,229,341 | ||||||
IDEXX Laboratories, Inc. (a) | 528,000 | 82,098,720 | ||||||
Intuitive Surgical, Inc. (a) | 209,999 | 219,633,754 | ||||||
Medtronic PLC | 7,663,263 | 595,971,964 | ||||||
ResMed, Inc | 801,670 | 61,696,523 | ||||||
Stryker Corp | 1,842,165 | 261,624,273 | ||||||
Varian Medical Systems, Inc. (a) | 517,008 | 51,731,821 | ||||||
Zimmer Biomet Holdings, Inc | 1,153,607 | 135,075,844 | ||||||
|
| |||||||
| 3,356,886,657 | ||||||||
|
| |||||||
HEALTH CARE PROVIDERS & SERVICES — 19.0% |
| |||||||
Aetna, Inc | 1,918,596 | 305,075,950 | ||||||
AmerisourceBergen Corp | 947,703 | 78,422,423 | ||||||
Anthem, Inc | 1,517,943 | 288,227,017 | ||||||
Cardinal Health, Inc | 1,799,905 | 120,449,643 | ||||||
Centene Corp. (a) | 971,926 | 94,053,279 | ||||||
Cigna Corp | 1,466,765 | 274,197,049 | ||||||
DaVita, Inc. (a) | 861,233 | 51,148,628 | ||||||
Envision Healthcare Corp. (a) | 710,197 | 31,923,355 | ||||||
Express Scripts Holding Co. (a) | 3,423,336 | 216,765,636 | ||||||
HCA Healthcare, Inc. (a) | 1,614,315 | 128,483,331 | ||||||
Henry Schein, Inc. (a) | 893,493 | 73,257,491 | ||||||
Humana, Inc | 874,765 | 213,118,997 | ||||||
Laboratory Corp. of America Holdings (a) | 573,301 | 86,551,252 | ||||||
McKesson Corp | 1,219,702 | 187,358,424 | ||||||
Patterson Cos., Inc. (b) | 462,383 | 17,871,103 | ||||||
Quest Diagnostics, Inc | 796,739 | 74,606,640 | ||||||
UnitedHealth Group, Inc | 5,489,598 | 1,075,137,768 | ||||||
Universal Health Services, Inc. Class B | 497,652 | 55,209,513 | ||||||
|
| |||||||
| 3,371,857,499 | ||||||||
|
| |||||||
HEALTH CARE TECHNOLOGY — 0.7% |
| |||||||
Cerner Corp. (a) | 1,774,838 | 126,581,446 | ||||||
|
| |||||||
LIFE SCIENCES TOOLS & SERVICES — 5.7% |
| |||||||
Agilent Technologies, Inc | 1,809,566 | $ | 116,174,137 | |||||
Illumina, Inc. (a) | 823,644 | 164,069,885 | ||||||
Mettler-Toledo International, Inc. (a) | 144,552 | 90,512,680 | ||||||
PerkinElmer, Inc | 618,511 | 42,658,704 | ||||||
Quintiles IMS Holdings, Inc. (a) | 854,197 | 81,208,509 | ||||||
Thermo Fisher Scientific, Inc | 2,254,130 | 426,481,396 | ||||||
Waters Corp. (a) | 449,503 | 80,694,778 | ||||||
|
| |||||||
| 1,001,800,089 | ||||||||
|
| |||||||
PHARMACEUTICALS — 33.6% |
| |||||||
Allergan PLC | 1,986,608 | 407,155,309 | ||||||
Bristol-Myers Squibb Co | 9,281,747 | 591,618,554 | ||||||
Eli Lilly & Co | 5,455,911 | 466,698,627 | ||||||
Johnson & Johnson | 15,114,133 | 1,964,988,431 | ||||||
Merck & Co., Inc | 15,402,789 | 986,240,580 | ||||||
Mylan NV (a) | 3,023,383 | 94,843,525 | ||||||
Perrigo Co. PLC | 746,317 | 63,175,734 | ||||||
Pfizer, Inc | 33,607,236 | 1,199,778,325 | ||||||
Zoetis, Inc | 2,768,751 | 176,535,564 | ||||||
|
| |||||||
| 5,951,034,649 | ||||||||
|
| |||||||
TOTAL COMMON STOCKS | 17,689,194,289 | |||||||
|
| |||||||
SHORT-TERM INVESTMENT — 0.1% |
| |||||||
State Street Institutional U.S. Government Money Market Fund, Class G Shares 0.96% (c) (d) | 10,549,299 | 10,549,299 | ||||||
|
| |||||||
TOTAL INVESTMENTS — 99.9% | ||||||||
(Cost $17,049,369,955) | 17,699,743,588 | |||||||
OTHER ASSETS IN EXCESS OF LIABILITIES — 0.1% | 11,882,999 | |||||||
|
| |||||||
NET ASSETS — 100.0% | $ | 17,711,626,587 | ||||||
|
| |||||||
| (a) | Non-income producing security. |
| (b) | All or a portion of the shares of the security are on loan at September 30, 2017. |
| (c) | The Fund invested in certain money market funds managed by SSGA Funds Management, Inc. Amounts related to these transactions during the period ended September 30, 2017 are shown in the Affiliate Table below. |
| (d) | The rate shown is the annualized seven-day yield at September 30, 2017. |
See accompanying notes to financial statements.
50
Table of Contents
The Health Care Select Sector SPDR Fund
SCHEDULE OF INVESTMENTS (continued)
September 30, 2017
The following table summarizes the value of the Fund’s investments according to the fair value hierarchy as of September 30, 2017.
Description | Level 1 — Quoted Prices | Level 2 — Other Significant Observable Inputs | Level 3 — Significant Unobservable Inputs | Total | ||||||||||||
ASSETS: | ||||||||||||||||
INVESTMENTS: | ||||||||||||||||
Common Stocks | ||||||||||||||||
Biotechnology | $ | 3,881,033,949 | $ | — | $ | — | $ | 3,881,033,949 | ||||||||
Health Care Equipment & Supplies | 3,356,886,657 | — | — | 3,356,886,657 | ||||||||||||
Health Care Providers & Services | 3,371,857,499 | — | — | 3,371,857,499 | ||||||||||||
Health Care Technology | 126,581,446 | — | — | 126,581,446 | ||||||||||||
Life Sciences Tools & Services | 1,001,800,089 | — | — | 1,001,800,089 | ||||||||||||
Pharmaceuticals | 5,951,034,649 | — | — | 5,951,034,649 | ||||||||||||
Short-Term Investment | 10,549,299 | — | — | 10,549,299 | ||||||||||||
|
|
|
|
|
|
|
| |||||||||
TOTAL INVESTMENTS | $ | 17,699,743,588 | $ | — | $ | — | $ | 17,699,743,588 | ||||||||
|
|
|
|
|
|
|
| |||||||||
Affiliate Table
| Number of Shares Held at 9/30/16 | Value At 9/30/16 | Cost of Purchases | Proceeds from Shares Sold | Realized Gain (Loss) | Change in Unrealized Appreciation/ Depreciation | Number of Shares Held at 9/30/17 | Value at 9/30/17 | Dividend Income | ||||||||||||||||||||||||||||
State Street Institutional Liquid Reserves Fund, Premier Class | 5,734,739 | $ | 5,734,739 | $ | 599,604 | $ | 6,334,343 | $ | — | $ | — | — | $ | — | $ | — | ||||||||||||||||||||
State Street Institutional U.S. Government Money Market Fund, Class G Shares | — | — | 188,076,812 | 177,527,513 | — | — | 10,549,299 | 10,549,299 | 89,350 | |||||||||||||||||||||||||||
State Street Institutional U.S. Government Money Market Fund, Premier Class | — | — | 337,283,000 | 337,283,000 | — | — | — | — | 72,068 | |||||||||||||||||||||||||||
State Street Navigator Securities Lending Government Money Market Portfolio* | 6,558,639 | 6,558,639 | 17,370,405 | 23,929,044 | — | — | — | — | 476 | |||||||||||||||||||||||||||
|
|
|
|
|
|
|
|
|
|
|
|
|
| |||||||||||||||||||||||
TOTAL | $ | 12,293,378 | $ | 543,329,821 | $ | 545,073,900 | $ | — | $ | — | $ | 10,549,299 | $ | 161,894 | ||||||||||||||||||||||
|
|
|
|
|
|
|
|
|
|
|
|
|
| |||||||||||||||||||||||
| * | Effective October 5, 2016, the name of State Street Navigator Securities Lending Prime Portfolio was changed to State Street Navigator Securities Lending Government Money Market Portfolio. |
See accompanying notes to financial statements.
51
Table of Contents
The Industrial Select Sector SPDR Fund
SCHEDULE OF INVESTMENTS
September 30, 2017
Security Description | Shares | Value | ||||||
COMMON STOCKS — 99.8% | ||||||||
AEROSPACE & DEFENSE — 24.8% | ||||||||
Arconic, Inc | 1,834,602 | $ | 45,644,898 | |||||
Boeing Co | 2,758,423 | 701,218,711 | ||||||
General Dynamics Corp | 1,440,146 | 296,065,214 | ||||||
L3 Technologies, Inc | 372,153 | 70,124,790 | ||||||
Lockheed Martin Corp | 1,262,549 | 391,756,329 | ||||||
Northrop Grumman Corp | 893,065 | 256,952,662 | ||||||
Raytheon Co | 1,508,276 | 281,414,136 | ||||||
Rockwell Collins, Inc | 998,469 | 130,509,883 | ||||||
Textron, Inc | 1,582,243 | 85,251,253 | ||||||
TransDigm Group, Inc. (a) | 231,578 | 59,202,916 | ||||||
United Technologies Corp | 3,665,686 | 425,512,831 | ||||||
|
| |||||||
| 2,743,653,623 | ||||||||
|
| |||||||
AIR FREIGHT & LOGISTICS — 7.1% |
| |||||||
C.H. Robinson Worldwide, Inc. (a) | 667,024 | 50,760,526 | ||||||
Expeditors International of Washington, Inc | 853,186 | 51,071,714 | ||||||
FedEx Corp | 1,258,532 | 283,899,649 | ||||||
United Parcel Service, Inc. Class B | 3,334,866 | 400,484,058 | ||||||
|
| |||||||
| 786,215,947 | ||||||||
|
| |||||||
AIRLINES — 4.8% |
| |||||||
Alaska Air Group, Inc | 585,360 | 44,645,407 | ||||||
American Airlines Group, Inc | 2,048,793 | 97,297,180 | ||||||
Delta Air Lines, Inc | 3,152,931 | 152,034,333 | ||||||
Southwest Airlines Co | 2,858,876 | 160,039,878 | ||||||
United Continental Holdings, Inc. (b) | 1,224,913 | 74,572,703 | ||||||
|
| |||||||
| 528,589,501 | ||||||||
|
| |||||||
BUILDING PRODUCTS — 3.4% |
| |||||||
Allegion PLC | 451,079 | 39,004,801 | ||||||
AO Smith Corp | 696,444 | 41,389,667 | ||||||
Fortune Brands Home & Security, Inc | 728,540 | 48,979,744 | ||||||
Johnson Controls International PLC | 4,441,444 | 178,945,779 | ||||||
Masco Corp | 1,686,114 | 65,775,307 | ||||||
|
| |||||||
| 374,095,298 | ||||||||
|
| |||||||
COMMERCIAL SERVICES & SUPPLIES — 3.0% |
| |||||||
Cintas Corp | 493,532 | 71,206,797 | ||||||
Republic Services, Inc | 1,088,639 | 71,915,492 | ||||||
Stericycle, Inc. (b) | 403,682 | 28,911,705 | ||||||
Waste Management, Inc | 2,100,176 | 164,380,776 | ||||||
|
| |||||||
| 336,414,770 | ||||||||
|
| |||||||
CONSTRUCTION & ENGINEERING — 0.9% |
| |||||||
Fluor Corp | 962,743 | 40,531,480 | ||||||
Jacobs Engineering Group, Inc | 570,315 | 33,232,255 | ||||||
Quanta Services, Inc. (b) | 719,607 | 26,891,714 | ||||||
|
| |||||||
| 100,655,449 | ||||||||
|
| |||||||
ELECTRICAL EQUIPMENT — 5.9% |
| |||||||
Acuity Brands, Inc. (a) | 199,742 | 34,211,810 | ||||||
AMETEK, Inc | 1,089,817 | 71,971,515 | ||||||
Eaton Corp. PLC | 2,589,359 | 198,836,877 | ||||||
Emerson Electric Co | 3,231,071 | 203,040,502 | ||||||
Rockwell Automation, Inc | 789,406 | 140,680,043 | ||||||
|
| |||||||
| 648,740,747 | ||||||||
|
| |||||||
INDUSTRIAL CONGLOMERATES — 18.2% |
| |||||||
3M Co | 2,909,912 | $ | 610,790,529 | |||||
General Electric Co | 30,477,543 | 736,946,990 | ||||||
Honeywell International, Inc | 3,824,859 | 542,135,515 | ||||||
Roper Technologies, Inc | 486,101 | 118,316,983 | ||||||
|
| |||||||
| 2,008,190,017 | ||||||||
|
| |||||||
MACHINERY — 17.4% |
| |||||||
Caterpillar, Inc | 2,997,573 | 373,827,329 | ||||||
Cummins, Inc | 1,381,197 | 232,082,532 | ||||||
Deere & Co | 1,704,392 | 214,054,591 | ||||||
Dover Corp | 892,128 | 81,531,578 | ||||||
Flowserve Corp | 618,491 | 26,341,532 | ||||||
Fortive Corp | 1,629,703 | 115,366,676 | ||||||
Illinois Tool Works, Inc | 1,564,816 | 231,530,175 | ||||||
Ingersoll-Rand PLC | 1,212,055 | 108,078,944 | ||||||
PACCAR, Inc | 1,943,778 | 140,612,901 | ||||||
Parker-Hannifin Corp | 795,607 | 139,247,137 | ||||||
Pentair PLC | 793,475 | 53,924,561 | ||||||
Snap-on, Inc. (a) | 274,329 | 40,877,764 | ||||||
Stanley Black & Decker, Inc | 728,364 | 109,961,113 | ||||||
Xylem, Inc | 850,962 | 53,295,750 | ||||||
|
| |||||||
| 1,920,732,583 | ||||||||
|
| |||||||
PROFESSIONAL SERVICES — 3.0% |
| |||||||
Equifax, Inc | 774,573 | 82,096,992 | ||||||
IHS Markit, Ltd. (b) | 1,737,039 | 76,568,679 | ||||||
Nielsen Holdings PLC | 1,590,529 | 65,927,427 | ||||||
Robert Half International, Inc | 851,615 | 42,870,299 | ||||||
Verisk Analytics, Inc. (b) | 739,457 | 61,515,428 | ||||||
|
| |||||||
| 328,978,825 | ||||||||
|
| |||||||
ROAD & RAIL — 9.7% |
| |||||||
CSX Corp | 5,233,248 | 283,956,037 | ||||||
JB Hunt Transport Services, Inc | 406,184 | 45,118,919 | ||||||
Kansas City Southern | 502,315 | 54,591,594 | ||||||
Norfolk Southern Corp | 1,610,714 | 213,000,819 | ||||||
Union Pacific Corp | 4,141,063 | 480,239,076 | ||||||
|
| |||||||
| 1,076,906,445 | ||||||||
|
| |||||||
TRADING COMPANIES & DISTRIBUTORS — 1.6% |
| |||||||
Fastenal Co | 1,369,570 | 62,425,001 | ||||||
United Rentals, Inc. (b) | 400,226 | 55,527,355 | ||||||
W.W. Grainger, Inc. (a) | 326,882 | 58,757,039 | ||||||
|
| |||||||
| 176,709,395 | ||||||||
|
| |||||||
TOTAL COMMON STOCKS | 11,029,882,600 | |||||||
|
| |||||||
SHORT-TERM INVESTMENT — 0.1% |
| |||||||
State Street Institutional U.S. Government Money Market Fund, Class G Shares 0.96% (c) (d) | 15,980,490 | 15,980,490 | ||||||
|
| |||||||
TOTAL INVESTMENTS — 99.9% | ||||||||
(Cost $10,625,749,575) | 11,045,863,090 | |||||||
OTHER ASSETS IN EXCESS OF LIABILITIES — 0.1% | 9,816,171 | |||||||
|
| |||||||
NET ASSETS — 100.0% | $ | 11,055,679,261 | ||||||
|
| |||||||
See accompanying notes to financial statements.
52
Table of Contents
The Industrial Select Sector SPDR Fund
SCHEDULE OF INVESTMENTS (continued)
September 30, 2017
| (a) | All or a portion of the shares of the security are on loan at September 30, 2017. |
| (b) | Non-income producing security. |
| (c) | The Fund invested in certain money market funds managed by SSGA Funds Management, Inc. Amounts related to these transactions during the period ended September 30, 2017 are shown in the Affiliate Table below. |
| (d) | The rate shown is the annualized seven-day yield at September 30, 2017. |
The following table summarizes the value of the Fund’s investments according to the fair value hierarchy as of September 30, 2017.
Description | Level 1 — Quoted Prices | Level 2 — Other Significant Observable Inputs | Level 3 — Significant Unobservable Inputs | Total | ||||||||||||
ASSETS: | ||||||||||||||||
INVESTMENTS: | ||||||||||||||||
Common Stocks | ||||||||||||||||
Aerospace & Defense. | $ | 2,743,653,623 | $ | — | $ | — | $ | 2,743,653,623 | ||||||||
Air Freight & Logistics | 786,215,947 | — | — | 786,215,947 | ||||||||||||
Airlines. | 528,589,501 | — | — | 528,589,501 | ||||||||||||
Building Products | 374,095,298 | — | — | 374,095,298 | ||||||||||||
Commercial Services & Supplies | 336,414,770 | — | — | 336,414,770 | ||||||||||||
Construction & Engineering | 100,655,449 | — | — | 100,655,449 | ||||||||||||
Electrical Equipment | 648,740,747 | — | — | 648,740,747 | ||||||||||||
Industrial Conglomerates | 2,008,190,017 | — | — | 2,008,190,017 | ||||||||||||
Machinery | 1,920,732,583 | — | — | 1,920,732,583 | ||||||||||||
Professional Services | 328,978,825 | — | — | 328,978,825 | ||||||||||||
Road & Rail | 1,076,906,445 | — | — | 1,076,906,445 | ||||||||||||
Trading Companies & Distributors | 176,709,395 | — | — | 176,709,395 | ||||||||||||
Short-Term Investment | 15,980,490 | — | — | 15,980,490 | ||||||||||||
|
|
|
|
|
|
|
| |||||||||
TOTAL INVESTMENTS | $ | 11,045,863,090 | $ | — | $ | — | $ | 11,045,863,090 | ||||||||
|
|
|
|
|
|
|
| |||||||||
Affiliate Table
| Number of Shares Held at 9/30/16 | Value At 9/30/16 | Cost of Purchases | Proceeds from Shares Sold | Realized Gain (Loss) | Change in Unrealized Appreciation/ Depreciation | Number of Shares Held at 9/30/17 | Value at 9/30/17 | Dividend Income | ||||||||||||||||||||||||||||
State Street Institutional Liquid Reserves Fund, Premier Class | 6,148,750 | $ | 6,148,750 | $ | 673,408 | $ | 6,822,158 | $ | — | $ | — | — | $ | — | $ | 86 | ||||||||||||||||||||
State Street Institutional U.S. Government Money Market Fund, Class G Shares | — | — | 158,347,688 | 142,367,198 | — | — | 15,980,490 | 15,980,490 | 57,756 | |||||||||||||||||||||||||||
State Street Institutional U.S. Government Money Market Fund, Premier Class | — | — | 191,003,404 | 191,003,404 | — | — | — | — | 65,526 | |||||||||||||||||||||||||||
State Street Navigator Securities Lending Government Money Market Portfolio* | — | — | 5,652,423 | 5,652,423 | — | — | — | — | 323 | |||||||||||||||||||||||||||
|
|
|
|
|
|
|
|
|
|
|
|
|
| |||||||||||||||||||||||
TOTAL | $ | 6,148,750 | $ | 355,676,923 | $ | 345,845,183 | $ | — | $ | — | $ | 15,980,490 | $ | 123,691 | ||||||||||||||||||||||
|
|
|
|
|
|
|
|
|
|
|
|
|
| |||||||||||||||||||||||
| * | Effective October 5, 2016, the name of State Street Navigator Securities Lending Prime Portfolio was changed to State Street Navigator Securities Lending Government Money Market Portfolio. |
See accompanying notes to financial statements.
53
Table of Contents
The Materials Select Sector SPDR Fund
SCHEDULE OF INVESTMENTS
September 30, 2017
Security Description | Shares | Value | ||||||
COMMON STOCKS — 99.8% | ||||||||
CHEMICALS — 72.8% | ||||||||
Air Products & Chemicals, Inc | 1,393,924 | $ | 210,789,187 | |||||
Albemarle Corp | 731,209 | 99,671,099 | ||||||
CF Industries Holdings, Inc | 1,602,298 | 56,336,798 | ||||||
DowDuPont, Inc | 13,413,810 | 928,638,066 | ||||||
Eastman Chemical Co | 965,388 | 87,357,960 | ||||||
Ecolab, Inc | 1,665,000 | 214,135,650 | ||||||
FMC Corp | 897,893 | 80,190,824 | ||||||
International Flavors & Fragrances, Inc | 530,332 | 75,789,746 | ||||||
LyondellBasell Industries NV Class A | 1,850,015 | 183,243,986 | ||||||
Monsanto Co | 2,791,666 | 334,497,420 | ||||||
Mosaic Co | 2,429,087 | 52,443,988 | ||||||
PPG Industries, Inc | 1,656,433 | 179,988,010 | ||||||
Praxair, Inc | 1,824,106 | 254,900,573 | ||||||
Sherwin-Williams Co | 530,329 | 189,878,995 | ||||||
|
| |||||||
| 2,947,862,302 | ||||||||
|
| |||||||
CONSTRUCTION MATERIALS — 4.7% |
| |||||||
Martin Marietta Materials, Inc | 418,545 | 86,316,535 | ||||||
Vulcan Materials Co | 871,689 | 104,254,005 | ||||||
|
| |||||||
| 190,570,540 | ||||||||
|
| |||||||
CONTAINERS & PACKAGING — 13.1% |
| |||||||
Avery Dennison Corp | 603,705 | 59,368,350 | ||||||
Ball Corp | 2,327,847 | 96,140,081 | ||||||
International Paper Co | 2,679,777 | 152,264,929 | ||||||
Packaging Corp. of America | 634,525 | 72,767,327 | ||||||
Sealed Air Corp | 1,306,798 | 55,826,410 | ||||||
WestRock Co | 1,681,478 | 95,390,247 | ||||||
|
| |||||||
| 531,757,344 | ||||||||
|
| |||||||
METALS & MINING — 9.2% |
| |||||||
Freeport-McMoRan, Inc. (a) | 8,799,113 | $ | 123,539,546 | |||||
Newmont Mining Corp | 3,480,195 | 130,542,114 | ||||||
Nucor Corp | 2,093,752 | 117,333,862 | ||||||
|
| |||||||
| 371,415,522 | ||||||||
|
| |||||||
TOTAL COMMON STOCKS | 4,041,605,708 | |||||||
|
| |||||||
SHORT-TERM INVESTMENT — 0.1% |
| |||||||
State Street Institutional U.S. Government Money Market Fund, Class G Shares 0.96% (b) (c) | 4,874,539 | 4,874,539 | ||||||
|
| |||||||
TOTAL INVESTMENTS — 99.9% |
| |||||||
(Cost $4,023,106,203) | 4,046,480,247 | |||||||
OTHER ASSETS IN EXCESS OF LIABILITIES — 0.1% | 4,921,604 | |||||||
|
| |||||||
NET ASSETS — 100.0% | $ | 4,051,401,851 | ||||||
|
| |||||||
| (a) | Non-income producing security. |
| (b) | The Fund invested in certain money market funds managed by SSGA Funds Management, Inc. Amounts related to these transactions during the period ended September 30, 2017 are shown in the Affiliate Table below. |
| (c) | The rate shown is the annualized seven-day yield at September 30, 2017. |
The following table summarizes the value of the Fund’s investments according to the fair value hierarchy as of September 30, 2017.
Description | Level 1 — Quoted Prices | Level 2 — Other Significant Observable Inputs | Level 3 — Significant Unobservable Inputs | Total | ||||||||||||
ASSETS: | ||||||||||||||||
INVESTMENTS: | ||||||||||||||||
Common Stocks | ||||||||||||||||
Chemicals. | $ | 2,947,862,302 | $ | — | $ | — | $ | 2,947,862,302 | ||||||||
Construction Materials. | 190,570,540 | — | — | 190,570,540 | ||||||||||||
Containers & Packaging | 531,757,344 | — | — | 531,757,344 | ||||||||||||
Metals & Mining. | 371,415,522 | — | — | 371,415,522 | ||||||||||||
Short-Term Investment | 4,874,539 | — | — | 4,874,539 | ||||||||||||
|
|
|
|
|
|
|
| |||||||||
TOTAL INVESTMENTS | $ | 4,046,480,247 | $ | — | $ | — | $ | 4,046,480,247 | ||||||||
|
|
|
|
|
|
|
| |||||||||
See accompanying notes to financial statements.
54
Table of Contents
The Materials Select Sector SPDR Fund
SCHEDULE OF INVESTMENTS (continued)
September 30, 2017
Affiliate Table
| Number of Shares Held at 9/30/16 | Value At 9/30/16 | Cost of Purchases | Proceeds from Shares Sold | Realized Gain (Loss) | Change in Unrealized Appreciation/ Depreciation | Number of Shares Held at 9/30/17 | Value at 9/30/17 | Dividend Income | ||||||||||||||||||||||||||||
State Street Institutional Liquid Reserves Fund, Premier Class | 1,117,308 | $ | 1,117,308 | $ | 482,047 | $ | 1,599,355 | $ | — | $ | — | — | $ | — | $ | — | ||||||||||||||||||||
State Street Institutional U.S. Government Money Market Fund, Class G Shares | — | — | 92,931,588 | 88,057,049 | — | — | 4,874,539 | 4,874,539 | 26,041 | |||||||||||||||||||||||||||
State Street Institutional U.S. Government Money Market Fund, Premier Class | — | — | 68,440,077 | 68,440,077 | — | — | — | — | 15,181 | |||||||||||||||||||||||||||
|
|
|
|
|
|
|
|
|
|
|
|
|
| |||||||||||||||||||||||
TOTAL | $ | 1,117,308 | $ | 161,853,712 | $ | 158,096,481 | $ | — | $ | — | $ | 4,874,539 | $ | 41,222 | ||||||||||||||||||||||
|
|
|
|
|
|
|
|
|
|
|
|
|
| |||||||||||||||||||||||
See accompanying notes to financial statements.
55
Table of Contents
The Real Estate Select Sector SPDR Fund
SCHEDULE OF INVESTMENTS
September 30, 2017
Security Description | Shares | Value | ||||||
COMMON STOCKS — 99.8% |
| |||||||
REAL ESTATE INVESTMENT TRUSTS (REITS) — 98.0% |
| |||||||
Alexandria Real Estate Equities, Inc. REIT | 341,508 | $ | 40,629,207 | |||||
American Tower Corp. REIT | 1,565,326 | 213,948,758 | ||||||
Apartment Investment & Management Co. Class A REIT | 570,846 | 25,037,306 | ||||||
AvalonBay Communities, Inc. REIT | 503,646 | 89,860,519 | ||||||
Boston Properties, Inc. REIT | 562,809 | 69,157,970 | ||||||
Crown Castle International Corp. REIT | 1,481,727 | 148,143,065 | ||||||
Digital Realty Trust, Inc. REIT | 746,661 | 88,352,396 | ||||||
Duke Realty Corp. REIT | 1,297,472 | 37,393,143 | ||||||
Equinix, Inc. REIT | 284,134 | 126,809,004 | ||||||
Equity Residential REIT | 1,339,699 | 88,326,355 | ||||||
Essex Property Trust, Inc. REIT | 240,690 | 61,142,481 | ||||||
Extra Space Storage, Inc. REIT (a) | 459,288 | 36,706,297 | ||||||
Federal Realty Investment Trust REIT | 263,549 | 32,735,421 | ||||||
GGP, Inc. REIT (a) | 2,279,399 | 47,343,117 | ||||||
HCP, Inc. REIT | 1,710,431 | 47,601,295 | ||||||
Host Hotels & Resorts, Inc. REIT | 2,699,142 | 49,907,136 | ||||||
Iron Mountain, Inc. REIT | 962,408 | 37,437,671 | ||||||
Kimco Realty Corp. REIT (a) | 1,547,502 | 30,253,664 | ||||||
Macerich Co. REIT | 397,113 | 21,829,302 | ||||||
Mid-America Apartment Communities, Inc. REIT | 414,380 | 44,288,934 | ||||||
Prologis, Inc. REIT | 1,939,843 | 123,102,437 | ||||||
Public Storage REIT | 545,761 | 116,787,396 | ||||||
Realty Income Corp. REIT (a) | 999,614 | 57,167,925 | ||||||
Regency Centers Corp. REIT | 539,650 | 33,479,886 | ||||||
SBA Communications Corp. REIT (b) | 439,027 | 63,241,839 | ||||||
Simon Property Group, Inc. REIT | 1,133,754 | 182,545,732 | ||||||
SL Green Realty Corp. REIT | 360,945 | 36,570,947 | ||||||
UDR, Inc. REIT | 975,910 | 37,113,857 | ||||||
Ventas, Inc. REIT | 1,298,972 | 84,602,046 | ||||||
Vornado Realty Trust REIT | 628,800 | $ | 48,342,144 | |||||
Welltower, Inc. REIT | 1,345,463 | 94,559,140 | ||||||
Weyerhaeuser Co. REIT | 2,746,221 | 93,453,901 | ||||||
|
| |||||||
| 2,307,870,291 | ||||||||
|
| |||||||
REAL ESTATE MANAGEMENT & DEVELOPMENT — 1.8% |
| |||||||
CBRE Group, Inc. Class A (b) | 1,096,982 | 41,553,678 | ||||||
|
| |||||||
TOTAL COMMON STOCKS | 2,349,423,969 | |||||||
|
| |||||||
SHORT-TERM INVESTMENT — 0.3% |
| |||||||
State Street Institutional U.S. Government Money Market Fund, Class G Shares 0.96% (c) (d) | 6,853,382 | 6,853,382 | ||||||
|
| |||||||
TOTAL INVESTMENTS — 100.1% | ||||||||
(Cost $2,441,081,420) | 2,356,277,351 | |||||||
LIABILITIES IN EXCESS OF OTHER ASSETS — (0.1)% | (1,459,411 | ) | ||||||
|
| |||||||
NET ASSETS — 100.0% | $ | 2,354,817,940 | ||||||
|
| |||||||
| (a) | All or a portion of the shares of the security are on loan at September 30, 2017. |
| (b) | Non-income producing security. |
| (c) | The Fund invested in certain money market funds managed by SSGA Funds Management, Inc. Amounts related to these transactions during the period ended September 30, 2017 are shown in the Affiliate Table below. |
| (d) | The rate shown is the annualized seven-day yield at September 30, 2017. |
| REIT | = Real Estate Investment Trust |
The following table summarizes the value of the Fund’s investments according to the fair value hierarchy as of September 30, 2017.
Description | Level 1 — Quoted Prices | Level 2 — Other Significant Observable Inputs | Level 3 — Significant Unobservable Inputs | Total | ||||||||||||
ASSETS: | ||||||||||||||||
INVESTMENTS: | ||||||||||||||||
Common Stocks | ||||||||||||||||
Real Estate Investment Trusts (REITs) | $ | 2,307,870,291 | $ | — | $ | — | $ | 2,307,870,291 | ||||||||
Real Estate Management & Development | 41,553,678 | — | — | 41,553,678 | ||||||||||||
Short-Term Investment | 6,853,382 | — | — | 6,853,382 | ||||||||||||
|
|
|
|
|
|
|
| |||||||||
TOTAL INVESTMENTS | $ | 2,356,277,351 | $ | — | $ | — | $ | 2,356,277,351 | ||||||||
|
|
|
|
|
|
|
| |||||||||
See accompanying notes to financial statements.
56
Table of Contents
The Real Estate Select Sector SPDR Fund
SCHEDULE OF INVESTMENTS (continued)
September 30, 2017
Affiliate Table
| Number of Shares Held at 9/30/16 | Value At 9/30/16 | Cost of Purchases | Proceeds from Shares Sold | Realized Gain (Loss) | Change in Unrealized Appreciation/ Depreciation | Number of Shares Held at 9/30/17 | Value at 9/30/17 | Dividend Income | ||||||||||||||||||||||||||||
State Street Institutional Liquid Reserves Fund, Premier Class | 2,733,411 | $ | 2,733,411 | $ | 4,059,927 | $ | 6,793,338 | $ | — | $ | — | — | $ | — | $ | 208 | ||||||||||||||||||||
State Street Institutional U.S. Government Money Market Fund, Class G Shares | — | — | 69,653,546 | 62,800,164 | — | — | 6,853,382 | 6,853,382 | 19,597 | |||||||||||||||||||||||||||
State Street Institutional U.S. Government Money Market Fund, Premier Class | — | — | 108,923,203 | 108,923,203 | — | — | — | — | 10,923 | |||||||||||||||||||||||||||
State Street Navigator Securities Lending Government Montey Market Portfolio* | 55,520 | 55,520 | 37 | 55,557 | — | — | — | — | — | |||||||||||||||||||||||||||
|
|
|
|
|
|
|
|
|
|
|
|
|
| |||||||||||||||||||||||
TOTAL | $ | 2,788,931 | $ | 182,636,713 | $ | 178,572,262 | $ | — | $ | — | $ | 6,853,382 | $ | 30,728 | ||||||||||||||||||||||
|
|
|
|
|
|
|
|
|
|
|
|
|
| |||||||||||||||||||||||
| * | Effective October 5, 2016, the name of State Street Navigator Securities Lending Prime Portfolio was changed to State Street Navigator Securities Lending Government Money Market Portfolio. |
See accompanying notes to financial statements.
57
Table of Contents
The Technology Select Sector SPDR Fund
SCHEDULE OF INVESTMENTS
September 30, 2017
Security Description | Shares | Value | ||||||
COMMON STOCKS — 99.8% |
| |||||||
COMMUNICATIONS EQUIPMENT — 4.0% |
| |||||||
Cisco Systems, Inc | 16,253,119 | $ | 546,592,392 | |||||
F5 Networks, Inc. (a) | 222,019 | 26,766,611 | ||||||
Harris Corp | 410,424 | 54,044,632 | ||||||
Juniper Networks, Inc | 1,325,908 | 36,900,020 | ||||||
Motorola Solutions, Inc | 556,970 | 47,270,044 | ||||||
|
| |||||||
| 711,573,699 | ||||||||
|
| |||||||
DIVERSIFIED TELECOMMUNICATION SERVICES — 7.9% |
| |||||||
AT&T, Inc | 19,875,705 | 778,531,365 | ||||||
CenturyLink, Inc. (b) | 1,850,122 | 34,967,306 | ||||||
Level 3 Communications, Inc. (a) | 989,236 | 52,716,386 | ||||||
Verizon Communications, Inc | 10,924,501 | 540,653,555 | ||||||
|
| |||||||
| 1,406,868,612 | ||||||||
|
| |||||||
ELECTRONIC EQUIPMENT, INSTRUMENTS & COMPONENTS — 1.6% |
| |||||||
Amphenol Corp. Class A | 1,022,378 | 86,534,074 | ||||||
Corning, Inc | 3,006,207 | 89,945,713 | ||||||
FLIR Systems, Inc | 506,070 | 19,691,184 | ||||||
TE Connectivity, Ltd | 1,177,826 | 97,830,228 | ||||||
|
| |||||||
| 294,001,199 | ||||||||
|
| |||||||
INTERNET SOFTWARE & SERVICES — 18.9% |
| |||||||
Akamai Technologies, Inc. (a) | 589,808 | 28,735,446 | ||||||
Alphabet, Inc. Class A (a) | 964,711 | 939,358,395 | ||||||
Alphabet, Inc. Class C (a) | 977,052 | 937,100,343 | ||||||
eBay, Inc. (a) | 3,299,965 | 126,916,654 | ||||||
Facebook, Inc. Class A (a) | 7,672,715 | 1,311,036,812 | ||||||
VeriSign, Inc. (a) (b) | 298,828 | 31,792,311 | ||||||
|
| |||||||
| 3,374,939,961 | ||||||||
|
| |||||||
IT SERVICES — 15.8% |
| |||||||
Accenture PLC Class A | 2,017,498 | 272,503,455 | ||||||
Alliance Data Systems Corp | 164,804 | 36,512,326 | ||||||
Automatic Data Processing, Inc | 1,459,571 | 159,560,302 | ||||||
Cognizant Technology Solutions Corp. Class A | 1,945,005 | 141,090,663 | ||||||
CSRA, Inc | 629,479 | 20,313,287 | ||||||
DXC Technology Co | 918,676 | 78,895,895 | ||||||
Fidelity National Information Services, Inc | 1,104,335 | 103,133,846 | ||||||
Fiserv, Inc. (a) | 698,440 | 90,070,822 | ||||||
Gartner, Inc. (a) | 293,220 | 36,479,500 | ||||||
Global Payments, Inc | 520,453 | 49,458,649 | ||||||
International Business Machines Corp | 2,817,963 | 408,830,072 | ||||||
Mastercard, Inc. Class A | 3,042,906 | 429,658,327 | ||||||
Paychex, Inc | 1,069,470 | 64,125,421 | ||||||
PayPal Holdings, Inc. (a) | 3,713,285 | 237,761,638 | ||||||
Total System Services, Inc | 579,559 | 37,961,114 | ||||||
Visa, Inc. Class A | 5,946,482 | 625,807,766 | ||||||
Western Union Co | 1,597,793 | 30,677,626 | ||||||
|
| |||||||
| 2,822,840,709 | ||||||||
|
| |||||||
SEMICONDUCTORS & SEMICONDUCTOR EQUIPMENT — 14.9% |
| |||||||
Advanced Micro Devices, Inc. (a) (b) | 2,965,232 | 37,806,708 | ||||||
Analog Devices, Inc | 1,232,414 | 106,197,114 | ||||||
Applied Materials, Inc | 3,533,285 | 184,048,816 | ||||||
Broadcom, Ltd | 1,329,844 | 322,540,364 | ||||||
Intel Corp | 15,271,612 | $ | 581,542,985 | |||||
KLA-Tencor Corp | 534,152 | 56,620,112 | ||||||
Lam Research Corp | 548,207 | 101,440,223 | ||||||
Microchip Technology, Inc. (b) | 794,730 | 71,350,859 | ||||||
Micron Technology, Inc. (a) | 3,760,521 | 147,901,291 | ||||||
NVIDIA Corp | 1,990,860 | 355,906,042 | ||||||
Qorvo, Inc. (a) (b) | 447,730 | 31,645,556 | ||||||
QUALCOMM, Inc | 4,818,801 | 249,806,644 | ||||||
Skyworks Solutions, Inc | 625,191 | 63,706,963 | ||||||
Texas Instruments, Inc | 3,235,954 | 290,070,917 | ||||||
Xilinx, Inc. (b) | 846,195 | 59,935,992 | ||||||
|
| |||||||
| 2,660,520,586 | ||||||||
|
| |||||||
SOFTWARE — 20.1% |
| |||||||
Activision Blizzard, Inc | 2,517,171 | 162,382,701 | ||||||
Adobe Systems, Inc. (a) | 1,617,393 | 241,282,688 | ||||||
ANSYS, Inc. (a) | 274,380 | 33,674,658 | ||||||
Autodesk, Inc. (a) | 744,577 | 83,586,214 | ||||||
CA, Inc | 1,079,231 | 36,024,731 | ||||||
Cadence Design Systems, Inc. (a) | 898,422 | 35,460,716 | ||||||
Citrix Systems, Inc. (a) | 488,322 | 37,512,896 | ||||||
Electronic Arts, Inc. (a) | 1,026,156 | 121,147,977 | ||||||
Intuit, Inc | 804,936 | 114,413,603 | ||||||
Microsoft Corp | 24,933,079 | 1,857,265,055 | ||||||
Oracle Corp | 9,821,561 | 474,872,474 | ||||||
Red Hat, Inc. (a) | 600,407 | 66,561,120 | ||||||
salesforce.com, Inc. (a) | 2,235,891 | 208,876,937 | ||||||
Symantec Corp | 2,083,480 | 68,358,979 | ||||||
Synopsys, Inc. (a) | 487,225 | 39,236,229 | ||||||
|
| |||||||
| 3,580,656,978 | ||||||||
|
| |||||||
TECHNOLOGY HARDWARE, STORAGE & PERIPHERALS — 16.6% |
| |||||||
Apple, Inc | 16,721,591 | 2,577,131,605 | ||||||
Hewlett Packard Enterprise Co | 5,425,519 | 79,809,384 | ||||||
HP, Inc | 5,563,810 | 111,053,647 | ||||||
NetApp, Inc | 949,433 | 41,547,188 | ||||||
Seagate Technology PLC (b) | 1,013,017 | 33,601,774 | ||||||
Western Digital Corp | 999,304 | 86,339,866 | ||||||
Xerox Corp | 739,513 | 24,618,388 | ||||||
|
| |||||||
| 2,954,101,852 | ||||||||
|
| |||||||
TOTAL COMMON STOCKS | 17,805,503,596 | |||||||
|
| |||||||
SHORT-TERM INVESTMENTS — 0.2% |
| |||||||
State Street Institutional U.S. Government Money Market Fund, Class G Shares 0.96% (c) (d) | 26,740,576 | 26,740,576 | ||||||
State Street Navigator Securities Lending Government Money Market Portfolio (c) (e) | 979,738 | 979,738 | ||||||
|
| |||||||
TOTAL SHORT-TERM INVESTMENTS | 27,720,314 | |||||||
|
| |||||||
TOTAL INVESTMENTS — 100.0% | ||||||||
(Cost $15,505,855,754) | 17,833,223,910 | |||||||
LIABILITIES IN EXCESS OF OTHER ASSETS — (0.0)% (f) | (779,606 | ) | ||||||
|
| |||||||
NET ASSETS — 100.0% | $ | 17,832,444,304 | ||||||
|
| |||||||
See accompanying notes to financial statements.
58
Table of Contents
The Technology Select Sector SPDR Fund
SCHEDULE OF INVESTMENTS (continued)
September 30, 2017
| (a) | Non-income producing security. |
| (b) | All or a portion of the shares of the security are on loan at September 30, 2017. |
| (c) | The Fund invested in certain money market funds managed by SSGA Funds Management, Inc. Amounts related to these transactions during the period ended September 30, 2017 are shown in the Affiliate Table below. |
| (d) | The rate shown is the annualized seven-day yield at September 30, 2017. |
| (e) | Investment of cash collateral for securities loaned. |
| (f) | Amount is less than 0.05% of net assets. |
The following table summarizes the value of the Fund’s investments according to the fair value hierarchy as of September 30, 2017.
Description | Level 1 — Quoted Prices | Level 2 — Other Significant Observable Inputs | Level 3 — Significant Unobservable Inputs | Total | ||||||||||||
ASSETS: | ||||||||||||||||
INVESTMENTS: | ||||||||||||||||
Common Stocks | ||||||||||||||||
Communications Equipment | $ | 711,573,699 | $ | — | $ | — | $ | 711,573,699 | ||||||||
Diversified Telecommunication Services | 1,406,868,612 | — | — | 1,406,868,612 | ||||||||||||
Electronic Equipment, Instruments & Components | 294,001,199 | — | — | 294,001,199 | ||||||||||||
Internet Software & Services | 3,374,939,961 | — | — | 3,374,939,961 | ||||||||||||
IT Services | 2,822,840,709 | — | — | 2,822,840,709 | ||||||||||||
Semiconductors & Semiconductor Equipment | 2,660,520,586 | — | — | 2,660,520,586 | ||||||||||||
Software | 3,580,656,978 | — | — | 3,580,656,978 | ||||||||||||
Technology Hardware, Storage & Peripherals | 2,954,101,852 | — | — | 2,954,101,852 | ||||||||||||
Short-Term Investments | 27,720,314 | — | — | 27,720,314 | ||||||||||||
|
|
|
|
|
|
|
| |||||||||
TOTAL INVESTMENTS | $ | 17,833,223,910 | $ | — | $ | — | $ | 17,833,223,910 | ||||||||
|
|
|
|
|
|
|
| |||||||||
Affiliate Table
| Number of Shares Held at 9/30/16 | Value At 9/30/16 | Cost of Purchases | Proceeds from Shares Sold | Realized Gain (Loss) | Change in Unrealized Appreciation/ Depreciation | Number of Shares Held at 9/30/17 | Value at 9/30/17 | Dividend Income | ||||||||||||||||||||||||||||
State Street Institutional Liquid Reserves Fund, Premier Class | 27,822,383 | $ | 27,822,383 | $ | 2,030,483 | $ | 29,852,866 | $ | — | $ | — | — | $ | — | $ | 712 | ||||||||||||||||||||
State Street Institutional U.S. Government Money Market Fund, Class G Shares | — | — | 211,247,493 | 184,506,917 | — | — | 26,740,576 | 26,740,576 | 151,358 | |||||||||||||||||||||||||||
State Street Institutional U.S. Government Money Market Fund, Premier Class | — | — | 343,519,938 | 343,519,938 | — | — | — | — | 97,104 | |||||||||||||||||||||||||||
State Street Navigator Securities Lending Government Money Market Portfolio* | 29,868,275 | 29,868,275 | 76,506,528 | 105,395,065 | — | — | 979,738 | 979,738 | 19,578 | |||||||||||||||||||||||||||
|
|
|
|
|
|
|
|
|
|
|
|
|
| |||||||||||||||||||||||
TOTAL | $ | 57,690,658 | $ | 633,304,442 | $ | 663,274,786 | $ | — | $ | — | $ | 27,720,314 | $ | 268,752 | ||||||||||||||||||||||
|
|
|
|
|
|
|
|
|
|
|
|
|
| |||||||||||||||||||||||
| * | Effective October 5, 2016, the name of State Street Navigator Securities Lending Prime Portfolio was changed to State Street Navigator Securities Lending Government Money Market Portfolio. |
See accompanying notes to financial statements.
59
Table of Contents
The Utilities Select Sector SPDR Fund
SCHEDULE OF INVESTMENTS
September 30, 2017
Security Description | Shares | Value | ||||||
COMMON STOCKS — 99.6% |
| |||||||
ELECTRIC UTILITIES — 62.3% |
| |||||||
Alliant Energy Corp | 2,668,894 | $ | 110,945,923 | |||||
American Electric Power Co., Inc | 5,704,374 | 400,675,230 | ||||||
Duke Energy Corp | 7,453,430 | 625,491,846 | ||||||
Edison International | 3,778,211 | 291,564,543 | ||||||
Entergy Corp | 2,072,608 | 158,264,347 | ||||||
Eversource Energy | 3,658,459 | 221,117,262 | ||||||
Exelon Corp | 11,097,086 | 418,027,230 | ||||||
FirstEnergy Corp | 5,129,768 | 158,150,747 | ||||||
NextEra Energy, Inc | 5,405,104 | 792,117,991 | ||||||
PG&E Corp | 5,952,503 | 405,305,929 | ||||||
Pinnacle West Capital Corp | 1,318,689 | 111,508,342 | ||||||
PPL Corp | 7,917,071 | 300,452,844 | ||||||
Southern Co | 11,540,949 | 567,122,234 | ||||||
Xcel Energy, Inc | 5,912,721 | 279,789,958 | ||||||
|
| |||||||
| 4,840,534,426 | ||||||||
|
| |||||||
INDEPENDENT POWER PRODUCERS & ENERGY TRADERS — 2.2% |
| |||||||
AES Corp | 7,667,964 | 84,500,963 | ||||||
NRG Energy, Inc | 3,465,234 | 88,675,338 | ||||||
|
| |||||||
| 173,176,301 | ||||||||
|
| |||||||
MULTI-UTILITIES — 32.9% |
| |||||||
Ameren Corp. | 2,824,865 | 163,390,192 | ||||||
CenterPoint Energy, Inc | 5,047,014 | 147,423,279 | ||||||
CMS Energy Corp | 3,328,165 | 154,160,603 | ||||||
Consolidated Edison, Inc (a) | 3,603,414 | 290,723,442 | ||||||
Dominion Energy, Inc | 7,423,869 | 571,118,242 | ||||||
DTE Energy Co | 2,093,075 | 224,712,532 | ||||||
NiSource, Inc | 3,822,857 | 97,826,911 | ||||||
Public Service Enterprise Group, Inc | 5,840,502 | $ | 270,123,217 | |||||
SCANA Corp | 1,650,111 | 80,013,882 | ||||||
Sempra Energy | 2,914,444 | 332,625,494 | ||||||
WEC Energy Group, Inc | 3,643,448 | 228,735,665 | ||||||
|
| |||||||
| 2,560,853,459 | ||||||||
|
| |||||||
WATER UTILITIES — 2.2% |
| |||||||
American Water Works Co., Inc | 2,058,315 | 166,538,267 | ||||||
|
| |||||||
TOTAL COMMON STOCKS | 7,741,102,453 | |||||||
|
| |||||||
SHORT-TERM INVESTMENT — 0.2% |
| |||||||
State Street Institutional U.S. Government Money Market Fund, Class G Shares 0.96% (b) (c) | 18,133,795 | 18,133,795 | ||||||
|
| |||||||
TOTAL INVESTMENTS — 99.8% | ||||||||
(Cost $8,064,052,164) | 7,759,236,248 | |||||||
OTHER ASSETS IN EXCESS OF | 16,178,013 | |||||||
|
| |||||||
NET ASSETS — 100.0% | $ | 7,775,414,261 | ||||||
|
| |||||||
| (a) | All or a portion of the shares of the security are on loan at September 30, 2017. |
| (b) | The Fund invested in certain money market funds managed by SSGA Funds Management, Inc. Amounts related to these transactions during the period ended September 30, 2017 are shown in the Affiliate Table below. |
| (c) | The rate shown is the annualized seven-day yield at September 30, 2017. |
The following table summarizes the value of the Fund’s investments according to the fair value hierarchy as of September 30, 2017.
Description | Level 1 — Quoted Prices | Level 2 — Other Significant Observable Inputs | Level 3 — Significant Unobservable Inputs | Total | ||||||||||||
ASSETS: | ||||||||||||||||
INVESTMENTS: | ||||||||||||||||
Common Stocks | ||||||||||||||||
Electric Utilities | $ | 4,840,534,426 | $ | — | $ | — | $ | 4,840,534,426 | ||||||||
Independent Power Producers & Energy Traders | 173,176,301 | — | — | 173,176,301 | ||||||||||||
Multi-Utilities | 2,560,853,459 | — | — | 2,560,853,459 | ||||||||||||
Water Utilities. | 166,538,267 | — | — | 166,538,267 | ||||||||||||
Short-Term Investment | 18,133,795 | — | — | 18,133,795 | ||||||||||||
|
|
|
|
|
|
|
| |||||||||
TOTAL INVESTMENTS | $ | 7,759,236,248 | $ | — | $ | — | $ | 7,759,236,248 | ||||||||
|
|
|
|
|
|
|
| |||||||||
See accompanying notes to financial statements.
60
Table of Contents
The Utilities Select Sector SPDR Fund
SCHEDULE OF INVESTMENTS (continued)
September 30, 2017
Affiliate Table
| Number of Shares Held at 9/30/16 | Value At 9/30/16 | Cost of Purchases | Proceeds from Shares Sold | Realized Gain (Loss) | Change in Unrealized Appreciation/ Depreciation | Number of Shares Held at 9/30/17 | Value at 9/30/17 | Dividend Income | ||||||||||||||||||||||||||||
State Street Institutional Liquid Reserves Fund, Premier Class | 13,352,521 | $ | 13,352,521 | $ | 3,961,660 | $ | 17,314,181 | $ | — | $ | — | — | $ | — | $ | 265 | ||||||||||||||||||||
State Street Institutional U.S. Government Money Market Fund, Class G Shares | — | — | 181,511,065 | 163,377,270 | — | — | 18,133,795 | 18,133,795 | 93,653 | |||||||||||||||||||||||||||
State Street Institutional U.S. Government Money Market Fund, Premier Class | — | — | 234,952,807 | 234,952,807 | — | — | — | — | 55,365 | |||||||||||||||||||||||||||
|
|
|
|
|
|
|
|
|
|
|
|
|
| |||||||||||||||||||||||
TOTAL | $ | 13,352,521 | $ | 420,425,532 | $ | 415,644,258 | $ | — | $ | — | $ | 18,133,795 | $ | 149,283 | ||||||||||||||||||||||
|
|
|
|
|
|
|
|
|
|
|
|
|
| |||||||||||||||||||||||
See accompanying notes to financial statements.
61
Table of Contents
STATEMENTS OF ASSETS AND LIABILITIES
September 30, 2017
| The Consumer Discretionary Select Sector SPDR Fund | The Consumer Staples Select Sector SPDR Fund | The Energy Select Sector SPDR Fund | ||||||||||
ASSETS | ||||||||||||
Investments in unaffiliated issuers, at value * (Note 2) | $ | 11,493,355,325 | $ | 8,783,650,030 | $ | 16,603,445,488 | ||||||
Investments in affiliated issuers, at value (Notes 2 and 3) | 44,878,892 | 3,856,474 | 53,801,921 | |||||||||
|
|
|
|
|
| |||||||
Total Investments | 11,538,234,217 | 8,787,506,504 | 16,657,247,409 | |||||||||
Cash | 151,457 | 3,003,674 | 38,699 | |||||||||
Receivable for investments sold | — | 430,249,544 | 211,905,128 | |||||||||
Receivable for income related to Select Sector SPDR shares in-kind transactions | — | 48,021 | 3,830 | |||||||||
Dividends receivable — unaffiliated issuers (Note 2) | 7,042,835 | 25,756,052 | 16,342,257 | |||||||||
Dividends receivable — affiliated issuers (Notes 2 and 3) | 29,085 | 21,636 | 65,368 | |||||||||
Securities lending income receivable — unaffiliated issuers (Note 9) | 34,419 | 3,166 | 61,468 | |||||||||
Securities lending income receivable — affiliated issuers (Notes 3 and 9) | 65,658 | — | 79,523 | |||||||||
Prepaid expenses and other assets | 25,964 | 19,385 | 37,507 | |||||||||
|
|
|
|
|
| |||||||
TOTAL ASSETS | 11,545,583,635 | 9,246,607,982 | 16,885,781,189 | |||||||||
|
|
|
|
|
| |||||||
LIABILITIES | ||||||||||||
Payable upon return of securities loaned | 24,093,725 | — | 42,538,543 | |||||||||
Payable for investments purchased | — | 435,440,832 | 221,460,167 | |||||||||
Payable for income related to Select Sector SPDR shares in-kind transactions | 12,455 | — | — | |||||||||
Advisory fee payable (Note 3) | 326,326 | 252,894 | 440,032 | |||||||||
Distribution fees payable (Note 4) | 646,819 | 500,595 | 860,775 | |||||||||
Unitary fees payable (administrator, custodian and transfer agent fees) (Note 3) | 89,851 | 88,520 | 169,876 | |||||||||
Trustees’ fees and expenses (Note 5) | 376 | 330 | 1,538 | |||||||||
License fee payable (Note 4) | 1,289,480 | 994,350 | 1,780,907 | |||||||||
Registration and filing fees payable | 203,256 | 159,553 | 283,578 | |||||||||
Professional fees payable | 53,428 | 47,210 | 64,650 | |||||||||
Printing and postage fees payable. | 282,915 | 220,635 | 346,174 | |||||||||
|
|
|
|
|
| |||||||
TOTAL LIABILITIES | 26,998,631 | 437,704,919 | 267,946,240 | |||||||||
|
|
|
|
|
| |||||||
NET ASSETS | $ | 11,518,585,004 | $ | 8,808,903,063 | $ | 16,617,834,949 | ||||||
|
|
|
|
|
| |||||||
NET ASSETS CONSIST OF: | ||||||||||||
Paid-in Capital (Note 7) | $ | 11,979,002,261 | $ | 9,619,250,232 | $ | 22,902,841,299 | ||||||
Undistributed (distribution in excess of) net investment income (loss) | — | — | 146,623 | |||||||||
Accumulated net realized gain (loss) on investments | (505,212,744 | ) | (235,515,423 | ) | (3,501,887,384 | ) | ||||||
Net unrealized appreciation (depreciation) on: | ||||||||||||
Investments - unaffiliated issuers | 44,795,487 | (574,831,746 | ) | (2,783,265,589 | ) | |||||||
Investments - affiliated issuers (Notes 2 and 3) | — | — | — | |||||||||
|
|
|
|
|
| |||||||
NET ASSETS | $ | 11,518,585,004 | $ | 8,808,903,063 | $ | 16,617,834,949 | ||||||
|
|
|
|
|
| |||||||
NET ASSET VALUE PER SHARE | ||||||||||||
Net asset value per share | $ | 90.09 | $ | 53.99 | $ | 68.46 | ||||||
|
|
|
|
|
| |||||||
Shares outstanding (unlimited amount authorized, $0.01 par value) | 127,853,252 | 163,171,809 | 242,724,200 | |||||||||
|
|
|
|
|
| |||||||
COST OF INVESTMENTS: | ||||||||||||
Investments in unaffiliated issuers | $ | 11,448,559,838 | $ | 9,358,481,776 | $ | 19,386,711,077 | ||||||
Investments in affiliated issuers | 44,878,892 | 3,856,474 | 53,801,921 | |||||||||
|
|
|
|
|
| |||||||
Total cost of investments | $ | 11,493,438,730 | $ | 9,362,338,250 | $ | 19,440,512,998 | ||||||
|
|
|
|
|
| |||||||
* Includes investments in securities on loan, at value | $ | 263,375,350 | $ | 31,835,653 | $ | 203,325,480 | ||||||
|
|
|
|
|
| |||||||
See accompanying notes to financial statements.
62
Table of Contents
| The Financial Select Sector SPDR Fund | The Health Care Select Sector SPDR Fund | The Industrial Select Sector SPDR Fund | The Materials Select Sector SPDR Fund | The Real Estate Select Sector SPDR Fund | The Technology Select Sector SPDR Fund | The Utilities Select Sector SPDR Fund | ||||||||||||||||||||
| $ | 27,059,017,871 | $ | 17,689,194,289 | $ | 11,029,882,600 | $ | 4,041,605,708 | $ | 2,349,423,969 | $ | 17,805,503,596 | $ | 7,741,102,453 | |||||||||||||
| 350,198,059 | 10,549,299 | 15,980,490 | 4,874,539 | 6,853,382 | 27,720,314 | 18,133,795 | ||||||||||||||||||||
|
|
|
|
|
|
|
|
|
|
|
|
|
| |||||||||||||
| 27,409,215,930 | 17,699,743,588 | 11,045,863,090 | 4,046,480,247 | 2,356,277,351 | 17,833,223,910 | 7,759,236,248 | ||||||||||||||||||||
| 169 | 1,053,769 | 3,843 | 19 | 563,293 | 2,394 | 2,508,731 | ||||||||||||||||||||
| — | — | — | 87,659,566 | — | — | — | ||||||||||||||||||||
| 44,149 | — | 102,312 | — | — | — | 21,966 | ||||||||||||||||||||
| 14,293,218 | 15,006,974 | 12,224,821 | 5,976,426 | 5,414,020 | 4,245,899 | 15,533,968 | ||||||||||||||||||||
| 1,404,585 | 29,258 | 24,842 | 8,075 | 4,638 | 48,908 | 28,453 | ||||||||||||||||||||
| 1,208 | 1,238 | 13,717 | 71 | 5,508 | 29,112 | 3,338 | ||||||||||||||||||||
| — | — | 50 | — | — | 380 | — | ||||||||||||||||||||
| 48,306 | �� | 33,295 | 22,922 | 8,052 | 5,426 | 34,758 | 15,788 | |||||||||||||||||||
|
|
|
|
|
|
|
|
|
|
|
|
|
| |||||||||||||
| 27,425,007,565 | 17,715,868,122 | 11,058,255,597 | 4,140,132,456 | 2,362,270,236 | 17,837,585,361 | 7,777,348,492 | ||||||||||||||||||||
|
|
|
|
|
|
|
|
|
|
|
|
|
| |||||||||||||
| — | — | — | — | — | 979,738 | — | ||||||||||||||||||||
| — | — | — | 87,809,234 | 6,680,518 | — | — | ||||||||||||||||||||
| — | 36,047 | — | 14,833 | 9,614 | 7,698 | — | ||||||||||||||||||||
| 709,741 | 503,995 | 304,884 | 107,302 | 226,287 | 491,315 | 221,017 | ||||||||||||||||||||
| 1,343,733 | 932,252 | 579,387 | 201,315 | 157,092 | 915,894 | 425,338 | ||||||||||||||||||||
| 271,100 | 153,336 | 42,960 | 24,230 | 22,035 | 179,255 | 78,220 | ||||||||||||||||||||
| 862 | 310 | 385 | 244 | 249 | 277 | 370 | ||||||||||||||||||||
| 2,709,367 | 1,947,133 | 1,219,482 | 402,400 | 265,122 | 1,870,655 | 866,155 | ||||||||||||||||||||
| 441,758 | 279,540 | 162,218 | 47,096 | 7,861 | 319,083 | 139,632 | ||||||||||||||||||||
| 75,222 | 60,655 | 50,568 | 36,371 | 31,224 | 61,806 | 43,741 | ||||||||||||||||||||
| 604,066 | 328,267 | 216,452 | 87,580 | 52,294 | 315,336 | 159,758 | ||||||||||||||||||||
|
|
|
|
|
|
|
|
|
|
|
|
|
| |||||||||||||
| 6,155,849 | 4,241,535 | 2,576,336 | 88,730,605 | 7,452,296 | 5,141,057 | 1,934,231 | ||||||||||||||||||||
|
|
|
|
|
|
|
|
|
|
|
|
|
| |||||||||||||
| $ | 27,418,851,716 | $ | 17,711,626,587 | $ | 11,055,679,261 | $ | 4,051,401,851 | $ | 2,354,817,940 | $ | 17,832,444,304 | $ | 7,775,414,261 | |||||||||||||
|
|
|
|
|
|
|
|
|
|
|
|
|
| |||||||||||||
| $ | 25,482,741,778 | $ | 17,352,517,436 | $ | 11,045,440,256 | $ | 4,939,892,906 | $ | 2,473,232,356 | $ | 16,199,694,368 | $ | 8,501,540,657 | |||||||||||||
| — | — | 7,236,727 | 302,259 | — | 1,944,269 | 11,769,678 | ||||||||||||||||||||
| (406,921,293 | ) | (291,264,482 | ) | (417,111,237 | ) | (912,167,358 | ) | (33,610,347 | ) | (696,562,489 | ) | (433,080,158 | ) | |||||||||||||
| 2,303,303,529 | 650,373,633 | 420,113,515 | 23,374,044 | (84,804,069 | ) | 2,327,368,156 | (304,815,916 | ) | ||||||||||||||||||
| 39,727,702 | — | — | — | — | — | — | ||||||||||||||||||||
|
|
|
|
|
|
|
|
|
|
|
|
|
| |||||||||||||
| $ | 27,418,851,716 | $ | 17,711,626,587 | $ | 11,055,679,261 | $ | 4,051,401,851 | $ | 2,354,817,940 | $ | 17,832,444,304 | $ | 7,775,414,261 | |||||||||||||
|
|
|
|
|
|
|
|
|
|
|
|
|
| |||||||||||||
| $ | 25.84 | $ | 81.76 | $ | 70.99 | $ | 56.80 | $ | 32.26 | $ | 59.13 | $ | 53.05 | |||||||||||||
|
|
|
|
|
|
|
|
|
|
|
|
|
| |||||||||||||
| 1,061,245,427 | 216,615,324 | 155,726,000 | 71,323,725 | 73,000,000 | 301,605,897 | 146,574,160 | ||||||||||||||||||||
|
|
|
|
|
|
|
|
|
|
|
|
|
| |||||||||||||
| $ | 24,755,714,342 | $ | 17,038,820,656 | $ | 10,609,769,085 | $ | 4,018,231,664 | $ | 2,434,228,038 | $ | 15,478,135,440 | $ | 8,045,918,369 | |||||||||||||
| 310,470,357 | 10,549,299 | 15,980,490 | 4,874,539 | 6,853,382 | 27,720,314 | 18,133,795 | ||||||||||||||||||||
|
|
|
|
|
|
|
|
|
|
|
|
|
| |||||||||||||
| $ | 25,066,184,699 | $ | 17,049,369,955 | $ | 10,625,749,575 | $ | 4,023,106,203 | $ | 2,441,081,420 | $ | 15,505,855,754 | $ | 8,064,052,164 | |||||||||||||
|
|
|
|
|
|
|
|
|
|
|
|
|
| |||||||||||||
| $ | 12,143,262 | $ | 8,189,007 | $ | 105,727,017 | $ | — | $ | 71,364,962 | $ | 252,206,014 | $ | 7,814,826 | |||||||||||||
|
|
|
|
|
|
|
|
|
|
|
|
|
| |||||||||||||
63
Table of Contents
THE SELECT SECTOR SPDR TRUST
STATEMENTS OF OPERATIONS
For the Year Ended September 30, 2017
| The Consumer Discretionary Select Sector SPDR Fund | The Consumer Staples Select Sector SPDR Fund | The Energy Select Sector SPDR Fund | ||||||||||
INVESTMENT INCOME | ||||||||||||
Dividend income — unaffiliated issuers (Note 2) | $ | 192,940,839 | $ | 249,473,586 | $ | 531,112,633 | ||||||
Dividend income — affiliated issuers (Notes 2 and 3) | 179,669 | 130,269 | 222,628 | |||||||||
Unaffiliated securities lending income (Note 9) | 396,162 | 17,088 | 507,135 | |||||||||
Affiliated securities lending income (Note 3 and 9) | 875,559 | 428,907 | 237,014 | |||||||||
Dividend income — non cash transactions | — | — | — | |||||||||
Foreign taxes withheld | — | — | — | |||||||||
|
|
|
|
|
| |||||||
TOTAL INVESTMENT INCOME (LOSS) | 194,392,229 | 250,049,850 | 532,079,410 | |||||||||
|
|
|
|
|
| |||||||
EXPENSES | ||||||||||||
Advisory fees (Note 3) | 4,018,471 | 2,996,381 | 5,626,636 | |||||||||
Distribution fees (Note 4) | 4,672,713 | 3,481,532 | 6,534,963 | |||||||||
Unitary fees (administrator, custodian and transfer agent fees) (Note 3) | 1,517,004 | 1,132,704 | 2,128,138 | |||||||||
Trustees’ fees and expenses (Note 5) | 109,246 | 88,642 | 156,783 | |||||||||
License fee (Note 4) | 4,863,662 | 3,645,712 | 6,891,160 | |||||||||
Registration fees | 168,653 | 125,660 | 235,869 | |||||||||
Professional fees | 77,139 | 61,194 | 98,078 | |||||||||
Printing and postage fees | 580,095 | 492,324 | 895,780 | |||||||||
Insurance expense | 39,907 | 32,672 | 49,215 | |||||||||
Miscellaneous expenses | 127,584 | 101,447 | 155,489 | |||||||||
|
|
|
|
|
| |||||||
TOTAL EXPENSES | 16,174,474 | 12,158,268 | 22,772,111 | |||||||||
|
|
|
|
|
| |||||||
Expenses waived/reimbursed by the Adviser (Note 3) | — | — | — | |||||||||
|
|
|
|
|
| |||||||
NET EXPENSES | 16,174,474 | 12,158,268 | 22,772,111 | |||||||||
|
|
|
|
|
| |||||||
NET INVESTMENT INCOME (LOSS) | 178,217,755 | 237,891,582 | 509,307,299 | |||||||||
|
|
|
|
|
| |||||||
REALIZED AND UNREALIZED GAIN (LOSS) | ||||||||||||
Net realized gain (loss) on: | ||||||||||||
Investments — unaffiliated issuers | (137,714,728 | ) | (88,307,085 | ) | (1,529,093,469 | ) | ||||||
Investments — affiliated issuers (Note 3) | — | — | — | |||||||||
In-kind redemptions — unaffiliated issuers | 969,629,319 | 473,495,995 | 323,422,375 | |||||||||
In-kind redemptions — affiliated issuers (Note 3) | — | — | — | |||||||||
|
|
|
|
|
| |||||||
Net realized gain (loss) | 831,914,591 | 385,188,910 | (1,205,671,094 | ) | ||||||||
|
|
|
|
|
| |||||||
Net change in unrealized appreciation/depreciation on: | ||||||||||||
Investments — unaffiliated issuers | 517,488,053 | (364,745,665 | ) | 566,314,820 | ||||||||
Investments — affiliated issuers (Note 3) | — | — | — | |||||||||
|
|
|
|
|
| |||||||
Net change in unrealized appreciation/depreciation | 517,488,053 | (364,745,665 | ) | 566,314,820 | ||||||||
|
|
|
|
|
| |||||||
NET REALIZED AND UNREALIZED GAIN (LOSS) | 1,349,402,644 | 20,443,245 | (639,356,274 | ) | ||||||||
|
|
|
|
|
| |||||||
NET INCREASE (DECREASE) IN NET ASSETS FROM OPERATIONS | $ | 1,527,620,399 | $ | 258,334,827 | $ | (130,048,975 | ) | |||||
|
|
|
|
|
| |||||||
See accompanying notes to financial statements.
64
Table of Contents
| The Financial Select Sector SPDR Fund | The Health Care Select Sector SPDR Fund | The Industrial Select Sector SPDR Fund | The Materials Select Sector SPDR Fund | The Real Estate Select Sector SPDR Fund | The Technology Select Sector SPDR Fund | The Utilities Select Sector SPDR Fund | ||||||||||||||||||||
| $ | 396,548,098 | $ | 270,059,619 | $ | 230,178,161 | $ | 74,915,463 | $ | 53,227,336 | $ | 276,238,082 | $ | 247,182,174 | |||||||||||||
| 4,889,544 | 161,418 | 123,368 | 41,222 | 30,728 | 249,174 | 149,283 | ||||||||||||||||||||
| 17,197 | 58,617 | 174,601 | 36,302 | 19,538 | 253,278 | 18,969 | ||||||||||||||||||||
| — | 476 | 323 | — | — | 19,578 | — | ||||||||||||||||||||
| — | — | — | — | 7,547,313 | — | — | ||||||||||||||||||||
| — | — | (42 | ) | — | — | — | — | |||||||||||||||||||
|
|
|
|
|
|
|
|
|
|
|
|
|
| |||||||||||||
| 401,454,839 | 270,280,130 | 230,476,411 | 74,992,987 | 60,824,915 | 276,760,112 | 247,350,426 | ||||||||||||||||||||
|
|
|
|
|
|
|
|
|
|
|
|
|
| |||||||||||||
| 7,708,123 | 5,341,315 | 3,582,654 | 1,238,027 | 831,272 | 5,450,788 | 2,465,365 | ||||||||||||||||||||
| 8,973,439 | 6,213,388 | 4,167,438 | 1,439,214 | 964,532 | 6,339,114 | 2,863,600 | ||||||||||||||||||||
| 2,903,870 | 2,015,135 | �� | 1,351,567 | 467,532 | 314,986 | 2,057,360 | 932,535 | |||||||||||||||||||
| 189,247 | 138,422 | 87,354 | 31,453 | 16,650 | 140,919 | 73,834 | ||||||||||||||||||||
| 9,332,403 | 6,530,525 | 4,330,671 | 1,488,980 | 1,004,270 | 6,626,884 | 3,015,674 | ||||||||||||||||||||
| 323,880 | 224,261 | 150,417 | 51,946 | 34,813 | 228,800 | 103,357 | ||||||||||||||||||||
| 156,781 | 91,052 | 70,585 | 41,184 | 70,022 | 92,864 | 54,837 | ||||||||||||||||||||
| 1,359,516 | 718,612 | 516,789 | 196,978 | 142,882 | 705,516 | 350,957 | ||||||||||||||||||||
| 66,177 | 48,678 | 26,680 | 9,290 | 1,851 | 48,798 | 26,286 | ||||||||||||||||||||
| 204,636 | 155,318 | 99,022 | 41,302 | 20,661 | 146,184 | 84,213 | ||||||||||||||||||||
|
|
|
|
|
|
|
|
|
|
|
|
|
| |||||||||||||
| 31,218,072 | 21,476,706 | 14,383,177 | 5,005,906 | 3,401,939 | 21,837,227 | 9,970,658 | ||||||||||||||||||||
|
|
|
|
|
|
|
|
|
|
|
|
|
| |||||||||||||
| — | — | — | — | (26,077 | ) | — | — | |||||||||||||||||||
|
|
|
|
|
|
|
|
|
|
|
|
|
| |||||||||||||
| 31,218,072 | 21,476,706 | 14,383,177 | 5,005,906 | 3,375,862 | 21,837,227 | 9,970,658 | ||||||||||||||||||||
|
|
|
|
|
|
|
|
|
|
|
|
|
| |||||||||||||
| 370,236,767 | 248,803,424 | 216,093,234 | 69,987,081 | 57,449,053 | 254,922,885 | 237,379,768 | ||||||||||||||||||||
|
|
|
|
|
|
|
|
|
|
|
|
|
| |||||||||||||
| (34,698,636 | ) | (193,356,536 | ) | (69,966,039 | ) | (74,933,960 | ) | (33,216,904 | ) | (33,730,262 | ) | (19,755,556 | ) | |||||||||||||
| (114,105 | ) | — | — | — | — | — | — | |||||||||||||||||||
| 2,394,119,463 | 868,028,149 | 1,150,077,905 | 338,857,270 | 49,024,076 | 1,738,061,770 | 320,198,246 | ||||||||||||||||||||
| 16,732,690 | — | — | — | — | — | — | ||||||||||||||||||||
|
|
|
|
|
|
|
|
|
|
|
|
|
| |||||||||||||
| 2,376,039,412 | 674,671,613 | 1,080,111,866 | 263,923,310 | 15,807,172 | 1,704,331,508 | 300,442,690 | ||||||||||||||||||||
|
|
|
|
|
|
|
|
|
|
|
|
|
| |||||||||||||
| 3,098,311,730 | 1,394,349,669 | 835,209,931 | 352,929,686 | (47,777,211 | ) | 1,723,331,700 | 186,732,287 | |||||||||||||||||||
| 49,779,093 | — | — | — | — | — | — | ||||||||||||||||||||
|
|
|
|
|
|
|
|
|
|
|
|
|
| |||||||||||||
| 3,148,090,823 | 1,394,349,669 | 835,209,931 | 352,929,686 | (47,777,211 | ) | 1,723,331,700 | 186,732,287 | |||||||||||||||||||
|
|
|
|
|
|
|
|
|
|
|
|
|
| |||||||||||||
| 5,524,130,235 | 2,069,021,282 | 1,915,321,797 | 616,852,996 | (31,970,039 | ) | 3,427,663,208 | 487,174,977 | |||||||||||||||||||
|
|
|
|
|
|
|
|
|
|
|
|
|
| |||||||||||||
| $ | 5,894,367,002 | $ | 2,317,824,706 | $ | 2,131,415,031 | $ | 686,840,077 | $ | 25,479,014 | $ | 3,682,586,093 | $ | 724,554,745 | |||||||||||||
|
|
|
|
|
|
|
|
|
|
|
|
|
| |||||||||||||
65
Table of Contents
THE SELECT SECTOR SPDR TRUST
STATEMENTS OF CHANGES IN NET ASSETS
| The Consumer Discretionary Select Sector SPDR Fund | The Consumer Staples Select Sector SPDR Fund | |||||||||||||||
| Year Ended 9/30/17 | Year Ended 9/30/16 | Year Ended 9/30/17 | Year Ended 9/30/16 | |||||||||||||
INCREASE (DECREASE) IN NET ASSETS FROM OPERATIONS: | ||||||||||||||||
Net investment income (loss) | $ | 178,217,755 | $ | 163,236,969 | $ | 237,891,582 | $ | 225,108,162 | ||||||||
Net realized gain (loss) | 831,914,591 | 778,624,881 | 385,188,910 | 844,684,922 | ||||||||||||
Net change in unrealized appreciation/depreciation | 517,488,053 | (86,695,866 | ) | (364,745,665 | ) | 197,306,804 | ||||||||||
|
|
|
|
|
|
|
| |||||||||
Net increase (decrease) in net assets resulting from operations | 1,527,620,399 | 855,165,984 | 258,334,827 | 1,267,099,888 | ||||||||||||
|
|
|
|
|
|
|
| |||||||||
Net equalization credits and charges (Note 2) | 3,302,274 | (3,298,979 | ) | 6,793,597 | 214,792 | |||||||||||
|
|
|
|
|
|
|
| |||||||||
DISTRIBUTIONS TO SHAREHOLDERS FROM: | ||||||||||||||||
Net investment income | (183,068,428 | ) | (161,248,260 | ) | (244,187,449 | ) | (225,446,392 | ) | ||||||||
Return of capital | — | — | — | — | ||||||||||||
|
|
|
|
|
|
|
| |||||||||
Total distributions to shareholders | (183,068,428 | ) | (161,248,260 | ) | (244,187,449 | ) | (225,446,392 | ) | ||||||||
|
|
|
|
|
|
|
| |||||||||
FROM BENEFICIAL INTEREST TRANSACTIONS: | ||||||||||||||||
Proceeds from sale of shares sold | 10,076,630,953 | 11,775,030,216 | 23,126,005,097 | 18,416,440,415 | ||||||||||||
Cost of shares redeemed | (9,434,526,584 | ) | (13,054,660,788 | ) | (23,224,407,701 | ) | (17,870,809,454 | ) | ||||||||
Net income equalization (Note 2) | (3,302,274 | ) | 3,298,979 | (6,793,597 | ) | (214,792 | ) | |||||||||
|
|
|
|
|
|
|
| |||||||||
Net increase (decrease) in net assets from beneficial interest transactions | 638,802,095 | (1,276,331,593 | ) | (105,196,201 | ) | 545,416,169 | ||||||||||
|
|
|
|
|
|
|
| |||||||||
Net increase (decrease) in net assets during the period | 1,986,656,340 | (585,712,848 | ) | (84,255,226 | ) | 1,587,284,457 | ||||||||||
Net assets at beginning of period | 9,531,928,664 | 10,117,641,512 | 8,893,158,289 | 7,305,873,832 | ||||||||||||
|
|
|
|
|
|
|
| |||||||||
NET ASSETS AT END OF PERIOD | $ | 11,518,585,004 | $ | 9,531,928,664 | $ | 8,808,903,063 | $ | 8,893,158,289 | ||||||||
|
|
|
|
|
|
|
| |||||||||
Undistributed (distribution in excess of) net investment income (loss) | $ | — | $ | 2,616,921 | $ | — | $ | 6,088,305 | ||||||||
|
|
|
|
|
|
|
| |||||||||
SHARES OF BENEFICIAL INTEREST: | ||||||||||||||||
Shares sold. | 118,750,000 | 151,550,000 | 430,400,000 | 353,950,000 | ||||||||||||
Shares redeemed. | (110,000,000 | ) | (168,700,000 | ) | (434,350,000 | ) | (341,550,000 | ) | ||||||||
|
|
|
|
|
|
|
| |||||||||
Net increase (decrease) | 8,750,000 | (17,150,000 | ) | (3,950,000 | ) | 12,400,000 | ||||||||||
|
|
|
|
|
|
|
| |||||||||
See accompanying notes to financial statements.
66
Table of Contents
| The Energy Select Sector SPDR Fund | The Financial Select Sector SPDR Fund | The Health Care Select Sector SPDR Fund | ||||||||||||||||||||
| Year Ended 9/30/17 | Year Ended 9/30/16 | Year Ended 9/30/17 | Year Ended 9/30/16 | Year Ended 9/30/17 | Year Ended 9/30/16 | |||||||||||||||||
| $ | 509,307,299 | $ | 359,928,435 | $ | 370,236,767 | $ | 310,675,504 | $ | 248,803,424 | $ | 198,108,486 | |||||||||||
| (1,205,671,094 | ) | 168,005,590 | 2,376,039,412 | (8,172,949 | ) | 674,671,613 | 615,252,153 | |||||||||||||||
| 566,314,820 | 1,865,723,939 | 3,148,090,823 | 455,161,993 | 1,394,349,669 | 356,573,643 | |||||||||||||||||
|
|
|
|
|
|
|
|
|
|
|
| |||||||||||
| (130,048,975 | ) | 2,393,657,964 | 5,894,367,002 | 757,664,548 | 2,317,824,706 | 1,169,934,282 | |||||||||||||||
|
|
|
|
|
|
|
|
|
|
|
| |||||||||||
| 951,856 | 8,267,811 | 25,865,664 | (4,842,492 | ) | 4,430,175 | (2,572,781 | ) | |||||||||||||||
|
|
|
|
|
|
|
|
|
|
|
| |||||||||||
| (509,160,676 | ) | (374,828,781 | ) | (390,504,087 | ) | (1,281,124,512 | ) | (252,388,527 | ) | (198,596,804 | ) | |||||||||||
| — | — | — | (1,725,398,884 | ) | — | — | ||||||||||||||||
|
|
|
|
|
|
|
|
|
|
|
| |||||||||||
| (509,160,676 | ) | (374,828,781 | ) | (390,504,087 | ) | (3,006,523,396 | ) | (252,388,527 | ) | (198,596,804 | ) | |||||||||||
|
|
|
|
|
|
|
|
|
|
|
| |||||||||||
| 20,903,915,315 | 22,765,773,039 | 36,817,183,513 | 28,059,444,023 | 19,678,407,269 | 23,962,098,812 | |||||||||||||||||
| (18,567,122,195 | ) | (20,967,871,440 | ) | (26,875,531,255 | ) | (30,638,168,071 | ) | (16,479,429,601 | ) | (25,359,123,909 | ) | |||||||||||
| (951,856 | ) | (8,267,811 | ) | (25,865,664 | ) | 4,842,492 | (4,430,175 | ) | 2,572,781 | |||||||||||||
|
|
|
|
|
|
|
|
|
|
|
| |||||||||||
| 2,335,841,264 |
| 1,789,633,788 | 9,915,786,594 | (2,573,881,556 | ) | 3,194,547,493 | (1,394,452,316 | ) | |||||||||||||
|
|
|
|
|
|
|
|
|
|
|
| |||||||||||
| 1,697,583,469 |
| 3,816,730,782 | 15,445,515,173 | (4,827,582,896 | ) | 5,264,413,847 | (425,687,619 | ) | |||||||||||||
| 14,920,251,480 | 11,103,520,698 | 11,973,336,543 | 16,800,919,439 | 12,447,212,740 | 12,872,900,359 | |||||||||||||||||
|
|
|
|
|
|
|
|
|
|
|
| |||||||||||
| $ | 16,617,834,949 | $ | 14,920,251,480 | $ | 27,418,851,716 | $ | 11,973,336,543 | $ | 17,711,626,587 | $ | 12,447,212,740 | |||||||||||
|
|
|
|
|
|
|
|
|
|
|
| |||||||||||
$ | 146,623 |
| $ | — | $ | — | $ | — | $ | — | $ | — | ||||||||||
|
|
|
|
|
|
|
|
|
|
|
| |||||||||||
| 299,400,000 | 356,550,000 | 1,580,250,000 | 1,224,600,000 | 267,300,000 | 340,850,000 | |||||||||||||||||
| (267,950,000 | ) | (326,600,000 | ) | (1,139,200,000 | ) | (1,345,950,000 | ) | (223,350,000 | ) | (362,350,000 | ) | |||||||||||
|
|
|
|
|
|
|
|
|
|
|
| |||||||||||
| 31,450,000 | 29,950,000 | 441,050,000 | (121,350,000 | ) | 43,950,000 | (21,500,000 | ) | |||||||||||||||
|
|
|
|
|
|
|
|
|
|
|
| |||||||||||
67
Table of Contents
THE SELECT SECTOR SPDR TRUST
STATEMENTS OF CHANGES IN NET ASSETS (continued)
| The Industrial Select Sector SPDR Fund | The Materials Select Sector SPDR Fund | |||||||||||||||
| Year Ended 9/30/17 | Year Ended 9/30/16 | Year Ended 9/30/17 | Year Ended 9/30/16 | |||||||||||||
INCREASE (DECREASE) IN NET ASSETS FROM OPERATIONS: | ||||||||||||||||
Net investment income (loss) | $ | 216,093,234 | $ | 144,122,630 | $ | 69,987,081 | $ | 50,210,365 | ||||||||
Net realized gain (loss) | 1,080,111,866 | 335,262,622 | 263,923,310 | (10,077,856 | ) | |||||||||||
Net change in unrealized appreciation/depreciation | 835,209,931 | 669,715,625 | 352,929,686 | 388,281,687 | ||||||||||||
|
|
|
|
|
|
|
| |||||||||
Net increase (decrease) in net assets resulting from operations | 2,131,415,031 | 1,149,100,877 | 686,840,077 | 428,414,196 | ||||||||||||
|
|
|
|
|
|
|
| |||||||||
Net equalization credits and charges (Note 2) | (1,024,809 | ) | (1,245,204 | ) | 2,243,728 | 1,132,532 | ||||||||||
|
|
|
|
|
|
|
| |||||||||
DISTRIBUTIONS TO SHAREHOLDERS FROM: | ||||||||||||||||
Net investment income | (212,336,521 | ) | (148,000,415 | ) | (74,656,242 | ) | (50,640,827 | ) | ||||||||
|
|
|
|
|
|
|
| |||||||||
FROM BENEFICIAL INTEREST TRANSACTIONS: | ||||||||||||||||
Proceeds from sale of shares sold | 19,062,178,269 | 18,884,393,512 | 6,190,069,633 | 5,747,584,171 | ||||||||||||
Cost of shares redeemed | (17,260,781,299 | ) | (18,807,598,740 | ) | (5,645,741,524 | ) | (5,172,588,353 | ) | ||||||||
Net income equalization (Note 2) | 1,024,809 | 1,245,204 | (2,243,728 | ) | (1,132,532 | ) | ||||||||||
|
|
|
|
|
|
|
| |||||||||
Net increase (decrease) in net assets from beneficial interest transactions | 1,802,421,779 | 78,039,976 | 542,084,381 | 573,863,286 | ||||||||||||
|
|
|
|
|
|
|
| |||||||||
Net increase (decrease) in net assets during the period | 3,720,475,480 | 1,077,895,234 | 1,156,511,944 | 952,769,187 | ||||||||||||
Net assets at beginning of period | 7,335,203,781 | 6,257,308,547 | 2,894,889,907 | 1,942,120,720 | ||||||||||||
|
|
|
|
|
|
|
| |||||||||
NET ASSETS AT END OF PERIOD | $ | 11,055,679,261 | $ | 7,335,203,781 | $ | 4,051,401,851 | $ | 2,894,889,907 | ||||||||
|
|
|
|
|
|
|
| |||||||||
Undistributed (distribution in excess of) net investment income (loss) | $ | 7,236,727 | $ | — | $ | 302,259 | $ | 4,971,420 | ||||||||
|
|
|
|
|
|
|
| |||||||||
SHARES OF BENEFICIAL INTEREST: | ||||||||||||||||
Shares sold. | 295,600,000 | 345,750,000 | 119,200,000 | 128,500,000 | ||||||||||||
Shares redeemed. | (265,500,000 | ) | (345,500,000 | ) | (108,500,000 | ) | (116,500,000 | ) | ||||||||
|
|
|
|
|
|
|
| |||||||||
Net increase (decrease) | 30,100,000 | 250,000 | 10,700,000 | 12,000,000 | ||||||||||||
|
|
|
|
|
|
|
| |||||||||
| * | Inception date. |
See accompanying notes to financial statements.
68
Table of Contents
| The Real Estate Select Sector SPDR Fund | The Technology Select Sector SPDR Fund | The Utilities Select Sector SPDR Fund | ||||||||||||||||||||
| Year Ended 9/30/17 | For the Period 10/7/15* - 9/30/16 | Year Ended 9/30/17 | Year Ended 9/30/16 | Year Ended 9/30/17 | Year Ended 9/30/16 | |||||||||||||||||
| $ | 57,449,053 | $ | 13,673,630 | $ | 254,922,885 | $ | 243,134,843 | $ | 237,379,768 | $ | 252,468,882 | |||||||||||
| 15,807,172 | 29,442,450 | 1,704,331,508 | 1,381,925,817 | 300,442,690 | 672,567,751 | |||||||||||||||||
| (47,777,211 | ) | (37,026,858 | ) | 1,723,331,700 | 734,647,238 | 186,732,287 | 223,164,412 | |||||||||||||||
|
|
|
|
|
|
|
|
|
|
|
| |||||||||||
| 25,479,014 |
| 6,089,222 | 3,682,586,093 | 2,359,707,898 | 724,554,745 | 1,148,201,045 | |||||||||||||||
|
|
|
|
|
|
|
|
|
|
|
| |||||||||||
| (6,048,620 | ) | 1,486,118 | (895,238 | ) | 2,025,905 | (1,395,744 | ) | (5,436,809 | ) | |||||||||||||
|
| �� |
|
|
|
|
|
|
|
|
| |||||||||||
| (94,128,585 | ) | (872,254 | ) | (254,143,361 | ) | (248,787,555 | ) | (235,607,383 | ) | (250,044,341 | ) | |||||||||||
|
|
|
|
|
|
|
|
|
|
|
| |||||||||||
| 1,187,415,832 | 3,887,678,447 | 15,219,138,310 | 11,612,124,130 | 21,312,440,021 | 16,315,281,290 | |||||||||||||||||
| (1,964,582,409 | ) | (692,261,327 | ) | (13,818,965,634 | ) | (12,101,499,338 | ) | (21,437,700,615 | ) | (16,441,399,089 | ) | |||||||||||
| 6,048,620 | (1,486,118 | ) | 895,238 | (2,025,905 | ) | 1,395,744 | 5,436,809 | |||||||||||||||
|
|
|
|
|
|
|
|
|
|
|
| |||||||||||
| (771,117,957 | ) | 3,193,931,002 | 1,401,067,914 | (491,401,113 | ) | (123,864,850 | ) | (120,680,990 | ) | ||||||||||||
|
|
|
|
|
|
|
|
|
|
|
| |||||||||||
| (845,816,148 | ) | 3,200,634,088 | 4,828,615,408 | 1,621,545,135 | 363,686,768 | 772,038,905 | |||||||||||||||
| 3,200,634,088 | — | 13,003,828,896 | 11,382,283,761 | 7,411,727,493 | 6,639,688,588 | |||||||||||||||||
|
|
|
|
|
|
|
|
|
|
|
| |||||||||||
| $ | 2,354,817,940 | $ | 3,200,634,088 | $ | 17,832,444,304 | $ | 13,003,828,896 | $ | 7,775,414,261 | $ | 7,411,727,493 | |||||||||||
|
|
|
|
|
|
|
|
|
|
|
| |||||||||||
$ | — |
| $ | 12,801,376 | $ | 1,944,269 | $ | — | $ | 11,769,678 | $ | 18,391,141 | ||||||||||
|
|
|
|
|
|
|
|
|
|
|
| |||||||||||
| 37,650,000 | 116,650,000 | 293,150,000 | 263,100,000 | 420,200,000 | 341,850,000 | |||||||||||||||||
| (62,400,000 | ) | (18,900,000 | ) | (263,700,000 | ) | (278,700,000 | ) | (424,900,000 | ) | (343,950,000 | ) | |||||||||||
|
|
|
|
|
|
|
|
|
|
|
| |||||||||||
| (24,750,000 | ) | 97,750,000 | 29,450,000 | (15,600,000 | ) | (4,700,000 | ) | (2,100,000 | ) | |||||||||||||
|
|
|
|
|
|
|
|
|
|
|
| |||||||||||
69
Table of Contents
Selected data for a share outstanding throughout each period
| The Consumer Discretionary Select Sector SPDR Fund | ||||||||||||||||||||
| Year Ended 9/30/17 | Year Ended 9/30/16 | Year Ended 9/30/15 | Year Ended 9/30/14 | Year Ended 9/30/13 | ||||||||||||||||
Net asset value, beginning of period | $ | 80.03 | $ | 74.26 | $ | 66.69 | $ | 60.59 | $ | 46.79 | ||||||||||
|
|
|
|
|
|
|
|
|
| |||||||||||
Income (loss) from investment operations: | ||||||||||||||||||||
Net investment income (loss) (a) | 1.32 | 1.22 | 1.05 | 0.90 | 0.83 | |||||||||||||||
Net realized and unrealized gain (loss) (b) | 10.07 | 5.79 | 7.55 | 6.10 | 13.73 | |||||||||||||||
|
|
|
|
|
|
|
|
|
| |||||||||||
Total from investment operations | 11.39 | 7.01 | 8.60 | 7.00 | 14.56 | |||||||||||||||
|
|
|
|
|
|
|
|
|
| |||||||||||
Net equalization credits and charges (a) | 0.02 | (0.02 | ) | 0.05 | 0.01 | 0.06 | ||||||||||||||
|
|
|
|
|
|
|
|
|
| |||||||||||
Distributions to shareholders from: | ||||||||||||||||||||
Net investment income | (1.35 | ) | (1.22 | ) | (1.08 | ) | (0.91 | ) | (0.82 | ) | ||||||||||
|
|
|
|
|
|
|
|
|
| |||||||||||
Net asset value, end of period | $ | 90.09 | $ | 80.03 | $ | 74.26 | $ | 66.69 | $ | 60.59 | ||||||||||
|
|
|
|
|
|
|
|
|
| |||||||||||
Total return (c) | 14.34 | % | 9.48 | % | 12.98 | % | 11.59 | % | 31.50 | % | ||||||||||
Ratios and Supplemental Data: | ||||||||||||||||||||
Net assets, end of period (in 000s) | $ | 11,518,585 | $ | 9,531,929 | $ | 10,117,642 | $ | 6,712,778 | $ | 6,734,928 | ||||||||||
Ratios to average net assets: | ||||||||||||||||||||
Total expenses | 0.14 | % | 0.14 | % | 0.15 | % | 0.15 | % | 0.17 | % | ||||||||||
Net investment income (loss) | 1.54 | % | 1.56 | % | 1.41 | % | 1.37 | % | 1.55 | % | ||||||||||
Portfolio turnover rate (d) | 6 | % | 10 | % | 6 | % | 5 | % | 8 | % | ||||||||||
| (a) | Per share numbers have been calculated using average shares outstanding, which more appropriately presents the per share data for the year. |
| (b) | Amounts shown in this caption for a share outstanding may not accord with the change in aggregate gains and losses in securities for the fiscal period because of the timing of sales and repurchases of Fund shares in relation to fluctuating market values for the Fund. |
| (c) | Total return is calculated assuming a purchase of shares at net asset value on the first day and a sale at net asset value on the last day of each period reported. Distributions are assumed, for the purpose of this calculation, to be reinvested at net asset value per share on the respective payment dates of each distribution. Total returns for periods of less than one year are not annualized. Broker commission charges are not included in this calculation. |
| (d) | Portfolio turnover rate excludes securities received or delivered from in-kind processing of creations or redemptions on Select Sector SPDR shares. |
See accompanying notes to financial statements.
70
Table of Contents
THE SELECT SECTOR SPDR TRUST
FINANCIAL HIGHLIGHTS
Selected data for a share outstanding throughout each period
| The Consumer Staples Select Sector SPDR Fund | ||||||||||||||||||||
| Year Ended 9/30/17 | Year Ended 9/30/16 | Year Ended 9/30/15 | Year Ended 9/30/14 | Year Ended 9/30/13 | ||||||||||||||||
Net asset value, beginning of period | $ | 53.21 | $ | 47.22 | $ | 45.10 | $ | 39.81 | $ | 35.83 | ||||||||||
|
|
|
|
|
|
|
|
|
| |||||||||||
Income (loss) from investment operations: | ||||||||||||||||||||
Net investment income (loss) (a) | 1.48 | 1.29 | 1.27 | 1.14 | 1.12 | |||||||||||||||
Net realized and unrealized gain (loss) (b) | 0.72 | 5.99 | 2.14 | 5.19 | 4.00 | |||||||||||||||
|
|
|
|
|
|
|
|
|
| |||||||||||
Total from investment operations | 2.20 | 7.28 | 3.41 | 6.33 | 5.12 | |||||||||||||||
|
|
|
|
|
|
|
|
|
| |||||||||||
Net equalization credits and charges (a) | 0.04 | 0.00 | (c) | (0.03 | ) | 0.10 | (0.04 | ) | ||||||||||||
|
|
|
|
|
|
|
|
|
| |||||||||||
Distributions to shareholders from: | ||||||||||||||||||||
Net investment income | (1.46 | ) | (1.29 | ) | (1.26 | ) | (1.14 | ) | (1.10 | ) | ||||||||||
|
|
|
|
|
|
|
|
|
| |||||||||||
Net asset value, end of period | $ | 53.99 | $ | 53.21 | $ | 47.22 | $ | 45.10 | $ | 39.81 | ||||||||||
|
|
|
|
|
|
|
|
|
| |||||||||||
Total return (d) | 4.21 | % | 15.50 | % | 7.45 | % | 16.26 | % | 14.35 | % | ||||||||||
Ratios and Supplemental Data: | ||||||||||||||||||||
Net assets, end of period (in 000s) | $ | 8,808,903 | $ | 8,893,158 | $ | 7,305,874 | $ | 7,623,200 | $ | 5,241,330 | ||||||||||
Ratios to average net assets: | ||||||||||||||||||||
Total expenses | 0.14 | % | 0.14 | % | 0.15 | % | 0.15 | % | 0.17 | % | ||||||||||
Net investment income (loss) | 2.73 | % | 2.48 | % | 2.62 | % | 2.62 | % | 2.91 | % | ||||||||||
Portfolio turnover rate (e) | 12 | % | 4 | % | 3 | % | 4 | % | 5 | % | ||||||||||
| (a) | Per share numbers have been calculated using average shares outstanding, which more appropriately presents the per share data for the year. |
| (b) | Amounts shown in this caption for a share outstanding may not accord with the change in aggregate gains and losses in securities for the fiscal period because of the timing of sales and repurchases of Fund shares in relation to fluctuating market values for the Fund. |
| (c) | Amount is less than $0.005 per share. |
| (d) | Total return is calculated assuming a purchase of shares at net asset value on the first day and a sale at net asset value on the last day of each period reported. Distributions are assumed, for the purpose of this calculation, to be reinvested at net asset value per share on the respective payment dates of each distribution. Total returns for periods of less than one year are not annualized. Broker commission charges are not included in this calculation. |
| (e) | Portfolio turnover rate excludes securities received or delivered from in-kind processing of creations or redemptions on Select Sector SPDR shares. |
See accompanying notes to financial statements.
71
Table of Contents
THE SELECT SECTOR SPDR TRUST
FINANCIAL HIGHLIGHTS
Selected data for a share outstanding throughout each period
| The Energy Select Sector SPDR Fund | ||||||||||||||||||||
| Year Ended 9/30/17 | Year Ended 9/30/16 | Year Ended 9/30/15 | Year Ended 9/30/14 | Year Ended 9/30/13 | ||||||||||||||||
Net asset value, beginning of period | $ | 70.62 | $ | 61.24 | $ | 90.58 | $ | 82.89 | $ | 73.45 | ||||||||||
|
|
|
|
|
|
|
|
|
| |||||||||||
Income (loss) from investment operations: | ||||||||||||||||||||
Net investment income (loss) (a) | 2.16 | (b) | 1.79 | 2.01 | 1.77 | 1.49 | ||||||||||||||
Net realized and unrealized gain (loss) (c) | (2.18 | ) | 9.39 | (29.45 | ) | 7.63 | 9.43 | |||||||||||||
|
|
|
|
|
|
|
|
|
| |||||||||||
Total from investment operations | (0.02 | ) | 11.18 | (27.44 | ) | 9.40 | 10.92 | |||||||||||||
|
|
|
|
|
|
|
|
|
| |||||||||||
Net equalization credits and charges (a) | 0.00 | (d) | 0.04 | 0.09 | 0.07 | 0.02 | ||||||||||||||
|
|
|
|
|
|
|
|
|
| |||||||||||
Distributions to shareholders from: | ||||||||||||||||||||
Net investment income | (2.14 | ) | (1.84 | ) | (1.99 | ) | (1.78 | ) | (1.50 | ) | ||||||||||
|
|
|
|
|
|
|
|
|
| |||||||||||
Net asset value, end of period | $ | 68.46 | $ | 70.62 | $ | 61.24 | $ | 90.58 | $ | 82.89 | ||||||||||
|
|
|
|
|
|
|
|
|
| |||||||||||
Total return (e) | (0.01 | )% | 18.72 | % | (30.52 | )% | 11.40 | % | 15.02 | % | ||||||||||
Ratios and Supplemental Data: | ||||||||||||||||||||
Net assets, end of period (in 000s) | $ | 16,617,835 | $ | 14,920,251 | $ | 11,103,521 | $ | 9,838,985 | $ | 7,967,582 | ||||||||||
Ratios to average net assets: | ||||||||||||||||||||
Total expenses | 0.14 | % | 0.14 | % | 0.15 | % | 0.15 | % | 0.17 | % | ||||||||||
Net investment income (loss) | 3.12 | % | 2.77 | % | 2.63 | % | 1.94 | % | 1.92 | % | ||||||||||
Portfolio turnover rate (f) | 23 | % | 6 | % | 6 | % | 5 | % | 3 | % | ||||||||||
| (a) | Per share numbers have been calculated using average shares outstanding, which more appropriately presents the per share data for the year. |
| (b) | Net investment income per share and ratio of net investment income to average net assets reflect receipt of special dividend from portfolio holding. The resulting increase to net investment income amounted to $0.44 per share and 0.64% of average net assets. If the special dividends were not received during the year ended September 30, 2017, the total return would have been (0.63)%. |
| (c) | Amounts shown in this caption for a share outstanding may not accord with the change in aggregate gains and losses in securities for the fiscal period because of the timing of sales and repurchases of Fund shares in relation to fluctuating market values for the Fund. |
| (d) | Amount is less than $0.005 per share. |
| (e) | Total return is calculated assuming a purchase of shares at net asset value on the first day and a sale at net asset value on the last day of each period reported. Distributions are assumed, for the purpose of this calculation, to be reinvested at net asset value per share on the respective payment dates of each distribution. Total returns for periods of less than one year are not annualized. Broker commission charges are not included in this calculation. |
| (f) | Portfolio turnover rate excludes securities received or delivered from in-kind processing of creations or redemptions on Select Sector SPDR shares. |
See accompanying notes to financial statements.
72
Table of Contents
THE SELECT SECTOR SPDR TRUST
FINANCIAL HIGHLIGHTS
Selected data for a share outstanding throughout each period
| The Financial Select Sector SPDR Fund | ||||||||||||||||||||
| Year Ended 9/30/17 | Year Ended 9/30/16 | Year Ended 9/30/15 | Year Ended 9/30/14 | Year Ended 9/30/13 | ||||||||||||||||
Net asset value, beginning of period | $ | 19.31 | $ | 22.66 | $ | 23.17 | $ | 19.91 | $ | 15.59 | ||||||||||
|
|
|
|
|
|
|
|
|
| |||||||||||
Income (loss) from investment operations: |
| |||||||||||||||||||
Net investment income (loss) (a) | 0.39 | 0.43 | 0.42 | 0.34 | 0.30 | |||||||||||||||
Net realized and unrealized gain (loss) (b) | 6.50 | 1.27 | (0.50 | ) | 3.28 | 4.33 | ||||||||||||||
|
|
|
|
|
|
|
|
|
| |||||||||||
Total from investment operations | 6.89 | 1.70 | (0.08 | ) | 3.62 | 4.63 | ||||||||||||||
|
|
|
|
|
|
|
|
|
| |||||||||||
Net equalization credits and charges (a) | 0.03 | (0.01 | ) | 0.01 | 0.01 | 0.01 | ||||||||||||||
|
|
|
|
|
|
|
|
|
| |||||||||||
Voluntary contribution from Adviser | — | — | 0.00 | (c)(d) | — | — | ||||||||||||||
|
|
|
|
|
|
|
|
|
| |||||||||||
Distributions to shareholders from: | ||||||||||||||||||||
Net investment income | (0.39 | ) | (2.10 | ) | (0.44 | ) | (0.37 | ) | (0.32 | ) | ||||||||||
Return of capital | — | (2.94 | ) | — | — | — | ||||||||||||||
|
|
|
|
|
|
|
|
|
| |||||||||||
Total distributions | (0.39 | ) | (5.04 | ) | (0.44 | ) | (0.37 | ) | (0.32 | ) | ||||||||||
|
|
|
|
|
|
|
|
|
| |||||||||||
Net asset value, end of period | $ | 25.84 | $ | 19.31 | $ | 22.66 | $ | 23.17 | $ | 19.91 | ||||||||||
|
|
|
|
|
|
|
|
|
| |||||||||||
Total return (e) | 36.01 | %(f) | 7.36 | % | (0.39 | )% (g) | 18.32 | % | 29.94 | % | ||||||||||
Ratios and Supplemental Data: | ||||||||||||||||||||
Net assets, end of period (in 000s) | $ | 27,418,852 | $ | 11,973,337 | $ | 16,800,919 | $ | 18,605,018 | $ | 14,594,535 | ||||||||||
Ratios to average net assets: | ||||||||||||||||||||
Total expenses | 0.14 | % | 0.14 | % | 0.15 | % | 0.15 | % | 0.17 | % | ||||||||||
Net investment income (loss) | 1.65 | % | 1.88 | % | 1.72 | % | 1.54 | % | 1.64 | % | ||||||||||
Portfolio turnover rate (h) | 3 | % | 6 | % | 3 | % | 5 | % | 4 | % | ||||||||||
| (a) | Per share numbers have been calculated using average shares outstanding, which more appropriately presents the per share data for the year. |
| (b) | Amounts shown in this caption for a share outstanding may not accord with the change in aggregate gains and losses in securities for the fiscal period because of the timing of sales and repurchases of Fund shares in relation to fluctuating market values for the Fund. |
| (c) | Amount is less than $0.005 per share. |
| (d) | Contribution paid by an Affiliate in the amount of $461,741. (See Note 3). |
| (e) | Total return is calculated assuming a purchase of shares at net asset value on the first day and a sale at net asset value on the last day of each period reported. Distributions are assumed, for the purpose of this calculation, to be reinvested at net asset value per share on the respective payment dates of each distribution. Total returns for periods of less than one year are not annualized. Broker commission charges are not included in this calculation. |
| (f) | Includes a non-recurring litigation payment received by the Fund from State Street Corp., an affiliate, which amounted to less than $0.005 per share outstanding as of March 20, 2017. This payment resulted in an increase to total return of less than 0.005% for the period ended September 30, 2017. |
| (g) | The contribution from an Affiliate had no impact on total return. (See Note 3). |
| (h) | Portfolio turnover rate excludes securities received or delivered from in-kind processing of creations or redemptions on Select Sector SPDR shares. |
See accompanying notes to financial statements.
73
Table of Contents
THE SELECT SECTOR SPDR TRUST
FINANCIAL HIGHLIGHTS
Selected data for a share outstanding throughout each period
| The Health Care Select Sector SPDR Fund | ||||||||||||||||||||
| Year Ended 9/30/17 | Year Ended 9/30/16 | Year Ended 9/30/15 | Year Ended 9/30/14 | Year Ended 9/30/13 | ||||||||||||||||
Net asset value, beginning of period | $ | 72.09 | $ | 66.30 | $ | 63.90 | $ | 50.59 | $ | 40.13 | ||||||||||
|
|
|
|
|
|
|
|
|
| |||||||||||
Income (loss) from investment operations: |
| |||||||||||||||||||
Net investment income (loss) (a) | 1.20 | 1.08 | 1.02 | 0.89 | 0.84 | |||||||||||||||
Net realized and unrealized gain (loss) (b) | 9.64 | 5.82 | 2.35 | 13.29 | 10.45 | |||||||||||||||
|
|
|
|
|
|
|
|
|
| |||||||||||
Total from investment operations | 10.84 | 6.90 | 3.37 | 14.18 | 11.29 | |||||||||||||||
|
|
|
|
|
|
|
|
|
| |||||||||||
Net equalization credits and charges (a) | 0.02 | (0.01 | ) | 0.02 | 0.02 | 0.01 | ||||||||||||||
|
|
|
|
|
|
|
|
|
| |||||||||||
Distributions to shareholders from: |
| |||||||||||||||||||
Net investment income | (1.19 | ) | (1.10 | ) | (0.99 | ) | (0.89 | ) | (0.84 | ) | ||||||||||
|
|
|
|
|
|
|
|
|
| |||||||||||
Net asset value, end of period | $ | 81.76 | $ | 72.09 | $ | 66.30 | $ | 63.90 | $ | 50.59 | ||||||||||
| �� |
|
|
|
|
|
|
|
|
|
| ||||||||||
Total return (c) | 15.21 | % | 10.45 | % | 5.22 | % | 28.22 | % | 28.39 | % | ||||||||||
Ratios and Supplemental Data: |
| |||||||||||||||||||
Net assets, end of period (in 000s) | $ | 17,711,627 | $ | 12,447,213 | $ | 12,872,900 | $ | 11,161,902 | $ | 7,479,810 | ||||||||||
Ratios to average net assets: | ||||||||||||||||||||
Total expenses | 0.14 | % | 0.14 | % | 0.15 | % | 0.15 | % | 0.17 | % | ||||||||||
Net investment income (loss) | 1.60 | % | 1.54 | % | 1.43 | % | 1.53 | % | 1.84 | % | ||||||||||
Portfolio turnover rate (d) | 4 | % | 8 | % | 3 | % | 3 | % | 5 | % | ||||||||||
| (a) | Per share numbers have been calculated using average shares outstanding, which more appropriately presents the per share data for the year. |
| (b) | Amounts shown in this caption for a share outstanding may not accord with the change in aggregate gains and losses in securities for the fiscal period because of the timing of sales and repurchases of Fund shares in relation to fluctuating market values for the Fund. |
| (c) | Total return is calculated assuming a purchase of shares at net asset value on the first day and a sale at net asset value on the last day of each period reported. Distributions are assumed, for the purpose of this calculation, to be reinvested at net asset value per share on the respective payment dates of each distribution. Total returns for periods of less than one year are not annualized. Broker commission charges are not included in this calculation. |
| (d) | Portfolio turnover rate excludes securities received or delivered from in-kind processing of creations or redemptions on Select Sector SPDR shares. |
See accompanying notes to financial statements.
74
Table of Contents
THE SELECT SECTOR SPDR TRUST
FINANCIAL HIGHLIGHTS
Selected data for a share outstanding throughout each period
| The Industrial Select Sector SPDR Fund | ||||||||||||||||||||
| Year Ended 9/30/17 | Year Ended 9/30/16 | Year Ended 9/30/15 | Year Ended 9/30/14 | Year Ended 9/30/13 | ||||||||||||||||
Net asset value, beginning of period | $ | 58.39 | $ | 49.91 | $ | 53.14 | $ | 46.39 | $ | 36.54 | ||||||||||
|
|
|
|
|
|
|
|
|
| |||||||||||
Income (loss) from investment operations: |
| |||||||||||||||||||
Net investment income (loss) (a) | 1.35 | 1.18 | 1.07 | 1.00 | 0.91 | |||||||||||||||
Net realized and unrealized gain (loss) (b) | 12.58 | 8.53 | (3.16 | ) | 6.71 | 9.79 | ||||||||||||||
|
|
|
|
|
|
|
|
|
| |||||||||||
Total from investment operations | 13.93 | 9.71 | (2.09 | ) | 7.71 | 10.70 | ||||||||||||||
|
|
|
|
|
|
|
|
|
| |||||||||||
Net equalization credits and charges (a) | (0.01 | ) | (0.01 | ) | (0.01 | ) | 0.03 | 0.05 | ||||||||||||
|
|
|
|
|
|
|
|
|
| |||||||||||
Distributions to shareholders from: |
| |||||||||||||||||||
Net investment income | (1.32 | ) | (1.22 | ) | (1.13 | ) | (0.99 | ) | (0.90 | ) | ||||||||||
|
|
|
|
|
|
|
|
|
| |||||||||||
Net asset value, end of period | $ | 70.99 | $ | 58.39 | $ | 49.91 | $ | 53.14 | $ | 46.39 | ||||||||||
|
|
|
|
|
|
|
|
|
| |||||||||||
Total return (c) | 24.03 | % | 19.62 | % | (4.09 | )% | 16.71 | % | 29.70 | % | ||||||||||
Ratios and Supplemental Data: |
| |||||||||||||||||||
Net assets, end of period (in 000s) | $ | 11,055,679 | $ | 7,335,204 | $ | 6,257,309 | $ | 8,575,617 | $ | 6,860,109 | ||||||||||
Ratios to average net assets: | ||||||||||||||||||||
Total expenses | 0.14 | % | 0.14 | % | 0.15 | % | 0.15 | % | 0.17 | % | ||||||||||
Net investment income (loss) | 2.07 | % | 2.15 | % | 1.95 | % | 1.93 | % | 2.19 | % | ||||||||||
Portfolio turnover rate (d) | 5 | % | 12 | % | 6 | % | 3 | % | 6 | % | ||||||||||
| (a) | Per share numbers have been calculated using average shares outstanding, which more appropriately presents the per share data for the year. |
| (b) | Amounts shown in this caption for a share outstanding may not accord with the change in aggregate gains and losses in securities for the fiscal period because of the timing of sales and repurchases of Fund shares in relation to fluctuating market values for the Fund. |
| (c) | Total return is calculated assuming a purchase of shares at net asset value on the first day and a sale at net asset value on the last day of each period reported. Distributions are assumed, for the purpose of this calculation, to be reinvested at net asset value per share on the respective payment dates of each distribution. Total returns for periods of less than one year are not annualized. Broker commission charges are not included in this calculation. |
| (d) | Portfolio turnover rate excludes securities received or delivered from in-kind processing of creations or redemptions on Select Sector SPDR shares. |
See accompanying notes to financial statements.
75
Table of Contents
THE SELECT SECTOR SPDR TRUST
FINANCIAL HIGHLIGHTS
Selected data for a share outstanding throughout each period
| The Materials Select Sector SPDR Fund | ||||||||||||||||||||
| Year Ended 9/30/17 | Year Ended 9/30/16 | Year Ended 9/30/15 | Year Ended 9/30/14 | Year Ended 9/30/13 | ||||||||||||||||
Net asset value, beginning of period | $ | 47.75 | $ | 39.94 | $ | 49.58 | $ | 42.00 | $ | 36.80 | ||||||||||
|
|
|
|
|
|
|
|
|
| |||||||||||
Income (loss) from investment operations: |
| |||||||||||||||||||
Net investment income (loss) (a) | 1.01 | 0.96 | 0.93 | 0.95 | 0.98 | |||||||||||||||
Net realized and unrealized gain (loss) (b) | 9.06 | 7.79 | (9.50 | ) | 7.57 | 5.21 | ||||||||||||||
|
|
|
|
|
|
|
|
|
| |||||||||||
Total from investment operations | 10.07 | 8.75 | (8.57 | ) | 8.52 | 6.19 | ||||||||||||||
|
|
|
|
|
|
|
|
|
| |||||||||||
Net equalization credits and charges (a) | 0.03 | 0.02 | (0.11 | ) | 0.00 | (c) | 0.02 | |||||||||||||
|
|
|
|
|
|
|
|
|
| |||||||||||
Distributions to shareholders from: |
| |||||||||||||||||||
Net investment income | (1.05 | ) | (0.96 | ) | (0.96 | ) | (0.94 | ) | (1.01 | ) | ||||||||||
|
|
|
|
|
|
|
|
|
| |||||||||||
Net asset value, end of period | $ | 56.80 | $ | 47.75 | $ | 39.94 | $ | 49.58 | $ | 42.00 | ||||||||||
|
|
|
|
|
|
|
|
|
| |||||||||||
Total return (d) | 21.33 | % | 22.11 | % | (17.75 | )% | 20.36 | % | 17.09 | % | ||||||||||
Ratios and Supplemental Data: |
| |||||||||||||||||||
Net assets, end of period (in 000s) | $ | 4,051,402 | $ | 2,894,890 | $ | 1,942,121 | $ | 5,182,235 | $ | 3,585,702 | ||||||||||
Ratios to average net assets: | ||||||||||||||||||||
Total expenses | 0.14 | % | 0.14 | % | 0.15 | % | 0.15 | % | 0.17 | % | ||||||||||
Net investment income (loss) | 1.95 | % | 2.12 | % | 1.94 | % | 2.02 | % | 2.50 | % | ||||||||||
Portfolio turnover rate (e) | 10 | % | 16 | % | 9 | % | 7 | % | 6 | % | ||||||||||
| (a) | Per share numbers have been calculated using average shares outstanding, which more appropriately presents the per share data for the year. |
| (b) | Amounts shown in this caption for a share outstanding may not accord with the change in aggregate gains and losses in securities for the fiscal period because of the timing of sales and repurchases of Fund shares in relation to fluctuating market values for the Fund. |
| (c) | Amount is less than $0.005 per share. |
| (d) | Total return is calculated assuming a purchase of shares at net asset value on the first day and a sale at net asset value on the last day of each period reported. Distributions are assumed, for the purpose of this calculation, to be reinvested at net asset value per share on the respective payment dates of each distribution. Total returns for periods of less than one year are not annualized. Broker commission charges are not included in this calculation. |
| (e) | Portfolio turnover rate excludes securities received or delivered from in-kind processing of creations or redemptions on Select Sector SPDR shares. |
See accompanying notes to financial statements.
76
Table of Contents
THE SELECT SECTOR SPDR TRUST
FINANCIAL HIGHLIGHTS
Selected data for a share outstanding throughout each period
| The Real Estate Select Sector SPDR Fund | ||||||||
| Year Ended 9/30/17 | For the Period 10/8/15* - 9/30/16 | |||||||
Net asset value, beginning of period | $ | 32.74 | $ | 30.00 | ||||
|
|
|
| |||||
Income (loss) from investment operations: | ||||||||
Net investment income (loss) (a) | 0.75 | 2.19 | ||||||
Net realized and unrealized gain (loss) (b) | 0.11 | 1.40 | ||||||
|
|
|
| |||||
Total from investment operations | 0.86 | 3.59 | ||||||
|
|
|
| |||||
Net equalization credits and charges (a) | (0.08 | ) | 0.24 | |||||
|
|
|
| |||||
Distributions to shareholders from: | ||||||||
Net investment income | (1.26 | ) | (1.09 | ) | ||||
|
|
|
| |||||
Net asset value, end of period | $ | 32.26 | $ | 32.74 | ||||
|
|
|
| |||||
Total return (c) | 2.52 | % | 12.92 | % | ||||
Ratios and Supplemental Data: | ||||||||
Net assets, end of period (in 000s) | $ | 2,354,818 | $ | 3,200,634 | ||||
Ratios to average net assets: | ||||||||
Total expenses | 0.14 | % | 0.16 | % (d) | ||||
Net expenses | 0.14 | % | 0.07 | % (d) | ||||
Net investment income (loss) | 2.38 | % | 6.82 | % (d) | ||||
Portfolio turnover rate (e) | 16 | % | 5 | % (f) | ||||
| * | Commencement of operations. |
| (a) | Per share numbers have been calculated using average shares outstanding, which more appropriately presents the per share data for the year. |
| (b) | Amounts shown in this caption for a share outstanding may not accord with the change in aggregate gains and losses in securities for the fiscal period because of the timing of sales and repurchases of Fund shares in relation to fluctuating market values for the Fund. |
| (c) | Total return is calculated assuming a purchase of shares at net asset value on the first day and a sale at net asset value on the last day of each period reported. Distributions are assumed, for the purpose of this calculation, to be reinvested at net asset value per share on the respective payment dates of each distribution. Total returns for periods of less than one year are not annualized. Broker commission charges are not included in this calculation. |
| (d) | The ratios for periods less than one year are annualized. |
| (e) | Portfolio turnover rate excludes securities received or delivered from in-kind processing of creations or redemptions on Select Sector SPDR shares. |
| (f) | Period less than one year is not annualized. |
See accompanying notes to financial statements.
77
Table of Contents
THE SELECT SECTOR SPDR TRUST
FINANCIAL HIGHLIGHTS
Selected data for a share outstanding throughout each period
| The Technology Select Sector SPDR Fund | ||||||||||||||||||||
| Year Ended 9/30/17 | Year Ended 9/30/16 | Year Ended 9/30/15 | Year Ended 9/30/14 | Year Ended 9/30/13 | ||||||||||||||||
Net asset value, beginning of period | $ | 47.78 | $ | 39.56 | $ | 39.89 | $ | 32.04 | $ | 30.83 | ||||||||||
|
|
|
|
|
|
|
|
|
| |||||||||||
Income (loss) from investment operations: | ||||||||||||||||||||
Net investment income (loss) (a) | 0.85 | 0.83 | 0.75 | 0.68 | 0.61 | |||||||||||||||
Net realized and unrealized gain (loss) (b) | 11.35 | 8.22 | (0.30 | ) | 7.86 | 1.20 | ||||||||||||||
|
|
|
|
|
|
|
|
|
| |||||||||||
Total from investment operations | 12.20 | 9.05 | 0.45 | 8.54 | 1.81 | |||||||||||||||
|
|
|
|
|
|
|
|
|
| |||||||||||
Net equalization credits and charges (a) | (0.00 | ) (c) | 0.01 | (0.01 | ) | (0.01 | ) | (0.00 | ) (c) | |||||||||||
|
|
|
|
|
|
|
|
|
| |||||||||||
Distributions to shareholders from: | ||||||||||||||||||||
Net investment income | (0.85 | ) | (0.84 | ) | (0.77 | ) | (0.68 | ) | (0.60 | ) | ||||||||||
|
|
|
|
|
|
|
|
|
| |||||||||||
Net asset value, end of period | $ | 59.13 | $ | 47.78 | $ | 39.56 | $ | 39.89 | $ | 32.04 | ||||||||||
|
|
|
|
|
|
|
|
|
| |||||||||||
Total return (d) | 25.72 | % | 23.13 | % | 1.04 | % | 26.75 | % | 5.99 | % | ||||||||||
Ratios and Supplemental Data: | ||||||||||||||||||||
Net assets, end of period (in 000s) | $ | 17,832,444 | $ | 13,003,829 | $ | 11,382,284 | $ | 13,854,341 | $ | 11,714,309 | ||||||||||
Ratios to average net assets: | ||||||||||||||||||||
Total expenses | 0.14 | % | 0.14 | % | 0.15 | % | 0.15 | % | 0.17 | % | ||||||||||
Net investment income (loss) | 1.62 | % | 1.91 | % | 1.80 | % | 1.85 | % | 1.99 | % | ||||||||||
Portfolio turnover rate (e) | 4 | % | 5 | % | 5 | % | 10 | % | 4 | % | ||||||||||
| (a) | Per share numbers have been calculated using average shares outstanding, which more appropriately presents the per share data for the year. |
| (b) | Amounts shown in this caption for a share outstanding may not accord with the change in aggregate gains and losses in securities for the fiscal period because of the timing of sales and repurchases of Fund shares in relation to fluctuating market values for the Fund. |
| (c) | Amount is less than $0.005 per share. |
| (d) | Total return is calculated assuming a purchase of shares at net asset value on the first day and a sale at net asset value on the last day of each period reported. Distributions are assumed, for the purpose of this calculation, to be reinvested at net asset value per share on the respective payment dates of each distribution. Total returns for periods of less than one year are not annualized. Broker commission charges are not included in this calculation. |
| (e) | Portfolio turnover rate excludes securities received or delivered from in-kind processing of creations or redemptions on Select Sector SPDR shares. |
See accompanying notes to financial statements.
78
Table of Contents
THE SELECT SECTOR SPDR TRUST
FINANCIAL HIGHLIGHTS
Selected data for a share outstanding throughout each period
| The Utilities Select Sector SPDR Fund | ||||||||||||||||||||
| Year Ended 9/30/17 | Year Ended 9/30/16 | Year Ended 9/30/15 | Year Ended 9/30/14 | Year Ended 9/30/13 | ||||||||||||||||
Net asset value, beginning of period | $ | 49.00 | $ | 43.29 | $ | 42.10 | $ | 37.36 | $ | 36.39 | ||||||||||
|
|
|
|
|
|
|
|
|
| |||||||||||
Income (loss) from investment operations: |
| |||||||||||||||||||
Net investment income (loss) (a) | 1.69 | 1.62 | 1.57 | 1.49 | 1.47 | |||||||||||||||
Net realized and unrealized gain (loss) (b) | 4.07 | 5.76 | 1.22 | 4.77 | 1.01 | |||||||||||||||
|
|
|
|
|
|
|
|
|
| |||||||||||
Total from investment operations | 5.76 | 7.38 | 2.79 | 6.26 | 2.48 | |||||||||||||||
|
|
|
|
|
|
|
|
|
| |||||||||||
Net equalization credits and charges (a) | (0.01 | ) | (0.03 | ) | (0.04 | ) | (0.03 | ) | (0.04 | ) | ||||||||||
|
|
|
|
|
|
|
|
|
| |||||||||||
Distributions to shareholders from: | ||||||||||||||||||||
Net investment income | (1.70 | ) | (1.64 | ) | (1.56 | ) | (1.49 | ) | (1.47 | ) | ||||||||||
|
|
|
|
|
|
|
|
|
| |||||||||||
Net asset value, end of period | $ | 53.05 | $ | 49.00 | $ | 43.29 | $ | 42.10 | $ | 37.36 | ||||||||||
|
|
|
|
|
|
|
|
|
| |||||||||||
Total return (c) | 11.88 | % | 17.06 | % | 6.51 | % | 16.83 | % | 6.78 | % | ||||||||||
Ratios and Supplemental Data: | ||||||||||||||||||||
Net assets, end of period (in 000s) | $ | 7,775,414 | $ | 7,411,727 | $ | 6,639,689 | $ | 5,468,273 | $ | 5,175,145 | ||||||||||
Ratios to average net assets: | ||||||||||||||||||||
Total expenses | 0.14 | % | 0.14 | % | 0.15 | % | 0.15 | % | 0.17 | % | ||||||||||
Net investment income (loss) | 3.32 | % | 3.40 | % | 3.52 | % | 3.67 | % | 3.93 | % | ||||||||||
Portfolio turnover rate (d) | 2 | % | 8 | % | 4 | % | 5 | % | 4 | % | ||||||||||
| (a) | Per share numbers have been calculated using average shares outstanding, which more appropriately presents the per share data for the year. |
| (b) | Amounts shown in this caption for a share outstanding may not accord with the change in aggregate gains and losses in securities for the fiscal period because of the timing of sales and repurchases of Fund shares in relation to fluctuating market values for the Fund. |
| (c) | Total return is calculated assuming a purchase of shares at net asset value on the first day and a sale at net asset value on the last day of each period reported. Distributions are assumed, for the purpose of this calculation, to be reinvested at net asset value per share on the respective payment dates of each distribution. Total returns for periods of less than one year are not annualized. Broker commission charges are not included in this calculation. |
| (d) | Portfolio turnover rate excludes securities received or delivered from in-kind processing of creations or redemptions on Select Sector SPDR shares. |
See accompanying notes to financial statements.
79
Table of Contents
September 30, 2017
| 1. | Organization |
The Select Sector SPDR Trust (the “Trust”), a Massachusetts business trust registered under the Investment Company Act of 1940, as amended (“1940 Act”), is an open-end management investment company.
As of September 30, 2017, the Trust consists of ten (10) series, each of which represents a separate series of beneficial interest in the Trust. The Declaration of Trust permits the Board of Trustees of the Trust (the “Board”) to authorize the issuance of an unlimited number of shares of beneficial interest at $0.01 par value. The financial statements herein relate to the following Funds (each a “Fund”, and collectively, the “Funds”):
The Consumer Discretionary Select Sector SPDR Fund
The Consumer Staples Select Sector SPDR Fund
The Energy Select Sector SPDR Fund
The Financial Select Sector SPDR Fund
The Health Care Select Sector SPDR Fund
The Industrial Select Sector SPDR Fund
The Materials Select Sector SPDR Fund
The Real Estate Select Sector SPDR Fund
The Technology Select Sector SPDR Fund
The Utilities Select Sector SPDR Fund
Each Fund is classified as a non-diversified investment company under the 1940 Act.
On November 21, 2016, The Financial Services Select Sector SPDR Fund was liquidated and closed.
Under the Trust’s organizational documents, its officers and trustees are indemnified against certain liabilities arising out of the performance of their duties to the Trust. The Trust has entered into an Indemnification Agreement with each trustee who is not an “interested person” (as defined in the 1940 Act) (each, an “Independent Trustee”) providing for indemnification of the Independent Trustee by the Trust consistent with the foregoing and providing procedures for seeking and obtaining indemnification advancement of expenses. Additionally, in the normal course of business, the Trust enters into contracts with service providers that contain general indemnification clauses. The Trust’s maximum exposure under these arrangements is unknown as this would involve future claims that may be made against the Trust that have not yet occurred.
| 2. | Summary of Significant Accounting Policies |
The following is a summary of significant accounting policies followed by the Trust in the preparation of its financial statements:
The preparation of financial statements in accordance with U.S. generally accepted accounting principles (“U.S. GAAP”) requires management to make estimates and assumptions that affect the reported amounts and disclosures in the financial statements. Actual results could differ from those estimates. Each Fund is an investment company under U.S. GAAP and follows the accounting and reporting guidance applicable to investment companies.
Security Valuation
Each Fund’s investments are valued at fair value each day that the New York Stock Exchange (“NYSE”) is open and, for financial reporting purposes, as of the report date should the reporting period end on a day that the NYSE is not open. Fair value is generally defined as the price a fund would receive to sell an asset or pay to transfer a liability in an orderly transaction between market participants at the measurement date. By its nature, a fair value price is a good faith estimate of the valuation in a current sale and may not reflect an actual market price. The investments of each Fund are valued pursuant to the policy and procedures developed by the Oversight Committee (the “Committee”) and approved by the Board. The Committee provides oversight of the valuation of investments for the Funds. The Board has responsibility for determining the fair value of investments.
Valuation techniques used to value each Fund’s investments by major category are as follows:
| • | Equity investments (including registered investment companies that are exchange-traded funds) traded on a recognized securities exchange for which market quotations are readily available are valued at the last sale price or official closing price, as applicable, on the primary market or exchange on which they trade. Equity investments traded on a recognized exchange for which there were no sales on that day are valued at the last published sale price or at fair value. |
| • | Investments in registered investment companies (including money market funds) or other unitized pooled investment vehicles that are not traded on an exchange are valued at that day’s published net asset value (“NAV”) per share or unit. |
80
Table of Contents
THE SELECT SECTOR SPDR TRUST
NOTES TO FINANCIAL STATEMENTS (continued)
September 30, 2017
In the event prices or quotations are not readily available or that the application of these valuation methods results in a price for an investment that is deemed to be not representative of the fair value of such investment, fair value will be determined in good faith by the Committee, in accordance with the valuation policy and procedures approved by the Board.
Fair value pricing could result in a difference between the prices used to calculate the Fund’s net asset value and the prices used by the Fund’s respective Select Sector Index, which in turn could result in a difference between the Fund’s performance and the performance of the Fund’s respective Select Sector Index. Various inputs are used in determining the value of the Funds’ investments.
The Funds value their assets and liabilities at fair value using a fair value hierarchy consisting of three broad levels that prioritize the inputs to valuation techniques giving the highest priority to readily available unadjusted quoted prices in active markets for identical assets or liabilities (Level 1 measurements) and the lowest priority to unobservable inputs (Level 3 measurements) when market prices are not readily available or reliable. The categorization of a value determined for an investment within the hierarchy is based upon the pricing transparency of the investment and is not necessarily an indication of the risk associated with investing in it.
The three levels of the fair value hierarchy are as follows:
| • | Level 1 — Unadjusted quoted prices in active markets for an identical asset or liability; |
| • | Level 2 — Inputs other than quoted prices included within Level 1 that are observable for the asset or liability either directly or indirectly, including quoted prices for similar assets or liabilities in active markets, quoted prices for identical or similar assets or liabilities in markets that are not considered to be active, inputs other than quoted prices that are observable for the asset or liability (such as exchange rates, financing terms, interest rates, yield curves, volatilities, prepayment speeds, loss severities, credit risks and default rates) or other market-corroborated inputs; and |
| • | Level 3 — Unobservable inputs for the asset or liability, including the Committee’s assumptions used in determining the fair value of investments. |
The value of each Fund’s investments according to the fair value hierarchy as of September 30, 2017, is disclosed in each Fund’s respective Schedule of Investments.
Changes in valuation techniques may result in transfers in or out of an assigned level within the fair value hierarchy. Transfers between different levels of the fair value hierarchy are recognized at the end of the reporting period.
The Funds had no transfers between levels for the period ended September 30, 2017.
Investment Transactions and Income Recognition
Investment transactions are accounted for on trade date for financial reporting purposes. Realized gains and losses from the sale or disposition of investments and foreign exchange transactions, if any, are determined using the identified cost method.
Dividend income and capital gain distributions, if any, are recognized on the ex-dividend date, net of any foreign taxes withheld at source, if any. Non-cash dividends received in the form of stock are recorded as dividend income at fair value. Distributions received by the Funds may include a return of capital that is estimated by management. Such amounts are recorded as a reduction of the cost of investments or reclassified to capital gains.
Certain Funds invest in real estate investment trusts (“REITs”). REITs determine the tax character of their distributions annually and may characterize a portion of their distributions as a return of capital or capital gain. The Funds’ policy is to record all REIT distributions initially as dividend income and re-designate the prior calendar year’s to return of capital or capital gain distributions at year end based on information provided by the REIT and/or SSGA Funds Management, Inc. (the “Adviser” or “SSGA FM”) estimates of such re-designations for which actual information has not yet been reported.
Expenses
Certain expenses, which are directly identifiable to a specific Fund, are applied to that Fund within the Trust. Other expenses which cannot be attributed to a specific Fund are allocated in such a manner as deemed equitable, taking into consideration the nature and type of expense and the relative net assets of the Funds within the Trust.
81
Table of Contents
THE SELECT SECTOR SPDR TRUST
NOTES TO FINANCIAL STATEMENTS (continued)
September 30, 2017
Foreign Taxes
The Funds may be subject to foreign taxes (a portion of which may be reclaimable) on income, stock dividends, realized and unrealized capital gains on investments or certain foreign currency transactions. Foreign taxes are recorded in accordance with SSGA FM’s understanding of the applicable foreign tax regulations and rates that exist in the foreign jurisdictions in which the Funds invest. These foreign taxes, if any, are paid by the Funds and are reflected in the Statements of Operations, if applicable. Foreign taxes payable or deferred as of September 30, 2017, if any, are disclosed in the Funds’ Statements of Assets and Liabilities.
Equalization
The Funds in the Trust follow the accounting practice known as “Equalization” by which a portion of the proceeds from sales and costs of reacquiring Fund shares, equivalent on a per share basis to the amount of distributable net investment income on the date of the transaction, is credited or charged to undistributed net investment income. As a result, undistributed net investment income per share is unaffected by sales or reacquisition of Fund shares. Amounts related to Equalization can be found on the Statements of Changes in Net Assets.
Distributions
Distributions from net investment income, if any, are declared and paid quarterly. Net realized capital gains, if any, are distributed annually, unless additional distributions are required for compliance with applicable tax regulations. The amount and character of income and capital gains to be distributed are determined in accordance with applicable tax regulations which may differ from net investment income and realized gains recognized for U.S. GAAP purposes.
| 3. | Fees and Transactions with Affiliates |
Advisory Fee
The Trust, on behalf of each Fund, has entered into an Investment Advisory Agreement with SSGA FM. For its advisory services to the Funds, each Fund pays the Adviser a fee accrued daily and paid monthly. The advisory fee is calculated based upon the average daily net assets of the Trust and allocated pro rata to each Select Sector SPDR Fund based on the relative net assets of each Fund. The advisory fee is a sliding scale fee calculated as follows: (i) 0.05% of average daily net assets of the Trust up to the first $12.5 billion of net assets; (ii) 0.04% of average daily net assets of the Trust up to the next $17.5 billion of net assets; (iii) 0.035% of average daily net assets of the Trust up to the next $20.0 billion of net assets; (iv) 0.03% of average daily net assets of the Trust up to the next $50.0 billion of net assets; (v) 0.0285% of average daily net assets of the Trust up to the next $50.0 billion of net assets; (vi) 0.0271% of average daily net assets of the Trust up to the next $50.0 billion of net assets; and (vii) 0.0256% of average daily net assets on the remainder of net assets of the Trust. From time to time, the Adviser may waive all or a portion of its fees. The Adviser has contractually agreed to waive its advisory fee and reimburse certain expenses, until January 31, 2018, so that the annual Fund operating expenses of The Real Estate Select Sector SPDR Fund are limited to no more than 0.14% of the Fund’s average daily net assets (exclusive of non-recurring account fees and extraordinary expenses). The Adviser may continue such waiver and/or reimbursement from year to year, but there is no guarantee that the Adviser will do so after January 31, 2018. The waiver and/or reimbursement may not be terminated prior to January 31, 2018, except with the approval of the Board. The amount of expenses reimbursed by the Adviser during the reporting period for The Real Estate Select Sector SPDR Fund was $26,077.
Unitary Fee
SSGA FM serves as Administrator and State Street Bank and Trust Company (“State Street”), an affiliate of the Adviser, serves as sub-administrator to each Fund of the Trust. A “unitary” fee is paid by each Fund to SSGA FM for administration services as well as to State Street for custody, sub-administration and transfer agency services provided to the Funds. The unitary fee is calculated based upon the average daily net assets of the Trust and allocated pro rata to each Select Sector SPDR Fund based upon the relative net assets of each Fund. Effective May 1, 2017, the unitary fee is a sliding scale fee calculated as follows: (i) 0.05% of average daily net assets up to the first $12.5 billion of net assets of the Trust; (ii) 0.015% of average daily net assets up to the next $25 billion of net assets of the Trust; (iii) 0.0075% of average daily net assets up to the next $118 billion of net assets of the Trust; (iv) 0.004% of average daily net assets up to the next $150 billion of net assets of the Trust; (v) 0.0030% of average daily net assets up to the next
82
Table of Contents
THE SELECT SECTOR SPDR TRUST
NOTES TO FINANCIAL STATEMENTS (continued)
September 30, 2017
$200 billion of the net assets of the Trust; and (vi) 0.0020 of average daily net assets on the remainder of net assets of the Trust. Prior to May 1, 2017, the unitary fee was calculated as follows: (i) 0.07% of average daily net assets up to the first $4.5 billion of net assets of the Trust; (ii) 0.05% of average daily net assets up to the next $4.5 billion of net assets of the Trust; (iii) 0.03% of average daily net assets up to the next $3.5 billion of net assets of the Trust; (iv) 0.015% of average daily net assets up to the next $10.0 billion of net assets of the Trust; and (v) 0.0075% of average daily net assets on the remainder of net assets of the Trust. SSGA FM and State Street each receive a portion of the unitary fee. SSGA FM and State Street are wholly owned subsidiaries of State Street Corporation.
Other Transactions with Affiliates - Securities Lending
State Street, an affiliate of the Funds, acts as the securities lending agent for the Funds, pursuant to an amended and restated securities lending authorization agreement dated July 10, 2017.
Proceeds collected by State Street on investment of cash collateral or any fee income are allocated as follows (after deduction of such other amounts payable to State Street under the terms of the securities lending agreement): 85% payable to the Fund, and 15% payable to State Street.
In addition, cash collateral from lending activities is invested in the State Street Navigator Securities Lending Government Money Market Portfolio, an affiliated money market fund, for which SSGA FM serves as investment adviser. See Note 9 for additional information regarding securities lending.
Other Transactions with Affiliates
The Funds may invest in affiliated entities, including securities issued by State Street Corporation, affiliated funds, or entities deemed to be affiliates as a result of the Funds owning more than five percent of the entity’s voting securities or outstanding shares. Amounts relating to these transactions during the period ended September 30, 2017 are disclosed in the Funds’ respective Schedules of Investments.
On March 20, 2017, the Financial Select Sector SPDR Fund received a non-recurring litigation payment of $779,607 from State Street Corp., an affiliate, which is recorded as a realized gain in the Statements of Operations.
Contribution from Affiliate
On September 30, 2015, State Street made a contribution of $461,741 to The Financial Select Sector SPDR Fund in connection with processing a class action distribution.
| 4. | Additional Expenses |
Distributor
ALPS Portfolio Solutions Distributor, Inc. (the “Distributor”) serves as the distributor of the shares of each Fund. Pursuant to a Distribution and Service Plan adopted in accordance with Rule 12b-1 under the 1940 Act, each Fund is authorized to pay fees, including fees to the Distributor, at an annualized rate of 0.25% of the average daily net assets of the Fund. Effective October 1, 2015, the Board has limited each Fund’s 12b-1 fee to 0.04% or its average daily net assets through at least January 31, 2018.
License Fees
Standard and Poor’s Financial Services LLC, an affiliate of The McGraw-Hill Companies (“S&P”), NYSE Arca, Inc. and Merrill Lynch, Pierce, Fenner & Smith Incorporated, an affiliate of Bank of America Corporation (“BofA Merrill Lynch”), have entered into a license agreement with respect to each Select Sector Index. The Trust has entered into a sub-license agreement whereby the Trust agrees to pay a sub-license fee per annum (i) to S&P equal to the greater of 0.03% of the aggregate net assets of the Trust up to $50 billion and 0.02% on the remainder of the assets of the Trust and (ii) to BofA Merrill Lynch equal to 0.03% of the aggregate net assets of the Trust up to $35 billion, 0.02% of the aggregate net assets of the Trust from $35 billion up to and including $50 billion and 0.01% on the remainder of net assets of the Trust over $50 billion. The fees to S&P and BofA Merrill Lynch are payable on a quarterly basis. Each Select Sector SPDR Fund will pay its proportionate share of the annual sub-license fees based on the relative net assets of each Fund.
83
Table of Contents
THE SELECT SECTOR SPDR TRUST
NOTES TO FINANCIAL STATEMENTS (continued)
September 30, 2017
| 5. | Trustees’ Fees |
The fees and expenses of the Trust’s trustees are paid directly by the Funds. The Independent Trustees are reimbursed for travel and other out-of-pocket expenses in connection with meeting attendance and industry seminars.
| 6. | Investment Transactions |
Purchases and sales of investments (excluding in-kind transactions and short term investments) for the period ended September 30, 2017, were as follows:
| Purchases | Sales | |||||||
The Consumer Discretionary Select Sector SPDR Fund | $ | 669,923,297 | $ | 663,413,450 | ||||
The Consumer Staples Select Sector SPDR Fund | 1,154,799,953 | 1,012,855,337 | ||||||
The Energy Select Sector SPDR Fund | 3,717,540,608 | 3,691,080,739 | ||||||
The Financial Select Sector SPDR Fund | 645,970,588 | 684,640,192 | ||||||
The Health Care Select Sector SPDR Fund | 711,803,483 | 646,412,655 | ||||||
The Industrial Select Sector SPDR Fund | 504,193,795 | 507,933,630 | ||||||
The Materials Select Sector SPDR Fund | 361,810,803 | 370,734,183 | ||||||
The Real Estate Select Sector SPDR Fund | 384,466,437 | 393,047,193 | ||||||
The Technology Select Sector SPDR Fund | 595,325,059 | 551,960,783 | ||||||
The Utilities Select Sector SPDR Fund | 164,757,516 | 163,888,399 | ||||||
For the period ended September 30, 2017, the following Funds had in-kind contributions, redemptions and net realized gains/losses in the amounts as follows:
| In-kind Contributions | In-kind Redemptions | In-kind Net Realized Gains/ (Losses) | ||||||||||
The Consumer Discretionary Select Sector SPDR Fund | $ | 7,322,282,273 | $ | 6,681,990,052 | $ | 969,629,319 | ||||||
The Consumer Staples Select Sector SPDR Fund | 15,025,182,860 | 15,139,575,369 | 473,495,995 | |||||||||
The Energy Select Sector SPDR Fund | 12,681,787,738 | 10,349,552,023 | 323,422,375 | |||||||||
The Financial Select Sector SPDR Fund | 26,353,179,762 | 16,415,386,615 | 2,410,852,350 | |||||||||
The Health Care Select Sector SPDR Fund | 13,616,923,696 | 10,422,764,628 | 868,028,149 | |||||||||
The Industrial Select Sector SPDR Fund | 13,442,485,711 | 11,639,446,356 | 1,150,077,905 | |||||||||
The Materials Select Sector SPDR Fund | 4,664,810,407 | 4,121,473,770 | 338,857,270 | |||||||||
The Real Estate Select Sector SPDR Fund | 791,954,004 | 1,565,013,369 | 49,024,076 | |||||||||
The Technology Select Sector SPDR Fund | 10,479,708,396 | 9,078,834,616 | 1,738,061,770 | |||||||||
The Utilities Select Sector SPDR Fund | 13,264,761,494 | 13,388,424,570 | 320,198,246 | |||||||||
| 7. | Shareholder Transactions |
Each Fund issues and redeems its shares, at NAV, by each Fund only in aggregations of a specified number of shares or multiples thereof (“Creation Units”). Except when aggregated in Creation Units, shares of each Fund are not redeemable. Transactions in capital shares for each Fund are disclosed in detail in the Statements of Changes in Net Assets.
The consideration for the purchase of Creation Units of a Fund may consist of the in-kind deposit of a designated portfolio of securities and a specified amount of cash. Investors purchasing and redeeming Creation Units may pay a purchase transaction fee and a redemption transaction fee directly to the Trust and/or custodian, to offset transfer and other transaction costs associated with the issuance and redemption of Creation Units, including Creation Units for cash. An additional variable fee may be charged for certain transactions. Such variable charges, if any, are included in “Other Capital” on the Statements of Changes on Net Assets.
84
Table of Contents
THE SELECT SECTOR SPDR TRUST
NOTES TO FINANCIAL STATEMENTS (continued)
September 30, 2017
| 8. | Income Tax Information |
The Funds have qualified and intend to continue to qualify as regulated investment companies under Subchapter M of the Internal Revenue Code of 1986, as amended. Each Fund will not be subject to federal income taxes to the extent it distributes its taxable income, including any net realized capital gains, for each fiscal year. Therefore, no provision for federal income tax is required.
The Funds file federal and various state and local tax returns as required. No income tax returns are currently under examination. Generally, the federal returns are subject to examination by the Internal Revenue Service for a period of three years from date of filing, while the state returns may remain open for an additional year depending upon jurisdiction. SSGA FM has analyzed each Fund’s tax positions taken on tax returns for all open years and does not believe there are any uncertain tax positions that would require recognition of a tax liability.
Distributions to shareholders are recorded on ex-dividend date. Income dividends and gain distributions are determined in accordance with income tax rules and regulations, which may differ from generally accepted accounting principles. Certain capital accounts in the financial statements have been adjusted for permanent book-tax differences. These adjustments have no impact on net asset values or results of operations. Temporary book-tax differences will reverse in the future. These book-tax differences are primarily due to differing treatments for character of distributions, nontaxable dividend adjustments to income, in-kind transactions, REITs, expired capital loss carryforwards, equalization, and wash sale loss deferrals. In addition, certain Funds claimed a portion of the payments made to redeeming shareholders as a distribution for income tax purposes.
The tax character of distributions paid during the year ended September 30, 2017 was as follows:
| Ordinary Income | Total | |||||||
The Consumer Discretionary Select Sector SPDR Fund | $ | 183,068,428 | $ | 183,068,428 | ||||
The Consumer Staples Select Sector SPDR Fund | 244,187,449 | 244,187,449 | ||||||
The Energy Select Sector SPDR Fund | 509,160,676 | 509,160,676 | ||||||
The Financial Select Sector SPDR Fund | 390,504,087 | 390,504,087 | ||||||
The Health Care Select Sector SPDR Fund | 252,388,527 | 252,388,527 | ||||||
The Industrial Select Sector SPDR Fund | 212,336,521 | 212,336,521 | ||||||
The Materials Select Sector SPDR Fund | 74,656,242 | 74,656,242 | ||||||
The Real Estate Select Sector SPDR Fund | 94,128,585 | 94,128,585 | ||||||
The Technology Select Sector SPDR Fund | 254,143,361 | 254,143,361 | ||||||
The Utilities Select Sector SPDR Fund | 235,607,383 | 235,607,383 | ||||||
The tax character of distributions paid during the year ended September 30, 2016 was as follows:
| Ordinary Income | Tax Return of Capital | Total | ||||||||||
The Consumer Discretionary Select Sector SPDR Fund | $ | 161,248,260 | $ | — | $ | 161,248,260 | ||||||
The Consumer Staples Select Sector SPDR Fund | 225,446,392 | — | 225,446,392 | |||||||||
The Energy Select Sector SPDR Fund | 374,828,781 | — | 374,828,781 | |||||||||
The Financial Select Sector SPDR Fund | 1,281,124,512 | 1,725,398,884 | 3,006,523,396 | |||||||||
The Health Care Select Sector SPDR Fund | 198,596,804 | — | 198,596,804 | |||||||||
The Industrial Select Sector SPDR Fund | 148,000,415 | — | 148,000,415 | |||||||||
The Materials Select Sector SPDR Fund | 50,640,827 | — | 50,640,827 | |||||||||
The Real Estate Select Sector SPDR Fund | 872,254 | — | 872,254 | |||||||||
The Technology Select Sector SPDR Fund | 248,787,555 | — | 248,787,555 | |||||||||
The Utilities Select Sector SPDR Fund | 250,044,341 | — | 250,044,341 | |||||||||
85
Table of Contents
THE SELECT SECTOR SPDR TRUST
NOTES TO FINANCIAL STATEMENTS (continued)
September 30, 2017
At September 30, 2017, the components of distributable earnings on a tax basis were as follows:
| Undistributed Ordinary Income | Capital Loss Carryforwards | Undistributed Long-Term Capital Gains | Net Unrealized Gains (Losses) | Qualified Late-Year Losses | Total | |||||||||||||||||||
The Consumer Discretionary Select Sector SPDR Fund | $ | — | $ | (502,490,553 | ) | $ | — | $ | 42,073,296 | $ | — | $ | (460,417,257 | ) | ||||||||||
The Consumer Staples Select Sector SPDR Fund | — | (227,867,580 | ) | — | (582,479,589 | ) | — | (810,347,169 | ) | |||||||||||||||
The Energy Select Sector SPDR Fund | 146,623 | (3,395,687,016 | ) | — | (2,889,465,956 | ) | — | (6,285,006,349 | ) | |||||||||||||||
The Financial Select Sector SPDR Fund | — | (404,686,835 | ) | — | 2,340,796,773 | — | 1,936,109,938 | |||||||||||||||||
The Health Care Select Sector SPDR Fund | — | (287,069,262 | ) | — | 646,178,413 | — | 359,109,151 | |||||||||||||||||
The Industrial Select Sector SPDR Fund | 7,236,727 | (414,951,576 | ) | — | 417,953,854 | — | 10,239,005 | |||||||||||||||||
The Materials Select Sector SPDR Fund | 302,259 | (904,440,867 | ) | — | 15,647,554 | — | (888,491,054 | ) | ||||||||||||||||
The Real Estate Select Sector SPDR Fund | — | (31,559,579 | ) | — | (86,854,837 | ) | — | (118,414,416 | ) | |||||||||||||||
The Technology Select Sector SPDR Fund | 1,944,269 | (692,861,845 | ) | — | 2,323,667,512 | — | 1,632,749,936 | |||||||||||||||||
The Utilities Select Sector SPDR Fund | 11,769,678 | (430,845,030 | ) | — | (307,051,044 | ) | — | (726,126,396 | ) | |||||||||||||||
As of September 30, 2017, the following Funds had capital loss carryforwards available to offset future realized capital gains through the indicated expiration dates as follows:
| Expiring 2018 | Expiring 2019 | Non-Expiring Short Term** | Non-Expiring Long Term** | |||||||||||||
The Consumer Discretionary Select Sector SPDR Fund | $ | 44,152,294 | $ | 41,068,081 | $ | 137,293,259 | $ | 279,976,919 | ||||||||
The Consumer Staples Select Sector SPDR Fund | 3,835,906 | 7,952,209 | 9,578,932 | 206,500,533 | ||||||||||||
The Energy Select Sector SPDR Fund | 932,038,288 | 120,300,080 | 238,364,025 | 2,104,984,623 | ||||||||||||
The Financial Select Sector SPDR Fund | 90,041,088 | 5,257,095 | 172,807,368 | 136,581,284 | ||||||||||||
The Health Care Select Sector SPDR Fund | — | — | 80,678,630 | 206,390,632 | ||||||||||||
The Industrial Select Sector SPDR Fund | 80,582,108 | 27,687,839 | 39,564,183 | 267,117,446 | ||||||||||||
The Materials Select Sector SPDR Fund | 254,329,658 | 159,773,879 | 126,485,714 | 363,851,616 | ||||||||||||
The Real Estate Select Sector SPDR Fund | — | — | 25,393,649 | 6,165,930 | ||||||||||||
The Technology Select Sector SPDR Fund | 135,090,209 | 61,133,352 | 44,827,421 | 451,810,863 | ||||||||||||
The Utilities Select Sector SPDR Fund | 83,031,840 | 104,752,494 | 5,303,369 | 237,757,327 | ||||||||||||
| ** | Must be utilized prior to losses subject to expiration. |
As of September 30, 2017, gross unrealized appreciation and gross unrealized depreciation of investments based on cost for federal income tax purposes were as follows:
| Tax Cost | Gross Unrealized Appreciation | Gross Unrealized Depreciation | Net Unrealized Appreciation (Depreciation) | |||||||||||||
The Consumer Discretionary Select Sector SPDR Fund | $ | 11,496,160,921 | $ | 1,066,008,122 | $ | 1,023,934,826 | $ | 42,073,296 | ||||||||
The Consumer Staples Select Sector SPDR Fund | 9,369,986,093 | 49,255,042 | 631,734,631 | (582,479,589 | ) | |||||||||||
The Energy Select Sector SPDR Fund | 19,546,713,365 | 193,478,265 | 3,082,944,221 | (2,889,465,956 | ) | |||||||||||
The Financial Select Sector SPDR Fund | 25,068,419,157 | 2,426,920,643 | 86,123,870 | 2,340,796,773 | ||||||||||||
The Health Care Select Sector SPDR Fund | 17,053,565,175 | 1,462,115,046 | 815,936,633 | 646,178,413 | ||||||||||||
The Industrial Select Sector SPDR Fund | 10,627,909,236 | 861,198,623 | 443,244,769 | 417,953,854 | ||||||||||||
The Materials Select Sector SPDR Fund | 4,030,832,693 | 215,718,671 | 200,071,117 | 15,647,554 | ||||||||||||
The Real Estate Select Sector SPDR Fund | 2,443,132,188 | 123,231,161 | 210,085,998 | (86,854,837 | ) | |||||||||||
The Technology Select Sector SPDR Fund | 15,509,556,398 | 2,684,888,663 | 361,221,151 | 2,323,667,512 | ||||||||||||
The Utilities Select Sector SPDR Fund | 8,066,287,292 | 64,255,621 | 371,306,665 | (307,051,044 | ) | |||||||||||
86
Table of Contents
THE SELECT SECTOR SPDR TRUST
NOTES TO FINANCIAL STATEMENTS (continued)
September 30, 2017
| 9. | Securities Lending |
Each Fund may lend securities to qualified broker-dealers or institutional investors. The loans are secured at all times by cash, cash equivalents or U.S. government securities in an amount at least equal to the market value of the securities loaned, plus accrued interest and dividends, determined on a daily basis and adjusted accordingly. The value of the collateral with respect to a loaned security may be temporarily more or less than the value of a security due to market fluctuations of securities values. With respect to each loan, if on any U.S. business day the aggregate market value of securities collateral plus cash collateral is less than the aggregate market value of the securities which are subject to the loan, the borrower will be notified to provide additional collateral on the next business day.
The Funds will regain record ownership of loaned securities to exercise certain beneficial rights; however, the Funds may bear the risk of delay in recovery of, or even loss of rights in the securities loaned should the borrower fail financially. In addition, a Fund will bear the risk of loss of any cash collateral that it may invest. Each Fund receives compensation for lending its securities from interest or dividends earned on the cash, cash equivalents or U.S. government securities held as collateral, net of fee rebates paid to the borrower and net of fees paid to State Street as the lending agent. Additionally, a Fund will receive a fee from the borrower for non-cash collateral equal to a percentage of the market value of the loaned securities.
The market value of securities on loan as of September 30, 2017 and the value of the invested cash collateral are disclosed in the Funds’ Statements of Assets and Liabilities. Non-cash collateral is not disclosed in the Funds’ Statements of Assets and Liabilities as it is held by the lending agent on behalf of the Funds, and the Funds do not have the ability to re-hypothecate those securities. Securities lending income, as disclosed in the Funds’ Statements of Operations, represents the income earned from the non-cash collateral and the investment of cash collateral, net of fee rebates paid to the borrower and net of fees paid to State Street as lending agent.
The following is a summary of each Fund’s securities lending agreements and related cash and non-cash collateral received as of September 30, 2017:
Fund | Market Value of Securities on Loan | Cash Collateral Received | Non Cash Collateral Received* | Total Collateral Received | ||||||||||||
The Consumer Discretionary Select Sector SPDR Fund | $ | 263,375,350 | $ | 24,093,725 | $ | 246,452,610 | $ | 270,546,335 | ||||||||
The Consumer Staples Select Sector SPDR Fund | 31,835,653 | — | 32,057,679 | 32,057,679 | ||||||||||||
The Energy Select Sector SPDR Fund | 203,325,480 | 42,538,543 | 166,327,653 | 208,866,196 | ||||||||||||
The Financial Select Sector SPDR Fund | 12,143,262 | — | 12,358,797 | 12,358,797 | ||||||||||||
The Health Care Select Sector SPDR Fund | 8,189,007 | — | 8,369,102 | 8,369,102 | ||||||||||||
The Industrial Select Sector SPDR Fund | 105,727,017 | — | 107,360,864 | 107,360,864 | ||||||||||||
The Real Estate Select Sector SPDR Fund | 71,364,962 | — | 73,931,152 | 73,931,152 | ||||||||||||
The Technology Select Sector SPDR Fund | 252,206,014 | 979,738 | 255,851,913 | 256,831,651 | ||||||||||||
The Utilities Select Sector SPDR Fund | 7,814,826 | — | 7,991,115 | 7,991,115 | ||||||||||||
| * | The non-cash collateral includes U.S. Treasuries and U.S. Government Agency securities. |
87
Table of Contents
THE SELECT SECTOR SPDR TRUST
NOTES TO FINANCIAL STATEMENTS (continued)
September 30, 2017
The following tables reflect a breakdown of transactions accounted for as secured borrowings, the gross obligation by the type of collateral pledged or securities loaned, and the remaining contractual maturity of those transactions as of September 30, 2017:
| Remaining Contractual Maturity of the Agreements As of September 30, 2017 | ||||||||||||||||||||||||||
Fund | Securities Lending | Overnight and Continuous | <30 days | Between 30 & 90 days | >90 days | Total Borrowings | Gross Amount of Recognized Liabilities for Securities Lending Transactions | |||||||||||||||||||
The Consumer Discretionary Select Sector SPDR Fund | Common Stocks | $ | 24,093,725 | $ | — | $ | — | $ | — | $ | 24,093,725 | $ | 24,093,725 | |||||||||||||
The Energy Select Sector SPDR Fund | Common Stocks | 42,538,543 | — | — | — | 42,538,543 | 42,538,543 | |||||||||||||||||||
The Technology Select Sector SPDR Fund | Common Stocks | 979,738 | 979,738 | 979,738 | ||||||||||||||||||||||
| 10. | Risks |
Concentration Risk
As a result of the Funds’ ability to invest a large percentage of their assets in obligations of issuers within the same country, state, region, currency or economic sector, an adverse economic, business or political development may affect the value of the Funds’ investments more than if the Funds were more broadly diversified.
Market and Credit Risk
In the normal course of business, the Funds trade financial instruments and enter into financial transactions where risk of potential loss exists due to changes in the general economic conditions and fluctuations of the market (market risk). Additionally, a Fund may also be exposed to credit risk in the event that an issuer or guarantor fails to perform or that an institution or entity with which the Fund has unsettled or open transactions defaults.
| 11. | Subsequent Events |
Management has evaluated the impact of all subsequent events on the Funds through the date on which the financial statements were available to be issued and has determined that there were no subsequent events requiring adjustment or disclosure in the financial statements.
88
Table of Contents
THE SELECT SECTOR SPDR TRUST
REPORT OF INDEPENDENT REGISTERED PUBLIC ACCOUNTING FIRM
To the Trustees and Shareholders of
the Select Sector SPDR Trust:
In our opinion, the accompanying statements of assets and liabilities, including the schedules of investments, and the related statements of operations and of changes in net assets and the financial highlights present fairly, in all material respects, the financial position of the ten funds, listed in Note 1, (each a “Fund”) comprising the Select Sector SPDR Trust (the “Trust”) as of September 30,2017, the results of each of their operations for the year then ended, the changes in each of their net assets and the financial highlights for the periods indicated, in conformity with accounting principles generally accepted in the United States of America. These financial statements and financial highlights (hereafter referred to as “financial statements”) are the responsibility of the Trust’s management. Our responsibility is to express an opinion on these financial statements based on our audits. We conducted our audits of these financial statements in accordance with the standards of the Public Company Accounting Oversight Board (United States). Those standards require that we plan and perform the audit to obtain reasonable assurance about whether the financial statements are free of material misstatement. An audit includes examining, on a test basis, evidence supporting the amounts and disclosures in the financial statements, assessing the accounting principles used and significant estimates made by management, and evaluating the overall financial statement presentation. We believe that our audits, which included confirmation of securities as of September 30, 2017 by correspondence with the custodian and the application of alternative auditing procedures where securities purchased had not been received, provide a reasonable basis for the opinion expressed above.
/s/ PricewaterhouseCoopers LLP
Boston, Massachusetts
November 21, 2017
89
Table of Contents
THE SELECT SECTOR SPDR TRUST
September 30, 2017 (Unaudited)
Expense Example
As a shareholder of a Fund, you incur two types of costs (1) transaction costs, including sales charges (loads), if applicable, on purchase payments, reinvested dividends, or other distributions and (2) ongoing costs, including advisory fees and other Fund expenses. This example is intended to help you understand your ongoing costs (in dollars) of investing in the Fund and to compare these costs with the ongoing costs of investing in other mutual funds. It is based on an investment of $1,000 made at the beginning of the period shown and held for the entire period from April 1, 2017 to September 30, 2017.
The table below illustrates your Fund’s cost in two ways:
Based on actual fund return — This section helps you to estimate the actual expenses that you paid over the period. The “Ending Account Value” shown is derived from each Fund’s actual return, and the third column shows the dollar amount that would have been paid by an investor who started with $1,000 in the Fund. You may use the information here, together with the amount you invested, to estimate the expenses that you paid over the period. To do so, simply divide your account value by $1,000 (for example, an $8,600 account value divided by $1,000 = 8.6), then multiply the result by the number given for the Fund under the heading “Expenses Paid During Period”.
Based on hypothetical 5% return — This section is intended to help you compare your Fund’s costs with those of other mutual funds. It assumes that the Fund had a yearly return of 5% before expenses, but that the expense ratio is unchanged. In this case, because the return used is not the Fund’s actual return, the results do not apply to your investment. The example is useful in making comparisons because the Securities and Exchange Commission (the “SEC”) requires all mutual funds to calculate expenses based on a 5% return. You can assess your Fund’s costs by comparing this hypothetical example with the hypothetical examples that appear in shareholder reports of other funds.
Please note that the expenses shown in the table are meant to highlight your ongoing costs only and do not reflect any transaction costs, such as sales load charges (loads). Therefore, the hypothetical 5% return section of the table is useful in comparing ongoing costs only, and will not help you determine the relative total costs of owning different funds. In addition, if these transaction costs were included, your costs would have been higher.
| Actual | Hypothetical (assuming a 5% return before expenses) | |||||||||||||||||||
| Annualized Expense Ratio | Ending Account Value | Expenses Paid During Period(a) | Ending Account Value | Expenses Paid During Period(a) | ||||||||||||||||
The Consumer Discretionary Select Sector SPDR Fund | 0.14 | % | $ | 1,031.40 | $ | 0.71 | $ | 1,024.40 | $ | 0.71 | ||||||||||
The Consumer Staples Select Sector SPDR Fund | 0.14 | 1,002.80 | 0.70 | 1,024.40 | 0.71 | |||||||||||||||
The Energy Select Sector SPDR Fund | 0.14 | 998.20 | 0.70 | 1,024.40 | 0.71 | |||||||||||||||
The Financial Select Sector SPDR Fund | 0.14 | 1,096.40 | 0.74 | 1,024.40 | 0.71 | |||||||||||||||
The Health Care Select Sector SPDR Fund | 0.14 | 1,108.20 | 0.74 | 1,024.40 | 0.71 | |||||||||||||||
The Industrial Select Sector SPDR Fund | 0.14 | 1,100.60 | 0.74 | 1,024.40 | 0.71 | |||||||||||||||
The Materials Select Sector SPDR Fund | 0.14 | 1,095.00 | 0.74 | 1,024.40 | 0.71 | |||||||||||||||
The Real Estate Select Sector SPDR Fund | 0.14 | 1,036.50 | 0.71 | 1,024.40 | 0.71 | |||||||||||||||
The Technology Select Sector SPDR Fund | 0.14 | 1,117.50 | 0.74 | 1,024.40 | 0.71 | |||||||||||||||
The Utilities Select Sector SPDR Fund | 0.14 | 1,050.70 | 0.72 | 1,024.40 | 0.71 | |||||||||||||||
| (a) | Expenses are equal to the Fund’s annualized net expense ratio multiplied by the average account value of the period, multiplied by 183, then divided by 365. |
Tax Information
For federal income tax purposes, the following information is furnished with respect to the distributions of the Trust for its fiscal year ended September 30, 2017.
90
Table of Contents
THE SELECT SECTOR SPDR TRUST
OTHER INFORMATION (continued)
September 30, 2017 (Unaudited)
Dividends Received Deduction
Each Fund reports the maximum amount allowable of its net taxable income as eligible for the corporate dividends-received deduction.
Qualified Dividend Income
A portion of dividends distributed by the Funds during the fiscal year ended September 30, 2017 are considered qualified dividend income and are eligible for reduced tax rates. These lower rates range from 5% to 20% depending on the individual’s tax bracket. Each Fund reports the maximum amount allowable of its net taxable income as qualified dividend income as provided in the Jobs and Growth Tax Relief Reconciliation Act of 2003.
Premium/Discount Information
Information regarding how often the Shares of each Fund traded on the Exchange at a price above (i.e., at a premium) or below (i.e., at a discount) the net asset value of the Fund during the past calendar year can be found at www.sectorspdrs.com.
Proxy Voting Policies and Procedures and Records
A description of the Trust’s proxy voting policies and procedures that are used by the Funds’ investment adviser to vote proxies relating to the Funds’ portfolio of securities is available (i) without charge, upon request by calling 1-866-787-2257 (toll free) or (ii) on the SEC’s website, at www.sec.gov.
Information regarding how the investment adviser voted for the most recent period ended June 30 is available by August 31 of each year by calling the same number and on the SEC’s website, at www.sec.gov, and on the Funds’ website at www.spdrs.com.
Quarterly Portfolio Schedule
The Funds file a complete schedule of investments with the SEC for the first and third quarters of each fiscal year on Form N-Q. The Funds’ Form N-Qs are available on the SEC’s website at www.sec.gov and may be reviewed and copied at the SEC’s Public Reference Room in Washington, DC. Information on the operation of the Public Reference Room may be obtained by calling 1-800-SEC-0330. The information in the Form N-Q is available upon request, without charge, by calling 1-866-Sector-ETF (1-866-732-8673).
Advisory Contract Renewal
At an in-person meeting held on May 11, 2017 (the “May Meeting”), the Trustees of The Select Sector SPDR® Trust (the “Trust”) considered the renewal of the Amended and Restated Investment Advisory Agreement dated December 1, 2003, as amended effective October 6, 2015 (the “Agreement”), between the Trust and SSGA Funds Management, Inc. (the “Adviser”) with respect to each series of the Trust (each a “Fund” and collectively, the “Funds”). The Trustees who are not “interested persons” of the Trust within the meaning of the Investment Company Act of 1940, as amended (the “1940 Act”) (the “Independent Trustees”), also met separately with their independent legal counsel during a meeting held on April 19, 2017 (the “April Meeting”) to consider the Agreement and the materials provided by the Adviser and State Street Bank and Trust Company (“State Street”) in response to a request from independent legal counsel on their behalf. The April Meeting included a presentation by representatives of the Adviser and State Street during which the Independent Trustees and independent legal counsel were able to pose questions. Following the April Meeting, independent legal counsel on behalf of the Independent Trustees requested certain clarifications and supplements to the materials provided, and those materials were considered at the May Meeting, during which the Independent Trustees also met separately with their independent legal counsel. In deciding whether to renew the Agreement, the Trustees considered various factors, including, among others, (i) the nature, extent and quality of the services provided by the Adviser under the Agreement, (ii) the investment performance of the Funds, (iii) the costs to the Adviser of its services and the profits realized by the Adviser and its affiliate, State Street, from their relationships with the Trust, and (iv) the extent to which economies of scale would be realized if and as the Funds grow and whether the fee levels in the Agreement reflect a sharing of any such economies of scale.
91
Table of Contents
THE SELECT SECTOR SPDR TRUST
OTHER INFORMATION (continued)
September 30, 2017 (Unaudited)
Nature, Extent and Quality of Services
In considering the nature, extent and quality of the services provided by the Adviser, the Trustees relied on their prior experience as Trustees of the Trust, as well as on the materials provided for purposes of reviewing the Agreement. They noted that under the Agreement the Adviser is responsible for: (i) managing the investment operations of each of the Funds in accordance with the Fund’s investment objective and policies, applicable legal and regulatory requirements, and the instructions of the Trustees; (ii) providing necessary and appropriate reports and information to the Trustees; (iii) maintaining all necessary books and records pertaining to the Trust’s securities transactions; and (iv) furnishing each Fund with the assistance, cooperation and information necessary for the Fund to meet various legal requirements regarding registration and reporting. They noted the distinctive nature of the Funds, as exchange-traded funds (“ETFs”) investing in sectors of the S&P 500 Index, and the experience and expertise appropriate in an adviser to funds of that nature. The Trustees reviewed the background and experience of the Adviser’s senior management, including those individuals responsible for the investment and compliance operations of the Trust, and the responsibilities of the latter with respect to the Funds. They also considered the resources, operational structures and practices of the Adviser in managing the Funds’ portfolios, in monitoring and securing each Fund’s compliance with its investment objective and policies and with applicable law and regulations, and in seeking best execution of portfolio transactions. Drawing upon the materials provided and their general knowledge of the business of the Adviser and its affiliate, State Street Global Advisors (“SSGA”), with which the Adviser shares all of its senior personnel, the Trustees took into account the experience, resources and strength of the Adviser and its affiliates in the areas of indexed products generally and ETFs in particular, and also noted SSGA’s recent acquisition of GE Asset Management. The Trustees also reviewed the successful reconstitution of The Financial Select Sector SPDR® Fund and launch of The Real Estate Select Sector SPDR® Trust due to the Global Industry Classification Standards reclassification of real estate companies as a separate sector. The Trustees noted the Adviser’s belief that shareholders of the Fund were direct beneficiaries of the analytical and operational abilities of the Adviser utilized in the reconstitution and launch. On the basis of this review, the Trustees determined that the nature and extent of the services provided by the Adviser to the Trust were appropriate, had been of high quality during the past year, and could be expected to remain so.
Investment Performance of the Funds
The Trustees noted that, in view of the distinctive investment objective of each Fund, the investment performance of the Funds in absolute terms was not of the importance that normally attaches to the performance of actively managed funds. Of more importance to the Trustees was the extent to which each Fund achieved its objective to provide investment results that, before expenses, correspond generally to the price and yield performance of publicly traded equity securities of companies in its applicable index. Drawing upon information provided at the April Meeting and at the May Meeting, and upon reports provided to the Trustees by the Adviser throughout the preceding year, the Trustees determined that the Funds had tracked their sector indexes within an acceptable range; they further concluded, on the basis of the data available (see discussion in “Comparison of Fees and Expense Ratios” below), that the expense ratios of the Funds were among the lowest of all of their direct competitors, and had been trending lower. Accordingly, they concluded that the performance of each Fund was satisfactory.
Profitability to the Adviser and its Affiliates
The Trustees considered the profitability of the advisory arrangement with the Funds to the Adviser and of the Trust’s relationship with the Adviser’s affiliate, State Street, in its role as Sub-Administrator, Transfer Agent and Custodian. The Trustees also considered the profitability from the fees received and income earned by State Street as Securities Lending Agent for the Trust. The Trustees received data on the Funds’ profitability to the Adviser for calendar year 2016 as well as 2015 profitability data along with data on the Trust’s profitability to State Street for the same and prior periods. The Trustees reviewed with representatives from both the Adviser and State Street the methods by which expenses were allocated to the Trust and to each of the Funds. On the basis of this information and discussions at the April Meeting and the May Meeting, the Trustees concluded that, to the extent that the Adviser’s and State Street’s relationships with the Trust had been profitable to either or both of those entities, the profitability at current asset levels was not such as to render the advisory fee excessive.
92
Table of Contents
THE SELECT SECTOR SPDR TRUST
OTHER INFORMATION (continued)
September 30, 2017 (Unaudited)
Other Benefits to the Adviser or its Affiliates
In considering whether the Adviser benefits in other ways from its relationship with the Trust, the Trustees noted that the Adviser does not currently use the Funds’ assets for, or participate in, third party soft dollar arrangements. It was further noted that the Trust’s brokerage transactions are not effected through the Adviser or any of its affiliates. The Trustees noted that the Adviser serves as Administrator to the Trust and that State Street, an affiliate of the Adviser, serves the Trust as Sub-Administrator, Transfer Agent and Custodian, as well as Securities Lending Agent. The Trustees also noted that, based on their review of the arrangements for those services, any benefit the Adviser or the Adviser’s affiliate receives or had received from providing those services appears to be appropriate. The Trustees concluded that, to the extent that the Adviser or its affiliates derive other benefits or will derive other benefits from their relationships with the Trust, those benefits are not such as to render the Adviser’s fees excessive.
Economies of Scale
On the basis of their discussions with management and their analysis of information provided at and prior to the May Meeting, the Trustees determined that the nature of the Funds and their operations is such that the Adviser is likely to realize economies of scale in the management of the Funds as the Funds grow in size. They were also of the view that these economies of scale were being shared with the Funds by virtue of an advisory fee, set at a relatively low level since the inception of the Trust, that subsumed economies of scale in the fee itself. Furthermore, the Trustees took into consideration the fact that, in order to ensure that if and as the Funds grow in size the economies of scale resulting from this growth would be shared with the Funds, the Adviser and State Street had each previously agreed to institute one or more breakpoints in their respective fee schedules, and that the Adviser had agreed to amend the Agreement effective February 1, 2011, to add a breakpoint at $30 billion of .035% and a breakpoint at $50 billion of .03%. The Trustees noted that in light of the continued growth in assets and the economies of scale being realized by the Adviser, the Adviser had agreed to further amend the Agreement effective June 1, 2014, to add a breakpoint at $100 billion of .0285%, a breakpoint at $150 billion of .0271% and a breakpoint at $200 billion of .0256%.
The Independent Trustees also noted that State Street had agreed to continue the same aggregate fee schedule for sub-administration, transfer agency and custody services for the Funds which existed prior to the Adviser assuming administration services on June 1, 2015. Under that arrangement, State Street had agreed to amend its agreements as Administrator, Transfer Agent and Custodian for the Trust to add a breakpoint on Trust assets over $22.5 billion of .0075%. The Trustees also discussed with State Street at the April and May Meetings the potential for additional break points in the future and State Street had agreed at the May Meeting to submit to the Independent Trustees a proposal for such additional breakpoints to take effect on June 1, 2017.
Comparison of Fees and Expense Ratios
In order better to evaluate the Funds’ advisory fee, the Independent Trustees requested information with respect to expense ratios and advisory fees of comparable funds, and the Adviser provided: (1) data from Broadridge Financial Solutions, Inc. (“Broadridge”) on peer sector funds, and (2) data obtained from a Broadridge database of peer sector funds, including both ETFs tracking indexes as well as mutual funds. The Independent Trustees also requested, and the Adviser provided, information on the advisory fees charged to other clients with comparable investment objectives, and reviewed the differences in services provided to such clients, including the Adviser’s institutional accounts. The Trustees found that, because of the distinctive nature of the Funds, the universe of comparable funds and accounts was limited. Moreover, they noted that because many ETFs pay a unitary advisory fee, encompassing all or virtually all of the ETFs’ operating expenses and in many cases a Fund’s advisory fee, as reflected in the materials, covered only advisory services, a Fund’s fee would be misleadingly low relative to its competitors’. The Trustees then reviewed comparable expense ratios and noted that the overall expense ratio of each Fund was among the lowest of its domestic sector ETF peers, but also noted that each Fund (other than The Real Estate Select Sector SPDR® Fund) continued to be significantly larger than all of its ETF sector peers. The Independent Trustees noted that this had prompted them to request, in connection with their 2010 annual review of the Agreement and contracts with the Adviser’s affiliate, State Street, that new breakpoints be added to the fee schedules of both the Agreement and the unitary fee payable under the Administration Agreement, Custodian Agreement and Transfer Agency Agreement, and that the Adviser and State Street had agreed to changes to the fee schedules for the benefit of shareholders, effective February 1, 2011, as noted above. The Trustees noted that in light of further asset growth, the Adviser had agreed to additional breakpoints under the Agreement effective June 1, 2014, as noted above. The Trustees
93
Table of Contents
THE SELECT SECTOR SPDR TRUST
OTHER INFORMATION (continued)
September 30, 2017 (Unaudited)
noted that at current asset levels, shareholders are benefiting from these breakpoints and should continue to benefit in the future with additional growth in assets. The Trustees concluded that the data available provided some indirect confirmation of the reasonableness of the Adviser’s fees.
Conclusion
Based on their review, the Trustees, including a majority of the Independent Trustees, as required by the 1940 Act, approved the continuance of the Agreement with respect to the Funds. In deciding to approve the renewal of each Advisory Agreement, the Board did not identify any single factor or group of factors as all important or controlling and considered all factors together. The Board did not allot a particular weight to any one factor or group of factors. They reasoned that, considered in themselves, the nature and extent of the services provided by the Adviser were appropriate, that the performance of the Funds had been satisfactory, and that the Adviser could be expected to provide services of high quality. As to the Adviser’s fees for each Fund, the Trustees determined that the fees, considered in relation to the services provided, were fair and reasonable, that the Trust’s relationship with the Adviser and State Street was not so profitable as to render the fees at current asset levels excessive, that any additional benefits to the Adviser and/or State Street were not of a magnitude to materially affect the outcome of the Trustees’ conclusions, and that, especially in light of the breakpoints in the Adviser’s and State Street’s fee schedules, the fees paid reflected a sharing of economies of scale with the Funds.
94
Table of Contents
THE SELECT SECTOR SPDR TRUST
OTHER INFORMATION (continued)
September 30, 2017 (Unaudited)
TRUSTEES AND OFFICERS OF THE TRUST
Name, Address and Year of Birth | Position(s) | Term of | Principal | Number of Portfolios in Fund Complex Overseen by Trustee† | Other Directorships | |||||||
Independent Trustees | ||||||||||||
CHERYL BURGERMEISTER c/o The Select Sector SPDR Trust State Street Financial Center One Lincoln Street Boston, MA 02111 1951 | Trustee, Chairman of the Board, Member of the Audit Committee, Member of the Nominating and Governance Committee | Term: Indefinite Elected: October 1998 | Retired; Finance Committee Member, Portland Community College Foundation (January 2001 to present); CPA (Retired). | 10 | Director, Chair of the Audit Committee and Member of the Nominating and Governance Committee, Russell Funds Complex; Lead Independent Director and Member of the Audit and Nominating and Governance Committees, ALPS Series Trust (2012 to 2016). | |||||||
GEORGE R. GASPARI c/o The Select Sector SPDR Trust State Street Financial Center One Lincoln Street Boston, MA 02111 1940 | Trustee, Chairman of the Audit Committee, Member of the Nominating and Governance Committee | Term: Indefinite Elected: October 1998 | Retired Financial Services Consultant (1996 to 2012). | 10 | Director and Member of the Audit Committee, Liberty All-Star Growth Fund, Inc.; Trustee and Member of the Audit Committee, Liberty All-Star Equity Fund. | |||||||
ASHLEY T. RABUN c/o The Select Sector SPDR Trust State Street Financial Center One Lincoln Street Boston, MA 02111 1952 | Trustee, Member of the Audit Committee, Member of the Nominating and Governance Committee | Term: Indefinite Appointed: October 2015 | Retired; President and Founder, InvestorReach, Inc., a financial services consulting firm (1996 to 2015). | 10 | Chairperson of the Board and Member of the Audit and Nominating Committees, Investment Managers Series Trust. | |||||||
ERNEST J. SCALBERG c/o The Select Sector SPDR Trust State Street Financial Center One Lincoln Street Boston, MA 02111 1945 | Trustee, Member of the Audit Committee, Chairman of the Nominating and Governance Committee | Term: Indefinite Elected: October 1998 | Retired; Research Professor and Director of the GLOBE Center, Monterey Institute of International Studies (2009 to 2014). | 10 | Director and Chairman of the Audit Committee of Principal Real Estate Income Fund; Director and Member of the Audit and Nominating Committees, db-X Exchange-Traded Funds Inc. (2007-2015); Chairman of the Board of the Foundation, International University in Geneva (IUG), Switzerland. | |||||||
95
Table of Contents
THE SELECT SECTOR SPDR TRUST
OTHER INFORMATION (continued)
September 30, 2017 (Unaudited)
Name, Address and Year of Birth | Position(s) with Trust | Term of Office and Length of Time Served | Principal Occupation(s) During Past 5 Years | Number of Portfolios in Fund Complex Overseen by Trustee† | Other Directorships Held by Trustee During the Past 5 Years | |||||||
R. CHARLES TSCHAMPION c/o The Select Sector SPDR Trust State Street Financial Center One Lincoln Street Boston, MA 02111 1946 | Trustee, Member of the Audit Committee, Member of the Nominating and Governance Committee, Chair of the Business Continuity Management Team | Term: Elected: October 1998 | Retired; Director, Special Projects, CFA Institute (2010 to 2014); Director, Industry Relations, CFA Institute (2005 to 2010). | 10 | Trustee Emeritus of Lehigh University; Director and Member of the Audit and Nominating Committees, db-X Exchange-Traded Funds, Inc. (2007-2015); Director, Real Estate Information Standards Board (2007-2013). | |||||||
Interested Trustee | ||||||||||||
JAMES E. ROSS* SSGA Funds Management, Inc. State Street Financial Center One Lincoln Street Boston, MA 02111 1965 | Trustee | Term: Indefinite Appointed: November 2005 | Chairman and Director, SSGA Funds Management, Inc. (2005-present); Executive Vice President, State Street Global Advisors (2012-present); Chief Executive Officer and Director, State Street Global Advisors Funds Distributors, LLC (May 2017-present); Director, State Street Global Markets, LLC (2013-April 2017); President, SSGA Funds Management, Inc. (2005-2012); Principal, State Street Global Advisors (2000-2005). | 234 | SSGA SPDR ETFs Europe I plc (Director) (November 2016-present); SSGA SPDR ETFs Europe II plc (Director) (November 2016-present). | |||||||
| † | For the purpose of determining the number of portfolios overseen by the Trustees, “Fund Complex” comprises registered investment companies for which SSGA Funds Management, Inc. serves as investment adviser. |
| * | Mr. Ross is an “interested person” of the Trust, as defined in the 1940 Act, because of his employment with the Adviser and ownership interest in an affiliate of the Adviser. |
96
Table of Contents
THE SELECT SECTOR SPDR TRUST
OTHER INFORMATION (continued)
September 30, 2017 (Unaudited)
Name, Address and Year of Birth | Position(s) | Term of | Principal | |||
Officers | ||||||
ELLEN M. NEEDHAM SSGA Funds Management, Inc. State Street Financial Center One Lincoln Street Boston, MA 02111 1967 | President and Principal Executive Officer | Term: Indefinite Elected: May 2013 | President and Director, SSGA Funds Management, Inc. (2001-present)*; Senior Managing Director, State Street Global Advisors (1992-present)*; Director, State Street Global Advisors Funds Distributors, LLC (May 2017-present). | |||
MICHAEL P. RILEY SSGA Funds Management, Inc. State Street Financial Center One Lincoln Street Boston, MA 02111 1969 | Vice President | Term: Indefinite Elected: February 2005 | Managing Director, State Street Global Advisors (2005-present).* | |||
BRUCE S. ROSENBERG SSGA Funds Management, Inc. State Street Financial Center One Lincoln Street Boston, MA 02111 1961 | Deputy Treasurer | Term: Indefinite Elected: February 2016 | Managing Director, State Street Global Advisors and SSGA Funds Management, Inc. (July 2015-present); Director, Credit Suisse (April 2008-July 2015). | |||
ANN CARPENTER SSGA Funds Management, Inc. State Street Financial Center One Lincoln Street Boston, MA 02111 1966 | Deputy Treasurer | Term: Indefinite Elected: February 2016 | Chief Operating Officer, SSGA Funds Management, Inc. (2005-present)*; Managing Director, State Street Global Advisors (2005-present).* | |||
CHAD C. HALLETT SSGA Funds Management, Inc. State Street Financial Center One Lincoln Street Boston, MA 02111 1969 | Treasurer and Principal Financial Officer | Term: Indefinite Elected: November 2007 | Vice President, State Street Global Advisors and SSGA Funds Management, Inc. (November 2014-present); Vice President, State Street Bank and Trust Company (2001-November 2014).* | |||
DARLENE ANDERSON-VASQUEZ SSGA Funds Management, Inc. State Street Financial Center One Lincoln Street Boston, MA 02111 1968 | Deputy Treasurer | Term: Indefinite Elected: February 2017 | Managing Director, State Street Global Advisors and SSGA Funds Management, Inc. (May 2016-present); Senior Vice President, John Hancock Investments (September 2007-May 2016). | |||
ARTHUR A. JENSEN SSGA Funds Management, Inc. 1600 Summer Street Stamford, CT 06905 1966 | Deputy Treasurer | Term: Indefinite Elected: November 2017 | Vice President at State Street Global Advisors (July 2016-present); Mutual Funds Controller of GE Asset Management Incorporated (April 2011-July 2016). | |||
SUJATA UPRETI SSGA Funds Management, Inc. State Street Financial Center One Lincoln Street Boston, MA 02111 1974 | Assistant Treasurer | Term: Indefinite Elected: February 2016 | Vice President, State Street Global Advisors and SSGA Funds Management, Inc. (May 2015-present); Assistant Director, Cambridge Associates, LLC (July 2014-January 2015); Vice President, Bank of New York Mellon (July 2012-August 2013); Manager, PricewaterhouseCoopers, LLP (September 2003-July 2012). |
97
Table of Contents
THE SELECT SECTOR SPDR TRUST
OTHER INFORMATION (continued)
September 30, 2017 (Unaudited)
Name, Address and Year of Birth | Position(s) | Term of | Principal | |||
DANIEL FOLEY SSGA Funds Management, Inc. State Street Financial Center One Lincoln Street Boston, MA 02111 1972 | Assistant Treasurer | Term: Indefinite Elected: February 2016 | Vice President, State Street Global Advisors and SSGA Funds Management, Inc. (April 2007-present).* | |||
DANIEL G. PLOURDE SSGA Funds Management, Inc. State Street Financial Center One Lincoln Street Boston, MA 02111 1980 | Assistant Treasurer | Term: Indefinite Elected: May 2017 | Assistant Vice President, SSGA Funds Management, Inc. (May 2015-present); Officer, State Street Bank and Trust Company (March 2009-May 2015). | |||
JOSHUA A. WEINBERG SSGA Funds Management, Inc. State Street Financial Center One Lincoln Street Boston, MA 02111 1978 | Chief Legal Officer | Term: Indefinite Elected: February 2015 | Managing Director and Managing Counsel, State Street Global Advisors (2011-present); Clerk, SSGA Funds Management, Inc. (2013-present); Associate, Financial Services Group, Dechert LLP (2006-2011). | |||
BRIAN HARRIS SSGA Funds Management, Inc. State Street Financial Center One Lincoln Street Boston, MA 02111 1973 | Chief Compliance Officer; Anti-Money Laundering Officer; Code of Ethics Compliance Officer | Term: Indefinite Elected: November 2013 | Managing Director, State Street Global Advisors and SSGA Funds Management, Inc. (June 2013-present)*; Senior Vice President and Global Head of Investment Compliance, BofA Global Capital Management (2010-2013). | |||
JESSE D. HALLEE State Street Bank and Trust Company 100 Summer Street, Floor 7 Mail Stop SUM0703 Boston, MA 02111 1976 | Secretary | Term: Indefinite Elected: November 2013 | Vice President and Senior Counsel, State Street Bank and Trust Company (2013 to present); Vice President and Counsel, Brown Brothers Harriman & Co. (2007-2013).** |
| * | Served in various capacities and/or with various affiliated entities during noted time period. |
| ** | Served in various capacities and/or with unaffiliated mutual funds or closed-end funds for which State Street Bank and Trust Company or its affiliates act as a provider of services during the noted time period. |
The Trust’s Statement of Additional Information (SAI) includes additional information about Funds’ directors and is available, without charge, upon request and by calling 1-866-787-2257.
98
Table of Contents
TRUSTEES
Cheryl Burgermeister, Chairperson
George R. Gaspari
Ashley T. Rabun
James E. Ross
Ernest J. Scalberg
R. Charles Tschampion
INVESTMENT MANAGERAND ADMINISTRATOR
SSGA Funds Management, Inc.
State Street Financial Center
One Lincoln Street
Boston, Massachusetts 02111
DISTRIBUTOR
ALPS Portfolio Solutions Distributor, Inc.
1290 Broadway, Suite 1100
Denver, Colorado 80203
CUSTODIAN, SUB-ADMINISTRATORAND TRANSFER AGENT
State Street Bank and Trust Company
State Street Financial Center
One Lincoln Street
Boston, Massachusetts 02111
LEGAL COUNSEL
Morgan, Lewis & Bockius LLP
1111 Pennsylvania Avenue, NW
Washington, DC 20004
INDEPENDENT REGISTERED PUBLIC ACCOUNTING FIRM
PricewaterhouseCoopers LLP
101 Seaport Boulevard
Suite 500
Boston, MA 02210
The information contained in this report is intended for the general information of shareholders of the Trust. This report is not authorized for distribution to prospective investors unless preceded or accompanied by a current Trust prospectus which contains important information concerning the Trust. You may obtain a current prospectus from the Distributor, ALPS Portfolio Solutions Distributor, Inc., by calling 1-866-SECTOR-ETF (1-866-732-8673). Please read the prospectus carefully before you invest.
Table of Contents
![]()
Visit www.sectorspdrs.com or call 1-866-SECTOR-ETF (1-866-732-8673)
| IBG-25641 | SPDRSSAR |
Table of Contents
| Item 2. | Code of Ethics. |
As of the end of the period covered by this report, the registrant has adopted a code of ethics that applies to the registrant’s principal executive officer, principal financial officer, principal accounting officer or controller, or persons performing similar functions, regardless of whether these individuals are employed by the registrant or a third party (the “Code of Ethics”). During the period covered by this report, no substantive amendments were made to the Code of Ethics. During the period covered by this report, the registrant did not grant any waivers, including any implicit waivers, from any provision of the Code of Ethics.
The Code of Ethics is attached hereto as Exhibit 13(a)(1).
| Item 3. | Audit Committee Financial Expert. |
(a)(1) The Board of Trustees of the registrant has determined that the registrant has four Board members serving on the Audit Committee that possess the attributes identified in Instructions 2(b) of Item 3 to Form N-CSR to qualify as an “audit committee financial expert.”
(2) Cheryl Burgermeister, George Gaspari, Ernest Scalberg and R. Charles Tschampion are the registrant’s audit committee financial experts. The Board has determined that each of the foregoing persons is “independent” in that, (i) other than in his or her capacity as a member of the Audit Committee and the Board of Trustees of the registrant, he or she has not accepted, directly or indirectly, any consulting, advisory or other compensatory fee from the registrant, and (ii) he or she is not an “interested person” of the registrant as defined in Section 2(a)(19) of the Investment Company Act of 1940, as amended (the “1940 Act”).
| Item 4. | Principal Accountant Fees and Services. |
(a) Audit Fees.
For the fiscal years ended September 30, 2017 and September 30, 2016, the aggregate audit fees billed for professional services rendered by the principal accountant were $170,698 and $179,078, respectively. The nature of the services are (1) auditing of the statements of assets and liabilities, related statements of operations and changes in net assets, and the financial highlights of each series of the registrant; (2) auditing and reporting on the financial statements to be included in the amendment to the registrant’s registration statement on Form N-1A to be filed with the Securities and Exchange Commission; (3) review of the amendment to the registration statement; (4) issuance of a Report on Internal Control for inclusion in the registrant’s Form N-SAR; and (5) Rule 17f-2 securities counts.
(b) Audit-Related Fees.
For the fiscal years ended September 30, 2017 and September 30, 2016, the principal accountant did not bill the registrant any fees for assurances and related services that are reasonably related to the performance of the audit of the registrant’s financial statements that are not reported under paragraph (a) of this Item.
(c) Tax Fees.
For the fiscal years ended September 30, 2017 and September 30, 2016, the aggregate tax fees billed for professional services rendered by the principal accountant were $91,010 and $92,180, respectively. Services included the review of the registrant’s federal, state and local income, franchise and other tax returns.
Table of Contents
(d) All Other Fees.
There were no other fees billed by the principal accountant for the fiscal years ending September 30, 2017 and September 30, 2016.
(e)(1) Audit Committee Pre-Approval Policies and Procedures.
The registrant’s Audit Committee Charter states the following with respect to pre-approval procedures:
Before the independent auditors are engaged by the Trust to render audit or non-audit services, either:
| a. | The Audit Committee shall pre-approve all audit services and permissible non-audit services (e.g., tax services) provided to the Trust. The Audit Committee may delegate to one or more of its members the authority to grant pre-approvals. Any decision of any member to whom authority is delegated under this section shall be presented to the full Audit Committee at the next regularly scheduled meeting of the Board of Trustees; or* |
| b. | Pre-Approval of Non-Audit Services Provided to the investment adviser and Certain Control Persons. The Audit Committee shall pre-approve any non-audit services proposed to be provided by the independent auditors to (a) the investment adviser and (b) any entity controlling, controlled by, or under common control with the investment adviser that provides ongoing services to the Trust, if the independent auditors’ engagement with the investment adviser or any such control persons relates directly to the operations and financial reporting of the Trust. Any decision of any member to whom authority is delegated under this section shall be presented to the full Audit Committee at the next regularly scheduled meeting of the Board. It shall be the responsibility of the independent auditors to notify the Audit Committee of any non-audit services that need to be pre-approved.** |
(e)(2) Percentage of Services.
None of the services described in paragraphs (b) through (d) of this Item were performed in reliance on paragraph (c)(7)(i)(C) of Rule 2-01 of Regulation S-X during the period of time for which such rule was effective.
(f) Not applicable.
(g) The aggregate non-audit fees for services rendered by the principal accountant to the registrant and its adviser and any entity controlling, controlled by, or under common control with the adviser that provided ongoing services to the registrant for the twelve months ended December 31, 2016 and December 31, 2015 were approximately $4,919,389 and $2,599,622, respectively. Such information is not readily available on a fiscal year basis.
| * | Minimis Exceptions to Pre-Approval Requirements: Pre-approval for a service provided to the Trust other than audit, review or attest services is not required if: (1) the aggregate amount of all such non-audit services provided to the Trust constitutes not more than 5 percent of the total amount of revenues paid by the Trust to the independent auditors during the fiscal year in which the non-audit services are provided; (2) such services were not recognized by the Trust at the time of the engagement to be non-audit services; and (3) such services are promptly brought to the attention of the Audit Committee and are approved by the Audit Committee or by one or more members of the Audit Committee to whom authority to grant such approvals has been delegated by the Audit Committee prior to the completion of the audit. |
| ** | Application of De Minimis Exception: The De Minimis exception set forth above applies to pre-approvals under section (b) as well, except that the “total amount of revenues” calculation is based on the total amount of revenues paid to the independent auditors by the Trust and any other entity for which services are approved under section (b) (i.e., the investment adviser or any control person). |
Table of Contents
(h) The registrant’s principal accountant notified the registrant’s Audit Committee of all non-audit services that were rendered by the principal accountant to the registrant’s adviser and any entity controlling, controlled by, or under common control with the adviser that provides services to the registrant, which services were not required to be pre-approved pursuant to paragraph (c)(7)(ii) of Rule 2-01 of Regulation S-X, allowing the registrant’s Audit Committee to consider whether such services were compatible with maintaining the principal accountant’s independence.
| Item 5. | Disclosure of Audit Committees for Listed Companies. |
The registrant has an audit committee which was established by the Board of Trustees of the registrant in accordance with Section 3(a)(58)(A) of the Securities Exchange Act of 1934, as amended (the “1934 Act”). The members of the registrant’s audit committee are Cheryl Burgermeister, George Gaspari, Ashley T. Rabun, Ernest Scalberg, and R. Charles Tschampion.
| Item 6. | Schedule of Investments. |
| (a) | The schedule of investments is included as part of the report to shareholders filed under Item 1 of this Form N-CSR. |
| (b) | Not applicable to the registrant. |
Item 7. Disclosure of Proxy Voting Policies and Procedures for Closed-End Management Investment Companies.
Not applicable to the registrant.
| Item 8. | Portfolio Managers of Closed-End Management Investment Companies. |
Not applicable to the registrant.
Item 9. Purchases of Equity Securities by Closed-End Management Investment Company and Affiliated Purchasers.
Not applicable to the registrant.
| Item 10. | Submission of Matters to a Vote of Security Holders. |
The registrant has not adopted any material changes to the procedures by which shareholders may recommend nominees to the registrant’s Board.
| Item 11. | Controls and Procedures. |
(a) Within 90 days of the filing date of this Form N-CSR, Ellen M. Needham, the registrant’s President and Principal Executive Officer, and Chad C. Hallett, the registrant’s Treasurer and Principal Financial Officer, reviewed the registrant’s disclosure controls and procedures (as defined in Rule 30a-3(c) under the 1940 Act) and evaluated their effectiveness. Based on their review, Ms. Needham and Mr. Hallett determined that the disclosure controls and procedures adequately ensure that information required to be disclosed by the registrant in its periodic reports is recorded, processed, summarized and reported within the time periods required by the U.S. Securities and Exchange Commission.
Table of Contents
(b) There were no changes in the registrant’s internal control over financial reporting (as defined in Rule 30a-3(d) under the 1940 Act) that occurred during the second fiscal quarter of the period covered by this report that have materially affected, or are reasonably likely to materially affect, the registrant’s internal control over financial reporting.
Item 12. Disclosure of Securities Lending Activities for Closed-End Management Investment Companies.
(a) Not applicable.
(b) Not applicable.
| Item 13. | Exhibits. |
(a)(1) Code of Ethics referred to in Item 2.
| ||
(a)(2) Separate certifications required by Rule 30a-2 under the 1940 Act for each principal executive officer and principal financial officer of the registrant are attached.
| ||
(a)(3) Not applicable to the registrant.
| ||
| (b) A single certification required by Rule 30a-2(b) under the 1940 Act, Rule 13a-14(b) or Rule 15d-14(b) under the 1934 Act and Section 1350 of Chapter 63 of Title 18 of the United States Code for the principal executive officer and principal financial officer of the registrant is attached. | ||
Table of Contents
SIGNATURES
Pursuant to the requirements of the Securities Exchange Act of 1934, as amended, and the Investment Company Act of 1940, as amended, the registrant has duly caused this report to be signed on its behalf by the undersigned, thereunto duly authorized.
| The Select Sector SPDR® Trust | ||
| By: | /s/ Ellen M. Needham | |
| Ellen M. Needham | ||
| President and Principal Executive Officer | ||
| Date: | December 5, 2017 | |
Pursuant to the requirements of the Securities Exchange Act of 1934, as amended, and the Investment Company Act of 1940, as amended, this report has been signed below by the following persons on behalf of the registrant and in the capacities and on the dates indicated.
| By: | /s/ Ellen M. Needham | |
| Ellen M. Needham | ||
| President and Principal Executive Officer | ||
| Date: | December 5, 2017 | |
| By: | /s/ Chad C. Hallett | |
| Chad C. Hallett | ||
| Treasurer and Principal Financial Officer | ||
| Date: | December 5, 2017 | |