UNITED STATES
SECURITIES AND EXCHANGE COMMISSION
Washington, D.C. 20549
FORMN-CSR
CERTIFIED SHAREHOLDER REPORT OF REGISTERED
MANAGEMENT INVESTMENT COMPANIES
Investment Company Act file number:811-08837
THE SELECT SECTOR SPDR® TRUST
(Exact name of registrant as specified in charter)
One Iron Street, Boston, Massachusetts 02210
(Address of principal executive offices) (zip code)
Sean O’Malley, Esq.
Senior Vice President and Deputy General Counsel
c/o SSGA Funds Management, Inc.
One Iron Street
Boston, Massachusetts 02210
(Name and address of agent for service)
Copy to:
W. John McGuire, Esq.
Morgan, Lewis, & Bockius, LLP
1111 Pennsylvania Avenue, NW
Washington, D.C. 20004
Registrant’s telephone number, including area code: (617)664-1465
Date of fiscal year end: September 30
Date of reporting period: September 30, 2019
Item 1. Report to Shareholders.
The Select Sector SPDR Trust
Beginning on January 1, 2021, as permitted by regulations adopted by the U.S. Securities and Exchange Commission, paper
copies of a Fund’s annual and semi- annual shareholder reports will no longer be sent by mail, unless you specifically request paper copies of the reports from the Fund (or from your financial intermediary, such as a broker-dealer or bank). Instead, the reports will be made available on a Fund’s website (www.sectorspdrs.com ), and you will be notified by mail each time a report is posted, and provided with a website link to access the report. If you already elected to receive reports electronically, you will not be affected by this change and you need not take any action. You may elect to receive shareholder reports and other communications by contacting your financial intermediary.
You may elect to receive all future reports in paper free of charge. If you invest through a financial intermediary, you can contact your financial intermediary to request that you continue to receive paper copies of your shareholder reports. Your election to receive reports in paper will apply to all funds held in your account.
Annual Report
September 30, 2019
Select Sector SPDR Funds
The Select Sector SPDR Trust consists of eleven separate investment portfolios (each a “Select Sector SPDR Fund” or a “Fund” and collectively the “Select Sector SPDR Funds” or the “Funds”).
Select Sector SPDR Funds are “index funds” that unbundle the benchmark S&P 500®† and give you ownership in particular sectors or groups of industries that are represented by a specified Select Sector Index. Through a single share, investors can buy or sell any of eleven major industry sectors that make up the S&P 500®, in the same way as they would buy or sell a share of stock. Select Sector SPDR Fund shares are different from the shares of conventional mutual funds. Select Sector SPDR Funds trade on NYSE Arca, Inc.
Eleven Select Sector SPDR Funds
Shares are available for exchange trading in the following Funds of The Select Sector SPDR Trust:
| The Communication Services Select Sector SPDR Fund | XLC |
| The Consumer Discretionary Select Sector SPDR Fund | XLY |
| The Consumer Staples Select Sector SPDR Fund | XLP |
| The Energy Select Sector SPDR Fund | XLE |
| The Financial Select Sector SPDR Fund | XLF |
| The Health Care Select Sector SPDR Fund | XLV |
| The Industrial Select Sector SPDR Fund | XLI |
| The Materials Select Sector SPDR Fund | XLB |
| The Real Estate Select Sector SPDR Fund | XLRE |
| The Technology Select Sector SPDR Fund | XLK |
| The Utilities Select Sector SPDR Fund | XLU |
Each of these Funds is designed to, before expenses, correspond generally to the price and yield performance of a Select Sector Index. Each Fund’s portfolio is comprised principally of shares of constituent companies in the S&P 500®. Each stock in the S&P 500® is allocated to one Select Sector Index. The combined companies of the eleven Select Sector Indexes represent all of the companies in the S&P 500®. Each Select Sector SPDR Fund can be expected to move up or down in value with its underlying Select Sector Index. Investors cannot invest directly in an index. Funds focused on a single sector generally experience greater price fluctuations than the overall stock market.
Objective
Select Sector SPDR Funds are designed to provide investors with an affordable way to invest in a portfolio of equity securities in a sector or group of industries in a single trade. Select Sector SPDR Funds allow you to tailor asset allocations to fit your particular investment needs or goals. One Fund may complement another; individual Select Sector SPDR Funds can be used to increase exposure to certain industries that may be outperforming the market or to hedge other holdings in your portfolio. Although an individual Select Sector SPDR Fund may bear a higher level of risk than a broad-market fund, because of less diversification, sector investments may also offer opportunities for returns greater than an investment in the entire constituents of the S&P 500®.
The information contained in this report is intended for the general information of shareholders of the Trust. This report is not authorized for distribution to prospective investors unless preceded or accompanied by a current Trust prospectus which contains important information concerning the Trust. You may obtain a current prospectus from the Distributor, ALPS Portfolio Solutions Distributor, Inc., by calling 1-866-SECTOR-ETF (1-866-732-8673). Please read the prospectus carefully before you invest.
† S&P 500: the Standard & Poor’s composite index of 500 stocks, a widely recognized, unmanaged, index of common stock prices.
[This Page Intentionally Left Blank]
Notes to Performance Summaries (Unaudited)
The performance chart of a Fund’s total return at net asset value (“NAV”), the total return based on market price and its benchmark index is provided for comparative purposes only and represents the periods noted. A Fund’s per share NAV is the value of one share of a Fund and is calculated by dividing the value of total assets less total liabilities by the number of shares outstanding. The NAV return is based on the NAV of a Fund and the market return is based on the market price per share of a Fund. The market price used to calculate the market return is determined by using the midpoint between the highest bid and the lowest offer on the exchange on which the shares of a Fund are listed for trading, as of the time that a Fund’s NAV is calculated. NAV and market returns assume that dividends and capital gain distributions have been reinvested in a Fund at NAV. Market returns do not include brokerage commissions that may be payable on secondary market transactions. If brokerage commissions were included market returns would be lower.
An index is a statistical measure of a specified financial market or sector. An index does not actually hold a portfolio of securities and therefore does not reflect deductions for fees or expenses. In comparison, a Fund’s performance is negatively impacted by these deductions. Index returns reflect all items of income, gain and loss and the reinvestment of dividends and other income.
The Communication Services Select Sector Index is intended to give investors an efficient, modified market capitalization-based way to track the movements of certain public companies that are components of the S&P 500 and are involved in the development and production of communication services products.
The Consumer Discretionary Select Sector Index is intended to give investors an efficient, modified market capitalization-based way to track the movements of certain public companies that are components of the S&P 500 and are involved in the development and production of consumer discretionary products.
The Consumer Staples Select Sector Index is intended to give investors an efficient, modified market capitalization-based way to track the movements of certain public companies that are components of the S&P 500 and are involved in the development and production of consumer products.
The Energy Select Sector Index is intended to give investors an efficient, modified market capitalization-based way to track the movements of certain public companies that are components of the S&P 500 and are involved in the development and production of energy products.
The Financial Select Sector Index is intended to give investors an efficient, modified market capitalization-based way to track the movements of certain public companies that are components of the S&P 500 and are involved in the development and production of financial products.
The Health Care Select Sector Index is intended to give investors an efficient, modified market capitalization-based way to track the movements of certain public companies that are components of the S&P 500 and are health care related firms.
The Industrial Select Sector Index is intended to give investors an efficient, modified market capitalization-based way to track the movements of certain public companies that are components of the S&P 500 and are industrials.
The Materials Select Sector Index is intended to give investors an efficient, modified market capitalization-based way to track the movements of certain public companies that are components of the S&P 500 and are in basic industries.
The Real Estate Select Sector Index is intended to give investors an efficient, modified market capitalization-based way to track the movements of certain public companies that are components of the S&P 500 and are involved in the investment in and/or management and development of real estate.
The Technology Select Sector Index is intended to give investors an efficient, modified market capitalization-based way to track the movements of certain public companies that are components of the S&P 500 and are involved in the development and production of technology products.
The Utilities Select Sector Index is intended to give investors an efficient, modified market capitalization-based way to track the movements of certain public companies that are components of the S&P 500 and are in the utilities industry.
The S&P 500 Index includes five hundred (500) selected companies, all of which are listed on national stock exchanges and spans over 25 separate industry groups.
See accompanying notes to financial statements.
1
THE COMMUNICATION SERVICES SELECT SECTOR SPDR FUND
Management's Discussion of Fund Performance (Unaudited)
The Communication Services Select Sector SPDR Fund (the “Fund”) seeks to provide investment results that, before expenses, correspond generally to the price and yield performance of publicly traded equity securities of companies in the Communication Services Select Sector Index. The Fund’s benchmark is the Communication Services Select Sector Index (the “Index”).
For the 12-month period ended September 30, 2019 (the “Reporting Period”), the total return for the Fund was 2.07%, and the Index was 2.17%. The Fund and Index returns reflect the reinvestment of dividends and other income. The Fund’s performance reflects the expenses of managing the Fund, including brokerage and advisory expenses. The Index is unmanaged and Index returns do not reflect fees and expenses of any kind, which would have a negative impact on returns. Cash, security misweights, transaction costs and compounding (the exponential growth of outperformance or underperformance) also contributed to the difference between the Fund’s performance and that of the Index.
Despite a difficult start to the period, the Fund was able to make a strong turnaround in 2019 and end the period in positive territory. Wireless technology demand continued to rise as communication and media devices increasingly move to the wireless arena, providing the potential for revenues to rise. Despite faster growth, pursuing new technologies and providing attractive content costs money. An additional challenge for some companies is the increased attention from lawmakers, who have expressed concerns about their size and how well they’re protecting consumers’ privacy. Both Facebook and Twitter are perfect examples of this. As these companies have continued to grow and profit, they are continuously fighting against privacy law violations. In Europe, antitrust issues have resulted in pushback against the big U.S. companies in the form of fines, taxes and regulation. The rise in local regulation adds complexity and cost to providing users with fast and universal access to data that is increasingly segregated behind layers of different regulations. As a result, although the Fund finished the period in positive territory, it was somewhat stifled by pressure on some of the largest and fastest growing companies.
On an individual security level, the top positive contributors to the Fund’s performance during the Reporting Period were Facebook, Inc. Class A, Twitter, Inc., and Comcast Corporation Class A. The top negative contributors to the Fund’s performance during the Reporting Period were Electronic Arts Inc., CenturyLink, Inc., and Activision Blizzard, Inc..
The views expressed above reflect those of the Fund’s portfolio manager only through the Reporting Period, and do not necessarily represent the views of the Adviser as a whole. Any such views are subject to change at any time based upon market or other conditions and the Adviser disclaims any responsibility to update such views. These views may not be relied on as investment advice and, because investment decisions for a fund are based on numerous factors, may not be relied on as an indication of trading intent on behalf of any fund.
See accompanying notes to financial statements.
2
The Communication Services Select Sector SPDR Fund
Performance Summary (Unaudited)
Performance as of September 30, 2019
| | | | | | | | | | | | | |
| | | | | Cumulative Total Return | | Average Annual Total Return | | |
| | | | | Net
Asset
Value | Market
Value | Communication Services Select Sector Index | S&P 500 Index | | Net
Asset
Value | Market
Value | Communication Services Select Sector Index | S&P 500 Index | |
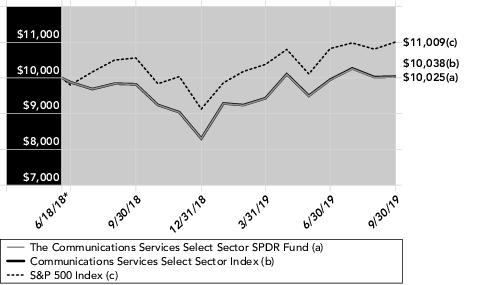
| | | ONE YEAR | | 2.07% | 2.03% | 2.17% | 4.25% | | 2.07% | 2.03% | 2.17% | 4.25% | |
| | | SINCE INCEPTION(1) | | 0.25% | 0.24% | 0.38% | 10.09% | | 0.20% | 0.18% | 0.30% | 7.78% | |
| | | | | | | | | | | | | |
| (1) | For the period June 18, 2018 to September 30, 2019. |
Comparison of Change in Value of a $10,000 Investment
(Based on Net Asset Value)
Line graph is based on cumulative total return.
* Inception date.
The total expense ratio for The Communication Services Select Sector SPDR Fund as stated in the Fees and Expenses table of the most recent prospectus is 0.13%.
Performance quoted represents past performance, which is no guarantee of future results. Investment return and principal value will fluctuate, so you may have a gain or loss when shares are sold. Current performance may be higher or lower than that quoted. Visit www.spdrs.com for most recent month-end performance. The returns do not reflect the deduction of taxes that a shareholder would pay on Fund distributions or on the redemption or sale of Fund shares. See "Notes to Performance Summaries" on page 1 for more information.
See accompanying notes to financial statements.
3
The Communication Services Select Sector SPDR Fund
Portfolio Statistics (Unaudited)
Top Five Holdings as of September 30, 2019
| | | | |
| | Description | Market Value | % of Net Assets | |
| | Facebook, Inc. Class A | 1,088,050,458 | 18.0% | |
| | Alphabet, Inc. Class C | 708,409,660 | 11.7 | |
| | Alphabet, Inc. Class A | 703,495,090 | 11.7 | |
| | Verizon Communications, Inc. | 282,603,166 | 4.7 | |
| | AT&T, Inc. | 280,211,860 | 4.6 | |
| | TOTAL | 3,062,770,234 | 50.7% | |
(The five largest holdings are subject to change, and there are no guarantees the Fund will continue to remain invested in any particular company.)
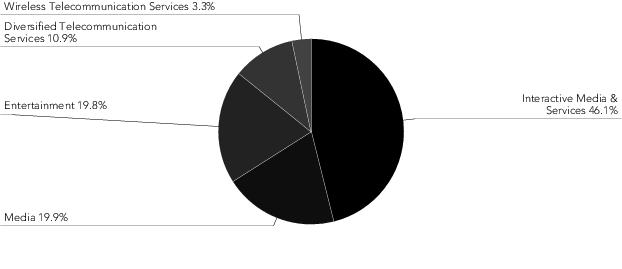
Industry Breakdown as of September 30, 2019*
* The Fund’s industry breakdown is expressed as a percentage of total common stock and may change over time.
See accompanying notes to financial statements.
4
THE CONSUMER DISCRETIONARY SELECT SECTOR SPDR FUND
Management's Discussion of Fund Performance (Unaudited)
The Consumer Discretionary Select Sector SPDR Fund (the “Fund”) seeks to provide investment results that, before expenses, correspond generally to the price and yield performance of publicly traded equity securities of companies in the Consumer Discretionary Select Sector Index. The Fund’s benchmark is the Consumer Discretionary Select Sector Index (the “Index”).
For the 12-month period ended September 30, 2019 (the “Reporting Period”), the total return for the Fund was 4.45%, and the Index was 4.58%. The Fund and Index returns reflect the reinvestment of dividends and other income. The Fund’s performance reflects the expenses of managing the Fund, including brokerage and advisory expenses. The Index is unmanaged and Index returns do not reflect fees and expenses of any kind, which would have a negative impact on returns. Cash, security misweights, transaction costs and compounding (the exponential growth of outperformance or underperformance) also contributed to the difference between the Fund’s performance and that of the Index.
Despite a difficult start to the period, the fund was able to make a strong turnaround in 2019 and end the period in positive territory. Under the new GICS structure implemented in September 2018, select companies from the Consumer Discretionary were renamed Communication Services. As a result, the Consumer Discretionary index no longer included media and entertainment companies, but continued to offer exposure to retailers, including Amazon and Home Depot. Despite the decline in Amazon performance for the period, this sector remained an attractive option for growth investors with its continued exposure to stocks with relatively high expected earnings and sales growth. Thanks to falling mortgage rates, low unemployment and rising wages, homebuilding saw a lot of growth which benefited home-improvement retailers like Home Depot. Positive performance was also driven by strong returns from Starbucks whose stock has taken off over the past year as comparable sales growth has consistently topped expectations. Many restaurants, including fast food retailers, have also seen an uptick in sales as they partner up with delivery companies like Uber Eats and Door Dash to cater to customers whom enjoy the convenience of staying home and eating in.
On an individual security level, the top positive contributors to the Fund’s performance during the Reporting Period were Starbucks Corporation, McDonald's Corporation, and Home Depot, Inc.. The top negative contributors to the Fund’s performance during the Reporting Period were Tapestry, Inc., Carnival Corporation, and Amazon.com, Inc..
The views expressed above reflect those of the Fund’s portfolio manager only through the Reporting Period, and do not necessarily represent the views of the Adviser as a whole. Any such views are subject to change at any time based upon market or other conditions and the Adviser disclaims any responsibility to update such views. These views may not be relied on as investment advice and, because investment decisions for a fund are based on numerous factors, may not be relied on as an indication of trading intent on behalf of any fund.
See accompanying notes to financial statements.
5
The Consumer Discretionary Select Sector SPDR Fund
Performance Summary (Unaudited)
Performance as of September 30, 2019
| | | | | | | | | | | | | |
| | | | | Cumulative Total Return | | Average Annual Total Return | | |
| | | | | Net
Asset
Value | Market
Value | Consumer Discretionary Select Sector Index | S&P 500 Index | | Net
Asset
Value | Market
Value | Consumer Discretionary Select Sector Index | S&P 500 Index | |
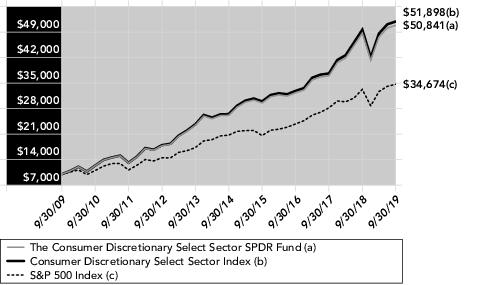
| | | ONE YEAR | | 4.45% | 4.43% | 4.58% | 4.25% | | 4.45% | 4.43% | 4.58% | 4.25% | |
| | | FIVE YEARS | | 94.43% | 94.38% | 95.96% | 67.27% | | 14.22% | 14.22% | 14.40% | 10.84% | |
| | | TEN YEARS | | 408.41% | 408.53% | 418.44% | 246.74% | | 17.66% | 17.66% | 17.89% | 13.24% | |
| | | | | | | | | | | | | |
Comparison of Change in Value of a $10,000 Investment
(Based on Net Asset Value)
Line graph is based on cumulative total return.
The total expense ratio for The Consumer Discretionary Select Sector SPDR Fund as stated in the Fees and Expenses table of the most recent prospectus is 0.13%.
Performance quoted represents past performance, which is no guarantee of future results. Investment return and principal value will fluctuate, so you may have a gain or loss when shares are sold. Current performance may be higher or lower than that quoted. Visit www.spdrs.com for most recent month-end performance. The returns do not reflect the deduction of taxes that a shareholder would pay on Fund distributions or on the redemption or sale of Fund shares. See "Notes to Performance Summaries" on page 1 for more information.
See accompanying notes to financial statements.
6
The Consumer Discretionary Select Sector SPDR Fund
Portfolio Statistics (Unaudited)
Top Five Holdings as of September 30, 2019
| | | | |
| | Description | Market Value | % of Net Assets | |
| | Amazon.com, Inc. | 3,064,065,156 | 22.0% | |
| | Home Depot, Inc. | 1,552,552,085 | 11.1 | |
| | McDonald's Corp. | 996,195,999 | 7.2 | |
| | NIKE, Inc. Class B | 718,180,881 | 5.2 | |
| | Starbucks Corp. | 646,492,645 | 4.6 | |
| | TOTAL | 6,977,486,766 | 50.1% | |
(The five largest holdings are subject to change, and there are no guarantees the Fund will continue to remain invested in any particular company.)
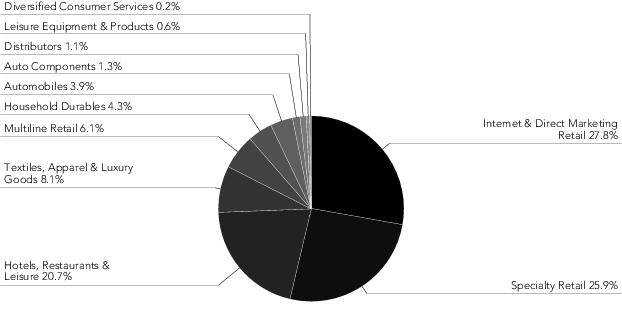
Industry Breakdown as of September 30, 2019*
* The Fund’s industry breakdown is expressed as a percentage of total common stock and may change over time.
See accompanying notes to financial statements.
7
The Consumer Staples Select Sector SPDR Fund
Management's Discussion of Fund Performance (Unaudited)
The Consumer Staples Select Sector SPDR Fund (the “Fund”) seeks to provide investment results that, before expenses, correspond generally to the price and yield performance of publicly traded equity securities of companies in the Consumer Staples Select Sector Index. The Fund’s benchmark is the Consumer Staples Select Sector Index (the “Index”).
For the 12-month period ended September 30, 2019 (the “Reporting Period”), the total return for the Fund was 17.14%, and the Index was 17.31%. The Fund and Index returns reflect the reinvestment of dividends and other income. The Fund’s performance reflects the expenses of managing the Fund, including brokerage and advisory expenses. The Index is unmanaged and Index returns do not reflect fees and expenses of any kind, which would have a negative impact on returns. Fees and expenses along with cash drag contributed to the difference between the Fund’s performance and that of the Index.
Some hawkish comments from the Fed during the last quarter of 2018, coupled with the arrest of a Chinese company’s Chief Financial Officer which stopped the progress being made on the trade talk front with China, were enough to put a quick halt to the ten year bull market run. After its best quarter in five years, the U.S. equity market responded with its worst quarterly performance since 2011. As a result, Consumer Staples stocks benefited from their defensive nature, if you can call it that, sliding just–4.96% (vs. S&P 500 Index return of–13.52%). While tobacco stocks caused a drag, this was somewhat offset by strong performances in the household products and beverages groups. The first quarter of 2019 started out with a downgrade of growth expectations, but this led to a sharp shift in tone from the Central Banks from hawkish to dovish which helped to buoy the markets. Earning reports, although not quite as strong as the previous three month period, were stronger than expected. Remarkably, the S&P 500 Index erased all of those losses in the first quarter of 2019 as it rebounded by +13.64%. Despite this sharp rally led by the more traditionally known cyclical sectors, consumer staples held their own to climb a more than respectable +11.10%. Tobacco stocks rebounded strongly along with a continued rise from household products and the packaged foods industry as accelerated sales growth and cheap valuations were the catalysts.
While the Fed began to put a halt to the markets expectations of a rate cut, a renewed escalation in trade talks and tariff wars between the US and China in May of 2019 caused the Fed to change its tune once again giving the markets hope for future accommodations. The Fund continued its momentum with this backdrop performing in line with the overall market with a gain of +4.40% for the three months ended June 30, 2019. Things only got better for the Fund in the last quarter of the fiscal year as a sharp decline in interest rates led to a flight to defensive stocks. This flight to safety resulted in the sector gaining +6.36% to end on a high note.
On an individual security level, the top positive contributors to the Fund’s performance during the Reporting Period were Procter & Gamble Company, PepsiCo, Inc., and Walmart Inc. The top negative contributors to the Fund’s performance during the Reporting Period were Walgreens Boots Alliance Inc., Kraft Heinz Company, and Altria Group Inc.
The views expressed above reflect those of the Fund’s portfolio manager only through the Reporting Period, and do not necessarily represent the views of the Adviser as a whole. Any such views are subject to change at any time based upon market or other conditions and the Adviser disclaims any responsibility to update such views. These views may not be relied on as investment advice and, because investment decisions for a fund are based on numerous factors, may not be relied on as an indication of trading intent on behalf of any fund.
See accompanying notes to financial statements.
8
The Consumer Staples Select Sector SPDR Fund
Performance Summary (Unaudited)
Performance as of September 30, 2019
| | | | | | | | | | | | | |
| | | | | Cumulative Total Return | | Average Annual Total Return | | |
| | | | | Net
Asset
Value | Market
Value | Consumer Staples Select Sector Index | S&P 500 Index | | Net
Asset
Value | Market
Value | Consumer Staples Select Sector Index | S&P 500 Index | |
| | | ONE YEAR | | 17.14% | 17.13% | 17.31% | 4.25% | | 17.14% | 17.13% | 17.31% | 4.25% | |
| | | FIVE YEARS | | 55.59% | 55.55% | 56.69% | 67.27% | | 9.24% | 9.24% | 9.40% | 10.84% | |
| | | TEN YEARS | | 216.36% | 216.56% | 222.29% | 246.74% | | 12.21% | 12.21% | 12.42% | 13.24% | |
| | | | | | | | | | | | | |
Comparison of Change in Value of a $10,000 Investment
(Based on Net Asset Value)
Line graph is based on cumulative total return.
The total expense ratio for The Consumer Staples Select Sector SPDR Fund as stated in the Fees and Expenses table of the most recent prospectus is 0.13%.
Performance quoted represents past performance, which is no guarantee of future results. Investment return and principal value will fluctuate, so you may have a gain or loss when shares are sold. Current performance may be higher or lower than that quoted. Visit www.spdrs.com for most recent month-end performance. The returns do not reflect the deduction of taxes that a shareholder would pay on Fund distributions or on the redemption or sale of Fund shares. See "Notes to Performance Summaries" on page 1 for more information.
See accompanying notes to financial statements.
9
The Consumer Staples Select Sector SPDR Fund
Portfolio Statistics (Unaudited)
Top Five Holdings as of September 30, 2019
| | | | |
| | Description | Market Value | % of Net Assets | |
| | Procter & Gamble Co. | 2,315,789,801 | 16.5% | |
| | Coca-Cola Co. | 1,558,533,743 | 11.1 | |
| | PepsiCo, Inc. | 1,426,344,117 | 10.2 | |
| | Walmart, Inc. | 1,255,884,103 | 9.0 | |
| | Mondelez International, Inc. Class A | 653,481,828 | 4.7 | |
| | TOTAL | 7,210,033,592 | 51.5% | |
(The five largest holdings are subject to change, and there are no guarantees the Fund will continue to remain invested in any particular company.)
Industry Breakdown as of September 30, 2019*
* The Fund’s industry breakdown is expressed as a percentage of total common stock and may change over time.
See accompanying notes to financial statements.
10
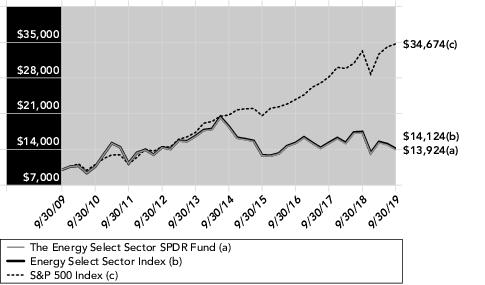
The Energy Select Sector SPDR Fund
Management's Discussion of Fund Performance (Unaudited)
The Energy Select Sector SPDR Fund (the “Fund”) seeks to provide investment results that, before expenses, correspond generally to the price and yield performance of publicly traded equity securities of companies in the Energy Select Sector Index. The Fund’s benchmark is the Energy Select Sector Index (the “Index”).
For the 12-month period ended September 30, 2019 (the “Reporting Period”), the total return for the Fund was–19.08%, and the Index was–19.01%. The Fund and Index returns reflect the reinvestment of dividends and other income. The Fund’s performance reflects the expenses of managing the Fund, including brokerage and advisory expenses. The Index is unmanaged and Index returns do not reflect fees and expenses of any kind, which would have a negative impact on returns. Fees, the cumulative effect of security misweights, and Index changes/corporate actions, contributed to the difference between the Fund’s performance and that of the Index.
It was a rough and volatile fiscal year for energy stocks starting with a substantial decline of–23.62% in the first three months of the period, as the sector fell into bear market territory. This freefall was driven by signs of an abundant supply of oil coupled with forecasts of weakening demand. Economic growth concerns and sharply declining oil prices, which dropped nearly 40% from the beginning of period highs, were sparked in part by the temporary waivers granted to eight countries importing oil from Iran. This contributed to an increased supply to the market. However, the sector rebounded strongly at the start of 2019, recouping a good portion of what had been lost, as the fund realized a 16.21% rise for the first three months of the calendar year. As January kicked in with a downgrade of global growth expectations from the International Monetary Fund, it did not look like things would get much better. But what it did lead to was a sudden reversal by the central banks whose hawkish tones shifted quickly to more dovish ones. In fact, the prospect of further rate hikes in 2019 was all but taken off the table by quarter’s end. In addition, earnings reports, although not quite as strong as the previous three month period, were stronger than expected. Oil prices also saw a significant bounce back as the calendar turned to 2019.
Continued tensions in trade talks and increasing tariffs being applied by the US and China rattled markets in May of 2019 and the Fed Chair, Jerome Powell, had put a halt to the market expectations for potential rate cuts heading into the month. Once again, oil prices fell into bear market territory as a result and the Fund declined–11.09% for the month alone. But as markets declined sharply during May, the sentiments from the Fed changed once again to give the markets renewed hope of some accommodations in the near future. The Fund quickly recovered in June with strong performance of over 9.24% as oil prices swung back sharply, finishing just below the highs at the start of the quarter. The Fund finished the fiscal year just as it began, on a down note, as escalating tariff wars were accompanied by a drone strike on Saudi Arabia oil facilities caused the largest single day rise in oil prices since 2008. These prices quickly retreated below levels prior to the attack as Saudi Aramco reassured that the facilities would be fully restored in short order.
On an individual security level, the top positive contributors to the Fund’s performance during the Reporting Period were Kinder Morgan Inc Class P, Chevron Corporation, and ONEOK, Inc.. The top negative contributors to the Fund’s performance during the Reporting Period were Occidental Petroleum Corporation, EOG Resources, Inc., and Exxon Mobil Corporation.
The views expressed above reflect those of the Fund’s portfolio manager only through the Reporting Period, and do not necessarily represent the views of the Adviser as a whole. Any such views are subject to change at any time based upon market or other conditions and the Adviser disclaims any responsibility to update such views. These views may not be relied on as investment advice and, because investment decisions for a fund are based on numerous factors, may not be relied on as an indication of trading intent on behalf of any fund.
See accompanying notes to financial statements.
11
The Energy Select Sector SPDR Fund
Performance Summary (Unaudited)
Performance as of September 30, 2019
| | | | | | | | | | | | | |
| | | | | Cumulative Total Return | | Average Annual Total Return | | |
| | | | | Net
Asset
Value | Market
Value | Energy Select Sector Index | S&P 500 Index | | Net
Asset
Value | Market
Value | Energy Select Sector Index | S&P 500 Index | |
| | | ONE YEAR | | –19.08% | –19.09% | –19.01% | 4.25% | | –19.08% | –19.09% | –19.01% | 4.25% | |
| | | FIVE YEARS | | –24.16% | –24.18% | –23.79% | 67.27% | | –5.38% | –5.39% | –5.29% | 10.84% | |
| | | TEN YEARS | | 39.24% | 39.40% | 41.27% | 246.74% | | 3.37% | 3.38% | 3.52% | 13.24% | |
| | | | | | | | | | | | | |
Comparison of Change in Value of a $10,000 Investment
(Based on Net Asset Value)
Line graph is based on cumulative total return.
The total expense ratio for The Energy Select Sector SPDR Fund as stated in the Fees and Expenses table of the most recent prospectus is 0.13%.
Performance quoted represents past performance, which is no guarantee of future results. Investment return and principal value will fluctuate, so you may have a gain or loss when shares are sold. Current performance may be higher or lower than that quoted. Visit www.spdrs.com for most recent month-end performance. The returns do not reflect the deduction of taxes that a shareholder would pay on Fund distributions or on the redemption or sale of Fund shares. See "Notes to Performance Summaries" on page 1 for more information.
See accompanying notes to financial statements.
12
The Energy Select Sector SPDR Fund
Portfolio Statistics (Unaudited)
Top Five Holdings as of September 30, 2019
| | | | |
| | Description | Market Value | % of Net Assets | |
| | Exxon Mobil Corp. | 2,279,412,814 | 22.8% | |
| | Chevron Corp. | 2,117,867,834 | 21.1 | |
| | ConocoPhillips | 455,915,157 | 4.6 | |
| | Phillips 66 | 447,718,605 | 4.5 | |
| | Schlumberger, Ltd. | 419,958,492 | 4.2 | |
| | TOTAL | 5,720,872,902 | 57.2% | |
(The five largest holdings are subject to change, and there are no guarantees the Fund will continue to remain invested in any particular company.)
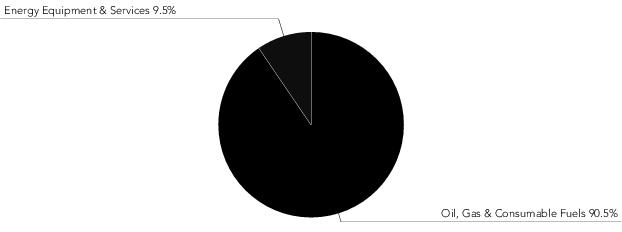
Industry Breakdown as of September 30, 2019*
* The Fund’s industry breakdown is expressed as a percentage of total common stock and may change over time.
See accompanying notes to financial statements.
13
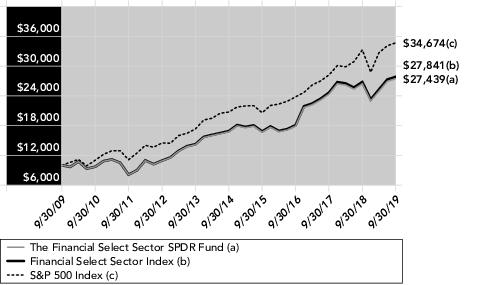
The Financial Select Sector SPDR Fund
Management's Discussion of Fund Performance (Unaudited)
The Financial Select Sector SPDR Fund (the “Fund”) seeks to provide investment results that, before expenses, correspond generally to the price and yield performance of publicly traded equity securities of companies in the Financial Select Sector Index. The Fund’s benchmark is the Financial Select Sector Index (the “Index”).
For the 12-month period ended September 30, 2019 (the “Reporting Period”), the total return for the Fund was 3.81%, and the Index was 3.92%. The Fund and Index returns reflect the reinvestment of dividends and other income. The Fund’s performance reflects the expenses of managing the Fund, including brokerage and advisory expenses. The Index is unmanaged and Index returns do not reflect fees and expenses of any kind, which would have a negative impact on returns. Expenses and cash contributed to the difference between the Fund’s performance and that of the Index.
The Financial Select Sector SPDR Fund had an inauspicious start to the Reporting Period, down over 13% mainly as a result of a flattening yield curve, but also due in part from a Democrat controlled House. Financial stocks showed some momentum at the beginning of 2019, but valuations still remained low and the sector was held back by the Fed’s gloomy views on the economic outlook. Heading into the 3rd quarter of the Reporting Period, the financial sector benefited from an environment where interest rates crept steadily higher and the yield curve also reversed course from its prior flattening trend. And while financials struggled at times as interest rates fell amidst expectations for additional central bank easing, a robust report on the health of the US banking sector from the Federal Reserve’s latest Comprehensive Capital Analysis and Review (CCAR) helped financials finish the quarter on a strong note. The financial sector held up fairly well during the final quarter of the Reporting Period given the sharp drop in interest rates and yield curve inversions that occurred during the period.
On an individual security level, the top positive contributors to the Fund’s performance during the Reporting Period were JPMorgan Chase & Co., CME Group Inc. Class A, and Chubb Limited. The top negative contributors to the Fund’s performance during the Reporting Period were Charles Schwab Corporation, State Street Corporation, and Berkshire Hathaway Inc. Class B.
The views expressed above reflect those of the Fund’s portfolio manager only through the Reporting Period, and do not necessarily represent the views of the Adviser as a whole. Any such views are subject to change at any time based upon market or other conditions and the Adviser disclaims any responsibility to update such views. These views may not be relied on as investment advice and, because investment decisions for a fund are based on numerous factors, may not be relied on as an indication of trading intent on behalf of any fund.
See accompanying notes to financial statements.
14
The Financial Select Sector SPDR Fund
Performance Summary (Unaudited)
Performance as of September 30, 2019
| | | | | | | | | | | | | |
| | | | | Cumulative Total Return | | Average Annual Total Return | | |
| | | | | Net
Asset
Value | Market
Value | Financial Select Sector Index | S&P 500 Index | | Net
Asset
Value | Market
Value | Financial Select Sector Index | S&P 500 Index | |
| | | ONE YEAR | | 3.81% | 3.81% | 3.92% | 4.25% | | 3.81% | 3.81% | 3.92% | 4.25% | |
| | | FIVE YEARS | | 63.95% | 63.98% | 64.82% | 67.27% | | 10.39% | 10.40% | 10.51% | 10.84% | |
| | | TEN YEARS | | 174.39% | 174.96% | 178.29% | 246.74% | | 10.62% | 10.64% | 10.78% | 13.24% | |
| | | | | | | | | | | | | |
Comparison of Change in Value of a $10,000 Investment
(Based on Net Asset Value)
Line graph is based on cumulative total return.
The total expense ratio for The Financial Select Sector SPDR Fund as stated in the Fees and Expenses table of the most recent prospectus is 0.13%.
Performance quoted represents past performance, which is no guarantee of future results. Investment return and principal value will fluctuate, so you may have a gain or loss when shares are sold. Current performance may be higher or lower than that quoted. Visit www.spdrs.com for most recent month-end performance. The returns do not reflect the deduction of taxes that a shareholder would pay on Fund distributions or on the redemption or sale of Fund shares. See "Notes to Performance Summaries" on page 1 for more information.
See accompanying notes to financial statements.
15
The Financial Select Sector SPDR Fund
Portfolio Statistics (Unaudited)
Top Five Holdings as of September 30, 2019
| | | | |
| | Description | Market Value | % of Net Assets | |
| | Berkshire Hathaway, Inc. Class B | 2,871,614,794 | 12.7% | |
| | JPMorgan Chase & Co. | 2,649,255,331 | 11.7 | |
| | Bank of America Corp. | 1,720,377,934 | 7.6 | |
| | Wells Fargo & Co. | 1,423,790,107 | 6.3 | |
| | Citigroup, Inc. | 1,098,643,415 | 4.9 | |
| | TOTAL | 9,763,681,581 | 43.2% | |
(The five largest holdings are subject to change, and there are no guarantees the Fund will continue to remain invested in any particular company.)
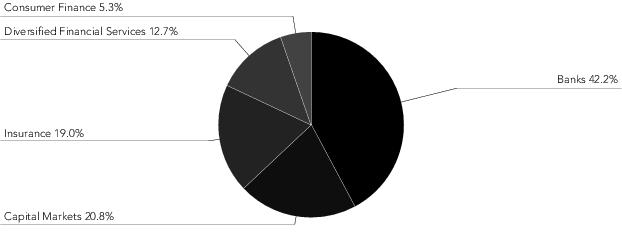
Industry Breakdown as of September 30, 2019*
* The Fund’s industry breakdown is expressed as a percentage of total common stock and may change over time.
See accompanying notes to financial statements.
16
The Health Care Select Sector SPDR Fund
Management's Discussion of Fund Performance (Unaudited)
The Health Care Select Sector SPDR Fund (the “Fund”) seeks to provide investment results that, before expenses, correspond generally to the price and yield performance of publicly traded equity securities of companies in the Health Care Select Sector Index. The Fund’s benchmark is the Health Care Select Sector Index (the “Index”).
For the 12-month period ended September 30, 2019 (the “Reporting Period”), the total return for the Fund was–3.65%, and the Index was–3.57%. The Fund and Index returns reflect the reinvestment of dividends and other income. The Fund’s performance reflects the expenses of managing the Fund, including brokerage and advisory expenses. The Index is unmanaged and Index returns do not reflect fees and expenses of any kind, which would have a negative impact on returns.
A number of factors have contributed to this Fund’s return over the Reporting Period. One of these has revolved around concerns regarding the government’s heightened scrutiny and increasing legislative initiatives on pharmaceutical pricing. Similarly, continued government actions regarding the amending and potentially eliminating of the Affordable Care Act impacted a number of this Fund’s constituents. In regard to eliminating, there were also a number of legal challenges regarding the Affordable Care Act including a pending constitutionality challenge in the Texas courts. Another factor negatively impacting a number of constituents was expiring pharmaceutical patents. Conversely, the continuing increased health care demands associated with the ongoing aging of the American population made a positive contribution to many of this Fund’s constituents. Finally, a significantly heightened level of merger and acquisition both completed and anticipated contributed to this Fund’s return.
On an individual security level, the top positive contributors to the Fund’s performance during the Reporting Period were Merck & Co., Inc., Danaher Corporation, and Abbott Laboratories. The top negative contributors to the Fund’s performance during the Reporting Period were Biogen Inc., Pfizer Inc., and UnitedHealth Group Incorporated.
The views expressed above reflect those of the Fund’s portfolio manager only through the Reporting Period, and do not necessarily represent the views of the Adviser as a whole. Any such views are subject to change at any time based upon market or other conditions and the Adviser disclaims any responsibility to update such views. These views may not be relied on as investment advice and, because investment decisions for a fund are based on numerous factors, may not be relied on as an indication of trading intent on behalf of any fund.
See accompanying notes to financial statements.
17
The Health Care Select Sector SPDR Fund
Performance Summary (Unaudited)
Performance as of September 30, 2019
| | | | | | | | | | | | | |
| | | | | Cumulative Total Return | | Average Annual Total Return | | |
| | | | | Net
Asset
Value | Market
Value | Health Care Select Sector Index | S&P 500 Index | | Net
Asset
Value | Market
Value | Health Care Select Sector Index | S&P 500 Index | |
| | | ONE YEAR | | –3.65% | –3.64% | –3.57% | 4.25% | | –3.65% | –3.64% | –3.57% | 4.25% | |
| | | FIVE YEARS | | 52.35% | 52.31% | 53.33% | 67.27% | | 8.78% | 8.78% | 8.93% | 10.84% | |
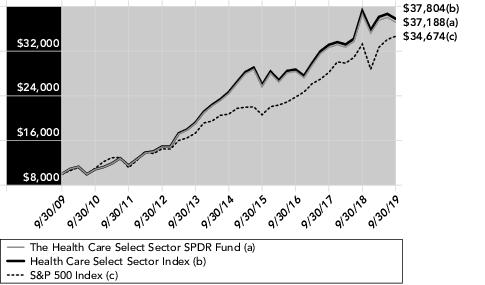
| | | TEN YEARS | | 271.88% | 272.33% | 278.09% | 246.74% | | 14.04% | 14.05% | 14.23% | 13.24% | |
| | | | | | | | | | | | | |
Comparison of Change in Value of a $10,000 Investment
(Based on Net Asset Value)
Line graph is based on cumulative total return.
The total expense ratio for The Health Care Select Sector SPDR Fund as stated in the Fees and Expenses table of the most recent prospectus is 0.13%.
Performance quoted represents past performance, which is no guarantee of future results. Investment return and principal value will fluctuate, so you may have a gain or loss when shares are sold. Current performance may be higher or lower than that quoted. Visit www.spdrs.com for most recent month-end performance. The returns do not reflect the deduction of taxes that a shareholder would pay on Fund distributions or on the redemption or sale of Fund shares. See "Notes to Performance Summaries" on page 1 for more information.
See accompanying notes to financial statements.
18
The Health Care Select Sector SPDR Fund
Portfolio Statistics (Unaudited)
Top Five Holdings as of September 30, 2019
| | | | |
| | Description | Market Value | % of Net Assets | |
| | Johnson & Johnson | 1,699,771,281 | 10.1% | |
| | Merck & Co., Inc. | 1,072,929,238 | 6.4 | |
| | UnitedHealth Group, Inc. | 1,025,236,004 | 6.1 | |
| | Pfizer, Inc. | 989,287,242 | 5.9 | |
| | Abbott Laboratories | 735,781,513 | 4.4 | |
| | TOTAL | 5,523,005,278 | 32.9% | |
(The five largest holdings are subject to change, and there are no guarantees the Fund will continue to remain invested in any particular company.)
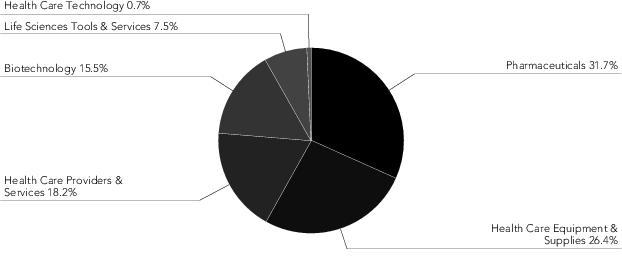
Industry Breakdown as of September 30, 2019*
* The Fund’s industry breakdown is expressed as a percentage of total common stock and may change over time.
See accompanying notes to financial statements.
19
THE INDUSTRIAL SELECT SECTOR SPDR FUND
Management's Discussion of Fund Performance (Unaudited)
The Industrial Select Sector SPDR Fund (the “Fund”) seeks to provide investment results that, before expenses, correspond generally to the price and yield performance of publicly traded equity securities of companies in the Industrial Select Sector Index. The Fund’s benchmark is the Industrial Select Sector Index (the “Index”).
For the 12-month period ended September 30, 2019 (the “Reporting Period”), the total return for the Fund was 1.25%, and the Index was 1.39%. The Fund and Index returns reflect the reinvestment of dividends and other income. The Fund’s performance reflects the expenses of managing the Fund, including brokerage and advisory expenses. The Index is unmanaged and Index returns do not reflect fees and expenses of any kind, which would have a negative impact on returns. Fees and expenses and the cumulative effect of security misweights contributed to the difference between the Fund’s performance and that of the Index.
Fears of a global economic slowdown, uncertainty over the timing of a US-China trade agreement, and continued geopolitical risks were primary drivers of Fund performance during the Reporting Period. Industrial shares suffered in Q4 2018 along with the broad equity markets as rising interest rates and economic growth concerns weighed on the more cyclical sectors. Industrials did bounce back in early Q1 2019, however, as recession fears subsided and strong earnings results were reported by firms involved in capital goods and transportation. But the sector nearly gave up all of its quarterly outperformance in March – much of which was attributed to a sharp decline in Boeing’s share price as the firm faced backlash associated with tragic accidents involving its 737 Max aircraft. Aerospace and Defense companies overall enjoyed a solid overall Reporting Period as they are considered more defensive in nature and not as susceptible to the trade and tariff tensions in the market. Airline stocks were less fortunate as most declined over the Reporting Period due to issues related to the 737 Max groundings and higher oil prices. Conglomerates and stocks in other industries within the Industrials sector such as Machinery and Electrical Equipment have also been suffering due to the ongoing uncertainty with the US-China trade war and what it could mean to future demand for their products and services.
On an individual security level, the top positive contributors to the Fund’s performance during the Reporting Period were Boeing Company, Waste Management, Inc., and Lockheed Martin Corporation. The top negative contributors to the Fund’s performance during the Reporting Period were General Electric Company, 3M Company, and FedEx Corporation.
The views expressed above reflect those of the Fund’s portfolio manager only through the Reporting Period, and do not necessarily represent the views of the Adviser as a whole. Any such views are subject to change at any time based upon market or other conditions and the Adviser disclaims any responsibility to update such views. These views may not be relied on as investment advice and, because investment decisions for a fund are based on numerous factors, may not be relied on as an indication of trading intent on behalf of any fund.
See accompanying notes to financial statements.
20
The Industrial Select Sector SPDR Fund
Performance Summary (Unaudited)
Performance as of September 30, 2019
| | | | | | | | | | | | | |
| | | | | Cumulative Total Return | | Average Annual Total Return | | |
| | | | | Net
Asset
Value | Market
Value | Industrial Select Sector Index | S&P 500 Index | | Net
Asset
Value | Market
Value | Industrial Select Sector Index | S&P 500 Index | |
| | | ONE YEAR | | 1.25% | 1.24% | 1.39% | 4.25% | | 1.25% | 1.24% | 1.39% | 4.25% | |
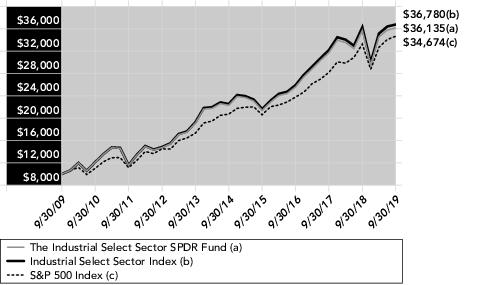
| | | FIVE YEARS | | 61.98% | 61.91% | 63.14% | 67.27% | | 10.13% | 10.12% | 10.29% | 10.84% | |
| | | TEN YEARS | | 261.35% | 261.87% | 267.77% | 246.74% | | 13.71% | 13.72% | 13.91% | 13.24% | |
| | | | | | | | | | | | | |
Comparison of Change in Value of a $10,000 Investment
(Based on Net Asset Value)
Line graph is based on cumulative total return.
The total expense ratio for The Industrial Select Sector SPDR Fund as stated in the Fees and Expenses table of the most recent prospectus is 0.13%.
Performance quoted represents past performance, which is no guarantee of future results. Investment return and principal value will fluctuate, so you may have a gain or loss when shares are sold. Current performance may be higher or lower than that quoted. Visit www.spdrs.com for most recent month-end performance. The returns do not reflect the deduction of taxes that a shareholder would pay on Fund distributions or on the redemption or sale of Fund shares. See "Notes to Performance Summaries" on page 1 for more information.
See accompanying notes to financial statements.
21
The Industrial Select Sector SPDR Fund
Portfolio Statistics (Unaudited)
Top Five Holdings as of September 30, 2019
| | | | |
| | Description | Market Value | % of Net Assets | |
| | Boeing Co. | 862,349,713 | 8.8% | |
| | Honeywell International, Inc. | 516,223,955 | 5.2 | |
| | Union Pacific Corp. | 483,906,179 | 4.9 | |
| | United Technologies Corp. | 469,551,393 | 4.8 | |
| | Lockheed Martin Corp. | 410,983,599 | 4.2 | |
| | TOTAL | 2,743,014,839 | 27.9% | |
(The five largest holdings are subject to change, and there are no guarantees the Fund will continue to remain invested in any particular company.)
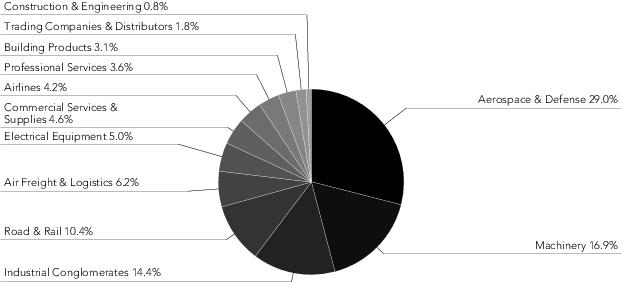
Industry Breakdown as of September 30, 2019*
* The Fund’s industry breakdown is expressed as a percentage of total common stock and may change over time.
See accompanying notes to financial statements.
22
THE MATERIALS SELECT SECTOR SPDR FUND
Management's Discussion of Fund Performance (Unaudited)
The Materials Select Sector SPDR Fund (the “Fund”) seeks to provide investment results that, before expenses, correspond generally to the price and yield performance of publicly traded equity securities of companies in the Materials Select Sector Index. The Fund’s benchmark is the Materials Select Sector Index (the “Index”).
For the 12-month period ended September 30, 2019 (the “Reporting Period”), the total return for the Fund was 2.64%, and the Index was 2.79%. The Fund and Index returns reflect the reinvestment of dividends and other income. The Fund’s performance reflects the expenses of managing the Fund, including brokerage and advisory expenses. The Index is unmanaged and Index returns do not reflect fees and expenses of any kind, which would have a negative impact on returns. Fees and expenses and the cumulative effect of security misweights contributed to the difference between the Fund’s performance and that of the Index
Fears of a global economic slowdown, uncertainty over the timing of a US-China trade agreement, and continued geopolitical risks were primary drivers of Fund performance during the Reporting Period. Materials shares suffered in Q4 2018 along with the broad equity markets as rising interest rates and economic growth concerns weighed on the more cyclical sectors. Materials did bounce back in early Q1 2019, as recession fears subsided. Q2 2019, saw some M& A activity in the Materials sector which helped to drive performance for the quarter. The two most notable M&A activities surrounded Index constituents Newmont Mining Corp and Amcor. Newmont Mining acquiried Goldcorp and formed Newmont Goldcorp. While Amcor merged with Bemis into a New Amcor Ltd. The final quarter of the Reporting Period generated slightly negative performance despite the optimism of a trade deal between the US and China at the G20 summit in Japan and positive earnings and easing of geopolitical tensions.
On an individual security level, the top positive contributors to the Fund’s performance during the Reporting Period were Linde plc, Air Products and Chemicals, Inc., and Ecolab Inc.. The top negative contributors to the Fund’s performance during the Reporting Period were WestRock Company, Dow, Inc., and Freeport-McMoRan, Inc..
The views expressed above reflect those of the Fund’s portfolio manager only through the Reporting Period, and do not necessarily represent the views of the Adviser as a whole. Any such views are subject to change at any time based upon market or other conditions and the Adviser disclaims any responsibility to update such views. These views may not be relied on as investment advice and, because investment decisions for a fund are based on numerous factors, may not be relied on as an indication of trading intent on behalf of any fund.
See accompanying notes to financial statements.
23
The Materials Select Sector SPDR Fund
Performance Summary (Unaudited)
Performance as of September 30, 2019
| | | | | | | | | | | | | |
| | | | | Cumulative Total Return | | Average Annual Total Return | | |
| | | | | Net
Asset
Value | Market
Value | Materials Select Sector Index | S&P 500 Index | | Net
Asset
Value | Market
Value | Materials Select Sector Index | S&P 500 Index | |
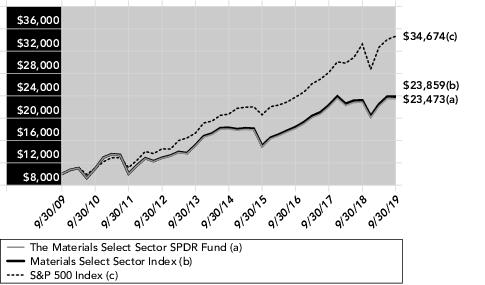
| | | ONE YEAR | | 2.64% | 2.64% | 2.79% | 4.25% | | 2.64% | 2.64% | 2.79% | 4.25% | |
| | | FIVE YEARS | | 29.87% | 29.84% | 30.48% | 67.27% | | 5.37% | 5.36% | 5.47% | 10.84% | |
| | | TEN YEARS | | 134.73% | 135.00% | 138.40% | 246.74% | | 8.91% | 8.92% | 9.08% | 13.24% | |
| | | | | | | | | | | | | |
Comparison of Change in Value of a $10,000 Investment
(Based on Net Asset Value)
Line graph is based on cumulative total return.
The total expense ratio for The Materials Select Sector SPDR Fund as stated in the Fees and Expenses table of the most recent prospectus is 0.13%.
Performance quoted represents past performance, which is no guarantee of future results. Investment return and principal value will fluctuate, so you may have a gain or loss when shares are sold. Current performance may be higher or lower than that quoted. Visit www.spdrs.com for most recent month-end performance. The returns do not reflect the deduction of taxes that a shareholder would pay on Fund distributions or on the redemption or sale of Fund shares. See "Notes to Performance Summaries" on page 1 for more information.
See accompanying notes to financial statements.
24
The Materials Select Sector SPDR Fund
Portfolio Statistics (Unaudited)
Top Five Holdings as of September 30, 2019
| | | | |
| | Description | Market Value | % of Net Assets | |
| | Linde PLC | 652,233,737 | 15.5% | |
| | DuPont de Nemours, Inc. | 331,090,191 | 7.9 | |
| | Ecolab, Inc. | 308,772,680 | 7.4 | |
| | Air Products & Chemicals, Inc. | 304,479,333 | 7.2 | |
| | Sherwin-Williams Co. | 281,209,017 | 6.7 | |
| | TOTAL | 1,877,784,958 | 44.7% | |
(The five largest holdings are subject to change, and there are no guarantees the Fund will continue to remain invested in any particular company.)
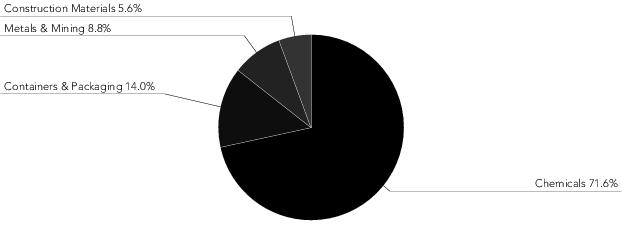
Industry Breakdown as of September 30, 2019*
* The Fund’s industry breakdown is expressed as a percentage of total common stock and may change over time.
See accompanying notes to financial statements.
25
THE REAL ESTATE SELECT SECTOR SPDR FUND
Management's Discussion of Fund Performance (Unaudited)
The Real Estate Select Sector SPDR Fund (the “Fund”) seeks to provide investment results that, before expenses, correspond generally to the price and yield performance of publicly traded equity securities of companies in the Real Estate Select Sector Index. The Fund’s benchmark is the Real Estate Select Sector Index (the “Index”).
For the 12-month period ended September 30, 2019 (the “Reporting Period”), the total return for the Fund was 24.64%, and the Index was 24.74%. The Fund and Index returns reflect the reinvestment of dividends and other income. The Fund’s performance reflects the expenses of managing the Fund, including brokerage and advisory expenses. The Index is unmanaged and Index returns do not reflect fees and expenses of any kind, which would have a negative impact on returns. Fees and expenses contributed to the difference between the Fund’s performance and that of the Index.
The S&P Real Estate Select Sector Index advanced over 24% and was one of the top performing sectors over the Reporting Period. Healthy real estate fundamentals and the low unemployment rate helped drive earnings in general and the more patient pace of future interest rate increases by the US Federal Reserve also helped the sector outperform the broader equity market, as measured by the S&P 500 Index, by over 20% over the Reporting Period. Real estate investment trusts (REITs) are also less exposed to trade policy than the broader market.
Specialized REITs such as American Tower Corporation (AMT), which leases cell towers to mobile carriers, performed well. AMT has a solid history revenue and earnings growth and may be positioned to grow with 5G coming. On the contrary, Hotel and Resort REITs such as Host Hotels and Resorts Inc, have suffered, due to the weakening economy and late cycle concerns.
On an individual security level, the top positive contributors to the Fund’s performance during the Reporting Period were American Tower Corporation, Crown Castle International Corp, and Welltower, Inc.. The top negative contributors to the Fund’s performance during the Reporting Period were Host Hotels & Resorts, Inc., Simon Property Group, Inc., and Weyerhaeuser Company.
The views expressed above reflect those of the Fund’s portfolio manager only through the Reporting Period, and do not necessarily represent the views of the Adviser as a whole. Any such views are subject to change at any time based upon market or other conditions and the Adviser disclaims any responsibility to update such views. These views may not be relied on as investment advice and, because investment decisions for a fund are based on numerous factors, may not be relied on as an indication of trading intent on behalf of any fund.
See accompanying notes to financial statements.
26
The Real Estate Select Sector SPDR Fund
Performance Summary (Unaudited)
Performance as of September 30, 2019
| | | | | | | | | | | | | |
| | | | | Cumulative Total Return | | Average Annual Total Return | | |
| | | | | Net
Asset
Value | Market
Value | Real Estate Select Sector Index | S&P 500 Index | | Net
Asset
Value | Market
Value | Real Estate Select Sector Index | S&P 500 Index | |
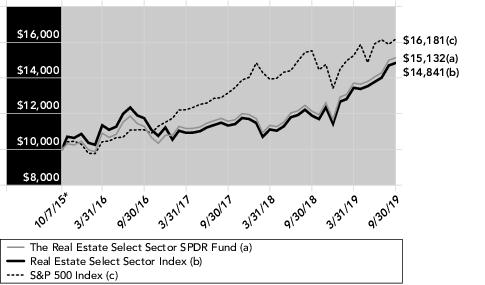
| | | ONE YEAR | | 24.64% | 24.61% | 24.74% | 4.25% | | 24.64% | 24.61% | 24.74% | 4.25% | |
| | | SINCE INCEPTION(1) | | 51.32% | 51.30% | 52.03% | 61.81% | | 10.95% | 10.95% | 11.10% | 12.85% | |
| | | | | | | | | | | | | |
| (1) | For the period October 7, 2015 to September 30, 2019. |
Comparison of Change in Value of a $10,000 Investment
(Based on Net Asset Value)
Line graph is based on cumulative total return.
* Inception date.
The total expense ratio for The Real Estate Select Sector SPDR Fund as stated in the Fees and Expenses table of the most recent prospectus is 0.13%.
Performance quoted represents past performance, which is no guarantee of future results. Investment return and principal value will fluctuate, so you may have a gain or loss when shares are sold. Current performance may be higher or lower than that quoted. Visit www.spdrs.com for most recent month-end performance. The returns do not reflect the deduction of taxes that a shareholder would pay on Fund distributions or on the redemption or sale of Fund shares. See "Notes to Performance Summaries" on page 1 for more information.
See accompanying notes to financial statements.
27
The Real Estate Select Sector SPDR Fund
Portfolio Statistics (Unaudited)
Top Five Holdings as of September 30, 2019
| | | | |
| | Description | Market Value | % of Net Assets | |
| | American Tower Corp. REIT | 476,607,238 | 12.3% | |
| | Crown Castle International Corp. REIT | 281,396,275 | 7.2 | |
| | Prologis, Inc. REIT | 261,873,901 | 6.7 | |
| | Equinix, Inc. REIT | 238,241,472 | 6.1 | |
| | Simon Property Group, Inc. REIT | 233,432,196 | 6.0 | |
| | TOTAL | 1,491,551,082 | 38.3% | |
(The five largest holdings are subject to change, and there are no guarantees the Fund will continue to remain invested in any particular company.)
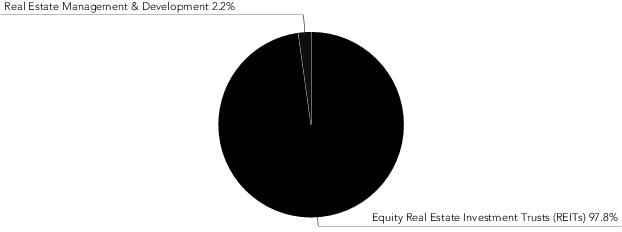
Industry Breakdown as of September 30, 2019*
* The Fund’s industry breakdown is expressed as a percentage of total common stock and may change over time.
See accompanying notes to financial statements.
28
THE TECHNOLOGY SELECT SECTOR SPDR FUND
Management's Discussion of Fund Performance (Unaudited)
The Technology Select Sector SPDR Fund (the “Fund”) seeks to provide investment results that, before expenses, correspond generally to the price and yield performance of publicly traded equity securities of companies in the Technology Select Sector Index. The Fund’s benchmark is the Technology Select Sector Index (the “Index”).
For the 12-month period ended September 30, 2019 (the “Reporting Period”), the total return for the Fund was 8.44%, and the Index was 8.59%. The Fund and Index returns reflect the reinvestment of dividends and other income. The Fund’s performance reflects the expenses of managing the Fund, including brokerage and advisory expenses. The Index is unmanaged and Index returns do not reflect fees and expenses of any kind, which would have a negative impact on returns. Expenses of the Fund, the effects of cash holdings on the Fund performance and the cumulative effect of small weight differences between the securities in the Fund and the Index contributed to the difference between the Fund’s performance and that of the Index.
Global reliance on technology products and services, strong macroeconomic data and corporate earnings were primary drivers of Fund performance during the Reporting Period. The Fund had positive performance for the Reporting Period. The first quarter of the Reporting Period, however, resulted in negative performance. The performance was driven in part by increased hostilities between the US and China over trade, a hawkish stance on monetary policy from the Fed, signs of a slowing global economy and geopolitical issues such as tensions with Saudi Arabia over the disappearance of a journalist in Turkey, Brexit, and the Italian budget deficit. Performance turned positive after the first quarter of the Reporting Period. Global reliance on technology products such as digital payment processing, cloud computing, smartphones and enhancements in artificial intelligence helped spur positive performance for the remainder of the Reporting Period. Performance in the second quarter of the Reporting Period was also aided by progress in the trade talks with China, better-than-expected earnings reports and dovish tones from the Fed. The third and fourth quarters of the Reporting Period had positive performance and were aided by optimism of a trade deal between the US and China at the G20 summit in Japan, positive earnings and easing of geopolitical tensions.
On an individual security level, the top positive contributors to the Fund’s performance during the Reporting Period were Microsoft Corporation, Mastercard Incorporated Class A, and Visa Inc. Class A. The top negative contributors to the Fund’s performance during the Reporting Period were DXC Technology Co., NVIDIA Corporation, and Apple Inc..
The views expressed above reflect those of the Fund’s portfolio manager only through the Reporting Period, and do not necessarily represent the views of the Adviser as a whole. Any such views are subject to change at any time based upon market or other conditions and the Adviser disclaims any responsibility to update such views. These views may not be relied on as investment advice and, because investment decisions for a Fund are based on numerous factors, may not be relied on as an indication of trading intent on behalf of any Fund.
See accompanying notes to financial statements.
29
The Technology Select Sector SPDR Fund
Performance Summary (Unaudited)
Performance as of September 30, 2019
| | | | | | | | | | | | | |
| | | | | Cumulative Total Return | | Average Annual Total Return | | |
| | | | | Net
Asset
Value | Market
Value | Technology Select Sector Index | S&P 500 Index | | Net
Asset
Value | Market
Value | Technology Select Sector Index | S&P 500 Index | |
| | | ONE YEAR | | 8.44% | 8.43% | 8.59% | 4.25% | | 8.44% | 8.43% | 8.59% | 4.25% | |
| | | FIVE YEARS | | 119.02% | 119.02% | 120.89% | 67.27% | | 16.98% | 16.98% | 17.18% | 10.84% | |
| | | TEN YEARS | | 354.76% | 355.34% | 363.74% | 246.74% | | 16.35% | 16.37% | 16.58% | 13.24% | |
| | | | | | | | | | | | | |
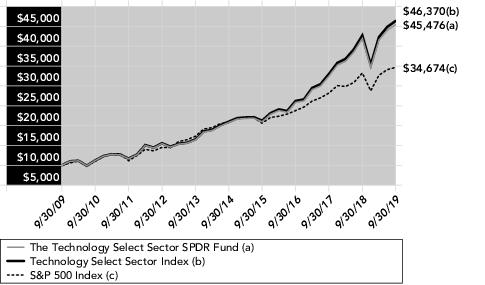
Comparison of Change in Value of a $10,000 Investment
(Based on Net Asset Value)
Line graph is based on cumulative total return.
The total expense ratio for The Technology Select Sector SPDR Fund as stated in the Fees and Expenses table of the most recent prospectus is 0.13%.
Performance quoted represents past performance, which is no guarantee of future results. Investment return and principal value will fluctuate, so you may have a gain or loss when shares are sold. Current performance may be higher or lower than that quoted. Visit www.spdrs.com for most recent month-end performance. The returns do not reflect the deduction of taxes that a shareholder would pay on Fund distributions or on the redemption or sale of Fund shares. See "Notes to Performance Summaries" on page 1 for more information.
See accompanying notes to financial statements.
30
The Technology Select Sector SPDR Fund
Portfolio Statistics (Unaudited)
Top Five Holdings as of September 30, 2019
| | | | |
| | Description | Market Value | % of Net Assets | |
| | Microsoft Corp. | 4,381,868,571 | 19.6% | |
| | Apple, Inc. | 3,927,339,483 | 17.5 | |
| | Visa, Inc. Class A | 1,226,189,626 | 5.5 | |
| | Mastercard, Inc. Class A | 1,000,785,147 | 4.5 | |
| | Intel Corp. | 942,288,350 | 4.2 | |
| | TOTAL | 11,478,471,177 | 51.3% | |
(The five largest holdings are subject to change, and there are no guarantees the Fund will continue to remain invested in any particular company.)
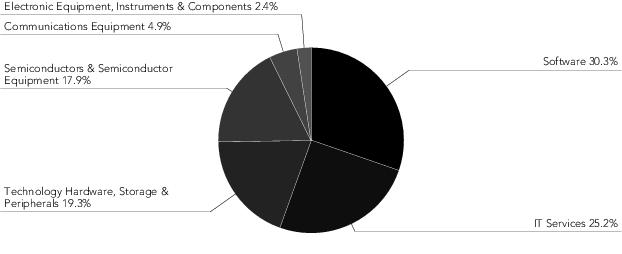
Industry Breakdown as of September 30, 2019*
* The Fund’s industry breakdown is expressed as a percentage of total common stock and may change over time.
See accompanying notes to financial statements.
31
THE UTILITIES SELECT SECTOR SPDR FUND
Management's Discussion of Fund Performance (Unaudited)
The Utilities Select Sector SPDR Fund (the “Fund”) seeks to provide investment results that, before expenses, correspond generally to the price and yield performance of publicly traded equity securities of companies in the Utilities Select Sector Index. The Fund’s benchmark is the Utilities Select Sector Index (the “Index”).
For the 12-month period ended September 30, 2019 (the “Reporting Period”), the total return for the Fund was 26.85%, and the Index was 27.10%. The Fund and Index returns reflect the reinvestment of dividends and other income. The Fund’s performance reflects the expenses of managing the Fund, including brokerage and advisory expenses. The Index is unmanaged and Index returns do not reflect fees and expenses of any kind, which would have a negative impact on returns. Fees and expenses and cash drag contributed to the difference between the Fund’s performance and that of the Index.
During the prior twelve month period, the utilities sector has been positively impacted by a significant shift by the Federal Reserve. At the beginning of the period, market expectations suggested continued Federal Reserve tightening but in actuality there ended up being two cuts to the federal funds rate in 2019. These rate decreases helped the Utlities sector by making their relatively high dividend yield more attractive and decreasing the borrowing costs for the Fund’s constituents. Due to the capital intensive nature of utilities, many of these stocks have historically tended to be more greatly impacted by rising interest rates due to their relatively high debt ratios. Conversely, many of this sector’s constituent’s returns have been modestly helped by increased electricity demand caused by a historically hot summer in significant portions of the United States. Similarly, this sector’s return has also been helped during the prior twelve months by increased demand for energy associated with improvements in the residential and commercial real estate marketplace.
On an individual security level, the top positive contributors to the Fund’s performance during the Reporting Period were NextEra Energy, Inc., Southern Company, and Duke Energy Corporation. The top negative contributors to the Fund’s performance during the Reporting Period were SCANA Corporation, NRG Energy, Inc., and PG&E Corporation.
The views expressed above reflect those of the Fund’s portfolio manager only through the Reporting Period, and do not necessarily represent the views of the Adviser as a whole. Any such views are subject to change at any time based upon market or other conditions and the Adviser disclaims any responsibility to update such views. These views may not be relied on as investment advice and, because investment decisions for a fund are based on numerous factors, may not be relied on as an indication of trading intent on behalf of any fund.
See accompanying notes to financial statements.
32
The Utilities Select Sector SPDR Fund
Performance Summary (Unaudited)
Performance as of September 30, 2019
| | | | | | | | | | | | | |
| | | | | Cumulative Total Return | | Average Annual Total Return | | |
| | | | | Net
Asset
Value | Market
Value | Utilities Select Sector Index | S&P 500 Index | | Net
Asset
Value | Market
Value | Utilities Select Sector Index | S&P 500 Index | |
| | | ONE YEAR | | 26.85% | 26.85% | 27.10% | 4.25% | | 26.85% | 26.85% | 27.10% | 4.25% | |
| | | FIVE YEARS | | 82.06% | 82.03% | 83.50% | 67.27% | | 12.73% | 12.73% | 12.91% | 10.84% | |
| | | TEN YEARS | | 218.83% | 219.25% | 225.40% | 246.74% | | 12.29% | 12.31% | 12.52% | 13.24% | |
| | | | | | | | | | | | | |
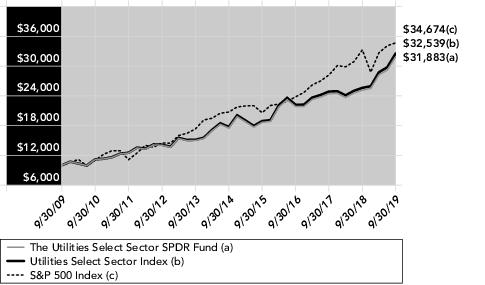
Comparison of Change in Value of a $10,000 Investment
(Based on Net Asset Value)
Line graph is based on cumulative total return.
The total expense ratio for The Utilities Select Sector SPDR Fund as stated in the Fees and Expenses table of the most recent prospectus is 0.13%.
Performance quoted represents past performance, which is no guarantee of future results. Investment return and principal value will fluctuate, so you may have a gain or loss when shares are sold. Current performance may be higher or lower than that quoted. Visit www.spdrs.com for most recent month-end performance. The returns do not reflect the deduction of taxes that a shareholder would pay on Fund distributions or on the redemption or sale of Fund shares. See "Notes to Performance Summaries" on page 1 for more information.
See accompanying notes to financial statements.
33
The Utilities Select Sector SPDR Fund
Portfolio Statistics (Unaudited)
Top Five Holdings as of September 30, 2019
| | | | |
| | Description | Market Value | % of Net Assets | |
| | NextEra Energy, Inc. | 1,447,413,796 | 12.8% | |
| | Duke Energy Corp. | 887,758,214 | 7.9 | |
| | Dominion Energy, Inc. | 846,631,849 | 7.5 | |
| | Southern Co. | 820,649,721 | 7.3 | |
| | Exelon Corp. | 596,602,074 | 5.3 | |
| | TOTAL | 4,599,055,654 | 40.8% | |
(The five largest holdings are subject to change, and there are no guarantees the Fund will continue to remain invested in any particular company.)
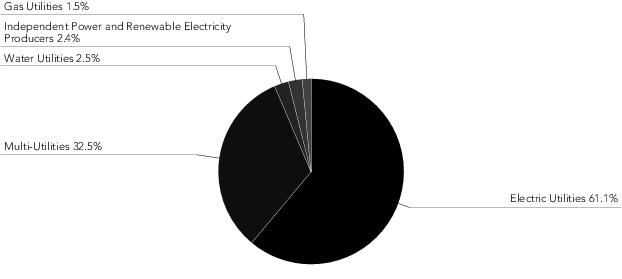
Industry Breakdown as of September 30, 2019*
* The Fund’s industry breakdown is expressed as a percentage of total common stock and may change over time.
See accompanying notes to financial statements.
34
THE COMMUNICATION SERVICES SELECT SECTOR SPDR FUND
SCHEDULE OF INVESTMENTS
September 30, 2019
| Security Description | | | Shares | | Value |
| COMMON STOCKS — 99.9% | | | | | |
| DIVERSIFIED TELECOMMUNICATION SERVICES — 10.9% | | | |
AT&T, Inc.
| | 7,405,176 | | $280,211,860 |
CenturyLink, Inc.
| | 7,764,165 | | 96,896,779 |
Verizon Communications, Inc.
| | 4,681,961 | | 282,603,166 |
| | | | | | 659,711,805 |
| ENTERTAINMENT — 19.8% | | | |
Activision Blizzard, Inc.
| | 5,017,483 | | 265,525,200 |
Electronic Arts, Inc. (a)
| | 2,330,784 | | 227,997,291 |
Netflix, Inc. (a)
| | 954,354 | | 255,404,218 |
Take-Two Interactive Software, Inc. (a)
| | 895,061 | | 112,186,946 |
Viacom, Inc. Class B
| | 2,799,465 | | 67,271,144 |
Walt Disney Co.
| | 2,034,023 | | 265,073,877 |
| | | | | | 1,193,458,676 |
| INTERACTIVE MEDIA & SERVICES — 46.1% | | | |
Alphabet, Inc. Class A (a)
| | 576,097 | | 703,495,090 |
Alphabet, Inc. Class C (a)
| | 581,140 | | 708,409,660 |
Facebook, Inc. Class A (a)
| | 6,109,897 | | 1,088,050,458 |
TripAdvisor, Inc. (a) (b)
| | 830,472 | | 32,122,657 |
Twitter, Inc. (a)
| | 6,113,851 | | 251,890,661 |
| | | | | | 2,783,968,526 |
| MEDIA — 19.8% | | | |
CBS Corp. Class B
| | 2,588,093 | | 104,481,314 |
Charter Communications, Inc. Class A (a)
| | 659,759 | | 271,899,879 |
Comcast Corp. Class A
| | 5,988,226 | | 269,949,228 |
Discovery, Inc. Class A (a) (b)
| | 1,249,907 | | 33,285,023 |
Discovery, Inc. Class C (a)
| | 2,744,129 | | 67,560,456 |
DISH Network Corp. Class A (a)
| | 1,902,807 | | 64,828,635 |
Fox Corp. Class A
| | 2,803,174 | | 88,398,092 |
Fox Corp. Class B
| | 1,284,181 | | 40,503,069 |
Interpublic Group of Cos., Inc.
| | 3,062,549 | | 66,028,557 |
News Corp. Class A
| | 3,050,124 | | 42,457,726 |
| Security Description | | | Shares | | Value |
News Corp. Class B
| | 963,148 | | $13,768,201 |
Omnicom Group, Inc.
| | 1,720,428 | | 134,709,512 |
| | | | | | 1,197,869,692 |
| WIRELESS TELECOMMUNICATION SERVICES — 3.3% | | | |
T-Mobile US, Inc. (a)
| | 2,500,438 | | 196,959,501 |
TOTAL COMMON STOCKS
(Cost $6,122,341,603)
| | | | | 6,031,968,200 |
| SHORT-TERM INVESTMENTS — 0.1% | | | |
State Street Institutional Liquid Reserves Fund, Premier Class 2.03% (c) (d)
| | 4,889,562 | | 4,890,051 |
State Street Navigator Securities Lending Portfolio II (e) (f)
| | 4,017,892 | | 4,017,892 |
TOTAL SHORT-TERM INVESTMENTS
(Cost $8,907,943)
| | 8,907,943 | |
TOTAL INVESTMENTS — 100.0%
(Cost $6,131,249,546)
| | 6,040,876,143 | |
LIABILITIES IN EXCESS OF OTHER ASSETS — (0.0)% (g)
| | (1,473,199) | |
NET ASSETS — 100.0%
| | $6,039,402,944 | |
| (a) | Non-income producing security. |
| (b) | All or a portion of the shares of the security are on loan at September 30, 2019. |
| (c) | The Fund invested in certain money market funds managed by SSGA Funds Management, Inc. Amounts related to these transactions during the period ended September 30, 2019 are shown in the Affiliate Table below. |
| (d) | The rate shown is the annualized seven-day yield at September 30, 2019. |
| (e) | The Fund invested in an affiliated entity. Amounts related to these transactions during the period ended September 30, 2019 are shown in the Affiliate Table below. |
| (f) | Investment of cash collateral for securities loaned. |
| (g) | Amount is less than 0.05% of net assets. |
The following table summarizes the value of the Fund's investments according to the fair value hierarchy as of September 30, 2019.
| Description | | Level 1 –
Quoted Prices | | Level 2 –
Other Significant
Observable Inputs | | Level 3 –
Significant
Unobservable Inputs | | Total |
| ASSETS: | | | | | | | | |
| INVESTMENTS: | | | | | | | | |
Common Stocks
| | $6,031,968,200 | | $— | | $— | | $6,031,968,200 |
Short-Term Investments
| | 8,907,943 | | — | | — | | 8,907,943 |
TOTAL INVESTMENTS
| | $6,040,876,143 | | $— | | $— | | $6,040,876,143 |
See accompanying notes to financial statements.
35
THE COMMUNICATION SERVICES SELECT SECTOR SPDR FUND
SCHEDULE OF INVESTMENTS (continued)
September 30, 2019
Affiliate Table
| | Number of
Shares Held
at
9/30/18 | | Value at
9/30/18 | | Cost of
Purchases | | Proceeds
from
Shares Sold | | Realized
Gain (Loss) | | Change in
Unrealized
Appreciation/
Depreciation | | Number of
Shares Held
at
9/30/19 | | Value at
9/30/19 | | Dividend
Income |
State Street Institutional Liquid Reserves Fund, Premier Class
| — | | $— | | $19,989,633 | | $15,099,581 | | $(1) | | $— | | 4,889,562 | | $4,890,051 | | $7,845 |
State Street Institutional U.S. Government Money Market Fund, Class G Shares
| 715,482 | | 715,482 | | 66,795,876 | | 67,511,358 | | — | | — | | — | | — | | 106,482 |
State Street Navigator Securities Lending Portfolio II
| — | | — | | 287,008,411 | | 282,990,519 | | — | | — | | 4,017,892 | | 4,017,892 | | 31,000 |
Total
| | | $715,482 | | $373,793,920 | | $365,601,458 | | $(1) | | $— | | | | $8,907,943 | | $145,327 |
See accompanying notes to financial statements.
36
THE CONSUMER DISCRETIONARY SELECT SECTOR SPDR FUND
SCHEDULE OF INVESTMENTS
September 30, 2019
| Security Description | | | Shares | | Value |
| COMMON STOCKS — 99.9% | | | | | |
| AUTO COMPONENTS — 1.3% | | | |
Aptiv PLC
| | 1,561,660 | | $136,520,317 |
BorgWarner, Inc.
| | 1,268,266 | | 46,519,997 |
| | | | | | 183,040,314 |
| AUTOMOBILES — 3.9% | | | |
Ford Motor Co.
| | 23,912,651 | | 219,039,883 |
General Motors Co.
| | 7,669,010 | | 287,434,495 |
Harley-Davidson, Inc. (a)
| | 962,527 | | 34,622,096 |
| | | | | | 541,096,474 |
| DISTRIBUTORS — 1.1% | | | |
Genuine Parts Co.
| | 897,127 | | 89,344,878 |
LKQ Corp. (b)
| | 1,892,720 | | 59,526,044 |
| | | | | | 148,870,922 |
| DIVERSIFIED CONSUMER SERVICES — 0.2% | | | |
H&R Block, Inc. (a)
| | 1,232,709 | | 29,116,587 |
| HOTELS, RESTAURANTS & LEISURE — 20.7% | | | |
Carnival Corp. (a)
| | 2,439,788 | | 106,643,133 |
Chipotle Mexican Grill, Inc. (b)
| | 155,425 | | 130,630,050 |
Darden Restaurants, Inc.
| | 754,219 | | 89,163,770 |
Hilton Worldwide Holdings, Inc.
| | 1,749,390 | | 162,885,703 |
Marriott International, Inc. Class A
| | 1,667,824 | | 207,427,271 |
McDonald's Corp.
| | 4,639,728 | | 996,195,999 |
MGM Resorts International
| | 3,202,210 | | 88,765,261 |
Norwegian Cruise Line Holdings, Ltd. (b)
| | 1,324,031 | | 68,545,085 |
Royal Caribbean Cruises, Ltd.
| | 1,047,001 | | 113,421,618 |
Starbucks Corp.
| | 7,311,611 | | 646,492,645 |
Wynn Resorts, Ltd.
| | 594,778 | | 64,664,264 |
Yum! Brands, Inc.
| | 1,856,550 | | 210,588,467 |
| | | | | | 2,885,423,266 |
| HOUSEHOLD DURABLES — 4.3% | | | |
D.R. Horton, Inc.
| | 2,050,052 | | 108,058,241 |
Garmin, Ltd.
| | 887,299 | | 75,145,352 |
Leggett & Platt, Inc. (a)
| | 807,408 | | 33,055,284 |
Lennar Corp. Class A
| | 1,746,610 | | 97,548,169 |
Mohawk Industries, Inc. (b)
| | 367,763 | | 45,628,355 |
Newell Brands, Inc. (a)
| | 2,340,189 | | 43,808,338 |
NVR, Inc. (b)
| | 19,116 | | 71,060,863 |
PulteGroup, Inc.
| | 1,582,986 | | 57,858,138 |
Whirlpool Corp. (a)
| | 390,181 | | 61,789,063 |
| | | | | | 593,951,803 |
| INTERNET & DIRECT MARKETING RETAIL — 27.8% | | | |
Amazon.com, Inc. (b)
| | 1,765,106 | | 3,064,065,156 |
Booking Holdings, Inc. (b)
| | 259,628 | | 509,548,509 |
eBay, Inc.
| | 4,809,769 | | 187,484,796 |
Expedia Group, Inc.
| | 851,982 | | 114,514,901 |
| | | | | | 3,875,613,362 |
| Security Description | | | Shares | | Value |
| LEISURE EQUIPMENT & PRODUCTS — 0.6% | | | |
Hasbro, Inc.
| | 720,821 | | $85,554,244 |
| MULTILINE RETAIL — 6.1% | | | |
Dollar General Corp.
| | 1,568,849 | | 249,352,860 |
Dollar Tree, Inc. (b)
| | 1,443,071 | | 164,740,985 |
Kohl's Corp.
| | 977,219 | | 48,528,695 |
Macy's, Inc. (a)
| | 1,897,103 | | 29,480,981 |
Nordstrom, Inc. (a)
| | 656,485 | | 22,103,850 |
Target Corp.
| | 3,119,347 | | 333,489,388 |
| | | | | | 847,696,759 |
| SPECIALTY RETAIL — 25.9% | | | |
Advance Auto Parts, Inc.
| | 438,392 | | 72,510,037 |
AutoZone, Inc. (b)
| | 149,610 | | 162,269,998 |
Best Buy Co., Inc.
| | 1,424,367 | | 98,267,079 |
CarMax, Inc. (a) (b)
| | 1,016,870 | | 89,484,560 |
Gap, Inc. (a)
| | 1,315,491 | | 22,836,924 |
Home Depot, Inc.
| | 6,691,458 | | 1,552,552,085 |
L Brands, Inc.
| | 1,425,789 | | 27,931,207 |
Lowe's Cos., Inc.
| | 4,713,658 | | 518,313,834 |
O'Reilly Automotive, Inc. (b)
| | 466,730 | | 185,996,572 |
Ross Stores, Inc.
| | 2,225,588 | | 244,480,842 |
Tiffany & Co. (a)
| | 667,690 | | 61,848,125 |
TJX Cos., Inc.
| | 7,382,052 | | 411,475,578 |
Tractor Supply Co.
| | 732,414 | | 66,239,522 |
Ulta Salon Cosmetics & Fragrance, Inc. (b)
| | 361,409 | | 90,587,166 |
| | | | | | 3,604,793,529 |
| TEXTILES, APPAREL & LUXURY GOODS — 8.0% | | | |
Capri Holdings, Ltd. (b)
| | 930,839 | | 30,866,621 |
Hanesbrands, Inc. (a)
| | 2,220,360 | | 34,015,915 |
NIKE, Inc. Class B
| | 7,646,730 | | 718,180,881 |
PVH Corp.
| | 455,342 | | 40,174,825 |
Ralph Lauren Corp.
| | 318,404 | | 30,398,030 |
Tapestry, Inc.
| | 1,761,638 | | 45,890,670 |
Under Armour, Inc. Class A (a) (b)
| | 1,155,433 | | 23,039,334 |
Under Armour, Inc. Class C (b)
| | 1,193,583 | | 21,639,660 |
VF Corp.
| | 1,991,378 | | 177,212,728 |
| | | | | | 1,121,418,664 |
TOTAL COMMON STOCKS
(Cost $14,426,405,772)
| | | | | 13,916,575,924 |
| SHORT-TERM INVESTMENTS — 0.7% | | | |
State Street Institutional Liquid Reserves Fund, Premier Class 2.03% (c) (d)
| | 10,102,149 | | 10,103,159 |
See accompanying notes to financial statements.
37
THE CONSUMER DISCRETIONARY SELECT SECTOR SPDR FUND
SCHEDULE OF INVESTMENTS (continued)
September 30, 2019
| Security Description | | | Shares | | Value |
State Street Navigator Securities Lending Portfolio II (e) (f)
| | 84,833,593 | | $84,833,593 |
TOTAL SHORT-TERM INVESTMENTS
(Cost $94,936,752)
| | 94,936,752 | |
TOTAL INVESTMENTS — 100.6%
(Cost $14,521,342,524)
| | 14,011,512,676 | |
LIABILITIES IN EXCESS OF OTHER ASSETS — (0.6)%
| | (83,198,464) | |
NET ASSETS — 100.0%
| | $13,928,314,212 | |
| (a) | All or a portion of the shares of the security are on loan at September 30, 2019. |
| (b) | Non-income producing security. |
| (c) | The Fund invested in certain money market funds managed by SSGA Funds Management, Inc. Amounts related to these transactions during the period ended September 30, 2019 are shown in the Affiliate Table below. |
| (d) | The rate shown is the annualized seven-day yield at September 30, 2019. |
| (e) | The Fund invested in an affiliated entity. Amounts related to these transactions during the period ended September 30, 2019 are shown in the Affiliate Table below. |
| (f) | Investment of cash collateral for securities loaned. |
The following table summarizes the value of the Fund's investments according to the fair value hierarchy as of September 30, 2019.
| Description | | Level 1 –
Quoted Prices | | Level 2 –
Other Significant
Observable Inputs | | Level 3 –
Significant
Unobservable Inputs | | Total |
| ASSETS: | | | | | | | | |
| INVESTMENTS: | | | | | | | | |
Common Stocks
| | $13,916,575,924 | | $— | | $— | | $13,916,575,924 |
Short-Term Investments
| | 94,936,752 | | — | | — | | 94,936,752 |
TOTAL INVESTMENTS
| | $14,011,512,676 | | $— | | $— | | $14,011,512,676 |
Affiliate Table
| | Number of
Shares Held
at
9/30/18 | | Value at
9/30/18 | | Cost of
Purchases | | Proceeds
from
Shares Sold | | Realized
Gain (Loss) | | Change in
Unrealized
Appreciation/
Depreciation | | Number of
Shares Held
at
9/30/19 | | Value at
9/30/19 | | Dividend
Income |
State Street Institutional Liquid Reserves Fund, Premier Class
| — | | $— | | $104,348,560 | | $94,245,302 | | $(99) | | $— | | 10,102,149 | | $10,103,159 | | $58,170 |
State Street Institutional U.S. Government Money Market Fund, Class G Shares
| 1,316,113 | | 1,316,113 | | 232,103,797 | | 233,419,910 | | — | | — | | — | | — | | 259,189 |
State Street Navigator Securities Lending Government Money Market Portfolio
| 41,766,139 | | 41,766,139 | | 17,756,495 | | 59,522,634 | | — | | — | | — | | — | | 9,454 |
State Street Navigator Securities Lending Portfolio II
| — | | — | | 1,436,689,612 | | 1,351,856,019 | | — | | — | | 84,833,593 | | 84,833,593 | | 248,177 |
Total
| | | $43,082,252 | | $1,790,898,464 | | $1,739,043,865 | | $(99) | | $— | | | | $94,936,752 | | $574,990 |
See accompanying notes to financial statements.
38
THE CONSUMER STAPLES SELECT SECTOR SPDR FUND
SCHEDULE OF INVESTMENTS
September 30, 2019
| Security Description | | | Shares | | Value |
| COMMON STOCKS — 99.6% | | | | | |
| BEVERAGES — 25.9% | | | |
Brown-Forman Corp. Class B (a)
| | 1,490,892 | | $93,598,200 |
Coca-Cola Co.
| | 28,628,467 | | 1,558,533,743 |
Constellation Brands, Inc. Class A
| | 1,369,868 | | 283,946,239 |
Molson Coors Brewing Co. Class B
| | 1,538,732 | | 88,477,090 |
Monster Beverage Corp. (b)
| | 3,168,802 | | 183,980,644 |
PepsiCo, Inc.
| | 10,403,677 | | 1,426,344,117 |
| | | | | | 3,634,880,033 |
| FOOD & STAPLES RETAILING — 19.4% | | | |
Costco Wholesale Corp.
| | 2,130,238 | | 613,742,870 |
Kroger Co.
| | 6,543,095 | | 168,680,989 |
Sysco Corp.
| | 4,203,544 | | 333,761,394 |
Walmart, Inc.
| | 10,582,104 | | 1,255,884,103 |
Walgreens Boots Alliance, Inc.
| | 6,214,094 | | 343,701,539 |
| | | | | | 2,715,770,895 |
| FOOD PRODUCTS — 17.2% | | | |
Archer-Daniels-Midland Co.
| | 4,562,229 | | 187,370,745 |
Campbell Soup Co. (a)
| | 1,381,386 | | 64,814,631 |
Conagra Brands, Inc.
| | 3,985,803 | | 122,284,436 |
General Mills, Inc.
| | 4,943,267 | | 272,472,877 |
Hershey Co.
| | 1,220,169 | | 189,113,993 |
Hormel Foods Corp. (a)
| | 2,274,404 | | 99,459,687 |
J.M. Smucker Co.
| | 934,215 | | 102,782,334 |
Kellogg Co.
| | 2,036,777 | | 131,066,600 |
Kraft Heinz Co.
| | 5,096,447 | | 142,369,247 |
Lamb Weston Holdings, Inc.
| | 1,193,191 | | 86,768,850 |
McCormick & Co., Inc. (a)
| | 1,007,942 | | 157,541,335 |
Mondelez International, Inc. Class A
| | 11,812,759 | | 653,481,828 |
Tyson Foods, Inc. Class A
| | 2,413,665 | | 207,913,103 |
| | | | | | 2,417,439,666 |
| HOUSEHOLD PRODUCTS — 25.3% | | | |
Church & Dwight Co., Inc.
| | 2,023,999 | | 152,285,685 |
Clorox Co.
| | 1,029,994 | | 156,425,189 |
Colgate-Palmolive Co.
| | 7,028,052 | | 516,632,102 |
Kimberly-Clark Corp.
| | 2,819,398 | | 400,495,486 |
Procter & Gamble Co.
| | 18,618,667 | | 2,315,789,801 |
| | | | | | 3,541,628,263 |
| Security Description | | | Shares | | Value |
| PERSONAL PRODUCTS — 2.7% | | | |
Coty, Inc. Class A (a)
| | 2,409,285 | | $25,321,586 |
Estee Lauder Cos., Inc. Class A
| | 1,812,057 | | 360,508,740 |
| | | | | | 385,830,326 |
| TOBACCO — 9.1% | | | |
Altria Group, Inc.
| | 15,301,813 | | 625,844,152 |
Philip Morris International, Inc.
| | 8,512,424 | | 646,348,354 |
| | | | | | 1,272,192,506 |
TOTAL COMMON STOCKS
(Cost $14,256,824,646)
| | | | | 13,967,741,689 |
| SHORT-TERM INVESTMENTS — 0.9% | | | |
State Street Institutional Liquid Reserves Fund, Premier Class 2.03% (c) (d)
| | 637,217 | | 637,281 |
State Street Navigator Securities Lending Portfolio II (e) (f)
| | 121,441,491 | | 121,441,491 |
TOTAL SHORT-TERM INVESTMENTS
(Cost $122,078,772)
| | 122,078,772 | |
TOTAL INVESTMENTS — 100.5%
(Cost $14,378,903,418)
| | 14,089,820,461 | |
LIABILITIES IN EXCESS OF OTHER ASSETS — (0.5)%
| | (74,816,390) | |
NET ASSETS — 100.0%
| | $14,015,004,071 | |
| (a) | All or a portion of the shares of the security are on loan at September 30, 2019. |
| (b) | Non-income producing security. |
| (c) | The Fund invested in certain money market funds managed by SSGA Funds Management, Inc. Amounts related to these transactions during the period ended September 30, 2019 are shown in the Affiliate Table below. |
| (d) | The rate shown is the annualized seven-day yield at September 30, 2019. |
| (e) | The Fund invested in an affiliated entity. Amounts related to these transactions during the period ended September 30, 2019 are shown in the Affiliate Table below. |
| (f) | Investment of cash collateral for securities loaned. |
The following table summarizes the value of the Fund's investments according to the fair value hierarchy as of September 30, 2019.
| Description | | Level 1 –
Quoted Prices | | Level 2 –
Other Significant
Observable Inputs | | Level 3 –
Significant
Unobservable Inputs | | Total |
| ASSETS: | | | | | | | | |
| INVESTMENTS: | | | | | | | | |
Common Stocks
| | $13,967,741,689 | | $— | | $— | | $13,967,741,689 |
Short-Term Investments
| | 122,078,772 | | — | | — | | 122,078,772 |
TOTAL INVESTMENTS
| | $14,089,820,461 | | $— | | $— | | $14,089,820,461 |
See accompanying notes to financial statements.
39
THE CONSUMER STAPLES SELECT SECTOR SPDR FUND
SCHEDULE OF INVESTMENTS (continued)
September 30, 2019
Affiliate Table
| | Number of
Shares Held
at
9/30/18 | | Value at
9/30/18 | | Cost of
Purchases | | Proceeds
from
Shares Sold | | Realized
Gain (Loss) | | Change in
Unrealized
Appreciation/
Depreciation | | Number of
Shares Held
at
9/30/19 | | Value at
9/30/19 | | Dividend
Income |
State Street Institutional Liquid Reserves Fund, Premier Class
| — | | $— | | $185,875,758 | | $185,238,397 | | $(80) | | $— | | 637,217 | | $637,281 | | $63,594 |
State Street Institutional U.S. Government Money Market Fund, Class G Shares
| 5,021,303 | | 5,021,303 | | 474,088,241 | | 479,109,544 | | — | | — | | — | | — | | 313,079 |
State Street Navigator Securities Lending Government Money Market Portfolio
| — | | — | | 100,363,213 | | 100,363,213 | | — | | — | | — | | — | | 10,820 |
State Street Navigator Securities Lending Portfolio II
| — | | — | | 1,134,819,896 | | 1,013,378,405 | | — | | — | | 121,441,491 | | 121,441,491 | | 598,582 |
Total
| | | $5,021,303 | | $1,895,147,108 | | $1,778,089,559 | | $(80) | | $— | | | | $122,078,772 | | $986,075 |
See accompanying notes to financial statements.
40
THE ENERGY SELECT SECTOR SPDR FUND
SCHEDULE OF INVESTMENTS
September 30, 2019
| Security Description | | | Shares | | Value |
| COMMON STOCKS — 99.7% | | | | | |
| ENERGY EQUIPMENT & SERVICES — 9.5% | | | |
Baker Hughes a GE Co. (a)
| | 6,339,967 | | $147,087,235 |
Halliburton Co.
| | 8,538,380 | | 160,948,463 |
Helmerich & Payne, Inc.
| | 1,051,503 | | 42,133,725 |
National Oilwell Varco, Inc.
| | 3,773,886 | | 80,006,383 |
Schlumberger, Ltd.
| | 12,290,269 | | 419,958,492 |
TechnipFMC PLC
| | 4,104,380 | | 99,079,733 |
| | | | | | 949,214,031 |
| OIL, GAS & CONSUMABLE FUELS — 90.2% | | | |
Apache Corp. (a)
| | 3,676,724 | | 94,124,134 |
Cabot Oil & Gas Corp.
| | 4,091,658 | | 71,890,431 |
Chevron Corp.
| | 17,857,233 | | 2,117,867,834 |
Cimarex Energy Co. (a)
| | 992,187 | | 47,565,445 |
Concho Resources, Inc.
| | 1,966,380 | | 133,517,202 |
ConocoPhillips
| | 8,001,319 | | 455,915,157 |
Devon Energy Corp.
| | 3,952,047 | | 95,086,251 |
Diamondback Energy, Inc.
| | 1,594,488 | | 143,360,416 |
EOG Resources, Inc.
| | 5,657,211 | | 419,878,200 |
Exxon Mobil Corp.
| | 32,281,728 | | 2,279,412,814 |
Hess Corp.
| | 2,530,980 | | 153,073,670 |
HollyFrontier Corp.
| | 1,480,735 | | 79,426,625 |
Kinder Morgan, Inc.
| | 18,977,616 | | 391,128,666 |
Marathon Oil Corp.
| | 7,863,111 | | 96,480,372 |
Marathon Petroleum Corp.
| | 6,417,116 | | 389,839,797 |
Noble Energy, Inc.
| | 4,677,022 | | 105,045,914 |
Occidental Petroleum Corp.
| | 8,719,112 | | 387,738,911 |
ONEOK, Inc.
| | 4,025,502 | | 296,639,242 |
Phillips 66
| | 4,372,252 | | 447,718,605 |
Pioneer Natural Resources Co.
| | 1,629,316 | | 204,919,073 |
Valero Energy Corp.
| | 4,039,455 | | 344,323,144 |
| Security Description | | | Shares | | Value |
Williams Cos., Inc.
| | 11,814,463 | | $284,255,980 |
| | | | | | 9,039,207,883 |
TOTAL COMMON STOCKS
(Cost $14,437,500,052)
| | | | | 9,988,421,914 |
| SHORT-TERM INVESTMENTS — 0.2% | | | |
State Street Institutional Liquid Reserves Fund, Premier Class 2.03% (b) (c)
| | 12,896,062 | | 12,897,352 |
State Street Navigator Securities Lending Portfolio II (d) (e)
| | 4,960,705 | | 4,960,705 |
TOTAL SHORT-TERM INVESTMENTS
(Cost $17,858,055)
| | 17,858,057 | |
TOTAL INVESTMENTS — 99.9%
(Cost $14,455,358,107)
| | 10,006,279,971 | |
OTHER ASSETS IN EXCESS OF LIABILITIES — 0.1%
| | 8,501,029 | |
NET ASSETS — 100.0%
| | $10,014,781,000 | |
| (a) | All or a portion of the shares of the security are on loan at September 30, 2019. |
| (b) | The Fund invested in certain money market funds managed by SSGA Funds Management, Inc. Amounts related to these transactions during the period ended September 30, 2019 are shown in the Affiliate Table below. |
| (c) | The rate shown is the annualized seven-day yield at September 30, 2019. |
| (d) | The Fund invested in an affiliated entity. Amounts related to these transactions during the period ended September 30, 2019 are shown in the Affiliate Table below. |
| (e) | Investment of cash collateral for securities loaned. |
The following table summarizes the value of the Fund's investments according to the fair value hierarchy as of September 30, 2019.
| Description | | Level 1 –
Quoted Prices | | Level 2 –
Other Significant
Observable Inputs | | Level 3 –
Significant
Unobservable Inputs | | Total |
| ASSETS: | | | | | | | | |
| INVESTMENTS: | | | | | | | | |
Common Stocks
| | $9,988,421,914 | | $— | | $— | | $9,988,421,914 |
Short-Term Investments
| | 17,858,057 | | — | | — | | 17,858,057 |
TOTAL INVESTMENTS
| | $10,006,279,971 | | $— | | $— | | $10,006,279,971 |
See accompanying notes to financial statements.
41
THE ENERGY SELECT SECTOR SPDR FUND
SCHEDULE OF INVESTMENTS (continued)
September 30, 2019
Affiliate Table
| | Number of
Shares Held
at
9/30/18 | | Value at
9/30/18 | | Cost of
Purchases | | Proceeds
from
Shares Sold | | Realized
Gain (Loss) | | Change in
Unrealized
Appreciation/
Depreciation | | Number of
Shares Held
at
9/30/19 | | Value at
9/30/19 | | Dividend
Income |
State Street Institutional Liquid Reserves Fund, Premier Class
| — | | $— | | $183,305,845 | | $170,408,435 | | $(60) | | $2 | | 12,896,062 | | $12,897,352 | | $33,928 |
State Street Institutional U.S. Government Money Market Fund, Class G Shares
| 6,022,279 | | 6,022,279 | | 812,628,705 | | 818,650,984 | | — | | — | | — | | — | | 542,378 |
State Street Navigator Securities Lending Portfolio II
| — | | — | | 1,063,948,890 | | 1,058,988,185 | | — | | — | | 4,960,705 | | 4,960,705 | | 80,268 |
Total
| | | $6,022,279 | | $2,059,883,440 | | $2,048,047,604 | | $(60) | | $2 | | | | $17,858,057 | | $656,574 |
See accompanying notes to financial statements.
42
THE FINANCIAL SELECT SECTOR SPDR FUND
SCHEDULE OF INVESTMENTS
September 30, 2019
| Security Description | | | Shares | | Value |
| COMMON STOCKS — 99.8% | | | | | |
| BANKS — 42.1% | | | |
Bank of America Corp.
| | 58,977,646 | | $1,720,377,934 |
BB&T Corp. (a)
| | 5,393,900 | | 287,872,443 |
Citigroup, Inc.
| | 15,903,929 | | 1,098,643,415 |
Citizens Financial Group, Inc.
| | 3,147,547 | | 111,328,737 |
Comerica, Inc.
| | 1,051,456 | | 69,385,581 |
Fifth Third Bancorp
| | 5,142,628 | | 140,805,155 |
First Republic Bank
| | 1,184,345 | | 114,526,162 |
Huntington Bancshares, Inc.
| | 7,306,526 | | 104,264,126 |
JPMorgan Chase & Co.
| | 22,510,454 | | 2,649,255,331 |
KeyCorp
| | 7,062,892 | | 126,001,993 |
M&T Bank Corp.
| | 941,053 | | 148,658,142 |
People's United Financial, Inc.
| | 2,807,249 | | 43,891,338 |
PNC Financial Services Group, Inc.
| | 3,134,688 | | 439,357,870 |
Regions Financial Corp.
| | 7,024,363 | | 111,125,423 |
SunTrust Banks, Inc.
| | 3,125,221 | | 215,015,205 |
SVB Financial Group (b)
| | 362,926 | | 75,833,388 |
US Bancorp
| | 10,095,433 | | 558,681,262 |
Wells Fargo & Co.
| | 28,227,401 | | 1,423,790,107 |
Zions Bancorp NA (a)
| | 1,245,832 | | 55,464,441 |
| | | | | | 9,494,278,053 |
| CAPITAL MARKETS — 20.8% | | | |
Affiliated Managers Group, Inc.
| | 356,513 | | 29,715,359 |
Ameriprise Financial, Inc.
| | 921,254 | | 135,516,463 |
Bank of New York Mellon Corp.
| | 6,039,161 | | 273,030,469 |
BlackRock, Inc.
| | 826,999 | | 368,543,834 |
Cboe Global Markets, Inc.
| | 786,264 | | 90,349,596 |
Charles Schwab Corp.
| | 8,190,435 | | 342,605,896 |
CME Group, Inc.
| | 2,521,061 | | 532,801,032 |
E*TRADE Financial Corp.
| | 1,688,330 | | 73,763,138 |
Franklin Resources, Inc. (a)
| | 1,985,651 | | 57,305,888 |
Goldman Sachs Group, Inc.
| | 2,278,280 | | 472,127,964 |
Intercontinental Exchange, Inc.
| | 3,945,157 | | 364,019,636 |
Invesco, Ltd. (a)
| | 2,711,978 | | 45,940,907 |
MarketAxess Holdings, Inc.
| | 265,953 | | 87,099,608 |
Moody's Corp.
| | 1,145,462 | | 234,624,981 |
Morgan Stanley
| | 8,842,924 | | 377,327,567 |
MSCI, Inc.
| | 596,224 | | 129,827,776 |
Nasdaq, Inc.
| | 811,433 | | 80,615,869 |
Northern Trust Corp.
| | 1,512,856 | | 141,179,722 |
Raymond James Financial, Inc.
| | 869,936 | | 71,734,923 |
S&P Global, Inc.
| | 1,733,970 | | 424,787,971 |
State Street Corp. (c)
| | 2,622,937 | | 155,251,641 |
T Rowe Price Group, Inc.
| | 1,658,414 | | 189,473,799 |
| | | | | | 4,677,644,039 |
| CONSUMER FINANCE — 5.3% | | | |
American Express Co.
| | 4,789,590 | | 566,512,705 |
Capital One Financial Corp.
| | 3,311,218 | | 301,254,614 |
Discover Financial Services
| | 2,240,363 | | 181,671,036 |
Synchrony Financial
| | 4,297,007 | | 146,484,968 |
| | | | | | 1,195,923,323 |
| Security Description | | | Shares | | Value |
| DIVERSIFIED FINANCIAL SERVICES — 12.7% | | | |
Berkshire Hathaway, Inc. Class B (b)
| | 13,804,513 | | $2,871,614,794 |
| INSURANCE — 18.9% | | | |
Aflac, Inc.
| | 5,212,287 | | 272,706,856 |
Allstate Corp.
| | 2,317,542 | | 251,870,465 |
American International Group, Inc.
| | 6,124,115 | | 341,113,205 |
Aon PLC
| | 1,660,287 | | 321,381,755 |
Arthur J Gallagher & Co.
| | 1,309,969 | | 117,333,923 |
Assurant, Inc.
| | 430,430 | | 54,156,703 |
Chubb, Ltd.
| | 3,208,463 | | 517,974,267 |
Cincinnati Financial Corp.
| | 1,069,352 | | 124,761,298 |
Everest Re Group, Ltd.
| | 286,828 | | 76,322,063 |
Globe Life, Inc.
| | 706,619 | | 67,665,835 |
Hartford Financial Services Group, Inc.
| | 2,545,499 | | 154,282,694 |
Lincoln National Corp.
| | 1,409,457 | | 85,018,446 |
Loews Corp.
| | 1,830,815 | | 94,250,356 |
Marsh & McLennan Cos., Inc.
| | 3,564,382 | | 356,616,419 |
MetLife, Inc.
| | 5,603,737 | | 264,272,237 |
Principal Financial Group, Inc.
| | 1,825,328 | | 104,299,242 |
Progressive Corp.
| | 4,115,976 | | 317,959,146 |
Prudential Financial, Inc.
| | 2,830,097 | | 254,567,225 |
Travelers Cos., Inc.
| | 1,833,146 | | 272,570,479 |
Unum Group
| | 1,468,711 | | 43,650,091 |
Willis Towers Watson PLC
| | 908,162 | | 175,248,022 |
| | | | | | 4,268,020,727 |
TOTAL COMMON STOCKS
(Cost $23,313,992,075)
| | | | | 22,507,480,936 |
| SHORT-TERM INVESTMENTS — 0.2% | | | |
State Street Institutional Liquid Reserves Fund, Premier Class 2.03% (d) (e)
| | 31,507,466 | | 31,510,617 |
State Street Navigator Securities Lending Portfolio II (c) (f)
| | 18,432,206 | | 18,432,206 |
TOTAL SHORT-TERM INVESTMENTS
(Cost $49,941,781)
| | 49,942,823 | |
TOTAL INVESTMENTS — 100.0%
(Cost $23,363,933,856)
| | 22,557,423,759 | |
LIABILITIES IN EXCESS OF OTHER ASSETS — (0.0)% (g)
| | (5,219,987) | |
NET ASSETS — 100.0%
| | $22,552,203,772 | |
See accompanying notes to financial statements.
43
THE FINANCIAL SELECT SECTOR SPDR FUND
SCHEDULE OF INVESTMENTS (continued)
September 30, 2019
| (a) | All or a portion of the shares of the security are on loan at September 30, 2019. |
| (b) | Non-income producing security. |
| (c) | The Fund invested in an affiliated entity. Amounts related to these transactions during the period ended September 30, 2019 are shown in the Affiliate Table below. |
| (d) | The Fund invested in certain money market funds managed by SSGA Funds Management, Inc. Amounts related to these transactions during the period ended September 30, 2019 are shown in the Affiliate Table below. |
| (e) | The rate shown is the annualized seven-day yield at September 30, 2019. |
| (f) | Investment of cash collateral for securities loaned. |
| (g) | Amount is less than 0.05% of net assets. |
The following table summarizes the value of the Fund's investments according to the fair value hierarchy as of September 30, 2019.
| Description | | Level 1 –
Quoted Prices | | Level 2 –
Other Significant
Observable Inputs | | Level 3 –
Significant
Unobservable Inputs | | Total |
| ASSETS: | | | | | | | | |
| INVESTMENTS: | | | | | | | | |
Common Stocks
| | $22,507,480,936 | | $— | | $— | | $22,507,480,936 |
Short-Term Investments
| | 49,942,823 | | — | | — | | 49,942,823 |
TOTAL INVESTMENTS
| | $22,557,423,759 | | $— | | $— | | $22,557,423,759 |
Affiliate Table
| | Number of
Shares Held
at
9/30/18 | | Value at
9/30/18 | | Cost of
Purchases | | Proceeds
from
Shares Sold | | Realized
Gain (Loss) | | Change in
Unrealized
Appreciation/
Depreciation | | Number of
Shares Held
at
9/30/19 | | Value at
9/30/19 | | Dividend
Income |
State Street Corp.
| 3,594,808 | | $301,173,014 | | $183,416,146 | | $245,766,577 | | $(28,473,669) | | $(55,097,273) | | 2,622,937 | | $155,251,641 | | $5,472,078 |
State Street Institutional Liquid Reserves Fund, Premier Class
| — | | — | | 150,709,624 | | 119,199,884 | | (165) | | 1,042 | | 31,507,466 | | 31,510,617 | | 131,697 |
State Street Institutional U.S. Government Money Market Fund, Class G Shares
| 40,474,692 | | 40,474,692 | | 804,648,550 | | 845,123,242 | | — | | — | | — | | — | | 707,395 |
State Street Navigator Securities Lending Portfolio II
| — | | — | | 1,208,715,616 | | 1,190,283,410 | | — | | — | | 18,432,206 | | 18,432,206 | | 89,294 |
Total
| | | $341,647,706 | | $2,347,489,936 | | $2,400,373,113 | | $(28,473,834) | | $(55,096,231) | | | | $205,194,464 | | $6,400,464 |
See accompanying notes to financial statements.
44
THE HEALTH CARE SELECT SECTOR SPDR FUND
SCHEDULE OF INVESTMENTS
September 30, 2019
| Security Description | | | Shares | | Value |
| COMMON STOCKS — 99.9% | | | | | |
| BIOTECHNOLOGY — 15.5% | | | |
AbbVie, Inc.
| | 7,359,920 | | $557,293,142 |
Alexion Pharmaceuticals, Inc. (a)
| | 1,117,837 | | 109,480,956 |
Amgen, Inc.
| | 2,985,339 | | 577,692,950 |
Biogen, Inc. (a)
| | 918,227 | | 213,781,610 |
Celgene Corp. (a)
| | 3,528,200 | | 350,350,260 |
Gilead Sciences, Inc.
| | 6,304,487 | | 399,578,386 |
Incyte Corp. (a)
| | 887,133 | | 65,851,883 |
Regeneron Pharmaceuticals, Inc. (a)
| | 397,814 | | 110,353,604 |
Vertex Pharmaceuticals, Inc. (a)
| | 1,276,648 | | 216,289,704 |
| | | | | | 2,600,672,495 |
| HEALTH CARE EQUIPMENT & SUPPLIES — 26.4% | | | |
Abbott Laboratories
| | 8,793,851 | | 735,781,513 |
ABIOMED, Inc. (a)
| | 224,913 | | 40,009,774 |
Align Technology, Inc. (a) (b)
| | 362,950 | | 65,664,914 |
Baxter International, Inc.
| | 2,541,519 | | 222,306,667 |
Becton Dickinson and Co.
| | 1,344,540 | | 340,114,838 |
Boston Scientific Corp. (a)
| | 6,931,768 | | 282,053,640 |
Cooper Cos., Inc.
| | 246,667 | | 73,260,099 |
Danaher Corp.
| | 3,178,204 | | 459,028,004 |
DENTSPLY SIRONA, Inc.
| | 1,115,965 | | 59,492,094 |
Edwards Lifesciences Corp. (a)
| | 1,035,294 | | 227,671,504 |
Hologic, Inc. (a)
| | 1,336,088 | | 67,459,083 |
IDEXX Laboratories, Inc. (a)
| | 428,541 | | 116,533,154 |
Intuitive Surgical, Inc. (a)
| | 573,725 | | 309,771,339 |
Medtronic PLC
| | 6,682,746 | | 725,879,870 |
ResMed, Inc.
| | 713,980 | | 96,465,838 |
Stryker Corp.
| | 1,597,359 | | 345,508,752 |
Teleflex, Inc.
| | 230,100 | | 78,176,475 |
Varian Medical Systems, Inc. (a)
| | 453,335 | | 53,987,665 |
Zimmer Biomet Holdings, Inc.
| | 1,020,826 | | 140,128,785 |
| | | | | | 4,439,294,008 |
| HEALTH CARE PROVIDERS & SERVICES — 18.2% | | | |
AmerisourceBergen Corp.
| | 757,068 | | 62,329,408 |
Anthem, Inc.
| | 1,273,421 | | 305,748,382 |
Cardinal Health, Inc.
| | 1,485,705 | | 70,110,419 |
Centene Corp. (a)
| | 2,060,462 | | 89,135,586 |
Cigna Corp.
| | 1,879,726 | | 285,323,609 |
CVS Health Corp.
| | 6,475,292 | | 408,396,666 |
DaVita, Inc. (a)
| | 482,062 | | 27,511,278 |
HCA Healthcare, Inc.
| | 1,324,034 | | 159,440,174 |
Henry Schein, Inc. (a) (b)
| | 741,649 | | 47,094,712 |
Humana, Inc.
| | 673,143 | | 172,102,471 |
Laboratory Corp. of America Holdings (a)
| | 486,377 | | 81,711,336 |
McKesson Corp.
| | 920,480 | | 125,792,797 |
Quest Diagnostics, Inc.
| | 668,435 | | 71,542,598 |
UnitedHealth Group, Inc.
| | 4,717,633 | | 1,025,236,004 |
Universal Health Services, Inc. Class B
| | 404,408 | | 60,155,690 |
| Security Description | | | Shares | | Value |
WellCare Health Plans, Inc. (a)
| | 250,311 | | $64,873,102 |
| | | | | | 3,056,504,232 |
| HEALTH CARE TECHNOLOGY — 0.6% | | | |
Cerner Corp.
| | 1,584,927 | | 108,044,473 |
| LIFE SCIENCES TOOLS & SERVICES — 7.5% | | | |
Agilent Technologies, Inc.
| | 1,540,569 | | 118,053,803 |
Illumina, Inc. (a)
| | 732,485 | | 222,836,587 |
IQVIA Holdings, Inc. (a)
| | 906,959 | | 135,481,535 |
Mettler-Toledo International, Inc. (a)
| | 122,481 | | 86,275,616 |
PerkinElmer, Inc.
| | 552,915 | | 47,091,771 |
Thermo Fisher Scientific, Inc.
| | 1,993,746 | | 580,718,397 |
Waters Corp. (a)
| | 332,314 | | 74,182,454 |
| | | | | | 1,264,640,163 |
| PHARMACEUTICALS — 31.7% | | | |
Allergan PLC
| | 1,632,975 | | 274,813,363 |
Bristol-Myers Squibb Co.
| | 8,153,376 | | 413,457,697 |
Eli Lilly & Co.
| | 4,229,321 | | 472,964,968 |
Johnson & Johnson
| | 13,137,821 | | 1,699,771,281 |
Merck & Co., Inc.
| | 12,745,655 | | 1,072,929,238 |
Mylan NV (a)
| | 2,563,398 | | 50,704,013 |
Nektar Therapeutics (a) (b)
| | 863,811 | | 15,734,317 |
Perrigo Co. PLC (b)
| | 677,287 | | 37,853,570 |
Pfizer, Inc.
| | 27,533,739 | | 989,287,242 |
Zoetis, Inc.
| | 2,377,275 | | 296,184,692 |
| | | | | | 5,323,700,381 |
TOTAL COMMON STOCKS
(Cost $18,869,657,154)
| | | | | 16,792,855,752 |
| SHORT-TERM INVESTMENTS — 0.2% | | | |
State Street Institutional Liquid Reserves Fund, Premier Class 2.03% (c) (d)
| | 12,480,331 | | 12,481,579 |
State Street Navigator Securities Lending Portfolio II (e) (f)
| | 28,805,353 | | 28,805,353 |
TOTAL SHORT-TERM INVESTMENTS
(Cost $41,286,521)
| | 41,286,932 | |
TOTAL INVESTMENTS — 100.1%
(Cost $18,910,943,675)
| | 16,834,142,684 | |
LIABILITIES IN EXCESS OF OTHER ASSETS — (0.1)%
| | (15,425,706) | |
NET ASSETS — 100.0%
| | $16,818,716,978 | |
See accompanying notes to financial statements.
45
THE HEALTH CARE SELECT SECTOR SPDR FUND
SCHEDULE OF INVESTMENTS (continued)
September 30, 2019
| (a) | Non-income producing security. |
| (b) | All or a portion of the shares of the security are on loan at September 30, 2019. |
| (c) | The Fund invested in certain money market funds managed by SSGA Funds Management, Inc. Amounts related to these transactions during the period ended September 30, 2019 are shown in the Affiliate Table below. |
| (d) | The rate shown is the annualized seven-day yield at September 30, 2019. |
| (e) | The Fund invested in an affiliated entity. Amounts related to these transactions during the period ended September 30, 2019 are shown in the Affiliate Table below. |
| (f) | Investment of cash collateral for securities loaned. |
The following table summarizes the value of the Fund's investments according to the fair value hierarchy as of September 30, 2019.
| Description | | Level 1 –
Quoted Prices | | Level 2 –
Other Significant
Observable Inputs | | Level 3 –
Significant
Unobservable Inputs | | Total |
| ASSETS: | | | | | | | | |
| INVESTMENTS: | | | | | | | | |
Common Stocks
| | $16,792,855,752 | | $— | | $— | | $16,792,855,752 |
Short-Term Investments
| | 41,286,932 | | — | | — | | 41,286,932 |
TOTAL INVESTMENTS
| | $16,834,142,684 | | $— | | $— | | $16,834,142,684 |
Affiliate Table
| | Number of
Shares Held
at
9/30/18 | | Value at
9/30/18 | | Cost of
Purchases | | Proceeds
from
Shares Sold | | Realized
Gain (Loss) | | Change in
Unrealized
Appreciation/
Depreciation | | Number of
Shares Held
at
9/30/19 | | Value at
9/30/19 | | Dividend
Income |
State Street Institutional Liquid Reserves Fund, Premier Class
| — | | $— | | $119,119,595 | | $106,638,428 | | $1 | | $411 | | 12,480,331 | | $12,481,579 | | $97,187 |
State Street Institutional U.S. Government Money Market Fund, Class G Shares
| 8,912,798 | | 8,912,798 | | 702,794,599 | | 711,707,397 | | — | | — | | — | | — | | 702,788 |
State Street Navigator Securities Lending Portfolio II
| — | | — | | 1,842,023,921 | | 1,813,218,568 | | — | | — | | 28,805,353 | | 28,805,353 | | 2,579,474 |
Total
| | | $8,912,798 | | $2,663,938,115 | | $2,631,564,393 | | $1 | | $411 | | | | $41,286,932 | | $3,379,449 |
See accompanying notes to financial statements.
46
THE INDUSTRIAL SELECT SECTOR SPDR FUND
SCHEDULE OF INVESTMENTS
September 30, 2019
| Security Description | | | Shares | | Value |
| COMMON STOCKS — 99.9% | | | | | |
| AEROSPACE & DEFENSE — 29.0% | | | |
Arconic, Inc.
| | 1,642,707 | | $42,710,382 |
Boeing Co.
| | 2,266,538 | | 862,349,713 |
General Dynamics Corp.
| | 992,712 | | 181,398,264 |
Huntington Ingalls Industries, Inc.
| | 175,299 | | 37,126,575 |
L3Harris Technologies, Inc.
| | 946,725 | | 197,524,704 |
Lockheed Martin Corp.
| | 1,053,642 | | 410,983,599 |
Northrop Grumman Corp.
| | 667,384 | | 250,128,849 |
Raytheon Co.
| | 1,180,902 | | 231,681,163 |
Textron, Inc.
| | 975,841 | | 47,777,175 |
TransDigm Group, Inc.
| | 210,504 | | 109,603,118 |
United Technologies Corp.
| | 3,439,433 | | 469,551,393 |
| | | | | | 2,840,834,935 |
| AIR FREIGHT & LOGISTICS — 6.2% | | | |
C.H. Robinson Worldwide, Inc. (a)
| | 576,016 | | 48,834,636 |
Expeditors International of Washington, Inc.
| | 725,653 | | 53,908,761 |
FedEx Corp.
| | 1,017,675 | | 148,142,950 |
United Parcel Service, Inc. Class B
| | 2,961,102 | | 354,799,242 |
| | | | | | 605,685,589 |
| AIRLINES — 4.2% | | | |
Alaska Air Group, Inc.
| | 524,243 | | 34,028,613 |
American Airlines Group, Inc. (a)
| | 1,680,341 | | 45,318,797 |
Delta Air Lines, Inc.
| | 2,454,006 | | 141,350,745 |
Southwest Airlines Co.
| | 2,051,338 | | 110,792,765 |
United Airlines Holdings, Inc. (b)
| | 934,921 | | 82,656,366 |
| | | | | | 414,147,286 |
| BUILDING PRODUCTS — 3.1% | | | |
Allegion PLC
| | 396,197 | | 41,065,819 |
AO Smith Corp.
| | 586,688 | | 27,990,884 |
Fortune Brands Home & Security, Inc.
| | 593,245 | | 32,450,502 |
Johnson Controls International PLC
| | 3,373,953 | | 148,082,797 |
Masco Corp.
| | 1,227,412 | | 51,158,532 |
| | | | | | 300,748,534 |
| COMMERCIAL SERVICES & SUPPLIES — 4.6% | | | |
Cintas Corp.
| | 352,048 | | 94,384,069 |
Copart, Inc. (b)
| | 852,791 | | 68,504,701 |
Republic Services, Inc.
| | 897,699 | | 77,695,849 |
Rollins, Inc. (a)
| | 597,262 | | 20,348,716 |
Waste Management, Inc.
| | 1,654,951 | | 190,319,365 |
| | | | | | 451,252,700 |
| CONSTRUCTION & ENGINEERING — 0.8% | | | |
Jacobs Engineering Group, Inc.
| | 574,159 | | 52,535,549 |
Quanta Services, Inc.
| | 603,153 | | 22,799,183 |
| | | | | | 75,334,732 |
| ELECTRICAL EQUIPMENT — 5.0% | | | |
AMETEK, Inc.
| | 968,265 | | 88,906,092 |
Eaton Corp. PLC
| | 1,780,992 | | 148,089,485 |
| Security Description | | | Shares | | Value |
Emerson Electric Co.
| | 2,608,151 | | $174,380,976 |
Rockwell Automation, Inc.
| | 496,162 | | 81,767,498 |
| | | | | | 493,144,051 |
| INDUSTRIAL CONGLOMERATES — 14.3% | | | |
3M Co.
| | 2,438,310 | | 400,858,164 |
General Electric Co.
| | 37,004,709 | | 330,822,098 |
Honeywell International, Inc.
| | 3,050,969 | | 516,223,955 |
Roper Technologies, Inc.
| | 441,013 | | 157,265,236 |
| | | | | | 1,405,169,453 |
| MACHINERY — 16.9% | | | |
Caterpillar, Inc.
| | 2,385,611 | | 301,326,525 |
Cummins, Inc.
| | 668,802 | | 108,794,021 |
Deere & Co.
| | 1,335,210 | | 225,223,223 |
Dover Corp.
| | 616,700 | | 61,398,652 |
Flowserve Corp.
| | 556,584 | | 25,998,039 |
Fortive Corp.
| | 1,252,008 | | 85,837,669 |
IDEX Corp.
| | 321,560 | | 52,697,253 |
Illinois Tool Works, Inc.
| | 1,248,298 | | 195,346,154 |
Ingersoll-Rand PLC
| | 1,024,381 | | 126,213,983 |
PACCAR, Inc.
| | 1,468,724 | | 102,825,367 |
Parker-Hannifin Corp.
| | 544,634 | | 98,366,347 |
Pentair PLC
| | 712,386 | | 26,928,191 |
Snap-on, Inc.
| | 235,036 | | 36,792,535 |
Stanley Black & Decker, Inc.
| | 643,471 | | 92,923,647 |
Wabtec Corp. (a)
| | 772,177 | | 55,488,639 |
Xylem, Inc.
| | 761,067 | | 60,596,155 |
| | | | | | 1,656,756,400 |
| PROFESSIONAL SERVICES — 3.6% | | | |
Equifax, Inc.
| | 512,631 | | 72,111,803 |
IHS Markit, Ltd. (b)
| | 1,700,157 | | 113,706,500 |
Nielsen Holdings PLC
| | 1,509,006 | | 32,066,377 |
Robert Half International, Inc.
| | 498,491 | | 27,746,009 |
Verisk Analytics, Inc.
| | 692,283 | | 109,477,634 |
| | | | | | 355,108,323 |
| ROAD & RAIL — 10.4% | | | |
CSX Corp.
| | 3,383,964 | | 234,407,186 |
JB Hunt Transport Services, Inc. (a)
| | 362,157 | | 40,072,672 |
Kansas City Southern
| | 425,479 | | 56,592,962 |
Norfolk Southern Corp.
| | 1,116,972 | | 200,675,190 |
Union Pacific Corp.
| | 2,987,444 | | 483,906,179 |
| | | | | | 1,015,654,189 |
| TRADING COMPANIES & DISTRIBUTORS — 1.8% | | | |
Fastenal Co. (a)
| | 2,431,497 | | 79,437,007 |
United Rentals, Inc. (b)
| | 327,215 | | 40,784,078 |
W.W. Grainger, Inc.
| | 187,484 | | 55,710,870 |
| | | | | | 175,931,955 |
TOTAL COMMON STOCKS
(Cost $11,002,040,794)
| | | | | 9,789,768,147 |
See accompanying notes to financial statements.
47
THE INDUSTRIAL SELECT SECTOR SPDR FUND
SCHEDULE OF INVESTMENTS (continued)
September 30, 2019
| Security Description | | | Shares | | Value |
| SHORT-TERM INVESTMENTS — 0.6% | | | |
State Street Institutional Liquid Reserves Fund, Premier Class 2.03% (c) (d)
| | 6,868,611 | | $6,869,298 |
State Street Navigator Securities Lending Portfolio II (e) (f)
| | 57,921,882 | | 57,921,882 |
TOTAL SHORT-TERM INVESTMENTS
(Cost $64,791,163)
| | 64,791,180 | |
TOTAL INVESTMENTS — 100.5%
(Cost $11,066,831,957)
| | 9,854,559,327 | |
LIABILITIES IN EXCESS OF OTHER ASSETS — (0.5)%
| | (52,190,885) | |
NET ASSETS — 100.0%
| | $9,802,368,442 | |
| (a) | All or a portion of the shares of the security are on loan at September 30, 2019. |
| (b) | Non-income producing security. |
| (c) | The Fund invested in certain money market funds managed by SSGA Funds Management, Inc. Amounts related to these transactions during the period ended September 30, 2019 are shown in the Affiliate Table below. |
| (d) | The rate shown is the annualized seven-day yield at September 30, 2019. |
| (e) | The Fund invested in an affiliated entity. Amounts related to these transactions during the period ended September 30, 2019 are shown in the Affiliate Table below. |
| (f) | Investment of cash collateral for securities loaned. |
The following table summarizes the value of the Fund's investments according to the fair value hierarchy as of September 30, 2019.
| Description | | Level 1 –
Quoted Prices | | Level 2 –
Other Significant
Observable Inputs | | Level 3 –
Significant
Unobservable Inputs | | Total |
| ASSETS: | | | | | | | | |
| INVESTMENTS: | | | | | | | | |
Common Stocks
| | $9,789,768,147 | | $— | | $— | | $9,789,768,147 |
Short-Term Investments
| | 64,791,180 | | — | | — | | 64,791,180 |
TOTAL INVESTMENTS
| | $9,854,559,327 | | $— | | $— | | $9,854,559,327 |
Affiliate Table
| | Number of
Shares Held
at
9/30/18 | | Value at
9/30/18 | | Cost of
Purchases | | Proceeds
from
Shares Sold | | Realized
Gain (Loss) | | Change in
Unrealized
Appreciation/
Depreciation | | Number of
Shares Held
at
9/30/19 | | Value at
9/30/19 | | Dividend
Income |
State Street Institutional Liquid Reserves Fund, Premier Class
| — | | $— | | $76,268,144 | | $69,398,568 | | $(295) | | $17 | | 6,868,611 | | $6,869,298 | | $40,339 |
State Street Institutional U.S. Government Money Market Fund, Class G Shares
| 17,453,498 | | 17,453,498 | | 473,310,081 | | 490,763,579 | | — | | — | | — | | — | | 364,168 |
State Street Navigator Securities Lending Government Money Market Portfolio
| 118,858,872 | | 118,858,872 | | 7,835 | | 118,866,707 | | — | | — | | — | | — | | 1,172 |
State Street Navigator Securities Lending Portfolio II
| — | | — | | 893,053,433 | | 835,131,551 | | — | | — | | 57,921,882 | | 57,921,882 | | 125,508 |
Total
| | | $136,312,370 | | $1,442,639,493 | | $1,514,160,405 | | $(295) | | $17 | | | | $64,791,180 | | $531,187 |
See accompanying notes to financial statements.
48
THE MATERIALS SELECT SECTOR SPDR FUND
SCHEDULE OF INVESTMENTS
September 30, 2019
| Security Description | | | Shares | | Value |
| COMMON STOCKS — 99.8% | | | | | |
| CHEMICALS — 71.5% | | | |
Air Products & Chemicals, Inc.
| | 1,372,394 | | $304,479,333 |
Albemarle Corp. (a)
| | 675,469 | | 46,958,605 |
Celanese Corp.
| | 788,598 | | 96,437,649 |
CF Industries Holdings, Inc.
| | 1,391,517 | | 68,462,636 |
Corteva, Inc.
| | 4,772,928 | | 133,641,984 |
Dow, Inc.
| | 3,976,459 | | 189,478,271 |
DuPont de Nemours, Inc.
| | 4,642,970 | | 331,090,191 |
Eastman Chemical Co.
| | 873,090 | | 64,460,235 |
Ecolab, Inc.
| | 1,559,143 | | 308,772,680 |
FMC Corp.
| | 831,326 | | 72,890,664 |
International Flavors & Fragrances, Inc. (a)
| | 680,541 | | 83,495,575 |
Linde PLC
| | 3,366,889 | | 652,233,737 |
LyondellBasell Industries NV Class A
| | 1,645,194 | | 147,195,507 |
Mosaic Co.
| | 2,262,558 | | 46,382,439 |
PPG Industries, Inc.
| | 1,505,958 | | 178,471,082 |
Sherwin-Williams Co.
| | 511,410 | | 281,209,017 |
| | | | | | 3,005,659,605 |
| CONSTRUCTION MATERIALS — 5.6% | | | |
Martin Marietta Materials, Inc.
| | 397,984 | | 109,087,414 |
Vulcan Materials Co.
| | 843,123 | | 127,513,923 |
| | | | | | 236,601,337 |
| CONTAINERS & PACKAGING — 13.9% | | | |
Amcor PLC
| | 10,353,606 | | 100,947,658 |
Avery Dennison Corp.
| | 536,561 | | 60,937,233 |
Ball Corp.
| | 2,115,948 | | 154,062,174 |
International Paper Co.
| | 2,503,721 | | 104,705,612 |
Packaging Corp. of America
| | 603,310 | | 64,011,191 |
Sealed Air Corp.
| | 984,892 | | 40,882,867 |
Westrock Co.
| | 1,640,088 | | 59,781,208 |
| | | | | | 585,327,943 |
| Security Description | | | Shares | | Value |
| METALS & MINING — 8.8% | | | |
Freeport-McMoRan, Inc.
| | 9,247,128 | | $88,495,015 |
Newmont Goldcorp Corp.
| | 4,771,495 | | 180,935,091 |
Nucor Corp.
| | 1,932,087 | | 98,362,549 |
| | | | | | 367,792,655 |
TOTAL COMMON STOCKS
(Cost $4,622,320,510)
| | | | | 4,195,381,540 |
| SHORT-TERM INVESTMENTS — 1.8% | | | |
State Street Institutional Liquid Reserves Fund, Premier Class 2.03% (b) (c)
| | 1,045,819 | | 1,045,923 |
State Street Navigator Securities Lending Portfolio II (d) (e)
| | 72,906,398 | | 72,906,398 |
TOTAL SHORT-TERM INVESTMENTS
(Cost $73,952,321)
| | 73,952,321 | |
TOTAL INVESTMENTS — 101.6%
(Cost $4,696,272,831)
| | 4,269,333,861 | |
LIABILITIES IN EXCESS OF OTHER ASSETS — (1.6)%
| | (67,860,535) | |
NET ASSETS — 100.0%
| | $4,201,473,326 | |
| (a) | All or a portion of the shares of the security are on loan at September 30, 2019. |
| (b) | The Fund invested in certain money market funds managed by SSGA Funds Management, Inc. Amounts related to these transactions during the period ended September 30, 2019 are shown in the Affiliate Table below. |
| (c) | The rate shown is the annualized seven-day yield at September 30, 2019. |
| (d) | The Fund invested in an affiliated entity. Amounts related to these transactions during the period ended September 30, 2019 are shown in the Affiliate Table below. |
| (e) | Investment of cash collateral for securities loaned. |
The following table summarizes the value of the Fund's investments according to the fair value hierarchy as of September 30, 2019.
| Description | | Level 1 –
Quoted Prices | | Level 2 –
Other Significant
Observable Inputs | | Level 3 –
Significant
Unobservable Inputs | | Total |
| ASSETS: | | | | | | | | |
| INVESTMENTS: | | | | | | | | |
Common Stocks
| | $4,195,381,540 | | $— | | $— | | $4,195,381,540 |
Short-Term Investments
| | 73,952,321 | | — | | — | | 73,952,321 |
TOTAL INVESTMENTS
| | $4,269,333,861 | | $— | | $— | | $4,269,333,861 |
See accompanying notes to financial statements.
49
THE MATERIALS SELECT SECTOR SPDR FUND
SCHEDULE OF INVESTMENTS (continued)
September 30, 2019
Affiliate Table
| | Number of
Shares Held
at
9/30/18 | | Value at
9/30/18 | | Cost of
Purchases | | Proceeds
from
Shares Sold | | Realized
Gain (Loss) | | Change in
Unrealized
Appreciation/
Depreciation | | Number of
Shares Held
at
9/30/19 | | Value at
9/30/19 | | Dividend
Income |
State Street Institutional Liquid Reserves Fund, Premier Class
| — | | $— | | $31,369,742 | | $30,323,819 | | $— | | $— | | 1,045,819 | | $1,045,923 | | $21,922 |
State Street Institutional U.S. Government Money Market Fund, Class G Shares
| 2,380,802 | | 2,380,802 | | 137,636,501 | | 140,017,303 | | — | | — | | — | | — | | 135,567 |
State Street Navigator Securities Lending Portfolio II
| — | | — | | 503,609,946 | | 430,703,548 | | — | | — | | 72,906,398 | | 72,906,398 | | 122,974 |
Total
| | | $2,380,802 | | $672,616,189 | | $601,044,670 | | $— | | $— | | | | $73,952,321 | | $280,463 |
See accompanying notes to financial statements.
50
THE REAL ESTATE SELECT SECTOR SPDR FUND
SCHEDULE OF INVESTMENTS
September 30, 2019
| Security Description | | | Shares | | Value |
| COMMON STOCKS — 99.8% | | | | | |
| EQUITY REAL ESTATE INVESTMENT TRUSTS (REITS) — 97.5% | | | |
Alexandria Real Estate Equities, Inc. REIT (a)
| | 552,255 | | $85,069,360 |
American Tower Corp. REIT
| | 2,155,326 | | 476,607,238 |
Apartment Investment & Management Co. Class A REIT
| | 724,883 | | 37,795,400 |
AvalonBay Communities, Inc. REIT
| | 679,942 | | 146,411,911 |
Boston Properties, Inc. REIT
| | 699,871 | | 90,745,274 |
Crown Castle International Corp. REIT
| | 2,024,288 | | 281,396,275 |
Digital Realty Trust, Inc. REIT
| | 1,014,365 | | 131,674,721 |
Duke Realty Corp. REIT
| | 1,759,821 | | 59,781,119 |
Equinix, Inc. REIT
| | 413,040 | | 238,241,472 |
Equity Residential REIT
| | 1,697,294 | | 146,408,580 |
Essex Property Trust, Inc. REIT
| | 320,051 | | 104,544,659 |
Extra Space Storage, Inc. REIT
| | 625,754 | | 73,100,582 |
Federal Realty Investment Trust REIT
| | 338,779 | | 46,121,373 |
HCP, Inc. REIT
| | 2,391,147 | | 85,196,568 |
Host Hotels & Resorts, Inc. REIT
| | 3,553,795 | | 61,445,116 |
Iron Mountain, Inc. REIT (a)
| | 1,395,377 | | 45,196,261 |
Kimco Realty Corp. REIT
| | 2,055,109 | | 42,910,676 |
Macerich Co. REIT (a)
| | 535,568 | | 16,918,593 |
Mid-America Apartment Communities, Inc. REIT
| | 555,279 | | 72,191,823 |
Prologis, Inc. REIT
| | 3,072,916 | | 261,873,901 |
Public Storage REIT
| | 731,041 | | 179,302,426 |
Realty Income Corp. REIT
| | 1,549,401 | | 118,808,069 |
Regency Centers Corp. REIT
| | 815,838 | | 56,692,583 |
SBA Communications Corp. REIT
| | 550,729 | | 132,808,298 |
Simon Property Group, Inc. REIT
| | 1,499,725 | | 233,432,196 |
SL Green Realty Corp. REIT
| | 400,564 | | 32,746,107 |
UDR, Inc. REIT
| | 1,425,752 | | 69,120,457 |
Ventas, Inc. REIT
| | 1,814,038 | | 132,479,195 |
Vornado Realty Trust REIT
| | 769,755 | | 49,010,301 |
| Security Description | | | Shares | | Value |
Welltower, Inc. REIT
| | 1,973,148 | | $178,865,866 |
Weyerhaeuser Co. REIT
| | 3,626,961 | | 100,466,820 |
| | | | | | 3,787,363,220 |
| REAL ESTATE MANAGEMENT & DEVELOPMENT — 2.3% | | | |
CBRE Group, Inc. Class A (b)
| | 1,637,634 | | 86,810,978 |
TOTAL COMMON STOCKS
(Cost $3,692,998,302)
| | | | | 3,874,174,198 |
| SHORT-TERM INVESTMENTS — 0.6% | | | |
State Street Institutional Liquid Reserves Fund, Premier Class 2.03% (c) (d)
| | 7,560,491 | | 7,561,247 |
State Street Navigator Securities Lending Portfolio II (e) (f)
| | 16,954,517 | | 16,954,517 |
TOTAL SHORT-TERM INVESTMENTS
(Cost $24,515,616)
| | 24,515,764 | |
TOTAL INVESTMENTS — 100.4%
(Cost $3,717,513,918)
| | 3,898,689,962 | |
LIABILITIES IN EXCESS OF OTHER ASSETS — (0.4)%
| | (14,416,520) | |
NET ASSETS — 100.0%
| | $3,884,273,442 | |
| (a) | All or a portion of the shares of the security are on loan at September 30, 2019. |
| (b) | Non-income producing security. |
| (c) | The Fund invested in certain money market funds managed by SSGA Funds Management, Inc. Amounts related to these transactions during the period ended September 30, 2019 are shown in the Affiliate Table below. |
| (d) | The rate shown is the annualized seven-day yield at September 30, 2019. |
| (e) | The Fund invested in an affiliated entity. Amounts related to these transactions during the period ended September 30, 2019 are shown in the Affiliate Table below. |
| (f) | Investment of cash collateral for securities loaned. |
| REIT | Real Estate Investment Trust |
The following table summarizes the value of the Fund's investments according to the fair value hierarchy as of September 30, 2019.
| Description | | Level 1 –
Quoted Prices | | Level 2 –
Other Significant
Observable Inputs | | Level 3 –
Significant
Unobservable Inputs | | Total |
| ASSETS: | | | | | | | | |
| INVESTMENTS: | | | | | | | | |
Common Stocks
| | $3,874,174,198 | | $— | | $— | | $3,874,174,198 |
Short-Term Investments
| | 24,515,764 | | — | | — | | 24,515,764 |
TOTAL INVESTMENTS
| | $3,898,689,962 | | $— | | $— | | $3,898,689,962 |
See accompanying notes to financial statements.
51
THE REAL ESTATE SELECT SECTOR SPDR FUND
SCHEDULE OF INVESTMENTS (continued)
September 30, 2019
Affiliate Table
| | Number of
Shares Held
at
9/30/18 | | Value at
9/30/18 | | Cost of
Purchases | | Proceeds
from
Shares Sold | | Realized
Gain (Loss) | | Change in
Unrealized
Appreciation/
Depreciation | | Number of
Shares Held
at
9/30/19 | | Value at
9/30/19 | | Dividend
Income |
State Street Institutional Liquid Reserves Fund, Premier Class
| — | | $— | | $42,229,265 | | $34,668,287 | | $121 | | $148 | | 7,560,491 | | $7,561,247 | | $8,544 |
State Street Institutional U.S. Government Money Market Fund, Class G Shares
| 6,227,878 | | 6,227,878 | | 142,535,086 | | 148,762,964 | | — | | — | | — | | — | | 47,228 |
State Street Navigator Securities Lending Portfolio II
| — | | — | | 180,698,216 | | 163,743,699 | | — | | — | | 16,954,517 | | 16,954,517 | | 8,774 |
Total
| | | $6,227,878 | | $365,462,567 | | $347,174,950 | | $121 | | $148 | | | | $24,515,764 | | $64,546 |
See accompanying notes to financial statements.
52
THE TECHNOLOGY SELECT SECTOR SPDR FUND
SCHEDULE OF INVESTMENTS
September 30, 2019
| Security Description | | | Shares | | Value |
| COMMON STOCKS — 99.8% | | | | | |
| COMMUNICATIONS EQUIPMENT — 4.9% | | | |
Arista Networks, Inc. (a) (b)
| | 224,684 | | $53,681,501 |
Cisco Systems, Inc.
| | 17,523,725 | | 865,847,252 |
F5 Networks, Inc. (a)
| | 247,455 | | 34,747,631 |
Juniper Networks, Inc.
| | 1,425,282 | | 35,275,730 |
Motorola Solutions, Inc.
| | 682,112 | | 116,238,706 |
| | | | | | 1,105,790,820 |
| ELECTRONIC EQUIPMENT, INSTRUMENTS & COMPONENTS — 2.4% | | | |
Amphenol Corp. Class A
| | 1,227,808 | | 118,483,472 |
CDW Corp.
| | 597,427 | | 73,626,904 |
Corning, Inc.
| | 3,223,270 | | 91,927,660 |
FLIR Systems, Inc.
| | 561,438 | | 29,526,024 |
IPG Photonics Corp. (a) (b)
| | 147,397 | | 19,987,033 |
Keysight Technologies, Inc. (a)
| | 774,263 | | 75,297,077 |
TE Connectivity, Ltd.
| | 1,386,654 | | 129,208,420 |
| | | | | | 538,056,590 |
| IT SERVICES — 25.1% | | | |
Accenture PLC Class A
| | 2,630,037 | | 505,887,617 |
Akamai Technologies, Inc. (a)
| | 679,362 | | 62,080,100 |
Alliance Data Systems Corp.
| | 169,180 | | 21,677,033 |
Automatic Data Processing, Inc.
| | 1,791,289 | | 289,149,870 |
Broadridge Financial Solutions, Inc.
| | 471,773 | | 58,702,714 |
Cognizant Technology Solutions Corp. Class A
| | 2,279,770 | | 137,390,339 |
DXC Technology Co.
| | 1,081,284 | | 31,897,878 |
Fidelity National Information Services, Inc.
| | 2,532,109 | | 336,162,791 |
Fiserv, Inc. (a)
| | 2,356,254 | | 244,084,352 |
FleetCor Technologies, Inc. (a)
| | 356,833 | | 102,332,568 |
Gartner, Inc. (a) (b)
| | 372,957 | | 53,329,122 |
Global Payments, Inc.
| | 1,238,510 | | 196,923,090 |
International Business Machines Corp.
| | 3,656,676 | | 531,753,824 |
Jack Henry & Associates, Inc.
| | 317,835 | | 46,394,375 |
Leidos Holdings, Inc.
| | 558,008 | | 47,921,727 |
Mastercard, Inc. Class A
| | 3,685,183 | | 1,000,785,147 |
Paychex, Inc.
| | 1,320,117 | | 109,266,084 |
PayPal Holdings, Inc. (a)
| | 4,857,091 | | 503,146,057 |
VeriSign, Inc. (a)
| | 430,054 | | 81,121,086 |
Visa, Inc. Class A (b)
| | 7,128,595 | | 1,226,189,626 |
Western Union Co. (b)
| | 1,749,766 | | 40,542,078 |
| | | | | | 5,626,737,478 |
| SEMICONDUCTORS & SEMICONDUCTOR EQUIPMENT — 17.8% | | | |
Advanced Micro Devices, Inc. (a) (b)
| | 4,480,906 | | 129,901,465 |
Analog Devices, Inc.
| | 1,524,818 | | 170,367,915 |
Applied Materials, Inc.
| | 3,813,074 | | 190,272,393 |
Broadcom, Inc.
| | 1,643,163 | | 453,628,009 |
Intel Corp.
| | 18,286,209 | | 942,288,350 |
KLA Corp.
| | 657,435 | | 104,828,011 |
| Security Description | | | Shares | | Value |
Lam Research Corp.
| | 596,603 | | $137,880,919 |
Maxim Integrated Products, Inc.
| | 1,119,793 | | 64,847,213 |
Microchip Technology, Inc. (b)
| | 984,848 | | 91,502,228 |
Micron Technology, Inc. (a)
| | 4,556,309 | | 195,237,841 |
NVIDIA Corp.
| | 2,513,851 | | 437,586,043 |
Qorvo, Inc. (a)
| | 486,184 | | 36,045,682 |
QUALCOMM, Inc.
| | 5,018,015 | | 382,774,184 |
Skyworks Solutions, Inc.
| | 708,729 | | 56,166,773 |
Texas Instruments, Inc.
| | 3,853,894 | | 498,077,260 |
Xilinx, Inc.
| | 1,042,717 | | 99,996,560 |
| | | | | | 3,991,400,846 |
| SOFTWARE — 30.3% | | | |
Adobe, Inc. (a)
| | 2,003,735 | | 553,531,794 |
ANSYS, Inc. (a)
| | 347,456 | | 76,912,860 |
Autodesk, Inc. (a)
| | 906,441 | | 133,881,336 |
Cadence Design Systems, Inc. (a)
| | 1,156,470 | | 76,419,537 |
Citrix Systems, Inc.
| | 507,969 | | 49,029,168 |
Fortinet, Inc. (a)
| | 585,888 | | 44,972,763 |
Intuit, Inc.
| | 1,073,096 | | 285,379,150 |
Microsoft Corp.
| | 31,517,432 | | 4,381,868,571 |
Oracle Corp.
| | 9,087,921 | | 500,108,293 |
salesforce.com, Inc. (a)
| | 3,620,067 | | 537,362,745 |
Symantec Corp.
| | 2,347,027 | | 55,460,248 |
Synopsys, Inc. (a)
| | 620,500 | | 85,163,625 |
| | | | | | 6,780,090,090 |
| TECHNOLOGY HARDWARE, STORAGE & PERIPHERALS — 19.3% | | | |
Apple, Inc.
| | 17,535,114 | | 3,927,339,483 |
Hewlett Packard Enterprise Co.
| | 5,389,201 | | 81,754,179 |
HP, Inc.
| | 6,117,006 | | 115,733,754 |
NetApp, Inc.
| | 982,006 | | 51,565,135 |
Seagate Technology PLC (b)
| | 977,304 | | 52,569,182 |
Western Digital Corp.
| | 1,221,805 | | 72,868,450 |
Xerox Holdings Corp.
| | 785,521 | | 23,494,933 |
| | | | | | 4,325,325,116 |
TOTAL COMMON STOCKS
(Cost $21,153,602,634)
| | | | | 22,367,400,940 |
| SHORT-TERM INVESTMENTS — 0.8% | | | |
State Street Institutional Liquid Reserves Fund, Premier Class 2.03% (c) (d)
| | 44,116,854 | | 44,121,266 |
State Street Navigator Securities Lending Portfolio II (e) (f)
| | 130,802,180 | | 130,802,180 |
TOTAL SHORT-TERM INVESTMENTS
(Cost $174,923,310)
| | 174,923,446 | |
TOTAL INVESTMENTS — 100.6%
(Cost $21,328,525,944)
| | 22,542,324,386 | |
LIABILITIES IN EXCESS OF OTHER ASSETS — (0.6)%
| | (125,164,492) | |
NET ASSETS — 100.0%
| | $22,417,159,894 | |
See accompanying notes to financial statements.
53
THE TECHNOLOGY SELECT SECTOR SPDR FUND
SCHEDULE OF INVESTMENTS (continued)
September 30, 2019
| (a) | Non-income producing security. |
| (b) | All or a portion of the shares of the security are on loan at September 30, 2019. |
| (c) | The Fund invested in certain money market funds managed by SSGA Funds Management, Inc. Amounts related to these transactions during the period ended September 30, 2019 are shown in the Affiliate Table below. |
| (d) | The rate shown is the annualized seven-day yield at September 30, 2019. |
| (e) | The Fund invested in an affiliated entity. Amounts related to these transactions during the period ended September 30, 2019 are shown in the Affiliate Table below. |
| (f) | Investment of cash collateral for securities loaned. |
The following table summarizes the value of the Fund's investments according to the fair value hierarchy as of September 30, 2019.
| Description | | Level 1 –
Quoted Prices | | Level 2 –
Other Significant
Observable Inputs | | Level 3 –
Significant
Unobservable Inputs | | Total |
| ASSETS: | | | | | | | | |
| INVESTMENTS: | | | | | | | | |
Common Stocks
| | $22,367,400,940 | | $— | | $— | | $22,367,400,940 |
Short-Term Investments
| | 174,923,446 | | — | | — | | 174,923,446 |
TOTAL INVESTMENTS
| | $22,542,324,386 | | $— | | $— | | $22,542,324,386 |
Affiliate Table
| | Number of
Shares Held
at
9/30/18 | | Value at
9/30/18 | | Cost of
Purchases | | Proceeds
from
Shares Sold | | Realized
Gain (Loss) | | Change in
Unrealized
Appreciation/
Depreciation | | Number of
Shares Held
at
9/30/19 | | Value at
9/30/19 | | Dividend
Income |
State Street Institutional Liquid Reserves Fund, Premier Class
| — | | $— | | $147,125,319 | | $103,004,109 | | $(80) | | $136 | | 44,116,854 | | $44,121,266 | | $125,427 |
State Street Institutional U.S. Government Money Market Fund, Class G Shares
| 16,254,753 | | 16,254,753 | | 582,120,408 | | 598,375,161 | | — | | — | | — | | — | | 677,051 |
State Street Navigator Securities Lending Government Money Market Portfolio
| 12,356,093 | | 12,356,093 | | 33,304,886 | | 45,660,979 | | — | | — | | — | | — | | 5,493 |
State Street Navigator Securities Lending Portfolio II
| — | | — | | 1,489,308,755 | | 1,358,506,575 | | — | | — | | 130,802,180 | | 130,802,180 | | 246,772 |
Total
| | | $28,610,846 | | $2,251,859,368 | | $2,105,546,824 | | $(80) | | $136 | | | | $174,923,446 | | $1,054,743 |
See accompanying notes to financial statements.
54
THE UTILITIES SELECT SECTOR SPDR FUND
SCHEDULE OF INVESTMENTS
September 30, 2019
| Security Description | | | Shares | | Value |
| COMMON STOCKS — 99.8% | | | | | |
| ELECTRIC UTILITIES — 61.0% | | | |
Alliant Energy Corp.
| | 3,019,083 | | $162,819,146 |
American Electric Power Co., Inc.
| | 6,276,508 | | 588,046,034 |
Duke Energy Corp.
| | 9,260,987 | | 887,758,214 |
Edison International
| | 4,551,562 | | 343,278,806 |
Entergy Corp.
| | 2,527,183 | | 296,590,197 |
Evergy, Inc. (a)
| | 2,992,955 | | 199,211,085 |
Eversource Energy
| | 4,113,235 | | 351,558,195 |
Exelon Corp.
| | 12,349,453 | | 596,602,074 |
FirstEnergy Corp. (a)
| | 6,863,559 | | 331,029,451 |
NextEra Energy, Inc.
| | 6,212,343 | | 1,447,413,796 |
Pinnacle West Capital Corp.
| | 1,427,472 | | 138,564,707 |
PPL Corp.
| | 9,180,218 | | 289,085,065 |
Southern Co.
| | 13,285,571 | | 820,649,721 |
Xcel Energy, Inc.
| | 6,665,056 | | 432,495,484 |
| | | | | | 6,885,101,975 |
| GAS UTILITIES — 1.5% | | | |
Atmos Energy Corp.
| | 1,502,445 | | 171,113,461 |
| INDEPENDENT POWER AND RENEWABLE ELECTRICITY PRODUCERS — 2.3% | | | |
AES Corp.
| | 8,437,922 | | 137,875,646 |
NRG Energy, Inc.
| | 3,215,667 | | 127,340,413 |
| | | | | | 265,216,059 |
| MULTI-UTILITIES — 32.5% | | | |
Ameren Corp.
| | 3,124,330 | | 250,102,617 |
CenterPoint Energy, Inc.
| | 6,383,450 | | 192,652,521 |
CMS Energy Corp.
| | 3,607,096 | | 230,673,789 |
Consolidated Edison, Inc.
| | 4,221,755 | | 398,829,195 |
Dominion Energy, Inc.
| | 10,447,086 | | 846,631,849 |
| Security Description | | | Shares | | Value |
DTE Energy Co.
| | 2,329,852 | | $309,777,122 |
NiSource, Inc.
| | 4,745,450 | | 141,983,864 |
Public Service Enterprise Group, Inc.
| | 6,426,929 | | 398,983,752 |
Sempra Energy
| | 3,489,690 | | 515,113,141 |
WEC Energy Group, Inc. (a)
| | 4,009,375 | | 381,291,562 |
| | | | | | 3,666,039,412 |
| WATER UTILITIES — 2.5% | | | |
American Water Works Co., Inc.
| | 2,296,213 | | 285,258,541 |
TOTAL COMMON STOCKS
(Cost $10,651,362,596)
| | | | | 11,272,729,448 |
| SHORT-TERM INVESTMENT — 0.1% | | | |
State Street Institutional Liquid Reserves Fund, Premier Class 2.03% (b) (c)
(Cost $8,628,860)
| | 8,627,998 | | 8,628,861 |
TOTAL INVESTMENTS — 99.9%
(Cost $10,659,991,456)
| | 11,281,358,309 | |
OTHER ASSETS IN EXCESS OF LIABILITIES — 0.1%
| | 15,124,799 | |
NET ASSETS — 100.0%
| | $11,296,483,108 | |
| (a) | All or a portion of the shares of the security are on loan at September 30, 2019. |
| (b) | The Fund invested in certain money market funds managed by SSGA Funds Management, Inc. Amounts related to these transactions during the period ended September 30, 2019 are shown in the Affiliate Table below. |
| (c) | The rate shown is the annualized seven-day yield at September 30, 2019. |
The following table summarizes the value of the Fund's investments according to the fair value hierarchy as of September 30, 2019.
| Description | | Level 1 –
Quoted Prices | | Level 2 –
Other Significant
Observable Inputs | | Level 3 –
Significant
Unobservable Inputs | | Total |
| ASSETS: | | | | | | | | |
| INVESTMENTS: | | | | | | | | |
Common Stocks
| | $11,272,729,448 | | $— | | $— | | $11,272,729,448 |
Short-Term Investment
| | 8,628,861 | | — | | — | | 8,628,861 |
TOTAL INVESTMENTS
| | $11,281,358,309 | | $— | | $— | | $11,281,358,309 |
See accompanying notes to financial statements.
55
THE UTILITIES SELECT SECTOR SPDR FUND
SCHEDULE OF INVESTMENTS (continued)
September 30, 2019
Affiliate Table
| | Number of
Shares Held
at
9/30/18 | | Value at
9/30/18 | | Cost of
Purchases | | Proceeds
from
Shares Sold | | Realized
Gain (Loss) | | Change in
Unrealized
Appreciation/
Depreciation | | Number of
Shares Held
at
9/30/19 | | Value at
9/30/19 | | Dividend
Income |
State Street Institutional Liquid Reserves Fund, Premier Class
| — | | $— | | $109,374,625 | | $100,745,706 | | $(59) | | $1 | | 8,627,998 | | $8,628,861 | | $90,737 |
State Street Institutional U.S. Government Money Market Fund, Class G Shares
| 8,502,091 | | 8,502,091 | | 506,691,884 | | 515,193,975 | | — | | — | | — | | — | | 385,484 |
State Street Navigator Securities Lending Portfolio II
| — | | — | | 1,262,811,583 | | 1,262,811,583 | | — | | — | | — | | — | | 128,121 |
Total
| | | $8,502,091 | | $1,878,878,092 | | $1,878,751,264 | | $(59) | | $1 | | | | $8,628,861 | | $604,342 |
See accompanying notes to financial statements.
56
[This Page Intentionally Left Blank]
THE SELECT SECTOR SPDR TRUST
STATEMENTS OF ASSETS AND LIABILITIES
September 30, 2019
| | The Communication Services Select Sector SPDR Fund | | The Consumer Discretionary Select Sector SPDR Fund | | The Consumer Staples Select Sector SPDR Fund |
| ASSETS | | | | | |
Investments in unaffiliated issuers, at value*
| $6,031,968,200 | | $13,916,575,924 | | $13,967,741,689 |
Investments in affiliated issuers, at value
| 8,907,943 | | 94,936,752 | | 122,078,772 |
Total Investments
| 6,040,876,143 | | 14,011,512,676 | | 14,089,820,461 |
Cash
| — | | — | | 9,895,002 |
Receivable for investments sold
| — | | — | | — |
Receivable for income related to Select Sector SPDR shares in-kind transactions
| 50,242 | | — | | — |
Dividends receivable — unaffiliated issuers
| 3,633,773 | | 4,519,371 | | 39,374,760 |
Dividends receivable — affiliated issuers
| 5,868 | | 46,838 | | 46,138 |
Securities lending income receivable — unaffiliated issuers
| 2,130 | | 22,066 | | 3,919 |
Securities lending income receivable — affiliated issuers
| 2,300 | | 27,688 | | 33,130 |
Other Receivable
| — | | — | | — |
Prepaid expenses and other assets
| 8,524 | | 25,937 | | 20,654 |
TOTAL ASSETS
| 6,044,578,980 | | 14,016,154,576 | | 14,139,194,064 |
| LIABILITIES | | | | | |
Due to custodian
| 55,237 | | 134,860 | | — |
Payable upon return of securities loaned
| 4,017,892 | | 84,833,593 | | 121,441,491 |
Payable for investments purchased
| — | | — | | — |
Payable for income related to Select Sector SPDR shares in-kind transactions
| — | | 26,185 | | 123,175 |
Advisory and Administration fees payable
| 184,658 | | 457,126 | | 434,336 |
Distribution fees payable
| 238,155 | | 591,029 | | 552,126 |
Unitary fees payable
| 19,063 | | 45,040 | | 67,920 |
Trustees’ fees and expenses payable
| — | | 1,028 | | 512 |
License fee payable
| 621,408 | | 1,436,907 | | 1,362,704 |
Professional fees payable
| 23,466 | | 41,558 | | 37,249 |
Printing and postage fees payable
| 13,502 | | 271,413 | | 168,582 |
Accrued expenses and other liabilities
| 2,655 | | 1,625 | | 1,898 |
TOTAL LIABILITIES
| 5,176,036 | | 87,840,364 | | 124,189,993 |
NET ASSETS
| $6,039,402,944 | | $13,928,314,212 | | $14,015,004,071 |
| NET ASSETS CONSIST OF: | | | | | |
Paid-in Capital
| $6,191,450,335 | | $15,253,320,119 | | $15,061,352,255 |
Total distributable earnings (loss)
| (152,047,391) | | (1,325,005,907) | | (1,046,348,184) |
NET ASSETS
| $6,039,402,944 | | $13,928,314,212 | | $14,015,004,071 |
| NET ASSET VALUE PER SHARE | | | | | |
Net asset value per share
| $49.50 | | $120.69 | | $61.41 |
Shares outstanding (unlimited amount authorized, $0.01 par value)
| 122,000,000 | | 115,403,252 | | 228,221,809 |
| COST OF INVESTMENTS: | | | | | |
Investments in unaffiliated issuers
| $6,122,341,603 | | $14,426,405,772 | | $14,256,824,646 |
Investments in affiliated issuers
| 8,907,943 | | 94,936,752 | | 122,078,772 |
Total cost of investments
| $6,131,249,546 | | $14,521,342,524 | | $14,378,903,418 |
* Includes investments in securities on loan, at value
| $31,799,686 | | $303,645,362 | | $166,477,122 |
See accompanying notes to financial statements.
58
| The Energy Select Sector SPDR Fund | | The Financial Select Sector SPDR Fund | | The Health Care Select Sector SPDR Fund | | The Industrial Select Sector SPDR Fund | | The Materials Select Sector SPDR Fund | | The Real Estate Select Sector SPDR Fund | | The Technology Select Sector SPDR Fund |
| | | | | | | | | | | | | |
| $9,988,421,914 | | $22,352,229,295 | | $16,792,855,752 | | $9,789,768,147 | | $4,195,381,540 | | $3,874,174,198 | | $22,367,400,940 |
| 17,858,057 | | 205,194,464 | | 41,286,932 | | 64,791,180 | | 73,952,321 | | 24,515,764 | | 174,923,446 |
| 10,006,279,971 | | 22,557,423,759 | | 16,834,142,684 | | 9,854,559,327 | | 4,269,333,861 | | 3,898,689,962 | | 22,542,324,386 |
| 5,054,090 | | 713,571 | | 1,384,869 | | 2,627,498 | | — | | — | | — |
| 29,012,101 | | — | | — | | — | | 44,226,186 | | — | | — |
| 3,025 | | — | | 12,555 | | — | | — | | — | | — |
| 14,286,022 | | 15,816,699 | | 15,423,557 | | 5,013,011 | | 6,486,477 | | 10,165,002 | | 10,172,915 |
| 24,682 | | 1,474,559 | | 68,064 | | 28,500 | | 13,178 | | 7,484 | | 93,765 |
| — | | 7,827 | | 945 | | 8,594 | | 3,442 | | 3,141 | | 18,295 |
| 1,220 | | 1,128 | | 8,350 | | 14,173 | | 15,977 | | 5,821 | | 29,880 |
| — | | — | | — | | 207,277 | | — | | — | | 12,779 |
| 27,789 | | 50,330 | | 37,053 | | 21,079 | | 7,886 | | 5,757 | | 38,867 |
| 10,054,688,900 | | 22,575,487,873 | | 16,851,078,077 | | 9,862,479,459 | | 4,320,087,007 | | 3,908,877,167 | | 22,552,690,887 |
| | | | | | | | | | | | | |
| — | | — | | — | | — | | 42,007 | | 37,261 | | 219,076 |
| 4,960,705 | | 18,432,206 | | 28,805,353 | | 57,921,882 | | 72,906,398 | | 16,954,517 | | 130,802,180 |
| 32,439,704 | | — | | — | | — | | 44,736,818 | | 6,681,800 | | — |
| — | | 8,677 | | — | | 55,208 | | 18,405 | | 158,493 | | 1,167 |
| 354,392 | | 737,165 | | 558,153 | | 326,238 | | 137,527 | | 122,922 | | 721,139 |
| 478,942 | | 974,647 | | 743,801 | | 428,106 | | 179,981 | | 156,692 | | 926,161 |
| 30,800 | | 102,357 | | 51,306 | | 35,126 | | 9,028 | | 20,450 | | 115,904 |
| 3,366 | | 4,186 | | 2,979 | | 1,850 | | 837 | | 274 | | 1,599 |
| 1,243,091 | | 2,343,032 | | 1,822,825 | | 1,046,549 | | 455,825 | | 387,657 | | 2,288,127 |
| 44,631 | | 56,542 | | 47,386 | | 39,233 | | 31,450 | | 29,750 | | 48,067 |
| 350,680 | | 624,992 | | 325,990 | | 254,891 | | 92,726 | | 50,986 | | 406,664 |
| 1,589 | | 297 | | 3,306 | | 1,934 | | 2,679 | | 2,923 | | 909 |
| 39,907,900 | | 23,284,101 | | 32,361,099 | | 60,111,017 | | 118,613,681 | | 24,603,725 | | 135,530,993 |
| $10,014,781,000 | | $22,552,203,772 | | $16,818,716,978 | | $9,802,368,442 | | $4,201,473,326 | | $3,884,273,442 | | $22,417,159,894 |
| | | | | | | | | | | | | |
| $17,852,370,203 | | $23,879,367,255 | | $19,150,476,394 | | $11,496,312,326 | | $5,419,364,216 | | $3,742,779,404 | | $22,085,123,822 |
| (7,837,589,203) | | (1,327,163,483) | | (2,331,759,416) | | (1,693,943,884) | | (1,217,890,890) | | 141,494,038 | | 332,036,072 |
| $10,014,781,000 | | $22,552,203,772 | | $16,818,716,978 | | $9,802,368,442 | | $4,201,473,326 | | $3,884,273,442 | | $22,417,159,894 |
| | | | | | | | | | | | | |
| $59.18 | | $28.02 | | $90.13 | | $77.66 | | $58.17 | | $39.35 | | $80.51 |
| 169,224,200 | | 804,945,427 | | 186,615,324 | | 126,226,000 | | 72,223,725 | | 98,700,000 | | 278,455,897 |
| | | | | | | | | | | | | |
| $14,437,500,052 | | $23,062,684,180 | | $18,869,657,154 | | $11,002,040,794 | | $4,622,320,510 | | $3,692,998,302 | | $21,153,602,634 |
| 17,858,055 | | 301,249,676 | | 41,286,521 | | 64,791,163 | | 73,952,321 | | 24,515,616 | | 174,923,310 |
| $14,455,358,107 | | $23,363,933,856 | | $18,910,943,675 | | $11,066,831,957 | | $4,696,272,831 | | $3,717,513,918 | | $21,328,525,944 |
| $4,819,528 | | $95,277,952 | | $41,570,326 | | $143,396,589 | | $115,926,239 | | $35,770,426 | | $321,851,082 |
THE SELECT SECTOR SPDR TRUST
STATEMENTS OF ASSETS AND LIABILITIES (continued)
September 30, 2019
| | The Utilities Select Sector SPDR Fund |
| ASSETS | |
Investments in unaffiliated issuers, at value*
| $11,272,729,448 |
Investments in affiliated issuers, at value
| 8,628,861 |
Total Investments
| 11,281,358,309 |
Cash
| 2,110,595 |
Receivable for income related to Select Sector SPDR shares in-kind transactions
| 12,532 |
Dividends receivable — unaffiliated issuers
| 15,079,591 |
Dividends receivable — affiliated issuers
| 69,283 |
Securities lending income receivable — unaffiliated issuers
| 14,485 |
Securities lending income receivable — affiliated issuers
| 1,067 |
Prepaid expenses and other assets
| 17,500 |
TOTAL ASSETS
| 11,298,663,362 |
| LIABILITIES | |
Advisory and Administration fees payable
| 352,161 |
Distribution fees payable
| 451,543 |
Unitary fees payable
| 52,181 |
Trustees’ fees and expenses payable
| 681 |
License fee payable
| 1,140,553 |
Professional fees payable
| 35,735 |
Printing and postage fees payable
| 145,315 |
Accrued expenses and other liabilities
| 2,085 |
TOTAL LIABILITIES
| 2,180,254 |
NET ASSETS
| $11,296,483,108 |
| NET ASSETS CONSIST OF: | |
Paid-in Capital
| $11,358,450,357 |
Total distributable earnings (loss)
| (61,967,249) |
NET ASSETS
| $11,296,483,108 |
| NET ASSET VALUE PER SHARE | |
Net asset value per share
| $64.73 |
Shares outstanding (unlimited amount authorized, $0.01 par value)
| 174,524,160 |
| COST OF INVESTMENTS: | |
Investments in unaffiliated issuers
| $10,651,362,596 |
Investments in affiliated issuers
| 8,628,860 |
Total cost of investments
| $10,659,991,456 |
* Includes investments in securities on loan, at value
| $284,065,856 |
See accompanying notes to financial statements.
60
[This Page Intentionally Left Blank]
THE SELECT SECTOR SPDR TRUST
STATEMENTS OF OPERATIONS
For the Year Ended September 30, 2019
| | The Communication Services Select Sector SPDR Fund | | The Consumer Discretionary Select Sector SPDR Fund | | The Consumer Staples Select Sector SPDR Fund |
| INVESTMENT INCOME | | | | | |
Dividend income — unaffiliated issuers
| 48,565,329 | | $203,007,485 | | $325,291,609 |
Dividend income — affiliated issuers
| 114,327 | | 317,359 | | 376,673 |
Dividend income — non-cash transactions
| — | | — | | — |
Unaffiliated securities lending income
| 5,352 | | 188,008 | | 115,232 |
Affiliated securities lending income
| 31,000 | | 257,631 | | 609,402 |
TOTAL INVESTMENT INCOME (LOSS)
| 48,716,008 | | 203,770,483 | | 326,392,916 |
| EXPENSES | | | | | |
Advisory and Administration fees
| 1,584,365 | | 4,548,489 | | 3,764,622 |
Distribution fees
| 1,620,598 | | 4,650,904 | | 3,849,049 |
License fees
| 1,819,195 | | 5,204,468 | | 4,313,061 |
Unitary fees
| 505,092 | | 1,450,232 | | 1,199,940 |
Trustees’ fees and expenses
| 33,075 | | 123,751 | | 93,791 |
Registration and filing fees
| 2,368 | | 47,662 | | 29,482 |
Professional fees
| 27,975 | | 49,778 | | 51,630 |
Printing and postage fees
| 181,069 | | 1,251,475 | | 664,298 |
Insurance expense
| 2,913 | | 34,146 | | 22,719 |
Miscellaneous expenses
| 19,755 | | 79,818 | | 62,711 |
TOTAL EXPENSES
| 5,796,405 | | 17,440,723 | | 14,051,303 |
NET INVESTMENT INCOME (LOSS)
| $42,919,603 | | $186,329,760 | | $312,341,613 |
| REALIZED AND UNREALIZED GAIN (LOSS) | | | | | |
| Net realized gain (loss) on: | | | | | |
Investments — unaffiliated issuers
| (63,819,469) | | (220,261,330) | | (376,208,962) |
Investments — affiliated issuers
| (1) | | (99) | | (80) |
In-kind redemptions — unaffiliated issuers
| 325,657,114 | | 2,186,100,637 | | 1,353,784,266 |
In-kind redemptions — affiliated issuers
| — | | — | | — |
Net realized gain (loss)
| 261,837,644 | | 1,965,839,208 | | 977,575,224 |
| Net change in unrealized appreciation/depreciation on: | | | | | |
Investments — unaffiliated issuers
| (97,536,808) | | (1,891,082,222) | | 503,354,114 |
Investments — affiliated issuers
| — | | — | | — |
Net change in unrealized appreciation/depreciation
| (97,536,808) | | (1,891,082,222) | | 503,354,114 |
NET REALIZED AND UNREALIZED GAIN (LOSS)
| 164,300,836 | | 74,756,986 | | 1,480,929,338 |
NET INCREASE (DECREASE) IN NET ASSETS FROM OPERATIONS
| $207,220,439 | | $261,086,746 | | $1,793,270,951 |
See accompanying notes to financial statements.
62
| The Energy Select Sector SPDR Fund | | The Financial Select Sector SPDR Fund | | The Health Care Select Sector SPDR Fund | | The Industrial Select Sector SPDR Fund | | The Materials Select Sector SPDR Fund | | The Real Estate Select Sector SPDR Fund | | The Technology Select Sector SPDR Fund |
| | | | | | | | | | | | | |
| 846,581,561 | | $553,588,837 | | $482,484,959 | | $211,570,575 | | $93,093,948 | | $87,034,410 | | $313,283,249 |
| 576,306 | | 6,311,170 | | 799,975 | | 404,507 | | 157,489 | | 55,772 | | 802,478 |
| — | | — | | — | | 16,655,688 | | — | | — | | — |
| 42,611 | | 88,969 | | 68,023 | | 578,225 | | 71,008 | | 10,949 | | 433,962 |
| 80,268 | | 89,294 | | 2,579,474 | | 126,680 | | 122,974 | | 8,774 | | 252,265 |
| 847,280,746 | | 560,078,270 | | 485,932,431 | | 229,335,675 | | 93,445,419 | | 87,109,905 | | 314,771,954 |
| | | | | | | | | | | | | |
| 4,539,864 | | 8,457,106 | | 6,260,372 | | 3,572,316 | | 1,386,054 | | 1,056,920 | | 6,873,404 |
| 4,640,697 | | 8,646,425 | | 6,398,665 | | 3,652,221 | | 1,417,102 | | 1,080,648 | | 7,028,358 |
| 5,188,923 | | 9,669,790 | | 7,166,048 | | 4,085,876 | | 1,586,446 | | 1,210,889 | | 7,866,560 |
| 1,447,642 | | 2,696,665 | | 1,995,702 | | 1,139,011 | | 441,883 | | 336,883 | | 2,191,359 |
| 140,606 | | 248,310 | | 173,743 | | 103,623 | | 39,642 | | 26,756 | | 186,798 |
| 62,624 | | 109,777 | | 58,419 | | 44,783 | | 16,333 | | 8,705 | | 73,758 |
| 58,854 | | 84,881 | | 72,433 | | 49,634 | | 34,798 | | 32,808 | | 65,155 |
| 1,189,142 | | 2,139,338 | | 1,290,497 | | 881,771 | | 338,978 | | 204,883 | | 1,748,441 |
| 44,587 | | 80,434 | | 44,660 | | 32,835 | | 12,221 | | 6,537 | | 52,954 |
| 98,829 | | 161,487 | | 94,147 | | 75,770 | | 39,972 | | 31,962 | | 114,160 |
| 17,411,768 | | 32,294,213 | | 23,554,686 | | 13,637,840 | | 5,313,429 | | 3,996,991 | | 26,200,947 |
| $829,868,978 | | $527,784,057 | | $462,377,745 | | $215,697,835 | | $88,131,990 | | $83,112,914 | | $288,571,007 |
| | | | | | | | | | | | | |
| | | | | | | | | | | | | |
| (759,187,773) | | (223,930,364) | | (45,300,895) | | (95,348,430) | | (312,448,365) | | 2,636,969 | | (92,477,500) |
| (60) | | (165) | | 1 | | (295) | | — | | 121 | | (80) |
| (194,827,930) | | 985,388,574 | | 2,353,329,253 | | 545,928,389 | | 326,202,493 | | 269,219,093 | | 3,216,736,639 |
| — | | (28,473,669) | | — | | — | | — | | — | | — |
| (954,015,763) | | 732,984,376 | | 2,308,028,359 | | 450,579,664 | | 13,754,128 | | 271,856,183 | | 3,124,259,059 |
| | | | | | | | | | | | | |
| (3,205,490,883) | | (1,130,108,032) | | (3,567,287,415) | | (851,842,624) | | (13,811,737) | | 328,392,786 | | (2,050,148,450) |
| 2 | | (55,096,231) | | 411 | | 17 | | — | | 148 | | 136 |
| (3,205,490,881) | | (1,185,204,263) | | (3,567,287,004) | | (851,842,607) | | (13,811,737) | | 328,392,934 | | (2,050,148,314) |
| (4,159,506,644) | | (452,219,887) | | (1,259,258,645) | | (401,262,943) | | (57,609) | | 600,249,117 | | 1,074,110,745 |
| $(3,329,637,666) | | $75,564,170 | | $(796,880,900) | | $(185,565,108) | | $88,074,381 | | $683,362,031 | | $1,362,681,752 |
THE SELECT SECTOR SPDR TRUST
STATEMENTS OF OPERATIONS (continued)
For the Year Ended September 30, 2019
| | The Utilities Select Sector SPDR Fund |
| INVESTMENT INCOME | |
Dividend income — unaffiliated issuers
| $315,118,511 |
Dividend income — affiliated issuers
| 476,221 |
Unaffiliated securities lending income
| 198,531 |
Affiliated securities lending income
| 128,121 |
TOTAL INVESTMENT INCOME (LOSS)
| 315,921,384 |
| EXPENSES | |
Advisory and Administration fees
| 3,155,023 |
Distribution fees
| 3,225,496 |
License fees
| 3,615,101 |
Unitary fees
| 1,005,615 |
Trustees’ fees and expenses
| 79,923 |
Registration and filing fees
| 25,693 |
Professional fees
| 47,421 |
Printing and postage fees
| 588,355 |
Insurance expense
| 20,136 |
Miscellaneous expenses
| 57,496 |
TOTAL EXPENSES
| 11,820,259 |
NET INVESTMENT INCOME (LOSS)
| $304,101,125 |
| REALIZED AND UNREALIZED GAIN (LOSS) | |
| Net realized gain (loss) on: | |
Investments — unaffiliated issuers
| (374,755,932) |
Investments — affiliated issuers
| (59) |
In-kind redemptions — unaffiliated issuers
| 1,091,735,471 |
Net realized gain (loss)
| 716,979,480 |
| Net change in unrealized appreciation/depreciation on: | |
Investments — unaffiliated issuers
| 1,220,643,645 |
Investments — affiliated issuers
| 1 |
Net change in unrealized appreciation/depreciation
| 1,220,643,646 |
NET REALIZED AND UNREALIZED GAIN (LOSS)
| 1,937,623,126 |
NET INCREASE (DECREASE) IN NET ASSETS FROM OPERATIONS
| $2,241,724,251 |
See accompanying notes to financial statements.
64
[This Page Intentionally Left Blank]
THE SELECT SECTOR SPDR TRUST
STATEMENTS OF CHANGES IN NET ASSETS
| | The Communication Services Select Sector SPDR Fund | | The Consumer Discretionary Select Sector SPDR Fund |
| | Year Ended
9/30/19 | | For the Period
6/18/18* -
9/30/18 | | Year Ended
9/30/19 | | Year Ended
9/30/18 |
| INCREASE (DECREASE) IN NET ASSETS FROM OPERATIONS: | | | | | | | |
Net investment income (loss)
| $42,919,603 | | $816,736 | | $186,329,760 | | $192,747,980 |
Net realized gain (loss)
| 261,837,644 | | (1,293,377) | | 1,965,839,208 | | 2,186,677,564 |
Net change in unrealized appreciation/depreciation
| (97,536,808) | | 7,163,405 | | (1,891,082,222) | | 1,336,456,887 |
Net increase (decrease) in net assets resulting from operations
| 207,220,439 | | 6,686,764 | | 261,086,746 | | 3,715,882,431 |
Net equalization credits and charges
| 2,407,544 | | 1,745,113 | | (2,522,826) | | 11,138,261 |
| DISTRIBUTIONS TO SHAREHOLDERS: | | | | | | | |
Distributions to shareholders
| (45,484,659) | | (1,080,224) | | (184,010,473) | | (177,386,571) |
Return of capital
| — | | (1,553,436) | | — | | — |
Total Distributions to shareholders
| (45,484,659) | | (2,633,660) | | (184,010,473) | | (177,386,571) |
| FROM BENEFICIAL INTEREST TRANSACTIONS: | | | | | | | |
Proceeds from sale of shares sold
| 11,663,782,846 | | 2,094,047,660 | | 20,171,605,252 | | 18,624,735,734 |
Cost of shares redeemed
| (7,821,126,786) | | (63,089,660) | | (22,539,309,614) | | (17,462,874,297) |
Net income equalization
| (2,407,544) | | (1,745,113) | | 2,522,826 | | (11,138,261) |
Net increase (decrease) in net assets from beneficial interest transactions
| 3,840,248,516 | | 2,029,212,887 | | (2,365,181,536) | | 1,150,723,176 |
Net increase (decrease) in net assets during the period
| 4,004,391,840 | | 2,035,011,104 | | (2,290,628,089) | | 4,700,357,297 |
Net assets at beginning of period
| 2,035,011,104 | | — | | 16,218,942,301 | | 11,518,585,004 |
NET ASSETS AT END OF PERIOD
| $6,039,402,944 | | $2,035,011,104 | | $13,928,314,212 | | $16,218,942,301 |
| SHARES OF BENEFICIAL INTEREST: | | | | | | | |
Shares sold
| 246,300,000 | | 42,850,000 | | 178,800,000 | | 174,450,000 |
Shares redeemed
| (165,850,000) | | (1,300,000) | | (201,800,000) | | (163,900,000) |
Net increase (decrease)
| 80,450,000 | | 41,550,000 | | (23,000,000) | | 10,550,000 |
See accompanying notes to financial statements.
66
| The Consumer Staples Select Sector SPDR Fund | | The Energy Select Sector SPDR Fund | | The Financial Select Sector SPDR Fund |
Year Ended
9/30/19 | | Year Ended
9/30/18 | | Year Ended
9/30/19 | | Year Ended
9/30/18 | | Year Ended
9/30/19 | | Year Ended
9/30/18 |
| | | | | | | | | | | |
| $312,341,613 | | $237,832,369 | | $829,868,978 | | $489,623,419 | | $527,784,057 | | $545,584,204 |
| 977,575,224 | | 258,220,307 | | (954,015,763) | | 161,904,715 | | 732,984,376 | | 3,758,337,121 |
| 503,354,114 | | (217,605,325) | | (3,205,490,881) | | 1,539,678,334 | | (1,185,204,263) | | (1,964,337,065) |
| 1,793,270,951 | | 278,447,351 | | (3,329,637,666) | | 2,191,206,468 | | 75,564,170 | | 2,339,584,260 |
| 9,224,666 | | 12,349,526 | | (8,215,744) | | (5,667,824) | | (26,253,632) | | 8,381,760 |
| | | | | | | | | | | |
| (320,699,124) | | (247,305,066) | | (437,805,660) | | (484,431,572) | | (502,942,678) | | (556,478,187) |
| — | | — | | — | | — | | — | | — |
| (320,699,124) | | (247,305,066) | | (437,805,660) | | (484,431,572) | | (502,942,678) | | (556,478,187) |
| | | | | | | | | | | |
| 30,878,885,442 | | 20,317,858,214 | | 25,459,828,236 | | 18,997,159,203 | | 38,373,618,648 | | 36,653,289,013 |
| (27,593,169,069) | | (19,901,187,691) | | (30,112,762,538) | | (18,886,610,420) | | (46,447,842,746) | | (34,801,440,424) |
| (9,224,666) | | (12,349,526) | | 8,215,744 | | 5,667,824 | | 26,253,632 | | (8,381,760) |
| 3,276,491,707 | | 404,320,997 | | (4,644,718,558) | | 116,216,607 | | (8,047,970,466) | | 1,843,466,829 |
| 4,758,288,200 | | 447,812,808 | | (8,420,377,628) | | 1,817,323,679 | | (8,501,602,606) | | 3,634,954,662 |
| 9,256,715,871 | | 8,808,903,063 | | 18,435,158,628 | | 16,617,834,949 | | 31,053,806,378 | | 27,418,851,716 |
| $14,015,004,071 | | $9,256,715,871 | | $10,014,781,000 | | $18,435,158,628 | | $22,552,203,772 | | $31,053,806,378 |
| | | | | | | | | | | |
| 544,850,000 | | 378,450,000 | | 401,600,000 | | 261,200,000 | | 1,445,250,000 | | 1,315,650,000 |
| (488,300,000) | | (369,950,000) | | (475,750,000) | | (260,550,000) | | (1,766,350,000) | | (1,250,850,000) |
| 56,550,000 | | 8,500,000 | | (74,150,000) | | 650,000 | | (321,100,000) | | 64,800,000 |
THE SELECT SECTOR SPDR TRUST
STATEMENTS OF CHANGES IN NET ASSETS (continued)
| | The Health Care Select Sector SPDR Fund | | The Industrial Select Sector SPDR Fund |
| | Year Ended
9/30/19 | | Year Ended
9/30/18 | | Year Ended
9/30/19 | | Year Ended
9/30/18 |
| INCREASE (DECREASE) IN NET ASSETS FROM OPERATIONS: | | | | | | | |
Net investment income (loss)
| $462,377,745 | | $257,102,587 | | $215,697,835 | | $224,803,377 |
Net realized gain (loss)
| 2,308,028,359 | | 1,775,244,100 | | 450,579,664 | | 1,962,024,152 |
Net change in unrealized appreciation/depreciation
| (3,567,287,004) | | 840,112,380 | | (851,842,607) | | (780,543,538) |
Net increase (decrease) in net assets resulting from operations
| (796,880,900) | | 2,872,459,067 | | (185,565,108) | | 1,406,283,991 |
Net equalization credits and charges
| (3,327,949) | | 1,856,458 | | (4,688,264) | | (3,271,128) |
| DISTRIBUTIONS TO SHAREHOLDERS: | | | | | | | |
Distributions to shareholders
| (303,471,062) | | (258,645,776) | | (219,261,944) | | (234,789,999) |
| FROM BENEFICIAL INTEREST TRANSACTIONS: | | | | | | | |
Proceeds from sale of shares sold
| 30,839,809,025 | | 18,290,105,906 | | 25,518,305,688 | | 23,686,905,734 |
Cost of shares redeemed
| (32,553,118,582) | | (18,983,167,287) | | (28,236,502,235) | | (22,988,747,367) |
Net income equalization
| 3,327,949 | | (1,856,458) | | 4,688,264 | | 3,271,128 |
Net increase (decrease) in net assets from beneficial interest transactions
| (1,709,981,608) | | (694,917,839) | | (2,713,508,283) | | 701,429,495 |
Contribution from Affiliate (Note 3)
| — | | — | | 60,421 | | — |
Net increase (decrease) in net assets during the period
| (2,813,661,519) | | 1,920,751,910 | | (3,122,963,178) | | 1,869,652,359 |
Net assets at beginning of period
| 19,632,378,497 | | 17,711,626,587 | | 12,925,331,620 | | 11,055,679,261 |
NET ASSETS AT END OF PERIOD
| $16,818,716,978 | | $19,632,378,497 | | $9,802,368,442 | | $12,925,331,620 |
| SHARES OF BENEFICIAL INTEREST: | | | | | | | |
Shares sold
| 341,450,000 | | 213,550,000 | | 346,400,000 | | 315,800,000 |
Shares redeemed
| (361,250,000) | | (223,750,000) | | (385,100,000) | | (306,600,000) |
Net increase (decrease)
| (19,800,000) | | (10,200,000) | | (38,700,000) | | 9,200,000 |
See accompanying notes to financial statements.
68
| The Materials Select Sector SPDR Fund | | The Real Estate Select Sector SPDR Fund | | The Technology Select Sector SPDR Fund |
Year Ended
9/30/19 | | Year Ended
9/30/18 | | Year Ended
9/30/19 | | Year Ended
9/30/18 | | Year Ended
9/30/19 | | Year Ended
9/30/18 |
| | | | | | | | | | | |
| $88,131,990 | | $87,516,658 | | $83,112,914 | | $72,508,618 | | $288,571,007 | | $285,584,193 |
| 13,754,128 | | 428,393,672 | | 271,856,183 | | 104,677,987 | | 3,124,259,059 | | 3,872,407,618 |
| (13,811,737) | | (436,501,277) | | 328,392,934 | | (62,412,821) | | (2,050,148,314) | | 936,578,600 |
| 88,074,381 | | 79,409,053 | | 683,362,031 | | 114,773,784 | | 1,362,681,752 | | 5,094,570,411 |
| (1,842,643) | | 1,436,420 | | 1,020,500 | | 126,651 | | 3,636,800 | | 13,158,840 |
| | | | | | | | | | | |
| (86,141,038) | | (87,749,456) | | (100,374,124) | | (89,715,446) | | (287,183,470) | | (309,252,206) |
| | | | | | | | | | | |
| 11,476,178,733 | | 9,060,229,046 | | 4,288,314,882 | | 2,437,434,063 | | 23,072,432,916 | | 28,155,605,742 |
| (11,824,404,299) | | (8,555,524,945) | | (3,719,107,466) | | (2,085,232,222) | | (24,690,255,121) | | (27,813,884,434) |
| 1,842,643 | | (1,436,420) | | (1,020,500) | | (126,651) | | (3,636,800) | | (13,158,840) |
| (346,382,923) | | 503,267,681 | | 568,186,916 | | 352,075,190 | | (1,621,459,005) | | 328,562,468 |
| — | | — | | — | | — | | — | | — |
| (346,292,223) | | 496,363,698 | | 1,152,195,323 | | 377,260,179 | | (542,323,923) | | 5,127,039,513 |
| 4,547,765,549 | | 4,051,401,851 | | 2,732,078,119 | | 2,354,817,940 | | 22,959,483,817 | | 17,832,444,304 |
| $4,201,473,326 | | $4,547,765,549 | | $3,884,273,442 | | $2,732,078,119 | | $22,417,159,894 | | $22,959,483,817 |
| | | | | | | | | | | |
| 208,650,000 | | 151,800,000 | | 121,250,000 | | 76,400,000 | | 317,250,000 | | 405,600,000 |
| (214,950,000) | | (144,600,000) | | (106,300,000) | | (65,650,000) | | (343,700,000) | | (402,300,000) |
| (6,300,000) | | 7,200,000 | | 14,950,000 | | 10,750,000 | | (26,450,000) | | 3,300,000 |
THE SELECT SECTOR SPDR TRUST
STATEMENTS OF CHANGES IN NET ASSETS (continued)
| | The Utilities Select Sector SPDR Fund |
| | Year Ended
9/30/19 | | Year Ended
9/30/18 |
| INCREASE (DECREASE) IN NET ASSETS FROM OPERATIONS: | | | |
Net investment income (loss)
| $304,101,125 | | $248,991,090 |
Net realized gain (loss)
| 716,979,480 | | 228,345,194 |
Net change in unrealized appreciation/depreciation
| 1,220,643,646 | | (294,460,877) |
Net increase (decrease) in net assets resulting from operations
| 2,241,724,251 | | 182,875,407 |
Net equalization credits and charges
| 2,286,382 | | (6,110,912) |
| DISTRIBUTIONS TO SHAREHOLDERS: | | | |
Distributions to shareholders
| (306,206,442) | | (251,480,540) |
| FROM BENEFICIAL INTEREST TRANSACTIONS: | | | |
Proceeds from sale of shares sold
| 32,174,828,096 | | 21,923,521,078 |
Cost of shares redeemed
| (30,456,122,612) | | (21,988,070,391) |
Net income equalization
| (2,286,382) | | 6,110,912 |
Net increase (decrease) in net assets from beneficial interest transactions
| 1,716,419,102 | | (58,438,401) |
Net increase (decrease) in net assets during the period
| 3,654,223,293 | | (133,154,446) |
Net assets at beginning of period
| 7,642,259,815 | | 7,775,414,261 |
NET ASSETS AT END OF PERIOD
| $11,296,483,108 | | $7,642,259,815 |
| SHARES OF BENEFICIAL INTEREST: | | | |
Shares sold
| 561,850,000 | | 422,650,000 |
Shares redeemed
| (532,400,000) | | (424,150,000) |
Net increase (decrease)
| 29,450,000 | | (1,500,000) |
See accompanying notes to financial statements.
70
THE SELECT SECTOR SPDR TRUST
FINANCIAL HIGHLIGHTS
Selected data for a share outstanding throughout each period
| | The Communication Services Select Sector SPDR Fund |
| | Year
Ended
9/30/19 | | For the
Period
6/19/18* -
9/30/18 |
Net asset value, beginning of period
| $48.98 | | $50.00 |
| Income (loss) from investment operations: | | | |
Net investment income (loss) (a)
| 0.44 | | 0.09 |
Net realized and unrealized gain (loss) (b)
| 0.51 | | (1.17) |
Total from investment operations
| 0.95 | | (1.08) |
Net equalization credits and charges (a)
| 0.02 | | 0.19 |
| Distributions to shareholders from: | | | |
Net investment income
| (0.45) | | (0.05) |
Return of Capital
| — | | (0.08) |
Total distributions
| (0.45) | | (0.13) |
Net asset value, end of period
| $49.50 | | $48.98 |
Total return (c)
| 2.07% | | (1.78)% |
| Ratios and Supplemental Data: | | | |
Net assets, end of period (in 000s)
| $6,039,403 | | $2,035,011 |
| Ratios to average net assets: | | | |
Total expenses
| 0.13% | | 0.15%(d) |
Net expenses
| 0.13% | | 0.13%(d) |
Net investment income (loss)
| 0.93% | | 0.62%(d) |
Portfolio turnover rate (e)
| 16% | | 7%(f) |
| * | Commencement of operations. |
| (a) | Per share numbers have been calculated using average shares outstanding, which more appropriately presents the per share data for the year. |
| (b) | Amounts shown in this caption for a share outstanding may not accord with the change in aggregate gains and losses in securities for the fiscal period because of the timing of sales and repurchases of Fund shares in relation to fluctuating market values for the Fund. |
| (c) | Total return is calculated assuming a purchase of shares at net asset value on the first day and a sale at net asset value on the last day of each period reported. Distributions are assumed, for the purpose of this calculation, to be reinvested at net asset value per share on the respective payment dates of each distribution. Total returns for periods of less than one year are not annualized. Broker commission charges are not included in this calculation. |
| (d) | The ratios for periods less than one year are annualized. |
| (e) | Portfolio turnover rate excludes securities received or delivered from in-kind processing of creations or redemptions on Select Sector SPDR shares. |
| (f) | Period less than one year is not annualized. |
See accompanying notes to financial statements.
71
THE SELECT SECTOR SPDR TRUST
FINANCIAL HIGHLIGHTS (continued)
Selected data for a share outstanding throughout each period
| | The Consumer Discretionary Select Sector SPDR Fund |
| | Year
Ended
9/30/19 | | Year
Ended
9/30/18 | | Year
Ended
9/30/17 | | Year
Ended
9/30/16 | | Year
Ended
9/30/15 |
Net asset value, beginning of period
| $117.19 | | $90.09 | | $80.03 | | $74.26 | | $66.69 |
| Income (loss) from investment operations: | | | | | | | | | |
Net investment income (loss) (a)
| 1.58 | | 1.49 | | 1.32 | | 1.22 | | 1.05 |
Net realized and unrealized gain (loss) (b)
| 3.51 | | 26.81 | | 10.07 | | 5.79 | | 7.55 |
Total from investment operations
| 5.09 | | 28.30 | | 11.39 | | 7.01 | | 8.60 |
Net equalization credits and charges (a)
| (0.02) | | 0.09 | | 0.02 | | (0.02) | | 0.05 |
| Distributions to shareholders from: | | | | | | | | | |
Net investment income
| (1.57) | | (1.29) | | (1.35) | | (1.22) | | (1.08) |
Net asset value, end of period
| $120.69 | | $117.19 | | $90.09 | | $80.03 | | $74.26 |
Total return (c)
| 4.45% | | 31.63% | | 14.34% | | 9.48% | | 12.98% |
| Ratios and Supplemental Data: | | | | | | | | | |
Net assets, end of period (in 000s)
| $13,928,314 | | $16,218,942 | | $11,518,585 | | $9,531,929 | | $10,117,642 |
| Ratios to average net assets: | | | | | | | | | |
Total expenses
| 0.13% | | 0.13% | | 0.14% | | 0.14% | | 0.15% |
Net investment income (loss)
| 1.40% | | 1.43% | | 1.54% | | 1.56% | | 1.41% |
Portfolio turnover rate (d)
| 6% | | 23% | | 6% | | 10% | | 6% |
| (a) | Per share numbers have been calculated using average shares outstanding, which more appropriately presents the per share data for the year. |
| (b) | Amounts shown in this caption for a share outstanding may not accord with the change in aggregate gains and losses in securities for the fiscal period because of the timing of sales and repurchases of Fund shares in relation to fluctuating market values for the Fund. |
| (c) | Total return is calculated assuming a purchase of shares at net asset value on the first day and a sale at net asset value on the last day of each period reported. Distributions are assumed, for the purpose of this calculation, to be reinvested at net asset value per share on the respective payment dates of each distribution. Total returns for periods of less than one year are not annualized. Broker commission charges are not included in this calculation. |
| (d) | Portfolio turnover rate excludes securities received or delivered from in-kind processing of creations or redemptions on Select Sector SPDR shares. |
See accompanying notes to financial statements.
72
THE SELECT SECTOR SPDR TRUST
FINANCIAL HIGHLIGHTS (continued)
Selected data for a share outstanding throughout each period
| | The Consumer Staples Select Sector SPDR Fund |
| | Year
Ended
9/30/19 | | Year
Ended
9/30/18 | | Year
Ended
9/30/17 | | Year
Ended
9/30/16 | | Year
Ended
9/30/15 |
Net asset value, beginning of period
| $53.92 | | $53.99 | | $53.21 | | $47.22 | | $45.10 |
| Income (loss) from investment operations: | | | | | | | | | |
Net investment income (loss) (a)
| 1.60 | | 1.52 | | 1.48 | | 1.29 | | 1.27 |
Net realized and unrealized gain (loss) (b)
| 7.41 | | (0.17) | | 0.72 | | 5.99 | | 2.14 |
Total from investment operations
| 9.01 | | 1.35 | | 2.20 | | 7.28 | | 3.41 |
Net equalization credits and charges (a)
| 0.05 | | 0.08 | | 0.04 | | 0.00(c) | | (0.03) |
| Distributions to shareholders from: | | | | | | | | | |
Net investment income
| (1.57) | | (1.50) | | (1.46) | | (1.29) | | (1.26) |
Net asset value, end of period
| $61.41 | | $53.92 | | $53.99 | | $53.21 | | $47.22 |
Total return (d)
| 17.14% | | 2.70% | | 4.21% | | 15.50% | | 7.45% |
| Ratios and Supplemental Data: | | | | | | | | | |
Net assets, end of period (in 000s)
| $14,015,004 | | $9,256,716 | | $8,808,903 | | $8,893,158 | | $7,305,874 |
| Ratios to average net assets: | | | | | | | | | |
Total expenses
| 0.13% | | 0.13% | | 0.14% | | 0.14% | | 0.15% |
Net investment income (loss)
| 2.84% | | 2.84% | | 2.73% | | 2.48% | | 2.62% |
Portfolio turnover rate (e)
| 10% | | 12% | | 12% | | 4% | | 3% |
| (a) | Per share numbers have been calculated using average shares outstanding, which more appropriately presents the per share data for the year. |
| (b) | Amounts shown in this caption for a share outstanding may not accord with the change in aggregate gains and losses in securities for the fiscal period because of the timing of sales and repurchases of Fund shares in relation to fluctuating market values for the Fund. |
| (c) | Amount is less than $0.005 per share. |
| (d) | Total return is calculated assuming a purchase of shares at net asset value on the first day and a sale at net asset value on the last day of each period reported. Distributions are assumed, for the purpose of this calculation, to be reinvested at net asset value per share on the respective payment dates of each distribution. Total returns for periods of less than one year are not annualized. Broker commission charges are not included in this calculation. |
| (e) | Portfolio turnover rate excludes securities received or delivered from in-kind processing of creations or redemptions on Select Sector SPDR shares. |
See accompanying notes to financial statements.
73
THE SELECT SECTOR SPDR TRUST
FINANCIAL HIGHLIGHTS (continued)
Selected data for a share outstanding throughout each period
| | The Energy Select Sector SPDR Fund |
| | Year
Ended
9/30/19 | | Year
Ended
9/30/18 | | Year
Ended
9/30/17 | | Year
Ended
9/30/16 | | Year
Ended
9/30/15 |
Net asset value, beginning of period
| $75.75 | | $68.46 | | $70.62 | | $61.24 | | $90.58 |
| Income (loss) from investment operations: | | | | | | | | | |
Net investment income (loss) (a)
| 4.01 | | 1.95 | | 2.16(b) | | 1.79 | | 2.01 |
Net realized and unrealized gain (loss) (c)
| (18.36) | | 7.32 | | (2.18) | | 9.39 | | (29.45) |
Total from investment operations
| (14.35) | | 9.27 | | (0.02) | | 11.18 | | (27.44) |
Net equalization credits and charges (a)
| (0.04) | | (0.02) | | 0.00(d) | | 0.04 | | 0.09 |
| Distributions to shareholders from: | | | | | | | | | |
Net investment income
| (2.18) | | (1.96) | | (2.14) | | (1.84) | | (1.99) |
Net asset value, end of period
| $59.18 | | $75.75 | | $68.46 | | $70.62 | | $61.24 |
Total return (e)
| (19.08)% | | 13.64% | | (0.01)% | | 18.72% | | (30.52)% |
| Ratios and Supplemental Data: | | | | | | | | | |
Net assets, end of period (in 000s)
| $10,014,781 | | $18,435,159 | | $16,617,835 | | $14,920,251 | | $11,103,521 |
| Ratios to average net assets: | | | | | | | | | |
Total expenses
| 0.13% | | 0.13% | | 0.14% | | 0.14% | | 0.15% |
Net investment income (loss)
| 6.25% | | 2.71% | | 3.12% | | 2.77% | | 2.63% |
Portfolio turnover rate (f)
| 10% | | 8% | | 23% | | 6% | | 6% |
| (a) | Per share numbers have been calculated using average shares outstanding, which more appropriately presents the per share data for the year. |
| (b) | Net investment income per share and ratio of net investment income to average net assets reflect receipt of special dividend from portfolio holding. The resulting increase to net investment income amounted to $0.44 per share and 0.64% of average net assets. If the special dividends were not received during the year ended September 30, 2017, the total return would have been (0.63)%. |
| (c) | Amounts shown in this caption for a share outstanding may not accord with the change in aggregate gains and losses in securities for the fiscal period because of the timing of sales and repurchases of Fund shares in relation to fluctuating market values for the Fund. |
| (d) | Amount is less than $0.005 per share. |
| (e) | Total return is calculated assuming a purchase of shares at net asset value on the first day and a sale at net asset value on the last day of each period reported. Distributions are assumed, for the purpose of this calculation, to be reinvested at net asset value per share on the respective payment dates of each distribution. Total returns for periods of less than one year are not annualized. Broker commission charges are not included in this calculation. |
| (f) | Portfolio turnover rate excludes securities received or delivered from in-kind processing of creations or redemptions on Select Sector SPDR shares. |
See accompanying notes to financial statements.
74
THE SELECT SECTOR SPDR TRUST
FINANCIAL HIGHLIGHTS (continued)
Selected data for a share outstanding throughout each period
| | The Financial Select Sector SPDR Fund |
| | Year
Ended
9/30/19 | | Year
Ended
9/30/18 | | Year
Ended
9/30/17 | | Year
Ended
9/30/16 | | Year
Ended
9/30/15 |
Net asset value, beginning of period
| $27.58 | | $25.84 | | $19.31 | | $22.66 | | $23.17 |
| Income (loss) from investment operations: | | | | | | | | | |
Net investment income (loss) (a)
| 0.57 | | 0.48 | | 0.39 | | 0.43 | | 0.42 |
Net realized and unrealized gain (loss) (b)
| 0.46 | | 1.73 | | 6.50 | | 1.27 | | (0.50) |
Total from investment operations
| 1.03 | | 2.21 | | 6.89 | | 1.70 | | (0.08) |
Net equalization credits and charges (a)
| (0.03) | | 0.01 | | 0.03 | | (0.01) | | 0.01 |
Voluntary contribution from Adviser
| — | | — | | — | | — | | 0.00(c)(d) |
| Distributions to shareholders from: | | | | | | | | | |
Net investment income
| (0.56) | | (0.48) | | (0.39) | | (2.10) | | (0.44) |
Return of Capital
| — | | — | | — | | (2.94) | | — |
Total distributions
| (0.56) | | (0.48) | | (0.39) | | (5.04) | | (0.44) |
Net asset value, end of period
| $28.02 | | $27.58 | | $25.84 | | $19.31 | | $22.66 |
Total return (e)
| 3.81% | | 8.58% | | 36.01%(f) | | 7.36% | | (0.39)%(g) |
| Ratios and Supplemental Data: | | | | | | | | | |
Net assets, end of period (in 000s)
| $22,552,204 | | $31,053,806 | | $27,418,852 | | $11,973,337 | | $16,800,919 |
| Ratios to average net assets: | | | | | | | | | |
Total expenses
| 0.13% | | 0.13% | | 0.14% | | 0.14% | | 0.15% |
Net investment income (loss)
| 2.13% | | 1.72% | | 1.65% | | 1.88% | | 1.72% |
Portfolio turnover rate (h)
| 4% | | 3% | | 3% | | 6% | | 3% |
| (a) | Per share numbers have been calculated using average shares outstanding, which more appropriately presents the per share data for the year. |
| (b) | Amounts shown in this caption for a share outstanding may not accord with the change in aggregate gains and losses in securities for the fiscal period because of the timing of sales and repurchases of Fund shares in relation to fluctuating market values for the Fund. |
| (c) | Amount is less than $0.005 per share. |
| (d) | Contribution paid by an Affiliate in the amount of $461,741. |
| (e) | Total return is calculated assuming a purchase of shares at net asset value on the first day and a sale at net asset value on the last day of each period reported. Distributions are assumed, for the purpose of this calculation, to be reinvested at net asset value per share on the respective payment dates of each distribution. Total returns for periods of less than one year are not annualized. Broker commission charges are not included in this calculation. |
| (f) | Includes a non-recurring litigation payment received by the Fund from State Street Corp., an affiliate, which amounted to less than $0.005 per share outstanding as of March 20, 2017. This payment resulted in an increase to total return of less than 0.005% for the period ended September 30, 2017. |
| (g) | The contribution from an Affiliate had no impact on total return. |
| (h) | Portfolio turnover rate excludes securities received or delivered from in-kind processing of creations or redemptions on Select Sector SPDR shares. |
See accompanying notes to financial statements.
75
THE SELECT SECTOR SPDR TRUST
FINANCIAL HIGHLIGHTS (continued)
Selected data for a share outstanding throughout each period
| | The Health Care Select Sector SPDR Fund |
| | Year
Ended
9/30/19 | | Year
Ended
9/30/18 | | Year
Ended
9/30/17 | | Year
Ended
9/30/16 | | Year
Ended
9/30/15 |
Net asset value, beginning of period
| $95.11 | | $81.76 | | $72.09 | | $66.30 | | $63.90 |
| Income (loss) from investment operations: | | | | | | | | | |
Net investment income (loss) (a)
| 2.29 | | 1.31 | | 1.20 | | 1.08 | | 1.02 |
Net realized and unrealized gain (loss) (b)
| (5.75) | | 13.34 | | 9.64 | | 5.82 | | 2.35 |
Total from investment operations
| (3.46) | | 14.65 | | 10.84 | | 6.90 | | 3.37 |
Net equalization credits and charges (a)
| (0.02) | | 0.01 | | 0.02 | | (0.01) | | 0.02 |
| Distributions to shareholders from: | | | | | | | | | |
Net investment income
| (1.50) | | (1.31) | | (1.19) | | (1.10) | | (0.99) |
Net asset value, end of period
| $90.13 | | $95.11 | | $81.76 | | $72.09 | | $66.30 |
Total return (c)
| (3.65)% | | 18.10% | | 15.21% | | 10.45% | | 5.22% |
| Ratios and Supplemental Data: | | | | | | | | | |
Net assets, end of period (in 000s)
| $16,818,717 | | $19,632,378 | | $17,711,627 | | $12,447,213 | | $12,872,900 |
| Ratios to average net assets: | | | | | | | | | |
Total expenses
| 0.13% | | 0.13% | | 0.14% | | 0.14% | | 0.15% |
Net investment income (loss)
| 2.53% | | 1.54% | | 1.60% | | 1.54% | | 1.43% |
Portfolio turnover rate (d)
| 2% | | 5% | | 4% | | 8% | | 3% |
| (a) | Per share numbers have been calculated using average shares outstanding, which more appropriately presents the per share data for the year. |
| (b) | Amounts shown in this caption for a share outstanding may not accord with the change in aggregate gains and losses in securities for the fiscal period because of the timing of sales and repurchases of Fund shares in relation to fluctuating market values for the Fund. |
| (c) | Total return is calculated assuming a purchase of shares at net asset value on the first day and a sale at net asset value on the last day of each period reported. Distributions are assumed, for the purpose of this calculation, to be reinvested at net asset value per share on the respective payment dates of each distribution. Total returns for periods of less than one year are not annualized. Broker commission charges are not included in this calculation. |
| (d) | Portfolio turnover rate excludes securities received or delivered from in-kind processing of creations or redemptions on Select Sector SPDR shares. |
See accompanying notes to financial statements.
76
THE SELECT SECTOR SPDR TRUST
FINANCIAL HIGHLIGHTS (continued)
Selected data for a share outstanding throughout each period
| | The Industrial Select Sector SPDR Fund |
| | Year
Ended
9/30/19 | | Year
Ended
9/30/18 | | Year
Ended
9/30/17 | | Year
Ended
9/30/16 | | Year
Ended
9/30/15 |
Net asset value, beginning of period
| $78.37 | | $70.99 | | $58.39 | | $49.91 | | $53.14 |
| Income (loss) from investment operations: | | | | | | | | | |
Net investment income (loss) (a)
| 1.52 | | 1.30 | | 1.35 | | 1.18 | | 1.07 |
Net realized and unrealized gain (loss) (b)
| (0.63) | | 7.49 | | 12.58 | | 8.53 | | (3.16) |
Total from investment operations
| 0.89 | | 8.79 | | 13.93 | | 9.71 | | (2.09) |
Net equalization credits and charges (a)
| (0.03) | | (0.02) | | (0.01) | | (0.01) | | (0.01) |
Voluntary contribution from Affiliate (Note 3)
| 0.00(c)(d) | | — | | — | | — | | — |
| Distributions to shareholders from: | | | | | | | | | |
Net investment income
| (1.57) | | (1.39) | | (1.32) | | (1.22) | | (1.13) |
Net asset value, end of period
| $77.66 | | $78.37 | | $70.99 | | $58.39 | | $49.91 |
Total return (e)
| 1.25%(f) | | 12.43% | | 24.03% | | 19.62% | | (4.09)% |
| Ratios and Supplemental Data: | | | | | | | | | |
Net assets, end of period (in 000s)
| $9,802,368 | | $12,925,332 | | $11,055,679 | | $7,335,204 | | $6,257,309 |
| Ratios to average net assets: | | | | | | | | | |
Total expenses
| 0.13% | | 0.13% | | 0.14% | | 0.14% | | 0.15% |
Net investment income (loss)
| 2.07% | | 1.74% | | 2.07% | | 2.15% | | 1.95% |
Portfolio turnover rate (g)
| 3% | | 6% | | 5% | | 12% | | 6% |
| (a) | Per share numbers have been calculated using average shares outstanding, which more appropriately presents the per share data for the year. |
| (b) | Amounts shown in this caption for a share outstanding may not accord with the change in aggregate gains and losses in securities for the fiscal period because of the timing of sales and repurchases of Fund shares in relation to fluctuating market values for the Fund. |
| (c) | Amount is less than $0.005 per share. |
| (d) | Contribution paid by an Affiliate in the amount of $60,421. |
| (e) | Total return is calculated assuming a purchase of shares at net asset value on the first day and a sale at net asset value on the last day of each period reported. Distributions are assumed, for the purpose of this calculation, to be reinvested at net asset value per share on the respective payment dates of each distribution. Total returns for periods of less than one year are not annualized. Broker commission charges are not included in this calculation. |
| (f) | The contribution from an Affiliate had no impact on total return. |
| (g) | Portfolio turnover rate excludes securities received or delivered from in-kind processing of creations or redemptions on Select Sector SPDR shares. |
See accompanying notes to financial statements.
77
THE SELECT SECTOR SPDR TRUST
FINANCIAL HIGHLIGHTS (continued)
Selected data for a share outstanding throughout each period
| | The Materials Select Sector SPDR Fund |
| | Year
Ended
9/30/19 | | Year
Ended
9/30/18 | | Year
Ended
9/30/17 | | Year
Ended
9/30/16 | | Year
Ended
9/30/15 |
Net asset value, beginning of period
| $57.92 | | $56.80 | | $47.75 | | $39.94 | | $49.58 |
| Income (loss) from investment operations: | | | | | | | | | |
Net investment income (loss) (a)
| 1.20 | | 1.09 | | 1.01 | | 0.96 | | 0.93 |
Net realized and unrealized gain (loss) (b)
| 0.28 | | 1.09 | | 9.06 | | 7.79 | | (9.50) |
Total from investment operations
| 1.48 | | 2.18 | | 10.07 | | 8.75 | | (8.57) |
Net equalization credits and charges (a)
| (0.03) | | 0.02 | | 0.03 | | 0.02 | | (0.11) |
| Distributions to shareholders from: | | | | | | | | | |
Net investment income
| (1.20) | | (1.08) | | (1.05) | | (0.96) | | (0.96) |
Net asset value, end of period
| $58.17 | | $57.92 | | $56.80 | | $47.75 | | $39.94 |
Total return (c)
| 2.64% | | 3.84% | | 21.33% | | 22.11% | | (17.75)% |
| Ratios and Supplemental Data: | | | | | | | | | |
Net assets, end of period (in 000s)
| $4,201,473 | | $4,547,766 | | $4,051,402 | | $2,894,890 | | $1,942,121 |
| Ratios to average net assets: | | | | | | | | | |
Total expenses
| 0.13% | | 0.13% | | 0.14% | | 0.14% | | 0.15% |
Net investment income (loss)
| 2.18% | | 1.84% | | 1.95% | | 2.12% | | 1.94% |
Portfolio turnover rate (d)
| 20% | | 17% | | 10% | | 16% | | 9% |
| (a) | Per share numbers have been calculated using average shares outstanding, which more appropriately presents the per share data for the year. |
| (b) | Amounts shown in this caption for a share outstanding may not accord with the change in aggregate gains and losses in securities for the fiscal period because of the timing of sales and repurchases of Fund shares in relation to fluctuating market values for the Fund. |
| (c) | Total return is calculated assuming a purchase of shares at net asset value on the first day and a sale at net asset value on the last day of each period reported. Distributions are assumed, for the purpose of this calculation, to be reinvested at net asset value per share on the respective payment dates of each distribution. Total returns for periods of less than one year are not annualized. Broker commission charges are not included in this calculation. |
| (d) | Portfolio turnover rate excludes securities received or delivered from in-kind processing of creations or redemptions on Select Sector SPDR shares. |
See accompanying notes to financial statements.
78
THE SELECT SECTOR SPDR TRUST
FINANCIAL HIGHLIGHTS (continued)
Selected data for a share outstanding throughout each period
| | The Real Estate Select Sector SPDR Fund |
| | Year
Ended
9/30/19 | | Year
Ended
9/30/18 | | Year
Ended
9/30/17 | | For the
Period
10/8/15* -
9/30/16 |
Net asset value, beginning of period
| $32.62 | | $32.26 | | $32.74 | | $30.00 |
| Income (loss) from investment operations: | | | | | | | |
Net investment income (loss) (a)
| 0.95 | | 0.95 | | 0.75 | | 2.19 |
Net realized and unrealized gain (loss) (b)
| 6.91 | | 0.58 | | 0.11 | | 1.40 |
Total from investment operations
| 7.86 | | 1.53 | | 0.86 | | 3.59 |
Net equalization credits and charges (a)
| 0.01 | | 0.00(c) | | (0.08) | | 0.24 |
| Distributions to shareholders from: | | | | | | | |
Net investment income
| (1.14) | | (1.17) | | (1.26) | | (1.09) |
Net asset value, end of period
| $39.35 | | $32.62 | | $32.26 | | $32.74 |
Total return (d)
| 24.64% | | 4.87% | | 2.52% | | 12.92% |
| Ratios and Supplemental Data: | | | | | | | |
Net assets, end of period (in 000s)
| $3,884,273 | | $2,732,078 | | $2,354,818 | | $3,200,634 |
| Ratios to average net assets: | | | | | | | |
Total expenses
| 0.13% | | 0.13% | | 0.14% | | 0.16%(e) |
Net expenses
| 0.13% | | 0.13% | | 0.14% | | 0.07%(e) |
Net investment income (loss)
| 2.69% | | 2.94% | | 2.38% | | 6.82%(e) |
Portfolio turnover rate (f)
| 3% | | 7% | | 16% | | 5%(g) |
| * | Commencement of operations. |
| (a) | Per share numbers have been calculated using average shares outstanding, which more appropriately presents the per share data for the year. |
| (b) | Amounts shown in this caption for a share outstanding may not accord with the change in aggregate gains and losses in securities for the fiscal period because of the timing of sales and repurchases of Fund shares in relation to fluctuating market values for the Fund. |
| (c) | Amount is less than $0.005 per share. |
| (d) | Total return is calculated assuming a purchase of shares at net asset value on the first day and a sale at net asset value on the last day of each period reported. Distributions are assumed, for the purpose of this calculation, to be reinvested at net asset value per share on the respective payment dates of each distribution. Total returns for periods of less than one year are not annualized. Broker commission charges are not included in this calculation. |
| (e) | The ratios for periods less than one year are annualized. |
| (f) | Portfolio turnover rate excludes securities received or delivered from in-kind processing of creations or redemptions on Select Sector SPDR shares. |
| (g) | Periods less than one year are not annualized. |
See accompanying notes to financial statements.
79
THE SELECT SECTOR SPDR TRUST
FINANCIAL HIGHLIGHTS (continued)
Selected data for a share outstanding throughout each period
| | The Technology Select Sector SPDR Fund |
| | Year
Ended
9/30/19 | | Year
Ended
9/30/18 | | Year
Ended
9/30/17 | | Year
Ended
9/30/16 | | Year
Ended
9/30/15 |
Net asset value, beginning of period
| $75.30 | | $59.13 | | $47.78 | | $39.56 | | $39.89 |
| Income (loss) from investment operations: | | | | | | | | | |
Net investment income (loss) (a)
| 1.05 | | 0.93 | | 0.85 | | 0.83 | | 0.75 |
Net realized and unrealized gain (loss) (b)
| 5.18 | | 16.17 | | 11.35 | | 8.22 | | (0.30) |
Total from investment operations
| 6.23 | | 17.10 | | 12.20 | | 9.05 | | 0.45 |
Net equalization credits and charges (a)
| 0.01 | | 0.04 | | (0.00)(c) | | 0.01 | | (0.01) |
| Distributions to shareholders from: | | | | | | | | | |
Net investment income
| (1.03) | | (0.97) | | (0.85) | | (0.84) | | (0.77) |
Net asset value, end of period
| $80.51 | | $75.30 | | $59.13 | | $47.78 | | $39.56 |
Total return (d)
| 8.44% | | 29.14% | | 25.72% | | 23.13% | | 1.04% |
| Ratios and Supplemental Data: | | | | | | | | | |
Net assets, end of period (in 000s)
| $22,417,160 | | $22,959,484 | | $17,832,444 | | $13,003,829 | | $11,382,284 |
| Ratios to average net assets: | | | | | | | | | |
Total expenses
| 0.13% | | 0.13% | | 0.14% | | 0.14% | | 0.15% |
Net investment income (loss)
| 1.44% | | 1.37% | | 1.62% | | 1.91% | | 1.80% |
Portfolio turnover rate (e)
| 6% | | 19% | | 4% | | 5% | | 5% |
| (a) | Per share numbers have been calculated using average shares outstanding, which more appropriately presents the per share data for the year. |
| (b) | Amounts shown in this caption for a share outstanding may not accord with the change in aggregate gains and losses in securities for the fiscal period because of the timing of sales and repurchases of Fund shares in relation to fluctuating market values for the Fund. |
| (c) | Amount is less than $0.005 per share. |
| (d) | Total return is calculated assuming a purchase of shares at net asset value on the first day and a sale at net asset value on the last day of each period reported. Distributions are assumed, for the purpose of this calculation, to be reinvested at net asset value per share on the respective payment dates of each distribution. Total returns for periods of less than one year are not annualized. Broker commission charges are not included in this calculation. |
| (e) | Portfolio turnover rate excludes securities received or delivered from in-kind processing of creations or redemptions on Select Sector SPDR shares. |
See accompanying notes to financial statements.
80
THE SELECT SECTOR SPDR TRUST
FINANCIAL HIGHLIGHTS (continued)
Selected data for a share outstanding throughout each period
| | The Utilities Select Sector SPDR Fund |
| | Year
Ended
9/30/19 | | Year
Ended
9/30/18 | | Year
Ended
9/30/17 | | Year
Ended
9/30/16 | | Year
Ended
9/30/15 |
Net asset value, beginning of period
| $52.68 | | $53.05 | | $49.00 | | $43.29 | | $42.10 |
| Income (loss) from investment operations: | | | | | | | | | |
Net investment income (loss) (a)
| 1.90 | | 1.76 | | 1.69 | | 1.62 | | 1.57 |
Net realized and unrealized gain (loss) (b)
| 12.01 | | (0.28) | | 4.07 | | 5.76 | | 1.22 |
Total from investment operations
| 13.91 | | 1.48 | | 5.76 | | 7.38 | | 2.79 |
Net equalization credits and charges (a)
| 0.01 | | (0.04) | | (0.01) | | (0.03) | | (0.04) |
| Distributions to shareholders from: | | | | | | | | | |
Net investment income
| (1.87) | | (1.81) | | (1.70) | | (1.64) | | (1.56) |
Net asset value, end of period
| $64.73 | | $52.68 | | $53.05 | | $49.00 | | $43.29 |
Total return (c)
| 26.85% | | 2.89% | | 11.88% | | 17.06% | | 6.51% |
| Ratios and Supplemental Data: | | | | | | | | | |
Net assets, end of period (in 000s)
| $11,296,483 | | $7,642,260 | | $7,775,414 | | $7,411,727 | | $6,639,689 |
| Ratios to average net assets: | | | | | | | | | |
Total expenses
| 0.13% | | 0.13% | | 0.14% | | 0.14% | | 0.15% |
Net investment income (loss)
| 3.30% | | 3.37% | | 3.32% | | 3.40% | | 3.52% |
Portfolio turnover rate (d)
| 5% | | 5% | | 2% | | 8% | | 4% |
| (a) | Per share numbers have been calculated using average shares outstanding, which more appropriately presents the per share data for the year. |
| (b) | Amounts shown in this caption for a share outstanding may not accord with the change in aggregate gains and losses in securities for the fiscal period because of the timing of sales and repurchases of Fund shares in relation to fluctuating market values for the Fund. |
| (c) | Total return is calculated assuming a purchase of shares at net asset value on the first day and a sale at net asset value on the last day of each period reported. Distributions are assumed, for the purpose of this calculation, to be reinvested at net asset value per share on the respective payment dates of each distribution. Total returns for periods of less than one year are not annualized. Broker commission charges are not included in this calculation. |
| (d) | Portfolio turnover rate excludes securities received or delivered from in-kind processing of creations or redemptions on Select Sector SPDR shares. |
See accompanying notes to financial statements.
81
THE SELECT SECTOR SPDR TRUST
NOTES TO FINANCIAL STATEMENTS
September 30, 2019
1. Organization
The Select Sector SPDR Trust (the “Trust”), a Massachusetts business trust registered under the Investment Company Act of 1940, as amended (“1940 Act”), is an open-end management investment company.
As of September 30, 2019, the Trust consists of eleven (11) series, each of which represents a separate series of beneficial interest in the Trust. The Declaration of Trust permits the Board of Trustees of the Trust (the “Board”) to authorize the issuance of an unlimited number of shares of beneficial interest at $0.01 par value. The financial statements herein relate to the following series (each a “Fund”, and collectively, the “Funds”):
| The Communication Services Select Sector SPDR Fund |
| The Consumer Discretionary Select Sector SPDR Fund |
| The Consumer Staples Select Sector SPDR Fund |
| The Energy Select Sector SPDR Fund |
| The Financial Select Sector SPDR Fund |
| The Health Care Select Sector SPDR Fund |
| The Industrial Select Sector SPDR Fund |
| The Materials Select Sector SPDR Fund |
| The Real Estate Select Sector SPDR Fund |
| The Technology Select Sector SPDR Fund |
| The Utilities Select Sector SPDR Fund |
Each Fund is classified as a non-diversified investment company under the 1940 Act.
Under the Trust’s organizational documents, its officers and trustees are indemnified against certain liabilities arising out of the performance of their duties to the Trust. The Trust has entered into an Indemnification Agreement with each trustee who is not an “interested person” (as defined in the 1940 Act) (each, an “Independent Trustee”) providing for indemnification of the Independent Trustee by the Trust consistent with the foregoing and providing procedures for seeking and obtaining indemnification advancement of expenses. Additionally, in the normal course of business, the Trust enters into contracts with service providers that contain general indemnification clauses. The Trust’s maximum exposure under these arrangements is unknown as this would involve future claims that may be made against the Trust that have not yet occurred.
2. Summary of Significant Accounting Policies
The following is a summary of significant accounting policies followed by the Trust in the preparation of its financial statements:
The preparation of financial statements in accordance with U.S. generally accepted accounting principles (“U.S. GAAP”) requires management to make estimates and assumptions that affect the reported amounts and disclosures in the financial statements. Actual results could differ from those estimates. Each Fund is an investment company under U.S. GAAP and follows the accounting and reporting guidance applicable to investment companies.
Security Valuation
Each Fund's investments are valued at fair value each day that the New York Stock Exchange (“NYSE”) is open and, for financial reporting purposes, as of the report date should the reporting period end on a day that the NYSE is not open. Fair value is generally defined as the price a fund would receive to sell an asset or pay to transfer a liability in an orderly transaction between market participants at the measurement date. By its nature, a fair value price is a good faith estimate of the valuation in a current sale and may not reflect an actual market price. The investments of each Fund are valued pursuant to the policy and procedures developed by the Oversight Committee (the “Committee”) and approved by the Board. The Committee provides oversight of the valuation of investments for the Funds. The Board has responsibility for overseeing the determination of the fair value of investments.
Valuation techniques used to value each Fund���s investments by major category are as follows:
• Equity investments (including registered investment companies that are exchange-traded funds) traded on a recognized securities exchange for which market quotations are readily available are valued at the last sale price or official closing price, as applicable, on the primary market or exchange on which they trade. Equity investments traded on a recognized exchange for which there were no sales on that day are valued at the last published sale price or at fair value.
• Investments in registered investment companies (including money market funds) or other unitized pooled investment
THE SELECT SECTOR SPDR TRUST
NOTES TO FINANCIAL STATEMENTS (continued)
September 30, 2019
vehicles that are not traded on an exchange are valued at that day’s published net asset value (“NAV”) per share or unit.
In the event prices or quotations are not readily available or that the application of these valuation methods results in a price for an investment that is deemed to be not representative of the fair value of such investment, fair value will be determined in good faith by the Committee, in accordance with the valuation policy and procedures approved by the Board.
Fair value pricing could result in a difference between the prices used to calculate a Fund's NAV and the prices used by the Funds' respective Select Sector Index, which in turn could result in a difference between the Fund's performance and the performance of the Fund's respective Select Sector Index. Various inputs are used in determining the value of the Funds' investments.
The Funds value their assets and liabilities at fair value using a fair value hierarchy consisting of three broad levels that prioritize the inputs to valuation techniques giving the highest priority to readily available unadjusted quoted prices in active markets for identical assets or liabilities (Level 1 measurements) and the lowest priority to unobservable inputs (Level 3 measurements) when market prices are not readily available or reliable. The categorization of a value determined for an investment within the hierarchy is based upon the pricing transparency of the investment and is not necessarily an indication of the risk associated with investing in it.
The three levels of the fair value hierarchy are as follows:
• Level 1 – Unadjusted quoted prices in active markets for an identical asset or liability;
• Level 2 – Inputs other than quoted prices included within Level 1 that are observable for the asset or liability either directly or indirectly, including quoted prices for similar assets or liabilities in active markets, quoted prices for identical or similar assets or liabilities in markets that are not considered to be active, inputs other than quoted prices that are observable for the asset or liability (such as exchange rates, financing terms, interest rates, yield curves, volatilities, prepayment speeds, loss severities, credit risks and default rates) or other market-corroborated inputs; and
• Level 3 – Unobservable inputs for the asset or liability, including the Committee’s assumptions used in determining the fair value of investments.
The value of each Fund’s investments according to the fair value hierarchy as of September 30, 2019 is disclosed in each Fund’s respective Schedule of Investments.
Investment Transactions and Income Recognition
Investment transactions are accounted for on trade date for financial reporting purposes. Realized gains and losses from the sale or disposition of investments and foreign exchange transactions, if any, are determined using the identified cost method.
Dividend income and capital gain distributions, if any, are recognized on the ex-dividend date, or when the information becomes available, net of any foreign taxes withheld at source, if any. Non-cash dividends received in the form of stock, if any, are recorded as dividend income at fair value. Distributions received by the Funds may include a return of capital that is estimated by management. Such amounts are recorded as a reduction of the cost of investments or reclassified to capital gains.
Certain Funds invest in real estate investment trusts (“REITs”). REITs determine the tax character of their distributions annually and may characterize a portion of their distributions as a return of capital or capital gain. The Funds' policy is to record all REIT distributions initially as dividend income and re-designate a portion to return of capital or capital gain distributions at year end based on information provided by the REIT and/or SSGA Funds Management, Inc.’s (the “Adviser” or “SSGA FM”) estimates of such re-designations for which actual information has not yet been reported.
Expenses
Certain expenses, which are directly identifiable to a specific Fund, are applied to that Fund within the Trust. Other expenses which cannot be attributed to a specific Fund are allocated in such a manner as deemed equitable, taking into consideration the nature and type of expense and the relative net assets of the Funds within the Trust.
THE SELECT SECTOR SPDR TRUST
NOTES TO FINANCIAL STATEMENTS (continued)
September 30, 2019
Foreign Taxes
The Funds may be subject to foreign taxes (a portion of which may be reclaimable) on income, stock dividends, realized and unrealized capital gains on investments or certain foreign currency transactions. Foreign taxes are recorded in accordance with SSGA FM's understanding of the applicable foreign tax regulations and rates that exist in the foreign jurisdictions in which the Funds invest. These foreign taxes, if any, are paid by the Funds and are reflected in the Statements of Operations, if applicable. Foreign taxes payable or deferred as of September 30, 2019, if any, are disclosed in the Funds' Statements of Assets and Liabilities.
Equalization
The Funds in the Trust follow the accounting practice known as “Equalization” by which a portion of the proceeds from sales and costs of reacquiring Fund shares, equivalent on a per share basis to the amount of distributable net investment income on the date of the transaction, is credited or charged to undistributed net investment income. As a result, undistributed net investment income per share is unaffected by sales or reacquisition of Fund shares. Amounts related to Equalization can be found on the Statements of Changes in Net Assets.
Distributions
Distributions from net investment income, if any, are declared and paid quarterly. Net realized capital gains, if any, are distributed annually. Dividends may be declared and paid more frequently or at any other times to improve Index tracking or to comply with the distribution requirements of the Internal Revenue Code of 1986, as amended (the “Internal Revenue Code”). The amount and character of income and capital gains to be distributed are determined in accordance with applicable tax regulations which may differ from net investment income and realized gains recognized for U.S. GAAP purposes.
3. Fees and Transactions with Affiliates
Advisory and Administration Fee
The Trust, on behalf of each Fund, has entered into an Investment Advisory Agreement with SSGA FM. For its advisory services to the Funds, each Fund pays the Adviser a fee accrued daily and paid monthly. The advisory fee is calculated based upon the average daily net assets of the Trust and allocated pro rata to each Select Sector SPDR Fund based on the relative net assets of each Fund. The advisory fee is a sliding scale fee calculated as follows: (i) 0.05% of average daily net assets of the Trust up to the first $12.5 billion of net assets; (ii) 0.04% of average daily net assets of the Trust up to the next $17.5 billion of net assets; (iii) 0.035% of average daily net assets of the Trust up to the next $20.0 billion of net assets; (iv) 0.03% of average daily net assets of the Trust up to the next $50.0 billion of net assets; (v) 0.0285% of average daily net assets of the Trust up to the next $50.0 billion of net assets; (vi) 0.0271% of average daily net assets of the Trust up to the next $50.0 billion of net assets; and (vii) 0.0256% of average daily net assets on the remainder of net assets of the Trust. From time to time, the Adviser may waive all or a portion of its fees.
Prior to January 31, 2019, the Adviser had contractually agreed to waive a portion of its advisory fee and reimburse certain expenses, so that the annual Fund operating expenses of The Real Estate Select Sector SPDR Fund were limited to no more than 0.1345% of the Fund’s average daily net assets (exclusive of non-recurring account fees and expenses). The Adviser did not waive advisory fees or reimburse expenses for The Real Estate Select Sector SPDR Fund during the year ended September 30, 2019.
The Adviser has contractually agreed to waive a portion of its advisory fee and reimburse certain expenses, until January 31, 2022, so that the annual Fund operating expenses of The Communication Services Select Sector SPDR Fund are limited to no more than 0.1345% of the Fund’s average daily net assets (exclusive of non-recurring account fees and expenses). This contractual fee waiver and/or reimbursement does not provide for the recoupment by the Adviser of any amounts waived or reimbursed. The Adviser may continue such waiver and/or reimbursement from year to year, but there is no guarantee that the Adviser will do so after January 31, 2022. The waiver and/or reimbursement may not be terminated prior to January 31, 2022 except with the approval of the Board. The Adviser did not waive advisory fees or reimburse expenses for The Communication Services Select Sector SPDR Fund during the year ended September 30, 2019.
THE SELECT SECTOR SPDR TRUST
NOTES TO FINANCIAL STATEMENTS (continued)
September 30, 2019
The Trust has also entered into an Administration Agreement with SSGA FM to serve as each Fund's Administrator. For its administration services to the Funds, each Fund pays SSGA FM a fee accrued daily and paid monthly at a rate 0.0006% of its average daily net assets.
Unitary Fee
State Street Bank and Trust Company (“State Street”), an affiliate of the Adviser, serves as custodian, sub-administrator and transfer agent to each Fund of the Trust. A “unitary” fee is paid by each Fund to State Street for custody, sub-administration and transfer agency services provided to the Funds. The unitary fee is calculated based upon the average daily net assets of the Trust and allocated pro rata to each Select Sector SPDR Fund based upon the relative net assets of each Fund. Effective January 1, 2018, the unitary fee structure was amended and is calculated as follows: (i) $0 - $50 billion of net assets of the Trust, 0.015% of average daily net assets; (ii) Over $50 billion - $75 billion of net assets of the Trust, 0.0125% of average daily net assets; (iii) Over $75 billion - $100 billion of net assets of the Trust, 0.01% of average daily net assets; (iv) Over $100 billion - $400 billion of net assets of the Trust, 0.004% of average net assets; and (v) Over $400 billion of net assets of the Trust, 0.0025% of average net assets.
State Street is a wholly-owned subsidiary of State Street Corporation.
Other Transactions with Affiliates - Securities Lending
State Street, an affiliate of the Funds, acts as the securities lending agent for the Funds, pursuant to an amended and restated securities lending authorization agreement dated July 10, 2017.
Proceeds collected by State Street on investment of cash collateral or any fee income are allocated as follows (after deduction of such other amounts payable to State Street under the terms of the securities lending agreement): 85% payable to the Fund, and 15% payable to State Street.
In addition, cash collateral from lending activities is invested in the State Street Navigator Securities Lending Portfolio II, an affiliated fund, for which SSGA FM serves as investment adviser. See Note 9 for additional information regarding securities lending.
Other Transactions with Affiliates
The Funds may invest in affiliated entities, including securities issued by State Street Corporation, affiliated funds, or entities deemed to be affiliates as a result of the Funds owning more than five percent of the entity’s voting securities or outstanding shares. Amounts relating to these transactions during the period ended September 30, 2019 are disclosed in the Schedules of Investments.
Contribution from Affiliate
On July 25, 2019, State Street, an affiliate of the Funds, agreed to make a contribution of $60,421 to The Industrial Select Sector SPDR Fund in connection with a transfer agency matter.
Due to Custodian
In certain circumstances, the Funds may have cash overdrafts with the custodian due to expense payments, capital transactions, trading of securities, investment operations or derivative transactions. The Due to custodian amount, if any, reflects cash overdrawn with State Street, as custodian, who is an affiliate of the Funds.
4. Additional Expenses
Distributor
ALPS Portfolio Solutions Distributor, Inc. (the “Distributor”) serves as the distributor of the shares of each Fund. Pursuant to a Distribution and Service Plan adopted by each Fund in accordance with Rule 12b-1 under the 1940 Act, each Fund is authorized to pay fees, including fees to the Distributor, at an annualized rate of 0.25% of the average daily net assets of the
THE SELECT SECTOR SPDR TRUST
NOTES TO FINANCIAL STATEMENTS (continued)
September 30, 2019
Fund. Effective January 31, 2018, the Board has limited each Fund’s 12b-1 fee to 0.035% of its average daily net assets through at least January 31, 2020.
License Fees
S&P Opco, LLC, a subsidiary of S&P Dow Jones Indices LLC and S&P Global (“S&P”), and NYSE Arca, Inc. (either directly or through affiliates) have entered into a license agreement with respect to each Fund's Select Sector Index. The Trust pays an annual sub-license fee to S&P equal to 0.06% of the average aggregate net assets of all series of the Trust, subject to certain breakpoints. The fees to S&P are generally paid quarterly. Each Fund will pay its proportionate share of the annual sub-license fees based on the relative net assets of each Fund.
5. Trustees’ Fees
The fees and expenses of the Trust’s trustees are paid directly by the Funds. The Independent Trustees are reimbursed for travel and other out-of-pocket expenses in connection with meeting attendance and industry seminars.
6. Investment Transactions
Purchases and sales of investments (excluding in-kind transactions and short term investments) for the period ended September 30, 2019, were as follows:
| | Purchases | | Sales |
The Communication Services Select Sector SPDR Fund
| $804,238,636 | | $752,916,530 |
The Consumer Discretionary Select Sector SPDR Fund
| 765,593,578 | | 763,902,067 |
The Consumer Staples Select Sector SPDR Fund
| 1,070,424,455 | | 1,077,594,467 |
The Energy Select Sector SPDR Fund
| 1,542,524,407 | | 1,264,631,209 |
The Financial Select Sector SPDR Fund
| 929,428,941 | | 917,752,709 |
The Health Care Select Sector SPDR Fund
| 753,506,041 | | 347,330,424 |
The Industrial Select Sector SPDR Fund
| 465,011,110 | | 333,353,181 |
The Materials Select Sector SPDR Fund
| 893,677,411 | | 825,463,880 |
The Real Estate Select Sector SPDR Fund
| 136,693,014 | | 86,466,624 |
The Technology Select Sector SPDR Fund
| 1,113,983,127 | | 1,146,273,161 |
The Utilities Select Sector SPDR Fund
| 426,786,553 | | 431,464,678 |
For the period ended September 30, 2019, the following Funds had in-kind contributions, redemptions and net realized gains/losses in the amounts as follows:
| | In-kind
Contributions | | In-kind
Redemptions | | In-kind Net
Realized
Gains/(Losses) |
The Communication Services Select Sector SPDR Fund
| $9,474,599,182 | | $5,692,420,974 | | $325,657,114 |
The Consumer Discretionary Select Sector SPDR Fund
| 15,194,460,573 | | 17,563,551,660 | | 2,186,100,637 |
The Consumer Staples Select Sector SPDR Fund
| 21,080,821,010 | | 17,803,142,749 | | 1,353,784,266 |
The Energy Select Sector SPDR Fund
| 16,005,635,833 | | 20,652,310,300 | | (194,827,930) |
The Financial Select Sector SPDR Fund
| 21,845,092,329 | | 29,886,252,373 | | 956,914,905 |
The Health Care Select Sector SPDR Fund
| 19,342,559,628 | | 21,051,189,387 | | 2,353,329,253 |
The Industrial Select Sector SPDR Fund
| 17,339,557,621 | | 20,110,928,791 | | 545,928,389 |
The Materials Select Sector SPDR Fund
| 8,343,835,433 | | 8,757,494,973 | | 326,202,493 |
The Real Estate Select Sector SPDR Fund
| 3,160,186,395 | | 2,641,720,901 | | 269,219,093 |
The Technology Select Sector SPDR Fund
| 14,189,414,730 | | 15,801,358,571 | | 3,216,736,639 |
The Utilities Select Sector SPDR Fund
| 19,712,270,784 | | 17,995,625,634 | | 1,091,735,471 |
THE SELECT SECTOR SPDR TRUST
NOTES TO FINANCIAL STATEMENTS (continued)
September 30, 2019
7. Shareholder Transactions
Each Fund issues and redeems its shares, at NAV, by each Fund only in aggregations of a specified number of shares or multiples thereof (“Creation Units”). Except when aggregated in Creation Units, shares of each Fund are not redeemable. Transactions in capital shares for each Fund are disclosed in detail in the Statements of Changes in Net Assets.
The consideration for the purchase of Creation Units of a Fund may consist of the in-kind deposit of a designated portfolio of securities and a specified amount of cash. Investors purchasing and redeeming Creation Units may pay a purchase transaction fee and a redemption transaction fee directly to the Trust and/or custodian, to offset transfer and other transaction costs associated with the issuance and redemption of Creation Units, including Creation Units for cash. An additional variable fee may be charged for certain transactions. Such variable charges, if any, are included in “Other Capital” on the Statements of Changes in Net Assets.
8. Income Tax Information
The Funds have qualified and intend to continue to qualify as regulated investment companies under Subchapter M of the Internal Revenue Code. Each Fund will not be subject to federal income taxes to the extent it distributes its taxable income, including any net realized capital gains, for each fiscal year. Therefore, no provision for federal income tax is required.
The Funds file federal and various state and local tax returns as required. No income tax returns are currently under examination. Generally, the federal returns are subject to examination by the Internal Revenue Service for a period of three years from date of filing, while the state returns may remain open for an additional year depending upon jurisdiction. SSGA FM has analyzed the Funds’ tax positions taken on tax returns for all open years and does not believe there are any uncertain tax positions that would require recognition of a tax liability.
Distributions to shareholders are recorded on ex-dividend date. Income dividends and gain distributions are determined in accordance with income tax rules and regulations, which may differ from generally accepted accounting principles.
Certain capital accounts in the financial statements have been adjusted for permanent book- tax differences. These adjustments have no impact on NAV or results of operations. Temporary book-tax differences will reverse in the future. These book-tax differences are primarily due to differing treatments for distribution in excess of current earnings, nontaxable dividend adjustments to income, in-kind transactions, expired capital loss carryforwards, and wash sale loss deferrals.
The tax character of distributions paid during the period ended September 30, 2019, was as follows:
| | Ordinary
Income | | Long-Term
Capital Gains | | Total |
The Communication Services Select Sector SPDR Fund
| $45,484,659 | | $— | | $45,484,659 |
The Consumer Discretionary Select Sector SPDR Fund
| 184,010,473 | | — | | 184,010,473 |
The Consumer Staples Select Sector SPDR Fund
| 320,699,124 | | — | | 320,699,124 |
The Energy Select Sector SPDR Fund
| 437,805,660 | | — | | 437,805,660 |
The Financial Select Sector SPDR Fund
| 502,942,678 | | — | | 502,942,678 |
The Health Care Select Sector SPDR Fund
| 303,471,062 | | — | | 303,471,062 |
The Industrial Select Sector SPDR Fund
| 219,261,944 | | — | | 219,261,944 |
The Materials Select Sector SPDR Fund
| 86,141,038 | | — | | 86,141,038 |
The Real Estate Select Sector SPDR Fund
| 100,374,124 | | — | | 100,374,124 |
The Technology Select Sector SPDR Fund
| 287,183,470 | | — | | 287,183,470 |
The Utilities Select Sector SPDR Fund
| 306,206,442 | | — | | 306,206,442 |
THE SELECT SECTOR SPDR TRUST
NOTES TO FINANCIAL STATEMENTS (continued)
September 30, 2019
The tax character of distributions paid during the period ended September 30, 2018, was as follows:
| | Ordinary
Income | | Long-Term
Capital Gains | | Tax Return
of Capital | | Total |
The Communication Services Select Sector SPDR Fund
| $ 1,080,224 | | $ — | | $ 1,553,436 | | $ 2,633,660 |
The Consumer Discretionary Select Sector SPDR Fund
| 177,386,572 | | — | | — | | 177,386,572 |
The Consumer Staples Select Sector SPDR Fund
| 247,305,066 | | — | | — | | 247,305,066 |
The Energy Select Sector SPDR Fund
| 484,431,572 | | — | | — | | 484,431,572 |
The Financial Select Sector SPDR Fund
| 556,478,187 | | — | | — | | 556,478,187 |
The Health Care Select Sector SPDR Fund
| 258,645,776 | | — | | — | | 258,645,776 |
The Industrial Select Sector SPDR Fund
| 234,789,999 | | — | | — | | 234,789,999 |
The Materials Select Sector SPDR Fund
| 87,749,456 | | — | | — | | 87,749,456 |
The Real Estate Select Sector SPDR Fund
| 89,715,446 | | — | | — | | 89,715,446 |
The Technology Select Sector SPDR Fund
| 309,252,206 | | — | | — | | 309,252,206 |
The Utilities Select Sector SPDR Fund
| 251,480,540 | | — | | — | | 251,480,540 |
At September 30, 2019, the components of distributable earnings on a tax basis were as follows:
| | Undistributed
Ordinary Income | | Capital Loss
Carryforwards | | Undistributed
Long-Term
Capital Gains | | Net Unrealized
Gains (Losses) | | Total |
The Communication Services Select Sector SPDR Fund
| $— | | $(57,575,102) | | $— | | $(94,472,314) | | $(152,047,416) |
The Consumer Discretionary Select Sector SPDR Fund
| 17,680,695 | | (829,255,317) | | — | | (513,431,286) | | (1,325,005,908) |
The Consumer Staples Select Sector SPDR Fund
| — | | (754,045,536) | | — | | (292,302,648) | | (1,046,348,184) |
The Energy Select Sector SPDR Fund
| 384,696,744 | | (3,771,507,641) | | — | | (4,450,778,306) | | (7,837,589,203) |
The Financial Select Sector SPDR Fund
| 24,841,379 | | (538,755,120) | | — | | (813,249,742) | | (1,327,163,483) |
The Health Care Select Sector SPDR Fund
| 158,906,683 | | (411,792,132) | | — | | (2,078,873,967) | | (2,331,759,416) |
The Industrial Select Sector SPDR Fund
| 1,387,336 | | (478,946,418) | | — | | (1,216,384,802) | | (1,693,943,884) |
The Materials Select Sector SPDR Fund
| 2,060,413 | | (764,673,392) | | — | | (455,277,911) | | (1,217,890,890) |
The Real Estate Select Sector SPDR Fund
| — | | (37,936,040) | | — | | 179,430,078 | | 141,494,038 |
The Technology Select Sector SPDR Fund
| 1,387,537 | | (873,931,030) | | — | | 1,204,579,565 | | 332,036,072 |
The Utilities Select Sector SPDR Fund
| 7,174,911 | | (682,586,816) | | — | | 613,444,657 | | (61,967,248) |
As of September 30, 2019, the following Funds had capital loss carryforwards available to offset future realized capital gains as follows:
| | Non-Expiring
Short Term | | Non-Expiring
Long Term |
The Communication Services Select Sector SPDR Fund
| $51,401,673 | | $6,173,429 |
The Consumer Discretionary Select Sector SPDR Fund
| 231,175,116 | | 598,080,201 |
The Consumer Staples Select Sector SPDR Fund
| 49,156,196 | | 704,889,340 |
The Energy Select Sector SPDR Fund
| 250,100,644 | | 3,521,406,997 |
The Financial Select Sector SPDR Fund
| 282,248,355 | | 256,506,765 |
The Health Care Select Sector SPDR Fund
| 72,985,251 | | 338,806,881 |
The Industrial Select Sector SPDR Fund
| 94,618,914 | | 384,327,504 |
The Materials Select Sector SPDR Fund
| 233,832,389 | | 530,841,003 |
The Real Estate Select Sector SPDR Fund
| 33,494,399 | | 4,441,641 |
The Technology Select Sector SPDR Fund
| 241,259,588 | | 632,671,442 |
The Utilities Select Sector SPDR Fund
| 79,754,834 | | 602,831,982 |
THE SELECT SECTOR SPDR TRUST
NOTES TO FINANCIAL STATEMENTS (continued)
September 30, 2019
As of September 30, 2019, gross unrealized appreciation and gross unrealized depreciation of investments based on cost for federal income tax purposes were as follows:
| | Tax
Cost | | Gross
Unrealized
Appreciation | | Gross
Unrealized
Depreciation | | Net Unrealized
Appreciation
(Depreciation) |
The Communication Services Select Sector SPDR Fund
| $6,135,348,457 | | $180,016,098 | | $274,488,412 | | $(94,472,314) |
The Consumer Discretionary Select Sector SPDR Fund
| 14,524,943,962 | | 644,907,947 | | 1,158,339,233 | | (513,431,286) |
The Consumer Staples Select Sector SPDR Fund
| 14,382,123,109 | | 631,735,937 | | 924,038,585 | | (292,302,648) |
The Energy Select Sector SPDR Fund
| 14,457,058,275 | | 16,016,749 | | 4,466,795,053 | | (4,450,778,304) |
The Financial Select Sector SPDR Fund
| 23,370,673,501 | | 564,372,853 | | 1,377,622,595 | | (813,249,742) |
The Health Care Select Sector SPDR Fund
| 18,913,016,652 | | 508,904,420 | | 2,587,778,387 | | (2,078,873,967) |
The Industrial Select Sector SPDR Fund
| 11,070,944,129 | | 181,469,261 | | 1,397,854,063 | | (1,216,384,802) |
The Materials Select Sector SPDR Fund
| 4,724,611,772 | | 93,320,898 | | 548,598,809 | | (455,277,911) |
The Real Estate Select Sector SPDR Fund
| 3,719,259,884 | | 351,097,462 | | 171,667,384 | | 179,430,078 |
The Technology Select Sector SPDR Fund
| 21,337,744,821 | | 1,816,411,925 | | 611,832,360 | | 1,204,579,565 |
The Utilities Select Sector SPDR Fund
| 10,667,913,652 | | 704,591,742 | | 91,147,085 | | 613,444,657 |
9. Securities Lending
Each Fund may lend securities to qualified broker-dealers or institutional investors. The loans are secured at all times by cash, cash equivalents or U.S. government securities in an amount at least equal to the market value of the securities loaned, plus accrued interest and dividends, determined on a daily basis and adjusted accordingly. The value of the collateral with respect to a loaned security may be temporarily more or less than the value of a security due to market fluctuations of securities values. With respect to each loan, if on any U.S. business day the aggregate market value of securities collateral plus cash collateral is less than the aggregate market value of the securities which are subject to the loan, the borrower will be notified to provide additional collateral on the next business day.
The Funds will regain record ownership of loaned securities to exercise certain beneficial rights; however, the Funds may bear the risk of delay in recovery of, or even loss of rights in the securities loaned should the borrower fail financially. In addition, a Fund will bear the risk of loss of any cash collateral that it may invest. Each Fund receives compensation for lending its securities from interest or dividends earned on the cash, cash equivalents or U.S. government securities held as collateral, net of fee rebates paid to the borrower and net of fees paid to State Street as the lending agent. Additionally, a Fund will receive a fee from the borrower for non-cash collateral equal to a percentage of the market value of the loaned securities.
The market value of securities on loan as of September 30, 2019, and the value of the invested cash collateral are disclosed in the Funds' Statements of Assets and Liabilities. Non-cash collateral is not disclosed in the Funds’ Statements of Assets and Liabilities as it is held by the lending agent on behalf of the Funds, and the Funds do not have the ability to re-hypothecate those securities. Securities lending income, as disclosed in the Funds’ Statements of Operations, represents the income earned from the non-cash collateral and the investment of cash collateral, net of fee rebates paid to the borrower and net of fees paid to State Street as lending agent.
The following is a summary of the Fund’s securities lending agreements and related cash and non-cash collateral received as of September 30, 2019:
| Fund | | Market Value of
Securities on Loan | | Cash
Collateral
Received | | Non-Cash
Collateral
Received * | | Total
Collateral
Received |
The Communication Services Select Sector SPDR Fund
| | $ 31,799,686 | | $ 4,017,892 | | $ 28,709,226 | | $ 32,727,118 |
The Consumer Discretionary Select Sector SPDR Fund
| | 303,645,362 | | 84,833,593 | | 222,471,395 | | 307,304,988 |
The Consumer Staples Select Sector SPDR Fund
| | 166,477,122 | | 121,441,491 | | 48,402,863 | | 169,844,354 |
The Energy Select Sector SPDR Fund
| | 4,819,528 | | 4,960,705 | | — | | 4,960,705 |
The Financial Select Sector SPDR Fund
| | 95,277,952 | | 18,432,206 | | 78,405,041 | | 96,837,247 |
The Health Care Select Sector SPDR Fund
| | 41,570,326 | | 28,805,353 | | 13,095,993 | | 41,901,346 |
The Industrial Select Sector SPDR Fund
| | 143,396,589 | | 57,921,882 | | 87,765,204 | | 145,687,086 |
THE SELECT SECTOR SPDR TRUST
NOTES TO FINANCIAL STATEMENTS (continued)
September 30, 2019
| Fund | | Market Value of
Securities on Loan | | Cash
Collateral
Received | | Non-Cash
Collateral
Received * | | Total
Collateral
Received |
The Materials Select Sector SPDR Fund
| | $115,926,239 | | $72,906,398 | | $43,496,555 | | $116,402,953 |
The Real Estate Select Sector SPDR Fund
| | 35,770,426 | | 16,954,517 | | 19,835,409 | | 36,789,926 |
The Technology Select Sector SPDR Fund
| | 321,851,082 | | 130,802,180 | | 196,994,266 | | 327,796,446 |
The Utilities Select Sector SPDR Fund
| | 284,065,856 | | — | | 290,223,825 | | 290,223,825 |
| * | The non-cash collateral includes U.S. Treasuries and U.S. Government Agency securities. |
The following table reflects a breakdown of transactions accounted for as secured borrowings, the gross obligation by the type of collateral pledged or securities loaned, and the remaining contractual maturity of those transactions as of September 30, 2019:
| | | | | Remaining Contractual Maturity of the Agreements
As of September 30, 2019 |
| Fund | | Securities
Lending
Transactions | | Overnight
and
Continuous | | <30 Days | | Between
30 & 90
Days | | >90 Days | | Total
Borrowings | | Gross Amount
of Recognized
Liabilities for
Securities Lending Transactions |
The Communication Services Select Sector SPDR Fund
| | Common Stocks | | $4,017,892 | | $— | | $— | | $— | | $4,017,892 | | $4,017,892 |
The Consumer Discretionary Select Sector SPDR Fund
| | Common Stocks | | 84,833,593 | | — | | — | | — | | 84,833,593 | | 84,833,593 |
The Consumer Staples Select Sector SPDR Fund
| | Common Stocks | | 121,441,491 | | — | | — | | — | | 121,441,491 | | 121,441,491 |
The Energy Select Sector SPDR Fund
| | Common Stocks | | 4,960,705 | | — | | — | | — | | 4,960,705 | | 4,960,705 |
The Financial Select Sector SPDR Fund
| | Common Stocks | | 18,432,206 | | — | | — | | — | | 18,432,206 | | 18,432,206 |
The Health Care Select Sector SPDR Fund
| | Common Stocks | | 28,805,353 | | — | | — | | — | | 28,805,353 | | 28,805,353 |
The Industrial Select Sector SPDR Fund
| | Common Stocks | | 57,921,882 | | — | | — | | — | | 57,921,882 | | 57,921,882 |
The Materials Select Sector SPDR Fund
| | Common Stocks | | 72,906,398 | | — | | — | | — | | 72,906,398 | | 72,906,398 |
The Real Estate Select Sector SPDR Fund
| | Common Stocks | | 16,954,517 | | — | | — | | — | | 16,954,517 | | 16,954,517 |
The Technology Select Sector SPDR Fund
| | Common Stocks | | 130,802,180 | | — | | — | | — | | 130,802,180 | | 130,802,180 |
10. Risks
Concentration Risk
As a result of the Funds' ability to invest a large percentage of their assets in obligations of issuers within the same country, state, region, currency or economic sector, an adverse economic, business or political development may affect the value of the Funds' investments more than if the Funds were more broadly diversified.
Market and Credit Risk
In the normal course of business, the Funds trade financial instruments and enter into financial transactions where risk of potential loss exists due to changes in the general economic conditions and fluctuations of the market (market risk). Additionally, a Fund may also be exposed to credit risk in the event that an issuer or guarantor fails to perform or that an institution or entity with which the Fund has unsettled or open transactions defaults.
11. Subsequent Events
Management has evaluated the impact of all subsequent events on the Funds through the date the financial statements were issued and has determined that there were no subsequent events requiring adjustment or disclosure in the financial statements.
THE SELECT SECTOR SPDR TRUST
REPORT OF INDEPENDENT REGISTERED PUBLIC
ACCOUNTING FIRM
To the Board of Trustees of the Select Sector SPDR Trust and Shareholders of each of the funds listed below
Opinions on the Financial Statements
We have audited the accompanying statements of assets and liabilities, including the schedules of investments, of each of the funds listed below (constituting the Select Sector SPDR Trust, hereafter collectively referred to as the "Funds") as of September 30, 2019, the related statements of operations and of changes in net assets for each of the periods indicated below, including the related notes, and the financial highlights for each of the periods indicated therein (collectively referred to as the “financial statements”). In our opinion, the financial statements present fairly, in all material respects, the financial position of each of the Funds as of September 30, 2019, the results of each of their operations and the changes in each of their net assets for each of the periods indicated below, and each of the financial highlights for each of the periods indicated therein in conformity with accounting principles generally accepted in the United States of America.
The Communication Services Select Sector SPDR Fund (2)
The Consumer Discretionary Select Sector SPDR Fund (1)
The Consumer Staples Select Sector SPDR Fund (1)
The Energy Select Sector SPDR Fund (1)
The Financial Select Sector SPDR Fund (1)
The Health Care Select Sector SPDR Fund (1)
The Industrial Select Sector SPDR Fund (1)
The Materials Select Sector SPDR Fund (1)
The Real Estate Select Sector SPDR Fund (1)
The Technology Select Sector SPDR Fund (1)
The Utilities Select Sector SPDR Fund (1)
(1) Statement of operations for the year ended September 30, 2019 and statements of changes in net assets for the years ended September 30, 2019 and 2018
(2) Statement of operations for the year ended September 30,2019 and statements of changes in net assets for the year ended September 30, 2019 and for the period June 18, 2018 (inception date) through September 30, 2018
Basis for Opinions
These financial statements are the responsibility of the Funds’ management. Our responsibility is to express an opinion on the Funds’ financial statements based on our audits. We are a public accounting firm registered with the Public Company Accounting Oversight Board (United States) (“PCAOB”) and are required to be independent with respect to the Funds in accordance with the U.S. federal securities laws and the applicable rules and regulations of the Securities and Exchange Commission and the PCAOB.
We conducted our audits of these financial statements in accordance with the standards of the PCAOB. Those standards require that we plan and perform the audit to obtain reasonable assurance about whether the financial statements are free of material misstatement, whether due to error or fraud.
Our audits included performing procedures to assess the risks of material misstatement of the financial statements, whether due to error or fraud, and performing procedures that respond to those risks. Such procedures included examining, on a test basis, evidence regarding the amounts and disclosures in the financial statements. Our audits also included evaluating the accounting principles used and significant estimates made by management, as well as evaluating the overall presentation of the financial statements. Our procedures included confirmation of securities owned as of September 30, 2019 by
THE SELECT SECTOR SPDR TRUST
REPORT OF INDEPENDENT REGISTERED PUBLIC
ACCOUNTING FIRM
correspondence with the custodian and brokers; when replies were not received from brokers, we performed other auditing procedures. We believe that our audits provide a reasonable basis for our opinions.
/s/PricewaterhouseCoopers LLP
Boston, Massachusetts
November 26, 2019
We have served as the auditor of one or more investment companies in the SPDR Funds since 1993.
THE SELECT SECTOR SPDR TRUST
OTHER INFORMATION
September 30, 2019 (Unaudited)
Expense Example
As a shareholder of a Fund, you incur two types of costs: (1) transaction costs, including sales charges (loads), if applicable, on purchase payments, reinvested dividends, or other distributions and (2) ongoing costs, including advisory fees and to the extent applicable, distribution (12b-1) and/or service fees; and other Fund expenses. This example is intended to help you understand your ongoing costs (in dollars) of investing in a Fund and to compare these costs with the ongoing costs of investing in other mutual funds. It is based on an investment of $1,000 made at the beginning of the period shown and held for the entire period from April 1, 2019 to September 30, 2019.
The table below illustrates your Fund’s cost in two ways:
Based on actual fund return ——This section helps you to estimate the actual expenses that you paid over the period. The “Ending Account Value” shown is derived from each Fund's actual return, and the third column shows the dollar amount that would have been paid by an investor who started with $1,000 in each Fund. You may use the information here, together with the amount you invested, to estimate the expenses that you paid over the period. To do so, simply divide your account value by $1,000 (for example, an $8,600 account value divided by $1,000 = 8.6), then multiply the result by the number given for the Fund under the heading “Expenses Paid During Period”.
Based on hypothetical 5% return ——This section is intended to help you compare your Fund’s costs with those of other mutual funds. It assumes that the Fund had a yearly return of 5% before expenses, but that the expense ratio is unchanged. In this case, because the return used is not the Fund’s actual return, the results do not apply to your investment. The example is useful in making comparisons because the SEC requires all mutual funds to calculate expenses based on a 5% return. You can assess your Fund’s costs by comparing this hypothetical example with the hypothetical examples that appear in shareholder reports of other funds.
Please note that the expenses shown in the table are meant to highlight your ongoing costs only and do not reflect any transaction costs, such as sales load charges (loads). Therefore, the hypothetical 5% return section of the table is useful in comparing ongoing costs only, and will not help you determine the relative total costs of owning different funds. In addition, if these transaction costs were included, your costs would have been higher.
| | | | Actual | | Hypothetical (assuming a 5%
return before expenses) |
| | Annualized
Expense Ratio | | Ending Account
Value | | Expenses Paid
During Period(a) | | Ending Account
Value | | Expenses Paid
During Period(a) |
The Communication Services Select Sector SPDR Fund
| 0.13% | | $1,063.60 | | $0.67 | | $1,024.40 | | $0.66 |
The Consumer Discretionary Select Sector SPDR Fund
| 0.13 | | 1,067.50 | | 0.67 | | 1,024.40 | | 0.66 |
The Consumer Staples Select Sector SPDR Fund
| 0.13 | | 1,109.50 | | 0.69 | | 1,024.40 | | 0.66 |
The Energy Select Sector SPDR Fund
| 0.13 | | 911.60 | | 0.62 | | 1,024.40 | | 0.66 |
The Financial Select Sector SPDR Fund
| 0.13 | | 1,100.90 | | 0.68 | | 1,024.40 | | 0.66 |
The Health Care Select Sector SPDR Fund
| 0.13 | | 990.70 | | 0.65 | | 1,024.40 | | 0.66 |
The Industrial Select Sector SPDR Fund
| 0.13 | | 1,045.10 | | 0.67 | | 1,024.40 | | 0.66 |
The Materials Select Sector SPDR Fund
| 0.13 | | 1,060.30 | | 0.67 | | 1,024.40 | | 0.66 |
The Real Estate Select Sector SPDR Fund
| 0.13 | | 1,103.20 | | 0.69 | | 1,024.40 | | 0.66 |
The Technology Select Sector SPDR Fund
| 0.13 | | 1,095.20 | | 0.68 | | 1,024.40 | | 0.66 |
The Utilities Select Sector SPDR Fund
| 0.13 | | 1,130.00 | | 0.69 | | 1,024.40 | | 0.66 |
| (a) | Expenses are equal to the Fund's annualized net expense ratio multiplied by the average account value of the period, multiplied by 183, then divided by 365. |
THE SELECT SECTOR SPDR TRUST
OTHER INFORMATION (continued)
September 30, 2019 (Unaudited)
Tax Information
For federal income tax purposes, the following information is furnished with respect to the distributions of the Trust for its fiscal year ended September 30, 2019.
Dividends Received Deduction
Each Fund reports the maximum amount allowable of its net taxable income as eligible for the corporate dividends received deduction.
Qualified Dividend Income
A portion of dividends distributed by the Funds during the fiscal year ended September 30, 2019 are considered qualified dividend income and are eligible for reduced tax rates. These lower rates range from 5% to 20% depending on the individual’s tax bracket. Each Fund reports the maximum amount allowable of its net taxable income as qualified dividend income as provided in the Jobs and Growth Tax Relief Reconciliation Act of 2003.
Qualified Business Income Deduction
Each Fund reports the maximum amount allowable of qualified REIT dividends eligible for the 20% qualified business income deduction under Section 199A.
Premium/Discount Information
Information regarding how often the Shares of each Fund traded on the exchange at a price above (i.e., at a premium) or below (i.e., at a discount) the NAV of the Fund during the past calendar year can be found atwww.sectorspdrs.com.
Proxy Voting Policies and Procedures and Records
A description of the Trust’s proxy voting policies and procedures that are used by the Funds’ investment adviser to vote proxies relating to the Funds’ portfolio of securities are available (i) without charge, upon request by calling 1-866-Sector-ETF (1-866-732-8673) (toll free) or (ii) on the SEC’s website atwww.sec.gov.
Information regarding how the investment adviser voted for the 12-month period ended June 30, is available by August 31 of each year by calling the same number, on the SEC’s website atwww.sec.gov, and on the Funds’ website atwww.sectorspdrs.com.
Quarterly Portfolio Schedule
Following the Funds' first and third fiscal quarter-ends, a complete schedule of investments is filed with the SEC as an exhibit on Form N-PORT, which can be found on the SEC's website atwww.sec.gov. The Funds’ schedules of investments are available upon request, without charge, by calling 1-866-Sector-ETF (1-866-732-8673) and on the Funds’ website at www.sectorspdrs.com.
Advisory Contract Renewal
At an in-person meeting held on May 8, 2019 (the “May Meeting”), the Board of Trustees of The Select Sector SPDR® Trust (the “Trust”) considered the renewal of the Amended and Restated Investment Advisory Agreement dated December 1, 2003, as amended effective June 18, 2018 (the “Agreement”), between the Trust and SSGA Funds Management, Inc. (the “Adviser”) with respect to each series of the Trust (each a “Fund” and collectively, the “Funds”). The Trustees who are not “interested persons” of the Trust within the meaning of the Investment Company Act of 1940, as amended (the “1940 Act”) (the “Independent Trustees”), also met separately with their independent legal counsel during a meeting held on April 17, 2019 (the “April Meeting”) to consider the Agreement and the materials provided by the Adviser and State Street Bank and Trust Company (“State Street”) in response to a request from independent legal counsel on their behalf. The April Meeting included a presentation by representatives of the Adviser and State Street during which the Independent Trustees and independent legal counsel were able to pose questions. Following the April Meeting, independent legal counsel on behalf of the Independent Trustees requested certain clarifications and supplements to the materials provided, and those materials were considered at the
THE SELECT SECTOR SPDR TRUST
OTHER INFORMATION (continued)
September 30, 2019 (Unaudited)
May Meeting, during which the Independent Trustees also met separately with their independent legal counsel. In deciding whether to renew the Agreement, the Trustees considered various factors, including, among others, (i) the nature, extent and quality of the services provided by the Adviser under the Agreement, (ii) the investment performance of the Funds, (iii) the costs to the Adviser of its services and the profits and other benefits realized by the Adviser and its affiliate, State Street, from their relationships with the Trust, and (iv) the extent to which economies of scale would be realized if and as the Funds grow and whether the fee levels in the Agreement reflect a sharing of any such economies of scale.
Nature, Extent and Quality of Services
In considering the nature, extent and quality of the services provided by the Adviser, the Trustees relied on their prior experience as Trustees of the Trust, as well as on the materials provided at their regular quarterly board meetings and those provided specifically for purposes of reviewing the Agreement. They noted that under the Agreement the Adviser is responsible for: (i) managing the investment operations of each of the Funds in accordance with the Fund’s investment objective and policies, applicable legal and regulatory requirements, and the instructions of the Trustees; (ii) providing necessary and appropriate reports and information to the Trustees; (iii) maintaining all necessary books and records pertaining to the Trust’s securities transactions; and (iv) furnishing each Fund with the assistance, cooperation and information necessary for the Fund to meet various legal requirements regarding registration and reporting. They noted the distinctive nature of the Funds, as exchange-traded funds (“ETFs”) investing in sectors of the S&P 500 Index, and the experience and expertise appropriate in an adviser to funds of that nature. The Trustees reviewed the background and experience of the Adviser’s senior management, including those individuals responsible for the investment and compliance operations of the Trust, and the responsibilities of the latter with respect to the Funds. They also considered the resources, operational structures and practices of the Adviser in managing the Funds’ portfolios, in monitoring and securing each Fund’s compliance with its investment objective and policies and with applicable law and regulations, and in seeking best execution of portfolio transactions. Drawing upon the materials provided and their general knowledge of the business of the Adviser and its affiliate, State Street Global Advisors, with which the Adviser shares all of its senior personnel, the Trustees took into account the experience, resources and strength of the Adviser and its affiliates in the areas of indexed products generally, and ETFs in particular. On the basis of this review, the Trustees determined that the nature and extent of the services provided by the Adviser to the Trust were appropriate, had been of high quality during the past year, and could be expected to remain so.
Investment Performance of the Funds
The Trustees noted that, in view of the distinctive investment objective of each Fund, the investment performance of the Funds in absolute terms was not of the importance that normally attaches to the performance of actively managed funds. Of more importance to the Trustees was the extent to which each Fund achieved its objective to provide investment results that, before expenses, correspond generally to the price and yield performance of publicly traded equity securities of companies in its applicable index. Drawing upon information provided at the April Meeting and at the May Meeting, and upon reports provided to the Trustees by the Adviser throughout the preceding year, the Trustees determined that the Funds had tracked their sector indexes within an acceptable range; they further concluded, on the basis of the data available (see discussion in “Comparison of Fees and Expense Ratios” below), that the expense ratios of the Funds were among the lowest of all of their direct competitors. Accordingly, they concluded that the performance of each Fund was satisfactory.
Profitability to the Adviser and its Affiliates
The Trustees considered the profitability of the advisory arrangement with the Funds to the Adviser and of the Trust’s relationship with the Adviser’s affiliate, State Street, in its role as Sub-Administrator, Transfer Agent and Custodian. The Trustees also considered the profitability from the fees received and income earned by State Street as Securities Lending Agent for the Trust. The Trustees received data on the Funds’ profitability to the Adviser for calendar year 2018 as well as 2017 profitability data, along with data on the Trust’s profitability to State Street for the same and prior periods. The Trustees reviewed with representatives from both the Adviser and State Street the methods by which expenses were allocated to the Trust and to each of the Funds. On the basis of this information and discussions at the April Meeting and the May Meeting, the Trustees concluded that, to the extent that the Adviser’s and State Street’s relationships with the Trust had been profitable to either or both of those entities, the profitability at current asset levels was not such as to render the advisory fee excessive.
THE SELECT SECTOR SPDR TRUST
OTHER INFORMATION (continued)
September 30, 2019 (Unaudited)
Other Benefits to the Adviser or its Affiliates
In considering whether the Adviser benefits in other ways from its relationship with the Trust, the Trustees noted that the Adviser does not currently use the Funds’ assets for, or participate in, third party soft dollar arrangements. It was further noted that the Trust’s brokerage transactions are not effected through the Adviser or any of its affiliates. The Trustees noted that the Adviser serves as Administrator to the Trust and that State Street, an affiliate of the Adviser, serves the Trust as Sub-Administrator, Transfer Agent and Custodian, as well as Securities Lending Agent. The Trustees also noted that, based on their review of the arrangements for those services, any benefit the Adviser or the Adviser’s affiliate receives or had received from providing those services appears to be appropriate. The Trustees concluded that, to the extent that the Adviser or its affiliates derive other benefits or will derive other benefits from their relationships with the Trust, those benefits are not such as to render the Adviser’s fees excessive.
Economies of Scale
On the basis of their discussions with management and their analysis of information provided at and prior to the May Meeting, the Trustees determined that the nature of the Funds and their operations is such that the potential exists for the Adviser to realize economies of scale in the management of the Funds as the Funds grow in size. They were also of the view that these economies of scale were being shared with the Funds by virtue of an advisory fee, set at a relatively low level since the inception of the Trust, that subsumed economies of scale in the fee itself. Furthermore, the Trustees took into consideration the fact that, in order to ensure that if and as the Funds grow in size the economies of scale resulting from this growth would be shared with the Funds, the Adviser and State Street had each previously agreed to institute one or more breakpoints in their respective fee schedules, with the Adviser agreeing most recently to amend the Agreement effective June 1, 2014, to add three additional breakpoints.
The Independent Trustees also noted that State Street had agreed to continue to the same aggregate fee schedule for sub-administration, transfer agency and custody services for the Funds which existed prior to the Adviser assuming administration services on June 1, 2015 and to amend the agreements as Administrator, Transfer Agent and Custodian to add a breakpoint. Furthermore, the Trustees took into consideration the fact that State Street had agreed to amend its agreements as Sub-Administrator, Transfer Agent and Custodian for the Trust to add additional breakpoints, effective May 1, 2017, and that State Street had further amended its agreements to consolidate fees and lower its effective fee rate, effective January 1, 2018.
Comparison of Fees and Expense Ratios
In order better to evaluate the Funds’ advisory fee, the Independent Trustees requested information with respect to expense ratios and advisory fees of comparable funds, and the Adviser provided: (1) data from Broadridge Financial Solutions, Inc. (“Broadridge”) on peer sector funds, and (2) data obtained from a Broadridge database of peer sector funds. The Independent Trustees also requested, and the Adviser provided, information on the advisory fees charged to other clients with comparable investment objectives, and reviewed the differences in services provided to such clients, including the Adviser’s institutional accounts. The Trustees found that, because of the distinctive nature of the Funds, the universe of comparable funds and accounts was limited. Moreover, they noted that because many ETFs pay a unitary advisory fee, encompassing all or virtually all of the ETFs’ operating expenses, in many cases where a Fund’s advisory fee covered only advisory services, as reflected in the materials, the Fund’s fee may appear to be low relative to its ETF peers. The Trustees then reviewed comparable expense ratios and noted that the overall expense ratio of each Fund was either among the lowest or below the average of its domestic sector ETF peers, but also noted that each Fund (other than The Real Estate Select Sector SPDR® Fund) continued to be larger than all of its ETF sector peers. The Independent Trustees noted that this had prompted them in past years to request that new breakpoints be added to the fee schedules of both the Agreement and the unitary fee payable under the Sub-Administration Agreement, Custodian Agreement and Transfer Agency Agreement, and that most recently the Adviser and State Street had agreed to additional breakpoints under the Agreement effective June 1, 2014 and under the Sub-Administration Agreement, Custodian Agreement and Transfer Agency Agreement effective May 1, 2017, as noted above. The Trustees noted that at current asset levels, shareholders are benefiting from breakpoints and should continue to benefit in the future with additional growth in assets. The Trustees concluded that the data available provided some indirect confirmation of the reasonableness of the Adviser’s fees.
THE SELECT SECTOR SPDR TRUST
OTHER INFORMATION (continued)
September 30, 2019 (Unaudited)
Conclusion
Based on their review, the Trustees, including a majority of the Independent Trustees, as required by the 1940 Act, concluded that the terms of the Agreement are fair and reasonable and that renewal of the Agreement is in the best interests of each Fund. In deciding to approve the renewal of the Agreement, the Board did not identify any single factor or group of factors as all important or controlling and considered all factors together, and the Board did not allot a particular weight to any one factor or group of factors. They reasoned that, considered in themselves, the nature and extent of the services provided by the Adviser were appropriate, that the performance of the Funds had been satisfactory, and that the Adviser could be expected to provide services of high quality. As to the Adviser’s fees for each Fund, the Trustees determined that the fees, considered in relation to the services provided, were fair and reasonable, that the Trust’s relationship with the Adviser and State Street was not so profitable as to render the fees at current asset levels excessive, that any additional benefits to the Adviser and/or State Street were not of a magnitude to materially affect the outcome of the Trustees’ conclusions, and that, especially in light of the breakpoints in the Adviser’s and State Street’s fee schedules, the fees paid reflected a sharing of economies of scale with the Funds.
THE SELECT SECTOR SPDR TRUST
OTHER INFORMATION (continued)
September 30, 2019 (Unaudited)
TRUSTEES AND OFFICERS INFORMATION
Name, Address
and Year of Birth | | Position(s)
with Trust | | Term of
Office and
Length of
Time Served | | Principal
Occupation(s)
During Past
5 Years | | Number of
Portfolios
in Fund
Complex
Overseen
by Trustee† | | Other
Directorships
Held by Trustee
During the
Past 5 Years |
| Trustees | | | | | | | | | | |
| Independent Trustees | | | | | | | | | | |
CHERYL BURGERMEISTER
c/o The Select Sector
SPDR Trust
One Iron Street
Boston, MA 02210
1951 | | Trustee,
Chairman of the
Board, Member
of the Audit
Committee,
Member of the
Nominating and
Governance
Committee | | Term: Indefinite
Elected: October
1998 | | Retired; Finance
Committee Member,
Portland Community
College Foundation
(January 2001 to
present); CPA
(Retired). | | 11 | | Director, Chair of
Audit Committee
and Member of the
Nominating and
Governance
Committee,
Russell Funds
Complex; Lead
Independent
Director and
Member of the
Audit and
Nominating and
Governance
Committees,
ALPS Series Trust
(2012 to 2016). |
GEORGE R. GASPARI
c/o The Select Sector
SPDR Trust
One Iron Street
Boston, MA 02210
1940 | | Trustee,
Chairman of the
Audit
Committee,
Member of the
Nominating and
Governance
Committee | | Term: Indefinite
Elected: October
1998 | | Retired Financial
Services Consultant
(1996 to 2012). | | 11 | | Director and
Member of the
Audit Committee,
Liberty All-Star
Growth Fund, Inc.;
Trustee and
Member of the
Audit Committee,
Liberty All-Star
Equity Fund. |
ASHLEY T. RABUN
c/o The Select Sector
SPDR Trust
One Iron Street
Boston, MA 02210
1952 | | Trustee, Member
of the Audit
Committee,
Member of the
Nominating and
Governance
Committee | | Term: Indefinite
Appointed:
October 2015 | | Retired; President and
Founder,
InvestorReach, Inc., a
financial services
consulting firm (1996
to 2015). | | 11 | | Chairperson of the
Board and Member
of the Audit,
Nominating and
Valuation
Committees,
Investment
Managers Series
Trust. |
THE SELECT SECTOR SPDR TRUST
OTHER INFORMATION (continued)
September 30, 2019 (Unaudited)
Name, Address
and Year of Birth | | Position(s)
with Trust | | Term of
Office and
Length of
Time Served | | Principal
Occupation(s)
During Past
5 Years | | Number of
Portfolios
in Fund
Complex
Overseen
by Trustee† | | Other
Directorships
Held by Trustee
During the
Past 5 Years |
ERNEST J. SCALBERG
c/o The Select Sector
SPDR Trust
One Iron Street
Boston, MA 02210
1945 | | Trustee, Member
of the Audit
Committee,
Chairman of the
Nominating
and Governance
Committee | | Term: Indefinite
Elected: October
1998 | | Retired; Research
Professor and
Director of the
GLOBE Center,
Monterey Institute of
International Studies
(2009 to 2014). | | 11 | | Chairman of the
Board and
Chairman of the
Audit Committee
of Principal Real
Estate Income
Fund; Director and
Member of the
Audit and
Nominating
Committees, db-X
Exchange-Traded
Funds Inc. (2007-
2015); Chairman
of the Board of the
Foundation,
International
University in
Geneva (IUG),
Switzerland. |
R. CHARLES TSCHAMPION
c/o The Select Sector
SPDR Trust
One Iron Street
Boston, MA 02210
1946 | | Trustee,
Member of the
Audit
Committee,
Member of the
Nominating and
Governance
Committee,
Chair of the
Business
Continuity
Management
Team | | Term: Indefinite
Elected: October
1998 | | Retired; Director,
Special Projects, CFA
Institute (2010 to
2014); Director,
Industry Relations,
CFA Institute
(2005 to 2010). | | 11 | | Trustee Emeritus
of Lehigh
University;
Director and
Member of the
Audit and
Nominating
Committees, db-X
Exchange-Traded
Funds,
Inc. (2007 –
2015); Director,
Real Estate
Information
Standards Board
(2007-2013). |
THE SELECT SECTOR SPDR TRUST
OTHER INFORMATION (continued)
September 30, 2019 (Unaudited)
Name, Address
and Year of Birth | | Position(s)
with Trust | | Term of
Office and
Length of
Time Served | | Principal
Occupation(s)
During Past
5 Years | | Number of
Portfolios
in Fund
Complex
Overseen
by Trustee† | | Other
Directorships
Held by Trustee
During the
Past 5 Years |
| Interested Trustee | | | | | | | | | | |
JAMES E. ROSS*
SSGA Funds Management, Inc.
One Iron Street
Boston, MA 02210
1965 | | Trustee | | Term: Indefinite
Appointed:
November 2005 | | Chairman and Director,
SSGA Funds
Management, Inc.
(2005-present);
Executive Vice
President,
State Street
Global Advisors
(2012-present);
Chief Executive
Officer and Director,
State Street Global
Advisors Funds
Distributors, LLC
(May 2017-
present); Director,
State Street Global
Markets, LLC
(2013-April 2017);
President, SSGA Funds
Management, Inc.
(2005-2012); Principal, State Street Global Advisors (2000 - 2005). | | 188 | | SSGA SPDR
ETFs Europe I plc
(Director)
(November 2016-
present); SSGA
SPDR ETFs
Europe II plc
(Director)
(November 2016-
present). |
| † For the purpose of determining the number of portfolios overseen by the Trustees, “Fund Complex” comprises registered investment companies for which SSGA Funds Management, Inc. serves as investment adviser. |
| * Mr. Ross is an “interested person” of the Trust, as defined in the 1940 Act, because of his employment with the Adviser and ownership interest in an affiliate of the Adviser. |
Name, Address
and Year of Birth | | Position(s)
with Trust | | Term of
Office and
Length of
Time Served | | Principal Occupation(s) During the Past 5 Years |
| Officers | | | | | | |
ELLEN M. NEEDHAM
SSGA Funds Management, Inc.
One Iron Street
Boston, MA 02210
1967 | | President and Principal Executive Officer | | Term: Indefinite
Elected:
May 2013 | | President and Director, SSGA Funds Management, Inc. (2001 - present)*; Senior Managing Director, State Street Global Advisors (1992 - present)*; Director, State Street Global Advisors Funds Distributors, LLC (May 2017 - present). |
MICHAEL P. RILEY
SSGA Funds Management, Inc.
One Iron Street
Boston, MA 02210
1969 | | Vice
President | | Term: Indefinite
Elected:
February 2005 | | Managing Director, State Street Global Advisors (2005 - present).* |
CHAD C. HALLETT
SSGA Funds Management, Inc.
One Iron Street
Boston, MA 02210
1969 | | Treasurer and
Principal Financial Officer | | Term: Indefinite
Elected:
November 2007 | | Vice President, State Street Global Advisors and SSGA Funds Management, Inc. (November 2014 - present); Vice President, State Street Bank and Trust Company (2001 - November 2014).* |
ANN M. CARPENTER
SSGA Funds Management, Inc.
One Iron Street
Boston, MA 02210
1966 | | Deputy
Treasurer | | Term: Indefinite
Elected:
April 2015 | | Chief Operating Officer, SSGA Funds Management, Inc. (2005 - Present)*; Managing Director, State Street Global Advisors (2005 - present).* |
THE SELECT SECTOR SPDR TRUST
OTHER INFORMATION (continued)
September 30, 2019 (Unaudited)
Name, Address
and Year of Birth | | Position(s)
with Trust | | Term of
Office and
Length of
Time Served | | Principal Occupation(s) During the Past 5 Years |
BRUCE S. ROSENBERG
SSGA Funds Management, Inc.
One Iron Street
Boston, MA 02210
1961 | | Deputy
Treasurer | | Term: Indefinite
Elected:
February 2016 | | Managing Director, State Street Global Advisors and SSGA Funds Management, Inc. (July 2015 - present); Director, Credit Suisse (April 2008 - July 2015). |
DARLENE ANDERSON-VASQUEZ
SSGA Funds Management, Inc.
One Iron Street
Boston, MA 02210
1968 | | Deputy
Treasurer | | Term: Indefinite
Elected:
February 2017 | | Managing Director, State Street Global Advisors and SSGA Funds Management, Inc. (May 2016 - present); Senior Vice President, John Hancock Investments (September 2007 - May 2016). |
ARTHUR A. JENSEN
SSGA Funds Management, Inc.
1600 Summer Street
Stamford, CT 06905
1966 | | Deputy
Treasurer | | Term: Indefinite
Elected:
November 2017 | | Vice President at State Street Global Advisors (July 2016 – present); Deputy Treasurer of Elfun Funds (July 2016 – present); Treasurer of State Street Institutional Funds, State Street Variable Insurance Series Funds, Inc. and GE Retirement Savings Plan Funds (June 2011 – present); Treasurer of Elfun Funds (June 2011—July 2016);Mutual Funds Controller of GE Asset Management Incorporated (April 2011 - July 2016). |
SUJATA UPRETI
SSGA Funds Management, Inc.
One Iron Street
Boston, MA 02210
1974 | | Assistant
Treasurer | | Term: Indefinite
Elected:
February 2016 | | Vice President, State Street Global Advisors and SSGA Funds Management, Inc. (May 2015 - present); Assistant Director, Cambridge Associates, LLC (July 2014 - January 2015); Vice President, Bank of New York Mellon (July 2012 - August 2013); Manager, PricewaterhouseCoopers, LLP (September 2003 - July 2012). |
DANIEL FOLEY
SSGA Funds Management, Inc.
One Iron Street
Boston, MA 02210
1972 | | Assistant
Treasurer | | Term: Indefinite
Elected:
February 2016 | | Vice President, State Street Global Advisors and SSGA Funds Management, Inc. (April 2007 - present).* |
DANIEL G. PLOURDE
SSGA Funds Management, Inc.
One Iron Street
Boston, MA 02210
1980 | | Assistant
Treasurer | | Term: Indefinite
Elected:
May 2017 | | Vice President, SSGA Funds Management, Inc. (May 2015 - present); Officer, State Street Bank and Trust Company (March 2009 - May 2015). |
SEAN O’MALLEY
SSGA Funds Management, Inc.
One Iron Street
Boston, MA 02210
1969 | | Chief
Legal
Officer | | Term: Indefinite
Served: since
August 2019 | | Senior Vice President and Deputy General Counsel, State Street Global Advisors (November 2013 - present). |
ANDREW DELORME
SSGA Funds Management, Inc.
One Iron Street
Boston, MA 02210
1975 | | Secretary | | Term: Indefinite
Served: since
August 2019 | | Vice President and Senior Counsel, State Street Global Advisors (April 2016 - present); Vice President and Counsel, State Street Global Advisors (August 2014 - March 2016). |
KEVIN MORRIS
SSGA Funds Management, Inc.
One Iron Street
Boston, MA 02210
1982 | | Assistant
Secretary | | Term: Indefinite
Served: since
August 2019 | | Vice President and Senior Counsel, State Street Global Advisors (April 2019 - present); Vice President and Counsel, State Street Global Advisors (January 2016 - April 2019); Director, Asset Management Compliance, Fidelity Investments (June 2015 - January 2016); Senior Compliance Advisor, Asset Management Compliance, Fidelity Investments (June 2012 - June 2015). |
DAVID URMAN
SSGA Funds Management, Inc.
One Iron Street
Boston, MA 02210
1985 | | Assistant
Secretary | | Term: Unlimited
Served: since
August 2019 | | Vice President and Senior Counsel, State Street Global Advisors (April 2019 - present); Vice President and Counsel, State Street Global Advisors (August 2015-April 2019); Associate, Ropes & Gray LLP (November 2012-August 2015). |
THE SELECT SECTOR SPDR TRUST
OTHER INFORMATION (continued)
September 30, 2019 (Unaudited)
Name, Address
and Year of Birth | | Position(s)
with Trust | | Term of
Office and
Length of
Time Served | | Principal Occupation(s) During the Past 5 Years |
BRIAN HARRIS
SSGA Funds Management, Inc.
One Iron Street
Boston, MA 02210
1973 | | Chief Compliance
Officer; Anti-
Money
Laundering
Officer and Code of
Ethics
Compliance
Officer | | Term: Indefinite
Elected:
November 2013 | | Managing Director, State Street Global Advisors and SSGA Funds Management, Inc. (June 2013 - present)*; Senior Vice President and Global Head of Investment Compliance, BofA Global Capital Management (2010 - 2013). |
| * Served in various capacities and/or with various affiliated entities during the noted time period. |
| The Trust's Statement of Additional Information (SAI) includes additional information about the Funds' directors and is available, without charge, upon request and by calling 1-866-787-2257. |
TRUSTEES
Cheryl Burgermeister, Chairperson
George R. Gaspari
Ashley T. Rabun
James E. Ross
Ernest J. Scalberg
R. Charles Tschampion
INVESTMENT MANAGER AND ADMINISTRATOR
SSGA Funds Management, Inc.
One Iron Street
Boston, MA 02210
DISTRIBUTOR
ALPS Portfolio Solutions Distributor, Inc.
1290 Broadway, Suite 1100
Denver, Colorado 80203
CUSTODIAN, SUB-ADMINISTRATOR AND TRANSFER AGENT
State Street Bank and Trust Company
State Street Financial Center
One Lincoln Street
Boston, MA 02111
LEGAL COUNSEL
Morgan, Lewis & Bockius LLP
1111 Pennsylvania Avenue, NW
Washington, DC 20004
INDEPENDENT REGISTERED PUBLIC ACCOUNTING FIRM
PricewaterhouseCoopers LLP
101 Seaport Boulevard
Suite 500
Boston, MA 02210
The information contained in this report is intended for the general information of shareholders of the Trust.This report is not authorized for distribution to prospective investors unless preceded or accompanied by a current Trust prospectus which contains important information concerning the Trust. You may obtain a current prospectus from the Distributor, ALPS Portfolio Solutions Distributor, Inc., by calling 1-866-SECTOR-ETF (1-866-732-8673). Please read the prospectus carefully before you invest.
Visit www.sectorspdrs.com or call 1-866-SECTOR-ETF (1-866-732-8673)
SPDRSSAR
Item 2. Code of Ethics.
As of the end of the period covered by this report, the registrant has adopted a code of ethics that applies to the registrant’s principal executive officer, principal financial officer, principal accounting officer or controller, or persons performing similar functions, regardless of whether these individuals are employed by the registrant or a third party (the “Code of Ethics”). During the period covered by this report, no substantive amendments were made to the Code of Ethics. During the period covered by this report, the registrant did not grant any waivers, including any implicit waivers, from any provision of the Code of Ethics.
The Code of Ethics is attached hereto as Exhibit 13(a)(1).
Item 3. Audit Committee Financial Expert.
(a)(1) The Board of Trustees of the registrant has determined that the registrant has five Board members serving on the Audit Committee that possess the attributes identified in Instructions 2(b) of Item 3 to FormN-CSR to qualify as an “audit committee financial expert.”
(2) Cheryl Burgermeister, George Gaspari, Ashley T. Rabun, Ernest Scalberg and R. Charles Tschampion are the registrant’s audit committee financial experts. The Board has determined that each of the foregoing persons is “independent” in that, (i) other than in his or her capacity as a member of the Audit Committee and the Board of Trustees of the registrant, he or she has not accepted, directly or indirectly, any consulting, advisory or other compensatory fee from the registrant, and (ii) he or she is not an “interested person” of the registrant as defined in Section 2(a)(19) of the Investment Company Act of 1940, as amended (the “1940 Act”).
Item 4. Principal Accountant Fees and Services.
(a)Audit Fees.
For the fiscal years ended September 30, 2019 and September 30, 2018, the aggregate audit fees billed for professional services rendered by the principal accountant were $187,768 and $181,698, respectively. The nature of the services are (1) auditing of the statements of assets and liabilities, related statements of operations and changes in net assets, and the financial highlights of each series of the registrant; (2) auditing and reporting on the financial statements to be included in the amendment to the registrant’s registration statement on FormN-1A to be filed with the Securities and Exchange Commission; (3) review of the amendment to the registration statement; (4) issuance of a Report on Internal Control for inclusion in the registrant’s FormN-CSR; and (5) Rule17f-2 securities counts.
(b)Audit-Related Fees.
For the fiscal years ended September 30, 2019 and September 30, 2018, the principal accountant did not bill the registrant any fees for assurances and related services that are reasonably related to the performance of the audit of the registrant’s financial statements that are not reported under paragraph (a) of this Item.
(c)Tax Fees.
For the fiscal years ended September 30, 2019 and September 30, 2018, the aggregate tax fees billed for professional services rendered by the principal accountant were $92,840 and $92,840, respectively. Services included the review of the registrant’s federal, state and local income, franchise and other tax returns.
(d)All Other Fees.
There were no other fees billed by the principal accountant for the fiscal years ending September 30, 2019 and September 30, 2018.
(e)(1)Audit CommitteePre-Approval Policies and Procedures.
The registrant’s Audit Committee Charter states the following with respect topre-approval procedures:
Before the independent auditors are engaged by the Trust to render audit ornon-audit services, either:
| | (a) | The Audit Committee shallpre-approve all auditing services and permissiblenon-audit services (e.g., tax services) provided to the Trust. The Audit Committee may delegate to one or more of its members the authority to grantpre-approvals. Any decision of any member to whom authority is delegated under this section shall be presented to the Audit Committee at its next regularly scheduled meeting; or |
| | (b) | The engagement to render the auditing service or permissiblenon-audit service is entered into pursuant topre-approval policies and procedures established by the Audit Committee. Any such policies and procedures must (1) be detailed as to the particular service and (2) not involve any delegation of the Audit Committee’s responsibilities to the investment adviser. The Audit Committee must be informed of each service entered into pursuant to the policies and procedures. A copy of any such policies and procedures shall be attached as an exhibit to the Audit Committee Charter. |
| | (c) | De Minimis Exceptions toPre-Approval Requirements.Pre-Approval for a service provided to the Trust other than audit, review or attest services is not required if: (1) the aggregate amount of all suchnon-audit services provided to the Trust constitutes not more than 5 percent of the total amount of revenues paid by the Trust to the independent auditors during the fiscal year in which thenon-audit services are provided; (2) such services were not recognized by the Trust at the time of the engagement to benon-audit services; and (3) such services are promptly brought to the attention of the Audit Committee and are approved by the Audit Committee or by one or more members of the Audit Committee to whom authority to grant such approvals has been delegated by the Audit Committee prior to the completion of the audit. |
| | (d) | Pre-Approval ofNon-Audit Services Provided to the investment adviser and Certain Control Persons. The Audit Committee shallpre-approve anynon-audit services proposed to be provided by the independent auditors to (a) the investment adviser and (b) any entity controlling, controlled by, or under common control with the investment adviser that provides ongoing services to the Trust, if the independent auditors’ engagement with the investment adviser or any such control persons relates directly to the operations and financial reporting of the Trust. It shall be the responsibility of the independent auditors to notify the Audit Committee of anynon-audit services that need to bepre-approved. |
| | (e) | Application of De Minimis Exception. The De Minimis exception set forth above applies topre-approvals under this Section as well, except that the “total amount of revenues” calculation is based on the total amount of revenues paid to the independent auditors by the Trust and any other entity that has its services approved under this Section (i.e., the investment adviser or any control person). |
(e)(2)Percentage of Services.
None of the services described in paragraphs (b) through (d) of this Item were performed in reliance on paragraph (c)(7)(i)(C) of Rule2-01 of RegulationS-X during the period of time for which such rule was effective.
(f) Not applicable.
(g) The aggregatenon-audit fees for services rendered by the principal accountant to the registrant and its adviser and any entity controlling, controlled by, or under common control with the adviser that provided ongoing services to the registrant for the twelve months ended December 31, 2018 and December 31, 2017 were approximately $12,786,401 and $12,773,210, respectively. Such information is not readily available on a fiscal year basis.
(h) The registrant’s principal accountant notified the registrant’s Audit Committee of allnon-audit services that were rendered by the principal accountant to the registrant’s adviser and any entity controlling, controlled by, or under common control with the adviser that provides services to the registrant, which services were not required to bepre-approved pursuant to paragraph (c)(7)(ii) of Rule2-01 of RegulationS-X, allowing the registrant’s Audit Committee to consider whether such services were compatible with maintaining the principal accountant’s independence.
Item 5. Audit Committee of Listed Registrants.
The registrant has an audit committee which was established by the Board of Trustees of the registrant in accordance with Section 3(a)(58)(A) of the Securities Exchange Act of 1934, as amended (the “1934 Act”). The members of the registrant’s audit committee are Cheryl Burgermeister, George Gaspari, Ashley T. Rabun, Ernest Scalberg and R. Charles Tschampion.
Item 6. Schedule of Investments.
| (a) | The schedule of investments is included as part of the reports to shareholders filed under Item 1 of this FormN-CSR. |
| (b) | Not applicable to the registrant. |
Item 7. Disclosure of Proxy Voting Policies and Procedures forClosed-End Management Investment Companies.
Not applicable to the registrant.
Item 8. Portfolio Managers ofClosed-End Management Investment Companies.
Not applicable to the registrant.
Item 9. Purchases of Equity Securities byClosed-End Management Investment Company and Affiliated Purchasers.
Not applicable to the registrant.
Item 10. Submission of Matters to a Vote of Security Holders.
The registrant has not adopted any material changes to the procedures by which shareholders may recommend nominees to the registrant’s Board.
Item 11. Controls and Procedures.
(a) Within 90 days of the filing date of this FormN-CSR, Ellen M. Needham, the registrant’s President and Principal Executive Officer, and Chad C. Hallett, the registrant’s Treasurer and Principal Financial Officer, reviewed the registrant’s disclosure controls and procedures (as defined in Rule30a-3(c) under the 1940 Act) and evaluated their effectiveness. Based on their review, Ms. Needham and Mr. Hallett determined that the disclosure controls and procedures adequately ensure that information required to be disclosed by the registrant in its periodic reports is recorded, processed, summarized and reported within the time periods required by the U.S. Securities and Exchange Commission.
(b) There were no changes in the registrant’s internal control over financial reporting (as defined in Rule30a-3(d) under the 1940 Act) that occurred during the most recent fiscal half-year that have materially affected, or are reasonably likely to materially affect, the registrant’s internal control over financial reporting.
Item 12. Disclosure of Securities Lending Activities forClosed-End Management Investment Companies.
(a) Not applicable to the registrant.
(b) Not applicable to the registrant.
Item 13. Exhibits.
(a)(1) Code of Ethics referred to in Item 2.
(a)(2) Separate certifications required by Rule30a-2(a) under the 1940 Act for each principal executive officer and principal financial officer of the registrant are attached.
(a)(3) Not applicable to the registrant.
(a)(4) Not applicable.
(b) A single certification required by Rule30a-2(b) under the 1940 Act, Rule13a-14(b) or Rule15d-14(b) under the 1934 Act and Section 1350 of Chapter 63 of Title 18 of the United States Code for the principal executive officer and principal financial officer of the registrant is attached.
SIGNATURES
Pursuant to the requirements of the Securities Exchange Act of 1934, as amended, and the Investment Company Act of 1940, as amended, the registrant has duly caused this report to be signed on its behalf by the undersigned, thereunto duly authorized.
The Select Sector SPDR® Trust
| | |
| |
| By: | | /s/ Ellen M. Needham |
| | Ellen M. Needham |
| | President and Principal Executive Officer |
Date: December 5, 2019
Pursuant to the requirements of the Securities Exchange Act of 1934, as amended, and the Investment Company Act of 1940, as amended, this report has been signed below by the following persons on behalf of the registrant and in the capacities and on the dates indicated.
| | |
| |
| By: | | /s/ Ellen M. Needham |
| | Ellen M. Needham |
| | President and Principal Executive Officer |
| |
| By: | | /s/ Chad C. Hallett |
| | Chad C. Hallett |
| | Treasurer and Principal Financial Officer |
Date: December 5, 2019