To the Board of Trustees of the Select Sector SPDR Trust and Shareholders of each of the funds listed below
Opinions on the Financial Statements
We have audited the accompanying statements of assets and liabilities, including the schedules of investments of each of the funds listed below (constituting the Select Sector SPDR Trust, hereafter collectively referred to as the "Funds") as of September 30, 2018, the related statements of operations and of changes in net assets for each of the periods indicated below, including the related notes, and the financial highlights for each of the periods indicated therein (collectively referred to as the “financial statements”). In our opinion, the financial statements present fairly, in all material respects, the financial position of each of the Funds as of September 30, 2018, the results of each of their operations and the changes in each of their net assets for each of the periods indicated below, and each of the financial highlights for each of the periods indicated therein in conformity with accounting principles generally accepted in the United States of America.
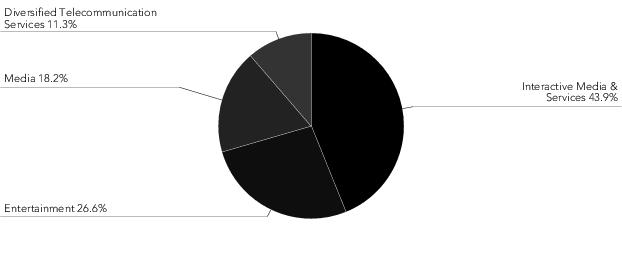
The Communication Services Select Sector SPDR Fund (2)
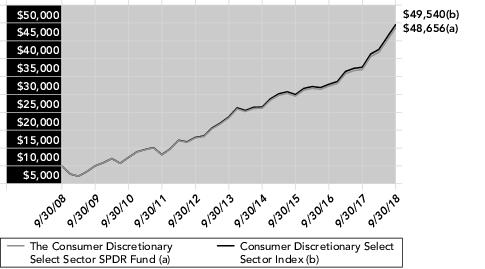
The Consumer Discretionary Select Sector SPDR Fund (1)
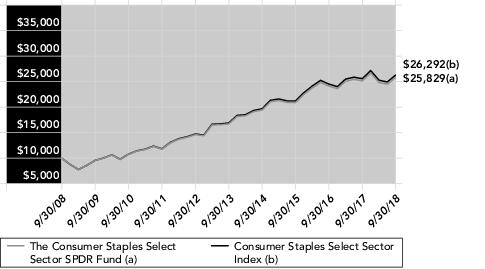
The Consumer Staples Select Sector SPDR Fund (1)
The Energy Select Sector SPDR Fund (1)
The Financial Select Sector SPDR Fund (1)
The Health Care Select Sector SPDR Fund (1)
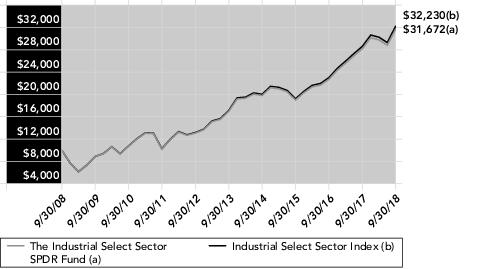
The Industrial Select Sector SPDR Fund (1)
The Materials Select Sector SPDR Fund (1)
The Real Estate Select Sector SPDR Fund (1)
The Technology Select Sector SPDR Fund (1)
The Utilities Select Sector SPDR Fund (1)
(1) Statement of operations for the year ended September 30, 2018 and statements of changes in net assets for the years ended September 30, 2018 and 2017
(2) Statement of operations and statement of changes in net assets for the period June 18, 2018 (inception date) through September 30, 2018
Basis for Opinions
These financial statements are the responsibility of the Funds’ management. Our responsibility is to express an opinion on the Funds’ financial statements based on our audits. We are a public accounting firm registered with the Public Company Accounting Oversight Board (United States) (“PCAOB”) and are required to be independent with respect to the Funds in accordance with the U.S. federal securities laws and the applicable rules and regulations of the Securities and Exchange Commission and the PCAOB.
We conducted our audits of these financial statements in accordance with the standards of the PCAOB. Those standards require that we plan and perform the audit to obtain reasonable assurance about whether the financial statements are free of material misstatement, whether due to error or fraud.
Our audits included performing procedures to assess the risks of material misstatement of the financial statements, whether due to error or fraud, and performing procedures that respond to those risks. Such procedures included examining, on a test basis, evidence regarding the amounts and disclosures in the financial statements. Our audits also included evaluating the accounting principles used and significant estimates made by management, as well as evaluating the overall presentation of the financial statements. Our procedures included confirmation of securities owned as of September 30, 2018 by correspondence with the custodian and brokers; when replies were not received from brokers, we performed other auditing procedures. We believe that our audits provide a reasonable basis for our opinions.
/s/PricewaterhouseCoopersLLP
Boston, Massachusetts
November 21, 2018
We have served as the auditor of one or more investment companies in the SPDR Funds since 1993.