We cannot assure that we will be successful in responding to the above technological and industry challenges in a timely and cost-effective manner. If we are unable to integrate new technologies and industry standards effectively, our business could be harmed.
Our business depends on the increased acceptance and use of the Internet as a medium for accessing public information and completing government filings. Rapid growth in the use of the Internet is a relatively recent phenomenon. As a result, acceptance and use may not continue to develop at historical rates and a sufficiently broad base of individual and business customers may not adopt or continue to use the Internet as a medium for accessing government portals and other online services. Demand and market acceptance for recently introduced services over the Internet are subject to a high level of uncertainty, and there exist few proven services.
The Internet has experienced, and is expected to continue to experience, significant growth in the number of users and amount of traffic. If the Web continues to experience increased numbers of users, frequency of use or increased bandwidth requirements, the Internet infrastructure may not be able to support these increased demands or perform reliably. The Internet has experienced a variety of outages and other delays as a result of damage to portions of its infrastructure, and could face such outages and delays in the future. These outages and delays could reduce the level of Internet usage and traffic on our government portals. Such outages and delays would also hinder our customers’ ability to complete eGovernment transactions. In addition, the Internet could lose its viability due to delays in the development or adoption of new standards and protocols to handle increased levels of activity or due to increased governmental regulation. If the Internet infrastructure is not adequately developed or maintained, use of our government portals and our government-to-citizen and government-to-business services may be reduced.
Our success depends on the increase in Internet usage generally and in particular as a means to access public information electronically. This in part requires the development and maintenance of the Internet infrastructure. If this infrastructure fails to develop or be adequately maintained, our business would be harmed because users may not be able to access our government portals. Among other things, this development and maintenance will require a reliable network backbone with the necessary speed, data capacity, security and timely development of complementary products for providing reliable Internet access and services.
Because we aggregate and distribute sometimes private and sensitive public information over the Internet, we may face potential liability for defamation, libel, negligence, invasion of privacy, copyright or trademark infringement, and other claims based on the nature and content of the material that is published on our outsourced government portals. Most of the agreements through which we obtain consent to disseminate this information do not contain indemnity provisions in our favor. These types of claims have been brought, sometimes successfully, against online services and Web sites in the past. We cannot assure that our general liability or errors and omissions insurance will be adequate to indemnify us for all liability that may be imposed. Any liability that is not covered by our insurance or is in excess of our insurance coverage could severely harm our business operations and financial condition.
Security breaches or system failures may harm our reputation and adversely affect future earnings.
A significant challenge to electronic commerce is the secure transmission of sensitive and/or personal information (“information”) over public networks. In addition to complying with requirements established for protecting information contained in federal and state laws, we are also required to comply with the Payment Card Industry’s Data Security Standards, or PCI DSS, because we provide online payment processing services. Since we provide the electronic transmission of information released from various government entities and we perform online payment processing services, we represent an attractive target for criminal hackers.
Despite the various security measures we have in place to protect information from unauthorized disclosure, a compromise or breach may still occur. Hackers have become increasingly sophisticated and serious, and therefore, cyber security is an ever moving target. A party who is able to circumvent our security measures could misappropriate information, including, but not limited to customer credit card information, or cause interruptions or direct damage to our government portals.
Any breach in our security resulting in the compromise of information, could expose us to fines imposed by the Payment Card Industry and jeopardize our ability to continue processing transactions with specific payment card brands. Also, should hackers compromise information, or create bugs or viruses in an attempt to sabotage the functionality of our applications and services, we may receive negative publicity, incur liability to our portal users and our partners or lose the confidence of the governments with whom we contract, any of which may cause the termination or modification of our government contracts.
Furthermore, the PCI DSS is an evolving standard that has already been modified twice since it was first issued in 2005. As it changes and new requirements are issued, we may be required to expend significant capital and other resources to comply with the PCI DSS.
Our systems may fail or limit user traffic.
Most of our communications hardware and computer hardware operations for delivering our eGovernment services are located individually in each state or city where we provide those services. We cannot assure that during the occurrence of fire, floods, earthquakes, power loss, telecommunications failures, break-ins and similar events that the modem banks and direct dial-up connections we have to serve as back-up systems will not prevent damage to our systems or cause interruptions to our services. Computer viruses, electronic break-ins or other similar disruptive problems could cause users to stop visiting our government portals and could cause our partners to terminate agreements with us. If any of these circumstances occurred, our business could be harmed. Our insurance policies may not adequately compensate us for any losses that may occur due to any failures of or interruptions in our systems.
Our government portals must accommodate a high volume of traffic and deliver frequently updated information. These government portals may experience interruptions due to any failure or delay by government agencies in the transmission or receipt of this information. Due to holidays and technical problems with state computer systems, our Web sites have experienced slower response times or decreased traffic in the past and may experience the same incidents in the future. In addition, our users depend on Internet service providers, online service providers and other Web site operators for access to our government portals and other online government-to-citizen and government-to-business services. Many of these providers and operators have experienced significant outages in the past due to system failures unrelated to our systems, holidays and heavy user traffic, and could experience the same outages, delays and other difficulties in the future. Any of these system failures could harm our business, results of operations and financial condition.
We may become subject to liability under NACHA rules and standards for processing electronic direct debit payments from bank accounts.
Our electronic check processing for online payments made by direct debit to a bank account is governed by rules and standards promulgated by the National Automated Clearing House Association, or NACHA, an industry trade association of banking institutions and regional automated clearing house associations. Under those rules, we may become liable for failing to handle transactions in accordance with those rules, or for failing to return funds within the prescribed time frame to the bank account of the person or entity disputing our authorization to debit those funds, before the dispute regarding our authorization is resolved. Our agreements with governmental
22
agencies at the state, federal, and local level transfer this obligation for rapid funds return during dispute resolution to the government agencies affected, but in the event that such return does not happen, we may be liable notwithstanding the government’s failure, and we may not be able to obtain reimbursement from the government involved or from the individual user or entity that initiated the debit without authorization. If this were to happen, our business, results of operations and financial condition may be adversely affected.
We may become liable for violations of the Driver Privacy Protection Act as adopted federally or in each state.
We act as an outsourced manager on behalf of states, for electronic access to records pertaining to motor vehicles and motor vehicle operators (driver history records) by users and certain permitted resellers. These records are the largest group of records for which we process electronic access for any state agency, and are processed in each of our portal states. These records contain “personal information” and “sensitive personal information” as defined by the federal Driver Privacy Protection Act, and state versions of that Act adopted in every state (collectively, the “DPPA”). The DPPA regulates categories and circumstances under which “personal information” and “sensitive personal information” may be disclosed to requestors. Each state has procedures for complying with the DPPA, and such procedures may vary from state to state. We closely follow the state’s existing compliance procedures for general access, with our electronic access. If we fail to follow such procedures, or we grant access to users not in compliance with such procedures, or if such procedures are deemed inadequate in some way, our business, results of operations and financial condition may be adversely affected. The DPPA permits statutory damages to be awarded to the subjects of such records, even without proof of actual damage, for certain infringements or violations of the DPPA. We may be liable for such damages in such instances, and we may have no recourse against the state, or the state may not be jointly and severally liable with us.
Compliance with changing regulation of corporate governance and public disclosure may result in additional expenses.
Changing laws, regulations and standards relating to corporate governance and public disclosure, including the Sarbanes-Oxley Act of 2002, new SEC regulations and NASDAQ Global Select Market rules, are creating uncertainty for companies such as ours. These new or changed laws, regulations and standards are subject to varying interpretations in many cases due to their lack of specificity, and as a result, their application in practice may evolve over time as new guidance is provided by regulatory and governing bodies, which could result in continuing uncertainty regarding compliance matters and higher costs necessitated by ongoing revisions to disclosure and governance practices. We are committed to maintaining high standards of corporate governance and public disclosure. As a result, our efforts to comply with evolving laws, regulations and standards have resulted in, and are likely to continue to result in, increased general and administrative expenses and a diversion of management time and attention from revenue-generating activities to compliance activities. In particular, our efforts to comply with Section 404 of the Sarbanes-Oxley Act of 2002 and the related regulations regarding our required assessment of our internal control over financial reporting has required the commitment of significant financial and managerial resources. Further, our board members, chief executive officer and chief financial officer could face an increased risk of personal liability in connection with the performance of their duties. As a result, we may have difficulty attracting and retaining qualified board members and executive officers, which could harm our business. If our efforts to comply with new or changed laws, regulations and standards differ from the activities intended by regulatory or governing bodies due to ambiguities related to practice, our reputation may be harmed.
An informal SEC inquiry involving us has resulted in significant costs to us, may result in future costs to us, and could adversely affect us.
As disclosed in a Form 8-K and press release issued on February 6, 2008, we are currently the subject of an informal SEC inquiry of expense reporting by certain officers of the Company and certain potentially related matters. In connection with that inquiry, a review was undertaken by the Audit Committee of our Board of Directors, with the assistance of outside, independent counsel, which focused on such expense reporting. The review covered the period from January 1, 2004 through June 30, 2007 and was conducted with full cooperation by us and Jeffery S. Fraser, who was then our Chief Executive Officer. Mr. Fraser has reimbursed the Company approximately $97,000 in expenses as a result of the review, which followed reimbursement by him of approximately $186,000 in expenses made prior to the review. The reimbursement was made to correct expense reporting during the period from January 2004 through October 2006 that was inconsistent with our expense
23
reimbursement policies. The review also revealed that these expense reimbursement deficiencies were isolated to Mr. Fraser. We do not believe the amounts involved in the review are material to our financial condition or results of operations. However, in view of his recognition of the importance of the proper tone at the top for effective corporate governance, Mr. Fraser decided to retire as our Chief Executive Officer, effective February 4, 2008, but remained as a director and our Chairman of the Board.
Both we and our Audit Committee intend to continue to fully cooperate with the informal SEC inquiry described above. However, there can be no assurance that the SEC will not take any action that could adversely affect us as a result of the matters it is reviewing. We have incurred significant legal fees and other expenses in connection with the informal SEC inquiry and the Audit Committee review and could incur significant legal fees and other expenses in connection with the ongoing, informal SEC inquiry. In addition, members of our management have devoted in the past, and may need to devote in the future, a significant amount of time to these matters, which would reduce the amount of time they can devote to our business and therefore have an adverse effect on our business.
Increases in credit card association fees may result in the loss of customers or a reduction in our earnings.
From time to time, Visa, MasterCard, American Express and Discover increase the fees (interchange and assessment fees) that they charge processors such as us. We could attempt to pass these increases along to our government client customers, but this might result in the loss of those customers. If we elect not to pass along such increased fees to our government client customers in the future, we may have to absorb all or a portion of such increases thereby increasing our operating costs and reducing our earnings
Our UCC and corporate filings software development business has incurred losses under its fixed-fee contracts in the past, and our results of operations could be harmed if the costs that this business incurs to meet contractual commitments exceed our current estimates.
Our UCC and corporate filings software development business, NIC Conquest, develops and delivers applications, typically for a fixed development fee, that improve the back-office administration of government records and better enable electronic filing and distribution of business entity and UCC records for secretaries of state. This business recognizes revenues on the percentage-of-completion method of accounting utilizing costs incurred to date as compared to the estimated total costs for each contract. This method is used because management considers expended costs to be the best available measure of progress on our fixed-price contracts and results in our recognizing contract revenues over the contract term in proportion to our incurrence of contract costs. The earnings or losses recognized on individual contracts are based on estimates of contract revenues and costs. Contract losses are recognized in full when determined, and contract profit estimates are adjusted based on ongoing reviews of contract profitability. Actual results could differ from estimated amounts and could result in a reduction or elimination of previously recognized earnings. In certain circumstances, such adjustments could be significant.
In the fourth quarter of 1998, we determined that the balance of revenues remaining to be recognized under our existing contractual obligations was not expected to cover anticipated costs of developing and implementing the related applications. Estimated costs in excess of fixed contract prices of $1.3 million for completing these applications were expensed under the percentage-of-completion method of accounting in the fourth quarter of 1998. We accrued additional anticipated losses of $1.1 million in 1999, $1.4 million in 2000, and $6.0 million in 2001 based on revised estimates relating to our then-existing contracts. In 2002, we accrued approximately $3.5 million in anticipated losses due to cost overruns on contracts in Arkansas, Minnesota and Oklahoma. We have fulfilled all obligations under our contracts with the states of Minnesota and Oklahoma, and the Arkansas system is currently in the maintenance phase. As recently as the first quarter of 2005, we recorded a $5.0 million charge due to anticipated cost overruns on our contract with the California Secretary of State, as further discussed in Note 2 in the Notes to Consolidated Financial Statements included in this Form 10-K. In June 2006, the California Secretary of State officially accepted the UCC system, which also commenced the maintenance and operations phase of the contract. However, it is possible that our costs will similarly exceed revenues in the future, as a result of unforeseen difficulties in the creation of an application called for in the contract, unforeseen challenges in ensuring compatibility with existing systems, rising development, subcontractor and personnel costs, delays in completing the contract, or other reasons. If this occurs, our results of operations, financial condition and cash flows could be seriously harmed.
24
We depend on other contractors and subcontractors in connection with our performance under our UCC and corporate filings software development engagement with the California Secretary of State. If these parties fail to satisfy their obligations to us or the California Secretary of State, or if we are unable to maintain these relationships, our operating results and business prospects could be adversely affected.
A significant portion of the work we are obligated to deliver to the California Secretary of State is performed by subcontractors. There is a risk that the California Secretary of State or we may have disputes with our subcontractors arising from, among other things, the quality and timeliness of work performed by the subcontractors and customer concerns about the subcontractors. Disputes with subcontractors or the California Secretary of State could lead to legal disputes and litigation. Adverse judgments or settlements in legal disputes may result in significant monetary damages or injunctive relief against us. In addition, if any of our subcontractors fails to deliver on a timely basis the agreed-upon supplies and/or perform the agreed-upon services, our ability to fulfill our obligations as a prime contractor may be jeopardized. Subcontractor performance deficiencies could result in the termination of our contract for default. A termination for default could expose us to liability and have an adverse effect on our business prospects, financial condition, and on our ability to compete for future contracts and orders.
We have incurred significant net losses in the past, and may do so again in the future.
We expanded rapidly following our initial public offering in July 1999 and incurred substantial net losses through mid-2002 primarily as a result of our acquired software & services businesses. However, as part of a broad strategic refocusing of the Company on our profitable core outsourced portal business during 2002, we exited our eProcurement business, NIC Commerce, decided to wind down our transportation business, IDT, and restructured the other software & services businesses in an effort to accelerate our path to profitability. As a result, the Company became profitable in the second half of 2002 and has been profitable since that time with the exception of the first quarter of 2005, as a result of the $5.0 million charge we recorded on our UCC and corporate filings software development engagement with the California Secretary of State, our only remaining legacy contract from this business. Further, even though we were profitable in 2007, we may not be able to sustain or increase profitability on a quarterly or annual basis thereafter. We will need to generate significantly higher revenues while containing costs and operating expenses if we are to achieve growing profitability. We cannot be certain that our revenues will continue to grow or that we will ever achieve sufficient revenues to remain profitable on a long-term, sustained basis.
We may be unable to generate sufficient taxable income from future operations to fully utilize our significant tax net operating loss carryforwards.
We have a history of unprofitable operations primarily due to operating losses incurred in the software & services companies we have acquired since September 1999, as further discussed above. These losses have generated significant federal tax net operating losses, or NOLs. We had available at December 31, 2007, total NOL carryforwards for federal tax purposes of approximately $25.1 million that will expire in the years 2021 ($14.8 million) and 2022 ($10.3 million), respectively. For the year ended December 31, 2007 total net deferred tax assets, including NOL carryforwards, comprised approximately 16% of our total assets. We became profitable in the second half of 2002 and have been profitable since that time with the exception of the first quarter of 2005, as further discussed above. Further, even though we expect to be profitable and generate taxable income in 2008 and beyond, we may not be able to sustain the necessary levels of taxable income to fully utilize our significant NOL carryforwards prior to expiration. There is considerable management judgment necessary to determine future taxable income, and accordingly, actual results could vary significantly from such estimates. Accordingly, the recorded amount of the deferred tax assets considered realizable could be reduced in the near term if estimates of future taxable income during the carryforward periods are reduced. If this occurs, our results of operations, financial condition and cash flows could be seriously harmed.
The National Information Consortium Voting Trust owns a significant amount of our common stock, which may impede attempts to replace or remove our board or management.
As of December 31, 2007, The National Information Consortium Voting Trust owned approximately 34% of our outstanding common stock. This concentration of ownership may have the effect of delaying or preventing a change in control or changes in management, or limiting the ability of other shareholders to approve or disapprove transactions that they may deem in their best interest.
25
The resale of shares owned by the National Information Consortium Voting Trust might adversely affect our stock price.
The National Information Consortium Voting Trust may sell shares in the open market from time to time without advance notice to us or to the market. Sales of substantial amounts of shares of our common stock in the public market, or the perception that those sales may occur, could cause the market price of our common stock to decline or make it more difficult for us to sell equity securities in the future at a time and a price that we consider appropriate.
ITEM 1B. UNRESOLVED STAFF COMMENTS
None.
ITEM 2. PROPERTIES
Our principal administrative office occupies a total of approximately 20,000 square feet of leased space at 25501 West Valley Parkway, Suite 300, Olathe, Kansas 66061. All of our subsidiaries also lease their facilities. We do not own any real property and do not currently anticipate acquiring real property or buildings in the foreseeable future.
ITEM 3. LEGAL PROCEEDINGS
As disclosed in a Form 8-K and in a press release issued on February 6, 2008, as well as under Item 1A of this Form 10-K, we are currently the subject of an informal SEC inquiry of expense reporting by certain officers of the Company and certain potentially related matters. In connection with that inquiry, a review was undertaken by the Audit Committee of our Board of Directors, with the assistance of outside, independent counsel, which focused on such expense reporting. The review revealed that expense reimbursement deficiencies occurred during the period from January 2004 through October 2006 related to Jeffery S. Fraser, who was then our Chief Executive Officer, and that the amount of such deficiencies was not material to our financial condition or results of operations.
In addition, the Company is involved from time to time in legal proceedings and litigation arising in the ordinary course of business. However, the Company is not currently involved with any other legal proceedings.
ITEM 4. SUBMISSION OF MATTERS TO A VOTE OF SECURITY HOLDERS
No matters were submitted to a vote of the shareholders during the fourth quarter of fiscal 2007.
26
PART II
| ITEM 5. | | MARKET FOR REGISTRANT’S COMMON EQUITY, RELATED SHAREHOLDER MATTERS AND ISSUER PURCHASES OF EQUITY SECURITIES |
Our common stock trades on the NASDAQ Global Select Market under the symbol “EGOV.” The following table shows the range of high and low sales prices reported on the NASDAQ Global Select Market for the periods indicated. On February 29, 2008, the closing price of our common stock was $6.02.
| Fiscal Year Ended December 31, 2006 | | High | | Low |
| First Quarter | | $6.60 | | $5.57 |
| Second Quarter | | $7.52 | | $5.88 |
| Third Quarter | | $7.09 | | $4.96 |
| Fourth Quarter | | $5.76 | | $4.44 |
| |
| Fiscal Year Ended December 31, 2007 | | High | | Low |
| First Quarter | | $5.82 | | $4.96 |
| Second Quarter | | $6.94 | | $5.23 |
| Third Quarter | | $7.70 | | $6.23 |
| Fourth Quarter | | $8.90 | | $6.70 |
As of February 29, 2008, there were approximately 285 holders of record of shares of our common stock.
Dividend Policy
On February 4, 2008, the NIC Board of Directors declared a special cash dividend of $0.25 per share, payable to shareholders of record as of February 18, 2008. The dividend, totaling approximately $15.7 million, was paid on February 28, 2008, out of the Company’s available cash and marketable securities.
On January 29, 2007, our Board of Directors declared a special cash dividend of $0.75 per share, payable to shareholders of record as of February 12, 2007. The dividend, totaling approximately $46.7 million, was paid on February 20, 2007 out of the Company’s available cash and marketable securities. Any future determination as to the payment of dividends will be made at the discretion of our Board of Directors and will depend on our operating results, financial condition, capital requirements, general business conditions and such other factors as the Board of Directors deems relevant.
Performance Graph
The following performance graph below compares the annual change in our cumulative total shareholder return on our common stock during a period commencing on December 31, 2002, and ending on December 31, 2007 (as measured by dividing (i) the sum of (A) the cumulative amount of dividends for the measurement period, assuming dividend reinvestment and (B) the difference between our share price at the end and the beginning of the measurement period; by (ii) the share price at the beginning of the measurement period) with the cumulative total return of each of: (a) the NASDAQ Composite (U.S.) Index and (b) a Peer Group, assuming a $100 investment on December 31, 2002. It should be noted that on February 20, 2007 we paid a special cash dividend of $0.75 per share, which is included in the presentation of our performance. We did not pay any other dividends on our common stock during the period commencing on December 31, 2002, and ending on December 31, 2007. The stock price performance on the graph below is not necessarily indicative of our future price performance.
27
Comparison of Cumulative Total Return Among
NIC Inc., NASDAQ Composite (U.S.) Index and a Peer Group
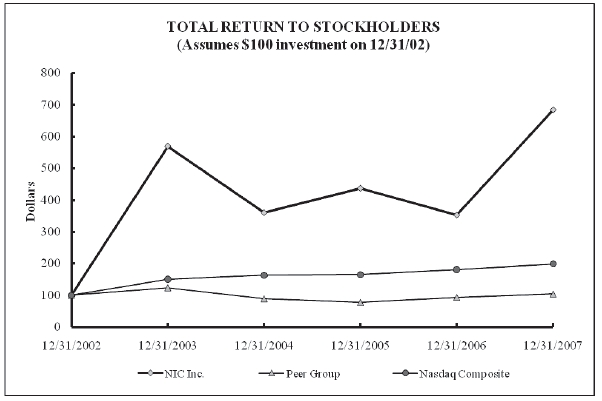
| Total Return Analysis | | 12/31/2002 | | 12/31/2003 | | 12/31/2004 | | 12/31/2005 | | 12/31/2006 | | 12/31/2007 |
| NIC Inc. | | $100.00 | | $569.50 | | $360.28 | | $436.88 | | $352.48 | | $683.45 |
| Peer Group | | $100.00 | | $123.24 | | $ 88.13 | | $ 76.94 | | $ 92.73 | | $103.19 |
| Nasdaq Composite | | $100.00 | | $150.01 | | $162.89 | | $165.13 | | $180.85 | | $198.60 |
The Peer Group consists of seven companies, each of whose business focus is similar to that of NIC. While not all of the companies provide services exclusively to governments, the services provided are similar to those we provide. The members of the Peer Group are as follows: PEC Solutions, Inc. (PECS), Bearing Point, Inc. (BE) (formerly known as KPMG Consulting, Inc. (KCIN)), Accenture, Ltd. (ACN), International Business Machines Corp. (IBM), Maximus, Inc. (MMS), American Management Systems, Inc. (AMSY) and Official Payments Corporation (OPAY). Bearing Point, Inc. began trading publicly on February 8, 2001, and Accenture, Ltd. began trading publicly on July 18, 2001. American Management Systems, Inc. was included until May 3, 2004, when, as a result of the merger with CGI Group, Inc., it was no longer a member of the Peer Group. PEC Solutions, Inc. was included until April 26, 2005, when, as a result of its merger with a subsidiary of Nortel Networks, Inc., it was no longer a member of the Peer Group.
The performance graph and related text are being furnished to and not filed with the SEC, and will not be deemed to be “soliciting material” or subject to Regulation 14A or 14C under the Securities Exchange Act of 1934 or to the liabilities of Section 18 of the Securities Exchange Act of 1934, and will not be deemed to be incorporated by reference into any filing under the Securities Act of 1933 or the Securities Exchange Act of 1934, except to the extent we specifically incorporate such information by reference into such a filing.
28
(c) During 2007, the Company acquired shares of common stock surrendered by employees to pay income taxes due upon the vesting of restricted stock and to pay the exercise price for stock options, as follows:
| | | | | | | Total Number of | | Maximum Number (or |
| | | Total | | | | Shares Purchased | | Approximate Dollar Value) |
| | | Number of | | Average | | as Part of Publicly | | of Shares that May Yet Be |
| | | Shares | | Price Paid | | Announced Plans or | | Purchased Under the Plans or |
| Period | | Purchased | | per Share | | Programs | | Programs |
| June 1, 2007 | | | 1,182 | | | $5.70 | | N/A | | N/A |
| July 24, 2007 | | | 1,223 | | | $7.03 | | N/A | | N/A |
| July 28, 2007 | | | 36,192 | | | $6.74 | | N/A | | N/A |
| August 15, 2007 | | | 20,500 | | | $7.21 | | N/A | | N/A |
| August 17, 2007 | | | 11,254 | | | $7.52 | | N/A | | N/A |
| September 24, 2007 | | | 7,254 | | | $7.08 | | N/A | | N/A |
| October 19, 2007 | | | 6,045 | | | $7.10 | | N/A | | N/A |
ITEM 6. SELECTED CONSOLIDATED FINANCIAL DATA
The selected consolidated financial data set forth below should be read in conjunction with the consolidated financial statements and related notes, and “Management’s Discussion and Analysis of Financial Condition and Results of Operations,” included in this Form 10-K.
| | | Year Ended December 31, |
| | | 2003 | | 2004 | | 2005 | | 2006 | | 2007 |
| Consolidated Statement of Income Data: | | (in thousands, except per share data) |
| Total revenues | | $50,831 | | $55,762 | | $59,243 | | $71,376 | | $85,755 |
| Operating income | | 7,338 | | 11,800 | | 10,191 | | 16,148 | | 16,127 |
| Income from continuing operations | | 6,328 | | 7,105 | | 6,363 | | 10,739 | | 11,955 |
| Net income | | 6,328 | | 7,105 | | 6,363 | | 10,739 | | 11,955 |
| Income per share from continuing operations – basic | | 0.11 | | 0.12 | | 0.11 | | 0.17 | | 0.19 |
| Income per share from continuing operations – diluted | | 0.11 | | 0.12 | | 0.10 | | 0.17 | | 0.19 |
| Net income per share – basic | | 0.11 | | 0.12 | | 0.11 | | 0.17 | | 0.19 |
| Net income per share – diluted | | 0.11 | | 0.12 | | 0.10 | | 0.17 | | 0.19 |
As further discussed in Note 2 in the Notes to Consolidated Financial Statements included in this Form 10-K, we recorded a $5.0 million charge for the anticipated contract loss under our contract with the California Secretary of State in the first quarter of 2005.
| | | December 31, |
| | | 2003 | | 2004 | | 2005 | | 2006 | | 2007 |
| Consolidated Balance Sheet Data: | | (in thousands, except for dividends declared) |
| Total assets | | $85,740 | | $93,071 | | $117,845 | | $140,134 | | $ | 111,376 |
| Long-term debt (includes current portion of notes payable/ | | | | | | | | | | | |
| capital lease obligations) | | 363 | | — | | — | | — | | | — |
| Dividends declared per share outstanding on | | | | | | | | | | | |
| February 12, 2007 | | — | | — | | — | | — | | $ | 0.75 |
| Total shareholders’ equity | | 63,164 | | 72,260 | | 85,168 | | 99,254 | | | 66,865 |
As further discussed in Note 9 in the Notes to Consolidated Financial Statements included in this Form 10-K, we paid a special dividend totaling approximately $46.7 million out of our available cash and marketable securities in February 2007.
29
| ITEM 7. | | MANAGEMENT’S DISCUSSION AND ANALYSIS OF FINANCIAL CONDITION AND RESULTS OF OPERATIONS |
Caution about Forward-Looking Statements
“Safe Harbor” statement under the Private Securities Litigation Reform Act of 1995: Statements in this Annual Report on Form 10-K regarding NIC and its business, which are not current or historical facts, are “ forward-looking statements” that involve risks and uncertainties. Certain matters discussed in this report may constitute forward-looking statements within the meaning of the federal securities laws that inherently include certain risks and uncertainties. Forward-looking statements include, but are not limited to, statements of plans and objectives, statements of future economic performance or financial projections, statements of assumptions underlying such statements, and statements of the Company’s or management’s intentions, hopes, beliefs, expectations or predictions of the future. For example, statements like we “expect,” we “believe,” we “plan,” we “intend” or we “anticipate” are forward-looking statements. Investors should be aware that our actual operating results and financial performance may differ materially from our expressed expectations because of risks and uncertainties about the future including those risks discussed in this 2007 Annual Report on Form 10-K. In addition, we will not necessarily update the information in this Form 10-K if any forward-looking statement later turns out to be inaccurate. Investors are cautioned not to put undue reliance on any forward-looking statement.
There are a number of important factors that could cause actual results to differ materially from those suggested or indicated by such forward-looking statements. These include, among others, the success of the Company in signing contracts with new states and government agencies, including continued favorable government legislation; NIC’s ability to develop new services; existing states and agencies adopting those new services; acceptance of eGovernment services by businesses and citizens; competition; and general economic conditions and the other factors discussed under “CAUTIONS ABOUT FORWARD LOOKING STATEMENTS” in Part I and “RISK FACTORS” in Part I, Item 1A of this 2007 Annual Report on Form 10-K. Investors should read all of these discussions of risks carefully.
What We Do – An Executive Summary
We are a leading provider of eGovernment services that help governments use the Internet to reduce costs and provide a higher level of service to businesses and citizens. We accomplish this currently through two divisions: our core portal outsourcing businesses and our software & services businesses.
In our core business, portal outsourcing, we enter into contracts primarily with state governments and design, build and operate Web-based portals on their behalf. We enter into long-term contracts, typically three to five years, and manage operations for each government partner through separate subsidiaries that operate as decentralized businesses with a high degree of autonomy. Our portals consist of Web sites and applications that we build, which allow businesses and citizens to access government information online and complete transactions, including applying for a permit, retrieving driver’s license records or filing a form or report. We help increase our government partners’ revenues by expanding the distribution of their information assets and increasing the number of financial transactions conducted with governments. We do this by marketing portal services and soliciting users to complete government-based transactions and to enter into subscriber contracts that permit users to access the portal and the government information contained therein in exchange for transactional and/or subscription user fees. We are typically responsible for funding up-front investment and ongoing operational costs of the government portals. Our unique self-funding business model allows us to reduce our government partners’ financial and technology risks and obtain revenues by sharing in the fees generated from eGovernment services. Our partners benefit because they gain a centralized, customer-focused presence on the Internet. Businesses and citizens gain a faster, more convenient and more cost-effective means to interact with governments.
On behalf of our government partners, we enter into separate agreements with various agencies and divisions of the government to provide specific services and to conduct specific transactions. These agreements preliminarily establish the pricing of the transaction and data access services we provide and the division of revenues between the Company and the government agency. The government must approve prices and revenue sharing agreements. We generally own all the applications developed under these contracts. After completion of a defined contract term, the government agency typically receives a perpetual, royalty-free license to the applications
30
for use only. If our contract were not renewed after a defined term, the government agency would be entitled to take over the portal in place with no future obligation of the Company. In some cases, we enter into contracts to provide consulting, development and portal management services to governments in exchange for an agreed-upon fee.
Currently, we have contracts to provide portal outsourcing services for 21 states. Our closest competitor operates one state portal. We also provide portal outsourcing services to three local governments.
Our objective is to strengthen our position as the leading provider of Internet-based eGovernment services. Key strategies to achieve this objective include:
- Renew all current outsourced government portal contracts –First and foremost, we will strive to obtain renewal of all currently profitable outsourced government portal contracts. In the history of our company, we have not lost a contract renewal opportunity or re-bid process and are very proud of our highly reference-able list of government partners.
- Win new portal contracts –A key objective of the Company in 2007 was to accelerate new state portal contract wins by making incremental expenditures in the areas of business development and marketing, through a combination of additional sales personnel, strategic advertising and public relations initiatives. In 2008, we will continue with similar levels of investment in business development and portal operations to drive long-term growth. Our goal is to continue expanding our number of government partners by leveraging our strong relationships with current government partners and our reputation for providing proven eGovernment services. We intend to continue marketing our services to new governments. Our expansion efforts include developing relationships and sponsors throughout an individual government entity, pursuing strategic technology alliances, making presentations at conferences of government executives with responsibility for information technology policy, and developing contacts with organizations that act as forums for discussions between these executives.
- Increase transactional revenues from our existing government portals –Part of our strategy is to increase transactional revenues from our existing government portals by building new applications and services, taking successful applications and services and implementing them in our other government portal states, and increasing the adoption of existing portal applications and services.
We intend to accomplish this with new service offerings, increased operational focus and expanded marketing initiatives. In addition, we will work closely with the governance entities in our partner portals to evaluate the pricing of new and existing services to encourage higher usage and increased revenue streams. We plan to continue our development of new online transactional services that enable government agencies to interact more effectively and efficiently with businesses, citizens and other government agencies. We will continue to work with government agencies, professional associations and other organizations to better understand the current and future needs of our customers. We will continue to work with our government partners to create awareness of the online alternatives to traditional government interaction through initiatives such as informational brochures, government voicemail recordings and inclusion of Web site information on government communication materials. In addition, we will continue to update our portals to highlight new government service information provided on the portals. We plan to work with professional associations to directly and indirectly communicate to their members the potential convenience, ease of use and other benefits of the services our portals offer.
In addition to overall portal revenue growth, which includes both organic revenue growth and growth from new portal contract wins, an important financial metric that we use to gauge our success in increasing transactional revenues in our existing portal businesses is same state revenue growth. Prior to July 1, 2006, we defined same state revenues as those from states in operation and generating DMV revenues for two full years. DMV revenues are transaction fees that we earn from the sale of driver history records through the portals we operate. Our Indiana portal subsidiary signed a new long-term contract with the state of Indiana that commenced on July 1, 2006. This contract is based on a funding model that includes recurring fixed monthly fees for baseline services and primarily time and materials pricing for variable services. Historically, the majority of revenues under this contract were DMV and non-DMV transaction-based. Under the new contract, the majority of revenues will be classified
31
as portal management. Because the majority of revenues from the new Indiana contract are generally recurring, we will continue to include Indiana portal revenues in the calculation of same state revenue growth even though we no longer earn DMV transaction-based revenues under the contract. In June 2007, we signed a similar long-term contract with the state of Arizona that is based on a funding model that includes recurring fixed monthly fees for baseline services and primarily time and materials pricing for variable services. Under this contract, the majority of revenues will be classified as portal management.
Our long-term goal is to grow same state revenues 10-15% per year, absent online DMV price increases. Same state portal revenues grew 15% in 2007, 10% in 2006 and 17% in 2005. Our same state revenue growth in 2007 was higher than our growth in prior years primarily due to increases in same state DMV and non-DMV transaction based revenue growth. In 2007, same state DMV revenues grew by 10% (excluding Indiana from the calculation) primarily due to DMV price increases in three of our portal states in late 2006 and in one portal state in the third quarter of 2007. In 2006, same state DMV revenues grew by 3% (excluding Indiana from the calculation) and were not impacted by DMV price increases. In 2005, same state DMV revenues grew by 9% primarily due to DMV price increases in two of our portal states in late 2004. Historically, DMV price increases have been relatively infrequent, and our ability to grow same state DMV revenues has been limited, as such revenues have been driven by broader economic factors outside of our control. Absent DMV price increases, same state DMV revenues have historically grown at a rate of 1% to 3% per year.
An important component of same state revenue growth is the growth in non-DMV transaction revenues, which are transaction fees generated by other means than from the sale of DMV records, for transactions conducted primarily by business users and, to a lesser extent, consumer users through our portals. In 2007, same state non-DMV revenues grew 31% (excluding Indiana from the calculation), up from 27% in 2006 and down from 41% in 2005. We are able to grow non-DMV revenues by continually deploying new revenue generating applications and by driving adoption of existing applications within our existing portal businesses. We believe a key factor in organically growing our revenues is to continually focus on driving adoption, and on implementation of new non-DMV revenue generating applications.
- Continue to grow profitability –In addition to driving same state revenue growth, part of our strategy is to increase profitability by driving cost containment efforts throughout the Company and maintaining a lean organizational structure that fosters entrepreneurial decision-making and innovation and accentuates the strong financial leverage of our business model.
An important financial metric that we use to gauge our portal profitability is portal gross profit percentage, or gross profit rate, which is calculated by dividing portal gross profit (portal revenues minus cost of portal revenues, excluding depreciation and amortization) by portal revenues. Our long-term outlook is for our portal gross profit rate to be in the 45-50% range. Our portal gross profit rate was 47% in 2007 and 2006, down from 49% in 2005. The decrease in 2006 was partially attributable to additional personnel in several of our portals due to our continued growth and reinvestment in our core business, coupled with mid-year 2006 non-executive salary increases across all portals that were in addition to normal annual increases, in an effort to better align our employee compensation structure with the general market. Also contributing to this decrease was an increase in bank fees. A growing percentage of our non-DMV transaction-based revenues are generated from online applications whereby users pay for information or transactions via credit cards. We typically earn a percentage of the credit card transaction amount, but also must pay an associated fee to the bank that processes the credit card transaction. We earn a lower gross profit percentage on these transactions as compared to our other non-DMV applications. However, we plan to continue to implement these services as they contribute favorably to our operating income growth. We carefully monitor our portal gross profit percentage to strike the balance between generating a solid return for our shareholders and delivering value to our government partners through reinvestment in our portal operations. We currently expect our portal gross profit percentage to range from 45% to 47% in 2008.
32
We also view selling & administrative costs, expressed as a percentage of portal revenue, to be an important indicator of the relative year-over-year growth in our corporate level expenses. Selling & administrative costs as a percentage of portal revenue were 26% in 2007, 22% in 2006 and 22% in 2005. In 2007, the increase in selling & administrative costs as a percentage of portal revenue resulted primarily from our incremental investment in business development and portal operations to drive long-term growth, as further discussed above. In 2008, we expect selling & administrative costs as a percentage of portal revenue to range from 24% to 25%, which reflects a return to historical levels of modest expense growth. We also expect depreciation and amortization expense as a percentage of portal revenue to range from 3% to 4%, as we will continue to make key IT infrastructure and security investments to support our long-term expansion and enhance corporate-wide information technology security and portal operations.
Finally, our consolidated operating margin (operating income or loss divided by portal revenues) is an important measure of our overall profitability. This metric decreased to 20% in 2007, down from 23% in 2006 and up from 18% in 2005. The decrease in 2007 resulted from our incremental investment in business development and portal operations to drive long-term growth, as further discussed above. The decrease in 2005 was mainly due to the effect of the adjustment under percentage of completion accounting recorded in the first quarter of 2005 relating to our contract with the California Secretary of State, which resulted in a $3.5 million reduction in software & services revenues in 2005 as further discussed below.
Overview of Business Models and Revenue Recognition
We classify our revenues and cost of revenues into two categories: (1) portal and (2) software & services. The portal category includes revenues and cost of revenues primarily from our subsidiaries operating government portals on an outsourced basis. The software & services category includes revenues and cost of revenues primarily from our UCC and corporate filings and ethics & elections businesses. We currently derive revenue from two main sources: transaction-based fees and fees for application development. Each of these revenue types and the corresponding business models are further described below.
Our portal outsourcing businesses
We categorize our portal revenues according to the underlying source of revenue. A brief description of each category follows:
- DMV transaction-based: these are transaction fees from the sale of electronic access to driver history records, referred to as DMV records, from our state portals to data resellers, insurance companies and other pre-authorized customers on behalf of our state partners, and are generally recurring.
- Non-DMV transaction-based: these are transaction fees from sources other than the sale of DMV records, for transactions conducted by business users and consumer users through our portals, and are generally recurring. For a representative listing of non-DMV services we currently offer through our portals, refer to Part I, Item 1 in this Form 10-K.
- Software development & portal management: these are fees from the performance of software development projects and other time and materials or fixed fee services for our government partners. While we actively market portal software development services, they do not have the same degree of predictability as our transaction-based or portal management revenues.
The highest volume, most commercially valuable service we offer is electronic access to DMV records through our insurance industry records exchange network. This service accounted for approximately 54% of our portal revenues in 2007, 59% in 2006 and 62% in 2005. We believe that while this application will continue to be an important source of revenue, its contribution as a percentage of total revenues on an individual portal basis will decline modestly as other sources grow. ChoicePoint, which resells these records to the auto insurance industry, accounted for approximately 40% of portal revenues in 2007, 47% in 2006 and 46% in 2005.
33
In our outsourced portal businesses for 2007, DMV transaction-based revenues represented approximately 54% of portal revenues, non-DMV transaction-based revenues represented approximately 34%, and software development & portal management revenues represented 12%. Software development & portal management revenues as a percentage of total portal revenues increased modestly in 2007 due to our new Arizona portal contract and the Indiana portal contract, as further discussed above. Approximately 85% of our transaction-based revenues related to business-to-government transactions, while the remaining 15% related to citizen-to-government transactions.
Transaction-based revenues from our outsourced state portal business units are highly correlated to population, but are also affected by pricing policies established by government entities for public records, the number and growth of commercial enterprises and the government entity’s development of policy and information technology infrastructure supporting electronic government.
ChoicePoint and other data resellers and companies who access DMV records electronically through our insurance industry records exchange network have entered into contracts with the portals our subsidiaries operate to request these records from the various states with which we have contracts. Under the terms of these contracts, we provide data resellers with driver’s license and traffic records that vary by contract, for fees that currently range from $2.00 to $20.00 per record requested. The fees charged to all entities that access DMV records are the same for records of a particular state. We typically collect the entire fee, of which a certain portion is remitted to the state by statute. These contracts are generally self-renewing until canceled by one side or the other, and generally may be terminated at any time after 60-days notice. These contracts may be terminated immediately at the option of any party upon a material breach of the contract by the other party. Furthermore, these contracts are immediately terminable if the state statute allowing for the public release of these records is repealed.
We charge for electronic access to records on a per-record basis and, depending upon government policies, also on a fixed or sliding scale bulk basis. Our fees are set by negotiation with the government agencies that control the records and are typically approved by a government sanctioned oversight body. We recognize revenues from transactions (primarily transaction-based information access fees and filing fees) on an accrual basis net of the transaction fee due to the government, and we bill end-user customers primarily on a monthly basis. We typically receive a majority of payments via electronic funds transfer and credit card within 25 days of billing and remit payment to governments within 30 to 45 days of the transaction. The costs that we pay state agencies for data access are accrued as accounts receivable and accounts payable at the time revenue from the access of public information is recognized. We must remit a certain amount or percentage of these fees to government agencies regardless of whether we ultimately collect the fees. The pricing of transactions varies by the type of transaction and by state.
We expense as incurred all employee costs to start up, operate and maintain outsourced government portals as costs of performance under the contracts because, after the completion of a defined contract term, the government entities with which we contract typically receive a perpetual, royalty-free license to the applications we developed. Such costs are included in cost of portal revenues in the consolidated statements of income.
Our software & services businesses
UCC and corporate filings
Our UCC and corporate filings software development business derives the majority of its revenues from fixed-price application development contracts and recognizes revenues on the percentage of completion method. At December 31, 2007, this business was primarily engaged in servicing its contract with the California Secretary of State, as further discussed below, and no longer markets its applications and services in respect of new engagements.
Ethics & elections
Our ethics & elections business derives the majority of its revenues from time and materials application development and maintenance outsourcing contracts and recognizes revenues as services are provided. At December 31, 2007, our ethics & elections business was primarily engaged in servicing its contracts with the Federal Election Commission and the state of Michigan.
34
Critical Accounting Policies
Many estimates and assumptions involved in the application of generally accepted accounting principles have a material impact on reported financial condition and operating performance and on the comparability of such reported information over different reporting periods. A critical accounting policy is one which is both important to the portrayal of the Company’s financial condition and results of operations and requires management’s most difficult, subjective or complex judgments, often as a result of the need to make estimates and assumptions about the effect of matters that are inherently uncertain. Our significant accounting policies are described in Note 2 to the Notes to Consolidated Financial Statements included in this Form 10-K. We have identified the policies below as critical to our business operations and the understanding of our results of operations. Note that the preparation of our consolidated financial statements in conformity with generally accepted accounting principles requires management to make estimates and assumptions that affect the reported amounts of assets and liabilities and disclosure of contingent assets and liabilities at the date of the financial statements and the reported amounts of revenues and expenses during the reporting period. There can be no assurance that actual results will not differ from those estimates.
Management has discussed the development and selection of the critical accounting policies described below with the Audit Committee of the Board of Directors, and the Audit Committee has reviewed the Company’s disclosure relating to it in this Management’s Discussion and Analysis of Financial Condition and Results of Operations.
Uncertain Tax Positions
We account for uncertain tax positions in accordance with FASB Interpretation No. (“FIN”) 48, “Accounting for Uncertainty in Income Taxes – an interpretation of FASB Statement No. 109.” The application of income tax law is inherently complex. Laws and regulations in this area are voluminous and are often ambiguous. As such, we are required to make many subjective assumptions and judgments regarding our income tax exposures. Interpretations of and guidance surrounding income tax laws and regulations change over time. As such, changes in our subjective assumptions and judgments can materially affect amounts recognized in the consolidated balance sheets and statements of income. See Notes 2 and 10 in the Notes to the Consolidated Financial Statements included in this Form 10-K for additional detail on our adoption of FIN 48 in the first quarter of 2007 and our uncertain tax positions.
Deferred income taxes
We recognize deferred income taxes for the tax consequences in future years of differences between the tax basis of assets and liabilities and their financial reporting amounts at each year-end based on enacted laws and statutory tax rates applicable to the periods in which the differences are expected to affect taxable income. Valuation allowances are established, when necessary, to reduce deferred tax assets to the amount expected to be realized.
We have a history of unprofitable operations prior to 2003 primarily due to operating losses incurred in our software & services businesses. These losses generated significant federal tax net operating losses, or NOLs. We had available at December 31, 2007, total NOL carryforwards for federal tax purposes of approximately $25.1 million that will expire in the years 2021 ($14.8 million) and 2022 ($10.3 million), respectively. We became profitable in the second half of 2002. We currently expect the Company to continue to be profitable and generate taxable income, and have focused the business on operations that have demonstrable ability to produce positive taxable income and sustainable cash flow in the future. We believe it is more likely than not that we will generate sufficient taxable income from future operations to fully utilize the NOL carryforwards prior to expiration. Based on our current projections, we currently expect to fully utilize the NOL carryforwards by the end of 2009. The recorded amount of the deferred tax assets considered realizable could be reduced in the near term if estimates of future taxable income during the carryforward periods are reduced. There is considerable management judgment necessary to determine future taxable income, and accordingly, actual results could vary significantly from such estimates. For additional discussion of deferred income taxes, see Note 10 in the Notes to Consolidated Financial Statements included in this Form 10-K. For the years ended December 31, 2007 and 2006, total net deferred tax assets, including NOL carryforwards, comprised approximately 16% of our total assets.
35
Valuation of Marketable Securities
Our short-term investments at December 31, 2007, consist entirely of marketable auction-rate debt securities. The fair values for marketable debt securities are determined by independent pricing sources that value the securities based on market prices or broker quotes and pricing models. Considerable judgment is required in determining the assumptions used in valuation models for our auction-rate debt securities, including interest rate, credit risk and liquidity risk assumptions. Significant changes in these assumptions can have a significant effect on carrying value.
We assess other-than-temporary impairment of marketable debt securities in accordance with FASB Staff Position No. FAS 115-1, “The Meaning of Other-Than-Temporary Impairment and its Application to Certain Investments.” This assessment requires significant judgment. In making this determination, we employ a systematic methodology that considers available quantitative and qualitative evidence in evaluating potential impairment of our investments. If the cost of an investment exceeds its fair value, we evaluate general market conditions, earnings performance, credit rating, asset quality, and other key measures for our investments. We also consider the duration and extent to which the fair value has been less than cost, and our ability and intent to hold the investment. Once a decline in fair value is determined to be other-than-temporary, an impairment charge is recorded and a new costs basis in the investment is established. We have not recorded any other-than-temporary impairments for marketable debt securities. However, if market, industry and/or investee conditions deteriorate, we may record impairments in the future, which could be material.
Application development contracts
Our UCC and corporate filings software development business, NIC Conquest, derives the majority of its revenues from fixed-price application development contracts and recognizes revenues on the percentage of completion method, utilizing costs incurred to date as compared to the estimated total costs for each contract. This method is used because management considers expended costs to be the best available measure of progress on our fixed-price contracts and results in our recognizing contract revenues over the contract term in proportion to our incurrence of contract costs. The earnings or losses recognized on individual contracts are based on management’s estimates of contract revenues and costs. Contract losses are recognized in full when determined, and contract profit estimates are adjusted based on ongoing reviews of contract profitability. Use of the percentage of completion method requires that management be able to reasonably estimate total contract costs and costs to complete at each reporting date. We continuously review and reassess our estimates of contract profitability.
Our UCC and corporate filings software development business has incurred substantial losses under its fixed-price contracts primarily due to cost overruns. As recently as the first quarter of 2005, we recorded a $5.0 million charge due to anticipated cost overruns on our contract with the California Secretary of State (as further discussed below and in Note 2 to the Notes to Consolidated Financial Statements included in this Form 10-K). In June 2006, the California Secretary of State officially accepted the UCC system, which also commenced the maintenance and operations phase of the contract. However, it is possible that our costs will similarly exceed revenues in the future, as a result of unforeseen difficulties such as rising development, subcontractor and personnel costs or other reasons. If this occurs, the Company’s results of operations, financial condition and cash flows could be adversely affected. Because of the inherent uncertainties in estimating the costs of completion, it is at least reasonably possible that our estimates will change in the near term.
Financial Analysis of Years Ended December 31, 2007, 2006 and 2005
In this section, we are providing more detailed information about our operating results and changes in financial position over the past three years. This section should be read in conjunction with the consolidated financial statements and related notes included in this Form 10-K.
California Secretary of State Contract
Results of operations for the year ended December 31, 2005 include a $5.0 million charge we recorded on our software & services engagement with the California Secretary of State (the “California SOS”) in the first quarter of 2005, as further discussed in Note 2 in the Notes to Consolidated Financial Statements included in this Form 10-K. Prior to the first quarter of 2005, key elements of our obligations under the California SOS contract were
36
subcontracted to various third parties under fixed price contracts. At the end of the first quarter of 2005, as a result of system delivery issues and the concern over the ability of one of the two remaining subcontractors to meet the criteria set forth by the California SOS, we determined we would assume the lead project manager role on the contract, which was previously performed by this subcontractor. As a result of this change, we further evaluated the status of the project and concluded that a further modification to the management and oversight structure of the project was necessary to improve performance under the contract and that additional internal project management and technical personnel would be required on the engagement. We also reevaluated the expected completion date of the project, which was previously estimated to be in the first quarter of 2006, and determined to revise the estimated completion date to the end of 2006. As a result of our decision to commit these additional resources and the extension of the expected project completion date, we recorded a $5.0 million adjustment under percentage of completion accounting in the first quarter of 2005, as we expected to incur a loss of approximately $4.2 million on this project, instead of a previously projected profit of approximately $1.0 million.
The adjustment in our consolidated statement of income for the year ended December 31, 2005 resulted in a reduction of software & services revenues of approximately $3.5 million and an increase in cost of software & services revenues of approximately $1.5 million.The adjustment in our consolidated balance sheet was a reduction in unbilled revenues of approximately $3.5 million and an increase in application development contracts (a current liability) of approximately $1.5 million.
In March 2006, we entered into an amendment to our contract with the California SOS. Among other changes, the amendment reduced the aggregate contract value from approximately $25 million to approximately $19 million, and released us from the obligation to deliver the business filings, or BE, portion of the project, except for maintenance of hardware and delivery of BE images as expressly set forth in the amendment. The amendment also set forth the final criteria in order for the California SOS to accept the Uniform Commercial Code, or UCC, portion of the project and move it into the maintenance and operations phase.
As a result of the amendment, we recorded an adjustment under percentage of completion accounting in the first quarter of 2006. The adjustment in our consolidated statement of income for the year ended December 31, 2006 resulted in a reduction of software & services revenues of approximately $2.1 million and a reduction of cost of software & services revenues of approximately $2.1 million. The adjustment in our consolidated balance sheet was a reduction in unbilled revenues of approximately $2.1 million, a reduction of accrued liabilities of approximately $1.6 million, and a reduction of application development contracts of approximately $0.5 million. This adjustment did not affect operating income, net income or earnings per share.
In June 2006, the California SOS officially accepted the UCC portion of the project, which also commenced the 42-month maintenance and operations phase.
We regularly review our cost estimates to complete and do not currently believe our estimated contract loss will exceed the $4.2 million estimate established in the first quarter of 2005. However, it is at least reasonably possible that our estimate will change in the near term. Further, it is possible that we will similarly incur cost overruns in the future as we have in the past as a result of unforeseen difficulties such as rising development, subcontractor and personnel costs or other reasons. If this occurs, our results of operations, financial condition and cash flows could be adversely affected.
At December 31, 2007, our corporate filings software & services business was primarily engaged in servicing the maintenance and operations obligation under its contract with the California SOS. This business is not marketing its applications and services for new engagements.
Stock-Based Compensation
In December 2004, the Financial Accounting Standards Board (“FASB”) issued Statement of Financial Accounting Standards (“SFAS”) No. 123R (revised 2004), “Share–Based Payment,” that requires companies to expense the grant-date fair value of stock options and other equity-based compensation issued to employees. SFAS No. 123R eliminates the use of the intrinsic value method prescribed in Accounting Principles Board Opinion (“APB”) No. 25, “Accounting for Stock Issued to Employees,” that we used to account for our stock-based compensation plans prior to January 1, 2006.
37
Effective January 1, 2006, we adopted the provisions of SFAS No. 123R using the modified prospective application transition method, which did not require us to restate our financial statements prior to the effective date of SFAS No. 123R. For vested stock option awards that were outstanding on January 1, 2006, the modified prospective application transition method did not require us to record any additional compensation expense. For unvested stock option awards that were outstanding on January 1, 2006, awards that were previously included as part of the pro forma net income and earnings per share calculations of SFAS No. 123 have been charged to expense over the remaining vesting period, without any changes in measurement. For all new equity-based awards that have been granted or modified after January 1, 2006, we have used SFAS No. 123R’s measurement model, expense recognition, and settlement provisions.
Prior to the adoption of SFAS No. 123R, we did not recognize stock-based compensation expense if the exercise price of stock options granted to employees or nonemployee directors was greater than or equal to the price of our common stock on the grant date. In addition, we did not recognize stock-based compensation expense for shares issued under our employee stock purchase plan. Beginning January 1, 2006 with the adoption of SFAS No. 123R, we began recognizing stock-based compensation expense for the cost of stock options, restricted stock awards and shares issued under our employee stock purchase plan. The following table presents stock-based compensation expense included in our consolidated statements of income for the years ended December 31, 2006 and 2007 (in thousands):
| | Year Ended December 31, |
| | 2007 | | 2006 |
| Cost of portal revenues, exclusive of depreciation & amortization | $ | 411 | | | $ | 346 | |
| Cost of software & services revenues, exclusive of depreciation | | | | | | | |
| and amortization | | 18 | | | | 19 | |
| Selling & administrative | | 1,248 | | | | 966 | |
| Stock-based compensation expense before income taxes | | 1,677 | | | | 1,331 | |
| Income tax benefit | | (655 | ) | | | (520 | ) |
| Net stock-based compensation expense | $ | 1,022 | | | $ | 811 | |
As of December 31, 2007, there was approximately $0.3 million of total unrecognized compensation cost, net of estimated forfeitures, related to nonvested stock options and approximately $2.1 million of total unrecognized compensation cost, net of estimated forfeitures, related to nonvested restricted stock awards. We expect to recognize the cost related to stock options over a weighted-average period of 1.2 years and the cost related to restricted stock awards over the next 3.0 years. We did not grant any stock options during the year-ended December 31, 2007 and 2006, and do not currently anticipate granting stock options in the future. Instead, the Company expects to grant only restricted stock awards.
On October 26, 2005, our Board of Directors approved the acceleration of vesting of all unvested options to purchase common stock of the Company that had an exercise price that was greater than the market price on that date. The closing price of our common stock on the NASDAQ Global Select Market on October 26, 2005 was $5.63 per share. As a condition of the acceleration and to prevent unintended personal benefit, the Company’s directors, executive officers and employees must refrain from selling common stock acquired upon the exercise of accelerated options until the original vesting date or, if earlier, termination of employment with or service to the Company. All other terms and conditions applicable to such options, including exercise prices, remained unchanged. This action resulted in the accelerated vesting of options to purchase 163,873 shares of common stock of the Company, or approximately six percent of the total of all then-outstanding Company options.
We accelerated the vesting of these options because we believed it was in the best interest of our shareholders to reduce future compensation expense that we would otherwise have been required to report in our statement of income upon adoption of SFAS No. 123R in the first quarter of 2006. Further, because the options had exercise prices in excess of the then-current market price, they were viewed to have limited economic value and were not achieving their objective of incentive compensation and retention. As a result of the vesting acceleration, approximately $0.5 million in aggregate future expense was eliminated.
38
We believe that equity-based compensation, particularly restricted stock awards, will continue to play an important role in supporting employee retention and providing individuals with long-term incentives to meet Company goals. For additional information regarding our adoption of SFAS No. 123R, see Note 11 in the Notes to Consolidated Financial Statements included in this Form 10-K.
Results of Operations
| Key Financial Metrics | | 2007 | | 2006 | | 2005 |
| Revenue growth – outsourced portals | | 18 | % | | 21 | % | | 19 | % |
| Same state revenue growth – outsourced portals | | 15 | % | | 10 | % | | 17 | % |
| Recurring portal revenue % | | 93 | % | | 95 | % | | 96 | % |
| Gross profit % - outsourced portals | | 47 | % | | 47 | % | | 49 | % |
| Selling & administrative expenses as % of portal revenues | | 26 | % | | 22 | % | | 22 | % |
| Operating income margin % (operating income as a | | | | | | | | | |
| % of portal revenues) | | 20 | % | | 23 | % | | 18 | % |
PORTAL REVENUES. In the analysis below, we have categorized our portal revenues according to the underlying source of revenue (in thousands), with the corresponding percentage increase or decrease from the prior year period.
| | | | | Increase | | | | | Increase | | | |
| Portal Revenue Analysis | | 2007 | | from 2006 | | 2006 | | from 2005 | | 2005 |
| DMV transaction-based | | $ | 44,387 | | 8 | % | | $ | 41,247 | | 16 | % | | $ | 35,630 |
| Non-DMV transaction-based | | | 27,981 | | 21 | % | | | 23,165 | | 15 | % | | | 20,145 |
| Software development & portal management | | | 10,084 | | 80 | % | | | 5,597 | | 167 | % | | | 2,100 |
| Total | | $ | 82,452 | | 18 | % | | $ | 70,009 | | 21 | % | | $ | 57,875 |
Portal revenues for 2007 increased 18%, or approximately $12.4 million, over 2006. This increase was mainly attributable to a 15% increase, or approximately $10.5 million, in same state portal revenues (outsourced portals in operation and generating recurring revenue for two full years) and a 3% increase, or approximately $1.9 million, in revenues from our newer portals, including Vermont ($1.0 million), which began to generate DMV revenues in October 2006 and Arizona ($0.9 million), which began to generate revenues in October 2007.
Our Indiana portal subsidiary signed a new long-term contract with the state of Indiana that commenced on July 1, 2006. The new contract is based on a funding model that includes recurring fixed monthly fees for baseline services and primarily time and materials pricing for variable services. Historically, the majority of revenues under this contract were DMV and non-DMV transaction-based. Under the new contract, the majority of revenues will be classified as portal management. Prior to July 1, 2006, we defined same state revenues as those from states in operation and generating DMV revenues for two full years. Because the majority of revenues from the new Indiana contract are generally recurring, we have continued to include Indiana portal revenues in the calculation of same state revenue growth even though we no longer earn DMV transaction-based revenues under the contract. Same state portal revenues in 2007 increased 15% over 2006 primarily due to increased transaction revenues from our Alabama, Arkansas, Idaho, Kentucky, Montana, and South Carolina portals, among others.
Excluding Indiana, same state portal revenues in 2007 increased 18%, or approximately $10.6 million, over 2006, with same state DMV transaction-based revenues increasing 10%, or approximately $3.9 million, and same state non-DMV transaction-based revenues increasing 31%, or approximately $5.8 million (primarily due to the addition of several new revenue generating applications in existing portals). Our same state revenue growth in the current year was higher than the 11% growth we achieved in 2006 primarily due to increases in same state DMV and non-DMV transaction-based revenue growth. Excluding Indiana, same state DMV revenue growth in 2007 was 10% compared to 3% in 2006. The higher growth in 2007 was primarily due to the effect of DMV price increases in three of our portal states in late 2006 and in one portal state in the third quarter of 2007. Absent DMV price increases, same state DMV revenues have historically grown at a rate of 1% to 3% per year.
39
Portal revenues for 2006 increased 21%, or approximately $12.1 million, over 2005. This increase was attributable to a 10% increase, or approximately $5.6 million, in same state portal revenues and an 11% increase, or approximately $6.5 million, in revenues at our newer portals, including South Carolina ($1.5 million), which began to generate DMV revenues in June 2005, and Colorado ($5.0 million), which began to generate DMV revenues in October 2005.
Excluding Indiana, same state portal revenues in 2006 increased 11%, or approximately $5.1 million, over 2005, with same state DMV transaction-based revenues increasing 3%, or approximately $0.9 million, and same state non-DMV transaction-based revenues increasing 27%, or approximately $3.8 million (primarily due to the addition of several new revenue generating applications in existing portals). Our same state revenue growth in 2006 was lower than the 17% growth we achieved in 2005 primarily due to decreases in same state DMV and non-DMV transaction-based revenue growth. Excluding Indiana, same state DMV revenue growth in 2006 was 3% compared to 9% in 2005. The higher growth in 2005 was primarily due to the effect of DMV price increases in two of our larger portal states in late 2004. Same state non-DMV transaction based revenue growth was 41% in 2005.
COST OF PORTAL REVENUES. Cost of portal revenues in 2007 increased 17%, or approximately $6.4 million, over 2006. Of this increase, 12%, or approximately $4.5 million, was attributable to an increase in same state cost of portal revenues, and 5%, or $1.9 million, was primarily attributable to our newer state portal businesses in Vermont, Arizona and West Virginia.
The increase in same state cost of portal revenues in 2007 was primarily attributable to additional personnel in several of our portals due to our continued growth and reinvestment in our core business. Also contributing to this increase was an increase in bank fees. A growing percentage of our non-DMV transaction-based revenues are generated from online applications whereby users pay for information or transactions via credit cards. We typically earn a percentage of the credit card transaction amount, but also must pay an associated fee to the bank that processes the credit card transaction. We earn a lower gross profit percentage on these transactions as compared to our other non-DMV applications. However, we plan to continue to implement these services as they contribute favorably to our operating income growth.
Cost of portal revenues in 2006 increased 26%, or approximately $7.8 million, over 2005. Of this increase, 17%, or approximately $5.1 million, was attributable to an increase in same state cost of portal revenues, and 9%, or approximately $2.7 million, was primarily attributable to our newer state portal businesses in South Carolina and Colorado.
The increase in same state cost of portal revenues in 2006 was partially attributable to additional personnel in several of our portals due to our continued growth and reinvestment in our core business, coupled with mid-year 2006 non-executive salary increases across all portals that were in addition to normal annual increases, in an effort to better align our employee compensation structure with the general market. Also contributing to this increase was an increase in bank fees, as described above.
Our portal gross profit percentage was 47% in 2007 and 2006, down from 49% in 2005. The decrease in 2006 was due to the increase in cost of portal revenues, as described above. We carefully monitor our portal gross profit percentage to strike the balance between generating a solid return for our shareholders and delivering value to our government partners through reinvestment in our portal operations. We currently expect our portal gross profit percentage to range from 45% to 47% in 2008.
SOFTWARE & SERVICES REVENUES. In the analysis below, we have categorized our software & services revenues by business (in thousands), with the corresponding percentage increase or decrease from the prior year period.
| | | | | | Increase/ | | | | | | Increase/ | | | | |
| | | | | | (Decrease) | | | | | | (Decrease) | | | | |
| Software & Services Revenue Analysis | | 2007 | | from 2006 | | 2006 | | from 2005 | | 2005 |
| UCC & corporate filings software development | | $ | 694 | | 179 | % | | $ | (883 | ) | | 34 | % | | $ | (1,328 | ) |
| Ethics & elections | | | 2,389 | | 29 | % | | | 1,847 | | | (18 | %) | | | 2,245 | |
| Other | | | 220 | | (45 | %) | | | 403 | | | (11 | %) | | | 451 | |
| Total | | $ | 3,303 | | 142 | % | | $ | 1,367 | | | — | | | $ | 1,368 | |
40
The increase in revenues in our ethics & elections business in 2007 is primarily due to our contract with the Federal Election Commission, which experienced budget reductions in 2006 in light of federal spending on the Hurricane Katrina relief effort. Software & services revenues in 2006 and 2005 primarily reflect revenue adjustments under percentage of completion accounting relating to our contract with the California Secretary of State, as further discussed above and in Note 2 in the Notes to Consolidated Financial Statements included in this Form 10-K. We recognize revenue on our contract with the California Secretary of State using the percentage of completion method as we make progress, utilizing costs incurred to date as compared to the estimated total cost for the contract.
COST OF SOFTWARE & SERVICES REVENUES. Cost of software & services revenues in 2006 and 2005 primarily reflects expense adjustments under percentage of completion accounting relating to our contract with the California Secretary of State as further discussed above and in Note 2 in the Notes to Consolidated Financial Statements included in this Form 10-K.
SELLING & ADMINISTRATIVE. Selling & administrative expenses in 2007 increased 41%, or approximately $6.3 million, over 2006. The increase in selling & administrative expenses was primarily attributable to the previously discussed incremental investment in business development, marketing and operations in an effort to accelerate new state portal contract wins and drive continued non-DMV growth, coupled with additional information technology personnel to support our long-term expansion and enhance corporate-wide information technology security and portal operations. As a result of these initiatives, our corporate-level headcount increased by approximately 23% in 2007. As further discussed in Item 1A, Item 3 and Note 8 in the Notes to the Consolidated Financial Statements included in this form 10-K, we are currently the subject of an informal SEC inquiry of expense reporting by certain officers of our Company and certain potentially related matters. In connection with that inquiry, a review was undertaken by the Audit Committee of our Board of Directors, with the assistance of outside, independent counsel, which focused on such expense reporting. In 2007, we have incurred legal fees and other expenses totaling approximately $0.7 million in connection with the informal SEC inquiry and the Audit Committee review and could incur significant legal fees and other expenses in connection with the ongoing, informal SEC inquiry.
Selling & administrative expenses in 2006 increased 21%, or approximately $2.7 million, over 2005. The increase in selling & administrative expenses was mostly attributable to additional personnel across our corporate level divisions, coupled with mid-year 2006 non-executive salary increases across all corporate level divisions that were in addition to normal annual increases, in an effort to better align our employee compensation structure with the general market. Our corporate level headcount increased by approximately 30% in 2006, as we added personnel to support and enhance corporate wide information technology security and portal operations, in addition to sales and marketing growth initiatives. In addition, selling & administrative expenses in 2006 include approximately $1.0 million in stock based compensation expense, as further discussed in Note 11 in the Notes to Consolidated Financial Statements included in this Form 10-K.
As a percentage of portal revenues, selling & administrative expenses were 26% in 2007 and 22% in 2006 and 2005. We currently expect selling & administrative costs as a percentage of portal revenue to range from 24% to 25% in 2008, which reflects a return to historical levels of modest expense growth.
DEPRECIATION & AMORTIZATION – Depreciation & amortization expense in 2007 increased 23%, or approximately $0.5 million, over 2006. This increase was primarily attributable to capital expenditures for normal fixed asset additions in our outsourced portal business, including Web servers, purchased software and office furniture and equipment to support and enhance corporate-wide information technology security and portal operations, in addition to capital expenditures for furniture, fixtures and leasehold improvements made in the second half of the year for our new corporate headquarters, as further discussed below.
As a percentage of portal revenues, depreciation & amortization was three percent in 2007, 2006 and 2005. We currently expect depreciation and amortization expense as a percentage of portal revenues to range from three to four percent in 2008, as we will continue to make key information technology infrastructure and security investments to support the long-term expansion of our portal business.
41
INTEREST INCOME. Interest income reflects interest earned on our investable cash and marketable securities portfolio. In 2005, we began investing our excess cash in short-term marketable debt securities, consisting primarily of auction-rate government-backed student loan obligations. Our marketable securities portfolio totaled $45.0 million at December 31, 2006, up significantly from $20.5 million at December 31, 2005. Higher short-term interest rates also contributed to the increase in interest income earned on these investments in 2006. As further discussed in Note 9 in the Notes to Consolidated Financial Statements included in this Form 10-K, we paid a special cash dividend of $0.75 per share totaling approximately $46.7 million in February 2007 out of our available cash and marketable securities. As a result of this dividend, interest income was lower in 2007 as compared to 2006. As further discussed in Note 14 to the Consolidated Financial Statements included in this Form 10-K, we paid a special cash dividend of $0.25 per share on February 28, 2008 totaling approximately $15.7 million out of our available cash and marketable securities. We currently expect interest income in 2008 to be lower than in 2007, partially as a result of paying this special dividend, but primarily because of the declining short-term interest rate environment we are currently experiencing.
GAIN (LOSS) ON AFFILIATE INVESTMENTS – Results of operations for the year ended December 31, 2007 include a $0.5 million gain on the sale of our remaining investment in e-Government Solutions Limited, a private joint venture based in London, England, as further discussed in Note 6 in the Notes to Consolidated Financial Statements included in this Form 10-K.
INCOME TAXES. Our effective tax rate was approximately 35% in 2007, 42% in 2006 and 42% in 2005. Our effective tax rate for 2007 was lower than the amount customarily expected due to the effect of decreases in the liability for uncertain tax positions totaling approximately $0.4 million in 2007, as further discussed in Note 10 in the Notes to Consolidated Financial Statements included in this Form 10-K. Our income tax provision for 2006 includes the establishment of a valuation allowance totaling approximately $177,000 for state income tax loss carryforwards that we may be unable to use, as further discussed in Note 10 in the Notes to Consolidated Financial Statements included in this Form 10-K. Prospectively, we currently expect our effective tax rate to be between 40% and 42%.
Liquidity and Capital Resources
Operating Activities
Net cash provided by operating activities was $24.6 million in 2007 compared to $25.7 million in 2006. The decrease in cash flow from operations was primarily the result of a year-over-year increase in operating income, excluding non-cash charges for depreciation & amortization and stock-based compensation, offset by a smaller increase in accounts payable in 2007 mainly due to the timing of payment processing for tax filing applications.
The smaller increase in accounts payable in 2007 was primarily attributable to an increase in fourth quarter tax payment processing from tax filing applications across various portal businesses. Such tax payments are frequently made via ACH or credit cards at the end of the year, whereby we do not receive payment until after year-end. The majority of these tax receipts were remitted to our government partners in early January 2008.
The increase in accrued expenses in 2007 was primarily due to increases in accrued payroll and benefit costs of approximately $0.7 million resulting from increased staffing.
Net cash provided by operating activities was $25.7 million in 2006 compared to $21.3 million in 2005. The increase in cash flow from operations was primarily the result of a year-over-year increase in operating income, excluding non-cash charges for depreciation & amortization and stock-based compensation, and the adjustments under percentage of completion accounting recorded in 2006 and 2005 on our contract with the California SOS, which did not affect operating cash flow.
The increases in accounts receivable and accounts payable in 2006 were primarily attributable to an increase in fourth quarter tax payment processing from tax filing applications across our portal businesses, most notably in Hawaii ($3.3 million increase in accounts receivable and $7.2 million increase in accounts payable). The increases in accounts receivable and accounts payable were also attributable to the general increase in revenues across our portal businesses in 2006.
42
The decrease in unbilled revenues in 2006 was primarily due to the first quarter 2006 adjustment under percentage of completion accounting relating to our contract with the California SOS that reduced unbilled revenues by approximately $2.1 million. Additionally, in June 2006, the California SOS officially accepted the UCC portion of the project, at which time approximately $1.5 million in milestone payments under the contract became due to us, thus reducing unbilled revenues.
The decrease in accrued expenses in 2006 was primarily due to the first quarter 2006 adjustment under percentage of completion accounting relating to our contract with the California SOS that reduced accrued liabilities by approximately $1.6 million.
We had a history of unprofitable operations prior to 2003 primarily due to operating losses incurred in our software & services businesses. These losses generated significant federal and state tax net operating losses, or NOLs, as further discussed above. As a result of our NOL carryforwards, we are not currently paying federal income taxes, with the exception of alternative minimum tax, and are only paying income taxes in certain states. This positively impacts our operating cash flow and will continue to positively impact our operating cash flow during the NOL carryforward periods. Based on our current projections, we expect to fully utilize our federal NOL carryforwards by the end of 2009. For the years ended December 31, 2007, 2006 and 2005, combined federal and state income tax payments totaled approximately $0.8 million, $0.4 million and $0.5 million, respectively.
Investing Activities
Cash provided by in investing activities in 2007 primarily reflects the liquidation of our marketable securities portfolio to pay the $46.7 million special cash dividend in February 2007, partially offset by the purchase of $18 million in marketable debt securities in an effort to increase investment income from our excess cash and $4.9 million of capital expenditures.
Capital expenditures in 2007 were primarily for normal fixed asset additions in our outsourced portal business, including Web servers, purchased software and office furniture and equipment to support and enhance corporate-wide information technology security and portal operations. Capital expenditures in 2007 also include approximately $1.0 million for furniture, fixtures and leasehold improvements made during the fourth quarter of the year for the Company’s new corporate headquarters. Investing activities in 2007 also included $0.5 million in proceeds from the sale of our remaining investment in the e-Government Solutions Limited joint venture, as further discussed in Note 6 in the Notes to Consolidated Financial Statements included in this Form 10-K. In 2007, we capitalized approximately $0.6 million of internal use software development costs relating to the standardization of customer management, billing and payment processing systems that support our portal operations and accounting systems.
Cash used in investing activities in 2006 primarily reflects $24.5 million in purchases of marketable debt securities in an effort to increase the investment income from our cash reserves, and $2.6 million of capital expenditures, which were primarily for normal fixed asset additions in our outsourced portal business, including Web servers, purchased software and office furniture and equipment, in addition to corporate-wide spending on information technology security.
Cash used in investing activities in 2005 primarily reflects $20.5 million in net purchases of marketable debt securities in an effort to increase the investment income from our growing cash reserves, and $2.3 million of capital expenditures, which were for our new South Carolina and Colorado portals (approximately $0.9 million), in addition to normal fixed asset additions in our other outsourced portal business, including Web servers, purchased software and office furniture and equipment. Investing activities in 2005 also reflect a $3.0 million reduction in our cash collateral requirements under the financing arrangement that covered all of the Company’s then-outstanding letters of credit.
Financing Activities
Financing activities in 2007 reflects the payment of the $46.7 million special cash dividend, in addition to $0.9 million in proceeds from the exercise of employee stock options for cash and $0.2 million in proceeds from our employee stock purchase program. Although we cannot predict the annual amount of proceeds we expect to receive from employee stock options exercised for cash in the future, we expect that our employees will continue to exercise vested stock options that have intrinsic value. At December 31, 2007, approximately 1.0 million employee stock options were exercisable at a weighted average exercise price of $4.38 per share. The closing price of our common stock on December 31, 2007 was $8.44 per share.
43
Financing activities in 2006 primarily reflect $1.2 million in proceeds from the exercise of employee stock options for cash and $0.2 million in proceeds from our employee stock purchase program.
Financing activities in 2005 reflects $4.6 million in proceeds from the exercise of employee stock options for cash and $0.1 million in proceeds from our employee stock purchase program.
Liquidity
We recognize revenue primarily from providing outsourced government portal services net of the transaction fees due to the government when the services are provided. The fees that we must remit to the government are accrued as accounts payable and accounts receivable at the time services are provided. As a result, trade accounts payable and accounts receivable reflect the gross amounts outstanding at the balance sheet dates. Gross billings for the three-months ended December 31, 2007 and 2006 were approximately $303.8 million and $196.9 million, respectively. The Company calculates days sales outstanding by dividing trade accounts receivable at the balance sheet date by gross billings for the period and multiplying the resulting quotient by the number of days in that period. Days sales outstanding for the three-month periods ended December 31, 2007 and 2006 was 9 and 13, respectively.
We believe that working capital is an important measure of our short-term liquidity. Working capital, defined as current assets minus current liabilities, decreased to $49.8 million at December 31, 2007, from $73.0 million at December 31, 2006. Our current ratio, defined as current assets divided by current liabilities, at December 31, 2007 was 2.1 compared to 2.8 at December 31, 2006. The decreases in our working capital and current ratios were attributable to the $46.7 million special dividend paid out of the Company’s available cash and marketable securities in February 2007, as further discussed below and in Note 9 in the Notes to Consolidated Financial Statements included in this Form 10-K. As further discussed in the paragraph below, if we still hold auction-rate debt securities at the end of the first quarter of 2008, we may need to reclassify such securities to long-term investments. Any such reclassification would cause our working capital and current ratio to decrease. Furthermore, we expect our working capital and current ratio to decrease during the first quarter of 2008 due to the $15.7 million special dividend paid on February 28, 2008, as further discussed below and in Note 14 in the Notes to the Consolidated Financial Statements included in this Form 10-K.
At December 31, 2007, our total cash, cash equivalents and marketable securities balance was $55.8 million compared to $81.8 million at December 31, 2006. Of this amount at December 31, 2007, approximately $17.6 million was invested in auction-rate debt securities. These securities are currently AAA-rated by one or more credit rating agencies and are secured by pools of student loans guaranteed by the U.S. Department of Education. The auction process is designed to provide a means by which these securities can be sold, and historically has provided a highly liquid market for these securities. During January 2008, we began to liquidate our marketable securities portfolio in anticipation of paying the $15.7 million special cash dividend on February 28, 2008. We had successful auctions on our auction-rate debt securities through mid-February 2008, at which time we had liquidated approximately $11.6 million of our portfolio. We encountered our first failed auction in mid-February 2008, as the amount of securities submitted for sale in those auctions exceeded the amount of bids, and we have not subsequently had a successful auction related to the remaining $7.0 million of these securities we currently hold. To date we have collected all interest payable on all of our auction-rate debt securities when due. The principal associated with failed auctions will not be accessible until a successful auction occurs, a buyer is found outside of the auction process, the issuers redeem the securities, the issuers establish a different form of financing to replace these securities, or final payments come due according to contractual maturities ranging from 22 to 50 years. We understand that issuers and financial markets are working on alternatives that may improve liquidity, although it is not yet clear when or if such efforts will be successful. We expect that we will receive the principal associated with these auction-rate securities through one of the means described above. If we still hold our auction-rate debt securities at the end of the first quarter of 2008, we may need to reclassify such securities as long-term investments, which would reduce our working capital.
On February 28, 2008, we paid a special cash dividend totalling approximately $15.7 million out of available cash and marketable securities. Due to the illiquidity of all of the remaining auction-rate debt securities we currently hold, as described above, we may be required to borrow against our $10 million line of credit in the future for general working capital purposes. We do not believe that this dividend will have a significant effect on our future liquidity. While the recent auction failures will limit our ability to liquidate these investments for some
44
period of time, we believe that our currently available liquid resources, coupled with the unused portion of our line of credit of approximately $8.7 million and cash generated from operations, will be sufficient to meet our operating requirements, capital expenditure requirements and current growth initiatives for at least the next twelve months without the need of additional capital. However, we may need to raise additional capital within the next twelve months to further:
- fund operations if unforeseen costs arise;
- support our expansion into other states and government agencies beyond what is contemplated ifunforeseen opportunities arise;
- expand our product and service offerings beyond what is contemplated if unforeseen opportunitiesarise;
- respond to unforeseen competitive pressures; and
- acquire technologies beyond what is contemplated.
Any projections of future earnings and cash flows are subject to substantial uncertainty. If our cash, marketable securities and cash generated from operations are insufficient to satisfy our liquidity requirements, we may seek to sell additional equity securities or issue debt securities. The sale of additional equity securities could result in dilution to the Company’s shareholders. There can be no assurance that financing will be available in amounts or on terms acceptable to the Company, if at all. Further, we may draw on the remaining unused portion of our $10 million line of credit.
We issue letters of credit as collateral for performance on certain of our outsourced government portal contracts, as collateral for certain performance bonds and as collateral for certain office leases. These irrevocable letters of credit are generally in force for one year, for which we currently pay bank fees of 1% of face value per annum. We had unused outstanding letters of credit totaling approximately $1.3 million at December 31, 2007. We are not currently required to cash collateralize these letters of credit. However, even though we currently expect to be profitable in fiscal 2008 and beyond, we may not be able to sustain or increase profitability on a quarterly or annual basis. We will need to generate sufficient revenues while containing costs and operating expenses if we are to achieve sustained profitability. If we are not able to sustain profitability, our cash collateral requirements may increase. Had we been required to post 100% cash collateral at December 31, 2007 for the face value of all performance bonds (which are partially supported by letters of credit) and our line of credit in conjunction with a corporate credit card agreement, unrestricted cash would have decreased by approximately $4.3 million and would have been classified as restricted cash.
At December 31, 2007, we were bound by performance bond commitments totaling approximately $3.3 million on certain government portal outsourcing contracts. These performance bonds are collateralized by a $1 million letter of credit. We have never had any defaults resulting in draws on performance bonds or letters of credit.
Off-Balance Sheet Arrangements and Contractual Obligations
We do not have off-balance sheet arrangements or significant exposures to liabilities that are not recorded or disclosed in our financial statements. The following table sets forth our future contractual obligations and commercial commitments as of December 31, 2007 (in thousands):
| Contractual Obligations | | Total | | Less than 1 year | | 1-3 years | | 3-5 years | | More than 5 years |
| Operating lease obligations | | $ | 8,453 | | $ | 2,021 | | | $ | 3,381 | | $ | 1,818 | | $ | 1,233 | |
| Income tax uncertainties | | | 713 | | | — | | | | 713 | | | — | | | — | |
| Long-term debt obligations | | | — | | | — | | | | — | | | — | | | — | |
| Capital lease obligations | | | — | | | — | | | | — | | | — | | | — | |
| Purchase obligations | | | — | | | — | | | | — | | | — | | | — | |
| Other long-term liabilities | | | — | | | — | | | | — | | | — | | | — | |
| Total contractual cash obligations | | $ | 9,166 | | $ | 2,021 | | | $ | 4,094 | | $ | 1,818 | | $ | 1,233 | |
45
While we have significant operating lease commitments for office space, those commitments are generally tied to the period of performance under related contracts. We have income tax uncertainties of approximately $0.7 million at December 31, 2007. These obligations are classified as non-current on our consolidated balance sheet, as resolution is expected to take more than a year. We estimate that these matters could be resolved in one to three years as reflected in the table above. However, the ultimate timing of resolution is uncertain. See Notes 2 and 10 in the Notes to the Consolidated Financial Statements included in this Form 10-K for further discussion on income taxes.
Recent Accounting Pronouncements
Quantifying Financial Statement Errors
In September 2006, the staff of the SEC issued Staff Accounting Bulletin (“SAB”) No. 108, “Considering the Effects of Prior Year Misstatements when Quantifying Misstatements in Current Year Financial Statements.” SAB No. 108 was issued in order to eliminate the diversity in practice surrounding how public companies quantify financial statement misstatements. We applied the provisions of SAB No. 108 to our fiscal year ended December 31, 2006 using the cumulative effect transition method, as further discussed in Note 2 in the Notes to Consolidated Financial Statements in this Form 10-K.
Accounting for Uncertainty in Income Taxes
In June 2006, the Financial Accounting Standards Board (“FASB”) issued FASB Interpretation No. (“FIN”) 48, “Accounting for Uncertainty in Income Taxes – an interpretation of FASB Statement No. 109.” FIN 48 provides a comprehensive model for how a company should recognize, measure, present and disclose in its financial statements uncertain tax positions that the Company has taken or expects to take on its income tax returns. FIN 48 defines the threshold for recognizing a tax return position in the financial statements as “more likely than not” that the position is sustainable, based on its technical merits. FIN 48 also provides guidance on the measurement, classification and disclosure of tax return positions in a company’s financial statements. We adopted the provisions of FIN 48 on January 1, 2007, with the cumulative effect recorded as an adjustment to the opening balance of accumulated deficit. See Notes 2 and 10 in the Notes to Consolidated Financial Statements in this Form 10-K for additional discussion of our adoption of FIN 48.
Fair Value Measurements
In September 2006, the FASB issued SFAS No. 157, “Fair Value Measurements,” which defines fair value, establishes a framework for measuring fair value in generally accepted accounting principles, and expands disclosures about fair value measurements. SFAS No. 157 does not require any new fair value measurements, but provides guidance on how to measure fair value by providing a fair value hierarchy used to classify the source of the information. Except for the portion of SFAS No. 157 that addresses nonfinancial assets and nonfinancial liabilities that are recognized or disclosed at fair value in the financial statements on a nonrecurring basis, which has been deferred for one additional year, we will be required to adopt this standard in the first quarter of 2008. We are currently evaluating the requirements of SFAS No. 157 and have not yet determined the impact on our consolidated financial statements.
In February 2007, the FASB issued SFAS No. 159, “The Fair Value Option for Financial Assets and Financial Liabilities, including an amendment of FASB Statement No. 115.” SFAS No. 159 permits entities to choose to measure many financial instruments and certain other items at fair value that are not currently required to be measured at fair value. Unrealized gains and losses on items for which the fair value option has been elected are reported in earnings. SFAS No. 159 does not affect any existing accounting literature that requires certain assets and liabilities to be carried at fair value. We will be required to adopt this standard in the first quarter of 2008. We are currently evaluating the requirements of SFAS No. 159 and have not yet determined the impact on our consolidated financial statements.
46
ITEM 7A. QUANTITATIVE AND QUALITATIVE DISCLOSURES ABOUT MARKET RISK
INTEREST RATE RISK. As further discussed above in the Liquidity section of Item 7, our marketable securities consist entirely of short-term auction-rate debt securities at December 31, 2007. Our auction-rate debt securities are structured with short-term interest rates that are reset through an auction process at 28-day intervals, but with contractual debt maturities that can be well in excess of 22 years. These securities are currently AAA-rated by one or more credit rating agencies and are secured by pools of student loans guaranteed by the U.S. Department of Education. In mid-February 2008, liquidity issues in the global credit markets resulted in the failure of auctions representing all of the remaining auction-rate debt securities we currently hold (totaling approximately $7.0 million), as the amount of securities submitted for sale in those auctions exceeded the amount of bids. For each unsuccessful auction, the interest rate moves to a maximum rate defined for each security, generally reset at a level higher than defined short-term interest benchmarks. To date we have collected all interest payable on all of our auction-rate debt securities. The principal associated with failed auctions will not be accessible until a successful auction occurs, a buyer is found outside of the auction process, the issuers establish a different form of financing to replace these securities, or final payments come due according to contractual maturities ranging from 22 to 50 years. We understand that issuers and financial markets are working on alternatives that may improve liquidity, although it is not yet clear when or if such efforts will be successful.
Our cash equivalents and our portfolio of marketable securities are subject to market risk due to changes in interest rates. Floating rate securities may produce less income than expected if interest rates fall. Furthermore, the market value of auction-rate debt securities may be adversely impacted due to a maximum interest rate cap if the spread between short-term rates and long-term rates increases. Due in part to these factors, our future income may fall short of expectation due to changes in interest rates or we may suffer losses in principal if we are forced to sell securities that decline in market value due to either changes in interest rates or discounts offered by prospective buyers of our auction-rate debt securities. However, because we classify our debt securities as “available for sale”, no gains or losses are recognized in our consolidated statements of income due to changes in interest rates unless such securities are sold prior to maturity or declines in fair value are determined to be other-than-temporary.
All of our borrowings under our line of credit bear interest at a floating rate. Interest on amounts borrowed is payable at a base rate equal to the higher of the Federal Funds Rate plus 0.5% or the bank’s prime rate. We currently have no principal amounts of indebtedness outstanding under our line of credit.
We do not use derivative financial instruments. A 10% change in interest rates would not have a material effect on our financial condition, results of operations or cash flows.
47
ITEM 8. CONSOLIDATED FINANCIAL STATEMENTS AND SUPPLEMENTARY DATA
| NIC INC. |
| CONSOLIDATED BALANCE SHEETS |
| |
| December 31, |
| 2006 | | 2007 |
| ASSETS | | | | | | | |
| Current assets: | | | | | | | |
| Cash and cash equivalents | $ | 36,744,872 | | | $ | 38,235,605 | |
| Marketable securities | | 45,008,431 | | | | 17,600,000 | |
| Trade accounts receivable | | 28,729,038 | | | | 28,149,698 | |
| Unbilled revenues | | 1,068,940 | | | | 720,131 | |
| Deferred income taxes, net | | 5,289,680 | | | | 6,746,355 | |
| Prepaid expenses & other current assets | | 1,644,816 | | | | 2,142,673 | |
| Total current assets | | 118,485,777 | | | | 93,594,462 | |
| Property and equipment, net | | 3,790,490 | | | | 6,110,075 | |
| Deferred income taxes, net | | 17,434,583 | | | | 10,808,941 | |
| Other assets | | 423,597 | | | | 862,669 | |
| Total assets | $ | 140,134,447 | | | $ | 111,376,147 | |
| |
| LIABILITIES AND SHAREHOLDERS’ EQUITY | | | | | | | |
| Current liabilities: | | | | | | | |
| Accounts payable | $ | 34,201,937 | | | $ | 36,497,922 | |
| Accrued expenses | | 5,911,197 | | | | 6,847,523 | |
| Application development contracts | | 512,618 | | | | 352,969 | |
| Other current liabilities | | 254,510 | | | | 99,285 | |
| Total current liabilities | | 40,880,262 | | | | 43,797,699 | |
| Other long-term liabilities | | — | | | | 713,496 | |
| Total liabilities | | 40,880,262 | | | | 44,511,195 | |
| Commitments and contingencies (Notes 2, 3, 7, 8 and 14) | | — | | | | — | |
| Shareholders' equity: | | | | | | | |
| Common stock, no par, 200,000,000 shares authorized 61,573,900 and | | | | | | | |
| 62,031,312 shares issued and outstanding | | — | | | | — | |
| Additional paid-in capital | | 210,210,393 | | | | 165,934,316 | |
| Accumulated deficit | | (110,788,533 | ) | | | (98,901,689 | ) |
| | 99,421,860 | | | | 67,032,627 | |
| Less treasury stock | | (167,675 | ) | | | (167,675 | ) |
| Total shareholders' equity | | 99,254,185 | | | | 66,864,952 | |
| Total liabilities and shareholders' equity | $ | 140,134,447 | | | $ | 111,376,147 | |
The accompanying notes are an integral part of these consolidated financial statements.
48
| NIC INC. |
| CONSOLIDATED STATEMENTS OF INCOME |
| |
| | Year Ended December 31, |
| | 2005 | | 2006 | | 2007 |
| Revenues: | | | | | | | | | | | |
| Portal revenues | $ | 57,875,067 | | | $ | 70,008,598 | | | $ | 82,451,763 | |
| Software & services revenues | | 1,367,546 | | | | 1,367,248 | | | | 3,303,171 | |
| Total revenues | | 59,242,613 | | | | 71,375,846 | | | | 85,754,934 | |
| Operating expenses: | | | | | | | | | | | |
| Cost of portal revenues, exclusive of depreciation | | | | | | | | | | | |
| & amortization | | 29,448,091 | | | | 37,249,358 | | | | 43,648,482 | |
| Cost of software & services revenues, exclusive | | | | | | | | | | | |
| of depreciation & amortization | | 5,348,438 | | | | 596,279 | | | | 1,883,478 | |
| Selling & administrative | | 12,651,948 | | | | 15,341,777 | | | | 21,594,393 | |
| Depreciation & amortization | | 1,602,879 | | | | 2,040,398 | | | | 2,501,615 | |
| Total operating expenses | | 49,051,356 | | | | 55,227,812 | | | | 69,627,968 | |
| Operating income | | 10,191,257 | | | | 16,148,034 | | | | 16,126,966 | |
| Other income (expense): | | | | | | | | | | | |
| Interest income | | 704,614 | | | | 2,401,504 | | | | 1,741,107 | |
| Gain (loss) on affiliate investments | | — | | | | (96,954 | ) | | | 508,209 | |
| Other expense, net | | (2,971 | ) | | | (35,187 | ) | | | (16,010 | ) |
| Total other income | | 701,643 | | | | 2,269,363 | | | | 2,233,306 | |
| Income before income taxes | | 10,892,900 | | | | 18,417,397 | | | | 18,360,272 | |
| Income tax provision | | 4,529,824 | | | | 7,678,396 | | | | 6,405,052 | |
| Net income | $ | 6,363,076 | | | $ | 10,739,001 | | | $ | 11,955,220 | |
| Basic net income per share | $ | 0.11 | | | $ | 0.17 | | | $ | 0.19 | |
| Diluted net income per share | $ | 0.10 | | | $ | 0.17 | | | $ | 0.19 | |
| Weighted average shares outstanding | | | | | | | | | | | |
| Basic | | 60,078,841 | | | | 61,408,552 | | | | 61,836,530 | |
| Diluted | | 61,093,788 | | | | 61,763,093 | | | | 62,525,249 | |
The accompanying notes are an integral part of these consolidated financial statements.
49
| NIC INC. |
| CONSOLIDATED STATEMENTS OF CHANGES IN SHAREHOLDERS’ EQUITY |
| |
| Common Stock | | Additional | | Accumulated | | Treasury | | | | |
| Shares | | Amount | | Paid-in Capital | | Deficit | | Stock | | Total |
| Balance, January 1, 2005 | 59,301,375 | | | $— | | $ | 200,921,146 | | | $ | (128,456,174 | ) | | $ | (204,497 | ) | | $ | 72,260,475 | |
| Net income | — | | | — | | | — | | | | 6,363,076 | | | | — | | | | 6,363,076 | |
| Retirement of treasury stock | — | | | — | | | (20,449 | ) | | | — | | | | 20,449 | | | | — | |
| Stock options exercised | 1,742,099 | | | — | | | 4,640,928 | | | | — | | | | — | | | | 4,640,928 | |
| Issuance of common stock | | | | | | | | | | | | | | | | | | | | |
| under employee stock | | | | | | | | | | | | | | | | | | | | |
| purchase plan | 30,031 | | | — | | | 121,761 | | | | — | | | | — | | | | 121,761 | |
| Tax deductions relating to | | | | | | | | | | | | | | | | | | | | |
| stock options | — | | | — | | | 1,781,364 | | | | — | | | | — | | | | 1,781,364 | |
| Balance, December 31, 2005 | 61,073,505 | | | — | | | 207,444,750 | | | | (122,093,098 | ) | | | (184,048 | ) | | | 85,167,604 | |
| Cumulative effect of SAB No. 108 | | | | | | | | | | | | | | | | | | | | |
| (Note 2) | — | | | — | | | — | | | | 565,564 | | | | — | | | | 565,564 | |
| Net income | — | | | — | | | — | | | | 10,739,001 | | | | — | | | | 10,739,001 | |
| Sale of treasury stock | 11,154 | | | — | | | 50,004 | | | | — | | | | 16,373 | | | | 66,377 | |
| Stock options exercised | 448,898 | | | — | | | 1,226,638 | | | | — | | | | — | | | | 1,226,638 | |
| Stock-based compensation | — | | | — | | | 1,331,603 | | | | — | | | | — | | | | 1,331,603 | |
| Issuance of common stock | | | | | | | | | | | | | | | | | | | | |
| under employee stock | | | | | | | | | | | | | | | | | | | | |
| purchase plan | 40,343 | | | — | | | 157,398 | | | | — | | | | — | | | | 157,398 | |
| Balance, December 31, 2006 | 61,573,900 | | | — | | | 210,210,393 | | | | (110,788,533 | ) | | | (167,675 | ) | | | 99,254,185 | |
| Cumulative effect of FIN 48 | | | | | | | | | | | | | | | | | | | | |
| (Note 2) | — | | | — | | | — | | | | (68,376 | ) | | | — | | | | (68,376 | ) |
| Net income | — | | | — | | | — | | | | 11,955,220 | | | | — | | | | 11,955,220 | |
| Cash dividends on common | | | | | | | | | | | | | | | | | | | | |
| stock (Note 9) | — | | | — | | | (46,729,871 | ) | | | — | | | | — | | | | (46,729,871 | ) |
| Shares surrendered to pay exercise | | | | | | | | | | | | | | | | | | | | |
| price of stock options | (33,446 | ) | | — | | | (246,998 | ) | | | — | | | | — | | | | (246,998 | ) |
| Shares surrendered upon exercise | | | | | | | | | | | | | | | | | | | | |
| of stock options and vesting | | | | | | | | | | | | | | | | | | | | |
| of restricted stock to satisfy | | | | | | | | | | | | | | | | | | | | |
| tax withholdings | (50,204 | ) | | — | | | (343,185 | ) | | | — | | | | — | | | | (343,185 | ) |
| Stock options exercises and | | | | | | | | | | | | | | | | | | | | |
| restricted stock vestings | 488,440 | | | — | | | 1,127,341 | | | | — | | | | — | | | | 1,127,341 | |
| Stock-based compensation | — | | | — | | | 1,676,890 | | | | — | | | | — | | | | 1,676,890 | |
| Issuance of common stock | | | | | | | | | | | | | | | | | | | | |
| under employee stock | | | | | | | | | | | | | | | | | | | | |
| purchase plan | 52,622 | | | — | | | 239,746 | | | | — | | | | — | | | | 239,746 | |
| Balance, December 31, 2007 | 62,031,312 | | | $— | | $ | 165,934,316 | | | $ | (98,901,689 | ) | | $ | (167,675 | ) | | $ | 66,864,952 | |
The accompanying notes are an integral part of these consolidated financial statements.
50
| NIC INC. |
| CONSOLIDATED STATEMENTS OF CASH FLOWS |
| |
| Year Ended December 31, |
| 2005 | | 2006 | | 2007 |
| Cash flows from operating activities: | | | | | | | | | | | |
| Net income | $ | 6,363,076 | | | $ | 10,739,001 | | | $ | 11,955,220 | |
| Adjustments to reconcile net income to net cash | | | | | | | | | | | |
| provided by operating activities: | | | | | | | | | | | |
| Depreciation & amortization | | 1,602,879 | | | | 2,040,398 | | | | 2,501,615 | |
| Stock-based compensation expense | | — | | | | 1,331,603 | | | | 1,676,890 | |
| Accretion of discount on marketable securities | | — | | | | (8,431 | ) | | | — | |
| Application development contracts | | 1,260,631 | | | | (748,013 | ) | | | (159,649 | ) |
| Deferred income taxes | | 4,150,803 | | | | 7,179,104 | | | | 6,220,176 | |
| Gain (loss) on affiliate investments | | — | | | | 96,954 | | | | (508,209 | ) |
| Impairment loss on property and equipment | | — | | | | — | | | | 164,075 | |
| Loss on disposal of property and equipment | | — | | | | 35,187 | | | | 16,258 | |
| Changes in operating assets and liabilities | | | | | | | | | | | |
| (Increase) decrease in trade accounts receivable | | (4,659,030 | ) | | | (6,486,896 | ) | | | 579,340 | |
| Decrease in unbilled revenues | | 2,211,223 | | | | 2,523,859 | | | | 348,809 | |
| (Increase) decrease in prepaid expenses & | | | | | | | | | | | |
| other current assets | | (320,014 | ) | | | 46,588 | | | | (497,857 | ) |
| (Increase) decrease in other assets | | 50,473 | | | | 19,117 | | | | (10,089 | ) |
| Increase in accounts payable | | 10,064,135 | | | | 9,744,035 | | | | 2,295,985 | |
| Increase (decrease) in accrued expenses | | 376,804 | | | | (731,384 | ) | | | 593,141 | |
| Increase (decrease) in other current liabilities | | 165,426 | | | | (62,220 | ) | | | (155,706 | ) |
| Increase in other long-term liabilities | | — | | | | — | | | | (405,608 | ) |
| Net cash provided by operating activities | | 21,266,406 | | | | 25,718,902 | | | | 24,614,391 | |
| Cash flows from investing activities: | | | | | | | | | | | |
| Purchases of property and equipment | | (2,327,360 | ) | | | (2,584,948 | ) | | | (4,876,242 | ) |
| Proceeds from sale of property and equipment | | — | | | | — | | | | 13,672 | |
| Capitalized internal use software development costs | | (68,994 | ) | | | (239,492 | ) | | | (567,946 | ) |
| Purchases of marketable securities | | (35,500,000 | ) | | | (24,500,000 | ) | | | (18,000,000 | ) |
| Sales and maturities of marketable securities | | 15,000,000 | | | | — | | | | 45,408,431 | |
| Cash and cash equivalents - restricted | | 3,000,000 | | | | — | | | | — | |
| Proceeds from sale of affiliate | | — | | | | — | | | | 508,209 | |
| Net cash provided by (used in) investing activities | | (19,896,354 | ) | | | (27,324,440 | ) | | | 22,486,124 | |
| Cash flows from financing activities: | | | | | | | | | | | |
| Cash dividends on common stock | | — | | | | — | | | | (46,729,871 | ) |
| Proceeds from sale of treasury stock | | — | | | | 64,965 | | | | — | |
| Proceeds from employee common stock purchases | | 121,761 | | | | 157,398 | | | | 239,746 | |
| Proceeds from exercise of employee stock options | | 4,640,928 | | | | 1,226,638 | | | | 880,343 | |
| Net cash provided by (used in) financing activities | | 4,762,689 | | | | 1,449,001 | | | | (45,609,782 | ) |
| Net increase (decrease) in cash and cash equivalents | | 6,132,741 | | | | (156,537 | ) | | | 1,490,733 | |
| Cash and cash equivalents, beginning of year | | 30,768,668 | | | | 36,901,409 | | | | 36,744,872 | |
| Cash and cash equivalents, end of year | $ | 36,901,409 | | | $ | 36,744,872 | | | $ | 38,235,605 | |
| Other cash flow information: | | | | | | | | | | | |
| Income taxes paid | $ | 450,745 | | | $ | 373,793 | | | $ | 776,717 | |
The accompanying notes are an integral part of these consolidated financial statements.
51
NIC INC.
NOTES TO CONSOLIDATED FINANCIAL STATEMENTS
1. THE COMPANY
NIC Inc. (the “Company” or “NIC”) is a provider of eGovernment services that helps governments use the Internet to increase internal efficiencies and provide a higher level of service to businesses and citizens. The Company accomplishes this currently through two divisions: its primary portal outsourcing businesses and its software & services businesses.
In its primary portal outsourcing business, the Company designs, builds and operates Internet-based portals on behalf of state and local governments desiring to provide access to government information and to complete government-based transactions online. These portals consist of Web sites and applications the Company has built that allow businesses and citizens to access government information online and complete transactions, including applying for a permit, retrieving driver’s license records or filing a government-mandated form or report. Operating under multiple-year contracts (see Note 3), NIC markets the services and solicits users to complete government-based transactions and to enter into subscriber contracts permitting users to access the portal and the government information contained therein in exchange for transactional and/or subscription user fees. The Company manages operations for each contractual relationship through separate local subsidiaries that operate as decentralized businesses with a high degree of autonomy. NIC’s self-funding business model allows the Company to reduce its government partners’ financial and technology risks and generate revenues by sharing in the fees the Company collects from eGovernment transactions. The Company’s government partners benefit through gaining a centralized, customer-focused presence on the Internet, while businesses and citizens receive a faster, more convenient and more cost-effective means to interact with governments. The Company is typically responsible for funding up front investment and ongoing operational costs of the government portals.
The Company’s software & services businesses primarily include its Uniform Commercial Code (“UCC”) and corporate filings software development business and its ethics & elections business. The Company’s UCC and corporate filings software development business, NIC Conquest, is a provider of software applications and services for electronic filings and document management solutions for governments. This business focuses on Secretaries of State, whose offices are state governments’ principal agencies for UCC and corporate filings. Currently, NIC Conquest is primarily engaged in servicing its contract with the California Secretary of State and is not actively marketing its applications and services in respect of new engagements. The Company’s ethics & elections business, NIC Technologies, designs and develops online campaign expenditure and ethics compliance systems for federal and state government agencies. Currently, NIC Technologies is primarily engaged in servicing its contracts with the Federal Election Commission and the State of Michigan.
2. SUMMARY OF SIGNIFICANT ACCOUNTING POLICIES
Basis of presentation
The Company classifies its revenues and cost of revenues into two categories: (1) portal and (2) software & services. The portal category includes revenues from the Company’s subsidiaries operating government portals under long-term contracts on an outsourced basis. The software & services category includes revenues primarily from the Company’s software & services businesses. The primary categories of operating expenses include: cost of portal revenues, cost of software & services revenues, selling & administrative, and depreciation & amortization. Cost of portal revenues consist of all direct costs associated with operating government portals on an outsourced basis including employee compensation (including stock-based compensation), telecommunications, credit card merchant fees, and all other costs associated with the provision of dedicated client service such as dedicated facilities. Cost of software & services revenues consist of all direct project costs to provide software development and services such as employee compensation (including stock-based compensation), subcontractor labor costs, and all other direct project costs including hardware, software, materials, travel and other out-of-pocket expenses. Selling & administrative costs consist primarily of corporate-level expenses relating to human resource management, administration, information technology, legal and finance, and all costs of non-customer service personnel from the Company’s software & services businesses, including information systems and office rent. Selling & administrative costs also consist of stock-based compensation and corporate-level expenses for market development and public relations.
52
The Company’s consolidated balance sheet as of December 31, 2006, reflects a revision of approximately $4.6 million of net deferred tax assets from noncurrent to current for the amount of tax net operating loss carryforwards the Company expected to utilize in 2007. A proportionate amount of the Company’s deferred tax asset valuation allowance was also allocated between current and noncurrent deferred tax assets.
Basis of consolidation
The accompanying consolidated financial statements consolidate the Company together with all of its direct and indirect wholly owned subsidiaries. All intercompany balances and transactions have been eliminated.
Cash and cash equivalents
Cash and cash equivalents primarily include cash on hand in the form of bank deposits and money market funds. For purposes of the consolidated balance sheets and consolidated statements of cash flows, the Company considers all non-restricted highly liquid instruments purchased with an original maturity of one month or less to be cash equivalents.
Marketable securities
The Company accounts for short-term marketable securities in accordance with Statement of Financial Accounting Standards (“SFAS”) No. 115, “Accounting for Certain Investments in Debt and Equity Securities.” The Company’s marketable securities at December 31, 2006 and 2007 were classified as available-for-sale at the time of purchase, and the Company re-evaluates such designation as of each consolidated balance sheet date.
Auction-rate debt securities are structured with short-term interest rates that are reset through the auction process at 28–day intervals, but with contractual debt maturities that can be well in excess of 22 years. Historically, the Company has had the option to liquidate its auction-rate debt securities whenever the interest rates on these securities were reset. Accordingly, such securities were classified as short-term at December 31, 2006 and 2007.
Marketable securities are reported at fair value with any unrealized holding gains or losses included in accumulated other comprehensive income or loss, a component of shareholders’ equity, net of tax, until realized. The fair values of the Company’s marketable securities are based on market prices or broker quotes at the reporting date. See Note 4. Realized gains or losses on the sale of marketable securities are determined using the specific-identification method and have not historically been material. The Company assesses other-than-temporary impairment of marketable debt securities in accordance with FASB Staff Position No. FAS 115-1, “The Meaning of Other-Than-Temporary Impairment and its Application to Certain Investments.” The Company evaluates its investments periodically for possible other-than-temporary impairment by reviewing factors such as the length of time and extent to which fair value has been below cost basis, the financial condition of the issuer and the Company’s ability and intent to hold the investment for a period of time which may be sufficient for anticipated recovery of market value. The Company records an impairment charge to the extent that the carrying value of available-for-sale securities exceeds the estimated fair market value of the securities and the decline in value is determined to be other-than-temporary. For the years ended December 31, 2005, 2006 and 2007, the Company did not recognize any impairment charge on its marketable securities.
Unbilled revenues
Unbilled revenues consist of revenues earned in excess of billings under long-term application development contracts accounted for under the percentage of completion method relating to the Company’s UCC and corporate filings software development business and revenues earned in excess of billings relating to the Company’s ethics & elections and portal businesses. Unbilled revenues arise when revenues have been recorded but the amounts cannot currently be billed under the terms of the contracts. Such amounts are recoverable from customers upon various measures of performance including, among others, achievement of certain milestones and completion of services during a specified period.
53
At each balance sheet date, the Company makes a determination as to the portion of the unbilled receivable relating to the Company’s long-term application development contracts that will be collected within one year and records that amount as a current asset in the consolidated balance sheets. The remainder of the receivable, if any, is classified as a long-term asset. All unbilled revenues at the balance sheet dates have been classified as current assets.
Unbilled revenues relating to the Company’s contract with the California Secretary of State at December 31, 2006 and 2007 were $0.5 million and $0.2 million. Unbilled revenues relating to the Company’s ethics & election business at December 31, 2006 and 2007 were $0 and $0.3 million. Unbilled revenues relating to the Company’s portal businesses at December 31, 2006 and 2007 were $0.6 million and $0.2 million.
Property and equipment
Property and equipment are carried at cost less accumulated depreciation. Depreciation is computed using the straight-line method over estimated useful lives of 8 years for furniture and fixtures, 3-10 years for equipment, 3-5 years for purchased software and the lesser of the term of the lease or 5 years for leasehold improvements. When assets are retired or otherwise disposed of, the cost and related accumulated depreciation are removed from the accounts and any resulting gain or loss is included in results of operations for the period. The cost of maintenance and repairs is charged to expense as incurred. Significant renewals and betterments are capitalized.
The Company periodically evaluates the carrying value of property and equipment to be held and used when events and circumstances warrant such a review. The carrying value of property and equipment is considered impaired when the anticipated undiscounted cash flows from the asset is separately identifiable and is less than its carrying value. In that event, a loss is recognized based on the amount by which the carrying value exceeds the fair value of the asset. Fair value is determined primarily using the anticipated cash flows discounted at a rate commensurate with the risk involved. Losses on assets to be disposed of are determined in a similar manner, except that fair values are reduced for the cost to dispose. In 2007, the Company recognized an impairment loss of $164,075 related primarily to the disposal of furniture, fixtures and leasehold improvements at its former corporate headquarters. The Company did not record any impairment losses on property and equipment during 2006 or 2005.
Software development costs and intangible assets
The Company expenses as incurred all employee costs to start up, operate and maintain government portals on an outsourced basis as costs of performance under the contracts because, after the completion of a defined contract term, the government entities with which the Company contracts typically receive a perpetual, royalty-free license to the applications the Company developed. Such costs are included in cost of portal revenues in the consolidated statements of income.
The Company accounts for the costs of developing internal use computer software in accordance with the American Institute of Certified Public Accountants Statement of Position (“SOP”) 98-1, “Accounting for the Costs of Computer Software Developed or Obtained for Internal Use” and Emerging Issues Task Force (“EITF”) Issue 00-2, “Accounting for Website Development Costs.” Costs capitalized pursuant to EITF Issue 00-2 would be included as part of the total of internal use software development costs capitalized pursuant to SOP 98-1.
The net carrying value of intangible assets at December 31, 2006 and 2007 was approximately $301,000 and $730,000 and was included in other long-term assets in the consolidated balance sheets. At December 31, 2007 and 2006, intangible assets consisted of capitalized internal use software development costs, and are being amortized over a three-year period. Accumulated amortization at December 31, 2006 and 2007 totaled approximately $8,000 and $147,000.
At each balance sheet date, or whenever events or changes in circumstances warrant, the Company assesses the carrying value of intangible assets for possible impairment based primarily on the ability to recover the balances from expected future cash flows on an undiscounted basis. If the sum of the expected future cash flows on an undiscounted basis were to be less than the carrying amount of the intangible asset, an impairment loss would be recognized for the amount by which the carrying value of the intangible asset exceeds its estimated fair
54
value. There is considerable management judgment necessary to determine future cash flows, and accordingly, actual results could vary significantly from such estimates. The Company has not recorded any impairment losses on intangible assets during the periods presented.
Revenue recognition
Portal revenues
The Company recognizes revenue from providing outsourced government portal services (primarily transaction-based information access fees and filing fees) net of the transaction fees due to the government when the services are provided. The fees that the Company must remit to state agencies for data access and other statutory fees are accrued as accounts payable at the time services are provided. The Company must remit a certain amount or percentage of these fees to government agencies regardless of whether the Company ultimately collects the fees. As a result, trade accounts receivable and accounts payable reflect the gross amounts outstanding at the balance sheet dates.
Revenue from service contracts to provide portal consulting, application development and management services to governments is recognized as the services are provided at rates provided for in the contract.
Software & services revenues
The Company’s UCC and corporate filings software development business recognizes revenues from fixed-fee, long-term application development contracts on the percentage of completion method, utilizing costs incurred to date as compared to the estimated total costs for each contract, following the guidance outlined in Alternative B as set forth in paragraph .81 of SOP 81-1, “Accounting for Performance of Construction-Type and Certain Production-Type Contracts.” The Company primarily includes internal labor and subcontractor labor costs in actual and estimated total costs for purposes of determining the percentage of completion for each contract. The Company also includes costs for hardware and software provided directly to the customer as part of the system and other direct project costs such as travel in actual and estimated total costs, but does not include such costs for determining the percentage of completion for each contract. The Company recognizes revenue and expenses for such costs with no associated profit margin. Contract revenues and estimated costs to complete are adjusted to reflect change orders when approved by the customer and the Company regarding both scope and price. Revenues and profits from these contracts are based on the Company’s estimates to complete and are reviewed periodically, with adjustments recorded in the period in which the revisions are made. Any anticipated contract losses are charged to operations as soon as determinable.
In 2001, NICUSA and the Company’s NIC Conquest subsidiary were awarded a five-year, $25 million contract by the California Secretary of State (the “California SOS”) to develop and implement a comprehensive information management and filing system. Revenues are recognized on the contract using the percentage of completion method utilizing costs incurred to date as compared to the estimated costs for the contract, as further described above. The Company believes costs incurred are a more representative measure of project progress than either the completion of billing or significant project milestones, as most of the significant milestone payments under this contract are concentrated toward the latter half of the project and do not appropriately reflect project progress and project costs incurred, especially in between milestone payment dates.
The contract contains early termination clauses that give the California SOS the right to terminate early including, among others, termination for non-appropriation of funds and termination for convenience. Such early termination clauses are generally standard in most government contracts and are not unique to the Company’s contract with the California SOS. However, in the event the contract is terminated for non-appropriation of funds, the Company would be required to take back any affected goods furnished under the contract and to relieve the California SOS of any further obligations therefrom. The Company does not recognize revenues in excess of what has been appropriated for the project. If the contract is terminated for the convenience of the State, the parties are to negotiate a settlement, which the Company believes would include billed and unbilled receivables for goods, manufacturing materials and/or services performed or delivered under the contract.
55
Prior to the first quarter of 2005, key elements of the Company’s obligations under the California SOS contract were subcontracted to various third parties under fixed price contracts. At the end of the first quarter of 2005, as a result of system delivery issues and the concern over the ability of one of the two remaining subcontractors to meet the criteria set forth by the California SOS, the Company determined it would assume the lead project manager role on the contract, which was previously performed by this subcontractor. As a result of this change, the Company further evaluated the status of the project and concluded that a further modification to the management and oversight structure of the project was necessary to improve performance under the contract and that additional internal project management and technical personnel would be required on the engagement. The Company also reevaluated the expected completion date of the project, which was previously estimated to be in the first quarter of 2006, and determined to revise the estimated completion date to the end of 2006. As a result of the Company’s decision to commit these additional resources and the extension of the expected project completion date, the Company recorded a $5.0 million adjustment under percentage of completion accounting in the first quarter of 2005, as the Company expected to incur a loss of approximately $4.2 million on this project, instead of a previously projected profit of approximately $1.0 million.
The adjustment in the Company’s consolidated statement of income for the year ended December 31, 2005 resulted in a reduction of software & services revenues of approximately $3.5 million and an increase in cost of software & services revenues of approximately $1.5 million. The adjustment in the Company’s consolidated balance sheet was a reduction in unbilled revenues of approximately $3.5 million and an increase in application development contracts (a current liability) of approximately $1.5 million.
In March 2006, the Company and the California SOS entered into an amendment (the “Amendment”) to the California Business Programs Automation Agreement (the “Agreement”). Among other changes to the Agreement, the Amendment reduced the aggregate contract value to approximately $19 million and released the Company from the obligation to deliver the business filings, or BE, portion of the project, except for maintenance of hardware and delivery of BE images as expressly set forth in the Amendment. The Amendment also set forth the final criteria in order for the California SOS to accept the UCC portion of the project and move it into the maintenance and operations phase.
As a result of the Amendment, the Company recorded an adjustment under percentage of completion accounting in the first quarter of 2006. The adjustment in the Company’s consolidated statement of income for the year ended December 31, 2006 resulted in a reduction of software & services revenues of approximately $2.1 million and a reduction of cost of software & services revenues of approximately $2.1 million. The adjustment in the Company’s consolidated balance sheet was a reduction in unbilled revenues of approximately $2.1 million, a reduction of accrued liabilities of approximately $1.6 million, and a reduction of application development contracts of approximately $0.5 million. This adjustment did not affect operating income, net income or earnings per share.
In June 2006, the California SOS officially accepted the UCC portion of the project, which also commenced the 42-month maintenance and operations phase. Upon acceptance, the Company was relieved of its obligation to provide a $5 million performance bond to the California SOS. The bond was collateralized by a $5 million letter of credit. Also upon acceptance, approximately $1.5 million in milestone payments became due to the Company, thus reducing unbilled revenues.
The Company regularly reviews its cost estimates to complete and does not currently believe its estimated contract loss will exceed the $4.2 million estimate established in the first quarter of 2005. However, it is at least reasonably possible that the estimate will change in the near term. Further, it is possible that the Company will similarly incur cost overruns in the future as it has in the past as a result of unforeseen difficulties such as rising development, subcontractor and personnel costs or other reasons. If this occurs, the Company’s results of operations, financial condition and cash flows could be adversely affected.
At December 31, 2007, the Company’s UCC and corporate filings software development business was primarily engaged in servicing the maintenance and operations obligation under its contract with the California Secretary of State. This software & services business is not marketing its applications and services for new engagements.
56
The Company’s ethics & elections business recognizes revenues from professional services as the services are provided. This business has entered into contracts with the state of Michigan and the Federal Election Commission that contain general fiscal funding clauses. The Company recognizes revenue under these contracts if the probability of cancellation is determined to be a remote contingency.
Stock-based compensation
Effective January 1, 2006, the Company adopted the provisions of SFAS No. 123R (revised 2004), “Share-Based Payment,” which establishes the accounting for equity instruments exchanged for employee services. Prior to January 1, 2006, the Company accounted for its stock-based compensation plans in accordance with Accounting Principles Board Opinion No. 25, “Accounting for Stock Issued to Employees,” and related interpretations. The Company also followed the disclosure requirements of SFAS No. 123, “Accounting for Stock-Based Compensation,” as amended by SFAS No. 148, “Accounting for Stock-Based Compensation – Transition and Disclosure.” See Note 11.
Income taxes
The Company, along with its wholly owned subsidiaries, files a consolidated federal income tax return. Deferred income taxes are recognized for the tax consequences in future years of differences between the tax basis of assets and liabilities and their financial reporting amounts at each year-end based on enacted laws and statutory tax rates applicable to the periods in which the differences are expected to affect taxable income. Valuation allowances are established, when necessary, to reduce deferred tax assets to the amounts expected to be realized.
The Company accounts for uncertain tax positions in accordance with FASB Interpretation No. (“FIN”) 48, “Accounting for Uncertainty in Income Taxes – an interpretation of FASB Statement No. 109.” Accordingly, the Company does not recognize a tax benefit for uncertain tax positions unless management’s assessment concludes that it is “more likely than not” that the position is sustainable, based on its technical merits. If the recognition threshold is met, the Company recognizes a tax benefit based upon the largest amount of the tax benefit that is greater than 50 percent likely to be realized. The Company recognizes interest and penalties, if any, related to unrecognized tax benefits in income tax expense in the consolidated statements of income. The Company adopted the provisions of FIN 48 on January 1, 2007, with the cumulative effect recorded as an adjustment to the opening balance of accumulated deficit. See Note 10 for additional discussion of the Company’s adoption of FIN 48.
Fair Value of Financial Instruments
The Company estimates its fair value disclosures for financial instruments using the following methods and assumptions. The carrying values of cash and marketable securities, accounts receivable, accounts payable and accrued expenses approximate their fair value due to their relatively short maturity. Fixed-rate long-term obligations are estimated using discounted cash flow analyses, based on the Company’s current incremental borrowing rates for similar types of borrowing arrangements. At December 31, 2006 and 2007, the Company did not have any such long-term obligations outstanding.
Comprehensive income
The Company has no material components of other comprehensive income or loss and, accordingly, the Company’s comprehensive income is approximately the same as its net income for all periods presented.
57
Earnings per share
Basic earnings per share are calculated on the basis of the weighted average number of common shares outstanding during the period. Diluted earnings per share are calculated on the basis of the weighted average number of common shares outstanding during the period and common stock equivalents that would arise from the exercise of stock options or the issuance of restricted stock awards to employees and nonemployee directors using the treasury stock method. The following table sets forth the computation of basic and diluted earnings per share:
| Year ended December 31, |
| 2005 | | 2006 | | 2007 |
| Numerator: | | | | | | | | |
| Net income | $ | 6,363,076 | | $ | 10,739,001 | | $ | 11,955,220 |
| Denominator: | | | | | | | | |
| Weighted average shares – basic | | 60,078,841 | | | 61,408,552 | | | 61,836,530 |
| Stock options and restricted stock awards | | 1,014,947 | | | 354,541 | | | 688,719 |
| Weighted average shares – diluted | | 61,093,788 | | | 61,763,093 | | | 62,525,249 |
| Basic net income per share | $ | 0.11 | | $ | 0.17 | | $ | 0.19 |
| Diluted net income per share | $ | 0.10 | | $ | 0.17 | | $ | 0.19 |
Outstanding stock options totaling 0.6 million, 0.3 million and 0.2 million common shares during the years ended December 31, 2005, 2006 and 2007, respectively, were not included in the computation of diluted weighted average shares outstanding because their exercise prices were in excess of the average stock price of the Company during the periods.
Concentration of credit risk
Financial instruments that potentially subject the Company to significant concentrations of credit risk consist primarily of cash and cash equivalents, marketable securities and accounts receivable. The Company limits its exposure to credit loss by depositing its cash with high credit quality financial institutions. The Company performs ongoing credit evaluations of its customers and generally requires no collateral to secure accounts receivable.
The Company is subject to concentrations of credit risk and interest rate risk related to its marketable securities, which consisted entirely of auction-rate student loan debt securities at December 31, 2007. These securities are structured with short-term interest rates that reset through an auction process at 28-day intervals, but with contractual debt maturities that can be well in excess of 22 years. Liquidity for these securities is typically provided by an auction process that resets the applicable interest rate every 28 days. However, if auctions for these securities fail, the Company will not be able to access the principal until a successful auction occurs, a buyer is found outside of the auction process, the issuers redeem the securities, the issuers establish a different form of financing to replace these securities or final payments come due according to contractual maturities ranging from 22 to 50 years. The Company attempts to manage its credit risk by limiting the amount of investments placed with any one issuer, investing primarily in AAA-rated securities that are secured by pools of student loans guaranteed by the U.S. Department of Education. This guarantee is based upon a sliding scale of 97% to 98% of the unpaid principal balance of eligible student loans, plus accrued interest, when the guarantor’s claims experience is less than 5% of the original principal amount of the loans, and decreases to 75% if the guarantor’s claims experience is greater than 9% of the original principal amount of the loans. See Note 4.
Segment reporting
The Company reports segment information in accordance with SFAS No. 131, “Disclosures about Segments of an Enterprise and Related Information.” SFAS No. 131 uses the “management” approach, which designates the internal organization that is used by management for making operating decisions and assessing performance as the source of the Company’s segments. SFAS No. 131 also requires disclosures about products and services and major customers. See Note 12.
58
Quantifying Financial Statement Errors
In September 2006, the staff of the Securities and Exchange Commission (“SEC”) issued Staff Accounting Bulletin (“SAB”) No. 108, “Considering the Effects of Prior Year Misstatements when Quantifying Misstatements in Current Year Financial Statements.” SAB No. 108 was issued in order to eliminate the diversity in practice surrounding how public companies quantify financial statement misstatements.
Traditionally, there have been two widely-recognized methods for quantifying the effects of financial statement misstatements: the “roll-over” method and the “iron curtain” method. The roll-over method focuses primarily on the impact of a misstatement on the income statement—including the reversing effect of prior year misstatements—but its use can lead to the accumulation of misstatements in the balance sheet. The iron-curtain method, on the other hand, focuses primarily on the effect of correcting the period-end balance sheet with less emphasis on the reversing effects of prior year errors on the income statement. Prior to application of the guidance in SAB No. 108, the Company used the roll-over method for quantifying financial statement misstatements.
In SAB No. 108, the SEC staff established an approach that requires quantification of financial statement misstatements based on the effects of the misstatements on each of the Company’s financial statements and the related financial statement disclosures. This model is commonly referred to as a “dual approach” because it requires quantification of errors under both the iron curtain and the roll-over methods.
SAB No. 108 permits public companies to initially apply its provisions either by (i) restating prior financial statements as if the dual approach had always been applied or (ii) recording the cumulative effect of initially applying the dual approach as adjustments to the carrying values of assets and liabilities as of January 1, 2006 with an offsetting adjustment recorded to the opening balance of retained earnings (accumulated deficit). The Company elected to record the effects of applying SAB No. 108 using the cumulative effect transition method.
The following table summarizes the effects (up to January 1, 2006) of applying the guidance in SAB No. 108:
| | Period in which the | | |
| | Misstatement Originated (1) | | |
| | Cumulative Effect Prior to | | Adjustment Recorded |
| | January 1, 2004 | | as of January 1, 2006 |
| Deferred income taxes (2) | | $565,564 | | $565,564 |
| Net loss (3) | | $565,564 | | |
| Accumulated deficit (4) | | | | $565,564 |
____________________
| (1) | The Company previously quantified this error under the roll-over method and concluded that it was immaterial. |
| |
| (2) | The Company did not record tax net operating loss carryforwards acquired upon the acquisition of SDR Technologies in 2000, resulting in an overstatement of goodwill and an understatement of deferred tax assets by $565,564. The tax benefits of the net operating loss carryforwards were subsequently realized. As a result of the misstatement, the Company overstated its net loss in 2001 by overstating its impairment loss when it determined that the goodwill and other acquired intangible assets related to the SDR Technologies acquisition were impaired. |
| |
| (3) | Represents the overstatement of the Company’s net loss resulting from this misstatement. |
| |
| (4) | Represents the decrease in accumulated deficit recorded as of January 1, 2006 to record the initial application of SAB No. 108. |
Use of estimates
The preparation of financial statements in conformity with generally accepted accounting principles requires management to make estimates and assumptions that affect the reported amounts of assets and liabilities and disclosure of contingent assets and liabilities at the date of the financial statements and the reported amounts of revenues and expenses during the reporting period. Actual results could differ from those estimates.
59
Recent Accounting Pronouncements
In June 2006, the Financial Accounting Standards Board (“FASB”) issued FASB Interpretation No. (“FIN”) 48, “Accounting for Uncertainty in Income Taxes – an interpretation of FASB Statement No. 109.” FIN 48 provides a comprehensive model for how a company should recognize, measure, present and disclose in its financial statements uncertain tax positions that the Company has taken or expects to take on its income tax returns. FIN 48 defines the threshold for recognizing a tax return position in the financial statements as “more likely than not” that the position is sustainable, based on its technical merits. FIN 48 also provides guidance on the measurement, classification and disclosure of tax return positions in a company’s financial statements. The Company adopted the provisions of FIN 48 on January 1, 2007, with the cumulative effect recorded as an adjustment to the opening balance of accumulated deficit. See Note 10 for additional discussion of the Company’s adoption of FIN 48.
In September 2006, the FASB issued SFAS No. 157, “Fair Value Measurements,” which defines fair value, establishes a framework for measuring fair value in generally accepted accounting principles, and expands disclosures about fair value measurements. SFAS No. 157 does not require any new fair value measurements, but provides guidance on how to measure fair value by providing a fair value hierarchy used to classify the source of the information. Except for the portion of SFAS No. 157 that addresses nonfinancial assets and liabilities that are recognized or disclosed at fair value in the financial statements on a nonrecurring basis, which has been deferred for one additional year, the Company will be required to adopt this standard in the first quarter of 2008. The Company is currently evaluating the requirements of SFAS No. 157 and has not yet determined the impact on its consolidated financial statements.
In February 2007, the FASB issued SFAS No. 159, “The Fair Value Option for Financial Assets and Financial Liabilities, including an amendment of FASB Statement No. 115.” SFAS No. 159 permits entities to choose to measure many financial instruments and certain other items at fair value that are not currently required to be measured at fair value. Unrealized gains and losses on items for which the fair value option has been elected are reported in earnings. SFAS No. 159 does not affect any existing accounting literature that requires certain assets and liabilities to be carried at fair value. The Company will be required to adopt this standard in the first quarter of 2008. The Company is currently evaluating the requirements of SFAS No. 159 and has not yet determined the impact on its consolidated financial statements.
3. OUTSOURCED GOVERNMENT PORTAL CONTRACTS
The Company’s outsourced government portal contracts generally have an initial term of three to five years with provisions for renewals for various periods at the option of the government. The Company’s primary business obligation under these contracts is to design, build and operate Internet-based portals on behalf of governments desiring to provide access to government information and to complete government-based transactions online. NIC typically markets the services and solicits users to complete government-based transactions and to enter into subscriber contracts permitting the user to access the portal and the government information contained therein in exchange for transactional and/or subscription user fees. The Company enters into separate agreements with various agencies and divisions of the government to provide specific services and to conduct specific transactions. These agreements preliminarily establish the pricing of the electronic transactions and data access services the Company provides and the division of revenues between the Company and the government agency. The government must approve prices and revenue sharing agreements.
The Company is typically responsible for funding up front investment and ongoing operational costs of the government portals, and generally owns all the applications developed under these contracts. After completion of a defined contract term, the government agency typically receives a perpetual, royalty-free license to the applications for use only. If the Company’s contract were not renewed after a defined term, the government agency would be entitled to take over the portal in place with no future obligation of the Company.
At December 31, 2007, the Company was bound by performance bond commitments totaling approximately $3.3 million on certain portal outsourcing contracts. Under a typical portal contract, the Company is required to fully indemnify its government clients against claims that the Company’s services infringe upon the intellectual property rights of others and against claims arising from the Company’s performance or the performance of the Company’s subcontractors under the contract.
60
The following is a summary of the Company’s twenty-one outsourced state government portal contracts at December 31, 2007:
| | | | Year Services | | Contract Expiration Date |
| NIC Subsidiary | | Portal Web Site (State) | | Commenced | | (Renewal Options Through) |
| NICUSA | | www.WV.gov (West Virginia) | | 2007 | | 6/30/2008(6/30/2010) |
| NICUSA | | www.AZ.gov (Arizona) | | 2007 | | 6/26/2010(6/26/2013) |
| Vermont Information Consortium | | www.Vermont.gov (Vermont) | | 2006 | | 10/15/2009(10/14/2012) |
| Colorado Interactive | | www.Colorado.gov (Colorado) | | 2005 | | 5/19/2010(5/19/2014) |
| South Carolina Interactive | | www.SC.gov (South Carolina) | | 2005 | | 7/15/2008(7/15/2009) |
| Kentucky Interactive | | www.Kentucky.gov (Kentucky) | | 2003 | | 1/31/2009(1/31/2013) |
| Alabama Interactive | | www.Alabama.gov (Alabama) | | 2002 | | 2/28/09(2/28/2012) |
| Rhode Island Interactive | | www.RI.gov (Rhode Island) | | 2001 | | 8/7/2010(8/7/2012) |
| Oklahoma Interactive | | www.OK.gov (Oklahoma) | | 2001 | | 6/30/2008(6/30/2009) |
| Montana Interactive | | www.MT.gov (Montana) | | 2001 | | 12/31/2010 |
| NICUSA | | www.Tennessee.gov (Tennessee) | | 2000 | | 8/27/2010 |
| Hawaii Information Consortium | | www.Hawaii.gov (Hawaii) | | 2000 | | 1/3/2013 (unlimited |
| | | | | | 3-year renewal options) |
| Idaho Information Consortium | | www.Idaho.gov (Idaho) | | 2000 | | 3/31/2008 |
| Utah Interactive | | www.Utah.gov (Utah) | | 1999 | | 5/6/2009 |
| Maine Information Network | | www.Maine.gov (Maine) | | 1999 | | 3/14/2008 (Contract |
| | | | | | has been temporarily |
| | | | | | extended to allow the |
| | | | | | state time to finalize |
| | | | | | contract terms and |
| | | | | | conditions) |
| Arkansas Information Consortium | | www.Arkansas.gov (Arkansas) | | 1997 | | 6/30/2008 |
| Iowa Interactive | | www.Iowa.gov (Iowa) | | 1997 | | 3/31/2011 (3/31/2012) |
| Virginia Interactive | | www.Virginia.gov (Virginia) | | 1997 | | 8/31/2012 |
| Indiana Interactive | | www.IN.gov (Indiana) | | 1995 | | 6/30/2010 (6/30/2014) |
| Nebraska Interactive | | www.Nebraska.gov (Nebraska) | | 1995 | | 1/31/2009 (1/31/2010) |
| Kansas Information Consortium | | www.Kansas.gov (Kansas) | | 1992 | | 12/31/2009 |
During the first quarter of 2007, the Company received a one-year contract extension from the State of Idaho, which extended the contract expiration date to March 2008, and signed a new one-year contract with the state of Alabama, which includes options for the government to extend the contract for four additional one-year renewal terms.
During the second quarter of 2007, the Company received a one-year contract extension from the state of Oklahoma. In addition, the Company received a two-year contract extension from the state of Kansas, which extended the expiration date to December 2009.
During the third quarter of 2007, the Company finalized a three-year contract with the state of Arizona to operate the state’s official Web site. The contract includes renewal options under which the government can extend the contract for an additional three years. The Company also received a new three-year contract with the state of Rhode Island, which includes an option for the government to extend the contract for one additional two-year term. In addition, the Company received a one-year contract extension from the state of South Carolina.
During the fourth quarter of 2007, the Company finalized a one-year contract with the state of West Virginia to operate the state’s official Web site. The contract includes renewal options under which the government can extend the contract for an additional two years.
During the first quarter of 2008, the Company received a five-year contract extension from the state of Hawaii, which extended the expiration date to January 3, 2013. The contract includes unlimited renewal options under which the state of Hawaii can extend the contract for additional 3-year periods.
61
4. MARKETABLE SECURITIES
The fair value of marketable securities was as follows at December 31:
| 2006 | | 2007 |
| Auction-rate debt securities | $ | 35,900,000 | | $ | 17,600,000 |
| Flex term notes | | 6,000,000 | | | — |
| Corporate debt securities | | 3,108,431 | | | — |
| $ | 45,008,431 | | $ | 17,600,000 |
The Company’s marketable securities at December 31, 2006 and 2007 were classified as available-for-sale at the time of purchase. Gross realized gains and losses and unrealized holding gains and losses for each of the periods presented were not significant.
Auction-rate debt securities are structured with short-term interest rates that are reset through the auction process at 28–day intervals, but with contractual debt maturities that can be well in excess of 22 years. Historically, the Company has had the option to liquidate its auction-rate debt securities whenever the interest rates on these securities were reset. Accordingly, such securities were classified as short-term at December 31, 2006 and 2007.
During January 2008, the Company began to liquidate its auction-rate debt securities at each interest rate reset date in anticipation of paying the special cash dividend of $0.25 per share on February 28, 2008, totaling approximately $15.7 million (see Note 14). The Company had successful auctions on these securities with scheduled 28-day reset dates through mid-February 2008, at which time the Company had liquidated approximately $11.6 million of its portfolio. Furthermore, there were successful actions during January 2008 for each auction-rate debt security the Company currently holds. Accordingly, the Company determined that there was no impairment of these securities at December 31, 2007. The Company encountered its first failed auction in mid-February 2008, as the amount of securities submitted for sale in those auctions exceeded the amount of bids. Subsequently, the Company has not had a successful auction related to the remaining securities it currently holds, which consist of the following taxable issues:
| | | | | | Carrying |
| | Current | | Next Interest Rate | | Amount |
| Security (Maturity) | | Interest Rate | | Reset Date | | (Par Value) |
| SLM Student Loan Trust 2003-5 A-9 (6/17/2030) | | 4.62% | | 3/24/2008 | | $ | 1,150,000 |
| Missouri Higher Ed Loan Auth 2001 B (6/1/2031) | | 2.77% | | 3/25/2008 | | | 1,000,000 |
| Missouri Higher Ed Loan Auth 2002D (7/1/2032) | | 2.84% | | 3/24/2008 | | | 2,800,000 |
| NELNET Education Loan Funding 2003-1 A-6 (7/25/2043) | | 4.61% | | 3/18/2008 | | | 1,000,000 |
| Panhandle Plains Higher Ed Auth 2007 A-4 (8/1/2057) | | 4.36% | | 4/9/2008 | | | 1,000,000 |
| | | | | | $ | 6,950,000 |
The Company’s auction-rate debt securities are currently AAA-rated by one or more rating agencies and are secured by pools of student loans guaranteed by the U.S. Department of Education. This guarantee is based upon a sliding scale of 97% to 98% of the unpaid principal balance of eligible student loans, plus accrued interest, when the guarantor’s claims experience is less than 5% of the original principal amount of the loans, and decreases to 75% if the guarantor’s claims experience is greater than 9% of the original principal amount of the loans. To date the Company has collected all interest payable on all of its auction-rate debt securities when due. For each unsuccessful auction, the interest rate moves to a maximum rate defined for each security, generally reset at a level higher than defined short-term interest benchmarks. The principal associated with failed auctions will not be accessible until a successful auction occurs, a buyer is found outside of the auction process, the issuers redeem the securities, the issuers establish a different form of financing to replace these securities or final payments come due according to contractual maturities ranging from 22 to 50 years. The Company understands that issuers and financial markets are working on alternatives that may improve liquidity, although it is not yet clear when, or if, such efforts will be successful. The Company currently expects that it will receive the principal associated with these auction-rate debt securities through one of the means described above.
62
At December 31, 2007, all of the Company’s auction-rate debt securities were classified as current investments in its consolidated balance sheet. If such securities are still held by the Company at the end of the first quarter of 2008, the Company may need to reclassify such securities as long-term investments, which would reduce working capital. Long-term investments are reported at fair value, with any unrealized holding gains or losses included in accumulated other comprehensive income or loss, a component of shareholders’ equity, net of tax.
Although the Company currently believes that any decline in the fair value of these securities would be temporary, there is a risk that the decline in value may ultimately be deemed to be other-than-temporary. Should the Company determine that the decline in value of these securities is other-than-temporary, it would result in a loss being recognized in its consolidated statements of income, which could be material.
5. PROPERTY AND EQUIPMENT
Property and equipment consisted of the following at December 31:
| 2006 | | 2007 |
| Furniture and fixtures | $ | 1,553,015 | | | $ | 2,090,399 | |
| Equipment | | 8,475,076 | | | | 8,983,240 | |
| Purchased software | | 2,731,689 | | | | 3,261,314 | |
| Leasehold improvements | | 398,862 | | | | 685,487 | |
| | 13,158,642 | | | | 15,020,440 | |
| Less accumulated depreciation | | (9,368,152 | ) | | | (8,910,365 | ) |
| $ | 3,790,490 | | | $ | 6,110,075 | |
Depreciation expense for the years ended December 31, 2005, 2006 and 2007, was $1,602,879, $2,032,456 and $2,362,652, respectively.
6. INVESTMENTS IN AFFILIATES AND JOINT VENTURES
In March 2000, NIC made a $5 million cash investment in E-Filing.com, Inc. (“E-Filing”), a provider of online filing applications for legal services, giving NIC ownership of 21% of E-Filing, a non-public company. The investment was accounted for under the equity method. In May 2004, E-Filing repurchased the Company’s ownership interest in E-Filing for approximately $0.5 million, which approximated the carrying value of the Company’s investment at the date of the repurchase. The Company received approximately $0.3 million in cash and a $0.2 million subordinated promissory note with principal plus 5% interest payable annually in three equal installments on each of the first, second and third anniversary dates of the issuance of the note. The Company had no investment balance remaining in E-Filing after the repurchase. During 2006, the Company wrote off the remaining balance of the promissory note ($96,954) due to E-Filing’s deteriorated financial condition, and recorded the loss in gain (loss) on affiliate investments in the consolidated statements of income.
In October 2000, NIC made an initial $0.5 million cash investment in e-Government Solutions Limited (“eGS”), a private joint venture giving NIC initial ownership of 40% of the ordinary shares of eGS. The purpose of the eGS joint venture, based in London, England, was to deliver eGovernment services throughout Western Europe, with initial efforts to focus on the United Kingdom. In September 2001, the joint venture agreement was modified and reduced NIC’s obligation to make future cash contributions to the joint venture and gave NIC ownership of 47% of the ordinary shares of eGS. In December 2002, the joint venture agreement was again modified and, among other changes, eliminated NIC’s obligation to make future cash contributions to the joint venture, reduced NIC’s ownership to 20% and eliminated NIC’s participation on the board of directors. The investment had been accounted for under the equity method. As a result of the modification to the joint venture agreement in December 2002, the Company began to account for its investment in eGS under the cost method and had no investment balance remaining in eGS after the modification. NIC’s cash contributions since the inception of the joint venture have totaled approximately $1.0 million. At December 31, 2006, the Company’s ownership interest in eGS was approximately 14%. In September 2007, a member of the joint venture purchased the Company’s ownership interest in eGS for approximately $0.5 million in cash. The Company had no investment balance in eGS at the date of the purchase and recorded a $0.5 million gain on the purchase in gain (loss) on affiliate investments in the consolidated statements of income.
63
7. DEBT OBLIGATIONS AND COLLATERAL REQUIREMENTS
In May 2007, the Company entered into a $10 million unsecured credit agreement with a bank. This revolving credit facility is available to finance working capital, issue letters of credit and finance general corporate purposes. The Company can obtain letters of credit in an aggregate amount of $5 million, which reduces the maximum amount available for borrowing under the facility. Interest on amounts borrowed is payable at a base rate or a Eurodollar rate, in each case as defined in the agreement. The base rate is equal to the higher of the Federal Funds Rate plus 0.5% or the bank’s prime rate. Fees on outstanding letters of credit are either 1% (if the Company’s consolidated leverage ratio is less than or equal to 1.25:1) or 1.25% (if the Company’s consolidated leverage ratio is greater than 1.25:1) of face value per annum. The Company also pays a quarterly commitment fee on the unused portion of the facility, which is either 0.1% per annum (if the Company’s consolidated leverage ratio is less than or equal to 1.25:1) or 0.15% per annum (if the Company’s consolidated leverage ratio is greater than 1.25:1).
The terms of the agreement provide for customary representations and warranties, affirmative and negative covenants, events of default, and limitations on dividends, capital expenditures and acquisitions. The Company also is required to maintain compliance with the following financial covenants (in each case, as defined in the agreement):
- Consolidated minimum annual EBITDA of at least $12 million, computed quarterly on a rolling12-month basis
- Consolidated tangible net worth of at least $36 million
- Consolidated maximum leverage ratio of 1.5:1
The Company was in compliance with each of the covenants listed above at December 31, 2007. The credit agreement expires in May 2009. However, letters of credit may have an expiration date of up to one year beyond the expiration date of the credit agreement.
The Company issues letters of credit as collateral for performance on certain of its outsourced government portal contracts, as collateral for certain performance bonds and as collateral for certain office leases. In total, the Company and its subsidiaries had unused outstanding letters of credit of approximately $1.3 million at both December 31, 2006 and 2007. In addition, the Company had $3.7 million in available capacity to issue additional letters of credit and $8.7 million of unused borrowing capacity at December 31, 2007 under the facility.
The Company has a $1.0 million line of credit with a separate bank in conjunction with a corporate credit card agreement.
8. COMMITMENTS AND CONTINGENCIES
Operating leases
The Company and its subsidiaries lease office space and certain equipment under noncancellable operating leases. Future minimum lease payments under all noncancellable operating leases at December 31, 2007 are as follows:
| Fiscal Year | | |
| 2008 | | $2,021,310 |
| 2009 | | 1,842,919 |
| 2010 | | 1,537,594 |
| 2011 | | 976,730 |
| 2012 | | 841,576 |
| Thereafter | | 1,233,392 |
Rent expense for operating leases for the years ended December 31, 2005, 2006 and 2007 was approximately $1.5 million, $1.8 million and $2.3 million, respectively.
64
Informal SEC Inquiry
The Company is currently the subject of an informal SEC inquiry of expense reporting by certain officers of the Company and certain potentially related matters. In connection with that inquiry, a review was undertaken by the Audit Committee of the Company’s Board of Directors, with the assistance of outside, independent counsel, which focused on such expense reporting. The review revealed that expense reimbursement deficiencies occurred during the period from January 2004 through October 2006 related to Jeffery S. Fraser, who was then the Company’s Chief Executive Officer, and that the amount of such deficiencies was not material to the Company’s financial condition or results of operations.
Litigation
The Company is involved from time to time in legal proceedings and litigation arising in the ordinary course of business. However, the Company is not currently involved with any legal proceedings.
9. SHAREHOLDERS’ EQUITY
Common stock
On June 30, 1998, the Company and the National Information Consortium Voting Trust (the “Voting Trust”) consisting of all the Company’s then current shareholders entered into a stock purchase agreement for the Company’s shareholders to sell a 25% interest in the Company to an investment management firm. The Company did not receive any of the proceeds from the sale. Under the Voting Trust agreement, two principal shareholders have the right to vote all of the Voting Trust’s common shares and to sell all or any part of such shares. In 2003, the Voting Trust distributed 5% of its shares of NIC common stock to its members. In 2005, the Voting Trust distributed 10% of its shares of NIC common stock to its members. In 2006, the Voting Trust sold approximately 2.1 million shares of NIC common stock in the open market. At December 31, 2006 and 2007, the Voting Trust held approximately 21.4 million shares of NIC common stock.
Common stock transactions and additional paid-in capital
As a condition of separation and severance from the Company in the second quarter of 2002, a former executive had the right to request the Company to repurchase all of the shares of the Company’s common stock, totaling 149,488 shares, beneficially owned by the former executive that were held of record in the Voting Trust for $1.44 per share. In October 2002, the former executive exercised this right and caused the Company to repurchase his Voting Trust units for $215,260. The shares of NIC common stock represented by the Voting Trust Units have been recorded as treasury stock in the consolidated balance sheets. In 2003, the Voting Trust distributed 5% of its shares of NIC common stock to its members. This affected 7,474 shares of NIC common stock held by the Company as treasury stock. The Company retired these shares in 2003, which had an assigned value of $10,763. In 2005, the Voting Trust distributed 10% of its shares of NIC common stock to its members. This affected 14,201 shares of NIC common stock held by the Company as treasury stock. The Company retired these shares in February 2005, which had an assigned value of $20,449, and had 127,813 shares remaining in treasury stock at December 31, 2005. In 2006, the Voting Trust sold approximately 2.1 million shares of NIC common stock in the open market. This affected 11,154 shares of NIC common stock held by the Company as treasury stock. The Company received $64,965 in proceeds from the sale. These shares had an assigned value of $16,373, which was credited to treasury stock, with the remaining $50,004 credited directly to additional paid-in capital. At December 31, 2006 and 2007, the Company had 116,441 shares remaining in treasury stock.
During 2005, certain employees of the Company exercised non-qualified stock options. As a result, the Company received federal income tax deductions, or windfall tax benefits. The tax benefit for the deductions of $1,781,364 for 2005 increased deferred tax assets and was credited directly to additional paid-in capital. See Note 11 for additional discussion of 2006 and 2007 income tax deductions relating to the exercise of non-qualified stock options.
65
On January 29, 2007, the Company’s Board of Directors declared a special cash dividend of $0.75 per share, payable to shareholders of record as of February 12, 2007. The dividend, totaling approximately $46.7 million, was paid on February 20, 2007 on 61,686,425 outstanding shares of common stock. A dividend equivalent of $0.75 per share was also paid simultaneously on 618,038 unvested shares of restricted stock granted under the Company’s 2006 Stock Option and Incentive Plan. The dividend was paid out of the Company’s available cash and marketable securities.
10. INCOME TAXES
The provision for income taxes consists of the following:
| | Year Ended December 31, |
| | 2005 | | 2006 | | 2007 |
| Current income taxes: | | | | | | | | |
| Federal | $ | 127,122 | | $ | 185,944 | | $ | 259,997 |
| State | | 251,899 | | | 313,348 | | | 330,487 |
| Total | | 379,021 | | | 499,292 | | | 590,484 |
| Deferred income taxes: | | | | | | | | |
| Federal | | 3,481,568 | | | 6,083,043 | | | 4,967,530 |
| State | | 669,235 | | | 1,096,061 | | | 847,038 |
| Total | | 4,150,803 | | | 7,179,104 | | | 5,814,568 |
| Total income tax provision | $ | 4,529,824 | | $ | 7,678,396 | | $ | 6,405,052 |
Significant components of the Company’s deferred tax assets and liabilities were as follows at December 31:
| 2006 | | 2007 |
| Deferred tax assets: | | | | | | | |
| Net operating loss carryforwards | $ | 15,950,998 | | | $ | 11,209,229 | |
| Amortization and impairment of purchase accounting goodwill | | | | | | | |
| and software intangibles | | 6,870,635 | | | | 6,029,979 | |
| Capital losses on sale of affiliates | | 3,830,703 | | | | 2,430,378 | |
| Investment in affiliate | | 548,780 | | | | — | |
| Stock-based compensation pursuant to SFAS No. 123R | | 519,732 | | | | 573,486 | |
| Accrued vacation | | 374,888 | | | | 441,639 | |
| Accrued contract expenses under percentage of completion accounting | | 251,343 | | | | 171,614 | |
| Application development contract loss | | 199,408 | | | | 143,821 | |
| Other | | — | | | | 72,509 | |
| | 28,546,487 | | | | 21,072,655 | |
| Less: Valuation allowance | | (5,040,010 | ) | | | (3,107,948 | ) |
| Total | | 23,506,477 | | | | 17,964,707 | |
| Deferred tax liabilities: | | | | | | | |
| Depreciation & capitalized software development costs | | (243,632 | ) | | | (409,411 | ) |
| Other | | (538,582 | ) | | | — | |
| Total | | (782,214 | ) | | | (409,411 | ) |
| Net deferred tax asset | $ | 22,724,263 | | | $ | 17,555,296 | |
For federal income tax purposes, the Company had available at December 31, 2007, total net operating loss (“NOL”) carryforwards of approximately $25.1 million that will expire in 2021 ($14.8 million) and 2022 ($10.3 million). The Company believes it is more likely than not it will generate sufficient taxable income from future operations to fully utilize its federal NOL carryforwards prior to expiration. The amount of the deferred tax asset considered realizable relating to these NOL’s could be reduced in the near term if estimates of future taxable income during the carryforward periods are reduced.
66
A portion of the Company’s total deferred tax asset valuation allowance relates to estimated state NOL carryforwards. The Company has identified certain estimated state NOL carryforwards that it had previously recognized that it might be unable to use. Based on a review of applicable state tax statutes, the Company concluded that there is substantial doubt it would be able to realize the full amount of certain estimated NOL carryforwards in states where the Company cannot file a consolidated income tax return. As a result, the Company recorded a deferred tax asset valuation allowance in 2003 totaling $483,386. In 2006 and 2007, the Company increased its valuation allowance by $177,141 and $17,043, respectively, for additional state NOL carryforwards that the Company may be unable to use.
A portion of the Company’s total deferred tax valuation allowance at December 31, 2006, totaling $3,830,703 related to capital losses realized on certain of the Company’s previous equity method investments, and $548,780 related to an expected capital loss (which was subsequently realized in 2007) on the Company’s investment in its European joint venture, eGS. At present, there is substantial doubt about the Company’s ability to generate capital gains in the future. In 2007, the Company decreased its deferred tax asset and the corresponding valuation allowance relating to certain of these investments by $1,949,105 for the expiration of certain capital loss carryforwards.
As further discussed in Note 2, the Company did not initially record tax net operating loss carryforwards acquired upon the acquisition of SDR Technologies in 2000, resulting in an understatement of deferred tax assets by $565,564. The Company recorded a $565,564 increase to deferred tax assets with an offsetting decrease to accumulated deficit as of January 1, 2006 to reflect the initial application of SAB No. 108. The table above reflects this adjustment in the balance of net operating loss carryforwards at December 31, 2006.
See Notes 9 and 11 for discussion of the accounting for income tax deductions relating to the exercise of non-qualified stock options.
The following table reconciles the effective income tax rate indicated by the consolidated statements of income and the statutory federal income tax rate:
| Year Ended December 31, |
| 2005 | | 2006 | | 2007 |
| Effective federal and state income tax rate | 41.6 | % | | 41.7 | % | | 34.9 | % |
| State income taxes | (5.5 | ) | | (4.8 | ) | | (4.5 | ) |
| Valuation allowance | — | | | (1.0 | ) | | — | |
| Uncertain tax positions | — | | | — | | | 2.2 | |
| Book gain on sale of investment | — | | | — | | | 1.0 | |
| Other | (1.1 | ) | | (0.9 | ) | | 1.4 | |
| Statutory federal income tax rate | 35.0 | % | | 35.0 | % | | 35.0 | % |
The Company adopted the provisions of FIN 48 on January 1, 2007 (see Note 2). As a result, the Company recognized a $68,376 increase in the liability for unrecognized tax benefits, which resulted in an increase to the January 1, 2007 accumulated deficit balance of $68,376. As of January 1, 2007, after the implementation of FIN 48, the Company’s unrecognized tax benefits were $1,119,104, all of which would affect the Company’s effective tax rate if recognized. This amount decreased by $405,608 during 2007 as the Company considered additional information relating to its uncertain tax positions. It is expected that the amount of unrecognized tax benefits will change in the next 12 months. However, the Company does not expect the change to have a significant impact on its results of operations or financial condition. A reconciliation of the beginning and ending amount of the consolidated liability for unrecognized income tax benefits during the year ended December 31, 2007 is as follows:
| 2007 |
| Balance at January 1, 2007 | $ | 1,119,104 | |
| Additions for tax positions of prior years | | — | |
| Reductions for tax positions of prior years | | (405,608 | ) |
| Settlements | | — | |
| Expiration of the statute of limitations | | — | |
| Balance at December 31, 2007 | $ | 713,496 | |
67
The Company, along with its wholly owned subsidiaries, files a consolidated U.S. federal income tax return and separate income tax returns in many states throughout the U.S. The Company’s tax returns are not currently under examination by any of these tax authorities. The Company remains subject to U.S. federal examination for the tax years ended on or after December 31, 2004. State income tax returns are generally subject to examination for a period of three to five years after filing of the respective return.
The Company recognizes accrued interest and penalties associated with uncertain tax positions as part of income tax expense in the consolidated statements of income. Upon the adoption date of FIN 48 and at December 31, 2007, accrued interest and penalty amounts were not material.
11. STOCK-BASED COMPENSATION AND EMPLOYEE BENEFIT PLANS
Prior to January 1, 2006, the Company accounted for its stock-based compensation plans using the intrinsic value method in accordance with Accounting Principles Board Opinion (“APB”) No. 25, “Accounting for Stock Issued to Employees,” and related interpretations. Accordingly, no compensation expense was recognized if the exercise price of a stock option equaled or exceeded the market price of the underlying stock on the date of grant. However, stock-based compensation has been included in prior period pro-forma disclosures in the financial statement footnotes as required under SFAS No. 123, “Accounting for Stock-Based Compensation,” which was amended by SFAS No. 148, “Accounting for Stock-Based Compensation – Transition and Disclosure.”
Effective January 1, 2006, the Company adopted the provisions of SFAS No. 123R (revised 2004), “Share-Based Payment,” which establishes the accounting for equity instruments exchanged for employee services. Under the provisions of SFAS No. 123R, stock-based compensation cost is measured at the grant date, based on the calculated fair value of the award, and is recognized as expense over the employee’s requisite service period (generally the vesting period of the grant). The Company elected to adopt the modified prospective application transition method as provided by SFAS No. 123R and, accordingly, financial statement amounts for the year ended December 31, 2005 have not been restated to reflect the fair value method of expensing stock-based compensation. For vested stock-based awards that were outstanding on January 1, 2006, the Company was not required to record any additional compensation expense. For unvested stock-based awards that were outstanding on January 1, 2006, awards that were previously included as part of the pro-forma net income and earnings per share calculations of SFAS No. 123 have been charged to expense over the remaining vesting period, without any changes in measurement. For all new stock-based awards that have been granted or modified after January 1, 2006, the Company has used SFAS No. 123R’s measurement model, expense recognition and settlement provisions. Upon adoption of SFAS No. 123R, the Company discontinued its historical accounting practice of recognizing forfeitures when they occurred and now estimates compensation cost related to awards not expected to vest.
The following table illustrates the effect on net income and net income per share for the year ended December 31, 2005 had the Company applied the fair value recognition provisions of SFAS No. 123 to stock-based compensation:
| Net income, as reported | $ | 6,363,076 | |
| Add: Stock-based employee compensation included in | | | |
| reported net income, net of related tax effects | | — | |
| Deduct: Total stock-based employee compensation expense determined | | | |
| under fair value based method for all awards, net of related tax effects | | (1,087,336 | ) |
| Pro forma net income | $ | 5,275,740 | |
| Basic net income per share, as reported | $ | 0.11 | |
| Diluted net income per share, as reported | $ | 0.10 | |
| Basic net income per share, pro forma | $ | 0.09 | |
| Diluted net income per share, pro forma | $ | 0.09 | |
68
The fair value of each option grant was determined using the Black-Scholes option-pricing model. The following assumptions were applied in determining pro forma compensation cost for the year ended December 31, 2005:
| Risk-free interest rate | | 3.90 | % |
| Expected dividend yield | | 0.00 | |
| Expected option life | | 3.2 years | |
| Expected stock price volatility | | 53 | % |
| Fair value of options granted | | $2.10 | |
The Black-Scholes option-pricing model was not developed for use in valuing employee stock options, but was developed for use in estimating the fair value of traded options that have no vesting restrictions and are fully transferable. In addition, it requires the use of subjective assumptions including expectations of future dividends and stock price volatility. Such assumptions are only used for making the required fair value estimate and should not be considered as indicators of future dividend policy or stock price appreciation, or should not be used to predict the value ultimately realized by employees who receive equity awards. Because changes in the subjective assumptions can materially affect the fair value estimate and because employee stock options have characteristics significantly different from those of traded options, the use of the Black-Scholes option-pricing model may not provide a reliable estimate of the fair value of employee stock options.
For purposes of this pro forma disclosure, the estimated fair value of options was amortized to expense over the option vesting periods. Such pro forma impact on net income and basic and diluted net income per share is not necessarily indicative of future effects on net income or earnings per share.
In 2005, all options were granted with exercise prices equal to the market price of the Company’s common stock on the grant dates.
On October 26, 2005, the Board of Directors of the Company approved the accelerated vesting of all unvested options to purchase common stock of the Company that had an exercise price that was greater than the market price on that date. The closing price of the Company’s common stock on October 26, 2005, was $5.63 per share. As a condition of the acceleration and to prevent unintended personal benefit, the Company’s directors, executive officers and employees must refrain from selling common stock acquired upon the exercise of accelerated options until the original vesting date or, if earlier, termination of employment with or service to the Company. All other terms and conditions applicable to such options, including exercise prices, remain unchanged. This action resulted in the accelerated vesting of options to purchase 163,873 shares of common stock of the Company, or approximately six percent of the total of all then outstanding Company options. Of this amount, 142,500 options had been granted to either directors or executive officers of the Company.
The Company accelerated the vesting of these options because it believed it was in the best interest of its shareholders to reduce future compensation expense that the Company would otherwise have been required to report in its statement of income upon adoption of SFAS No. 123R in the first quarter of 2006. Further, because the options had exercise prices in excess of the then-current market price, they were viewed to have limited economic value and were not achieving their objective of incentive compensation and retention. As a result of the vesting acceleration, approximately $0.5 million in aggregate future expense was eliminated. The vesting acceleration did not result in compensation expense in the Company’s statement of income, but is reflected as additional stock-based employee compensation expense in the calculation of 2005 pro forma earnings above.
The following table presents stock-based compensation expense included in the Company’s consolidated statements of income for the years ended December 31, 2006 and 2007 pursuant to the provisions of SFAS No. 123R:
| Year Ended December 31, |
| 2006 | | 2007 |
| Cost of portal revenues, exclusive of depreciation & amortization | $ | 346,392 | | | $ | 410,822 | |
| Cost of software & services revenues, exclusive of depreciation and amortization | | 19,051 | | | | 17,986 | |
| Selling & administrative | | 966,160 | | | | 1,248,082 | |
| Stock-based compensation expense before income taxes | | 1,331,603 | | | | 1,676,890 | |
| Income tax benefit | | (519,732 | ) | | | (654,993 | ) |
| Net stock-based compensation expense | $ | 811,871 | | | $ | 1,021,897 | |
69
Stock option and restricted stock plans
The Company has two formal stock-option and incentive plans (the “NIC” plan and the “SDR” plan) to provide for the granting of incentive stock options, non-qualified stock options or restricted stock awards to encourage certain employees of the Company and its subsidiaries, and directors of the Company, to participate in the ownership of the Company, and to provide additional incentive for such employees and directors to promote the success of its business through sharing the future growth of such business.
The NIC plan was adopted in May 1998, amended in November 1998 and May 1999, revised in August 1999, and amended and restated in May 2004 and May 2006. The May 2006 amendment and restatement, as approved by the Company’s Board of Directors and shareholders, modified the NIC plan to allow for the granting of restricted stock awards in addition to stock options. Under the NIC plan, the Company is authorized to grant stock options and restricted stock awards for up to 9,286,754 common shares. At December 31, 2007, a total of 1,388,327 shares were available for future grants under the NIC plan. There have been no option repricings under the NIC plan.
The SDR plan was adopted in May 2000 in conjunction with NIC’s acquisition of SDR Technologies. Under the SDR plan, the Company is authorized to grant options for up to 229,965 common shares. No options in addition to the 227,566 options granted upon the close of the SDR acquisition will be granted under the SDR plan. There have been no option repricings under the SDR plan.
Stock options are generally exercisable one year from date of grant in cumulative annual installments of 25% and expire five years after the grant date. The Company did not grant any stock options in 2006 or 2007, and does not currently anticipate granting stock options in the future. Instead, the Company expects to grant only restricted stock awards, as further discussed below.
Stock options
Summary stock option activity for the year ended December 31, 2007 is presented below:
| | | | | | Weighted | | |
| | | | Weighted | | Average | | |
| | | | Average | | Remaining | | Aggregate |
| | | | Exercise | | Contractual | | Intrinsic |
| Shares | | Price | | Term | | Value |
| Outstanding at January 1 | 1,555,633 | | | $4.19 | | | | |
| Granted | — | | | — | | | | |
| Exercised | (342,950 | ) | | $3.28 | | | | |
| Expired | (8,250 | ) | | $4.11 | | | | |
| Canceled | (14,250 | ) | | $3.93 | | | | |
| Outstanding at December 31 | 1,190,183 | | | $4.46 | | 1.3 | | $4,737,000 |
| Options exercisable at December 31 | 997,683 | | | $4.38 | | 1.1 | | $4,049,000 |
The aggregate intrinsic value of options exercised during the years ended December 31, 2005, 2006 and 2007 was approximately $4.5 million, $1.5 million and $1.1 million, respectively. Cash proceeds from the exercise of employee stock options for the years ended December 31, 2005, 2006 and 2007 were approximately $4.6 million, $1.2 million and $0.9 million, respectively.
The fair value of shares vested during the years ended December 31, 2005, 2006 and 2007 was approximately $2.4 million, $0.8 million and $0.9 million, respectively. As of December 31, 2007, there was approximately $0.3 million of total unrecognized compensation cost, net of estimated forfeitures, related to nonvested stock options. The Company expects to recognize this cost over a weighted-average period of 1.2 years.
Restricted stock
The Company began granting shares of restricted stock awards in the second quarter of 2006. Grants of restricted stock generally vest beginning one year from the date of grant in cumulative annual installments of 25%. Restricted stock is valued at the date of grant, based on the closing market price of the Company’s common stock, and expensed using the straight-line method over the requisite service period.
70
A summary of restricted stock activity for the year ended December 31, 2007 is presented below:
| | | | Weighted |
| | | | Average |
| Restricted | | Grant Date |
| Shares | | Fair Value |
| Outstanding at January 1 | 595,485 | | | $5.70 |
| Granted | 99,299 | | | $4.96 |
| Vested | (145,490 | ) | | $5.70 |
| Expired | — | | | — |
| Canceled | (59,878 | ) | | $5.64 |
| Outstanding at December 31 | 489,416 | | | $5.55 |
The fair value of restricted stock vested during the year ended December 31, 2007 was approximately $0.8 million. At December 31, 2007, the Company had approximately $2.1 million of total unrecognized compensation cost, net of estimated forfeitures, related to nonvested restricted stock awards. The Company expects to recognize this cost over the next 3.0 years.
Income taxes
During 2005, certain employees of the Company exercised non-qualified stock options. As a result, the Company received federal income tax deductions, or windfall tax benefits. The tax benefit for the deductions of approximately $1.8 million for 2005 increased deferred tax assets and was credited directly to additional paid-in capital.
Under the guidance of footnote 82 of paragraph A94 of SFAS No. 123R, the Company is not permitted to recognize a credit to additional paid-in capital for windfall tax benefits unless such windfall tax benefits reduce income taxes payable. Since the Company is not currently paying federal income taxes (with the exception of federal alternative minimum tax), such windfall tax benefits generally increase the Company’s tax net operating loss carryforwards. Following the with-and-without approach for utilization of tax attributes, which results in windfall tax benefits being utilized after utilization of available tax net operating loss carryforwards to offset current year taxable income, the Company did not record an increase to deferred tax assets with an offsetting increase to additional paid-in capital for the windfall tax benefit of approximately $0.6 million and $0.9 million relating to the exercise of non-qualified stock options and vesting of restricted stock awards during the years ended December 31, 2006 and 2007.
Paragraph 81 of SFAS No. 123R indicates that for purposes of calculating the pool of excess tax benefits available to absorb tax deficiencies recognized subsequent to the adoption of SFAS No. 123R (i.e., the pool of additional paid-in capital, or the “APIC pool”), the Company shall include the net excess tax benefits that would have qualified as such had the entity adopted SFAS No. 123 for recognition purposes. The Company elected to use the alternative transition method described in FASB Staff Position No. FAS 123(R)-3 (the “short cut method”) for calculating the APIC pool upon adoption of SFAS No. 123R, and determined it had no such pool available.
Earnings per share
In calculating diluted earnings per share under SFAS No. 128, “Earnings Per Share,” the assumed proceeds in the treasury stock calculation are adjusted for any stock option windfall tax benefits or shortfalls that would be credited or debited, respectively, to additional paid-in capital. Upon adoption of SFAS No. 123R using the modified prospective application transition method, the Company elected to exclude the impact of pro forma deferred tax assets (i.e., the windfall or shortfall that would be recognized in the financial statements upon exercise of an award) when calculating diluted earnings per share.
Employee Stock Purchase Plan
In 1999, the Company’s Board of Directors approved an employee stock purchase plan (“ESPP”) intended to qualify as an “employee stock purchase plan” under Section 423 of the Internal Revenue Code. A total of 2,321,688 shares of NIC common stock have been reserved for issuance under this plan. Terms of the plan permit eligible employees to purchase NIC common stock through payroll deductions up to 15% of each employee’s compensation.
71
Amounts deducted and accumulated by the participant are used to purchase shares of NIC’s common stock at 85% of the lower of the fair value of the common stock at the beginning or the end of the offering period, as defined in the plan.
In the offering period commencing on April 1, 2004 and ending on March 31, 2005, 30,031 shares were purchased at a price of $4.055 per share, resulting in total cash proceeds to the Company of approximately $122,000. In the offering period commencing on April 1, 2005 and ending on March 31, 2006, 40,343 shares were purchased at a price of $3.9015 per share, resulting in total cash proceeds to the Company of approximately $157,000. In the offering period commencing on April 1, 2006 and ending on March 31, 2007, 52,622 shares were purchased at a price of $4.556 per share, resulting in total cash proceeds to the Company of approximately $240,000. The next offering period under this plan commenced on April 1, 2007. The closing fair market value of NIC common stock on the first day of the current offering period was $5.36 per share.
Included in the Company’s stock-based compensation expense for the year ended December 31, 2007 is a portion of the cost (approximately $77,000) relating to the ESPP offering period ending on March 31, 2008, and a portion of the cost (approximately $43,000) relating to the ESPP offering period that ended on March 31, 2007.
The fair values of the offerings were estimated on the dates of grant using the Black-Scholes model using the assumptions in the following table.
| | | March 31, 2007 | | March 31, 2008 |
| | | Offering | | Offering |
| Risk-free interest rate | | | 4.77 | % | | | 4.93 | % |
| Expected dividend yield | | | 0.00 | % | | | 0.00 | % |
| Expected life | | | 1.0 year | | | | 1.0 year | |
| Expected stock price volatility | | | 30.11 | % | | | 34.11 | % |
| Weighted average fair value of ESPP rights | | | $1.60 | | | | $1.52 | |
Defined Contribution 401(k) Profit Sharing Plan
The Company and its subsidiaries sponsor a defined contribution 401(k) profit sharing plan. In accordance with the plan, all full-time employees are eligible immediately upon employment. A discretionary match of up to 10% of an employee’s salary and a discretionary contribution may be made to the plan as determined by the Board of Directors. Expense related to Company matching contributions totaled approximately $0.5 million, $0.5 million and $0.6 million for the years ended December 31, 2005, 2006 and 2007, respectively.
12. REPORTABLE SEGMENTS AND RELATED INFORMATION
The Company’s two reportable segments consist of its Outsourced Portal businesses and Software & Services businesses. The Outsourced Portals segment includes the Company’s subsidiaries operating outsourced government portals and the corporate divisions that directly support portal operations. The Software & Services segment primarily includes the Company’s UCC and corporate filings software development business (NIC Conquest) and ethics & elections filings business (NIC Technologies). Each of the Company’s Software & Services businesses is an operating segment and has been aggregated to form the Software & Services reportable segment. Unallocated corporate-level expenses are reported in the reconciliation of the segment totals to the related consolidated totals as “Other Reconciling Items.” There have been no significant intersegment transactions for the periods reported. The summary of significant accounting policies applies to all segments.
The measure of profitability by which management evaluates the performance of its segments and allocates resources to them is operating income (loss). Segment asset or other segment balance sheet information is not presented to the Company’s chief operating decision maker. Accordingly, the Company has not presented information relating to segment assets.
72
The table below reflects summarized financial information for the Company’s reportable segments for the years ended December 31:
| | Outsourced | | Software & | | Other Reconciling | | Consolidated |
| | | Portals | | Services | | Items | | Total |
| 2005 | | | | | | | | | | | | | | |
| Revenues | | $ | 57,875,067 | | $ | 1,367,546 | | | $ | — | | | $ | 59,242,613 |
| Costs & expenses | | | 31,980,570 | | | 5,779,628 | | | | 9,688,279 | | | | 47,448,477 |
| Depreciation & amortization | | | 1,376,673 | | | 140,900 | | | | 85,306 | | | | 1,602,879 |
| Operating income (loss) | | $ | 24,517,824 | | $ | (4,552,982 | ) | | $ | (9,773,585 | ) | | $ | 10,191,257 |
| 2006 | | | | | | | | | | | | | | |
| Revenues | | $ | 70,008,598 | | $ | 1,367,248 | | | $ | — | | | $ | 71,375,846 |
| Costs & expenses | | | 40,433,646 | | | 1,169,498 | | | | 11,584,270 | | | | 53,187,414 |
| Depreciation & amortization | | | 1,863,437 | | | 65,131 | | | | 111,830 | | | | 2,040,398 |
| Operating income (loss) | | $ | 27,711,515 | | $ | 132,619 | | | $ | (11,696,100 | ) | | $ | 16,148,034 |
| 2007 | | | | | | | | | | | | | | |
| Revenues | | $ | 82,451,763 | | $ | 3,303,171 | | | $ | — | | | $ | 85,754,934 |
| Costs & expenses | | | 47,580,543 | | | 2,160,340 | | | | 17,385,470 | | | | 67,126,353 |
| Depreciation & amortization | | | 2,310,968 | | | 24,371 | | | | 166,276 | | | | 2,501,615 |
| Operating income (loss) | | $ | 32,560,252 | | $ | 1,118,460 | | | $ | (17,551,746 | ) | | $ | 16,126,966 |
The following is a reconciliation of total segment operating income to total consolidated income before income taxes for the years ended December 31:
| | | 2005 | | 2006 | | 2007 |
| Total operating income for reportable segments | | $ | 10,191,257 | | | $ | 16,148,034 | | | $ | 16,126,966 | |
| Interest income | | | 704,614 | | | | 2,401,504 | | | | 1,741,107 | |
| Gain (loss) on affiliate investments | | | — | | | | (96,954 | ) | | | 508,209 | |
| Other income (expense), net | | | (2,971 | ) | | | (35,187 | ) | | | (16,010 | ) |
| Income before income taxes | | $ | 10,892,900 | | | $ | 18,417,397 | | | $ | 18,360,272 | |
The highest volume, most commercially valuable service the Company offers is access to motor vehicle records through the Company’s outsourced government portals, referred to as DMV records. This service accounted for approximately 62%, 59% and 54% of the Company’s portal revenues in 2005, 2006 and 2007, respectively.
A primary source of revenue is derived from data resellers, who use the Company’s government portals to access DMV records for sale to the auto insurance industry. For the year ended December 31, 2005, one of these data resellers accounted for approximately 46% of the Company’s portal revenues and 45% of the Company’s total revenues. For the year ended December 31, 2006, one of these data resellers accounted for approximately 47% of the Company’s portal revenues and 47% of the Company’s total revenues. For the year ended December 31, 2007, one of these data resellers accounted for approximately 40% of the Company’s portal revenues and 38% of the Company’s total revenues. At December 31, 2007, this one data reseller accounted for approximately 29% of the Company’s accounts receivable.
For the year ended December 31, 2005, the Company’s Indiana portal accounted for approximately 16% of the Company’s portal revenues and 15% of the Company’s consolidated revenues. For the year ended December 31, 2006, the Company’s Indiana portal accounted for approximately 14% of the Company’s portal revenues and 13% of the Company’s consolidated revenues. For the year ended December 31, 2007, the Company’s Indiana portal accounted for approximately 11% of the Company’s portal revenues and 11% of the Company’s consolidated revenues.
For the years ended December 31, 2005 and 2006, revenues from the Company’s UCC and corporate filings software development contract with the California Secretary of State were negative ($1,425,000) and negative ($940,000) as a result of adjustments under percentage of completion accounting as further discussed in Note 2.
73
13. RELATED PARTY TRANSACTIONS
The Company rented an aircraft on an hourly basis from a company that is owned by two shareholders/directors of the Company at costs that the Company believes were reasonable compared to similar services provided by third parties. One of these directors was the Chairman and Chief Executive Officer of the Company. In 2005, payments made to this company totaled approximately $0.1 million. No payments were made to this company in 2006 or 2007.
14. SUBSEQUENT EVENTS
On February 4, 2008, the Company’s Board of Directors declared a special cash dividend of $0.25 per share, payable to shareholders of record as of February 18, 2008. The dividend, totaling approximately $15.7 million, was paid on February 28, 2008 on 62,039,256 outstanding shares of common stock. A dividend equivalent of $0.25 per share was also paid simultaneously on 790,032 unvested shares of restricted stock granted under the Company’s 2006 Stock Option and Incentive Plan. The dividend was paid out of the Company’s available cash and marketable securities.
The dividend may result in a partial return of capital to shareholders, with the balance being taxable to shareholders as a qualified dividend. The exact amount of the return of capital, if any, is dependent on the earnings of the Company, computed on a tax basis, through the end of its 2008 fiscal year.
15. UNAUDITED QUARTERLY OPERATING RESULTS
The unaudited quarterly information below is subject to seasonal fluctuations resulting in lower portal revenues in the fourth quarter of each calendar year, due to the smaller number of business days in the quarter and a lower volume of business-to-government and citizen-to-government transactions during the holiday periods. For additional information on significant items affecting the quarterly results for the periods presented, refer above to Notes 2 and 11 in 2006 and Notes 2, 6 and 10 in 2007.
74
| 2006 | | | | | | | | | | | | | | | | | | | |
| |
| | | Three Months Ended | | Year Ended |
| | | March 31, 2006 | | June 30, 2006 | | September 30, 2006 | | December 31, 2006 | | December 31, 2006 |
| Revenues: | | | | | | | | | | | | | | | | | | | |
| Portal revenues | | $ | 16,988,892 | | | $ | 17,793,833 | | $ | 17,214,120 | | | $ | 18,011,753 | | | $ | 70,008,598 | |
| Software & services revenues | | | (1,241,425 | ) | | | 967,731 | | | 821,175 | | | | 819,767 | | | | 1,367,248 | |
| Total revenues | | | 15,747,467 | | | | 18,761,564 | | | 18,035,295 | | | | 18,831,520 | | | | 71,375,846 | |
| | | | | | | | | | | | | | | | | | | | |
| Operating expenses: | | | | | | | | | | | | | | | | | | | |
| Cost of portal revenues, exclusive | | | | | | | | | | | | | | | | | | | |
| of depreciation | | | | | | | | | | | | | | | | | | | |
| & amortization | | | 8,276,575 | | | | 8,930,990 | | | 9,477,909 | | | | 10,563,884 | | | | 37,249,358 | |
| Cost of software & services | | | | | | | | | | | | | | | | | | | |
| revenues, exclusive | | | | | | | | | | | | | | | | | | | |
| of depreciation | | | | | | | | | | | | | | | | | | | |
| & amortization | | | (1,329,170 | ) | | | 766,123 | | | 565,448 | | | | 593,878 | | | | 596,279 | |
| Selling & administrative | | | 3,428,499 | | | | 3,559,951 | | | 3,915,668 | | | | 4,437,659 | | | | 15,341,777 | |
| Depreciation & amortization | | | 504,590 | | | | 525,452 | | | 501,381 | | | | 508,975 | | | | 2,040,398 | |
| Total operating expenses | | | 10,880,494 | | | | 13,782,516 | | | 14,460,406 | | | | 16,104,396 | | | | 55,227,812 | |
| Operating income | | | 4,866,973 | | | | 4,979,048 | | | 3,574,889 | | | | 2,727,124 | | | | 16,148,034 | |
| Other income (expense): | | | | | | | | | | | | | | | | | | | |
| Interest income | | | 379,740 | | | | 498,347 | | | 665,655 | | | | 857,762 | | | | 2,401,504 | |
| Equity in net loss of affiliates | | | (96,954 | ) | | | — | | | — | | | | — | | | | (96,954 | ) |
| Other income (expense), net | | | 300 | | | | — | | | (49,185 | ) | | | 13,698 | | | | (35,187 | ) |
| Total other income | | | | | | | | | | | | | | | | | | | |
| (expense) | | | 283,086 | | | | 498,347 | | | 616,470 | | | | 871,460 | | | | 2,269,363 | |
| Income before taxes | | | 5,150,059 | | | | 5,477,395 | | | 4,191,359 | | | | 3,598,584 | | | | 18,417,397 | |
| Income tax provision | | | 2,231,509 | | | | 2,232,378 | | | 1,732,560 | | | | 1,481,949 | | | | 7,678,396 | |
| Net income | | $ | 2,918,550 | | | $ | 3,245,017 | | $ | 2,458,799 | | | $ | 2,116,635 | | | $ | 10,739,001 | |
| | | | | | | | | | | | | | | | | | | | |
| Basic net income per share: | | $ | 0.05 | | | $ | 0.05 | | $ | 0.04 | | | $ | 0.03 | | | $ | 0.17 | |
| Diluted net income per share | | $ | 0.05 | | | $ | 0.05 | | $ | 0.04 | | | $ | 0.03 | | | $ | 0.17 | |
| | | | | | | | | | | | | | | | | | | | |
| Weighted average shares outstanding: | | | | | | | | | | | | | | | | | | | |
| Basic | | | 61,139,586 | | | | 61,380,512 | | | 61,535,607 | | | | 61,572,351 | | | | 61,408,552 | |
| Diluted | | | 61,606,781 | | | | 61,838,566 | | | 61,798,252 | | | | 61,802,623 | | | | 61,763,093 | |
75
| 2007 | | | | | | | | | | | | | | | | | | | |
| |
| | | Three Months Ended | | Year Ended |
| Revenues: | | March 31, 2007 | | June 30, 2007 | | September 30, 2007 | | December 31, 2007 | | December 31, 2007 |
| Portal revenues | | $ | 19,868,121 | | $ | 20,610,064 | | | $ | 20,699,037 | | | $ | 21,274,541 | | | $ | 82,451,763 | |
| Software & services revenues | | | 765,716 | | | 866,117 | | | | 858,715 | | | | 812,623 | | | | 3,303,171 | |
| Total revenues | | | 20,633,837 | | | 21,476,181 | | | | 21,557,752 | | | | 22,087,164 | | | | 85,754,934 | |
| Operating expenses: | | | | | | | | | | | | | | | | | | | |
| Cost of portal revenues, exclusive | | | | | | | | | | | | | | | | | | | |
| of depreciation | | | | | | | | | | | | | | | | | | | |
| & amortization | | | 10,454,148 | | | 10,418,844 | | | | 10,844,146 | | | | 11,931,344 | | | | 43,648,482 | |
| Cost of software & services | | | | | | | | | | | | | | | | | | | |
| revenues, exclusive | | | | | | | | | | | | | | | | | | | |
| of depreciation | | | | | | | | | | | | | | | | | | | |
| & amortization | | | 470,716 | | | 493,210 | | | | 478,811 | | | | 440,741 | | | | 1,883,478 | |
| Selling & administrative | | | 5,119,716 | | | 5,445,394 | | | | 5,206,679 | | | | 5,822,604 | | | | 21,594,393 | |
| Depreciation & amortization | | | 535,670 | | | 576,405 | | | | 632,251 | | | | 757,289 | | | | 2,501,615 | |
| Total operating expenses | | | 16,580,250 | | | 16,933,853 | | | | 17,161,887 | | | | 18,951,978 | | | | 69,627,968 | |
| Operating income | | | 4,053,587 | | | 4,542,328 | | | | 4,395,865 | | | | 3,135,186 | | | | 16,126,966 | |
| Other income (expense): | | | | | | | | | | | | | | | | | | | |
| Interest income | | | 580,425 | | | 317,182 | | | | 359,870 | | | | 483,630 | | | | 1,741,107 | |
| Gain (loss) on affiliate | | | | | | | | | | | | | | | | | | | |
| investments | | | — | | | — | | | | 508,209 | | | | — | | | | 508,209 | |
| Other income (expense), net | | | 105 | | | (166 | ) | | | 2,191 | | | | (18,140 | ) | | | (16,010 | ) |
| Total other income | | | | | | | | | | | | | | | | | | | |
| (expense) | | | 580,530 | | | 317,016 | | | | 870,270 | | | | 465,490 | | | | 2,233,306 | |
| Income before taxes | | | 4,634,117 | | | 4,859,344 | | | | 5,266,135 | | | | 3,600,676 | | | | 18,360,272 | |
| Income tax provision | | | 1,888,403 | | | 2,107,032 | | | | 1,476,154 | | | | 933,463 | | | | 6,405,052 | |
| Net income | | $ | 2,745,714 | | $ | 2,752,312 | | | $ | 3,789,981 | | | $ | 2,667,213 | | | $ | 11,955,220 | |
| | | | | | | | | | | | | | | | | | | | |
| Basic net income per share: | | $ | 0.04 | | $ | 0.04 | | | $ | 0.06 | | | $ | 0.04 | | | $ | 0.19 | |
| Diluted net income per share | | $ | 0.04 | | $ | 0.04 | | | $ | 0.06 | | | $ | 0.04 | | | $ | 0.19 | |
| | | | | | | | | | | | | | | | | | | | |
| Weighted average shares outstanding: | | | | | | | | | | | | | | | | | | | |
| Basic | | | 61,652,154 | | | 61,768,673 | | | | 61,904,985 | | | | 62,015,563 | | | | 61,836,530 | |
| Diluted | | | 61,968,819 | | | 62,255,725 | | | | 62,536,688 | | | | 62,646,298 | | | | 62,525,249 | |
76
REPORT OF INDEPENDENT REGISTERED PUBLIC ACCOUNTING FIRM
To the Board of Directors and Shareholders of NIC Inc.:
In our opinion, the consolidated financial statements listed in the index appearing under Item 15(a) present fairly, in all material respects, the financial position of NIC Inc. and its subsidiaries at December 31, 2007 and 2006, and the results of their operations and their cash flows for each of the three years in the period ended December 31, 2007 in conformity with accounting principles generally accepted in the United States of America. Also in our opinion, the Company maintained, in all material respects, effective internal control over financial reporting as of December 31, 2007, based on criteria established inInternal Control – Integrated Framework issued by the Committee of Sponsoring Organizations of the Treadway Commission (COSO). The Company’s management is responsible for these financial statements, for maintaining effective internal control over financial reporting and for its assessment of the effectiveness of internal control over financial reporting, included in the accompanying Management’s Report on Internal Control Over Financial Reporting appearing under Item 9A. Our responsibility is to express opinions on these financial statements and on the Company’s internal control over financial reporting based on our integrated audits. We conducted our audits in accordance with the standards of the Public Company Accounting Oversight Board (United States). Those standards require that we plan and perform the audits to obtain reasonable assurance about whether the financial statements are free of material misstatement and whether effective internal control over financial reporting was maintained in all material respects. Our audits of the financial statements include examining, on a test basis, evidence supporting the amounts and disclosures in the financial statements, assessing the accounting principles used and significant estimates made by management, and evaluating the overall financial statement presentation. Our audit of internal control over financial reporting included obtaining an understanding of internal control over financial reporting, assessing the risk that a material weakness exists, and testing and evaluating the design and operating effectiveness of internal control based on the assessed risk. Our audits also included performing such other procedures as we considered necessary in the circumstances. We believe that our audits provide a reasonable basis for our opinions.
As discussed in Note 2 to the consolidated financial statements, the Company changed the manner in which it accounts for uncertain tax positions effective January 1, 2007 and share-based compensation effective January 1, 2006.
A company’s internal control over financial reporting is a process designed to provide reasonable assurance regarding the reliability of financial reporting and the preparation of financial statements for external purposes in accordance with generally accepted accounting principles. A company’s internal control over financial reporting includes those policies and procedures that (i) pertain to the maintenance of records that, in reasonable detail, accurately and fairly reflect the transactions and dispositions of the assets of the company; (ii) provide reasonable assurance that transactions are recorded as necessary to permit preparation of financial statements in accordance with generally accepted accounting principles, and that receipts and expenditures of the company are being made only in accordance with authorizations of management and directors of the company; and (iii) provide reasonable assurance regarding prevention or timely detection of unauthorized acquisition, use, or disposition of the company’s assets that could have a material effect on the financial statements.
Because of its inherent limitations, internal control over financial reporting may not prevent or detect misstatements. Also, projections of any evaluation of effectiveness to future periods are subject to the risk that controls may become inadequate because of changes in conditions, or that the degree of compliance with the policies or procedures may deteriorate.
/S/ PRICEWATERHOUSECOOPERS LLP
Kansas City, Missouri
March 17, 2008
77
| ITEM 9. | CHANGES IN AND DISAGREEMENTS WITH ACCOUNTANTS ON ACCOUNTING AND FINANCIAL DISCLOSURE |
None.
ITEM 9A. CONTROLS AND PROCEDURES
Conclusion Regarding the Effectiveness of Disclosure Controls and Procedures - The Company maintains disclosure controls and procedures (as defined in Rules 13a-15(e) and 15d-15(e) promulgated under the Securities Exchange Act of 1934, as amended (the “Exchange Act”)) that are designed to ensure that material information required to be disclosed in its filings under the Exchange Act is recorded, processed, summarized and reported within the time periods specified in the SEC’s rules and forms. Disclosure controls and procedures include, without limitation, controls and procedures designed to ensure that information required to be disclosed by an issuer in the reports that it files or submits under the Exchange Act is accumulated and communicated to the issuer’s management, including its principal executive and principal financial officers, or persons performing similar functions, as appropriate to allow timely decisions regarding required disclosure. Under the supervision and with the participation of our management, including our principal executive officer and principal financial officer, we conducted an evaluation of the effectiveness of our disclosure controls and procedures as of the end of the period covered by this Annual Report on Form 10-K. Based on this evaluation, our principal executive officer and our principal financial officer concluded that our disclosure controls and procedures were effective as of such date.
Management’s Report on Internal Control Over Financial Reporting - Our management is responsible for establishing and maintaining adequate internal control over financial reporting, as such term is defined in Exchange Act Rule 13a-15(f). Under the supervision and with the participation of our management, including our principal executive officer and principal financial officer, we conducted an evaluation of the effectiveness of our internal control over financial reporting based on the framework inInternal Control – Integrated Framework issued by the Committee of Sponsoring Organizations of the Treadway Commission. Based on our evaluation under the framework inInternal Control – Integrated Framework, our management concluded that our internal control over financial reporting was effective as of December 31, 2007.
Because of its inherent limitations, internal control over financial reporting may not prevent or detect misstatements. Also, projections of any evaluation of effectiveness to future periods are subject to the risk that controls may become inadequate because of changes in conditions, or that the degree of compliance with the policies or procedures may deteriorate.
The effectiveness of the Company’s internal control over financial reporting as of December 31, 2007 has been audited by PricewaterhouseCoopers LLP, an independent registered public accounting firm, as stated in their report which appears herein.
Changes in Internal Control over Financial Reporting - - As of the end of the period covered by this report, our management, including our principal executive officer and principal financial officer, concluded that there have been no changes in our internal control over financial reporting that occurred during our fourth fiscal quarter of 2007 that have materially affected, or are reasonably likely to materially affect, our internal control over financial reporting.
ITEM 9A(T). CONTROLS AND PROCEDURES
Not applicable.
ITEM 9B. OTHER INFORMATION
None.
78
PART III
ITEM 10. DIRECTORS, EXECUTIVE OFFICERS AND CORPORATE GOVERNANCE
The information under “Election of Directors,” “Executive Officers,” “Section 16(a) Beneficial Ownership Reporting Compliance” and “Structure and Practices of the Board of Directors - Corporate Governance Principles and Practices and Code of Business Conduct and Ethics, – Committees of the Board and – Nominations of Directors” set forth in the Company’s proxy statement related to its 2008 annual meeting of shareholders (the “Proxy Statement”), which will be filed with the SEC not later than 120 days after the end of the Company’s fiscal year pursuant to Regulation 14A, is incorporated herein by reference.
ITEM 11. EXECUTIVE COMPENSATION
The information under “Executive Compensation,” “Compensation Discussion and Analysis,” “Compensation Tables,” “Compensation Committee Interlocks and Insider Participation,” “Employment Agreements and Severance Payments,” and “Structure and Practices of the Board of Directors – Director Compensation” set forth in the Proxy Statement, which will be filed with the SEC not later than 120 days after the end of the Company’s fiscal year pursuant to Regulation 14A, is incorporated herein by reference.
| ITEM 12. | SECURITY OWNERSHIP OF CERTAIN BENEFICIAL OWNERS AND MANAGEMENT |
| | AND RELATED SHAREHOLDER MATTERS |
The information under “Security Ownership of Certain Beneficial Owners and Management” set forth in the Proxy Statement, which will be filed with the SEC not later than 120 days after the end of the Company’s fiscal year pursuant to Regulation 14A, is incorporated herein by reference.
The following table shows the Company’s common stock authorized for issuance under the Company’s equity compensation plans as of December 31, 2007:
| | | A | | B | | C |
| | | Number of securities to | | Weighted average | | |
| | | be issued upon exercise of | | exercise price of | | Number of |
| | | outstanding options, warrants | | outstanding options, | | securities available |
| | | and rights outstanding as of | | warrants and rights | | for issuance as of |
| Plan Category | | December 31, 2007 | | shown in Column A | | December 31, 2007 |
| Equity compensation plans approved by | | | | | | | |
| shareholders | | | | | | | |
| |
| ·Stock options | | 1,175,500 | | | $4.49 | | |
| ·Restricted stock | | 489,416 | | | — | | |
| Total | | 1,664,916 | | | | | 1,388,327 |
| Employee stock purchase plan | | See Note | (1) | | See Note(1) | | 2,037,132 |
| Equity compensation plans not approved by | | | | | | | |
| shareholders (2) | | 14,683 | | | $2.03 | | 2,399 |
__________________
| (1) | | March 31, 2007 was the purchase date of common stock for the most recently completed offering period under the Company’s employee stock purchase plan. Therefore, as of such date, no purchase rights were outstanding. The purchase price for the offering period ended March 31, 2007, was $4.556 per share, and the total number of shares purchased was 52,622. |
| |
| (2) | | In connection with the Company’s acquisition of SDR Technologies, Inc. in May 2000, the Company adopted the 1999 Stock Option Plan of SDR Technologies, Inc (the “SDR Plan”). Options to purchase 227,566 shares were granted in connection with the acquisition of SDR. However, no options in addition to those granted at the close of the SDR transaction will be granted under this plan. The SDR Plan is administered by the Compensation Committee of the Company’ Board of Directors. |
79
| ITEM 13. | CERTAIN RELATIONSHIPS AND RELATED TRANSACTIONS, AND DIRECTOR INDEPENDENCE |
The information under “Certain Relationships and Related Transactions” set forth in the Proxy Statement, which will be filed with the SEC not later than 120 days after the end of the Company’s fiscal year pursuant to Regulation 14A, is incorporated herein by reference.
ITEM 14. PRINCIPAL ACCOUNTANT FEES AND SERVICES
The information under “Ratification of Appointment of Independent Registered Public Accounting Firm” set forth in the Proxy Statement, which will be filed with the SEC not later than 120 days after the end of the Company’s fiscal year pursuant to Regulation 14A, is incorporated herein by reference.
80
PART IV
ITEM 15. EXHIBITS, FINANCIAL STATEMENT SCHEDULES
(a) The following documents are filed as part of this report:
| Index To Consolidated Financial Statements: | Page |
| Consolidated Balance Sheets | 48 |
| Consolidated Statements of Income | 49 |
| Consolidated Statements of Changes in Shareholders’ Equity | 50 |
| Consolidated Statements of Cash Flows | 51 |
| Notes to Consolidated Financial Statements | 52 |
| Report of PricewaterhouseCoopers LLP, Independent Registered Public Accounting Firm | 77 |
All schedules are omitted because they are not applicable or the required information is shown in the consolidated financial statements or notes thereto.
| Exhibit | | |
| Number | | Description |
| 3.1 | | Articles of Incorporation of the registrant(1) |
| 3.2 | | Articles of Amendment to Articles of Incorporation of the registrant(7) |
| 3.3 | | Amended and Restated Bylaws of registrant, as restated effective November 5, 2007(13) |
| 4.1 | | Reference is made to Exhibits 3.1, 3.2 and 3.3 |
| 4.2 | | Investor Rights Agreement dated June 30, 1998(1) |
| 4.3 | | Investors’ Rights Agreement, dated January 12, 2000(2) |
| 4.4 | | Specimen Stock Certificate of the registrant(1) |
| 9.1 | | Voting Trust Agreement between Jeffery S. Fraser and Ross C. Hartley and certain Holders of Shares of National Information Consortium, Inc. dated June 30, 1998 and form of the voting trust certificate(1) |
| 9.2 | | First Amendment dated December 15, 1999 to Voting Trust Agreement between Jeffery S. Fraser and Ross C. Hartley and certain Holders of Shares of National Information Consortium, Inc. dated June 20, 1998(11) |
| 10.1 | | Form of Indemnification Agreement between the registrant and each of its executive officers and directors(1)** |
| 10.2 | | Registrant’s 1998 Stock Option Plan, as amended and restated(1)** |
| 10.3 | | Registrant’s 1999 Employee Stock Purchase Plan(1)** |
| 10.4 | | Employment Agreement between the registrant and Jeffery S. Fraser dated July 1, 1998(1)** |
| 10.5 | | Contract for Network Manager Services between the Information Network of Kansas and Kansas Information Consortium, Inc. dated December 18, 1991 with addenda dated October 15, 1992, August 19, 1993, May 26, 1995 and June 13, 1996 and amendment on March 2, 1998(1) |
| 10.6 | | Contract for Network Manager Services between the State of Indiana by and through the Intelenet Commission and Indian@ Interactive, Inc., dated July 18, 1995(1) |
| 10.7 | | Services Contract by and between National Information Consortium, U.S.A. and the GeorgiaNet Authority, an agency of the State of Georgia, dated September 15, 1996(1) |
| 10.8 | | Contract for Network Manager between Information Network of Arkansas by and through the Information Network of Arkansas Board and Arkansas Information Consortium, Inc. dated July 2, 1997(1) |
| 10.9 | | Contract for Network Manager Services between the Nebraska State Records Board on behalf of the State of Nebraska and Nebrask@ Interactive, Inc. dated December 3, 1997 with addendum No. 1 dated as of the same date(1) |
| 10.10 | | Contract for Network Manager Services between the Commonwealth of Virginia by and through the Virginia Information Providers Network Authority and Virginia Interactive, LLC dated January 15, 1998(1) |
81
| Exhibit | | |
| Number | | Description |
| 10.11 | | Contract for Network Manager Services between Iowa Interactive, Inc. and the State of Iowa by and through Information Technology Services dated April 23, 1998 with letter addendum dated August 7, 1998(1) |
| 10.12 | | Contract for Network Manager Services between the Consolidated City of Indianapolis and Marion County by and through the Enhanced Access Board of Marion County and City-County Interactive, LLC dated August 31, 1998 with addendum dated as of the same date(1) |
| 10.13 | | State of Maine Contract for Special Services with New England Interactive, Inc. dated April 14, 1999(1) |
| 10.14 | | State of Idaho Contract for Electronic Business and portal Services with the Idaho Department of Administration and other Public Agencies, dated December 7, 1999(2) |
| 10.15 | | State of Hawaii Contract for Special Services with the State of Hawaii, dated December 29, 1999(2) |
| 10.16 | | Agreement between Equifax Services and Nebrask@ Online dated March 25, 1996(1) |
| 10.17 | | Agreement between ChoicePoint and the Information Network of Kansas dated September 1, 1997(1) |
| 10.18 | | Agreement between Equifax/ChoicePoint and the Information Network of Arkansas dated September 2, 1997(1) |
| 10.19 | | Agreement between Equifax Systems, Inc. and Access Indian@ Information Network dated November 14, 1995(1) |
| 10.20 | | Contract for Network Manager Services between the State of Utah and Utah Interactive, Inc. dated as of May 7, 1999(1) |
| 10.21 | | Asset Purchase Agreement between the registrant and Electric Press, Inc, for the acquisition of eFed, a division of Electric Press, Inc., dated as of September 15, 1999(2) |
| 10.22 | | Contribution Agreement between the registrant and Conquest Softworks, LLC, dated as of January 12, 2000 Agreement(2) |
| 10.23 | | Agreement and Plan of Reorganization and Merger between the registrant and SDR Technologies, Inc., dated as of February 16, 2000(2) |
| 10.24 | | Amended and Restated Agreement and Plan of Reorganization and Merger, dated as of May 5, 2000, as amended, by and among the registrant, SDR Acquisition Corp., a California corporation and a wholly owned subsidiary of the registrant, and SDR Technologies, Inc.(3) |
| 10.25 | | Registrant’s 1999 Stock Option Plan of SDR Technologies, Inc.(4)** |
| 10.26 | | Agreement and Plan of Merger, dated as of September 8, 2000, by and among the registrant, Cherry Hills Acquisition Sub, Inc., a Colorado corporation and wholly owned subsidiary of the registrant, and Intelligent Decision Technologies, Ltd.(5) |
| 10.27 | | Employment agreement between the Registrant and William F. Bradley, dated September 1, 2000(5)** |
| 10.28 | | Employment agreement between the Registrant and Samuel R. Somerhalder, dated September 1, 2000(5)** |
| 10.29 | | Employment agreement between the Registrant and Harry H. Herington, dated September 1, 2000(5)** |
| 10.30 | | Employment agreement between the Registrant and Stephen M. Kovzan, dated September 1, 2000(5)** |
| 10.31 | | Contract Between the State of Tennessee, Department of Finance and Administration and National Information Consortium USA, Inc., dated August 28, 2000(5) |
| 10.32 | | Self Funded Electronic Government Services Term Contract between the Department of Administration of the State of Montana and National Information Consortium USA, Inc., doing business in Montana through the subsidiary Montana Interactive, Inc., dated December 21, 2000(5) |
| 10.33 | | Business Programs Automation Agreement, dated September 6, 2001, between National Information USA, Inc. and the State of California(6) |
| 10.34 | | Employment agreement between the Registrant and Eric J. Bur dated April 1, 2001 (8)** |
| 10.35 | | Amendment to Contract No. 00SA420104, SSD SOS 0010, California Business Programs Automation Project, dated March 13, 2006, between NICUSA, Inc. and the State of California, Secretary of State |
| 10.36 | | Registrant’s 2006 Amended and Restated Stock Option and Incentive Plan (10)** |
| 10.37 | | Credit Agreement Dated as of May 2, 2007 between NIC Inc., as borrower, and Bank of America, N.A., as Lender and L/C Issuer(11) |
| 10.38 | | Separation and Severance Agreement and Release of Claims, dated June 27, 2007, between the Registrant and Eric J. Bur(12)** |
82
| Exhibit | | |
| Number | | Description |
| 10.39 | | Restricted Stock Agreement for NIC Inc. 2006 Amended and Restated Stock Option and Incentive Plan(13)** |
| 10.40 | | Stock Option Agreement for NIC Inc. 2006 Amended and Restated Stock Option and Incentive Plan(13) |
| 21.1 | | Subsidiaries of the registrant** |
| 23.1 | | Consent of PricewaterhouseCoopers LLP, Independent Registered Public Accountants |
| 31.1 | | Certification of Chief Executive Officer Pursuant to Section 302 of the Sarbanes-Oxley Act of 2002 |
| 31.2 | | Certification of Chief Financial Officer Pursuant to Section 302 of the Sarbanes-Oxley Act of 2002 |
| 32.1 | | Section 906 Certifications of Chief Executive Officer and Chief Financial Officer |
__________________
| (1) | | Incorporated by reference to Registration Statement on Form S-1, File No. 333-77939 |
| |
| (2) | | Incorporated by reference to Registration Statement on Form S-1, File No. 333-30872 |
| |
| (3) | | Incorporated by reference to Form 8-K filed with the SEC on May 26, 2000 |
| |
| (4) | | Incorporated by reference to Registration Statement on Form S-8, File No. 333-37000 |
| |
| (5) | | Incorporated by reference to Form 10-K filed with the SEC on April 2, 2001 |
| |
| (6) | | Incorporated by reference to Form 10-Q filed with the SEC on November 14, 2001 |
| |
| (7) | | Incorporated by reference to Form 10-Q filed with the SEC on May 14, 2002 |
| |
| (8) | | Incorporated by reference to Form 10-K filed with the SEC on March 25, 2002 |
| |
| (9) | | Incorporated by reference to Form 10-K filed with the SEC on March 12, 2004 |
| |
| (10) | | Incorporate by reference to Registration Statement on Form S-8, File No. 333-136016 |
| |
| (11) | | Incorporated by reference to Form 10-Q filed with SEC on May 7, 2007 |
| |
| (12) | | Incorporated by reference to Form 10-Q file with SEC on August 6, 2007 |
| |
| (13) | | Incorporated by reference to Form 10-Q file with SEC on November 11, 2007 |
| | |
| ** | | Management contracts and compensatory plans and arrangements required to be filed as Exhibits pursuant to Item 15(b) of this report. |
83
SIGNATURES
Pursuant to the requirements of Section 13 or 15(d) of the Securities Exchange Act of 1934, the registrant has duly caused this report to be signed on its behalf by the undersigned, thereunto duly authorized, on March 17, 2008.
| | NIC INC. |
| By: | /s/HARRY H. HERINGTON |
| Harry H. Herington, Chief Executive Officerand Director |
Pursuant to the requirements of the Securities Exchange Act of 1934, this report has been signed below by the following persons on behalf of the registrant and in the capacities and on the dates indicated.
| Signature | | Title | | Date |
| | | | | |
| /s/HARRY H. HERINGTON | | Chief Executive Officer and Director | | March 17, 2008 |
| Harry H. Herington | | (Principal Executive Officer) | | |
| | | | | |
| /s/STEPHEN M. KOVZAN | | Chief Financial Officer | | March 17, 2008 |
| Stephen M. Kovzan | | (Principal Financial Officer and Principal | | |
| | | Accounting Officer) | | |
| | | | |
| /s/JEFFERY S. FRASER | | Chairman of the Board | | March 17, 2008 |
| Jeffery S. Fraser | | | | |
| | | | | |
| /s/ART N. BURTSCHER | | Lead Director | | March 17, 2008 |
| Art N. Burtscher | | | | |
| | | | | |
| | | Director | | March 17, 2008 |
| John L. Bunce, Jr. | | | | |
| | | | | |
| /s/DANIEL J. EVANS | | Director | | March 17, 2008 |
| Daniel J. Evans | | | | |
| | | | | |
| /s/ROSS C. HARTLEY | | Director | | March 17, 2008 |
| Ross C. Hartley | | | | |
| | | | | |
| /s/ALEXANDER C. KEMPER | | Director | | March 17, 2008 |
| Alexander C. Kemper | | | | |
| | | | | |
| /s/PETE WILSON | | Director | | March 17, 2008 |
| Pete Wilson | | | | |
84