On March 13, 2006, we entered into an amendment to this contract with the California SOS. Among other changes, the amendment reduces the aggregate contract value to from approximately $25 million to approximately $19 million and releases us from the obligation to deliver the business filings, or BE, portion of the project, except for maintenance of hardware and delivery of BE images as expressly set forth in the amendment. The amendment also sets forth the final criteria in order for the California SOS to accept the Uniform Commercial Code, or UCC, portion of the project and move it into the maintenance and operations phase.
We are in the process of reviewing our cost estimates to complete based on the revised terms and conditions in the amendment and do not believe our estimated contract loss will exceed the $4.2 million estimate established in the first quarter of 2005. However, because of the inherent uncertainties surrounding the ultimate outcome of subcontract negotiations between our subcontractors and us as a result of the amendment, it is at least reasonably possible that the estimate will change in the near term. Further, it is possible that we will similarly incur cost overruns in the future as we have in the past as a result of unforeseen difficulties in the creation of an application called for in the contract, unforeseen challenges in ensuring compatibility with existing systems, rising development, subcontractor and personnel costs or other reasons. If this occurs, our results of operations, financial condition and cash flows could be adversely affected.
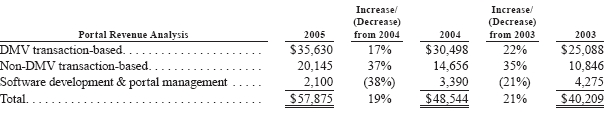
PORTAL REVENUES. In the analysis below, we have categorized our portal revenues according to the underlying source of revenue (in thousands), with the corresponding percentage increase or decrease from the prior year period.
Portal revenues for 2005 increased 19%, or approximately $9.3 million, over 2004. Of this increase, 16%, or approximately $7.9 million, was attributable to an increase in same state portal revenues (states in operation and generating DMV revenues for two full years) and 5%, or approximately $2.2 million, was primarily attributable to our new portals in South Carolina ($1.4 million), which began to generate DMV revenues in June 2005, and Colorado ($1.1 million), which began to generate DMV revenues in October 2005. Revenues related to our Vermont and New Hampshire portals, from which we primarily earn software development and portal management revenues, decreased by approximately $0.3 million in 2005. Increases in same state and new portal revenues were partially offset by a $0.8 million decrease in revenues from our local portal business, primarily due to the wind
down of certain of our less profitable local portals. In the first quarter of 2005, the Company ceased providing portal outsourcing services to Kent County, Michigan and the City of Tampa, Florida. Currently, the only local portals the Company services are those located in states where we operate an official state government portal.
Same state portal revenues in 2005 increased 17%, or approximately $7.9 million, over 2004 primarily as a result of increased transaction revenues from our Tennessee, Indiana, Arkansas, Oklahoma and Kansas portals, among others. Same state DMV transaction-based revenues increased 9%, or approximately $2.7 million, in 2005 due mainly to price increases in two of our larger portal states in late 2004. Same state non-DMV transaction-based revenues increased 41%, or approximately $5.8 million, in 2005 due to the addition of several new revenue generating applications in existing portals. Partially offsetting these increases was a 25%, or approximately $0.6 million, decrease in same state software development & portal management revenues, as we continue to focus our growth efforts on recurring non-DMV transaction-based revenues, rather than on less predictable time and materials software development projects. We expect same state revenue growth in 2006 to decrease to between 10% and 15%, due primarily to a decrease in same state DMV revenue growth. Same state DMV revenue growth is expected to range from 1% to 3% in 2006, as we do not currently anticipate any new DMV price increases. Absent DMV price increases, same state DMV revenues have historically grown at a rate of 1% to 3% per year.
Portal revenues for 2004 increased 21%, or approximately $8.3 million, over 2003. Of this increase, 17%, or approximately $6.9 million, was attributable to an increase in same state portal revenues and 6%, or approximately $2.5 million, was attributable to our newer portals including Kentucky ($2.1 million), which began to generate DMV revenues in September 2003, and Alabama ($0.5 million), which began to generate DMV revenues in February 2003. These increases were partially offset by a decrease in revenues from our local portals, primarily due to the continued wind down of certain of our unprofitable local portal businesses. In 2004, the Company ceased providing local portal services to Dallas County, Texas, the City of Corpus Christi, Texas, and Washtenaw County, Michigan.
Same state portal revenues in 2004 increased 20% over 2003 primarily as a result of increased transaction revenues from several of our portals, most notably Hawaii, Montana, Tennessee and Utah. Our same state revenue growth in 2004 was higher than the 7% growth we achieved in 2003 due in part to a 14% increase (approximately $3.2 million) in same state DMV revenues. This increase was mainly attributable to modest DMV price increases in two portal states in late 2003 and in two portal states in late 2004. In addition, same state non-DMV transaction based revenues increased 39%, or approximately $3.9 million, in 2004 due primarily to the addition of several new revenue generating applications in existing portals.
COST OF PORTAL REVENUES. Cost of portal revenues in 2005 increased 18%, or approximately $4.6 million, over 2004. Of this increase, 18%, or approximately $4.6 million, was attributable to an increase in same state cost of portal revenues, and 5%, or approximately $1.2 million, was primarily attributable to new state portal businesses in South Carolina and Colorado. These increases were offset by a $1.2 million decrease in operating expenses from our local portals as a result of the wind down of certain of our unprofitable local portal businesses. Same state cost of portal revenues in 2004 increased 20%, or approximately $4.6 million, primarily as a result of the addition of personnel in several of our portals due to our continued growth and reinvestment in our core business. Also contributing to the increase in same state cost of portal revenues was an increase in bank fees. A growing percentage of our non-DMV revenues are generated from online applications whereby users pay for information or transactions via credit cards. On these transactions, we must pay an associated fee to the bank that processes the credit card transaction. We earn a lower gross profit percentage on these transactions as compared to our other non-DMV applications. However, we anticipate these revenues and the associated credit card fees to continue to increase in the future, as these transactions contribute favorably to our operating income growth.
Our portal gross profit rate was 49% in 2005 and 2004. On a same state basis, our portal gross profit rate was 50%, down from 52% in 2004. While same state portal revenues grew by 17% in 2005, same state cost of portal revenues increased by approximately 20%, as further discussed above. Additionally, our new South Carolina and Colorado portal businesses earned a lower gross profit percentage in their first year of operations as compared to our other state portal businesses. New portal contract wins can have a short-term negative effect on our gross profit percentage in the start-up period of a portal as we incur costs to develop and implement the portal infrastructure prior to the time we begin to generate transaction revenues. We expect portal gross profit will be
35
similarly affected in the future if we are successful in winning new portal contracts. We carefully monitor our portal gross profit percentage in an effort to balance generating a solid financial return and delivering value to our government partners through reinvestment in our portals.
Cost of portal revenues in 2004 increased 15%, or approximately $3.3 million, over 2003. Of this increase, 15%, or approximately $3.1 million, was attributable to an increase in same state cost of portal revenues, and 4%, or approximately $0.8 million, was attributable to our newer state portal businesses, including Kentucky and Alabama. These increases were offset by a $0.7 million decrease in operating expenses from our local portals as a result of the continued wind down of certain of our unprofitable local portal businesses. Same state cost of portal revenues in 2004 increased 18%, or approximately $3.1 million, primarily as a result of the addition of personnel in several of our portals due to our continued growth and reinvestment in our core business. Also contributing to the increase in same state cost of portal revenues was an increase in bank fees, for reasons discussed above.
Our portal gross profit rate increased to 49% in 2004 from 46% in 2003. This increase was primarily attributable to a full year of operations in 2004 from our Kentucky portal, and to a modest improvement in our same state gross profit rate. On a same state basis, our portal gross profit rate was 50%, an increase of less than 1% from 2003. While same state portal revenues grew by 20% in 2004, same state cost of portal revenues increased by approximately 18%, as further discussed above.
SOFTWARE & SERVICES REVENUES. In the analysis below, we have categorized our software & services revenues by business (in thousands), with the corresponding percentage increase or decrease from the prior year period.
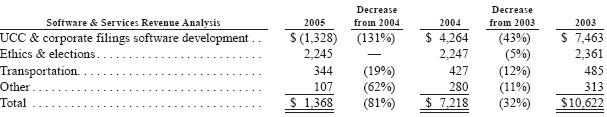
The decrease in software & services revenues in 2005 primarily reflects the first quarter 2005 adjustment under percentage of completion accounting relating to our contract with the California Secretary of State, which resulted in a $3.5 million reduction in software & services revenues, as further discussed in Note 2 in the Notes to Consolidated Financial Statements included in this Form 10-K. We recognize revenue on our contract with the California Secretary of State using the percentage of completion method as we make progress, utilizing costs incurred to date as compared to the estimated total cost for the contract. Software & services revenues in 2004 decreased 32%, or approximately $3.4 million, from 2003 primarily due to a decrease in revenues from our UCC & corporate filings software development business. We recognized approximately $4.1 million in revenue from our contract with the California Secretary of State in 2004 compared to $7.2 million in 2003.
COST OF SOFTWARE & SERVICES REVENUES. Cost of software & services revenues in 2005 includes a charge of $1.5 million due to the effect of the adjustment under percentage of completion accounting relating to our contract with the California Secretary of State as further discussed in Note 2 in the Notes to Consolidated Financial Statements included in this Form 10-K. The decrease in cost of software & services revenues in 2004 was mostly due to a decrease in project costs incurred on our contract with the California Secretary of State, and was relatively consistent with the corresponding decrease in project revenues as further discussed above. In addition, in the third quarter of 2004, we reversed approximately $0.4 million in loss accruals relating to our legacy business filing contracts in Arkansas and Oklahoma, as these contracts were expected to cost less to complete than our previous estimates. This adjustment positively affected our software & services gross profit rate for 2004. Additionally, in the first quarter of 2004, we reduced our expected profit margin on our contract with the California Secretary of State from approximately 6% to 4% due to an increase in estimated costs to complete the contract as a result of adding project management resources to the project. This margin adjustment adversely affected our software & services gross profit rate for 2004.
36
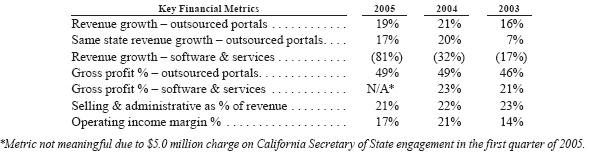
SELLING & ADMINISTRATIVE. Selling & administrative expenses as a percentage of revenue were 21%, 22% and 23% for 2005, 2004 and 2003, respectively. We expect selling & administrative costs as a percentage of revenues to continue to decline modestly as our revenues grow and our corporate expenses increase modestly year over year.
INTEREST INCOME. Interest income reflects interest earned on our cash and marketable securities portfolio. In 2005, we began investing our excess cash in short-term marketable debt securities, consisting primarily of auction rate government-backed obligations. Our marketable securities portfolio totaled $20.5 million at December 31, 2005. Rising short-term interest rates throughout 2005 also contributed to the increase in interest income earned on these investments.
EQUITY IN NET LOSS OF AFFILIATES. Equity in net loss of affiliates represents our share of losses of companies in which we have had equity method investments that give us the ability to exercise significant influence, but not control, over the investees. In the first quarter of 2000, we invested in two private companies involved in the eGovernment services industry, Tidemark and E-Filing, primarily for strategic purposes. In May 2001, a private technology company acquired Tidemark. We recognized a $0.3 million gain in the second quarter of 2003 relating to our previous equity investment in Tidemark. In May 2004, E-Filing repurchased the Company’s ownership interest in E-Filing for $535,000, which approximated the carrying value of the Company’s investment at the date of the repurchase. The Company had no investment balance remaining in E-Filing after the repurchase. At December 31, 2005 and 2004, we held no investments in affiliates or joint ventures accounted under the equity method.
INCOME TAXES. Our effective tax rate was approximately 42% in 2005, 40% in 2004 and 16% in 2003. Our income tax provision in 2003 was less than the amount customarily expected due primarily to deferred tax asset adjustments recorded in the fourth quarter of 2003 totaling a benefit of approximately $1.8 million as more fully described in Note 9 to the Notes to Consolidated Financial Statements included in this Form 10-K. Prospectively, we expect our effective tax rate to be between 40% and 42%.
Liquidity and Capital Resources
Net cash provided by operating activities was $21.2 million in 2005 compared to $14.6 million in 2004. This improvement was partially the result of a year-over-year increase in operating income, excluding non-cash charges and the $5.0 million adjustment on our contract with the California Secretary of State recorded under percentage of completion accounting, which did not affect operating cash flow in 2005. The effect of the adjustment relating to the California Secretary of State contract on our consolidated balance sheets was a reduction in unbilled revenues of approximately $3.5 million and an increase in application development contracts (a current liability) of approximately $1.5 million. The increase in accounts receivable and payable in the current period was partially attributable to a general increase in revenues across our portal businesses in 2005, including our South Carolina and Colorado portals (combined $2.1 million increase in accounts receivable and $1.9 million increase in accounts payable), which began to generate DMV revenues in June 2005 and October 2005, respectively. In addition, our Virginia portal entered into a contract amendment in late 2005 that required it to become the primary depositor of customer remittances, whereas customer remittances were previously deposited directly with the state. This change contributed to a $1.8 million increase in accounts receivable and a corresponding increase in accounts payable in 2005. Further, several of our state portals experienced an increase in fourth quarter tax payment processing from tax filing applications, including Idaho ($1.4 million increase in accounts receivable and $0.7 million increase in accounts payable) and Hawaii ($2.9 million increase in accounts payable), among others. Such tax payments are frequently made via ACH or credit cards at the end of the year, whereby we do not receive payment until after year-end. The majority of these tax receipts were remitted to our government partners in early January 2006.
Net cash provided by operating activities was $14.6 million in 2004 compared to $3.5 million in 2003. This improvement was primarily the result of approximately $6.1 million in milestone payments received from the California Secretary of State and a year-over-year improvement in our operating income, excluding non-cash charges. These payments from the California Secretary of State contributed to the decrease in unbilled revenues in 2004. We recognize revenues on this contract under percentage of completion accounting as progress is made on the project. However, we do not receive regular progress payments from the California Secretary of State, which
37
contributes to fairly significant fluctuations in unbilled revenues each reporting period. The increase in accrued expenses in 2004 was partially due to accrued subcontractor costs on this project, as we are not required to pay certain subcontractors until we receive major milestone payments under the contract. Approximately $1.0 million of the milestone payments received in 2004 were paid to certain subcontractors during the year. The decrease in accounts payable in 2004 was mainly attributable to the continued wind down of certain of our unprofitable local portal businesses during 2004, as further discussed above.
We have a history of unprofitable operations prior to 2003 primarily due to operating losses incurred in our software & services businesses. These losses generated significant federal and state tax net operating losses, or NOLs, as further discussed below. As a result of our NOL carryforwards, we are not currently paying federal income taxes, with the exception of minimal amounts relating to alternative minimum tax, and are only paying minimal amounts of state income taxes in certain states. This positively impacts our operating cash flow and will continue to positively impact our operating cash flow during the NOL carryforward periods. Based on our current projections, we expect to fully utilize our federal NOL carryforwards by the end of 2008. For the years ended December 31, 2005, 2004 and 2003, combined federal and state income tax payments totaled approximately $0.5 million, $0.5 million and $0.4 million, respectively.
We recognize revenue primarily from providing outsourced government portal services net of the transaction fees due to the government when the services are provided. The fees that the Company must remit to the government are accrued as accounts payable and accounts receivable at the time services are provided. As a result, trade accounts payable and accounts receivable reflect the gross amounts outstanding at the balance sheet dates. Gross billings for the years ended December 31, 2005 and 2004 were approximately $215.2million and $197.7 million, respectively. The Company calculates days sales outstanding by dividing trade accounts receivable at the balance sheet date by gross billings for the period and multiplying the resulting quotient by the number of days in that period. Days sales outstanding for the years ended December 31, 2005 and 2004 was 38 and 33, respectively.
We believe that working capital is an important measure of our short-term liquidity. Working capital, defined as current assets minus current liabilities, increased to $51.2 million at December 31, 2005 from $35.7 million at December 31, 2004. Our current ratio, defined as current assets divided by current liabilities, at December 31, 2005 was 2.6 compared to 2.7 at December 31, 2004. The increase in our working capital was primarily attributable to an increase in total cash and marketable securities as a result of the significant increase in our operating cash flow in 2005.
Cash used in investing activities in 2005 primarily reflects $20.5 million in net purchases of marketable debt securities in an effort to increase the investment income from our growing cash reserves, and $2.3 million of capital expenditures, which were for our new South Carolina and Colorado portals (approximately $0.9 million), in addition to normal fixed asset additions in our other outsourced portal business, including Web servers, purchased software and office furniture and equipment.
Investing activities in 2004 resulted in net cash used of $0.6 million, reflecting $1.2 million in capital expenditures, which were partially offset by the maturity of marketable securities and proceeds from the sale of our minority investment in E-Filing (as further discussed in Note 5 in the Notes to Consolidated Financial Statements included in this Form 10-K). Capital expenditures in 2004 were mainly attributable to computer equipment purchases relating to our move to a new data center for company-wide hosting and disaster recovery purposes, in addition to normal fixed asset additions in our portal business.
Investing activities in 2003 resulted in net cash used of $1.5 million for capital expenditures, which were primarily for normal fixed asset additions in our outsourced portal business, including Web servers, purchased software and office furniture and equipment.
Financing activities in 2005 resulted in net cash generated of approximately $7.8 million, reflecting a $3.0 million reduction in our cash collateral requirements under the financing arrangement that covers all of the Company’s outstanding letters of credit, as further discussed in Note 6 in the Notes to Consolidated Financial Statements included in this Form 10-K. Cash provided by financing activities in 2005 also reflects approximately $4.6 million in proceeds from the exercise of employee stock options and $0.1 million in proceeds from our employee stock purchase program. Although we cannot predict the annual amount of proceeds we expect to receive from employee stock options in the future, we expect that our employees will continue to exercise vested
38
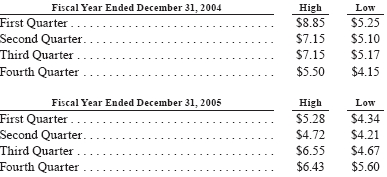
stock options that have intrinsic value. At December 31, 2005, approximately 1.1 million employee stock options were exercisable at a weighted average exercise price of $4.30 per share. The closing price of our common stock on December 30, 2005 was $6.16 per share.
Financing activities in 2004 resulted in net cash generated of approximately $3.3 million, reflecting a $2.4 million reduction in our cash collateral requirements under the financing arrangement that covered all of the Company’s outstanding letters of credit, term note payable, which was paid off in 2004, and working capital line of credit (as further discussed in Note 6 in the Notes to Consolidated Financial Statements included in this Form 10-K). Financing activities in 2004 also reflect $1.2 million in proceeds from the exercise of employee stock options and $0.1 million in proceeds from our employee stock purchase program.
Net cash provided by financing activities totaled approximately $2.0 million in 2003, primarily reflecting a $0.9 million decrease in restricted cash to collateralize a bank note payable and certain bank letters of credit issued on behalf of the Company, and $0.2 million in payments on the note payable. We received approximately $1.2 million in proceeds from the exercise of employee stock options and our employee stock purchase program.
At December 31, 2005, our total unrestricted cash and marketable securities balance was $57.4 million compared to $30.8 million at December 31, 2004. At December 31, 2004, we had posted $3.0 million in cash as collateral for bank letters of credit issued on behalf of the Company. However, as further discussed in Note 6 of the Notes to Consolidated Financial Statements included in this Form 10-K, in April 2005, the cash collateral requirements under our current banking agreement were eliminated, and we are no longer required to cash collateralize letters of credit. We issue letters of credit as collateral for performance on certain of our government contracts, as collateral for certain performance bonds, and as collateral for certain office leases. These irrevocable letters of credit are generally in force for one year. Our collateral requirements have eased over time as we have continued to operate profitably and grow our earnings. However, even though we expect to be profitable in fiscal 2005 and beyond, we may not be able to sustain or increase profitability on a quarterly or annual basis. We will need to generate sufficient revenues while containing costs and operating expenses if we are to achieve sustained profitability. If we are not able to sustain profitability, our cash collateral requirements may increase. Had we been required to post 100% cash collateral at December 31, 2005 for the face value of all performance bonds (which are partially supported by letters of credit) and our line of credit in conjunction with a corporate credit card agreement, unrestricted cash would have decreased and restricted cash would have increased by approximately $7.8 million.
We do not believe the $5.0 million charge we recorded in the first quarter of 2005 relating to the California Secretary of State project or the recent contract amendment that reduces the project scope will have a significant effect on our future liquidity. We believe that our currently available liquid resources and cash generated from operations will be sufficient to meet our operating requirements, capital expenditure requirements, and current growth initiatives for at least the next twelve months without the need of additional capital. However, we may need to raise additional capital before this period ends to further:
- fund operations if unforeseen costs arise, including the costs to fund our contract with the CaliforniaSecretary of State and subcontractors on that project;
- collateralize letters of credit, which we are required to post as collateral for performance on certainof our outsourced government portal contracts, as collateral for certain performance bonds, and ascollateral for certain office leases;
- support our expansion into other states and government agencies beyond what is contemplated ifunforeseen opportunities arise;
- expand our product and service offerings beyond what is contemplated if unforeseen opportunitiesarise;
- respond to unforeseen competitive pressures; and
- acquire technologies beyond what is contemplated.
39
Any projections of future earnings and cash flows are subject to substantial uncertainty. If our unrestricted cash, marketable securities and cash generated from operations are insufficient to satisfy our liquidity requirements, we may seek to sell additional equity securities, issue debt securities, or increase our working capital line of credit. The sale of additional equity securities could result in dilution to the Company’s shareholders. There can be no assurance that financing will be available in amounts or on terms acceptable to the Company, if at all.
At December 31, 2005, we were bound by performance bond commitments totaling approximately $7.3 million on certain government contracts. Of this amount, $5 million relates to the performance bond on our contract with the California Secretary of State, which is collateralized by a $5 million letter of credit. We have never had any defaults resulting in draws on performance bonds.
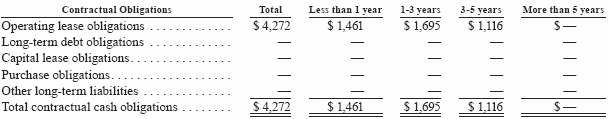
We do not have off-balance sheet arrangements or significant exposures to liabilities that are not recorded or disclosed in our financial statements. While we have significant operating lease commitments for office space, those commitments are generally tied to the period of performance under related contracts. The following table sets forth our future contractual obligations and commercial commitments as of December 31, 2005 (in thousands):
Deferred Tax Assets
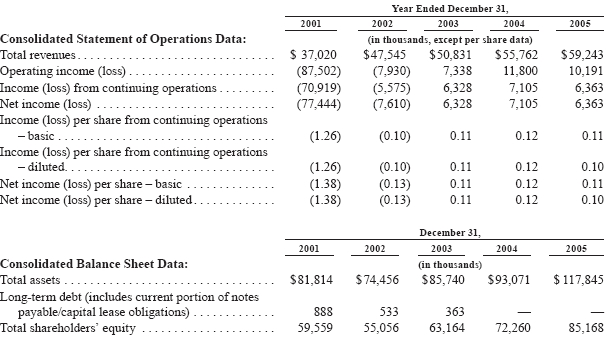
At December 31, 2005, we have recorded net deferred tax assets in accordance with Statement of Financial Accounting Standards No. 109, “Accounting for Income Taxes,” totaling approximately $29.3 million. We estimate that we must generate at least $72.4 million of future taxable income to realize those deferred tax assets. To achieve a sufficient level of future taxable income, we intend to continue to pursue our current strategy of adding new government partners, broadening our service offerings in our existing government portals, and increasing transactional revenues from our existing government portals. Based on information currently known to management, we believe it is more likely than not that the Company will realize the deferred tax assets. The table below reconciles income before income taxes for financial statement purposes with taxable income before net operating loss carryforwards for federal income tax purposes (in thousands):
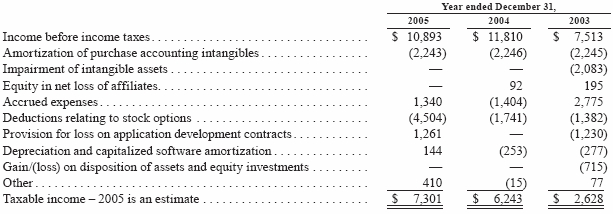
The taxable income for federal income tax purposes includes deductible temporary differences. As of December 31, 2005, our net deductible temporary differences, exclusive of net operating loss carryforwards, total approximately $34.8 million. Our federal income tax loss carryforward of approximately $55.2 million expires as follows: $17.8 million expires in 2020, $27.1 million expires in 2021 and $10.3 million expires in 2022. Our state
40
income tax loss carryforwards of approximately $48.7 million may be used over various periods ranging from 1 to 19 years. We are currently paying state income taxes in certain states. In addition, we are currently paying federal alternative minimum tax as a result of alternative minimum tax net operating loss deduction limits.
Recent Accounting Pronouncements
In December 2004, the Financial Accounting Standards Board issued Statement of Financial Accounting Standards (“SFAS”) No. 123R (revised 2004), “Share–Based Payment,” that requires companies to expense the grant-date fair value of stock options and other equity-based compensation issued to employees. SFAS No. 123R eliminates the use of the intrinsic value method prescribed in Accounting Principles Board Opinion (“APB”) No. 25, “Accounting for Stock Issued to Employees,” that we currently use to account for our stock-based compensation plans. SFAS No. 123R is effective for annual periods beginning after June 15, 2005. We will be required to adopt SFAS No. 123R in the first quarter of 2006. We currently expect to use the modified prospective transition method, which would not require us to restate our financial statements prior to the effective date of SFAS No. 123R. For vested stock option awards that are outstanding on January 1, 2006, the modified prospective method would not require us to record any additional compensation expense. For unvested stock option awards that are outstanding on January 1, 2006, awards that were previously included as part of the pro forma net income and earnings per share calculations of SFAS No. 123 would be charged to expense over the remaining vesting period, without any changes in measurement. For all new stock option awards that are granted or modified after January 1, 2006, we would use SFAS No. 123R’s measurement model, expense recognition, and settlement provisions. Based solely on the expected remaining unrecognized fair value of currently outstanding stock option awards we estimated for purposes of preparing our current SFAS No. 123 pro forma disclosures (see Note 2 in the Notes to Consolidated Financial Statements included in this Form 10-K), the effect of adopting SFAS No. 123R in 2006 on net income is expected to be approximately $0.6 million. We believe that equity-based compensation, like stock options, will continue to play an important role in supporting employee retention and providing individuals with long-term incentives to meet Company goals. We will consider granting stock options to Directors and employees in the future with exercise prices equal to then current market prices.
As further discussed in Note 2 of the Notes to Consolidated Financial Statements included in this Form 10-K, on October 26, 2005, our Board of Directors approved the acceleration of vesting of all unvested options to purchase common stock of the Company that had an exercise price that was greater than the market price on that date. The closing price of our common stock on the Nasdaq National Market on October 26, 2005 was $5.63 per share. As a condition of the acceleration and to prevent unintended personal benefit, the Company’s Directors, executive officers and employees must refrain from selling common stock acquired upon the exercise of accelerated options until the original vesting date or, if earlier, termination of employment with or service to the Company. All other terms and conditions applicable to such options, including exercise prices, remain unchanged. This action resulted in the accelerated vesting of options to purchase 163,873 shares of common stock of the Company, or approximately six percent of the total of all then outstanding Company options.
We accelerated the vesting of these options because we believed it was in the best interest of our shareholders to reduce future compensation expense that we would otherwise be required to report in our statement of income upon adoption of SFAS No. 123R in the first quarter of 2006. Further, because the options had exercise prices in excess of the current market price, they are viewed to have limited economic value and are not fully achieving their objective of incentive compensation and retention. Currently, we account for stock options using the intrinsic value method prescribed in APB No. 25 and provide pro forma footnote disclosure of the compensation expense associated with stock options as if we had applied the fair value recognition provisions of SFAS No. 123. As a result of the vesting acceleration, approximately $0.5 million in aggregate future expense will be eliminated over the next three fiscal years. The vesting acceleration did not result in compensation expense in the Company’s statement of income, but is reflected as additional stock-based employee compensation expense in the calculation of 2005 pro forma earnings in Note 2 in the Notes to Consolidated Financial Statements included in this Form 10-K.
41
ITEM 7A. QUANTITATIVE AND QUALITATIVE DISCLOSURES ABOUT MARKET RISK
INTEREST RATE RISK. Our exposure to market risk for changes in interest rates relates to the increase or decrease in the amount of interest income we can earn on our short-term investments in marketable debt securities and cash balances. Because our investments are in short-term, investment-grade, interest-bearing marketable securities, we are exposed to minimal risk on the principal of those investments. We limit our exposure to credit loss by depositing our cash with high credit quality financial institutions. We enhance the safety and preservation of our invested principal funds by attempting to limit default risk, market risk and investment risk. We do not use derivative financial instruments. A 10% change in interest rates would not have a material effect on our financial condition, results of operations or cash flows.
42
ITEM 8. CONSOLIDATED FINANCIAL STATEMENTS AND SUPPLEMENTARY DATA
NIC INC.
CONSOLIDATED BALANCE SHEETS
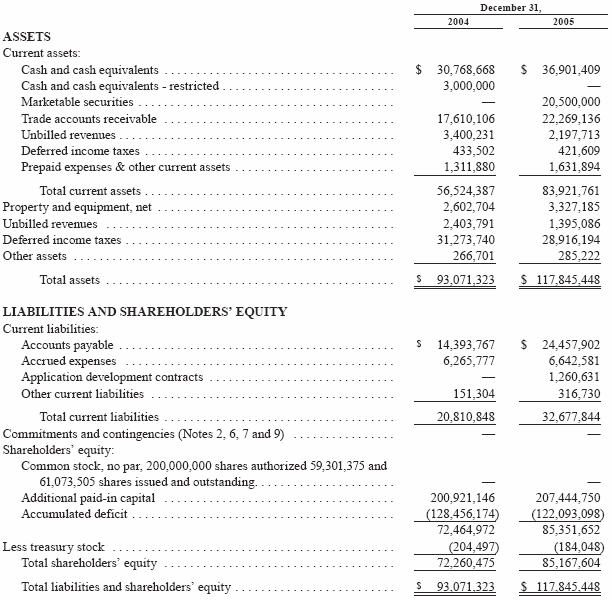
The accompanying notes are an integral part of these consolidated financial statements.
43
NIC INC.
CONSOLIDATED STATEMENTS OF INCOME
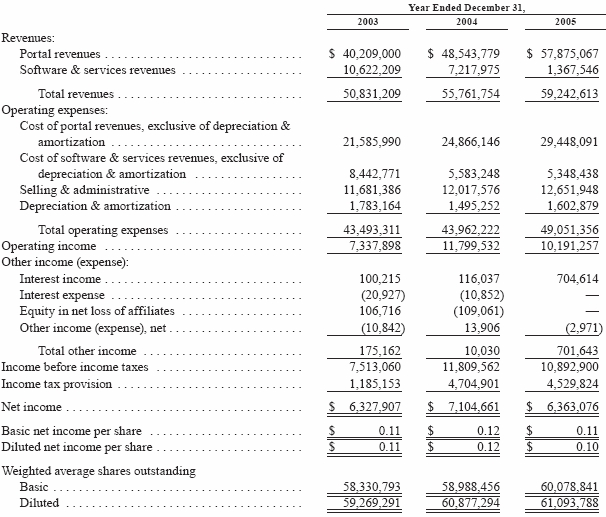
The accompanying notes are an integral part of these consolidated financial statements.
44
NIC INC.
CONSOLIDATED STATEMENTS OF CHANGES IN SHAREHOLDERS’ EQUITY
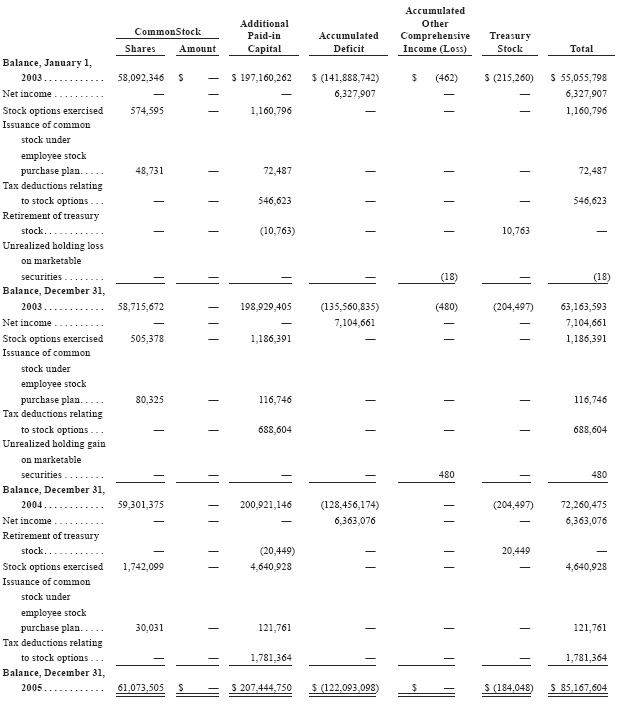
The accompanying notes are an integral part of these consolidated financial statements.
45
NIC INC.
CONSOLIDATED STATEMENTS OF CASH FLOWS
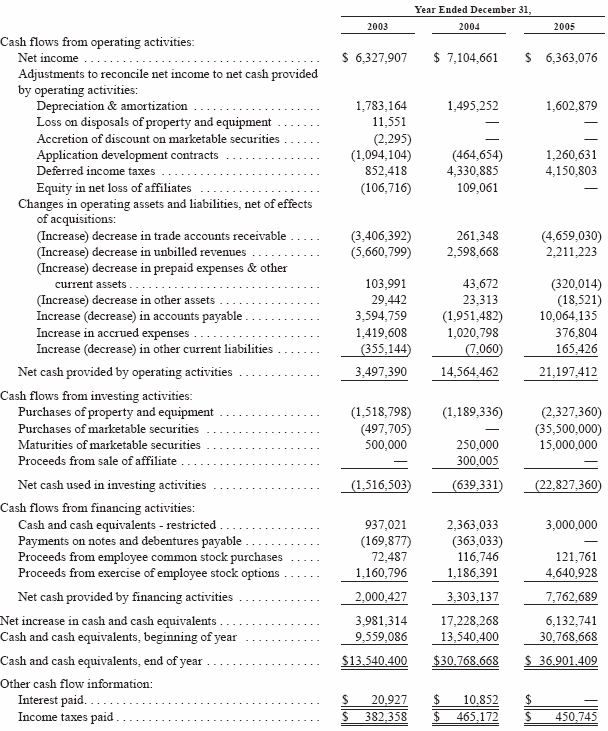
The accompanying notes are an integral part of these consolidated financial statements.
46
NIC INC.
NOTES TO CONSOLIDATED FINANCIAL STATEMENTS
1. THE COMPANY AND BASIS OF PRESENTATION
The Company
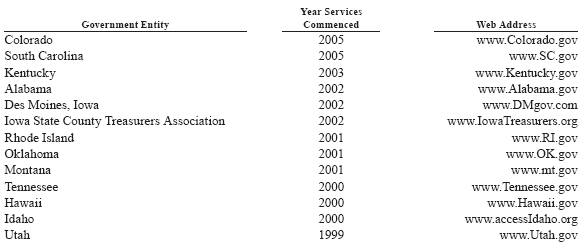
NIC Inc. (the “Company” or “NIC”), formerly National Information Consortium, Inc., is a provider of eGovernment services that helps governments use the Internet to reduce costs and provide a higher level of service to businesses and citizens. The Company accomplishes this currently through two divisions: its primary portal outsourcing businesses and its software & services businesses.
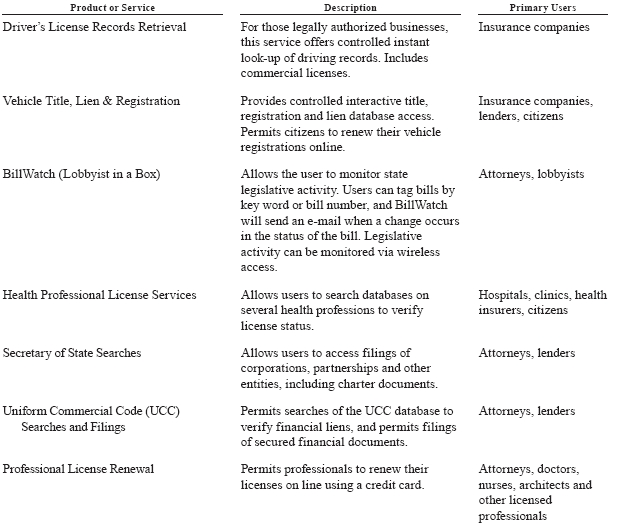
In its primary portal outsourcing business, the Company designs, builds and operates Internet-based portals on behalf of state and local governments desiring to provide access to government information and to complete government-based transactions online. These portals consist of Web sites and applications the Company has built that allow businesses and citizens to access government information online and complete transactions, including applying for a permit, retrieving driver’s license records or filing a government-mandated form or report.Operating under multiple-year contracts (see Note 3), NIC markets the services and solicits users to complete government-based transactions and to enter into subscriber contracts permitting users to access the portal and the government information contained therein in exchange for transactional and/or subscription user fees. The Company manages operations for each contractual relationship through separate local subsidiaries that operate as decentralized businesses with a high degree of autonomy. The Company’s self-funding business model allows it to reduce its government partners’ financial and technology risks and generate revenues by sharing in the fees the Company collects from eGovernment transactions. The Company’s government partners benefit through gaining a centralized, customer-focused presence on the Internet, while businesses and citizens receive a faster, more convenient and more cost-effective means to interact with governments. The Company is typically responsible for funding up front investment and ongoing operational costs of the outsourced government portals. In July 1999, the Company completed its initial public offering of common stock.
The Company’s software & services businesses primarily include its UCC and corporate filings software development business and its ethics & elections business. The Company’s UCC and corporate filings software development business, NIC Conquest, is a provider of software applications and services for electronic filings and document management solutions for governments. This business focuses on Secretaries of State, whose offices are state governments’ principal agencies for UCC and corporate filings. Currently, NIC Conquest is primarily engaged in servicing its contract with the California Secretary of State and is not actively marketing its applications and services in respect of new engagements. The Company’s ethics & elections business, NIC Technologies, designs and develops online campaign expenditure and ethics compliance systems for federal and state government agencies. Currently, NIC Technologies is primarily engaged in servicing its contracts with the Federal Election Commission and the State of Michigan. The Company’s transportation business, IDT, is a provider of business-to-government reporting and filing software for the transportation industry. In 2002, the Company decided to wind down substantially all of IDT’s operations. The Company may incur costs in future periods to exit this business. However, the Company does not believe these costs will have a material adverse affect on the Company’s financial condition, results of operations or liquidity.
Basis of presentation
The Company classifies its revenues and cost of revenues into two categories: (1) portal and (2) software & services. The portal category includes revenues from the Company’s subsidiaries operating government portals under long-term contracts on an outsourced basis. The software & services category includes revenues primarily from the Company’s software & services businesses. The primary categories of operating expenses include: cost of portal revenues, cost of software & services revenues, selling & administrative, and depreciation & amortization. Cost of portal revenues consist of all direct costs associated with operating government portals on an outsourced basis including employee compensation, telecommunications and all other costs associated with the provision of dedicated client service such as dedicated facilities. Cost of software & services revenues consist of all direct project costs to provide software development and services such as employee compensation, subcontractor labor costs, and all other direct project costs including hardware, software, materials, travel and
47
other out-of-pocket expenses. Selling & administrative costs consist primarily of corporate-level expenses relating to human resource management, administration, information technology, legal and finance, and all costs of non-customer service personnel from the Company’s software & services businesses, including information systems and office rent. Selling & administrative costs also consist of corporate-level expenses for market development and public relations.
2. SUMMARY OF SIGNIFICANT ACCOUNTING POLICIES
Basis of consolidation
The accompanying consolidated financial statements consolidate the Company together with all of its direct and indirect wholly owned subsidiaries. All intercompany balances and transactions have been eliminated.
Cash and cash equivalents
Cash and cash equivalents primarily include cash on hand in the form of bank deposits and money market funds. For purposes of the consolidated balance sheets and consolidated statements of cash flows, the Company considers all non-restricted highly liquid instruments purchased with an original maturity of one month or less to be cash equivalents.
Cash and cash equivalents – restricted
Cash and cash equivalents – restricted consists of bank deposits and money market funds that have been segregated to collateralize primarily bank letters of credit issued on behalf of the Company.
Marketable securities
The Company’s marketable securities at December 31, 2005 were classified as available-for-sale and consisted of short-term auction rate government-backed obligations. These investments are stated at fair value with any unrealized holding gains or losses included as a component of shareholders’ equity as accumulated other comprehensive income or loss until realized. The cost of securities sold is based on the specific identification method. The fair values of the Company’s marketable securities are based on quoted market prices at the reporting date. Gross realized gains and losses and unrealized holding gains and losses through December 31, 2005 were not significant.
Unbilled revenues
Unbilled revenues consist of revenues earned in excess of billings under long-term application development contracts accounted for under the percentage of completion method relating to the Company’s UCC and corporate filings software development business and revenues earned in excess of billings relating to the Company’s ethics & elections business. Unbilled revenues arise when revenues have been recorded but the amounts cannot be billed under the terms of the contracts. Such amounts are recoverable from customers upon various measures of performance including, among others, achievement of certain milestones and completion of services during a specified period.
At each balance sheet date, the Company makes a determination as to the portion of the unbilled receivable relating to the Company’s long-term application development contracts that will be collected within one year and records that amount as a current asset in the consolidated balance sheets. The remainder of the receivable, if any, is classified as a long-term asset. All unbilled revenues relating to the Company’s ethics & elections business are collectible within one year of the balance sheet dates and have been classified as a current asset.
Unbilled revenues relating to the Company’s contract with the California Secretary of State at December 31, 2004 and 2005 were approximately $5.6 million and $3.4 million. Unbilled revenues relating to the Company’s ethics & election business at both December 31, 2004 and 2005 were $0.2 million.
48
Property and equipment
Property and equipment are carried at cost less accumulated depreciation. Depreciation is computed using the straight-line method over estimated useful lives of 8 years for furniture and fixtures, 3-10 years for equipment, 3-5 years for purchased software and the lesser of the term of the lease or 5 years for leasehold improvements. When assets are retired or otherwise disposed of, the cost and related accumulated depreciation are removed from the accounts and any resulting gain or loss is included in results of operations for the period. The cost of maintenance and repairs is charged to expense as incurred; significant renewals and betterments are capitalized.
The Company periodically evaluates the carrying value of property and equipment to be held and used when events and circumstances warrant such a review. The carrying value of property and equipment is considered impaired when the anticipated undiscounted cash flows from the asset is separately identifiable and is less than its carrying value. In that event, a loss is recognized based on the amount by which the carrying value exceeds the fair value of the asset. Fair value is determined primarily using the anticipated cash flows discounted at a rate commensurate with the risk involved. Losses on assets to be disposed of are determined in a similar manner, except that fair values are reduced for the cost to dispose.
Software development costs and intangible assets
The Company expenses as incurred all employee costs to start up, operate and maintain government portals on an outsourced basis as costs of performance under the contracts because, after the completion of a defined contract term, the government entities with which the Company contracts typically receive a perpetual, royalty-free license to the applications the Company developed. Such costs are included in cost of portal revenues in the consolidated statements of income.
The Company accounts for the costs of developing internal use computer software in accordance with the American Institute of Certified Public Accountants Statement of Position (“SOP”) 98-1, “Accounting for the Costs of Computer Software Developed or Obtained for Internal Use” and Emerging Issues Task Force (“EITF”) Issue 00-2, “Accounting for Website Development Costs.”Costs capitalized pursuant to EITF Issue 00-2 would be included as part of the total of internal use software development costs capitalized pursuant to SOP 98-1.
The net carrying value of intangible assets at December 31, 2004 and 2005 was not significant and was included in other long-term assets in the consolidated balance sheets. At December 31, 2005, intangible assets consisted primarily of capitalized internal use software development costs and were not yet being amortized.
At each balance sheet date, or whenever events or changes in circumstances warrant, the Company assesses the carrying value of intangible assets for possible impairment based primarily on the ability to recover the balances from expected future cash flows on an undiscounted basis. If the sum of the expected future cash flows on an undiscounted basis were to be less than the carrying amount of the intangible asset, an impairment loss would be recognized for the amount by which the carrying value of the intangible asset exceeds its estimated fair value. There is considerable management judgment necessary to determine future cash flows, and accordingly, actual results could vary significantly from such estimates.
Revenue recognition
Portal revenues
The Company recognizes revenue from providing outsourced government portal services (primarily transaction-based information access fees and filing fees) net of the transaction fees due to the government when the services are provided. The fees that the Company must remit to state agencies for data access and other statutory fees are accrued as accounts payable at the time services are provided. The Company must remit a certain amount or percentage of these fees to government agencies regardless of whether the Company ultimately collects the fees. As a result, trade accounts receivable and accounts payable reflect the gross amounts outstanding at the balance sheet dates.
Revenue from service contracts to provide portal consulting, application development and management services to governments is recognized as the services are provided at rates provided for in the contract.
49
Software & services revenues
The Company’s UCC and corporate filings software development business recognizes revenues from fixed-fee, long-term application development contracts on the percentage of completion method, utilizing costs incurred to date as compared to the estimated total costs for each contract, following the guidance outlined in Alternative B as set forth in paragraph .81 of SOP 81-1, “Accounting for Performance of Construction-Type and Certain Production-Type Contracts.” The Company primarily includes internal labor and subcontractor labor costs in actual and estimated total costs for purposes of determining the percentage of completion for each contract. The Company also includes costs for hardware and software provided directly to the customer as part of the system and other direct project costs such as travel in actual and estimated total costs, but does not include such costs for determining the percentage of completion for each contract. The Company recognizes revenue and expenses for such costs with no associated profit margin. Contract revenues and estimated costs to complete are adjusted to reflect change orders when approved by the customer and the Company regarding both scope and price. Revenues and profits from these contracts are based on the Company’s estimates to complete and are reviewed periodically, with adjustments recorded in the period in which the revisions are made. Any anticipated contract losses are charged to operations as soon as determinable.
In September 2001, NICUSA and the Company’s NIC Conquest subsidiary were awarded a five-year, $25 million contract by the California Secretary of State (the “California SOS”) to develop and implement a comprehensive information management and filing system. Revenues are recognized on the California SOS contract using the percentage of completion method utilizing costs incurred to date as compared to the estimated costs for the contract, as further described above. The Company believes costs incurred are a more representative measure of project progress than either the completion of billing or significant project milestones, as most of the significant milestone payments under this contract are concentrated toward the latter half of the project and do not appropriately reflect project progress and project costs incurred, especially in between milestone payment dates. The contract contains early termination clauses that give the California SOS the right to terminate early including, among others, termination for non-appropriation of funds and termination for convenience. Such early termination clauses are generally standard in most government contracts and are not unique to the Company’s contract with the California SOS. However, in the event the contract is terminated for non-appropriation of funds, the Company would be required to take back any affected goods furnished under the contract and to relieve the California SOS of any further obligations therefrom. The Company does not recognize revenues in excess of what has been appropriated for the project. If the contract is terminated for the convenience of the State, the parties are to negotiate a settlement, which the Company believes would include billed and unbilled receivables for goods, manufacturing materials and/or services performed or delivered under the contract.
Prior to the first quarter of 2005, key elements of the Company’s obligations under the California SOS contract were subcontracted to various third parties under fixed price contracts. At the end of the first quarter of 2005, as a result of system delivery issues and the concern over the ability of one of the two remaining subcontractors to meet the criteria set forth by the California SOS, the Company determined it would assume the lead project manager role on the contract, which was previously performed by this subcontractor. As a result of this change, the Company further evaluated the status of the project and concluded that a further modification to the management and oversight structure of the project was necessary to improve performance under the contract and that additional internal project management and technical personnel would be required on the engagement. The Company also reevaluated the expected completion date of the project, which was previously estimated to be in the first quarter of 2006, and determined to revise the estimated completion date to the end of 2006. As a result of the Company’s decision to commit these additional resources and the extension of the expected project completion date, the Company recorded a $5.0 million adjustment under percentage of completion accounting in the first quarter of 2005, as the Company expected to incur a loss of approximately $4.2 million on this project, instead of a previously projected profit of approximately $1.0 million.
The effect of the adjustment under percentage of completion accounting in the Company’s consolidated statements of income resulted in a reduction of software & services revenues of approximately $3.5 million and an increase in cost of software & services revenues of approximately $1.5 million. The effect of the adjustment in the Company’s consolidated balance sheets was a reduction in unbilled revenues of approximately $3.5 million and an increase in application development contracts (a current liability) of approximately $1.5 million.
50
On March 13, 2006, the Company and the California SOS entered into an amendment to the contract as further discussed in Note 13.
The Company’s ethics & elections and transportation businesses recognize revenues from professional services as the services are provided. Software maintenance revenues are recognized ratably over the term of the support contract, typically one year. The Company’s ethics & elections business has entered into contracts with the state of Michigan and the Federal Election Commission that contain general fiscal funding clauses. The Company recognizes revenue under these contracts if the probability of cancellation is determined to be a remote contingency.
Stock-based compensation
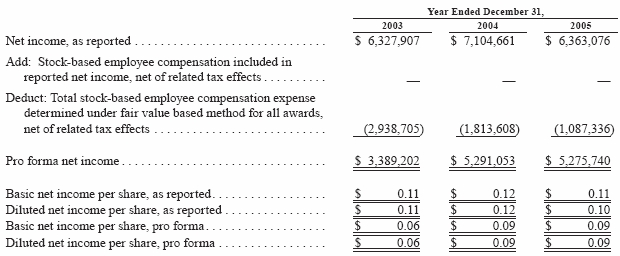
The Company accounts for its stock-based compensation plans, which are described more fully in Note 10, using the intrinsic value method prescribed in Accounting Principles Board Opinion (“APB”) No. 25, “Accounting for Stock Issued to Employees.” Accordingly, the Company records as compensation expense the amount by which the fair value of common stock sold to employees exceeds the amount paid. Any excess of fair value of the price of the Company’s common stock over the exercise price for options granted to employees or nonemployee directors is recorded as deferred compensation expense within shareholders’ equity and amortized as stock compensation expense ratably over the vesting period. The following table illustrates the effect on net income and net income per share if the Company had applied the fair value recognition provisions of Statement of Financial Accounting Standards (“SFAS”) No. 123, “Accounting for Stock-Based Compensation,” to stock-based employee compensation.
The fair value of each option grant was determined using the Black-Scholes option-pricing model. The following assumptions were applied in determining pro forma compensation cost for the years ended December 31, 2003, 2004 and 2005:

The Black-Scholes model was not developed for use in valuing employee stock options, but was developed for use in estimating the fair value of traded options that have no vesting restrictions and are fully transferable. In addition, it requires the use of subjective assumptions including expectations of future dividends and stock price volatility. Such assumptions are only used for making the required fair value estimate and should not be considered as indicators of future dividend policy or stock price appreciation. Because changes in the subjective
51
assumptions can materially affect the fair value estimate and because employee stock options have characteristics significantly different from those of traded options, the use of the Black-Scholes option-pricing model may not provide a reliable estimate of the fair value of employee stock options.
For purposes of this pro forma disclosure, the estimated fair value of options is amortized to expense over the option vesting periods. Such pro forma impact on net income and basic and diluted net income per share is not necessarily indicative of future effects on net income or earnings per share.
In December 2004, the Financial Accounting Standards Board issued SFAS No. 123R (revised 2004), “Share–Based Payment,” that requires companies to expense the grant-date fair value of stock options and other equity-based compensation issued to employees. SFAS No. 123R eliminates the use of the intrinsic value method prescribed in APB No. 25 that the Company currently uses to account for its stock-based compensation plans. SFAS No. 123R is effective for annual periods beginning after June 15, 2005. The Company will be required to adopt SFAS No. 123R in the first quarter of 2006. The Company currently expects to use the modified prospective transition method, which would not require the Company to restate its financial statements prior to the effective date of SFAS No. 123R. For vested stock option awards that are outstanding on January 1, 2006, the modified prospective method would not require the Company to record any additional compensation expense. For unvested stock option awards that are outstanding on January 1, 2006, awards that were previously included as part of the pro forma net income and earnings per share calculations of SFAS No. 123 would be charged to expense over the remaining vesting period, without any changes in measurement. For all new stock option awards that are granted or modified after January 1, 2006, the Company would use SFAS No. 123R’s measurement model, expense recognition, and settlement provisions. Based solely on the expected remaining unrecognized fair value of currently outstanding stock option awards the Company estimated for purposes of preparing its current SFAS No. 123 pro forma disclosures above, the effect of adopting SFAS No. 123R in 2006 on net income is expected to be approximately $0.6 million. The Company believes that equity-based compensation, like stock options, will continue to play an important role in supporting employee retention and providing individuals with long-term incentives to meet Company goals. The Company will consider granting stock options to Directors and employees in the future with exercise prices equal to then current market prices.
On October 26, 2005, the Board of Directors of the Company approved the acceleration of vesting of all unvested options to purchase common stock of the Company that had an exercise price that was greater than the market price on that date. The closing price of the Company’s common stock on the Nasdaq National Market on October 26, 2005 was $5.63 per share. As a condition of the acceleration and to prevent unintended personal benefit, the Company’s Directors, executive officers and employees must refrain from selling common stock acquired upon the exercise of accelerated options until the original vesting date or, if earlier, termination of employment with or service to the Company. All other terms and conditions applicable to such options, including exercise prices, remain unchanged. This action resulted in the accelerated vesting of options to purchase 163,873 shares of common stock of the Company, or approximately six percent of the total of all then outstanding Company options. Of this amount, 142,500 options had been granted to either directors or executive officers of the Company.
The Company accelerated the vesting of these options because it believed it was in the best interest of its shareholders to reduce future compensation expense that the Company would otherwise be required to report in its statement of income upon adoption of SFAS No. 123R in the first quarter of 2006. Further, because the options have exercise prices in excess of the current market price, they are viewed to have limited economic value and are not fully achieving their objective of incentive compensation and retention. As a result of the vesting acceleration, approximately $0.5 million in aggregate future expense will be eliminated over the next three fiscal years. The vesting acceleration did not result in compensation expense in the Company’s statement of income, but is reflected as additional stock-based employee compensation expense in the calculation of 2005 pro forma earnings above.
Income taxes
The Company, along with its wholly owned subsidiaries, files a consolidated federal income tax return. Deferred income taxes are recognized for the tax consequences in future years of differences between the tax basis of assets and liabilities and their financial reporting amounts at each year-end based on enacted laws and statutory tax rates applicable to the periods in which the differences are expected to affect taxable income. Valuation allowances are established, when necessary, to reduce deferred tax assets to the amount expected to be realized.
52
Comprehensive income
The Company has no material components of other comprehensive income or loss and, accordingly, the Company’s comprehensive income is approximately the same as its net income for all periods presented.
Earnings per share
Basic earnings per share are calculated on the basis of the weighted average number of common shares outstanding during the period. Diluted earnings per share are calculated on the basis of the weighted average number of common shares outstanding during the period and common stock equivalents that would arise from the exercise of employee common stock options and common stock warrants using the treasury stock method. The following table sets forth the computation of basic and diluted earnings per share for the years ended December 31, 2003, 2004 and 2005:
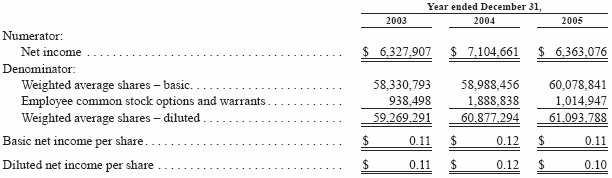
Outstanding employee common stock options totaling 1.8 million common shares and outstanding common stock warrants issued to AOL totaling 0.6 million common shares during the year ended December 31, 2003, were not included in the computation of diluted weighted average shares outstanding because their exercise prices were in excess of the average stock price of the Company during the period. Outstanding employee common stock options totaling 0.7 million and 0.6 million common shares during the years ended December 31, 2004 and 2005, respectively, were not included in the computation of diluted weighted average shares outstanding because their exercise prices were in excess of the average stock price of the Company during the periods.
Concentration of credit risk
Financial instruments that potentially subject the Company to significant concentrations of credit risk consist primarily of cash and cash equivalents, marketable securities and accounts receivable. The Company limits its exposure to credit loss by depositing its cash and cash equivalents with high credit quality financial institutions. The Company is subject to concentrations of credit risk and interest rate risk related to its short-term marketable securities. The Company’s credit risk is managed by limiting the amount of investments placed with any one issuer, investing primarily in government-backed debt instruments with maturities of less than one year. The Company performs ongoing credit evaluations of its customers and generally requires no collateral to secure accounts receivable. Due to the high credit worthiness of the Company’s customers, consisting mainly of data resellers, insurance companies and governmental entities, the Company considers accounts receivable to be fully collectible. Accordingly, no allowance for doubtful accounts has been recorded.
Segment reporting
The Company reports segment information in accordance with SFAS No. 131, “Disclosures about Segments of an Enterprise and Related Information.” SFAS No. 131 uses the “management” approach, which designates the internal organization that is used by management for making operating decisions and assessing performance as the source of the Company’s segments. SFAS No. 131 also requires disclosures about products and services and major customers. See Note 12.
53
Use of estimates The preparation of financial statements in conformity with generally accepted accounting principles requires management to make estimates and assumptions that affect the reported amounts of assets and liabilities and disclosure of contingent assets and liabilities at the date of the financial statements and the reported amounts of revenues and expenses during the reporting period. Actual results could differ from those estimates.
Reclassifications
Certain prior year amounts have been reclassified to conform to the current year presentation.
3. OUTSOURCED GOVERNMENT PORTAL CONTRACTS
Each of the Company’s outsourced government portal contracts generally has an initial term of three to five years with provisions for renewals for various periods at the option of the government. The Company’s primary business obligation under these contracts is to design, build and operate Internet-based portals on behalf of governments desiring to provide access to government information and to complete government-based transactions online. NIC typically markets the services and solicits users to complete government-based transactions and to enter into subscriber contracts permitting the user to access the portal and the government information contained therein in exchange for transactional and/or subscription user fees. The Company is typically responsible for funding up front investment and ongoing operational costs of the government portals. The Company enters into separate agreements with various agencies and divisions of the government to provide specific services and to conduct specific transactions. These agreements preliminarily establish the pricing of the electronic transactions and data access services the Company provides and the division of revenues between the Company and the government agency. The government must approve prices and revenue sharing agreements. The Company generally owns all the applications developed under these contracts. After completion of a defined contract term, the government agency typically receives a perpetual, royalty-free license to the applications for use only. If the Company’s contract were not renewed after a defined term, the government agency would be entitled to take over the portal in place with no future obligation of the Company. In a few instances, the Company has entered into contracts to provide portal consulting, development and management services to governments in exchange for an agreed-upon fee. Under a typical portal contract, the Company is required to fully indemnify its government clients against claims that the Company’s services infringe upon the intellectual property rights of others and against claims arising from the Company’s performance or the performance of the Company’s subcontractors under the contract. The Company has never experienced such claims.
54
The following is a summary of the Company’s eighteen outsourced state government portal contracts that are primarily funded with transaction fees paid by users at December 31, 2005: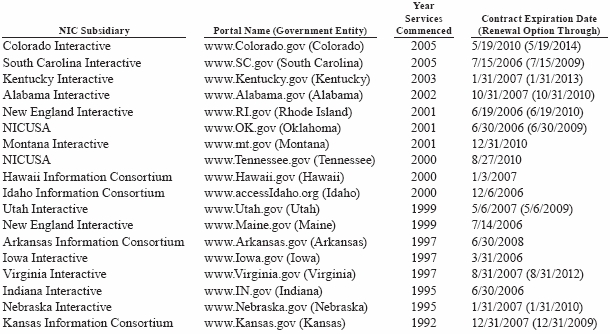
55
4. PROPERTY AND EQUIPMENT
Property and equipment consisted of the following at December 31:
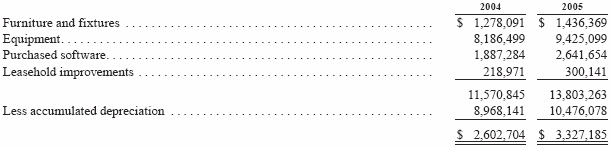
Depreciation expense for the years ended December 31, 2003, 2004 and 2005, was $1,640,638, $1,438,253 and $1,602,879, respectively.
5. INVESTMENTS IN AFFILIATES AND JOINT VENTURES
In March 2000, NIC completed a $5 million cash investment in E-Filing.com, Inc. (“E-Filing”), a provider of online filing applications for legal services, giving NIC ownership of 21% of E-Filing, a non-pubic company, through 2,433,800 shares of Series A voting Preferred Stock. The investment was accounted for under the equity method. In May 2004, E-Filing repurchased the Company’s ownership interest in E-Filing for $535,000, which approximated the carrying value of the Company’s investment at the date of the repurchase. The Company received approximately $300,000 in cash and a $235,000 subordinated promissory note with principal plus 5% interest payable annually in three equal installments on each of the first, second and third anniversary dates of the issuance of the note. The Company had no investment balance remaining in E-Filing after the repurchase. At December 31, 2004 and 2005, the balance of the promissory note was $235,000 and $157,000, respectively.
6. DEBT OBLIGATIONS AND COLLATERAL REQUIREMENTS
The Company issues letters of credit as collateral for performance on certain of its outsourced government portal contracts, as collateral for certain performance bonds and as collateral for certain office leases. These irrevocable letters of credit are generally in force for one year, for which the Company pays bank fees of approximately 1.25% to 1.5% of face value per annum. In total, the Company and its subsidiaries had unused outstanding letters of credit of approximately $6.4 million and $5.4 million at December 31, 2004 and 2005, respectively.
The Company has a $500,000 working capital line of credit, which was unused at December 31, 2004 and 2005.
At December 31, 2004, the Company had pledged $3.0 million of its cash as collateral under the financing arrangement that covers the Company’s outstanding letters of credit and working capital line of credit, and had given the issuing bank a security interest in certain of its accounts receivable and other assets. The Company classifies cash used for collateral purposes as restricted in its consolidated balance sheets. In April 2005, the Company’s collateral requirements under its current banking agreement were eliminated, and the Company is no longer required to collateralize letters of credit.
The Company has a $500,000 line of credit with a separate bank in conjunction with a corporate credit card agreement.
In August 2001, the Company borrowed $1.0 million from a bank in the form of a promissory note payable to finance the purchase of certain hardware and software components for its discontinued eProcurement business. In July 2004, the Company paid off the note in full and had no balance remaining.
56
7. COMMITMENTS AND CONTINGENCIES
Operating leases
The Company and its subsidiaries lease office space and certain equipment under noncancellable operating leases. Future minimum lease payments under all noncancellable operating leases at December 31, 2005 are as follows:
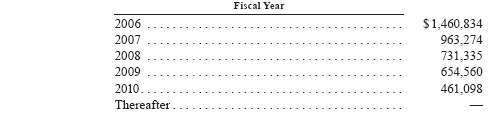
Rent expense for operating leases for the years ended December 31, 2003, 2004 and 2005 was approximately $1,603,000, $1,491,000 and $1,538,000, respectively.
Litigation
The Company is involved from time to time in legal proceedings and litigation arising in the ordinary course of business. However, the Company is not currently involved with any legal proceedings.
8. SHAREHOLDERS’ EQUITY
Common stock
On June 30, 1998, the Company and the National Information Consortium Voting Trust (the “Voting Trust”) consisting of all the Company’s then current shareholders entered into a stock purchase agreement for the Company’s shareholders to sell a 25% interest in the Company to an investment management firm. The Company did not receive any of the proceeds from the sale. Under the Voting Trust agreement, two principal shareholders have the right to vote all of the Voting Trust’s common shares and to sell all or any part of such shares. In 2003, the Voting Trust distributed 5% of its shares of NIC common stock to its members. In January 2005, the Voting Trust distributed 10% of its shares of NIC common stock to its members. At December 31, 2004 and 2005, the Voting Trust held approximately 26.1 million shares and 23.5 million shares, respectively, of NIC common stock. In January 2006, the Voting Trust sold 2.0 million shares of NIC common stock in the open market. After this sale, the Voting Trust held approximately 21.5 million shares of NIC common stock.
Common stock transactions and additional paid-in capital
As a condition of separation and severance from the Company in the second quarter of 2002, a former executive had the right to request the Company to repurchase all of the shares of the Company’s common stock, totaling 149,488 shares, beneficially owned by the former executive that were held of record in the Voting Trust for $1.44 per share. In October 2002, the former executive exercised this right and caused the Company to repurchase his Voting Trust units for $215,260. The shares of NIC common stock represented by the Voting Trust Units have been recorded as treasury stock in the consolidated balance sheets. In 2003, the Voting Trust distributed 5% of its shares of NIC common stock to its members. This affected 7,474 shares of NIC common stock held by the Company as treasury stock. The Company retired these shares in 2003, which had an assigned value of $10,763. At December 31, 2004, the Company had 142,014 shares remaining in treasury stock. In 2005, the Voting Trust distributed 10% of its shares of NIC common stock to its members. This affected 14,201 shares of NIC common stock held by the Company as treasury stock. The Company retired these shares in February 2005, which had an assigned value of $20,449, and had 127,813 shares remaining in treasury stock at December 31, 2005. In January 2006, the Voting Trust sold 2.0 million shares of NIC common stock in the open market. This affected 11,100
57
shares of NIC common stock held by the Company as treasury stock. The Company received $64,965 in proceeds from the sale. These shares had an assigned value of $15,984, which was credited to treasury stock, with the remaining $48,981 credited directly to additional paid-in capital.
During 2003, 2004 and 2005, certain employees and directors of the Company exercised non-qualified stock options. As a result, the Company received federal income tax deductions. The tax benefit for the deductions of $546,623 for 2003, $688,604 for 2004 and $1,781,364 for 2005 were credited directly to additional paid-in capital.
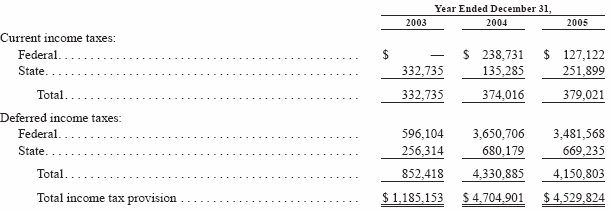
9. INCOME TAXES
The provision for income taxes consists of the following:
Significant components of the Company’s deferred tax assets and liabilities were as follows at December 31:
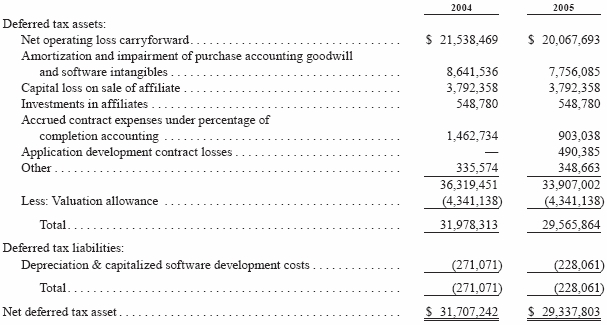
For federal income tax purposes, the Company had available at December 31, 2005, total net operating loss (“NOL”) carryforwards of approximately $55.2 million that will expire in 2020 ($17.8 million), 2021 ($27.1 million) and 2022 ($10.3 million). The Company believes it is more likely than not it will generate sufficient taxable income from future operations to fully utilize the NOL carryforwards prior to expiration. The amount of the deferred tax asset considered realizable relating to these NOL’s could be reduced in the near term if estimates of future taxable income during the carryforward periods are reduced.
58
In 2003, the Company completed an internal reorganization and legal entity restructuring plan to simplify its corporate structure, standardize business development and contracting practices, increase internal operating efficiencies through reduced administrative costs, and concentrate all companies under one subsidiary, NICUSA. Most operating subsidiaries were converted to single member limited liability companies (LLCs) directly owned by NICUSA. Management believes the restructuring will be treated as tax-free reorganizations or liquidations. As a result of the restructuring, certain NOL carryforwards relating to the Company’s NIC Conquest business that were generated prior to the date the Company acquired 100% ownership of NIC Conquest can now be utilized by NICUSA. Consequently, the Company released a deferred tax asset valuation allowance relating to NIC Conquest totaling $3,214,026 in 2003.
In 2003, management identified certain deferred tax assets pertaining to section 197 intangible asset amortization that the Company had not recognized since the acquisition of NIC Conquest in January 2000. Accordingly, the Company recognized an additional deferred tax asset totaling $1,483,386. The Company also identified certain estimated state NOL carryforwards that it had previously recognized that it might be unable to use. Based on a review of applicable state tax statutes, the Company concluded that there is substantial doubt it would be able to realize the full amount of certain estimated NOL carryforwards in states where the Company cannot file a consolidated income tax return. As a result, in the fourth quarter of 2003, the Company reduced its net deferred tax asset by $483,386.
At December 31, 2004 and 2005, the Company’s total deferred tax asset valuation allowance was $4,341,138. Of this amount, $3,792,358 related to capital losses realized on certain of the Company’s previous equity method investments, and $548,780 related to an expected capital loss on the Company’s investment in a European joint venture. At present, there is substantial doubt about the Company’s ability to generate capital gains in the future. During 2003 and 2004, the Company increased the valuation allowance relating to these investments by $2,495,875 and $48,588, respectively.
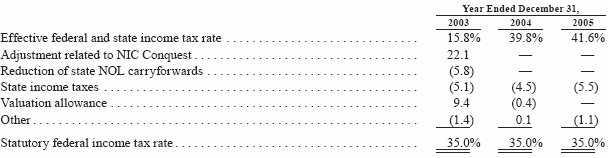
The following table reconciles the effective income tax rate indicated by the consolidated statements of income and the statutory federal income tax rate:
10. EMPLOYEE BENEFIT AND STOCK OPTION PLANS
Defined Contribution 401(k) Profit Sharing Plan
The Company and its subsidiaries sponsor a defined contribution 401(k) profit sharing plan. In accordance with the plan, all full-time employees are eligible immediately upon employment. A discretionary match of up to 5% of an employee’s salary and a discretionary contribution may be made to the plan as determined by the Board of Directors. Expense related to Company matching contributions totaled approximately $207,000, $222,000 and $477,000 for the years ended December 31, 2003, 2004 and 2005, respectively.
Employee Stock Purchase Plan
In May 1999, the Company’s Board of Directors approved an employee stock purchase plan intended to qualify as an “employee stock purchase plan” under Section 423 of the Internal Revenue Code. A total of 2,321,688 shares of NIC common stock have been reserved for issuance under this plan. Terms of the plan permit eligible employees to purchase NIC common stock through payroll deductions up to 15% of each employee’s compensation. Amounts deducted and accumulated by the participant will be used to purchase shares of NIC’s common stock at
59
85% of the lower of the fair value of the common stock at the beginning or the end of the offering period, as defined in the plan. In the offering period commencing on April 1, 2002 and ending on March 31, 2003, 48,731 shares were purchased. In the offering period commencing on April 1, 2003 and ending on March 31, 2004, 80,325 shares were purchased. In the offering period commencing on April 1, 2004 and ending on March 31, 2005, 30,031 shares were purchased. The next offering period under this plan commenced on April 1, 2005. The closing fair market value of NIC common stock on the first day of the current offering period was $4.59 per share.
Stock Option Plans
The Company has two formal stock option plans (the “NIC” plan and the “SDR” plan) to provide for the granting of either incentive stock options or non-qualified stock options to encourage certain employees of the Company and its subsidiaries, and certain directors of the Company, to participate in the ownership of the Company, and to provide additional incentive for such employees and directors to promote the success of its business through sharing the future growth of such business. The NIC plan was adopted in May 1998 and amended in November 1998, May 1999 and May 2004. Under the NIC plan, the Company is authorized to grant options for up to 9,286,754 common shares. Employee options are generally exercisable one year from date of grant in cumulative annual installments of 25% to 33% and expire four to five years after the grant date. At December 31, 2005, a total of 1,625,092 options were available for future grants under the NIC plan. The SDR plan was adopted in May 2000 in conjunction with NIC’s acquisition of SDR. Under the SDR plan, the Company is authorized to grant options for up to 229,965 common shares. No options that are in addition to those granted upon the close of the SDR acquisition will be granted under the SDR plan. There have been no option repricings under the plans.
A summary of the activity under the Company’s stock option plans for the years ended December 31, 2003, 2004 and 2005 is presented below:
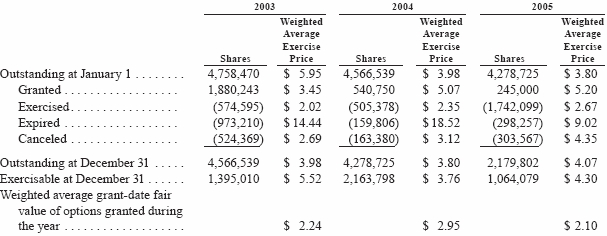
In 2003, the Company granted 1,633,200 options with exercise prices equal to the market price of the Company’s common stock on the grant dates. The weighted average exercise price of such shares was $3.45 and the weighted average grant-date fair value was $2.29. Additionally, in 2003, the Company granted 247,043 options with exercise prices that exceeded the market price of the Company’s common stock on the grant date. The weighted average exercise price of such shares was $3.45 and the weighted average grant-date fair value was $1.93. In 2004 and 2005, all options were granted with exercise prices equal to the market price of the Company’s common stock on the grant dates.
60
The following table summarizes information about stock options outstanding under the Company’s stock option plans at December 31, 2005:
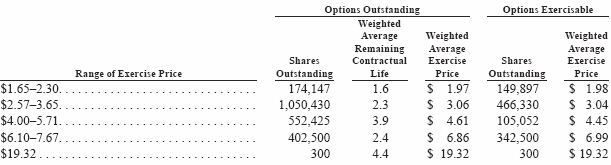
11. RELATED PARTY TRANSACTIONS
The Company rented an aircraft on an hourly basis from a company that is owned by two shareholders/ directors of the Company at costs that the Company believes are reasonable compared to similar services provided by third parties. One of these directors is the current Chairman and Chief Executive Officer of the Company. In 2003, 2004 and 2005, payments made to this company totaled approximately $565,000, $399,000 and $114,000, respectively.
12. REPORTABLE SEGMENTS AND RELATED INFORMATION
The Company’s two reportable segments consist of its Outsourced Portal businesses and Software & Services businesses. The Outsourced Portals segment includes the Company’s subsidiaries operating outsourced government portals and the corporate divisions that directly support portal operations. The Software & Services segment primarily includes the Company’s UCC and corporate filings software development business (NIC Conquest), ethics & elections filings business (NIC Technologies) and transportation business (IDT). Each of the Company’s Software & Services businesses is an operating segment and has been aggregated to form the Software & Services reportable segment. Unallocated corporate-level expenses are reported in the reconciliation of the segment totals to the related consolidated totals as “Other Reconciling Items.” There have been no significant intersegment transactions for the periods reported. The summary of significant accounting policies applies to all segments.
The measure of profitability by which management evaluates the performance of its segments and allocates resources to them is operating income (loss). Segment asset or other segment balance sheet information is not presented to the Company’s chief operating decision maker. Accordingly, the Company has not presented information relating to segment assets.
61
The table below reflects summarized financial information for the Company’s reportable segments for the years ended December 31:

The following is a reconciliation of total segment operating income to total consolidated income before income taxes for the years ended December 31:
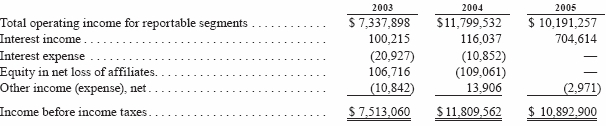
The highest volume, most commercially valuable service the Company offers is access to motor vehicle records through the Company’s outsourced government portals, referred to as DMV records. This service accounted for approximately 62%, 63% and 62% of the Company’s portal revenues in 2003, 2004 and 2005, respectively, and approximately 49%, 55% and 60% of the Company’s total revenues in 2003, 2004 and 2005, respectively.
A primary source of revenue is derived from data resellers, who use the Company’s government portals to access DMV records for sale to the auto insurance industry. For the year ended December 31, 2003, one of these data resellers accounted for approximately 47% of the Company’s portal revenues and 37% of the Company’s total revenues. For the year ended December 31, 2004, one of these data resellers accounted for approximately 46% of the Company’s portal revenues and 40% of the Company’s total revenues. For the year ended December 31, 2005, one of these data resellers accounted for approximately 46% of the Company’s portal revenues and 45% of the Company’s total revenues. At December 31, 2005, this one data reseller accounted for approximately 47% of the Company’s accounts receivable.
62
For the year ended December 31, 2003, the Company’s Indiana and Virginia portals accounted for approximately 16% and 12%, respectively, of the Company’s portal revenues and 12% and 9%, respectively, of the Company’s consolidated revenues. For the year ended December 31, 2004, the Company’s Indiana, Virginia and Utah portals accounts for approximately 15%, 10% and 10%, respectively, of the Company’s portal revenues and 13%, 9% and 9%, respectively, of the Company’s consolidated revenues. For the year ended December 31, 2005, the Company’s Indiana portal accounted for approximately 16% of the Company’s portal revenues and 15% of the Company’s consolidated revenues.
For the year ended December 31, 2003, revenues from the Company’s UCC and corporate filings software development contract with the California Secretary of State accounted for approximately 68% of the Company’s software & services revenues and 14% of the Company’s total revenues. For the year ended December 31, 2004, revenues from this contract accounted for approximately 56% of the Company’s software & services revenues and 7% of the Company’s total revenues. For the year ended December 31, 2005, revenues from this contract were negative ($1,425,000) as a result of the first quarter 2005 adjustment under percentage of completion accounting as further discussed in Note 2.
13. SUBSEQUENT EVENT
On March 13, 2006, the Company and the California SOS entered into an amendment (the “Amendment”) to the California Business Programs Automation Agreement (the “Agreement”). Among other changes to the Agreement, the Amendment reduces the aggregate contract value to approximately $19 million, and releases the Company from the obligation to deliver the business filings, or BE, portion of the project, except for maintenance of hardware and delivery of BE images as expressly set forth in the Amendment. The Amendment also sets forth the final criteria in order for the California SOS to accept the Uniform Commercial Code, or UCC, portion of the project and move it into the maintenance and operations phase.
The Company is in the process of reviewing its cost estimates to complete based on the revised terms and conditions in the Amendment and does not believe its estimated contract loss will exceed the $4.2 million estimate established in the first quarter of 2005. However, because of the inherent uncertainties surrounding the ultimate outcome of subcontract negotiations between the Company and its subcontractors as a result of the Amendment, it is at least reasonably possible that the estimate will change in the near term. Further, it is possible that the Company will similarly incur cost overruns in the future as it has in the past as a result of unforeseen difficulties in the creation of an application called for in the contract, unforeseen challenges in ensuring compatibility with existing systems, rising development, subcontractor and personnel costs or other reasons. If this occurs, the Company’s results of operations, financial condition and cash flows could be adversely affected.
As a result of the Amendment, the Company expects to record an adjustment under percentage of completion accounting in the first quarter of 2006 that will reduce both software & services revenues and cost of software & services revenues by approximately $2.1 - $2.3 million in its consolidated statements of income. The adjustment will also reduce unbilled revenues by approximately $2.1 - $2.3 million, accrued contract expenses by approximately $1.6 million and application development contracts by approximately $0.5 - $0.7 million in its consolidated balance sheets. However, subject to the uncertainties referred to above, this adjustment is not expected to affect operating income, net income or basic and diluted earnings per share.
63
14. UNAUDITED QUARTERLY OPERATING RESULTS
The unaudited quarterly information below is subject to seasonal fluctuations resulting in lower portal revenues in the fourth quarter of each calendar year, due to the smaller number of business days in the quarter and a lower volume of business-to-government and citizen-to-government transactions during the holiday periods. For additional information on significant items affecting the quarterly results for the periods presented, refer to Note 2 above.
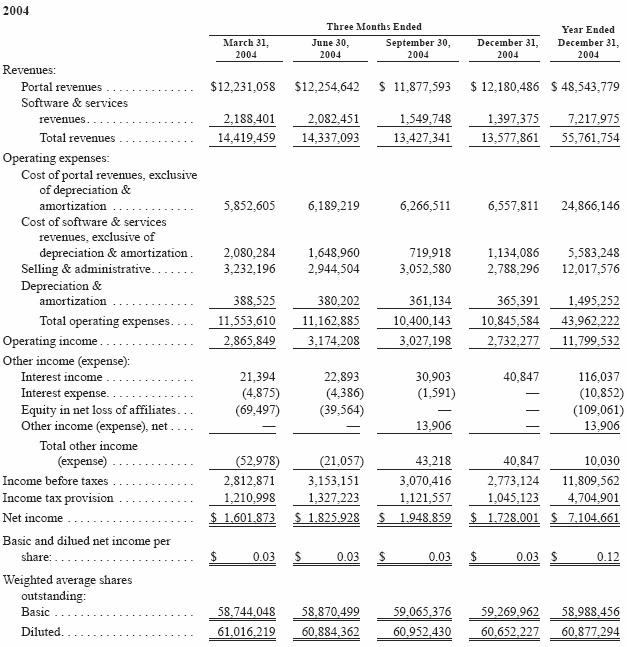
64

65
REPORT OF INDEPENDENT REGISTERED PUBLIC ACCOUNTING FIRM
To the Board of Directors and Shareholders of NIC Inc.:
We have completed integrated audits of NIC Inc.’s December 31, 2005 and December 31, 2004 consolidated financial statements and of its internal control over financial reporting as of December 31, 2005, and an audit of its December 31, 2003 consolidated financial statements in accordance with the standards of the Public Company Accounting Oversight Board (United States). Our opinions, based on our audits, are presented below.
CONSOLIDATED FINANCIAL STATEMENTS AND FINANCIAL STATEMENT SCHEDULES
In our opinion, the consolidated financial statements listed in the index appearing under Item 15(a) present fairly, in all material respects, the financial position of NIC Inc. and its subsidiaries at December 31, 2005 and 2004, and the results of their operations and their cash flows for each of the three years in the period ended December 31, 2005 in conformity with accounting principles generally accepted in the United States of America. These financial statements and financial statement schedules are the responsibility of the Company’s management. Our responsibility is to express an opinion on these financial statements and financial statement schedules based on our audits. We conducted our audits of these statements in accordance with the standards of the Public Company Accounting Oversight Board (United States). Those standards require that we plan and perform the audit to obtain reasonable assurance about whether the financial statements are free of material misstatement. An audit of financial statements includes examining, on a test basis, evidence supporting the amounts and disclosures in the financial statements, assessing the accounting principles used and significant estimates made by management, and evaluating the overall financial statement presentation. We believe that our audits provide a reasonable basis for our opinion.
INTERNAL CONTROL OVER FINANCIAL REPORTING
Also, in our opinion, management’s assessment, included in Management’s Report on Internal Control Over Financial Reporting appearing under Item 9A, that the Company maintained effective internal control over financial reporting as of December 31, 2005 based on criteria established inInternal Control - Integrated Framework issued by the Committee of Sponsoring Organizations of the Treadway Commission (COSO), is fairly stated, in all material respects, based on those criteria. Furthermore, in our opinion, the Company maintained, in all material respects, effective internal control over financial reporting as of December 31, 2005, based on criteria established inInternal Control - Integrated Framework issued by the COSO. The Company’s management is responsible for maintaining effective internal control over financial reporting and for its assessment of the effectiveness of internal control over financial reporting. Our responsibility is to express opinions on management’s assessment and on the effectiveness of the Company’s internal control over financial reporting based on our audit. We conducted our audit of internal control over financial reporting in accordance with the standards of the Public Company Accounting Oversight Board (United States). Those standards require that we plan and perform the audit to obtain reasonable assurance about whether effective internal control over financial reporting was maintained in all material respects. An audit of internal control over financial reporting includes obtaining an understanding of internal control over financial reporting, evaluating management’s assessment, testing and evaluating the design and operating effectiveness of internal control, and performing such other procedures as we consider necessary in the circumstances. We believe that our audit provides a reasonable basis for our opinions.
A company’s internal control over financial reporting is a process designed to provide reasonable assurance regarding the reliability of financial reporting and the preparation of financial statements for external purposes in accordance with generally accepted accounting principles. A company’s internal control over financial reporting includes those policies and procedures that (i) pertain to the maintenance of records that, in reasonable detail, accurately and fairly reflect the transactions and dispositions of the assets of the company; (ii) provide reasonable assurance that transactions are recorded as necessary to permit preparation of financial statements in accordance with generally accepted accounting principles, and that receipts and expenditures of the company are being made only in accordance with authorizations of management and directors of the company; and (iii) provide reasonable assurance regarding prevention or timely detection of unauthorized acquisition, use, or disposition of the company’s assets that could have a material effect on the financial statements.
66
Because of its inherent limitations, internal control over financial reporting may not prevent or detect misstatements. Also, projections of any evaluation of effectiveness to future periods are subject to the risk that controls may become inadequate because of changes in conditions, or that the degree of compliance with the policies or procedures may deteriorate.
/s/PRICEWATERHOUSECOOPERS LLP
Kansas City, Missouri
March 9, 2006, except as to
Note 13, for which the
date is March 14, 2006
67
ITEM 9. CHANGES IN AND DISAGREEMENTS WITH ACCOUNTANTS ON ACCOUNTING AND FINANCIAL DISCLOSURE
None.
ITEM 9A. CONTROLS AND PROCEDURES
Conclusion Regarding the Effectiveness of Disclosure Controls and Procedures - The Company maintains a set of disclosure controls and procedures designed to ensure that material information required to be disclosed in its filings under the Securities Exchange Act of 1934 is recorded, processed, summarized and reported within the time periods specified in the Securities and Exchange Commission’s rules and forms. Disclosure controls and procedures include, without limitation, controls and procedures designed to ensure that information required to be disclosed by an issuer in the reports that it files or submits under the Act is accumulated and communicated to the issuer’s management, including its principal executive and principal financial officers, or persons performing similar functions, as appropriate to allow timely decisions regarding required disclosure. Under the supervision and with the participation of our management, including our principal executive officer and principal financial officer, we conducted an evaluation of the effectiveness of our disclosure controls and procedures, as defined in Rules 13a-15(e) and 15d-15(e) promulgated under the Securities Exchange Act of 1934, as amended (the “Exchange Act”). Based on this evaluation, our principal executive officer and our principal financial officer concluded that our disclosure controls and procedures were effective as of the end of the period covered by this Annual Report on Form 10-K.
Management’s Report on Internal Control Over Financial Reporting – Our management is responsible for establishing and maintaining adequate internal control over financial reporting, as such term is defined in Exchange Act Rules 13a-15(f). Under the supervision and with the participation of our management, including our principal executive officer and principal financial officer, we conducted an evaluation of the effectiveness of our internal control over financial reporting based on the framework inInternal Control –Integrated Framework issued by the Committee of Sponsoring Organizations of the Treadway Commission. Based on our evaluation under the framework inInternal Control – Integrated Framework, our management concluded that our internal control over financial reporting was effective as of December 31, 2005. Our management’s assessment of the effectiveness of our internal control over financial reporting as of December 31, 2005 has been audited by PricewaterhouseCoopers LLP, an independent registered public accounting firm, as stated in their report which is included herein.
Because of its inherent limitations, internal control over financial reporting may not prevent or detect misstatements. Also, projections of any evaluation of effectiveness to future periods are subject to the risk that controls may become inadequate because of changes in conditions, or that the degree of compliance with the policies or procedures may deteriorate.
Changes in Internal Control over Financial Reporting - As of the end of the period covered by this report, our management, including our principal executive officer and principal financial officer, concluded that there have been no changes in our internal control over financial reporting that occurred during our fourth fiscal quarter that have materially affected, or are reasonably likely to materially affect, our internal control over financial reporting.
ITEM 9B. OTHER INFORMATION
Entry Into a Material Definitive Agreement - On March 13, 2006, NICUSA, Inc., a wholly owned subsidiary of NIC Inc. (the “Company”), and the California Secretary of State (“California SOS”) entered into an amendment (the “Amendment”) to the California Business Programs Automation Agreement (the “Agreement”). Among other changes to the Agreement, the Amendment reduces the aggregate contract value from approximately $25 million to approximately $19 million, and releases NICUSA from the obligation to deliver the business filings, or BE, portion of the project, except for maintenance of hardware and delivery of BE images as expressly set forth in the Amendment. The Amendment also sets forth the final criteria in order for the California SOS to accept the Uniform Commercial Code, or UCC, portion of the project and move it into the maintenance and operations phase. A copy of the Amendment is filed with this report on Form 10-K as Exhibit 10.50, and this summary is qualified in all respects by reference to the Amendment.
68
PART III
ITEM 10. DIRECTORS AND EXECUTIVE OFFICERS OF THE REGISTRANT
The information regarding directors of the Company and the executive officers of the Company will be set forth under the captions “Board of Directors” and “Executive Officers” in the Company’s proxy statement related to its 2006 annual meeting of shareholders (the “Proxy Statement”) and is incorporated herein by reference since such Proxy Statement will be filed with the Securities and Exchange Commission not later than 120 days after the end of the Company’s fiscal year pursuant to regulation 14A. Information required by Item 405 of Regulation S-K will be set forth under the caption “Section 16(a) Beneficial Ownership Reporting Compliance” in the Proxy Statement and is incorporated herein by reference.
ITEM 11. EXECUTIVE COMPENSATION
The information required by this item is incorporated herein by reference to “Executive Compensation” in the Proxy Statement, since such Proxy Statement will be filed with the Securities and Exchange Commission not later than 120 days after the end of the Company’s fiscal year pursuant to Regulation 14A.
ITEM 12. SECURITY OWNERSHIP OF CERTAIN BENEFICIAL OWNERS AND MANAGEMENT AND RELATED SHAREHOLDER MATTERS
The information required by this item is incorporated herein by reference to “Share Ownership” in the Proxy Statement, since such Proxy Statement will be filed with the Securities and Exchange Commission not later than 120 days after the end of the Company’s fiscal year pursuant to Regulation 14A.
The following table shows the Company’s common stock authorized for issuance under the Company’s equity compensation plans as of December 31, 2005:
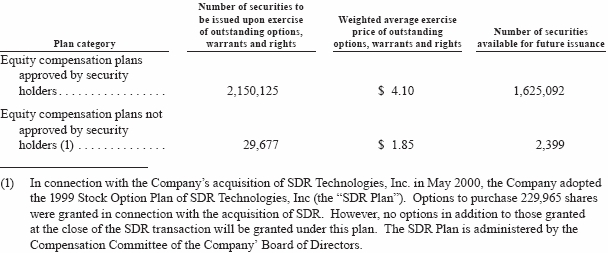
ITEM 13. CERTAIN RELATIONSHIPS AND RELATED TRANSACTIONS
To the extent applicable the information required by this item is incorporated herein by reference to “Compensation Committee Interlocks and Insider Participation” and “Certain Relationships and Related Transactions” in the Proxy Statement, since such Proxy Statement will be filed with the Securities and Exchange Commission not later than 120 days after the end of the Company’s fiscal year pursuant to Regulation 14A.
ITEM 14. PRINCIPAL ACCOUNTANT FEES AND SERVICES
The information required by this item is incorporated herein by reference to “Independent PublicAccountants” in the Proxy Statement, since such Proxy Statement will be filed with the Securities and Exchange Commission not later than 120 days after the end of the Company’s fiscal year pursuant to Regulation 14A.
69
PART IV
ITEM 15. EXHIBITS, FINANCIAL STATEMENT SCHEDULES
(a) The following documents are filed as part of this report:
| Index To Consolidated Financial Statements: | Page |
| Consolidated Balance Sheets | 43 |
| Consolidated Statements of Income | 44 |
| Consolidated Statements of Changes in Shareholders’ Equity | 45 |
| Consolidated Statements of Cash Flows | 46 |
| Notes to Consolidated Financial Statements | 47 |
| Report of PricewaterhouseCoopers LLP, Independent Registered Public Accounting Firm | 66 |
All schedules are omitted because they are not applicable or the required information is shown in the consolidated financial statements or notes thereto.
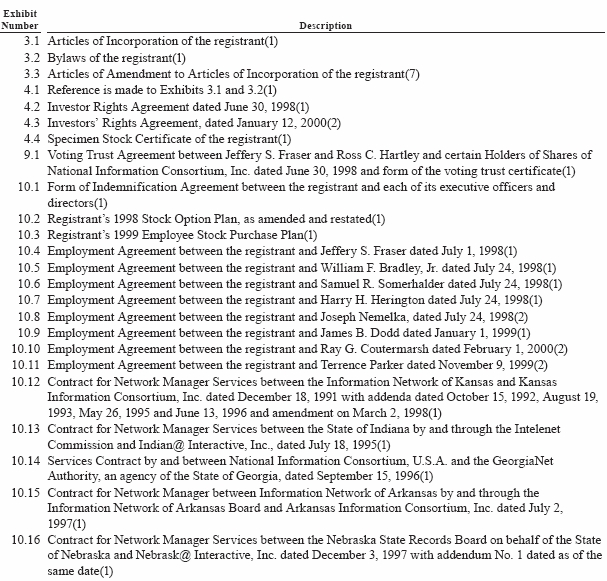
70
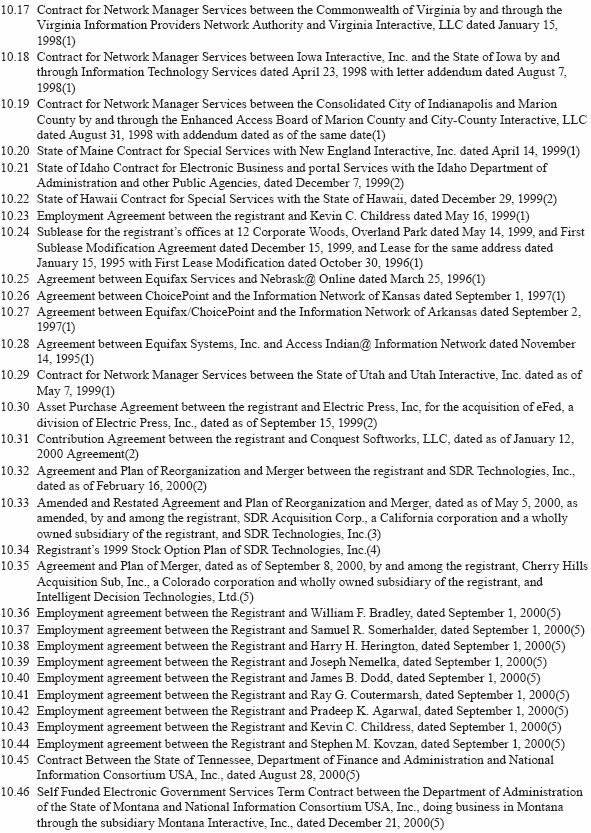
71
72
SIGNATURES
Pursuant to the requirements of Section 13 or 15(d) of the Securities Exchange Act of 1934, the registrant has duly caused this report to be signed on its behalf by the undersigned, thereunto duly authorized, on March 16, 2006.
| | | NIC INC. |
| By: | /s/JEFFERY S. FRASER |
Pursuant to the requirements of the Securities Exchange Act of 1934, this report has been signed below by the following persons on behalf of the registrant and in the capacities and on the dates indicated.
73