UNITED STATES
SECURITIES AND EXCHANGE COMMISSION Washington, D.C. 20549
FORM N-CSR
CERTIFIED SHAREHOLDER REPORT OF REGISTERED MANAGEMENT INVESTMENT COMPANIES
Investment Company Act file number 811-08879
MFS VARIABLE INSURANCE TRUST III
(Exact name of registrant as specified in charter)
111 Huntington Avenue, Boston, Massachusetts 02199 (Address of principal executive offices) (Zip code)
Christopher R. Bohane
Massachusetts Financial Services Company
111Huntington Avenue Boston, Massachusetts 02199
(Name and address of agents for service)
Registrant's telephone number, including area code: (617) 954-5000
Date of fiscal year end: December 31
Date of reporting period: December 31, 2022
ITEM 1. REPORTS TO STOCKHOLDERS.
Item 1(a):
Annual Report
December 31, 2022
MFS® Moderate
Allocation Portfolio
MFS® Variable Insurance Trust III
MFS® Moderate Allocation Portfolio
| 1 |
| 2 |
| 3 |
| 5 |
| 7 |
| 8 |
| 9 |
| 10 |
| 11 |
| 12 |
| 14 |
| 21 |
| 22 |
| 25 |
| 27 |
| 27 |
| 27 |
| 27 |
| 27 |
| 28 |
The report is prepared for the general information of shareholders. It is authorized for distribution to prospective investors only when preceded or accompanied by a current prospectus.
NOT FDIC INSURED • MAY LOSE VALUE • NO BANK OR CREDIT UNION GUARANTEE •
NOT A DEPOSIT • NOT INSURED BY ANY FEDERAL GOVERNMENT AGENCY OR NCUA/NCUSIF
MFS Moderate Allocation Portfolio
LETTER FROM THE CHAIR AND CEO
Dear Shareholders:
Signs of peaking inflation, hopes that monetary policy tightening cycles may be nearing an end and a rapid reopening of China’s economy in late-2022 and early-2023 have combined to bolster investor sentiment in recent months. Markets have largely adjusted to the challenges posed by Russia’s invasion of Ukraine, thanks in part to mild European winter weather which has alleviated concerns over potential shortages of natural gas. Resilient labor markets in much of the developed world have further contributed to a brighter-than-expected economic backdrop. However, many investors are mindful that the lagged effects of ongoing policy tightening have yet to work their way through the global economy.
Tighter global financial conditions have been a particular headwind for richly valued growth equities and interest rate-sensitive parts of the economy, such as housing. Over the near term, companies may face a challenging earnings backdrop as they are forced to absorb higher input and labor costs at a time of dwindling pricing power. For fixed income, the rise in interest rates has made bonds more attractive than they have been in years, which may provide balance to an overall portfolio.
During times of market transition, it is important to have a deep understanding of company fundamentals, and we have built our unique global research platform to do just that.
At MFS®, we put our clients’ assets to work responsibly by carefully navigating increasingly complex global capital markets. Our investment team is guided by a commitment to long-term fundamental investing. Our global investment platform — combining collective expertise, long-term discipline, and thoughtful risk management — seeks to uncover what we believe are the best, most durable investment ideas in markets around the world, enabling us to potentially create value for investors.
Respectfully,
Michael W. Roberge
Chair and Chief Executive Officer
MFS Investment Management
February 15, 2023
The opinions expressed in this letter are subject to change and may not be relied upon for investment advice. No forecasts can be guaranteed.
MFS Moderate Allocation Portfolio
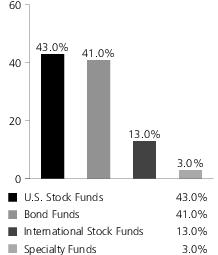
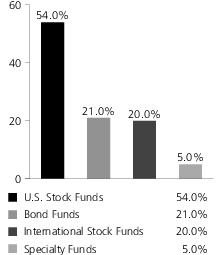
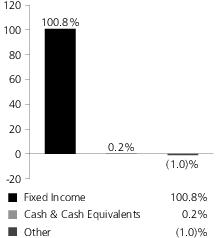
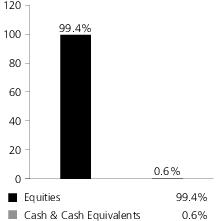
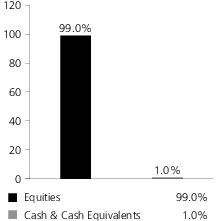
Portfolio target allocation
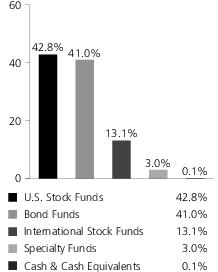
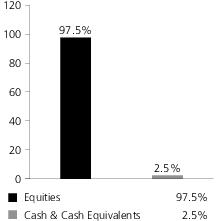
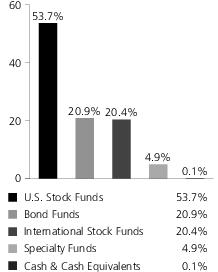
Portfolio actual allocation
Portfolio holdings
| MFS Total Return Bond Series | 12.0% |
| MFS Government Securities Portfolio | 10.0% |
| MFS Value Series | 9.1% |
| MFS Growth Series | 8.7% |
| MFS Research Series | 8.0% |
| MFS Research International Portfolio | 7.1% |
| MFS Mid Cap Value Portfolio | 7.0% |
| MFS Mid Cap Growth Series | 7.0% |
| MFS Global Governments Portfolio | 5.0% |
| MFS Inflation-Adjusted Bond Portfolio | 5.0% |
| MFS High Yield Portfolio | 5.0% |
| MFS Limited Maturity Portfolio | 4.0% |
| MFS International Intrinsic Value Portfolio | 3.0% |
| MFS International Growth Portfolio | 3.0% |
| MFS Global Real Estate Portfolio | 3.0% |
| MFS New Discovery Value Portfolio | 1.5% |
| MFS New Discovery Series | 1.5% |
| Cash & Cash Equivalents | 0.1% |
Cash & Cash Equivalents includes any cash, investments in money market funds, short-term securities, and other assets less liabilities. MFS endeavors to fully invest all MFS funds-of-funds in underlying funds on a daily basis. Any divergence from 0.0% in Cash & Cash Equivalents is typically due to the timing of fund subscriptions/redemptions and the settlement of subsequent investment in/divestment from the underlying funds. While the MFS funds-of-funds' subscriptions/redemptions are processed at the same day NAV of the underlying funds, a positive/negative cash balance will be reflected on the MFS funds-of-funds' Statements of Assets and Liabilities until the trades with the underlying funds settle, which is typically two business days. Please see the fund's Statement of Assets and Liabilities for additional information related to the fund’s cash position and other assets and liabilities.
Percentages are based on net assets as of December 31, 2022.
The portfolio is actively managed and current holdings may be different.
MFS Moderate Allocation Portfolio
Management Review
Summary of Results
For the twelve months ended December 31, 2022, Initial Class shares of the MFS Moderate Allocation Portfolio (fund) provided a total return of -16.76%, while Service Class shares of the fund provided a total return of -16.91%. These compare with a return of -18.11% for the fund’s benchmark, the Standard & Poor's 500 Stock Index (S&P 500 Index). The fund's other benchmark, the MFS Moderate Allocation Portfolio Blended Index (Blended Index), generated a return of -15.47%. The Blended Index reflects the blended returns of various equity and fixed income market indices, with percentage allocations to each index designed to resemble the allocations of the fund. The market indices and related percentage allocations used to compile the Blended Index are set forth in the Performance Summary.
Market Environment
During the reporting period, markets continued to grapple with the strongest global inflationary pressures in decades along with signs of slowing economic growth. Intermittent coronavirus flareups, particularly in China, where home-grown vaccines have proved less effective than elsewhere, kept supply chains stretched for a considerable period. At the same time, the reopening of the economy in the parts of the world where the virus has been better contained has led to a shift in consumption patterns in favor of services, straining already tight labor markets in most developed economies, while reducing demand for manufactured goods, primarily from Asia. As a result of Russia’s invasion of Ukraine, geopolitical considerations, such as sanctions and trade bans, have resulted in additional supply chain disruptions and volatile global energy prices. Taken together, these factors have contributed to market volatility.
The ripple effects from the Russian invasion further complicated the mission central banks must undertake to rein in surging inflation. Energy shocks have historically resulted in global growth slowdowns, if not pullbacks, so policymakers will find themselves in the difficult position of trying to restrain inflation without tipping economies into recession. Despite the challenging macroeconomic and geopolitical environment, policymakers remained focused on controlling inflation, although investors appeared to have expected varying degrees of action from the central banks. The Fed has been among the most aggressive developed market central banks, tightening policy at the fastest rate in decades, although it slowed its hiking pace at the end of the period, as did the European Central Bank. After remaining on the monetary sidelines for much of the period, the Bank of Japan widened its Yield Curve Control band, capping the yield on its 10-year bond at 0.5%, up from 0.25%, an action investors interpreted as a first step toward monetary policy normalization.
Against an environment of still-tight labor markets, tighter global financial conditions and volatile materials prices, investor anxiety appeared to have increased over the potential that corporate profit margins may be past peak for this cycle. That said, tentative signs that supply chain bottlenecks (particularly semiconductors) may be moderating, the easing of COVID restrictions in China, low levels of unemployment across developed markets and hopes that inflation levels may be near a peak were supportive factors for the macroeconomic backdrop.
Factors Affecting Performance
During the reporting period, the fund outperformed its benchmark, the Standard & Poor’s 500 Stock Index. Over the same period, the fund underperformed the Blended Index.
Relative to the Blended Index, the fund’s exposure to the international equity asset class was a primary detractor from relative performance. Within this segment, both the MFS International Intrinsic Value Portfolio and MFS Research International Portfolio weighed on the fund’s relative results as both portfolios tilted toward higher quality growth and lagged their respective benchmarks.
The fund's exposure to the U.S. equity asset class also held back relative returns. Here, exposure to growth-oriented funds, most notably to the MFS Growth Series and MFS Mid Cap Growth Series, which both underperformed their respective benchmarks, held back relative returns and outweighed the positive contribution from the fund’s exposure to value-oriented funds, particularly the MFS Value Series and MFS Mid Cap Value Portfolio.
The fund's exposure to the fixed income asset class also weakened relative performance. Within this asset class, the fund’s exposure to both the MFS Inflation-Adjusted Bond Portfolio and MFS Global Governments Portfolio, both of which are global portfolios and were negatively impacted by a stronger U.S. dollar, outweighed the positive contribution from the fund’s exposure to the MFS Limited Maturity Portfolio, a shorter duration(d) portfolio which held in better in the face of rising interest rates.
MFS Moderate Allocation Portfolio
Management Review - continued
Respectfully,
Portfolio Manager(s)
Joseph Flaherty and Natalie Shapiro
| (d) | Duration is a measure of how much a bond’s price is likely to fluctuate with general changes in interest rates, e.g., if rates rise 1.00%, a bond with a 5-year duration is likely to lose about 5.00% of its value. |
The views expressed in this report are those of the portfolio manager(s) only through the end of the period of the report as stated on the cover and do not necessarily reflect the views of MFS or any other person in the MFS organization. These views are subject to change at any time based on market or other conditions, and MFS disclaims any responsibility to update such views. These views may not be relied upon as investment advice or an indication of trading intent on behalf of any MFS portfolio. References to specific securities are not recommendations of such securities, and may not be representative of any MFS portfolio’s current or future investments.
MFS Moderate Allocation Portfolio
Performance Summary Through 12/31/22
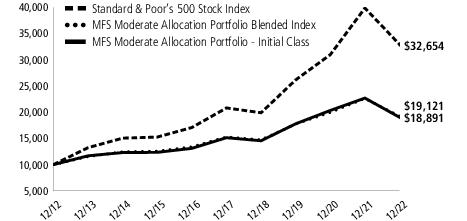
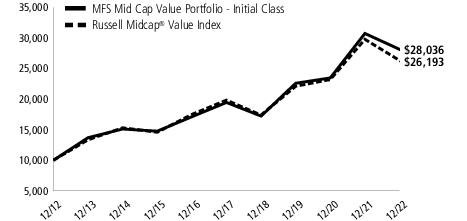
The following chart illustrates the historical performance of the fund in comparison to its benchmark(s). Benchmarks are unmanaged and may not be invested in directly. Benchmark returns do not reflect any fees or expenses. The performance of other share classes will be greater than or less than that of the class depicted below. (See Notes to Performance Summary.)
Performance data shown represents past performance and is no guarantee of future results. Investment return and principal value fluctuate so your shares, when sold, may be worth more or less than the original cost; current performance may be lower or higher than quoted. The performance shown does not reflect the deduction of taxes, if any, that a shareholder would pay on fund distributions or the redemption of fund shares. The returns for the fund shown also do not reflect the deduction of expenses associated with variable products, such as mortality and expense risk charges, separate account charges, and sales charges imposed by the insurance company separate accounts. Such expenses would reduce the overall returns shown.
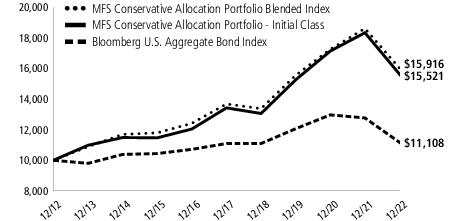
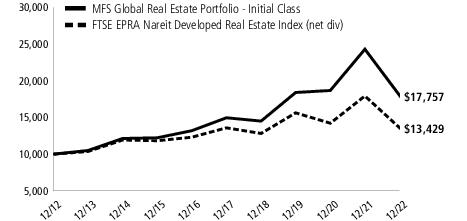
Growth of a Hypothetical $10,000 Investment
Total Returns through 12/31/22
Average annual total returns
| Share Class | Class Inception Date | 1-yr | 5-yr | 10-yr |
| Initial Class | 10/01/08 | (16.76)% | 4.53% | 6.57% |
| Service Class | 10/01/08 | (16.91)% | 4.27% | 6.30% |
Comparative benchmark(s)
| Standard & Poor's 500 Stock Index (f) | (18.11)% | 9.42% | 12.56% |
| MFS Moderate Allocation Portfolio Blended Index (f)(w) | (15.47)% | 4.57% | 6.70% |
| Bloomberg U.S. Aggregate Bond Index (f) | (13.01)% | 0.02% | 1.06% |
| FTSE EPRA Nareit Developed Real Estate Index (net div) (f) | (25.09)% | (0.23)% | 2.99% |
| MSCI EAFE Index (net div) (f) | (14.45)% | 1.54% | 4.67% |
| (f) | Source: FactSet Research Systems Inc. |
| (w) | The MFS Moderate Allocation Portfolio Blended Index (a custom index) was comprised of the following at the beginning and at the end of the reporting period: |
| | 12/31/22 |
| Standard & Poor's 500 Stock Index | 43% |
| Bloomberg U.S. Aggregate Bond Index | 41% |
| MSCI EAFE Index (net div) | 13% |
| FTSE EPRA Nareit Developed Real Estate Index (net div) | 3% |
Benchmark Definition(s)
Bloomberg U.S. Aggregate Bond Index(a) – a market capitalization-weighted index that measures the performance of the U.S. investment-grade, fixed rate bond market, with index components for government and corporate securities, mortgage pass-through securities, and asset-backed securities with at least one year to final maturity.
MFS Moderate Allocation Portfolio
Performance Summary – continued
FTSE EPRA Nareit Developed Real Estate Index(c) (net div) – measures the performance of eligible real estate equities worldwide that generate a majority of their revenue and income through the ownership, disposure and development of income-producing real estate.
MSCI EAFE (Europe, Australasia, Far East) Index(e) (net div) – a market capitalization-weighted index that is designed to measure equity market performance in the developed markets, excluding the U.S. and Canada.
Standard & Poor's 500 Stock Index(g) – a market capitalization-weighted index of 500 widely held equity securities, designed to measure broad U.S. equity performance.
It is not possible to invest directly in an index.
| (a) | Source: Bloomberg Index Services Limited. BLOOMBERG® is a trademark and service mark of Bloomberg Finance L.P. and its affiliates (collectively “Bloomberg”). Bloomberg or Bloomberg's licensors own all proprietary rights in the Bloomberg Indices. Bloomberg neither approves or endorses this material, or guarantees the accuracy or completeness of any information herein, or makes any warranty, express or implied, as to the results to be obtained therefrom and, to the maximum extent allowed by law, neither shall have any liability or responsibility for injury or damages arising in connection therewith. |
| (c) | FTSE International Limited (“FTSE”)© FTSE 2019. “FTSE®” is a trademark of the London Stock Exchange Group companies and is used by FTSE International Limited under license. “FT-SE®”, “FOOTSIE®” and “FTSE4GOOD®” are trademarks of the London Stock Exchange Group companies. “Nareit®” is a trademark of the National Association of Real Estate Investment Trusts (“Nareit”) and “EPRA®” is a trademark of the European Public Real Estate Association (“EPRA”) and all are used by FTSE under license. The FTSE EPRA Nareit Developed Real Estate Index is calculated by FTSE. Neither FTSE, Euronext N.V., Nareit, nor EPRA sponsor, endorse, or promote this product and are not in any way connected to it and do not accept any liability. All intellectual property rights in the index values and constituent list vests in FTSE, Euronext N.V., Nareit, and EPRA. Neither FTSE nor its licensors accept any liability for any errors or omissions in the FTSE indices and/or FTSE ratings or underlying data. No further distribution of FTSE Data is permitted without FTSE's express written consent. |
| (e) | Morgan Stanley Capital International (“MSCI”) makes no express or implied warranties or representations and shall have no liability whatsoever with respect to any MSCI data contained herein. The MSCI data may not be further redistributed or used as a basis for other indices or any securities or financial products. This report is not approved, reviewed, or produced by MSCI. |
| (g) | “Standard & Poor's®” and “S&P®” are registered trademarks of Standard & Poor's Financial Services LLC (“S&P”) and Dow Jones is a registered trademark of Dow Jones Trademark Holdings LLC (“Dow Jones”) and have been licensed for use by S&P Dow Jones Indices LLC and sublicensed for certain purposes by MFS. The S&P 500® is a product of S&P Dow Jones Indices LLC, and has been licensed for use by MFS. MFS's product(s) is not sponsored, endorsed, sold, or promoted by S&P Dow Jones Indices LLC, Dow Jones, S&P, or their respective affiliates, and neither S&P Dow Jones Indices LLC, Dow Jones, S&P, nor their respective affiliates make any representation regarding the advisability of investing in such product(s). |
Notes to Performance Summary
Average annual total return represents the average annual change in value for each share class for the periods presented.
Performance results reflect any applicable expense subsidies and waivers in effect during the periods shown. Without such subsidies and waivers the fund's performance results would be less favorable. Please see the prospectus and financial statements for complete details. All results are historical and assume the reinvestment of any dividends and capital gains distributions.
Performance results do not include adjustments made for financial reporting purposes in accordance with U.S. generally accepted accounting principles and may differ from amounts reported in the financial highlights.
From time to time the fund may receive proceeds from litigation settlements, without which performance would be lower.
MFS Moderate Allocation Portfolio
Expense Table
Fund expenses borne by the shareholders during the period,
July 1, 2022 through December 31, 2022
As a shareholder of the fund, you incur ongoing costs, including distribution and/or service (12b-1) fees; and other fund expenses. This example is intended to help you understand your ongoing costs (in dollars) of investing in the fund and to compare these costs with the ongoing costs of investing in other mutual funds.
In addition to the fees and expenses which the fund bears directly, the fund indirectly bears a pro rata share of the fees and expenses of the underlying funds in which the fund invests. Because the underlying funds have varied expenses and fee levels and the fund may own different proportions of the underlying funds at different times, the amount of fees and expenses incurred indirectly by the fund will vary. If these indirect costs were included, your costs would have been higher.
The example is based on an investment of $1,000 invested at the beginning of the period and held for the entire period July 1, 2022 through December 31, 2022.
Actual Expenses
The first line for each share class in the following table provides information about actual account values and actual expenses. You may use the information in this line, together with the amount you invested, to estimate the expenses that you paid over the period. Simply divide your account value by $1,000 (for example, an $8,600 account value divided by $1,000 = 8.6), then multiply the result by the number in the first line under the heading entitled “Expenses Paid During Period” to estimate the expenses you paid on your account during this period.
Hypothetical Example for Comparison Purposes
The second line for each share class in the following table provides information about hypothetical account values and hypothetical expenses based on the fund’s actual expense ratio and an assumed rate of return of 5% per year before expenses, which is not the fund’s actual return. The hypothetical account values and expenses may not be used to estimate the actual ending account balance or expenses you paid for the period. You may use this information to compare the ongoing costs of investing in the fund and other funds. To do so, compare this 5% hypothetical example with the 5% hypothetical examples that appear in the shareholder reports of the other funds.
Please note that the expenses shown in the table are meant to highlight the fund's ongoing costs only and do not take into account the fees and expenses imposed under the variable contracts through which your investment in the fund is made. Therefore, the second line for each share class in the table is useful in comparing ongoing costs associated with an investment in vehicles (such as the fund) which fund benefits under variable annuity and variable life insurance contracts and to qualified pension and retirement plans only, and will not help you determine the relative total costs of investing in the fund through variable annuity and variable life insurance contracts. If the fees and expenses imposed under the variable contracts were included, your costs would have been higher.
Share
Class | | Annualized
Expense
Ratio | Beginning
Account Value
7/01/22 | Ending
Account Value
12/31/22 | Expenses
Paid During
Period (p)
7/01/22-12/31/22 |
| Initial Class | Actual | 0.01% | $1,000.00 | $1,008.59 | $0.05 |
| Hypothetical (h) | 0.01% | $1,000.00 | $1,025.16 | $0.05 |
| Service Class | Actual | 0.27% | $1,000.00 | $1,007.75 | $1.37 |
| Hypothetical (h) | 0.27% | $1,000.00 | $1,023.84 | $1.38 |
| (h) | 5% class return per year before expenses. |
| (p) | “Expenses Paid During Period” are equal to each class’s annualized expense ratio, as shown above, multiplied by the average account value over the period, multiplied by 184/365 (to reflect the one-half year period). In addition to the fees and expenses which the fund bears directly, the fund indirectly bears a pro rata share of the fees and expenses of the underlying funds in which the fund invests. If these indirect costs were included, your costs would have been higher. |
MFS Moderate Allocation Portfolio
Portfolio of Investments − 12/31/22
The Portfolio of Investments is a complete list of all securities owned by your fund. It is categorized by broad-based asset classes.
| Issuer | | | Shares/Par | Value ($) |
| Investment Companies (h) – 100.0% |
| Bond Funds – 41.0% |
| MFS Global Governments Portfolio - Initial Class | | | 5,874,874 | $ 50,582,670 |
| MFS Government Securities Portfolio - Initial Class | | | 9,449,671 | 100,166,512 |
| MFS High Yield Portfolio - Initial Class | | | 10,659,575 | 50,313,193 |
| MFS Inflation-Adjusted Bond Portfolio - Initial Class | | | 6,049,181 | 50,510,666 |
| MFS Limited Maturity Portfolio - Initial Class | | | 4,209,745 | 40,203,065 |
| MFS Total Return Bond Series - Initial Class | | | 10,710,940 | 120,605,181 |
| | | | | $412,381,287 |
| International Stock Funds – 13.1% |
| MFS International Growth Portfolio - Initial Class | | | 2,278,212 | $ 30,414,124 |
| MFS International Intrinsic Value Portfolio - Initial Class | | | 1,116,978 | 30,426,491 |
| MFS Research International Portfolio - Initial Class | | | 4,717,338 | 71,231,807 |
| | | | | $132,072,422 |
| Specialty Funds – 3.0% |
| MFS Global Real Estate Portfolio - Initial Class | | | 2,376,164 | $ 30,367,374 |
| U.S. Stock Funds – 42.8% |
| MFS Growth Series - Initial Class | | | 1,836,646 | $ 88,195,740 |
| MFS Mid Cap Growth Series - Initial Class | | | 9,817,422 | 70,292,741 |
| MFS Mid Cap Value Portfolio - Initial Class | | | 7,701,658 | 70,778,233 |
| MFS New Discovery Series - Initial Class | | | 1,322,392 | 14,956,257 |
| MFS New Discovery Value Portfolio - Initial Class | | | 1,917,163 | 15,203,098 |
| MFS Research Series - Initial Class | | | 2,898,722 | 80,410,553 |
| MFS Value Series - Initial Class | | | 4,233,971 | 91,242,079 |
| | | | | $431,078,701 |
| Money Market Funds – 0.1% | |
| MFS Institutional Money Market Portfolio, 4.02% (v) | | | 735,685 | $ 735,906 |
| Total Investment Companies (Identified Cost, $960,850,894) | $1,006,635,690 |
| Other Assets, Less Liabilities – (0.0)% | | (97,991) |
| Net Assets – 100.0% | $1,006,537,699 |
| (h) | An affiliated issuer, which may be considered one in which the fund owns 5% or more of the outstanding voting securities, or a company which is under common control. At period end, the aggregate value of the fund’s investments in affiliated issuers was $1,006,635,690. | | | |
| (v) | Affiliated issuer that is available only to investment companies managed by MFS. The rate quoted for the MFS Institutional Money Market Portfolio is the annualized seven-day yield of the fund at period end. | | | |
See Notes to Financial Statements
MFS Moderate Allocation Portfolio
| Financial Statements | Statement of Assets and Liabilities |
This statement represents your fund’s balance sheet, which details the assets and liabilities comprising the total value of the fund.
| At 12/31/22Assets | |
| Investments in affiliated issuers, at value (identified cost, $960,850,894) | $1,006,635,690 |
| Receivables for | |
| Investments sold | 768,182 |
| Fund shares sold | 1,511 |
| Other assets | 5,131 |
| Total assets | $1,007,410,514 |
| Liabilities | |
| Payables for | |
| Fund shares reacquired | $766,426 |
| Payable to affiliates | |
| Administrative services fee | 142 |
| Shareholder servicing costs | 68 |
| Distribution and/or service fees | 20,537 |
| Accrued expenses and other liabilities | 85,642 |
| Total liabilities | $872,815 |
| Net assets | $1,006,537,699 |
| Net assets consist of | |
| Paid-in capital | $885,605,562 |
| Total distributable earnings (loss) | 120,932,137 |
| Net assets | $1,006,537,699 |
| Shares of beneficial interest outstanding | 96,272,533 |
| | Net assets | Shares
outstanding | Net asset value
per share |
| Initial Class | $7,560,060 | 723,593 | $10.45 |
| Service Class | 998,977,639 | 95,548,940 | 10.46 |
See Notes to Financial Statements
MFS Moderate Allocation Portfolio
| Financial Statements | Statement of Operations |
This statement describes how much your fund earned in investment income and accrued in expenses. It also describes any gains and/or losses generated by fund operations.
| Year ended 12/31/22 | |
| Net investment income (loss) | |
| Income | |
| Dividends from affiliated issuers | $26,915,492 |
| Other | 144 |
| Total investment income | $26,915,636 |
| Expenses | |
| Distribution and/or service fees | $2,783,891 |
| Shareholder servicing costs | 16,883 |
| Administrative services fee | 17,500 |
| Independent Trustees' compensation | 17,575 |
| Custodian fee | 21,282 |
| Shareholder communications | 7,516 |
| Audit and tax fees | 43,564 |
| Legal fees | 4,821 |
| Miscellaneous | 36,226 |
| Total expenses | $2,949,258 |
| Net investment income (loss) | $23,966,378 |
| Realized and unrealized gain (loss) | |
| Realized gain (loss) (identified cost basis) | |
| Investments in affiliated issuers | $(837,426) |
| Capital gain distributions from affiliated issuers | 58,917,033 |
| Net realized gain (loss) | $58,079,607 |
| Change in unrealized appreciation or depreciation | |
| Affiliated issuers | $(307,736,649) |
| Net realized and unrealized gain (loss) | $(249,657,042) |
| Change in net assets from operations | $(225,690,664) |
See Notes to Financial Statements
MFS Moderate Allocation Portfolio
| Financial Statements | Statements of Changes in Net Assets |
These statements describe the increases and/or decreases in net assets resulting from operations, any distributions, and any shareholder transactions.
| | Year ended |
| | 12/31/22 | 12/31/21 |
| Change in net assets | | |
| From operations | | |
| Net investment income (loss) | $23,966,378 | $19,432,185 |
| Net realized gain (loss) | 58,079,607 | 122,852,398 |
| Net unrealized gain (loss) | (307,736,649) | 8,807,403 |
| Change in net assets from operations | $(225,690,664) | $151,091,986 |
| Total distributions to shareholders | $(142,177,295) | $(87,100,447) |
| Change in net assets from fund share transactions | $8,207,909 | $(131,955,533) |
| Total change in net assets | $(359,660,050) | $(67,963,994) |
| Net assets | | |
| At beginning of period | 1,366,197,749 | 1,434,161,743 |
| At end of period | $1,006,537,699 | $1,366,197,749 |
See Notes to Financial Statements
MFS Moderate Allocation Portfolio
| Financial Statements | Financial Highlights |
The financial highlights table is intended to help you understand the fund's financial performance for the past 5 years. Certain information reflects financial results for a single fund share. The total returns in the table represent the rate that an investor would have earned (or lost) on an investment in the fund share class (assuming reinvestment of all distributions) held for the entire period.
| Initial Class | Year ended |
| | 12/31/22 | 12/31/21 | 12/31/20 | 12/31/19 | 12/31/18 |
| Net asset value, beginning of period | $14.48 | $13.86 | $13.23 | $11.95 | $13.33 |
| Income (loss) from investment operations | | | | | |
| Net investment income (loss) (d)(l) | $0.29 | $0.25 | $0.29 | $0.30 | $0.30 |
| Net realized and unrealized gain (loss) | (2.66) | 1.34 | 1.51 | 2.28 | (0.74) |
| Total from investment operations | $(2.37) | $1.59 | $1.80 | $2.58 | $(0.44) |
| Less distributions declared to shareholders | | | | | |
| From net investment income | $(0.26) | $(0.30) | $(0.32) | $(0.35) | $(0.29) |
| From net realized gain | (1.40) | (0.67) | (0.85) | (0.95) | (0.65) |
| Total distributions declared to shareholders | $(1.66) | $(0.97) | $(1.17) | $(1.30) | $(0.94) |
| Net asset value, end of period (x) | $10.45 | $14.48 | $13.86 | $13.23 | $11.95 |
| Total return (%) (k)(s)(x) | (16.76) | 11.61 | 14.29 | 22.23 | (3.85) |
Ratios (%) (to average net assets)
and Supplemental data: | | | | | |
| Expenses before expense reductions (h) | 0.01 | 0.01 | 0.01 | 0.01 | 0.01 |
| Expenses after expense reductions (h) | N/A | N/A | N/A | N/A | N/A |
| Net investment income (loss) (l) | 2.42 | 1.74 | 2.24 | 2.28 | 2.29 |
| Portfolio turnover | 3 | 2 | 7 | 1 | 1 |
| Net assets at end of period (000 omitted) | $7,560 | $9,312 | $7,891 | $6,448 | $5,333 |
| Service Class | Year ended |
| | 12/31/22 | 12/31/21 | 12/31/20 | 12/31/19 | 12/31/18 |
| Net asset value, beginning of period | $14.47 | $13.86 | $13.22 | $11.94 | $13.32 |
| Income (loss) from investment operations | | | | | |
| Net investment income (loss) (d)(l) | $0.26 | $0.20 | $0.24 | $0.26 | $0.27 |
| Net realized and unrealized gain (loss) | (2.65) | 1.34 | 1.54 | 2.28 | (0.75) |
| Total from investment operations | $(2.39) | $1.54 | $1.78 | $2.54 | $(0.48) |
| Less distributions declared to shareholders | | | | | |
| From net investment income | $(0.22) | $(0.26) | $(0.29) | $(0.31) | $(0.25) |
| From net realized gain | (1.40) | (0.67) | (0.85) | (0.95) | (0.65) |
| Total distributions declared to shareholders | $(1.62) | $(0.93) | $(1.14) | $(1.26) | $(0.90) |
| Net asset value, end of period (x) | $10.46 | $14.47 | $13.86 | $13.22 | $11.94 |
| Total return (%) (k)(s)(x) | (16.91) | 11.26 | 14.08 | 21.90 | (4.13) |
Ratios (%) (to average net assets)
and Supplemental data: | | | | | |
| Expenses before expense reductions (h) | 0.27 | 0.26 | 0.26 | 0.26 | 0.26 |
| Expenses after expense reductions (h) | N/A | N/A | N/A | N/A | N/A |
| Net investment income (loss) (l) | 2.14 | 1.38 | 1.81 | 1.98 | 2.02 |
| Portfolio turnover | 3 | 2 | 7 | 1 | 1 |
| Net assets at end of period (000 omitted) | $998,978 | $1,356,886 | $1,426,271 | $1,414,989 | $1,364,874 |
See Notes to Financial Statements
MFS Moderate Allocation Portfolio
Financial Highlights - continued
| (d) | Per share data is based on average shares outstanding. |
| (h) | In addition to the fees and expenses which the fund bears directly, the fund indirectly bears a pro rata share of the fees and expenses of the underlying affiliated funds in which the fund invests. Accordingly, the expense ratio for the fund reflects only those fees and expenses borne directly by the fund. Because the underlying affiliated funds have varied expense and fee levels and the fund may own different proportions of the underlying affiliated funds at different times, the amount of fees and expenses incurred indirectly by the fund will vary. |
| (k) | The total return does not reflect expenses that apply to separate accounts. Inclusion of these charges would reduce the total return figures for all periods shown. |
| (l) | The ratios and per share amounts do not include net investment income of the underlying affiliated funds in which the fund invests. |
| (s) | From time to time the fund may receive proceeds from litigation settlements, without which performance would be lower. |
| (x) | The net asset values and total returns have been calculated on net assets which include adjustments made in accordance with U.S. generally accepted accounting principles required at period end for financial reporting purposes. |
See Notes to Financial Statements
MFS Moderate Allocation Portfolio
Notes to Financial Statements
(1) Business and Organization
MFS Moderate Allocation Portfolio (the fund) is a diversified series of MFS Variable Insurance Trust III (the trust). The trust is organized as a Delaware statutory trust and is registered under the Investment Company Act of 1940, as amended, as an open-end management investment company. The shareholders of each series of the trust are separate accounts of insurance companies, which offer variable annuity and/or life insurance products, and qualified retirement and pension plans.
The fund is an investment company and accordingly follows the investment company accounting and reporting guidance of the Financial Accounting Standards Board (FASB) Accounting Standards Codification Topic 946 Financial Services - Investment Companies.
(2) Significant Accounting Policies
General — The preparation of financial statements in conformity with U.S. generally accepted accounting principles requires management to make estimates and assumptions that affect the reported amounts of assets and liabilities, and disclosure of contingent assets and liabilities at the date of the financial statements and the reported amounts of increases and decreases in net assets from operations during the reporting period. Actual results could differ from those estimates. In the preparation of these financial statements, management has evaluated subsequent events occurring after the date of the fund’s Statement of Assets and Liabilities through the date that the financial statements were issued.
The fund is a “fund of funds”, which invests the majority of its assets in other MFS mutual funds (hereafter referred to as “underlying affiliated funds” or “underlying funds”), which may have different fiscal year ends than the funds. The underlying funds, in turn, may engage in a number of investment techniques and practices, which involve certain risks. Certain underlying funds invest their portfolio in high-yield securities rated below investment grade. Investments in below investment grade quality securities can involve a substantially greater risk of default or can already be in default, and their values can decline significantly. Below investment grade quality securities tend to be more sensitive to adverse news about the issuer, or the market or economy in general, than higher quality debt instruments. Certain underlying funds invest a significant portion of their assets in asset-backed and/or mortgage-backed securities. For these securities, the value of the debt instrument also depends on the credit quality and adequacy of the underlying assets or collateral as well as whether there is a security interest in the underlying assets or collateral. Enforcing rights, if any, against the underlying assets or collateral may be difficult. U.S. Government securities not supported as to the payment of principal or interest by the U.S. Treasury, such as those issued by Fannie Mae, Freddie Mac, and the Federal Home Loan Banks, are subject to greater credit risk than are U.S. Government securities supported by the U.S. Treasury, such as those issued by Ginnie Mae. Certain underlying funds invest in foreign securities, including securities of emerging market issuers. Investments in foreign securities are vulnerable to the effects of changes in the relative values of the local currency and the U.S. dollar and to the effects of changes in each country’s market, economic, industrial, political, regulatory, geopolitical, environmental, public health, and other conditions. Investments in emerging markets can involve additional and greater risks than the risks associated with investments in developed foreign markets. Emerging markets can have less developed markets, greater custody and operational risk, less developed legal, regulatory, and accounting, and auditing systems, greater government involvement in the economy, greater risk of new or inconsistent government treatment of or restrictions on issuers and instruments, and greater political, social, and economic instability than developed markets.
The accounting policies of the underlying funds in which the fund invests are outlined in the underlying funds’ shareholder reports, which are available without charge by calling 1-800-225-2606, at mfs.com and on the Securities and Exchange Commission (SEC) web site at http://www.sec.gov. The underlying funds' shareholder reports are not covered by this report.
Investment Valuations — Open-end investment companies (underlying funds) are generally valued at their net asset value per share. The investments of underlying funds managed by the adviser are valued as described below. For purposes of this policy disclosure, “fund” also refers to the underlying funds in which the fund-of-funds invests.
Subject to its oversight, the fund's Board of Trustees has delegated primary responsibility for determining or causing to be determined the value of the fund’s investments to MFS as the fund's adviser, pursuant to the fund’s valuation policy and procedures which have been adopted by the adviser and approved by the Board. Effective September 8, 2022, and in accordance with Rule 2a-5 under the Investment Company Act of 1940, the Board of Trustees designated the adviser as the “valuation designee” of the fund. If the adviser, as valuation designee, determines that reliable market quotations are not readily available for an investment, the investment is valued at fair value as determined in good faith by the adviser in accordance with the adviser’s fair valuation policy and procedures.
Under the fund's valuation policy and procedures, equity securities, including restricted equity securities and equity securities sold short, are generally valued at the last sale or official closing price on their primary market or exchange as provided by a third-party pricing service. Equity securities, for which there were no sales reported that day, are generally valued at the last quoted daily bid
MFS Moderate Allocation Portfolio
Notes to Financial Statements - continued
quotation on their primary market or exchange as provided by a third-party pricing service. Equity securities sold short, for which there were no sales reported that day, are generally valued at the last quoted daily ask quotation on their primary market or exchange as provided by a third-party pricing service. Debt instruments and floating rate loans, including restricted debt instruments, are generally valued at an evaluated or composite bid as provided by a third-party pricing service. Debt instruments sold short are generally valued at an evaluated or composite mean as provided by a third-party pricing service. Short-term instruments with a maturity at issuance of 60 days or less may be valued at amortized cost, which approximates market value. Exchange-traded options are generally valued at the last sale or official closing price on their primary exchange as provided by a third-party pricing service. Exchange-traded options for which there were no sales reported that day are generally valued at the last daily bid quotation on their primary exchange as provided by a third-party pricing service. For put options, the position may be valued at the last daily ask quotation if there are no trades reported during the day. Options not traded on an exchange are generally valued at a broker/dealer bid quotation. Foreign currency options are generally valued at valuations provided by a third-party pricing service. Futures contracts are generally valued at last posted settlement price on their primary exchange as provided by a third-party pricing service. Futures contracts for which there were no trades that day for a particular position are generally valued at the closing bid quotation on their primary exchange as provided by a third-party pricing service. Forward foreign currency exchange contracts are generally valued at the mean of bid and asked prices for the time period interpolated from rates provided by a third-party pricing service for proximate time periods. Swap agreements are generally valued using valuations provided by a third-party pricing service, which for cleared swaps includes an evaluation of any trading activity at the clearinghouses. Open-end investment companies are generally valued at net asset value per share. The values of foreign securities and other assets and liabilities expressed in foreign currencies are converted to U.S. dollars using the mean of bid and asked prices for rates provided by a third-party pricing service.
Under the fund’s valuation policy and procedures, market quotations are not considered to be readily available for debt instruments, floating rate loans, and many types of derivatives. These investments are generally valued at fair value based on information from third-party pricing services or otherwise determined by the adviser in accordance with the adviser’s fair valuation policy and procedures. Securities and other assets generally valued on the basis of information from a third-party pricing service may also be valued at a broker/dealer bid quotation. In determining values, third-party pricing services can utilize both transaction data and market information such as yield, quality, coupon rate, maturity, type of issue, trading characteristics, spreads and other market data. An investment may also be valued at fair value if the adviser determines that the investment’s value has been materially affected by events occurring after the close of the exchange or market on which the investment is principally traded (such as foreign exchange or market) and prior to the determination of the fund’s net asset value, or after the halt of trading of a specific security where trading does not resume prior to the close of the exchange or market on which the security is principally traded. Events that occur after foreign markets close (such as developments in foreign markets and significant movements in the U.S. markets) and prior to the determination of the fund’s net asset value may be deemed to have a material effect on the value of securities traded in foreign markets. Accordingly, the fund’s foreign equity securities may often be valued at fair value. The adviser generally relies on third-party pricing services or other information (such as the correlation with price movements of similar securities in the same or other markets; the type, cost and investment characteristics of the security; the business and financial condition of the issuer; and trading and other market data) to assist in determining whether to fair value and at what value to fair value an investment. The value of an investment for purposes of calculating the fund’s net asset value can differ depending on the source and method used to determine value. When fair valuation is used, the value of an investment used to determine the fund’s net asset value may differ from quoted or published prices for the same investment. There can be no assurance that the fund could obtain the fair value assigned to an investment if it were to sell the investment at the same time at which the fund determines its net asset value per share.
Various inputs are used in determining the value of the fund's assets or liabilities. These inputs are categorized into three broad levels. In certain cases, the inputs used to measure fair value may fall into different levels of the fair value hierarchy. In such cases, an investment's level within the fair value hierarchy is based on the lowest level of input that is significant to the fair value measurement. The fund's assessment of the significance of a particular input to the fair value measurement in its entirety requires judgment, and considers factors specific to the investment. Level 1 includes unadjusted quoted prices in active markets for identical assets or liabilities. Level 2 includes other significant observable market-based inputs (including quoted prices for similar securities, interest rates, prepayment speed, and credit risk). Level 3 includes significant unobservable inputs, which may include the adviser's own assumptions in determining the fair value of investments. The following is a summary of the levels used as of December 31, 2022 in valuing the fund's assets and liabilities:
| Financial Instruments | Level 1 | Level 2 | Level 3 | Total |
| Mutual Funds | $1,006,635,690 | $— | $— | $1,006,635,690 |
For further information regarding security characteristics, see the Portfolio of Investments. Please refer to the underlying funds’ shareholder reports for further information regarding the levels used in valuing the underlying funds’ assets and liabilities.
MFS Moderate Allocation Portfolio
Notes to Financial Statements - continued
Derivatives — The fund does not invest in derivatives directly. The fund does invest in underlying funds that may use derivatives primarily to increase or decrease exposure to a particular market or segment of the market, or security, to increase or decrease interest rate or currency exposure, or as alternatives to direct investments. Derivatives are used for hedging or non-hedging purposes. While hedging can reduce or eliminate losses, it can also reduce or eliminate gains. When the underlying funds use derivatives as an investment to increase market exposure, or for hedging purposes, gains and losses from derivative instruments may be substantially greater than the derivative’s original cost.
Indemnifications — Under the fund's organizational documents, its officers and Trustees may be indemnified against certain liabilities and expenses arising out of the performance of their duties to the fund. Additionally, in the normal course of business, the fund enters into agreements with service providers that may contain indemnification clauses. The fund's maximum exposure under these agreements is unknown as this would involve future claims that may be made against the fund that have not yet occurred.
Investment Transactions and Income — Investment transactions are recorded on the trade date. Interest income is recorded on the accrual basis. All premium and discount is amortized or accreted for financial statement purposes in accordance with U.S. generally accepted accounting principles. Distributions of income and capital gains from the underlying funds are recorded on the ex-dividend date. Recognition of net investment income by the fund is affected by the timing of the declaration of distributions by the underlying funds in which the fund invests. In determining the net gain or loss on securities sold, the cost of securities is determined on the identified cost basis.
The fund and/or the underlying funds may receive proceeds from litigation settlements. Any proceeds received from litigation involving portfolio holdings are reflected in the Statement of Operations in realized gain/loss if the security has been disposed of by the fund or in unrealized gain/loss if the security is still held by the fund. Any other proceeds from litigation not related to portfolio holdings are reflected as other income in the Statement of Operations.
Tax Matters and Distributions — The fund intends to qualify as a regulated investment company, as defined under Subchapter M of the Internal Revenue Code, and to distribute all of its taxable income, including realized capital gains. As a result, no provision for federal income tax is required. The fund’s federal tax returns, when filed, will remain subject to examination by the Internal Revenue Service for a three year period. Management has analyzed the fund’s tax positions taken on federal and state tax returns for all open tax years and does not believe that there are any uncertain tax positions that require recognition of a tax liability.
Distributions to shareholders are recorded on the ex-dividend date. Income and capital gain distributions are determined in accordance with income tax regulations, which may differ from U.S. generally accepted accounting principles. Certain capital accounts in the financial statements are periodically adjusted for permanent differences in order to reflect their tax character. These adjustments have no impact on net assets or net asset value per share. Temporary differences which arise from recognizing certain items of income, expense, gain or loss in different periods for financial statement and tax purposes will reverse at some time in the future.
Book/tax differences primarily relate to wash sale loss deferrals.
The tax character of distributions declared to shareholders for the last two fiscal years is as follows:
| | Year ended
12/31/22 | Year ended
12/31/21 |
| Ordinary income (including any short-term capital gains) | $22,417,778 | $31,407,050 |
| Long-term capital gains | 119,759,517 | 55,693,397 |
| Total distributions | $142,177,295 | $87,100,447 |
The federal tax cost and the tax basis components of distributable earnings were as follows:
| As of 12/31/22 | |
| Cost of investments | $972,826,233 |
| Gross appreciation | 124,258,839 |
| Gross depreciation | (90,449,382) |
| Net unrealized appreciation (depreciation) | $33,809,457 |
| Undistributed ordinary income | 23,961,917 |
| Undistributed long-term capital gain | 63,160,763 |
| Total distributable earnings (loss) | $120,932,137 |
MFS Moderate Allocation Portfolio
Notes to Financial Statements - continued
Multiple Classes of Shares of Beneficial Interest — The fund offers multiple classes of shares, which differ in their respective distribution and/or service fees. The fund's income, realized and unrealized gain (loss), and common expenses are allocated to shareholders based on the daily net assets of each class. Dividends are declared separately for each class. Differences in per share dividend rates are generally due to differences in separate class expenses. The fund’s distributions declared to shareholders as reported in the Statements of Changes in Net Assets are presented by class as follows:
| | Year
ended
12/31/22 | | Year
ended
12/31/21 |
| Initial Class | $1,045,404 | | $625,183 |
| Service Class | 141,131,891 | | 86,475,264 |
| Total | $142,177,295 | | $87,100,447 |
(3) Transactions with Affiliates
Investment Adviser — The fund has an investment advisory agreement with MFS to provide overall investment management and related administrative services and facilities to the fund. MFS receives no compensation under this agreement; however MFS receives management fees from the underlying MFS funds.
The investment adviser has agreed in writing to pay a portion of the fund’s operating expenses, excluding distribution and/or service fees, interest, taxes, extraordinary expenses, brokerage and transaction costs, and investment-related expenses such as fees and expenses associated with investments in investment companies and other similar investment vehicles such that fund operating expenses do not exceed 0.20% annually of the fund’s average daily net assets. This written agreement will continue until modified by the fund’s Board of Trustees, but such agreement will continue at least until April 30, 2024. For the year ended December 31, 2022, the fund’s actual operating expenses did not exceed the limit and therefore, the investment adviser did not pay any portion of the fund’s expenses related to this agreement.
In addition to the fees and expenses which the fund bears directly, the fund indirectly bears a pro rata share of the fees and expenses of the underlying funds in which the fund invests. Accordingly, the expense ratio for the fund reflects only those fees and expenses borne directly by the fund.
Distributor — MFS Fund Distributors, Inc. (MFD), a wholly-owned subsidiary of MFS, is the distributor of shares of the fund. The Trustees have adopted a distribution plan for the Service Class shares pursuant to Rule 12b-1 under the Investment Company Act of 1940.
The fund's distribution plan provides that the fund will pay MFD distribution and/or service fees equal to 0.25% per annum of its average daily net assets attributable to Service Class shares as partial consideration for services performed and expenses incurred by MFD and financial intermediaries (including participating insurance companies that invest in the fund to fund variable annuity and variable life insurance contracts, sponsors of qualified retirement and pension plans that invest in the fund, and affiliates of these participating insurance companies and plan sponsors) in connection with the sale and distribution of the Service Class shares. MFD may subsequently pay all, or a portion, of the distribution and/or service fees to financial intermediaries.
Shareholder Servicing Agent — MFS Service Center, Inc. (MFSC), a wholly-owned subsidiary of MFS, receives a fee from the fund for its services as shareholder servicing agent. For the year ended December 31, 2022, the fee was $16,712, which equated to 0.0015% annually of the fund's average daily net assets. MFSC also receives reimbursement from the fund for out-of-pocket expenses paid by MFSC on behalf of the fund. For the year ended December 31, 2022, these costs amounted to $171.
Administrator — MFS provides certain financial, legal, shareholder communications, compliance, and other administrative services to the fund. Under an administrative services agreement, the fund reimburses MFS the costs incurred to provide these services. The fund pays an annual fixed amount of $17,500. The administrative services fee incurred for the year ended December 31, 2022 was equivalent to an annual effective rate of 0.0016% of the fund's average daily net assets.
Trustees’ and Officers’ Compensation — The fund pays compensation to independent Trustees in the form of a retainer, attendance fees, and additional compensation to Board and Committee chairpersons. The fund does not pay compensation directly to Trustees or officers of the fund who are also officers of the investment adviser, all of whom receive remuneration from MFS for their services to the fund. Certain officers and Trustees of the fund are officers or directors of MFS, MFD, and MFSC.
Other — The fund invests in the MFS Institutional Money Market Portfolio which is managed by MFS and seeks current income consistent with preservation of capital and liquidity. This money market fund does not pay a management fee to MFS but does incur investment and operating costs.
MFS Moderate Allocation Portfolio
Notes to Financial Statements - continued
(4) Portfolio Securities
For the year ended December 31, 2022, purchases and sales of shares of underlying funds, excluding the MFS Institutional Money Market Portfolio, aggregated $28,193,221 and $164,323,252, respectively.
(5) Shares of Beneficial Interest
The fund's Declaration of Trust permits the Trustees to issue an unlimited number of full and fractional shares of beneficial interest. Transactions in fund shares were as follows:
| | Year ended
12/31/22 | | Year ended
12/31/21 |
| | Shares | Amount | | Shares | Amount |
| Shares sold | | | | | |
| Initial Class | 13,366 | $158,065 | | 100,307 | $1,443,545 |
| Service Class | 855,546 | 10,416,049 | | 306,006 | 4,390,844 |
| | 868,912 | $10,574,114 | | 406,313 | $5,834,389 |
Shares issued to shareholders
in reinvestment of distributions | | | | | |
| Initial Class | 96,797 | $1,045,404 | | 43,965 | $625,183 |
| Service Class | 13,043,613 | 141,131,891 | | 6,076,969 | 86,475,264 |
| | 13,140,410 | $142,177,295 | | 6,120,934 | $87,100,447 |
| Shares reacquired | | | | | |
| Initial Class | (29,785) | $(364,660) | | (70,317) | $(1,014,109) |
| Service Class | (12,104,547) | (144,178,840) | | (15,563,681) | (223,876,260) |
| | (12,134,332) | $(144,543,500) | | (15,633,998) | $(224,890,369) |
| Net change | | | | | |
| Initial Class | 80,378 | $838,809 | | 73,955 | $1,054,619 |
| Service Class | 1,794,612 | 7,369,100 | | (9,180,706) | (133,010,152) |
| | 1,874,990 | $8,207,909 | | (9,106,751) | $(131,955,533) |
(6) Line of Credit
The fund and certain other funds managed by MFS participate in a $1.45 billion unsecured committed line of credit of which $1.2 billion is reserved for use by the fund and certain other MFS U.S. funds. The line of credit is provided by a syndicate of banks under a credit agreement. Borrowings may be made for temporary financing needs. Interest is charged to each fund, based on its borrowings, generally at a rate equal to the highest of 1) Daily Simple SOFR (Secured Overnight Financing Rate) plus 0.10%, 2) the Federal Funds Effective Rate, or 3) the Overnight Bank Funding Rate, each plus an agreed upon spread. A commitment fee, based on the average daily unused portion of the committed line of credit, is allocated among the participating funds. The line of credit expires on March 16, 2023 unless extended or renewed. In addition, the fund and other funds managed by MFS have established unsecured uncommitted borrowing arrangements with certain banks for temporary financing needs. Interest is charged to each fund, based on its borrowings, at rates equal to customary reference rates plus an agreed upon spread. For the year ended December 31, 2022, the fund’s commitment fee and interest expense were $5,619 and $0, respectively, and are included in “Miscellaneous” expense in the Statement of Operations.
(7) Investments in Affiliated Issuers
An affiliated issuer may be considered one in which the fund owns 5% or more of the outstanding voting securities, or a company which is under common control. For the purposes of this report, the following were affiliated issuers:
| Affiliated Issuers | Beginning
Value | Purchases | Sales
Proceeds | Realized
Gain
(Loss) | Change in
Unrealized
Appreciation or
Depreciation | Ending
Value |
| MFS Global Governments Portfolio | $66,714,569 | $1,406,902 | $5,531,510 | $(1,293,942) | $(10,713,349) | $50,582,670 |
| MFS Global Real Estate Portfolio | 42,050,156 | 5,808,061 | 3,835,590 | 838,874 | (14,494,127) | 30,367,374 |
| MFS Government Securities Portfolio | 134,944,096 | 2,507,471 | 19,436,781 | (3,712,253) | (14,136,021) | 100,166,512 |
MFS Moderate Allocation Portfolio
Notes to Financial Statements - continued
| Affiliated Issuers − continued | Beginning
Value | Purchases | Sales
Proceeds | Realized
Gain
(Loss) | Change in
Unrealized
Appreciation or
Depreciation | Ending
Value |
| MFS Growth Series | $122,716,807 | $20,423,476 | $4,604,257 | $(1,481,736) | $(48,858,550) | $88,195,740 |
| MFS High Yield Portfolio | 68,185,130 | 3,112,432 | 10,882,836 | (2,463,530) | (7,638,003) | 50,313,193 |
| MFS Inflation-Adjusted Bond Portfolio | 67,626,116 | 8,108,649 | 5,490,491 | (321,212) | (19,412,396) | 50,510,666 |
| MFS Institutional Money Market Portfolio | 1,500,980 | 6,124,838 | 6,890,164 | 124 | 128 | 735,906 |
| MFS International Growth Portfolio | 41,247,180 | 2,251,754 | 4,841,204 | 355,444 | (8,599,050) | 30,414,124 |
| MFS International Intrinsic Value Portfolio | 41,185,739 | 3,554,133 | 2,938,902 | 19,066 | (11,393,545) | 30,426,491 |
| MFS Limited Maturity Portfolio | 54,135,043 | 1,112,691 | 11,835,387 | (558,733) | (2,650,549) | 40,203,065 |
| MFS Mid Cap Growth Series | 96,354,427 | 17,579,361 | 5,081,710 | (2,119,238) | (36,440,099) | 70,292,741 |
| MFS Mid Cap Value Portfolio | 97,152,435 | 7,509,531 | 18,792,794 | 3,184,210 | (18,275,149) | 70,778,233 |
| MFS New Discovery Series | 18,898,498 | 7,915,810 | 1,090,712 | (908,653) | (9,858,686) | 14,956,257 |
| MFS New Discovery Value Portfolio | 20,681,954 | 3,717,032 | 3,458,860 | 603,252 | (6,340,280) | 15,203,098 |
| MFS Research International Portfolio | 96,117,925 | 3,765,771 | 8,723,082 | 204,737 | (20,133,544) | 71,231,807 |
| MFS Research Series | 110,061,530 | 12,112,146 | 11,716,214 | 2,584,485 | (32,631,394) | 80,410,553 |
| MFS Total Return Bond Series | 162,364,517 | 5,560,395 | 20,409,554 | (2,667,422) | (24,242,755) | 120,605,181 |
| MFS Value Series | 124,350,782 | 7,564,858 | 25,653,382 | 6,899,101 | (21,919,280) | 91,242,079 |
| | $1,366,287,884 | $120,135,311 | $171,213,430 | $(837,426) | $(307,736,649) | $1,006,635,690 |
| Affiliated Issuers | Dividend
Income | Capital Gain
Distributions |
| MFS Global Governments Portfolio | $837,604 | $— |
| MFS Global Real Estate Portfolio | 904,377 | 1,991,174 |
| MFS Government Securities Portfolio | 2,258,498 | — |
| MFS Growth Series | 490,724 | 10,955,178 |
| MFS High Yield Portfolio | 3,097,420 | — |
| MFS Inflation-Adjusted Bond Portfolio | 2,807,776 | 2,976,291 |
| MFS Institutional Money Market Portfolio | 15,272 | — |
| MFS International Growth Portfolio | 375,641 | 1,756,417 |
| MFS International Intrinsic Value Portfolio | 386,891 | 1,341,379 |
| MFS Limited Maturity Portfolio | 874,576 | 170,838 |
| MFS Mid Cap Growth Series | — | 11,053,167 |
| MFS Mid Cap Value Portfolio | 1,876,159 | 5,320,825 |
| MFS New Discovery Series | 1,653,184 | 3,466,655 |
| MFS New Discovery Value Portfolio | 1,576,535 | 2,061,078 |
| MFS Research International Portfolio | 2,492,419 | 752,754 |
| MFS Research Series | 1,764,400 | 9,994,167 |
| MFS Total Return Bond Series | 3,644,496 | 1,535,910 |
| MFS Value Series | 1,859,520 | 5,541,200 |
| | $26,915,492 | $58,917,033 |
(8) LIBOR Transition
Certain of the fund's investments, including investments in certain debt instruments and derivatives (if any), as well as borrowings by the fund and certain other contractual arrangements of the fund, may be based on the London Interbank Offered Rate (“LIBOR”). In 2017, the regulatory authority that oversees financial services firms in the United Kingdom announced plans to transition away from LIBOR by the end of 2021. In March 2021, the administrator of LIBOR announced the extension of the publication of the more commonly used U.S. dollar LIBOR settings to the end of June 2023. Although the full impacts of the transition away from LIBOR are not fully known, the transition may result in, among other things, an increase in volatility or illiquidity of the markets for instruments
MFS Moderate Allocation Portfolio
Notes to Financial Statements - continued
that currently rely on LIBOR to determine interest rates and this could have an adverse impact on the fund's performance. With respect to the fund's accounting for investments, including investments in certain debt instruments and derivatives, as well as borrowings by the fund and any other contractual arrangements of the fund that undergo reference rate-related modifications as a result of the transition, management will rely upon the relief provided by FASB Codification Topic 848 – Reference Rate Reform (Topic 848). The guidance in Topic 848 permits the fund to account for those modified contracts as a continuation of the existing contracts. Management is still evaluating the impact to the fund of the June 30, 2023 planned discontinuation of the more commonly used U.S. dollar LIBOR settings.
(9) Russia and Ukraine Conflict
The market disruptions, which began in late February 2022, associated with geopolitical events related to the conflict between Russia and Ukraine may adversely affect the value of the fund’s assets and thus the fund’s performance. Management continues to monitor these events and to evaluate the related impacts, if any, to the fund.
MFS Moderate Allocation Portfolio
Report of Independent Registered Public Accounting Firm
To the Board of Trustees of MFS Variable Insurance Trust III and the Shareholders of MFS Moderate Allocation Portfolio:
Opinion on the Financial Statements and Financial Highlights
We have audited the accompanying statement of assets and liabilities of MFS Moderate Allocation Portfolio (the “Fund”), including the portfolio of investments, as of December 31, 2022, the related statement of operations for the year then ended, the statements of changes in net assets for each of the two years in the period then ended, the financial highlights for each of the five years in the period then ended, and the related notes. In our opinion, the financial statements and financial highlights present fairly, in all material respects, the financial position of the Fund as of December 31, 2022, and the results of its operations for the year then ended, the changes in its net assets for each of the two years in the period then ended, and the financial highlights for each of the five years in the period then ended, in conformity with accounting principles generally accepted in the United States of America.
Basis for Opinion
These financial statements and financial highlights are the responsibility of the Fund's management. Our responsibility is to express an opinion on the Fund's financial statements and financial highlights based on our audits. We are a public accounting firm registered with the Public Company Accounting Oversight Board (United States) (PCAOB) and are required to be independent with respect to the Fund in accordance with the U.S. federal securities laws and the applicable rules and regulations of the Securities and Exchange Commission and the PCAOB.
We conducted our audits in accordance with the standards of the PCAOB. Those standards require that we plan and perform the audit to obtain reasonable assurance about whether the financial statements and financial highlights are free of material misstatement, whether due to error or fraud. The Fund is not required to have, nor were we engaged to perform, an audit of its internal control over financial reporting. As part of our audits, we are required to obtain an understanding of internal control over financial reporting but not for the purpose of expressing an opinion on the effectiveness of the Fund's internal control over financial reporting. Accordingly, we express no such opinion.
Our audits included performing procedures to assess the risks of material misstatement of the financial statements and financial highlights, whether due to error or fraud, and performing procedures that respond to those risks. Such procedures included examining, on a test basis, evidence regarding the amounts and disclosures in the financial statements and financial highlights. Our audits also included evaluating the accounting principles used and significant estimates made by management, as well as evaluating the overall presentation of the financial statements and financial highlights. Our procedures included confirmation of securities owned as of December 31, 2022, by correspondence with the transfer agent. We believe that our audits provide a reasonable basis for our opinion.
DELOITTE & TOUCHE LLP
Boston, Massachusetts
February 15, 2023
We have served as the auditor of one or more of the MFS investment companies since 1924.
MFS Moderate Allocation Portfolio
Trustees and Officers — Identification and Background
The Trustees and Officers of the Trust, as of February 1, 2023, are listed below, together with their principal occupations during the past five years. (Their titles may have varied during that period.) The address of each Trustee and Officer is 111 Huntington Avenue, Boston, Massachusetts 02199-7618.
| Name, Age | | Position(s) Held with Fund | | Trustee/Officer Since(h) | | Number of MFS Funds overseen by the Trustee | | Principal Occupations During
the Past Five Years | | Other Directorships During
the Past Five Years (j) |
| INTERESTED TRUSTEE | | | | | | | | | | |
Michael W. Roberge (k)
(age 56) | | Trustee | | January 2021 | | 136 | | Massachusetts Financial Services Company, Chairman (since January 2021); Chief Executive Officer (since January 2017); Director; Chairman of the Board (since January 2022); President (until December 2018); Chief Investment Officer (until December 2018) | | N/A |
| INDEPENDENT TRUSTEES | | | | | | | | | | |
John P. Kavanaugh
(age 68) | | Trustee and Chair of Trustees | | January 2009 | | 136 | | Private investor | | N/A |
Steven E. Buller
(age 71) | | Trustee | | February 2014 | | 136 | | Private investor | | N/A |
John A. Caroselli
(age 68) | | Trustee | | March 2017 | | 136 | | Private investor; JC Global Advisors, LLC (management consulting), President (since 2015) | | N/A |
Maureen R. Goldfarb
(age 67) | | Trustee | | January 2009 | | 136 | | Private investor | | N/A |
Peter D. Jones
(age 67) | | Trustee | | January 2019 | | 136 | | Private investor | | N/A |
James W. Kilman, Jr.
(age 61) | | Trustee | | January 2019 | | 136 | | Burford Capital Limited (finance and investment management), Senior Advisor (since May 3, 2021), Chief Financial Officer (2019 - May 2, 2021); KielStrand Capital LLC (family office), Chief Executive Officer (since 2016) | | Alpha-En Corporation, Director (2016-2019) |
Clarence Otis, Jr.
(age 66) | | Trustee | | March 2017 | | 136 | | Private investor | | VF Corporation, Director; Verizon Communications, Inc., Director; The Travelers Companies, Director |
Maryanne L. Roepke
(age 66) | | Trustee | | May 2014 | | 136 | | Private investor | | N/A |
Laurie J. Thomsen
(age 65) | | Trustee | | March 2005 | | 136 | | Private investor | | The Travelers Companies, Director; Dycom Industries, Inc., Director |
MFS Moderate Allocation Portfolio
Trustees and Officers - continued
| Name, Age | | Position(s) Held with
Fund | | Trustee/Officer Since(h) | | Number of MFS Funds for which the Person is an Officer | | Principal Occupations During
the Past Five Years |
| OFFICERS | | | | | | | | |
Christopher R. Bohane (k)
(age 49) | | Assistant Secretary and Assistant Clerk | | July 2005 | | 136 | | Massachusetts Financial Services Company, Senior Vice President and Senior Managing Counsel |
Kino Clark (k)
(age 54) | | Assistant Treasurer | | January 2012 | | 136 | | Massachusetts Financial Services Company, Vice President |
John W. Clark, Jr. (k)
(age 55) | | Assistant Treasurer | | April 2017 | | 136 | | Massachusetts Financial Services Company, Vice President |
David L. DiLorenzo (k)
(age 54) | | President | | July 2005 | | 136 | | Massachusetts Financial Services Company, Senior Vice President |
Heidi W. Hardin (k)
(age 55) | | Secretary and Clerk | | April 2017 | | 136 | | Massachusetts Financial Services Company, Executive Vice President and General Counsel |
Brian E. Langenfeld (k)
(age 49) | | Assistant Secretary and Assistant Clerk | | June 2006 | | 136 | | Massachusetts Financial Services Company, Vice President and Managing Counsel |
Rosa E. Licea-Mailloux (k)
(age 46) | | Chief Compliance Officer | | March 2022 | | 136 | | Massachusetts Financial Services Company, Vice President (since 2018); Director of Corporate Compliance (2018-2021), Senior Director Compliance (2021-2022), Senior Managing Director of North American Compliance & Chief Compliance Officer (since March 2022); Natixis Investment Managers (investment management), Funds Chief Compliance Officer, Deputy General Counsel & Senior Vice President (until 2018) |
Amanda S. Mooradian (k)
(age 43) | | Assistant Secretary and Assistant Clerk | | September 2018 | | 136 | | Massachusetts Financial Services Company, Assistant Vice President and Senior Counsel |
Susan A. Pereira (k)
(age 52) | | Assistant Secretary and Assistant Clerk | | July 2005 | | 136 | | Massachusetts Financial Services Company, Vice President and Managing Counsel |
Kasey L. Phillips (k)
(age 52) | | Assistant Treasurer | | September 2012 | | 136 | | Massachusetts Financial Services Company, Vice President |
Matthew A. Stowe (k)
(age 48) | | Assistant Secretary and Assistant Clerk | | October 2014 | | 136 | | Massachusetts Financial Services Company, Vice President and Senior Managing Counsel |
William B. Wilson (k)
(age 40) | | Assistant Secretary and Assistant Clerk | | October 2022 | | 136 | | Massachusetts Financial Services Company, Assistant Vice President and Counsel |
James O. Yost (k)
(age 62) | | Treasurer | | September 1990 | | 136 | | Massachusetts Financial Services Company, Senior Vice President |
| (h) | Date first appointed to serve as Trustee/Officer of an MFS Fund. Each Trustee has served continuously since appointment unless indicated otherwise. From January 2012 through December 2016, Messrs. DiLorenzo and Yost served as Treasurer and Deputy Treasurer of the Funds, respectively. |
| (j) | Directorships or trusteeships of companies required to report to the Securities and Exchange Commission (i.e., “public companies”). |
| (k) | “Interested person” of the Trust within the meaning of the Investment Company Act of 1940 (referred to as the 1940 Act), which is the principal federal law governing investment companies like the fund, as a result of a position with MFS. The address of MFS is 111 Huntington Avenue, Boston, Massachusetts 02199-7618. |
Each Trustee (other than Messrs. Jones, Kilman and Roberge) has been elected by shareholders and each Trustee and Officer holds office until his or her successor is chosen and qualified or until his or her earlier death, resignation, retirement or removal. Mr. Roberge became a Trustee of the Funds on January 1, 2021 and Messrs. Jones and Kilman became Trustees of the Funds on January 1, 2019. The Trust does not hold annual meetings for the purpose of electing Trustees, and Trustees are not elected for fixed terms. Under the terms of the Board's retirement policy, an Independent Trustee shall retire at the end of the calendar year in which he or she reaches the earlier of 75 years of age or 15 years of service on the Board (or, in the case of any Independent Trustee who joined the Board prior to 2015, 20 years of service on the Board).
MFS Moderate Allocation Portfolio
Trustees and Officers - continued
Messrs. Buller, Kilman and Otis and Ms. Roepke are members of the Trust’s Audit Committee.
Each of the Interested Trustees and certain Officers hold comparable officer positions with certain affiliates of MFS.
The Statement of Additional Information for a Fund includes further information about the Trustees and is available without charge upon request by calling 1-800-225-2606.
| Investment Adviser | Custodian |
Massachusetts Financial Services Company
111 Huntington Avenue
Boston, MA 02199-7618 | State Street Bank and Trust Company
1 Lincoln Street
Boston, MA 02111-2900 |
| Distributor | Independent Registered Public Accounting Firm |
MFS Fund Distributors, Inc.
111 Huntington Avenue
Boston, MA 02199-7618 | Deloitte & Touche LLP
200 Berkeley Street
Boston, MA 02116 |
| Portfolio Manager(s) | |
Joseph Flaherty
Natalie Shapiro | |
MFS Moderate Allocation Portfolio
Board Review of Investment Advisory Agreement
MFS Moderate Allocation Portfolio
The Investment Company Act of 1940 requires that both the full Board of Trustees and a majority of the non-interested (“independent”) Trustees, voting separately, annually approve the continuation of the Fund’s investment advisory agreement with MFS. The Trustees consider matters bearing on the Fund and its advisory arrangements at their meetings throughout the year, including a review of performance data at each regular meeting. In addition, the independent Trustees met several times over the course of three months beginning in May and ending in July, 2022 (“contract review meetings”) for the specific purpose of considering whether to approve the continuation of the investment advisory agreement for the Fund and the other investment companies that the Board oversees (the “MFS Funds”). The independent Trustees were assisted in their evaluation of the Fund’s investment advisory agreement by independent legal counsel, from whom they received separate legal advice and with whom they met separately from MFS during various contract review meetings. The independent Trustees were also assisted in this process by an independent consultant who was retained by and reported to the independent Trustees.
In connection with their deliberations regarding the continuation of the investment advisory agreement, the Trustees, including the independent Trustees, considered such information and factors as they believed, in light of the legal advice furnished to them and their own business judgment, to be relevant. The investment advisory agreement for the Fund was considered separately, although the Trustees also took into account the common interests of all MFS Funds in their review. As described below, the Trustees considered the nature, quality, and extent of the various investment advisory, administrative, and shareholder services performed by MFS under the existing investment advisory agreement and other arrangements with the Fund.
In connection with their contract review meetings, the Trustees received and relied upon materials that included, among other items: (i) information provided by Broadridge Financial Solutions, Inc. (“Broadridge”), an independent third party, on the investment performance of the Fund for various time periods ended December 31, 2021 and the investment performance of a group of funds with substantially similar investment classifications/objectives (the “Broadridge performance universe”), (ii) information provided by Broadridge on the Fund’s fees and expenses and the fees and expenses of comparable funds identified by Broadridge as well as all other funds in the same investment classification/category (the “Broadridge expense group and universe”), (iii) information as to whether and to what extent applicable expense waivers and reimbursements are observed for the Fund, (iv) information regarding MFS’ financial results and financial condition, including MFS’ and certain of its affiliates’ estimated profitability from services performed for the Fund and the MFS Funds as a whole, and compared to MFS’ institutional business, (v) MFS’ views regarding the outlook for the mutual fund industry and the strategic business plans of MFS, (vi) descriptions of various functions performed by MFS for the Funds, such as compliance monitoring and portfolio trading practices, and (vii) information regarding the overall organization of MFS, including information about MFS’ senior management and other personnel providing investment advisory, administrative and other services to the Fund and the other MFS Funds. The comparative performance, fee and expense information prepared and provided by Broadridge was not independently verified and the independent Trustees did not independently verify any information provided to them by MFS.
The Trustees’ conclusion as to the continuation of the investment advisory agreement was based on a comprehensive consideration of all information provided to the Trustees and not the result of any single factor. Some of the factors that figured particularly in the Trustees’ deliberations are described below, although individual Trustees may have evaluated the information presented differently from one another, giving different weights to various factors. It is also important to recognize that the fee arrangements for the Fund and other MFS Funds are the result of years of review and discussion between the independent Trustees and MFS, that certain aspects of such arrangements may receive greater scrutiny in some years than in others, and that the Trustees’ conclusions may be based, in part, on their consideration of these same arrangements during the course of the year and in prior years.
Based on information provided by Broadridge and MFS, the Trustees reviewed the Fund’s total return investment performance as well as the Broadridge performance universe over various time periods. The Trustees placed particular emphasis on the total return performance of the Fund’s Initial Class shares in comparison to the performance of funds in its Broadridge performance universe over the five-year period ended December 31, 2021, which the Trustees believed was a long enough period to reflect differing market conditions. The total return performance of the Fund’s Initial Class shares was in the 2nd quintile relative to the other funds in the universe for this five-year period (the 1st quintile being the best performers and the 5th quintile being the worst performers). The total return performance of the Fund’s Initial Class shares was in the 4th quintile for the one-year period and the 2nd quintile for the three-year period ended December 31, 2021 relative to the Broadridge performance universe. Because of the passage of time, these performance results may differ from the performance results for more recent periods, including those shown elsewhere in this report.
In the course of their deliberations, the Trustees took into account information provided by MFS in connection with the contract review meetings, as well as during investment review meetings conducted with portfolio management personnel during the course of the year regarding the Fund’s performance. After reviewing these and related factors, the Trustees concluded, within the context of their overall conclusions regarding the investment advisory agreement, that they were satisfied with MFS’ responses and efforts relating to investment performance.
MFS Moderate Allocation Portfolio
Board Review of Investment Advisory Agreement - continued
The Trustees considered that MFS does not charge an advisory fee for providing investment advisory services to the Fund, but that the Fund pays its pro rata share of the advisory fees paid by the underlying funds in which it invests (the “Underlying Funds”).
In assessing the reasonableness of the Fund’s expenses, the Trustees considered, among other information, the Fund’s total expense ratio of the Fund’s Initial Class shares as a percentage of average daily net assets and the total expense ratios of the Broadridge expense group based on information provided by Broadridge. The Trustees considered that MFS currently observes an expense limitation for the Fund, which may not be changed without the Trustees’ approval. The Trustees also considered that, according to the data provided by Broadridge (which takes into account any expense limitations that were in effect during the Fund’s last fiscal year), the Fund’s total expense ratio was lower than the Broadridge expense group median. Because the Fund does not pay an advisory fee, the Trustees did not consider the extent to which economies of scale would be realized due to the Fund’s growth of assets, whether fee levels reflect economies of scale for shareholders, or the fees paid by similar funds to other investment advisers or by similar clients of MFS.
The Trustees also considered information prepared by MFS relating to MFS’ costs and profits with respect to the Fund, the MFS Funds considered as a group, and other investment companies and accounts advised by MFS, as well as MFS’ methodologies used to determine and allocate its costs to the MFS Funds, the Fund and other accounts and products for purposes of estimating profitability.
In addition, the Trustees considered MFS’ resources and related efforts to continue to retain, attract and motivate capable personnel to serve the Fund. The Trustees also considered current and developing conditions in the financial services industry, including the presence of large and well-capitalized companies which are spending, and appear to be prepared to continue to spend, substantial sums to engage personnel and to provide services to competing investment companies. In this regard, the Trustees also considered the financial resources of MFS and its ultimate parent, Sun Life Financial Inc. The Trustees also considered the advantages and possible disadvantages to the Fund of having an adviser that also serves other investment companies as well as other accounts.
The Trustees also considered the nature, quality, cost, and extent of administrative, transfer agency, and distribution services provided to the Fund by MFS and its affiliates under agreements and plans other than the investment advisory agreement, including any 12b-1 fees the Fund pays to MFS Fund Distributors, Inc., an affiliate of MFS. The Trustees also considered the nature, extent and quality of certain other services MFS performs or arranges for on the Fund’s or the Underlying Funds’ behalf, which may include securities lending programs, directed expense payment programs, class action recovery programs, and MFS’ interaction with third-party service providers, principally custodians and sub-custodians. The Trustees concluded that the various non-advisory services provided by MFS and its affiliates on behalf of the Fund were satisfactory.
The Trustees considered so-called “fall-out benefits” to MFS such as reputational value derived from serving as investment manager to the MFS Funds. The Trustees also considered that MFS discontinued its historic practice of obtaining investment research from portfolio brokerage commissions paid by certain MFS Funds effective January 2018, and directly pays or voluntarily reimburses a Fund, if applicable, for the costs of external research acquired through the use of the Fund’s portfolio brokerage commissions.
Based on their evaluation of factors that they deemed to be material, including those factors described above, the Board of Trustees, including the independent Trustees, concluded that the Fund’s investment advisory agreement with MFS should be continued for an additional one-year period, commencing August 1, 2022.
MFS Moderate Allocation Portfolio
Proxy Voting Policies and Information
MFS votes proxies on behalf of the fund pursuant to proxy voting policies and procedures that are available without charge, upon request, by calling 1-800-225-2606, by visiting mfs.com/proxyvoting, or by visiting the SEC’s Web site at http://www.sec.gov.
Information regarding how the fund voted proxies relating to portfolio securities during the most recent twelve-month period ended June 30 is available by August 31 of each year without charge by visiting mfs.com/proxyvoting, or by visiting the SEC’s Web site at http://www.sec.gov.
Quarterly Portfolio Disclosure
The fund files a complete schedule of portfolio holdings with the SEC for the first and third quarters of each fiscal year as an exhibit to its reports on Form N-PORT. The fund’s Form N-PORT reports are available on the SEC’s Web site at http://www.sec.gov. A shareholder can obtain the portfolio holdings report for the first and third quarters of the fund's fiscal year at mfs.com/vit3 by choosing the fund's name and then scrolling to the “Resources” section and clicking on the “Prospectus and Reports” tab.
FURTHER INFORMATION
From time to time, MFS may post important information about the fund or the MFS Funds on the MFS Web site (mfs.com). This information is available at https://www.mfs.com/announcements or at mfs.com/vit3 by choosing the fund's name and then scrolling to the “Resources” section and clicking on the “Announcements” tab, if any.
Information About Fund Contracts and Legal Claims
The fund has entered into contractual arrangements with an investment adviser, administrator, distributor, shareholder servicing agent, and custodian who each provide services to the fund. Unless expressly stated otherwise, shareholders are not parties to, or intended beneficiaries of these contractual arrangements, and these contractual arrangements are not intended to create any shareholder right to enforce them against the service providers or to seek any remedy under them against the service providers, either directly or on behalf of the fund.
Under the Trust’s By-Laws and Declaration of Trust, any claims asserted against or on behalf of the MFS Funds, including claims against Trustees and Officers, must be brought in state and federal courts located within the Commonwealth of Massachusetts.
Federal Tax Information (unaudited)
The following information is provided pursuant to provisions of the Internal Revenue Code.
The fund designates $131,736,000 as capital gain dividends paid during the fiscal year.
For corporate shareholders, 19.50% of the ordinary income dividends paid during the fiscal year qualify for the corporate dividends received deduction.
The fund intends to pass through the maximum amount allowable as Section 163(j) Interest Dividends as defined in Treasury Regulation §1.163(j)-1(b).
| FACTS | WHAT DOES MFS DO WITH YOUR PERSONAL INFORMATION? |
| Why? | Financial companies choose how they share your personal information. Federal law gives consumers the right to limit some but not all sharing. Federal law also requires us to tell you how we collect, share, and protect your personal information. Please read this notice carefully to understand what we do. |
| What? | The types of personal information we collect and share depend on the product or service you have with us. This information can include: |
| • Social Security number and account balances |
| • Account transactions and transaction history |
| • Checking account information and wire transfer instructions |
| When you are no longer our customer, we continue to share your information as described in this notice. |
| How? | All financial companies need to share customers' personal information to run their everyday business. In the section below, we list the reasons financial companies can share their customers' personal information; the reasons MFS chooses to share; and whether you can limit this sharing. |
Reasons we can share your
personal information | Does MFS share? | Can you limit
this sharing? |
For our everyday business purposes –
such as to process your transactions, maintain your
account(s), respond to court orders and legal
investigations, or report to credit bureaus | Yes | No |
For our marketing purposes –
to offer our products and services to you | No | We don't share |
For joint marketing with other
financial companies | No | We don't share |
For our affiliates' everyday business purposes –
information about your transactions and experiences | No | We don't share |
For our affiliates' everyday business purposes –
information about your creditworthiness | No | We don't share |
| For nonaffiliates to market to you | No | We don't share |
| Questions? | Call 800-225-2606 or go to mfs.com. |
| Who we are |
| Who is providing this notice? | MFS Funds, MFS Investment Management, MFS Institutional Advisors, Inc., and MFS Heritage Trust Company. |
| What we do |
How does MFS
protect my personal
information? | To protect your personal information from unauthorized access and use, we use security measures that comply with federal law. These measures include procedural, electronic, and physical safeguards for the protection of the personal information we collect about you. |
How does MFS
collect my personal
information? | We collect your personal information, for example, when you |
| • open an account or provide account information |
| • direct us to buy securities or direct us to sell your securities |
| • make a wire transfer |
| We also collect your personal information from others, such as credit bureaus, affiliates, or other companies. |
| Why can't I limit all sharing? | Federal law gives you the right to limit only |
| • sharing for affiliates' everyday business purposes – information about your creditworthiness |
| • affiliates from using your information to market to you |
| • sharing for nonaffiliates to market to you |
| State laws and individual companies may give you additional rights to limit sharing. |
| Definitions |
| Affiliates | Companies related by common ownership or control. They can be financial and nonfinancial companies. |
| • MFS does not share personal information with affiliates, except for everyday business purposes as described on page one of this notice. |
| Nonaffiliates | Companies not related by common ownership or control. They can be financial and nonfinancial companies. |
| • MFS does not share with nonaffiliates so they can market to you. |
| Joint marketing | A formal agreement between nonaffiliated financial companies that together market financial products or services to you. |
| • MFS doesn't jointly market. |
| Other important information |
| If you own an MFS product or receive an MFS service in the name of a third party such as a bank or broker-dealer, their privacy policy may apply to you instead of ours. |
Annual Report
December 31, 2022
MFS® Blended Research®
Small Cap Equity Portfolio
MFS® Variable Insurance Trust III
MFS® Blended Research® Small Cap Equity Portfolio
| 1 |
| 2 |
| 3 |
| 5 |
| 7 |
| 8 |
| 14 |
| 15 |
| 16 |
| 17 |
| 19 |
| 25 |
| 26 |
| 29 |
| 31 |
| 31 |
| 31 |
| 31 |
| 31 |
| 32 |
The report is prepared for the general information of shareholders. It is authorized for distribution to prospective investors only when preceded or accompanied by a current prospectus.
NOT FDIC INSURED • MAY LOSE VALUE • NO BANK OR CREDIT UNION GUARANTEE •
NOT A DEPOSIT • NOT INSURED BY ANY FEDERAL GOVERNMENT AGENCY OR NCUA/NCUSIF
MFS Blended Research Small Cap Equity Portfolio
LETTER FROM THE CHAIR AND CEO
Dear Shareholders:
Signs of peaking inflation, hopes that monetary policy tightening cycles may be nearing an end and a rapid reopening of China’s economy in late-2022 and early-2023 have combined to bolster investor sentiment in recent months. Markets have largely adjusted to the challenges posed by Russia’s invasion of Ukraine, thanks in part to mild European winter weather which has alleviated concerns over potential shortages of natural gas. Resilient labor markets in much of the developed world have further contributed to a brighter-than-expected economic backdrop. However, many investors are mindful that the lagged effects of ongoing policy tightening have yet to work their way through the global economy.
Tighter global financial conditions have been a particular headwind for richly valued growth equities and interest rate-sensitive parts of the economy, such as housing. Over the near term, companies may face a challenging earnings backdrop as they are forced to absorb higher input and labor costs at a time of dwindling pricing power. For fixed income, the rise in interest rates has made bonds more attractive than they have been in years, which may provide balance to an overall portfolio.
During times of market transition, it is important to have a deep understanding of company fundamentals, and we have built our unique global research platform to do just that.
At MFS®, we put our clients’ assets to work responsibly by carefully navigating increasingly complex global capital markets. Our investment team is guided by a commitment to long-term fundamental investing. Our global investment platform — combining collective expertise, long-term discipline, and thoughtful risk management — seeks to uncover what we believe are the best, most durable investment ideas in markets around the world, enabling us to potentially create value for investors.
Respectfully,
Michael W. Roberge
Chair and Chief Executive Officer
MFS Investment Management
February 15, 2023
The opinions expressed in this letter are subject to change and may not be relied upon for investment advice. No forecasts can be guaranteed.
MFS Blended Research Small Cap Equity Portfolio
Top ten holdings
| Prestige Consumer Healthcare, Inc. | 1.9% |
| Portland General Electric Co. | 1.8% |
| Reinsurance Group of America, Inc. | 1.7% |
| Box, Inc., “A” | 1.6% |
| Grand Canyon Education, Inc. | 1.5% |
| Cathay General Bancorp, Inc. | 1.5% |
| SLM Corp. | 1.5% |
| Magnolia Oil & Gas Corp., “A” | 1.5% |
| Silicon Laboratories, Inc. | 1.4% |
| Umpqua Holdings Corp. | 1.4% |
GICS equity sectors (g)
| Health Care | 17.2% |
| Financials | 16.6% |
| Industrials | 16.0% |
| Information Technology | 13.0% |
| Consumer Discretionary | 11.8% |
| Real Estate | 7.5% |
| Energy | 6.3% |
| Materials | 3.9% |
| Communication Services | 2.4% |
| Utilities | 2.3% |
| Consumer Staples | 2.1% |
| (g) | The Global Industry Classification Standard (GICS®) was developed by and/or is the exclusive property of MSCI, Inc. and S&P Global Market Intelligence Inc. (“S&P Global Market Intelligence”). GICS is a service mark of MSCI and S&P Global Market Intelligence and has been licensed for use by MFS. MFS has applied its own internal sector/industry classification methodology for equity securities and non-equity securities that are unclassified by GICS. |
Cash & Cash Equivalents includes any cash, investments in money market funds, short-term securities, and other assets less liabilities. Please see the Statement of Assets and Liabilities for additional information related to the fund’s cash position and other assets and liabilities.
Percentages are based on net assets as of December 31, 2022.
The portfolio is actively managed and current holdings may be different.
MFS Blended Research Small Cap Equity Portfolio
Management Review
Summary of Results
For the twelve months ended December 31, 2022, Initial Class shares of the MFS Blended Research Small Cap Equity Portfolio (fund) provided a total return of -18.37%, while Service Class shares of the fund provided a total return of -18.56%. These compare with a return of -20.44% over the same period for the fund’s benchmark, the Russell 2000® Index.
Market Environment
During the reporting period, markets continued to grapple with the strongest global inflationary pressures in decades along with signs of slowing economic growth. Intermittent coronavirus flareups, particularly in China, where home-grown vaccines have proved less effective than elsewhere, kept supply chains stretched for a considerable period. At the same time, the reopening of the economy in the parts of the world where the virus has been better contained has led to a shift in consumption patterns in favor of services, straining already tight labor markets in most developed economies, while reducing demand for manufactured goods, primarily from Asia. As a result of Russia’s invasion of Ukraine, geopolitical considerations, such as sanctions and trade bans, have resulted in additional supply chain disruptions and volatile global energy prices. Taken together, these factors have contributed to market volatility.
The ripple effects from the Russian invasion further complicated the mission central banks must undertake to rein in surging inflation. Energy shocks have historically resulted in global growth slowdowns, if not pullbacks, so policymakers will find themselves in the difficult position of trying to restrain inflation without tipping economies into recession. Despite the challenging macroeconomic and geopolitical environment, policymakers remained focused on controlling inflation, although investors appeared to have expected varying degrees of action from the central banks. The Fed has been among the most aggressive developed market central banks, tightening policy at the fastest rate in decades, although it slowed its hiking pace at the end of the period, as did the European Central Bank. After remaining on the monetary sidelines for much of the period, the Bank of Japan widened its Yield Curve Control band, capping the yield on its 10-year bond at 0.5%, up from 0.25%, an action investors interpreted as a first step toward monetary policy normalization.
Against an environment of still-tight labor markets, tighter global financial conditions and volatile materials prices, investor anxiety appeared to have increased over the potential that corporate profit margins may be past peak for this cycle. That said, tentative signs that supply chain bottlenecks (particularly semiconductors) may be moderating, the easing of COVID restrictions in China, low levels of unemployment across developed markets and hopes that inflation levels may be near a peak were supportive factors for the macroeconomic backdrop.
Contributors to Performance
Security selection within both the consumer discretionary and information technology sectors contributed to the fund’s performance relative to the Russell 2000® Index. Within the consumer discretionary sector, the fund’s holdings of strong-performing educational services provider Grand Canyon Education(b) aided relative returns. The stock price of Grand Canyon Education rose as the company reported higher-than-expected revenue and increased its traditional campus student enrollment. Within the information technology sector, the fund’s overweight position in enterprise content platform Box also bolstered relative returns. The stock price of Box advanced as the company posted strong operating results and expanded its line of comprehensive suite products.
Stock selection in the financials sector further helped relative performance, driven by the fund’s holdings of reinsurer Reinsurance Group of America(b).
Elsewhere, the fund’s overweight positions in coal mining company Peabody Energy(h), oil and gas exploration company Magnolia Oil & Gas, sweet goods producer Hostess Brands, oil and gas technology solutions and equipment provider ChampionX and coal mining company CONSOL Energy aided relative returns. The stock price of ChampionX rose as the company delivered above-consensus earnings, driven by higher-than-expected revenues in its production chemical technologies segment. The company also announced an increase in its share buyback program, which further supported the share price. Additionally, the fund’s holdings of strong-performing chemical company Chemours(b) and industrial and specialty chemicals distributor Univar(b) also helped relative results.
Detractors from Performance
Security selection within both the health care and real estate sectors detracted from the fund’s relative performance. Within the health care sector, the fund’s holdings of life sciences company Maravai Lifesciences Holdings(b) and clinical development company Syneos Health(b) hindered relative returns. The stock price of Syneos Health fell as the company reported lower-than-expected revenue and depressed margins. The fund’s overweight positions in immune medicine developer Adaptive Biotechnologies, direct-to-consumer healthcare apparel seller FIGS, regenerative medical company Organogenesis Holdings and medical technology
MFS Blended Research Small Cap Equity Portfolio
Management Review - continued
company Bioventus further weighed on relative results. Within the real estate sector, the fund’s overweight positions in industrial property manager Innovative Industrial Properties(h) and self-storage property manager National Storage Affiliates Trust detracted from relative performance. Although Innovative Industrial Properties released financial results that beat estimates, the stock price declined after the company announced a dividend cut.
Elsewhere, the fund’s overweight position in event management services provider Eventbrite, and holdings of poor-performing digital outsourcing services provider TaskUs(b), hindered relative returns. The stock price of TaskUs fell as the company reduced its forward guidance and shed clients due to a softening of the cryptocurrency market.
Respectfully,
Portfolio Manager(s)
Jim Fallon, Matt Krummell, Jonathan Sage, and Jed Stocks
| (b) | Security is not a benchmark constituent. |
| (h) | Security was not held in the portfolio at period end. |
The views expressed in this report are those of the portfolio manager(s) only through the end of the period of the report as stated on the cover and do not necessarily reflect the views of MFS or any other person in the MFS organization. These views are subject to change at any time based on market or other conditions, and MFS disclaims any responsibility to update such views. These views may not be relied upon as investment advice or an indication of trading intent on behalf of any MFS portfolio. References to specific securities are not recommendations of such securities, and may not be representative of any MFS portfolio’s current or future investments.
MFS Blended Research Small Cap Equity Portfolio
Performance Summary Through 12/31/22
The following chart illustrates the historical performance of the fund in comparison to its benchmark(s). Benchmarks are unmanaged and may not be invested in directly. Benchmark returns do not reflect any fees or expenses. The performance of other share classes will be greater than or less than that of the class depicted below. (See Notes to Performance Summary.)
Performance data shown represents past performance and is no guarantee of future results. Investment return and principal value fluctuate so your shares, when sold, may be worth more or less than the original cost; current performance may be lower or higher than quoted. The performance shown does not reflect the deduction of taxes, if any, that a shareholder would pay on fund distributions or the redemption of fund shares. The returns for the fund shown also do not reflect the deduction of expenses associated with variable products, such as mortality and expense risk charges, separate account charges, and sales charges imposed by the insurance company separate accounts. Such expenses would reduce the overall returns shown.
Growth of a Hypothetical $10,000 Investment
Total Returns through 12/31/22
Average annual total returns
| Share Class | Class Inception Date | 1-yr | 5-yr | 10-yr |
| Initial Class | 7/17/00 | (18.37)% | 5.41% | 10.49% |
| Service Class | 5/01/06 | (18.56)% | 5.14% | 10.21% |
Comparative benchmark(s)
| Russell 2000® Index (f) | (20.44)% | 4.13% | 9.01% |
| (f) | Source: FactSet Research Systems Inc. |
Benchmark Definition(s)
Russell 2000® Index(h) - constructed to provide a comprehensive barometer for securities in the small-cap segment of the U.S. equity universe. The index includes 2,000 of the smallest U.S. companies based on total market capitalization, representing approximately 10% of the investable U.S. equity market.
It is not possible to invest directly in an index.
| (h) | Frank Russell Company (“Russell”) is the source and owner of the trademarks, service marks, and copyrights related to the Russell Indexes. Russell® is a trademark of Frank Russell Company. Neither Russell nor its licensors accept any liability for any errors or omissions in the Russell Indexes and/or Russell ratings or underlying data and no party may rely on any Russell Indexes and/or Russell ratings and/or underlying data contained in this document. No further distribution of Russell Data is permitted without Russell's express written consent. Russell does not promote, sponsor, or endorse the content of this document. |
Notes to Performance Summary
Average annual total return represents the average annual change in value for each share class for the periods presented.
Performance results reflect any applicable expense subsidies and waivers in effect during the periods shown. Without such subsidies and waivers the fund's performance results would be less favorable. Please see the prospectus and financial statements for complete details. All results are historical and assume the reinvestment of any dividends and capital gains distributions.
MFS Blended Research Small Cap Equity Portfolio
Performance Summary – continued
Performance results do not include adjustments made for financial reporting purposes in accordance with U.S. generally accepted accounting principles and may differ from amounts reported in the financial highlights.
From time to time the fund may receive proceeds from litigation settlements, without which performance would be lower.
MFS Blended Research Small Cap Equity Portfolio
Expense Table
Fund expenses borne by the shareholders during the period,
July 1, 2022 through December 31, 2022
As a shareholder of the fund, you incur ongoing costs, including management fees; distribution and/or service (12b-1) fees; and other fund expenses. This example is intended to help you understand your ongoing costs (in dollars) of investing in the fund and to compare these costs with the ongoing costs of investing in other mutual funds.
The example is based on an investment of $1,000 invested at the beginning of the period and held for the entire period July 1, 2022 through December 31, 2022.
Actual Expenses
The first line for each share class in the following table provides information about actual account values and actual expenses. You may use the information in this line, together with the amount you invested, to estimate the expenses that you paid over the period. Simply divide your account value by $1,000 (for example, an $8,600 account value divided by $1,000 = 8.6), then multiply the result by the number in the first line under the heading entitled “Expenses Paid During Period” to estimate the expenses you paid on your account during this period.
Hypothetical Example for Comparison Purposes
The second line for each share class in the following table provides information about hypothetical account values and hypothetical expenses based on the fund’s actual expense ratio and an assumed rate of return of 5% per year before expenses, which is not the fund’s actual return. The hypothetical account values and expenses may not be used to estimate the actual ending account balance or expenses you paid for the period. You may use this information to compare the ongoing costs of investing in the fund and other funds. To do so, compare this 5% hypothetical example with the 5% hypothetical examples that appear in the shareholder reports of the other funds.
Please note that the expenses shown in the table are meant to highlight the fund's ongoing costs only and do not take into account the fees and expenses imposed under the variable contracts through which your investment in the fund is made. Therefore, the second line for each share class in the table is useful in comparing ongoing costs associated with an investment in vehicles (such as the fund) which fund benefits under variable annuity and variable life insurance contracts and to qualified pension and retirement plans only, and will not help you determine the relative total costs of investing in the fund through variable annuity and variable life insurance contracts. If the fees and expenses imposed under the variable contracts were included, your costs would have been higher.
Share
Class | | Annualized
Expense
Ratio | Beginning
Account Value
7/01/22 | Ending
Account Value
12/31/22 | Expenses
Paid During
Period (p)
7/01/22-12/31/22 |
| Initial Class | Actual | 0.54% | $1,000.00 | $1,023.61 | $2.75 |
| Hypothetical (h) | 0.54% | $1,000.00 | $1,022.48 | $2.75 |
| Service Class | Actual | 0.80% | $1,000.00 | $1,022.33 | $4.08 |
| Hypothetical (h) | 0.80% | $1,000.00 | $1,021.17 | $4.08 |
| (h) | 5% class return per year before expenses. |
| (p) | “Expenses Paid During Period” are equal to each class's annualized expense ratio, as shown above, multiplied by the average account value over the period, multiplied by 184/365 (to reflect the one-half year period). |
MFS Blended Research Small Cap Equity Portfolio
Portfolio of Investments − 12/31/22
The Portfolio of Investments is a complete list of all securities owned by your fund. It is categorized by broad-based asset classes.
| Issuer | | | Shares/Par | Value ($) |
| Common Stocks – 99.1% |
| Aerospace & Defense – 0.9% | |
| CACI International, Inc., “A” (a) | | 2,495 | $ 749,972 |
| Apparel Manufacturers – 1.6% | |
| FIGS, Inc. (a) | | 34,465 | $ 231,949 |
| Skechers USA, Inc., “A” (a) | | 25,061 | 1,051,309 |
| | | | | $1,283,258 |
| Automotive – 2.2% | |
| REV Group, Inc. | | 41,561 | $ 524,500 |
| Titan International, Inc. (a) | | 31,406 | 481,140 |
| Visteon Corp. (a) | | 5,931 | 775,953 |
| | | | | $1,781,593 |
| Biotechnology – 3.9% | |
| Adaptive Biotechnologies Corp. (a) | | 52,275 | $ 399,381 |
| Alector, Inc. (a) | | 16,007 | 147,745 |
| AlloVir, Inc. (a) | | 29,321 | 150,417 |
| BioAtla, Inc. (a) | | 25,322 | 208,906 |
| Dynavax Technologies Corp. (a) | | 4,169 | 44,358 |
| Exelixis, Inc. (a) | | 11,626 | 186,481 |
| iTeos Therapeutics, Inc. (a) | | 25,550 | 498,991 |
| Lyell Immunopharma, Inc. (a) | | 46,444 | 161,161 |
| Novavax, Inc. (a)(l) | | 3,845 | 39,527 |
| Sana Biotechnology, Inc. (a) | | 47,831 | 188,932 |
| Sangamo Therapeutics, Inc. (a) | | 44,699 | 140,355 |
| Varex Imaging Corp. (a) | | 19,735 | 400,620 |
| Vir Biotechnology, Inc. (a) | | 22,286 | 564,059 |
| | | | | $3,130,933 |
| Broadcasting – 0.5% | |
| Entravision Communications Corp., “A” | | 81,072 | $ 389,146 |
| Business Services – 4.5% | |
| BlueLinx Holdings, Inc. (a) | | 6,418 | $ 456,384 |
| Boise Cascade Corp. | | 8,152 | 559,798 |
| Forrester Research, Inc. (a) | | 20,573 | 735,690 |
| HireRight Holdings Corp. (a) | | 20,909 | 247,981 |
| Paya, Inc. (a) | | 18,787 | 147,853 |
| StoneCo Ltd., “A” (a) | | 8,745 | 82,553 |
| TaskUs, Inc., “A” (a) | | 47,661 | 805,471 |
| Yext, Inc. (a) | | 92,794 | 605,945 |
| | | | | $3,641,675 |
| Cable TV – 0.1% | |
| Cable One, Inc. | | 100 | $ 71,186 |
| Chemicals – 1.7% | |
| Avient Corp. | | 9,995 | $ 337,431 |
| Element Solutions, Inc. | | 55,643 | 1,012,146 |
| | | | | $1,349,577 |
MFS Blended Research Small Cap Equity Portfolio
Portfolio of Investments – continued
| Issuer | | | Shares/Par | Value ($) |
| Common Stocks – continued |
| Computer Software – 4.0% | |
| Clear Secure, Inc., “A” | | 12,855 | $ 352,613 |
| Domo, Inc., “B” (a) | | 1,705 | 24,279 |
| Elastic N.V. (a) | | 5,602 | 288,503 |
| Eventbrite, Inc. (a) | | 109,686 | 642,760 |
| Everbridge, Inc. (a) | | 14,747 | 436,216 |
| Paycor HCM, Inc. (a) | | 25,357 | 620,486 |
| Paylocity Holding Corp. (a) | | 4,398 | 854,355 |
| | | | | $3,219,212 |
| Computer Software - Systems – 2.7% | |
| Box, Inc., “A” (a) | | 40,784 | $ 1,269,606 |
| Rapid7, Inc. (a) | | 7,620 | 258,928 |
| Rimini Street, Inc. (a) | | 68,314 | 260,276 |
| Verint Systems, Inc. (a) | | 10,365 | 376,042 |
| | | | | $2,164,852 |
| Construction – 1.5% | |
| AZEK Co., Inc. (a) | | 20,378 | $ 414,081 |
| GMS, Inc. (a) | | 15,232 | 758,554 |
| | | | | $1,172,635 |
| Consumer Products – 2.3% | |
| Herbalife Ltd. (a) | | 13,552 | $ 201,654 |
| Nu Skin Enterprises, Inc., “A” | | 4,202 | 177,156 |
| Prestige Consumer Healthcare, Inc. (a) | | 24,231 | 1,516,861 |
| | | | | $1,895,671 |
| Consumer Services – 2.0% | |
| Grand Canyon Education, Inc. (a) | | 11,696 | $ 1,235,799 |
| TravelCenters of America LLC (a) | | 8,755 | 392,049 |
| | | | | $1,627,848 |
| Electrical Equipment – 0.6% | |
| Vertiv Holdings Co. | | 34,071 | $ 465,410 |
| Electronics – 5.0% | |
| Advanced Energy Industries, Inc. | | 11,061 | $ 948,813 |
| Alpha and Omega Semiconductor Ltd. (a) | | 12,823 | 366,353 |
| Photronics, Inc. (a) | | 19,805 | 333,318 |
| Plexus Corp. (a) | | 10,552 | 1,086,117 |
| Sanmina Corp. (a) | | 2,992 | 171,412 |
| Silicon Laboratories, Inc. (a) | | 8,505 | 1,153,873 |
| | | | | $4,059,886 |
| Energy - Independent – 2.9% | |
| Alpha Metallurgical Resources | | 845 | $ 123,699 |
| CONSOL Energy, Inc. | | 1,938 | 125,970 |
| CVR Energy, Inc. | | 14,890 | 466,653 |
| Magnolia Oil & Gas Corp., “A” | | 50,408 | 1,182,068 |
| Par Pacific Holdings, Inc. (a) | | 19,294 | 448,585 |
| | | | | $2,346,975 |
| Energy - Integrated – 0.5% | |
| National Gas Fuel Co. | | 6,418 | $ 406,259 |
MFS Blended Research Small Cap Equity Portfolio
Portfolio of Investments – continued
| Issuer | | | Shares/Par | Value ($) |
| Common Stocks – continued |
| Engineering - Construction – 2.0% | |
| APi Group, Inc. (a) | | 29,301 | $ 551,152 |
| Dycom Industries, Inc. (a) | | 11,526 | 1,078,834 |
| | | | | $1,629,986 |
| Food & Beverages – 1.3% | |
| Cal-Maine Foods, Inc. | | 1,337 | $ 72,800 |
| Hostess Brands, Inc. (a) | | 44,746 | 1,004,100 |
| | | | | $1,076,900 |
| Food & Drug Stores – 0.2% | |
| United Natural Foods, Inc. (a) | | 4,977 | $ 192,660 |
| Gaming & Lodging – 1.9% | |
| International Game Technology PLC | | 46,977 | $ 1,065,438 |
| Target Hospitality Corp. (a) | | 31,140 | 471,460 |
| | | | | $1,536,898 |
| General Merchandise – 0.6% | |
| Dillards, Inc., “A” (l) | | 1,484 | $ 479,629 |
| Insurance – 4.9% | |
| Brighthouse Financial, Inc. (a) | | 9,891 | $ 507,112 |
| Hanover Insurance Group, Inc. | | 4,738 | 640,246 |
| Jackson Financial, Inc. | | 13,937 | 484,868 |
| Radian Group, Inc. | | 2,041 | 38,922 |
| Reinsurance Group of America, Inc. | | 9,535 | 1,354,828 |
| Voya Financial, Inc. | | 14,463 | 889,330 |
| | | | | $3,915,306 |
| Internet – 0.6% | |
| ZipRecruiter, Inc., “A” (a) | | 30,177 | $ 495,506 |
| Leisure & Toys – 3.0% | |
| Brunswick Corp. | | 12,139 | $ 874,979 |
| Funko, Inc., “A” (a) | | 44,823 | 489,019 |
| Malibu Boats, Inc., “A” (a) | | 8,706 | 464,030 |
| MasterCraft Boat Holdings, Inc. (a) | | 3,322 | 85,940 |
| Polaris, Inc. | | 5,282 | 533,482 |
| | | | | $2,447,450 |
| Machinery & Tools – 3.3% | |
| Flowserve Corp. | | 10,346 | $ 317,415 |
| ITT, Inc. | | 1,103 | 89,453 |
| Regal Rexnord Corp. | | 7,493 | 899,010 |
| Timken Co. | | 14,048 | 992,772 |
| Titan Machinery, Inc. (a) | | 9,743 | 387,090 |
| | | | | $2,685,740 |
| Major Banks – 0.6% | |
| First Financial Corp. | | 9,672 | $ 445,686 |
| Medical & Health Technology & Services – 2.4% | |
| Cross Country Healthcare, Inc. (a) | | 9,018 | $ 239,608 |
| Health Catalyst, Inc. (a) | | 20,772 | 220,806 |
| HealthEquity, Inc. (a) | | 10,238 | 631,070 |
MFS Blended Research Small Cap Equity Portfolio
Portfolio of Investments – continued
| Issuer | | | Shares/Par | Value ($) |
| Common Stocks – continued |
| Medical & Health Technology & Services – continued | |
| Medpace Holdings, Inc. (a) | | 1,926 | $ 409,102 |
| ModivCare, Inc. (a) | | 413 | 37,059 |
| Syneos Health, Inc. (a) | | 11,609 | 425,818 |
| | | | | $1,963,463 |
| Medical Equipment – 5.6% | |
| AngioDynamics, Inc. (a) | | 13,126 | $ 180,745 |
| Avanos Medical, Inc. (a) | | 14,834 | 401,408 |
| Bioventus, Inc., “A” (a)(l) | | 30,938 | 80,748 |
| CareDx, Inc. (a) | | 4,146 | 47,306 |
| Envista Holdings Corp. (a) | | 29,532 | 994,343 |
| Inogen, Inc. (a) | | 9,376 | 184,801 |
| Integer Holdings Corp. (a) | | 5,669 | 388,100 |
| Maravai Lifesciences Holdings, Inc., “A” (a) | | 57,469 | 822,381 |
| Organogenesis Holdings, Inc. (a) | | 60,730 | 163,364 |
| Quidel Corp. (a) | | 12,584 | 1,078,071 |
| Zynex, Inc. | | 14,664 | 203,976 |
| | | | | $4,545,243 |
| Metals & Mining – 0.9% | |
| Ryerson Holding Corp. | | 22,663 | $ 685,782 |
| United States Steel Corp. | | 2,154 | 53,958 |
| | | | | $739,740 |
| Natural Gas - Pipeline – 0.9% | |
| Equitrans Midstream Corp. | | 113,919 | $ 763,257 |
| Oil Services – 2.0% | |
| Cactus, Inc., “A” | | 11,277 | $ 566,782 |
| ChampionX Corp. | | 35,303 | 1,023,434 |
| | | | | $1,590,216 |
| Other Banks & Diversified Financials – 11.2% | |
| Amalgamated Financial Corp. | | 17,000 | $ 391,680 |
| Atlanticus Holdings Corp. (a) | | 1,668 | 43,702 |
| Bank OZK | | 3,798 | 152,148 |
| Cathay General Bancorp, Inc. | | 30,280 | 1,235,121 |
| Enova International, Inc. (a) | | 1,891 | 72,558 |
| First BanCorp. | | 23,754 | 302,151 |
| First Hawaiian, Inc. | | 32,490 | 846,040 |
| Navient Corp. | | 17,504 | 287,941 |
| OFG Bancorp | | 17,007 | 468,713 |
| Preferred Bank | | 5,363 | 400,187 |
| Silvergate Capital Corp., “A” (a) | | 3,747 | 65,198 |
| SLM Corp. | | 71,417 | 1,185,522 |
| UMB Financial Corp. | | 12,401 | 1,035,731 |
| Umpqua Holdings Corp. | | 63,002 | 1,124,586 |
| United Community Bank, Inc. | | 10,288 | 347,734 |
| Wintrust Financial Corp. | | 12,522 | 1,058,359 |
| | | | | $9,017,371 |
| Pharmaceuticals – 3.1% | |
| Alkermes PLC (a) | | 5,078 | $ 132,688 |
| Coherus BioSciences, Inc. (a) | | 22,813 | 180,679 |
| Eagle Pharmaceuticals, Inc. (a) | | 4,007 | 117,125 |
MFS Blended Research Small Cap Equity Portfolio
Portfolio of Investments – continued
| Issuer | | | Shares/Par | Value ($) |
| Common Stocks – continued |
| Pharmaceuticals – continued | |
| Emergent BioSolutions, Inc. (a) | | 5,831 | $ 68,864 |
| Intercept Pharmaceuticals, Inc. (a) | | 32,882 | 406,750 |
| Macrogenics, Inc. (a) | | 20,330 | 136,414 |
| Phibro Animal Health Corp., “A” | | 10,960 | 146,974 |
| REGENXBIO, Inc. (a) | | 9,188 | 208,384 |
| United Therapeutics Corp. (a) | | 2,988 | 830,933 |
| Vanda Pharmaceuticals, Inc. (a) | | 31,771 | 234,788 |
| | | | | $2,463,599 |
| Railroad & Shipping – 0.9% | |
| Scorpio Tankers, Inc. | | 4,833 | $ 259,870 |
| Teekay Tankers LTD., “A” (a) | | 15,585 | 480,174 |
| | | | | $740,044 |
| Real Estate – 7.5% | |
| DiamondRock Hospitality Co., REIT | | 31,656 | $ 259,263 |
| Empire State Realty Trust, REIT, “A” | | 81,404 | 548,663 |
| EPR Properties, REIT | | 20,366 | 768,206 |
| Equity Commonwealth, REIT | | 10,289 | 256,916 |
| National Storage Affiliates Trust, REIT | | 23,832 | 860,812 |
| Phillips Edison & Co., REIT | | 31,848 | 1,014,040 |
| Piedmont Office Realty Trust, Inc., REIT | | 62,488 | 573,015 |
| Spirit Realty Capital, Inc., REIT | | 25,554 | 1,020,371 |
| STAG Industrial, Inc., REIT | | 14,611 | 472,081 |
| Uniti Group, Inc., REIT | | 45,217 | 250,050 |
| | | | | $6,023,417 |
| Restaurants – 0.8% | |
| Texas Roadhouse, Inc. | | 7,139 | $ 649,292 |
| Specialty Chemicals – 2.5% | |
| Chemours Co. | | 31,433 | $ 962,478 |
| Univar Solutions, Inc. (a) | | 33,287 | 1,058,527 |
| | | | | $2,021,005 |
| Specialty Stores – 2.3% | |
| Builders FirstSource, Inc. (a) | | 13,457 | $ 873,090 |
| Urban Outfitters, Inc. (a) | | 31,976 | 762,628 |
| Zumiez, Inc. (a) | | 10,150 | 220,661 |
| | | | | $1,856,379 |
| Telephone Services – 0.5% | |
| EchoStar Corp., “A” (a) | | 22,948 | $ 382,773 |
| Tobacco – 0.1% | |
| Vector Group Ltd. | | 3,605 | $ 42,755 |
| Trucking – 1.3% | |
| Landstar System, Inc. | | 2,371 | $ 386,236 |
| Saia, Inc. (a) | | 3,007 | 630,508 |
| | | | | $1,016,744 |
MFS Blended Research Small Cap Equity Portfolio
Portfolio of Investments – continued
| Issuer | | | Shares/Par | Value ($) |
| Common Stocks – continued |
| Utilities - Electric Power – 1.8% | |
| IDACORP, Inc. | | 392 | $ 42,277 |
| Portland General Electric Co. | | 29,188 | 1,430,212 |
| | | | | $1,472,489 |
| Total Common Stocks (Identified Cost, $77,223,405) | | $79,949,636 |
| Investment Companies (h) – 0.9% |
| Money Market Funds – 0.9% | |
| MFS Institutional Money Market Portfolio, 4.02% (v) (Identified Cost, $705,159) | | | 705,022 | $ 705,234 |
| Collateral for Securities Loaned – 0.3% |
| State Street Navigator Securities Lending Government Money Market Portfolio, 4.33% (j) (Identified Cost, $240,957) | | | 240,957 | $ 240,957 |
| Other Assets, Less Liabilities – (0.3)% | | (269,083) |
| Net Assets – 100.0% | $80,626,744 |
| (a) | Non-income producing security. | | | |
| (h) | An affiliated issuer, which may be considered one in which the fund owns 5% or more of the outstanding voting securities, or a company which is under common control. At period end, the aggregate values of the fund's investments in affiliated issuers and in unaffiliated issuers were $705,234 and $80,190,593, respectively. | | | |
| (j) | The rate quoted is the annualized seven-day yield of the fund at period end. | | | |
| (l) | A portion of this security is on loan. See Note 2 for additional information. | | | |
| (v) | Affiliated issuer that is available only to investment companies managed by MFS. The rate quoted for the MFS Institutional Money Market Portfolio is the annualized seven-day yield of the fund at period end. | | | |
| The following abbreviations are used in this report and are defined: |
| REIT | Real Estate Investment Trust |
See Notes to Financial Statements
MFS Blended Research Small Cap Equity Portfolio
| Financial Statements | Statement of Assets and Liabilities |
This statement represents your fund’s balance sheet, which details the assets and liabilities comprising the total value of the fund.
| At 12/31/22Assets | |
| Investments in unaffiliated issuers, at value, including $298,366 of securities on loan (identified cost, $77,464,362) | $80,190,593 |
| Investments in affiliated issuers, at value (identified cost, $705,159) | 705,234 |
| Receivables for | |
| Fund shares sold | 6,790 |
| Interest and dividends | 105,262 |
| Other assets | 744 |
| Total assets | $81,008,623 |
| Liabilities | |
| Payables for | |
| Fund shares reacquired | $71,501 |
| Collateral for securities loaned, at value (c) | 240,957 |
| Payable to affiliates | |
| Investment adviser | 2,549 |
| Administrative services fee | 178 |
| Shareholder servicing costs | 42 |
| Distribution and/or service fees | 1,038 |
| Payable for independent Trustees' compensation | 104 |
| Accrued expenses and other liabilities | 65,510 |
| Total liabilities | $381,879 |
| Net assets | $80,626,744 |
| Net assets consist of | |
| Paid-in capital | $75,279,329 |
| Total distributable earnings (loss) | 5,347,415 |
| Net assets | $80,626,744 |
| Shares of beneficial interest outstanding | 9,491,716 |
| | Net assets | Shares
outstanding | Net asset value
per share |
| Initial Class | $29,826,034 | 3,398,802 | $8.78 |
| Service Class | 50,800,710 | 6,092,914 | 8.34 |
| (c) | Non-cash collateral is not included. |
See Notes to Financial Statements
MFS Blended Research Small Cap Equity Portfolio
| Financial Statements | Statement of Operations |
This statement describes how much your fund earned in investment income and accrued in expenses. It also describes any gains and/or losses generated by fund operations.
| Year ended 12/31/22 | |
| Net investment income (loss) | |
| Income | |
| Dividends | $1,099,117 |
| Other | 12,827 |
| Dividends from affiliated issuers | 9,462 |
| Income on securities loaned | 1,868 |
| Foreign taxes withheld | (2,682) |
| Total investment income | $1,120,592 |
| Expenses | |
| Management fee | $352,348 |
| Distribution and/or service fees | 138,117 |
| Shareholder servicing costs | 10,307 |
| Administrative services fee | 23,330 |
| Independent Trustees' compensation | 3,595 |
| Custodian fee | 5,579 |
| Shareholder communications | 5,626 |
| Audit and tax fees | 59,827 |
| Legal fees | 418 |
| Miscellaneous | 25,255 |
| Total expenses | $624,402 |
| Reduction of expenses by investment adviser | (12,242) |
| Net expenses | $612,160 |
| Net investment income (loss) | $508,432 |
| Realized and unrealized gain (loss) | |
| Realized gain (loss) (identified cost basis) | |
| Unaffiliated issuers | $2,701,522 |
| Affiliated issuers | (3) |
| Net realized gain (loss) | $2,701,519 |
| Change in unrealized appreciation or depreciation | |
| Unaffiliated issuers | $(21,966,245) |
| Affiliated issuers | 75 |
| Net unrealized gain (loss) | $(21,966,170) |
| Net realized and unrealized gain (loss) | $(19,264,651) |
| Change in net assets from operations | $(18,756,219) |
See Notes to Financial Statements
MFS Blended Research Small Cap Equity Portfolio
| Financial Statements | Statements of Changes in Net Assets |
These statements describe the increases and/or decreases in net assets resulting from operations, any distributions, and any shareholder transactions.
| | Year ended |
| | 12/31/22 | 12/31/21 |
| Change in net assets | | |
| From operations | | |
| Net investment income (loss) | $508,432 | $521,826 |
| Net realized gain (loss) | 2,701,519 | 23,809,565 |
| Net unrealized gain (loss) | (21,966,170) | 1,832,471 |
| Change in net assets from operations | $(18,756,219) | $26,163,862 |
| Total distributions to shareholders | $(20,920,094) | $(770,014) |
| Change in net assets from fund share transactions | $15,936,179 | $(14,248,191) |
| Total change in net assets | $(23,740,134) | $11,145,657 |
| Net assets | | |
| At beginning of period | 104,366,878 | 93,221,221 |
| At end of period | $80,626,744 | $104,366,878 |
See Notes to Financial Statements
MFS Blended Research Small Cap Equity Portfolio
| Financial Statements | Financial Highlights |
The financial highlights table is intended to help you understand the fund's financial performance for the past 5 years. Certain information reflects financial results for a single fund share. The total returns in the table represent the rate that an investor would have earned (or lost) on an investment in the fund share class (assuming reinvestment of all distributions) held for the entire period.
| Initial Class | Year ended |
| | 12/31/22 | 12/31/21 | 12/31/20 | 12/31/19 | 12/31/18 |
| Net asset value, beginning of period | $14.02 | $10.91 | $11.66 | $11.25 | $13.47 |
| Income (loss) from investment operations | | | | | |
| Net investment income (loss) (d) | $0.08 | $0.09 | $0.10 | $0.10 | $0.09 |
| Net realized and unrealized gain (loss) | (2.48) | 3.14 | 0.01(g) | 2.56 | (0.40) |
| Total from investment operations | $(2.40) | $3.23 | $0.11 | $2.66 | $(0.31) |
| Less distributions declared to shareholders | | | | | |
| From net investment income | $(0.09) | $(0.12) | $(0.09) | $(0.10) | $(0.13) |
| From net realized gain | (2.75) | — | (0.77) | (2.15) | (1.78) |
| Total distributions declared to shareholders | $(2.84) | $(0.12) | $(0.86) | $(2.25) | $(1.91) |
| Net asset value, end of period (x) | $8.78 | $14.02 | $10.91 | $11.66 | $11.25 |
| Total return (%) (k)(r)(s)(x) | (18.37) | 29.64 | 2.23 | 26.78 | (5.11) |
Ratios (%) (to average net assets)
and Supplemental data: | | | | | |
| Expenses before expense reductions | 0.55 | 0.54 | 0.55 | 0.54 | 0.54 |
| Expenses after expense reductions | 0.54 | 0.52 | 0.54 | 0.53 | 0.53 |
| Net investment income (loss) | 0.73 | 0.67 | 1.05 | 0.81 | 0.69 |
| Portfolio turnover | 55 | 78 | 84 | 59 | 72 |
| Net assets at end of period (000 omitted) | $29,826 | $39,073 | $33,850 | $35,441 | $29,936 |
| Service Class | Year ended |
| | 12/31/22 | 12/31/21 | 12/31/20 | 12/31/19 | 12/31/18 |
| Net asset value, beginning of period | $13.47 | $10.50 | $11.24 | $10.92 | $13.12 |
| Income (loss) from investment operations | | | | | |
| Net investment income (loss) (d) | $0.05 | $0.05 | $0.07 | $0.07 | $0.06 |
| Net realized and unrealized gain (loss) | (2.37) | 3.01 | 0.02(g) | 2.46 | (0.39) |
| Total from investment operations | $(2.32) | $3.06 | $0.09 | $2.53 | $(0.33) |
| Less distributions declared to shareholders | | | | | |
| From net investment income | $(0.06) | $(0.09) | $(0.06) | $(0.06) | $(0.09) |
| From net realized gain | (2.75) | — | (0.77) | (2.15) | (1.78) |
| Total distributions declared to shareholders | $(2.81) | $(0.09) | $(0.83) | $(2.21) | $(1.87) |
| Net asset value, end of period (x) | $8.34 | $13.47 | $10.50 | $11.24 | $10.92 |
| Total return (%) (k)(r)(s)(x) | (18.56) | 29.17 | 2.14 | 26.36 | (5.35) |
Ratios (%) (to average net assets)
and Supplemental data: | | | | | |
| Expenses before expense reductions | 0.80 | 0.79 | 0.80 | 0.79 | 0.79 |
| Expenses after expense reductions | 0.79 | 0.77 | 0.79 | 0.78 | 0.78 |
| Net investment income (loss) | 0.49 | 0.42 | 0.80 | 0.56 | 0.43 |
| Portfolio turnover | 55 | 78 | 84 | 59 | 72 |
| Net assets at end of period (000 omitted) | $50,801 | $65,294 | $59,371 | $61,099 | $55,648 |
See Notes to Financial Statements
MFS Blended Research Small Cap Equity Portfolio
Financial Highlights - continued
| (d) | Per share data is based on average shares outstanding. |
| (g) | The per share amount varies from the net realized and unrealized gain/loss for the period because of the timing of sales of fund shares and the per share amount of realized and unrealized gains and losses at such time. |
| (k) | The total return does not reflect expenses that apply to separate accounts. Inclusion of these charges would reduce the total return figures for all periods shown. |
| (r) | Certain expenses have been reduced without which performance would have been lower. |
| (s) | From time to time the fund may receive proceeds from litigation settlements, without which performance would be lower. |
| (x) | The net asset values and total returns have been calculated on net assets which include adjustments made in accordance with U.S. generally accepted accounting principles required at period end for financial reporting purposes. |
See Notes to Financial Statements
MFS Blended Research Small Cap Equity Portfolio
Notes to Financial Statements
(1) Business and Organization
MFS Blended Research Small Cap Equity Portfolio (the fund) is a diversified series of MFS Variable Insurance Trust III (the trust). The trust is organized as a Delaware statutory trust and is registered under the Investment Company Act of 1940, as amended, as an open-end management investment company. The shareholders of each series of the trust are separate accounts of insurance companies, which offer variable annuity and/or life insurance products, and qualified retirement and pension plans.
The fund is an investment company and accordingly follows the investment company accounting and reporting guidance of the Financial Accounting Standards Board (FASB) Accounting Standards Codification Topic 946 Financial Services - Investment Companies.
(2) Significant Accounting Policies
General — The preparation of financial statements in conformity with U.S. generally accepted accounting principles requires management to make estimates and assumptions that affect the reported amounts of assets and liabilities, and disclosure of contingent assets and liabilities at the date of the financial statements and the reported amounts of increases and decreases in net assets from operations during the reporting period. Actual results could differ from those estimates. In the preparation of these financial statements, management has evaluated subsequent events occurring after the date of the fund’s Statement of Assets and Liabilities through the date that the financial statements were issued. The fund will generally focus on securities of small size companies which may be more volatile than those of larger companies.
Balance Sheet Offsetting — The fund's accounting policy with respect to balance sheet offsetting is that, absent an event of default by the counterparty or a termination of the agreement, the International Swaps and Derivatives Association (ISDA) Master Agreement, or similar agreement, does not result in an offset of reported amounts of financial assets and financial liabilities in the Statement of Assets and Liabilities across transactions between the fund and the applicable counterparty. The fund's right to setoff may be restricted or prohibited by the bankruptcy or insolvency laws of the particular jurisdiction to which a specific master netting agreement counterparty is subject. Balance sheet offsetting disclosures, to the extent applicable to the fund, have been included in the fund’s Significant Accounting Policies note under the captions for each of the fund’s in-scope financial instruments and transactions.
Investment Valuations — Subject to its oversight, the fund's Board of Trustees has delegated primary responsibility for determining or causing to be determined the value of the fund’s investments to MFS as the fund's adviser, pursuant to the fund’s valuation policy and procedures which have been adopted by the adviser and approved by the Board. Effective September 8, 2022, and in accordance with Rule 2a-5 under the Investment Company Act of 1940, the Board of Trustees designated the adviser as the “valuation designee” of the fund. If the adviser, as valuation designee, determines that reliable market quotations are not readily available for an investment, the investment is valued at fair value as determined in good faith by the adviser in accordance with the adviser’s fair valuation policy and procedures.
Under the fund's valuation policy and procedures, equity securities, including restricted equity securities, are generally valued at the last sale or official closing price on their primary market or exchange as provided by a third-party pricing service. Equity securities, for which there were no sales reported that day, are generally valued at the last quoted daily bid quotation on their primary market or exchange as provided by a third-party pricing service. Short-term instruments with a maturity at issuance of 60 days or less may be valued at amortized cost, which approximates market value. Open-end investment companies are generally valued at net asset value per share. The values of foreign securities and other assets and liabilities expressed in foreign currencies are converted to U.S. dollars using the mean of bid and asked prices for rates provided by a third-party pricing service.
Under the fund’s valuation policy and procedures, market quotations are not considered to be readily available for debt instruments, floating rate loans, and many types of derivatives. These investments are generally valued at fair value based on information from third-party pricing services or otherwise determined by the adviser in accordance with the adviser’s fair valuation policy and procedures. Securities and other assets generally valued on the basis of information from a third-party pricing service may also be valued at a broker/dealer bid quotation. In determining values, third-party pricing services can utilize both transaction data and market information such as yield, quality, coupon rate, maturity, type of issue, trading characteristics, spreads and other market data. An investment may also be valued at fair value if the adviser determines that the investment’s value has been materially affected by events occurring after the close of the exchange or market on which the investment is principally traded (such as foreign exchange or market) and prior to the determination of the fund’s net asset value, or after the halt of trading of a specific security where trading does not resume prior to the close of the exchange or market on which the security is principally traded. Events that occur after foreign markets close (such as developments in foreign markets and significant movements in the U.S. markets) and prior to the determination of the fund’s net asset value may be deemed to have a material effect on the value of securities traded in foreign markets. Accordingly, the fund’s foreign equity securities may often be valued at fair value. The adviser generally relies on third-party pricing services or other information (such as the correlation with price movements of similar securities in the same or other markets;
MFS Blended Research Small Cap Equity Portfolio
Notes to Financial Statements - continued
the type, cost and investment characteristics of the security; the business and financial condition of the issuer; and trading and other market data) to assist in determining whether to fair value and at what value to fair value an investment. The value of an investment for purposes of calculating the fund’s net asset value can differ depending on the source and method used to determine value. When fair valuation is used, the value of an investment used to determine the fund’s net asset value may differ from quoted or published prices for the same investment. There can be no assurance that the fund could obtain the fair value assigned to an investment if it were to sell the investment at the same time at which the fund determines its net asset value per share.
Various inputs are used in determining the value of the fund's assets or liabilities. These inputs are categorized into three broad levels. In certain cases, the inputs used to measure fair value may fall into different levels of the fair value hierarchy. In such cases, an investment's level within the fair value hierarchy is based on the lowest level of input that is significant to the fair value measurement. The fund's assessment of the significance of a particular input to the fair value measurement in its entirety requires judgment, and considers factors specific to the investment. Level 1 includes unadjusted quoted prices in active markets for identical assets or liabilities. Level 2 includes other significant observable market-based inputs (including quoted prices for similar securities, interest rates, prepayment speed, and credit risk). Level 3 includes significant unobservable inputs, which may include the adviser's own assumptions in determining the fair value of investments. The following is a summary of the levels used as of December 31, 2022 in valuing the fund's assets and liabilities:
| Financial Instruments | Level 1 | Level 2 | Level 3 | Total |
| Equity Securities | $79,949,636 | $— | $— | $79,949,636 |
| Mutual Funds | 946,191 | — | — | 946,191 |
| Total | $80,895,827 | $— | $— | $80,895,827 |
For further information regarding security characteristics, see the Portfolio of Investments.
Security Loans — Under its Securities Lending Agency Agreement with the fund, State Street Bank and Trust Company, as lending agent, loans the securities of the fund to certain qualified institutions (the “Borrowers”) approved by the fund. Security loans can be terminated at the discretion of either the lending agent or the fund and the related securities must be returned within the earlier of the standard trade settlement period for such securities or within three business days. The loans are collateralized by cash and/or U.S. Treasury and federal agency obligations in an amount typically at least equal to the market value of the securities loaned. On loans collateralized by cash, the cash collateral is invested in a money market fund. The market value of the loaned securities is determined at the close of business of the fund and any additional required collateral is delivered to the fund on the next business day. The lending agent provides the fund with indemnification against Borrower default. In the event of Borrower default, the lending agent will, for the benefit of the fund, either purchase securities identical to those loaned or, when such purchase is commercially impracticable, pay the fund the market value of the loaned securities. In return, the lending agent assumes the fund's rights to the related collateral. If the collateral value is less than the cost to purchase identical securities, the lending agent is responsible for the shortfall, but only to the extent that such shortfall is not due to a decline in collateral value resulting from collateral reinvestment for which the fund bears the risk of loss. At period end, the fund had investment securities on loan, all of which were classified as equity securities in the fund's Portfolio of Investments, with a fair value of $298,366. The fair value of the fund's investment securities on loan and a related liability of $240,957 for cash collateral received on securities loaned are both presented gross in the Statement of Assets and Liabilities. Additionally, these loans were collateralized by U.S. Treasury Obligations of $60,185 held by the lending agent. The collateral on securities loaned exceeded the value of securities on loan at period end. The liability for cash collateral for securities loaned is carried at fair value, which is categorized as level 2 within the fair value hierarchy. A portion of the income generated upon investment of the collateral is remitted to the Borrowers, and the remainder is allocated between the fund and the lending agent. On loans collateralized by U.S. Treasury and/or federal agency obligations, a fee is received from the Borrower, and is allocated between the fund and the lending agent. Income from securities lending is separately reported in the Statement of Operations. The dividend and interest income earned on the securities loaned is accounted for in the same manner as other dividend and interest income.
Indemnifications — Under the fund's organizational documents, its officers and Trustees may be indemnified against certain liabilities and expenses arising out of the performance of their duties to the fund. Additionally, in the normal course of business, the fund enters into agreements with service providers that may contain indemnification clauses. The fund's maximum exposure under these agreements is unknown as this would involve future claims that may be made against the fund that have not yet occurred.
Investment Transactions and Income — Investment transactions are recorded on the trade date. Interest income is recorded on the accrual basis. Dividends received in cash are recorded on the ex-dividend date. Certain dividends from foreign securities will be recorded when the fund is informed of the dividend if such information is obtained subsequent to the ex-dividend date. Dividend payments received in additional securities are recorded on the ex-dividend date in an amount equal to the value of the security on such date. In determining the net gain or loss on securities sold, the cost of securities is determined on the identified cost basis.
MFS Blended Research Small Cap Equity Portfolio
Notes to Financial Statements - continued
The fund may receive proceeds from litigation settlements. Any proceeds received from litigation involving portfolio holdings are reflected in the Statement of Operations in realized gain/loss if the security has been disposed of by the fund or in unrealized gain/loss if the security is still held by the fund. Any other proceeds from litigation not related to portfolio holdings are reflected as other income in the Statement of Operations.
Tax Matters and Distributions — The fund intends to qualify as a regulated investment company, as defined under Subchapter M of the Internal Revenue Code, and to distribute all of its taxable income, including realized capital gains. As a result, no provision for federal income tax is required. The fund’s federal tax returns, when filed, will remain subject to examination by the Internal Revenue Service for a three year period. Management has analyzed the fund’s tax positions taken on federal and state tax returns for all open tax years and does not believe that there are any uncertain tax positions that require recognition of a tax liability. Foreign taxes, if any, have been accrued by the fund in the accompanying financial statements in accordance with the applicable foreign tax law. Foreign income taxes may be withheld by certain countries in which the fund invests. Additionally, capital gains realized by the fund on securities issued in or by certain foreign countries may be subject to capital gains tax imposed by those countries.
Distributions to shareholders are recorded on the ex-dividend date. Income and capital gain distributions are determined in accordance with income tax regulations, which may differ from U.S. generally accepted accounting principles. Certain capital accounts in the financial statements are periodically adjusted for permanent differences in order to reflect their tax character. These adjustments have no impact on net assets or net asset value per share. Temporary differences which arise from recognizing certain items of income, expense, gain or loss in different periods for financial statement and tax purposes will reverse at some time in the future.
Book/tax differences primarily relate to wash sale loss deferrals.
The tax character of distributions declared to shareholders for the last two fiscal years is as follows:
| | Year ended
12/31/22 | Year ended
12/31/21 |
| Ordinary income (including any short-term capital gains) | $7,210,050 | $770,014 |
| Long-term capital gains | 13,710,044 | — |
| Total distributions | $20,920,094 | $770,014 |
The federal tax cost and the tax basis components of distributable earnings were as follows:
| As of 12/31/22 | |
| Cost of investments | $78,865,287 |
| Gross appreciation | 13,843,650 |
| Gross depreciation | (11,813,110) |
| Net unrealized appreciation (depreciation) | $2,030,540 |
| Undistributed ordinary income | 504,273 |
| Undistributed long-term capital gain | 2,812,602 |
| Total distributable earnings (loss) | $5,347,415 |
Multiple Classes of Shares of Beneficial Interest — The fund offers multiple classes of shares, which differ in their respective distribution and/or service fees. The fund's income, realized and unrealized gain (loss), and common expenses are allocated to shareholders based on the daily net assets of each class. Dividends are declared separately for each class. Differences in per share dividend rates are generally due to differences in separate class expenses. The fund’s distributions declared to shareholders as reported in the Statements of Changes in Net Assets are presented by class as follows:
| | Year
ended
12/31/22 | | Year
ended
12/31/21 |
| Initial Class | $7,622,659 | | $338,509 |
| Service Class | 13,297,435 | | 431,505 |
| Total | $20,920,094 | | $770,014 |
(3) Transactions with Affiliates
Investment Adviser — The fund has an investment advisory agreement with MFS to provide overall investment management and related administrative services and facilities to the fund. The management fee is computed daily and paid monthly at an annual rate of 0.40% of the fund’s average daily net assets. MFS has agreed in writing to reduce its management fee by a specified amount if
MFS Blended Research Small Cap Equity Portfolio
Notes to Financial Statements - continued
certain MFS mutual fund assets exceed thresholds agreed to by MFS and the fund's Board of Trustees. Effective March 1, 2022, MFS has also agreed in writing to waive at least 0.01% of its management fee as part of this agreement. The agreement to waive at least 0.01% of the management fee will continue until modified by the fund's Board of Trustees, but such agreement will continue at least until April 30, 2024. For the year ended December 31, 2022, this management fee reduction amounted to $12,242, which is included in the reduction of total expenses in the Statement of Operations. The management fee incurred for the year ended December 31, 2022 was equivalent to an annual effective rate of 0.39% of the fund's average daily net assets.
The investment adviser has agreed in writing to pay a portion of the fund’s total annual operating expenses, excluding interest, taxes, extraordinary expenses, brokerage and transaction costs, certain tax reclaim recovery expenses (including contingency fees and closing agreement expenses), and investment-related expenses, such that total annual operating expenses do not exceed 0.60% of average daily net assets for the Initial Class shares and 0.85% of average daily net assets for the Service Class shares. This written agreement will continue until modified by the fund’s Board of Trustees, but such agreement will continue at least until April 30, 2024. For the year ended December 31, 2022, the fund’s actual operating expenses did not exceed the limit and therefore, the investment adviser did not pay any portion of the fund’s expenses related to this agreement.
Distributor — MFS Fund Distributors, Inc. (MFD), a wholly-owned subsidiary of MFS, is the distributor of shares of the fund. The Trustees have adopted a distribution plan for the Service Class shares pursuant to Rule 12b-1 under the Investment Company Act of 1940.
The fund's distribution plan provides that the fund will pay MFD distribution and/or service fees equal to 0.25% per annum of its average daily net assets attributable to Service Class shares as partial consideration for services performed and expenses incurred by MFD and financial intermediaries (including participating insurance companies that invest in the fund to fund variable annuity and variable life insurance contracts, sponsors of qualified retirement and pension plans that invest in the fund, and affiliates of these participating insurance companies and plan sponsors) in connection with the sale and distribution of the Service Class shares. MFD may subsequently pay all, or a portion, of the distribution and/or service fees to financial intermediaries.
Shareholder Servicing Agent — MFS Service Center, Inc. (MFSC), a wholly-owned subsidiary of MFS, receives a fee from the fund for its services as shareholder servicing agent. For the year ended December 31, 2022, the fee was $9,553, which equated to 0.0109% annually of the fund's average daily net assets. MFSC also receives reimbursement from the fund for out-of-pocket expenses paid by MFSC on behalf of the fund. For the year ended December 31, 2022, these costs amounted to $754.
Administrator — MFS provides certain financial, legal, shareholder communications, compliance, and other administrative services to the fund. Under an administrative services agreement, the fund reimburses MFS the costs incurred to provide these services. The fund is charged an annual fixed amount of $17,500 plus a fee based on average daily net assets. The administrative services fee incurred for the year ended December 31, 2022 was equivalent to an annual effective rate of 0.0265% of the fund's average daily net assets.
Trustees’ and Officers’ Compensation — The fund pays compensation to independent Trustees in the form of a retainer, attendance fees, and additional compensation to Board and Committee chairpersons. The fund does not pay compensation directly to Trustees or officers of the fund who are also officers of the investment adviser, all of whom receive remuneration from MFS for their services to the fund. Certain officers and Trustees of the fund are officers or directors of MFS, MFD, and MFSC.
Other — The fund invests in the MFS Institutional Money Market Portfolio which is managed by MFS and seeks current income consistent with preservation of capital and liquidity. This money market fund does not pay a management fee to MFS but does incur investment and operating costs.
The adviser has voluntarily undertaken to reimburse the fund from its own resources on a quarterly basis for the cost of investment research embedded in the cost of the fund’s securities trades. This agreement may be rescinded at any time. For the year ended December 31, 2022, this reimbursement amounted to $12,805, which is included in “Other” income in the Statement of Operations.
The fund is permitted to engage in purchase and sale transactions with funds and accounts for which MFS serves as investment adviser or sub-adviser (“cross-trades”) pursuant to a policy adopted by the Board of Trustees. This policy has been designed to ensure that cross-trades conducted by the fund comply with Rule 17a-7 under the Investment Company Act of 1940. During the year ended December 31, 2022, the fund engaged in purchase transactions pursuant to this policy, which amounted to $578,068.
(4) Portfolio Securities
For the year ended December 31, 2022, purchases and sales of investments, other than short-term obligations, aggregated $48,780,082 and $52,827,554, respectively.
MFS Blended Research Small Cap Equity Portfolio
Notes to Financial Statements - continued
(5) Shares of Beneficial Interest
The fund's Declaration of Trust permits the Trustees to issue an unlimited number of full and fractional shares of beneficial interest. Transactions in fund shares were as follows:
| | Year ended
12/31/22 | | Year ended
12/31/21 |
| | Shares | Amount | | Shares | Amount |
| Shares sold | | | | | |
| Initial Class | 244,552 | $2,627,998 | | 263,239 | $3,473,991 |
| Service Class | 628,724 | 6,501,877 | | 607,326 | 7,714,638 |
| | 873,276 | $9,129,875 | | 870,565 | $11,188,629 |
Shares issued to shareholders
in reinvestment of distributions | | | | | |
| Initial Class | 813,518 | $7,622,659 | | 25,357 | $338,509 |
| Service Class | 1,492,417 | 13,297,435 | | 33,580 | 431,505 |
| | 2,305,935 | $20,920,094 | | 58,937 | $770,014 |
| Shares reacquired | | | | | |
| Initial Class | (447,049) | $(4,929,664) | | (602,378) | $(7,913,165) |
| Service Class | (874,850) | (9,184,126) | | (1,450,359) | (18,293,669) |
| | (1,321,899) | $(14,113,790) | | (2,052,737) | $(26,206,834) |
| Net change | | | | | |
| Initial Class | 611,021 | $5,320,993 | | (313,782) | $(4,100,665) |
| Service Class | 1,246,291 | 10,615,186 | | (809,453) | (10,147,526) |
| | 1,857,312 | $15,936,179 | | (1,123,235) | $(14,248,191) |
(6) Line of Credit
The fund and certain other funds managed by MFS participate in a $1.45 billion unsecured committed line of credit of which $1.2 billion is reserved for use by the fund and certain other MFS U.S. funds. The line of credit is provided by a syndicate of banks under a credit agreement. Borrowings may be made for temporary financing needs. Interest is charged to each fund, based on its borrowings, generally at a rate equal to the highest of 1) Daily Simple SOFR (Secured Overnight Financing Rate) plus 0.10%, 2) the Federal Funds Effective Rate, or 3) the Overnight Bank Funding Rate, each plus an agreed upon spread. A commitment fee, based on the average daily unused portion of the committed line of credit, is allocated among the participating funds. The line of credit expires on March 16, 2023 unless extended or renewed. In addition, the fund and other funds managed by MFS have established unsecured uncommitted borrowing arrangements with certain banks for temporary financing needs. Interest is charged to each fund, based on its borrowings, at rates equal to customary reference rates plus an agreed upon spread. For the year ended December 31, 2022, the fund’s commitment fee and interest expense were $441 and $0, respectively, and are included in “Miscellaneous” expense in the Statement of Operations.
(7) Investments in Affiliated Issuers
An affiliated issuer may be considered one in which the fund owns 5% or more of the outstanding voting securities, or a company which is under common control. For the purposes of this report, the following were affiliated issuers:
| Affiliated Issuers | Beginning
Value | Purchases | Sales
Proceeds | Realized
Gain
(Loss) | Change in
Unrealized
Appreciation or
Depreciation | Ending
Value |
| MFS Institutional Money Market Portfolio | $1,035,352 | $12,553,930 | $12,884,120 | $(3) | $75 | $705,234 |
| Affiliated Issuers | Dividend
Income | Capital Gain
Distributions |
| MFS Institutional Money Market Portfolio | $9,462 | $— |
MFS Blended Research Small Cap Equity Portfolio
Notes to Financial Statements - continued
(8) LIBOR Transition
Certain of the fund's investments, including investments in certain debt instruments and derivatives (if any), as well as borrowings by the fund and certain other contractual arrangements of the fund, may be based on the London Interbank Offered Rate (“LIBOR”). In 2017, the regulatory authority that oversees financial services firms in the United Kingdom announced plans to transition away from LIBOR by the end of 2021. In March 2021, the administrator of LIBOR announced the extension of the publication of the more commonly used U.S. dollar LIBOR settings to the end of June 2023. Although the full impacts of the transition away from LIBOR are not fully known, the transition may result in, among other things, an increase in volatility or illiquidity of the markets for instruments that currently rely on LIBOR to determine interest rates and this could have an adverse impact on the fund's performance. With respect to the fund's accounting for investments, including investments in certain debt instruments and derivatives, as well as borrowings by the fund and any other contractual arrangements of the fund that undergo reference rate-related modifications as a result of the transition, management will rely upon the relief provided by FASB Codification Topic 848 – Reference Rate Reform (Topic 848). The guidance in Topic 848 permits the fund to account for those modified contracts as a continuation of the existing contracts. Management is still evaluating the impact to the fund of the June 30, 2023 planned discontinuation of the more commonly used U.S. dollar LIBOR settings.
(9) Russia and Ukraine Conflict
The market disruptions, which began in late February 2022, associated with geopolitical events related to the conflict between Russia and Ukraine may adversely affect the value of the fund’s assets and thus the fund’s performance. Management continues to monitor these events and to evaluate the related impacts, if any, to the fund.
MFS Blended Research Small Cap Equity Portfolio
Report of Independent Registered Public Accounting Firm
To the Board of Trustees of MFS Variable Insurance Trust III and the Shareholders of MFS Blended Research Small Cap Equity Portfolio:
Opinion on the Financial Statements and Financial Highlights
We have audited the accompanying statement of assets and liabilities of MFS Blended Research Small Cap Equity Portfolio (the “Fund”), including the portfolio of investments, as of December 31, 2022, the related statement of operations for the year then ended, the statements of changes in net assets for each of the two years in the period then ended, the financial highlights for each of the five years in the period then ended, and the related notes. In our opinion, the financial statements and financial highlights present fairly, in all material respects, the financial position of the Fund as of December 31, 2022, and the results of its operations for the year then ended, the changes in its net assets for each of the two years in the period then ended, and the financial highlights for each of the five years in the period then ended, in conformity with accounting principles generally accepted in the United States of America.
Basis for Opinion
These financial statements and financial highlights are the responsibility of the Fund's management. Our responsibility is to express an opinion on the Fund's financial statements and financial highlights based on our audits. We are a public accounting firm registered with the Public Company Accounting Oversight Board (United States) (PCAOB) and are required to be independent with respect to the Fund in accordance with the U.S. federal securities laws and the applicable rules and regulations of the Securities and Exchange Commission and the PCAOB.
We conducted our audits in accordance with the standards of the PCAOB. Those standards require that we plan and perform the audit to obtain reasonable assurance about whether the financial statements and financial highlights are free of material misstatement, whether due to error or fraud. The Fund is not required to have, nor were we engaged to perform, an audit of its internal control over financial reporting. As part of our audits, we are required to obtain an understanding of internal control over financial reporting but not for the purpose of expressing an opinion on the effectiveness of the Fund's internal control over financial reporting. Accordingly, we express no such opinion.
Our audits included performing procedures to assess the risks of material misstatement of the financial statements and financial highlights, whether due to error or fraud, and performing procedures that respond to those risks. Such procedures included examining, on a test basis, evidence regarding the amounts and disclosures in the financial statements and financial highlights. Our audits also included evaluating the accounting principles used and significant estimates made by management, as well as evaluating the overall presentation of the financial statements and financial highlights. Our procedures included confirmation of securities owned as of December 31, 2022, by correspondence with the custodian and brokers. We believe that our audits provide a reasonable basis for our opinion.
DELOITTE & TOUCHE LLP
Boston, Massachusetts
February 15, 2023
We have served as the auditor of one or more of the MFS investment companies since 1924.
MFS Blended Research Small Cap Equity Portfolio
Trustees and Officers — Identification and Background
The Trustees and Officers of the Trust, as of February 1, 2023, are listed below, together with their principal occupations during the past five years. (Their titles may have varied during that period.) The address of each Trustee and Officer is 111 Huntington Avenue, Boston, Massachusetts 02199-7618.
| Name, Age | | Position(s) Held with Fund | | Trustee/Officer Since(h) | | Number of MFS Funds overseen by the Trustee | | Principal Occupations During
the Past Five Years | | Other Directorships During
the Past Five Years (j) |
| INTERESTED TRUSTEE | | | | | | | | | | |
Michael W. Roberge (k)
(age 56) | | Trustee | | January 2021 | | 136 | | Massachusetts Financial Services Company, Chairman (since January 2021); Chief Executive Officer (since January 2017); Director; Chairman of the Board (since January 2022); President (until December 2018); Chief Investment Officer (until December 2018) | | N/A |
| INDEPENDENT TRUSTEES | | | | | | | | | | |
John P. Kavanaugh
(age 68) | | Trustee and Chair of Trustees | | January 2009 | | 136 | | Private investor | | N/A |
Steven E. Buller
(age 71) | | Trustee | | February 2014 | | 136 | | Private investor | | N/A |
John A. Caroselli
(age 68) | | Trustee | | March 2017 | | 136 | | Private investor; JC Global Advisors, LLC (management consulting), President (since 2015) | | N/A |
Maureen R. Goldfarb
(age 67) | | Trustee | | January 2009 | | 136 | | Private investor | | N/A |
Peter D. Jones
(age 67) | | Trustee | | January 2019 | | 136 | | Private investor | | N/A |
James W. Kilman, Jr.
(age 61) | | Trustee | | January 2019 | | 136 | | Burford Capital Limited (finance and investment management), Senior Advisor (since May 3, 2021), Chief Financial Officer (2019 - May 2, 2021); KielStrand Capital LLC (family office), Chief Executive Officer (since 2016) | | Alpha-En Corporation, Director (2016-2019) |
Clarence Otis, Jr.
(age 66) | | Trustee | | March 2017 | | 136 | | Private investor | | VF Corporation, Director; Verizon Communications, Inc., Director; The Travelers Companies, Director |
Maryanne L. Roepke
(age 66) | | Trustee | | May 2014 | | 136 | | Private investor | | N/A |
Laurie J. Thomsen
(age 65) | | Trustee | | March 2005 | | 136 | | Private investor | | The Travelers Companies, Director; Dycom Industries, Inc., Director |
MFS Blended Research Small Cap Equity Portfolio
Trustees and Officers - continued
| Name, Age | | Position(s) Held with
Fund | | Trustee/Officer Since(h) | | Number of MFS Funds for which the Person is an Officer | | Principal Occupations During
the Past Five Years |
| OFFICERS | | | | | | | | |
Christopher R. Bohane (k)
(age 49) | | Assistant Secretary and Assistant Clerk | | July 2005 | | 136 | | Massachusetts Financial Services Company, Senior Vice President and Senior Managing Counsel |
Kino Clark (k)
(age 54) | | Assistant Treasurer | | January 2012 | | 136 | | Massachusetts Financial Services Company, Vice President |
John W. Clark, Jr. (k)
(age 55) | | Assistant Treasurer | | April 2017 | | 136 | | Massachusetts Financial Services Company, Vice President |
David L. DiLorenzo (k)
(age 54) | | President | | July 2005 | | 136 | | Massachusetts Financial Services Company, Senior Vice President |
Heidi W. Hardin (k)
(age 55) | | Secretary and Clerk | | April 2017 | | 136 | | Massachusetts Financial Services Company, Executive Vice President and General Counsel |
Brian E. Langenfeld (k)
(age 49) | | Assistant Secretary and Assistant Clerk | | June 2006 | | 136 | | Massachusetts Financial Services Company, Vice President and Managing Counsel |
Rosa E. Licea-Mailloux (k)
(age 46) | | Chief Compliance Officer | | March 2022 | | 136 | | Massachusetts Financial Services Company, Vice President (since 2018); Director of Corporate Compliance (2018-2021), Senior Director Compliance (2021-2022), Senior Managing Director of North American Compliance & Chief Compliance Officer (since March 2022); Natixis Investment Managers (investment management), Funds Chief Compliance Officer, Deputy General Counsel & Senior Vice President (until 2018) |
Amanda S. Mooradian (k)
(age 43) | | Assistant Secretary and Assistant Clerk | | September 2018 | | 136 | | Massachusetts Financial Services Company, Assistant Vice President and Senior Counsel |
Susan A. Pereira (k)
(age 52) | | Assistant Secretary and Assistant Clerk | | July 2005 | | 136 | | Massachusetts Financial Services Company, Vice President and Managing Counsel |
Kasey L. Phillips (k)
(age 52) | | Assistant Treasurer | | September 2012 | | 136 | | Massachusetts Financial Services Company, Vice President |
Matthew A. Stowe (k)
(age 48) | | Assistant Secretary and Assistant Clerk | | October 2014 | | 136 | | Massachusetts Financial Services Company, Vice President and Senior Managing Counsel |
William B. Wilson (k)
(age 40) | | Assistant Secretary and Assistant Clerk | | October 2022 | | 136 | | Massachusetts Financial Services Company, Assistant Vice President and Counsel |
James O. Yost (k)
(age 62) | | Treasurer | | September 1990 | | 136 | | Massachusetts Financial Services Company, Senior Vice President |
| (h) | Date first appointed to serve as Trustee/Officer of an MFS Fund. Each Trustee has served continuously since appointment unless indicated otherwise. From January 2012 through December 2016, Messrs. DiLorenzo and Yost served as Treasurer and Deputy Treasurer of the Funds, respectively. |
| (j) | Directorships or trusteeships of companies required to report to the Securities and Exchange Commission (i.e., “public companies”). |
| (k) | “Interested person” of the Trust within the meaning of the Investment Company Act of 1940 (referred to as the 1940 Act), which is the principal federal law governing investment companies like the fund, as a result of a position with MFS. The address of MFS is 111 Huntington Avenue, Boston, Massachusetts 02199-7618. |
Each Trustee (other than Messrs. Jones, Kilman and Roberge) has been elected by shareholders and each Trustee and Officer holds office until his or her successor is chosen and qualified or until his or her earlier death, resignation, retirement or removal. Mr. Roberge became a Trustee of the Funds on January 1, 2021 and Messrs. Jones and Kilman became Trustees of the Funds on January 1, 2019. The Trust does not hold annual meetings for the purpose of electing Trustees, and Trustees are not elected for fixed terms. Under the terms of the Board's retirement policy, an Independent Trustee shall retire at the end of the calendar year in which he or she reaches the earlier of 75 years of age or 15 years of service on the Board (or, in the case of any Independent Trustee who joined the Board prior to 2015, 20 years of service on the Board).
MFS Blended Research Small Cap Equity Portfolio
Trustees and Officers - continued
Messrs. Buller, Kilman and Otis and Ms. Roepke are members of the Trust’s Audit Committee.
Each of the Interested Trustees and certain Officers hold comparable officer positions with certain affiliates of MFS.
The Statement of Additional Information for a Fund includes further information about the Trustees and is available without charge upon request by calling 1-800-225-2606.
| Investment Adviser | Custodian |
Massachusetts Financial Services Company
111 Huntington Avenue
Boston, MA 02199-7618 | State Street Bank and Trust Company
1 Lincoln Street
Boston, MA 02111-2900 |
| Distributor | Independent Registered Public Accounting Firm |
MFS Fund Distributors, Inc.
111 Huntington Avenue
Boston, MA 02199-7618 | Deloitte & Touche LLP
200 Berkeley Street
Boston, MA 02116 |
| Portfolio Manager(s) | |
Jim Fallon
Matt Krummell
Jonathan Sage
Jed Stocks | |
MFS Blended Research Small Cap Equity Portfolio
Board Review of Investment Advisory Agreement
MFS Blended Research Small Cap Equity Portfolio
The Investment Company Act of 1940 requires that both the full Board of Trustees and a majority of the non-interested (“independent”) Trustees, voting separately, annually approve the continuation of the Fund’s investment advisory agreement with MFS. The Trustees consider matters bearing on the Fund and its advisory arrangements at their meetings throughout the year, including a review of performance data at each regular meeting. In addition, the independent Trustees met several times over the course of three months beginning in May and ending in July, 2022 (“contract review meetings”) for the specific purpose of considering whether to approve the continuation of the investment advisory agreement for the Fund and the other investment companies that the Board oversees (the “MFS Funds”). The independent Trustees were assisted in their evaluation of the Fund’s investment advisory agreement by independent legal counsel, from whom they received separate legal advice and with whom they met separately from MFS during various contract review meetings. The independent Trustees were also assisted in this process by an independent consultant who was retained by and reported to the independent Trustees.
In connection with their deliberations regarding the continuation of the investment advisory agreement, the Trustees, including the independent Trustees, considered such information and factors as they believed, in light of the legal advice furnished to them and their own business judgment, to be relevant. The investment advisory agreement for the Fund was considered separately, although the Trustees also took into account the common interests of all MFS Funds in their review. As described below, the Trustees considered the nature, quality, and extent of the various investment advisory, administrative, and shareholder services performed by MFS under the existing investment advisory agreement and other arrangements with the Fund.
In connection with their contract review meetings, the Trustees received and relied upon materials that included, among other items: (i) information provided by Broadridge Financial Solutions, Inc. (“Broadridge”), an independent third party, on the investment performance of the Fund for various time periods ended December 31, 2021 and the investment performance of a group of funds with substantially similar investment classifications/objectives (the “Broadridge performance universe”), (ii) information provided by Broadridge on the Fund’s advisory fees and other expenses and the advisory fees and other expenses of comparable funds identified by Broadridge as well as all other funds in the same investment classification/category (the “Broadridge expense group and universe”), (iii) information provided by MFS on the advisory fees of portfolios of other clients of MFS, including institutional separate accounts and other clients, (iv) information as to whether and to what extent applicable expense waivers, reimbursements or fee “breakpoints” are observed for the Fund, (v) information regarding MFS’ financial results and financial condition, including MFS’ and certain of its affiliates’ estimated profitability from services performed for the Fund and the MFS Funds as a whole, and compared to MFS’ institutional business, (vi) MFS’ views regarding the outlook for the mutual fund industry and the strategic business plans of MFS, (vii) descriptions of various functions performed by MFS for the Funds, such as compliance monitoring and portfolio trading practices, and (viii) information regarding the overall organization of MFS, including information about MFS’ senior management and other personnel providing investment advisory, administrative and other services to the Fund and the other MFS Funds. The comparative performance, fee and expense information prepared and provided by Broadridge was not independently verified and the independent Trustees did not independently verify any information provided to them by MFS.
The Trustees’ conclusion as to the continuation of the investment advisory agreement was based on a comprehensive consideration of all information provided to the Trustees and not the result of any single factor. Some of the factors that figured particularly in the Trustees’ deliberations are described below, although individual Trustees may have evaluated the information presented differently from one another, giving different weights to various factors. It is also important to recognize that the fee arrangements for the Fund and other MFS Funds are the result of years of review and discussion between the independent Trustees and MFS, that certain aspects of such arrangements may receive greater scrutiny in some years than in others, and that the Trustees’ conclusions may be based, in part, on their consideration of these same arrangements during the course of the year and in prior years.
Based on information provided by Broadridge and MFS, the Trustees reviewed the Fund’s total return investment performance as well as the Broadridge performance universe over various time periods. The Trustees placed particular emphasis on the total return performance of the Fund’s Initial Class shares in comparison to the performance of funds in its Broadridge performance universe over the five-year period ended December 31, 2021, which the Trustees believed was a long enough period to reflect differing market conditions. The total return performance of the Fund’s Initial Class shares was in the 1st quintile relative to the other funds in the universe for this five-year period (the 1st quintile being the best performers and the 5th quintile being the worst performers). The total return performance of the Fund’s Initial Class shares was in the 1st quintile for the one-year period and the 5th quintile for the three-year period ended December 31, 2021 relative to the Broadridge performance universe. Because of the passage of time, these performance results may differ from the performance results for more recent periods, including those shown elsewhere in this report.
In the course of their deliberations, the Trustees took into account information provided by MFS in connection with the contract review meetings, as well as during investment review meetings conducted with portfolio management personnel during the course of the year regarding the Fund’s performance. After reviewing these and related factors, the Trustees concluded, within the context of their overall conclusions regarding the investment advisory agreement, that they were satisfied with MFS’ responses and efforts relating to investment performance.
MFS Blended Research Small Cap Equity Portfolio
Board Review of Investment Advisory Agreement - continued
In assessing the reasonableness of the Fund’s advisory fee, the Trustees considered, among other information, the Fund’s advisory fee and the total expense ratio of the Fund’s Initial Class shares as a percentage of average daily net assets and the advisory fee and total expense ratios of the Broadridge expense group based on information provided by Broadridge. The Trustees considered that MFS currently observes an expense limitation for the Fund, which may not be changed without the Trustees’ approval. The Trustees also considered that, according to the data provided by Broadridge (which takes into account any fee reductions or expense limitations that were in effect during the Fund’s last fiscal year), the Fund’s effective advisory fee rate and total expense ratio were each lower than the Broadridge expense group median.
The Trustees also considered the advisory fees charged by MFS to any institutional separate accounts advised by MFS (“separate accounts”) and unaffiliated investment companies for which MFS serves as subadviser (“subadvised funds”) that have comparable investment strategies to the Fund, if any. In comparing these fees, the Trustees considered information provided by MFS as to the generally broader scope of services provided by MFS to the Fund, as well as the more extensive regulatory burdens imposed on MFS in managing the Fund, in comparison to separate accounts and subadvised funds. The Trustees also considered the higher demands placed on MFS’ investment personnel and trading infrastructure as a result of the daily cash in-flows and out-flows of the Fund in comparison to separate accounts.
The Trustees also considered whether the Fund may benefit from any economies of scale in the management of the Fund in the event of growth in assets of the Fund and/or growth in assets of the MFS Funds as a whole. They noted that the Fund’s advisory fee rate schedule is not subject to any breakpoints. Taking into account the expense limitation noted above, the Trustees determined not to recommend any advisory fee breakpoints for the Fund at this time. The Trustees also noted that MFS has agreed in writing to waive a portion of the management fees of certain MFS Funds, including the Fund, if the total combined assets of certain funds within the MFS Funds’ complex increase above agreed upon thresholds (the “group fee waiver”), enabling the Fund’s shareholders to share in the benefits from any economies of scale at the complex level. The group fee waiver is reviewed and renewed annually between the Board and MFS. The Trustees concluded that the group fee waiver was sufficient to allow the Fund to benefit from economies of scale as its assets and overall complex assets grow.
The Trustees also considered information prepared by MFS relating to MFS’ costs and profits with respect to the Fund, the MFS Funds considered as a group, and other investment companies and accounts advised by MFS, as well as MFS’ methodologies used to determine and allocate its costs to the MFS Funds, the Fund and other accounts and products for purposes of estimating profitability.
After reviewing these and other factors described herein, the Trustees concluded, within the context of their overall conclusions regarding the investment advisory agreement, that the advisory fees charged to the Fund represent reasonable compensation in light of the services being provided by MFS to the Fund.
In addition, the Trustees considered MFS’ resources and related efforts to continue to retain, attract and motivate capable personnel to serve the Fund. The Trustees also considered current and developing conditions in the financial services industry, including the presence of large and well-capitalized companies which are spending, and appear to be prepared to continue to spend, substantial sums to engage personnel and to provide services to competing investment companies. In this regard, the Trustees also considered the financial resources of MFS and its ultimate parent, Sun Life Financial Inc. The Trustees also considered the advantages and possible disadvantages to the Fund of having an adviser that also serves other investment companies as well as other accounts.
The Trustees also considered the nature, quality, cost, and extent of administrative, transfer agency, and distribution services provided to the Fund by MFS and its affiliates under agreements and plans other than the investment advisory agreement, including any 12b-1 fees the Fund pays to MFS Fund Distributors, Inc., an affiliate of MFS. The Trustees also considered the nature, extent and quality of certain other services MFS performs or arranges for on the Fund’s behalf, which may include securities lending programs, directed expense payment programs, class action recovery programs, and MFS’ interaction with third-party service providers, principally custodians and sub-custodians. The Trustees concluded that the various non-advisory services provided by MFS and its affiliates on behalf of the Fund were satisfactory.
The Trustees considered so-called “fall-out benefits” to MFS such as reputational value derived from serving as investment manager to the MFS Funds. The Trustees also considered that MFS discontinued its historic practice of obtaining investment research from portfolio brokerage commissions paid by certain MFS Funds effective January 2018, and directly pays or voluntarily reimburses a Fund, if applicable, for the costs of external research acquired through the use of the Fund’s portfolio brokerage commissions.
Based on their evaluation of factors that they deemed to be material, including those factors described above, the Board of Trustees, including the independent Trustees, concluded that the Fund’s investment advisory agreement with MFS should be continued for an additional one-year period, commencing August 1, 2022.
MFS Blended Research Small Cap Equity Portfolio
Proxy Voting Policies and Information
MFS votes proxies on behalf of the fund pursuant to proxy voting policies and procedures that are available without charge, upon request, by calling 1-800-225-2606, by visiting mfs.com/proxyvoting, or by visiting the SEC’s Web site at http://www.sec.gov.
Information regarding how the fund voted proxies relating to portfolio securities during the most recent twelve-month period ended June 30 is available by August 31 of each year without charge by visiting mfs.com/proxyvoting, or by visiting the SEC’s Web site at http://www.sec.gov.
Quarterly Portfolio Disclosure
The fund files a complete schedule of portfolio holdings with the SEC for the first and third quarters of each fiscal year as an exhibit to its reports on Form N-PORT. The fund’s Form N-PORT reports are available on the SEC’s Web site at http://www.sec.gov. A shareholder can obtain the portfolio holdings report for the first and third quarters of the fund's fiscal year at mfs.com/vit3 by choosing the fund's name and then scrolling to the “Resources” section and clicking on the “Prospectus and Reports” tab.
FURTHER INFORMATION
From time to time, MFS may post important information about the fund or the MFS Funds on the MFS Web site (mfs.com). This information is available at https://www.mfs.com/announcements or at mfs.com/vit3 by choosing the fund's name and then scrolling to the “Resources” section and clicking on the “Announcements” tab, if any.
Information About Fund Contracts and Legal Claims
The fund has entered into contractual arrangements with an investment adviser, administrator, distributor, shareholder servicing agent, and custodian who each provide services to the fund. Unless expressly stated otherwise, shareholders are not parties to, or intended beneficiaries of these contractual arrangements, and these contractual arrangements are not intended to create any shareholder right to enforce them against the service providers or to seek any remedy under them against the service providers, either directly or on behalf of the fund.
Under the Trust’s By-Laws and Declaration of Trust, any claims asserted against or on behalf of the MFS Funds, including claims against Trustees and Officers, must be brought in state and federal courts located within the Commonwealth of Massachusetts.
Federal Tax Information (unaudited)
The following information is provided pursuant to provisions of the Internal Revenue Code.
The fund designates $15,082,000 as capital gain dividends paid during the fiscal year.
For corporate shareholders, 12.72% of the ordinary income dividends paid during the fiscal year qualify for the corporate dividends received deduction.
| FACTS | WHAT DOES MFS DO WITH YOUR PERSONAL INFORMATION? |
| Why? | Financial companies choose how they share your personal information. Federal law gives consumers the right to limit some but not all sharing. Federal law also requires us to tell you how we collect, share, and protect your personal information. Please read this notice carefully to understand what we do. |
| What? | The types of personal information we collect and share depend on the product or service you have with us. This information can include: |
| • Social Security number and account balances |
| • Account transactions and transaction history |
| • Checking account information and wire transfer instructions |
| When you are no longer our customer, we continue to share your information as described in this notice. |
| How? | All financial companies need to share customers' personal information to run their everyday business. In the section below, we list the reasons financial companies can share their customers' personal information; the reasons MFS chooses to share; and whether you can limit this sharing. |
Reasons we can share your
personal information | Does MFS share? | Can you limit
this sharing? |
For our everyday business purposes –
such as to process your transactions, maintain your
account(s), respond to court orders and legal
investigations, or report to credit bureaus | Yes | No |
For our marketing purposes –
to offer our products and services to you | No | We don't share |
For joint marketing with other
financial companies | No | We don't share |
For our affiliates' everyday business purposes –
information about your transactions and experiences | No | We don't share |
For our affiliates' everyday business purposes –
information about your creditworthiness | No | We don't share |
| For nonaffiliates to market to you | No | We don't share |
| Questions? | Call 800-225-2606 or go to mfs.com. |
| Who we are |
| Who is providing this notice? | MFS Funds, MFS Investment Management, MFS Institutional Advisors, Inc., and MFS Heritage Trust Company. |
| What we do |
How does MFS
protect my personal
information? | To protect your personal information from unauthorized access and use, we use security measures that comply with federal law. These measures include procedural, electronic, and physical safeguards for the protection of the personal information we collect about you. |
How does MFS
collect my personal
information? | We collect your personal information, for example, when you |
| • open an account or provide account information |
| • direct us to buy securities or direct us to sell your securities |
| • make a wire transfer |
| We also collect your personal information from others, such as credit bureaus, affiliates, or other companies. |
| Why can't I limit all sharing? | Federal law gives you the right to limit only |
| • sharing for affiliates' everyday business purposes – information about your creditworthiness |
| • affiliates from using your information to market to you |
| • sharing for nonaffiliates to market to you |
| State laws and individual companies may give you additional rights to limit sharing. |
| Definitions |
| Affiliates | Companies related by common ownership or control. They can be financial and nonfinancial companies. |
| • MFS does not share personal information with affiliates, except for everyday business purposes as described on page one of this notice. |
| Nonaffiliates | Companies not related by common ownership or control. They can be financial and nonfinancial companies. |
| • MFS does not share with nonaffiliates so they can market to you. |
| Joint marketing | A formal agreement between nonaffiliated financial companies that together market financial products or services to you. |
| • MFS doesn't jointly market. |
| Other important information |
| If you own an MFS product or receive an MFS service in the name of a third party such as a bank or broker-dealer, their privacy policy may apply to you instead of ours. |
Annual Report
December 31, 2022
MFS® Conservative
Allocation Portfolio
MFS® Variable Insurance Trust III
MFS® Conservative Allocation Portfolio
| 1 |
| 2 |
| 3 |
| 5 |
| 7 |
| 8 |
| 9 |
| 10 |
| 11 |
| 12 |
| 14 |
| 21 |
| 22 |
| 25 |
| 27 |
| 27 |
| 27 |
| 27 |
| 27 |
| 28 |
The report is prepared for the general information of shareholders. It is authorized for distribution to prospective investors only when preceded or accompanied by a current prospectus.
NOT FDIC INSURED • MAY LOSE VALUE • NO BANK OR CREDIT UNION GUARANTEE •
NOT A DEPOSIT • NOT INSURED BY ANY FEDERAL GOVERNMENT AGENCY OR NCUA/NCUSIF
MFS Conservative Allocation Portfolio
LETTER FROM THE CHAIR AND CEO
Dear Shareholders:
Signs of peaking inflation, hopes that monetary policy tightening cycles may be nearing an end and a rapid reopening of China’s economy in late-2022 and early-2023 have combined to bolster investor sentiment in recent months. Markets have largely adjusted to the challenges posed by Russia’s invasion of Ukraine, thanks in part to mild European winter weather which has alleviated concerns over potential shortages of natural gas. Resilient labor markets in much of the developed world have further contributed to a brighter-than-expected economic backdrop. However, many investors are mindful that the lagged effects of ongoing policy tightening have yet to work their way through the global economy.
Tighter global financial conditions have been a particular headwind for richly valued growth equities and interest rate-sensitive parts of the economy, such as housing. Over the near term, companies may face a challenging earnings backdrop as they are forced to absorb higher input and labor costs at a time of dwindling pricing power. For fixed income, the rise in interest rates has made bonds more attractive than they have been in years, which may provide balance to an overall portfolio.
During times of market transition, it is important to have a deep understanding of company fundamentals, and we have built our unique global research platform to do just that.
At MFS®, we put our clients’ assets to work responsibly by carefully navigating increasingly complex global capital markets. Our investment team is guided by a commitment to long-term fundamental investing. Our global investment platform — combining collective expertise, long-term discipline, and thoughtful risk management — seeks to uncover what we believe are the best, most durable investment ideas in markets around the world, enabling us to potentially create value for investors.
Respectfully,
Michael W. Roberge
Chair and Chief Executive Officer
MFS Investment Management
February 15, 2023
The opinions expressed in this letter are subject to change and may not be relied upon for investment advice. No forecasts can be guaranteed.
MFS Conservative Allocation Portfolio
Portfolio target allocation
Portfolio actual allocation
Portfolio holdings
| MFS Total Return Bond Series | 16.9% |
| MFS Limited Maturity Portfolio | 12.0% |
| MFS Inflation-Adjusted Bond Portfolio | 10.0% |
| MFS Government Securities Portfolio | 9.9% |
| MFS Global Governments Portfolio | 8.0% |
| MFS Value Series | 6.0% |
| MFS Research Series | 6.0% |
| MFS Growth Series | 5.9% |
| MFS High Yield Portfolio | 4.9% |
| MFS Research International Portfolio | 4.0% |
| MFS Mid Cap Value Portfolio | 4.0% |
| MFS Mid Cap Growth Series | 3.9% |
| MFS International Intrinsic Value Portfolio | 2.0% |
| MFS Global Real Estate Portfolio | 2.0% |
| MFS International Growth Portfolio | 2.0% |
| MFS New Discovery Value Portfolio | 1.0% |
| MFS New Discovery Series | 1.0% |
| Cash & Cash Equivalents | 0.5% |
Cash & Cash Equivalents includes any cash, investments in money market funds, short-term securities, and other assets less liabilities. MFS endeavors to fully invest all MFS funds-of-funds in underlying funds on a daily basis. Any divergence from 0.0% in Cash & Cash Equivalents is typically due to the timing of fund subscriptions/redemptions and the settlement of subsequent investment in/divestment from the underlying funds. While the MFS funds-of-funds' subscriptions/redemptions are processed at the same day NAV of the underlying funds, a positive/negative cash balance will be reflected on the MFS funds-of-funds' Statements of Assets and Liabilities until the trades with the underlying funds settle, which is typically two business days. Please see the fund's Statement of Assets and Liabilities for additional information related to the fund’s cash position and other assets and liabilities.
Percentages are based on net assets as of December 31, 2022.
The portfolio is actively managed and current holdings may be different.
MFS Conservative Allocation Portfolio
Management Review
Summary of Results
For the twelve months ended December 31, 2022, Initial Class shares of the MFS Conservative Allocation Portfolio (fund) provided a total return of -15.39%, while Service Class shares of the fund provided a total return of -15.53%. These compare with a return of -13.01% for the fund’s benchmark, the Bloomberg U.S. Aggregate Bond Index. The fund's other benchmark, the MFS Conservative Allocation Portfolio Blended Index (Blended Index), generated a return of -14.53%. The Blended Index reflects the blended returns of various equity and fixed income market indices, with percentage allocations to each index designed to resemble the allocations of the fund. The market indices and related percentage allocations used to compile the Blended Index are set forth in the Performance Summary.
Market Environment
During the reporting period, markets continued to grapple with the strongest global inflationary pressures in decades along with signs of slowing economic growth. Intermittent coronavirus flareups, particularly in China, where home-grown vaccines have proved less effective than elsewhere, kept supply chains stretched for a considerable period. At the same time, the reopening of the economy in the parts of the world where the virus has been better contained has led to a shift in consumption patterns in favor of services, straining already tight labor markets in most developed economies, while reducing demand for manufactured goods, primarily from Asia. As a result of Russia’s invasion of Ukraine, geopolitical considerations, such as sanctions and trade bans, have resulted in additional supply chain disruptions and volatile global energy prices. Taken together, these factors have contributed to market volatility.
The ripple effects from the Russian invasion further complicated the mission central banks must undertake to rein in surging inflation. Energy shocks have historically resulted in global growth slowdowns, if not pullbacks, so policymakers will find themselves in the difficult position of trying to restrain inflation without tipping economies into recession. Despite the challenging macroeconomic and geopolitical environment, policymakers remained focused on controlling inflation, although investors appeared to have expected varying degrees of action from the central banks. The Fed has been among the most aggressive developed market central banks, tightening policy at the fastest rate in decades, although it slowed its hiking pace at the end of the period, as did the European Central Bank. After remaining on the monetary sidelines for much of the period, the Bank of Japan widened its Yield Curve Control band, capping the yield on its 10-year bond at 0.5%, up from 0.25%, an action investors interpreted as a first step toward monetary policy normalization.
Against an environment of still-tight labor markets, tighter global financial conditions and volatile materials prices, investor anxiety appeared to have increased over the potential that corporate profit margins may be past peak for this cycle. That said, tentative signs that supply chain bottlenecks (particularly semiconductors) may be moderating, the easing of COVID restrictions in China, low levels of unemployment across developed markets and hopes that inflation levels may be near a peak were supportive factors for the macroeconomic backdrop.
Factors Affecting Performance
During the reporting period, the fund underperformed its benchmark, the Bloomberg U.S. Aggregate Bond Index. Over the same period, the fund also underperformed the Blended Index.
Relative to the Blended Index, the fund’s exposure to the international equity asset class was a primary detractor from relative performance. Within this segment, the MFS International Intrinsic Value Portfolio weighed on the fund's relative results as the portfolio tilted toward higher quality growth and lagged its respective benchmark.
The fund's exposure to the U.S. equity asset class also held back relative returns. Here, exposure to growth-oriented funds, particularly to both the MFS Growth Series and MFS Mid Cap Growth Series, which both underperformed their respective benchmarks, held back relative performance and more than offset the positive relative contribution stemming from the fund’s exposure to value-oriented funds, in particular the MFS Value Series and MFS Mid Cap Value Portfolio.
The fund's exposure to the fixed income asset class also weakened relative performance. Within this asset class, the fund’s exposure to both the MFS Inflation-Adjusted Bond Portfolio and MFS Global Governments Portfolio, both of which are global portfolios and were negatively impacted by a stronger U.S. dollar, outweighed the positive contribution from the fund’s exposure to the MFS Limited Maturity Portfolio, a shorter duration(d) portfolio which held in better in the face of rising interest rates. Additionally, the fund's relative performance was further weakened by exposure to the MFS Total Return Bond Series which lagged its respective benchmark.
MFS Conservative Allocation Portfolio
Management Review - continued
Respectfully,
Portfolio Manager(s)
Joseph Flaherty and Natalie Shapiro
| (d) | Duration is a measure of how much a bond’s price is likely to fluctuate with general changes in interest rates, e.g., if rates rise 1.00%, a bond with a 5-year duration is likely to lose about 5.00% of its value. |
The views expressed in this report are those of the portfolio manager(s) only through the end of the period of the report as stated on the cover and do not necessarily reflect the views of MFS or any other person in the MFS organization. These views are subject to change at any time based on market or other conditions, and MFS disclaims any responsibility to update such views. These views may not be relied upon as investment advice or an indication of trading intent on behalf of any MFS portfolio. References to specific securities are not recommendations of such securities, and may not be representative of any MFS portfolio’s current or future investments.
MFS Conservative Allocation Portfolio
Performance Summary Through 12/31/22
The following chart illustrates the historical performance of the fund in comparison to its benchmark(s). Benchmarks are unmanaged and may not be invested in directly. Benchmark returns do not reflect any fees or expenses. The performance of other share classes will be greater than or less than that of the class depicted below. (See Notes to Performance Summary.)
Performance data shown represents past performance and is no guarantee of future results. Investment return and principal value fluctuate so your shares, when sold, may be worth more or less than the original cost; current performance may be lower or higher than quoted. The performance shown does not reflect the deduction of taxes, if any, that a shareholder would pay on fund distributions or the redemption of fund shares. The returns for the fund shown also do not reflect the deduction of expenses associated with variable products, such as mortality and expense risk charges, separate account charges, and sales charges imposed by the insurance company separate accounts. Such expenses would reduce the overall returns shown.
Growth of a Hypothetical $10,000 Investment
Total Returns through 12/31/22
Average annual total returns
| Share Class | Class Inception Date | 1-yr | 5-yr | 10-yr |
| Initial Class | 10/01/08 | (15.39)% | 2.94% | 4.49% |
| Service Class | 10/01/08 | (15.53)% | 2.69% | 4.23% |
Comparative benchmark(s)
| Bloomberg U.S. Aggregate Bond Index (f) | (13.01)% | 0.02% | 1.06% |
| MFS Conservative Allocation Portfolio Blended Index (f)(w) | (14.53)% | 3.07% | 4.76% |
| FTSE EPRA Nareit Developed Reat Estate Index (net div) (f) | (25.09)% | (0.23)% | 2.99% |
| MSCI EAFE Index (net div) (f) | (14.45)% | 1.54% | 4.67% |
| Standard & Poor's 500 Stock Index (f) | (18.11)% | 9.42% | 12.56% |
| (f) | Source: FactSet Research Systems Inc. |
| (w) | The MFS Conservative Allocation Portfolio Blended Index (a custom index) was comprised of the following at the beginning and at the end of the reporting period: |
| | 12/31/22 |
| Bloomberg U.S. Aggregate Bond Index | 62% |
| Standard & Poor’s 500 Stock Index | 28% |
| MSCI EAFE Index (net div) | 8% |
| FTSE EPRA Nareit Developed Real Estate Index (net div) | 2% |
Benchmark Definition(s)
Bloomberg U.S. Aggregate Bond Index(a) – a market capitalization-weighted index that measures the performance of the U.S. investment-grade, fixed rate bond market, with index components for government and corporate securities, mortgage pass-through securities, and asset-backed securities with at least one year to final maturity.
MFS Conservative Allocation Portfolio
Performance Summary – continued
FTSE EPRA Nareit Developed Real Estate Index(c) (net div) – measures the performance of eligible real estate equities worldwide that generate a majority of their revenue and income through the ownership, disposure and development of income-producing real estate.
MSCI EAFE (Europe, Australasia, Far East) Index(e) (net div) – a market capitalization-weighted index that is designed to measure equity market performance in the developed markets, excluding the U.S. and Canada.
Standard & Poor's 500 Stock Index(g) – a market capitalization-weighted index of 500 widely held equity securities, designed to measure broad U.S. equity performance.
It is not possible to invest directly in an index.
| (a) | Source: Bloomberg Index Services Limited. BLOOMBERG® is a trademark and service mark of Bloomberg Finance L.P. and its affiliates (collectively “Bloomberg”). Bloomberg or Bloomberg's licensors own all proprietary rights in the Bloomberg Indices. Bloomberg neither approves or endorses this material, or guarantees the accuracy or completeness of any information herein, or makes any warranty, express or implied, as to the results to be obtained therefrom and, to the maximum extent allowed by law, neither shall have any liability or responsibility for injury or damages arising in connection therewith. |
| (c) | FTSE International Limited (“FTSE”)© FTSE 2019. “FTSE®” is a trademark of the London Stock Exchange Group companies and is used by FTSE International Limited under license. “FT-SE®”, “FOOTSIE®” and “FTSE4GOOD®” are trademarks of the London Stock Exchange Group companies. “Nareit®” is a trademark of the National Association of Real Estate Investment Trusts (“Nareit”) and “EPRA®” is a trademark of the European Public Real Estate Association (“EPRA”) and all are used by FTSE under license. The FTSE EPRA Nareit Developed Real Estate Index is calculated by FTSE. Neither FTSE, Euronext N.V., Nareit, nor EPRA sponsor, endorse, or promote this product and are not in any way connected to it and do not accept any liability. All intellectual property rights in the index values and constituent list vests in FTSE, Euronext N.V., Nareit, and EPRA. Neither FTSE nor its licensors accept any liability for any errors or omissions in the FTSE indices and/or FTSE ratings or underlying data. No further distribution of FTSE Data is permitted without FTSE's express written consent. |
| (e) | Morgan Stanley Capital International (“MSCI”) makes no express or implied warranties or representations and shall have no liability whatsoever with respect to any MSCI data contained herein. The MSCI data may not be further redistributed or used as a basis for other indices or any securities or financial products. This report is not approved, reviewed, or produced by MSCI. |
| (g) | “Standard & Poor's®” and “S&P®” are registered trademarks of Standard & Poor's Financial Services LLC (“S&P”) and Dow Jones is a registered trademark of Dow Jones Trademark Holdings LLC (“Dow Jones”) and have been licensed for use by S&P Dow Jones Indices LLC and sublicensed for certain purposes by MFS. The S&P 500® is a product of S&P Dow Jones Indices LLC, and has been licensed for use by MFS. MFS's product(s) is not sponsored, endorsed, sold, or promoted by S&P Dow Jones Indices LLC, Dow Jones, S&P, or their respective affiliates, and neither S&P Dow Jones Indices LLC, Dow Jones, S&P, nor their respective affiliates make any representation regarding the advisability of investing in such product(s). |
Notes to Performance Summary
Average annual total return represents the average annual change in value for each share class for the periods presented.
Performance results reflect any applicable expense subsidies and waivers in effect during the periods shown. Without such subsidies and waivers the fund's performance results would be less favorable. Please see the prospectus and financial statements for complete details. All results are historical and assume the reinvestment of any dividends and capital gains distributions.
Performance results do not include adjustments made for financial reporting purposes in accordance with U.S. generally accepted accounting principles and may differ from amounts reported in the financial highlights.
From time to time the fund may receive proceeds from litigation settlements, without which performance would be lower.
MFS Conservative Allocation Portfolio
Expense Table
Fund expenses borne by the shareholders during the period,
July 1, 2022 through December 31, 2022
As a shareholder of the fund, you incur ongoing costs, including distribution and/or service (12b-1) fees; and other fund expenses. This example is intended to help you understand your ongoing costs (in dollars) of investing in the fund and to compare these costs with the ongoing costs of investing in other mutual funds.
In addition to the fees and expenses which the fund bears directly, the fund indirectly bears a pro rata share of the fees and expenses of the underlying funds in which the fund invests. Because the underlying funds have varied expenses and fee levels and the fund may own different proportions of the underlying funds at different times, the amount of fees and expenses incurred indirectly by the fund will vary. If these indirect costs were included, your costs would have been higher.
The example is based on an investment of $1,000 invested at the beginning of the period and held for the entire period July 1, 2022 through December 31, 2022.
Actual Expenses
The first line for each share class in the following table provides information about actual account values and actual expenses. You may use the information in this line, together with the amount you invested, to estimate the expenses that you paid over the period. Simply divide your account value by $1,000 (for example, an $8,600 account value divided by $1,000 = 8.6), then multiply the result by the number in the first line under the heading entitled “Expenses Paid During Period” to estimate the expenses you paid on your account during this period.
Hypothetical Example for Comparison Purposes
The second line for each share class in the following table provides information about hypothetical account values and hypothetical expenses based on the fund’s actual expense ratio and an assumed rate of return of 5% per year before expenses, which is not the fund’s actual return. The hypothetical account values and expenses may not be used to estimate the actual ending account balance or expenses you paid for the period. You may use this information to compare the ongoing costs of investing in the fund and other funds. To do so, compare this 5% hypothetical example with the 5% hypothetical examples that appear in the shareholder reports of the other funds.
Please note that the expenses shown in the table are meant to highlight the fund's ongoing costs only and do not take into account the fees and expenses imposed under the variable contracts through which your investment in the fund is made. Therefore, the second line for each share class in the table is useful in comparing ongoing costs associated with an investment in vehicles (such as the fund) which fund benefits under variable annuity and variable life insurance contracts and to qualified pension and retirement plans only, and will not help you determine the relative total costs of investing in the fund through variable annuity and variable life insurance contracts. If the fees and expenses imposed under the variable contracts were included, your costs would have been higher.
Share
Class | | Annualized
Expense
Ratio | Beginning
Account Value
7/01/22 | Ending
Account Value
12/31/22 | Expenses
Paid During
Period (p)
7/01/22-12/31/22 |
| Initial Class | Actual | 0.04% | $1,000.00 | $996.15 | $0.20 |
| Hypothetical (h) | 0.04% | $1,000.00 | $1,025.00 | $0.20 |
| Service Class | Actual | 0.29% | $1,000.00 | $995.81 | $1.46 |
| Hypothetical (h) | 0.29% | $1,000.00 | $1,023.74 | $1.48 |
| (h) | 5% class return per year before expenses. |
| (p) | “Expenses Paid During Period” are equal to each class’s annualized expense ratio, as shown above, multiplied by the average account value over the period, multiplied by 184/365 (to reflect the one-half year period). In addition to the fees and expenses which the fund bears directly, the fund indirectly bears a pro rata share of the fees and expenses of the underlying funds in which the fund invests. If these indirect costs were included, your costs would have been higher. |
MFS Conservative Allocation Portfolio
Portfolio of Investments − 12/31/22
The Portfolio of Investments is a complete list of all securities owned by your fund. It is categorized by broad-based asset classes.
| Issuer | | | Shares/Par | Value ($) |
| Investment Companies (h) – 100.0% |
| Bond Funds – 61.7% |
| MFS Global Governments Portfolio - Initial Class | | | 2,786,377 | $ 23,990,710 |
| MFS Government Securities Portfolio - Initial Class | | | 2,815,602 | 29,845,384 |
| MFS High Yield Portfolio - Initial Class | | | 3,163,870 | 14,933,466 |
| MFS Inflation-Adjusted Bond Portfolio - Initial Class | | | 3,589,220 | 29,969,985 |
| MFS Limited Maturity Portfolio - Initial Class | | | 3,770,426 | 36,007,568 |
| MFS Total Return Bond Series - Initial Class | | | 4,509,402 | 50,775,863 |
| | | | | $185,522,976 |
| International Stock Funds – 8.0% |
| MFS International Growth Portfolio - Initial Class | | | 448,193 | $ 5,983,376 |
| MFS International Intrinsic Value Portfolio - Initial Class | | | 220,162 | 5,997,208 |
| MFS Research International Portfolio - Initial Class | | | 795,307 | 12,009,143 |
| | | | | $23,989,727 |
| Specialty Funds – 2.0% |
| MFS Global Real Estate Portfolio - Initial Class | | | 468,978 | $ 5,993,537 |
| U.S. Stock Funds – 27.8% |
| MFS Growth Series - Initial Class | | | 367,638 | $ 17,653,987 |
| MFS Mid Cap Growth Series - Initial Class | | | 1,657,000 | 11,864,120 |
| MFS Mid Cap Value Portfolio - Initial Class | | | 1,304,898 | 11,992,014 |
| MFS New Discovery Series - Initial Class | | | 263,900 | 2,984,712 |
| MFS New Discovery Value Portfolio - Initial Class | | | 379,138 | 3,006,559 |
| MFS Research Series - Initial Class | | | 645,152 | 17,896,518 |
| MFS Value Series - Initial Class | | | 835,538 | 18,005,838 |
| | | | | $83,403,748 |
| Money Market Funds – 0.5% | |
| MFS Institutional Money Market Portfolio, 4.02% (v) | | | 1,655,659 | $ 1,656,155 |
| Total Investment Companies (Identified Cost, $307,986,048) | $300,566,143 |
| Other Assets, Less Liabilities – (0.0)% | | (50,127) |
| Net Assets – 100.0% | $300,516,016 |
| (h) | An affiliated issuer, which may be considered one in which the fund owns 5% or more of the outstanding voting securities, or a company which is under common control. At period end, the aggregate value of the fund’s investments in affiliated issuers was $300,566,143. | | | |
| (v) | Affiliated issuer that is available only to investment companies managed by MFS. The rate quoted for the MFS Institutional Money Market Portfolio is the annualized seven-day yield of the fund at period end. | | | |
See Notes to Financial Statements
MFS Conservative Allocation Portfolio
| Financial Statements | Statement of Assets and Liabilities |
This statement represents your fund’s balance sheet, which details the assets and liabilities comprising the total value of the fund.
| At 12/31/22Assets | |
| Investments in affiliated issuers, at value (identified cost, $307,986,048) | $300,566,143 |
| Receivables for | |
| Investments sold | 275,493 |
| Fund shares sold | 230 |
| Other assets | 1,892 |
| Total assets | $300,843,758 |
| Liabilities | |
| Payables for | |
| Fund shares reacquired | $266,901 |
| Payable to affiliates | |
| Administrative services fee | 142 |
| Shareholder servicing costs | 27 |
| Distribution and/or service fees | 6,142 |
| Accrued expenses and other liabilities | 54,530 |
| Total liabilities | $327,742 |
| Net assets | $300,516,016 |
| Net assets consist of | |
| Paid-in capital | $293,223,043 |
| Total distributable earnings (loss) | 7,292,973 |
| Net assets | $300,516,016 |
| Shares of beneficial interest outstanding | 32,772,120 |
| | Net assets | Shares
outstanding | Net asset value
per share |
| Initial Class | $1,756,417 | 192,534 | $9.12 |
| Service Class | 298,759,599 | 32,579,586 | 9.17 |
See Notes to Financial Statements
MFS Conservative Allocation Portfolio
| Financial Statements | Statement of Operations |
This statement describes how much your fund earned in investment income and accrued in expenses. It also describes any gains and/or losses generated by fund operations.
| Year ended 12/31/22 | |
| Net investment income (loss) | |
| Income | |
| Dividends from affiliated issuers | $8,593,795 |
| Other | 52 |
| Total investment income | $8,593,847 |
| Expenses | |
| Distribution and/or service fees | $832,324 |
| Shareholder servicing costs | 6,527 |
| Administrative services fee | 17,500 |
| Independent Trustees' compensation | 6,894 |
| Custodian fee | 5,453 |
| Shareholder communications | 4,438 |
| Audit and tax fees | 43,372 |
| Legal fees | 1,468 |
| Miscellaneous | 28,303 |
| Total expenses | $946,279 |
| Net investment income (loss) | $7,647,568 |
| Realized and unrealized gain (loss) | |
| Realized gain (loss) (identified cost basis) | |
| Investments in affiliated issuers | $(2,579,329) |
| Capital gain distributions from affiliated issuers | 13,102,924 |
| Net realized gain (loss) | $10,523,595 |
| Change in unrealized appreciation or depreciation | |
| Affiliated issuers | $(78,765,821) |
| Net realized and unrealized gain (loss) | $(68,242,226) |
| Change in net assets from operations | $(60,594,658) |
See Notes to Financial Statements
MFS Conservative Allocation Portfolio
| Financial Statements | Statements of Changes in Net Assets |
These statements describe the increases and/or decreases in net assets resulting from operations, any distributions, and any shareholder transactions.
| | Year ended |
| | 12/31/22 | 12/31/21 |
| Change in net assets | | |
| From operations | | |
| Net investment income (loss) | $7,647,568 | $6,700,560 |
| Net realized gain (loss) | 10,523,595 | 25,776,581 |
| Net unrealized gain (loss) | (78,765,821) | (5,112,515) |
| Change in net assets from operations | $(60,594,658) | $27,364,626 |
| Total distributions to shareholders | $(32,481,327) | $(23,872,548) |
| Change in net assets from fund share transactions | $(8,422,855) | $(32,767,356) |
| Total change in net assets | $(101,498,840) | $(29,275,278) |
| Net assets | | |
| At beginning of period | 402,014,856 | 431,290,134 |
| At end of period | $300,516,016 | $402,014,856 |
See Notes to Financial Statements
MFS Conservative Allocation Portfolio
| Financial Statements | Financial Highlights |
The financial highlights table is intended to help you understand the fund's financial performance for the past 5 years. Certain information reflects financial results for a single fund share. The total returns in the table represent the rate that an investor would have earned (or lost) on an investment in the fund share class (assuming reinvestment of all distributions) held for the entire period.
| Initial Class | Year ended |
| | 12/31/22 | 12/31/21 | 12/31/20 | 12/31/19 | 12/31/18 |
| Net asset value, beginning of period | $12.02 | $11.95 | $11.44 | $10.58 | $11.61 |
| Income (loss) from investment operations | | | | | |
| Net investment income (loss) (d)(l) | $0.21 | $0.23 | $0.27 | $0.28 | $0.27 |
| Net realized and unrealized gain (loss) | (2.03) | 0.60 | 1.09 | 1.47 | (0.55) |
| Total from investment operations | $(1.82) | $0.83 | $1.36 | $1.75 | $(0.28) |
| Less distributions declared to shareholders | | | | | |
| From net investment income | $(0.25) | $(0.29) | $(0.31) | $(0.31) | $(0.26) |
| From net realized gain | (0.83) | (0.47) | (0.54) | (0.58) | (0.49) |
| Total distributions declared to shareholders | $(1.08) | $(0.76) | $(0.85) | $(0.89) | $(0.75) |
| Net asset value, end of period (x) | $9.12 | $12.02 | $11.95 | $11.44 | $10.58 |
| Total return (%) (k)(s)(x) | (15.39) | 7.00 | 12.31 | 16.87 | (2.73) |
Ratios (%) (to average net assets)
and Supplemental data: | | | | | |
| Expenses before expense reductions (h) | 0.03 | 0.03 | 0.03 | 0.03 | 0.03 |
| Expenses after expense reductions (h) | N/A | N/A | N/A | N/A | N/A |
| Net investment income (loss) (l) | 2.05 | 1.90 | 2.40 | 2.47 | 2.34 |
| Portfolio turnover | 3 | 1 | 7 | 2 | 1 |
| Net assets at end of period (000 omitted) | $1,756 | $3,278 | $3,061 | $2,029 | $2,062 |
| Service Class | Year ended |
| | 12/31/22 | 12/31/21 | 12/31/20 | 12/31/19 | 12/31/18 |
| Net asset value, beginning of period | $12.06 | $11.99 | $11.47 | $10.61 | $11.63 |
| Income (loss) from investment operations | | | | | |
| Net investment income (loss) (d)(l) | $0.23 | $0.19 | $0.23 | $0.25 | $0.23 |
| Net realized and unrealized gain (loss) | (2.07) | 0.60 | 1.11 | 1.47 | (0.53) |
| Total from investment operations | $(1.84) | $0.79 | $1.34 | $1.72 | $(0.30) |
| Less distributions declared to shareholders | | | | | |
| From net investment income | $(0.22) | $(0.25) | $(0.28) | $(0.28) | $(0.23) |
| From net realized gain | (0.83) | (0.47) | (0.54) | (0.58) | (0.49) |
| Total distributions declared to shareholders | $(1.05) | $(0.72) | $(0.82) | $(0.86) | $(0.72) |
| Net asset value, end of period (x) | $9.17 | $12.06 | $11.99 | $11.47 | $10.61 |
| Total return (%) (k)(s)(x) | (15.53) | 6.70 | 12.06 | 16.48 | (2.92) |
Ratios (%) (to average net assets)
and Supplemental data: | | | | | |
| Expenses before expense reductions (h) | 0.28 | 0.28 | 0.28 | 0.28 | 0.28 |
| Expenses after expense reductions (h) | N/A | N/A | N/A | N/A | N/A |
| Net investment income (loss) (l) | 2.29 | 1.60 | 1.98 | 2.18 | 2.05 |
| Portfolio turnover | 3 | 1 | 7 | 2 | 1 |
| Net assets at end of period (000 omitted) | $298,760 | $398,737 | $428,229 | $433,203 | $442,988 |
See Notes to Financial Statements
MFS Conservative Allocation Portfolio
Financial Highlights - continued
| (d) | Per share data is based on average shares outstanding. |
| (h) | In addition to the fees and expenses which the fund bears directly, the fund indirectly bears a pro rata share of the fees and expenses of the underlying affiliated funds in which the fund invests. Accordingly, the expense ratio for the fund reflects only those fees and expenses borne directly by the fund. Because the underlying affiliated funds have varied expense and fee levels and the fund may own different proportions of the underlying affiliated funds at different times, the amount of fees and expenses incurred indirectly by the fund will vary. |
| (k) | The total return does not reflect expenses that apply to separate accounts. Inclusion of these charges would reduce the total return figures for all periods shown. |
| (l) | The ratios and per share amounts do not include net investment income of the underlying affiliated funds in which the fund invests. |
| (s) | From time to time the fund may receive proceeds from litigation settlements, without which performance would be lower. |
| (x) | The net asset values and total returns have been calculated on net assets which include adjustments made in accordance with U.S. generally accepted accounting principles required at period end for financial reporting purposes. |
See Notes to Financial Statements
MFS Conservative Allocation Portfolio
Notes to Financial Statements
(1) Business and Organization
MFS Conservative Allocation Portfolio (the fund) is a diversified series of MFS Variable Insurance Trust III (the trust). The trust is organized as a Delaware statutory trust and is registered under the Investment Company Act of 1940, as amended, as an open-end management investment company. The shareholders of each series of the trust are separate accounts of insurance companies, which offer variable annuity and/or life insurance products, and qualified retirement and pension plans.
The fund is an investment company and accordingly follows the investment company accounting and reporting guidance of the Financial Accounting Standards Board (FASB) Accounting Standards Codification Topic 946 Financial Services - Investment Companies.
(2) Significant Accounting Policies
General — The preparation of financial statements in conformity with U.S. generally accepted accounting principles requires management to make estimates and assumptions that affect the reported amounts of assets and liabilities, and disclosure of contingent assets and liabilities at the date of the financial statements and the reported amounts of increases and decreases in net assets from operations during the reporting period. Actual results could differ from those estimates. In the preparation of these financial statements, management has evaluated subsequent events occurring after the date of the fund’s Statement of Assets and Liabilities through the date that the financial statements were issued.
The fund is a “fund of funds”, which invests the majority of its assets in other MFS mutual funds (hereafter referred to as “underlying affiliated funds” or “underlying funds”), which may have different fiscal year ends than the funds. The underlying funds, in turn, may engage in a number of investment techniques and practices, which involve certain risks. Certain underlying funds invest their portfolio in high-yield securities rated below investment grade. Investments in below investment grade quality securities can involve a substantially greater risk of default or can already be in default, and their values can decline significantly. Below investment grade quality securities tend to be more sensitive to adverse news about the issuer, or the market or economy in general, than higher quality debt instruments. Certain underlying funds invest a significant portion of their assets in asset-backed and/or mortgage-backed securities. For these securities, the value of the debt instrument also depends on the credit quality and adequacy of the underlying assets or collateral as well as whether there is a security interest in the underlying assets or collateral. Enforcing rights, if any, against the underlying assets or collateral may be difficult. U.S. Government securities not supported as to the payment of principal or interest by the U.S. Treasury, such as those issued by Fannie Mae, Freddie Mac, and the Federal Home Loan Banks, are subject to greater credit risk than are U.S. Government securities supported by the U.S. Treasury, such as those issued by Ginnie Mae. Certain underlying funds invest in foreign securities, including securities of emerging market issuers. Investments in foreign securities are vulnerable to the effects of changes in the relative values of the local currency and the U.S. dollar and to the effects of changes in each country’s market, economic, industrial, political, regulatory, geopolitical, environmental, public health, and other conditions. Investments in emerging markets can involve additional and greater risks than the risks associated with investments in developed foreign markets. Emerging markets can have less developed markets, greater custody and operational risk, less developed legal, regulatory, and accounting, and auditing systems, greater government involvement in the economy, greater risk of new or inconsistent government treatment of or restrictions on issuers and instruments, and greater political, social, and economic instability than developed markets.
The accounting policies of the underlying funds in which the fund invests are outlined in the underlying funds’ shareholder reports, which are available without charge by calling 1-800-225-2606, at mfs.com and on the Securities and Exchange Commission (SEC) web site at http://www.sec.gov. The underlying funds' shareholder reports are not covered by this report.
Investment Valuations — Open-end investment companies (underlying funds) are generally valued at their net asset value per share. The investments of underlying funds managed by the adviser are valued as described below. For purposes of this policy disclosure, “fund” also refers to the underlying funds in which the fund-of-funds invests.
Subject to its oversight, the fund's Board of Trustees has delegated primary responsibility for determining or causing to be determined the value of the fund’s investments to MFS as the fund's adviser, pursuant to the fund’s valuation policy and procedures which have been adopted by the adviser and approved by the Board. Effective September 8, 2022, and in accordance with Rule 2a-5 under the Investment Company Act of 1940, the Board of Trustees designated the adviser as the “valuation designee” of the fund. If the adviser, as valuation designee, determines that reliable market quotations are not readily available for an investment, the investment is valued at fair value as determined in good faith by the adviser in accordance with the adviser’s fair valuation policy and procedures.
Under the fund's valuation policy and procedures, equity securities, including restricted equity securities and equity securities sold short, are generally valued at the last sale or official closing price on their primary market or exchange as provided by a third-party pricing service. Equity securities, for which there were no sales reported that day, are generally valued at the last quoted daily bid
MFS Conservative Allocation Portfolio
Notes to Financial Statements - continued
quotation on their primary market or exchange as provided by a third-party pricing service. Equity securities sold short, for which there were no sales reported that day, are generally valued at the last quoted daily ask quotation on their primary market or exchange as provided by a third-party pricing service. Debt instruments and floating rate loans, including restricted debt instruments, are generally valued at an evaluated or composite bid as provided by a third-party pricing service. Debt instruments sold short are generally valued at an evaluated or composite mean as provided by a third-party pricing service. Short-term instruments with a maturity at issuance of 60 days or less may be valued at amortized cost, which approximates market value. Exchange-traded options are generally valued at the last sale or official closing price on their primary exchange as provided by a third-party pricing service. Exchange-traded options for which there were no sales reported that day are generally valued at the last daily bid quotation on their primary exchange as provided by a third-party pricing service. For put options, the position may be valued at the last daily ask quotation if there are no trades reported during the day. Options not traded on an exchange are generally valued at a broker/dealer bid quotation. Foreign currency options are generally valued at valuations provided by a third-party pricing service. Futures contracts are generally valued at last posted settlement price on their primary exchange as provided by a third-party pricing service. Futures contracts for which there were no trades that day for a particular position are generally valued at the closing bid quotation on their primary exchange as provided by a third-party pricing service. Forward foreign currency exchange contracts are generally valued at the mean of bid and asked prices for the time period interpolated from rates provided by a third-party pricing service for proximate time periods. Swap agreements are generally valued using valuations provided by a third-party pricing service, which for cleared swaps includes an evaluation of any trading activity at the clearinghouses. Open-end investment companies are generally valued at net asset value per share. The values of foreign securities and other assets and liabilities expressed in foreign currencies are converted to U.S. dollars using the mean of bid and asked prices for rates provided by a third-party pricing service.
Under the fund’s valuation policy and procedures, market quotations are not considered to be readily available for debt instruments, floating rate loans, and many types of derivatives. These investments are generally valued at fair value based on information from third-party pricing services or otherwise determined by the adviser in accordance with the adviser’s fair valuation policy and procedures. Securities and other assets generally valued on the basis of information from a third-party pricing service may also be valued at a broker/dealer bid quotation. In determining values, third-party pricing services can utilize both transaction data and market information such as yield, quality, coupon rate, maturity, type of issue, trading characteristics, spreads and other market data. An investment may also be valued at fair value if the adviser determines that the investment’s value has been materially affected by events occurring after the close of the exchange or market on which the investment is principally traded (such as foreign exchange or market) and prior to the determination of the fund’s net asset value, or after the halt of trading of a specific security where trading does not resume prior to the close of the exchange or market on which the security is principally traded. Events that occur after foreign markets close (such as developments in foreign markets and significant movements in the U.S. markets) and prior to the determination of the fund’s net asset value may be deemed to have a material effect on the value of securities traded in foreign markets. Accordingly, the fund’s foreign equity securities may often be valued at fair value. The adviser generally relies on third-party pricing services or other information (such as the correlation with price movements of similar securities in the same or other markets; the type, cost and investment characteristics of the security; the business and financial condition of the issuer; and trading and other market data) to assist in determining whether to fair value and at what value to fair value an investment. The value of an investment for purposes of calculating the fund’s net asset value can differ depending on the source and method used to determine value. When fair valuation is used, the value of an investment used to determine the fund’s net asset value may differ from quoted or published prices for the same investment. There can be no assurance that the fund could obtain the fair value assigned to an investment if it were to sell the investment at the same time at which the fund determines its net asset value per share.
Various inputs are used in determining the value of the fund's assets or liabilities. These inputs are categorized into three broad levels. In certain cases, the inputs used to measure fair value may fall into different levels of the fair value hierarchy. In such cases, an investment's level within the fair value hierarchy is based on the lowest level of input that is significant to the fair value measurement. The fund's assessment of the significance of a particular input to the fair value measurement in its entirety requires judgment, and considers factors specific to the investment. Level 1 includes unadjusted quoted prices in active markets for identical assets or liabilities. Level 2 includes other significant observable market-based inputs (including quoted prices for similar securities, interest rates, prepayment speed, and credit risk). Level 3 includes significant unobservable inputs, which may include the adviser's own assumptions in determining the fair value of investments. The following is a summary of the levels used as of December 31, 2022 in valuing the fund's assets and liabilities:
| Financial Instruments | Level 1 | Level 2 | Level 3 | Total |
| Mutual Funds | $300,566,143 | $— | $— | $300,566,143 |
For further information regarding security characteristics, see the Portfolio of Investments. Please refer to the underlying funds’ shareholder reports for further information regarding the levels used in valuing the underlying funds’ assets and liabilities.
MFS Conservative Allocation Portfolio
Notes to Financial Statements - continued
Derivatives — The fund does not invest in derivatives directly. The fund does invest in underlying funds that may use derivatives primarily to increase or decrease exposure to a particular market or segment of the market, or security, to increase or decrease interest rate or currency exposure, or as alternatives to direct investments. Derivatives are used for hedging or non-hedging purposes. While hedging can reduce or eliminate losses, it can also reduce or eliminate gains. When the underlying funds use derivatives as an investment to increase market exposure, or for hedging purposes, gains and losses from derivative instruments may be substantially greater than the derivative’s original cost.
Indemnifications — Under the fund's organizational documents, its officers and Trustees may be indemnified against certain liabilities and expenses arising out of the performance of their duties to the fund. Additionally, in the normal course of business, the fund enters into agreements with service providers that may contain indemnification clauses. The fund's maximum exposure under these agreements is unknown as this would involve future claims that may be made against the fund that have not yet occurred.
Investment Transactions and Income — Investment transactions are recorded on the trade date. Interest income is recorded on the accrual basis. All premium and discount is amortized or accreted for financial statement purposes in accordance with U.S. generally accepted accounting principles. Distributions of income and capital gains from the underlying funds are recorded on the ex-dividend date. Recognition of net investment income by the fund is affected by the timing of the declaration of distributions by the underlying funds in which the fund invests. In determining the net gain or loss on securities sold, the cost of securities is determined on the identified cost basis.
The fund and/or the underlying funds may receive proceeds from litigation settlements. Any proceeds received from litigation involving portfolio holdings are reflected in the Statement of Operations in realized gain/loss if the security has been disposed of by the fund or in unrealized gain/loss if the security is still held by the fund. Any other proceeds from litigation not related to portfolio holdings are reflected as other income in the Statement of Operations.
Tax Matters and Distributions — The fund intends to qualify as a regulated investment company, as defined under Subchapter M of the Internal Revenue Code, and to distribute all of its taxable income, including realized capital gains. As a result, no provision for federal income tax is required. The fund’s federal tax returns, when filed, will remain subject to examination by the Internal Revenue Service for a three year period. Management has analyzed the fund’s tax positions taken on federal and state tax returns for all open tax years and does not believe that there are any uncertain tax positions that require recognition of a tax liability.
Distributions to shareholders are recorded on the ex-dividend date. Income and capital gain distributions are determined in accordance with income tax regulations, which may differ from U.S. generally accepted accounting principles. Certain capital accounts in the financial statements are periodically adjusted for permanent differences in order to reflect their tax character. These adjustments have no impact on net assets or net asset value per share. Temporary differences which arise from recognizing certain items of income, expense, gain or loss in different periods for financial statement and tax purposes will reverse at some time in the future.
Book/tax differences primarily relate to wash sale loss deferrals.
The tax character of distributions declared to shareholders for the last two fiscal years is as follows:
| | Year ended
12/31/22 | Year ended
12/31/21 |
| Ordinary income (including any short-term capital gains) | $7,278,182 | $10,079,337 |
| Long-term capital gains | 25,203,145 | 13,793,211 |
| Total distributions | $32,481,327 | $23,872,548 |
The federal tax cost and the tax basis components of distributable earnings were as follows:
| As of 12/31/22 | |
| Cost of investments | $313,270,269 |
| Gross appreciation | 27,016,660 |
| Gross depreciation | (39,720,786) |
| Net unrealized appreciation (depreciation) | $(12,704,126) |
| Undistributed ordinary income | 7,640,311 |
| Undistributed long-term capital gain | 12,356,788 |
| Total distributable earnings (loss) | $7,292,973 |
MFS Conservative Allocation Portfolio
Notes to Financial Statements - continued
Multiple Classes of Shares of Beneficial Interest — The fund offers multiple classes of shares, which differ in their respective distribution and/or service fees. The fund's income, realized and unrealized gain (loss), and common expenses are allocated to shareholders based on the daily net assets of each class. Dividends are declared separately for each class. Differences in per share dividend rates are generally due to differences in separate class expenses. The fund’s distributions declared to shareholders as reported in the Statements of Changes in Net Assets are presented by class as follows:
| | Year
ended
12/31/22 | | Year
ended
12/31/21 |
| Initial Class | $188,910 | | $189,389 |
| Service Class | 32,292,417 | | 23,683,159 |
| Total | $32,481,327 | | $23,872,548 |
(3) Transactions with Affiliates
Investment Adviser — The fund has an investment advisory agreement with MFS to provide overall investment management and related administrative services and facilities to the fund. MFS receives no compensation under this agreement; however MFS receives management fees from the underlying MFS funds.
The investment adviser has agreed in writing to pay a portion of the fund’s operating expenses, excluding distribution and/or service fees, interest, taxes, extraordinary expenses, brokerage and transaction costs, and investment-related expenses such as fees and expenses associated with investments in investment companies and other similar investment vehicles such that fund operating expenses do not exceed 0.20% annually of the fund’s average daily net assets. This written agreement will continue until modified by the fund’s Board of Trustees, but such agreement will continue at least until April 30, 2024. For the year ended December 31, 2022, the fund’s actual operating expenses did not exceed the limit and therefore, the investment adviser did not pay any portion of the fund’s expenses related to this agreement.
In addition to the fees and expenses which the fund bears directly, the fund indirectly bears a pro rata share of the fees and expenses of the underlying funds in which the fund invests. Accordingly, the expense ratio for the fund reflects only those fees and expenses borne directly by the fund.
Distributor — MFS Fund Distributors, Inc. (MFD), a wholly-owned subsidiary of MFS, is the distributor of shares of the fund. The Trustees have adopted a distribution plan for the Service Class shares pursuant to Rule 12b-1 under the Investment Company Act of 1940.
The fund's distribution plan provides that the fund will pay MFD distribution and/or service fees equal to 0.25% per annum of its average daily net assets attributable to Service Class shares as partial consideration for services performed and expenses incurred by MFD and financial intermediaries (including participating insurance companies that invest in the fund to fund variable annuity and variable life insurance contracts, sponsors of qualified retirement and pension plans that invest in the fund, and affiliates of these participating insurance companies and plan sponsors) in connection with the sale and distribution of the Service Class shares. MFD may subsequently pay all, or a portion, of the distribution and/or service fees to financial intermediaries.
Shareholder Servicing Agent — MFS Service Center, Inc. (MFSC), a wholly-owned subsidiary of MFS, receives a fee from the fund for its services as shareholder servicing agent. For the year ended December 31, 2022, the fee was $6,384, which equated to 0.0019% annually of the fund's average daily net assets. MFSC also receives reimbursement from the fund for out-of-pocket expenses paid by MFSC on behalf of the fund. For the year ended December 31, 2022, these costs amounted to $143.
Administrator — MFS provides certain financial, legal, shareholder communications, compliance, and other administrative services to the fund. Under an administrative services agreement, the fund reimburses MFS the costs incurred to provide these services. The fund pays an annual fixed amount of $17,500. The administrative services fee incurred for the year ended December 31, 2022 was equivalent to an annual effective rate of 0.0052% of the fund's average daily net assets.
Trustees’ and Officers’ Compensation — The fund pays compensation to independent Trustees in the form of a retainer, attendance fees, and additional compensation to Board and Committee chairpersons. The fund does not pay compensation directly to Trustees or officers of the fund who are also officers of the investment adviser, all of whom receive remuneration from MFS for their services to the fund. Certain officers and Trustees of the fund are officers or directors of MFS, MFD, and MFSC.
Other — The fund invests in the MFS Institutional Money Market Portfolio which is managed by MFS and seeks current income consistent with preservation of capital and liquidity. This money market fund does not pay a management fee to MFS but does incur investment and operating costs.
MFS Conservative Allocation Portfolio
Notes to Financial Statements - continued
(4) Portfolio Securities
For the year ended December 31, 2022, purchases and sales of shares of underlying funds, excluding the MFS Institutional Money Market Portfolio, aggregated $10,938,395 and $52,774,999, respectively.
(5) Shares of Beneficial Interest
The fund's Declaration of Trust permits the Trustees to issue an unlimited number of full and fractional shares of beneficial interest. Transactions in fund shares were as follows:
| | Year ended
12/31/22 | | Year ended
12/31/21 |
| | Shares | Amount | | Shares | Amount |
| Shares sold | | | | | |
| Initial Class | 1,955 | $19,673 | | 32,316 | $389,338 |
| Service Class | 812,076 | 8,037,049 | | 589,590 | 7,135,130 |
| | 814,031 | $8,056,722 | | 621,906 | $7,524,468 |
Shares issued to shareholders
in reinvestment of distributions | | | | | |
| Initial Class | 20,075 | $188,910 | | 15,902 | $189,389 |
| Service Class | 3,409,970 | 32,292,417 | | 1,978,543 | 23,683,159 |
| | 3,430,045 | $32,481,327 | | 1,994,445 | $23,872,548 |
| Shares reacquired | | | | | |
| Initial Class | (102,259) | $(1,077,347) | | (31,668) | $(382,074) |
| Service Class | (4,693,800) | (47,883,557) | | (5,238,847) | (63,782,298) |
| | (4,796,059) | $(48,960,904) | | (5,270,515) | $(64,164,372) |
| Net change | | | | | |
| Initial Class | (80,229) | $(868,764) | | 16,550 | $196,653 |
| Service Class | (471,754) | (7,554,091) | | (2,670,714) | (32,964,009) |
| | (551,983) | $(8,422,855) | | (2,654,164) | $(32,767,356) |
(6) Line of Credit
The fund and certain other funds managed by MFS participate in a $1.45 billion unsecured committed line of credit of which $1.2 billion is reserved for use by the fund and certain other MFS U.S. funds. The line of credit is provided by a syndicate of banks under a credit agreement. Borrowings may be made for temporary financing needs. Interest is charged to each fund, based on its borrowings, generally at a rate equal to the highest of 1) Daily Simple SOFR (Secured Overnight Financing Rate) plus 0.10%, 2) the Federal Funds Effective Rate, or 3) the Overnight Bank Funding Rate, each plus an agreed upon spread. A commitment fee, based on the average daily unused portion of the committed line of credit, is allocated among the participating funds. The line of credit expires on March 16, 2023 unless extended or renewed. In addition, the fund and other funds managed by MFS have established unsecured uncommitted borrowing arrangements with certain banks for temporary financing needs. Interest is charged to each fund, based on its borrowings, at rates equal to customary reference rates plus an agreed upon spread. For the year ended December 31, 2022, the fund’s commitment fee and interest expense were $1,683 and $0, respectively, and are included in “Miscellaneous” expense in the Statement of Operations.
(7) Investments in Affiliated Issuers
An affiliated issuer may be considered one in which the fund owns 5% or more of the outstanding voting securities, or a company which is under common control. For the purposes of this report, the following were affiliated issuers:
| Affiliated Issuers | Beginning
Value | Purchases | Sales
Proceeds | Realized
Gain
(Loss) | Change in
Unrealized
Appreciation or
Depreciation | Ending
Value |
| MFS Global Governments Portfolio | $31,862,246 | $635,748 | $2,794,700 | $(561,479) | $(5,151,105) | $23,990,710 |
| MFS Global Real Estate Portfolio | 8,135,042 | 1,463,778 | 943,221 | 106,300 | (2,768,362) | 5,993,537 |
| MFS Government Securities Portfolio | 39,928,327 | 782,762 | 5,582,959 | (1,052,715) | (4,230,031) | 29,845,384 |
MFS Conservative Allocation Portfolio
Notes to Financial Statements - continued
| Affiliated Issuers − continued | Beginning
Value | Purchases | Sales
Proceeds | Realized
Gain
(Loss) | Change in
Unrealized
Appreciation or
Depreciation | Ending
Value |
| MFS Growth Series | $23,921,598 | $4,940,233 | $1,284,299 | $(418,048) | $(9,505,497) | $17,653,987 |
| MFS High Yield Portfolio | 20,026,199 | 934,763 | 3,060,956 | (645,408) | (2,321,132) | 14,933,466 |
| MFS Inflation-Adjusted Bond Portfolio | 39,991,232 | 5,430,260 | 3,743,618 | (248,177) | (11,459,712) | 29,969,985 |
| MFS Institutional Money Market Portfolio | 1,644,909 | 1,704,370 | 1,693,628 | 19 | 485 | 1,656,155 |
| MFS International Growth Portfolio | 8,054,407 | 544,448 | 1,008,450 | 84,746 | (1,691,775) | 5,983,376 |
| MFS International Intrinsic Value Portfolio | 8,024,105 | 980,234 | 779,580 | (21,474) | (2,206,077) | 5,997,208 |
| MFS Limited Maturity Portfolio | 47,985,772 | 1,318,506 | 10,452,840 | (464,186) | (2,379,684) | 36,007,568 |
| MFS Mid Cap Growth Series | 16,090,595 | 3,582,491 | 1,313,222 | (579,301) | (5,916,443) | 11,864,120 |
| MFS Mid Cap Value Portfolio | 16,165,941 | 1,623,387 | 3,298,755 | 509,659 | (3,008,218) | 11,992,014 |
| MFS New Discovery Series | 3,890,147 | 1,579,564 | 297,838 | (253,981) | (1,933,180) | 2,984,712 |
| MFS New Discovery Value Portfolio | 4,031,596 | 818,896 | 722,839 | 116,661 | (1,237,755) | 3,006,559 |
| MFS Research International Portfolio | 16,085,915 | 980,599 | 1,719,125 | 45,460 | (3,383,706) | 12,009,143 |
| MFS Research Series | 24,053,763 | 3,057,511 | 2,610,997 | 428,856 | (7,032,615) | 17,896,518 |
| MFS Total Return Bond Series | 67,998,054 | 2,300,888 | 8,240,752 | (909,869) | (10,372,458) | 50,775,863 |
| MFS Value Series | 24,175,763 | 1,635,871 | 4,920,848 | 1,283,608 | (4,168,556) | 18,005,838 |
| | $402,065,611 | $34,314,309 | $54,468,627 | $(2,579,329) | $(78,765,821) | $300,566,143 |
| Affiliated Issuers | Dividend
Income | Capital Gain
Distributions |
| MFS Global Governments Portfolio | $400,890 | $— |
| MFS Global Real Estate Portfolio | 179,165 | 394,470 |
| MFS Government Securities Portfolio | 673,250 | — |
| MFS Growth Series | 97,462 | 2,175,783 |
| MFS High Yield Portfolio | 921,401 | — |
| MFS Inflation-Adjusted Bond Portfolio | 1,675,272 | 1,775,818 |
| MFS Institutional Money Market Portfolio | 25,159 | — |
| MFS International Growth Portfolio | 74,617 | 348,892 |
| MFS International Intrinsic Value Portfolio | 76,623 | 265,658 |
| MFS Limited Maturity Portfolio | 784,686 | 153,279 |
| MFS Mid Cap Growth Series | — | 1,880,386 |
| MFS Mid Cap Value Portfolio | 318,843 | 904,246 |
| MFS New Discovery Series | 328,575 | 689,008 |
| MFS New Discovery Value Portfolio | 312,365 | 408,369 |
| MFS Research International Portfolio | 423,769 | 127,986 |
| MFS Research Series | 393,949 | 2,231,461 |
| MFS Total Return Bond Series | 1,538,967 | 648,571 |
| MFS Value Series | 368,802 | 1,098,997 |
| | $8,593,795 | $13,102,924 |
(8) LIBOR Transition
Certain of the fund's investments, including investments in certain debt instruments and derivatives (if any), as well as borrowings by the fund and certain other contractual arrangements of the fund, may be based on the London Interbank Offered Rate (“LIBOR”). In 2017, the regulatory authority that oversees financial services firms in the United Kingdom announced plans to transition away from LIBOR by the end of 2021. In March 2021, the administrator of LIBOR announced the extension of the publication of the more commonly used U.S. dollar LIBOR settings to the end of June 2023. Although the full impacts of the transition away from LIBOR are not fully known, the transition may result in, among other things, an increase in volatility or illiquidity of the markets for instruments
MFS Conservative Allocation Portfolio
Notes to Financial Statements - continued
that currently rely on LIBOR to determine interest rates and this could have an adverse impact on the fund's performance. With respect to the fund's accounting for investments, including investments in certain debt instruments and derivatives, as well as borrowings by the fund and any other contractual arrangements of the fund that undergo reference rate-related modifications as a result of the transition, management will rely upon the relief provided by FASB Codification Topic 848 – Reference Rate Reform (Topic 848). The guidance in Topic 848 permits the fund to account for those modified contracts as a continuation of the existing contracts. Management is still evaluating the impact to the fund of the June 30, 2023 planned discontinuation of the more commonly used U.S. dollar LIBOR settings.
(9) Russia and Ukraine Conflict
The market disruptions, which began in late February 2022, associated with geopolitical events related to the conflict between Russia and Ukraine may adversely affect the value of the fund’s assets and thus the fund’s performance. Management continues to monitor these events and to evaluate the related impacts, if any, to the fund.
MFS Conservative Allocation Portfolio
Report of Independent Registered Public Accounting Firm
To the Board of Trustees of MFS Variable Insurance Trust III and the Shareholders of MFS Conservative Allocation Portfolio:
Opinion on the Financial Statements and Financial Highlights
We have audited the accompanying statement of assets and liabilities of MFS Conservative Allocation Portfolio (the “Fund”), including the portfolio of investments, as of December 31, 2022, the related statement of operations for the year then ended, the statements of changes in net assets for each of the two years in the period then ended, the financial highlights for each of the five years in the period then ended, and the related notes. In our opinion, the financial statements and financial highlights present fairly, in all material respects, the financial position of the Fund as of December 31, 2022, and the results of its operations for the year then ended, the changes in its net assets for each of the two years in the period then ended, and the financial highlights for each of the five years in the period then ended, in conformity with accounting principles generally accepted in the United States of America.
Basis for Opinion
These financial statements and financial highlights are the responsibility of the Fund's management. Our responsibility is to express an opinion on the Fund's financial statements and financial highlights based on our audits. We are a public accounting firm registered with the Public Company Accounting Oversight Board (United States) (PCAOB) and are required to be independent with respect to the Fund in accordance with the U.S. federal securities laws and the applicable rules and regulations of the Securities and Exchange Commission and the PCAOB.
We conducted our audits in accordance with the standards of the PCAOB. Those standards require that we plan and perform the audit to obtain reasonable assurance about whether the financial statements and financial highlights are free of material misstatement, whether due to error or fraud. The Fund is not required to have, nor were we engaged to perform, an audit of its internal control over financial reporting. As part of our audits, we are required to obtain an understanding of internal control over financial reporting but not for the purpose of expressing an opinion on the effectiveness of the Fund's internal control over financial reporting. Accordingly, we express no such opinion.
Our audits included performing procedures to assess the risks of material misstatement of the financial statements and financial highlights, whether due to error or fraud, and performing procedures that respond to those risks. Such procedures included examining, on a test basis, evidence regarding the amounts and disclosures in the financial statements and financial highlights. Our audits also included evaluating the accounting principles used and significant estimates made by management, as well as evaluating the overall presentation of the financial statements and financial highlights. Our procedures included confirmation of securities owned as of December 31, 2022, by correspondence with the transfer agent. We believe that our audits provide a reasonable basis for our opinion.
DELOITTE & TOUCHE LLP
Boston, Massachusetts
February 15, 2023
We have served as the auditor of one or more of the MFS investment companies since 1924.
MFS Conservative Allocation Portfolio
Trustees and Officers — Identification and Background
The Trustees and Officers of the Trust, as of February 1, 2023, are listed below, together with their principal occupations during the past five years. (Their titles may have varied during that period.) The address of each Trustee and Officer is 111 Huntington Avenue, Boston, Massachusetts 02199-7618.
| Name, Age | | Position(s) Held with Fund | | Trustee/Officer Since(h) | | Number of MFS Funds overseen by the Trustee | | Principal Occupations During
the Past Five Years | | Other Directorships During
the Past Five Years (j) |
| INTERESTED TRUSTEE | | | | | | | | | | |
Michael W. Roberge (k)
(age 56) | | Trustee | | January 2021 | | 136 | | Massachusetts Financial Services Company, Chairman (since January 2021); Chief Executive Officer (since January 2017); Director; Chairman of the Board (since January 2022); President (until December 2018); Chief Investment Officer (until December 2018) | | N/A |
| INDEPENDENT TRUSTEES | | | | | | | | | | |
John P. Kavanaugh
(age 68) | | Trustee and Chair of Trustees | | January 2009 | | 136 | | Private investor | | N/A |
Steven E. Buller
(age 71) | | Trustee | | February 2014 | | 136 | | Private investor | | N/A |
John A. Caroselli
(age 68) | | Trustee | | March 2017 | | 136 | | Private investor; JC Global Advisors, LLC (management consulting), President (since 2015) | | N/A |
Maureen R. Goldfarb
(age 67) | | Trustee | | January 2009 | | 136 | | Private investor | | N/A |
Peter D. Jones
(age 67) | | Trustee | | January 2019 | | 136 | | Private investor | | N/A |
James W. Kilman, Jr.
(age 61) | | Trustee | | January 2019 | | 136 | | Burford Capital Limited (finance and investment management), Senior Advisor (since May 3, 2021), Chief Financial Officer (2019 - May 2, 2021); KielStrand Capital LLC (family office), Chief Executive Officer (since 2016) | | Alpha-En Corporation, Director (2016-2019) |
Clarence Otis, Jr.
(age 66) | | Trustee | | March 2017 | | 136 | | Private investor | | VF Corporation, Director; Verizon Communications, Inc., Director; The Travelers Companies, Director |
Maryanne L. Roepke
(age 66) | | Trustee | | May 2014 | | 136 | | Private investor | | N/A |
Laurie J. Thomsen
(age 65) | | Trustee | | March 2005 | | 136 | | Private investor | | The Travelers Companies, Director; Dycom Industries, Inc., Director |
MFS Conservative Allocation Portfolio
Trustees and Officers - continued
| Name, Age | | Position(s) Held with
Fund | | Trustee/Officer Since(h) | | Number of MFS Funds for which the Person is an Officer | | Principal Occupations During
the Past Five Years |
| OFFICERS | | | | | | | | |
Christopher R. Bohane (k)
(age 49) | | Assistant Secretary and Assistant Clerk | | July 2005 | | 136 | | Massachusetts Financial Services Company, Senior Vice President and Senior Managing Counsel |
Kino Clark (k)
(age 54) | | Assistant Treasurer | | January 2012 | | 136 | | Massachusetts Financial Services Company, Vice President |
John W. Clark, Jr. (k)
(age 55) | | Assistant Treasurer | | April 2017 | | 136 | | Massachusetts Financial Services Company, Vice President |
David L. DiLorenzo (k)
(age 54) | | President | | July 2005 | | 136 | | Massachusetts Financial Services Company, Senior Vice President |
Heidi W. Hardin (k)
(age 55) | | Secretary and Clerk | | April 2017 | | 136 | | Massachusetts Financial Services Company, Executive Vice President and General Counsel |
Brian E. Langenfeld (k)
(age 49) | | Assistant Secretary and Assistant Clerk | | June 2006 | | 136 | | Massachusetts Financial Services Company, Vice President and Managing Counsel |
Rosa E. Licea-Mailloux (k)
(age 46) | | Chief Compliance Officer | | March 2022 | | 136 | | Massachusetts Financial Services Company, Vice President (since 2018); Director of Corporate Compliance (2018-2021), Senior Director Compliance (2021-2022), Senior Managing Director of North American Compliance & Chief Compliance Officer (since March 2022); Natixis Investment Managers (investment management), Funds Chief Compliance Officer, Deputy General Counsel & Senior Vice President (until 2018) |
Amanda S. Mooradian (k)
(age 43) | | Assistant Secretary and Assistant Clerk | | September 2018 | | 136 | | Massachusetts Financial Services Company, Assistant Vice President and Senior Counsel |
Susan A. Pereira (k)
(age 52) | | Assistant Secretary and Assistant Clerk | | July 2005 | | 136 | | Massachusetts Financial Services Company, Vice President and Managing Counsel |
Kasey L. Phillips (k)
(age 52) | | Assistant Treasurer | | September 2012 | | 136 | | Massachusetts Financial Services Company, Vice President |
Matthew A. Stowe (k)
(age 48) | | Assistant Secretary and Assistant Clerk | | October 2014 | | 136 | | Massachusetts Financial Services Company, Vice President and Senior Managing Counsel |
William B. Wilson (k)
(age 40) | | Assistant Secretary and Assistant Clerk | | October 2022 | | 136 | | Massachusetts Financial Services Company, Assistant Vice President and Counsel |
James O. Yost (k)
(age 62) | | Treasurer | | September 1990 | | 136 | | Massachusetts Financial Services Company, Senior Vice President |
| (h) | Date first appointed to serve as Trustee/Officer of an MFS Fund. Each Trustee has served continuously since appointment unless indicated otherwise. From January 2012 through December 2016, Messrs. DiLorenzo and Yost served as Treasurer and Deputy Treasurer of the Funds, respectively. |
| (j) | Directorships or trusteeships of companies required to report to the Securities and Exchange Commission (i.e., “public companies”). |
| (k) | “Interested person” of the Trust within the meaning of the Investment Company Act of 1940 (referred to as the 1940 Act), which is the principal federal law governing investment companies like the fund, as a result of a position with MFS. The address of MFS is 111 Huntington Avenue, Boston, Massachusetts 02199-7618. |
Each Trustee (other than Messrs. Jones, Kilman and Roberge) has been elected by shareholders and each Trustee and Officer holds office until his or her successor is chosen and qualified or until his or her earlier death, resignation, retirement or removal. Mr. Roberge became a Trustee of the Funds on January 1, 2021 and Messrs. Jones and Kilman became Trustees of the Funds on January 1, 2019. The Trust does not hold annual meetings for the purpose of electing Trustees, and Trustees are not elected for fixed terms. Under the terms of the Board's retirement policy, an Independent Trustee shall retire at the end of the calendar year in which he or she reaches the earlier of 75 years of age or 15 years of service on the Board (or, in the case of any Independent Trustee who joined the Board prior to 2015, 20 years of service on the Board).
MFS Conservative Allocation Portfolio
Trustees and Officers - continued
Messrs. Buller, Kilman and Otis and Ms. Roepke are members of the Trust’s Audit Committee.
Each of the Interested Trustees and certain Officers hold comparable officer positions with certain affiliates of MFS.
The Statement of Additional Information for a Fund includes further information about the Trustees and is available without charge upon request by calling 1-800-225-2606.
| Investment Adviser | Custodian |
Massachusetts Financial Services Company
111 Huntington Avenue
Boston, MA 02199-7618 | State Street Bank and Trust Company
1 Lincoln Street
Boston, MA 02111-2900 |
| Distributor | Independent Registered Public Accounting Firm |
MFS Fund Distributors, Inc.
111 Huntington Avenue
Boston, MA 02199-7618 | Deloitte & Touche LLP
200 Berkeley Street
Boston, MA 02116 |
| Portfolio Manager(s) | |
Joseph Flaherty
Natalie Shapiro | |
MFS Conservative Allocation Portfolio
Board Review of Investment Advisory Agreement
MFS Conservative Allocation Portfolio
The Investment Company Act of 1940 requires that both the full Board of Trustees and a majority of the non-interested (“independent”) Trustees, voting separately, annually approve the continuation of the Fund’s investment advisory agreement with MFS. The Trustees consider matters bearing on the Fund and its advisory arrangements at their meetings throughout the year, including a review of performance data at each regular meeting. In addition, the independent Trustees met several times over the course of three months beginning in May and ending in July, 2022 (“contract review meetings”) for the specific purpose of considering whether to approve the continuation of the investment advisory agreement for the Fund and the other investment companies that the Board oversees (the “MFS Funds”). The independent Trustees were assisted in their evaluation of the Fund’s investment advisory agreement by independent legal counsel, from whom they received separate legal advice and with whom they met separately from MFS during various contract review meetings. The independent Trustees were also assisted in this process by an independent consultant who was retained by and reported to the independent Trustees.
In connection with their deliberations regarding the continuation of the investment advisory agreement, the Trustees, including the independent Trustees, considered such information and factors as they believed, in light of the legal advice furnished to them and their own business judgment, to be relevant. The investment advisory agreement for the Fund was considered separately, although the Trustees also took into account the common interests of all MFS Funds in their review. As described below, the Trustees considered the nature, quality, and extent of the various investment advisory, administrative, and shareholder services performed by MFS under the existing investment advisory agreement and other arrangements with the Fund.
In connection with their contract review meetings, the Trustees received and relied upon materials that included, among other items: (i) information provided by Broadridge Financial Solutions, Inc. (“Broadridge”), an independent third party, on the investment performance of the Fund for various time periods ended December 31, 2021 and the investment performance of a group of funds with substantially similar investment classifications/objectives (the “Broadridge performance universe”), (ii) information provided by Broadridge on the Fund’s fees and expenses and the fees and expenses of comparable funds identified by Broadridge as well as all other funds in the same investment classification/category (the “Broadridge expense group and universe”), (iii) information as to whether and to what extent applicable expense waivers and reimbursements are observed for the Fund, (iv) information regarding MFS’ financial results and financial condition, including MFS’ and certain of its affiliates’ estimated profitability from services performed for the Fund and the MFS Funds as a whole, and compared to MFS’ institutional business, (v) MFS’ views regarding the outlook for the mutual fund industry and the strategic business plans of MFS, (vi) descriptions of various functions performed by MFS for the Funds, such as compliance monitoring and portfolio trading practices, and (vii) information regarding the overall organization of MFS, including information about MFS’ senior management and other personnel providing investment advisory, administrative and other services to the Fund and the other MFS Funds. The comparative performance, fee and expense information prepared and provided by Broadridge was not independently verified and the independent Trustees did not independently verify any information provided to them by MFS.
The Trustees’ conclusion as to the continuation of the investment advisory agreement was based on a comprehensive consideration of all information provided to the Trustees and not the result of any single factor. Some of the factors that figured particularly in the Trustees’ deliberations are described below, although individual Trustees may have evaluated the information presented differently from one another, giving different weights to various factors. It is also important to recognize that the fee arrangements for the Fund and other MFS Funds are the result of years of review and discussion between the independent Trustees and MFS, that certain aspects of such arrangements may receive greater scrutiny in some years than in others, and that the Trustees’ conclusions may be based, in part, on their consideration of these same arrangements during the course of the year and in prior years.
Based on information provided by Broadridge and MFS, the Trustees reviewed the Fund’s total return investment performance as well as the Broadridge performance universe over various time periods. The Trustees placed particular emphasis on the total return performance of the Fund’s Initial Class shares in comparison to the performance of funds in its Broadridge performance universe over the five-year period ended December 31, 2021, which the Trustees believed was a long enough period to reflect differing market conditions. The total return performance of the Fund’s Initial Class shares was in the 1st quintile relative to the other funds in the universe for this five-year period (the 1st quintile being the best performers and the 5th quintile being the worst performers). The total return performance of the Fund’s Initial Class shares was in the 4th quintile for the one-year period and the 2nd quintile for the three-year period ended December 31, 2021 relative to the Broadridge performance universe. Because of the passage of time, these performance results may differ from the performance results for more recent periods, including those shown elsewhere in this report.
In the course of their deliberations, the Trustees took into account information provided by MFS in connection with the contract review meetings, as well as during investment review meetings conducted with portfolio management personnel during the course of the year regarding the Fund’s performance. After reviewing these and related factors, the Trustees concluded, within the context of their overall conclusions regarding the investment advisory agreement, that they were satisfied with MFS’ responses and efforts relating to investment performance.
MFS Conservative Allocation Portfolio
Board Review of Investment Advisory Agreement - continued
The Trustees considered that MFS does not charge an advisory fee for providing investment advisory services to the Fund, but that the Fund pays its pro rata share of the advisory fees paid by the underlying funds in which it invests (the “Underlying Funds”).
In assessing the reasonableness of the Fund’s expenses, the Trustees considered, among other information, the Fund’s total expense ratio of the Fund’s Initial Class shares as a percentage of average daily net assets and the total expense ratios of the Broadridge expense group based on information provided by Broadridge. The Trustees considered that MFS currently observes an expense limitation for the Fund, which may not be changed without the Trustees’ approval. The Trustees also considered that, according to the data provided by Broadridge (which takes into account any expense limitations that were in effect during the Fund’s last fiscal year), the Fund’s total expense ratio was lower than the Broadridge expense group median. Because the Fund does not pay an advisory fee, the Trustees did not consider the extent to which economies of scale would be realized due to the Fund’s growth of assets, whether fee levels reflect economies of scale for shareholders, or the fees paid by similar funds to other investment advisers or by similar clients of MFS.
The Trustees also considered information prepared by MFS relating to MFS’ costs and profits with respect to the Fund, the MFS Funds considered as a group, and other investment companies and accounts advised by MFS, as well as MFS’ methodologies used to determine and allocate its costs to the MFS Funds, the Fund and other accounts and products for purposes of estimating profitability.
In addition, the Trustees considered MFS’ resources and related efforts to continue to retain, attract and motivate capable personnel to serve the Fund. The Trustees also considered current and developing conditions in the financial services industry, including the presence of large and well-capitalized companies which are spending, and appear to be prepared to continue to spend, substantial sums to engage personnel and to provide services to competing investment companies. In this regard, the Trustees also considered the financial resources of MFS and its ultimate parent, Sun Life Financial Inc. The Trustees also considered the advantages and possible disadvantages to the Fund of having an adviser that also serves other investment companies as well as other accounts.
The Trustees also considered the nature, quality, cost, and extent of administrative, transfer agency, and distribution services provided to the Fund by MFS and its affiliates under agreements and plans other than the investment advisory agreement, including any 12b-1 fees the Fund pays to MFS Fund Distributors, Inc., an affiliate of MFS. The Trustees also considered the nature, extent and quality of certain other services MFS performs or arranges for on the Fund’s or the Underlying Funds’ behalf, which may include securities lending programs, directed expense payment programs, class action recovery programs, and MFS’ interaction with third-party service providers, principally custodians and sub-custodians. The Trustees concluded that the various non-advisory services provided by MFS and its affiliates on behalf of the Fund were satisfactory.
The Trustees considered so-called “fall-out benefits” to MFS such as reputational value derived from serving as investment manager to the MFS Funds. The Trustees also considered that MFS discontinued its historic practice of obtaining investment research from portfolio brokerage commissions paid by certain MFS Funds effective January 2018, and directly pays or voluntarily reimburses a Fund, if applicable, for the costs of external research acquired through the use of the Fund’s portfolio brokerage commissions.
Based on their evaluation of factors that they deemed to be material, including those factors described above, the Board of Trustees, including the independent Trustees, concluded that the Fund’s investment advisory agreement with MFS should be continued for an additional one-year period, commencing August 1, 2022.
MFS Conservative Allocation Portfolio
Proxy Voting Policies and Information
MFS votes proxies on behalf of the fund pursuant to proxy voting policies and procedures that are available without charge, upon request, by calling 1-800-225-2606, by visiting mfs.com/proxyvoting, or by visiting the SEC’s Web site at http://www.sec.gov.
Information regarding how the fund voted proxies relating to portfolio securities during the most recent twelve-month period ended June 30 is available by August 31 of each year without charge by visiting mfs.com/proxyvoting, or by visiting the SEC’s Web site at http://www.sec.gov.
Quarterly Portfolio Disclosure
The fund files a complete schedule of portfolio holdings with the SEC for the first and third quarters of each fiscal year as an exhibit to its reports on Form N-PORT. The fund’s Form N-PORT reports are available on the SEC’s Web site at http://www.sec.gov. A shareholder can obtain the portfolio holdings report for the first and third quarters of the fund's fiscal year at mfs.com/vit3 by choosing the fund's name and then scrolling to the “Resources” section and clicking on the “Prospectus and Reports” tab.
FURTHER INFORMATION
From time to time, MFS may post important information about the fund or the MFS Funds on the MFS Web site (mfs.com). This information is available at https://www.mfs.com/announcements or at mfs.com/vit3 by choosing the fund's name and then scrolling to the “Resources” section and clicking on the “Announcements” tab, if any.
Information About Fund Contracts and Legal Claims
The fund has entered into contractual arrangements with an investment adviser, administrator, distributor, shareholder servicing agent, and custodian who each provide services to the fund. Unless expressly stated otherwise, shareholders are not parties to, or intended beneficiaries of these contractual arrangements, and these contractual arrangements are not intended to create any shareholder right to enforce them against the service providers or to seek any remedy under them against the service providers, either directly or on behalf of the fund.
Under the Trust’s By-Laws and Declaration of Trust, any claims asserted against or on behalf of the MFS Funds, including claims against Trustees and Officers, must be brought in state and federal courts located within the Commonwealth of Massachusetts.
Federal Tax Information (unaudited)
The following information is provided pursuant to provisions of the Internal Revenue Code.
The fund designates $27,724,000 as capital gain dividends paid during the fiscal year.
For corporate shareholders, 11.62% of the ordinary income dividends paid during the fiscal year qualify for the corporate dividends received deduction.
The fund intends to pass through the maximum amount allowable as Section 163(j) Interest Dividends as defined in Treasury Regulation §1.163(j)-1(b).
| FACTS | WHAT DOES MFS DO WITH YOUR PERSONAL INFORMATION? |
| Why? | Financial companies choose how they share your personal information. Federal law gives consumers the right to limit some but not all sharing. Federal law also requires us to tell you how we collect, share, and protect your personal information. Please read this notice carefully to understand what we do. |
| What? | The types of personal information we collect and share depend on the product or service you have with us. This information can include: |
| • Social Security number and account balances |
| • Account transactions and transaction history |
| • Checking account information and wire transfer instructions |
| When you are no longer our customer, we continue to share your information as described in this notice. |
| How? | All financial companies need to share customers' personal information to run their everyday business. In the section below, we list the reasons financial companies can share their customers' personal information; the reasons MFS chooses to share; and whether you can limit this sharing. |
Reasons we can share your
personal information | Does MFS share? | Can you limit
this sharing? |
For our everyday business purposes –
such as to process your transactions, maintain your
account(s), respond to court orders and legal
investigations, or report to credit bureaus | Yes | No |
For our marketing purposes –
to offer our products and services to you | No | We don't share |
For joint marketing with other
financial companies | No | We don't share |
For our affiliates' everyday business purposes –
information about your transactions and experiences | No | We don't share |
For our affiliates' everyday business purposes –
information about your creditworthiness | No | We don't share |
| For nonaffiliates to market to you | No | We don't share |
| Questions? | Call 800-225-2606 or go to mfs.com. |
| Who we are |
| Who is providing this notice? | MFS Funds, MFS Investment Management, MFS Institutional Advisors, Inc., and MFS Heritage Trust Company. |
| What we do |
How does MFS
protect my personal
information? | To protect your personal information from unauthorized access and use, we use security measures that comply with federal law. These measures include procedural, electronic, and physical safeguards for the protection of the personal information we collect about you. |
How does MFS
collect my personal
information? | We collect your personal information, for example, when you |
| • open an account or provide account information |
| • direct us to buy securities or direct us to sell your securities |
| • make a wire transfer |
| We also collect your personal information from others, such as credit bureaus, affiliates, or other companies. |
| Why can't I limit all sharing? | Federal law gives you the right to limit only |
| • sharing for affiliates' everyday business purposes – information about your creditworthiness |
| • affiliates from using your information to market to you |
| • sharing for nonaffiliates to market to you |
| State laws and individual companies may give you additional rights to limit sharing. |
| Definitions |
| Affiliates | Companies related by common ownership or control. They can be financial and nonfinancial companies. |
| • MFS does not share personal information with affiliates, except for everyday business purposes as described on page one of this notice. |
| Nonaffiliates | Companies not related by common ownership or control. They can be financial and nonfinancial companies. |
| • MFS does not share with nonaffiliates so they can market to you. |
| Joint marketing | A formal agreement between nonaffiliated financial companies that together market financial products or services to you. |
| • MFS doesn't jointly market. |
| Other important information |
| If you own an MFS product or receive an MFS service in the name of a third party such as a bank or broker-dealer, their privacy policy may apply to you instead of ours. |
Annual Report
December 31, 2022
MFS® Global Real
Estate Portfolio
MFS® Variable Insurance Trust III
MFS® Global Real Estate Portfolio
| 1 |
| 2 |
| 3 |
| 5 |
| 7 |
| 8 |
| 10 |
| 11 |
| 12 |
| 13 |
| 15 |
| 21 |
| 22 |
| 25 |
| 28 |
| 28 |
| 28 |
| 28 |
| 28 |
| 29 |
The report is prepared for the general information of shareholders. It is authorized for distribution to prospective investors only when preceded or accompanied by a current prospectus.
NOT FDIC INSURED • MAY LOSE VALUE • NO BANK OR CREDIT UNION GUARANTEE •
NOT A DEPOSIT • NOT INSURED BY ANY FEDERAL GOVERNMENT AGENCY OR NCUA/NCUSIF
MFS Global Real Estate Portfolio
LETTER FROM THE CHAIR AND CEO
Dear Shareholders:
Signs of peaking inflation, hopes that monetary policy tightening cycles may be nearing an end and a rapid reopening of China’s economy in late-2022 and early-2023 have combined to bolster investor sentiment in recent months. Markets have largely adjusted to the challenges posed by Russia’s invasion of Ukraine, thanks in part to mild European winter weather which has alleviated concerns over potential shortages of natural gas. Resilient labor markets in much of the developed world have further contributed to a brighter-than-expected economic backdrop. However, many investors are mindful that the lagged effects of ongoing policy tightening have yet to work their way through the global economy.
Tighter global financial conditions have been a particular headwind for richly valued growth equities and interest rate-sensitive parts of the economy, such as housing. Over the near term, companies may face a challenging earnings backdrop as they are forced to absorb higher input and labor costs at a time of dwindling pricing power. For fixed income, the rise in interest rates has made bonds more attractive than they have been in years, which may provide balance to an overall portfolio.
During times of market transition, it is important to have a deep understanding of company fundamentals, and we have built our unique global research platform to do just that.
At MFS®, we put our clients’ assets to work responsibly by carefully navigating increasingly complex global capital markets. Our investment team is guided by a commitment to long-term fundamental investing. Our global investment platform — combining collective expertise, long-term discipline, and thoughtful risk management — seeks to uncover what we believe are the best, most durable investment ideas in markets around the world, enabling us to potentially create value for investors.
Respectfully,
Michael W. Roberge
Chair and Chief Executive Officer
MFS Investment Management
February 15, 2023
The opinions expressed in this letter are subject to change and may not be relied upon for investment advice. No forecasts can be guaranteed.
MFS Global Real Estate Portfolio
Portfolio structure
Top ten holdings
| Prologis, Inc., REIT | 8.2% |
| Equinix, Inc., REIT | 5.2% |
| Simon Property Group, Inc., REIT | 4.9% |
| Extra Space Storage, Inc., REIT | 3.2% |
| Equity Lifestyle Properties, Inc., REIT | 2.9% |
| Goodman Group, REIT | 2.8% |
| Sun Communities, Inc., REIT | 2.7% |
| CapitaLand Investment Ltd. | 2.7% |
| Weyerhaeuser Co., REIT | 2.6% |
| Alexandria Real Estate Equities, Inc., REIT | 2.5% |
GICS equity industries (g)
| Real Estate | 90.9% |
| Communication Services | 3.1% |
| Health Care | 2.0% |
| Financials | 1.5% |
Issuer country weightings (x)
| United States | 57.9% |
| United Kingdom | 10.2% |
| Australia | 5.5% |
| Japan | 5.1% |
| Hong Kong | 4.7% |
| Singapore | 4.3% |
| Canada | 4.0% |
| Germany | 2.4% |
| Spain | 1.8% |
| Other Countries | 4.1% |
Currency exposure weightings (y)
| United States Dollar | 57.9% |
| British Pound Sterling | 10.2% |
| Euro | 5.8% |
| Australian Dollar | 5.5% |
| Japanese Yen | 5.1% |
| Hong Kong Dollar | 4.7% |
| Singapore Dollar | 4.3% |
| Canadian Dollar | 4.0% |
| Mexican Peso | 1.2% |
| Other Currencies | 1.3% |
| (g) | The Global Industry Classification Standard (GICS®) was developed by and/or is the exclusive property of MSCI, Inc. and S&P Global Market Intelligence Inc. (“S&P Global Market Intelligence”). GICS is a service mark of MSCI and S&P Global Market Intelligence and has been licensed for use by MFS. MFS has applied its own internal sector/industry classification methodology for equity securities and non-equity securities that are unclassified by GICS. |
| (x) | Represents the portfolio’s exposure to issuer countries as a percentage of a portfolio’s net assets. For purposes of this presentation, United States includes Cash & Cash Equivalents. |
| (y) | Represents the portfolio’s exposure to a particular currency as a percentage of a portfolio's net assets. For purposes of this presentation, United States Dollar includes Cash & Cash Equivalents. |
Cash & Cash Equivalents includes any cash, investments in money market funds, short-term securities, and other assets less liabilities. Please see the Statement of Assets and Liabilities for additional information related to the fund’s cash position and other assets and liabilities.
Percentages are based on net assets as of December 31, 2022.
The portfolio is actively managed and current holdings may be different.
MFS Global Real Estate Portfolio
Management Review
Summary of Results
For the twelve months ended December 31, 2022, Initial Class shares of the MFS Global Real Estate Portfolio (fund) provided a total return of -26.94%, while Service Class shares of the fund provided a total return of -27.14%. These compare with a return of -25.09% over the same period for the fund’s benchmark, the FTSE EPRA Nareit Developed Real Estate Index (net div).
Market Environment
During the reporting period, markets continued to grapple with the strongest global inflationary pressures in decades along with signs of slowing economic growth. Intermittent coronavirus flareups, particularly in China, where home-grown vaccines have proved less effective than elsewhere, kept supply chains stretched for a considerable period. At the same time, the reopening of the economy in the parts of the world where the virus has been better contained has led to a shift in consumption patterns in favor of services, straining already tight labor markets in most developed economies, while reducing demand for manufactured goods, primarily from Asia. As a result of Russia’s invasion of Ukraine, geopolitical considerations, such as sanctions and trade bans, have resulted in additional supply chain disruptions and volatile global energy prices. Taken together, these factors have contributed to market volatility.
The ripple effects from the Russian invasion further complicated the mission central banks must undertake to rein in surging inflation. Energy shocks have historically resulted in global growth slowdowns, if not pullbacks, so policymakers will find themselves in the difficult position of trying to restrain inflation without tipping economies into recession. Despite the challenging macroeconomic and geopolitical environment, policymakers remained focused on controlling inflation, although investors appeared to have expected varying degrees of action from the central banks. The Fed has been among the most aggressive developed market central banks, tightening policy at the fastest rate in decades, although it slowed its hiking pace at the end of the period, as did the European Central Bank. After remaining on the monetary sidelines for much of the period, the Bank of Japan widened its Yield Curve Control band, capping the yield on its 10-year bond at 0.5%, up from 0.25%, an action investors interpreted as a first step toward monetary policy normalization.
Against an environment of still-tight labor markets, tighter global financial conditions and volatile materials prices, investor anxiety appeared to have increased over the potential that corporate profit margins may be past peak for this cycle. That said, tentative signs that supply chain bottlenecks (particularly semiconductors) may be moderating, the easing of COVID restrictions in China, low levels of unemployment across developed markets and hopes that inflation levels may be near a peak were supportive factors for the macroeconomic backdrop.
Detractors from Performance
Relative to the FTSE EPRA Nareit Developed Real Estate Index, the combination of an underweight position and security selection within Japanese real estate investments held back relative performance, led by the fund’s holdings of real estate services provider KATITAS(b) (Japan).
Stock selection within Hong Kong-based real estate investments also weighed on relative results. Here, not owning shares of real estate development company Sun Hung Kai Properties (Hong Kong) weakened relative performance as the stock outperformed the benchmark.
Other notable relative detractors during the reporting period included the fund’s positions in industrial property and business space management firm Goodman Group(b) (Australia) and telecommunication infrastructure services providers Cellnex Telecom(b) (Spain) and Helios Towers(b) (United Kingdom). Additionally, the fund’s overweight positions in residential real estate management company Vonovia (Germany), real estate investment trust Shaftesbury (United Kingdom), self-storage services provider Big Yellow Group (United Kingdom) and real estate company LEG Immobilien (Germany), and not owning shares of real estate company Realty Income, further held back relative performance.
Contributors to Performance
The fund’s avoidance of Sweden-based investments contributed to relative performance. During the reporting period, there were no individual stocks within this country, either in the fund or in the benchmark, that were among the fund's largest relative contributors.
Stock selection within US real estate investments further supported relative results. Here, the fund’s holdings of post-acute healthcare services provider Encompass Health(b), and its overweight positions in real estate investment companies Phillips Edison & Co., National Retail Properties, Brixmor Property Group, and property developer and manager Simon Property Group aided relative returns. Not owning shares of real estate investment trust Digital Realty Trust also helped relative performance.
The fund’s exposure to real estate investments within Mexico benefited relative returns, led by the fund’s holdings of real estate developer Corporación Inmobiliaria Vesta(b) (Mexico).
Elsewhere, the fund's overweight positions in real estate development company Swire Properties (Hong Kong) and real estate investment trust CapitaLand Investment (Singapore) further strengthened relative performance.
MFS Global Real Estate Portfolio
Management Review - continued
The fund’s cash and/or cash equivalents position during the period also contributed to relative performance. Under normal market conditions, the fund strives to be fully invested and generally holds cash to buy new holdings and to provide liquidity. In a period when equity markets fell, as measured by the fund’s benchmark, holding cash helped performance versus the benchmark, which has no cash position.
Respectfully,
Portfolio Manager(s)
Rick Gable and Mark Syn
Note to Shareholders: Effective March 31, 2022, Mark Syn was added as a Portfolio Manager of the fund.
| (b) | Security is not a benchmark constituent. |
The views expressed in this report are those of the portfolio manager(s) only through the end of the period of the report as stated on the cover and do not necessarily reflect the views of MFS or any other person in the MFS organization. These views are subject to change at any time based on market or other conditions, and MFS disclaims any responsibility to update such views. These views may not be relied upon as investment advice or an indication of trading intent on behalf of any MFS portfolio. References to specific securities are not recommendations of such securities, and may not be representative of any MFS portfolio’s current or future investments.
MFS Global Real Estate Portfolio
Performance Summary Through 12/31/22
The following chart illustrates the historical performance of the fund in comparison to its benchmark(s). Benchmarks are unmanaged and may not be invested in directly. Benchmark returns do not reflect any fees or expenses. The performance of other share classes will be greater than or less than that of the class depicted below. (See Notes to Performance Summary.)
Performance data shown represents past performance and is no guarantee of future results. Investment return and principal value fluctuate so your shares, when sold, may be worth more or less than the original cost; current performance may be lower or higher than quoted. The performance shown does not reflect the deduction of taxes, if any, that a shareholder would pay on fund distributions or the redemption of fund shares. The returns for the fund shown also do not reflect the deduction of expenses associated with variable products, such as mortality and expense risk charges, separate account charges, and sales charges imposed by the insurance company separate accounts. Such expenses would reduce the overall returns shown.
Growth of a Hypothetical $10,000 Investment
Total Returns through 12/31/22
Average annual total returns
| Share Class | Class Inception Date | 1-yr | 5-yr | 10-yr |
| Initial Class | 12/07/98 | (26.94)% | 3.49% | 5.91% |
| Service Class | 2/01/04 | (27.14)% | 3.23% | 5.65% |
Comparative benchmark(s)
| FTSE EPRA Nareit Developed Real Estate Index (net div) (f) | (25.09)% | (0.23)% | 2.99% |
| (f) | Source: FactSet Research Systems Inc. |
Benchmark Definition(s)
FTSE EPRA Nareit Developed Real Estate Index(c) (net div) – measures the performance of eligible real estate equities worldwide that generate a majority of their revenue and income through the ownership, disposure and development of income-producing real estate.
It is not possible to invest directly in an index.
| (c) | FTSE International Limited (“FTSE”)© FTSE 2019. “FTSE®” is a trademark of the London Stock Exchange Group companies and is used by FTSE International Limited under license. “FT-SE®”, “FOOTSIE®” and “FTSE4GOOD®” are trademarks of the London Stock Exchange Group companies. “Nareit®” is a trademark of the National Association of Real Estate Investment Trusts (“Nareit”) and “EPRA®” is a trademark of the European Public Real Estate Association (“EPRA”) and all are used by FTSE under license. The FTSE EPRA Nareit Developed Real Estate Index is calculated by FTSE. Neither FTSE, Euronext N.V., Nareit, nor EPRA sponsor, endorse, or promote this product and are not in any way connected to it and do not accept any liability. All intellectual property rights in the index values and constituent list vests in FTSE, Euronext N.V., Nareit, and EPRA. Neither FTSE nor its licensors accept any liability for any errors or omissions in the FTSE indices and/or FTSE ratings or underlying data. No further distribution of FTSE Data is permitted without FTSE's express written consent. |
Notes to Performance Summary
Average annual total return represents the average annual change in value for each share class for the periods presented.
MFS Global Real Estate Portfolio
Performance Summary – continued
Performance results reflect any applicable expense subsidies and waivers in effect during the periods shown. Without such subsidies and waivers the fund's performance results would be less favorable. Please see the prospectus and financial statements for complete details. All results are historical and assume the reinvestment of any dividends and capital gains distributions.
Performance results do not include adjustments made for financial reporting purposes in accordance with U.S. generally accepted accounting principles and may differ from amounts reported in the financial highlights.
From time to time the fund may receive proceeds from litigation settlements, without which performance would be lower.
MFS Global Real Estate Portfolio
Expense Table
Fund expenses borne by the shareholders during the period,
July 1, 2022 through December 31, 2022
As a shareholder of the fund, you incur ongoing costs, including management fees; distribution and/or service (12b-1) fees; and other fund expenses. This example is intended to help you understand your ongoing costs (in dollars) of investing in the fund and to compare these costs with the ongoing costs of investing in other mutual funds.
The example is based on an investment of $1,000 invested at the beginning of the period and held for the entire period July 1, 2022 through December 31, 2022.
Actual Expenses
The first line for each share class in the following table provides information about actual account values and actual expenses. You may use the information in this line, together with the amount you invested, to estimate the expenses that you paid over the period. Simply divide your account value by $1,000 (for example, an $8,600 account value divided by $1,000 = 8.6), then multiply the result by the number in the first line under the heading entitled “Expenses Paid During Period” to estimate the expenses you paid on your account during this period.
Hypothetical Example for Comparison Purposes
The second line for each share class in the following table provides information about hypothetical account values and hypothetical expenses based on the fund’s actual expense ratio and an assumed rate of return of 5% per year before expenses, which is not the fund’s actual return. The hypothetical account values and expenses may not be used to estimate the actual ending account balance or expenses you paid for the period. You may use this information to compare the ongoing costs of investing in the fund and other funds. To do so, compare this 5% hypothetical example with the 5% hypothetical examples that appear in the shareholder reports of the other funds.
Please note that the expenses shown in the table are meant to highlight the fund's ongoing costs only and do not take into account the fees and expenses imposed under the variable contracts through which your investment in the fund is made. Therefore, the second line for each share class in the table is useful in comparing ongoing costs associated with an investment in vehicles (such as the fund) which fund benefits under variable annuity and variable life insurance contracts and to qualified pension and retirement plans only, and will not help you determine the relative total costs of investing in the fund through variable annuity and variable life insurance contracts. If the fees and expenses imposed under the variable contracts were included, your costs would have been higher.
Share
Class | | Annualized
Expense
Ratio | Beginning
Account Value
7/01/22 | Ending
Account Value
12/31/22 | Expenses
Paid During
Period (p)
7/01/22-12/31/22 |
| Initial Class | Actual | 0.92% | $1,000.00 | $939.45 | $4.50 |
| Hypothetical (h) | 0.92% | $1,000.00 | $1,020.57 | $4.69 |
| Service Class | Actual | 1.17% | $1,000.00 | $938.19 | $5.72 |
| Hypothetical (h) | 1.17% | $1,000.00 | $1,019.31 | $5.96 |
| (h) | 5% class return per year before expenses. |
| (p) | “Expenses Paid During Period” are equal to each class's annualized expense ratio, as shown above, multiplied by the average account value over the period, multiplied by 184/365 (to reflect the one-half year period). |
MFS Global Real Estate Portfolio
Portfolio of Investments − 12/31/22
The Portfolio of Investments is a complete list of all securities owned by your fund. It is categorized by broad-based asset classes.
| Issuer | | | Shares/Par | Value ($) |
| Common Stocks – 97.5% |
| Brokerage & Asset Managers – 1.2% | |
| Brookfield Corp. | | 63,185 | $ 1,987,014 |
| Construction – 5.8% | |
| American Homes 4 Rent, “A”, REIT | | 86,698 | $ 2,613,078 |
| AvalonBay Communities, Inc., REIT | | 22,881 | 3,695,739 |
| Essex Property Trust, Inc., REIT | | 14,298 | 3,030,032 |
| | | | | $9,338,849 |
| Engineering - Construction – 1.2% | |
| Corporacion Inmobiliaria Vesta S.A.B. de C.V. | | 824,013 | $ 1,966,738 |
| Financial Institutions – 0.3% | |
| Brookfield Corp., “A” (a) | | 15,796 | $ 452,298 |
| Forest & Paper Products – 5.0% | |
| Rayonier, Inc., REIT | | 116,265 | $ 3,832,094 |
| Weyerhaeuser Co., REIT | | 132,402 | 4,104,462 |
| | | | | $7,936,556 |
| Medical & Health Technology & Services – 2.0% | |
| Encompass Health Corp. | | 53,080 | $ 3,174,715 |
| Network & Telecom – 5.2% | |
| Equinix, Inc., REIT | | 12,750 | $ 8,351,633 |
| Real Estate – 70.6% | |
| Alexandria Real Estate Equities, Inc., REIT | | 27,346 | $ 3,983,492 |
| Big Yellow Group PLC, REIT | | 207,693 | 2,880,008 |
| Brixmor Property Group, Inc., REIT | | 169,628 | 3,845,467 |
| Canadian Apartment Properties, REIT | | 30,908 | 974,264 |
| CapitaLand India Trusts IEU, REIT | | 1,795,900 | 1,515,131 |
| CapitaLand Investment Ltd. | | 1,577,400 | 4,357,459 |
| Douglas Emmett, Inc., REIT | | 105,591 | 1,655,667 |
| Embassy Office Parks, REIT | | 480,604 | 1,952,218 |
| Equity Lifestyle Properties, Inc., REIT | | 71,246 | 4,602,492 |
| ESR Group Ltd. | | 1,369,600 | 2,874,152 |
| Extra Space Storage, Inc., REIT | | 34,548 | 5,084,775 |
| Farmland Partners, Inc., REIT | | 31,699 | 394,969 |
| Goodman Group, REIT | | 381,662 | 4,484,001 |
| Grainger PLC | | 1,223,109 | 3,726,268 |
| Granite REIT | | 59,333 | 3,027,122 |
| Heiwa Real Estate Co. Ltd. | | 30,800 | 853,866 |
| Japan Logistics Fund, Inc., REIT | | 964 | 2,299,799 |
| KATITAS Co. Ltd. | | 170,100 | 3,914,218 |
| LEG Immobilien SE | | 17,121 | 1,115,391 |
| National Retail Properties, Inc., REIT | | 83,871 | 3,837,937 |
| National Storage, REIT | | 2,036,026 | 3,201,873 |
| Parkway Real Estate LLC, REIT | | 331,400 | 930,315 |
| Phillips Edison & Co., REIT | | 113,385 | 3,610,178 |
| Prologis, Inc., REIT | | 116,701 | 13,155,704 |
| Region RE Ltd., REIT | | 444,636 | 820,400 |
| Rural Funds Group, REIT | | 203,263 | 331,848 |
| SEGRO PLC, REIT | | 289,900 | 2,676,224 |
| Shaftesbury PLC, REIT | | 645,863 | 2,873,403 |
MFS Global Real Estate Portfolio
Portfolio of Investments – continued
| Issuer | | | Shares/Par | Value ($) |
| Common Stocks – continued |
| Real Estate – continued | |
| Shurgard Self Storage S.A. | | 56,790 | $ 2,610,440 |
| Simon Property Group, Inc., REIT | | 66,316 | 7,790,804 |
| Sino Land Co. Ltd. | | 2,036,613 | 2,536,590 |
| Star Asia Investment Corp., REIT | | 2,764 | 1,157,947 |
| Sun Communities, Inc., REIT | | 30,709 | 4,391,387 |
| Swire Properties Ltd. | | 853,400 | 2,158,956 |
| Unite Group PLC, REIT | | 181,103 | 1,992,395 |
| Urban Edge Properties, REIT | | 179,039 | 2,522,659 |
| Vonovia SE, REIT | | 114,943 | 2,709,356 |
| | | | | $112,849,175 |
| Telecommunications - Wireless – 4.9% | |
| American Tower Corp., REIT | | 12,336 | $ 2,613,505 |
| Cellnex Telecom S.A. | | 85,449 | 2,841,659 |
| SBA Communications Corp., REIT | | 8,206 | 2,300,224 |
| | | | | $7,755,388 |
| Telephone Services – 1.3% | |
| Helios Towers PLC (a) | | 1,632,365 | $ 2,093,828 |
| Total Common Stocks (Identified Cost, $143,522,455) | | $155,906,194 |
| Investment Companies (h) – 2.3% |
| Money Market Funds – 2.3% | |
| MFS Institutional Money Market Portfolio, 4.02% (v) (Identified Cost, $3,668,602) | | | 3,668,300 | $ 3,669,400 |
| Other Assets, Less Liabilities – 0.2% | | 362,243 |
| Net Assets – 100.0% | $159,937,837 |
| (a) | Non-income producing security. | | | |
| (h) | An affiliated issuer, which may be considered one in which the fund owns 5% or more of the outstanding voting securities, or a company which is under common control. At period end, the aggregate values of the fund's investments in affiliated issuers and in unaffiliated issuers were $3,669,400 and $155,906,194, respectively. | | | |
| (v) | Affiliated issuer that is available only to investment companies managed by MFS. The rate quoted for the MFS Institutional Money Market Portfolio is the annualized seven-day yield of the fund at period end. | | | |
| The following abbreviations are used in this report and are defined: |
| IEU | International Equity Unit |
| REIT | Real Estate Investment Trust |
See Notes to Financial Statements
MFS Global Real Estate Portfolio
| Financial Statements | Statement of Assets and Liabilities |
This statement represents your fund’s balance sheet, which details the assets and liabilities comprising the total value of the fund.
| At 12/31/22Assets | |
| Investments in unaffiliated issuers, at value (identified cost, $143,522,455) | $155,906,194 |
| Investments in affiliated issuers, at value (identified cost, $3,668,602) | 3,669,400 |
| Foreign currency, at value (identified cost, $23) | 23 |
| Receivables for | |
| Fund shares sold | 174,270 |
| Dividends | 421,085 |
| Receivable from investment adviser | 4,469 |
| Other assets | 1,101 |
| Total assets | $160,176,542 |
| Liabilities | |
| Payables for | |
| Fund shares reacquired | $155,906 |
| Payable to affiliates | |
| Administrative services fee | 268 |
| Shareholder servicing costs | 50 |
| Distribution and/or service fees | 1,129 |
| Payable for independent Trustees' compensation | 132 |
| Accrued expenses and other liabilities | 81,220 |
| Total liabilities | $238,705 |
| Net assets | $159,937,837 |
| Net assets consist of | |
| Paid-in capital | $136,985,979 |
| Total distributable earnings (loss) | 22,951,858 |
| Net assets | $159,937,837 |
| Shares of beneficial interest outstanding | 11,795,019 |
| | Net assets | Shares
outstanding | Net asset value
per share |
| Initial Class | $104,737,489 | 8,194,904 | $12.78 |
| Service Class | 55,200,348 | 3,600,115 | 15.33 |
See Notes to Financial Statements
MFS Global Real Estate Portfolio
| Financial Statements | Statement of Operations |
This statement describes how much your fund earned in investment income and accrued in expenses. It also describes any gains and/or losses generated by fund operations.
| Year ended 12/31/22 | |
| Net investment income (loss) | |
| Income | |
| Dividends | $4,683,877 |
| Dividends from affiliated issuers | 56,366 |
| Other | 8,198 |
| Foreign taxes withheld | (162,297) |
| Total investment income | $4,586,144 |
| Expenses | |
| Management fee | $1,604,958 |
| Distribution and/or service fees | 147,062 |
| Shareholder servicing costs | 12,285 |
| Administrative services fee | 37,211 |
| Independent Trustees' compensation | 5,010 |
| Custodian fee | 28,045 |
| Shareholder communications | 17,180 |
| Audit and tax fees | 71,558 |
| Legal fees | 859 |
| Miscellaneous | 28,883 |
| Total expenses | $1,953,051 |
| Reduction of expenses by investment adviser | (165,695) |
| Net expenses | $1,787,356 |
| Net investment income (loss) | $2,798,788 |
| Realized and unrealized gain (loss) | |
| Realized gain (loss) (identified cost basis) | |
| Unaffiliated issuers | $11,982,292 |
| Affiliated issuers | (48) |
| Foreign currency | (27,986) |
| Net realized gain (loss) | $11,954,258 |
| Change in unrealized appreciation or depreciation | |
| Unaffiliated issuers | $(72,464,771) |
| Affiliated issuers | 798 |
| Translation of assets and liabilities in foreign currencies | (4,984) |
| Net unrealized gain (loss) | $(72,468,957) |
| Net realized and unrealized gain (loss) | $(60,514,699) |
| Change in net assets from operations | $(57,715,911) |
See Notes to Financial Statements
MFS Global Real Estate Portfolio
| Financial Statements | Statements of Changes in Net Assets |
These statements describe the increases and/or decreases in net assets resulting from operations, any distributions, and any shareholder transactions.
| | Year ended |
| | 12/31/22 | 12/31/21 |
| Change in net assets | | |
| From operations | | |
| Net investment income (loss) | $2,798,788 | $2,407,206 |
| Net realized gain (loss) | 11,954,258 | 15,733,020 |
| Net unrealized gain (loss) | (72,468,957) | 35,301,403 |
| Change in net assets from operations | $(57,715,911) | $53,441,629 |
| Total distributions to shareholders | $(14,602,234) | $(2,751,003) |
| Change in net assets from fund share transactions | $13,153,425 | $(17,145,580) |
| Total change in net assets | $(59,164,720) | $33,545,046 |
| Net assets | | |
| At beginning of period | 219,102,557 | 185,557,511 |
| At end of period | $159,937,837 | $219,102,557 |
See Notes to Financial Statements
MFS Global Real Estate Portfolio
| Financial Statements | Financial Highlights |
The financial highlights table is intended to help you understand the fund's financial performance for the past 5 years. Certain information reflects financial results for a single fund share. The total returns in the table represent the rate that an investor would have earned (or lost) on an investment in the fund share class (assuming reinvestment of all distributions) held for the entire period.
| Initial Class | Year ended |
| | 12/31/22 | 12/31/21 | 12/31/20 | 12/31/19 | 12/31/18 |
| Net asset value, beginning of period | $19.21 | $14.98 | $15.91 | $13.10 | $14.27 |
| Income (loss) from investment operations | | | | | |
| Net investment income (loss) (d) | $0.25 | $0.22 | $0.28 | $0.35 | $0.42 |
| Net realized and unrealized gain (loss) | (5.30) | 4.27 | (0.14) | 3.14 | (0.79) |
| Total from investment operations | $(5.05) | $4.49 | $0.14 | $3.49 | $(0.37) |
| Less distributions declared to shareholders | | | | | |
| From net investment income | $(0.26) | $(0.26) | $(0.70) | $(0.58) | $(0.58) |
| From net realized gain | (1.12) | — | (0.37) | (0.10) | (0.22) |
| Total distributions declared to shareholders | $(1.38) | $(0.26) | $(1.07) | $(0.68) | $(0.80) |
| Net asset value, end of period (x) | $12.78 | $19.21 | $14.98 | $15.91 | $13.10 |
| Total return (%) (k)(r)(s)(x) | (26.94) | 30.12 | 1.49 | 26.87 | (3.03) |
Ratios (%) (to average net assets)
and Supplemental data: | | | | | |
| Expenses before expense reductions | 1.01 | 1.01 | 1.02 | 1.01 | 1.01 |
| Expenses after expense reductions | 0.92 | 0.92 | 0.92 | 0.92 | 0.92 |
| Net investment income (loss) | 1.65 | 1.27 | 2.00 | 2.31 | 3.00 |
| Portfolio turnover | 32 | 26 | 43 | 36 | 24 |
| Net assets at end of period (000 omitted) | $104,737 | $149,746 | $127,523 | $132,530 | $99,826 |
| Service Class | Year ended |
| | 12/31/22 | 12/31/21 | 12/31/20 | 12/31/19 | 12/31/18 |
| Net asset value, beginning of period | $22.70 | $17.66 | $18.56 | $15.17 | $16.41 |
| Income (loss) from investment operations | | | | | |
| Net investment income (loss) (d) | $0.26 | $0.20 | $0.29 | $0.36 | $0.44 |
| Net realized and unrealized gain (loss) | (6.30) | 5.06 | (0.17)(g) | 3.66 | (0.93) |
| Total from investment operations | $(6.04) | $5.26 | $0.12 | $4.02 | $(0.49) |
| Less distributions declared to shareholders | | | | | |
| From net investment income | $(0.21) | $(0.22) | $(0.65) | $(0.53) | $(0.53) |
| From net realized gain | (1.12) | — | (0.37) | (0.10) | (0.22) |
| Total distributions declared to shareholders | $(1.33) | $(0.22) | $(1.02) | $(0.63) | $(0.75) |
| Net asset value, end of period (x) | $15.33 | $22.70 | $17.66 | $18.56 | $15.17 |
| Total return (%) (k)(r)(s)(x) | (27.14) | 29.87 | 1.15 | 26.68 | (3.33) |
Ratios (%) (to average net assets)
and Supplemental data: | | | | | |
| Expenses before expense reductions | 1.26 | 1.26 | 1.27 | 1.26 | 1.26 |
| Expenses after expense reductions | 1.17 | 1.17 | 1.17 | 1.17 | 1.17 |
| Net investment income (loss) | 1.42 | 1.02 | 1.75 | 2.07 | 2.74 |
| Portfolio turnover | 32 | 26 | 43 | 36 | 24 |
| Net assets at end of period (000 omitted) | $55,200 | $69,356 | $58,035 | $58,508 | $53,577 |
See Notes to Financial Statements
MFS Global Real Estate Portfolio
Financial Highlights - continued
| (d) | Per share data is based on average shares outstanding. |
| (g) | The per share amount varies from the net realized and unrealized gain/loss for the period because of the timing of sales of fund shares and the per share amount of realized and unrealized gains and losses at such time. |
| (k) | The total return does not reflect expenses that apply to separate accounts. Inclusion of these charges would reduce the total return figures for all periods shown. |
| (r) | Certain expenses have been reduced without which performance would have been lower. |
| (s) | From time to time the fund may receive proceeds from litigation settlements, without which performance would be lower. |
| (x) | The net asset values and total returns have been calculated on net assets which include adjustments made in accordance with U.S. generally accepted accounting principles required at period end for financial reporting purposes. |
See Notes to Financial Statements
MFS Global Real Estate Portfolio
Notes to Financial Statements
(1) Business and Organization
MFS Global Real Estate Portfolio (the fund) is a diversified series of MFS Variable Insurance Trust III (the trust). The trust is organized as a Delaware statutory trust and is registered under the Investment Company Act of 1940, as amended, as an open-end management investment company. The shareholders of each series of the trust are separate accounts of insurance companies, which offer variable annuity and/or life insurance products, and qualified retirement and pension plans.
The fund is an investment company and accordingly follows the investment company accounting and reporting guidance of the Financial Accounting Standards Board (FASB) Accounting Standards Codification Topic 946 Financial Services - Investment Companies.
(2) Significant Accounting Policies
General — The preparation of financial statements in conformity with U.S. generally accepted accounting principles requires management to make estimates and assumptions that affect the reported amounts of assets and liabilities, and disclosure of contingent assets and liabilities at the date of the financial statements and the reported amounts of increases and decreases in net assets from operations during the reporting period. Actual results could differ from those estimates. In the preparation of these financial statements, management has evaluated subsequent events occurring after the date of the fund’s Statement of Assets and Liabilities through the date that the financial statements were issued. The fund invests a significant amount of its net assets in U.S. and foreign real estate related investments and as a result is subject to certain risks associated with the direct ownership of real estate and the real estate industry in general. These include risks related to general, regional and local economic conditions; difficulties in valuing and disposing of real estate; fluctuations in interest rates and property tax rates, shifts in zoning laws, environmental regulations and other governmental action; cash flow dependency; increased operating expenses; lack of availability of mortgage funds; losses due to natural disasters; overbuilding; losses due to casualty or condemnation; changes in property values and rental rates; the management skill and creditworthiness of the manager; and other factors. The fund invests in foreign securities. Investments in foreign securities are vulnerable to the effects of changes in the relative values of the local currency and the U.S. dollar and to the effects of changes in each country’s market, economic, industrial, political, regulatory, geopolitical, environmental, public health, and other conditions.
Balance Sheet Offsetting — The fund's accounting policy with respect to balance sheet offsetting is that, absent an event of default by the counterparty or a termination of the agreement, the International Swaps and Derivatives Association (ISDA) Master Agreement, or similar agreement, does not result in an offset of reported amounts of financial assets and financial liabilities in the Statement of Assets and Liabilities across transactions between the fund and the applicable counterparty. The fund's right to setoff may be restricted or prohibited by the bankruptcy or insolvency laws of the particular jurisdiction to which a specific master netting agreement counterparty is subject. Balance sheet offsetting disclosures, to the extent applicable to the fund, have been included in the fund’s Significant Accounting Policies note under the captions for each of the fund’s in-scope financial instruments and transactions.
Investment Valuations — Subject to its oversight, the fund's Board of Trustees has delegated primary responsibility for determining or causing to be determined the value of the fund’s investments to MFS as the fund's adviser, pursuant to the fund’s valuation policy and procedures which have been adopted by the adviser and approved by the Board. Effective September 8, 2022, and in accordance with Rule 2a-5 under the Investment Company Act of 1940, the Board of Trustees designated the adviser as the “valuation designee” of the fund. If the adviser, as valuation designee, determines that reliable market quotations are not readily available for an investment, the investment is valued at fair value as determined in good faith by the adviser in accordance with the adviser’s fair valuation policy and procedures.
Under the fund's valuation policy and procedures, equity securities, including restricted equity securities, are generally valued at the last sale or official closing price on their primary market or exchange as provided by a third-party pricing service. Equity securities, for which there were no sales reported that day, are generally valued at the last quoted daily bid quotation on their primary market or exchange as provided by a third-party pricing service. Short-term instruments with a maturity at issuance of 60 days or less may be valued at amortized cost, which approximates market value. Open-end investment companies are generally valued at net asset value per share. The values of foreign securities and other assets and liabilities expressed in foreign currencies are converted to U.S. dollars using the mean of bid and asked prices for rates provided by a third-party pricing service.
Under the fund’s valuation policy and procedures, market quotations are not considered to be readily available for debt instruments, floating rate loans, and many types of derivatives. These investments are generally valued at fair value based on information from third-party pricing services or otherwise determined by the adviser in accordance with the adviser’s fair valuation policy and procedures. Securities and other assets generally valued on the basis of information from a third-party pricing service may also be valued at a broker/dealer bid quotation. In determining values, third-party pricing services can utilize both transaction data and market information such as yield, quality, coupon rate, maturity, type of issue, trading characteristics, spreads and other market data.
MFS Global Real Estate Portfolio
Notes to Financial Statements - continued
An investment may also be valued at fair value if the adviser determines that the investment’s value has been materially affected by events occurring after the close of the exchange or market on which the investment is principally traded (such as foreign exchange or market) and prior to the determination of the fund’s net asset value, or after the halt of trading of a specific security where trading does not resume prior to the close of the exchange or market on which the security is principally traded. Events that occur after foreign markets close (such as developments in foreign markets and significant movements in the U.S. markets) and prior to the determination of the fund’s net asset value may be deemed to have a material effect on the value of securities traded in foreign markets. Accordingly, the fund’s foreign equity securities may often be valued at fair value. The adviser generally relies on third-party pricing services or other information (such as the correlation with price movements of similar securities in the same or other markets; the type, cost and investment characteristics of the security; the business and financial condition of the issuer; and trading and other market data) to assist in determining whether to fair value and at what value to fair value an investment. The value of an investment for purposes of calculating the fund’s net asset value can differ depending on the source and method used to determine value. When fair valuation is used, the value of an investment used to determine the fund’s net asset value may differ from quoted or published prices for the same investment. There can be no assurance that the fund could obtain the fair value assigned to an investment if it were to sell the investment at the same time at which the fund determines its net asset value per share.
Various inputs are used in determining the value of the fund's assets or liabilities. These inputs are categorized into three broad levels. In certain cases, the inputs used to measure fair value may fall into different levels of the fair value hierarchy. In such cases, an investment's level within the fair value hierarchy is based on the lowest level of input that is significant to the fair value measurement. The fund's assessment of the significance of a particular input to the fair value measurement in its entirety requires judgment, and considers factors specific to the investment. Level 1 includes unadjusted quoted prices in active markets for identical assets or liabilities. Level 2 includes other significant observable market-based inputs (including quoted prices for similar securities, interest rates, prepayment speed, and credit risk). Level 3 includes significant unobservable inputs, which may include the adviser's own assumptions in determining the fair value of investments. The following is a summary of the levels used as of December 31, 2022 in valuing the fund's assets and liabilities:
| Financial Instruments | Level 1 | Level 2 | Level 3 | Total |
| Equity Securities: | | | | |
| United States | $88,591,013 | $— | $— | $88,591,013 |
| United Kingdom | 16,242,126 | — | — | 16,242,126 |
| Australia | 820,400 | 8,017,722 | — | 8,838,122 |
| Japan | 3,914,218 | 4,311,612 | — | 8,225,830 |
| Hong Kong | 2,874,152 | 4,695,546 | — | 7,569,698 |
| Singapore | 6,802,905 | — | — | 6,802,905 |
| Canada | 6,440,698 | — | — | 6,440,698 |
| Germany | 3,824,747 | — | — | 3,824,747 |
| Spain | — | 2,841,659 | — | 2,841,659 |
| Other Countries | 3,918,956 | 2,610,440 | — | 6,529,396 |
| Mutual Funds | 3,669,400 | — | — | 3,669,400 |
| Total | $137,098,615 | $22,476,979 | $— | $159,575,594 |
For further information regarding security characteristics, see the Portfolio of Investments.
Foreign Currency Translation — Purchases and sales of foreign investments, income, and expenses are converted into U.S. dollars based upon currency exchange rates prevailing on the respective dates of such transactions or on the reporting date for foreign denominated receivables and payables. Gains and losses attributable to foreign currency exchange rates on sales of securities are recorded for financial statement purposes as net realized gains and losses on investments. Gains and losses attributable to foreign exchange rate movements on receivables, payables, income and expenses are recorded for financial statement purposes as foreign currency transaction gains and losses. That portion of both realized and unrealized gains and losses on investments that results from fluctuations in foreign currency exchange rates is not separately disclosed.
Indemnifications — Under the fund's organizational documents, its officers and Trustees may be indemnified against certain liabilities and expenses arising out of the performance of their duties to the fund. Additionally, in the normal course of business, the fund enters into agreements with service providers that may contain indemnification clauses. The fund's maximum exposure under these agreements is unknown as this would involve future claims that may be made against the fund that have not yet occurred.
Investment Transactions and Income — Investment transactions are recorded on the trade date. Dividends received in cash are recorded on the ex-dividend date. Certain dividends from foreign securities will be recorded when the fund is informed of the dividend if such information is obtained subsequent to the ex-dividend date. Dividend payments received in additional securities are recorded on the ex-dividend date in an amount equal to the value of the security on such date. In determining the net gain or loss on securities sold, the cost of securities is determined on the identified cost basis. Distributions from REITs may be characterized as
MFS Global Real Estate Portfolio
Notes to Financial Statements - continued
ordinary income, net capital gain, or a return of capital to the fund. The proper characterization of REIT distributions is generally not known until after the end of each calendar year. As such, estimates are used in reporting the character of income and distributions for financial statement purposes. The fund receives substantial distributions from holdings in REITs.
The fund may receive proceeds from litigation settlements. Any proceeds received from litigation involving portfolio holdings are reflected in the Statement of Operations in realized gain/loss if the security has been disposed of by the fund or in unrealized gain/loss if the security is still held by the fund. Any other proceeds from litigation not related to portfolio holdings are reflected as other income in the Statement of Operations.
Tax Matters and Distributions — The fund intends to qualify as a regulated investment company, as defined under Subchapter M of the Internal Revenue Code, and to distribute all of its taxable income, including realized capital gains. As a result, no provision for federal income tax is required. The fund’s federal tax returns, when filed, will remain subject to examination by the Internal Revenue Service for a three year period. Management has analyzed the fund’s tax positions taken on federal and state tax returns for all open tax years and does not believe that there are any uncertain tax positions that require recognition of a tax liability. Foreign taxes, if any, have been accrued by the fund in the accompanying financial statements in accordance with the applicable foreign tax law. Foreign income taxes may be withheld by certain countries in which the fund invests. Additionally, capital gains realized by the fund on securities issued in or by certain foreign countries may be subject to capital gains tax imposed by those countries.
Distributions to shareholders are recorded on the ex-dividend date. Income and capital gain distributions are determined in accordance with income tax regulations, which may differ from U.S. generally accepted accounting principles. Certain capital accounts in the financial statements are periodically adjusted for permanent differences in order to reflect their tax character. These adjustments have no impact on net assets or net asset value per share. Temporary differences which arise from recognizing certain items of income, expense, gain or loss in different periods for financial statement and tax purposes will reverse at some time in the future.
Book/tax differences primarily relate to passive foreign investment companies and wash sale loss deferrals.
The tax character of distributions declared to shareholders for the last two fiscal years is as follows:
| | Year ended
12/31/22 | Year ended
12/31/21 |
| Ordinary income (including any short-term capital gains) | $4,454,179 | $2,751,003 |
| Long-term capital gains | 10,148,055 | — |
| Total distributions | $14,602,234 | $2,751,003 |
The federal tax cost and the tax basis components of distributable earnings were as follows:
| As of 12/31/22 | |
| Cost of investments | $148,500,090 |
| Gross appreciation | 26,624,723 |
| Gross depreciation | (15,549,219) |
| Net unrealized appreciation (depreciation) | $11,075,504 |
| Undistributed ordinary income | 1,158,123 |
| Undistributed long-term capital gain | 10,722,485 |
| Other temporary differences | (4,254) |
| Total distributable earnings (loss) | $22,951,858 |
Multiple Classes of Shares of Beneficial Interest — The fund offers multiple classes of shares, which differ in their respective distribution and/or service fees. The fund's income, realized and unrealized gain (loss), and common expenses are allocated to shareholders based on the daily net assets of each class. Dividends are declared separately for each class. Differences in per share dividend rates are generally due to differences in separate class expenses. The fund’s distributions declared to shareholders as reported in the Statements of Changes in Net Assets are presented by class as follows:
| | Year
ended
12/31/22 | | Year
ended
12/31/21 |
| Initial Class | $10,318,539 | | $2,105,622 |
| Service Class | 4,283,695 | | 645,381 |
| Total | $14,602,234 | | $2,751,003 |
MFS Global Real Estate Portfolio
Notes to Financial Statements - continued
(3) Transactions with Affiliates
Investment Adviser — The fund has an investment advisory agreement with MFS to provide overall investment management and related administrative services and facilities to the fund. The management fee is computed daily and paid monthly at the following annual rates based on the fund's average daily net assets:
| Up to $1 billion | 0.90% |
| In excess of $1 billion and up to $2.5 billion | 0.75% |
| In excess of $2.5 billion | 0.65% |
MFS has agreed in writing to reduce its management fee by a specified amount if certain MFS mutual fund assets exceed thresholds agreed to by MFS and the fund's Board of Trustees. Effective March 1, 2022, MFS has also agreed in writing to waive at least 0.01% of its management fee as part of this agreement. The agreement to waive at least 0.01% of the management fee will continue until modified by the fund's Board of Trustees, but such agreement will continue at least until April 30, 2024. For the year ended December 31, 2022, this management fee reduction amounted to $24,810, which is included in the reduction of total expenses in the Statement of Operations. The management fee incurred for the year ended December 31, 2022 was equivalent to an annual effective rate of 0.89% of the fund's average daily net assets.
The investment adviser has agreed in writing to pay a portion of the fund’s total annual operating expenses, excluding interest, taxes, extraordinary expenses, brokerage and transaction costs, certain tax reclaim recovery expenses (including contingency fees and closing agreement expenses), and investment-related expenses, such that total annual operating expenses do not exceed 0.92% of average daily net assets for the Initial Class shares and 1.17% of average daily net assets for the Service Class shares. This written agreement will continue until modified by the fund’s Board of Trustees, but such agreement will continue at least until April 30, 2024. For the year ended December 31, 2022, this reduction amounted to $140,885, which is included in the reduction of total expenses in the Statement of Operations.
Distributor — MFS Fund Distributors, Inc. (MFD), a wholly-owned subsidiary of MFS, is the distributor of shares of the fund. The Trustees have adopted a distribution plan for the Service Class shares pursuant to Rule 12b-1 under the Investment Company Act of 1940.
The fund's distribution plan provides that the fund will pay MFD distribution and/or service fees equal to 0.25% per annum of its average daily net assets attributable to Service Class shares as partial consideration for services performed and expenses incurred by MFD and financial intermediaries (including participating insurance companies that invest in the fund to fund variable annuity and variable life insurance contracts, sponsors of qualified retirement and pension plans that invest in the fund, and affiliates of these participating insurance companies and plan sponsors) in connection with the sale and distribution of the Service Class shares. MFD may subsequently pay all, or a portion, of the distribution and/or service fees to financial intermediaries.
Shareholder Servicing Agent — MFS Service Center, Inc. (MFSC), a wholly-owned subsidiary of MFS, receives a fee from the fund for its services as shareholder servicing agent. For the year ended December 31, 2022, the fee was $11,463, which equated to 0.0064% annually of the fund's average daily net assets. MFSC also receives reimbursement from the fund for out-of-pocket expenses paid by MFSC on behalf of the fund. For the year ended December 31, 2022, these costs amounted to $822.
Administrator — MFS provides certain financial, legal, shareholder communications, compliance, and other administrative services to the fund. Under an administrative services agreement, the fund reimburses MFS the costs incurred to provide these services. The fund is charged an annual fixed amount of $17,500 plus a fee based on average daily net assets. The administrative services fee incurred for the year ended December 31, 2022 was equivalent to an annual effective rate of 0.0209% of the fund's average daily net assets.
Trustees’ and Officers’ Compensation — The fund pays compensation to independent Trustees in the form of a retainer, attendance fees, and additional compensation to Board and Committee chairpersons. The fund does not pay compensation directly to Trustees or officers of the fund who are also officers of the investment adviser, all of whom receive remuneration from MFS for their services to the fund. Certain officers and Trustees of the fund are officers or directors of MFS, MFD, and MFSC.
Other — The fund invests in the MFS Institutional Money Market Portfolio which is managed by MFS and seeks current income consistent with preservation of capital and liquidity. This money market fund does not pay a management fee to MFS but does incur investment and operating costs.
The adviser has voluntarily undertaken to reimburse the fund from its own resources on a quarterly basis for the cost of investment research embedded in the cost of the fund’s securities trades. This agreement may be rescinded at any time. For the year ended December 31, 2022, this reimbursement amounted to $8,148, which is included in “Other” income in the Statement of Operations.
MFS Global Real Estate Portfolio
Notes to Financial Statements - continued
(4) Portfolio Securities
For the year ended December 31, 2022, purchases and sales of investments, other than short-term obligations, aggregated $58,812,912 and $56,836,884, respectively.
(5) Shares of Beneficial Interest
The fund's Declaration of Trust permits the Trustees to issue an unlimited number of full and fractional shares of beneficial interest. Transactions in fund shares were as follows:
| | Year ended
12/31/22 | | Year ended
12/31/21 |
| | Shares | Amount | | Shares | Amount |
| Shares sold | | | | | |
| Initial Class | 1,145,505 | $17,068,075 | | 1,366,223 | $22,749,533 |
| Service Class | 889,626 | 16,159,669 | | 530,725 | 11,017,801 |
| | 2,035,131 | $33,227,744 | | 1,896,948 | $33,767,334 |
Shares issued to shareholders
in reinvestment of distributions | | | | | |
| Initial Class | 734,939 | $10,318,539 | | 118,161 | $2,105,622 |
| Service Class | 254,074 | 4,283,695 | | 30,630 | 645,381 |
| | 989,013 | $14,602,234 | | 148,791 | $2,751,003 |
| Shares reacquired | | | | | |
| Initial Class | (1,480,461) | $(23,560,753) | | (2,204,570) | $(37,592,076) |
| Service Class | (599,069) | (11,115,800) | | (791,441) | (16,071,841) |
| | (2,079,530) | $(34,676,553) | | (2,996,011) | $(53,663,917) |
| Net change | | | | | |
| Initial Class | 399,983 | $3,825,861 | | (720,186) | $(12,736,921) |
| Service Class | 544,631 | 9,327,564 | | (230,086) | (4,408,659) |
| | 944,614 | $13,153,425 | | (950,272) | $(17,145,580) |
The fund is one of several mutual funds in which certain MFS funds may invest. The MFS funds do not invest in the underlying funds for the purpose of exercising management or control. At the end of the period, the MFS Moderate Allocation Portfolio, the MFS Growth Allocation Portfolio, and the MFS Conservative Allocation Portfolio were the owners of record of approximately 19%, 8%, and 4%, respectively, of the value of outstanding voting shares of the fund.
(6) Line of Credit
The fund and certain other funds managed by MFS participate in a $1.45 billion unsecured committed line of credit of which $1.2 billion is reserved for use by the fund and certain other MFS U.S. funds. The line of credit is provided by a syndicate of banks under a credit agreement. Borrowings may be made for temporary financing needs. Interest is charged to each fund, based on its borrowings, generally at a rate equal to the highest of 1) Daily Simple SOFR (Secured Overnight Financing Rate) plus 0.10%, 2) the Federal Funds Effective Rate, or 3) the Overnight Bank Funding Rate, each plus an agreed upon spread. A commitment fee, based on the average daily unused portion of the committed line of credit, is allocated among the participating funds. The line of credit expires on March 16, 2023 unless extended or renewed. In addition, the fund and other funds managed by MFS have established unsecured uncommitted borrowing arrangements with certain banks for temporary financing needs. Interest is charged to each fund, based on its borrowings, at rates equal to customary reference rates plus an agreed upon spread. For the year ended December 31, 2022, the fund’s commitment fee and interest expense were $869 and $0, respectively, and are included in “Miscellaneous” expense in the Statement of Operations.
(7) Investments in Affiliated Issuers
An affiliated issuer may be considered one in which the fund owns 5% or more of the outstanding voting securities, or a company which is under common control. For the purposes of this report, the following were affiliated issuers:
MFS Global Real Estate Portfolio
Notes to Financial Statements - continued
| Affiliated Issuers | Beginning
Value | Purchases | Sales
Proceeds | Realized
Gain
(Loss) | Change in
Unrealized
Appreciation or
Depreciation | Ending
Value |
| MFS Institutional Money Market Portfolio | $4,160,356 | $47,328,976 | $47,820,682 | $(48) | $798 | $3,669,400 |
| Affiliated Issuers | Dividend
Income | Capital Gain
Distributions |
| MFS Institutional Money Market Portfolio | $56,366 | $— |
(8) LIBOR Transition
Certain of the fund's investments, including investments in certain debt instruments and derivatives (if any), as well as borrowings by the fund and certain other contractual arrangements of the fund, may be based on the London Interbank Offered Rate (“LIBOR”). In 2017, the regulatory authority that oversees financial services firms in the United Kingdom announced plans to transition away from LIBOR by the end of 2021. In March 2021, the administrator of LIBOR announced the extension of the publication of the more commonly used U.S. dollar LIBOR settings to the end of June 2023. Although the full impacts of the transition away from LIBOR are not fully known, the transition may result in, among other things, an increase in volatility or illiquidity of the markets for instruments that currently rely on LIBOR to determine interest rates and this could have an adverse impact on the fund's performance. With respect to the fund's accounting for investments, including investments in certain debt instruments and derivatives, as well as borrowings by the fund and any other contractual arrangements of the fund that undergo reference rate-related modifications as a result of the transition, management will rely upon the relief provided by FASB Codification Topic 848 – Reference Rate Reform (Topic 848). The guidance in Topic 848 permits the fund to account for those modified contracts as a continuation of the existing contracts. Management is still evaluating the impact to the fund of the June 30, 2023 planned discontinuation of the more commonly used U.S. dollar LIBOR settings.
(9) Russia and Ukraine Conflict
The market disruptions, which began in late February 2022, associated with geopolitical events related to the conflict between Russia and Ukraine may adversely affect the value of the fund’s assets and thus the fund’s performance. Management continues to monitor these events and to evaluate the related impacts, if any, to the fund.
MFS Global Real Estate Portfolio
Report of Independent Registered Public Accounting Firm
To the Board of Trustees of MFS Variable Insurance Trust III and the Shareholders of MFS Global Real Estate Portfolio:
Opinion on the Financial Statements and Financial Highlights
We have audited the accompanying statement of assets and liabilities of MFS Global Real Estate Portfolio (the “Fund”), including the portfolio of investments, as of December 31, 2022, the related statement of operations for the year then ended, the statements of changes in net assets for each of the two years in the period then ended, the financial highlights for each of the five years in the period then ended, and the related notes. In our opinion, the financial statements and financial highlights present fairly, in all material respects, the financial position of the Fund as of December 31, 2022, and the results of its operations for the year then ended, the changes in its net assets for each of the two years in the period then ended, and the financial highlights for each of the five years in the period then ended, in conformity with accounting principles generally accepted in the United States of America.
Basis for Opinion
These financial statements and financial highlights are the responsibility of the Fund's management. Our responsibility is to express an opinion on the Fund's financial statements and financial highlights based on our audits. We are a public accounting firm registered with the Public Company Accounting Oversight Board (United States) (PCAOB) and are required to be independent with respect to the Fund in accordance with the U.S. federal securities laws and the applicable rules and regulations of the Securities and Exchange Commission and the PCAOB.
We conducted our audits in accordance with the standards of the PCAOB. Those standards require that we plan and perform the audit to obtain reasonable assurance about whether the financial statements and financial highlights are free of material misstatement, whether due to error or fraud. The Fund is not required to have, nor were we engaged to perform, an audit of its internal control over financial reporting. As part of our audits, we are required to obtain an understanding of internal control over financial reporting but not for the purpose of expressing an opinion on the effectiveness of the Fund's internal control over financial reporting. Accordingly, we express no such opinion.
Our audits included performing procedures to assess the risks of material misstatement of the financial statements and financial highlights, whether due to error or fraud, and performing procedures that respond to those risks. Such procedures included examining, on a test basis, evidence regarding the amounts and disclosures in the financial statements and financial highlights. Our audits also included evaluating the accounting principles used and significant estimates made by management, as well as evaluating the overall presentation of the financial statements and financial highlights. Our procedures included confirmation of securities owned as of December 31, 2022, by correspondence with the custodian. We believe that our audits provide a reasonable basis for our opinion.
DELOITTE & TOUCHE LLP
Boston, Massachusetts
February 15, 2023
We have served as the auditor of one or more of the MFS investment companies since 1924.
MFS Global Real Estate Portfolio
Trustees and Officers — Identification and Background
The Trustees and Officers of the Trust, as of February 1, 2023, are listed below, together with their principal occupations during the past five years. (Their titles may have varied during that period.) The address of each Trustee and Officer is 111 Huntington Avenue, Boston, Massachusetts 02199-7618.
| Name, Age | | Position(s) Held with Fund | | Trustee/Officer Since(h) | | Number of MFS Funds overseen by the Trustee | | Principal Occupations During
the Past Five Years | | Other Directorships During
the Past Five Years (j) |
| INTERESTED TRUSTEE | | | | | | | | | | |
Michael W. Roberge (k)
(age 56) | | Trustee | | January 2021 | | 136 | | Massachusetts Financial Services Company, Chairman (since January 2021); Chief Executive Officer (since January 2017); Director; Chairman of the Board (since January 2022); President (until December 2018); Chief Investment Officer (until December 2018) | | N/A |
| INDEPENDENT TRUSTEES | | | | | | | | | | |
John P. Kavanaugh
(age 68) | | Trustee and Chair of Trustees | | January 2009 | | 136 | | Private investor | | N/A |
Steven E. Buller
(age 71) | | Trustee | | February 2014 | | 136 | | Private investor | | N/A |
John A. Caroselli
(age 68) | | Trustee | | March 2017 | | 136 | | Private investor; JC Global Advisors, LLC (management consulting), President (since 2015) | | N/A |
Maureen R. Goldfarb
(age 67) | | Trustee | | January 2009 | | 136 | | Private investor | | N/A |
Peter D. Jones
(age 67) | | Trustee | | January 2019 | | 136 | | Private investor | | N/A |
James W. Kilman, Jr.
(age 61) | | Trustee | | January 2019 | | 136 | | Burford Capital Limited (finance and investment management), Senior Advisor (since May 3, 2021), Chief Financial Officer (2019 - May 2, 2021); KielStrand Capital LLC (family office), Chief Executive Officer (since 2016) | | Alpha-En Corporation, Director (2016-2019) |
Clarence Otis, Jr.
(age 66) | | Trustee | | March 2017 | | 136 | | Private investor | | VF Corporation, Director; Verizon Communications, Inc., Director; The Travelers Companies, Director |
Maryanne L. Roepke
(age 66) | | Trustee | | May 2014 | | 136 | | Private investor | | N/A |
Laurie J. Thomsen
(age 65) | | Trustee | | March 2005 | | 136 | | Private investor | | The Travelers Companies, Director; Dycom Industries, Inc., Director |
MFS Global Real Estate Portfolio
Trustees and Officers - continued
| Name, Age | | Position(s) Held with
Fund | | Trustee/Officer Since(h) | | Number of MFS Funds for which the Person is an Officer | | Principal Occupations During
the Past Five Years |
| OFFICERS | | | | | | | | |
Christopher R. Bohane (k)
(age 49) | | Assistant Secretary and Assistant Clerk | | July 2005 | | 136 | | Massachusetts Financial Services Company, Senior Vice President and Senior Managing Counsel |
Kino Clark (k)
(age 54) | | Assistant Treasurer | | January 2012 | | 136 | | Massachusetts Financial Services Company, Vice President |
John W. Clark, Jr. (k)
(age 55) | | Assistant Treasurer | | April 2017 | | 136 | | Massachusetts Financial Services Company, Vice President |
David L. DiLorenzo (k)
(age 54) | | President | | July 2005 | | 136 | | Massachusetts Financial Services Company, Senior Vice President |
Heidi W. Hardin (k)
(age 55) | | Secretary and Clerk | | April 2017 | | 136 | | Massachusetts Financial Services Company, Executive Vice President and General Counsel |
Brian E. Langenfeld (k)
(age 49) | | Assistant Secretary and Assistant Clerk | | June 2006 | | 136 | | Massachusetts Financial Services Company, Vice President and Managing Counsel |
Rosa E. Licea-Mailloux (k)
(age 46) | | Chief Compliance Officer | | March 2022 | | 136 | | Massachusetts Financial Services Company, Vice President (since 2018); Director of Corporate Compliance (2018-2021), Senior Director Compliance (2021-2022), Senior Managing Director of North American Compliance & Chief Compliance Officer (since March 2022); Natixis Investment Managers (investment management), Funds Chief Compliance Officer, Deputy General Counsel & Senior Vice President (until 2018) |
Amanda S. Mooradian (k)
(age 43) | | Assistant Secretary and Assistant Clerk | | September 2018 | | 136 | | Massachusetts Financial Services Company, Assistant Vice President and Senior Counsel |
Susan A. Pereira (k)
(age 52) | | Assistant Secretary and Assistant Clerk | | July 2005 | | 136 | | Massachusetts Financial Services Company, Vice President and Managing Counsel |
Kasey L. Phillips (k)
(age 52) | | Assistant Treasurer | | September 2012 | | 136 | | Massachusetts Financial Services Company, Vice President |
Matthew A. Stowe (k)
(age 48) | | Assistant Secretary and Assistant Clerk | | October 2014 | | 136 | | Massachusetts Financial Services Company, Vice President and Senior Managing Counsel |
William B. Wilson (k)
(age 40) | | Assistant Secretary and Assistant Clerk | | October 2022 | | 136 | | Massachusetts Financial Services Company, Assistant Vice President and Counsel |
James O. Yost (k)
(age 62) | | Treasurer | | September 1990 | | 136 | | Massachusetts Financial Services Company, Senior Vice President |
| (h) | Date first appointed to serve as Trustee/Officer of an MFS Fund. Each Trustee has served continuously since appointment unless indicated otherwise. From January 2012 through December 2016, Messrs. DiLorenzo and Yost served as Treasurer and Deputy Treasurer of the Funds, respectively. |
| (j) | Directorships or trusteeships of companies required to report to the Securities and Exchange Commission (i.e., “public companies”). |
| (k) | “Interested person” of the Trust within the meaning of the Investment Company Act of 1940 (referred to as the 1940 Act), which is the principal federal law governing investment companies like the fund, as a result of a position with MFS. The address of MFS is 111 Huntington Avenue, Boston, Massachusetts 02199-7618. |
Each Trustee (other than Messrs. Jones, Kilman and Roberge) has been elected by shareholders and each Trustee and Officer holds office until his or her successor is chosen and qualified or until his or her earlier death, resignation, retirement or removal. Mr. Roberge became a Trustee of the Funds on January 1, 2021 and Messrs. Jones and Kilman became Trustees of the Funds on January 1, 2019. The Trust does not hold annual meetings for the purpose of electing Trustees, and Trustees are not elected for fixed terms. Under the terms of the Board's retirement policy, an Independent Trustee shall retire at the end of the calendar year in which he or she reaches the earlier of 75 years of age or 15 years of service on the Board (or, in the case of any Independent Trustee who joined the Board prior to 2015, 20 years of service on the Board).
MFS Global Real Estate Portfolio
Trustees and Officers - continued
Messrs. Buller, Kilman and Otis and Ms. Roepke are members of the Trust’s Audit Committee.
Each of the Interested Trustees and certain Officers hold comparable officer positions with certain affiliates of MFS.
The Statement of Additional Information for a Fund includes further information about the Trustees and is available without charge upon request by calling 1-800-225-2606.
| Investment Adviser | Custodian |
Massachusetts Financial Services Company
111 Huntington Avenue
Boston, MA 02199-7618 | State Street Bank and Trust Company
1 Lincoln Street
Boston, MA 02111-2900 |
| Distributor | Independent Registered Public Accounting Firm |
MFS Fund Distributors, Inc.
111 Huntington Avenue
Boston, MA 02199-7618 | Deloitte & Touche LLP
200 Berkeley Street
Boston, MA 02116 |
| Portfolio Manager(s) | |
Rick Gable
Mark Syn | |
MFS Global Real Estate Portfolio
Board Review of Investment Advisory Agreement
MFS Global Real Estate Portfolio
The Investment Company Act of 1940 requires that both the full Board of Trustees and a majority of the non-interested (“independent”) Trustees, voting separately, annually approve the continuation of the Fund’s investment advisory agreement with MFS. The Trustees consider matters bearing on the Fund and its advisory arrangements at their meetings throughout the year, including a review of performance data at each regular meeting. In addition, the independent Trustees met several times over the course of three months beginning in May and ending in July, 2022 (“contract review meetings”) for the specific purpose of considering whether to approve the continuation of the investment advisory agreement for the Fund and the other investment companies that the Board oversees (the “MFS Funds”). The independent Trustees were assisted in their evaluation of the Fund’s investment advisory agreement by independent legal counsel, from whom they received separate legal advice and with whom they met separately from MFS during various contract review meetings. The independent Trustees were also assisted in this process by an independent consultant who was retained by and reported to the independent Trustees.
In connection with their deliberations regarding the continuation of the investment advisory agreement, the Trustees, including the independent Trustees, considered such information and factors as they believed, in light of the legal advice furnished to them and their own business judgment, to be relevant. The investment advisory agreement for the Fund was considered separately, although the Trustees also took into account the common interests of all MFS Funds in their review. As described below, the Trustees considered the nature, quality, and extent of the various investment advisory, administrative, and shareholder services performed by MFS under the existing investment advisory agreement and other arrangements with the Fund.
In connection with their contract review meetings, the Trustees received and relied upon materials that included, among other items: (i) information provided by Broadridge Financial Solutions, Inc. (“Broadridge”), an independent third party, on the investment performance of the Fund for various time periods ended December 31, 2021 and the investment performance of a group of funds with substantially similar investment classifications/objectives (the “Broadridge performance universe”), (ii) information provided by Broadridge on the Fund’s advisory fees and other expenses and the advisory fees and other expenses of comparable funds identified by Broadridge as well as all other funds in the same investment classification/category (the “Broadridge expense group and universe”), (iii) information provided by MFS on the advisory fees of portfolios of other clients of MFS, including institutional separate accounts and other clients, (iv) information as to whether and to what extent applicable expense waivers, reimbursements or fee “breakpoints” are observed for the Fund, (v) information regarding MFS’ financial results and financial condition, including MFS’ and certain of its affiliates’ estimated profitability from services performed for the Fund and the MFS Funds as a whole, and compared to MFS’ institutional business, (vi) MFS’ views regarding the outlook for the mutual fund industry and the strategic business plans of MFS, (vii) descriptions of various functions performed by MFS for the Funds, such as compliance monitoring and portfolio trading practices, and (viii) information regarding the overall organization of MFS, including information about MFS’ senior management and other personnel providing investment advisory, administrative and other services to the Fund and the other MFS Funds. The comparative performance, fee and expense information prepared and provided by Broadridge was not independently verified and the independent Trustees did not independently verify any information provided to them by MFS.
The Trustees’ conclusion as to the continuation of the investment advisory agreement was based on a comprehensive consideration of all information provided to the Trustees and not the result of any single factor. Some of the factors that figured particularly in the Trustees’ deliberations are described below, although individual Trustees may have evaluated the information presented differently from one another, giving different weights to various factors. It is also important to recognize that the fee arrangements for the Fund and other MFS Funds are the result of years of review and discussion between the independent Trustees and MFS, that certain aspects of such arrangements may receive greater scrutiny in some years than in others, and that the Trustees’ conclusions may be based, in part, on their consideration of these same arrangements during the course of the year and in prior years.
Based on information provided by Broadridge and MFS, the Trustees reviewed the Fund’s total return investment performance as well as the Broadridge performance universe over various time periods. The Trustees placed particular emphasis on the total return performance of the Fund’s Initial Class shares in comparison to the performance of funds in its Broadridge performance universe over the five-year period ended December 31, 2021, which the Trustees believed was a long enough period to reflect differing market conditions. The total return performance of the Fund’s Initial Class shares was in the 1st quintile relative to the other funds in the universe for this five-year period (the 1st quintile being the best performers and the 5th quintile being the worst performers). The total return performance of the Fund’s Initial Class shares was in the 2nd quintile for the one-year period and in the 1st quintile for the three-year period ended December 31, 2021 relative to the Broadridge performance universe. Because of the passage of time, these performance results may differ from the performance results for more recent periods, including those shown elsewhere in this report.
MFS Global Real Estate Portfolio
Board Review of Investment Advisory Agreement - continued
In the course of their deliberations, the Trustees took into account information provided by MFS in connection with the contract review meetings, as well as during investment review meetings conducted with portfolio management personnel during the course of the year regarding the Fund’s performance. After reviewing these and related factors, the Trustees concluded, within the context of their overall conclusions regarding the investment advisory agreement, that they were satisfied with MFS’ responses and efforts relating to investment performance.
In assessing the reasonableness of the Fund’s advisory fee, the Trustees considered, among other information, the Fund’s advisory fee and the total expense ratio of the Fund’s Initial Class shares as a percentage of average daily net assets and the advisory fee and total expense ratios of the Broadridge expense group based on information provided by Broadridge. The Trustees considered that MFS currently observes an expense limitation for the Fund, which may not be changed without the Trustees’ approval. The Trustees also considered that, according to the data provided by Broadridge (which takes into account any fee reductions or expense limitations that were in effect during the Fund’s last fiscal year), the Fund’s effective advisory fee rate and total expense ratio were each higher than the Broadridge expense group median.
The Trustees also considered the advisory fees charged by MFS to any institutional separate accounts advised by MFS (“separate accounts”) and unaffiliated investment companies for which MFS serves as subadviser (“subadvised funds”) that have comparable investment strategies to the Fund, if any. In comparing these fees, the Trustees considered information provided by MFS as to the generally broader scope of services provided by MFS to the Fund, as well as the more extensive regulatory burdens imposed on MFS in managing the Fund, in comparison to separate accounts and subadvised funds. The Trustees also considered the higher demands placed on MFS’ investment personnel and trading infrastructure as a result of the daily cash in-flows and out-flows of the Fund in comparison to separate accounts.
The Trustees also considered whether the Fund may benefit from any economies of scale in the management of the Fund in the event of growth in assets of the Fund and/or growth in assets of the MFS Funds as a whole. They noted that the Fund’s advisory fee rate schedule is subject to contractual breakpoints that reduce the Fund’s advisory fee rate on average daily net assets over $1 billion and $2.5 billion. The Trustees also noted that MFS has agreed in writing to waive a portion of the management fees of certain MFS Funds, including the Fund, if the total combined assets of certain funds within the MFS Funds’ complex increase above agreed upon thresholds (the “group fee waiver”), enabling the Fund’s shareholders to share in the benefits from any economies of scale at the complex level. The group fee waiver is reviewed and renewed annually between the Board and MFS. The Trustees concluded that the breakpoints and the group fee waiver were sufficient to allow the Fund to benefit from economies of scale as its assets and overall complex assets grow.
The Trustees also considered information prepared by MFS relating to MFS’ costs and profits with respect to the Fund, the MFS Funds considered as a group, and other investment companies and accounts advised by MFS, as well as MFS’ methodologies used to determine and allocate its costs to the MFS Funds, the Fund and other accounts and products for purposes of estimating profitability.
After reviewing these and other factors described herein, the Trustees concluded, within the context of their overall conclusions regarding the investment advisory agreement, that the advisory fees charged to the Fund represent reasonable compensation in light of the services being provided by MFS to the Fund.
In addition, the Trustees considered MFS’ resources and related efforts to continue to retain, attract and motivate capable personnel to serve the Fund. The Trustees also considered current and developing conditions in the financial services industry, including the presence of large and well-capitalized companies which are spending, and appear to be prepared to continue to spend, substantial sums to engage personnel and to provide services to competing investment companies. In this regard, the Trustees also considered the financial resources of MFS and its ultimate parent, Sun Life Financial Inc. The Trustees also considered the advantages and possible disadvantages to the Fund of having an adviser that also serves other investment companies as well as other accounts.
The Trustees also considered the nature, quality, cost, and extent of administrative, transfer agency, and distribution services provided to the Fund by MFS and its affiliates under agreements and plans other than the investment advisory agreement, including any 12b-1 fees the Fund pays to MFS Fund Distributors, Inc., an affiliate of MFS. The Trustees also considered the nature, extent and quality of certain other services MFS performs or arranges for on the Fund’s behalf, which may include securities lending programs, directed expense payment programs, class action recovery programs, and MFS’ interaction with third-party service providers, principally custodians and sub-custodians. The Trustees concluded that the various non-advisory services provided by MFS and its affiliates on behalf of the Fund were satisfactory.
The Trustees considered so-called “fall-out benefits” to MFS such as reputational value derived from serving as investment manager to the MFS Funds. The Trustees also considered that MFS discontinued its historic practice of obtaining investment research from portfolio brokerage commissions paid by certain MFS Funds effective January 2018, and directly pays or voluntarily reimburses a Fund, if applicable, for the costs of external research acquired through the use of the Fund’s portfolio brokerage commissions.
MFS Global Real Estate Portfolio
Board Review of Investment Advisory Agreement - continued
Based on their evaluation of factors that they deemed to be material, including those factors described above, the Board of Trustees, including the independent Trustees, concluded that the Fund’s investment advisory agreement with MFS should be continued for an additional one-year period, commencing August 1, 2022.
MFS Global Real Estate Portfolio
Proxy Voting Policies and Information
MFS votes proxies on behalf of the fund pursuant to proxy voting policies and procedures that are available without charge, upon request, by calling 1-800-225-2606, by visiting mfs.com/proxyvoting, or by visiting the SEC’s Web site at http://www.sec.gov.
Information regarding how the fund voted proxies relating to portfolio securities during the most recent twelve-month period ended June 30 is available by August 31 of each year without charge by visiting mfs.com/proxyvoting, or by visiting the SEC’s Web site at http://www.sec.gov.
Quarterly Portfolio Disclosure
The fund files a complete schedule of portfolio holdings with the SEC for the first and third quarters of each fiscal year as an exhibit to its reports on Form N-PORT. The fund’s Form N-PORT reports are available on the SEC’s Web site at http://www.sec.gov. A shareholder can obtain the portfolio holdings report for the first and third quarters of the fund's fiscal year at mfs.com/vit3 by choosing the fund's name and then scrolling to the “Resources” section and clicking on the “Prospectus and Reports” tab.
FURTHER INFORMATION
From time to time, MFS may post important information about the fund or the MFS Funds on the MFS Web site (mfs.com). This information is available at https://www.mfs.com/announcements or at mfs.com/vit3 by choosing the fund's name and then scrolling to the “Resources” section and clicking on the “Announcements” tab, if any.
Information About Fund Contracts and Legal Claims
The fund has entered into contractual arrangements with an investment adviser, administrator, distributor, shareholder servicing agent, and custodian who each provide services to the fund. Unless expressly stated otherwise, shareholders are not parties to, or intended beneficiaries of these contractual arrangements, and these contractual arrangements are not intended to create any shareholder right to enforce them against the service providers or to seek any remedy under them against the service providers, either directly or on behalf of the fund.
Under the Trust’s By-Laws and Declaration of Trust, any claims asserted against or on behalf of the MFS Funds, including claims against Trustees and Officers, must be brought in state and federal courts located within the Commonwealth of Massachusetts.
Federal Tax Information (unaudited)
The following information is provided pursuant to provisions of the Internal Revenue Code.
The fund designates $11,163,000 as capital gain dividends paid during the fiscal year.
| FACTS | WHAT DOES MFS DO WITH YOUR PERSONAL INFORMATION? |
| Why? | Financial companies choose how they share your personal information. Federal law gives consumers the right to limit some but not all sharing. Federal law also requires us to tell you how we collect, share, and protect your personal information. Please read this notice carefully to understand what we do. |
| What? | The types of personal information we collect and share depend on the product or service you have with us. This information can include: |
| • Social Security number and account balances |
| • Account transactions and transaction history |
| • Checking account information and wire transfer instructions |
| When you are no longer our customer, we continue to share your information as described in this notice. |
| How? | All financial companies need to share customers' personal information to run their everyday business. In the section below, we list the reasons financial companies can share their customers' personal information; the reasons MFS chooses to share; and whether you can limit this sharing. |
Reasons we can share your
personal information | Does MFS share? | Can you limit
this sharing? |
For our everyday business purposes –
such as to process your transactions, maintain your
account(s), respond to court orders and legal
investigations, or report to credit bureaus | Yes | No |
For our marketing purposes –
to offer our products and services to you | No | We don't share |
For joint marketing with other
financial companies | No | We don't share |
For our affiliates' everyday business purposes –
information about your transactions and experiences | No | We don't share |
For our affiliates' everyday business purposes –
information about your creditworthiness | No | We don't share |
| For nonaffiliates to market to you | No | We don't share |
| Questions? | Call 800-225-2606 or go to mfs.com. |
| Who we are |
| Who is providing this notice? | MFS Funds, MFS Investment Management, MFS Institutional Advisors, Inc., and MFS Heritage Trust Company. |
| What we do |
How does MFS
protect my personal
information? | To protect your personal information from unauthorized access and use, we use security measures that comply with federal law. These measures include procedural, electronic, and physical safeguards for the protection of the personal information we collect about you. |
How does MFS
collect my personal
information? | We collect your personal information, for example, when you |
| • open an account or provide account information |
| • direct us to buy securities or direct us to sell your securities |
| • make a wire transfer |
| We also collect your personal information from others, such as credit bureaus, affiliates, or other companies. |
| Why can't I limit all sharing? | Federal law gives you the right to limit only |
| • sharing for affiliates' everyday business purposes – information about your creditworthiness |
| • affiliates from using your information to market to you |
| • sharing for nonaffiliates to market to you |
| State laws and individual companies may give you additional rights to limit sharing. |
| Definitions |
| Affiliates | Companies related by common ownership or control. They can be financial and nonfinancial companies. |
| • MFS does not share personal information with affiliates, except for everyday business purposes as described on page one of this notice. |
| Nonaffiliates | Companies not related by common ownership or control. They can be financial and nonfinancial companies. |
| • MFS does not share with nonaffiliates so they can market to you. |
| Joint marketing | A formal agreement between nonaffiliated financial companies that together market financial products or services to you. |
| • MFS doesn't jointly market. |
| Other important information |
| If you own an MFS product or receive an MFS service in the name of a third party such as a bank or broker-dealer, their privacy policy may apply to you instead of ours. |
Annual Report
December 31, 2022
MFS® Growth Allocation Portfolio
MFS® Variable Insurance Trust III
MFS® Growth Allocation Portfolio
| 1 |
| 2 |
| 3 |
| 5 |
| 7 |
| 8 |
| 9 |
| 10 |
| 11 |
| 12 |
| 14 |
| 21 |
| 22 |
| 25 |
| 27 |
| 27 |
| 27 |
| 27 |
| 27 |
| 28 |
The report is prepared for the general information of shareholders. It is authorized for distribution to prospective investors only when preceded or accompanied by a current prospectus.
NOT FDIC INSURED • MAY LOSE VALUE • NO BANK OR CREDIT UNION GUARANTEE •
NOT A DEPOSIT • NOT INSURED BY ANY FEDERAL GOVERNMENT AGENCY OR NCUA/NCUSIF
MFS Growth Allocation Portfolio
LETTER FROM THE CHAIR AND CEO
Dear Shareholders:
Signs of peaking inflation, hopes that monetary policy tightening cycles may be nearing an end and a rapid reopening of China’s economy in late-2022 and early-2023 have combined to bolster investor sentiment in recent months. Markets have largely adjusted to the challenges posed by Russia’s invasion of Ukraine, thanks in part to mild European winter weather which has alleviated concerns over potential shortages of natural gas. Resilient labor markets in much of the developed world have further contributed to a brighter-than-expected economic backdrop. However, many investors are mindful that the lagged effects of ongoing policy tightening have yet to work their way through the global economy.
Tighter global financial conditions have been a particular headwind for richly valued growth equities and interest rate-sensitive parts of the economy, such as housing. Over the near term, companies may face a challenging earnings backdrop as they are forced to absorb higher input and labor costs at a time of dwindling pricing power. For fixed income, the rise in interest rates has made bonds more attractive than they have been in years, which may provide balance to an overall portfolio.
During times of market transition, it is important to have a deep understanding of company fundamentals, and we have built our unique global research platform to do just that.
At MFS®, we put our clients’ assets to work responsibly by carefully navigating increasingly complex global capital markets. Our investment team is guided by a commitment to long-term fundamental investing. Our global investment platform — combining collective expertise, long-term discipline, and thoughtful risk management — seeks to uncover what we believe are the best, most durable investment ideas in markets around the world, enabling us to potentially create value for investors.
Respectfully,
Michael W. Roberge
Chair and Chief Executive Officer
MFS Investment Management
February 15, 2023
The opinions expressed in this letter are subject to change and may not be relied upon for investment advice. No forecasts can be guaranteed.
MFS Growth Allocation Portfolio
Portfolio target allocation
Portfolio actual allocation
Portfolio holdings
| MFS Value Series | 11.1% |
| MFS Growth Series | 10.5% |
| MFS Research Series | 10.0% |
| MFS Research International Portfolio | 9.2% |
| MFS Mid Cap Value Portfolio | 9.1% |
| MFS Mid Cap Growth Series | 9.0% |
| MFS International Growth Portfolio | 5.1% |
| MFS International Intrinsic Value Portfolio | 5.1% |
| MFS Inflation-Adjusted Bond Portfolio | 5.0% |
| MFS High Yield Portfolio | 5.0% |
| MFS Total Return Bond Series | 4.9% |
| MFS Global Real Estate Portfolio | 4.9% |
| MFS Global Governments Portfolio | 4.0% |
| MFS New Discovery Value Portfolio | 2.0% |
| MFS New Discovery Series | 2.0% |
| MFS Limited Maturity Portfolio | 2.0% |
| MFS Emerging Markets Equity Portfolio | 1.0% |
| Cash & Cash Equivalents | 0.1% |
Cash & Cash Equivalents includes any cash, investments in money market funds, short-term securities, and other assets less liabilities. MFS endeavors to fully invest all MFS funds-of-funds in underlying funds on a daily basis. Any divergence from 0.0% in Cash & Cash Equivalents is typically due to the timing of fund subscriptions/redemptions and the settlement of subsequent investment in/divestment from the underlying funds. While the MFS funds-of-funds' subscriptions/redemptions are processed at the same day NAV of the underlying funds, a positive/negative cash balance will be reflected on the MFS funds-of-funds' Statements of Assets and Liabilities until the trades with the underlying funds settle, which is typically two business days. Please see the fund's Statement of Assets and Liabilities for additional information related to the fund’s cash position and other assets and liabilities.
Percentages are based on net assets as of December 31, 2022.
The portfolio is actively managed and current holdings may be different.
MFS Growth Allocation Portfolio
Management Review
Summary of Results
For the twelve months ended December 31, 2022, Initial Class shares of the MFS Growth Allocation Portfolio (fund) provided a total return of -18.27%, while Service Class shares of the fund provided a total return of -18.50%. These compare with a return of -18.11% for the fund’s benchmark, the Standard & Poor's 500 Stock Index (S&P 500 Index). The fund's other benchmark, the MFS Growth Allocation Portfolio Blended Index (Blended Index), generated a return of -16.44%. The Blended Index reflects the blended returns of various equity and fixed income market indices, with percentage allocations to each index designed to resemble the allocations of the fund. The market indices and related percentage allocations used to compile the Blended Index are set forth in the Performance Summary.
Market Environment
During the reporting period, markets continued to grapple with the strongest global inflationary pressures in decades along with signs of slowing economic growth. Intermittent coronavirus flareups, particularly in China, where home-grown vaccines have proved less effective than elsewhere, kept supply chains stretched for a considerable period. At the same time, the reopening of the economy in the parts of the world where the virus has been better contained has led to a shift in consumption patterns in favor of services, straining already tight labor markets in most developed economies, while reducing demand for manufactured goods, primarily from Asia. As a result of Russia’s invasion of Ukraine, geopolitical considerations, such as sanctions and trade bans, have resulted in additional supply chain disruptions and volatile global energy prices. Taken together, these factors have contributed to market volatility.
The ripple effects from the Russian invasion further complicated the mission central banks must undertake to rein in surging inflation. Energy shocks have historically resulted in global growth slowdowns, if not pullbacks, so policymakers will find themselves in the difficult position of trying to restrain inflation without tipping economies into recession. Despite the challenging macroeconomic and geopolitical environment, policymakers remained focused on controlling inflation, although investors appeared to have expected varying degrees of action from the central banks. The Fed has been among the most aggressive developed market central banks, tightening policy at the fastest rate in decades, although it slowed its hiking pace at the end of the period, as did the European Central Bank. After remaining on the monetary sidelines for much of the period, the Bank of Japan widened its Yield Curve Control band, capping the yield on its 10-year bond at 0.5%, up from 0.25%, an action investors interpreted as a first step toward monetary policy normalization.
Against an environment of still-tight labor markets, tighter global financial conditions and volatile materials prices, investor anxiety appeared to have increased over the potential that corporate profit margins may be past peak for this cycle. That said, tentative signs that supply chain bottlenecks (particularly semiconductors) may be moderating, the easing of COVID restrictions in China, low levels of unemployment across developed markets and hopes that inflation levels may be near a peak were supportive factors for the macroeconomic backdrop.
Factors Affecting Performance
During the reporting period, the fund underperformed its benchmark, the Standard & Poor’s 500 Stock Index. Over the same period, the fund underperformed the Blended Index.
Relative to the Blended Index, the fund’s exposure to the international equity asset class was a primary detractor from relative performance. Within this segment, both the MFS International Intrinsic Value Portfolio and MFS Research International Portfolio weighed on the fund's relative results as both portfolios tilted toward higher quality growth and lagged their respective benchmarks.
The fund's exposure to the U.S. equity asset class also held back relative returns. Here, exposure to growth-oriented funds, most notably to the MFS Growth Series and MFS Mid Cap Growth Series, which both underperformed their respective benchmarks, held back relative returns and outweighed the positive relative contribution from the fund’s exposure to value-oriented funds, particularly the MFS Value Series and MFS Mid Cap Value Portfolio.
The fund's exposure to the fixed income asset class also weakened relative performance. Within this asset class, the fund’s exposure to both the MFS Inflation-Adjusted Bond Portfolio and MFS Global Governments Portfolio, both of which are global portfolios and were negatively impacted by a stronger U.S. dollar, outweighed the positive contribution from the fund’s exposure to the MFS Limited Maturity Portfolio, a shorter duration(d) portfolio which held in better in the face of rising interest rates.
MFS Growth Allocation Portfolio
Management Review - continued
Respectfully,
Portfolio Manager(s)
Joseph Flaherty and Natalie Shapiro
| (d) | Duration is a measure of how much a bond’s price is likely to fluctuate with general changes in interest rates, e.g., if rates rise 1.00%, a bond with a 5-year duration is likely to lose about 5.00% of its value. |
The views expressed in this report are those of the portfolio manager(s) only through the end of the period of the report as stated on the cover and do not necessarily reflect the views of MFS or any other person in the MFS organization. These views are subject to change at any time based on market or other conditions, and MFS disclaims any responsibility to update such views. These views may not be relied upon as investment advice or an indication of trading intent on behalf of any MFS portfolio. References to specific securities are not recommendations of such securities, and may not be representative of any MFS portfolio’s current or future investments.
MFS Growth Allocation Portfolio
Performance Summary Through 12/31/22
The following chart illustrates the historical performance of the fund in comparison to its benchmark(s). Benchmarks are unmanaged and may not be invested in directly. Benchmark returns do not reflect any fees or expenses. The performance of other share classes will be greater than or less than that of the class depicted below. (See Notes to Performance Summary.)
Performance data shown represents past performance and is no guarantee of future results. Investment return and principal value fluctuate so your shares, when sold, may be worth more or less than the original cost; current performance may be lower or higher than quoted. The performance shown does not reflect the deduction of taxes, if any, that a shareholder would pay on fund distributions or the redemption of fund shares. The returns for the fund shown also do not reflect the deduction of expenses associated with variable products, such as mortality and expense risk charges, separate account charges, and sales charges imposed by the insurance company separate accounts. Such expenses would reduce the overall returns shown.
Growth of a Hypothetical $10,000 Investment
Total Returns through 12/31/22
Average annual total returns
| Share Class | Class Inception Date | 1-yr | 5-yr | 10-yr |
| Initial Class | 10/01/08 | (18.27)% | 5.69% | 8.20% |
| Service Class | 10/01/08 | (18.50)% | 5.42% | 7.93% |
Comparative benchmark(s)
| Standard & Poor's 500 Stock Index (f) | (18.11)% | 9.42% | 12.56% |
| MFS Growth Allocation Portfolio Blended Index (f)(w) | (16.44)% | 5.63% | 8.22% |
| Bloomberg U.S. Aggregate Bond Index (f) | (13.01)% | 0.02% | 1.06% |
| FTSE EPRA Nareit Developed Real Estate Index (net div) (f) | (25.09)% | (0.23)% | 2.99% |
| MSCI EAFE Index (net div) (f) | (14.45)% | 1.54% | 4.67% |
| (f) | Source: FactSet Research Systems Inc. |
| (w) | The MFS Growth Allocation Portfolio Blended Index (a custom index) was comprised of the following at the beginning and at the end of the reporting period: |
| | 12/31/22 |
| Standard & Poor's 500 Stock Index | 54% |
| Bloomberg U.S. Aggregate Bond Index | 21% |
| MSCI EAFE Index (net div) | 20% |
| FTSE EPRA Nareit Developed Real Estate Index (net div) | 5% |
Benchmark Definition(s)
Bloomberg U.S. Aggregate Bond Index(a) – a market capitalization-weighted index that measures the performance of the U.S. investment-grade, fixed rate bond market, with index components for government and corporate securities, mortgage pass-through securities, and asset-backed securities with at least one year to final maturity.
MFS Growth Allocation Portfolio
Performance Summary – continued
FTSE EPRA Nareit Developed Real Estate Index(c) (net div) – measures the performance of eligible real estate equities worldwide that generate a majority of their revenue and income through the ownership, disposure and development of income-producing real estate.
MSCI EAFE (Europe, Australasia, Far East) Index(e) (net div) – a market capitalization-weighted index that is designed to measure equity market performance in the developed markets, excluding the U.S. and Canada.
Standard & Poor's 500 Stock Index(g) – a market capitalization-weighted index of 500 widely held equity securities, designed to measure broad U.S. equity performance.
It is not possible to invest directly in an index.
| (a) | Source: Bloomberg Index Services Limited. BLOOMBERG® is a trademark and service mark of Bloomberg Finance L.P. and its affiliates (collectively “Bloomberg”). Bloomberg or Bloomberg's licensors own all proprietary rights in the Bloomberg Indices. Bloomberg neither approves or endorses this material, or guarantees the accuracy or completeness of any information herein, or makes any warranty, express or implied, as to the results to be obtained therefrom and, to the maximum extent allowed by law, neither shall have any liability or responsibility for injury or damages arising in connection therewith. |
| (c) | FTSE International Limited (“FTSE”)© FTSE 2019. “FTSE®” is a trademark of the London Stock Exchange Group companies and is used by FTSE International Limited under license. “FT-SE®”, “FOOTSIE®” and “FTSE4GOOD®” are trademarks of the London Stock Exchange Group companies. “Nareit®” is a trademark of the National Association of Real Estate Investment Trusts (“Nareit”) and “EPRA®” is a trademark of the European Public Real Estate Association (“EPRA”) and all are used by FTSE under license. The FTSE EPRA Nareit Developed Real Estate Index is calculated by FTSE. Neither FTSE, Euronext N.V., Nareit, nor EPRA sponsor, endorse, or promote this product and are not in any way connected to it and do not accept any liability. All intellectual property rights in the index values and constituent list vests in FTSE, Euronext N.V., Nareit, and EPRA. Neither FTSE nor its licensors accept any liability for any errors or omissions in the FTSE indices and/or FTSE ratings or underlying data. No further distribution of FTSE Data is permitted without FTSE's express written consent. |
| (e) | Morgan Stanley Capital International (“MSCI”) makes no express or implied warranties or representations and shall have no liability whatsoever with respect to any MSCI data contained herein. The MSCI data may not be further redistributed or used as a basis for other indices or any securities or financial products. This report is not approved, reviewed, or produced by MSCI. |
| (g) | “Standard & Poor's®” and “S&P®” are registered trademarks of Standard & Poor's Financial Services LLC (“S&P”) and Dow Jones is a registered trademark of Dow Jones Trademark Holdings LLC (“Dow Jones”) and have been licensed for use by S&P Dow Jones Indices LLC and sublicensed for certain purposes by MFS. The S&P 500® is a product of S&P Dow Jones Indices LLC, and has been licensed for use by MFS. MFS's product(s) is not sponsored, endorsed, sold, or promoted by S&P Dow Jones Indices LLC, Dow Jones, S&P, or their respective affiliates, and neither S&P Dow Jones Indices LLC, Dow Jones, S&P, nor their respective affiliates make any representation regarding the advisability of investing in such product(s). |
Notes to Performance Summary
Average annual total return represents the average annual change in value for each share class for the periods presented.
Performance results reflect any applicable expense subsidies and waivers in effect during the periods shown. Without such subsidies and waivers the fund's performance results would be less favorable. Please see the prospectus and financial statements for complete details. All results are historical and assume the reinvestment of any dividends and capital gains distributions.
Performance results do not include adjustments made for financial reporting purposes in accordance with U.S. generally accepted accounting principles and may differ from amounts reported in the financial highlights.
From time to time the fund may receive proceeds from litigation settlements, without which performance would be lower.
MFS Growth Allocation Portfolio
Expense Table
Fund expenses borne by the shareholders during the period,
July 1, 2022 through December 31, 2022
As a shareholder of the fund, you incur ongoing costs, including distribution and/or service (12b-1) fees; and other fund expenses. This example is intended to help you understand your ongoing costs (in dollars) of investing in the fund and to compare these costs with the ongoing costs of investing in other mutual funds.
In addition to the fees and expenses which the fund bears directly, the fund indirectly bears a pro rata share of the fees and expenses of the underlying funds in which the fund invests. Because the underlying funds have varied expenses and fee levels and the fund may own different proportions of the underlying funds at different times, the amount of fees and expenses incurred indirectly by the fund will vary. If these indirect costs were included, your costs would have been higher.
The example is based on an investment of $1,000 invested at the beginning of the period and held for the entire period July 1, 2022 through December 31, 2022.
Actual Expenses
The first line for each share class in the following table provides information about actual account values and actual expenses. You may use the information in this line, together with the amount you invested, to estimate the expenses that you paid over the period. Simply divide your account value by $1,000 (for example, an $8,600 account value divided by $1,000 = 8.6), then multiply the result by the number in the first line under the heading entitled “Expenses Paid During Period” to estimate the expenses you paid on your account during this period.
Hypothetical Example for Comparison Purposes
The second line for each share class in the following table provides information about hypothetical account values and hypothetical expenses based on the fund’s actual expense ratio and an assumed rate of return of 5% per year before expenses, which is not the fund’s actual return. The hypothetical account values and expenses may not be used to estimate the actual ending account balance or expenses you paid for the period. You may use this information to compare the ongoing costs of investing in the fund and other funds. To do so, compare this 5% hypothetical example with the 5% hypothetical examples that appear in the shareholder reports of the other funds.
Please note that the expenses shown in the table are meant to highlight the fund's ongoing costs only and do not take into account the fees and expenses imposed under the variable contracts through which your investment in the fund is made. Therefore, the second line for each share class in the table is useful in comparing ongoing costs associated with an investment in vehicles (such as the fund) which fund benefits under variable annuity and variable life insurance contracts and to qualified pension and retirement plans only, and will not help you determine the relative total costs of investing in the fund through variable annuity and variable life insurance contracts. If the fees and expenses imposed under the variable contracts were included, your costs would have been higher.
Share
Class | | Annualized
Expense
Ratio | Beginning
Account Value
7/01/22 | Ending
Account Value
12/31/22 | Expenses
Paid During
Period (p)
7/01/22-12/31/22 |
| Initial Class | Actual | 0.04% | $1,000.00 | $1,020.29 | $0.20 |
| Hypothetical (h) | 0.04% | $1,000.00 | $1,025.00 | $0.20 |
| Service Class | Actual | 0.29% | $1,000.00 | $1,018.76 | $1.48 |
| Hypothetical (h) | 0.29% | $1,000.00 | $1,023.74 | $1.48 |
| (h) | 5% class return per year before expenses. |
| (p) | “Expenses Paid During Period” are equal to each class’s annualized expense ratio, as shown above, multiplied by the average account value over the period, multiplied by 184/365 (to reflect the one-half year period). In addition to the fees and expenses which the fund bears directly, the fund indirectly bears a pro rata share of the fees and expenses of the underlying funds in which the fund invests. If these indirect costs were included, your costs would have been higher. |
MFS Growth Allocation Portfolio
Portfolio of Investments − 12/31/22
The Portfolio of Investments is a complete list of all securities owned by your fund. It is categorized by broad-based asset classes.
| Issuer | | | Shares/Par | Value ($) |
| Investment Companies (h) – 100.0% |
| Bond Funds – 20.9% |
| MFS Global Governments Portfolio - Initial Class | | | 1,212,846 | $ 10,442,606 |
| MFS High Yield Portfolio - Initial Class | | | 2,754,872 | 13,002,993 |
| MFS Inflation-Adjusted Bond Portfolio - Initial Class | | | 1,561,152 | 13,035,620 |
| MFS Limited Maturity Portfolio - Initial Class | | | 539,012 | 5,147,566 |
| MFS Total Return Bond Series - Initial Class | | | 1,142,570 | 12,865,339 |
| | | | | $54,494,124 |
| International Stock Funds – 20.4% |
| MFS Emerging Markets Equity Portfolio - Initial Class | | | 233,636 | $ 2,663,457 |
| MFS International Growth Portfolio - Initial Class | | | 993,717 | 13,266,120 |
| MFS International Intrinsic Value Portfolio - Initial Class | | | 486,942 | 13,264,298 |
| MFS Research International Portfolio - Initial Class | | | 1,591,499 | 24,031,636 |
| | | | | $53,225,511 |
| Specialty Funds – 4.9% |
| MFS Global Real Estate Portfolio - Initial Class | | | 1,006,597 | $ 12,864,312 |
| U.S. Stock Funds – 53.7% |
| MFS Growth Series - Initial Class | | | 573,136 | $ 27,521,975 |
| MFS Mid Cap Growth Series - Initial Class | | | 3,276,238 | 23,457,863 |
| MFS Mid Cap Value Portfolio - Initial Class | | | 2,578,063 | 23,692,403 |
| MFS New Discovery Series - Initial Class | | | 456,855 | 5,167,031 |
| MFS New Discovery Value Portfolio - Initial Class | | | 665,468 | 5,277,163 |
| MFS Research Series - Initial Class | | | 937,871 | 26,016,528 |
| MFS Value Series - Initial Class | | | 1,351,147 | 29,117,218 |
| | | | | $140,250,181 |
| Money Market Funds – 0.1% | |
| MFS Institutional Money Market Portfolio, 4.02% (v) | | | 178,631 | $ 178,684 |
| Total Investment Companies (Identified Cost, $229,682,169) | $261,012,812 |
| Other Assets, Less Liabilities – (0.0)% | | (53,419) |
| Net Assets – 100.0% | $260,959,393 |
| (h) | An affiliated issuer, which may be considered one in which the fund owns 5% or more of the outstanding voting securities, or a company which is under common control. At period end, the aggregate value of the fund’s investments in affiliated issuers was $261,012,812. | | | |
| (v) | Affiliated issuer that is available only to investment companies managed by MFS. The rate quoted for the MFS Institutional Money Market Portfolio is the annualized seven-day yield of the fund at period end. | | | |
See Notes to Financial Statements
MFS Growth Allocation Portfolio
| Financial Statements | Statement of Assets and Liabilities |
This statement represents your fund’s balance sheet, which details the assets and liabilities comprising the total value of the fund.
| At 12/31/22Assets | |
| Investments in affiliated issuers, at value (identified cost, $229,682,169) | $261,012,812 |
| Receivables for | |
| Investments sold | 122,678 |
| Fund shares sold | 612 |
| Other assets | 1,578 |
| Total assets | $261,137,680 |
| Liabilities | |
| Payables for | |
| Fund shares reacquired | $122,783 |
| Payable to affiliates | |
| Administrative services fee | 142 |
| Shareholder servicing costs | 25 |
| Distribution and/or service fees | 5,303 |
| Payable for independent Trustees' compensation | 137 |
| Accrued expenses and other liabilities | 49,897 |
| Total liabilities | $178,287 |
| Net assets | $260,959,393 |
| Net assets consist of | |
| Paid-in capital | $203,461,222 |
| Total distributable earnings (loss) | 57,498,171 |
| Net assets | $260,959,393 |
| Shares of beneficial interest outstanding | 27,823,161 |
| | Net assets | Shares
outstanding | Net asset value
per share |
| Initial Class | $2,817,368 | 301,362 | $9.35 |
| Service Class | 258,142,025 | 27,521,799 | 9.38 |
See Notes to Financial Statements
MFS Growth Allocation Portfolio
| Financial Statements | Statement of Operations |
This statement describes how much your fund earned in investment income and accrued in expenses. It also describes any gains and/or losses generated by fund operations.
| Year ended 12/31/22 | |
| Net investment income (loss) | |
| Income | |
| Dividends from affiliated issuers | $6,913,412 |
| Other | 49 |
| Total investment income | $6,913,461 |
| Expenses | |
| Distribution and/or service fees | $715,449 |
| Shareholder servicing costs | 6,147 |
| Administrative services fee | 17,500 |
| Independent Trustees' compensation | 6,416 |
| Custodian fee | 4,658 |
| Shareholder communications | 3,985 |
| Audit and tax fees | 43,362 |
| Legal fees | 1,284 |
| Miscellaneous | 27,923 |
| Total expenses | $826,724 |
| Net investment income (loss) | $6,086,737 |
| Realized and unrealized gain (loss) | |
| Realized gain (loss) (identified cost basis) | |
| Investments in affiliated issuers | $2,793,594 |
| Capital gain distributions from affiliated issuers | 19,151,402 |
| Net realized gain (loss) | $21,944,996 |
| Change in unrealized appreciation or depreciation | |
| Affiliated issuers | $(92,552,645) |
| Net realized and unrealized gain (loss) | $(70,607,649) |
| Change in net assets from operations | $(64,520,912) |
See Notes to Financial Statements
MFS Growth Allocation Portfolio
| Financial Statements | Statements of Changes in Net Assets |
These statements describe the increases and/or decreases in net assets resulting from operations, any distributions, and any shareholder transactions.
| | Year ended |
| | 12/31/22 | 12/31/21 |
| Change in net assets | | |
| From operations | | |
| Net investment income (loss) | $6,086,737 | $3,962,970 |
| Net realized gain (loss) | 21,944,996 | 34,050,761 |
| Net unrealized gain (loss) | (92,552,645) | 14,160,136 |
| Change in net assets from operations | $(64,520,912) | $52,173,867 |
| Total distributions to shareholders | $(37,921,553) | $(26,312,418) |
| Change in net assets from fund share transactions | $6,816,927 | $(28,148,870) |
| Total change in net assets | $(95,625,538) | $(2,287,421) |
| Net assets | | |
| At beginning of period | 356,584,931 | 358,872,352 |
| At end of period | $260,959,393 | $356,584,931 |
See Notes to Financial Statements
MFS Growth Allocation Portfolio
| Financial Statements | Financial Highlights |
The financial highlights table is intended to help you understand the fund's financial performance for the past 5 years. Certain information reflects financial results for a single fund share. The total returns in the table represent the rate that an investor would have earned (or lost) on an investment in the fund share class (assuming reinvestment of all distributions) held for the entire period.
| Initial Class | Year ended |
| | 12/31/22 | 12/31/21 | 12/31/20 | 12/31/19 | 12/31/18 |
| Net asset value, beginning of period | $13.27 | $12.38 | $11.93 | $10.64 | $12.21 |
| Income (loss) from investment operations | | | | | |
| Net investment income (loss) (d)(l) | $0.26 | $0.17 | $0.23 | $0.22 | $0.26 |
| Net realized and unrealized gain (loss) | (2.64) | 1.75 | 1.53 | 2.53 | (0.78) |
| Total from investment operations | $(2.38) | $1.92 | $1.76 | $2.75 | $(0.52) |
| Less distributions declared to shareholders | | | | | |
| From net investment income | $(0.19) | $(0.23) | $(0.25) | $(0.29) | $(0.23) |
| From net realized gain | (1.35) | (0.80) | (1.06) | (1.17) | (0.82) |
| Total distributions declared to shareholders | $(1.54) | $(1.03) | $(1.31) | $(1.46) | $(1.05) |
| Net asset value, end of period (x) | $9.35 | $13.27 | $12.38 | $11.93 | $10.64 |
| Total return (%) (k)(s)(x) | (18.27) | 15.76 | 15.80 | 26.96 | (5.20) |
Ratios (%) (to average net assets)
and Supplemental data: | | | | | |
| Expenses before expense reductions (h) | 0.04 | 0.03 | 0.04 | 0.03 | 0.03 |
| Expenses after expense reductions (h) | N/A | N/A | N/A | N/A | N/A |
| Net investment income (loss) (l) | 2.37 | 1.31 | 2.02 | 1.88 | 2.13 |
| Portfolio turnover | 2 | 2 | 6 | 0(b) | 2 |
| Net assets at end of period (000 omitted) | $2,817 | $4,564 | $4,602 | $3,905 | $3,770 |
| Service Class | Year ended |
| | 12/31/22 | 12/31/21 | 12/31/20 | 12/31/19 | 12/31/18 |
| Net asset value, beginning of period | $13.30 | $12.40 | $11.95 | $10.65 | $12.22 |
| Income (loss) from investment operations | | | | | |
| Net investment income (loss) (d)(l) | $0.23 | $0.14 | $0.18 | $0.20 | $0.22 |
| Net realized and unrealized gain (loss) | (2.64) | 1.76 | 1.55 | 2.52 | (0.77) |
| Total from investment operations | $(2.41) | $1.90 | $1.73 | $2.72 | $(0.55) |
| Less distributions declared to shareholders | | | | | |
| From net investment income | $(0.16) | $(0.20) | $(0.22) | $(0.25) | $(0.20) |
| From net realized gain | (1.35) | (0.80) | (1.06) | (1.17) | (0.82) |
| Total distributions declared to shareholders | $(1.51) | $(1.00) | $(1.28) | $(1.42) | $(1.02) |
| Net asset value, end of period (x) | $9.38 | $13.30 | $12.40 | $11.95 | $10.65 |
| Total return (%) (k)(s)(x) | (18.50) | 15.54 | 15.46 | 26.66 | (5.46) |
Ratios (%) (to average net assets)
and Supplemental data: | | | | | |
| Expenses before expense reductions (h) | 0.29 | 0.28 | 0.29 | 0.28 | 0.28 |
| Expenses after expense reductions (h) | N/A | N/A | N/A | N/A | N/A |
| Net investment income (loss) (l) | 2.10 | 1.09 | 1.57 | 1.70 | 1.80 |
| Portfolio turnover | 2 | 2 | 6 | 0(b) | 2 |
| Net assets at end of period (000 omitted) | $258,142 | $352,021 | $354,270 | $351,229 | $330,320 |
See Notes to Financial Statements
MFS Growth Allocation Portfolio
Financial Highlights - continued
| (b) | Less than 0.5%. |
| (d) | Per share data is based on average shares outstanding. |
| (h) | In addition to the fees and expenses which the fund bears directly, the fund indirectly bears a pro rata share of the fees and expenses of the underlying affiliated funds in which the fund invests. Accordingly, the expense ratio for the fund reflects only those fees and expenses borne directly by the fund. Because the underlying affiliated funds have varied expense and fee levels and the fund may own different proportions of the underlying affiliated funds at different times, the amount of fees and expenses incurred indirectly by the fund will vary. |
| (k) | The total return does not reflect expenses that apply to separate accounts. Inclusion of these charges would reduce the total return figures for all periods shown. |
| (l) | The ratios and per share amounts do not include net investment income of the underlying affiliated funds in which the fund invests. |
| (s) | From time to time the fund may receive proceeds from litigation settlements, without which performance would be lower. |
| (x) | The net asset values and total returns have been calculated on net assets which include adjustments made in accordance with U.S. generally accepted accounting principles required at period end for financial reporting purposes. |
See Notes to Financial Statements
MFS Growth Allocation Portfolio
Notes to Financial Statements
(1) Business and Organization
MFS Growth Allocation Portfolio (the fund) is a diversified series of MFS Variable Insurance Trust III (the trust). The trust is organized as a Delaware statutory trust and is registered under the Investment Company Act of 1940, as amended, as an open-end management investment company. The shareholders of each series of the trust are separate accounts of insurance companies, which offer variable annuity and/or life insurance products, and qualified retirement and pension plans.
The fund is an investment company and accordingly follows the investment company accounting and reporting guidance of the Financial Accounting Standards Board (FASB) Accounting Standards Codification Topic 946 Financial Services - Investment Companies.
(2) Significant Accounting Policies
General — The preparation of financial statements in conformity with U.S. generally accepted accounting principles requires management to make estimates and assumptions that affect the reported amounts of assets and liabilities, and disclosure of contingent assets and liabilities at the date of the financial statements and the reported amounts of increases and decreases in net assets from operations during the reporting period. Actual results could differ from those estimates. In the preparation of these financial statements, management has evaluated subsequent events occurring after the date of the fund’s Statement of Assets and Liabilities through the date that the financial statements were issued.
The fund is a “fund of funds”, which invests the majority of its assets in other MFS mutual funds (hereafter referred to as “underlying affiliated funds” or “underlying funds”), which may have different fiscal year ends than the funds. The underlying funds, in turn, may engage in a number of investment techniques and practices, which involve certain risks. Certain underlying funds invest their portfolio in high-yield securities rated below investment grade. Investments in below investment grade quality securities can involve a substantially greater risk of default or can already be in default, and their values can decline significantly. Below investment grade quality securities tend to be more sensitive to adverse news about the issuer, or the market or economy in general, than higher quality debt instruments. Certain underlying funds invest a significant portion of their assets in asset-backed and/or mortgage-backed securities. For these securities, the value of the debt instrument also depends on the credit quality and adequacy of the underlying assets or collateral as well as whether there is a security interest in the underlying assets or collateral. Enforcing rights, if any, against the underlying assets or collateral may be difficult. U.S. Government securities not supported as to the payment of principal or interest by the U.S. Treasury, such as those issued by Fannie Mae, Freddie Mac, and the Federal Home Loan Banks, are subject to greater credit risk than are U.S. Government securities supported by the U.S. Treasury, such as those issued by Ginnie Mae. Certain underlying funds invest in foreign securities, including securities of emerging market issuers. Investments in foreign securities are vulnerable to the effects of changes in the relative values of the local currency and the U.S. dollar and to the effects of changes in each country’s market, economic, industrial, political, regulatory, geopolitical, environmental, public health, and other conditions. Investments in emerging markets can involve additional and greater risks than the risks associated with investments in developed foreign markets. Emerging markets can have less developed markets, greater custody and operational risk, less developed legal, regulatory, and accounting, and auditing systems, greater government involvement in the economy, greater risk of new or inconsistent government treatment of or restrictions on issuers and instruments, and greater political, social, and economic instability than developed markets.
The accounting policies of the underlying funds in which the fund invests are outlined in the underlying funds’ shareholder reports, which are available without charge by calling 1-800-225-2606, at mfs.com and on the Securities and Exchange Commission (SEC) web site at http://www.sec.gov. The underlying funds' shareholder reports are not covered by this report.
Investment Valuations — Open-end investment companies (underlying funds) are generally valued at their net asset value per share. The investments of underlying funds managed by the adviser are valued as described below. For purposes of this policy disclosure, “fund” also refers to the underlying funds in which the fund-of-funds invests.
Subject to its oversight, the fund's Board of Trustees has delegated primary responsibility for determining or causing to be determined the value of the fund’s investments to MFS as the fund's adviser, pursuant to the fund’s valuation policy and procedures which have been adopted by the adviser and approved by the Board. Effective September 8, 2022, and in accordance with Rule 2a-5 under the Investment Company Act of 1940, the Board of Trustees designated the adviser as the “valuation designee” of the fund. If the adviser, as valuation designee, determines that reliable market quotations are not readily available for an investment, the investment is valued at fair value as determined in good faith by the adviser in accordance with the adviser’s fair valuation policy and procedures.
Under the fund's valuation policy and procedures, equity securities, including restricted equity securities and equity securities sold short, are generally valued at the last sale or official closing price on their primary market or exchange as provided by a third-party pricing service. Equity securities, for which there were no sales reported that day, are generally valued at the last quoted daily bid
MFS Growth Allocation Portfolio
Notes to Financial Statements - continued
quotation on their primary market or exchange as provided by a third-party pricing service. Equity securities sold short, for which there were no sales reported that day, are generally valued at the last quoted daily ask quotation on their primary market or exchange as provided by a third-party pricing service. Debt instruments and floating rate loans, including restricted debt instruments, are generally valued at an evaluated or composite bid as provided by a third-party pricing service. Debt instruments sold short are generally valued at an evaluated or composite mean as provided by a third-party pricing service. Short-term instruments with a maturity at issuance of 60 days or less may be valued at amortized cost, which approximates market value. Exchange-traded options are generally valued at the last sale or official closing price on their primary exchange as provided by a third-party pricing service. Exchange-traded options for which there were no sales reported that day are generally valued at the last daily bid quotation on their primary exchange as provided by a third-party pricing service. For put options, the position may be valued at the last daily ask quotation if there are no trades reported during the day. Options not traded on an exchange are generally valued at a broker/dealer bid quotation. Foreign currency options are generally valued at valuations provided by a third-party pricing service. Futures contracts are generally valued at last posted settlement price on their primary exchange as provided by a third-party pricing service. Futures contracts for which there were no trades that day for a particular position are generally valued at the closing bid quotation on their primary exchange as provided by a third-party pricing service. Forward foreign currency exchange contracts are generally valued at the mean of bid and asked prices for the time period interpolated from rates provided by a third-party pricing service for proximate time periods. Swap agreements are generally valued using valuations provided by a third-party pricing service, which for cleared swaps includes an evaluation of any trading activity at the clearinghouses. Open-end investment companies are generally valued at net asset value per share. The values of foreign securities and other assets and liabilities expressed in foreign currencies are converted to U.S. dollars using the mean of bid and asked prices for rates provided by a third-party pricing service.
Under the fund’s valuation policy and procedures, market quotations are not considered to be readily available for debt instruments, floating rate loans, and many types of derivatives. These investments are generally valued at fair value based on information from third-party pricing services or otherwise determined by the adviser in accordance with the adviser’s fair valuation policy and procedures. Securities and other assets generally valued on the basis of information from a third-party pricing service may also be valued at a broker/dealer bid quotation. In determining values, third-party pricing services can utilize both transaction data and market information such as yield, quality, coupon rate, maturity, type of issue, trading characteristics, spreads and other market data. An investment may also be valued at fair value if the adviser determines that the investment’s value has been materially affected by events occurring after the close of the exchange or market on which the investment is principally traded (such as foreign exchange or market) and prior to the determination of the fund’s net asset value, or after the halt of trading of a specific security where trading does not resume prior to the close of the exchange or market on which the security is principally traded. Events that occur after foreign markets close (such as developments in foreign markets and significant movements in the U.S. markets) and prior to the determination of the fund’s net asset value may be deemed to have a material effect on the value of securities traded in foreign markets. Accordingly, the fund’s foreign equity securities may often be valued at fair value. The adviser generally relies on third-party pricing services or other information (such as the correlation with price movements of similar securities in the same or other markets; the type, cost and investment characteristics of the security; the business and financial condition of the issuer; and trading and other market data) to assist in determining whether to fair value and at what value to fair value an investment. The value of an investment for purposes of calculating the fund’s net asset value can differ depending on the source and method used to determine value. When fair valuation is used, the value of an investment used to determine the fund’s net asset value may differ from quoted or published prices for the same investment. There can be no assurance that the fund could obtain the fair value assigned to an investment if it were to sell the investment at the same time at which the fund determines its net asset value per share.
Various inputs are used in determining the value of the fund's assets or liabilities. These inputs are categorized into three broad levels. In certain cases, the inputs used to measure fair value may fall into different levels of the fair value hierarchy. In such cases, an investment's level within the fair value hierarchy is based on the lowest level of input that is significant to the fair value measurement. The fund's assessment of the significance of a particular input to the fair value measurement in its entirety requires judgment, and considers factors specific to the investment. Level 1 includes unadjusted quoted prices in active markets for identical assets or liabilities. Level 2 includes other significant observable market-based inputs (including quoted prices for similar securities, interest rates, prepayment speed, and credit risk). Level 3 includes significant unobservable inputs, which may include the adviser's own assumptions in determining the fair value of investments. The following is a summary of the levels used as of December 31, 2022 in valuing the fund's assets and liabilities:
| Financial Instruments | Level 1 | Level 2 | Level 3 | Total |
| Mutual Funds | $261,012,812 | $— | $— | $261,012,812 |
For further information regarding security characteristics, see the Portfolio of Investments. Please refer to the underlying funds’ shareholder reports for further information regarding the levels used in valuing the underlying funds’ assets and liabilities.
MFS Growth Allocation Portfolio
Notes to Financial Statements - continued
Derivatives — The fund does not invest in derivatives directly. The fund does invest in underlying funds that may use derivatives primarily to increase or decrease exposure to a particular market or segment of the market, or security, to increase or decrease interest rate or currency exposure, or as alternatives to direct investments. Derivatives are used for hedging or non-hedging purposes. While hedging can reduce or eliminate losses, it can also reduce or eliminate gains. When the underlying funds use derivatives as an investment to increase market exposure, or for hedging purposes, gains and losses from derivative instruments may be substantially greater than the derivative’s original cost.
Indemnifications — Under the fund's organizational documents, its officers and Trustees may be indemnified against certain liabilities and expenses arising out of the performance of their duties to the fund. Additionally, in the normal course of business, the fund enters into agreements with service providers that may contain indemnification clauses. The fund's maximum exposure under these agreements is unknown as this would involve future claims that may be made against the fund that have not yet occurred.
Investment Transactions and Income — Investment transactions are recorded on the trade date. Interest income is recorded on the accrual basis. All premium and discount is amortized or accreted for financial statement purposes in accordance with U.S. generally accepted accounting principles. Distributions of income and capital gains from the underlying funds are recorded on the ex-dividend date. Recognition of net investment income by the fund is affected by the timing of the declaration of distributions by the underlying funds in which the fund invests. In determining the net gain or loss on securities sold, the cost of securities is determined on the identified cost basis.
The fund and/or the underlying funds may receive proceeds from litigation settlements. Any proceeds received from litigation involving portfolio holdings are reflected in the Statement of Operations in realized gain/loss if the security has been disposed of by the fund or in unrealized gain/loss if the security is still held by the fund. Any other proceeds from litigation not related to portfolio holdings are reflected as other income in the Statement of Operations.
Tax Matters and Distributions — The fund intends to qualify as a regulated investment company, as defined under Subchapter M of the Internal Revenue Code, and to distribute all of its taxable income, including realized capital gains. As a result, no provision for federal income tax is required. The fund’s federal tax returns, when filed, will remain subject to examination by the Internal Revenue Service for a three year period. Management has analyzed the fund’s tax positions taken on federal and state tax returns for all open tax years and does not believe that there are any uncertain tax positions that require recognition of a tax liability.
Distributions to shareholders are recorded on the ex-dividend date. Income and capital gain distributions are determined in accordance with income tax regulations, which may differ from U.S. generally accepted accounting principles. Certain capital accounts in the financial statements are periodically adjusted for permanent differences in order to reflect their tax character. These adjustments have no impact on net assets or net asset value per share. Temporary differences which arise from recognizing certain items of income, expense, gain or loss in different periods for financial statement and tax purposes will reverse at some time in the future.
Book/tax differences primarily relate to wash sale loss deferrals.
The tax character of distributions declared to shareholders for the last fiscal year is as follows:
| | Year ended
12/31/22 | Year ended
12/31/21 |
| Ordinary income (including any short-term capital gains) | $5,033,364 | $6,858,157 |
| Long-term capital gains | 32,888,189 | 19,454,261 |
| Total distributions | $37,921,553 | $26,312,418 |
The federal tax cost and the tax basis components of distributable earnings were as follows:
| As of 12/31/22 | |
| Cost of investments | $232,699,131 |
| Gross appreciation | 43,241,394 |
| Gross depreciation | (14,927,713) |
| Net unrealized appreciation (depreciation) | $28,313,681 |
| Undistributed ordinary income | 6,080,736 |
| Undistributed long-term capital gain | 23,103,754 |
| Total distributable earnings (loss) | $57,498,171 |
MFS Growth Allocation Portfolio
Notes to Financial Statements - continued
Multiple Classes of Shares of Beneficial Interest — The fund offers multiple classes of shares, which differ in their respective distribution and/or service fees. The fund's income, realized and unrealized gain (loss), and common expenses are allocated to shareholders based on the daily net assets of each class. Dividends are declared separately for each class. Differences in per share dividend rates are generally due to differences in separate class expenses. The fund’s distributions declared to shareholders as reported in the Statements of Changes in Net Assets are presented by class as follows:
| | Year
ended
12/31/22 | | Year
ended
12/31/21 |
| Initial Class | $507,004 | | $338,086 |
| Service Class | 37,414,549 | | 25,974,332 |
| Total | $37,921,553 | | $26,312,418 |
(3) Transactions with Affiliates
Investment Adviser — The fund has an investment advisory agreement with MFS to provide overall investment management and related administrative services and facilities to the fund. MFS receives no compensation under this agreement; however MFS receives management fees from the underlying MFS funds.
The investment adviser has agreed in writing to pay a portion of the fund’s operating expenses, excluding distribution and/or service fees, interest, taxes, extraordinary expenses, brokerage and transaction costs, and investment-related expenses such as fees and expenses associated with investments in investment companies and other similar investment vehicles such that fund operating expenses do not exceed 0.20% annually of the fund’s average daily net assets. This written agreement will continue until modified by the fund’s Board of Trustees, but such agreement will continue at least until April 30, 2024. For the year ended December 31, 2022, the fund’s actual operating expenses did not exceed the limit and therefore, the investment adviser did not pay any portion of the fund’s expenses related to this agreement.
In addition to the fees and expenses which the fund bears directly, the fund indirectly bears a pro rata share of the fees and expenses of the underlying funds in which the fund invests. Accordingly, the expense ratio for the fund reflects only those fees and expenses borne directly by the fund.
Distributor — MFS Fund Distributors, Inc. (MFD), a wholly-owned subsidiary of MFS, is the distributor of shares of the fund. The Trustees have adopted a distribution plan for the Service Class shares pursuant to Rule 12b-1 under the Investment Company Act of 1940.
The fund's distribution plan provides that the fund will pay MFD distribution and/or service fees equal to 0.25% per annum of its average daily net assets attributable to Service Class shares as partial consideration for services performed and expenses incurred by MFD and financial intermediaries (including participating insurance companies that invest in the fund to fund variable annuity and variable life insurance contracts, sponsors of qualified retirement and pension plans that invest in the fund, and affiliates of these participating insurance companies and plan sponsors) in connection with the sale and distribution of the Service Class shares. MFD may subsequently pay all, or a portion, of the distribution and/or service fees to financial intermediaries.
Shareholder Servicing Agent — MFS Service Center, Inc. (MFSC), a wholly-owned subsidiary of MFS, receives a fee from the fund for its services as shareholder servicing agent. For the year ended December 31, 2022, the fee was $5,974, which equated to 0.0021% annually of the fund's average daily net assets. MFSC also receives reimbursement from the fund for out-of-pocket expenses paid by MFSC on behalf of the fund. For the year ended December 31, 2022, these costs amounted to $173.
Administrator — MFS provides certain financial, legal, shareholder communications, compliance, and other administrative services to the fund. Under an administrative services agreement, the fund reimburses MFS the costs incurred to provide these services. The fund pays an annual fixed amount of $17,500. The administrative services fee incurred for the year ended December 31, 2022 was equivalent to an annual effective rate of 0.0060% of the fund's average daily net assets.
Trustees’ and Officers’ Compensation — The fund pays compensation to independent Trustees in the form of a retainer, attendance fees, and additional compensation to Board and Committee chairpersons. The fund does not pay compensation directly to Trustees or officers of the fund who are also officers of the investment adviser, all of whom receive remuneration from MFS for their services to the fund. Certain officers and Trustees of the fund are officers or directors of MFS, MFD, and MFSC.
Other — The fund invests in the MFS Institutional Money Market Portfolio which is managed by MFS and seeks current income consistent with preservation of capital and liquidity. This money market fund does not pay a management fee to MFS but does incur investment and operating costs.
MFS Growth Allocation Portfolio
Notes to Financial Statements - continued
(4) Portfolio Securities
For the year ended December 31, 2022, purchases and sales of shares of underlying funds, excluding the MFS Institutional Money Market Portfolio, aggregated $6,424,481 and $38,338,993, respectively.
(5) Shares of Beneficial Interest
The fund's Declaration of Trust permits the Trustees to issue an unlimited number of full and fractional shares of beneficial interest. Transactions in fund shares were as follows:
| | Year ended
12/31/22 | | Year ended
12/31/21 |
| | Shares | Amount | | Shares | Amount |
| Shares sold | | | | | |
| Initial Class | 2,276 | $23,212 | | 60,088 | $761,953 |
| Service Class | 569,317 | 6,267,400 | | 682,056 | 8,959,061 |
| | 571,593 | $6,290,612 | | 742,144 | $9,721,014 |
Shares issued to shareholders
in reinvestment of distributions | | | | | |
| Initial Class | 52,485 | $507,004 | | 26,147 | $338,086 |
| Service Class | 3,857,170 | 37,414,549 | | 2,002,647 | 25,974,332 |
| | 3,909,655 | $37,921,553 | | 2,028,794 | $26,312,418 |
| Shares reacquired | | | | | |
| Initial Class | (97,292) | $(977,222) | | (114,198) | $(1,495,258) |
| Service Class | (3,375,336) | (36,418,016) | | (4,784,086) | (62,687,044) |
| | (3,472,628) | $(37,395,238) | | (4,898,284) | $(64,182,302) |
| Net change | | | | | |
| Initial Class | (42,531) | $(447,006) | | (27,963) | $(395,219) |
| Service Class | 1,051,151 | 7,263,933 | | (2,099,383) | (27,753,651) |
| | 1,008,620 | $6,816,927 | | (2,127,346) | $(28,148,870) |
(6) Line of Credit
The fund and certain other funds managed by MFS participate in a $1.45 billion unsecured committed line of credit of which $1.2 billion is reserved for use by the fund and certain other MFS U.S. funds. The line of credit is provided by a syndicate of banks under a credit agreement. Borrowings may be made for temporary financing needs. Interest is charged to each fund, based on its borrowings, generally at a rate equal to the highest of 1) Daily Simple SOFR (Secured Overnight Financing Rate) plus 0.10%, 2) the Federal Funds Effective Rate, or 3) the Overnight Bank Funding Rate, each plus an agreed upon spread. A commitment fee, based on the average daily unused portion of the committed line of credit, is allocated among the participating funds. The line of credit expires on March 16, 2023 unless extended or renewed. In addition, the fund and other funds managed by MFS have established unsecured uncommitted borrowing arrangements with certain banks for temporary financing needs. Interest is charged to each fund, based on its borrowings, at rates equal to customary reference rates plus an agreed upon spread. For the year ended December 31, 2022, the fund’s commitment fee and interest expense were $1,434 and $0, respectively, and are included in “Miscellaneous” expense in the Statement of Operations.
(7) Investments in Affiliated Issuers
An affiliated issuer may be considered one in which the fund owns 5% or more of the outstanding voting securities, or a company which is under common control. For the purposes of this report, the following were affiliated issuers:
MFS Growth Allocation Portfolio
Notes to Financial Statements - continued
| Affiliated Issuers | Beginning
Value | Purchases | Sales
Proceeds | Realized
Gain
(Loss) | Change in
Unrealized
Appreciation or
Depreciation | Ending
Value |
| MFS Emerging Markets Equity Portfolio | $3,394,382 | $445,957 | $191,606 | $(68,609) | $(916,667) | $2,663,457 |
| MFS Global Governments Portfolio | 13,922,931 | 399,092 | 1,365,881 | (317,381) | (2,196,155) | 10,442,606 |
| MFS Global Real Estate Portfolio | 18,242,774 | 1,701,314 | 1,151,227 | 410,800 | (6,339,349) | 12,864,312 |
| MFS Growth Series | 39,071,878 | 5,425,238 | 1,016,367 | (266,196) | (15,692,578) | 27,521,975 |
| MFS High Yield Portfolio | 17,725,856 | 818,671 | 2,912,696 | (667,993) | (1,960,845) | 13,002,993 |
| MFS Inflation-Adjusted Bond Portfolio | 17,562,431 | 1,754,726 | 1,171,367 | (77,512) | (5,032,658) | 13,035,620 |
| MFS Institutional Money Market Portfolio | 184,532 | 2,852,103 | 2,858,064 | 71 | 42 | 178,684 |
| MFS International Growth Portfolio | 17,900,752 | 925,502 | 1,973,331 | 117,565 | (3,704,368) | 13,266,120 |
| MFS International Intrinsic Value Portfolio | 17,867,359 | 1,263,875 | 906,424 | (27,726) | (4,932,786) | 13,264,298 |
| MFS Limited Maturity Portfolio | 7,021,967 | 179,565 | 1,635,291 | (99,644) | (319,031) | 5,147,566 |
| MFS Mid Cap Growth Series | 32,274,365 | 5,271,034 | 1,185,733 | (426,545) | (12,475,258) | 23,457,863 |
| MFS Mid Cap Value Portfolio | 32,533,688 | 2,471,388 | 6,310,033 | 1,166,086 | (6,168,726) | 23,692,403 |
| MFS New Discovery Series | 6,589,512 | 2,458,479 | 146,697 | (126,513) | (3,607,750) | 5,167,031 |
| MFS New Discovery Value Portfolio | 7,189,307 | 1,270,358 | 1,210,478 | 232,072 | (2,204,096) | 5,277,163 |
| MFS Research International Portfolio | 32,201,596 | 1,234,174 | 2,709,211 | 45,560 | (6,740,483) | 24,031,636 |
| MFS Research Series | 35,813,863 | 3,826,246 | 3,935,275 | 1,076,843 | (10,765,149) | 26,016,528 |
| MFS Total Return Bond Series | 17,553,990 | 722,642 | 2,496,853 | (367,760) | (2,546,680) | 12,865,339 |
| MFS Value Series | 39,579,129 | 2,318,244 | 8,020,523 | 2,190,476 | (6,950,108) | 29,117,218 |
| | $356,630,312 | $35,338,608 | $41,197,057 | $2,793,594 | $(92,552,645) | $261,012,812 |
| Affiliated Issuers | Dividend
Income | Capital Gain
Distributions |
| MFS Emerging Markets Equity Portfolio | $152,857 | $170,165 |
| MFS Global Governments Portfolio | 175,669 | — |
| MFS Global Real Estate Portfolio | 387,627 | 853,441 |
| MFS Growth Series | 152,825 | 3,411,741 |
| MFS High Yield Portfolio | 797,387 | — |
| MFS Inflation-Adjusted Bond Portfolio | 718,643 | 761,774 |
| MFS Institutional Money Market Portfolio | 2,777 | — |
| MFS International Growth Portfolio | 161,703 | 756,090 |
| MFS International Intrinsic Value Portfolio | 166,141 | 576,024 |
| MFS Limited Maturity Portfolio | 114,151 | 22,298 |
| MFS Mid Cap Growth Series | — | 3,630,095 |
| MFS Mid Cap Value Portfolio | 617,265 | 1,750,575 |
| MFS New Discovery Series | 557,703 | 1,169,479 |
| MFS New Discovery Value Portfolio | 539,891 | 705,825 |
| MFS Research International Portfolio | 830,303 | 250,766 |
| MFS Research Series | 563,521 | 3,191,976 |
| MFS Total Return Bond Series | 392,463 | 165,396 |
| MFS Value Series | 582,486 | 1,735,757 |
| | $6,913,412 | $19,151,402 |
MFS Growth Allocation Portfolio
Notes to Financial Statements - continued
(8) LIBOR Transition
Certain of the fund's investments, including investments in certain debt instruments and derivatives (if any), as well as borrowings by the fund and certain other contractual arrangements of the fund, may be based on the London Interbank Offered Rate (“LIBOR”). In 2017, the regulatory authority that oversees financial services firms in the United Kingdom announced plans to transition away from LIBOR by the end of 2021. In March 2021, the administrator of LIBOR announced the extension of the publication of the more commonly used U.S. dollar LIBOR settings to the end of June 2023. Although the full impacts of the transition away from LIBOR are not fully known, the transition may result in, among other things, an increase in volatility or illiquidity of the markets for instruments that currently rely on LIBOR to determine interest rates and this could have an adverse impact on the fund's performance. With respect to the fund's accounting for investments, including investments in certain debt instruments and derivatives, as well as borrowings by the fund and any other contractual arrangements of the fund that undergo reference rate-related modifications as a result of the transition, management will rely upon the relief provided by FASB Codification Topic 848 – Reference Rate Reform (Topic 848). The guidance in Topic 848 permits the fund to account for those modified contracts as a continuation of the existing contracts. Management is still evaluating the impact to the fund of the June 30, 2023 planned discontinuation of the more commonly used U.S. dollar LIBOR settings.
(9) Russia and Ukraine Conflict
The market disruptions, which began in late February 2022, associated with geopolitical events related to the conflict between Russia and Ukraine may adversely affect the value of the fund’s assets and thus the fund’s performance. Management continues to monitor these events and to evaluate the related impacts, if any, to the fund.
MFS Growth Allocation Portfolio
Report of Independent Registered Public Accounting Firm
To the Board of Trustees of MFS Variable Insurance Trust III and the Shareholders of MFS Growth Allocation Portfolio:
Opinion on the Financial Statements and Financial Highlights
We have audited the accompanying statement of assets and liabilities of MFS Growth Allocation Portfolio (the “Fund”), including the portfolio of investments, as of December 31, 2022, the related statement of operations for the year then ended, the statements of changes in net assets for each of the two years in the period then ended, the financial highlights for each of the five years in the period then ended, and the related notes. In our opinion, the financial statements and financial highlights present fairly, in all material respects, the financial position of the Fund as of December 31, 2022, and the results of its operations for the year then ended, the changes in its net assets for each of the two years in the period then ended, and the financial highlights for each of the five years in the period then ended, in conformity with accounting principles generally accepted in the United States of America.
Basis for Opinion
These financial statements and financial highlights are the responsibility of the Fund's management. Our responsibility is to express an opinion on the Fund's financial statements and financial highlights based on our audits. We are a public accounting firm registered with the Public Company Accounting Oversight Board (United States) (PCAOB) and are required to be independent with respect to the Fund in accordance with the U.S. federal securities laws and the applicable rules and regulations of the Securities and Exchange Commission and the PCAOB.
We conducted our audits in accordance with the standards of the PCAOB. Those standards require that we plan and perform the audit to obtain reasonable assurance about whether the financial statements and financial highlights are free of material misstatement, whether due to error or fraud. The Fund is not required to have, nor were we engaged to perform, an audit of its internal control over financial reporting. As part of our audits, we are required to obtain an understanding of internal control over financial reporting but not for the purpose of expressing an opinion on the effectiveness of the Fund's internal control over financial reporting. Accordingly, we express no such opinion.
Our audits included performing procedures to assess the risks of material misstatement of the financial statements and financial highlights, whether due to error or fraud, and performing procedures that respond to those risks. Such procedures included examining, on a test basis, evidence regarding the amounts and disclosures in the financial statements and financial highlights. Our audits also included evaluating the accounting principles used and significant estimates made by management, as well as evaluating the overall presentation of the financial statements and financial highlights. Our procedures included confirmation of securities owned as of December 31, 2022, by correspondence with the transfer agent. We believe that our audits provide a reasonable basis for our opinion.
DELOITTE & TOUCHE LLP
Boston, Massachusetts
February 15, 2023
We have served as the auditor of one or more of the MFS investment companies since 1924.
MFS Growth Allocation Portfolio
Trustees and Officers — Identification and Background
The Trustees and Officers of the Trust, as of February 1, 2023, are listed below, together with their principal occupations during the past five years. (Their titles may have varied during that period.) The address of each Trustee and Officer is 111 Huntington Avenue, Boston, Massachusetts 02199-7618.
| Name, Age | | Position(s) Held with Fund | | Trustee/Officer Since(h) | | Number of MFS Funds overseen by the Trustee | | Principal Occupations During
the Past Five Years | | Other Directorships During
the Past Five Years (j) |
| INTERESTED TRUSTEE | | | | | | | | | | |
Michael W. Roberge (k)
(age 56) | | Trustee | | January 2021 | | 136 | | Massachusetts Financial Services Company, Chairman (since January 2021); Chief Executive Officer (since January 2017); Director; Chairman of the Board (since January 2022); President (until December 2018); Chief Investment Officer (until December 2018) | | N/A |
| INDEPENDENT TRUSTEES | | | | | | | | | | |
John P. Kavanaugh
(age 68) | | Trustee and Chair of Trustees | | January 2009 | | 136 | | Private investor | | N/A |
Steven E. Buller
(age 71) | | Trustee | | February 2014 | | 136 | | Private investor | | N/A |
John A. Caroselli
(age 68) | | Trustee | | March 2017 | | 136 | | Private investor; JC Global Advisors, LLC (management consulting), President (since 2015) | | N/A |
Maureen R. Goldfarb
(age 67) | | Trustee | | January 2009 | | 136 | | Private investor | | N/A |
Peter D. Jones
(age 67) | | Trustee | | January 2019 | | 136 | | Private investor | | N/A |
James W. Kilman, Jr.
(age 61) | | Trustee | | January 2019 | | 136 | | Burford Capital Limited (finance and investment management), Senior Advisor (since May 3, 2021), Chief Financial Officer (2019 - May 2, 2021); KielStrand Capital LLC (family office), Chief Executive Officer (since 2016) | | Alpha-En Corporation, Director (2016-2019) |
Clarence Otis, Jr.
(age 66) | | Trustee | | March 2017 | | 136 | | Private investor | | VF Corporation, Director; Verizon Communications, Inc., Director; The Travelers Companies, Director |
Maryanne L. Roepke
(age 66) | | Trustee | | May 2014 | | 136 | | Private investor | | N/A |
Laurie J. Thomsen
(age 65) | | Trustee | | March 2005 | | 136 | | Private investor | | The Travelers Companies, Director; Dycom Industries, Inc., Director |
MFS Growth Allocation Portfolio
Trustees and Officers - continued
| Name, Age | | Position(s) Held with
Fund | | Trustee/Officer Since(h) | | Number of MFS Funds for which the Person is an Officer | | Principal Occupations During
the Past Five Years |
| OFFICERS | | | | | | | | |
Christopher R. Bohane (k)
(age 49) | | Assistant Secretary and Assistant Clerk | | July 2005 | | 136 | | Massachusetts Financial Services Company, Senior Vice President and Senior Managing Counsel |
Kino Clark (k)
(age 54) | | Assistant Treasurer | | January 2012 | | 136 | | Massachusetts Financial Services Company, Vice President |
John W. Clark, Jr. (k)
(age 55) | | Assistant Treasurer | | April 2017 | | 136 | | Massachusetts Financial Services Company, Vice President |
David L. DiLorenzo (k)
(age 54) | | President | | July 2005 | | 136 | | Massachusetts Financial Services Company, Senior Vice President |
Heidi W. Hardin (k)
(age 55) | | Secretary and Clerk | | April 2017 | | 136 | | Massachusetts Financial Services Company, Executive Vice President and General Counsel |
Brian E. Langenfeld (k)
(age 49) | | Assistant Secretary and Assistant Clerk | | June 2006 | | 136 | | Massachusetts Financial Services Company, Vice President and Managing Counsel |
Rosa E. Licea-Mailloux (k)
(age 46) | | Chief Compliance Officer | | March 2022 | | 136 | | Massachusetts Financial Services Company, Vice President (since 2018); Director of Corporate Compliance (2018-2021), Senior Director Compliance (2021-2022), Senior Managing Director of North American Compliance & Chief Compliance Officer (since March 2022); Natixis Investment Managers (investment management), Funds Chief Compliance Officer, Deputy General Counsel & Senior Vice President (until 2018) |
Amanda S. Mooradian (k)
(age 43) | | Assistant Secretary and Assistant Clerk | | September 2018 | | 136 | | Massachusetts Financial Services Company, Assistant Vice President and Senior Counsel |
Susan A. Pereira (k)
(age 52) | | Assistant Secretary and Assistant Clerk | | July 2005 | | 136 | | Massachusetts Financial Services Company, Vice President and Managing Counsel |
Kasey L. Phillips (k)
(age 52) | | Assistant Treasurer | | September 2012 | | 136 | | Massachusetts Financial Services Company, Vice President |
Matthew A. Stowe (k)
(age 48) | | Assistant Secretary and Assistant Clerk | | October 2014 | | 136 | | Massachusetts Financial Services Company, Vice President and Senior Managing Counsel |
William B. Wilson (k)
(age 40) | | Assistant Secretary and Assistant Clerk | | October 2022 | | 136 | | Massachusetts Financial Services Company, Assistant Vice President and Counsel |
James O. Yost (k)
(age 62) | | Treasurer | | September 1990 | | 136 | | Massachusetts Financial Services Company, Senior Vice President |
| (h) | Date first appointed to serve as Trustee/Officer of an MFS Fund. Each Trustee has served continuously since appointment unless indicated otherwise. From January 2012 through December 2016, Messrs. DiLorenzo and Yost served as Treasurer and Deputy Treasurer of the Funds, respectively. |
| (j) | Directorships or trusteeships of companies required to report to the Securities and Exchange Commission (i.e., “public companies”). |
| (k) | “Interested person” of the Trust within the meaning of the Investment Company Act of 1940 (referred to as the 1940 Act), which is the principal federal law governing investment companies like the fund, as a result of a position with MFS. The address of MFS is 111 Huntington Avenue, Boston, Massachusetts 02199-7618. |
Each Trustee (other than Messrs. Jones, Kilman and Roberge) has been elected by shareholders and each Trustee and Officer holds office until his or her successor is chosen and qualified or until his or her earlier death, resignation, retirement or removal. Mr. Roberge became a Trustee of the Funds on January 1, 2021 and Messrs. Jones and Kilman became Trustees of the Funds on January 1, 2019. The Trust does not hold annual meetings for the purpose of electing Trustees, and Trustees are not elected for fixed terms. Under the terms of the Board's retirement policy, an Independent Trustee shall retire at the end of the calendar year in which he or she reaches the earlier of 75 years of age or 15 years of service on the Board (or, in the case of any Independent Trustee who joined the Board prior to 2015, 20 years of service on the Board).
MFS Growth Allocation Portfolio
Trustees and Officers - continued
Messrs. Buller, Kilman and Otis and Ms. Roepke are members of the Trust’s Audit Committee.
Each of the Interested Trustees and certain Officers hold comparable officer positions with certain affiliates of MFS.
The Statement of Additional Information for a Fund includes further information about the Trustees and is available without charge upon request by calling 1-800-225-2606.
| Investment Adviser | Custodian |
Massachusetts Financial Services Company
111 Huntington Avenue
Boston, MA 02199-7618 | State Street Bank and Trust Company
1 Lincoln Street
Boston, MA 02111-2900 |
| Distributor | Independent Registered Public Accounting Firm |
MFS Fund Distributors, Inc.
111 Huntington Avenue
Boston, MA 02199-7618 | Deloitte & Touche LLP
200 Berkeley Street
Boston, MA 02116 |
| Portfolio Manager(s) | |
Joseph Flaherty
Natalie Shapiro | |
MFS Growth Allocation Portfolio
Board Review of Investment Advisory Agreement
MFS Growth Allocation Portfolio
The Investment Company Act of 1940 requires that both the full Board of Trustees and a majority of the non-interested (“independent”) Trustees, voting separately, annually approve the continuation of the Fund’s investment advisory agreement with MFS. The Trustees consider matters bearing on the Fund and its advisory arrangements at their meetings throughout the year, including a review of performance data at each regular meeting. In addition, the independent Trustees met several times over the course of three months beginning in May and ending in July, 2022 (“contract review meetings”) for the specific purpose of considering whether to approve the continuation of the investment advisory agreement for the Fund and the other investment companies that the Board oversees (the “MFS Funds”). The independent Trustees were assisted in their evaluation of the Fund’s investment advisory agreement by independent legal counsel, from whom they received separate legal advice and with whom they met separately from MFS during various contract review meetings. The independent Trustees were also assisted in this process by an independent consultant who was retained by and reported to the independent Trustees.
In connection with their deliberations regarding the continuation of the investment advisory agreement, the Trustees, including the independent Trustees, considered such information and factors as they believed, in light of the legal advice furnished to them and their own business judgment, to be relevant. The investment advisory agreement for the Fund was considered separately, although the Trustees also took into account the common interests of all MFS Funds in their review. As described below, the Trustees considered the nature, quality, and extent of the various investment advisory, administrative, and shareholder services performed by MFS under the existing investment advisory agreement and other arrangements with the Fund.
In connection with their contract review meetings, the Trustees received and relied upon materials that included, among other items: (i) information provided by Broadridge Financial Solutions, Inc. (“Broadridge”), an independent third party, on the investment performance of the Fund for various time periods ended December 31, 2021 and the investment performance of a group of funds with substantially similar investment classifications/objectives (the “Broadridge performance universe”), (ii) information provided by Broadridge on the Fund’s fees and expenses and the fees and expenses of comparable funds identified by Broadridge as well as all other funds in the same investment classification/category (the “Broadridge expense group and universe”), (iii) information as to whether and to what extent applicable expense waivers and reimbursements are observed for the Fund, (iv) information regarding MFS’ financial results and financial condition, including MFS’ and certain of its affiliates’ estimated profitability from services performed for the Fund and the MFS Funds as a whole, and compared to MFS’ institutional business, (v) MFS’ views regarding the outlook for the mutual fund industry and the strategic business plans of MFS, (vi) descriptions of various functions performed by MFS for the Funds, such as compliance monitoring and portfolio trading practices, and (vii) information regarding the overall organization of MFS, including information about MFS’ senior management and other personnel providing investment advisory, administrative and other services to the Fund and the other MFS Funds. The comparative performance, fee and expense information prepared and provided by Broadridge was not independently verified and the independent Trustees did not independently verify any information provided to them by MFS.
The Trustees’ conclusion as to the continuation of the investment advisory agreement was based on a comprehensive consideration of all information provided to the Trustees and not the result of any single factor. Some of the factors that figured particularly in the Trustees’ deliberations are described below, although individual Trustees may have evaluated the information presented differently from one another, giving different weights to various factors. It is also important to recognize that the fee arrangements for the Fund and other MFS Funds are the result of years of review and discussion between the independent Trustees and MFS, that certain aspects of such arrangements may receive greater scrutiny in some years than in others, and that the Trustees’ conclusions may be based, in part, on their consideration of these same arrangements during the course of the year and in prior years.
Based on information provided by Broadridge and MFS, the Trustees reviewed the Fund’s total return investment performance as well as the Broadridge performance universe over various time periods. The Trustees placed particular emphasis on the total return performance of the Fund’s Initial Class shares in comparison to the performance of funds in its Broadridge performance universe over the five-year period ended December 31, 2021, which the Trustees believed was a long enough period to reflect differing market conditions. The total return performance of the Fund’s Initial Class shares was in the 1st quintile relative to the other funds in the universe for this five-year period (the 1st quintile being the best performers and the 5th quintile being the worst performers). The total return performance of the Fund’s Initial Class shares was in the 3rd quintile for the one-year period and the 1st quintile for the three-year period ended December 31, 2021 relative to the Broadridge performance universe. Because of the passage of time, these performance results may differ from the performance results for more recent periods, including those shown elsewhere in this report.
In the course of their deliberations, the Trustees took into account information provided by MFS in connection with the contract review meetings, as well as during investment review meetings conducted with portfolio management personnel during the course of the year regarding the Fund’s performance. After reviewing these and related factors, the Trustees concluded, within the context of their overall conclusions regarding the investment advisory agreement, that they were satisfied with MFS’ responses and efforts relating to investment performance.
MFS Growth Allocation Portfolio
Board Review of Investment Advisory Agreement - continued
The Trustees considered that MFS does not charge an advisory fee for providing investment advisory services to the Fund, but that the Fund pays its pro rata share of the advisory fees paid by the underlying funds in which it invests (the “Underlying Funds”).
In assessing the reasonableness of the Fund’s expenses, the Trustees considered, among other information, the Fund’s total expense ratio of the Fund’s Initial Class shares as a percentage of average daily net assets and the total expense ratios of the Broadridge expense group based on information provided by Broadridge. The Trustees considered that MFS currently observes an expense limitation for the Fund, which may not be changed without the Trustees’ approval. The Trustees also considered that, according to the data provided by Broadridge (which takes into account any expense limitations that were in effect during the Fund’s last fiscal year), the Fund’s total expense ratio was lower than the Broadridge expense group median. Because the Fund does not pay an advisory fee, the Trustees did not consider the extent to which economies of scale would be realized due to the Fund’s growth of assets, whether fee levels reflect economies of scale for shareholders, or the fees paid by similar funds to other investment advisers or by similar clients of MFS.
The Trustees also considered information prepared by MFS relating to MFS’ costs and profits with respect to the Fund, the MFS Funds considered as a group, and other investment companies and accounts advised by MFS, as well as MFS’ methodologies used to determine and allocate its costs to the MFS Funds, the Fund and other accounts and products for purposes of estimating profitability.
In addition, the Trustees considered MFS’ resources and related efforts to continue to retain, attract and motivate capable personnel to serve the Fund. The Trustees also considered current and developing conditions in the financial services industry, including the presence of large and well-capitalized companies which are spending, and appear to be prepared to continue to spend, substantial sums to engage personnel and to provide services to competing investment companies. In this regard, the Trustees also considered the financial resources of MFS and its ultimate parent, Sun Life Financial Inc. The Trustees also considered the advantages and possible disadvantages to the Fund of having an adviser that also serves other investment companies as well as other accounts.
The Trustees also considered the nature, quality, cost, and extent of administrative, transfer agency, and distribution services provided to the Fund by MFS and its affiliates under agreements and plans other than the investment advisory agreement, including any 12b-1 fees the Fund pays to MFS Fund Distributors, Inc., an affiliate of MFS. The Trustees also considered the nature, extent and quality of certain other services MFS performs or arranges for on the Fund’s or the Underlying Funds’ behalf, which may include securities lending programs, directed expense payment programs, class action recovery programs, and MFS’ interaction with third-party service providers, principally custodians and sub-custodians. The Trustees concluded that the various non-advisory services provided by MFS and its affiliates on behalf of the Fund were satisfactory.
The Trustees considered so-called “fall-out benefits” to MFS such as reputational value derived from serving as investment manager to the MFS Funds. The Trustees also considered that MFS discontinued its historic practice of obtaining investment research from portfolio brokerage commissions paid by certain MFS Funds effective January 2018, and directly pays or voluntarily reimburses a Fund, if applicable, for the costs of external research acquired through the use of the Fund’s portfolio brokerage commissions.
Based on their evaluation of factors that they deemed to be material, including those factors described above, the Board of Trustees, including the independent Trustees, concluded that the Fund’s investment advisory agreement with MFS should be continued for an additional one-year period, commencing August 1, 2022.
MFS Growth Allocation Portfolio
Proxy Voting Policies and Information
MFS votes proxies on behalf of the fund pursuant to proxy voting policies and procedures that are available without charge, upon request, by calling 1-800-225-2606, by visiting mfs.com/proxyvoting, or by visiting the SEC’s Web site at http://www.sec.gov.
Information regarding how the fund voted proxies relating to portfolio securities during the most recent twelve-month period ended June 30 is available by August 31 of each year without charge by visiting mfs.com/proxyvoting, or by visiting the SEC’s Web site at http://www.sec.gov.
Quarterly Portfolio Disclosure
The fund files a complete schedule of portfolio holdings with the SEC for the first and third quarters of each fiscal year as an exhibit to its reports on Form N-PORT. The fund’s Form N-PORT reports are available on the SEC’s Web site at http://www.sec.gov. A shareholder can obtain the portfolio holdings report for the first and third quarters of the fund's fiscal year at mfs.com/vit3 by choosing the fund's name and then scrolling to the “Resources” section and clicking on the “Prospectus and Reports” tab.
FURTHER INFORMATION
From time to time, MFS may post important information about the fund or the MFS Funds on the MFS Web site (mfs.com). This information is available at https://www.mfs.com/announcements or at mfs.com/vit3 by choosing the fund's name and then scrolling to the “Resources” section and clicking on the “Announcements” tab, if any.
Information About Fund Contracts and Legal Claims
The fund has entered into contractual arrangements with an investment adviser, administrator, distributor, shareholder servicing agent, and custodian who each provide services to the fund. Unless expressly stated otherwise, shareholders are not parties to, or intended beneficiaries of these contractual arrangements, and these contractual arrangements are not intended to create any shareholder right to enforce them against the service providers or to seek any remedy under them against the service providers, either directly or on behalf of the fund.
Under the Trust’s By-Laws and Declaration of Trust, any claims asserted against or on behalf of the MFS Funds, including claims against Trustees and Officers, must be brought in state and federal courts located within the Commonwealth of Massachusetts.
Federal Tax Information (unaudited)
The following information is provided pursuant to provisions of the Internal Revenue Code.
The fund designates $36,178,000 as capital gain dividends paid during the fiscal year.
For corporate shareholders, 28.49% of the ordinary income dividends paid during the fiscal year qualify for the corporate dividends received deduction.
The fund intends to pass through the maximum amount allowable as Section 163(j) Interest Dividends as defined in Treasury Regulation §1.163(j)-1(b).
| FACTS | WHAT DOES MFS DO WITH YOUR PERSONAL INFORMATION? |
| Why? | Financial companies choose how they share your personal information. Federal law gives consumers the right to limit some but not all sharing. Federal law also requires us to tell you how we collect, share, and protect your personal information. Please read this notice carefully to understand what we do. |
| What? | The types of personal information we collect and share depend on the product or service you have with us. This information can include: |
| • Social Security number and account balances |
| • Account transactions and transaction history |
| • Checking account information and wire transfer instructions |
| When you are no longer our customer, we continue to share your information as described in this notice. |
| How? | All financial companies need to share customers' personal information to run their everyday business. In the section below, we list the reasons financial companies can share their customers' personal information; the reasons MFS chooses to share; and whether you can limit this sharing. |
Reasons we can share your
personal information | Does MFS share? | Can you limit
this sharing? |
For our everyday business purposes –
such as to process your transactions, maintain your
account(s), respond to court orders and legal
investigations, or report to credit bureaus | Yes | No |
For our marketing purposes –
to offer our products and services to you | No | We don't share |
For joint marketing with other
financial companies | No | We don't share |
For our affiliates' everyday business purposes –
information about your transactions and experiences | No | We don't share |
For our affiliates' everyday business purposes –
information about your creditworthiness | No | We don't share |
| For nonaffiliates to market to you | No | We don't share |
| Questions? | Call 800-225-2606 or go to mfs.com. |
| Who we are |
| Who is providing this notice? | MFS Funds, MFS Investment Management, MFS Institutional Advisors, Inc., and MFS Heritage Trust Company. |
| What we do |
How does MFS
protect my personal
information? | To protect your personal information from unauthorized access and use, we use security measures that comply with federal law. These measures include procedural, electronic, and physical safeguards for the protection of the personal information we collect about you. |
How does MFS
collect my personal
information? | We collect your personal information, for example, when you |
| • open an account or provide account information |
| • direct us to buy securities or direct us to sell your securities |
| • make a wire transfer |
| We also collect your personal information from others, such as credit bureaus, affiliates, or other companies. |
| Why can't I limit all sharing? | Federal law gives you the right to limit only |
| • sharing for affiliates' everyday business purposes – information about your creditworthiness |
| • affiliates from using your information to market to you |
| • sharing for nonaffiliates to market to you |
| State laws and individual companies may give you additional rights to limit sharing. |
| Definitions |
| Affiliates | Companies related by common ownership or control. They can be financial and nonfinancial companies. |
| • MFS does not share personal information with affiliates, except for everyday business purposes as described on page one of this notice. |
| Nonaffiliates | Companies not related by common ownership or control. They can be financial and nonfinancial companies. |
| • MFS does not share with nonaffiliates so they can market to you. |
| Joint marketing | A formal agreement between nonaffiliated financial companies that together market financial products or services to you. |
| • MFS doesn't jointly market. |
| Other important information |
| If you own an MFS product or receive an MFS service in the name of a third party such as a bank or broker-dealer, their privacy policy may apply to you instead of ours. |
Annual Report
December 31, 2022
MFS® Inflation-Adjusted
Bond Portfolio
MFS® Variable Insurance Trust III
MFS® Inflation-Adjusted Bond Portfolio
| 1 |
| 2 |
| 4 |
| 5 |
| 7 |
| 8 |
| 13 |
| 14 |
| 15 |
| 16 |
| 18 |
| 26 |
| 27 |
| 30 |
| 32 |
| 32 |
| 32 |
| 32 |
| 32 |
| 33 |
The report is prepared for the general information of shareholders. It is authorized for distribution to prospective investors only when preceded or accompanied by a current prospectus.
NOT FDIC INSURED • MAY LOSE VALUE • NO BANK OR CREDIT UNION GUARANTEE •
NOT A DEPOSIT • NOT INSURED BY ANY FEDERAL GOVERNMENT AGENCY OR NCUA/NCUSIF
MFS Inflation-Adjusted Bond Portfolio
LETTER FROM THE CHAIR AND CEO
Dear Shareholders:
Signs of peaking inflation, hopes that monetary policy tightening cycles may be nearing an end and a rapid reopening of China’s economy in late-2022 and early-2023 have combined to bolster investor sentiment in recent months. Markets have largely adjusted to the challenges posed by Russia’s invasion of Ukraine, thanks in part to mild European winter weather which has alleviated concerns over potential shortages of natural gas. Resilient labor markets in much of the developed world have further contributed to a brighter-than-expected economic backdrop. However, many investors are mindful that the lagged effects of ongoing policy tightening have yet to work their way through the global economy.
Tighter global financial conditions have been a particular headwind for richly valued growth equities and interest rate-sensitive parts of the economy, such as housing. Over the near term, companies may face a challenging earnings backdrop as they are forced to absorb higher input and labor costs at a time of dwindling pricing power. For fixed income, the rise in interest rates has made bonds more attractive than they have been in years, which may provide balance to an overall portfolio.
During times of market transition, it is important to have a deep understanding of company fundamentals, and we have built our unique global research platform to do just that.
At MFS®, we put our clients’ assets to work responsibly by carefully navigating increasingly complex global capital markets. Our investment team is guided by a commitment to long-term fundamental investing. Our global investment platform — combining collective expertise, long-term discipline, and thoughtful risk management — seeks to uncover what we believe are the best, most durable investment ideas in markets around the world, enabling us to potentially create value for investors.
Respectfully,
Michael W. Roberge
Chair and Chief Executive Officer
MFS Investment Management
February 15, 2023
The opinions expressed in this letter are subject to change and may not be relied upon for investment advice. No forecasts can be guaranteed.
MFS Inflation-Adjusted Bond Portfolio
Portfolio structure (i)
Fixed income sectors (i)
| Non-U.S. Government Bonds | 56.5% |
| U.S. Treasury Securities | 41.6% |
| Commercial Mortgage-Backed Securities | 1.1% |
| Mortgage-Backed Securities | 0.8% |
| Investment Grade Corporates | 0.6% |
| Municipal Bonds | 0.2% |
Composition including fixed income credit quality (a)(i)
| AAA | 9.9% |
| AA | 34.8% |
| A | 3.1% |
| BBB | 11.7% |
| U.S. Government | 40.5% |
| Federal Agencies | 0.8% |
| Not Rated (o) | 0.0% |
| Cash & Cash Equivalents | 0.2% |
| Other | (1.0)% |
Portfolio facts
| Average Duration (d) | 9.2 |
| Average Effective Maturity (m) | 10.1 yrs. |
Issuer country weightings (i)(x)
| United States | 43.5% |
| United Kingdom | 25.3% |
| France | 9.1% |
| Spain | 8.1% |
| Canada | 4.3% |
| Italy | 3.4% |
| Japan | 2.7% |
| Australia | 1.2% |
| Germany | 1.1% |
| Other Countries | 1.3% |
Currency exposure weightings (i)(y)
| United States Dollar | 51.9% |
| Euro | 21.1% |
| British Pound Sterling | 20.0% |
| Japanese Yen | 3.0% |
| Canadian Dollar | 2.7% |
| Australian Dollar | 1.0% |
| Swedish Krona | 0.7% |
| Danish Krone | 0.1% |
| New Zealand Dollar | (0.5)% |
| (a) | For all securities other than those specifically described below, ratings are assigned to underlying securities utilizing ratings from Moody’s, Fitch, and Standard & Poor’s rating agencies and applying the following hierarchy: If all three agencies provide a rating, the middle rating (after dropping the highest and lowest ratings) is assigned; if two of the three agencies rate a security, the lower of the two is assigned. If none of the 3 rating agencies above assign a rating, but the security is rated by DBRS Morningstar, then the DBRS Morningstar rating is assigned. If none of the 4 rating agencies listed above rate the security, but the security is rated by the Kroll Bond Rating Agency (KBRA), then the KBRA rating is assigned. Ratings are shown in the S&P and Fitch scale (e.g., AAA). Securities rated BBB or higher are considered investment grade. All ratings are subject to change. U.S. Government includes securities issued by the U.S. Department of the Treasury. Federal Agencies includes rated and unrated U.S. Agency fixed-income securities, U.S. Agency mortgage-backed securities, and collateralized mortgage obligations of U.S. Agency mortgage-backed securities. Not Rated includes fixed income securities and fixed income derivatives that have not been rated by any rating agency. The fund may or may not have held all of these instruments on this date. The fund is not rated by these agencies. |
| (d) | Duration is a measure of how much a bond’s price is likely to fluctuate with general changes in interest rates, e.g., if rates rise 1.00%, a bond with a 5-year duration is likely to lose about 5.00% of its value due to the interest rate move. The Average Duration calculation reflects the impact of the equivalent exposure of derivative positions, if any. |
| (i) | For purposes of this presentation, the components include the value of securities, and reflect the impact of the equivalent exposure of derivative positions, if any. These amounts may be negative from time to time. Equivalent exposure is a calculated amount that translates the derivative position into a reasonable approximation of the amount of the underlying asset that the portfolio would have to hold at a given point in time to have the same price sensitivity that results from the portfolio’s ownership of the derivative contract. When dealing with derivatives, equivalent exposure is a more representative measure of the potential impact of a position on portfolio performance than value. The bond component will include any accrued interest amounts. |
MFS Inflation-Adjusted Bond Portfolio
Portfolio Composition - continued
| (m) | In determining each instrument’s effective maturity for purposes of calculating the fund’s dollar-weighted average effective maturity, MFS uses the instrument’s stated maturity or, if applicable, an earlier date on which MFS believes it is probable that a maturity-shortening device (such as a put, pre-refunding or prepayment) will cause the instrument to be repaid. Such an earlier date can be substantially shorter than the instrument’s stated maturity. |
| (x) | Represents the portfolio’s exposure to issuer countries as a percentage of a portfolio’s net assets. For purposes of this presentation, United States includes Cash & Cash Equivalents and Other. |
| (y) | Represents the portfolio’s exposure to a particular currency as a percentage of a portfolio's net assets. For purposes of this presentation, United States Dollar includes Cash & Cash Equivalents. |
Where the fund holds convertible bonds, they are treated as part of the equity portion of the portfolio.
Cash & Cash Equivalents includes any cash, investments in money market funds, short-term securities, and other assets less liabilities. Please see the Statement of Assets and Liabilities for additional information related to the fund’s cash position and other assets and liabilities.
Other includes equivalent exposure from currency derivatives and/or any offsets to derivative positions and may be negative.
Percentages are based on net assets as of December 31, 2022.
The portfolio is actively managed and current holdings may be different.
MFS Inflation-Adjusted Bond Portfolio
Management Review
Summary of Results
For the twelve months ended December 31, 2022, Initial Class shares of the MFS Inflation-Adjusted Bond Portfolio (fund) provided a total return of -21.55%, while Service Class shares of the fund provided a total return of -21.66%. These compare with a return of -21.86% over the same period for the fund’s benchmark, the Bloomberg World Government Inflation-Linked Bond Index.
Market Environment
During the reporting period, markets continued to grapple with the strongest global inflationary pressures in decades along with signs of slowing economic growth. Intermittent coronavirus flareups, particularly in China, where home-grown vaccines have proved less effective than elsewhere, kept supply chains stretched for a considerable period. At the same time, the reopening of the economy in the parts of the world where the virus has been better contained has led to a shift in consumption patterns in favor of services, straining already tight labor markets in most developed economies, while reducing demand for manufactured goods, primarily from Asia. As a result of Russia’s invasion of Ukraine, geopolitical considerations, such as sanctions and trade bans, have resulted in additional supply chain disruptions and volatile global energy prices. Taken together, these factors have contributed to market volatility.
The ripple effects from the Russian invasion further complicated the mission central banks must undertake to rein in surging inflation. Energy shocks have historically resulted in global growth slowdowns, if not pullbacks, so policymakers will find themselves in the difficult position of trying to restrain inflation without tipping economies into recession. Despite the challenging macroeconomic and geopolitical environment, policymakers remained focused on controlling inflation, although investors appeared to have expected varying degrees of action from the central banks. The Fed has been among the most aggressive developed market central banks, tightening policy at the fastest rate in decades, although it slowed its hiking pace at the end of the period, as did the European Central Bank. After remaining on the monetary sidelines for much of the period, the Bank of Japan widened its Yield Curve Control band, capping the yield on its 10-year bond at 0.5%, up from 0.25%, an action investors interpreted as a first step toward monetary policy normalization.
Against an environment of still-tight labor markets, tighter global financial conditions and volatile materials prices, investor anxiety appeared to have increased over the potential that corporate profit margins may be past peak for this cycle. That said, tentative signs that supply chain bottlenecks (particularly semiconductors) may be moderating, the easing of COVID restrictions in China, low levels of unemployment across developed markets and hopes that inflation levels may be near a peak were supportive factors for the macroeconomic backdrop.
Factors Affecting Performance
Relative to the Bloomberg World Government Inflation-Linked Bond Index, the fund's duration(d) stance and yield curve(y) positioning along both United Kingdom and Canada curves supported relative performance. From a country perspective, the fund’s underweight exposure to the United States and overweight exposure to Germany also benefited relative returns. Within the United States, the fund’s underweight exposure to the 3- and 5-year key interest rates, and overweight exposure to 15- and 20-year key rates, significantly contributed to relative returns. The fund’s underweight exposure to the British pound, euro and New Zealand dollar further strengthened relative performance.
Conversely, the fund’s long relative duration stance and yield curve positioning along the New Zealand curve detracted from relative returns. From a country perspective, an underweight exposure to France and bond selection within the UK dampened relative returns. Additionally, the fund’s overweight exposure to 7- and 10-year key interest rates within the United States held back relative performance. The fund’s slight overweight allocation to the Norwegian krone also weakened relative results.
Respectfully,
Portfolio Manager(s)
Robert Spector and Erik Weisman
| (d) | Duration is a measure of how much a bond’s price is likely to fluctuate with general changes in interest rates, e.g., if rates rise 1.00%, a bond with a 5-year duration is likely to lose about 5.00% of its value. |
| (y) | A yield curve graphically depicts the yields of different maturity bonds of the same credit quality and type; a normal yield curve is upward sloping, with short-term rates lower than long-term rates. |
The views expressed in this report are those of the portfolio manager(s) only through the end of the period of the report as stated on the cover and do not necessarily reflect the views of MFS or any other person in the MFS organization. These views are subject to change at any time based on market or other conditions, and MFS disclaims any responsibility to update such views. These views may not be relied upon as investment advice or an indication of trading intent on behalf of any MFS portfolio. References to specific securities are not recommendations of such securities, and may not be representative of any MFS portfolio’s current or future investments.
MFS Inflation-Adjusted Bond Portfolio
Performance Summary Through 12/31/22
The following chart illustrates the historical performance of the fund in comparison to its benchmark(s). Benchmarks are unmanaged and may not be invested in directly. Benchmark returns do not reflect any fees or expenses. The performance of other share classes will be greater than or less than that of the class depicted below. (See Notes to Performance Summary.)
Performance data shown represents past performance and is no guarantee of future results. Investment return and principal value fluctuate so your shares, when sold, may be worth more or less than the original cost; current performance may be lower or higher than quoted. The performance shown does not reflect the deduction of taxes, if any, that a shareholder would pay on fund distributions or the redemption of fund shares. The returns for the fund shown also do not reflect the deduction of expenses associated with variable products, such as mortality and expense risk charges, separate account charges, and sales charges imposed by the insurance company separate accounts. Such expenses would reduce the overall returns shown.
Growth of a Hypothetical $10,000 Investment
Total Returns through 12/31/22
Average annual total returns
| Share Class | Class Inception Date | 1-yr | 5-yr | 10-yr |
| Initial Class | 10/01/08 | (21.55)% | (1.31)% | (0.28)% |
| Service Class | 10/01/08 | (21.66)% | (1.54)% | (0.52)% |
Comparative benchmark(s)
| Bloomberg World Government Inflation-Linked Bond Index (f) | (21.86)% | (1.20)% | 0.03% |
| (f) | Source: FactSet Research Systems Inc. |
Benchmark Definition(s)
Bloomberg World Government Inflation-Linked Bond Index(a) – measures the performance of the major government inflation-linked bond markets.
It is not possible to invest directly in an index.
| (a) | Source: Bloomberg Index Services Limited. BLOOMBERG® is a trademark and service mark of Bloomberg Finance L.P. and its affiliates (collectively “Bloomberg”). Bloomberg or Bloomberg's licensors own all proprietary rights in the Bloomberg Indices. Bloomberg neither approves or endorses this material, or guarantees the accuracy or completeness of any information herein, or makes any warranty, express or implied, as to the results to be obtained therefrom and, to the maximum extent allowed by law, neither shall have any liability or responsibility for injury or damages arising in connection therewith. |
MFS Inflation-Adjusted Bond Portfolio
Performance Summary – continued
Notes to Performance Summary
Average annual total return represents the average annual change in value for each share class for the periods presented.
Performance results reflect any applicable expense subsidies and waivers in effect during the periods shown. Without such subsidies and waivers the fund's performance results would be less favorable. Please see the prospectus and financial statements for complete details. All results are historical and assume the reinvestment of any dividends and capital gains distributions.
Performance results do not include adjustments made for financial reporting purposes in accordance with U.S. generally accepted accounting principles and may differ from amounts reported in the financial highlights.
From time to time the fund may receive proceeds from litigation settlements, without which performance would be lower.
MFS Inflation-Adjusted Bond Portfolio
Expense Table
Fund expenses borne by the shareholders during the period,
July 1, 2022 through December 31, 2022
As a shareholder of the fund, you incur ongoing costs, including management fees; distribution and/or service (12b-1) fees; and other fund expenses. This example is intended to help you understand your ongoing costs (in dollars) of investing in the fund and to compare these costs with the ongoing costs of investing in other mutual funds.
The example is based on an investment of $1,000 invested at the beginning of the period and held for the entire period July 1, 2022 through December 31, 2022.
Actual Expenses
The first line for each share class in the following table provides information about actual account values and actual expenses. You may use the information in this line, together with the amount you invested, to estimate the expenses that you paid over the period. Simply divide your account value by $1,000 (for example, an $8,600 account value divided by $1,000 = 8.6), then multiply the result by the number in the first line under the heading entitled “Expenses Paid During Period” to estimate the expenses you paid on your account during this period.
Hypothetical Example for Comparison Purposes
The second line for each share class in the following table provides information about hypothetical account values and hypothetical expenses based on the fund’s actual expense ratio and an assumed rate of return of 5% per year before expenses, which is not the fund’s actual return. The hypothetical account values and expenses may not be used to estimate the actual ending account balance or expenses you paid for the period. You may use this information to compare the ongoing costs of investing in the fund and other funds. To do so, compare this 5% hypothetical example with the 5% hypothetical examples that appear in the shareholder reports of the other funds.
Please note that the expenses shown in the table are meant to highlight the fund's ongoing costs only and do not take into account the fees and expenses imposed under the variable contracts through which your investment in the fund is made. Therefore, the second line for each share class in the table is useful in comparing ongoing costs associated with an investment in vehicles (such as the fund) which fund benefits under variable annuity and variable life insurance contracts and to qualified pension and retirement plans only, and will not help you determine the relative total costs of investing in the fund through variable annuity and variable life insurance contracts. If the fees and expenses imposed under the variable contracts were included, your costs would have been higher.
Share
Class | | Annualized
Expense
Ratio | Beginning
Account Value
7/01/22 | Ending
Account Value
12/31/22 | Expenses
Paid During
Period (p)
7/01/22-12/31/22 |
| Initial Class | Actual | 0.57% | $1,000.00 | $944.39 | $2.79 |
| Hypothetical (h) | 0.57% | $1,000.00 | $1,022.33 | $2.91 |
| Service Class | Actual | 0.82% | $1,000.00 | $943.60 | $4.02 |
| Hypothetical (h) | 0.82% | $1,000.00 | $1,021.07 | $4.18 |
| (h) | 5% class return per year before expenses. |
| (p) | “Expenses Paid During Period” are equal to each class's annualized expense ratio, as shown above, multiplied by the average account value over the period, multiplied by 184/365 (to reflect the one-half year period). |
MFS Inflation-Adjusted Bond Portfolio
Portfolio of Investments − 12/31/22
The Portfolio of Investments is a complete list of all securities owned by your fund. It is categorized by broad-based asset classes.
| Issuer | | | Shares/Par | Value ($) |
| Bonds – 100.6% |
| Asset-Backed & Securitized – 1.1% |
| 3650R Commercial Mortgage Trust, 2021-PF1, “XA”, 1.028%, 11/15/2054 (i) | | $ | 2,104,030 | $ 123,959 |
| BBCMS Mortgage Trust, 2021-C10, “XA”, 1.297%, 7/15/2054 (i) | | | 2,080,304 | 150,594 |
| BBCMS Mortgage Trust, 2021-C9, “XA”, 1.626%, 2/15/2054 (i) | | | 1,332,907 | 120,625 |
| Benchmark 2021-B23 Mortgage Trust, “XA”, 1.271%, 2/15/2054 (i) | | | 4,273,789 | 288,191 |
| Benchmark 2021-B24 Mortgage Trust, “XA”, 1.151%, 3/15/2054 (i) | | | 2,520,395 | 153,553 |
| Benchmark 2021-B27 Mortgage Trust, “XA”, 1.266%, 7/15/2054 (i) | | | 3,290,217 | 231,853 |
| Benchmark 2021-B28 Mortgage Trust, “XA”, 1.282%, 8/15/2054 (i) | | | 3,946,552 | 278,132 |
| Commercial Mortgage Pass-Through Certificates, 2021-BN31, “XA”, 1.325%, 2/15/2054 (i) | | | 3,299,089 | 247,811 |
| Commercial Mortgage Pass-Through Certificates, 2021-BN35, “XA”, 1.046%, 6/15/2064 (i) | | | 1,300,175 | 77,403 |
| Morgan Stanley Capital I Trust, 2021-L5, “XA”, 1.296%, 5/15/2054 (i) | | | 1,654,008 | 114,136 |
| Morgan Stanley Capital I Trust, 2021-L6, “XA”, 1.228%, 6/15/2054 (i) | | | 2,008,643 | 127,201 |
| Wells Fargo Commercial Mortgage Trust, 2021-C60, “XA”, 1.546%, 8/15/2054 (i) | | | 1,460,534 | 128,816 |
| | | | | $2,042,274 |
| Consumer Services – 0.2% |
| Conservation Fund, 3.474%, 12/15/2029 | | $ | 312,000 | $ 268,253 |
| Industrial – 0.1% |
| Howard University, Washington D.C., AGM, 2.416%, 10/01/2024 | | $ | 66,000 | $ 62,323 |
| Howard University, Washington D.C., AGM, 2.516%, 10/01/2025 | | | 82,000 | 76,586 |
| | | | | $138,909 |
| International Market Sovereign – 57.5% |
| Commonwealth of Australia, Inflation Linked Bond, 3%, 9/20/2025 | | AUD | 1,722,500 | $ 1,238,030 |
| Commonwealth of Australia, Inflation Linked Bond, 2%, 8/21/2035 | | | 1,121,400 | 775,531 |
| Commonwealth of Australia, Inflation Linked Bond, 1.25%, 8/21/2040 | | | 83,692 | 50,817 |
| Federal Republic of Germany, Inflation Linked Bond, 0.1%, 4/15/2026 | | EUR | 2,824,643 | 2,997,997 |
| Federal Republic of Germany, Inflation Linked Bond, 0.5%, 4/15/2030 | | | 176,627 | 192,052 |
| Federal Republic of Germany, Inflation Linked Bond, 0.1%, 4/15/2033 | | | 283,247 | 298,741 |
| Federal Republic of Germany, Inflation Linked Bond, 0.1%, 4/15/2046 | | | 652,408 | 699,906 |
| Government of Canada, Inflation Linked Bond, 4.25%, 12/01/2026 | | CAD | 525,402 | 427,974 |
| Government of Canada, Inflation Linked Bond, 4%, 12/01/2031 | | | 841,590 | 754,591 |
| Government of Canada, Inflation Linked Bond, 3%, 12/01/2036 | | | 6,160,481 | 5,501,073 |
| Government of Canada, Inflation Linked Bond, 1.25%, 12/01/2047 | | | 1,621,841 | 1,196,868 |
| Government of Japan, Inflation Linked Bond, 0.1%, 3/10/2026 | | JPY | 400,805,000 | 3,168,510 |
| Government of Japan, Inflation Linked Bond, 0.005%, 3/10/2031 | | | 224,507,300 | 1,776,523 |
| Government of New Zealand, Inflation Linked Bond, 3%, 9/20/2030 | | NZD | 597,294 | 396,502 |
| Government of New Zealand, Inflation Linked Bond, 2.5%, 9/20/2035 | | | 1,966,413 | 1,246,438 |
| Kingdom of Spain, Inflation Linked Bond, 0.15%, 11/30/2023 | | EUR | 5,066,921 | 5,457,630 |
| Kingdom of Spain, Inflation Linked Bond, 1.8%, 11/30/2024 | | | 3,621,420 | 3,986,711 |
| Kingdom of Spain, Inflation Linked Bond, 0.65%, 11/30/2027 | | | 180,227 | 190,946 |
| Kingdom of Spain, Inflation Linked Bond, 1%, 11/30/2030 | | | 5,003,117 | 5,331,806 |
| Kingdom of Spain, Inflation Linked Bond, 0.7%, 11/30/2033 (n) | | | 131,408 | 132,100 |
| Kingdom of Sweden, Inflation Linked Bond, 0.125%, 6/01/2030 (n) | | SEK | 6,855,143 | 740,964 |
| Republic of France, Inflation Linked Bond, 0.25%, 7/25/2024 | | EUR | 11,792,994 | 12,722,649 |
| Republic of France, Inflation Linked Bond, 0.1%, 7/25/2036 (n) | | | 353,339 | 342,186 |
| Republic of France, Inflation Linked Bond, 1.8%, 7/25/2040 | | | 1,380,640 | 1,730,012 |
| Republic of France, Inflation Linked Bond, 0.1%, 7/25/2047 | | | 1,401,693 | 1,297,516 |
| Republic of France, Inflation Linked Bond, 0.1%, 7/25/2053 (n) | | | 734,377 | 672,145 |
| Republic of Italy, Inflation Linked Bond, 3.1%, 9/15/2026 | | | 2,135,012 | 2,427,278 |
| Republic of Italy, Inflation Linked Bond, 0.4%, 5/15/2030 | | | 1,691,730 | 1,584,801 |
| Republic of Italy, Inflation Linked Bond, 1.25%, 9/15/2032 | | | 2,408,420 | 2,339,742 |
| United Kingdom Treasury, Inflation Linked Bond, 0.125%, 3/22/2024 | | GBP | 7,399,527 | 9,082,527 |
| United Kingdom Treasury, Inflation Linked Bond, 0.125%, 3/22/2029 | | | 6,183,584 | 7,451,624 |
| United Kingdom Treasury, Inflation Linked Bond, 0.75%, 3/22/2034 | | | 3,713,272 | 4,717,289 |
MFS Inflation-Adjusted Bond Portfolio
Portfolio of Investments – continued
| Issuer | | | Shares/Par | Value ($) |
| Bonds – continued |
| International Market Sovereign – continued |
| United Kingdom Treasury, Inflation Linked Bond, 2%, 1/26/2035 | | GBP | 1,774,824 | $ 2,648,935 |
| United Kingdom Treasury, Inflation Linked Bond, 1.125%, 11/22/2037 | | | 2,316,925 | 3,082,807 |
| United Kingdom Treasury, Inflation Linked Bond, 0.625%, 3/22/2040 | | | 2,127,916 | 2,645,276 |
| United Kingdom Treasury, Inflation Linked Bond, 0.625%, 11/22/2042 | | | 2,079,666 | 2,575,844 |
| United Kingdom Treasury, Inflation Linked Bond, 0.125%, 3/22/2044 | | | 586,486 | 648,566 |
| United Kingdom Treasury, Inflation Linked Bond, 0.125%, 3/22/2046 | | | 1,112,727 | 1,211,164 |
| United Kingdom Treasury, Inflation Linked Bond, 0.75%, 11/22/2047 | | | 2,191,872 | 2,740,723 |
| United Kingdom Treasury, Inflation Linked Bond, 0.5%, 3/22/2050 | | | 729,703 | 871,959 |
| United Kingdom Treasury, Inflation Linked Bond, 0.25%, 3/22/2052 | | | 2,046,302 | 2,276,521 |
| United Kingdom Treasury, Inflation Linked Bond, 1.25%, 11/22/2055 | | | 721,198 | 1,072,216 |
| United Kingdom Treasury, Inflation Linked Bond, 0.125%, 3/22/2058 | | | 1,976,990 | 2,128,341 |
| United Kingdom Treasury, Inflation Linked Bond, 0.375%, 3/22/2062 | | | 1,320,605 | 1,589,598 |
| United Kingdom Treasury, Inflation Linked Bond, 0.125%, 11/22/2065 | | | 827,779 | 919,951 |
| United Kingdom Treasury, Inflation Linked Bond, 0.125%, 3/22/2068 | | | 1,006,070 | 1,120,893 |
| United Kingdom Treasury, Inflation Linked Bond, 0.125%, 3/22/2073 | | | 196,474 | 230,410 |
| | | | | $106,692,683 |
| Medical & Health Technology & Services – 0.3% |
| ProMedica Toledo Hospital, “B”, AGM, 5.325%, 11/15/2028 | | $ | 487,000 | $ 480,819 |
| ProMedica Toledo Hospital, “B”, AGM, 5.75%, 11/15/2038 | | | 144,000 | 135,417 |
| | | | | $616,236 |
| Mortgage-Backed – 0.8% | |
| Freddie Mac, 1.8%, 4/25/2030 (i) | | $ | 564,669 | $ 59,453 |
| Freddie Mac, 1.665%, 5/25/2030 (i) | | | 1,221,668 | 120,356 |
| Freddie Mac, 1.169%, 9/25/2030 (i) | | | 646,322 | 46,535 |
| Freddie Mac, 0.329%, 1/25/2031 (i) | | | 4,877,274 | 97,321 |
| Freddie Mac, 0.781%, 1/25/2031 (i) | | | 1,882,263 | 93,933 |
| Freddie Mac, 0.936%, 1/25/2031 (i) | | | 1,425,035 | 85,185 |
| Freddie Mac, 0.516%, 3/25/2031 (i) | | | 5,925,776 | 190,710 |
| Freddie Mac, 1.22%, 5/25/2031 (i) | | | 709,327 | 56,409 |
| Freddie Mac, 0.937%, 7/25/2031 (i) | | | 1,133,380 | 71,758 |
| Freddie Mac, 0.536%, 9/25/2031 (i) | | | 4,635,695 | 176,353 |
| Freddie Mac, 0.855%, 9/25/2031 (i) | | | 1,417,400 | 83,216 |
| Freddie Mac, 0.349%, 11/25/2031 (i) | | | 6,965,967 | 178,904 |
| Freddie Mac, 0.497%, 12/25/2031 (i) | | | 6,916,623 | 245,179 |
| Freddie Mac, 0.567%, 12/25/2031 (i) | | | 1,130,491 | 44,630 |
| | | | | $1,549,942 |
| Municipals – 0.2% |
| Golden State, CA, Tobacco Securitization Corp., Tobacco Settlement Rev., Taxable, “B”, 3%, 6/01/2046 | | $ | 395,000 | $ 365,608 |
| U.S. Treasury Inflation Protected Securities – 40.4% |
| U.S. Treasury Bonds, 0.25%, 1/15/2025 | | $ | 12,910,930 | $ 12,384,394 |
| U.S. Treasury Bonds, 2%, 1/15/2026 | | | 8,158,553 | 8,148,269 |
| U.S. Treasury Bonds, 0.375%, 1/15/2027 | | | 6,198,940 | 5,845,414 |
| U.S. Treasury Bonds, 0.75%, 2/15/2042 | | | 10,887,848 | 9,106,668 |
| U.S. Treasury Bonds, 0.75%, 2/15/2045 | | | 3,828,017 | 3,093,156 |
| U.S. Treasury Bonds, 0.125%, 2/15/2051 | | | 2,432,233 | 1,564,538 |
| U.S. Treasury Bonds, 0.125%, 2/15/2052 | | | 3,570,017 | 2,309,109 |
| U.S. Treasury Notes, 0.375%, 7/15/2025 | | | 3,534,788 | 3,394,734 |
| U.S. Treasury Notes, 0.875%, 1/15/2029 | | | 9,547,494 | 9,095,459 |
| U.S. Treasury Notes, 0.125%, 1/15/2031 (f) | | | 14,496,861 | 12,874,086 |
MFS Inflation-Adjusted Bond Portfolio
Portfolio of Investments – continued
| Issuer | | | Shares/Par | Value ($) |
| Bonds – continued |
| U.S. Treasury Inflation Protected Securities – continued |
| U.S. Treasury Notes, 0.125%, 1/15/2032 | | $ | 8,170,000 | $ 7,155,878 |
| | | | | $74,971,705 |
| Total Bonds (Identified Cost, $207,139,842) | | $186,645,610 |
| Investment Companies (h) – 0.3% |
| Money Market Funds – 0.3% | |
| MFS Institutional Money Market Portfolio, 4.02% (v) (Identified Cost, $515,617) | | | 515,483 | $ 515,637 |
| Other Assets, Less Liabilities – (0.9)% | | (1,625,895) |
| Net Assets – 100.0% | $185,535,352 |
| (f) | All or a portion of the security has been segregated as collateral for open futures contracts. | | | |
| (h) | An affiliated issuer, which may be considered one in which the fund owns 5% or more of the outstanding voting securities, or a company which is under common control. At period end, the aggregate values of the fund's investments in affiliated issuers and in unaffiliated issuers were $515,637 and $186,645,610, respectively. | | | |
| (i) | Interest only security for which the fund receives interest on notional principal (Par amount). Par amount shown is the notional principal and does not reflect the cost of the security. | | | |
| (n) | Securities exempt from registration under Rule 144A of the Securities Act of 1933. These securities may be sold in the ordinary course of business in transactions exempt from registration, normally to qualified institutional buyers. At period end, the aggregate value of these securities was $1,887,395, representing 1.0% of net assets. | | | |
| (v) | Affiliated issuer that is available only to investment companies managed by MFS. The rate quoted for the MFS Institutional Money Market Portfolio is the annualized seven-day yield of the fund at period end. | | | |
| The following abbreviations are used in this report and are defined: |
| AGM | Assured Guaranty Municipal |
| Abbreviations indicate amounts shown in currencies other than the U.S. dollar. All amounts are stated in U.S. dollars unless otherwise indicated. A list of abbreviations is shown below: |
| AUD | Australian Dollar |
| CAD | Canadian Dollar |
| DKK | Danish Krone |
| EUR | Euro |
| GBP | British Pound |
| JPY | Japanese Yen |
| NZD | New Zealand Dollar |
| SEK | Swedish Krona |
| Derivative Contracts at 12/31/22 |
| Forward Foreign Currency Exchange Contracts |
Currency
Purchased | Currency
Sold | Counterparty | Settlement
Date | Unrealized
Appreciation
(Depreciation) |
| Asset Derivatives |
| AUD | 1,443,637 | USD | 973,248 | Citibank N.A. | 1/20/2023 | $10,286 |
| AUD | 1,454,922 | USD | 920,100 | Morgan Stanley Capital Services, Inc. | 1/20/2023 | 71,123 |
| AUD | 402,903 | USD | 270,244 | NatWest Markets PLC | 1/20/2023 | 4,250 |
| CAD | 2,032,960 | USD | 1,493,546 | Barclays Bank PLC | 1/20/2023 | 8,025 |
| CAD | 1,319,267 | USD | 967,408 | Morgan Stanley Capital Services, Inc. | 1/20/2023 | 7,019 |
| CAD | 638,557 | USD | 467,118 | State Street Bank Corp. | 1/20/2023 | 4,528 |
| CAD | 2,618,192 | USD | 1,921,530 | UBS AG | 1/20/2023 | 12,301 |
| DKK | 3,369,185 | USD | 443,916 | Deutsche Bank AG | 1/20/2023 | 41,670 |
| EUR | 3,763,913 | USD | 4,005,250 | Barclays Bank PLC | 1/20/2023 | 28,179 |
| EUR | 789,415 | USD | 831,011 | Brown Brothers Harriman | 1/20/2023 | 14,930 |
| EUR | 1,858,754 | USD | 1,978,793 | Citibank N.A. | 1/20/2023 | 13,058 |
MFS Inflation-Adjusted Bond Portfolio
Portfolio of Investments – continued
| Forward Foreign Currency Exchange Contracts - continued |
Currency
Purchased | Currency
Sold | Counterparty | Settlement
Date | Unrealized
Appreciation
(Depreciation) |
| Asset Derivatives - continued |
| EUR | 3,637,469 | USD | 3,695,247 | HSBC Bank | 1/20/2023 | $202,683 |
| EUR | 5,845,821 | USD | 6,082,890 | JPMorgan Chase Bank N.A. | 1/20/2023 | 181,522 |
| EUR | 4,889,755 | USD | 5,038,348 | Merrill Lynch International | 1/20/2023 | 201,539 |
| EUR | 4,733,738 | USD | 4,961,650 | Morgan Stanley Capital Services, Inc. | 1/20/2023 | 111,051 |
| EUR | 1,834,902 | USD | 1,938,172 | State Street Bank Corp. | 1/20/2023 | 28,118 |
| GBP | 403,292 | USD | 485,039 | Brown Brothers Harriman | 1/20/2023 | 2,726 |
| GBP | 1,961,995 | USD | 2,231,540 | Goldman Sachs International | 1/20/2023 | 141,410 |
| GBP | 816,709 | USD | 939,565 | JPMorgan Chase Bank N.A. | 1/20/2023 | 48,211 |
| GBP | 906,292 | USD | 1,050,544 | Morgan Stanley Capital Services, Inc. | 1/20/2023 | 45,578 |
| GBP | 1,881,112 | USD | 2,172,472 | State Street Bank Corp. | 1/20/2023 | 102,654 |
| JPY | 107,130,862 | USD | 724,178 | Deutsche Bank AG | 1/20/2023 | 93,740 |
| JPY | 135,343,109 | USD | 961,799 | JPMorgan Chase Bank N.A. | 1/20/2023 | 71,513 |
| JPY | 67,647,017 | USD | 483,289 | UBS AG | 1/20/2023 | 33,179 |
| NZD | 2,852,148 | USD | 1,644,155 | Brown Brothers Harriman | 1/20/2023 | 167,057 |
| NZD | 1,570,628 | USD | 940,424 | Morgan Stanley Capital Services, Inc. | 1/20/2023 | 56,977 |
| NZD | 2,067,517 | USD | 1,194,616 | NatWest Markets PLC | 1/20/2023 | 118,328 |
| NZD | 6,166,002 | USD | 3,503,855 | State Street Bank Corp. | 1/20/2023 | 411,765 |
| SEK | 5,685,883 | USD | 510,334 | Deutsche Bank AG | 1/20/2023 | 35,060 |
| SEK | 597,509 | USD | 53,307 | Morgan Stanley Capital Services, Inc. | 1/20/2023 | 4,007 |
| USD | 194,662 | CAD | 261,949 | JPMorgan Chase Bank N.A. | 1/20/2023 | 1,183 |
| USD | 114,142 | CAD | 151,457 | Morgan Stanley Capital Services, Inc. | 1/20/2023 | 2,274 |
| USD | 950,467 | GBP | 771,413 | Brown Brothers Harriman | 1/20/2023 | 17,475 |
| USD | 409,020 | GBP | 334,532 | NatWest Markets PLC | 1/20/2023 | 4,417 |
| USD | 3,915,248 | NZD | 6,129,681 | Goldman Sachs International | 1/20/2023 | 22,693 |
| USD | 77,945 | NZD | 122,407 | HSBC Bank | 1/20/2023 | 212 |
| USD | 38,755 | SEK | 402,109 | Morgan Stanley Capital Services, Inc. | 1/20/2023 | 185 |
| | | | | | | $2,320,926 |
| Liability Derivatives |
| CAD | 124,943 | USD | 93,809 | Citibank N.A. | 1/20/2023 | $(1,525) |
| EUR | 897,671 | USD | 962,885 | Morgan Stanley Capital Services, Inc. | 1/20/2023 | (936) |
| NZD | 1,519,036 | USD | 968,553 | State Street Bank Corp. | 1/20/2023 | (3,914) |
| USD | 973,516 | AUD | 1,449,562 | JPMorgan Chase Bank N.A. | 1/20/2023 | (14,055) |
| USD | 1,514,517 | AUD | 2,424,079 | State Street Bank Corp. | 1/20/2023 | (136,982) |
| USD | 1,578,128 | CAD | 2,151,698 | Brown Brothers Harriman | 1/20/2023 | (11,145) |
| USD | 333,316 | CAD | 451,341 | Goldman Sachs International | 1/20/2023 | (50) |
| USD | 4,984,233 | CAD | 6,840,932 | HSBC Bank | 1/20/2023 | (68,570) |
| USD | 556,711 | CAD | 753,851 | NatWest Markets PLC | 1/20/2023 | (93) |
| USD | 214,098 | DKK | 1,515,970 | Morgan Stanley Capital Services, Inc. | 1/20/2023 | (4,392) |
| USD | 3,991,873 | EUR | 3,821,441 | Brown Brothers Harriman | 1/20/2023 | (103,203) |
| USD | 277,184 | EUR | 280,573 | Deutsche Bank AG | 1/20/2023 | (23,479) |
| USD | 1,188,108 | EUR | 1,164,484 | HSBC Bank | 1/20/2023 | (59,759) |
| USD | 867,092 | EUR | 858,607 | JPMorgan Chase Bank N.A. | 1/20/2023 | (52,997) |
| USD | 1,167,818 | EUR | 1,121,799 | Merrill Lynch International | 1/20/2023 | (34,308) |
| USD | 734,952 | EUR | 749,003 | Morgan Stanley Capital Services, Inc. | 1/20/2023 | (67,683) |
| USD | 23,062,874 | EUR | 23,378,207 | State Street Bank Corp. | 1/20/2023 | (1,989,334) |
| USD | 3,118,881 | GBP | 2,740,930 | HSBC Bank | 1/20/2023 | (196,159) |
| USD | 1,595,924 | GBP | 1,362,002 | JPMorgan Chase Bank N.A. | 1/20/2023 | (51,361) |
| USD | 4,249,020 | GBP | 3,662,208 | Morgan Stanley Capital Services, Inc. | 1/20/2023 | (180,268) |
| USD | 6,014,516 | GBP | 5,358,621 | State Street Bank Corp. | 1/20/2023 | (466,512) |
| USD | 131,933 | JPY | 19,214,318 | Brown Brothers Harriman | 1/20/2023 | (14,764) |
| USD | 957,250 | JPY | 131,130,216 | HSBC Bank | 1/20/2023 | (43,897) |
| USD | 78,445 | JPY | 10,558,698 | JPMorgan Chase Bank N.A. | 1/20/2023 | (2,168) |
MFS Inflation-Adjusted Bond Portfolio
Portfolio of Investments – continued
| Forward Foreign Currency Exchange Contracts - continued |
Currency
Purchased | Currency
Sold | Counterparty | Settlement
Date | Unrealized
Appreciation
(Depreciation) |
| Liability Derivatives - continued |
| USD | 475,655 | JPY | 66,748,301 | Morgan Stanley Capital Services, Inc. | 1/20/2023 | $(33,952) |
| USD | 1,871,667 | NZD | 2,965,883 | Morgan Stanley Capital Services, Inc. | 1/20/2023 | (11,769) |
| USD | 5,079,056 | NZD | 8,946,883 | State Street Bank Corp. | 1/20/2023 | (602,518) |
| | | | | | | $(4,175,793) |
| Futures Contracts |
| Description | Long/
Short | Currency | Contracts | Notional
Amount | Expiration
Date | Value/Unrealized
Appreciation
(Depreciation) |
| Asset Derivatives |
| Interest Rate Futures | | |
| Euro-Bobl 5 yr | Short | EUR | 17 | $2,106,377 | March – 2023 | $58,742 |
| Liability Derivatives |
| Interest Rate Futures | | |
| U.S. Treasury Note 10 yr | Long | USD | 19 | $2,133,641 | March – 2023 | $(14,420) |
At December 31, 2022, the fund had liquid securities with an aggregate value of $102,669 to cover any collateral or margin obligations for certain derivative contracts.
See Notes to Financial Statements
MFS Inflation-Adjusted Bond Portfolio
| Financial Statements | Statement of Assets and Liabilities |
This statement represents your fund’s balance sheet, which details the assets and liabilities comprising the total value of the fund.
| At 12/31/22Assets | |
| Investments in unaffiliated issuers, at value (identified cost, $207,139,842) | $186,645,610 |
| Investments in affiliated issuers, at value (identified cost, $515,617) | 515,637 |
| Cash | 4,898 |
| Foreign currency, at value (identified cost, $19) | 19 |
| Receivables for | |
| Forward foreign currency exchange contracts | 2,320,926 |
| Net daily variation margin on open futures contracts | 5,397 |
| Fund shares sold | 174 |
| Interest | 410,403 |
| Other assets | 1,292 |
| Total assets | $189,904,356 |
| Liabilities | |
| Payables for | |
| Forward foreign currency exchange contracts | $4,175,793 |
| Fund shares reacquired | 103,552 |
| Payable to affiliates | |
| Investment adviser | 7,417 |
| Administrative services fee | 297 |
| Shareholder servicing costs | 17 |
| Distribution and/or service fees | 1,870 |
| Payable for independent Trustees' compensation | 54 |
| Accrued expenses and other liabilities | 80,004 |
| Total liabilities | $4,369,004 |
| Net assets | $185,535,352 |
| Net assets consist of | |
| Paid-in capital | $212,364,672 |
| Total distributable earnings (loss) | (26,829,320) |
| Net assets | $185,535,352 |
| Shares of beneficial interest outstanding | 22,379,870 |
| | Net assets | Shares
outstanding | Net asset value
per share |
| Initial Class | $94,431,799 | 11,319,943 | $8.34 |
| Service Class | 91,103,553 | 11,059,927 | 8.24 |
See Notes to Financial Statements
MFS Inflation-Adjusted Bond Portfolio
| Financial Statements | Statement of Operations |
This statement describes how much your fund earned in investment income and accrued in expenses. It also describes any gains and/or losses generated by fund operations.
| Year ended 12/31/22 | |
| Net investment income (loss) | |
| Income | |
| Interest | $14,476,077 |
| Dividends from affiliated issuers | 13,234 |
| Other | 43 |
| Total investment income | $14,489,354 |
| Expenses | |
| Management fee | $1,038,500 |
| Distribution and/or service fees | 256,218 |
| Shareholder servicing costs | 4,325 |
| Administrative services fee | 41,677 |
| Independent Trustees' compensation | 5,237 |
| Custodian fee | 29,878 |
| Shareholder communications | 4,618 |
| Audit and tax fees | 47,891 |
| Legal fees | 936 |
| Miscellaneous | 32,815 |
| Total expenses | $1,462,095 |
| Reduction of expenses by investment adviser | (28,875) |
| Net expenses | $1,433,220 |
| Net investment income (loss) | $13,056,134 |
| Realized and unrealized gain (loss) | |
| Realized gain (loss) (identified cost basis) | |
| Unaffiliated issuers | $(18,633,462) |
| Affiliated issuers | (191) |
| Futures contracts | 529,720 |
| Forward foreign currency exchange contracts | (392,355) |
| Foreign currency | 1,435,473 |
| Net realized gain (loss) | $(17,060,815) |
| Change in unrealized appreciation or depreciation | |
| Unaffiliated issuers | $(46,299,717) |
| Affiliated issuers | 20 |
| Futures contracts | 53,549 |
| Forward foreign currency exchange contracts | (1,702,234) |
| Translation of assets and liabilities in foreign currencies | 5,395 |
| Net unrealized gain (loss) | $(47,942,987) |
| Net realized and unrealized gain (loss) | $(65,003,802) |
| Change in net assets from operations | $(51,947,668) |
See Notes to Financial Statements
MFS Inflation-Adjusted Bond Portfolio
| Financial Statements | Statements of Changes in Net Assets |
These statements describe the increases and/or decreases in net assets resulting from operations, any distributions, and any shareholder transactions.
| | Year ended |
| | 12/31/22 | 12/31/21 |
| Change in net assets | | |
| From operations | | |
| Net investment income (loss) | $13,056,134 | $7,049,975 |
| Net realized gain (loss) | (17,060,815) | 14,982,442 |
| Net unrealized gain (loss) | (47,942,987) | (17,972,564) |
| Change in net assets from operations | $(51,947,668) | $4,059,853 |
| Total distributions to shareholders | $(21,082,368) | $(6,632,339) |
| Change in net assets from fund share transactions | $9,664,157 | $(7,574,086) |
| Total change in net assets | $(63,365,879) | $(10,146,572) |
| Net assets | | |
| At beginning of period | 248,901,231 | 259,047,803 |
| At end of period | $185,535,352 | $248,901,231 |
See Notes to Financial Statements
MFS Inflation-Adjusted Bond Portfolio
| Financial Statements | Financial Highlights |
The financial highlights table is intended to help you understand the fund's financial performance for the past 5 years. Certain information reflects financial results for a single fund share. The total returns in the table represent the rate that an investor would have earned (or lost) on an investment in the fund share class (assuming reinvestment of all distributions) held for the entire period.
| Initial Class | Year ended |
| | 12/31/22 | 12/31/21 | 12/31/20 | 12/31/19 | 12/31/18 |
| Net asset value, beginning of period | $11.93 | $12.06 | $10.81 | $10.15 | $10.81 |
| Income (loss) from investment operations | | | | | |
| Net investment income (loss) (d) | $0.63 | $0.34 | $0.05 | $0.12 | $0.19 |
| Net realized and unrealized gain (loss) | (3.15) | (0.14) | 1.40 | 0.72 | (0.67) |
| Total from investment operations | $(2.52) | $0.20 | $1.45 | $0.84 | $(0.48) |
| Less distributions declared to shareholders | | | | | |
| From net investment income | $(0.45) | $(0.13) | $(0.05) | $(0.18) | $(0.18) |
| From net realized gain | (0.62) | (0.20) | (0.15) | — | — |
| Total distributions declared to shareholders | $(1.07) | $(0.33) | $(0.20) | $(0.18) | $(0.18) |
| Net asset value, end of period (x) | $8.34 | $11.93 | $12.06 | $10.81 | $10.15 |
| Total return (%) (k)(r)(s)(x) | (21.65) | 1.63 | 13.55 | 8.26 | (4.47) |
Ratios (%) (to average net assets)
and Supplemental data: | | | | | |
| Expenses before expense reductions | 0.58 | 0.57 | 0.58 | 0.57 | 0.57 |
| Expenses after expense reductions | 0.57 | 0.56 | 0.57 | 0.56 | 0.56 |
| Net investment income (loss) | 6.42 | 2.88 | 0.45 | 1.11 | 1.78 |
| Portfolio turnover | 126 | 96 | 46 | 62 | 63 |
| Net assets at end of period (000 omitted) | $94,432 | $126,161 | $132,577 | $131,221 | $134,599 |
| Service Class | Year ended |
| | 12/31/22 | 12/31/21 | 12/31/20 | 12/31/19 | 12/31/18 |
| Net asset value, beginning of period | $11.78 | $11.92 | $10.69 | $10.03 | $10.68 |
| Income (loss) from investment operations | | | | | |
| Net investment income (loss) (d) | $0.60 | $0.31 | $0.02 | $0.09 | $0.16 |
| Net realized and unrealized gain (loss) | (3.10) | (0.15) | 1.38 | 0.72 | (0.66) |
| Total from investment operations | $(2.50) | $0.16 | $1.40 | $0.81 | $(0.50) |
| Less distributions declared to shareholders | | | | | |
| From net investment income | $(0.42) | $(0.10) | $(0.02) | $(0.15) | $(0.15) |
| From net realized gain | (0.62) | (0.20) | (0.15) | — | — |
| Total distributions declared to shareholders | $(1.04) | $(0.30) | $(0.17) | $(0.15) | $(0.15) |
| Net asset value, end of period (x) | $8.24 | $11.78 | $11.92 | $10.69 | $10.03 |
| Total return (%) (k)(r)(s)(x) | (21.76) | 1.32 | 13.21 | 8.05 | (4.70) |
Ratios (%) (to average net assets)
and Supplemental data: | | | | | |
| Expenses before expense reductions | 0.83 | 0.82 | 0.83 | 0.82 | 0.82 |
| Expenses after expense reductions | 0.82 | 0.81 | 0.82 | 0.81 | 0.81 |
| Net investment income (loss) | 6.17 | 2.64 | 0.19 | 0.86 | 1.54 |
| Portfolio turnover | 126 | 96 | 46 | 62 | 63 |
| Net assets at end of period (000 omitted) | $91,104 | $122,740 | $126,471 | $125,926 | $131,678 |
See Notes to Financial Statements
MFS Inflation-Adjusted Bond Portfolio
Financial Highlights - continued
| (d) | Per share data is based on average shares outstanding. |
| (k) | The total return does not reflect expenses that apply to separate accounts. Inclusion of these charges would reduce the total return figures for all periods shown. |
| (r) | Certain expenses have been reduced without which performance would have been lower. |
| (s) | From time to time the fund may receive proceeds from litigation settlements, without which performance would be lower. |
| (x) | The net asset values and total returns have been calculated on net assets which include adjustments made in accordance with U.S. generally accepted accounting principles required at period end for financial reporting purposes. |
See Notes to Financial Statements
MFS Inflation-Adjusted Bond Portfolio
Notes to Financial Statements
(1) Business and Organization
MFS Inflation-Adjusted Bond Portfolio (the fund) is a non-diversified series of MFS Variable Insurance Trust III (the trust). The trust is organized as a Delaware statutory trust and is registered under the Investment Company Act of 1940, as amended, as an open-end management investment company. The shareholders of each series of the trust are separate accounts of insurance companies, which offer variable annuity and/or life insurance products, and qualified retirement and pension plans.
The fund is an investment company and accordingly follows the investment company accounting and reporting guidance of the Financial Accounting Standards Board (FASB) Accounting Standards Codification Topic 946 Financial Services - Investment Companies.
(2) Significant Accounting Policies
General — The preparation of financial statements in conformity with U.S. generally accepted accounting principles requires management to make estimates and assumptions that affect the reported amounts of assets and liabilities, and disclosure of contingent assets and liabilities at the date of the financial statements and the reported amounts of increases and decreases in net assets from operations during the reporting period. Actual results could differ from those estimates. In the preparation of these financial statements, management has evaluated subsequent events occurring after the date of the fund’s Statement of Assets and Liabilities through the date that the financial statements were issued. The fund invests in foreign securities. Investments in foreign securities are vulnerable to the effects of changes in the relative values of the local currency and the U.S. dollar and to the effects of changes in each country’s market, economic, industrial, political, regulatory, geopolitical, environmental, public health, and other conditions.
Balance Sheet Offsetting — The fund's accounting policy with respect to balance sheet offsetting is that, absent an event of default by the counterparty or a termination of the agreement, the International Swaps and Derivatives Association (ISDA) Master Agreement, or similar agreement, does not result in an offset of reported amounts of financial assets and financial liabilities in the Statement of Assets and Liabilities across transactions between the fund and the applicable counterparty. The fund's right to setoff may be restricted or prohibited by the bankruptcy or insolvency laws of the particular jurisdiction to which a specific master netting agreement counterparty is subject. Balance sheet offsetting disclosures, to the extent applicable to the fund, have been included in the fund’s Significant Accounting Policies note under the captions for each of the fund’s in-scope financial instruments and transactions.
Investment Valuations — Subject to its oversight, the fund's Board of Trustees has delegated primary responsibility for determining or causing to be determined the value of the fund’s investments to MFS as the fund's adviser, pursuant to the fund’s valuation policy and procedures which have been adopted by the adviser and approved by the Board. Effective September 8, 2022, and in accordance with Rule 2a-5 under the Investment Company Act of 1940, the Board of Trustees designated the adviser as the “valuation designee” of the fund. If the adviser, as valuation designee, determines that reliable market quotations are not readily available for an investment, the investment is valued at fair value as determined in good faith by the adviser in accordance with the adviser’s fair valuation policy and procedures.
Under the fund's valuation policy and procedures, debt instruments and floating rate loans, including restricted debt instruments, are generally valued at an evaluated or composite bid as provided by a third-party pricing service. Short-term instruments with a maturity at issuance of 60 days or less may be valued at amortized cost, which approximates market value. Futures contracts are generally valued at last posted settlement price on their primary exchange as provided by a third-party pricing service. Futures contracts for which there were no trades that day for a particular position are generally valued at the closing bid quotation on their primary exchange as provided by a third-party pricing service. Forward foreign currency exchange contracts are generally valued at the mean of bid and asked prices for the time period interpolated from rates provided by a third-party pricing service for proximate time periods. Open-end investment companies are generally valued at net asset value per share. The values of foreign securities and other assets and liabilities expressed in foreign currencies are converted to U.S. dollars using the mean of bid and asked prices for rates provided by a third-party pricing service.
Under the fund’s valuation policy and procedures, market quotations are not considered to be readily available for debt instruments, floating rate loans, and many types of derivatives. These investments are generally valued at fair value based on information from third-party pricing services or otherwise determined by the adviser in accordance with the adviser’s fair valuation policy and procedures. Securities and other assets generally valued on the basis of information from a third-party pricing service may also be valued at a broker/dealer bid quotation. In determining values, third-party pricing services can utilize both transaction data and market information such as yield, quality, coupon rate, maturity, type of issue, trading characteristics, spreads and other market data. An investment may also be valued at fair value if the adviser determines that the investment’s value has been materially affected by events occurring after the close of the exchange or market on which the investment is principally traded (such as foreign exchange or market) and prior to the determination of the fund’s net asset value, or after the halt of trading of a specific security where trading
MFS Inflation-Adjusted Bond Portfolio
Notes to Financial Statements - continued
does not resume prior to the close of the exchange or market on which the security is principally traded. The adviser generally relies on third-party pricing services or other information (such as the correlation with price movements of similar securities in the same or other markets; the type, cost and investment characteristics of the security; the business and financial condition of the issuer; and trading and other market data) to assist in determining whether to fair value and at what value to fair value an investment. The value of an investment for purposes of calculating the fund’s net asset value can differ depending on the source and method used to determine value. When fair valuation is used, the value of an investment used to determine the fund’s net asset value may differ from quoted or published prices for the same investment. There can be no assurance that the fund could obtain the fair value assigned to an investment if it were to sell the investment at the same time at which the fund determines its net asset value per share.
Various inputs are used in determining the value of the fund's assets or liabilities. These inputs are categorized into three broad levels. In certain cases, the inputs used to measure fair value may fall into different levels of the fair value hierarchy. In such cases, an investment's level within the fair value hierarchy is based on the lowest level of input that is significant to the fair value measurement. The fund's assessment of the significance of a particular input to the fair value measurement in its entirety requires judgment, and considers factors specific to the investment. Level 1 includes unadjusted quoted prices in active markets for identical assets or liabilities. Level 2 includes other significant observable market-based inputs (including quoted prices for similar securities, interest rates, prepayment speed, and credit risk). Level 3 includes significant unobservable inputs, which may include the adviser's own assumptions in determining the fair value of investments. Other financial instruments are derivative instruments, such as futures contracts and forward foreign currency exchange contracts. The following is a summary of the levels used as of December 31, 2022 in valuing the fund's assets and liabilities:
| Financial Instruments | Level 1 | Level 2 | Level 3 | Total |
| U.S. Treasury Bonds & U.S. Government Agencies & Equivalents | $— | $74,971,705 | $— | $74,971,705 |
| Non - U.S. Sovereign Debt | — | 106,692,683 | — | 106,692,683 |
| Municipal Bonds | — | 365,608 | — | 365,608 |
| U.S. Corporate Bonds | — | 1,023,398 | — | 1,023,398 |
| Residential Mortgage-Backed Securities | — | 1,549,942 | — | 1,549,942 |
| Commercial Mortgage-Backed Securities | — | 2,042,274 | — | 2,042,274 |
| Mutual Funds | 515,637 | — | — | 515,637 |
| Total | $515,637 | $186,645,610 | $— | $187,161,247 |
| Other Financial Instruments | | | | |
| Futures Contracts – Assets | $58,742 | $— | $— | $58,742 |
| Futures Contracts – Liabilities | (14,420) | — | — | (14,420) |
| Forward Foreign Currency Exchange Contracts – Assets | — | 2,320,926 | — | 2,320,926 |
| Forward Foreign Currency Exchange Contracts – Liabilities | — | (4,175,793) | — | (4,175,793) |
For further information regarding security characteristics, see the Portfolio of Investments.
Inflation-Adjusted Debt Securities — The fund invests in inflation-adjusted debt securities issued by the U.S. Treasury. The fund also invests in inflation-adjusted debt securities issued by U.S. Government agencies and instrumentalities other than the U.S. Treasury and by other entities such as U.S. and foreign corporations and foreign governments. The principal value of these debt securities is adjusted through income according to changes in the Consumer Price Index or another general price or wage index. These debt securities typically pay a fixed rate of interest, but this fixed rate is applied to the inflation-adjusted principal amount. The principal paid at maturity of the debt security is typically equal to the inflation-adjusted principal amount, or the security’s original par value, whichever is greater. Other types of inflation-adjusted securities may use other methods to adjust for other measures of inflation.
Foreign Currency Translation — Purchases and sales of foreign investments, income, and expenses are converted into U.S. dollars based upon currency exchange rates prevailing on the respective dates of such transactions or on the reporting date for foreign denominated receivables and payables. Gains and losses attributable to foreign currency exchange rates on sales of securities are recorded for financial statement purposes as net realized gains and losses on investments. Gains and losses attributable to foreign exchange rate movements on receivables, payables, income and expenses are recorded for financial statement purposes as foreign currency transaction gains and losses. That portion of both realized and unrealized gains and losses on investments that results from fluctuations in foreign currency exchange rates is not separately disclosed.
MFS Inflation-Adjusted Bond Portfolio
Notes to Financial Statements - continued
Derivatives — The fund uses derivatives primarily to increase or decrease exposure to a particular market or segment of the market, or security, to increase or decrease interest rate or currency exposure, or as alternatives to direct investments. Derivatives are used for hedging or non-hedging purposes. While hedging can reduce or eliminate losses, it can also reduce or eliminate gains. When the fund uses derivatives as an investment to increase market exposure, or for hedging purposes, gains and losses from derivative instruments may be substantially greater than the derivative’s original cost.
The derivative instruments used by the fund during the period were futures contracts and forward foreign currency exchange contracts. Depending on the type of derivative, a fund may exit a derivative position by entering into an offsetting transaction with a counterparty or exchange, negotiating an agreement with the derivative counterparty, or novating the position to a third party. The fund may be unable to promptly close out a futures position in instances where the daily fluctuation in the price for that type of future exceeds the daily limit set by the exchange. The fund's period end derivatives, as presented in the Portfolio of Investments and the associated Derivative Contract tables, generally are indicative of the volume of its derivative activity during the period.
The following table presents, by major type of derivative contract, the fair value, on a gross basis, of the asset and liability components of derivatives held by the fund at December 31, 2022 as reported in the Statement of Assets and Liabilities:
| | | Fair Value (a) |
| Risk | Derivative Contracts | Asset Derivatives | Liability Derivatives |
| Interest Rate | Futures Contracts | $58,742 | $(14,420) |
| Foreign Exchange | Forward Foreign Currency Exchange Contracts | 2,320,926 | (4,175,793) |
| Total | | $2,379,668 | $(4,190,213) |
(a) Values presented in this table for futures contracts correspond to the values reported in the Portfolio of Investments. Only the current day net variation margin for futures contracts is reported separately within the Statement of Assets and Liabilities.
The following table presents, by major type of derivative contract, the realized gain (loss) on derivatives held by the fund for the year ended December 31, 2022 as reported in the Statement of Operations:
| Risk | Futures
Contracts | Forward Foreign
Currency
Exchange
Contracts |
| Interest Rate | $529,720 | $— |
| Foreign Exchange | — | (392,355) |
| Total | $529,720 | $(392,355) |
The following table presents, by major type of derivative contract, the change in unrealized appreciation or depreciation on derivatives held by the fund for the year ended December 31, 2022 as reported in the Statement of Operations:
| Risk | Futures
Contracts | Forward Foreign
Currency
Exchange
Contracts |
| Interest Rate | $53,549 | $— |
| Foreign Exchange | — | (1,702,234) |
| Total | $53,549 | $(1,702,234) |
Derivative counterparty credit risk is managed through formal evaluation of the creditworthiness of all potential counterparties. On certain, but not all, uncleared derivatives, the fund attempts to reduce its exposure to counterparty credit risk whenever possible by entering into an ISDA Master Agreement on a bilateral basis. The ISDA Master Agreement gives each party to the agreement the right to terminate all transactions traded under such agreement if there is a specified deterioration in the credit quality of the other party. Upon an event of default or a termination of the ISDA Master Agreement, the non-defaulting party has the right to close out all transactions traded under such agreement and to net amounts owed under each agreement to one net amount payable by one party to the other. This right to close out and net payments across all transactions traded under the ISDA Master Agreement could result in a reduction of the fund's credit risk to such counterparty equal to any amounts payable by the fund under the applicable transactions, if any.
Collateral and margin requirements differ by type of derivative. For cleared derivatives (e.g., futures contracts, cleared swaps, and exchange-traded options), margin requirements are set by the clearing broker and the clearing house and collateral, in the form of cash or securities, is posted by the fund directly with the clearing broker. Collateral terms are counterparty agreement specific for
MFS Inflation-Adjusted Bond Portfolio
Notes to Financial Statements - continued
uncleared derivatives (e.g., forward foreign currency exchange contracts, uncleared swap agreements, and uncleared options) and collateral, in the form of cash and securities, is held in segregated accounts with the fund's custodian in connection with these agreements. For derivatives traded under an ISDA Master Agreement, which contains a credit support annex, the collateral requirements are netted across all transactions traded under such counterparty-specific agreement and an amount is posted from one party to the other to collateralize such obligations. Cash that has been segregated or delivered to cover the fund's collateral or margin obligations under derivative contracts, if any, will be reported separately in the Statement of Assets and Liabilities as restricted cash for uncleared derivatives and/or deposits with brokers for cleared derivatives. Securities pledged as collateral or margin for the same purpose, if any, are noted in the Portfolio of Investments. The fund may be required to make payments of interest on uncovered collateral or margin obligations with the broker. Any such payments are included in “Miscellaneous” expense in the Statement of Operations.
Futures Contracts — The fund entered into futures contracts which may be used to hedge against or obtain broad market exposure, interest rate exposure, or to manage duration. A futures contract represents a commitment for the future purchase or sale of an asset at a specified price on a specified date.
Upon entering into a futures contract, the fund is required to deposit with the broker, either in cash or securities, an initial margin in an amount equal to a specified percentage of the notional amount of the contract. Subsequent payments (variation margin) are made or received by the fund each day, depending on the daily fluctuations in the value of the contract, and are recorded for financial statement purposes as unrealized gain or loss by the fund until the contract is closed or expires at which point the gain or loss on futures contracts is realized.
The fund bears the risk of interest rates or securities prices moving unexpectedly, in which case, the fund may not achieve the anticipated benefits of the futures contracts and may realize a loss. While futures contracts may present less counterparty risk to the fund since the contracts are exchange traded and the exchange’s clearinghouse guarantees payments to the broker, there is still counterparty credit risk due to the insolvency of the broker. The fund's maximum risk of loss due to counterparty credit risk is equal to the margin posted by the fund to the broker plus any gains or minus any losses on the outstanding futures contracts.
Forward Foreign Currency Exchange Contracts — The fund entered into forward foreign currency exchange contracts for the purchase or sale of a specific foreign currency at a fixed price on a future date. These contracts may be used to hedge the fund’s currency risk or for non-hedging purposes. For hedging purposes, the fund may enter into contracts to deliver or receive foreign currency that the fund will receive from or use in its normal investment activities. The fund may also use contracts to hedge against declines in the value of foreign currency denominated securities due to unfavorable exchange rate movements. For non-hedging purposes, the fund may enter into contracts with the intent of changing the relative exposure of the fund’s portfolio of securities to different currencies to take advantage of anticipated exchange rate changes.
Forward foreign currency exchange contracts are adjusted by the daily exchange rate of the underlying currency and any unrealized gains or losses are recorded as a receivable or payable for forward foreign currency exchange contracts until the contract settlement date. On contract settlement date, any gain or loss on the contract is recorded as realized gains or losses on forward foreign currency exchange contracts.
Risks may arise upon entering into these contracts from unanticipated movements in the value of the contract and from the potential inability of counterparties to meet the terms of their contracts. Generally, the fund’s maximum risk due to counterparty credit risk is the unrealized gain on the contract due to the use of Continuous Linked Settlement, a multicurrency cash settlement system for the centralized settlement of foreign transactions. This risk is mitigated in cases where there is an ISDA Master Agreement between the fund and the counterparty providing for netting as described above and, where applicable, by the posting of collateral by the counterparty to the fund to cover the fund’s exposure to the counterparty under such ISDA Master Agreement.
Indemnifications — Under the fund's organizational documents, its officers and Trustees may be indemnified against certain liabilities and expenses arising out of the performance of their duties to the fund. Additionally, in the normal course of business, the fund enters into agreements with service providers that may contain indemnification clauses. The fund's maximum exposure under these agreements is unknown as this would involve future claims that may be made against the fund that have not yet occurred.
Investment Transactions and Income — Investment transactions are recorded on the trade date. Interest income is recorded on the accrual basis. All premium and discount is amortized or accreted for financial statement purposes in accordance with U.S. generally accepted accounting principles. Interest payments received in additional securities are recorded on the ex-interest date in an amount equal to the value of the security on such date. In determining the net gain or loss on securities sold, the cost of securities is determined on the identified cost basis. Inflation-indexed bonds are fixed-income securities whose principal value is periodically adjusted upward or downward based on the rate of inflation. Interest is accrued based on the principal amount, which is adjusted for inflation. Any increase or decrease in the principal amount of an inflation-indexed bond is generally recorded as an increase or decrease in interest income, respectively, even though the adjusted principal is not received until maturity.
MFS Inflation-Adjusted Bond Portfolio
Notes to Financial Statements - continued
The fund may receive proceeds from litigation settlements. Any proceeds received from litigation involving portfolio holdings are reflected in the Statement of Operations in realized gain/loss if the security has been disposed of by the fund or in unrealized gain/loss if the security is still held by the fund. Any other proceeds from litigation not related to portfolio holdings are reflected as other income in the Statement of Operations.
Tax Matters and Distributions — The fund intends to qualify as a regulated investment company, as defined under Subchapter M of the Internal Revenue Code, and to distribute all of its taxable income, including realized capital gains. As a result, no provision for federal income tax is required. The fund’s federal tax returns, when filed, will remain subject to examination by the Internal Revenue Service for a three year period. Management has analyzed the fund’s tax positions taken on federal and state tax returns for all open tax years and does not believe that there are any uncertain tax positions that require recognition of a tax liability. Foreign taxes, if any, have been accrued by the fund in the accompanying financial statements in accordance with the applicable foreign tax law. Foreign income taxes may be withheld by certain countries in which the fund invests. Additionally, capital gains realized by the fund on securities issued in or by certain foreign countries may be subject to capital gains tax imposed by those countries.
Distributions to shareholders are recorded on the ex-dividend date. Income and capital gain distributions are determined in accordance with income tax regulations, which may differ from U.S. generally accepted accounting principles. Certain capital accounts in the financial statements are periodically adjusted for permanent differences in order to reflect their tax character. These adjustments have no impact on net assets or net asset value per share. Temporary differences which arise from recognizing certain items of income, expense, gain or loss in different periods for financial statement and tax purposes will reverse at some time in the future.
Book/tax differences primarily relate to wash sale loss deferrals and derivative transactions.
The tax character of distributions declared to shareholders for the last two fiscal years is as follows:
| | Year ended
12/31/22 | Year ended
12/31/21 |
| Ordinary income (including any short-term capital gains) | $10,073,595 | $3,482,285 |
| Long-term capital gains | 11,008,773 | 3,150,054 |
| Total distributions | $21,082,368 | $6,632,339 |
The federal tax cost and the tax basis components of distributable earnings were as follows:
| As of 12/31/22 | |
| Cost of investments | $207,568,543 |
| Gross appreciation | 2,210,055 |
| Gross depreciation | (24,427,896) |
| Net unrealized appreciation (depreciation) | $(22,217,841) |
| Undistributed ordinary income | 5,199,643 |
| Capital loss carryforwards | (9,816,049) |
| Other temporary differences | 4,927 |
| Total distributable earnings (loss) | $(26,829,320) |
As of December 31, 2022, the fund had capital loss carryforwards available to offset future realized gains. These net capital losses may be carried forward indefinitely and their character is retained as short-term and/or long-term losses. Such losses are characterized as follows:
| Short-Term | $(8,616,670) |
| Long-Term | (1,199,379) |
| Total | $(9,816,049) |
Multiple Classes of Shares of Beneficial Interest — The fund offers multiple classes of shares, which differ in their respective distribution and/or service fees. The fund's income, realized and unrealized gain (loss), and common expenses are allocated to shareholders based on the daily net assets of each class. Dividends are declared separately for each class. Differences in per share dividend rates are generally due to differences in separate class expenses. The fund’s distributions declared to shareholders as reported in the Statements of Changes in Net Assets are presented by class as follows:
MFS Inflation-Adjusted Bond Portfolio
Notes to Financial Statements - continued
| | Year
ended
12/31/22 | | Year
ended
12/31/21 |
| Initial Class | $10,811,076 | | $3,498,989 |
| Service Class | 10,271,292 | | 3,133,350 |
| Total | $21,082,368 | | $6,632,339 |
(3) Transactions with Affiliates
Investment Adviser — The fund has an investment advisory agreement with MFS to provide overall investment management and related administrative services and facilities to the fund. The management fee is computed daily and paid monthly at an annual rate of 0.50% of the fund’s average daily net assets.
MFS has agreed in writing to reduce its management fee by a specified amount if certain MFS mutual fund assets exceed thresholds agreed to by MFS and the fund's Board of Trustees. Effective March 1, 2022, MFS has also agreed in writing to waive at least 0.01% of its management fee as part of this agreement. The agreement to waive at least 0.01% of the management fee will continue until modified by the fund's Board of Trustees, but such agreement will continue at least until April 30, 2024. For the year ended December 31, 2022, this management fee reduction amounted to $28,875, which is included in the reduction of total expenses in the Statement of Operations. The management fee incurred for the year ended December 31, 2022 was equivalent to an annual effective rate of 0.49% of the fund's average daily net assets.
Distributor — MFS Fund Distributors, Inc. (MFD), a wholly-owned subsidiary of MFS, is the distributor of shares of the fund. The Trustees have adopted a distribution plan for the Service Class shares pursuant to Rule 12b-1 under the Investment Company Act of 1940.
The fund's distribution plan provides that the fund will pay MFD distribution and/or service fees equal to 0.25% per annum of its average daily net assets attributable to Service Class shares as partial consideration for services performed and expenses incurred by MFD and financial intermediaries (including participating insurance companies that invest in the fund to fund variable annuity and variable life insurance contracts, sponsors of qualified retirement and pension plans that invest in the fund, and affiliates of these participating insurance companies and plan sponsors) in connection with the sale and distribution of the Service Class shares. MFD may subsequently pay all, or a portion, of the distribution and/or service fees to financial intermediaries.
Shareholder Servicing Agent — MFS Service Center, Inc. (MFSC), a wholly-owned subsidiary of MFS, receives a fee from the fund for its services as shareholder servicing agent. For the year ended December 31, 2022, the fee was $4,099, which equated to 0.0020% annually of the fund's average daily net assets. MFSC also receives reimbursement from the fund for out-of-pocket expenses paid by MFSC on behalf of the fund. For the year ended December 31, 2022, these costs amounted to $226.
Administrator — MFS provides certain financial, legal, shareholder communications, compliance, and other administrative services to the fund. Under an administrative services agreement, the fund reimburses MFS the costs incurred to provide these services. The fund is charged an annual fixed amount of $17,500 plus a fee based on average daily net assets. The administrative services fee incurred for the year ended December 31, 2022 was equivalent to an annual effective rate of 0.0201% of the fund's average daily net assets.
Trustees’ and Officers’ Compensation — The fund pays compensation to independent Trustees in the form of a retainer, attendance fees, and additional compensation to Board and Committee chairpersons. The fund does not pay compensation directly to Trustees or officers of the fund who are also officers of the investment adviser, all of whom receive remuneration from MFS for their services to the fund. Certain officers and Trustees of the fund are officers or directors of MFS, MFD, and MFSC.
Other — The fund invests in the MFS Institutional Money Market Portfolio which is managed by MFS and seeks current income consistent with preservation of capital and liquidity. This money market fund does not pay a management fee to MFS but does incur investment and operating costs.
(4) Portfolio Securities
For the year ended December 31, 2022, purchases and sales of investments, other than short-term obligations, were as follows:
| | Purchases | Sales |
| U.S. Government securities | $131,455,988 | $147,095,165 |
| Non-U.S. Government securities | 130,068,560 | 123,261,901 |
MFS Inflation-Adjusted Bond Portfolio
Notes to Financial Statements - continued
(5) Shares of Beneficial Interest
The fund's Declaration of Trust permits the Trustees to issue an unlimited number of full and fractional shares of beneficial interest. Transactions in fund shares were as follows:
| | Year ended
12/31/22 | | Year ended
12/31/21 |
| | Shares | Amount | | Shares | Amount |
| Shares sold | | | | | |
| Initial Class | 564,068 | $4,806,981 | | 223,436 | $2,667,109 |
| Service Class | 1,016,586 | 9,132,485 | | 1,067,266 | 12,419,057 |
| | 1,580,654 | $13,939,466 | | 1,290,702 | $15,086,166 |
Shares issued to shareholders
in reinvestment of distributions | | | | | |
| Initial Class | 1,217,463 | $10,811,076 | | 291,582 | $3,498,989 |
| Service Class | 1,169,851 | 10,271,292 | | 263,972 | 3,133,350 |
| | 2,387,314 | $21,082,368 | | 555,554 | $6,632,339 |
| Shares reacquired | | | | | |
| Initial Class | (1,040,479) | $(10,427,441) | | (931,878) | $(11,261,662) |
| Service Class | (1,543,930) | (14,930,236) | | (1,526,352) | (18,030,929) |
| | (2,584,409) | $(25,357,677) | | (2,458,230) | $(29,292,591) |
| Net change | | | | | |
| Initial Class | 741,052 | $5,190,616 | | (416,860) | $(5,095,564) |
| Service Class | 642,507 | 4,473,541 | | (195,114) | (2,478,522) |
| | 1,383,559 | $9,664,157 | | (611,974) | $(7,574,086) |
The fund is one of several mutual funds in which certain MFS funds may invest. The MFS funds do not invest in the underlying funds for the purpose of exercising management or control. At the end of the period, the MFS Moderate Allocation Portfolio, the MFS Conservative Allocation Portfolio, and the MFS Growth Allocation Portfolio were the owners of record of approximately 27%, 16%, and 7%, respectively, of the value of outstanding voting shares of the fund.
(6) Line of Credit
The fund and certain other funds managed by MFS participate in a $1.45 billion unsecured committed line of credit of which $1.2 billion is reserved for use by the fund and certain other MFS U.S. funds. The line of credit is provided by a syndicate of banks under a credit agreement. Borrowings may be made for temporary financing needs. Interest is charged to each fund, based on its borrowings, generally at a rate equal to the highest of 1) Daily Simple SOFR (Secured Overnight Financing Rate) plus 0.10%, 2) the Federal Funds Effective Rate, or 3) the Overnight Bank Funding Rate, each plus an agreed upon spread. A commitment fee, based on the average daily unused portion of the committed line of credit, is allocated among the participating funds. The line of credit expires on March 16, 2023 unless extended or renewed. In addition, the fund and other funds managed by MFS have established unsecured uncommitted borrowing arrangements with certain banks for temporary financing needs. Interest is charged to each fund, based on its borrowings, at rates equal to customary reference rates plus an agreed upon spread. For the year ended December 31, 2022, the fund’s commitment fee and interest expense were $1,024 and $0, respectively, and are included in “Miscellaneous” expense in the Statement of Operations.
(7) Investments in Affiliated Issuers
An affiliated issuer may be considered one in which the fund owns 5% or more of the outstanding voting securities, or a company which is under common control. For the purposes of this report, the following were affiliated issuers:
| Affiliated Issuers | Beginning
Value | Purchases | Sales
Proceeds | Realized
Gain
(Loss) | Change in
Unrealized
Appreciation or
Depreciation | Ending
Value |
| MFS Institutional Money Market Portfolio | $157,672 | $72,577,887 | $72,219,751 | $(191) | $20 | $515,637 |
MFS Inflation-Adjusted Bond Portfolio
Notes to Financial Statements - continued
| Affiliated Issuers | Dividend
Income | Capital Gain
Distributions |
| MFS Institutional Money Market Portfolio | $13,234 | $— |
(8) LIBOR Transition
Certain of the fund's investments, including investments in certain debt instruments and derivatives (if any), as well as borrowings by the fund and certain other contractual arrangements of the fund, may be based on the London Interbank Offered Rate (“LIBOR”). In 2017, the regulatory authority that oversees financial services firms in the United Kingdom announced plans to transition away from LIBOR by the end of 2021. In March 2021, the administrator of LIBOR announced the extension of the publication of the more commonly used U.S. dollar LIBOR settings to the end of June 2023. Although the full impacts of the transition away from LIBOR are not fully known, the transition may result in, among other things, an increase in volatility or illiquidity of the markets for instruments that currently rely on LIBOR to determine interest rates and this could have an adverse impact on the fund's performance. With respect to the fund's accounting for investments, including investments in certain debt instruments and derivatives, as well as borrowings by the fund and any other contractual arrangements of the fund that undergo reference rate-related modifications as a result of the transition, management will rely upon the relief provided by FASB Codification Topic 848 – Reference Rate Reform (Topic 848). The guidance in Topic 848 permits the fund to account for those modified contracts as a continuation of the existing contracts. Management is still evaluating the impact to the fund of the June 30, 2023 planned discontinuation of the more commonly used U.S. dollar LIBOR settings.
(9) Russia and Ukraine Conflict
The market disruptions, which began in late February 2022, associated with geopolitical events related to the conflict between Russia and Ukraine may adversely affect the value of the fund’s assets and thus the fund’s performance. Management continues to monitor these events and to evaluate the related impacts, if any, to the fund.
MFS Inflation-Adjusted Bond Portfolio
Report of Independent Registered Public Accounting Firm
To the Board of Trustees of MFS Variable Insurance Trust III and the Shareholders of MFS Inflation-Adjusted Bond Portfolio:
Opinion on the Financial Statements and Financial Highlights
We have audited the accompanying statement of assets and liabilities of MFS Inflation-Adjusted Bond Portfolio (the “Fund”), including the portfolio of investments, as of December 31, 2022, the related statement of operations for the year then ended, the statements of changes in net assets for each of the two years in the period then ended, the financial highlights for each of the five years in the period then ended, and the related notes. In our opinion, the financial statements and financial highlights present fairly, in all material respects, the financial position of the Fund as of December 31, 2022, and the results of its operations for the year then ended, the changes in its net assets for each of the two years in the period then ended, and the financial highlights for each of the five years in the period then ended, in conformity with accounting principles generally accepted in the United States of America.
Basis for Opinion
These financial statements and financial highlights are the responsibility of the Fund's management. Our responsibility is to express an opinion on the Fund's financial statements and financial highlights based on our audits. We are a public accounting firm registered with the Public Company Accounting Oversight Board (United States) (PCAOB) and are required to be independent with respect to the Fund in accordance with the U.S. federal securities laws and the applicable rules and regulations of the Securities and Exchange Commission and the PCAOB.
We conducted our audits in accordance with the standards of the PCAOB. Those standards require that we plan and perform the audit to obtain reasonable assurance about whether the financial statements and financial highlights are free of material misstatement, whether due to error or fraud. The Fund is not required to have, nor were we engaged to perform, an audit of its internal control over financial reporting. As part of our audits, we are required to obtain an understanding of internal control over financial reporting but not for the purpose of expressing an opinion on the effectiveness of the Fund's internal control over financial reporting. Accordingly, we express no such opinion.
Our audits included performing procedures to assess the risks of material misstatement of the financial statements and financial highlights, whether due to error or fraud, and performing procedures that respond to those risks. Such procedures included examining, on a test basis, evidence regarding the amounts and disclosures in the financial statements and financial highlights. Our audits also included evaluating the accounting principles used and significant estimates made by management, as well as evaluating the overall presentation of the financial statements and financial highlights. Our procedures included confirmation of securities owned as of December 31, 2022, by correspondence with the custodian and brokers; when replies were not received from brokers, we performed other auditing procedures. We believe that our audits provide a reasonable basis for our opinion.
DELOITTE & TOUCHE LLP
Boston, Massachusetts
February 15, 2023
We have served as the auditor of one or more of the MFS investment companies since 1924.
MFS Inflation-Adjusted Bond Portfolio
Trustees and Officers — Identification and Background
The Trustees and Officers of the Trust, as of February 1, 2023, are listed below, together with their principal occupations during the past five years. (Their titles may have varied during that period.) The address of each Trustee and Officer is 111 Huntington Avenue, Boston, Massachusetts 02199-7618.
| Name, Age | | Position(s) Held with Fund | | Trustee/Officer Since(h) | | Number of MFS Funds overseen by the Trustee | | Principal Occupations During
the Past Five Years | | Other Directorships During
the Past Five Years (j) |
| INTERESTED TRUSTEE | | | | | | | | | | |
Michael W. Roberge (k)
(age 56) | | Trustee | | January 2021 | | 136 | | Massachusetts Financial Services Company, Chairman (since January 2021); Chief Executive Officer (since January 2017); Director; Chairman of the Board (since January 2022); President (until December 2018); Chief Investment Officer (until December 2018) | | N/A |
| INDEPENDENT TRUSTEES | | | | | | | | | | |
John P. Kavanaugh
(age 68) | | Trustee and Chair of Trustees | | January 2009 | | 136 | | Private investor | | N/A |
Steven E. Buller
(age 71) | | Trustee | | February 2014 | | 136 | | Private investor | | N/A |
John A. Caroselli
(age 68) | | Trustee | | March 2017 | | 136 | | Private investor; JC Global Advisors, LLC (management consulting), President (since 2015) | | N/A |
Maureen R. Goldfarb
(age 67) | | Trustee | | January 2009 | | 136 | | Private investor | | N/A |
Peter D. Jones
(age 67) | | Trustee | | January 2019 | | 136 | | Private investor | | N/A |
James W. Kilman, Jr.
(age 61) | | Trustee | | January 2019 | | 136 | | Burford Capital Limited (finance and investment management), Senior Advisor (since May 3, 2021), Chief Financial Officer (2019 - May 2, 2021); KielStrand Capital LLC (family office), Chief Executive Officer (since 2016) | | Alpha-En Corporation, Director (2016-2019) |
Clarence Otis, Jr.
(age 66) | | Trustee | | March 2017 | | 136 | | Private investor | | VF Corporation, Director; Verizon Communications, Inc., Director; The Travelers Companies, Director |
Maryanne L. Roepke
(age 66) | | Trustee | | May 2014 | | 136 | | Private investor | | N/A |
Laurie J. Thomsen
(age 65) | | Trustee | | March 2005 | | 136 | | Private investor | | The Travelers Companies, Director; Dycom Industries, Inc., Director |
MFS Inflation-Adjusted Bond Portfolio
Trustees and Officers - continued
| Name, Age | | Position(s) Held with
Fund | | Trustee/Officer Since(h) | | Number of MFS Funds for which the Person is an Officer | | Principal Occupations During
the Past Five Years |
| OFFICERS | | | | | | | | |
Christopher R. Bohane (k)
(age 49) | | Assistant Secretary and Assistant Clerk | | July 2005 | | 136 | | Massachusetts Financial Services Company, Senior Vice President and Senior Managing Counsel |
Kino Clark (k)
(age 54) | | Assistant Treasurer | | January 2012 | | 136 | | Massachusetts Financial Services Company, Vice President |
John W. Clark, Jr. (k)
(age 55) | | Assistant Treasurer | | April 2017 | | 136 | | Massachusetts Financial Services Company, Vice President |
David L. DiLorenzo (k)
(age 54) | | President | | July 2005 | | 136 | | Massachusetts Financial Services Company, Senior Vice President |
Heidi W. Hardin (k)
(age 55) | | Secretary and Clerk | | April 2017 | | 136 | | Massachusetts Financial Services Company, Executive Vice President and General Counsel |
Brian E. Langenfeld (k)
(age 49) | | Assistant Secretary and Assistant Clerk | | June 2006 | | 136 | | Massachusetts Financial Services Company, Vice President and Managing Counsel |
Rosa E. Licea-Mailloux (k)
(age 46) | | Chief Compliance Officer | | March 2022 | | 136 | | Massachusetts Financial Services Company, Vice President (since 2018); Director of Corporate Compliance (2018-2021), Senior Director Compliance (2021-2022), Senior Managing Director of North American Compliance & Chief Compliance Officer (since March 2022); Natixis Investment Managers (investment management), Funds Chief Compliance Officer, Deputy General Counsel & Senior Vice President (until 2018) |
Amanda S. Mooradian (k)
(age 43) | | Assistant Secretary and Assistant Clerk | | September 2018 | | 136 | | Massachusetts Financial Services Company, Assistant Vice President and Senior Counsel |
Susan A. Pereira (k)
(age 52) | | Assistant Secretary and Assistant Clerk | | July 2005 | | 136 | | Massachusetts Financial Services Company, Vice President and Managing Counsel |
Kasey L. Phillips (k)
(age 52) | | Assistant Treasurer | | September 2012 | | 136 | | Massachusetts Financial Services Company, Vice President |
Matthew A. Stowe (k)
(age 48) | | Assistant Secretary and Assistant Clerk | | October 2014 | | 136 | | Massachusetts Financial Services Company, Vice President and Senior Managing Counsel |
William B. Wilson (k)
(age 40) | | Assistant Secretary and Assistant Clerk | | October 2022 | | 136 | | Massachusetts Financial Services Company, Assistant Vice President and Counsel |
James O. Yost (k)
(age 62) | | Treasurer | | September 1990 | | 136 | | Massachusetts Financial Services Company, Senior Vice President |
| (h) | Date first appointed to serve as Trustee/Officer of an MFS Fund. Each Trustee has served continuously since appointment unless indicated otherwise. From January 2012 through December 2016, Messrs. DiLorenzo and Yost served as Treasurer and Deputy Treasurer of the Funds, respectively. |
| (j) | Directorships or trusteeships of companies required to report to the Securities and Exchange Commission (i.e., “public companies”). |
| (k) | “Interested person” of the Trust within the meaning of the Investment Company Act of 1940 (referred to as the 1940 Act), which is the principal federal law governing investment companies like the fund, as a result of a position with MFS. The address of MFS is 111 Huntington Avenue, Boston, Massachusetts 02199-7618. |
Each Trustee (other than Messrs. Jones, Kilman and Roberge) has been elected by shareholders and each Trustee and Officer holds office until his or her successor is chosen and qualified or until his or her earlier death, resignation, retirement or removal. Mr. Roberge became a Trustee of the Funds on January 1, 2021 and Messrs. Jones and Kilman became Trustees of the Funds on January 1, 2019. The Trust does not hold annual meetings for the purpose of electing Trustees, and Trustees are not elected for fixed terms. Under the terms of the Board's retirement policy, an Independent Trustee shall retire at the end of the calendar year in which he or she reaches the earlier of 75 years of age or 15 years of service on the Board (or, in the case of any Independent Trustee who joined the Board prior to 2015, 20 years of service on the Board).
MFS Inflation-Adjusted Bond Portfolio
Trustees and Officers - continued
Messrs. Buller, Kilman and Otis and Ms. Roepke are members of the Trust’s Audit Committee.
Each of the Interested Trustees and certain Officers hold comparable officer positions with certain affiliates of MFS.
The Statement of Additional Information for a Fund includes further information about the Trustees and is available without charge upon request by calling 1-800-225-2606.
| Investment Adviser | Custodian |
Massachusetts Financial Services Company
111 Huntington Avenue
Boston, MA 02199-7618 | State Street Bank and Trust Company
1 Lincoln Street
Boston, MA 02111-2900 |
| Distributor | Independent Registered Public Accounting Firm |
MFS Fund Distributors, Inc.
111 Huntington Avenue
Boston, MA 02199-7618 | Deloitte & Touche LLP
200 Berkeley Street
Boston, MA 02116 |
| Portfolio Manager(s) | |
Robert Spector
Erik Weisman | |
MFS Inflation-Adjusted Bond Portfolio
Board Review of Investment Advisory Agreement
MFS Inflation-Adjusted Bond Portfolio
The Investment Company Act of 1940 requires that both the full Board of Trustees and a majority of the non-interested (“independent”) Trustees, voting separately, annually approve the continuation of the Fund’s investment advisory agreement with MFS. The Trustees consider matters bearing on the Fund and its advisory arrangements at their meetings throughout the year, including a review of performance data at each regular meeting. In addition, the independent Trustees met several times over the course of three months beginning in May and ending in July, 2022 (“contract review meetings”) for the specific purpose of considering whether to approve the continuation of the investment advisory agreement for the Fund and the other investment companies that the Board oversees (the “MFS Funds”). The independent Trustees were assisted in their evaluation of the Fund’s investment advisory agreement by independent legal counsel, from whom they received separate legal advice and with whom they met separately from MFS during various contract review meetings. The independent Trustees were also assisted in this process by an independent consultant who was retained by and reported to the independent Trustees.
In connection with their deliberations regarding the continuation of the investment advisory agreement, the Trustees, including the independent Trustees, considered such information and factors as they believed, in light of the legal advice furnished to them and their own business judgment, to be relevant. The investment advisory agreement for the Fund was considered separately, although the Trustees also took into account the common interests of all MFS Funds in their review. As described below, the Trustees considered the nature, quality, and extent of the various investment advisory, administrative, and shareholder services performed by MFS under the existing investment advisory agreement and other arrangements with the Fund.
In connection with their contract review meetings, the Trustees received and relied upon materials that included, among other items: (i) information provided by Broadridge Financial Solutions, Inc. (“Broadridge”), an independent third party, on the investment performance of the Fund for various time periods ended December 31, 2021 and the investment performance of a group of funds with substantially similar investment classifications/objectives (the “Broadridge performance universe”), (ii) information provided by Broadridge on the Fund’s advisory fees and other expenses and the advisory fees and other expenses of comparable funds identified by Broadridge as well as all other funds in the same investment classification/category (the “Broadridge expense group and universe”), (iii) information provided by MFS on the advisory fees of portfolios of other clients of MFS, including institutional separate accounts and other clients, (iv) information as to whether and to what extent applicable expense waivers, reimbursements or fee “breakpoints” are observed for the Fund, (v) information regarding MFS’ financial results and financial condition, including MFS’ and certain of its affiliates’ estimated profitability from services performed for the Fund and the MFS Funds as a whole, and compared to MFS’ institutional business, (vi) MFS’ views regarding the outlook for the mutual fund industry and the strategic business plans of MFS, (vii) descriptions of various functions performed by MFS for the Funds, such as compliance monitoring and portfolio trading practices, and (viii) information regarding the overall organization of MFS, including information about MFS’ senior management and other personnel providing investment advisory, administrative and other services to the Fund and the other MFS Funds. The comparative performance, fee and expense information prepared and provided by Broadridge was not independently verified and the independent Trustees did not independently verify any information provided to them by MFS.
The Trustees’ conclusion as to the continuation of the investment advisory agreement was based on a comprehensive consideration of all information provided to the Trustees and not the result of any single factor. Some of the factors that figured particularly in the Trustees’ deliberations are described below, although individual Trustees may have evaluated the information presented differently from one another, giving different weights to various factors. It is also important to recognize that the fee arrangements for the Fund and other MFS Funds are the result of years of review and discussion between the independent Trustees and MFS, that certain aspects of such arrangements may receive greater scrutiny in some years than in others, and that the Trustees’ conclusions may be based, in part, on their consideration of these same arrangements during the course of the year and in prior years.
Based on information provided by Broadridge and MFS, the Trustees reviewed the Fund’s total return investment performance as well as the Broadridge performance universe over various time periods. The Trustees placed particular emphasis on the total return performance of the Fund’s Initial Class shares in comparison to the performance of funds in its Broadridge performance universe over the five-year period ended December 31, 2021, which the Trustees believed was a long enough period to reflect differing market conditions. The total return performance of the Fund’s Initial Class shares was in the 2nd quintile relative to the other funds in the universe for this five-year period (the 1st quintile being the best performers and the 5th quintile being the worst performers). The total return performance of the Fund’s Initial Class shares was in the 5th quintile for the one-year period and the 4th quintile for the three-year period ended December 31, 2021 relative to the Broadridge performance universe. Because of the passage of time, these performance results may differ from the performance results for more recent periods, including those shown elsewhere in this report.
In the course of their deliberations, the Trustees took into account information provided by MFS in connection with the contract review meetings, as well as during investment review meetings conducted with portfolio management personnel during the course of the year regarding the Fund’s performance. After reviewing these and related factors, the Trustees concluded, within the context of their overall conclusions regarding the investment advisory agreement, that they were satisfied with MFS’ responses and efforts relating to investment performance.
MFS Inflation-Adjusted Bond Portfolio
Board Review of Investment Advisory Agreement - continued
In assessing the reasonableness of the Fund’s advisory fee, the Trustees considered, among other information, the Fund’s advisory fee and the total expense ratio of the Fund’s Initial Class shares as a percentage of average daily net assets and the advisory fee and total expense ratios of the Broadridge expense group based on information provided by Broadridge. The Trustees considered that, according to the data provided by Broadridge (which takes into account any fee reductions or expense limitations that were in effect during the Fund’s last fiscal year), the Fund’s effective advisory fee rate and total expense ratio were each approximately at the Broadridge expense group median.
The Trustees also considered the advisory fees charged by MFS to any institutional separate accounts advised by MFS (“separate accounts”) and unaffiliated investment companies for which MFS serves as subadviser (“subadvised funds”) that have comparable investment strategies to the Fund, if any. In comparing these fees, the Trustees considered information provided by MFS as to the generally broader scope of services provided by MFS to the Fund, as well as the more extensive regulatory burdens imposed on MFS in managing the Fund, in comparison to separate accounts and subadvised funds. The Trustees also considered the higher demands placed on MFS’ investment personnel and trading infrastructure as a result of the daily cash in-flows and out-flows of the Fund in comparison to separate accounts.
The Trustees also considered whether the Fund may benefit from any economies of scale in the management of the Fund in the event of growth in assets of the Fund and/or growth in assets of the MFS Funds as a whole. They noted that the Fund’s advisory fee rate schedule is not subject to any breakpoints. Taking into account that the Fund’s effective advisory fee rate was approximately at the Broadridge expense group median described above, the Trustees determined not to recommend any advisory fee breakpoints for the Fund at this time. The Trustees also noted that MFS has agreed in writing to waive a portion of the management fees of certain MFS Funds, including the Fund, if the total combined assets of certain funds within the MFS Funds’ complex increase above agreed upon thresholds (the “group fee waiver”), enabling the Fund’s shareholders to share in the benefits from any economies of scale at the complex level. The group fee waiver is reviewed and renewed annually between the Board and MFS. The Trustees concluded that the group fee waiver was sufficient to allow the Fund to benefit from economies of scale as its assets and overall complex assets grow.
The Trustees also considered information prepared by MFS relating to MFS’ costs and profits with respect to the Fund, the MFS Funds considered as a group, and other investment companies and accounts advised by MFS, as well as MFS’ methodologies used to determine and allocate its costs to the MFS Funds, the Fund and other accounts and products for purposes of estimating profitability.
After reviewing these and other factors described herein, the Trustees concluded, within the context of their overall conclusions regarding the investment advisory agreement, that the advisory fees charged to the Fund represent reasonable compensation in light of the services being provided by MFS to the Fund.
In addition, the Trustees considered MFS’ resources and related efforts to continue to retain, attract and motivate capable personnel to serve the Fund. The Trustees also considered current and developing conditions in the financial services industry, including the presence of large and well-capitalized companies which are spending, and appear to be prepared to continue to spend, substantial sums to engage personnel and to provide services to competing investment companies. In this regard, the Trustees also considered the financial resources of MFS and its ultimate parent, Sun Life Financial Inc. The Trustees also considered the advantages and possible disadvantages to the Fund of having an adviser that also serves other investment companies as well as other accounts.
The Trustees also considered the nature, quality, cost, and extent of administrative, transfer agency, and distribution services provided to the Fund by MFS and its affiliates under agreements and plans other than the investment advisory agreement, including any 12b-1 fees the Fund pays to MFS Fund Distributors, Inc., an affiliate of MFS. The Trustees also considered the nature, extent and quality of certain other services MFS performs or arranges for on the Fund’s behalf, which may include securities lending programs, directed expense payment programs, class action recovery programs, and MFS’ interaction with third-party service providers, principally custodians and sub-custodians. The Trustees concluded that the various non-advisory services provided by MFS and its affiliates on behalf of the Fund were satisfactory.
The Trustees considered so-called “fall-out benefits” to MFS such as reputational value derived from serving as investment manager to the MFS Funds. The Trustees also considered that MFS discontinued its historic practice of obtaining investment research from portfolio brokerage commissions paid by certain MFS Funds effective January 2018, and directly pays or voluntarily reimburses a Fund, if applicable, for the costs of external research acquired through the use of the Fund’s portfolio brokerage commissions.
Based on their evaluation of factors that they deemed to be material, including those factors described above, the Board of Trustees, including the independent Trustees, concluded that the Fund’s investment advisory agreement with MFS should be continued for an additional one-year period, commencing August 1, 2022.
MFS Inflation-Adjusted Bond Portfolio
Proxy Voting Policies and Information
MFS votes proxies on behalf of the fund pursuant to proxy voting policies and procedures that are available without charge, upon request, by calling 1-800-225-2606, by visiting mfs.com/proxyvoting, or by visiting the SEC’s Web site at http://www.sec.gov.
Information regarding how the fund voted proxies relating to portfolio securities during the most recent twelve-month period ended June 30 is available by August 31 of each year without charge by visiting mfs.com/proxyvoting, or by visiting the SEC’s Web site at http://www.sec.gov.
Quarterly Portfolio Disclosure
The fund files a complete schedule of portfolio holdings with the SEC for the first and third quarters of each fiscal year as an exhibit to its reports on Form N-PORT. The fund’s Form N-PORT reports are available on the SEC’s Web site at http://www.sec.gov. A shareholder can obtain the portfolio holdings report for the first and third quarters of the fund's fiscal year at mfs.com/vit3 by choosing the fund's name and then scrolling to the “Resources” section and clicking on the “Prospectus and Reports” tab.
FURTHER INFORMATION
From time to time, MFS may post important information about the fund or the MFS Funds on the MFS Web site (mfs.com). This information is available at https://www.mfs.com/announcements or at mfs.com/vit3 by choosing the fund's name and then scrolling to the “Resources” section and clicking on the “Announcements” tab, if any.
Information About Fund Contracts and Legal Claims
The fund has entered into contractual arrangements with an investment adviser, administrator, distributor, shareholder servicing agent, and custodian who each provide services to the fund. Unless expressly stated otherwise, shareholders are not parties to, or intended beneficiaries of these contractual arrangements, and these contractual arrangements are not intended to create any shareholder right to enforce them against the service providers or to seek any remedy under them against the service providers, either directly or on behalf of the fund.
Under the Trust’s By-Laws and Declaration of Trust, any claims asserted against or on behalf of the MFS Funds, including claims against Trustees and Officers, must be brought in state and federal courts located within the Commonwealth of Massachusetts.
Federal Tax Information (unaudited)
The following information is provided pursuant to provisions of the Internal Revenue Code.
The fund designates $12,110,000 as capital gain dividends paid during the fiscal year.
The fund intends to pass through the maximum amount allowable as Section 163(j) Interest Dividends as defined in Treasury Regulation §1.163(j)-1(b).
| FACTS | WHAT DOES MFS DO WITH YOUR PERSONAL INFORMATION? |
| Why? | Financial companies choose how they share your personal information. Federal law gives consumers the right to limit some but not all sharing. Federal law also requires us to tell you how we collect, share, and protect your personal information. Please read this notice carefully to understand what we do. |
| What? | The types of personal information we collect and share depend on the product or service you have with us. This information can include: |
| • Social Security number and account balances |
| • Account transactions and transaction history |
| • Checking account information and wire transfer instructions |
| When you are no longer our customer, we continue to share your information as described in this notice. |
| How? | All financial companies need to share customers' personal information to run their everyday business. In the section below, we list the reasons financial companies can share their customers' personal information; the reasons MFS chooses to share; and whether you can limit this sharing. |
Reasons we can share your
personal information | Does MFS share? | Can you limit
this sharing? |
For our everyday business purposes –
such as to process your transactions, maintain your
account(s), respond to court orders and legal
investigations, or report to credit bureaus | Yes | No |
For our marketing purposes –
to offer our products and services to you | No | We don't share |
For joint marketing with other
financial companies | No | We don't share |
For our affiliates' everyday business purposes –
information about your transactions and experiences | No | We don't share |
For our affiliates' everyday business purposes –
information about your creditworthiness | No | We don't share |
| For nonaffiliates to market to you | No | We don't share |
| Questions? | Call 800-225-2606 or go to mfs.com. |
| Who we are |
| Who is providing this notice? | MFS Funds, MFS Investment Management, MFS Institutional Advisors, Inc., and MFS Heritage Trust Company. |
| What we do |
How does MFS
protect my personal
information? | To protect your personal information from unauthorized access and use, we use security measures that comply with federal law. These measures include procedural, electronic, and physical safeguards for the protection of the personal information we collect about you. |
How does MFS
collect my personal
information? | We collect your personal information, for example, when you |
| • open an account or provide account information |
| • direct us to buy securities or direct us to sell your securities |
| • make a wire transfer |
| We also collect your personal information from others, such as credit bureaus, affiliates, or other companies. |
| Why can't I limit all sharing? | Federal law gives you the right to limit only |
| • sharing for affiliates' everyday business purposes – information about your creditworthiness |
| • affiliates from using your information to market to you |
| • sharing for nonaffiliates to market to you |
| State laws and individual companies may give you additional rights to limit sharing. |
| Definitions |
| Affiliates | Companies related by common ownership or control. They can be financial and nonfinancial companies. |
| • MFS does not share personal information with affiliates, except for everyday business purposes as described on page one of this notice. |
| Nonaffiliates | Companies not related by common ownership or control. They can be financial and nonfinancial companies. |
| • MFS does not share with nonaffiliates so they can market to you. |
| Joint marketing | A formal agreement between nonaffiliated financial companies that together market financial products or services to you. |
| • MFS doesn't jointly market. |
| Other important information |
| If you own an MFS product or receive an MFS service in the name of a third party such as a bank or broker-dealer, their privacy policy may apply to you instead of ours. |
Annual Report
December 31, 2022
MFS® Limited Maturity Portfolio
MFS® Variable Insurance Trust III
MFS® Limited Maturity Portfolio
| 1 |
| 2 |
| 3 |
| 4 |
| 6 |
| 7 |
| 17 |
| 18 |
| 19 |
| 20 |
| 22 |
| 31 |
| 32 |
| 35 |
| 37 |
| 37 |
| 37 |
| 37 |
| 37 |
| 38 |
The report is prepared for the general information of shareholders. It is authorized for distribution to prospective investors only when preceded or accompanied by a current prospectus.
NOT FDIC INSURED • MAY LOSE VALUE • NO BANK OR CREDIT UNION GUARANTEE •
NOT A DEPOSIT • NOT INSURED BY ANY FEDERAL GOVERNMENT AGENCY OR NCUA/NCUSIF
MFS Limited Maturity Portfolio
LETTER FROM THE CHAIR AND CEO
Dear Shareholders:
Signs of peaking inflation, hopes that monetary policy tightening cycles may be nearing an end and a rapid reopening of China’s economy in late-2022 and early-2023 have combined to bolster investor sentiment in recent months. Markets have largely adjusted to the challenges posed by Russia’s invasion of Ukraine, thanks in part to mild European winter weather which has alleviated concerns over potential shortages of natural gas. Resilient labor markets in much of the developed world have further contributed to a brighter-than-expected economic backdrop. However, many investors are mindful that the lagged effects of ongoing policy tightening have yet to work their way through the global economy.
Tighter global financial conditions have been a particular headwind for richly valued growth equities and interest rate-sensitive parts of the economy, such as housing. Over the near term, companies may face a challenging earnings backdrop as they are forced to absorb higher input and labor costs at a time of dwindling pricing power. For fixed income, the rise in interest rates has made bonds more attractive than they have been in years, which may provide balance to an overall portfolio.
During times of market transition, it is important to have a deep understanding of company fundamentals, and we have built our unique global research platform to do just that.
At MFS®, we put our clients’ assets to work responsibly by carefully navigating increasingly complex global capital markets. Our investment team is guided by a commitment to long-term fundamental investing. Our global investment platform — combining collective expertise, long-term discipline, and thoughtful risk management — seeks to uncover what we believe are the best, most durable investment ideas in markets around the world, enabling us to potentially create value for investors.
Respectfully,
Michael W. Roberge
Chair and Chief Executive Officer
MFS Investment Management
February 15, 2023
The opinions expressed in this letter are subject to change and may not be relied upon for investment advice. No forecasts can be guaranteed.
MFS Limited Maturity Portfolio
Portfolio structure (i)
Fixed income sectors (i)
| Investment Grade Corporates | 42.1% |
| U.S. Treasury Securities | 32.3% |
| Collateralized Debt Obligations | 11.3% |
| Commercial Mortgage-Backed Securities | 7.1% |
| Emerging Markets Bonds | 2.9% |
| Municipal Bonds | 2.8% |
| Asset-Backed Securities | 2.2% |
| High Yield Corporates | 1.8% |
| Mortgage-Backed Securities | 1.0% |
Composition including fixed income credit quality (a)(i)
| AAA | 8.1% |
| AA | 10.8% |
| A | 24.4% |
| BBB | 35.1% |
| BB | 1.8% |
| U.S. Government | 17.4% |
| Federal Agencies | 1.1% |
| Not Rated | 4.8% |
| Cash & Cash Equivalents | 1.3% |
| Other | (4.8)% |
Portfolio facts
| Average Duration (d) | 2.0 |
| Average Effective Maturity (m) | 2.3 yrs. |
| (a) | For all securities other than those specifically described below, ratings are assigned to underlying securities utilizing ratings from Moody’s, Fitch, and Standard & Poor’s rating agencies and applying the following hierarchy: If all three agencies provide a rating, the middle rating (after dropping the highest and lowest ratings) is assigned; if two of the three agencies rate a security, the lower of the two is assigned. If none of the 3 rating agencies above assign a rating, but the security is rated by DBRS Morningstar, then the DBRS Morningstar rating is assigned. If none of the 4 rating agencies listed above rate the security, but the security is rated by the Kroll Bond Rating Agency (KBRA), then the KBRA rating is assigned. Ratings are shown in the S&P and Fitch scale (e.g., AAA). Securities rated BBB or higher are considered investment grade. All ratings are subject to change. U.S. Government includes securities issued by the U.S. Department of the Treasury. Federal Agencies includes rated and unrated U.S. Agency fixed-income securities, U.S. Agency mortgage-backed securities, and collateralized mortgage obligations of U.S. Agency mortgage-backed securities. Not Rated includes fixed income securities and fixed income derivatives that have not been rated by any rating agency. The fund may or may not have held all of these instruments on this date. The fund is not rated by these agencies. |
| (d) | Duration is a measure of how much a bond’s price is likely to fluctuate with general changes in interest rates, e.g., if rates rise 1.00%, a bond with a 5-year duration is likely to lose about 5.00% of its value due to the interest rate move. The Average Duration calculation reflects the impact of the equivalent exposure of derivative positions, if any. |
| (i) | For purposes of this presentation, the components include the value of securities, and reflect the impact of the equivalent exposure of derivative positions, if any. These amounts may be negative from time to time. Equivalent exposure is a calculated amount that translates the derivative position into a reasonable approximation of the amount of the underlying asset that the portfolio would have to hold at a given point in time to have the same price sensitivity that results from the portfolio’s ownership of the derivative contract. When dealing with derivatives, equivalent exposure is a more representative measure of the potential impact of a position on portfolio performance than value. The bond component will include any accrued interest amounts. |
| (m) | In determining each instrument’s effective maturity for purposes of calculating the fund’s dollar-weighted average effective maturity, MFS uses the instrument’s stated maturity or, if applicable, an earlier date on which MFS believes it is probable that a maturity-shortening device (such as a put, pre-refunding or prepayment) will cause the instrument to be repaid. Such an earlier date can be substantially shorter than the instrument’s stated maturity. |
Where the fund holds convertible bonds, they are treated as part of the equity portion of the portfolio.
Cash & Cash Equivalents includes any cash, investments in money market funds, short-term securities, and other assets less liabilities. Please see the Statement of Assets and Liabilities for additional information related to the fund’s cash position and other assets and liabilities.
Other includes equivalent exposure from currency derivatives and/or any offsets to derivative positions and may be negative.
Percentages are based on net assets as of December 31, 2022.
The portfolio is actively managed and current holdings may be different.
MFS Limited Maturity Portfolio
Management Review
Summary of Results
For the twelve months ended December 31, 2022, Initial Class shares of the MFS Limited Maturity Portfolio (fund) provided a total return of -4.14%, while Service Class shares of the fund provided a total return of -4.24%. These compare with a return of -3.69% over the same period for the fund’s benchmark, the Bloomberg 1-3 Year U.S. Government/Credit Bond Index.
Market Environment
During the reporting period, markets continued to grapple with the strongest global inflationary pressures in decades along with signs of slowing economic growth. Intermittent coronavirus flareups, particularly in China, where home-grown vaccines have proved less effective than elsewhere, kept supply chains stretched for a considerable period. At the same time, the reopening of the economy in the parts of the world where the virus has been better contained has led to a shift in consumption patterns in favor of services, straining already tight labor markets in most developed economies, while reducing demand for manufactured goods, primarily from Asia. As a result of Russia’s invasion of Ukraine, geopolitical considerations, such as sanctions and trade bans, have resulted in additional supply chain disruptions and volatile global energy prices. Taken together, these factors have contributed to market volatility.
The ripple effects from the Russian invasion further complicated the mission central banks must undertake to rein in surging inflation. Energy shocks have historically resulted in global growth slowdowns, if not pullbacks, so policymakers will find themselves in the difficult position of trying to restrain inflation without tipping economies into recession. Despite the challenging macroeconomic and geopolitical environment, policymakers remained focused on controlling inflation, although investors appeared to have expected varying degrees of action from the central banks. The Fed has been among the most aggressive developed market central banks, tightening policy at the fastest rate in decades, although it slowed its hiking pace at the end of the period, as did the European Central Bank. After remaining on the monetary sidelines for much of the period, the Bank of Japan widened its Yield Curve Control band, capping the yield on its 10-year bond at 0.5%, up from 0.25%, an action investors interpreted as a first step toward monetary policy normalization.
Against an environment of still-tight labor markets, tighter global financial conditions and volatile materials prices, investor anxiety appeared to have increased over the potential that corporate profit margins may be past peak for this cycle. That said, tentative signs that supply chain bottlenecks (particularly semiconductors) may be moderating, the easing of COVID restrictions in China, low levels of unemployment across developed markets and hopes that inflation levels may be near a peak were supportive factors for the macroeconomic backdrop.
Factors Affecting Performance
Relative to the Bloomberg 1-3 Year U.S. Government/Credit Bond Index, the fund's asset allocation decisions detracted from performance, led by the fund's exposure to collateralized mortgage obligations (CMOs) and commercial mortgage-backed securities (CMBS), for which the benchmark has no exposure. Security selection also weighed on the fund’s relative performance over the reporting period, most notably within both the financial institutions and industrials sectors and within “BBB” rated(r) bonds.
Conversely, the fund’s underweight allocation to “AAA” rated bonds contributed to relative returns. Yield curve(y) positioning, particularly the fund’s greater exposure to shifts in the middle portion (centered around maturities of 5 years) of the yield curve, further supported relative performance.
Respectfully,
Portfolio Manager(s)
Philipp Burgener and Alexander Mackey
| (r) | Securities rated “BBB”, “Baa”, or higher are considered investment grade; securities rated “BB”, “Ba”, or below are considered non-investment grade. Ratings are assigned to underlying securities utilizing ratings from Moody's, Fitch, and Standard & Poor's and applying the following hierarchy: If all three agencies provide a rating, the middle rating (after dropping the highest and lowest ratings) is assigned; if two of the three agencies rate a security, the lower of the two is assigned. If none of the 3 rating agencies above assign a rating, but the security is rated by DBRS Morningstar, then the DBRS Morningstar rating is assigned. If none of the 4 rating agencies listed above rate the security, but the security is rated by the Kroll Bond Rating Agency (KBRA), then the KBRA rating is assigned. Ratings are shown in the S&P and Fitch scale (e.g., AAA). For securities that are not rated by any of the rating agencies, the security is considered Not Rated. |
| (y) | A yield curve graphically depicts the yields of different maturity bonds of the same credit quality and type; a normal yield curve is upward sloping, with short-term rates lower than long-term rates. |
The views expressed in this report are those of the portfolio manager(s) only through the end of the period of the report as stated on the cover and do not necessarily reflect the views of MFS or any other person in the MFS organization. These views are subject to change at any time based on market or other conditions, and MFS disclaims any responsibility to update such views. These views may not be relied upon as investment advice or an indication of trading intent on behalf of any MFS portfolio. References to specific securities are not recommendations of such securities, and may not be representative of any MFS portfolio’s current or future investments.
MFS Limited Maturity Portfolio
Performance Summary Through 12/31/22
The following chart illustrates the historical performance of the fund in comparison to its benchmark(s). Benchmarks are unmanaged and may not be invested in directly. Benchmark returns do not reflect any fees or expenses. The performance of other share classes will be greater than or less than that of the class depicted below. (See Notes to Performance Summary.)
Performance data shown represents past performance and is no guarantee of future results. Investment return and principal value fluctuate so your shares, when sold, may be worth more or less than the original cost; current performance may be lower or higher than quoted. The performance shown does not reflect the deduction of taxes, if any, that a shareholder would pay on fund distributions or the redemption of fund shares. The returns for the fund shown also do not reflect the deduction of expenses associated with variable products, such as mortality and expense risk charges, separate account charges, and sales charges imposed by the insurance company separate accounts. Such expenses would reduce the overall returns shown.
Growth of a Hypothetical $10,000 Investment
Total Returns through 12/31/22
Average annual total returns
| Share Class | Class Inception Date | 1-yr | 5-yr | 10-yr |
| Initial Class | 3/07/08 | (4.14)% | 1.31% | 1.19% |
| Service Class | 3/07/08 | (4.24)% | 1.07% | 0.95% |
Comparative benchmark(s)
| Bloomberg 1-3 Year U.S. Government/Credit Bond Index (f) | (3.69)% | 0.92% | 0.88% |
| (f) | Source: FactSet Research Systems Inc. |
Benchmark Definition(s)
Bloomberg 1-3 Year U.S. Government/Credit Bond Index(a) – a market capitalization-weighted index that measures the performance of the short-term (1 to 3 years) investment-grade corporate and U.S. government bond markets.
It is not possible to invest directly in an index.
| (a) | Source: Bloomberg Index Services Limited. BLOOMBERG® is a trademark and service mark of Bloomberg Finance L.P. and its affiliates (collectively “Bloomberg”). Bloomberg or Bloomberg's licensors own all proprietary rights in the Bloomberg Indices. Bloomberg neither approves or endorses this material, or guarantees the accuracy or completeness of any information herein, or makes any warranty, express or implied, as to the results to be obtained therefrom and, to the maximum extent allowed by law, neither shall have any liability or responsibility for injury or damages arising in connection therewith. |
MFS Limited Maturity Portfolio
Performance Summary – continued
Notes to Performance Summary
Average annual total return represents the average annual change in value for each share class for the periods presented.
Performance results reflect any applicable expense subsidies and waivers in effect during the periods shown. Without such subsidies and waivers the fund's performance results would be less favorable. Please see the prospectus and financial statements for complete details. All results are historical and assume the reinvestment of any dividends and capital gains distributions.
Performance results do not include adjustments made for financial reporting purposes in accordance with U.S. generally accepted accounting principles and may differ from amounts reported in the financial highlights.
From time to time the fund may receive proceeds from litigation settlements, without which performance would be lower.
MFS Limited Maturity Portfolio
Expense Table
Fund expenses borne by the shareholders during the period,
July 1, 2022 through December 31, 2022
As a shareholder of the fund, you incur ongoing costs, including management fees; distribution and/or service (12b-1) fees; and other fund expenses. This example is intended to help you understand your ongoing costs (in dollars) of investing in the fund and to compare these costs with the ongoing costs of investing in other mutual funds.
The example is based on an investment of $1,000 invested at the beginning of the period and held for the entire period July 1, 2022 through December 31, 2022.
Actual Expenses
The first line for each share class in the following table provides information about actual account values and actual expenses. You may use the information in this line, together with the amount you invested, to estimate the expenses that you paid over the period. Simply divide your account value by $1,000 (for example, an $8,600 account value divided by $1,000 = 8.6), then multiply the result by the number in the first line under the heading entitled “Expenses Paid During Period” to estimate the expenses you paid on your account during this period.
Hypothetical Example for Comparison Purposes
The second line for each share class in the following table provides information about hypothetical account values and hypothetical expenses based on the fund’s actual expense ratio and an assumed rate of return of 5% per year before expenses, which is not the fund’s actual return. The hypothetical account values and expenses may not be used to estimate the actual ending account balance or expenses you paid for the period. You may use this information to compare the ongoing costs of investing in the fund and other funds. To do so, compare this 5% hypothetical example with the 5% hypothetical examples that appear in the shareholder reports of the other funds.
Please note that the expenses shown in the table are meant to highlight the fund's ongoing costs only and do not take into account the fees and expenses imposed under the variable contracts through which your investment in the fund is made. Therefore, the second line for each share class in the table is useful in comparing ongoing costs associated with an investment in vehicles (such as the fund) which fund benefits under variable annuity and variable life insurance contracts and to qualified pension and retirement plans only, and will not help you determine the relative total costs of investing in the fund through variable annuity and variable life insurance contracts. If the fees and expenses imposed under the variable contracts were included, your costs would have been higher.
Share
Class | | Annualized
Expense
Ratio | Beginning
Account Value
7/01/22 | Ending
Account Value
12/31/22 | Expenses
Paid During
Period (p)
7/01/22-12/31/22 |
| Initial Class | Actual | 0.45% | $1,000.00 | $1,000.79 | $2.27 |
| Hypothetical (h) | 0.45% | $1,000.00 | $1,022.94 | $2.29 |
| Service Class | Actual | 0.70% | $1,000.00 | $1,000.78 | $3.53 |
| Hypothetical (h) | 0.70% | $1,000.00 | $1,021.68 | $3.57 |
| (h) | 5% class return per year before expenses. |
| (p) | “Expenses Paid During Period” are equal to each class's annualized expense ratio, as shown above, multiplied by the average account value over the period, multiplied by 184/365 (to reflect the one-half year period). |
MFS Limited Maturity Portfolio
Portfolio of Investments − 12/31/22
The Portfolio of Investments is a complete list of all securities owned by your fund. It is categorized by broad-based asset classes.
| Issuer | | | Shares/Par | Value ($) |
| Bonds – 98.0% |
| Aerospace & Defense – 1.0% |
| Boeing Co., 1.167%, 2/04/2023 | | $ | 438,000 | $ 436,318 |
| Boeing Co., 1.433%, 2/04/2024 | | | 876,000 | 839,477 |
| Boeing Co., 2.196%, 2/04/2026 | | | 1,118,000 | 1,015,773 |
| Huntington Ingalls Industries, Inc., 3.844%, 5/01/2025 | | | 1,049,000 | 1,013,552 |
| Raytheon Technologies Corp., 3.65%, 8/16/2023 | | | 114,000 | 113,040 |
| | | | | $3,418,160 |
| Asset-Backed & Securitized – 20.4% |
| 3650R Commercial Mortgage Trust, 2021-PF1, “XA”, 1.028%, 11/15/2054 (i) | | $ | 13,060,655 | $ 769,468 |
| ACREC 2021-FL1 Ltd., “AS”, FLR, 5.826% (LIBOR - 1mo. + 1.5%), 10/16/2036 (n) | | | 898,000 | 845,233 |
| ACREC 2021-FL1 Ltd., “B”, FLR, 6.126% (LIBOR - 1mo. + 1.8%), 10/16/2036 (n) | | | 1,596,000 | 1,502,903 |
| ACREC 2021-FL1 Ltd., “C”, FLR, 6.476% (LIBOR - 1mo. + 2.15%), 10/16/2036 (n) | | | 902,000 | 831,907 |
| AmeriCredit Automobile Receivables Trust, 2020-1, “C”, 1.59%, 10/20/2025 | | | 659,000 | 637,673 |
| Arbor Realty Trust, Inc., CLO, 2021-FL3, “B”, FLR, 5.917% (LIBOR - 1mo. + 1.6%), 8/15/2034 (n) | | | 455,000 | 414,075 |
| Arbor Realty Trust, Inc., CLO, 2021-FL3, “C”, FLR, 6.168% (LIBOR - 1mo. + 1.85%), 8/15/2034 (n) | | | 264,000 | 238,269 |
| Arbor Realty Trust, Inc., CLO, 2021-FL4, “AS”, FLR, 6.017% (LIBOR - 1mo. + 1.7%), 11/15/2036 (n) | | | 1,102,500 | 1,037,870 |
| Arbor Realty Trust, Inc., CLO, 2021-FL4, “B”, FLR, 6.317% (LIBOR - 1mo. + 2%), 11/15/2036 (n) | | | 1,102,500 | 1,030,937 |
| Arbor Realty Trust, Inc., CLO, 2021-FL4, “C”, FLR, 6.618% (LIBOR - 1mo. + 2.3%), 11/15/2036 (n) | | | 663,500 | 610,491 |
| Arbor Realty Trust, Inc., CLO, 2022-FL1, “C”, FLR, 6.107% (SOFR - 30 day + 2.3%), 1/15/2037 (n) | | | 1,737,500 | 1,619,157 |
| AREIT 2019-CRE3 Trust, “AS”, FLR, 5.74% (LIBOR - 1mo. + 1.3%), 9/14/2036 (n) | | | 647,000 | 630,113 |
| AREIT 2019-CRE3 Trust, “B”, FLR, 5.99% (LIBOR - 1mo. + 1.55%), 9/14/2036 (n) | | | 319,500 | 306,884 |
| AREIT 2019-CRE3 Trust, “C”, FLR, 6.34% (SOFR - 1mo. + 2.014%), 9/14/2036 (n) | | | 264,000 | 249,950 |
| AREIT 2022-CRE6 Trust, “D”, FLR, 6.676% (SOFR - 30 day + 2.85%), 1/16/2037 (n) | | | 237,500 | 219,408 |
| Avery Point CLO Ltd., 2014-1A, “CR”, FLR, 6.708% (LIBOR - 3mo. + 2.35%), 4/25/2026 (n) | | | 7,600 | 7,573 |
| Balboa Bay Loan Funding Ltd., 2020-1A, “BR”, FLR, 5.892% (LIBOR - 3mo. + 1.65%), 1/20/2032 (n) | | | 1,039,826 | 995,456 |
| Balboa Bay Loan Funding Ltd., 2020-1A, “CR”, FLR, 6.342% (LIBOR - 3mo. + 2.1%), 1/20/2032 (n) | | | 563,239 | 526,275 |
| Ballyrock CLO 2018-1A Ltd., “A2”, FLR, 5.842% (LIBOR - 3mo. + 1.6%), 4/20/2031 (n) | | | 1,748,737 | 1,685,820 |
| Ballyrock CLO 2018-1A Ltd., “B”, FLR, 6.142% (LIBOR - 3mo. + 1.9%), 4/20/2031 (n) | | | 741,069 | 698,080 |
| BBCMS Mortgage Trust, 2018-C2, “XA”, 0.757%, 12/15/2051 (i)(n) | | | 21,812,251 | 746,932 |
| BBCMS Mortgage Trust, 2021-C10, “XA”, 1.297%, 7/15/2054 (i) | | | 5,751,321 | 416,339 |
| BBCMS Mortgage Trust, 2021-C11, “XA”, 1.383%, 9/15/2054 (i) | | | 5,952,345 | 455,396 |
| BDS 2021-FL10 Ltd., “B”, FLR, 6.289% (LIBOR - 1mo. + 1.95%), 12/16/2036 (n) | | | 519,000 | 485,120 |
| BDS 2021-FL10 Ltd., “C”, FLR, 6.639% (LIBOR - 1mo. + 2.3%), 12/16/2036 (n) | | | 377,500 | 351,579 |
| Benchmark 2021-B23 Mortgage Trust, “XA”, 1.271%, 2/15/2054 (i) | | | 10,373,127 | 699,483 |
| Benchmark 2021-B27 Mortgage Trust, “XA”, 1.266%, 7/15/2054 (i) | | | 11,291,848 | 795,708 |
| Benchmark 2021-B28 Mortgage Trust, “XA”, 1.282%, 8/15/2054 (i) | | | 8,246,491 | 581,169 |
| Benchmark 2021-B29 Mortgage Trust, “XA”, 1.042%, 9/15/2054 (i) | | | 11,886,078 | 661,297 |
| BSPRT 2022-FL8 Issuer Ltd., “A”, FLR, 5.307% (SOFR - 30 day + 1.5%), 2/15/2037 (n) | | | 2,069,500 | 1,999,669 |
| BSPRT 2022-FL8 Issuer Ltd., “B”, FLR, 5.857% (SOFR - 30 day + 2.05%), 2/15/2037 (n) | | | 287,500 | 274,180 |
| BSPRT 2022-FL8 Issuer Ltd., “C”, FLR, 6.107% (SOFR - 30 day + 2.3%), 2/15/2037 (n) | | | 463,500 | 435,410 |
| Business Jet Securities LLC, 2020-1A, “A”, 2.981%, 11/15/2035 (n) | | | 183,882 | 167,487 |
| Business Jet Securities LLC, 2021-1A, “A”, 2.162%, 4/15/2036 (n) | | | 289,222 | 253,952 |
| Business Jet Securities LLC, 2021-1A, “B”, 2.918%, 4/15/2036 (n) | | | 74,594 | 63,222 |
| BXMT 2020-FL2 Ltd., “B”, FLR, 5.84% (LIBOR - 1mo. + 1.4%), 2/15/2038 (n) | | | 1,445,000 | 1,363,021 |
| Capital Automotive, 2020-1A, “A4”, REIT, 3.19%, 2/15/2050 (n) | | | 552,965 | 516,649 |
| CD 2017-CD4 Mortgage Trust, “XA”, 1.226%, 5/10/2050 (i) | | | 14,021,614 | 555,273 |
| CF Hippolyta Issuer LLC, 2020-1, “A1”, 1.69%, 7/15/2060 (n) | | | 339,267 | 302,827 |
| CF Hippolyta Issuer LLC, 2020-1, “B1”, 2.28%, 7/15/2060 (n) | | | 107,323 | 93,669 |
| Commercial Equipment Finance 2021-A, LLC, “A”, 2.05%, 2/16/2027 (n) | | | 448,754 | 432,162 |
| Commercial Mortgage Pass-Through Certificates, 2019-BN24, “XA”, 0.639%, 11/15/2062 (i) | | | 8,812,586 | 308,648 |
| Commercial Mortgage Pass-Through Certificates, 2021-BN31, “XA”, 1.325%, 2/15/2054 (i) | | | 9,113,465 | 684,558 |
| Commercial Mortgage Pass-Through Certificates, 2021-BN34, “XA”, 0.976%, 6/15/2063 (i) | | | 8,864,986 | 491,789 |
| Commercial Mortgage Pass-Through Certificates, 2021-BN35, “XA”, 1.046%, 6/15/2064 (i) | | | 4,932,345 | 293,636 |
| Credit Acceptance Auto Loan Trust, 2021-4, “B”, 1.74%, 12/16/2030 (n) | | | 478,000 | 438,912 |
| Credit Acceptance Auto Loan Trust, 2021-2A, “A”, 0.96%, 2/15/2030 (n) | | | 373,000 | 358,712 |
MFS Limited Maturity Portfolio
Portfolio of Investments – continued
| Issuer | | | Shares/Par | Value ($) |
| Bonds – continued |
| Asset-Backed & Securitized – continued |
| Credit Acceptance Auto Loan Trust, 2021-2A, “B”, 1.26%, 4/15/2030 (n) | | $ | 250,000 | $ 228,312 |
| Credit Acceptance Auto Loan Trust, 2021-3A, “B”, 1.38%, 7/15/2030 (n) | | | 250,000 | 229,371 |
| Credit Acceptance Auto Loan Trust, 2021-3A, “C”, 1.63%, 9/16/2030 (n) | | | 250,000 | 225,394 |
| Credit Acceptance Auto Loan Trust, 2021-4, “A”, 1.26%, 10/15/2030 (n) | | | 261,000 | 244,706 |
| Fortress CBO Investments Ltd., 2022-FL3, “A”, FLR, 5.76% (SOFR - 30 day + 1.85%), 2/23/2039 (n) | | | 1,241,500 | 1,214,137 |
| Fortress CBO Investments Ltd., 2022-FL3, “AS”, FLR, 6.16% (SOFR - 30 day + 2.25%), 2/23/2039 (n) | | | 1,154,000 | 1,104,409 |
| GLS Auto Receivables Trust, 2021-3A, “B”, 0.78%, 11/17/2025 (n) | | | 704,072 | 684,857 |
| GS Mortgage Securities Trust, 2017-GS6, “XA”, 1.012%, 5/10/2050 (i) | | | 15,254,437 | 542,329 |
| GS Mortgage Securities Trust, 2017-GS7, “XA”, 1.082%, 8/10/2050 (i) | | | 15,019,559 | 536,041 |
| GS Mortgage Securities Trust, 2020-GC47, “A5”, 1.129%, 5/12/2053 (i) | | | 8,339,877 | 520,415 |
| Jamestown CLO Ltd., 2020-15A, “C”, FLR, 6.529% (LIBOR - 3mo. + 2.45%), 4/15/2033 (n) | | | 1,998,469 | 1,874,178 |
| JPMorgan Chase Commercial Mortgage Securities Corp., 0.987%, 9/15/2050 (i) | | | 13,545,029 | 434,106 |
| LoanCore 2018-CRE1 Ltd., “AS”, FLR, 5.817% (LIBOR - 1mo. + 1.5%), 5/15/2028 (n) | | | 1,317,894 | 1,313,077 |
| LoanCore 2018-CRE1 Ltd., “C”, FLR, 6.867% (LIBOR - 1mo. + 2.55%), 5/15/2028 (n) | | | 741,500 | 711,893 |
| LoanCore 2019-CRE3 Ltd., “AS”, FLR, 5.687% (LIBOR - 1mo. + 1.37%), 4/15/2034 (n) | | | 1,807,643 | 1,799,602 |
| LoanCore 2021-CRE5 Ltd., “AS”, FLR, 6.067% (LIBOR - 1mo. + 1.75%), 7/15/2036 (n) | | | 1,344,000 | 1,263,353 |
| LoanCore 2021-CRE5 Ltd., “B”, FLR, 6.317% (LIBOR - 1mo. + 2%), 7/15/2036 (n) | | | 567,500 | 531,421 |
| Madison Park Funding Ltd., 2014-13A, “BR2”, FLR, 5.726% (LIBOR - 3mo. + 1.5%), 4/19/2030 (n) | | | 2,779,008 | 2,717,639 |
| MF1 2020-FL4 Ltd., “B”, FLR, 7.2% (LIBOR - 1mo. + 2.75%), 11/15/2035 (n) | | | 1,946,000 | 1,878,164 |
| MF1 2021-FL6 Ltd., “B”, FLR, 5.976% (LIBOR - 1mo. + 1.65%), 7/16/2036 (n) | | | 1,598,887 | 1,499,966 |
| MF1 2022-FL9 Ltd., “B”, FLR, 7.471% (SOFR - 1mo. + 3.15%), 6/19/2037 (n) | | | 1,885,500 | 1,855,741 |
| Morgan Stanley Bank of America Merrill Lynch Trust, 2017-C33, “XA”, 1.251%, 5/15/2050 (i) | | | 13,374,983 | 523,693 |
| Morgan Stanley Capital I Trust, 2017-H1, “XA”, 1.325%, 6/15/2050 (i) | | | 6,848,811 | 257,363 |
| Morgan Stanley Capital I Trust, 2018-H4, “XA”, 0.831%, 12/15/2051 (i) | | | 17,406,657 | 634,377 |
| Morgan Stanley Capital I Trust, 2021-L5, “XA”, 1.296%, 5/15/2054 (i) | | | 7,303,954 | 504,016 |
| Morgan Stanley Capital I Trust, 2021-L6, “XA”, 1.228%, 6/15/2054 (i) | | | 6,832,152 | 432,659 |
| Oaktree CLO 2019-1A Ltd., “BR”, FLR, 6.074% (LIBOR - 3mo. + 1.75%), 4/22/2030 (n) | | | 1,129,454 | 1,081,432 |
| Oaktree CLO 2019-1A Ltd., “CR”, FLR, 6.674% (LIBOR - 3mo. + 2.35%), 4/22/2030 (n) | | | 1,129,454 | 1,055,691 |
| OneMain Financial Issuance Trust, 2020-1A, “A”, 3.84%, 5/14/2032 (n) | | | 775,875 | 770,217 |
| OneMain Financial Issuance Trust, 2020-2A, “A”, 1.75%, 9/14/2035 (n) | | | 1,108,000 | 967,916 |
| OneMain Financial Issuance Trust, 2022-S1, “A”, 4.13%, 5/14/2035 (n) | | | 712,000 | 671,315 |
| PFP III 2021-8 Ltd., “B”, FLR, 5.826% (LIBOR - 1mo. + 1.5%), 8/09/2037 (n) | | | 490,500 | 441,969 |
| Securitized Term Auto Receivable Trust, 2019-CRTA, “B”, 2.453%, 3/25/2026 (n) | | | 58,371 | 57,974 |
| Securitized Term Auto Receivable Trust, 2019-CRTA, “C”, 2.849%, 3/25/2026 (n) | | | 74,841 | 74,376 |
| Shackleton 2013-4RA CLO Ltd., “B”, FLR, 5.84% (LIBOR - 3mo. + 1.9%), 4/13/2031 (n) | | | 927,055 | 854,126 |
| Shackleton 2015-8A CLO Ltd., “CR”, FLR, 5.892% (LIBOR - 3mo. + 1.65%), 10/20/2027 (n) | | | 709,957 | 689,539 |
| Shelter Growth CRE 2021-FL3 Ltd., “C”, FLR, 6.467% (LIBOR - 1mo. + 2.15%), 9/15/2036 (n) | | | 516,000 | 476,844 |
| Southwick Park CLO, Ltd., 2019-4A, “B1R”, FLR, 5.742% (LIBOR - 3mo. + 1.5%), 7/20/2032 (n) | | | 422,000 | 406,012 |
| Southwick Park CLO, Ltd., 2019-4A, “B2R”, 2.46%, 7/20/2032 (n) | | | 735,000 | 610,525 |
| Southwick Park CLO, Ltd., 2019-4A, “CR”, FLR, 6.192% (LIBOR - 3mo. + 1.95%), 7/20/2032 (n) | | | 1,001,000 | 940,518 |
| Starwood Commercial Mortgage, 2021-FL2, “B”, FLR, 6.126% (LIBOR - 1mo. + 1.8%), 4/18/2038 (n) | | | 764,000 | 714,990 |
| TICP CLO 2018-3R Ltd., “B”, FLR, 5.592% (LIBOR - 3mo. + 1.35%), 4/20/2028 (n) | | | 870,756 | 860,026 |
| TICP CLO 2018-3R Ltd., “C”, FLR, 6.042% (LIBOR - 3mo. + 1.8%), 4/20/2028 (n) | | | 1,528,084 | 1,502,971 |
| TPG Real Estate Finance, 2021-FL4, “B”, FLR, 6.176% (LIBOR - 1mo. + 1.85%), 3/15/2038 (n) | | | 2,000,000 | 1,851,968 |
| UBS Commercial Mortgage Trust, 2017-C1, “XA”, 1.013%, 11/15/2050 (i) | | | 9,271,530 | 330,612 |
| UBS Commercial Mortgage Trust, 2018-C14, “XA”, 0.91%, 12/15/2051 (i) | | | 7,842,420 | 322,359 |
| Wells Fargo Commercial Mortgage Trust, 2021-C61, “XA”, 1.369%, 11/15/2054 (i) | | | 4,005,055 | 300,154 |
| | | | | $67,827,094 |
| Automotive – 2.8% |
| Daimler Trucks Finance North America LLC, 1.625%, 12/13/2024 (n) | | $ | 1,487,000 | $ 1,379,994 |
| General Motors Financial Co., 1.7%, 8/18/2023 | | | 1,491,000 | 1,456,797 |
| Hyundai Capital America, 5.75%, 4/06/2023 (n) | | | 1,733,000 | 1,734,074 |
| Hyundai Capital America, 0.8%, 1/08/2024 (n) | | | 154,000 | 146,502 |
| Hyundai Capital America, 5.875%, 4/07/2025 (n) | | | 958,000 | 961,712 |
| Mercedes-Benz Finance North America LLC, 0.75%, 3/01/2024 (n) | | | 870,000 | 826,062 |
| Stellantis Finance US, Inc., 1.711%, 1/29/2027 (n) | | | 1,275,000 | 1,094,030 |
MFS Limited Maturity Portfolio
Portfolio of Investments – continued
| Issuer | | | Shares/Par | Value ($) |
| Bonds – continued |
| Automotive – continued |
| Volkswagen Group of America Finance LLC, 2.85%, 9/26/2024 (n) | | $ | 602,000 | $ 576,119 |
| Volkswagen Group of America Finance LLC, 3.35%, 5/13/2025 (n) | | | 650,000 | 620,756 |
| Volkswagen Group of America Finance LLC, 1.25%, 11/24/2025 (n) | | | 494,000 | 440,377 |
| | | | | $9,236,423 |
| Broadcasting – 0.8% |
| Warnermedia Holdings, Inc., 3.788%, 3/15/2025 (n) | | $ | 2,271,000 | $ 2,169,142 |
| Warnermedia Holdings, Inc., 3.755%, 3/15/2027 (n) | | | 679,000 | 611,460 |
| | | | | $2,780,602 |
| Brokerage & Asset Managers – 0.9% |
| Brookfield Finance, Inc., 3.9%, 1/25/2028 | | $ | 1,942,000 | $ 1,780,632 |
| National Securities Clearing Corp., 1.5%, 4/23/2025 (n) | | | 250,000 | 231,739 |
| National Securities Clearing Corp., 0.75%, 12/07/2025 (n) | | | 1,000,000 | 886,094 |
| | | | | $2,898,465 |
| Business Services – 1.0% |
| Equinix, Inc., 1.25%, 7/15/2025 | | $ | 607,000 | $ 548,858 |
| Global Payments, Inc., 1.2%, 3/01/2026 | | | 1,450,000 | 1,263,903 |
| Tencent Holdings Ltd., 1.81%, 1/26/2026 (n) | | | 1,481,000 | 1,335,225 |
| | | | | $3,147,986 |
| Cable TV – 0.7% |
| SES S.A., 3.6%, 4/04/2023 (n) | | $ | 2,469,000 | $ 2,446,788 |
| Chemicals – 0.1% |
| Westlake Chemical Corp., 0.875%, 8/15/2024 | | $ | 500,000 | $ 464,257 |
| Computer Software – 0.5% |
| Dell International LLC/EMC Corp., 4%, 7/15/2024 | | $ | 1,415,000 | $ 1,390,627 |
| Dell International LLC/EMC Corp., 5.85%, 7/15/2025 | | | 340,000 | 343,614 |
| | | | | $1,734,241 |
| Computer Software - Systems – 0.4% |
| VMware, Inc., 1%, 8/15/2024 | | $ | 839,000 | $ 780,687 |
| VMware, Inc., 1.4%, 8/15/2026 | | | 649,000 | 565,776 |
| | | | | $1,346,463 |
| Conglomerates – 0.7% |
| Carrier Global Corp., 2.242%, 2/15/2025 | | $ | 200,000 | $ 188,387 |
| Westinghouse Air Brake Technologies Corp., 4.4%, 3/15/2024 | | | 2,237,000 | 2,200,546 |
| | | | | $2,388,933 |
| Consumer Products – 0.3% |
| GSK Consumer Healthcare Capital UK PLC, 3.125%, 3/24/2025 | | $ | 591,000 | $ 562,038 |
| GSK Consumer Healthcare Capital UK PLC, 3.375%, 3/24/2027 | | | 345,000 | 321,179 |
| | | | | $883,217 |
| Containers – 0.5% |
| Berry Global, Inc., 1.57%, 1/15/2026 | | $ | 432,000 | $ 384,832 |
| Berry Global, Inc., 1.65%, 1/15/2027 | | | 1,534,000 | 1,311,986 |
| | | | | $1,696,818 |
MFS Limited Maturity Portfolio
Portfolio of Investments – continued
| Issuer | | | Shares/Par | Value ($) |
| Bonds – continued |
| Electronics – 0.9% |
| Microchip Technology, Inc., 0.983%, 9/01/2024 | | $ | 2,095,000 | $ 1,939,887 |
| Qorvo, Inc., 1.75%, 12/15/2024 (n) | | | 515,000 | 474,289 |
| Skyworks Solutions, Inc., 0.9%, 6/01/2023 | | | 590,000 | 578,329 |
| | | | | $2,992,505 |
| Emerging Market Quasi-Sovereign – 0.6% |
| DAE Funding LLC (United Arab Emirates), 1.55%, 8/01/2024 (n) | | $ | 619,000 | $ 575,243 |
| DAE Funding LLC (United Arab Emirates), 2.625%, 3/20/2025 (n) | | | 344,000 | 321,227 |
| Indian Oil Corp. Ltd., 5.75%, 8/01/2023 | | | 933,000 | 934,378 |
| | | | | $1,830,848 |
| Emerging Market Sovereign – 0.5% |
| Emirate of Abu Dhabi, 0.75%, 9/02/2023 (n) | | $ | 1,572,000 | $ 1,522,787 |
| Energy - Independent – 0.3% |
| EQT Corp., 5.678%, 10/01/2025 | | $ | 351,000 | $ 349,294 |
| EQT Corp., 5.7%, 4/01/2028 | | | 350,000 | 348,119 |
| Pioneer Natural Resources Co., 0.55%, 5/15/2023 | | | 204,000 | 200,641 |
| | | | | $898,054 |
| Energy - Integrated – 0.6% |
| Eni S.p.A., 4%, 9/12/2023 (n) | | $ | 1,857,000 | $ 1,831,027 |
| Financial Institutions – 3.0% |
| AerCap Ireland Capital DAC/AerCap Global Aviation Trust, 4.875%, 1/16/2024 | | $ | 1,585,000 | $ 1,569,879 |
| AerCap Ireland Capital DAC/AerCap Global Aviation Trust, 3.15%, 2/15/2024 | | | 1,399,000 | 1,352,354 |
| AerCap Ireland Capital DAC/AerCap Global Aviation Trust, 1.75%, 10/29/2024 | | | 798,000 | 733,805 |
| AerCap Ireland Capital DAC/AerCap Global Aviation Trust, 6.5%, 7/15/2025 | | | 1,212,000 | 1,228,093 |
| Air Lease Corp., 2.2%, 1/15/2027 | | | 1,101,000 | 959,475 |
| Avolon Holdings Funding Ltd., 3.95%, 7/01/2024 (n) | | | 1,214,000 | 1,162,163 |
| Avolon Holdings Funding Ltd., 2.125%, 2/21/2026 (n) | | | 1,574,000 | 1,354,704 |
| Avolon Holdings Funding Ltd., 4.25%, 4/15/2026 (n) | | | 506,000 | 458,715 |
| Avolon Holdings Funding Ltd., 2.528%, 11/18/2027 (n) | | | 886,000 | 708,175 |
| Avolon Holdings Funding Ltd., 2.75%, 2/21/2028 (n) | | | 678,000 | 544,253 |
| | | | | $10,071,616 |
| Food & Beverages – 1.4% |
| General Mills, Inc., 5.241%, 11/18/2025 | | $ | 834,000 | $ 836,077 |
| JBS USA Lux S.A./JBS USA Food Co./JBS USA Finance, Inc., 5.125%, 2/01/2028 (n) | | | 546,000 | 517,265 |
| JBS USA Lux S.A./JBS USA Food Co./JBS USA Finance, Inc., 3%, 2/02/2029 (n) | | | 1,669,000 | 1,381,339 |
| JDE Peet's N.V., 0.8%, 9/24/2024 (n) | | | 1,392,000 | 1,271,376 |
| JDE Peet's N.V., 1.375%, 1/15/2027 (n) | | | 678,000 | 572,273 |
| | | | | $4,578,330 |
| Food & Drug Stores – 0.9% |
| 7-Eleven, Inc., 0.625%, 2/10/2023 (n) | | $ | 1,785,000 | $ 1,775,850 |
| 7-Eleven, Inc., 0.8%, 2/10/2024 (n) | | | 1,339,000 | 1,274,220 |
| | | | | $3,050,070 |
| Forest & Paper Products – 0.3% |
| Fibria Overseas Finance Ltd., 5.5%, 1/17/2027 | | $ | 829,000 | $ 831,794 |
MFS Limited Maturity Portfolio
Portfolio of Investments – continued
| Issuer | | | Shares/Par | Value ($) |
| Bonds – continued |
| Gaming & Lodging – 1.5% |
| GLP Capital LP/GLP Financing II, Inc., 5.375%, 11/01/2023 | | $ | 1,459,000 | $ 1,453,930 |
| GLP Capital LP/GLP Financing II, Inc., 5.25%, 6/01/2025 | | | 1,084,000 | 1,065,588 |
| Hyatt Hotels Corp., 1.3%, 10/01/2023 | | | 1,224,000 | 1,189,795 |
| Hyatt Hotels Corp., 1.8%, 10/01/2024 | | | 1,134,000 | 1,062,570 |
| Marriott International, Inc., 3.75%, 10/01/2025 | | | 370,000 | 354,837 |
| | | | | $5,126,720 |
| Industrial – 0.1% |
| Howard University, Washington D.C., AGM, 2.416%, 10/01/2024 | | $ | 117,000 | $ 110,482 |
| Howard University, Washington D.C., AGM, 2.516%, 10/01/2025 | | | 144,000 | 134,492 |
| | | | | $244,974 |
| Insurance – 0.2% |
| Equitable Financial Life Insurance Co., 1.4%, 7/07/2025 (n) | | $ | 882,000 | $ 799,769 |
| Internet – 0.2% |
| Baidu, Inc., 3.875%, 9/29/2023 | | $ | 676,000 | $ 667,956 |
| Machinery & Tools – 0.5% |
| CNH Industrial Capital LLC, 4.2%, 1/15/2024 | | $ | 1,121,000 | $ 1,104,905 |
| CNH Industrial Capital LLC, 1.875%, 1/15/2026 | | | 448,000 | 406,244 |
| | | | | $1,511,149 |
| Major Banks – 16.0% |
| Bank of America Corp., 4.2%, 8/26/2024 | | $ | 692,000 | $ 681,294 |
| Bank of America Corp., 4.45%, 3/03/2026 | | | 995,000 | 974,967 |
| Bank of America Corp., 4.25%, 10/22/2026 | | | 575,000 | 555,421 |
| Bank of America Corp., 1.734% to 7/22/2026, FLR (SOFR - 1 day + 0.96%) to 7/22/2027 | | | 2,531,000 | 2,217,451 |
| Bank of America Corp., 4.183%, 11/25/2027 | | | 959,000 | 909,612 |
| Barclays PLC, 1.007% to 12/10/2023, FLR (CMT - 1yr. + 0.8%) to 12/10/2024 | | | 207,000 | 197,045 |
| Barclays PLC, 2.852% to 5/07/2025, FLR (LIBOR - 3mo. + 2.452%) to 5/07/2026 | | | 550,000 | 511,074 |
| Barclays PLC, 2.279% to 11/24/2026, FLR (CMT - 1yr. + 1.05%) to 11/24/2027 | | | 1,474,000 | 1,274,091 |
| BNP Paribas S.A., 2.591% to 1/20/2027, FLR (SOFR - 1 day + 1.228%) to 1/20/2028 (n) | | | 1,764,000 | 1,551,442 |
| Capital One Financial Corp., 2.636% to 3/03/2025, FLR (SOFR - 1 day + 1.29%) to 3/03/2026 | | | 1,545,000 | 1,447,119 |
| Deutsche Bank AG, 0.898%, 5/28/2024 | | | 421,000 | 393,653 |
| Deutsche Bank AG, 1.447% to 4/1/2024, FLR (SOFR - 1 day + 1.131%) to 4/01/2025 | | | 2,012,000 | 1,868,646 |
| Deutsche Bank AG, 2.311% to 11/16/2026, FLR (SOFR - 1 day + 1.219%) to 11/16/2027 | | | 464,000 | 393,417 |
| Goldman Sachs Group, Inc., 1.757% to 1/24/2024, FLR (SOFR - 1 day + 0.73%) to 1/24/2025 | | | 1,426,000 | 1,364,900 |
| Goldman Sachs Group, Inc., 3.5%, 4/01/2025 | | | 750,000 | 721,232 |
| Goldman Sachs Group, Inc., 1.093% to 12/09/2025, FLR (SOFR - 1 day + 0.789%) to 12/09/2026 | | | 821,000 | 723,733 |
| Goldman Sachs Group, Inc., 5.95%, 1/15/2027 | | | 1,439,000 | 1,476,850 |
| Goldman Sachs Group, Inc., 1.948% to 10/21/2026, FLR (SOFR - 1 day + 0.913%) to 10/21/2027 | | | 1,205,000 | 1,053,634 |
| HSBC Holdings PLC, 2.099% to 6/04/2025, FLR (SOFR - 1 day + 1.929%) to 6/04/2026 | | | 910,000 | 828,097 |
| HSBC Holdings PLC, 1.589% to 5/24/2026, FLR (SOFR - 1 day + 1.29%) to 5/24/2027 | | | 623,000 | 537,158 |
| HSBC Holdings PLC, 2.251% to 11/22/2026, FLR (SOFR - 1 day + 1.1%) to 11/22/2027 | | | 900,000 | 779,441 |
| JPMorgan Chase & Co., 3.797% to 7/23/2023, FLR (LIBOR - 3mo. + 0.89%) to 7/23/2024 | | | 1,380,000 | 1,366,288 |
| JPMorgan Chase & Co., 2.005% to 3/13/2025, FLR (SOFR - 1 day + 1.585%) to 3/13/2026 | | | 1,642,000 | 1,519,763 |
| JPMorgan Chase & Co., 1.04% to 2/04/2026, FLR (SOFR - 1 day + 0.695%) to 2/04/2027 | | | 1,071,000 | 931,629 |
| JPMorgan Chase & Co., 1.578% to 4/22/2026, FLR (SOFR - 1 day + 0.885%) to 4/22/2027 | | | 862,000 | 757,407 |
| JPMorgan Chase & Co., 4.25%, 10/01/2027 | | | 959,000 | 924,001 |
| Lloyds Banking Group PLC, 3.511% to 3/18/2025, FLR (CMT - 1yr. + 1.6%) to 3/18/2026 | | | 450,000 | 427,515 |
| Mitsubishi UFJ Financial Group, Inc., 0.953% to 7/19/2024, FLR (CMT - 1yr. + 0.55%) to 7/19/2025 | | | 1,003,000 | 931,954 |
| Mitsubishi UFJ Financial Group, Inc., 0.962% to 10/11/2024, FLR (CMT - 1yr. + 0.45%) to 10/11/2025 | | | 437,000 | 401,801 |
| Mizuho Financial Group, 0.849% to 9/08/2023, FLR (LIBOR - 3mo. + 0.61%) to 9/08/2024 | | | 600,000 | 579,053 |
| Morgan Stanley, 4.598% to 11/10/2022, FLR (SOFR - 1 day + 0.466%) to 11/10/2023 | | | 1,637,000 | 1,632,196 |
| Morgan Stanley, 0.529% to 1/25/2023, FLR (SOFR - 1 day + 0.455%) to 1/25/2024 | | | 2,151,000 | 2,136,572 |
MFS Limited Maturity Portfolio
Portfolio of Investments – continued
| Issuer | | | Shares/Par | Value ($) |
| Bonds – continued |
| Major Banks – continued |
| Morgan Stanley, 0.864% to 10/21/2024, FLR (SOFR - 1 day + 0.745%) to 10/21/2025 | | $ | 1,635,000 | $ 1,500,071 |
| Morgan Stanley, 4.35%, 9/08/2026 | | | 1,350,000 | 1,309,827 |
| Morgan Stanley, 3.625%, 1/20/2027 | | | 381,000 | 359,289 |
| Morgan Stanley, 3.95%, 4/23/2027 | | | 135,000 | 127,493 |
| Morgan Stanley, 1.512% to 7/20/2026, FLR (SOFR - 1 day + 0.858%) to 7/20/2027 | | | 411,000 | 356,661 |
| Nationwide Building Society, 2.972% to 2/16/2027, FLR (SOFR - 1 day + 1.29%) to 2/16/2028 (n) | | | 750,000 | 659,247 |
| NatWest Group PLC, 2.359% to 5/22/2023, FLR (CMT - 1yr. + 2.15%) to 5/22/2024 | | | 1,038,000 | 1,023,134 |
| NatWest Group PLC, 4.269% to 3/22/2024, FLR (LIBOR - 3mo. + 1.762%) to 3/22/2025 | | | 2,018,000 | 1,973,359 |
| PNC Bank N.A., 2.5%, 8/27/2024 | | | 1,183,000 | 1,134,280 |
| PNC Financial Services Group, Inc., 5.354% to 9/22/2026, FLR (SOFR - 1 day + 0.765%) to 12/02/2028 | | | 1,717,000 | 1,730,513 |
| Standard Chartered PLC, 0.991% to 1/12/2024, FLR (CMT - 1yr. + 0.78%) to 1/12/2025 (n) | | | 907,000 | 855,889 |
| Standard Chartered PLC, 1.214% to 3/23/2024, FLR (CMT - 1yr. + 0.88%) to 3/23/2025 (n) | | | 437,000 | 411,342 |
| Standard Chartered PLC, 1.822% to 11/23/2024, FLR (CMT - 1yr. + 0.95%) to 11/23/2025 (n) | | | 444,000 | 405,525 |
| Sumitomo Mitsui Financial Group, Inc., 0.508%, 1/12/2024 | | | 455,000 | 433,151 |
| Sumitomo Mitsui Financial Group, Inc., 1.474%, 7/08/2025 | | | 1,613,000 | 1,469,713 |
| Sumitomo Mitsui Financial Group, Inc., 2.174%, 1/14/2027 | | | 1,184,000 | 1,049,548 |
| Sumitomo Mitsui Trust Bank Ltd., 0.85%, 3/25/2024 (n) | | | 944,000 | 892,840 |
| Toronto-Dominion Bank, 0.25%, 1/06/2023 | | | 910,000 | 909,586 |
| UBS Group AG, 1.008% to 7/30/2023, FLR (CMT - 1yr. + 0.83%) to 7/30/2024 (n) | | | 924,000 | 898,448 |
| UBS Group AG, 4.703% to 8/05/2026, FLR (CMT - 1yr. + 2.05%) to 8/05/2027 (n) | | | 374,000 | 361,466 |
| UniCredit S.p.A., 2.569% to 9/22/2025, FLR (CMT - 1yr. + 2.3%) to 9/22/2026 (n) | | | 421,000 | 372,806 |
| Wells Fargo & Co., 2.164% to 2/11/2025, FLR (LIBOR - 3mo. + 0.75%) to 2/11/2026 | | | 2,242,000 | 2,090,066 |
| Wells Fargo & Co., 3.526% to 3/24/2027, FLR (SOFR - 1 day + 1.51%) to 3/24/2028 | | | 734,000 | 679,685 |
| | | | | $53,072,395 |
| Medical & Health Technology & Services – 1.0% |
| HCA Healthcare, Inc., 3.125%, 3/15/2027 (n) | | $ | 411,000 | $ 373,672 |
| HCA, Inc., 5%, 3/15/2024 | | | 1,692,000 | 1,682,279 |
| Thermo Fisher Scientific, Inc., 1.215%, 10/18/2024 | | | 1,500,000 | 1,407,765 |
| | | | | $3,463,716 |
| Metals & Mining – 1.2% |
| Anglo American Capital PLC, 4.75%, 4/10/2027 (n) | | $ | 766,000 | $ 740,332 |
| Glencore Funding LLC, 4.125%, 3/12/2024 (n) | | | 1,354,000 | 1,332,289 |
| Glencore Funding LLC, 1.625%, 9/01/2025 (n) | | | 1,100,000 | 995,598 |
| Glencore Funding LLC, 1.625%, 4/27/2026 (n) | | | 1,191,000 | 1,049,381 |
| | | | | $4,117,600 |
| Midstream – 1.8% |
| Enbridge, Inc., 2.5%, 2/14/2025 | | $ | 496,000 | $ 467,916 |
| Energy Transfer LP, 2.9%, 5/15/2025 | | | 635,000 | 598,008 |
| Energy Transfer LP, 5.55%, 2/15/2028 | | | 436,000 | 432,482 |
| Gray Oak Pipeline LLC, 2%, 9/15/2023 (n) | | | 968,000 | 941,641 |
| Plains All American Pipeline LP, 3.85%, 10/15/2023 | | | 750,000 | 739,454 |
| Plains All American Pipeline LP/PAA Finance Corp., 4.65%, 10/15/2025 | | | 992,000 | 970,695 |
| Western Midstream Operating LP, 3.35%, 2/01/2025 | | | 796,000 | 753,191 |
| Western Midstream Operating LP, FLR, 5.04% (LIBOR - 3mo. + 0.85%), 1/13/2023 | | | 1,222,000 | 1,220,167 |
| | | | | $6,123,554 |
| Mortgage-Backed – 1.0% | |
| Fannie Mae, 5%, 7/01/2039 - 3/01/2042 | | $ | 440,151 | $ 445,710 |
| Fannie Mae, 2%, 5/25/2044 | | | 222,346 | 213,722 |
| Freddie Mac, 0.903%, 4/25/2024 (i) | | | 411,778 | 3,856 |
| Freddie Mac, 1.582%, 4/25/2030 (i) | | | 6,124,257 | 528,743 |
| Freddie Mac, 3%, 4/15/2033 - 6/15/2045 | | | 2,132,240 | 1,974,369 |
MFS Limited Maturity Portfolio
Portfolio of Investments – continued
| Issuer | | | Shares/Par | Value ($) |
| Bonds – continued |
| Mortgage-Backed – continued | |
| Freddie Mac, 2%, 7/15/2042 | | $ | 320,136 | $ 289,608 |
| | | | | $3,456,008 |
| Municipals – 2.8% |
| California Earthquake Authority Rev., Taxable, “B”, 1.477%, 7/01/2023 | | $ | 440,000 | $ 432,575 |
| California Municipal Finance Authority Rev., Taxable (Century Housing Corp.), 1.605%, 11/01/2023 | | | 280,000 | 271,487 |
| Illinois Sales Tax Securitization Corp., Second Lien, Taxable, “B”, BAM, 2.128%, 1/01/2023 | | | 300,000 | 300,000 |
| Illinois Sales Tax Securitization Corp., Second Lien, Taxable, “B”, BAM, 2.225%, 1/01/2024 | | | 730,000 | 710,221 |
| Long Island, NY, Power Authority, Electric System General Rev., Taxable, “C”, 0.764%, 3/01/2023 | | | 595,000 | 591,156 |
| Massachusetts Educational Financing Authority, Education Loan Rev., Taxable, “A”, 1.904%, 7/01/2023 | | | 65,000 | 64,073 |
| Massachusetts Educational Financing Authority, Education Loan Rev., Taxable, “A”, 2.156%, 7/01/2024 | | | 190,000 | 182,077 |
| Massachusetts Educational Financing Authority, Education Loan Rev., Taxable, “A”, 2.306%, 7/01/2025 | | | 150,000 | 139,975 |
| Massachusetts Educational Financing Authority, Education Loan Rev., Taxable, “A”, 2.562%, 7/01/2026 | | | 185,000 | 169,347 |
| Michigan Finance Authority Tobacco Settlement Asset-Backed Rev., Taxable (2006 Sold Tobacco Receipts), “A-1”, 2.326%, 6/01/2030 | | | 398,229 | 359,674 |
| New Jersey Economic Development Authority State Pension Funding Rev., Capital Appreciation, Taxable, “B”, AGM, 0%, 2/15/2023 | | | 4,091,000 | 4,068,644 |
| New Jersey Transportation Trust Fund Authority, Transportation System, Taxable, “B”, 2.551%, 6/15/2023 | | | 465,000 | 459,833 |
| New Jersey Transportation Trust Fund Authority, Transportation System, Taxable, “B”, 2.631%, 6/15/2024 | | | 440,000 | 423,361 |
| Port Authority of NY & NJ, Taxable, “AAA”, 1.086%, 7/01/2023 | | | 1,060,000 | 1,041,175 |
| | | | | $9,213,598 |
| Natural Gas - Distribution – 0.7% |
| Atmos Energy Corp., 0.625%, 3/09/2023 | | $ | 1,055,000 | $ 1,047,239 |
| CenterPoint Energy Resources Corp., 0.7%, 3/02/2023 | | | 1,302,000 | 1,292,608 |
| | | | | $2,339,847 |
| Natural Gas - Pipeline – 0.6% |
| APA Infrastructure Ltd., 4.2%, 3/23/2025 (n) | | $ | 1,960,000 | $ 1,892,523 |
| Network & Telecom – 0.8% |
| AT&T, Inc., 0.9%, 3/25/2024 | | $ | 2,621,000 | $ 2,488,953 |
| Oils – 0.4% |
| Valero Energy Corp., 1.2%, 3/15/2024 | | $ | 1,330,000 | $ 1,263,297 |
| Other Banks & Diversified Financials – 2.1% |
| American Express Co., 2.25%, 3/04/2025 | | $ | 773,000 | $ 729,613 |
| Banque Federative du Credit Mutuel S.A., 0.65%, 2/27/2024 (n) | | | 1,833,000 | 1,735,292 |
| Groupe BPCE S.A., 4%, 9/12/2023 (n) | | | 1,385,000 | 1,367,134 |
| Groupe BPCE S.A., FLR, 5.975% (LIBOR - 3mo. + 1.24%), 9/12/2023 (n) | | | 1,385,000 | 1,387,067 |
| Macquarie Group Ltd., 1.201% to 10/14/2024, FLR (SOFR - 1 day + 0.694%) to 10/14/2025 (n) | | | 654,000 | 600,170 |
| Macquarie Group Ltd., 1.34% to 1/12/2026, FLR (SOFR - 1 day + 1.069%) to 1/12/2027 (n) | | | 1,200,000 | 1,045,865 |
| National Bank of Canada, 0.55% to 11/15/2023, FLR (CMT - 1yr. + 0.4%) to 11/15/2024 | | | 250,000 | 239,276 |
| | | | | $7,104,417 |
| Pharmaceuticals – 0.4% |
| Royalty Pharma PLC, 0.75%, 9/02/2023 | | $ | 1,481,000 | $ 1,434,771 |
| Railroad & Shipping – 0.5% |
| Canadian Pacific Railway Co., 1.35%, 12/02/2024 | | $ | 1,588,000 | $ 1,480,177 |
| Real Estate - Office – 0.3% |
| Corporate Office Property LP, REIT, 2.25%, 3/15/2026 | | $ | 1,092,000 | $ 957,381 |
MFS Limited Maturity Portfolio
Portfolio of Investments – continued
| Issuer | | | Shares/Par | Value ($) |
| Bonds – continued |
| Retailers – 1.0% |
| Alibaba Group Holding Ltd., 2.8%, 6/06/2023 | | $ | 1,223,000 | $ 1,208,989 |
| Kohl's Corp., 9.5%, 5/15/2025 | | | 1,587,000 | 1,673,095 |
| Nordstrom, Inc., 2.3%, 4/08/2024 | | | 519,000 | 485,369 |
| | | | | $3,367,453 |
| Specialty Stores – 0.7% |
| Genuine Parts Co., 1.75%, 2/01/2025 | | $ | 792,000 | $ 739,471 |
| Ross Stores, Inc., 0.875%, 4/15/2026 | | | 1,622,000 | 1,423,469 |
| | | | | $2,162,940 |
| Telecommunications - Wireless – 1.2% |
| Crown Castle, Inc., REIT, 3.15%, 7/15/2023 | | $ | 1,037,000 | $ 1,025,397 |
| Crown Castle, Inc., REIT, 1.35%, 7/15/2025 | | | 257,000 | 233,795 |
| Crown Castle, Inc., REIT, 2.9%, 3/15/2027 | | | 206,000 | 187,368 |
| Rogers Communications, Inc., 3.2%, 3/15/2027 (n) | | | 683,000 | 631,957 |
| T-Mobile USA, Inc., 3.5%, 4/15/2025 | | | 1,901,000 | 1,828,202 |
| | | | | $3,906,719 |
| Tobacco – 0.8% |
| B.A.T. Capital Corp., 3.222%, 8/15/2024 | | $ | 1,047,000 | $ 1,008,143 |
| Imperial Brands Finance PLC, 6.125%, 7/27/2027 (n) | | | 305,000 | 303,525 |
| Philip Morris International, Inc., 5.125%, 11/15/2024 | | | 800,000 | 801,058 |
| Philip Morris International, Inc., 5%, 11/17/2025 | | | 364,000 | 365,635 |
| Philip Morris International, Inc., 5.125%, 11/17/2027 | | | 324,000 | 326,366 |
| | | | | $2,804,727 |
| Transportation - Services – 1.4% |
| Element Fleet Management Corp., 1.6%, 4/06/2024 (n) | | $ | 2,849,000 | $ 2,698,909 |
| ERAC USA Finance LLC, 2.7%, 11/01/2023 (n) | | | 872,000 | 853,819 |
| ERAC USA Finance LLC, 3.85%, 11/15/2024 (n) | | | 551,000 | 532,378 |
| ERAC USA Finance LLC, 3.8%, 11/01/2025 (n) | | | 551,000 | 526,874 |
| | | | | $4,611,980 |
| U.S. Treasury Obligations – 17.4% |
| U.S. Treasury Notes, 0.125%, 12/15/2023 (f) | | $ | 24,482,000 | $ 23,452,035 |
| U.S. Treasury Notes, 0.75%, 11/15/2024 | | | 11,578,000 | 10,806,435 |
| U.S. Treasury Notes, 2.75%, 5/15/2025 | | | 7,016,000 | 6,765,507 |
| U.S. Treasury Notes, 2.25%, 11/15/2025 | | | 17,716,000 | 16,767,917 |
| | | | | $57,791,894 |
| Utilities - Electric Power – 4.8% |
| Edison International, 4.7%, 8/15/2025 | | $ | 750,000 | $ 733,841 |
| Emera US Finance LP, 0.833%, 6/15/2024 | | | 589,000 | 549,638 |
| Enel Finance International N.V., 6.8%, 10/14/2025 (n) | | | 630,000 | 646,902 |
| ENGIE Energía Chile S.A., 4.5%, 1/29/2025 (n) | | | 2,071,000 | 2,029,580 |
| Entergy Louisiana LLC, 0.95%, 10/01/2024 | | | 2,993,000 | 2,786,007 |
| FirstEnergy Corp., 2.05%, 3/01/2025 | | | 929,000 | 857,657 |
| FirstEnergy Corp., 1.6%, 1/15/2026 | | | 513,000 | 452,722 |
| NextEra Energy Capital Holdings, Inc., 0.65%, 3/01/2023 | | | 1,049,000 | 1,041,817 |
| Pacific Gas & Electric Co., 1.7%, 11/15/2023 | | | 443,000 | 428,744 |
| Pacific Gas & Electric Co., 3.25%, 2/16/2024 | | | 1,338,000 | 1,305,958 |
| Pacific Gas & Electric Co., 4.95%, 6/08/2025 | | | 550,000 | 541,510 |
| Southern California Edison Co., 0.7%, 8/01/2023 | | | 900,000 | 876,730 |
| Southern California Edison Co., 0.975%, 8/01/2024 | | | 667,000 | 623,725 |
| Vistra Operations Co. LLC, 4.875%, 5/13/2024 (n) | | | 952,000 | 932,817 |
MFS Limited Maturity Portfolio
Portfolio of Investments – continued
| Issuer | | | Shares/Par | Value ($) |
| Bonds – continued |
| Utilities - Electric Power – continued |
| WEC Energy Group, Inc., 0.8%, 3/15/2024 | | $ | 612,000 | $ 579,802 |
| Xcel Energy, Inc., 0.5%, 10/15/2023 | | | 1,753,000 | 1,689,379 |
| | | | | $16,076,829 |
| Total Bonds (Identified Cost, $341,625,631) | | $325,357,825 |
| Investment Companies (h) – 1.4% |
| Money Market Funds – 1.4% | |
| MFS Institutional Money Market Portfolio, 4.02% (v) (Identified Cost, $4,749,451) | | | 4,749,783 | $ 4,751,208 |
| Other Assets, Less Liabilities – 0.6% | | 1,880,822 |
| Net Assets – 100.0% | $331,989,855 |
| (f) | All or a portion of the security has been segregated as collateral for open futures contracts and cleared swap agreements. | | | |
| (h) | An affiliated issuer, which may be considered one in which the fund owns 5% or more of the outstanding voting securities, or a company which is under common control. At period end, the aggregate values of the fund's investments in affiliated issuers and in unaffiliated issuers were $4,751,208 and $325,357,825, respectively. | | | |
| (i) | Interest only security for which the fund receives interest on notional principal (Par amount). Par amount shown is the notional principal and does not reflect the cost of the security. | | | |
| (n) | Securities exempt from registration under Rule 144A of the Securities Act of 1933. These securities may be sold in the ordinary course of business in transactions exempt from registration, normally to qualified institutional buyers. At period end, the aggregate value of these securities was $116,170,012, representing 35.0% of net assets. | | | |
| (v) | Affiliated issuer that is available only to investment companies managed by MFS. The rate quoted for the MFS Institutional Money Market Portfolio is the annualized seven-day yield of the fund at period end. | | | |
| The following abbreviations are used in this report and are defined: |
| AGM | Assured Guaranty Municipal |
| BAM | Build America Mutual |
| CLO | Collateralized Loan Obligation |
| CMT | Constant Maturity Treasury |
| FLR | Floating Rate. Interest rate resets periodically based on the parenthetically disclosed reference rate plus a spread (if any). The period-end rate reported may not be the current rate. All reference rates are USD unless otherwise noted. |
| LIBOR | London Interbank Offered Rate |
| REIT | Real Estate Investment Trust |
| SOFR | Secured Overnight Financing Rate |
| Derivative Contracts at 12/31/22 |
| Futures Contracts |
| Description | Long/
Short | Currency | Contracts | Notional
Amount | Expiration
Date | Value/Unrealized
Appreciation
(Depreciation) |
| Asset Derivatives |
| Interest Rate Futures | | |
| U.S. Treasury Note 2 yr | Long | USD | 61 | $12,509,766 | March – 2023 | $9,032 |
| Cleared Swap Agreements |
Maturity
Date | Notional
Amount | Counterparty | Cash Flows
to Receive/
Frequency | Cash Flows
to Pay/
Frequency | Unrealized
Appreciation
(Depreciation) | | Net Unamortized
Upfront Payments
(Receipts) | | Value |
| Asset Derivatives | | | | | |
| Interest Rate Swaps | | | | | |
| 10/17/25 | USD | 8,400,000 | centrally cleared | 4.2% / Annually | SOFR - 1 day / Annually | $22,737 | | $— | | $22,737 |
MFS Limited Maturity Portfolio
Portfolio of Investments – continued
Maturity
Date | Notional
Amount | Counterparty | Cash Flows
to Receive/
Frequency | Cash Flows
to Pay/
Frequency | Unrealized
Appreciation
(Depreciation) | | Net Unamortized
Upfront Payments
(Receipts) | | Value |
| Liability Derivatives | | | | | |
| Interest Rate Swaps | | | | | |
| 12/06/25 | USD | 28,500,000 | centrally cleared | 3.82% / Annually | SOFR - 1 day / Annually | $(230,344) | | $4,207 | | $(226,137) |
| Credit Default Swaps | | | | | |
| 12/20/27 | USD | 33,200,000 | centrally cleared | (1) | 1% / Quarterly | $(117,207) | | $(158,467) | | $(275,674) |
| | | | | | | $(347,551) | | $(154,260) | | $(501,811) |
(1) Fund, as protection buyer, to receive notional amount upon a defined credit event by a reference obligation specified in the Markit CDX North America High Yield Series 39 Index.
At December 31, 2022, the fund had liquid securities with an aggregate value of $1,397,619 to cover any collateral or margin obligations for certain derivative contracts.
See Notes to Financial Statements
MFS Limited Maturity Portfolio
| Financial Statements | Statement of Assets and Liabilities |
This statement represents your fund’s balance sheet, which details the assets and liabilities comprising the total value of the fund.
| At 12/31/22Assets | |
| Investments in unaffiliated issuers, at value (identified cost, $341,625,631) | $325,357,825 |
| Investments in affiliated issuers, at value (identified cost, $4,749,451) | 4,751,208 |
| Cash | 8,080 |
| Receivables for | |
| Fund shares sold | 1,305 |
| Interest | 2,199,261 |
| Other assets | 2,285 |
| Total assets | $332,319,964 |
| Liabilities | |
| Payables for | |
| Net daily variation margin on open cleared swap agreements | $47,625 |
| Net daily variation margin on open futures contracts | 9,509 |
| Fund shares reacquired | 149,653 |
| Payable to affiliates | |
| Investment adviser | 10,582 |
| Administrative services fee | 464 |
| Shareholder servicing costs | 21 |
| Distribution and/or service fees | 1,769 |
| Accrued expenses and other liabilities | 110,486 |
| Total liabilities | $330,109 |
| Net assets | $331,989,855 |
| Net assets consist of | |
| Paid-in capital | $348,348,403 |
| Total distributable earnings (loss) | (16,358,548) |
| Net assets | $331,989,855 |
| Shares of beneficial interest outstanding | 34,803,493 |
| | Net assets | Shares
outstanding | Net asset value
per share |
| Initial Class | $246,102,110 | 25,801,206 | $9.54 |
| Service Class | 85,887,745 | 9,002,287 | 9.54 |
See Notes to Financial Statements
MFS Limited Maturity Portfolio
| Financial Statements | Statement of Operations |
This statement describes how much your fund earned in investment income and accrued in expenses. It also describes any gains and/or losses generated by fund operations.
| Year ended 12/31/22 | |
| Net investment income (loss) | |
| Income | |
| Interest | $6,151,516 |
| Dividends from affiliated issuers | 113,432 |
| Other | 98,247 |
| Total investment income | $6,363,195 |
| Expenses | |
| Management fee | $1,471,973 |
| Distribution and/or service fees | 236,101 |
| Shareholder servicing costs | 5,331 |
| Administrative services fee | 66,311 |
| Independent Trustees' compensation | 7,220 |
| Custodian fee | 25,955 |
| Shareholder communications | 5,839 |
| Audit and tax fees | 71,979 |
| Legal fees | 1,647 |
| Miscellaneous | 41,257 |
| Total expenses | $1,933,613 |
| Reduction of expenses by investment adviser | (51,156) |
| Net expenses | $1,882,457 |
| Net investment income (loss) | $4,480,738 |
| Realized and unrealized gain (loss) | |
| Realized gain (loss) (identified cost basis) | |
| Unaffiliated issuers | $(2,466,318) |
| Affiliated issuers | 675 |
| Futures contracts | (1,022,632) |
| Swap agreements | (734,126) |
| Net realized gain (loss) | $(4,222,401) |
| Change in unrealized appreciation or depreciation | |
| Unaffiliated issuers | $(17,531,039) |
| Affiliated issuers | 1,757 |
| Futures contracts | 16,530 |
| Swap agreements | (324,814) |
| Net unrealized gain (loss) | $(17,837,566) |
| Net realized and unrealized gain (loss) | $(22,059,967) |
| Change in net assets from operations | $(17,579,229) |
See Notes to Financial Statements
MFS Limited Maturity Portfolio
| Financial Statements | Statements of Changes in Net Assets |
These statements describe the increases and/or decreases in net assets resulting from operations, any distributions, and any shareholder transactions.
| | Year ended |
| | 12/31/22 | 12/31/21 |
| Change in net assets | | |
| From operations | | |
| Net investment income (loss) | $4,480,738 | $6,078,008 |
| Net realized gain (loss) | (4,222,401) | 2,567,548 |
| Net unrealized gain (loss) | (17,837,566) | (8,459,336) |
| Change in net assets from operations | $(17,579,229) | $186,220 |
| Total distributions to shareholders | $(8,206,419) | $(10,447,490) |
| Change in net assets from fund share transactions | $(67,494,849) | $(3,392,860) |
| Total change in net assets | $(93,280,497) | $(13,654,130) |
| Net assets | | |
| At beginning of period | 425,270,352 | 438,924,482 |
| At end of period | $331,989,855 | $425,270,352 |
See Notes to Financial Statements
MFS Limited Maturity Portfolio
| Financial Statements | Financial Highlights |
The financial highlights table is intended to help you understand the fund's financial performance for the past 5 years. Certain information reflects financial results for a single fund share. The total returns in the table represent the rate that an investor would have earned (or lost) on an investment in the fund share class (assuming reinvestment of all distributions) held for the entire period.
| Initial Class | Year ended |
| | 12/31/22 | 12/31/21 | 12/31/20 | 12/31/19 | 12/31/18 |
| Net asset value, beginning of period | $10.21 | $10.45 | $10.34 | $10.10 | $10.18 |
| Income (loss) from investment operations | | | | | |
| Net investment income (loss) (d) | $0.13 | $0.15 | $0.23 | $0.29 | $0.23 |
| Net realized and unrealized gain (loss) | (0.56) | (0.13) | 0.21 | 0.23 | (0.10) |
| Total from investment operations | $(0.43) | $0.02 | $0.44 | $0.52 | $0.13 |
| Less distributions declared to shareholders | | | | | |
| From net investment income | $(0.20) | $(0.24) | $(0.33) | $(0.28) | $(0.21) |
| From net realized gain | (0.04) | (0.02) | — | — | — |
| Total distributions declared to shareholders | $(0.24) | $(0.26) | $(0.33) | $(0.28) | $(0.21) |
| Net asset value, end of period (x) | $9.54 | $10.21 | $10.45 | $10.34 | $10.10 |
| Total return (%) (k)(r)(s)(x) | (4.24) | 0.16 | 4.34 | 5.19 | 1.28 |
Ratios (%) (to average net assets)
and Supplemental data: | | | | | |
| Expenses before expense reductions | 0.46 | 0.46 | 0.46 | 0.45 | 0.45 |
| Expenses after expense reductions | 0.45 | 0.44 | 0.45 | 0.44 | 0.44 |
| Net investment income (loss) | 1.28 | 1.45 | 2.18 | 2.81 | 2.31 |
| Portfolio turnover | 25 | 50 | 51 | 39 | 62 |
| Net assets at end of period (000 omitted) | $246,102 | $318,803 | $326,075 | $343,507 | $359,909 |
| Service Class | Year ended |
| | 12/31/22 | 12/31/21 | 12/31/20 | 12/31/19 | 12/31/18 |
| Net asset value, beginning of period | $10.20 | $10.45 | $10.33 | $10.09 | $10.17 |
| Income (loss) from investment operations | | | | | |
| Net investment income (loss) (d) | $0.10 | $0.13 | $0.20 | $0.26 | $0.21 |
| Net realized and unrealized gain (loss) | (0.55) | (0.15) | 0.23 | 0.23 | (0.11) |
| Total from investment operations | $(0.45) | $(0.02) | $0.43 | $0.49 | $0.10 |
| Less distributions declared to shareholders | | | | | |
| From net investment income | $(0.17) | $(0.21) | $(0.31) | $(0.25) | $(0.18) |
| From net realized gain | (0.04) | (0.02) | — | — | — |
| Total distributions declared to shareholders | $(0.21) | $(0.23) | $(0.31) | $(0.25) | $(0.18) |
| Net asset value, end of period (x) | $9.54 | $10.20 | $10.45 | $10.33 | $10.09 |
| Total return (%) (k)(r)(s)(x) | (4.44) | (0.19) | 4.15 | 4.90 | 0.99 |
Ratios (%) (to average net assets)
and Supplemental data: | | | | | |
| Expenses before expense reductions | 0.71 | 0.71 | 0.71 | 0.70 | 0.70 |
| Expenses after expense reductions | 0.70 | 0.69 | 0.70 | 0.69 | 0.69 |
| Net investment income (loss) | 1.04 | 1.20 | 1.93 | 2.56 | 2.06 |
| Portfolio turnover | 25 | 50 | 51 | 39 | 62 |
| Net assets at end of period (000 omitted) | $85,888 | $106,468 | $112,850 | $117,362 | $117,798 |
See Notes to Financial Statements
MFS Limited Maturity Portfolio
Financial Highlights - continued
| (d) | Per share data is based on average shares outstanding. |
| (k) | The total return does not reflect expenses that apply to separate accounts. Inclusion of these charges would reduce the total return figures for all periods shown. |
| (r) | Certain expenses have been reduced without which performance would have been lower. |
| (s) | From time to time the fund may receive proceeds from litigation settlements, without which performance would be lower. |
| (x) | The net asset values and total returns have been calculated on net assets which include adjustments made in accordance with U.S. generally accepted accounting principles required at period end for financial reporting purposes. |
See Notes to Financial Statements
MFS Limited Maturity Portfolio
Notes to Financial Statements
(1) Business and Organization
MFS Limited Maturity Portfolio (the fund) is a diversified series of MFS Variable Insurance Trust III (the trust). The trust is organized as a Delaware statutory trust and is registered under the Investment Company Act of 1940, as amended, as an open-end management investment company. The shareholders of each series of the trust are separate accounts of insurance companies, which offer variable annuity and/or life insurance products, and qualified retirement and pension plans.
The fund is an investment company and accordingly follows the investment company accounting and reporting guidance of the Financial Accounting Standards Board (FASB) Accounting Standards Codification Topic 946 Financial Services - Investment Companies.
(2) Significant Accounting Policies
General — The preparation of financial statements in conformity with U.S. generally accepted accounting principles requires management to make estimates and assumptions that affect the reported amounts of assets and liabilities, and disclosure of contingent assets and liabilities at the date of the financial statements and the reported amounts of increases and decreases in net assets from operations during the reporting period. Actual results could differ from those estimates. In the preparation of these financial statements, management has evaluated subsequent events occurring after the date of the fund’s Statement of Assets and Liabilities through the date that the financial statements were issued. The fund invests in foreign securities. Investments in foreign securities are vulnerable to the effects of changes in the relative values of the local currency and the U.S. dollar and to the effects of changes in each country’s market, economic, industrial, political, regulatory, geopolitical, environmental, public health, and other conditions.
Balance Sheet Offsetting — The fund's accounting policy with respect to balance sheet offsetting is that, absent an event of default by the counterparty or a termination of the agreement, the International Swaps and Derivatives Association (ISDA) Master Agreement, or similar agreement, does not result in an offset of reported amounts of financial assets and financial liabilities in the Statement of Assets and Liabilities across transactions between the fund and the applicable counterparty. The fund's right to setoff may be restricted or prohibited by the bankruptcy or insolvency laws of the particular jurisdiction to which a specific master netting agreement counterparty is subject. Balance sheet offsetting disclosures, to the extent applicable to the fund, have been included in the fund’s Significant Accounting Policies note under the captions for each of the fund’s in-scope financial instruments and transactions.
Investment Valuations — Subject to its oversight, the fund's Board of Trustees has delegated primary responsibility for determining or causing to be determined the value of the fund’s investments to MFS as the fund's adviser, pursuant to the fund’s valuation policy and procedures which have been adopted by the adviser and approved by the Board. Effective September 8, 2022, and in accordance with Rule 2a-5 under the Investment Company Act of 1940, the Board of Trustees designated the adviser as the “valuation designee” of the fund. If the adviser, as valuation designee, determines that reliable market quotations are not readily available for an investment, the investment is valued at fair value as determined in good faith by the adviser in accordance with the adviser’s fair valuation policy and procedures.
Under the fund's valuation policy and procedures, debt instruments and floating rate loans, including restricted debt instruments, are generally valued at an evaluated or composite bid as provided by a third-party pricing service. Short-term instruments with a maturity at issuance of 60 days or less may be valued at amortized cost, which approximates market value. Futures contracts are generally valued at last posted settlement price on their primary exchange as provided by a third-party pricing service. Futures contracts for which there were no trades that day for a particular position are generally valued at the closing bid quotation on their primary exchange as provided by a third-party pricing service. Swap agreements are generally valued using valuations provided by a third-party pricing service, which for cleared swaps includes an evaluation of any trading activity at the clearinghouses. Open-end investment companies are generally valued at net asset value per share. The values of foreign securities and other assets and liabilities expressed in foreign currencies are converted to U.S. dollars using the mean of bid and asked prices for rates provided by a third-party pricing service.
Under the fund’s valuation policy and procedures, market quotations are not considered to be readily available for debt instruments, floating rate loans, and many types of derivatives. These investments are generally valued at fair value based on information from third-party pricing services or otherwise determined by the adviser in accordance with the adviser’s fair valuation policy and procedures. Securities and other assets generally valued on the basis of information from a third-party pricing service may also be valued at a broker/dealer bid quotation. In determining values, third-party pricing services can utilize both transaction data and market information such as yield, quality, coupon rate, maturity, type of issue, trading characteristics, spreads and other market data. An investment may also be valued at fair value if the adviser determines that the investment’s value has been materially affected by events occurring after the close of the exchange or market on which the investment is principally traded (such as foreign exchange or market) and prior to the determination of the fund’s net asset value, or after the halt of trading of a specific security where trading
MFS Limited Maturity Portfolio
Notes to Financial Statements - continued
does not resume prior to the close of the exchange or market on which the security is principally traded. The adviser generally relies on third-party pricing services or other information (such as the correlation with price movements of similar securities in the same or other markets; the type, cost and investment characteristics of the security; the business and financial condition of the issuer; and trading and other market data) to assist in determining whether to fair value and at what value to fair value an investment. The value of an investment for purposes of calculating the fund’s net asset value can differ depending on the source and method used to determine value. When fair valuation is used, the value of an investment used to determine the fund’s net asset value may differ from quoted or published prices for the same investment. There can be no assurance that the fund could obtain the fair value assigned to an investment if it were to sell the investment at the same time at which the fund determines its net asset value per share.
Various inputs are used in determining the value of the fund's assets or liabilities. These inputs are categorized into three broad levels. In certain cases, the inputs used to measure fair value may fall into different levels of the fair value hierarchy. In such cases, an investment's level within the fair value hierarchy is based on the lowest level of input that is significant to the fair value measurement. The fund's assessment of the significance of a particular input to the fair value measurement in its entirety requires judgment, and considers factors specific to the investment. Level 1 includes unadjusted quoted prices in active markets for identical assets or liabilities. Level 2 includes other significant observable market-based inputs (including quoted prices for similar securities, interest rates, prepayment speed, and credit risk). Level 3 includes significant unobservable inputs, which may include the adviser's own assumptions in determining the fair value of investments. Other financial instruments are derivative instruments, such as futures contracts and swap agreements. The following is a summary of the levels used as of December 31, 2022 in valuing the fund's assets and liabilities:
| Financial Instruments | Level 1 | Level 2 | Level 3 | Total |
| U.S. Treasury Bonds & U.S. Government Agencies & Equivalents | $— | $57,791,894 | $— | $57,791,894 |
| Non - U.S. Sovereign Debt | — | 3,353,635 | — | 3,353,635 |
| Municipal Bonds | — | 9,213,598 | — | 9,213,598 |
| U.S. Corporate Bonds | — | 114,221,972 | — | 114,221,972 |
| Residential Mortgage-Backed Securities | — | 3,456,008 | — | 3,456,008 |
| Commercial Mortgage-Backed Securities | — | 23,260,428 | — | 23,260,428 |
| Asset-Backed Securities (including CDOs) | — | 44,566,666 | — | 44,566,666 |
| Foreign Bonds | — | 69,493,624 | — | 69,493,624 |
| Mutual Funds | 4,751,208 | — | — | 4,751,208 |
| Total | $4,751,208 | $325,357,825 | $— | $330,109,033 |
| Other Financial Instruments | | | | |
| Futures Contracts – Assets | $9,032 | $— | $— | $9,032 |
| Swap Agreements – Assets | — | 22,737 | — | 22,737 |
| Swap Agreements – Liabilities | — | (501,811) | — | (501,811) |
For further information regarding security characteristics, see the Portfolio of Investments.
Foreign Currency Translation — Purchases and sales of foreign investments, income, and expenses are converted into U.S. dollars based upon currency exchange rates prevailing on the respective dates of such transactions or on the reporting date for foreign denominated receivables and payables. Gains and losses attributable to foreign currency exchange rates on sales of securities are recorded for financial statement purposes as net realized gains and losses on investments. Gains and losses attributable to foreign exchange rate movements on receivables, payables, income and expenses are recorded for financial statement purposes as foreign currency transaction gains and losses. That portion of both realized and unrealized gains and losses on investments that results from fluctuations in foreign currency exchange rates is not separately disclosed.
Derivatives — The fund uses derivatives primarily to increase or decrease exposure to a particular market or segment of the market, or security, to increase or decrease interest rate or currency exposure, or as alternatives to direct investments. Derivatives are used for hedging or non-hedging purposes. While hedging can reduce or eliminate losses, it can also reduce or eliminate gains. When the fund uses derivatives as an investment to increase market exposure, or for hedging purposes, gains and losses from derivative instruments may be substantially greater than the derivative’s original cost.
The derivative instruments used by the fund during the period were futures contracts and swap agreements. Depending on the type of derivative, a fund may exit a derivative position by entering into an offsetting transaction with a counterparty or exchange, negotiating an agreement with the derivative counterparty, or novating the position to a third party. The fund may be unable to promptly close out a futures position in instances where the daily fluctuation in the price for that type of future exceeds the daily limit set by the exchange. The fund's period end derivatives, as presented in the Portfolio of Investments and the associated Derivative Contract tables, generally are indicative of the volume of its derivative activity during the period.
MFS Limited Maturity Portfolio
Notes to Financial Statements - continued
The following table presents, by major type of derivative contract, the fair value, on a gross basis, of the asset and liability components of derivatives held by the fund at December 31, 2022 as reported in the Statement of Assets and Liabilities:
| | | Fair Value (a) |
| Risk | Derivative Contracts | Asset Derivatives | Liability Derivatives |
| Interest Rate | Futures Contracts | $9,032 | $— |
| Credit | Cleared Swap Agreements | — | (275,674) |
| Interest Rate | Cleared Swap Agreements | 22,737 | (226,137) |
| Total | | $31,769 | $(501,811) |
(a) Values presented in this table for futures contracts and cleared swap agreements correspond to the values reported in the Portfolio of Investments. Only the current day net variation margin for futures contracts and cleared swap agreements is reported separately within the Statement of Assets and Liabilities.
The following table presents, by major type of derivative contract, the realized gain (loss) on derivatives held by the fund for the year ended December 31, 2022 as reported in the Statement of Operations:
| Risk | Futures
Contracts | Swap
Agreements |
| Interest Rate | $(1,022,632) | $(673,259) |
| Credit | — | (60,867) |
| Total | $(1,022,632) | $(734,126) |
The following table presents, by major type of derivative contract, the change in unrealized appreciation or depreciation on derivatives held by the fund for the year ended December 31, 2022 as reported in the Statement of Operations:
| Risk | Futures
Contracts | Swap
Agreements |
| Interest Rate | $16,530 | $(207,607) |
| Credit | — | (117,207) |
| Total | $16,530 | $(324,814) |
Derivative counterparty credit risk is managed through formal evaluation of the creditworthiness of all potential counterparties. On certain, but not all, uncleared derivatives, the fund attempts to reduce its exposure to counterparty credit risk whenever possible by entering into an ISDA Master Agreement on a bilateral basis. The ISDA Master Agreement gives each party to the agreement the right to terminate all transactions traded under such agreement if there is a specified deterioration in the credit quality of the other party. Upon an event of default or a termination of the ISDA Master Agreement, the non-defaulting party has the right to close out all transactions traded under such agreement and to net amounts owed under each agreement to one net amount payable by one party to the other. This right to close out and net payments across all transactions traded under the ISDA Master Agreement could result in a reduction of the fund's credit risk to such counterparty equal to any amounts payable by the fund under the applicable transactions, if any.
Collateral and margin requirements differ by type of derivative. For cleared derivatives (e.g., futures contracts, cleared swaps, and exchange-traded options), margin requirements are set by the clearing broker and the clearing house and collateral, in the form of cash or securities, is posted by the fund directly with the clearing broker. Collateral terms are counterparty agreement specific for uncleared derivatives (e.g., forward foreign currency exchange contracts, uncleared swap agreements, and uncleared options) and collateral, in the form of cash and securities, is held in segregated accounts with the fund's custodian in connection with these agreements. For derivatives traded under an ISDA Master Agreement, which contains a credit support annex, the collateral requirements are netted across all transactions traded under such counterparty-specific agreement and an amount is posted from one party to the other to collateralize such obligations. Cash that has been segregated or delivered to cover the fund's collateral or margin obligations under derivative contracts, if any, will be reported separately in the Statement of Assets and Liabilities as restricted cash for uncleared derivatives and/or deposits with brokers for cleared derivatives. Securities pledged as collateral or margin for the same purpose, if any, are noted in the Portfolio of Investments. The fund may be required to make payments of interest on uncovered collateral or margin obligations with the broker. Any such payments are included in “Miscellaneous” expense in the Statement of Operations.
Futures Contracts — The fund entered into futures contracts which may be used to hedge against or obtain broad market exposure, interest rate exposure, currency exposure, or to manage duration. A futures contract represents a commitment for the future purchase or sale of an asset at a specified price on a specified date.
MFS Limited Maturity Portfolio
Notes to Financial Statements - continued
Upon entering into a futures contract, the fund is required to deposit with the broker, either in cash or securities, an initial margin in an amount equal to a specified percentage of the notional amount of the contract. Subsequent payments (variation margin) are made or received by the fund each day, depending on the daily fluctuations in the value of the contract, and are recorded for financial statement purposes as unrealized gain or loss by the fund until the contract is closed or expires at which point the gain or loss on futures contracts is realized.
The fund bears the risk of interest rates, exchange rates or securities prices moving unexpectedly, in which case, the fund may not achieve the anticipated benefits of the futures contracts and may realize a loss. While futures contracts may present less counterparty risk to the fund since the contracts are exchange traded and the exchange’s clearinghouse guarantees payments to the broker, there is still counterparty credit risk due to the insolvency of the broker. The fund’s maximum risk of loss due to counterparty credit risk is equal to the margin posted by the fund to the broker plus any gains or minus any losses on the outstanding futures contracts.
Swap Agreements — The fund entered into swap agreements which generally involve a periodic exchange of cash payments on a net basis, at specified intervals or upon the occurrence of specified events, between the fund and a counterparty. Certain swap agreements may be entered into as a bilateral contract (“uncleared swaps”) while others are required to be centrally cleared (“cleared swaps”).
Both cleared and uncleared swap agreements are marked to market daily. The value of uncleared swap agreements is reported in the Statement of Assets and Liabilities as “Uncleared swaps, at value” which includes any related interest accruals to be paid or received by the fund. For cleared swaps, payments (variation margin) are made or received by the fund each day, depending on the daily fluctuations in the value of the cleared swap, such that only the current day net receivable or payable for variation margin is reported in the Statement of Assets and Liabilities.
For both cleared and uncleared swaps, premiums paid or received at the inception of the agreements are amortized over the term of the agreement as realized gain or loss on swap agreements in the Statement of Operations. The periodic exchange of net cash payments, as well as any liquidation payment received or made upon early termination, are recorded as a realized gain or loss on swap agreements in the Statement of Operations. The change in unrealized appreciation or depreciation on swap agreements in the Statement of Operations reflects the aggregate change over the reporting period in the value of swaps net of any unamortized premiums paid or received.
Risks related to swap agreements include the possible lack of a liquid market, unfavorable market and interest rate movements of the underlying instrument and the failure of the counterparty to perform under the terms of the agreements. The fund's maximum risk of loss from counterparty credit risk is the discounted net value of the cash flows to be received from/paid to the counterparty over the contract's remaining life, to the extent that the amount is positive. To address counterparty risk, uncleared swap agreements are limited to only highly-rated counterparties. Risk is further reduced by having an ISDA Master Agreement (“ISDA”) between the fund and the counterparty and, where applicable, by the posting of collateral by the counterparty to the fund to cover the fund’s exposure to the counterparty under such ISDA. The fund's counterparty risk due to cleared swaps is mitigated by the fact that the clearinghouse is the true counterparty to the transaction and the regulatory requirement safeguards in the event of a clearing broker bankruptcy.
The fund entered into interest rate swap agreements in order to manage its exposure to interest rate fluctuations. Interest rate swap agreements involve the periodic exchange of cash flows, between the fund and a counterparty, based on the difference between two interest rates applied to a notional principal amount. The two interest rates exchanged may either be a fixed rate and a floating rate or two floating rates based on different indices.
The fund entered into credit default swap agreements in order to manage its exposure to the market or certain sectors of the market, to reduce its credit risk exposure to defaults of corporate and sovereign issuers or to create exposure to corporate or sovereign issuers to which it is not otherwise exposed. A credit default swap’s reference obligation may be either a single security or a basket of securities issued by corporate or sovereign issuers. At the inception of the agreement, the protection buyer may make an upfront payment to or receive an upfront payment from the protection seller. Over the term of the agreement, the protection buyer will make a series of periodic payments to the protection seller based on a fixed percentage applied to the agreement’s notional amount in exchange for a promise from the protection seller to make a specific payment should a defined credit event occur with respect to the reference obligation. Although agreement-specific, credit events generally consist of a combination of the following: bankruptcy, failure to pay, restructuring, obligation acceleration, obligation default, or repudiation/moratorium. If a defined credit event occurs, the protection buyer will either (i) receive from the protection seller an amount equal to the agreement’s notional amount and deliver the reference obligation (i.e., physical settlement) or (ii) receive from the protection seller a net settlement of cash equal to the agreement’s notional amount less the recovery value of the reference obligation. Upon determination of the final price for the reference obligation (or upon delivery of the reference obligation in the case of physical settlement), the difference between the recovery value of the reference obligation and the agreement’s notional amount is recorded as realized gain or loss on swap agreements in the Statement of Operations.
MFS Limited Maturity Portfolio
Notes to Financial Statements - continued
Credit default swap agreements are considered to have credit-risk-related contingent features since they trigger payment by the protection seller to the protection buyer upon the occurrence of a defined credit event. The maximum amount of future, undiscounted payments that the fund, as protection seller, could be required to make is equal to the swap agreement’s notional amount. The protection seller’s payment obligation would be offset to the extent of the value of the agreement’s deliverable obligation. At December 31, 2022, the fund did not hold any credit default swap agreements at an unrealized loss where it is the protection seller. The fund’s maximum risk of loss from counterparty risk, either as the protection seller or as the protection buyer, is the fair value of the agreement.
Indemnifications — Under the fund's organizational documents, its officers and Trustees may be indemnified against certain liabilities and expenses arising out of the performance of their duties to the fund. Additionally, in the normal course of business, the fund enters into agreements with service providers that may contain indemnification clauses. The fund's maximum exposure under these agreements is unknown as this would involve future claims that may be made against the fund that have not yet occurred.
Investment Transactions and Income — Investment transactions are recorded on the trade date. Interest income is recorded on the accrual basis. All premium and discount is amortized or accreted for financial statement purposes in accordance with U.S. generally accepted accounting principles. Interest payments received in additional securities are recorded on the ex-interest date in an amount equal to the value of the security on such date. In determining the net gain or loss on securities sold, the cost of securities is determined on the identified cost basis.
The fund may receive proceeds from litigation settlements. Any proceeds received from litigation involving portfolio holdings are reflected in the Statement of Operations in realized gain/loss if the security has been disposed of by the fund or in unrealized gain/loss if the security is still held by the fund. Any other proceeds from litigation not related to portfolio holdings are reflected as other income in the Statement of Operations.
The fund invests a significant portion of its assets in asset-backed and/or mortgage-backed securities. For these securities, the value of the debt instrument also depends on the credit quality and adequacy of the underlying assets or collateral as well as whether there is a security interest in the underlying assets or collateral. Enforcing rights, if any, against the underlying assets or collateral may be difficult. U.S. Government securities not supported as to the payment of principal or interest by the U.S. Treasury, such as those issued by Fannie Mae, Freddie Mac, and the Federal Home Loan Banks, are subject to greater credit risk than are U.S. Government securities supported by the U.S. Treasury, such as those issued by Ginnie Mae.
The fund may purchase or sell mortgage-backed securities on a “To Be Announced” (TBA) basis. A TBA transaction is subject to extended settlement and typically does not designate the actual security to be delivered, but instead includes an approximate principal amount. The price of the TBA security and the date that it will be settled are fixed at the time the transaction is negotiated. The value of the security varies with market fluctuations and no interest accrues to the fund until settlement takes place. TBA purchase and sale commitments are held at carrying amount, which approximates fair value and are categorized as level 2 within the fair value hierarchy. Losses may arise as a result of changes in the value of the TBA investment prior to settlement date or due to counterparty non-performance.
To mitigate the counterparty credit risk on TBA transactions, mortgage dollar rolls, and other types of forward settling mortgage-backed and asset-backed security transactions, the fund whenever possible enters into a Master Securities Forward Transaction Agreement (“MSFTA”) on a bilateral basis with each of the counterparties with whom it undertakes a significant volume of transactions. The MSFTA gives each party to the agreement the right to terminate all transactions traded under such agreement if there is a specified deterioration in the credit quality of the other party. Upon an event of default or a termination of the MSFTA, the non-defaulting party has the right to close out all transactions traded under such agreement and to net amounts owed under each transaction to one net amount payable by one party to the other. This right to close out and net payments across all transactions traded under the MSFTA could result in a reduction of the fund's credit risk to such counterparty equal to any amounts payable by the fund under the applicable transactions, if any.
For mortgage-backed and asset-backed securities traded under a MSFTA, the collateral and margining requirements are contract specific. Collateral amounts across all transactions traded under such agreement are netted and an amount is posted from one party to the other to collateralize such obligations. Cash that has been pledged to cover the fund's collateral or margin obligations under a MSFTA, if any, will be reported separately on the Statement of Assets and Liabilities as restricted cash. Securities pledged as collateral or margin for the same purpose, if any, are noted in the Portfolio of Investments.
Tax Matters and Distributions — The fund intends to qualify as a regulated investment company, as defined under Subchapter M of the Internal Revenue Code, and to distribute all of its taxable income, including realized capital gains. As a result, no provision for federal income tax is required. The fund’s federal tax returns, when filed, will remain subject to examination by the Internal Revenue Service for a three year period. Management has analyzed the fund’s tax positions taken on federal and state tax returns for all open tax years and does not believe that there are any uncertain tax positions that require recognition of a tax liability. Foreign taxes, if any,
MFS Limited Maturity Portfolio
Notes to Financial Statements - continued
have been accrued by the fund in the accompanying financial statements in accordance with the applicable foreign tax law. Foreign income taxes may be withheld by certain countries in which the fund invests. Additionally, capital gains realized by the fund on securities issued in or by certain foreign countries may be subject to capital gains tax imposed by those countries.
Distributions to shareholders are recorded on the ex-dividend date. Income and capital gain distributions are determined in accordance with income tax regulations, which may differ from U.S. generally accepted accounting principles. Certain capital accounts in the financial statements are periodically adjusted for permanent differences in order to reflect their tax character. These adjustments have no impact on net assets or net asset value per share. Temporary differences which arise from recognizing certain items of income, expense, gain or loss in different periods for financial statement and tax purposes will reverse at some time in the future.
Book/tax differences primarily relate to derivative transactions.
The tax character of distributions declared to shareholders for the last two fiscal years is as follows:
| | Year ended
12/31/22 | Year ended
12/31/21 |
| Ordinary income (including any short-term capital gains) | $6,821,233 | $9,619,310 |
| Long-term capital gains | 1,385,186 | 828,180 |
| Total distributions | $8,206,419 | $10,447,490 |
The federal tax cost and the tax basis components of distributable earnings were as follows:
| As of 12/31/22 | |
| Cost of investments | $346,663,504 |
| Gross appreciation | 582,436 |
| Gross depreciation | (17,606,949) |
| Net unrealized appreciation (depreciation) | $(17,024,513) |
| Undistributed ordinary income | 4,849,958 |
| Capital loss carryforwards | (4,183,993) |
| Total distributable earnings (loss) | $(16,358,548) |
As of December 31, 2022, the fund had capital loss carryforwards available to offset future realized gains. These net capital losses may be carried forward indefinitely and their character is retained as short-term and/or long-term losses. Such losses are characterized as follows:
| Short-Term | $(1,561,053) |
| Long-Term | (2,622,940) |
| Total | $(4,183,993) |
Multiple Classes of Shares of Beneficial Interest — The fund offers multiple classes of shares, which differ in their respective distribution and/or service fees. The fund's income, realized and unrealized gain (loss), and common expenses are allocated to shareholders based on the daily net assets of each class. Dividends are declared separately for each class. Differences in per share dividend rates are generally due to differences in separate class expenses. The fund’s distributions declared to shareholders as reported in the Statements of Changes in Net Assets are presented by class as follows:
| | Year
ended
12/31/22 | | Year
ended
12/31/21 |
| Initial Class | $6,307,773 | | $8,028,886 |
| Service Class | 1,898,646 | | 2,418,604 |
| Total | $8,206,419 | | $10,447,490 |
(3) Transactions with Affiliates
Investment Adviser — The fund has an investment advisory agreement with MFS to provide overall investment management and related administrative services and facilities to the fund. The management fee is computed daily and paid monthly at an annual rate of 0.40% of the fund’s average daily net assets.
MFS Limited Maturity Portfolio
Notes to Financial Statements - continued
MFS has agreed in writing to reduce its management fee by a specified amount if certain MFS mutual fund assets exceed thresholds agreed to by MFS and the fund's Board of Trustees. Effective March 1, 2022, MFS has also agreed in writing to waive at least 0.01% of its management fee as part of this agreement. The agreement to waive at least 0.01% of the management fee will continue until modified by the fund's Board of Trustees, but such agreement will continue at least until April 30, 2024. For the year ended December 31, 2022, this management fee reduction amounted to $51,156, which is included in the reduction of total expenses in the Statement of Operations. The management fee incurred for the year ended December 31, 2022 was equivalent to an annual effective rate of 0.39% of the fund's average daily net assets.
Distributor — MFS Fund Distributors, Inc. (MFD), a wholly-owned subsidiary of MFS, is the distributor of shares of the fund. The Trustees have adopted a distribution plan for the Service Class shares pursuant to Rule 12b-1 under the Investment Company Act of 1940.
The fund's distribution plan provides that the fund will pay MFD distribution and/or service fees equal to 0.25% per annum of its average daily net assets attributable to Service Class shares as partial consideration for services performed and expenses incurred by MFD and financial intermediaries (including participating insurance companies that invest in the fund to fund variable annuity and variable life insurance contracts, sponsors of qualified retirement and pension plans that invest in the fund, and affiliates of these participating insurance companies and plan sponsors) in connection with the sale and distribution of the Service Class shares. MFD may subsequently pay all, or a portion, of the distribution and/or service fees to financial intermediaries.
Shareholder Servicing Agent — MFS Service Center, Inc. (MFSC), a wholly-owned subsidiary of MFS, receives a fee from the fund for its services as shareholder servicing agent. For the year ended December 31, 2022, the fee was $5,107, which equated to 0.0014% annually of the fund's average daily net assets. MFSC also receives reimbursement from the fund for out-of-pocket expenses paid by MFSC on behalf of the fund. For the year ended December 31, 2022, these costs amounted to $224.
Administrator — MFS provides certain financial, legal, shareholder communications, compliance, and other administrative services to the fund. Under an administrative services agreement, the fund reimburses MFS the costs incurred to provide these services. The fund is charged an annual fixed amount of $17,500 plus a fee based on average daily net assets. The administrative services fee incurred for the year ended December 31, 2022 was equivalent to an annual effective rate of 0.0180% of the fund's average daily net assets.
Trustees’ and Officers’ Compensation — The fund pays compensation to independent Trustees in the form of a retainer, attendance fees, and additional compensation to Board and Committee chairpersons. The fund does not pay compensation directly to Trustees or officers of the fund who are also officers of the investment adviser, all of whom receive remuneration from MFS for their services to the fund. Certain officers and Trustees of the fund are officers or directors of MFS, MFD, and MFSC.
Other — The fund invests in the MFS Institutional Money Market Portfolio which is managed by MFS and seeks current income consistent with preservation of capital and liquidity. This money market fund does not pay a management fee to MFS but does incur investment and operating costs.
(4) Portfolio Securities
For the year ended December 31, 2022, purchases and sales of investments, other than short-term obligations, were as follows:
| | Purchases | Sales |
| U.S. Government securities | $34,410,029 | $59,916,737 |
| Non-U.S. Government securities | 55,186,827 | 98,868,272 |
(5) Shares of Beneficial Interest
The fund's Declaration of Trust permits the Trustees to issue an unlimited number of full and fractional shares of beneficial interest. Transactions in fund shares were as follows:
| | Year ended
12/31/22 | | Year ended
12/31/21 |
| | Shares | Amount | | Shares | Amount |
| Shares sold | | | | | |
| Initial Class | 465,902 | $4,498,291 | | 2,725,133 | $28,404,219 |
| Service Class | 361,690 | 3,524,643 | | 1,005,181 | 10,464,064 |
| | 827,592 | $8,022,934 | | 3,730,314 | $38,868,283 |
MFS Limited Maturity Portfolio
Notes to Financial Statements - continued
| | Year ended
12/31/22 | | Year ended
12/31/21 |
| | Shares | Amount | | Shares | Amount |
Shares issued to shareholders
in reinvestment of distributions | | | | | |
| Initial Class | 658,431 | $6,307,773 | | 783,306 | $8,028,886 |
| Service Class | 197,982 | 1,898,646 | | 235,731 | 2,418,604 |
| | 856,413 | $8,206,419 | | 1,019,037 | $10,447,490 |
| Shares reacquired | | | | | |
| Initial Class | (6,557,737) | $(64,285,836) | | (3,467,630) | $(36,020,828) |
| Service Class | (1,992,084) | (19,438,366) | | (1,605,376) | (16,687,805) |
| | (8,549,821) | $(83,724,202) | | (5,073,006) | $(52,708,633) |
| Net change | | | | | |
| Initial Class | (5,433,404) | $(53,479,772) | | 40,809 | $412,277 |
| Service Class | (1,432,412) | (14,015,077) | | (364,464) | (3,805,137) |
| | (6,865,816) | $(67,494,849) | | (323,655) | $(3,392,860) |
The fund is one of several mutual funds in which certain MFS funds may invest. The MFS funds do not invest in the underlying funds for the purpose of exercising management or control. At the end of the period, the MFS Moderate Allocation Portfolio, the MFS Conservative Allocation Portfolio, and the MFS Growth Allocation Portfolio were the owners of record of approximately 12%, 11%, and 2%, respectively, of the value of outstanding voting shares of the fund.
(6) Line of Credit
The fund and certain other funds managed by MFS participate in a $1.45 billion unsecured committed line of credit of which $1.2 billion is reserved for use by the fund and certain other MFS U.S. funds. The line of credit is provided by a syndicate of banks under a credit agreement. Borrowings may be made for temporary financing needs. Interest is charged to each fund, based on its borrowings, generally at a rate equal to the highest of 1) Daily Simple SOFR (Secured Overnight Financing Rate) plus 0.10%, 2) the Federal Funds Effective Rate, or 3) the Overnight Bank Funding Rate, each plus an agreed upon spread. A commitment fee, based on the average daily unused portion of the committed line of credit, is allocated among the participating funds. The line of credit expires on March 16, 2023 unless extended or renewed. In addition, the fund and other funds managed by MFS have established unsecured uncommitted borrowing arrangements with certain banks for temporary financing needs. Interest is charged to each fund, based on its borrowings, at rates equal to customary reference rates plus an agreed upon spread. For the year ended December 31, 2022, the fund’s commitment fee and interest expense were $1,825 and $0, respectively, and are included in “Miscellaneous” expense in the Statement of Operations.
(7) Investments in Affiliated Issuers
An affiliated issuer may be considered one in which the fund owns 5% or more of the outstanding voting securities, or a company which is under common control. For the purposes of this report, the following were affiliated issuers:
| Affiliated Issuers | Beginning
Value | Purchases | Sales
Proceeds | Realized
Gain
(Loss) | Change in
Unrealized
Appreciation or
Depreciation | Ending
Value |
| MFS Institutional Money Market Portfolio | $4,686,372 | $85,055,726 | $84,993,322 | $675 | $1,757 | $4,751,208 |
| Affiliated Issuers | Dividend
Income | Capital Gain
Distributions |
| MFS Institutional Money Market Portfolio | $113,432 | $— |
MFS Limited Maturity Portfolio
Notes to Financial Statements - continued
(8) LIBOR Transition
Certain of the fund's investments, including investments in certain debt instruments and derivatives (if any), as well as borrowings by the fund and certain other contractual arrangements of the fund, may be based on the London Interbank Offered Rate (“LIBOR”). In 2017, the regulatory authority that oversees financial services firms in the United Kingdom announced plans to transition away from LIBOR by the end of 2021. In March 2021, the administrator of LIBOR announced the extension of the publication of the more commonly used U.S. dollar LIBOR settings to the end of June 2023. Although the full impacts of the transition away from LIBOR are not fully known, the transition may result in, among other things, an increase in volatility or illiquidity of the markets for instruments that currently rely on LIBOR to determine interest rates and this could have an adverse impact on the fund's performance. With respect to the fund's accounting for investments, including investments in certain debt instruments and derivatives, as well as borrowings by the fund and any other contractual arrangements of the fund that undergo reference rate-related modifications as a result of the transition, management will rely upon the relief provided by FASB Codification Topic 848 – Reference Rate Reform (Topic 848). The guidance in Topic 848 permits the fund to account for those modified contracts as a continuation of the existing contracts. Management is still evaluating the impact to the fund of the June 30, 2023 planned discontinuation of the more commonly used U.S. dollar LIBOR settings.
(9) Russia and Ukraine Conflict
The market disruptions, which began in late February 2022, associated with geopolitical events related to the conflict between Russia and Ukraine may adversely affect the value of the fund’s assets and thus the fund’s performance. Management continues to monitor these events and to evaluate the related impacts, if any, to the fund.
MFS Limited Maturity Portfolio
Report of Independent Registered Public Accounting Firm
To the Board of Trustees of MFS Variable Insurance Trust III and the Shareholders of MFS Limited Maturity Portfolio:
Opinion on the Financial Statements and Financial Highlights
We have audited the accompanying statement of assets and liabilities of MFS Limited Maturity Portfolio (the “Fund”), including the portfolio of investments, as of December 31, 2022, the related statement of operations for the year then ended, the statements of changes in net assets for each of the two years in the period then ended, the financial highlights for each of the five years in the period then ended, and the related notes. In our opinion, the financial statements and financial highlights present fairly, in all material respects, the financial position of the Fund as of December 31, 2022, and the results of its operations for the year then ended, the changes in its net assets for each of the two years in the period then ended, and the financial highlights for each of the five years in the period then ended, in conformity with accounting principles generally accepted in the United States of America.
Basis for Opinion
These financial statements and financial highlights are the responsibility of the Fund's management. Our responsibility is to express an opinion on the Fund's financial statements and financial highlights based on our audits. We are a public accounting firm registered with the Public Company Accounting Oversight Board (United States) (PCAOB) and are required to be independent with respect to the Fund in accordance with the U.S. federal securities laws and the applicable rules and regulations of the Securities and Exchange Commission and the PCAOB.
We conducted our audits in accordance with the standards of the PCAOB. Those standards require that we plan and perform the audit to obtain reasonable assurance about whether the financial statements and financial highlights are free of material misstatement, whether due to error or fraud. The Fund is not required to have, nor were we engaged to perform, an audit of its internal control over financial reporting. As part of our audits, we are required to obtain an understanding of internal control over financial reporting but not for the purpose of expressing an opinion on the effectiveness of the Fund's internal control over financial reporting. Accordingly, we express no such opinion.
Our audits included performing procedures to assess the risks of material misstatement of the financial statements and financial highlights, whether due to error or fraud, and performing procedures that respond to those risks. Such procedures included examining, on a test basis, evidence regarding the amounts and disclosures in the financial statements and financial highlights. Our audits also included evaluating the accounting principles used and significant estimates made by management, as well as evaluating the overall presentation of the financial statements and financial highlights. Our procedures included confirmation of securities owned as of December 31, 2022, by correspondence with the custodian and brokers; when replies were not received from brokers, we performed other auditing procedures. We believe that our audits provide a reasonable basis for our opinion.
DELOITTE & TOUCHE LLP
Boston, Massachusetts
February 15, 2023
We have served as the auditor of one or more of the MFS investment companies since 1924.
MFS Limited Maturity Portfolio
Trustees and Officers — Identification and Background
The Trustees and Officers of the Trust, as of February 1, 2023, are listed below, together with their principal occupations during the past five years. (Their titles may have varied during that period.) The address of each Trustee and Officer is 111 Huntington Avenue, Boston, Massachusetts 02199-7618.
| Name, Age | | Position(s) Held with Fund | | Trustee/Officer Since(h) | | Number of MFS Funds overseen by the Trustee | | Principal Occupations During
the Past Five Years | | Other Directorships During
the Past Five Years (j) |
| INTERESTED TRUSTEE | | | | | | | | | | |
Michael W. Roberge (k)
(age 56) | | Trustee | | January 2021 | | 136 | | Massachusetts Financial Services Company, Chairman (since January 2021); Chief Executive Officer (since January 2017); Director; Chairman of the Board (since January 2022); President (until December 2018); Chief Investment Officer (until December 2018) | | N/A |
| INDEPENDENT TRUSTEES | | | | | | | | | | |
John P. Kavanaugh
(age 68) | | Trustee and Chair of Trustees | | January 2009 | | 136 | | Private investor | | N/A |
Steven E. Buller
(age 71) | | Trustee | | February 2014 | | 136 | | Private investor | | N/A |
John A. Caroselli
(age 68) | | Trustee | | March 2017 | | 136 | | Private investor; JC Global Advisors, LLC (management consulting), President (since 2015) | | N/A |
Maureen R. Goldfarb
(age 67) | | Trustee | | January 2009 | | 136 | | Private investor | | N/A |
Peter D. Jones
(age 67) | | Trustee | | January 2019 | | 136 | | Private investor | | N/A |
James W. Kilman, Jr.
(age 61) | | Trustee | | January 2019 | | 136 | | Burford Capital Limited (finance and investment management), Senior Advisor (since May 3, 2021), Chief Financial Officer (2019 - May 2, 2021); KielStrand Capital LLC (family office), Chief Executive Officer (since 2016) | | Alpha-En Corporation, Director (2016-2019) |
Clarence Otis, Jr.
(age 66) | | Trustee | | March 2017 | | 136 | | Private investor | | VF Corporation, Director; Verizon Communications, Inc., Director; The Travelers Companies, Director |
Maryanne L. Roepke
(age 66) | | Trustee | | May 2014 | | 136 | | Private investor | | N/A |
Laurie J. Thomsen
(age 65) | | Trustee | | March 2005 | | 136 | | Private investor | | The Travelers Companies, Director; Dycom Industries, Inc., Director |
MFS Limited Maturity Portfolio
Trustees and Officers - continued
| Name, Age | | Position(s) Held with
Fund | | Trustee/Officer Since(h) | | Number of MFS Funds for which the Person is an Officer | | Principal Occupations During
the Past Five Years |
| OFFICERS | | | | | | | | |
Christopher R. Bohane (k)
(age 49) | | Assistant Secretary and Assistant Clerk | | July 2005 | | 136 | | Massachusetts Financial Services Company, Senior Vice President and Senior Managing Counsel |
Kino Clark (k)
(age 54) | | Assistant Treasurer | | January 2012 | | 136 | | Massachusetts Financial Services Company, Vice President |
John W. Clark, Jr. (k)
(age 55) | | Assistant Treasurer | | April 2017 | | 136 | | Massachusetts Financial Services Company, Vice President |
David L. DiLorenzo (k)
(age 54) | | President | | July 2005 | | 136 | | Massachusetts Financial Services Company, Senior Vice President |
Heidi W. Hardin (k)
(age 55) | | Secretary and Clerk | | April 2017 | | 136 | | Massachusetts Financial Services Company, Executive Vice President and General Counsel |
Brian E. Langenfeld (k)
(age 49) | | Assistant Secretary and Assistant Clerk | | June 2006 | | 136 | | Massachusetts Financial Services Company, Vice President and Managing Counsel |
Rosa E. Licea-Mailloux (k)
(age 46) | | Chief Compliance Officer | | March 2022 | | 136 | | Massachusetts Financial Services Company, Vice President (since 2018); Director of Corporate Compliance (2018-2021), Senior Director Compliance (2021-2022), Senior Managing Director of North American Compliance & Chief Compliance Officer (since March 2022); Natixis Investment Managers (investment management), Funds Chief Compliance Officer, Deputy General Counsel & Senior Vice President (until 2018) |
Amanda S. Mooradian (k)
(age 43) | | Assistant Secretary and Assistant Clerk | | September 2018 | | 136 | | Massachusetts Financial Services Company, Assistant Vice President and Senior Counsel |
Susan A. Pereira (k)
(age 52) | | Assistant Secretary and Assistant Clerk | | July 2005 | | 136 | | Massachusetts Financial Services Company, Vice President and Managing Counsel |
Kasey L. Phillips (k)
(age 52) | | Assistant Treasurer | | September 2012 | | 136 | | Massachusetts Financial Services Company, Vice President |
Matthew A. Stowe (k)
(age 48) | | Assistant Secretary and Assistant Clerk | | October 2014 | | 136 | | Massachusetts Financial Services Company, Vice President and Senior Managing Counsel |
William B. Wilson (k)
(age 40) | | Assistant Secretary and Assistant Clerk | | October 2022 | | 136 | | Massachusetts Financial Services Company, Assistant Vice President and Counsel |
James O. Yost (k)
(age 62) | | Treasurer | | September 1990 | | 136 | | Massachusetts Financial Services Company, Senior Vice President |
| (h) | Date first appointed to serve as Trustee/Officer of an MFS Fund. Each Trustee has served continuously since appointment unless indicated otherwise. From January 2012 through December 2016, Messrs. DiLorenzo and Yost served as Treasurer and Deputy Treasurer of the Funds, respectively. |
| (j) | Directorships or trusteeships of companies required to report to the Securities and Exchange Commission (i.e., “public companies”). |
| (k) | “Interested person” of the Trust within the meaning of the Investment Company Act of 1940 (referred to as the 1940 Act), which is the principal federal law governing investment companies like the fund, as a result of a position with MFS. The address of MFS is 111 Huntington Avenue, Boston, Massachusetts 02199-7618. |
Each Trustee (other than Messrs. Jones, Kilman and Roberge) has been elected by shareholders and each Trustee and Officer holds office until his or her successor is chosen and qualified or until his or her earlier death, resignation, retirement or removal. Mr. Roberge became a Trustee of the Funds on January 1, 2021 and Messrs. Jones and Kilman became Trustees of the Funds on January 1, 2019. The Trust does not hold annual meetings for the purpose of electing Trustees, and Trustees are not elected for fixed terms. Under the terms of the Board's retirement policy, an Independent Trustee shall retire at the end of the calendar year in which he or she reaches the earlier of 75 years of age or 15 years of service on the Board (or, in the case of any Independent Trustee who joined the Board prior to 2015, 20 years of service on the Board).
MFS Limited Maturity Portfolio
Trustees and Officers - continued
Messrs. Buller, Kilman and Otis and Ms. Roepke are members of the Trust’s Audit Committee.
Each of the Interested Trustees and certain Officers hold comparable officer positions with certain affiliates of MFS.
The Statement of Additional Information for a Fund includes further information about the Trustees and is available without charge upon request by calling 1-800-225-2606.
| Investment Adviser | Custodian |
Massachusetts Financial Services Company
111 Huntington Avenue
Boston, MA 02199-7618 | State Street Bank and Trust Company
1 Lincoln Street
Boston, MA 02111-2900 |
| Distributor | Independent Registered Public Accounting Firm |
MFS Fund Distributors, Inc.
111 Huntington Avenue
Boston, MA 02199-7618 | Deloitte & Touche LLP
200 Berkeley Street
Boston, MA 02116 |
| Portfolio Manager(s) | |
Philipp Burgener
Alexander Mackey | |
MFS Limited Maturity Portfolio
Board Review of Investment Advisory Agreement
MFS Limited Maturity Portfolio
The Investment Company Act of 1940 requires that both the full Board of Trustees and a majority of the non-interested (“independent”) Trustees, voting separately, annually approve the continuation of the Fund’s investment advisory agreement with MFS. The Trustees consider matters bearing on the Fund and its advisory arrangements at their meetings throughout the year, including a review of performance data at each regular meeting. In addition, the independent Trustees met several times over the course of three months beginning in May and ending in July, 2022 (“contract review meetings”) for the specific purpose of considering whether to approve the continuation of the investment advisory agreement for the Fund and the other investment companies that the Board oversees (the “MFS Funds”). The independent Trustees were assisted in their evaluation of the Fund’s investment advisory agreement by independent legal counsel, from whom they received separate legal advice and with whom they met separately from MFS during various contract review meetings. The independent Trustees were also assisted in this process by an independent consultant who was retained by and reported to the independent Trustees.
In connection with their deliberations regarding the continuation of the investment advisory agreement, the Trustees, including the independent Trustees, considered such information and factors as they believed, in light of the legal advice furnished to them and their own business judgment, to be relevant. The investment advisory agreement for the Fund was considered separately, although the Trustees also took into account the common interests of all MFS Funds in their review. As described below, the Trustees considered the nature, quality, and extent of the various investment advisory, administrative, and shareholder services performed by MFS under the existing investment advisory agreement and other arrangements with the Fund.
In connection with their contract review meetings, the Trustees received and relied upon materials that included, among other items: (i) information provided by Broadridge Financial Solutions, Inc. (“Broadridge”), an independent third party, on the investment performance of the Fund for various time periods ended December 31, 2021 and the investment performance of a group of funds with substantially similar investment classifications/objectives (the “Broadridge performance universe”), (ii) information provided by Broadridge on the Fund’s advisory fees and other expenses and the advisory fees and other expenses of comparable funds identified by Broadridge as well as all other funds in the same investment classification/category (the “Broadridge expense group and universe”), (iii) information provided by MFS on the advisory fees of portfolios of other clients of MFS, including institutional separate accounts and other clients, (iv) information as to whether and to what extent applicable expense waivers, reimbursements or fee “breakpoints” are observed for the Fund, (v) information regarding MFS’ financial results and financial condition, including MFS’ and certain of its affiliates’ estimated profitability from services performed for the Fund and the MFS Funds as a whole, and compared to MFS’ institutional business, (vi) MFS’ views regarding the outlook for the mutual fund industry and the strategic business plans of MFS, (vii) descriptions of various functions performed by MFS for the Funds, such as compliance monitoring and portfolio trading practices, and (viii) information regarding the overall organization of MFS, including information about MFS’ senior management and other personnel providing investment advisory, administrative and other services to the Fund and the other MFS Funds. The comparative performance, fee and expense information prepared and provided by Broadridge was not independently verified and the independent Trustees did not independently verify any information provided to them by MFS.
The Trustees’ conclusion as to the continuation of the investment advisory agreement was based on a comprehensive consideration of all information provided to the Trustees and not the result of any single factor. Some of the factors that figured particularly in the Trustees’ deliberations are described below, although individual Trustees may have evaluated the information presented differently from one another, giving different weights to various factors. It is also important to recognize that the fee arrangements for the Fund and other MFS Funds are the result of years of review and discussion between the independent Trustees and MFS, that certain aspects of such arrangements may receive greater scrutiny in some years than in others, and that the Trustees’ conclusions may be based, in part, on their consideration of these same arrangements during the course of the year and in prior years.
Based on information provided by Broadridge and MFS, the Trustees reviewed the Fund’s total return investment performance as well as the Broadridge performance universe over various time periods. The Trustees placed particular emphasis on the total return performance of the Fund’s Initial Class shares in comparison to the performance of funds in its Broadridge performance universe over the five-year period ended December 31, 2021, which the Trustees believed was a long enough period to reflect differing market conditions. The total return performance of the Fund’s Initial Class shares was in the 1st quintile relative to the other funds in the universe for this five-year period (the 1st quintile being the best performers and the 5th quintile being the worst performers). The total return performance of the Fund’s Initial Class shares was in the 2nd quintile for each of the one- and three-year periods ended December 31, 2021 relative to the Broadridge performance universe. Because of the passage of time, these performance results may differ from the performance results for more recent periods, including those shown elsewhere in this report.
In the course of their deliberations, the Trustees took into account information provided by MFS in connection with the contract review meetings, as well as during investment review meetings conducted with portfolio management personnel during the course of the year regarding the Fund’s performance. After reviewing these and related factors, the Trustees concluded, within the context of their overall conclusions regarding the investment advisory agreement, that they were satisfied with MFS’ responses and efforts relating to investment performance.
MFS Limited Maturity Portfolio
Board Review of Investment Advisory Agreement - continued
In assessing the reasonableness of the Fund’s advisory fee, the Trustees considered, among other information, the Fund’s advisory fee and the total expense ratio of the Fund’s Initial Class shares as a percentage of average daily net assets and the advisory fee and total expense ratios of the Broadridge expense group based on information provided by Broadridge. The Trustees considered that, according to the data provided by Broadridge (which takes into account any fee reductions or expense limitations that were in effect during the Fund’s last fiscal year), the Fund’s effective advisory fee rate and total expense ratio were each approximately at the Broadridge expense group median.
The Trustees also considered the advisory fees charged by MFS to any institutional separate accounts advised by MFS (“separate accounts”) and unaffiliated investment companies for which MFS serves as subadviser (“subadvised funds”) that have comparable investment strategies to the Fund, if any. In comparing these fees, the Trustees considered information provided by MFS as to the generally broader scope of services provided by MFS to the Fund, as well as the more extensive regulatory burdens imposed on MFS in managing the Fund, in comparison to separate accounts and subadvised funds. The Trustees also considered the higher demands placed on MFS’ investment personnel and trading infrastructure as a result of the daily cash in-flows and out-flows of the Fund in comparison to separate accounts.
The Trustees also considered whether the Fund may benefit from any economies of scale in the management of the Fund in the event of growth in assets of the Fund and/or growth in assets of the MFS Funds as a whole. They noted that the Fund’s advisory fee rate schedule is not subject to any breakpoints. Taking into account that the Fund’s effective advisory fee rate was approximately at the Broadridge expense group median described above, the Trustees determined not to recommend any advisory fee breakpoints for the Fund at this time. The Trustees also noted that MFS has agreed in writing to waive a portion of the management fees of certain MFS Funds, including the Fund, if the total combined assets of certain funds within the MFS Funds’ complex increase above agreed upon thresholds (the “group fee waiver”), enabling the Fund’s shareholders to share in the benefits from any economies of scale at the complex level. The group fee waiver is reviewed and renewed annually between the Board and MFS. The Trustees concluded that the group fee waiver was sufficient to allow the Fund to benefit from economies of scale as its assets and overall complex assets grow.
The Trustees also considered information prepared by MFS relating to MFS’ costs and profits with respect to the Fund, the MFS Funds considered as a group, and other investment companies and accounts advised by MFS, as well as MFS’ methodologies used to determine and allocate its costs to the MFS Funds, the Fund and other accounts and products for purposes of estimating profitability.
After reviewing these and other factors described herein, the Trustees concluded, within the context of their overall conclusions regarding the investment advisory agreement, that the advisory fees charged to the Fund represent reasonable compensation in light of the services being provided by MFS to the Fund.
In addition, the Trustees considered MFS’ resources and related efforts to continue to retain, attract and motivate capable personnel to serve the Fund. The Trustees also considered current and developing conditions in the financial services industry, including the presence of large and well-capitalized companies which are spending, and appear to be prepared to continue to spend, substantial sums to engage personnel and to provide services to competing investment companies. In this regard, the Trustees also considered the financial resources of MFS and its ultimate parent, Sun Life Financial Inc. The Trustees also considered the advantages and possible disadvantages to the Fund of having an adviser that also serves other investment companies as well as other accounts.
The Trustees also considered the nature, quality, cost, and extent of administrative, transfer agency, and distribution services provided to the Fund by MFS and its affiliates under agreements and plans other than the investment advisory agreement, including any 12b-1 fees the Fund pays to MFS Fund Distributors, Inc., an affiliate of MFS. The Trustees also considered the nature, extent and quality of certain other services MFS performs or arranges for on the Fund’s behalf, which may include securities lending programs, directed expense payment programs, class action recovery programs, and MFS’ interaction with third-party service providers, principally custodians and sub-custodians. The Trustees concluded that the various non-advisory services provided by MFS and its affiliates on behalf of the Fund were satisfactory.
The Trustees considered so-called “fall-out benefits” to MFS such as reputational value derived from serving as investment manager to the MFS Funds. The Trustees also considered that MFS discontinued its historic practice of obtaining investment research from portfolio brokerage commissions paid by certain MFS Funds effective January 2018, and directly pays or voluntarily reimburses a Fund, if applicable, for the costs of external research acquired through the use of the Fund’s portfolio brokerage commissions.
Based on their evaluation of factors that they deemed to be material, including those factors described above, the Board of Trustees, including the independent Trustees, concluded that the Fund’s investment advisory agreement with MFS should be continued for an additional one-year period, commencing August 1, 2022.
MFS Limited Maturity Portfolio
Proxy Voting Policies and Information
MFS votes proxies on behalf of the fund pursuant to proxy voting policies and procedures that are available without charge, upon request, by calling 1-800-225-2606, by visiting mfs.com/proxyvoting, or by visiting the SEC’s Web site at http://www.sec.gov.
Information regarding how the fund voted proxies relating to portfolio securities during the most recent twelve-month period ended June 30 is available by August 31 of each year without charge by visiting mfs.com/proxyvoting, or by visiting the SEC’s Web site at http://www.sec.gov.
Quarterly Portfolio Disclosure
The fund files a complete schedule of portfolio holdings with the SEC for the first and third quarters of each fiscal year as an exhibit to its reports on Form N-PORT. The fund’s Form N-PORT reports are available on the SEC’s Web site at http://www.sec.gov. A shareholder can obtain the portfolio holdings report for the first and third quarters of the fund's fiscal year at mfs.com/vit3 by choosing the fund's name and then scrolling to the “Resources” section and clicking on the “Prospectus and Reports” tab.
FURTHER INFORMATION
From time to time, MFS may post important information about the fund or the MFS Funds on the MFS Web site (mfs.com). This information is available at https://www.mfs.com/announcements or at mfs.com/vit3 by choosing the fund's name and then scrolling to the “Resources” section and clicking on the “Announcements” tab, if any.
Information About Fund Contracts and Legal Claims
The fund has entered into contractual arrangements with an investment adviser, administrator, distributor, shareholder servicing agent, and custodian who each provide services to the fund. Unless expressly stated otherwise, shareholders are not parties to, or intended beneficiaries of these contractual arrangements, and these contractual arrangements are not intended to create any shareholder right to enforce them against the service providers or to seek any remedy under them against the service providers, either directly or on behalf of the fund.
Under the Trust’s By-Laws and Declaration of Trust, any claims asserted against or on behalf of the MFS Funds, including claims against Trustees and Officers, must be brought in state and federal courts located within the Commonwealth of Massachusetts.
Federal Tax Information (unaudited)
The following information is provided pursuant to provisions of the Internal Revenue Code.
The fund designates $1,524,000 as capital gain dividends paid during the fiscal year.
The fund intends to pass through the maximum amount allowable as Section 163(j) Interest Dividends as defined in Treasury Regulation §1.163(j)-1(b).
| FACTS | WHAT DOES MFS DO WITH YOUR PERSONAL INFORMATION? |
| Why? | Financial companies choose how they share your personal information. Federal law gives consumers the right to limit some but not all sharing. Federal law also requires us to tell you how we collect, share, and protect your personal information. Please read this notice carefully to understand what we do. |
| What? | The types of personal information we collect and share depend on the product or service you have with us. This information can include: |
| • Social Security number and account balances |
| • Account transactions and transaction history |
| • Checking account information and wire transfer instructions |
| When you are no longer our customer, we continue to share your information as described in this notice. |
| How? | All financial companies need to share customers' personal information to run their everyday business. In the section below, we list the reasons financial companies can share their customers' personal information; the reasons MFS chooses to share; and whether you can limit this sharing. |
Reasons we can share your
personal information | Does MFS share? | Can you limit
this sharing? |
For our everyday business purposes –
such as to process your transactions, maintain your
account(s), respond to court orders and legal
investigations, or report to credit bureaus | Yes | No |
For our marketing purposes –
to offer our products and services to you | No | We don't share |
For joint marketing with other
financial companies | No | We don't share |
For our affiliates' everyday business purposes –
information about your transactions and experiences | No | We don't share |
For our affiliates' everyday business purposes –
information about your creditworthiness | No | We don't share |
| For nonaffiliates to market to you | No | We don't share |
| Questions? | Call 800-225-2606 or go to mfs.com. |
| Who we are |
| Who is providing this notice? | MFS Funds, MFS Investment Management, MFS Institutional Advisors, Inc., and MFS Heritage Trust Company. |
| What we do |
How does MFS
protect my personal
information? | To protect your personal information from unauthorized access and use, we use security measures that comply with federal law. These measures include procedural, electronic, and physical safeguards for the protection of the personal information we collect about you. |
How does MFS
collect my personal
information? | We collect your personal information, for example, when you |
| • open an account or provide account information |
| • direct us to buy securities or direct us to sell your securities |
| • make a wire transfer |
| We also collect your personal information from others, such as credit bureaus, affiliates, or other companies. |
| Why can't I limit all sharing? | Federal law gives you the right to limit only |
| • sharing for affiliates' everyday business purposes – information about your creditworthiness |
| • affiliates from using your information to market to you |
| • sharing for nonaffiliates to market to you |
| State laws and individual companies may give you additional rights to limit sharing. |
| Definitions |
| Affiliates | Companies related by common ownership or control. They can be financial and nonfinancial companies. |
| • MFS does not share personal information with affiliates, except for everyday business purposes as described on page one of this notice. |
| Nonaffiliates | Companies not related by common ownership or control. They can be financial and nonfinancial companies. |
| • MFS does not share with nonaffiliates so they can market to you. |
| Joint marketing | A formal agreement between nonaffiliated financial companies that together market financial products or services to you. |
| • MFS doesn't jointly market. |
| Other important information |
| If you own an MFS product or receive an MFS service in the name of a third party such as a bank or broker-dealer, their privacy policy may apply to you instead of ours. |
Annual Report
December 31, 2022
MFS® Mid Cap Value Portfolio
MFS® Variable Insurance Trust III
MFS® Mid Cap Value Portfolio
| 1 |
| 2 |
| 3 |
| 5 |
| 7 |
| 8 |
| 14 |
| 15 |
| 16 |
| 17 |
| 19 |
| 25 |
| 26 |
| 29 |
| 31 |
| 31 |
| 31 |
| 31 |
| 31 |
| 32 |
The report is prepared for the general information of shareholders. It is authorized for distribution to prospective investors only when preceded or accompanied by a current prospectus.
NOT FDIC INSURED • MAY LOSE VALUE • NO BANK OR CREDIT UNION GUARANTEE •
NOT A DEPOSIT • NOT INSURED BY ANY FEDERAL GOVERNMENT AGENCY OR NCUA/NCUSIF
MFS Mid Cap Value Portfolio
LETTER FROM THE CHAIR AND CEO
Dear Shareholders:
Signs of peaking inflation, hopes that monetary policy tightening cycles may be nearing an end and a rapid reopening of China’s economy in late-2022 and early-2023 have combined to bolster investor sentiment in recent months. Markets have largely adjusted to the challenges posed by Russia’s invasion of Ukraine, thanks in part to mild European winter weather which has alleviated concerns over potential shortages of natural gas. Resilient labor markets in much of the developed world have further contributed to a brighter-than-expected economic backdrop. However, many investors are mindful that the lagged effects of ongoing policy tightening have yet to work their way through the global economy.
Tighter global financial conditions have been a particular headwind for richly valued growth equities and interest rate-sensitive parts of the economy, such as housing. Over the near term, companies may face a challenging earnings backdrop as they are forced to absorb higher input and labor costs at a time of dwindling pricing power. For fixed income, the rise in interest rates has made bonds more attractive than they have been in years, which may provide balance to an overall portfolio.
During times of market transition, it is important to have a deep understanding of company fundamentals, and we have built our unique global research platform to do just that.
At MFS®, we put our clients’ assets to work responsibly by carefully navigating increasingly complex global capital markets. Our investment team is guided by a commitment to long-term fundamental investing. Our global investment platform — combining collective expertise, long-term discipline, and thoughtful risk management — seeks to uncover what we believe are the best, most durable investment ideas in markets around the world, enabling us to potentially create value for investors.
Respectfully,
Michael W. Roberge
Chair and Chief Executive Officer
MFS Investment Management
February 15, 2023
The opinions expressed in this letter are subject to change and may not be relied upon for investment advice. No forecasts can be guaranteed.
MFS Mid Cap Value Portfolio
Top ten holdings
| PG&E Corp. | 1.5% |
| Hartford Financial Services Group, Inc. | 1.4% |
| Johnson Controls International PLC | 1.3% |
| KBR, Inc. | 1.3% |
| LKQ Corp. | 1.3% |
| Hess Corp. | 1.2% |
| Eaton Corp. PLC | 1.2% |
| Arthur J. Gallagher & Co. | 1.1% |
| AES Corp. | 1.1% |
| Raymond James Financial, Inc. | 1.1% |
GICS equity sectors (g)
| Financials | 19.1% |
| Industrials | 16.7% |
| Consumer Discretionary | 10.7% |
| Materials | 9.5% |
| Information Technology | 8.3% |
| Utilities | 8.2% |
| Health Care | 7.4% |
| Energy | 7.3% |
| Real Estate | 6.8% |
| Consumer Staples | 4.4% |
| Communication Services | 1.0% |
| (g) | The Global Industry Classification Standard (GICS®) was developed by and/or is the exclusive property of MSCI, Inc. and S&P Global Market Intelligence Inc. (“S&P Global Market Intelligence”). GICS is a service mark of MSCI and S&P Global Market Intelligence and has been licensed for use by MFS. MFS has applied its own internal sector/industry classification methodology for equity securities and non-equity securities that are unclassified by GICS. |
Cash & Cash Equivalents includes any cash, investments in money market funds, short-term securities, and other assets less liabilities. Please see the Statement of Assets and Liabilities for additional information related to the fund’s cash position and other assets and liabilities.
Percentages are based on net assets as of December 31, 2022.
The portfolio is actively managed and current holdings may be different.
MFS Mid Cap Value Portfolio
Management Review
Summary of Results
For the twelve months ended December 31, 2022, Initial Class shares of the MFS Mid Cap Value Portfolio (fund) provided a total return of -8.79%, while Service Class shares of the fund provided a total return of -9.00%. These compare with a return of -12.03% over the same period for the fund’s benchmark, the Russell Midcap® Value Index.
Market Environment
During the reporting period, markets continued to grapple with the strongest global inflationary pressures in decades along with signs of slowing economic growth. Intermittent coronavirus flareups, particularly in China, where home-grown vaccines have proved less effective than elsewhere, kept supply chains stretched for a considerable period. At the same time, the reopening of the economy in the parts of the world where the virus has been better contained has led to a shift in consumption patterns in favor of services, straining already tight labor markets in most developed economies, while reducing demand for manufactured goods, primarily from Asia. As a result of Russia’s invasion of Ukraine, geopolitical considerations, such as sanctions and trade bans, have resulted in additional supply chain disruptions and volatile global energy prices. Taken together, these factors have contributed to market volatility.
The ripple effects from the Russian invasion further complicated the mission central banks must undertake to rein in surging inflation. Energy shocks have historically resulted in global growth slowdowns, if not pullbacks, so policymakers will find themselves in the difficult position of trying to restrain inflation without tipping economies into recession. Despite the challenging macroeconomic and geopolitical environment, policymakers remained focused on controlling inflation, although investors appeared to have expected varying degrees of action from the central banks. The Fed has been among the most aggressive developed market central banks, tightening policy at the fastest rate in decades, although it slowed its hiking pace at the end of the period, as did the European Central Bank. After remaining on the monetary sidelines for much of the period, the Bank of Japan widened its Yield Curve Control band, capping the yield on its 10-year bond at 0.5%, up from 0.25%, an action investors interpreted as a first step toward monetary policy normalization.
Against an environment of still-tight labor markets, tighter global financial conditions and volatile materials prices, investor anxiety appeared to have increased over the potential that corporate profit margins may be past peak for this cycle. That said, tentative signs that supply chain bottlenecks (particularly semiconductors) may be moderating, the easing of COVID restrictions in China, low levels of unemployment across developed markets and hopes that inflation levels may be near a peak were supportive factors for the macroeconomic backdrop.
Contributors to Performance
The combination of favorable stock selection and underweight positions in both the information technology and real estate sectors contributed to the fund’s performance relative to the Russell Midcap® Value Index. There were no individual stocks within either sector, either in the fund or in the benchmark, that were among the fund's largest relative contributors for the reporting period.
Elsewhere, the fund's overweight positions in global integrated energy company Hess, utility company PG&E, oil and gas producer Devon Energy, independent oil and gas exploration and production company Pioneer Natural Resources, engineering, procurement, and construction company KBR, oil and natural gas exploration and development firm Diamondback Energy, reinsurer Everest Reinsurance and integrated electric power company AES aided relative performance. The stock price of Hess climbed during the reporting period as the company posted strong production volumes at its Bakken and Guyana oil and gas fields amid elevated energy commodity prices. The timing of the fund’s ownership in shares of natural gas services provider Targa Resources further supported relative returns.
The fund’s cash and/or cash equivalents position during the period was also a contributor to relative performance. Under normal market conditions, the fund strives to be fully invested and generally holds cash to buy new holdings and to provide liquidity. In a period when equity markets fell, as measured by the fund’s benchmark, holding cash helped performance versus the benchmark, which has no cash position.
Detractors from Performance
Stock selection within the health care sector detracted from the fund’s relative performance, led by the fund’s holdings of clinical research provider ICON(b) (Ireland). Stocks in other sectors that held back relative results included the timing of the fund’s ownership in shares of automatic identification and data capture products manufacturer Zebra Technologies. The stock price of Zebra Technologies came under pressure due to the challenging macroeconomic backdrop and lingering supply chain constraints across print and mobile computing. Additionally, margin growth was revised downward over elevated costs and foreign exchange headwinds. Not owning shares of strong-performing oil and gas exploration and production company Occidental Petroleum, fuel storage and transportation firm Phillips 66 and independent petroleum products company Marathon Petroleum also detracted from relative performance. The fund’s overweight positions in power and hand tools manufacturer Stanley Black & Decker, banking and financial services company SVB Financial Group, commercial banking service provider Signature Bank, cable company Liberty
MFS Mid Cap Value Portfolio
Management Review - continued
Broadband and self-storage real estate investment trust Life Storage further weakened relative returns. The stock price of Stanley Black & Decker declined as the company reported earnings results below consensus estimates, driven by weaker tools and storage margins. The company also lowered its revenue guidance for the remainder of the year due to weaker-than-expected consumer demand in its tools & outdoor segment.
Respectfully,
Portfolio Manager(s)
Richard Offen, Kevin Schmitz, and Brooks Taylor
| (b) | Security is not a benchmark constituent. |
The views expressed in this report are those of the portfolio manager(s) only through the end of the period of the report as stated on the cover and do not necessarily reflect the views of MFS or any other person in the MFS organization. These views are subject to change at any time based on market or other conditions, and MFS disclaims any responsibility to update such views. These views may not be relied upon as investment advice or an indication of trading intent on behalf of any MFS portfolio. References to specific securities are not recommendations of such securities, and may not be representative of any MFS portfolio’s current or future investments.
MFS Mid Cap Value Portfolio
Performance Summary Through 12/31/22
The following chart illustrates the historical performance of the fund in comparison to its benchmark(s). Benchmarks are unmanaged and may not be invested in directly. Benchmark returns do not reflect any fees or expenses. The performance of other share classes will be greater than or less than that of the class depicted below. (See Notes to Performance Summary.)
Performance data shown represents past performance and is no guarantee of future results. Investment return and principal value fluctuate so your shares, when sold, may be worth more or less than the original cost; current performance may be lower or higher than quoted. The performance shown does not reflect the deduction of taxes, if any, that a shareholder would pay on fund distributions or the redemption of fund shares. The returns for the fund shown also do not reflect the deduction of expenses associated with variable products, such as mortality and expense risk charges, separate account charges, and sales charges imposed by the insurance company separate accounts. Such expenses would reduce the overall returns shown.
Growth of a Hypothetical $10,000 Investment
Total Returns through 12/31/22
Average annual total returns
| Share Class | Class Inception Date | 1-yr | 5-yr | 10-yr |
| Initial Class | 3/07/08 | (8.79)% | 7.58% | 10.86% |
| Service Class | 3/07/08 | (9.00)% | 7.32% | 10.59% |
Comparative benchmark(s)
| Russell Midcap® Value Index (f) | (12.03)% | 5.72% | 10.11% |
| (f) | Source: FactSet Research Systems Inc. |
Benchmark Definition(s)
Russell Midcap® Value Index(h) - constructed to provide a comprehensive barometer for value securities in the mid-cap segment of the U.S. equity universe. Companies in this index generally have lower price-to-book ratios and lower forecasted growth values.
It is not possible to invest directly in an index.
| (h) | Frank Russell Company (“Russell”) is the source and owner of the trademarks, service marks, and copyrights related to the Russell Indexes. Russell® is a trademark of Frank Russell Company. Neither Russell nor its licensors accept any liability for any errors or omissions in the Russell Indexes and/or Russell ratings or underlying data and no party may rely on any Russell Indexes and/or Russell ratings and/or underlying data contained in this document. No further distribution of Russell Data is permitted without Russell's express written consent. Russell does not promote, sponsor, or endorse the content of this document. |
MFS Mid Cap Value Portfolio
Performance Summary – continued
Notes to Performance Summary
Average annual total return represents the average annual change in value for each share class for the periods presented.
Performance results reflect any applicable expense subsidies and waivers in effect during the periods shown. Without such subsidies and waivers the fund's performance results would be less favorable. Please see the prospectus and financial statements for complete details. All results are historical and assume the reinvestment of any dividends and capital gains distributions.
Performance results do not include adjustments made for financial reporting purposes in accordance with U.S. generally accepted accounting principles and may differ from amounts reported in the financial highlights.
From time to time the fund may receive proceeds from litigation settlements, without which performance would be lower.
MFS Mid Cap Value Portfolio
Expense Table
Fund expenses borne by the shareholders during the period,
July 1, 2022 through December 31, 2022
As a shareholder of the fund, you incur ongoing costs, including management fees; distribution and/or service (12b-1) fees; and other fund expenses. This example is intended to help you understand your ongoing costs (in dollars) of investing in the fund and to compare these costs with the ongoing costs of investing in other mutual funds.
The example is based on an investment of $1,000 invested at the beginning of the period and held for the entire period July 1, 2022 through December 31, 2022.
Actual Expenses
The first line for each share class in the following table provides information about actual account values and actual expenses. You may use the information in this line, together with the amount you invested, to estimate the expenses that you paid over the period. Simply divide your account value by $1,000 (for example, an $8,600 account value divided by $1,000 = 8.6), then multiply the result by the number in the first line under the heading entitled “Expenses Paid During Period” to estimate the expenses you paid on your account during this period.
Hypothetical Example for Comparison Purposes
The second line for each share class in the following table provides information about hypothetical account values and hypothetical expenses based on the fund’s actual expense ratio and an assumed rate of return of 5% per year before expenses, which is not the fund’s actual return. The hypothetical account values and expenses may not be used to estimate the actual ending account balance or expenses you paid for the period. You may use this information to compare the ongoing costs of investing in the fund and other funds. To do so, compare this 5% hypothetical example with the 5% hypothetical examples that appear in the shareholder reports of the other funds.
Please note that the expenses shown in the table are meant to highlight the fund's ongoing costs only and do not take into account the fees and expenses imposed under the variable contracts through which your investment in the fund is made. Therefore, the second line for each share class in the table is useful in comparing ongoing costs associated with an investment in vehicles (such as the fund) which fund benefits under variable annuity and variable life insurance contracts and to qualified pension and retirement plans only, and will not help you determine the relative total costs of investing in the fund through variable annuity and variable life insurance contracts. If the fees and expenses imposed under the variable contracts were included, your costs would have been higher.
Share
Class | | Annualized
Expense
Ratio | Beginning
Account Value
7/01/22 | Ending
Account Value
12/31/22 | Expenses
Paid During
Period (p)
7/01/22-12/31/22 |
| Initial Class | Actual | 0.79% | $1,000.00 | $1,067.06 | $4.12 |
| Hypothetical (h) | 0.79% | $1,000.00 | $1,021.22 | $4.02 |
| Service Class | Actual | 1.04% | $1,000.00 | $1,065.66 | $5.41 |
| Hypothetical (h) | 1.04% | $1,000.00 | $1,019.96 | $5.30 |
| (h) | 5% class return per year before expenses. |
| (p) | “Expenses Paid During Period” are equal to each class's annualized expense ratio, as shown above, multiplied by the average account value over the period, multiplied by 184/365 (to reflect the one-half year period). |
MFS Mid Cap Value Portfolio
Portfolio of Investments − 12/31/22
The Portfolio of Investments is a complete list of all securities owned by your fund. It is categorized by broad-based asset classes.
| Issuer | | | Shares/Par | Value ($) |
| Common Stocks – 99.0% |
| Aerospace & Defense – 3.9% | |
| Howmet Aerospace, Inc. | | 100,911 | $ 3,976,902 |
| KBR, Inc. | | 109,712 | 5,792,794 |
| L3Harris Technologies, Inc. | | 14,825 | 3,086,713 |
| Leidos Holdings, Inc. | | 42,648 | 4,486,143 |
| | | | | $17,342,552 |
| Airlines – 0.8% | |
| Alaska Air Group, Inc. (a) | | 36,761 | $ 1,578,518 |
| Delta Air Lines, Inc. (a) | | 65,477 | 2,151,574 |
| | | | | $3,730,092 |
| Apparel Manufacturers – 1.3% | |
| PVH Corp. | | 35,603 | $ 2,513,216 |
| Skechers USA, Inc., “A” (a) | | 77,456 | 3,249,279 |
| | | | | $5,762,495 |
| Automotive – 2.2% | |
| Aptiv PLC (a) | | 21,368 | $ 1,990,002 |
| Lear Corp. | | 19,455 | 2,412,809 |
| LKQ Corp. | | 105,329 | 5,625,622 |
| | | | | $10,028,433 |
| Brokerage & Asset Managers – 3.0% | |
| Cboe Global Markets, Inc. | | 23,225 | $ 2,914,041 |
| Evercore Partners, Inc. | | 20,349 | 2,219,669 |
| Invesco Ltd. | | 96,344 | 1,733,229 |
| Raymond James Financial, Inc. | | 45,614 | 4,873,856 |
| TPG, Inc. | | 57,109 | 1,589,343 |
| | | | | $13,330,138 |
| Business Services – 1.5% | |
| Amdocs Ltd. | | 42,868 | $ 3,896,701 |
| Global Payments, Inc. | | 26,765 | 2,658,300 |
| | | | | $6,555,001 |
| Chemicals – 0.9% | |
| Eastman Chemical Co. | | 49,107 | $ 3,999,274 |
| Computer Software – 1.2% | |
| Black Knight, Inc. (a) | | 29,626 | $ 1,829,405 |
| Check Point Software Technologies Ltd. (a) | | 13,112 | 1,654,210 |
| Dun & Bradstreet Holdings, Inc. | | 134,822 | 1,652,918 |
| | | | | $5,136,533 |
| Computer Software - Systems – 1.3% | |
| Seagate Technology Holdings PLC | | 28,742 | $ 1,512,117 |
| Verint Systems, Inc. (a) | | 32,783 | 1,189,367 |
| Zebra Technologies Corp., “A” (a) | | 11,209 | 2,874,100 |
| | | | | $5,575,584 |
MFS Mid Cap Value Portfolio
Portfolio of Investments – continued
| Issuer | | | Shares/Par | Value ($) |
| Common Stocks – continued |
| Construction – 4.0% | |
| Essex Property Trust, Inc., REIT | | 9,440 | $ 2,000,525 |
| Fortune Brands Innovations, Inc. | | 32,500 | 1,856,075 |
| Masco Corp. | | 59,769 | 2,789,419 |
| Mid-America Apartment Communities, Inc., REIT | | 11,936 | 1,873,833 |
| Stanley Black & Decker, Inc. | | 29,391 | 2,207,852 |
| Toll Brothers, Inc. | | 84,107 | 4,198,621 |
| Vulcan Materials Co. | | 15,892 | 2,782,848 |
| | | | | $17,709,173 |
| Consumer Products – 1.2% | |
| International Flavors & Fragrances, Inc. | | 31,895 | $ 3,343,872 |
| Newell Brands, Inc. | | 159,639 | 2,088,078 |
| | | | | $5,431,950 |
| Containers – 2.7% | |
| Avery Dennison Corp. | | 13,773 | $ 2,492,913 |
| Crown Holdings, Inc. | | 30,299 | 2,490,881 |
| Graphic Packaging Holding Co. | | 173,925 | 3,869,831 |
| WestRock Co. | | 95,950 | 3,373,602 |
| | | | | $12,227,227 |
| Electrical Equipment – 3.2% | |
| Berry Global, Inc. | | 56,129 | $ 3,391,875 |
| Johnson Controls International PLC | | 90,552 | 5,795,328 |
| Sensata Technologies Holding PLC | | 63,078 | 2,547,090 |
| TE Connectivity Ltd. | | 24,004 | 2,755,659 |
| | | | | $14,489,952 |
| Electronics – 3.4% | |
| Corning, Inc. | | 86,444 | $ 2,761,021 |
| Flex Ltd. (a) | | 136,997 | 2,939,956 |
| Marvell Technology, Inc. | | 72,051 | 2,668,769 |
| NXP Semiconductors N.V. | | 22,261 | 3,517,906 |
| ON Semiconductor Corp. (a) | | 51,194 | 3,192,970 |
| | | | | $15,080,622 |
| Energy - Independent – 5.3% | |
| Chesapeake Energy Corp. | | 26,307 | $ 2,482,591 |
| Devon Energy Corp. | | 65,263 | 4,014,327 |
| Diamondback Energy, Inc. | | 27,139 | 3,712,072 |
| Hess Corp. | | 38,491 | 5,458,794 |
| Pioneer Natural Resources Co. | | 20,566 | 4,697,069 |
| Valero Energy Corp. | | 26,581 | 3,372,066 |
| | | | | $23,736,919 |
| Energy - Renewables – 1.1% | |
| AES Corp. | | 172,747 | $ 4,968,204 |
| Engineering - Construction – 0.6% | |
| Quanta Services, Inc. | | 18,306 | $ 2,608,605 |
| Food & Beverages – 2.9% | |
| Coca-Cola Europacific Partners PLC | | 51,458 | $ 2,846,657 |
| Ingredion, Inc. | | 44,574 | 4,365,132 |
| J.M. Smucker Co. | | 20,368 | 3,227,513 |
MFS Mid Cap Value Portfolio
Portfolio of Investments – continued
| Issuer | | | Shares/Par | Value ($) |
| Common Stocks – continued |
| Food & Beverages – continued | |
| Kellogg Co. | | 38,000 | $ 2,707,120 |
| | | | | $13,146,422 |
| Food & Drug Stores – 0.6% | |
| Albertsons Cos., Inc., “A” | | 118,422 | $ 2,456,072 |
| Gaming & Lodging – 1.2% | |
| Hyatt Hotels Corp. (a) | | 22,833 | $ 2,065,245 |
| International Game Technology PLC | | 140,885 | 3,195,272 |
| | | | | $5,260,517 |
| General Merchandise – 0.7% | |
| Dollar Tree, Inc. (a) | | 22,425 | $ 3,171,792 |
| Insurance – 8.9% | |
| American International Group, Inc. | | 57,301 | $ 3,623,715 |
| Arthur J. Gallagher & Co. | | 26,450 | 4,986,883 |
| Assurant, Inc. | | 32,911 | 4,115,850 |
| Cincinnati Financial Corp. | | 19,447 | 1,991,178 |
| Equitable Holdings, Inc. | | 150,169 | 4,309,850 |
| Everest Re Group Ltd. | | 14,199 | 4,703,703 |
| Hanover Insurance Group, Inc. | | 13,136 | 1,775,068 |
| Hartford Financial Services Group, Inc. | | 85,343 | 6,471,560 |
| Voya Financial, Inc. | | 53,488 | 3,288,977 |
| Willis Towers Watson PLC | | 17,960 | 4,392,657 |
| | | | | $39,659,441 |
| Leisure & Toys – 1.8% | |
| Brunswick Corp. | | 45,572 | $ 3,284,830 |
| Electronic Arts, Inc. | | 19,343 | 2,363,328 |
| Mattel, Inc. (a) | | 136,268 | 2,431,021 |
| | | | | $8,079,179 |
| Machinery & Tools – 5.1% | |
| Eaton Corp. PLC | | 33,795 | $ 5,304,125 |
| Ingersoll Rand, Inc. | | 57,042 | 2,980,445 |
| ITT, Inc. | | 31,931 | 2,589,604 |
| PACCAR, Inc. | | 36,988 | 3,660,702 |
| Regal Rexnord Corp. | | 30,504 | 3,659,870 |
| Wabtec Corp. | | 44,905 | 4,481,968 |
| | | | | $22,676,714 |
| Major Banks – 1.1% | |
| Comerica, Inc. | | 37,356 | $ 2,497,248 |
| State Street Corp. | | 31,126 | 2,414,444 |
| | | | | $4,911,692 |
| Medical & Health Technology & Services – 3.3% | |
| AmerisourceBergen Corp. | | 27,600 | $ 4,573,596 |
| ICON PLC (a) | | 13,465 | 2,615,576 |
| Laboratory Corp. of America Holdings | | 12,985 | 3,057,708 |
| Syneos Health, Inc. (a) | | 23,050 | 845,474 |
| Universal Health Services, Inc. | | 26,057 | 3,671,171 |
| | | | | $14,763,525 |
MFS Mid Cap Value Portfolio
Portfolio of Investments – continued
| Issuer | | | Shares/Par | Value ($) |
| Common Stocks – continued |
| Medical Equipment – 3.6% | |
| Agilent Technologies, Inc. | | 19,023 | $ 2,846,792 |
| Dentsply Sirona, Inc. | | 72,886 | 2,320,690 |
| Hologic, Inc. (a) | | 29,027 | 2,171,510 |
| Maravai Lifesciences Holdings, Inc., “A” (a) | | 49,607 | 709,876 |
| PerkinElmer, Inc. | | 23,038 | 3,230,388 |
| Teleflex, Inc. | | 6,060 | 1,512,758 |
| Zimmer Biomet Holdings, Inc. | | 27,410 | 3,494,775 |
| | | | | $16,286,789 |
| Natural Gas - Distribution – 0.4% | |
| Atmos Energy Corp. | | 16,034 | $ 1,796,930 |
| Natural Gas - Pipeline – 1.3% | |
| Plains GP Holdings LP | | 199,135 | $ 2,477,239 |
| Targa Resources Corp. | | 45,742 | 3,362,037 |
| | | | | $5,839,276 |
| Network & Telecom – 0.8% | |
| Motorola Solutions, Inc. | | 13,689 | $ 3,527,792 |
| Oil Services – 0.6% | |
| Halliburton Co. | | 72,867 | $ 2,867,316 |
| Other Banks & Diversified Financials – 6.2% | |
| Discover Financial Services | | 19,337 | $ 1,891,739 |
| East West Bancorp, Inc. | | 32,054 | 2,112,359 |
| Element Fleet Management Corp. (l) | | 47,515 | 647,453 |
| M&T Bank Corp. | | 21,798 | 3,162,018 |
| Northern Trust Corp. | | 30,952 | 2,738,943 |
| Prosperity Bancshares, Inc. | | 34,475 | 2,505,643 |
| Signature Bank | | 15,097 | 1,739,476 |
| SLM Corp. | | 221,347 | 3,674,360 |
| SVB Financial Group (a) | | 12,059 | 2,775,258 |
| Umpqua Holdings Corp. | | 171,773 | 3,066,148 |
| Zions Bancorp NA | | 67,187 | 3,302,913 |
| | | | | $27,616,310 |
| Pharmaceuticals – 0.4% | |
| Organon & Co. | | 70,524 | $ 1,969,735 |
| Pollution Control – 1.0% | |
| GFL Environmental, Inc. | | 73,378 | $ 2,144,839 |
| Republic Services, Inc. | | 18,159 | 2,342,329 |
| | | | | $4,487,168 |
| Real Estate – 5.9% | |
| Brixmor Property Group, Inc., REIT | | 135,800 | $ 3,078,586 |
| Host Hotels & Resorts, Inc., REIT | | 149,999 | 2,407,484 |
| Jones Lang LaSalle, Inc. (a) | | 13,818 | 2,202,175 |
| Life Storage, Inc., REIT | | 39,581 | 3,898,729 |
| Spirit Realty Capital, Inc., REIT | | 49,382 | 1,971,823 |
| STAG Industrial, Inc., REIT | | 59,522 | 1,923,156 |
| Sun Communities, Inc., REIT | | 22,897 | 3,274,271 |
| VICI Properties, Inc., REIT | | 143,731 | 4,656,884 |
MFS Mid Cap Value Portfolio
Portfolio of Investments – continued
| Issuer | | | Shares/Par | Value ($) |
| Common Stocks – continued |
| Real Estate – continued | |
| W.P. Carey, Inc., REIT | | 39,027 | $ 3,049,960 |
| | | | | $26,463,068 |
| Restaurants – 2.2% | |
| Aramark | | 88,730 | $ 3,668,098 |
| Performance Food Group Co. (a) | | 39,266 | 2,292,742 |
| Wendy's Co. | | 162,416 | 3,675,474 |
| | | | | $9,636,314 |
| Specialty Chemicals – 3.7% | |
| Ashland, Inc. | | 29,023 | $ 3,120,843 |
| Axalta Coating Systems Ltd. (a) | | 121,356 | 3,090,937 |
| Celanese Corp. | | 23,120 | 2,363,789 |
| Corteva, Inc. | | 67,651 | 3,976,526 |
| DuPont de Nemours, Inc. | | 60,623 | 4,160,557 |
| | | | | $16,712,652 |
| Specialty Stores – 1.4% | |
| Builders FirstSource, Inc. (a) | | 26,440 | $ 1,715,427 |
| Ross Stores, Inc. | | 25,363 | 2,943,884 |
| Urban Outfitters, Inc. (a) | | 62,187 | 1,483,160 |
| | | | | $6,142,471 |
| Telecommunications - Wireless – 0.5% | |
| Liberty Broadband Corp. (a) | | 28,275 | $ 2,156,534 |
| Trucking – 1.1% | |
| Knight-Swift Transportation Holdings, Inc. | | 46,017 | $ 2,411,751 |
| RXO, Inc. (a) | | 40,517 | 696,892 |
| XPO Logistics, Inc. (a) | | 57,398 | 1,910,780 |
| | | | | $5,019,423 |
| Utilities - Electric Power – 6.7% | |
| CenterPoint Energy, Inc. | | 102,831 | $ 3,083,902 |
| CMS Energy Corp. | | 58,583 | 3,710,061 |
| Edison International | | 37,762 | 2,402,418 |
| Eversource Energy | | 38,209 | 3,203,443 |
| PG&E Corp. (a) | | 409,267 | 6,654,681 |
| Pinnacle West Capital Corp. | | 44,303 | 3,368,800 |
| Public Service Enterprise Group, Inc. | | 66,029 | 4,045,597 |
| Sempra Energy | | 23,652 | 3,655,180 |
| | | | | $30,124,082 |
| Total Common Stocks (Identified Cost, $319,926,381) | | $442,483,968 |
| Preferred Stocks – 0.4% |
| Consumer Products – 0.4% | | | | |
| Henkel AG & Co. KGaA (Identified Cost, $2,333,068) | | 26,550 | $ 1,847,896 |
| Investment Companies (h) – 0.6% |
| Money Market Funds – 0.6% | |
| MFS Institutional Money Market Portfolio, 4.02% (v) (Identified Cost, $2,632,814) | | | 2,632,546 | $ 2,633,336 |
MFS Mid Cap Value Portfolio
Portfolio of Investments – continued
| Issuer | | | Shares/Par | Value ($) |
| Collateral for Securities Loaned – 0.1% |
| State Street Navigator Securities Lending Government Money Market Portfolio, 4.33% (j) (Identified Cost, $134,876) | | | 134,876 | $ 134,876 |
| Other Assets, Less Liabilities – (0.1)% | | (270,840) |
| Net Assets – 100.0% | $446,829,236 |
| (a) | Non-income producing security. | | | |
| (h) | An affiliated issuer, which may be considered one in which the fund owns 5% or more of the outstanding voting securities, or a company which is under common control. At period end, the aggregate values of the fund's investments in affiliated issuers and in unaffiliated issuers were $2,633,336 and $444,466,740, respectively. | | | |
| (j) | The rate quoted is the annualized seven-day yield of the fund at period end. | | | |
| (l) | A portion of this security is on loan. See Note 2 for additional information. | | | |
| (v) | Affiliated issuer that is available only to investment companies managed by MFS. The rate quoted for the MFS Institutional Money Market Portfolio is the annualized seven-day yield of the fund at period end. | | | |
| The following abbreviations are used in this report and are defined: |
| REIT | Real Estate Investment Trust |
See Notes to Financial Statements
MFS Mid Cap Value Portfolio
| Financial Statements | Statement of Assets and Liabilities |
This statement represents your fund’s balance sheet, which details the assets and liabilities comprising the total value of the fund.
| At 12/31/22Assets | |
| Investments in unaffiliated issuers, at value, including $128,130 of securities on loan (identified cost, $322,394,325) | $444,466,740 |
| Investments in affiliated issuers, at value (identified cost, $2,632,814) | 2,633,336 |
| Receivables for | |
| Investments sold | 64,220 |
| Fund shares sold | 637,318 |
| Dividends | 1,744,115 |
| Other assets | 3,608 |
| Total assets | $449,549,337 |
| Liabilities | |
| Payables for | |
| Fund shares reacquired | $2,486,249 |
| Collateral for securities loaned, at value | 134,876 |
| Payable to affiliates | |
| Investment adviser | 27,154 |
| Administrative services fee | 595 |
| Shareholder servicing costs | 77 |
| Distribution and/or service fees | 4,103 |
| Accrued expenses and other liabilities | 67,047 |
| Total liabilities | $2,720,101 |
| Net assets | $446,829,236 |
| Net assets consist of | |
| Paid-in capital | $305,552,971 |
| Total distributable earnings (loss) | 141,276,265 |
| Net assets | $446,829,236 |
| Shares of beneficial interest outstanding | 48,928,876 |
| | Net assets | Shares
outstanding | Net asset value
per share |
| Initial Class | $246,813,314 | 26,852,274 | $9.19 |
| Service Class | 200,015,922 | 22,076,602 | 9.06 |
See Notes to Financial Statements
MFS Mid Cap Value Portfolio
| Financial Statements | Statement of Operations |
This statement describes how much your fund earned in investment income and accrued in expenses. It also describes any gains and/or losses generated by fund operations.
| Year ended 12/31/22 | |
| Net investment income (loss) | |
| Income | |
| Dividends | $11,326,605 |
| Dividends from affiliated issuers | 116,898 |
| Other | 17,839 |
| Income on securities loaned | 164 |
| Foreign taxes withheld | (27,529) |
| Total investment income | $11,433,977 |
| Expenses | |
| Management fee | $3,808,871 |
| Distribution and/or service fees | 557,011 |
| Shareholder servicing costs | 21,622 |
| Administrative services fee | 87,967 |
| Independent Trustees' compensation | 8,903 |
| Custodian fee | 22,957 |
| Shareholder communications | 8,326 |
| Audit and tax fees | 61,413 |
| Legal fees | 2,424 |
| Miscellaneous | 33,987 |
| Total expenses | $4,613,481 |
| Reduction of expenses by investment adviser | (70,570) |
| Net expenses | $4,542,911 |
| Net investment income (loss) | $6,891,066 |
| Realized and unrealized gain (loss) | |
| Realized gain (loss) (identified cost basis) | |
| Unaffiliated issuers | $15,132,220 |
| Affiliated issuers | 1,101 |
| Foreign currency | (1,885) |
| Net realized gain (loss) | $15,131,436 |
| Change in unrealized appreciation or depreciation | |
| Unaffiliated issuers | $(70,816,954) |
| Affiliated issuers | 522 |
| Translation of assets and liabilities in foreign currencies | (445) |
| Net unrealized gain (loss) | $(70,816,877) |
| Net realized and unrealized gain (loss) | $(55,685,441) |
| Change in net assets from operations | $(48,794,375) |
See Notes to Financial Statements
MFS Mid Cap Value Portfolio
| Financial Statements | Statements of Changes in Net Assets |
These statements describe the increases and/or decreases in net assets resulting from operations, any distributions, and any shareholder transactions.
| | Year ended |
| | 12/31/22 | 12/31/21 |
| Change in net assets | | |
| From operations | | |
| Net investment income (loss) | $6,891,066 | $4,272,910 |
| Net realized gain (loss) | 15,131,436 | 42,522,241 |
| Net unrealized gain (loss) | (70,816,877) | 79,620,961 |
| Change in net assets from operations | $(48,794,375) | $126,416,112 |
| Total distributions to shareholders | $(47,086,062) | $(7,068,768) |
| Change in net assets from fund share transactions | $(1,713,064) | $11,028,583 |
| Total change in net assets | $(97,593,501) | $130,375,927 |
| Net assets | | |
| At beginning of period | 544,422,737 | 414,046,810 |
| At end of period | $446,829,236 | $544,422,737 |
See Notes to Financial Statements
MFS Mid Cap Value Portfolio
| Financial Statements | Financial Highlights |
The financial highlights table is intended to help you understand the fund's financial performance for the past 5 years. Certain information reflects financial results for a single fund share. The total returns in the table represent the rate that an investor would have earned (or lost) on an investment in the fund share class (assuming reinvestment of all distributions) held for the entire period.
| Initial Class | Year ended |
| | 12/31/22 | 12/31/21 | 12/31/20 | 12/31/19 | 12/31/18 |
| Net asset value, beginning of period | $11.09 | $8.59 | $8.74 | $7.42 | $9.01 |
| Income (loss) from investment operations | | | | | |
| Net investment income (loss) (d) | $0.14 | $0.10 | $0.09 | $0.11 | $0.10 |
| Net realized and unrealized gain (loss) | (1.10) | 2.55 | 0.19 | 2.09 | (1.03) |
| Total from investment operations | $(0.96) | $2.65 | $0.28 | $2.20 | $(0.93) |
| Less distributions declared to shareholders | | | | | |
| From net investment income | $(0.10) | $(0.08) | $(0.10) | $(0.12) | $(0.08) |
| From net realized gain | (0.84) | (0.07) | (0.33) | (0.76) | (0.58) |
| Total distributions declared to shareholders | $(0.94) | $(0.15) | $(0.43) | $(0.88) | $(0.66) |
| Net asset value, end of period (x) | $9.19 | $11.09 | $8.59 | $8.74 | $7.42 |
| Total return (%) (k)(r)(s)(x) | (8.79) | 30.99 | 3.87 | 31.12 | (11.45) |
Ratios (%) (to average net assets)
and Supplemental data: | | | | | |
| Expenses before expense reductions | 0.80 | 0.80 | 0.81 | 0.81 | 0.81 |
| Expenses after expense reductions | 0.79 | 0.79 | 0.80 | 0.80 | 0.80 |
| Net investment income (loss) | 1.45 | 0.97 | 1.22 | 1.31 | 1.13 |
| Portfolio turnover | 21 | 26 | 35 | 30 | 32 |
| Net assets at end of period (000 omitted) | $246,813 | $316,524 | $271,131 | $261,832 | $210,218 |
| Service Class | Year ended |
| | 12/31/22 | 12/31/21 | 12/31/20 | 12/31/19 | 12/31/18 |
| Net asset value, beginning of period | $10.95 | $8.50 | $8.65 | $7.35 | $8.93 |
| Income (loss) from investment operations | | | | | |
| Net investment income (loss) (d) | $0.12 | $0.07 | $0.08 | $0.09 | $0.08 |
| Net realized and unrealized gain (loss) | (1.09) | 2.52 | 0.18 | 2.06 | (1.02) |
| Total from investment operations | $(0.97) | $2.59 | $0.26 | $2.15 | $(0.94) |
| Less distributions declared to shareholders | | | | | |
| From net investment income | $(0.08) | $(0.07) | $(0.08) | $(0.09) | $(0.06) |
| From net realized gain | (0.84) | (0.07) | (0.33) | (0.76) | (0.58) |
| Total distributions declared to shareholders | $(0.92) | $(0.14) | $(0.41) | $(0.85) | $(0.64) |
| Net asset value, end of period (x) | $9.06 | $10.95 | $8.50 | $8.65 | $7.35 |
| Total return (%) (k)(r)(s)(x) | (9.00) | 30.60 | 3.67 | 30.71 | (11.61) |
Ratios (%) (to average net assets)
and Supplemental data: | | | | | |
| Expenses before expense reductions | 1.05 | 1.05 | 1.06 | 1.06 | 1.06 |
| Expenses after expense reductions | 1.04 | 1.04 | 1.05 | 1.05 | 1.05 |
| Net investment income (loss) | 1.24 | 0.74 | 1.01 | 1.06 | 0.86 |
| Portfolio turnover | 21 | 26 | 35 | 30 | 32 |
| Net assets at end of period (000 omitted) | $200,016 | $227,898 | $142,916 | $74,018 | $55,837 |
See Notes to Financial Statements
MFS Mid Cap Value Portfolio
Financial Highlights - continued
| (d) | Per share data is based on average shares outstanding. |
| (k) | The total return does not reflect expenses that apply to separate accounts. Inclusion of these charges would reduce the total return figures for all periods shown. |
| (r) | Certain expenses have been reduced without which performance would have been lower. |
| (s) | From time to time the fund may receive proceeds from litigation settlements, without which performance would be lower. |
| (x) | The net asset values and total returns have been calculated on net assets which include adjustments made in accordance with U.S. generally accepted accounting principles required at period end for financial reporting purposes. |
See Notes to Financial Statements
MFS Mid Cap Value Portfolio
Notes to Financial Statements
(1) Business and Organization
MFS Mid Cap Value Portfolio (the fund) is a diversified series of MFS Variable Insurance Trust III (the trust). The trust is organized as a Delaware statutory trust and is registered under the Investment Company Act of 1940, as amended, as an open-end management investment company. The shareholders of each series of the trust are separate accounts of insurance companies, which offer variable annuity and/or life insurance products, and qualified retirement and pension plans.
The fund is an investment company and accordingly follows the investment company accounting and reporting guidance of the Financial Accounting Standards Board (FASB) Accounting Standards Codification Topic 946 Financial Services - Investment Companies.
(2) Significant Accounting Policies
General — The preparation of financial statements in conformity with U.S. generally accepted accounting principles requires management to make estimates and assumptions that affect the reported amounts of assets and liabilities, and disclosure of contingent assets and liabilities at the date of the financial statements and the reported amounts of increases and decreases in net assets from operations during the reporting period. Actual results could differ from those estimates. In the preparation of these financial statements, management has evaluated subsequent events occurring after the date of the fund’s Statement of Assets and Liabilities through the date that the financial statements were issued.
Balance Sheet Offsetting — The fund's accounting policy with respect to balance sheet offsetting is that, absent an event of default by the counterparty or a termination of the agreement, the International Swaps and Derivatives Association (ISDA) Master Agreement, or similar agreement, does not result in an offset of reported amounts of financial assets and financial liabilities in the Statement of Assets and Liabilities across transactions between the fund and the applicable counterparty. The fund's right to setoff may be restricted or prohibited by the bankruptcy or insolvency laws of the particular jurisdiction to which a specific master netting agreement counterparty is subject. Balance sheet offsetting disclosures, to the extent applicable to the fund, have been included in the fund’s Significant Accounting Policies note under the captions for each of the fund’s in-scope financial instruments and transactions.
Investment Valuations — Subject to its oversight, the fund's Board of Trustees has delegated primary responsibility for determining or causing to be determined the value of the fund’s investments to MFS as the fund's adviser, pursuant to the fund’s valuation policy and procedures which have been adopted by the adviser and approved by the Board. Effective September 8, 2022, and in accordance with Rule 2a-5 under the Investment Company Act of 1940, the Board of Trustees designated the adviser as the “valuation designee” of the fund. If the adviser, as valuation designee, determines that reliable market quotations are not readily available for an investment, the investment is valued at fair value as determined in good faith by the adviser in accordance with the adviser’s fair valuation policy and procedures.
Under the fund's valuation policy and procedures, equity securities, including restricted equity securities, are generally valued at the last sale or official closing price on their primary market or exchange as provided by a third-party pricing service. Equity securities, for which there were no sales reported that day, are generally valued at the last quoted daily bid quotation on their primary market or exchange as provided by a third-party pricing service. Short-term instruments with a maturity at issuance of 60 days or less may be valued at amortized cost, which approximates market value. Open-end investment companies are generally valued at net asset value per share. The values of foreign securities and other assets and liabilities expressed in foreign currencies are converted to U.S. dollars using the mean of bid and asked prices for rates provided by a third-party pricing service.
Under the fund’s valuation policy and procedures, market quotations are not considered to be readily available for debt instruments, floating rate loans, and many types of derivatives. These investments are generally valued at fair value based on information from third-party pricing services or otherwise determined by the adviser in accordance with the adviser’s fair valuation policy and procedures. Securities and other assets generally valued on the basis of information from a third-party pricing service may also be valued at a broker/dealer bid quotation. In determining values, third-party pricing services can utilize both transaction data and market information such as yield, quality, coupon rate, maturity, type of issue, trading characteristics, spreads and other market data. An investment may also be valued at fair value if the adviser determines that the investment’s value has been materially affected by events occurring after the close of the exchange or market on which the investment is principally traded (such as foreign exchange or market) and prior to the determination of the fund’s net asset value, or after the halt of trading of a specific security where trading does not resume prior to the close of the exchange or market on which the security is principally traded. Events that occur after foreign markets close (such as developments in foreign markets and significant movements in the U.S. markets) and prior to the determination of the fund’s net asset value may be deemed to have a material effect on the value of securities traded in foreign markets. Accordingly, the fund’s foreign equity securities may often be valued at fair value. The adviser generally relies on third-party pricing services or other information (such as the correlation with price movements of similar securities in the same or other markets; the type, cost and investment characteristics of the security; the business and financial condition of the issuer; and trading and other
MFS Mid Cap Value Portfolio
Notes to Financial Statements - continued
market data) to assist in determining whether to fair value and at what value to fair value an investment. The value of an investment for purposes of calculating the fund’s net asset value can differ depending on the source and method used to determine value. When fair valuation is used, the value of an investment used to determine the fund’s net asset value may differ from quoted or published prices for the same investment. There can be no assurance that the fund could obtain the fair value assigned to an investment if it were to sell the investment at the same time at which the fund determines its net asset value per share.
Various inputs are used in determining the value of the fund's assets or liabilities. These inputs are categorized into three broad levels. In certain cases, the inputs used to measure fair value may fall into different levels of the fair value hierarchy. In such cases, an investment's level within the fair value hierarchy is based on the lowest level of input that is significant to the fair value measurement. The fund's assessment of the significance of a particular input to the fair value measurement in its entirety requires judgment, and considers factors specific to the investment. Level 1 includes unadjusted quoted prices in active markets for identical assets or liabilities. Level 2 includes other significant observable market-based inputs (including quoted prices for similar securities, interest rates, prepayment speed, and credit risk). Level 3 includes significant unobservable inputs, which may include the adviser's own assumptions in determining the fair value of investments. The following is a summary of the levels used as of December 31, 2022 in valuing the fund's assets and liabilities:
| Financial Instruments | Level 1 | Level 2 | Level 3 | Total |
| Equity Securities | $444,331,864 | $— | $— | $444,331,864 |
| Mutual Funds | 2,768,212 | — | — | 2,768,212 |
| Total | $447,100,076 | $— | $— | $447,100,076 |
For further information regarding security characteristics, see the Portfolio of Investments.
Foreign Currency Translation — Purchases and sales of foreign investments, income, and expenses are converted into U.S. dollars based upon currency exchange rates prevailing on the respective dates of such transactions or on the reporting date for foreign denominated receivables and payables. Gains and losses attributable to foreign currency exchange rates on sales of securities are recorded for financial statement purposes as net realized gains and losses on investments. Gains and losses attributable to foreign exchange rate movements on receivables, payables, income and expenses are recorded for financial statement purposes as foreign currency transaction gains and losses. That portion of both realized and unrealized gains and losses on investments that results from fluctuations in foreign currency exchange rates is not separately disclosed.
Security Loans — Under its Securities Lending Agency Agreement with the fund, State Street Bank and Trust Company, as lending agent, loans the securities of the fund to certain qualified institutions (the “Borrowers”) approved by the fund. Security loans can be terminated at the discretion of either the lending agent or the fund and the related securities must be returned within the earlier of the standard trade settlement period for such securities or within three business days. The loans are collateralized by cash and/or U.S. Treasury and federal agency obligations in an amount typically at least equal to the market value of the securities loaned. On loans collateralized by cash, the cash collateral is invested in a money market fund. The market value of the loaned securities is determined at the close of business of the fund and any additional required collateral is delivered to the fund on the next business day. The lending agent provides the fund with indemnification against Borrower default. In the event of Borrower default, the lending agent will, for the benefit of the fund, either purchase securities identical to those loaned or, when such purchase is commercially impracticable, pay the fund the market value of the loaned securities. In return, the lending agent assumes the fund's rights to the related collateral. If the collateral value is less than the cost to purchase identical securities, the lending agent is responsible for the shortfall, but only to the extent that such shortfall is not due to a decline in collateral value resulting from collateral reinvestment for which the fund bears the risk of loss. At period end, the fund had investment securities on loan, all of which were classified as equity securities in the fund's Portfolio of Investments, with a fair value of $128,130. The fair value of the fund's investment securities on loan and a related liability of $134,876 for cash collateral received on securities loaned are both presented gross in the Statement of Assets and Liabilities. The collateral on securities loaned exceeded the value of securities on loan at period end. The liability for cash collateral for securities loaned is carried at fair value, which is categorized as level 2 within the fair value hierarchy. A portion of the income generated upon investment of the collateral is remitted to the Borrowers, and the remainder is allocated between the fund and the lending agent. On loans collateralized by U.S. Treasury and/or federal agency obligations, a fee is received from the Borrower, and is allocated between the fund and the lending agent. Income from securities lending is separately reported in the Statement of Operations. The dividend and interest income earned on the securities loaned is accounted for in the same manner as other dividend and interest income.
Indemnifications — Under the fund's organizational documents, its officers and Trustees may be indemnified against certain liabilities and expenses arising out of the performance of their duties to the fund. Additionally, in the normal course of business, the fund enters into agreements with service providers that may contain indemnification clauses. The fund's maximum exposure under these agreements is unknown as this would involve future claims that may be made against the fund that have not yet occurred.
MFS Mid Cap Value Portfolio
Notes to Financial Statements - continued
Investment Transactions and Income — Investment transactions are recorded on the trade date. Dividends received in cash are recorded on the ex-dividend date. Certain dividends from foreign securities will be recorded when the fund is informed of the dividend if such information is obtained subsequent to the ex-dividend date. Dividend payments received in additional securities are recorded on the ex-dividend date in an amount equal to the value of the security on such date. In determining the net gain or loss on securities sold, the cost of securities is determined on the identified cost basis.
The fund may receive proceeds from litigation settlements. Any proceeds received from litigation involving portfolio holdings are reflected in the Statement of Operations in realized gain/loss if the security has been disposed of by the fund or in unrealized gain/loss if the security is still held by the fund. Any other proceeds from litigation not related to portfolio holdings are reflected as other income in the Statement of Operations.
Tax Matters and Distributions — The fund intends to qualify as a regulated investment company, as defined under Subchapter M of the Internal Revenue Code, and to distribute all of its taxable income, including realized capital gains. As a result, no provision for federal income tax is required. The fund’s federal tax returns, when filed, will remain subject to examination by the Internal Revenue Service for a three year period. Management has analyzed the fund’s tax positions taken on federal and state tax returns for all open tax years and does not believe that there are any uncertain tax positions that require recognition of a tax liability. Foreign taxes, if any, have been accrued by the fund in the accompanying financial statements in accordance with the applicable foreign tax law. Foreign income taxes may be withheld by certain countries in which the fund invests. Additionally, capital gains realized by the fund on securities issued in or by certain foreign countries may be subject to capital gains tax imposed by those countries.
Distributions to shareholders are recorded on the ex-dividend date. Income and capital gain distributions are determined in accordance with income tax regulations, which may differ from U.S. generally accepted accounting principles. Certain capital accounts in the financial statements are periodically adjusted for permanent differences in order to reflect their tax character. These adjustments have no impact on net assets or net asset value per share. Temporary differences which arise from recognizing certain items of income, expense, gain or loss in different periods for financial statement and tax purposes will reverse at some time in the future.
Book/tax differences primarily relate to passive foreign investment companies and wash sale loss deferrals.
The tax character of distributions declared to shareholders for the last two fiscal years is as follows:
| | Year ended
12/31/22 | Year ended
12/31/21 |
| Ordinary income (including any short-term capital gains) | $11,924,635 | $5,697,623 |
| Long-term capital gains | 35,161,427 | 1,371,145 |
| Total distributions | $47,086,062 | $7,068,768 |
The federal tax cost and the tax basis components of distributable earnings were as follows:
| As of 12/31/22 | |
| Cost of investments | $328,886,401 |
| Gross appreciation | 135,619,826 |
| Gross depreciation | (17,406,151) |
| Net unrealized appreciation (depreciation) | $118,213,675 |
| Undistributed ordinary income | 7,597,753 |
| Undistributed long-term capital gain | 15,465,226 |
| Other temporary differences | (389) |
| Total distributable earnings (loss) | $141,276,265 |
Multiple Classes of Shares of Beneficial Interest — The fund offers multiple classes of shares, which differ in their respective distribution and/or service fees. The fund's income, realized and unrealized gain (loss), and common expenses are allocated to shareholders based on the daily net assets of each class. Dividends are declared separately for each class. Differences in per share dividend rates are generally due to differences in separate class expenses. The fund’s distributions declared to shareholders as reported in the Statements of Changes in Net Assets are presented by class as follows:
MFS Mid Cap Value Portfolio
Notes to Financial Statements - continued
| | Year
ended
12/31/22 | | Year
ended
12/31/21 |
| Initial Class | $26,193,294 | | $4,276,275 |
| Service Class | 20,892,768 | | 2,792,493 |
| Total | $47,086,062 | | $7,068,768 |
(3) Transactions with Affiliates
Investment Adviser — The fund has an investment advisory agreement with MFS to provide overall investment management and related administrative services and facilities to the fund. The management fee is computed daily and paid monthly at the following annual rates based on the fund's average daily net assets:
| Up to $1 billion | 0.75% |
| In excess of $1 billion | 0.70% |
MFS has agreed in writing to reduce its management fee by a specified amount if certain MFS mutual fund assets exceed thresholds agreed to by MFS and the fund's Board of Trustees. Effective March 1, 2022, MFS has also agreed in writing to waive at least 0.01% of its management fee as part of this agreement. The agreement to waive at least 0.01% of the management fee will continue until modified by the fund's Board of Trustees, but such agreement will continue at least until April 30, 2024. For the year ended December 31, 2022, this management fee reduction amounted to $70,570, which is included in the reduction of total expenses in the Statement of Operations. The management fee incurred for the year ended December 31, 2022 was equivalent to an annual effective rate of 0.74% of the fund's average daily net assets.
The investment adviser has agreed in writing to pay a portion of the fund’s total annual operating expenses, excluding interest, taxes, extraordinary expenses, brokerage and transaction costs, certain tax reclaim recovery expenses (including contingency fees and closing agreement expenses), and investment-related expenses, such that total annual operating expenses do not exceed 0.92% of average daily net assets for the Initial Class shares and 1.17% of average daily net assets for the Service Class shares. This written agreement will continue until modified by the fund’s Board of Trustees, but such agreement will continue at least until April 30, 2024. For the year ended December 31, 2022, the fund’s actual operating expenses did not exceed the limit and therefore, the investment adviser did not pay any portion of the fund’s expenses related to this agreement.
Distributor — MFS Fund Distributors, Inc. (MFD), a wholly-owned subsidiary of MFS, is the distributor of shares of the fund. The Trustees have adopted a distribution plan for the Service Class shares pursuant to Rule 12b-1 under the Investment Company Act of 1940.
The fund's distribution plan provides that the fund will pay MFD distribution and/or service fees equal to 0.25% per annum of its average daily net assets attributable to Service Class shares as partial consideration for services performed and expenses incurred by MFD and financial intermediaries (including participating insurance companies that invest in the fund to fund variable annuity and variable life insurance contracts, sponsors of qualified retirement and pension plans that invest in the fund, and affiliates of these participating insurance companies and plan sponsors) in connection with the sale and distribution of the Service Class shares. MFD may subsequently pay all, or a portion, of the distribution and/or service fees to financial intermediaries.
Shareholder Servicing Agent — MFS Service Center, Inc. (MFSC), a wholly-owned subsidiary of MFS, receives a fee from the fund for its services as shareholder servicing agent. For the year ended December 31, 2022, the fee was $20,072, which equated to 0.0040% annually of the fund's average daily net assets. MFSC also receives reimbursement from the fund for out-of-pocket expenses paid by MFSC on behalf of the fund. For the year ended December 31, 2022, these costs amounted to $1,550.
Administrator — MFS provides certain financial, legal, shareholder communications, compliance, and other administrative services to the fund. Under an administrative services agreement, the fund reimburses MFS the costs incurred to provide these services. The fund is charged an annual fixed amount of $17,500 plus a fee based on average daily net assets. The administrative services fee incurred for the year ended December 31, 2022 was equivalent to an annual effective rate of 0.0173% of the fund's average daily net assets.
Trustees’ and Officers’ Compensation — The fund pays compensation to independent Trustees in the form of a retainer, attendance fees, and additional compensation to Board and Committee chairpersons. The fund does not pay compensation directly to Trustees or officers of the fund who are also officers of the investment adviser, all of whom receive remuneration from MFS for their services to the fund. Certain officers and Trustees of the fund are officers or directors of MFS, MFD, and MFSC.
MFS Mid Cap Value Portfolio
Notes to Financial Statements - continued
Other — The fund invests in the MFS Institutional Money Market Portfolio which is managed by MFS and seeks current income consistent with preservation of capital and liquidity. This money market fund does not pay a management fee to MFS but does incur investment and operating costs.
The fund is permitted to engage in purchase and sale transactions with funds and accounts for which MFS serves as investment adviser or sub-adviser (“cross-trades”) pursuant to a policy adopted by the Board of Trustees. This policy has been designed to ensure that cross-trades conducted by the fund comply with Rule 17a-7 under the Investment Company Act of 1940. During the year ended December 31, 2022, the fund engaged in sale transactions pursuant to this policy, which amounted to $125,433. The sales transactions resulted in net realized gains (losses) of $18,105.
The adviser has voluntarily undertaken to reimburse the fund from its own resources on a quarterly basis for the cost of investment research embedded in the cost of the fund’s securities trades. This agreement may be rescinded at any time. For the year ended December 31, 2022, this reimbursement amounted to $15,045, which is included in “Other” income in the Statement of Operations.
(4) Portfolio Securities
For the year ended December 31, 2022, purchases and sales of investments, other than short-term obligations, aggregated $106,781,879 and $144,665,150, respectively.
(5) Shares of Beneficial Interest
The fund's Declaration of Trust permits the Trustees to issue an unlimited number of full and fractional shares of beneficial interest. Transactions in fund shares were as follows:
| | Year ended
12/31/22 | | Year ended
12/31/21 |
| | Shares | Amount | | Shares | Amount |
| Shares sold | | | | | |
| Initial Class | 4,681,871 | $47,560,208 | | 5,403,334 | $54,466,927 |
| Service Class | 15,477,754 | 154,792,195 | | 8,348,445 | 83,577,530 |
| | 20,159,625 | $202,352,403 | | 13,751,779 | $138,044,457 |
Shares issued to shareholders
in reinvestment of distributions | | | | | |
| Initial Class | 2,792,462 | $26,193,294 | | 415,576 | $4,276,275 |
| Service Class | 2,256,238 | 20,892,768 | | 274,581 | 2,792,493 |
| | 5,048,700 | $47,086,062 | | 690,157 | $7,068,768 |
| Shares reacquired | | | | | |
| Initial Class | (9,159,594) | $(89,546,799) | | (8,849,348) | $(87,892,961) |
| Service Class | (16,462,055) | (161,604,730) | | (4,637,335) | (46,191,681) |
| | (25,621,649) | $(251,151,529) | | (13,486,683) | $(134,084,642) |
| Net change | | | | | |
| Initial Class | (1,685,261) | $(15,793,297) | | (3,030,438) | $(29,149,759) |
| Service Class | 1,271,937 | 14,080,233 | | 3,985,691 | 40,178,342 |
| | (413,324) | $(1,713,064) | | 955,253 | $11,028,583 |
The fund is one of several mutual funds in which certain MFS funds may invest. The MFS funds do not invest in the underlying funds for the purpose of exercising management or control. At the end of the period, the MFS Moderate Allocation Portfolio, the MFS Growth Allocation Portfolio, and the MFS Conservative Allocation Portfolio were the owners of record of approximately 16%, 5%, and 3%, respectively, of the value of outstanding voting shares of the fund.
(6) Line of Credit
The fund and certain other funds managed by MFS participate in a $1.45 billion unsecured committed line of credit of which $1.2 billion is reserved for use by the fund and certain other MFS U.S. funds. The line of credit is provided by a syndicate of banks under a credit agreement. Borrowings may be made for temporary financing needs. Interest is charged to each fund, based on its borrowings, generally at a rate equal to the highest of 1) Daily Simple SOFR (Secured Overnight Financing Rate) plus 0.10%, 2) the Federal Funds Effective Rate, or 3) the Overnight Bank Funding Rate, each plus an agreed upon spread. A commitment fee, based on the average daily unused portion of the committed line of credit, is allocated among the participating funds. The line of credit expires
MFS Mid Cap Value Portfolio
Notes to Financial Statements - continued
on March 16, 2023 unless extended or renewed. In addition, the fund and other funds managed by MFS have established unsecured uncommitted borrowing arrangements with certain banks for temporary financing needs. Interest is charged to each fund, based on its borrowings, at rates equal to customary reference rates plus an agreed upon spread. For the year ended December 31, 2022, the fund’s commitment fee and interest expense were $2,452 and $2,680, respectively, and are included in “Miscellaneous” expense in the Statement of Operations.
(7) Investments in Affiliated Issuers
An affiliated issuer may be considered one in which the fund owns 5% or more of the outstanding voting securities, or a company which is under common control. For the purposes of this report, the following were affiliated issuers:
| Affiliated Issuers | Beginning
Value | Purchases | Sales
Proceeds | Realized
Gain
(Loss) | Change in
Unrealized
Appreciation or
Depreciation | Ending
Value |
| MFS Institutional Money Market Portfolio | $5,087,830 | $96,511,384 | $98,967,501 | $1,101 | $522 | $2,633,336 |
| Affiliated Issuers | Dividend
Income | Capital Gain
Distributions |
| MFS Institutional Money Market Portfolio | $116,898 | $— |
(8) LIBOR Transition
Certain of the fund's investments, including investments in certain debt instruments and derivatives (if any), as well as borrowings by the fund and certain other contractual arrangements of the fund, may be based on the London Interbank Offered Rate (“LIBOR”). In 2017, the regulatory authority that oversees financial services firms in the United Kingdom announced plans to transition away from LIBOR by the end of 2021. In March 2021, the administrator of LIBOR announced the extension of the publication of the more commonly used U.S. dollar LIBOR settings to the end of June 2023. Although the full impacts of the transition away from LIBOR are not fully known, the transition may result in, among other things, an increase in volatility or illiquidity of the markets for instruments that currently rely on LIBOR to determine interest rates and this could have an adverse impact on the fund's performance. With respect to the fund's accounting for investments, including investments in certain debt instruments and derivatives, as well as borrowings by the fund and any other contractual arrangements of the fund that undergo reference rate-related modifications as a result of the transition, management will rely upon the relief provided by FASB Codification Topic 848 – Reference Rate Reform (Topic 848). The guidance in Topic 848 permits the fund to account for those modified contracts as a continuation of the existing contracts. Management is still evaluating the impact to the fund of the June 30, 2023 planned discontinuation of the more commonly used U.S. dollar LIBOR settings.
(9) Russia and Ukraine Conflict
The market disruptions, which began in late February 2022, associated with geopolitical events related to the conflict between Russia and Ukraine may adversely affect the value of the fund’s assets and thus the fund’s performance. Management continues to monitor these events and to evaluate the related impacts, if any, to the fund.
MFS Mid Cap Value Portfolio
Report of Independent Registered Public Accounting Firm
To the Board of Trustees of MFS Variable Insurance Trust III and the Shareholders of MFS Mid Cap Value Portfolio:
Opinion on the Financial Statements and Financial Highlights
We have audited the accompanying statement of assets and liabilities of MFS Mid Cap Value Portfolio (the “Fund”), including the portfolio of investments, as of December 31, 2022, the related statement of operations for the year then ended, the statements of changes in net assets for each of the two years in the period then ended, the financial highlights for each of the five years in the period then ended, and the related notes. In our opinion, the financial statements and financial highlights present fairly, in all material respects, the financial position of the Fund as of December 31, 2022, and the results of its operations for the year then ended, the changes in its net assets for each of the two years in the period then ended, and the financial highlights for each of the five years in the period then ended, in conformity with accounting principles generally accepted in the United States of America.
Basis for Opinion
These financial statements and financial highlights are the responsibility of the Fund's management. Our responsibility is to express an opinion on the Fund's financial statements and financial highlights based on our audits. We are a public accounting firm registered with the Public Company Accounting Oversight Board (United States) (PCAOB) and are required to be independent with respect to the Fund in accordance with the U.S. federal securities laws and the applicable rules and regulations of the Securities and Exchange Commission and the PCAOB.
We conducted our audits in accordance with the standards of the PCAOB. Those standards require that we plan and perform the audit to obtain reasonable assurance about whether the financial statements and financial highlights are free of material misstatement, whether due to error or fraud. The Fund is not required to have, nor were we engaged to perform, an audit of its internal control over financial reporting. As part of our audits, we are required to obtain an understanding of internal control over financial reporting but not for the purpose of expressing an opinion on the effectiveness of the Fund's internal control over financial reporting. Accordingly, we express no such opinion.
Our audits included performing procedures to assess the risks of material misstatement of the financial statements and financial highlights, whether due to error or fraud, and performing procedures that respond to those risks. Such procedures included examining, on a test basis, evidence regarding the amounts and disclosures in the financial statements and financial highlights. Our audits also included evaluating the accounting principles used and significant estimates made by management, as well as evaluating the overall presentation of the financial statements and financial highlights. Our procedures included confirmation of securities owned as of December 31, 2022, by correspondence with the custodian and brokers. We believe that our audits provide a reasonable basis for our opinion.
DELOITTE & TOUCHE LLP
Boston, Massachusetts
February 15, 2023
We have served as the auditor of one or more of the MFS investment companies since 1924.
MFS Mid Cap Value Portfolio
Trustees and Officers — Identification and Background
The Trustees and Officers of the Trust, as of February 1, 2023, are listed below, together with their principal occupations during the past five years. (Their titles may have varied during that period.) The address of each Trustee and Officer is 111 Huntington Avenue, Boston, Massachusetts 02199-7618.
| Name, Age | | Position(s) Held with Fund | | Trustee/Officer Since(h) | | Number of MFS Funds overseen by the Trustee | | Principal Occupations During
the Past Five Years | | Other Directorships During
the Past Five Years (j) |
| INTERESTED TRUSTEE | | | | | | | | | | |
Michael W. Roberge (k)
(age 56) | | Trustee | | January 2021 | | 136 | | Massachusetts Financial Services Company, Chairman (since January 2021); Chief Executive Officer (since January 2017); Director; Chairman of the Board (since January 2022); President (until December 2018); Chief Investment Officer (until December 2018) | | N/A |
| INDEPENDENT TRUSTEES | | | | | | | | | | |
John P. Kavanaugh
(age 68) | | Trustee and Chair of Trustees | | January 2009 | | 136 | | Private investor | | N/A |
Steven E. Buller
(age 71) | | Trustee | | February 2014 | | 136 | | Private investor | | N/A |
John A. Caroselli
(age 68) | | Trustee | | March 2017 | | 136 | | Private investor; JC Global Advisors, LLC (management consulting), President (since 2015) | | N/A |
Maureen R. Goldfarb
(age 67) | | Trustee | | January 2009 | | 136 | | Private investor | | N/A |
Peter D. Jones
(age 67) | | Trustee | | January 2019 | | 136 | | Private investor | | N/A |
James W. Kilman, Jr.
(age 61) | | Trustee | | January 2019 | | 136 | | Burford Capital Limited (finance and investment management), Senior Advisor (since May 3, 2021), Chief Financial Officer (2019 - May 2, 2021); KielStrand Capital LLC (family office), Chief Executive Officer (since 2016) | | Alpha-En Corporation, Director (2016-2019) |
Clarence Otis, Jr.
(age 66) | | Trustee | | March 2017 | | 136 | | Private investor | | VF Corporation, Director; Verizon Communications, Inc., Director; The Travelers Companies, Director |
Maryanne L. Roepke
(age 66) | | Trustee | | May 2014 | | 136 | | Private investor | | N/A |
Laurie J. Thomsen
(age 65) | | Trustee | | March 2005 | | 136 | | Private investor | | The Travelers Companies, Director; Dycom Industries, Inc., Director |
MFS Mid Cap Value Portfolio
Trustees and Officers - continued
| Name, Age | | Position(s) Held with
Fund | | Trustee/Officer Since(h) | | Number of MFS Funds for which the Person is an Officer | | Principal Occupations During
the Past Five Years |
| OFFICERS | | | | | | | | |
Christopher R. Bohane (k)
(age 49) | | Assistant Secretary and Assistant Clerk | | July 2005 | | 136 | | Massachusetts Financial Services Company, Senior Vice President and Senior Managing Counsel |
Kino Clark (k)
(age 54) | | Assistant Treasurer | | January 2012 | | 136 | | Massachusetts Financial Services Company, Vice President |
John W. Clark, Jr. (k)
(age 55) | | Assistant Treasurer | | April 2017 | | 136 | | Massachusetts Financial Services Company, Vice President |
David L. DiLorenzo (k)
(age 54) | | President | | July 2005 | | 136 | | Massachusetts Financial Services Company, Senior Vice President |
Heidi W. Hardin (k)
(age 55) | | Secretary and Clerk | | April 2017 | | 136 | | Massachusetts Financial Services Company, Executive Vice President and General Counsel |
Brian E. Langenfeld (k)
(age 49) | | Assistant Secretary and Assistant Clerk | | June 2006 | | 136 | | Massachusetts Financial Services Company, Vice President and Managing Counsel |
Rosa E. Licea-Mailloux (k)
(age 46) | | Chief Compliance Officer | | March 2022 | | 136 | | Massachusetts Financial Services Company, Vice President (since 2018); Director of Corporate Compliance (2018-2021), Senior Director Compliance (2021-2022), Senior Managing Director of North American Compliance & Chief Compliance Officer (since March 2022); Natixis Investment Managers (investment management), Funds Chief Compliance Officer, Deputy General Counsel & Senior Vice President (until 2018) |
Amanda S. Mooradian (k)
(age 43) | | Assistant Secretary and Assistant Clerk | | September 2018 | | 136 | | Massachusetts Financial Services Company, Assistant Vice President and Senior Counsel |
Susan A. Pereira (k)
(age 52) | | Assistant Secretary and Assistant Clerk | | July 2005 | | 136 | | Massachusetts Financial Services Company, Vice President and Managing Counsel |
Kasey L. Phillips (k)
(age 52) | | Assistant Treasurer | | September 2012 | | 136 | | Massachusetts Financial Services Company, Vice President |
Matthew A. Stowe (k)
(age 48) | | Assistant Secretary and Assistant Clerk | | October 2014 | | 136 | | Massachusetts Financial Services Company, Vice President and Senior Managing Counsel |
William B. Wilson (k)
(age 40) | | Assistant Secretary and Assistant Clerk | | October 2022 | | 136 | | Massachusetts Financial Services Company, Assistant Vice President and Counsel |
James O. Yost (k)
(age 62) | | Treasurer | | September 1990 | | 136 | | Massachusetts Financial Services Company, Senior Vice President |
| (h) | Date first appointed to serve as Trustee/Officer of an MFS Fund. Each Trustee has served continuously since appointment unless indicated otherwise. From January 2012 through December 2016, Messrs. DiLorenzo and Yost served as Treasurer and Deputy Treasurer of the Funds, respectively. |
| (j) | Directorships or trusteeships of companies required to report to the Securities and Exchange Commission (i.e., “public companies”). |
| (k) | “Interested person” of the Trust within the meaning of the Investment Company Act of 1940 (referred to as the 1940 Act), which is the principal federal law governing investment companies like the fund, as a result of a position with MFS. The address of MFS is 111 Huntington Avenue, Boston, Massachusetts 02199-7618. |
Each Trustee (other than Messrs. Jones, Kilman and Roberge) has been elected by shareholders and each Trustee and Officer holds office until his or her successor is chosen and qualified or until his or her earlier death, resignation, retirement or removal. Mr. Roberge became a Trustee of the Funds on January 1, 2021 and Messrs. Jones and Kilman became Trustees of the Funds on January 1, 2019. The Trust does not hold annual meetings for the purpose of electing Trustees, and Trustees are not elected for fixed terms. Under the terms of the Board's retirement policy, an Independent Trustee shall retire at the end of the calendar year in which he or she reaches the earlier of 75 years of age or 15 years of service on the Board (or, in the case of any Independent Trustee who joined the Board prior to 2015, 20 years of service on the Board).
MFS Mid Cap Value Portfolio
Trustees and Officers - continued
Messrs. Buller, Kilman and Otis and Ms. Roepke are members of the Trust’s Audit Committee.
Each of the Interested Trustees and certain Officers hold comparable officer positions with certain affiliates of MFS.
The Statement of Additional Information for a Fund includes further information about the Trustees and is available without charge upon request by calling 1-800-225-2606.
| Investment Adviser | Custodian |
Massachusetts Financial Services Company
111 Huntington Avenue
Boston, MA 02199-7618 | State Street Bank and Trust Company
1 Lincoln Street
Boston, MA 02111-2900 |
| Distributor | Independent Registered Public Accounting Firm |
MFS Fund Distributors, Inc.
111 Huntington Avenue
Boston, MA 02199-7618 | Deloitte & Touche LLP
200 Berkeley Street
Boston, MA 02116 |
| Portfolio Manager(s) | |
Richard Offen
Kevin Schmitz
Brooks Taylor | |
MFS Mid Cap Value Portfolio
Board Review of Investment Advisory Agreement
MFS Mid Cap Value Portfolio
The Investment Company Act of 1940 requires that both the full Board of Trustees and a majority of the non-interested (“independent”) Trustees, voting separately, annually approve the continuation of the Fund’s investment advisory agreement with MFS. The Trustees consider matters bearing on the Fund and its advisory arrangements at their meetings throughout the year, including a review of performance data at each regular meeting. In addition, the independent Trustees met several times over the course of three months beginning in May and ending in July, 2022 (“contract review meetings”) for the specific purpose of considering whether to approve the continuation of the investment advisory agreement for the Fund and the other investment companies that the Board oversees (the “MFS Funds”). The independent Trustees were assisted in their evaluation of the Fund’s investment advisory agreement by independent legal counsel, from whom they received separate legal advice and with whom they met separately from MFS during various contract review meetings. The independent Trustees were also assisted in this process by an independent consultant who was retained by and reported to the independent Trustees.
In connection with their deliberations regarding the continuation of the investment advisory agreement, the Trustees, including the independent Trustees, considered such information and factors as they believed, in light of the legal advice furnished to them and their own business judgment, to be relevant. The investment advisory agreement for the Fund was considered separately, although the Trustees also took into account the common interests of all MFS Funds in their review. As described below, the Trustees considered the nature, quality, and extent of the various investment advisory, administrative, and shareholder services performed by MFS under the existing investment advisory agreement and other arrangements with the Fund.
In connection with their contract review meetings, the Trustees received and relied upon materials that included, among other items: (i) information provided by Broadridge Financial Solutions, Inc. (“Broadridge”), an independent third party, on the investment performance of the Fund for various time periods ended December 31, 2021 and the investment performance of a group of funds with substantially similar investment classifications/objectives (the “Broadridge performance universe”), (ii) information provided by Broadridge on the Fund’s advisory fees and other expenses and the advisory fees and other expenses of comparable funds identified by Broadridge as well as all other funds in the same investment classification/category (the “Broadridge expense group and universe”), (iii) information provided by MFS on the advisory fees of portfolios of other clients of MFS, including institutional separate accounts and other clients, (iv) information as to whether and to what extent applicable expense waivers, reimbursements or fee “breakpoints” are observed for the Fund, (v) information regarding MFS’ financial results and financial condition, including MFS’ and certain of its affiliates’ estimated profitability from services performed for the Fund and the MFS Funds as a whole, and compared to MFS’ institutional business, (vi) MFS’ views regarding the outlook for the mutual fund industry and the strategic business plans of MFS, (vii) descriptions of various functions performed by MFS for the Funds, such as compliance monitoring and portfolio trading practices, and (viii) information regarding the overall organization of MFS, including information about MFS’ senior management and other personnel providing investment advisory, administrative and other services to the Fund and the other MFS Funds. The comparative performance, fee and expense information prepared and provided by Broadridge was not independently verified and the independent Trustees did not independently verify any information provided to them by MFS.
The Trustees’ conclusion as to the continuation of the investment advisory agreement was based on a comprehensive consideration of all information provided to the Trustees and not the result of any single factor. Some of the factors that figured particularly in the Trustees’ deliberations are described below, although individual Trustees may have evaluated the information presented differently from one another, giving different weights to various factors. It is also important to recognize that the fee arrangements for the Fund and other MFS Funds are the result of years of review and discussion between the independent Trustees and MFS, that certain aspects of such arrangements may receive greater scrutiny in some years than in others, and that the Trustees’ conclusions may be based, in part, on their consideration of these same arrangements during the course of the year and in prior years.
Based on information provided by Broadridge and MFS, the Trustees reviewed the Fund’s total return investment performance as well as the Broadridge performance universe over various time periods. The Trustees placed particular emphasis on the total return performance of the Fund’s Initial Class shares in comparison to the performance of funds in its Broadridge performance universe over the five-year period ended December 31, 2021, which the Trustees believed was a long enough period to reflect differing market conditions. The total return performance of the Fund’s Initial Class shares was in the 1st quintile relative to the other funds in the universe for this five-year period (the 1st quintile being the best performers and the 5th quintile being the worst performers). The total return performance of the Fund’s Initial Class shares was in the 2nd quintile for each of the one- and three-year periods ended December 31, 2021 relative to the Broadridge performance universe. Because of the passage of time, these performance results may differ from the performance results for more recent periods, including those shown elsewhere in this report.
In the course of their deliberations, the Trustees took into account information provided by MFS in connection with the contract review meetings, as well as during investment review meetings conducted with portfolio management personnel during the course of the year regarding the Fund’s performance. After reviewing these and related factors, the Trustees concluded, within the context of their overall conclusions regarding the investment advisory agreement, that they were satisfied with MFS’ responses and efforts relating to investment performance.
MFS Mid Cap Value Portfolio
Board Review of Investment Advisory Agreement - continued
In assessing the reasonableness of the Fund’s advisory fee, the Trustees considered, among other information, the Fund’s advisory fee and the total expense ratio of the Fund’s Initial Class shares as a percentage of average daily net assets and the advisory fee and total expense ratios of the Broadridge expense group based on information provided by Broadridge. The Trustees considered that MFS currently observes an expense limitation for the Fund, which may not be changed without the Trustees’ approval. The Trustees also considered that, according to the data provided by Broadridge (which takes into account any fee reductions or expense limitations that were in effect during the Fund’s last fiscal year), the Fund’s effective advisory fee rate and total expense ratio were each approximately at the Broadridge expense group median.
The Trustees also considered the advisory fees charged by MFS to any institutional separate accounts advised by MFS (“separate accounts”) and unaffiliated investment companies for which MFS serves as subadviser (“subadvised funds”) that have comparable investment strategies to the Fund, if any. In comparing these fees, the Trustees considered information provided by MFS as to the generally broader scope of services provided by MFS to the Fund, as well as the more extensive regulatory burdens imposed on MFS in managing the Fund, in comparison to separate accounts and subadvised funds. The Trustees also considered the higher demands placed on MFS’ investment personnel and trading infrastructure as a result of the daily cash in-flows and out-flows of the Fund in comparison to separate accounts.
The Trustees also considered whether the Fund may benefit from any economies of scale in the management of the Fund in the event of growth in assets of the Fund and/or growth in assets of the MFS Funds as a whole. They noted that the Fund’s advisory fee rate schedule is subject to a contractual breakpoint that reduces the Fund’s advisory fee rate on average daily net assets over $1 billion. The Trustees also noted that MFS has agreed in writing to waive a portion of the management fees of certain MFS Funds, including the Fund, if the total combined assets of certain funds within the MFS Funds’ complex increase above agreed upon thresholds (the “group fee waiver”), enabling the Fund’s shareholders to share in the benefits from any economies of scale at the complex level. The group fee waiver is reviewed and renewed annually between the Board and MFS. The Trustees concluded that the breakpoint and the group fee waiver were sufficient to allow the Fund to benefit from economies of scale as its assets and overall complex assets grow.
The Trustees also considered information prepared by MFS relating to MFS’ costs and profits with respect to the Fund, the MFS Funds considered as a group, and other investment companies and accounts advised by MFS, as well as MFS’ methodologies used to determine and allocate its costs to the MFS Funds, the Fund and other accounts and products for purposes of estimating profitability.
After reviewing these and other factors described herein, the Trustees concluded, within the context of their overall conclusions regarding the investment advisory agreement, that the advisory fees charged to the Fund represent reasonable compensation in light of the services being provided by MFS to the Fund.
In addition, the Trustees considered MFS’ resources and related efforts to continue to retain, attract and motivate capable personnel to serve the Fund. The Trustees also considered current and developing conditions in the financial services industry, including the presence of large and well-capitalized companies which are spending, and appear to be prepared to continue to spend, substantial sums to engage personnel and to provide services to competing investment companies. In this regard, the Trustees also considered the financial resources of MFS and its ultimate parent, Sun Life Financial Inc. The Trustees also considered the advantages and possible disadvantages to the Fund of having an adviser that also serves other investment companies as well as other accounts.
The Trustees also considered the nature, quality, cost, and extent of administrative, transfer agency, and distribution services provided to the Fund by MFS and its affiliates under agreements and plans other than the investment advisory agreement, including any 12b-1 fees the Fund pays to MFS Fund Distributors, Inc., an affiliate of MFS. The Trustees also considered the nature, extent and quality of certain other services MFS performs or arranges for on the Fund’s behalf, which may include securities lending programs, directed expense payment programs, class action recovery programs, and MFS’ interaction with third-party service providers, principally custodians and sub-custodians. The Trustees concluded that the various non-advisory services provided by MFS and its affiliates on behalf of the Fund were satisfactory.
The Trustees considered so-called “fall-out benefits” to MFS such as reputational value derived from serving as investment manager to the MFS Funds. The Trustees also considered that MFS discontinued its historic practice of obtaining investment research from portfolio brokerage commissions paid by certain MFS Funds effective January 2018, and directly pays or voluntarily reimburses a Fund, if applicable, for the costs of external research acquired through the use of the Fund’s portfolio brokerage commissions.
Based on their evaluation of factors that they deemed to be material, including those factors described above, the Board of Trustees, including the independent Trustees, concluded that the Fund’s investment advisory agreement with MFS should be continued for an additional one-year period, commencing August 1, 2022.
MFS Mid Cap Value Portfolio
Proxy Voting Policies and Information
MFS votes proxies on behalf of the fund pursuant to proxy voting policies and procedures that are available without charge, upon request, by calling 1-800-225-2606, by visiting mfs.com/proxyvoting, or by visiting the SEC’s Web site at http://www.sec.gov.
Information regarding how the fund voted proxies relating to portfolio securities during the most recent twelve-month period ended June 30 is available by August 31 of each year without charge by visiting mfs.com/proxyvoting, or by visiting the SEC’s Web site at http://www.sec.gov.
Quarterly Portfolio Disclosure
The fund files a complete schedule of portfolio holdings with the SEC for the first and third quarters of each fiscal year as an exhibit to its reports on Form N-PORT. The fund’s Form N-PORT reports are available on the SEC’s Web site at http://www.sec.gov. A shareholder can obtain the portfolio holdings report for the first and third quarters of the fund's fiscal year at mfs.com/vit3 by choosing the fund's name and then scrolling to the “Resources” section and clicking on the “Prospectus and Reports” tab.
FURTHER INFORMATION
From time to time, MFS may post important information about the fund or the MFS Funds on the MFS Web site (mfs.com). This information is available at https://www.mfs.com/announcements or at mfs.com/vit3 by choosing the fund's name and then scrolling to the “Resources” section and clicking on the “Announcements” tab, if any.
Information About Fund Contracts and Legal Claims
The fund has entered into contractual arrangements with an investment adviser, administrator, distributor, shareholder servicing agent, and custodian who each provide services to the fund. Unless expressly stated otherwise, shareholders are not parties to, or intended beneficiaries of these contractual arrangements, and these contractual arrangements are not intended to create any shareholder right to enforce them against the service providers or to seek any remedy under them against the service providers, either directly or on behalf of the fund.
Under the Trust’s By-Laws and Declaration of Trust, any claims asserted against or on behalf of the MFS Funds, including claims against Trustees and Officers, must be brought in state and federal courts located within the Commonwealth of Massachusetts.
Federal Tax Information (unaudited)
The following information is provided pursuant to provisions of the Internal Revenue Code.
The fund designates $38,678,000 as capital gain dividends paid during the fiscal year.
For corporate shareholders, 58.66% of the ordinary income dividends paid during the fiscal year qualify for the corporate dividends received deduction.
| FACTS | WHAT DOES MFS DO WITH YOUR PERSONAL INFORMATION? |
| Why? | Financial companies choose how they share your personal information. Federal law gives consumers the right to limit some but not all sharing. Federal law also requires us to tell you how we collect, share, and protect your personal information. Please read this notice carefully to understand what we do. |
| What? | The types of personal information we collect and share depend on the product or service you have with us. This information can include: |
| • Social Security number and account balances |
| • Account transactions and transaction history |
| • Checking account information and wire transfer instructions |
| When you are no longer our customer, we continue to share your information as described in this notice. |
| How? | All financial companies need to share customers' personal information to run their everyday business. In the section below, we list the reasons financial companies can share their customers' personal information; the reasons MFS chooses to share; and whether you can limit this sharing. |
Reasons we can share your
personal information | Does MFS share? | Can you limit
this sharing? |
For our everyday business purposes –
such as to process your transactions, maintain your
account(s), respond to court orders and legal
investigations, or report to credit bureaus | Yes | No |
For our marketing purposes –
to offer our products and services to you | No | We don't share |
For joint marketing with other
financial companies | No | We don't share |
For our affiliates' everyday business purposes –
information about your transactions and experiences | No | We don't share |
For our affiliates' everyday business purposes –
information about your creditworthiness | No | We don't share |
| For nonaffiliates to market to you | No | We don't share |
| Questions? | Call 800-225-2606 or go to mfs.com. |
| Who we are |
| Who is providing this notice? | MFS Funds, MFS Investment Management, MFS Institutional Advisors, Inc., and MFS Heritage Trust Company. |
| What we do |
How does MFS
protect my personal
information? | To protect your personal information from unauthorized access and use, we use security measures that comply with federal law. These measures include procedural, electronic, and physical safeguards for the protection of the personal information we collect about you. |
How does MFS
collect my personal
information? | We collect your personal information, for example, when you |
| • open an account or provide account information |
| • direct us to buy securities or direct us to sell your securities |
| • make a wire transfer |
| We also collect your personal information from others, such as credit bureaus, affiliates, or other companies. |
| Why can't I limit all sharing? | Federal law gives you the right to limit only |
| • sharing for affiliates' everyday business purposes – information about your creditworthiness |
| • affiliates from using your information to market to you |
| • sharing for nonaffiliates to market to you |
| State laws and individual companies may give you additional rights to limit sharing. |
| Definitions |
| Affiliates | Companies related by common ownership or control. They can be financial and nonfinancial companies. |
| • MFS does not share personal information with affiliates, except for everyday business purposes as described on page one of this notice. |
| Nonaffiliates | Companies not related by common ownership or control. They can be financial and nonfinancial companies. |
| • MFS does not share with nonaffiliates so they can market to you. |
| Joint marketing | A formal agreement between nonaffiliated financial companies that together market financial products or services to you. |
| • MFS doesn't jointly market. |
| Other important information |
| If you own an MFS product or receive an MFS service in the name of a third party such as a bank or broker-dealer, their privacy policy may apply to you instead of ours. |
Annual Report
December 31, 2022
MFS® New Discovery
Value Portfolio
MFS® Variable Insurance Trust III
MFS® New Discovery Value Portfolio
| 1 |
| 2 |
| 3 |
| 5 |
| 7 |
| 8 |
| 13 |
| 14 |
| 15 |
| 16 |
| 18 |
| 24 |
| 25 |
| 28 |
| 30 |
| 30 |
| 30 |
| 30 |
| 30 |
| 31 |
The report is prepared for the general information of shareholders. It is authorized for distribution to prospective investors only when preceded or accompanied by a current prospectus.
NOT FDIC INSURED • MAY LOSE VALUE • NO BANK OR CREDIT UNION GUARANTEE •
NOT A DEPOSIT • NOT INSURED BY ANY FEDERAL GOVERNMENT AGENCY OR NCUA/NCUSIF
MFS New Discovery Value Portfolio
LETTER FROM THE CHAIR AND CEO
Dear Shareholders:
Signs of peaking inflation, hopes that monetary policy tightening cycles may be nearing an end and a rapid reopening of China’s economy in late-2022 and early-2023 have combined to bolster investor sentiment in recent months. Markets have largely adjusted to the challenges posed by Russia’s invasion of Ukraine, thanks in part to mild European winter weather which has alleviated concerns over potential shortages of natural gas. Resilient labor markets in much of the developed world have further contributed to a brighter-than-expected economic backdrop. However, many investors are mindful that the lagged effects of ongoing policy tightening have yet to work their way through the global economy.
Tighter global financial conditions have been a particular headwind for richly valued growth equities and interest rate-sensitive parts of the economy, such as housing. Over the near term, companies may face a challenging earnings backdrop as they are forced to absorb higher input and labor costs at a time of dwindling pricing power. For fixed income, the rise in interest rates has made bonds more attractive than they have been in years, which may provide balance to an overall portfolio.
During times of market transition, it is important to have a deep understanding of company fundamentals, and we have built our unique global research platform to do just that.
At MFS®, we put our clients’ assets to work responsibly by carefully navigating increasingly complex global capital markets. Our investment team is guided by a commitment to long-term fundamental investing. Our global investment platform — combining collective expertise, long-term discipline, and thoughtful risk management — seeks to uncover what we believe are the best, most durable investment ideas in markets around the world, enabling us to potentially create value for investors.
Respectfully,
Michael W. Roberge
Chair and Chief Executive Officer
MFS Investment Management
February 15, 2023
The opinions expressed in this letter are subject to change and may not be relied upon for investment advice. No forecasts can be guaranteed.
MFS New Discovery Value Portfolio
Portfolio structure
Top ten holdings
| International Game Technology PLC | 1.6% |
| Umpqua Holdings Corp. | 1.5% |
| Berry Global, Inc. | 1.5% |
| Skechers USA, Inc., “A” | 1.5% |
| Cathay General Bancorp, Inc. | 1.4% |
| Prestige Consumer Healthcare, Inc. | 1.4% |
| Prosperity Bancshares, Inc. | 1.4% |
| KBR, Inc. | 1.4% |
| Black Hills Corp. | 1.4% |
| SLM Corp. | 1.3% |
GICS equity sectors (g)
| Financials | 23.6% |
| Consumer Discretionary | 15.0% |
| Industrials | 13.6% |
| Materials | 11.2% |
| Information Technology | 8.3% |
| Energy | 7.2% |
| Health Care | 7.1% |
| Real Estate | 6.3% |
| Utilities | 4.7% |
| Consumer Staples | 2.0% |
| (g) | The Global Industry Classification Standard (GICS®) was developed by and/or is the exclusive property of MSCI, Inc. and S&P Global Market Intelligence Inc. (“S&P Global Market Intelligence”). GICS is a service mark of MSCI and S&P Global Market Intelligence and has been licensed for use by MFS. MFS has applied its own internal sector/industry classification methodology for equity securities and non-equity securities that are unclassified by GICS. |
Cash & Cash Equivalents includes any cash, investments in money market funds, short-term securities, and other assets less liabilities. Please see the Statement of Assets and Liabilities for additional information related to the fund’s cash position and other assets and liabilities.
Percentages are based on net assets as of December 31, 2022.
The portfolio is actively managed and current holdings may be different.
MFS New Discovery Value Portfolio
Management Review
Summary of Results
For the twelve months ended December 31, 2022, Initial Class shares of the MFS New Discovery Value Portfolio (fund) provided a total return of -10.96%, while Service Class shares of the fund provided a total return of -11.23%. These compare with a return of -14.48% over the same period for the fund’s benchmark, the Russell 2000® Value Index.
Market Environment
During the reporting period, markets continued to grapple with the strongest global inflationary pressures in decades along with signs of slowing economic growth. Intermittent coronavirus flareups, particularly in China, where home-grown vaccines have proved less effective than elsewhere, kept supply chains stretched for a considerable period. At the same time, the reopening of the economy in the parts of the world where the virus has been better contained has led to a shift in consumption patterns in favor of services, straining already tight labor markets in most developed economies, while reducing demand for manufactured goods, primarily from Asia. As a result of Russia’s invasion of Ukraine, geopolitical considerations, such as sanctions and trade bans, have resulted in additional supply chain disruptions and volatile global energy prices. Taken together, these factors have contributed to market volatility.
The ripple effects from the Russian invasion further complicated the mission central banks must undertake to rein in surging inflation. Energy shocks have historically resulted in global growth slowdowns, if not pullbacks, so policymakers will find themselves in the difficult position of trying to restrain inflation without tipping economies into recession. Despite the challenging macroeconomic and geopolitical environment, policymakers remained focused on controlling inflation, although investors appeared to have expected varying degrees of action from the central banks. The Fed has been among the most aggressive developed market central banks, tightening policy at the fastest rate in decades, although it slowed its hiking pace at the end of the period, as did the European Central Bank. After remaining on the monetary sidelines for much of the period, the Bank of Japan widened its Yield Curve Control band, capping the yield on its 10-year bond at 0.5%, up from 0.25%, an action investors interpreted as a first step toward monetary policy normalization.
Against an environment of still-tight labor markets, tighter global financial conditions and volatile materials prices, investor anxiety appeared to have increased over the potential that corporate profit margins may be past peak for this cycle. That said, tentative signs that supply chain bottlenecks (particularly semiconductors) may be moderating, the easing of COVID restrictions in China, low levels of unemployment across developed markets and hopes that inflation levels may be near a peak were supportive factors for the macroeconomic backdrop.
Contributors to Performance
Relative to the Russell 2000® Value Index, favorable stock selection in the financials sector contributed to the fund’s performance, led by its holdings of financial services firm Element Fleet Management(b) (Canada) and reinsurer Everest Reinsurance(b). The stock price of Element Fleet Management rose as the company reported strong revenue due to pent-up demand from the pandemic and a large backlog of customer orders for fleet vehicles.
Stock selection within the consumer discretionary sector also aided relative returns, driven by the fund’s holdings of strong-performing specialty value retailer Five Below(b). The stock price of Five Below advanced as the company posted better-than-expected sales and margins.
Security selection within the industrials sector was another contributor to relative performance, however, there were no individual stocks within this sector, either in the fund or in the benchmark, that were among the fund's largest relative contributors for the reporting period.
Elsewhere, the fund’s holdings of oil and natural gas property developer Viper Energy Partners(b), oil transportation and storage company Plains GP Holdings(b), consumer goods packaging manufacturer Silgan Holdings(b), integrated payment and frictionless commerce solutions provider Paya(b) and paper-based packing goods manufacturer Graphic Packaging(b) were among the fund’s top relative contributors for the reporting period. Additionally, the fund’s overweight position in oil and gas technology solutions and equipment provider ChampionX, and its avoidance of poor-performing multinational movie-theatre chain AMC Entertainment, also benefited relative performance.
Detractors from Performance
Stock selection in the materials sector detracted from relative performance, led by the fund’s holdings of cleaning and hygiene products provider Diversey(b) and metal beverage can manufacturer Ardagh Metal Packaging(b). Although Diversey delivered strong financial results, the stock price declined as the company cut its earnings guidance, citing higher raw material costs and unfavorable foreign exchange headwinds.
MFS New Discovery Value Portfolio
Management Review - continued
The combination of security selection and underweight allocations to both the energy and consumer staples sectors further weighed on the fund’s relative results. Within the energy sector, not owning shares of strong-performing oil and natural gas producers, Antero Resources, Ovintiv and Chesapeake Energy, hindered relative performance. The stock price of Antero Resources rose as the company reported better-than-expected Marcellus shale production figures and benefited from elevated energy prices. There were no individual stocks within the consumer staples sector, either in the fund or in the benchmark, that were among the fund's largest relative detractors for the reporting period.
Elsewhere, the fund’s holdings of clinical development company Syneos Health(b), self-storage property manager National Storage Affiliates Trust(b) and life sciences company Maravai Lifesciences Holdings(b), and its overweight positions in youth apparel retailer Zumiez and real estate investment trust Industrial Logistics Properties Trust(h), weakened relative performance. The stock price of Syneos Health declined as the company reported lower-than-expected revenue and depressed margins.
Respectfully,
Portfolio Manager(s)
Richard Offen and Kevin Schmitz
Note to Shareholders: Effective December 31, 2023, Kevin Schmitz will no longer be a Portfolio Manager of the fund.
| (b) | Security is not a benchmark constituent. |
| (h) | Security was not held in the portfolio at period end. |
The views expressed in this report are those of the portfolio manager(s) only through the end of the period of the report as stated on the cover and do not necessarily reflect the views of MFS or any other person in the MFS organization. These views are subject to change at any time based on market or other conditions, and MFS disclaims any responsibility to update such views. These views may not be relied upon as investment advice or an indication of trading intent on behalf of any MFS portfolio. References to specific securities are not recommendations of such securities, and may not be representative of any MFS portfolio’s current or future investments.
MFS New Discovery Value Portfolio
Performance Summary Through 12/31/22
The following chart illustrates the historical performance of the fund in comparison to its benchmark(s). Benchmarks are unmanaged and may not be invested in directly. Benchmark returns do not reflect any fees or expenses. The performance of other share classes will be greater than or less than that of the class depicted below. (See Notes to Performance Summary.)
Performance data shown represents past performance and is no guarantee of future results. Investment return and principal value fluctuate so your shares, when sold, may be worth more or less than the original cost; current performance may be lower or higher than quoted. The performance shown does not reflect the deduction of taxes, if any, that a shareholder would pay on fund distributions or the redemption of fund shares. The returns for the fund shown also do not reflect the deduction of expenses associated with variable products, such as mortality and expense risk charges, separate account charges, and sales charges imposed by the insurance company separate accounts. Such expenses would reduce the overall returns shown.
Growth of a Hypothetical $10,000 Investment
Total Returns through 12/31/22
Average annual total returns
| Share Class | Class Inception Date | 1-yr | 5-yr | 10-yr |
| Initial Class | 10/01/08 | (10.96)% | 8.20% | 11.84% |
| Service Class | 10/01/08 | (11.23)% | 7.92% | 11.56% |
Comparative benchmark(s)
| Russell 2000® Value Index (f) | (14.48)% | 4.13% | 8.48% |
| (f) | Source: FactSet Research Systems Inc. |
Benchmark Definition(s)
Russell 2000® Value Index(h) - a market-capitalization-weighted, value-oriented index that measures the performance of small-capitalization stocks that have relatively low price-to-book ratios and lower forecasted growth values.
It is not possible to invest directly in an index.
| (h) | Frank Russell Company (“Russell”) is the source and owner of the trademarks, service marks, and copyrights related to the Russell Indexes. Russell® is a trademark of Frank Russell Company. Neither Russell nor its licensors accept any liability for any errors or omissions in the Russell Indexes and/or Russell ratings or underlying data and no party may rely on any Russell Indexes and/or Russell ratings and/or underlying data contained in this document. No further distribution of Russell Data is permitted without Russell's express written consent. Russell does not promote, sponsor, or endorse the content of this document. |
MFS New Discovery Value Portfolio
Performance Summary – continued
Notes to Performance Summary
Average annual total return represents the average annual change in value for each share class for the periods presented.
Performance results reflect any applicable expense subsidies and waivers in effect during the periods shown. Without such subsidies and waivers the fund's performance results would be less favorable. Please see the prospectus and financial statements for complete details. All results are historical and assume the reinvestment of any dividends and capital gains distributions.
Performance results do not include adjustments made for financial reporting purposes in accordance with U.S. generally accepted accounting principles and may differ from amounts reported in the financial highlights.
From time to time the fund may receive proceeds from litigation settlements, without which performance would be lower.
MFS New Discovery Value Portfolio
Expense Table
Fund expenses borne by the shareholders during the period,
July 1, 2022 through December 31, 2022
As a shareholder of the fund, you incur ongoing costs, including management fees; distribution and/or service (12b-1) fees; and other fund expenses. This example is intended to help you understand your ongoing costs (in dollars) of investing in the fund and to compare these costs with the ongoing costs of investing in other mutual funds.
The example is based on an investment of $1,000 invested at the beginning of the period and held for the entire period July 1, 2022 through December 31, 2022.
Actual Expenses
The first line for each share class in the following table provides information about actual account values and actual expenses. You may use the information in this line, together with the amount you invested, to estimate the expenses that you paid over the period. Simply divide your account value by $1,000 (for example, an $8,600 account value divided by $1,000 = 8.6), then multiply the result by the number in the first line under the heading entitled “Expenses Paid During Period” to estimate the expenses you paid on your account during this period.
Hypothetical Example for Comparison Purposes
The second line for each share class in the following table provides information about hypothetical account values and hypothetical expenses based on the fund’s actual expense ratio and an assumed rate of return of 5% per year before expenses, which is not the fund’s actual return. The hypothetical account values and expenses may not be used to estimate the actual ending account balance or expenses you paid for the period. You may use this information to compare the ongoing costs of investing in the fund and other funds. To do so, compare this 5% hypothetical example with the 5% hypothetical examples that appear in the shareholder reports of the other funds.
Please note that the expenses shown in the table are meant to highlight the fund's ongoing costs only and do not take into account the fees and expenses imposed under the variable contracts through which your investment in the fund is made. Therefore, the second line for each share class in the table is useful in comparing ongoing costs associated with an investment in vehicles (such as the fund) which fund benefits under variable annuity and variable life insurance contracts and to qualified pension and retirement plans only, and will not help you determine the relative total costs of investing in the fund through variable annuity and variable life insurance contracts. If the fees and expenses imposed under the variable contracts were included, your costs would have been higher.
Share
Class | | Annualized
Expense
Ratio | Beginning
Account Value
7/01/22 | Ending
Account Value
12/31/22 | Expenses
Paid During
Period (p)
7/01/22-12/31/22 |
| Initial Class | Actual | 0.88% | $1,000.00 | $1,044.31 | $4.53 |
| Hypothetical (h) | 0.88% | $1,000.00 | $1,020.77 | $4.48 |
| Service Class | Actual | 1.13% | $1,000.00 | $1,043.18 | $5.82 |
| Hypothetical (h) | 1.13% | $1,000.00 | $1,019.51 | $5.75 |
| (h) | 5% class return per year before expenses. |
| (p) | “Expenses Paid During Period” are equal to each class's annualized expense ratio, as shown above, multiplied by the average account value over the period, multiplied by 184/365 (to reflect the one-half year period). |
MFS New Discovery Value Portfolio
Portfolio of Investments − 12/31/22
The Portfolio of Investments is a complete list of all securities owned by your fund. It is categorized by broad-based asset classes.
| Issuer | | | Shares/Par | Value ($) |
| Common Stocks – 99.0% |
| Aerospace & Defense – 2.6% | |
| CACI International, Inc., “A” (a) | | 1,897 | $ 570,219 |
| KBR, Inc. | | 11,924 | 629,587 |
| | | | | $1,199,806 |
| Apparel Manufacturers – 3.3% | |
| Canada Goose Holdings, Inc. (a)(l) | | 17,683 | $ 314,934 |
| PVH Corp. | | 7,195 | 507,895 |
| Skechers USA, Inc., “A” (a) | | 16,687 | 700,020 |
| | | | | $1,522,849 |
| Automotive – 3.0% | |
| LKQ Corp. | | 11,276 | $ 602,251 |
| Methode Electronics, Inc. | | 11,103 | 492,640 |
| Visteon Corp. (a) | | 2,126 | 278,145 |
| | | | | $1,373,036 |
| Brokerage & Asset Managers – 1.0% | |
| Focus Financial Partners, “A” (a) | | 11,866 | $ 442,246 |
| Business Services – 3.2% | |
| HireRight Holdings Corp. (a) | | 18,447 | $ 218,782 |
| Paya, Inc. (a) | | 70,352 | 553,670 |
| TaskUs, Inc., “A” (a) | | 10,730 | 181,337 |
| Thoughtworks Holding, Inc. (a) | | 24,627 | 250,949 |
| WNS (Holdings) Ltd., ADR (a) | | 3,087 | 246,929 |
| | | | | $1,451,667 |
| Chemicals – 2.0% | |
| Avient Corp. | | 14,445 | $ 487,663 |
| Element Solutions, Inc. | | 24,720 | 449,657 |
| | | | | $937,320 |
| Computer Software – 1.6% | |
| ACI Worldwide, Inc. (a) | | 17,875 | $ 411,125 |
| Everbridge, Inc. (a) | | 5,815 | 172,008 |
| Sabre Corp. (a) | | 26,033 | 160,884 |
| | | | | $744,017 |
| Computer Software - Systems – 1.3% | |
| Softchoice Corp. (l) | | 23,184 | $ 312,659 |
| Verint Systems, Inc. (a) | | 8,143 | 295,428 |
| | | | | $608,087 |
| Construction – 1.0% | |
| Toll Brothers, Inc. | | 8,758 | $ 437,199 |
| Consumer Products – 2.0% | |
| Newell Brands, Inc. | | 20,947 | $ 273,987 |
| Prestige Consumer Healthcare, Inc. (a) | | 10,286 | 643,903 |
| | | | | $917,890 |
MFS New Discovery Value Portfolio
Portfolio of Investments – continued
| Issuer | | | Shares/Par | Value ($) |
| Common Stocks – continued |
| Consumer Services – 1.4% | |
| Bright Horizons Family Solutions, Inc. (a) | | 4,799 | $ 302,817 |
| Grand Canyon Education, Inc. (a) | | 3,350 | 353,961 |
| | | | | $656,778 |
| Containers – 3.3% | |
| Ardagh Metal Packaging S.A. | | 59,741 | $ 287,354 |
| Graphic Packaging Holding Co. | | 22,143 | 492,682 |
| Pactiv Evergreen, Inc. | | 15,131 | 171,888 |
| Silgan Holdings, Inc. | | 10,582 | 548,571 |
| | | | | $1,500,495 |
| Electrical Equipment – 4.4% | |
| Berry Global, Inc. | | 11,604 | $ 701,230 |
| nVent Electric PLC | | 11,781 | 453,215 |
| TriMas Corp. | | 16,719 | 463,785 |
| Vertiv Holdings Co. | | 28,576 | 390,348 |
| | | | | $2,008,578 |
| Electronics – 1.6% | |
| Cohu, Inc. (a) | | 10,295 | $ 329,955 |
| Plexus Corp. (a) | | 3,923 | 403,794 |
| | | | | $733,749 |
| Energy - Independent – 3.1% | |
| CNX Resources Corp. (a) | | 30,618 | $ 515,607 |
| Magnolia Oil & Gas Corp., “A” | | 16,273 | 381,602 |
| Viper Energy Partners LP | | 16,392 | 521,102 |
| | | | | $1,418,311 |
| Food & Beverages – 2.0% | |
| Hostess Brands, Inc. (a) | | 14,338 | $ 321,744 |
| Nomad Foods Ltd. (a) | | 33,749 | 581,833 |
| | | | | $903,577 |
| Gaming & Lodging – 1.6% | |
| International Game Technology PLC | | 32,370 | $ 734,151 |
| General Merchandise – 1.0% | |
| Five Below, Inc. (a) | | 2,693 | $ 476,311 |
| Insurance – 4.2% | |
| CNO Financial Group, Inc. | | 18,431 | $ 421,148 |
| Everest Re Group Ltd. | | 1,675 | 554,877 |
| Hanover Insurance Group, Inc. | | 3,027 | 409,039 |
| Selective Insurance Group, Inc. | | 6,306 | 558,775 |
| | | | | $1,943,839 |
| Leisure & Toys – 1.4% | |
| Brunswick Corp. | | 3,895 | $ 280,752 |
| Funko, Inc., “A” (a) | | 19,056 | 207,901 |
| Hayward Holdings, Inc. (a) | | 17,496 | 164,462 |
| | | | | $653,115 |
MFS New Discovery Value Portfolio
Portfolio of Investments – continued
| Issuer | | | Shares/Par | Value ($) |
| Common Stocks – continued |
| Machinery & Tools – 4.4% | |
| ESAB Corp. | | 9,845 | $ 461,928 |
| Flowserve Corp. | | 15,145 | 464,649 |
| ITT, Inc. | | 2,892 | 234,541 |
| Regal Rexnord Corp. | | 2,994 | 359,220 |
| Timken Co. | | 6,987 | 493,771 |
| | | | | $2,014,109 |
| Medical & Health Technology & Services – 2.7% | |
| ICON PLC (a) | | 1,773 | $ 344,405 |
| Premier, Inc., “A” | | 13,300 | 465,234 |
| Syneos Health, Inc. (a) | | 11,180 | 410,083 |
| | | | | $1,219,722 |
| Medical Equipment – 2.5% | |
| Agiliti Health, Inc. (a) | | 13,171 | $ 214,819 |
| Envista Holdings Corp. (a) | | 11,896 | 400,538 |
| Maravai Lifesciences Holdings, Inc., “A” (a) | | 11,748 | 168,114 |
| Quidel Corp. (a) | | 4,180 | 358,101 |
| | | | | $1,141,572 |
| Metals & Mining – 1.2% | |
| Arconic Corp. (a) | | 16,207 | $ 342,940 |
| Kaiser Aluminum Corp. | | 2,603 | 197,724 |
| | | | | $540,664 |
| Natural Gas - Distribution – 2.1% | |
| New Jersey Resources Corp. | | 9,907 | $ 491,585 |
| ONE Gas, Inc. | | 6,142 | 465,072 |
| | | | | $956,657 |
| Natural Gas - Pipeline – 1.1% | |
| Plains GP Holdings LP | | 39,652 | $ 493,271 |
| Oil Services – 3.0% | |
| ChampionX Corp. | | 17,857 | $ 517,674 |
| Expro Group Holdings N.V. (a) | | 27,145 | 492,139 |
| Helmerich & Payne | | 7,675 | 380,450 |
| | | | | $1,390,263 |
| Other Banks & Diversified Financials – 19.4% | |
| Air Lease Corp. | | 14,384 | $ 552,633 |
| Bank of Hawaii Corp. | | 6,936 | 537,956 |
| Brookline Bancorp, Inc. | | 33,735 | 477,350 |
| Cathay General Bancorp, Inc. | | 16,134 | 658,106 |
| East West Bancorp, Inc. | | 7,504 | 494,514 |
| Element Fleet Management Corp. (l) | | 25,627 | 349,201 |
| First Hawaiian, Inc. | | 17,888 | 465,803 |
| First Interstate BancSystem, Inc. | | 13,532 | 523,012 |
| Hanmi Financial Corp. | | 15,385 | 380,779 |
| Pacific Premier Bancorp, Inc. | | 12,130 | 382,823 |
| Prosperity Bancshares, Inc. | | 8,851 | 643,291 |
| Sandy Spring Bancorp, Inc. | | 8,384 | 295,368 |
| SLM Corp. | | 37,185 | 617,271 |
| Texas Capital Bancshares, Inc. (a) | | 6,029 | 363,609 |
| Textainer Group Holdings Ltd. | | 7,847 | 243,335 |
MFS New Discovery Value Portfolio
Portfolio of Investments – continued
| Issuer | | | Shares/Par | Value ($) |
| Common Stocks – continued |
| Other Banks & Diversified Financials – continued | |
| UMB Financial Corp. | | 6,742 | $ 563,092 |
| Umpqua Holdings Corp. | | 39,435 | 703,915 |
| Wintrust Financial Corp. | | 2,963 | 250,433 |
| Zions Bancorp NA | | 7,862 | 386,496 |
| | | | | $8,888,987 |
| Pharmaceuticals – 0.5% | |
| Organon & Co. | | 9,047 | $ 252,683 |
| Real Estate – 7.0% | |
| Brixmor Property Group, Inc., REIT | | 14,039 | $ 318,264 |
| Broadstone Net Lease, Inc., REIT | | 29,416 | 476,833 |
| Cushman & Wakefield PLC (a) | | 15,867 | 197,703 |
| Douglas Emmett, Inc., REIT | | 7,323 | 114,825 |
| Empire State Realty Trust, REIT, “A” | | 47,704 | 321,525 |
| Life Storage, Inc., REIT | | 1,801 | 177,399 |
| LXP Industrial Trust, REIT | | 37,075 | 371,492 |
| National Storage Affiliates Trust, REIT | | 9,027 | 326,055 |
| Phillips Edison & Co., REIT | | 18,523 | 589,772 |
| Two Harbors Investment Corp., REIT | | 20,037 | 315,983 |
| | | | | $3,209,851 |
| Restaurants – 0.8% | |
| Jack in the Box, Inc. | | 5,101 | $ 348,041 |
| Specialty Chemicals – 2.2% | |
| Axalta Coating Systems Ltd. (a) | | 16,032 | $ 408,335 |
| Diversey Holdings Ltd. (a) | | 79,823 | 340,046 |
| Quaker Chemical Corp. | | 1,495 | 249,515 |
| | | | | $997,896 |
| Specialty Stores – 2.3% | |
| Monro Muffler Brake, Inc. | | 6,579 | $ 297,371 |
| Urban Outfitters, Inc. (a) | | 18,118 | 432,114 |
| Zumiez, Inc. (a) | | 14,058 | 305,621 |
| | | | | $1,035,106 |
| Trucking – 2.2% | |
| RXO, Inc. (a) | | 17,974 | $ 309,153 |
| Schneider National, Inc. | | 14,761 | 345,407 |
| XPO Logistics, Inc. (a) | | 10,634 | 354,006 |
| | | | | $1,008,566 |
| Utilities - Electric Power – 2.6% | |
| Black Hills Corp. | | 8,832 | $ 621,243 |
| Portland General Electric Co. | | 11,704 | 573,496 |
| | | | | $1,194,739 |
| Total Common Stocks (Identified Cost, $36,380,194) | | $45,355,148 |
| Investment Companies (h) – 1.1% |
| Money Market Funds – 1.1% | |
| MFS Institutional Money Market Portfolio, 4.02% (v) (Identified Cost, $512,579) | | | 512,556 | $ 512,710 |
MFS New Discovery Value Portfolio
Portfolio of Investments – continued
| Issuer | | | Shares/Par | Value ($) |
| Collateral for Securities Loaned – 0.3% |
| State Street Navigator Securities Lending Government Money Market Portfolio, 4.33% (j) (Identified Cost, $143,945) | | | 143,945 | $ 143,945 |
| Other Assets, Less Liabilities – (0.4)% | | (176,127) |
| Net Assets – 100.0% | $45,835,676 |
| (a) | Non-income producing security. | | | |
| (h) | An affiliated issuer, which may be considered one in which the fund owns 5% or more of the outstanding voting securities, or a company which is under common control. At period end, the aggregate values of the fund's investments in affiliated issuers and in unaffiliated issuers were $512,710 and $45,499,093, respectively. | | | |
| (j) | The rate quoted is the annualized seven-day yield of the fund at period end. | | | |
| (l) | A portion of this security is on loan. See Note 2 for additional information. | | | |
| (v) | Affiliated issuer that is available only to investment companies managed by MFS. The rate quoted for the MFS Institutional Money Market Portfolio is the annualized seven-day yield of the fund at period end. | | | |
| The following abbreviations are used in this report and are defined: |
| ADR | American Depositary Receipt |
| REIT | Real Estate Investment Trust |
See Notes to Financial Statements
MFS New Discovery Value Portfolio
| Financial Statements | Statement of Assets and Liabilities |
This statement represents your fund’s balance sheet, which details the assets and liabilities comprising the total value of the fund.
| At 12/31/22Assets | |
| Investments in unaffiliated issuers, at value, including $141,318 of securities on loan (identified cost, $36,524,139) | $45,499,093 |
| Investments in affiliated issuers, at value (identified cost, $512,579) | 512,710 |
| Receivables for | |
| Fund shares sold | 655 |
| Interest and dividends | 51,090 |
| Receivable from investment adviser | 8,238 |
| Other assets | 516 |
| Total assets | $46,072,302 |
| Liabilities | |
| Payables for | |
| Fund shares reacquired | $43,556 |
| Collateral for securities loaned, at value | 143,945 |
| Payable to affiliates | |
| Administrative services fee | 144 |
| Shareholder servicing costs | 16 |
| Distribution and/or service fees | 269 |
| Payable for independent Trustees' compensation | 83 |
| Accrued expenses and other liabilities | 48,613 |
| Total liabilities | $236,626 |
| Net assets | $45,835,676 |
| Net assets consist of | |
| Paid-in capital | $34,523,037 |
| Total distributable earnings (loss) | 11,312,639 |
| Net assets | $45,835,676 |
| Shares of beneficial interest outstanding | 5,802,196 |
| | Net assets | Shares
outstanding | Net asset value
per share |
| Initial Class | $32,664,679 | 4,116,784 | $7.93 |
| Service Class | 13,170,997 | 1,685,412 | 7.81 |
See Notes to Financial Statements
MFS New Discovery Value Portfolio
| Financial Statements | Statement of Operations |
This statement describes how much your fund earned in investment income and accrued in expenses. It also describes any gains and/or losses generated by fund operations.
| Year ended 12/31/22 | |
| Net investment income (loss) | |
| Income | |
| Dividends | $843,691 |
| Dividends from affiliated issuers | 8,333 |
| Other | 3,557 |
| Income on securities loaned | 1,999 |
| Foreign taxes withheld | (5,912) |
| Total investment income | $851,668 |
| Expenses | |
| Management fee | $436,771 |
| Distribution and/or service fees | 33,533 |
| Shareholder servicing costs | 4,170 |
| Administrative services fee | 17,624 |
| Independent Trustees' compensation | 3,062 |
| Custodian fee | 5,226 |
| Shareholder communications | 4,579 |
| Audit and tax fees | 59,818 |
| Legal fees | 251 |
| Miscellaneous | 26,530 |
| Total expenses | $591,564 |
| Reduction of expenses by investment adviser | (130,980) |
| Net expenses | $460,584 |
| Net investment income (loss) | $391,084 |
| Realized and unrealized gain (loss) | |
| Realized gain (loss) (identified cost basis) | |
| Unaffiliated issuers | $4,373,665 |
| Affiliated issuers | (16) |
| Foreign currency | 121 |
| Net realized gain (loss) | $4,373,770 |
| Change in unrealized appreciation or depreciation | |
| Unaffiliated issuers | $(10,596,795) |
| Affiliated issuers | 131 |
| Translation of assets and liabilities in foreign currencies | (36) |
| Net unrealized gain (loss) | $(10,596,700) |
| Net realized and unrealized gain (loss) | $(6,222,930) |
| Change in net assets from operations | $(5,831,846) |
See Notes to Financial Statements
MFS New Discovery Value Portfolio
| Financial Statements | Statements of Changes in Net Assets |
These statements describe the increases and/or decreases in net assets resulting from operations, any distributions, and any shareholder transactions.
| | Year ended |
| | 12/31/22 | 12/31/21 |
| Change in net assets | | |
| From operations | | |
| Net investment income (loss) | $391,084 | $284,504 |
| Net realized gain (loss) | 4,373,770 | 11,782,149 |
| Net unrealized gain (loss) | (10,596,700) | 3,812,772 |
| Change in net assets from operations | $(5,831,846) | $15,879,425 |
| Total distributions to shareholders | $(10,618,121) | $(1,651,131) |
| Change in net assets from fund share transactions | $7,079,354 | $(14,070,396) |
| Total change in net assets | $(9,370,613) | $157,898 |
| Net assets | | |
| At beginning of period | 55,206,289 | 55,048,391 |
| At end of period | $45,835,676 | $55,206,289 |
See Notes to Financial Statements
MFS New Discovery Value Portfolio
| Financial Statements | Financial Highlights |
The financial highlights table is intended to help you understand the fund's financial performance for the past 5 years. Certain information reflects financial results for a single fund share. The total returns in the table represent the rate that an investor would have earned (or lost) on an investment in the fund share class (assuming reinvestment of all distributions) held for the entire period.
| Initial Class | Year ended |
| | 12/31/22 | 12/31/21 | 12/31/20 | 12/31/19 | 12/31/18 |
| Net asset value, beginning of period | $11.40 | $8.77 | $9.33 | $8.45 | $11.13 |
| Income (loss) from investment operations | | | | | |
| Net investment income (loss) (d) | $0.08 | $0.06 | $0.07 | $0.10 | $0.08 |
| Net realized and unrealized gain (loss) | (1.27) | 2.91 | 0.14 | 2.46 | (0.94) |
| Total from investment operations | $(1.19) | $2.97 | $0.21 | $2.56 | $(0.86) |
| Less distributions declared to shareholders | | | | | |
| From net investment income | $(0.07) | $(0.09) | $(0.08) | $(0.08) | $(0.06) |
| From net realized gain | (2.21) | (0.25) | (0.69) | (1.60) | (1.76) |
| Total distributions declared to shareholders | $(2.28) | $(0.34) | $(0.77) | $(1.68) | $(1.82) |
| Net asset value, end of period (x) | $7.93 | $11.40 | $8.77 | $9.33 | $8.45 |
| Total return (%) (k)(r)(s)(x) | (10.96) | 34.05 | 4.19 | 33.65 | (10.78) |
Ratios (%) (to average net assets)
and Supplemental data: | | | | | |
| Expenses before expense reductions | 1.15 | 1.12 | 1.14 | 1.13 | 1.11 |
| Expenses after expense reductions | 0.88 | 0.88 | 0.88 | 0.88 | 0.88 |
| Net investment income (loss) | 0.87 | 0.58 | 0.90 | 1.02 | 0.72 |
| Portfolio turnover | 32 | 51 | 84 | 38 | 55 |
| Net assets at end of period (000 omitted) | $32,665 | $40,980 | $44,834 | $41,098 | $36,665 |
| Service Class | Year ended |
| | 12/31/22 | 12/31/21 | 12/31/20 | 12/31/19 | 12/31/18 |
| Net asset value, beginning of period | $11.27 | $8.67 | $9.25 | $8.38 | $11.05 |
| Income (loss) from investment operations | | | | | |
| Net investment income (loss) (d) | $0.06 | $0.04 | $0.05 | $0.07 | $0.05 |
| Net realized and unrealized gain (loss) | (1.27) | 2.88 | 0.12 | 2.45 | (0.93) |
| Total from investment operations | $(1.21) | $2.92 | $0.17 | $2.52 | $(0.88) |
| Less distributions declared to shareholders | | | | | |
| From net investment income | $(0.04) | $(0.07) | $(0.06) | $(0.05) | $(0.03) |
| From net realized gain | (2.21) | (0.25) | (0.69) | (1.60) | (1.76) |
| Total distributions declared to shareholders | $(2.25) | $(0.32) | $(0.75) | $(1.65) | $(1.79) |
| Net asset value, end of period (x) | $7.81 | $11.27 | $8.67 | $9.25 | $8.38 |
| Total return (%) (k)(r)(s)(x) | (11.23) | 33.87 | 3.73 | 33.43 | (11.00) |
Ratios (%) (to average net assets)
and Supplemental data: | | | | | |
| Expenses before expense reductions | 1.40 | 1.37 | 1.39 | 1.38 | 1.36 |
| Expenses after expense reductions | 1.13 | 1.13 | 1.13 | 1.13 | 1.13 |
| Net investment income (loss) | 0.63 | 0.36 | 0.66 | 0.78 | 0.45 |
| Portfolio turnover | 32 | 51 | 84 | 38 | 55 |
| Net assets at end of period (000 omitted) | $13,171 | $14,227 | $10,215 | $9,518 | $8,387 |
See Notes to Financial Statements
MFS New Discovery Value Portfolio
Financial Highlights - continued
| (d) | Per share data is based on average shares outstanding. |
| (k) | The total return does not reflect expenses that apply to separate accounts. Inclusion of these charges would reduce the total return figures for all periods shown. |
| (r) | Certain expenses have been reduced without which performance would have been lower. |
| (s) | From time to time the fund may receive proceeds from litigation settlements, without which performance would be lower. |
| (x) | The net asset values and total returns have been calculated on net assets which include adjustments made in accordance with U.S. generally accepted accounting principles required at period end for financial reporting purposes. |
See Notes to Financial Statements
MFS New Discovery Value Portfolio
Notes to Financial Statements
(1) Business and Organization
MFS New Discovery Value Portfolio (the fund) is a diversified series of MFS Variable Insurance Trust III (the trust). The trust is organized as a Delaware statutory trust and is registered under the Investment Company Act of 1940, as amended, as an open-end management investment company. The shareholders of each series of the trust are separate accounts of insurance companies, which offer variable annuity and/or life insurance products, and qualified retirement and pension plans.
The fund is an investment company and accordingly follows the investment company accounting and reporting guidance of the Financial Accounting Standards Board (FASB) Accounting Standards Codification Topic 946 Financial Services - Investment Companies.
(2) Significant Accounting Policies
General — The preparation of financial statements in conformity with U.S. generally accepted accounting principles requires management to make estimates and assumptions that affect the reported amounts of assets and liabilities, and disclosure of contingent assets and liabilities at the date of the financial statements and the reported amounts of increases and decreases in net assets from operations during the reporting period. Actual results could differ from those estimates. In the preparation of these financial statements, management has evaluated subsequent events occurring after the date of the fund’s Statement of Assets and Liabilities through the date that the financial statements were issued. The fund will generally focus on securities of small size companies which may be more volatile than those of larger companies.
Balance Sheet Offsetting — The fund's accounting policy with respect to balance sheet offsetting is that, absent an event of default by the counterparty or a termination of the agreement, the International Swaps and Derivatives Association (ISDA) Master Agreement, or similar agreement, does not result in an offset of reported amounts of financial assets and financial liabilities in the Statement of Assets and Liabilities across transactions between the fund and the applicable counterparty. The fund's right to setoff may be restricted or prohibited by the bankruptcy or insolvency laws of the particular jurisdiction to which a specific master netting agreement counterparty is subject. Balance sheet offsetting disclosures, to the extent applicable to the fund, have been included in the fund’s Significant Accounting Policies note under the captions for each of the fund’s in-scope financial instruments and transactions.
Investment Valuations — Subject to its oversight, the fund's Board of Trustees has delegated primary responsibility for determining or causing to be determined the value of the fund’s investments to MFS as the fund's adviser, pursuant to the fund’s valuation policy and procedures which have been adopted by the adviser and approved by the Board. Effective September 8, 2022, and in accordance with Rule 2a-5 under the Investment Company Act of 1940, the Board of Trustees designated the adviser as the “valuation designee” of the fund. If the adviser, as valuation designee, determines that reliable market quotations are not readily available for an investment, the investment is valued at fair value as determined in good faith by the adviser in accordance with the adviser’s fair valuation policy and procedures.
Under the fund's valuation policy and procedures, equity securities, including restricted equity securities, are generally valued at the last sale or official closing price on their primary market or exchange as provided by a third-party pricing service. Equity securities, for which there were no sales reported that day, are generally valued at the last quoted daily bid quotation on their primary market or exchange as provided by a third-party pricing service. Short-term instruments with a maturity at issuance of 60 days or less may be valued at amortized cost, which approximates market value. Open-end investment companies are generally valued at net asset value per share. The values of foreign securities and other assets and liabilities expressed in foreign currencies are converted to U.S. dollars using the mean of bid and asked prices for rates provided by a third-party pricing service.
Under the fund’s valuation policy and procedures, market quotations are not considered to be readily available for debt instruments, floating rate loans, and many types of derivatives. These investments are generally valued at fair value based on information from third-party pricing services or otherwise determined by the adviser in accordance with the adviser’s fair valuation policy and procedures. Securities and other assets generally valued on the basis of information from a third-party pricing service may also be valued at a broker/dealer bid quotation. In determining values, third-party pricing services can utilize both transaction data and market information such as yield, quality, coupon rate, maturity, type of issue, trading characteristics, spreads and other market data. An investment may also be valued at fair value if the adviser determines that the investment’s value has been materially affected by events occurring after the close of the exchange or market on which the investment is principally traded (such as foreign exchange or market) and prior to the determination of the fund’s net asset value, or after the halt of trading of a specific security where trading does not resume prior to the close of the exchange or market on which the security is principally traded. Events that occur after foreign markets close (such as developments in foreign markets and significant movements in the U.S. markets) and prior to the determination of the fund’s net asset value may be deemed to have a material effect on the value of securities traded in foreign markets. Accordingly, the fund’s foreign equity securities may often be valued at fair value. The adviser generally relies on third-party pricing services or other information (such as the correlation with price movements of similar securities in the same or other markets;
MFS New Discovery Value Portfolio
Notes to Financial Statements - continued
the type, cost and investment characteristics of the security; the business and financial condition of the issuer; and trading and other market data) to assist in determining whether to fair value and at what value to fair value an investment. The value of an investment for purposes of calculating the fund’s net asset value can differ depending on the source and method used to determine value. When fair valuation is used, the value of an investment used to determine the fund’s net asset value may differ from quoted or published prices for the same investment. There can be no assurance that the fund could obtain the fair value assigned to an investment if it were to sell the investment at the same time at which the fund determines its net asset value per share.
Various inputs are used in determining the value of the fund's assets or liabilities. These inputs are categorized into three broad levels. In certain cases, the inputs used to measure fair value may fall into different levels of the fair value hierarchy. In such cases, an investment's level within the fair value hierarchy is based on the lowest level of input that is significant to the fair value measurement. The fund's assessment of the significance of a particular input to the fair value measurement in its entirety requires judgment, and considers factors specific to the investment. Level 1 includes unadjusted quoted prices in active markets for identical assets or liabilities. Level 2 includes other significant observable market-based inputs (including quoted prices for similar securities, interest rates, prepayment speed, and credit risk). Level 3 includes significant unobservable inputs, which may include the adviser's own assumptions in determining the fair value of investments. The following is a summary of the levels used as of December 31, 2022 in valuing the fund's assets and liabilities:
| Financial Instruments | Level 1 | Level 2 | Level 3 | Total |
| Equity Securities | $45,355,148 | $— | $— | $45,355,148 |
| Mutual Funds | 656,655 | — | — | 656,655 |
| Total | $46,011,803 | $— | $— | $46,011,803 |
For further information regarding security characteristics, see the Portfolio of Investments.
Foreign Currency Translation — Purchases and sales of foreign investments, income, and expenses are converted into U.S. dollars based upon currency exchange rates prevailing on the respective dates of such transactions or on the reporting date for foreign denominated receivables and payables. Gains and losses attributable to foreign currency exchange rates on sales of securities are recorded for financial statement purposes as net realized gains and losses on investments. Gains and losses attributable to foreign exchange rate movements on receivables, payables, income and expenses are recorded for financial statement purposes as foreign currency transaction gains and losses. That portion of both realized and unrealized gains and losses on investments that results from fluctuations in foreign currency exchange rates is not separately disclosed.
Security Loans — Under its Securities Lending Agency Agreement with the fund, State Street Bank and Trust Company, as lending agent, loans the securities of the fund to certain qualified institutions (the “Borrowers”) approved by the fund. Security loans can be terminated at the discretion of either the lending agent or the fund and the related securities must be returned within the earlier of the standard trade settlement period for such securities or within three business days. The loans are collateralized by cash and/or U.S. Treasury and federal agency obligations in an amount typically at least equal to the market value of the securities loaned. On loans collateralized by cash, the cash collateral is invested in a money market fund. The market value of the loaned securities is determined at the close of business of the fund and any additional required collateral is delivered to the fund on the next business day. The lending agent provides the fund with indemnification against Borrower default. In the event of Borrower default, the lending agent will, for the benefit of the fund, either purchase securities identical to those loaned or, when such purchase is commercially impracticable, pay the fund the market value of the loaned securities. In return, the lending agent assumes the fund's rights to the related collateral. If the collateral value is less than the cost to purchase identical securities, the lending agent is responsible for the shortfall, but only to the extent that such shortfall is not due to a decline in collateral value resulting from collateral reinvestment for which the fund bears the risk of loss. At period end, the fund had investment securities on loan, all of which were classified as equity securities in the fund's Portfolio of Investments, with a fair value of $141,318. The fair value of the fund's investment securities on loan and a related liability of $143,945 for cash collateral received on securities loaned are both presented gross in the Statement of Assets and Liabilities. The collateral on securities loaned exceeded the value of securities on loan at period end. The liability for cash collateral for securities loaned is carried at fair value, which is categorized as level 2 within the fair value hierarchy. A portion of the income generated upon investment of the collateral is remitted to the Borrowers, and the remainder is allocated between the fund and the lending agent. On loans collateralized by U.S. Treasury and/or federal agency obligations, a fee is received from the Borrower, and is allocated between the fund and the lending agent. Income from securities lending is separately reported in the Statement of Operations. The dividend and interest income earned on the securities loaned is accounted for in the same manner as other dividend and interest income.
Indemnifications — Under the fund's organizational documents, its officers and Trustees may be indemnified against certain liabilities and expenses arising out of the performance of their duties to the fund. Additionally, in the normal course of business, the fund enters into agreements with service providers that may contain indemnification clauses. The fund's maximum exposure under these agreements is unknown as this would involve future claims that may be made against the fund that have not yet occurred.
MFS New Discovery Value Portfolio
Notes to Financial Statements - continued
Investment Transactions and Income — Investment transactions are recorded on the trade date. Dividends received in cash are recorded on the ex-dividend date. Certain dividends from foreign securities will be recorded when the fund is informed of the dividend if such information is obtained subsequent to the ex-dividend date. Dividend payments received in additional securities are recorded on the ex-dividend date in an amount equal to the value of the security on such date. In determining the net gain or loss on securities sold, the cost of securities is determined on the identified cost basis.
The fund may receive proceeds from litigation settlements. Any proceeds received from litigation involving portfolio holdings are reflected in the Statement of Operations in realized gain/loss if the security has been disposed of by the fund or in unrealized gain/loss if the security is still held by the fund. Any other proceeds from litigation not related to portfolio holdings are reflected as other income in the Statement of Operations.
Tax Matters and Distributions — The fund intends to qualify as a regulated investment company, as defined under Subchapter M of the Internal Revenue Code, and to distribute all of its taxable income, including realized capital gains. As a result, no provision for federal income tax is required. The fund’s federal tax returns, when filed, will remain subject to examination by the Internal Revenue Service for a three year period. Management has analyzed the fund’s tax positions taken on federal and state tax returns for all open tax years and does not believe that there are any uncertain tax positions that require recognition of a tax liability. Foreign taxes, if any, have been accrued by the fund in the accompanying financial statements in accordance with the applicable foreign tax law. Foreign income taxes may be withheld by certain countries in which the fund invests. Additionally, capital gains realized by the fund on securities issued in or by certain foreign countries may be subject to capital gains tax imposed by those countries.
Distributions to shareholders are recorded on the ex-dividend date. Income and capital gain distributions are determined in accordance with income tax regulations, which may differ from U.S. generally accepted accounting principles. Certain capital accounts in the financial statements are periodically adjusted for permanent differences in order to reflect their tax character. These adjustments have no impact on net assets or net asset value per share. Temporary differences which arise from recognizing certain items of income, expense, gain or loss in different periods for financial statement and tax purposes will reverse at some time in the future.
Book/tax differences primarily relate to passive foreign investment companies and wash sale loss deferrals.
The tax character of distributions declared to shareholders for the last two fiscal years is as follows:
| | Year ended
12/31/22 | Year ended
12/31/21 |
| Ordinary income (including any short-term capital gains) | $4,595,522 | $1,311,100 |
| Long-term capital gains | 6,022,599 | 340,031 |
| Total distributions | $10,618,121 | $1,651,131 |
The federal tax cost and the tax basis components of distributable earnings were as follows:
| As of 12/31/22 | |
| Cost of investments | $39,191,807 |
| Gross appreciation | 9,995,770 |
| Gross depreciation | (3,175,774) |
| Net unrealized appreciation (depreciation) | $6,819,996 |
| Undistributed ordinary income | 708,391 |
| Undistributed long-term capital gain | 3,784,246 |
| Other temporary differences | 6 |
| Total distributable earnings (loss) | $11,312,639 |
Multiple Classes of Shares of Beneficial Interest — The fund offers multiple classes of shares, which differ in their respective distribution and/or service fees. The fund's income, realized and unrealized gain (loss), and common expenses are allocated to shareholders based on the daily net assets of each class. Dividends are declared separately for each class. Differences in per share dividend rates are generally due to differences in separate class expenses. The fund’s distributions declared to shareholders as reported in the Statements of Changes in Net Assets are presented by class as follows:
MFS New Discovery Value Portfolio
Notes to Financial Statements - continued
| | Year
ended
12/31/22 | | Year
ended
12/31/21 |
| Initial Class | $7,623,891 | | $1,259,904 |
| Service Class | 2,994,230 | | 391,227 |
| Total | $10,618,121 | | $1,651,131 |
(3) Transactions with Affiliates
Investment Adviser — The fund has an investment advisory agreement with MFS to provide overall investment management and related administrative services and facilities to the fund. The management fee is computed daily and paid monthly at the following annual rates based on the fund's average daily net assets:
| Up to $250 million | 0.90% |
| In excess of $250 million | 0.85% |
MFS has agreed in writing to reduce its management fee by a specified amount if certain MFS mutual fund assets exceed thresholds agreed to by MFS and the fund's Board of Trustees. Effective March 1, 2022, MFS has also agreed in writing to waive at least 0.01% of its management fee as part of this agreement. The agreement to waive at least 0.01% of the management fee will continue until modified by the fund's Board of Trustees, but such agreement will continue at least until April 30, 2024. For the year ended December 31, 2022, this management fee reduction amounted to $6,745, which is included in the reduction of total expenses in the Statement of Operations. The management fee incurred for the year ended December 31, 2022 was equivalent to an annual effective rate of 0.89% of the fund's average daily net assets.
The investment adviser has agreed in writing to pay a portion of the fund’s total annual operating expenses, excluding interest, taxes, extraordinary expenses, brokerage and transaction costs, certain tax reclaim recovery expenses (including contingency fees and closing agreement expenses), and investment-related expenses, such that total annual operating expenses do not exceed 0.88% of average daily net assets for the Initial Class shares and 1.13% of average daily net assets for the Service Class shares. This written agreement will continue until modified by the fund’s Board of Trustees, but such agreement will continue at least until April 30, 2024. For the year ended December 31, 2022, this reduction amounted to $124,235, which is included in the reduction of total expenses in the Statement of Operations.
Distributor — MFS Fund Distributors, Inc. (MFD), a wholly-owned subsidiary of MFS, is the distributor of shares of the fund. The Trustees have adopted a distribution plan for the Service Class shares pursuant to Rule 12b-1 under the Investment Company Act of 1940.
The fund's distribution plan provides that the fund will pay MFD distribution and/or service fees equal to 0.25% per annum of its average daily net assets attributable to Service Class shares as partial consideration for services performed and expenses incurred by MFD and financial intermediaries (including participating insurance companies that invest in the fund to fund variable annuity and variable life insurance contracts, sponsors of qualified retirement and pension plans that invest in the fund, and affiliates of these participating insurance companies and plan sponsors) in connection with the sale and distribution of the Service Class shares. MFD may subsequently pay all, or a portion, of the distribution and/or service fees to financial intermediaries.
Shareholder Servicing Agent — MFS Service Center, Inc. (MFSC), a wholly-owned subsidiary of MFS, receives a fee from the fund for its services as shareholder servicing agent. For the year ended December 31, 2022, the fee was $3,784, which equated to 0.0078% annually of the fund's average daily net assets. MFSC also receives reimbursement from the fund for out-of-pocket expenses paid by MFSC on behalf of the fund. For the year ended December 31, 2022, these costs amounted to $386.
Administrator — MFS provides certain financial, legal, shareholder communications, compliance, and other administrative services to the fund. Under an administrative services agreement, the fund reimburses MFS the costs incurred to provide these services. The fund is charged an annual fixed amount of $17,500 plus a fee based on average daily net assets. The administrative services fee incurred for the year ended December 31, 2022 was equivalent to an annual effective rate of 0.0363% of the fund's average daily net assets.
Trustees’ and Officers’ Compensation — The fund pays compensation to independent Trustees in the form of a retainer, attendance fees, and additional compensation to Board and Committee chairpersons. The fund does not pay compensation directly to Trustees or officers of the fund who are also officers of the investment adviser, all of whom receive remuneration from MFS for their services to the fund. Certain officers and Trustees of the fund are officers or directors of MFS, MFD, and MFSC.
MFS New Discovery Value Portfolio
Notes to Financial Statements - continued
Other — The fund invests in the MFS Institutional Money Market Portfolio which is managed by MFS and seeks current income consistent with preservation of capital and liquidity. This money market fund does not pay a management fee to MFS but does incur investment and operating costs.
The fund is permitted to engage in purchase and sale transactions with funds and accounts for which MFS serves as investment adviser or sub-adviser (“cross-trades”) pursuant to a policy adopted by the Board of Trustees. This policy has been designed to ensure that cross-trades conducted by the fund comply with Rule 17a-7 under the Investment Company Act of 1940. During the year ended December 31, 2022, the fund engaged in purchase and sale transactions pursuant to this policy, which amounted to $2,290 and $103,305, respectively. The sales transactions resulted in net realized gains (losses) of $24,492.
The adviser has voluntarily undertaken to reimburse the fund from its own resources on a quarterly basis for the cost of investment research embedded in the cost of the fund’s securities trades. This agreement may be rescinded at any time. For the year ended December 31, 2022, this reimbursement amounted to $3,535, which is included in “Other” income in the Statement of Operations.
(4) Portfolio Securities
For the year ended December 31, 2022, purchases and sales of investments, other than short-term obligations, aggregated $15,533,781 and $18,650,034, respectively.
(5) Shares of Beneficial Interest
The fund's Declaration of Trust permits the Trustees to issue an unlimited number of full and fractional shares of beneficial interest. Transactions in fund shares were as follows:
| | Year ended
12/31/22 | | Year ended
12/31/21 |
| | Shares | Amount | | Shares | Amount |
| Shares sold | | | | | |
| Initial Class | 189,342 | $1,803,802 | | 431,095 | $4,511,414 |
| Service Class | 406,264 | 3,826,984 | | 437,830 | 4,651,820 |
| | 595,606 | $5,630,786 | | 868,925 | $9,163,234 |
Shares issued to shareholders
in reinvestment of distributions | | | | | |
| Initial Class | 938,903 | $7,623,891 | | 118,412 | $1,259,904 |
| Service Class | 373,811 | 2,994,230 | | 37,189 | 391,227 |
| | 1,312,714 | $10,618,121 | | 155,601 | $1,651,131 |
| Shares reacquired | | | | | |
| Initial Class | (604,995) | $(5,885,751) | | (2,069,710) | $(20,828,539) |
| Service Class | (357,231) | (3,283,802) | | (390,160) | (4,056,222) |
| | (962,226) | $(9,169,553) | | (2,459,870) | $(24,884,761) |
| Net change | | | | | |
| Initial Class | 523,250 | $3,541,942 | | (1,520,203) | $(15,057,221) |
| Service Class | 422,844 | 3,537,412 | | 84,859 | 986,825 |
| | 946,094 | $7,079,354 | | (1,435,344) | $(14,070,396) |
The fund is one of several mutual funds in which certain MFS funds may invest. The MFS funds do not invest in the underlying funds for the purpose of exercising management or control. At the end of the period, the MFS Moderate Allocation Portfolio, the MFS Growth Allocation Portfolio, and the MFS Conservative Allocation Portfolio were the owners of record of approximately 33%, 12%, and 7%, respectively, of the value of outstanding voting shares of the fund.
Effective at the close of business on August 14, 2019, the fund was closed to new investors subject to certain exceptions.
(6) Line of Credit
The fund and certain other funds managed by MFS participate in a $1.45 billion unsecured committed line of credit of which $1.2 billion is reserved for use by the fund and certain other MFS U.S. funds. The line of credit is provided by a syndicate of banks under a credit agreement. Borrowings may be made for temporary financing needs. Interest is charged to each fund, based on its borrowings, generally at a rate equal to the highest of 1) Daily Simple SOFR (Secured Overnight Financing Rate) plus 0.10%, 2) the Federal Funds Effective Rate, or 3) the Overnight Bank Funding Rate, each plus an agreed upon spread. A commitment fee, based on
MFS New Discovery Value Portfolio
Notes to Financial Statements - continued
the average daily unused portion of the committed line of credit, is allocated among the participating funds. The line of credit expires on March 16, 2023 unless extended or renewed. In addition, the fund and other funds managed by MFS have established unsecured uncommitted borrowing arrangements with certain banks for temporary financing needs. Interest is charged to each fund, based on its borrowings, at rates equal to customary reference rates plus an agreed upon spread. For the year ended December 31, 2022, the fund’s commitment fee and interest expense were $240 and $0, respectively, and are included in “Miscellaneous” expense in the Statement of Operations.
(7) Investments in Affiliated Issuers
An affiliated issuer may be considered one in which the fund owns 5% or more of the outstanding voting securities, or a company which is under common control. For the purposes of this report, the following were affiliated issuers:
| Affiliated Issuers | Beginning
Value | Purchases | Sales
Proceeds | Realized
Gain
(Loss) | Change in
Unrealized
Appreciation or
Depreciation | Ending
Value |
| MFS Institutional Money Market Portfolio | $383,820 | $11,111,667 | $10,982,892 | $(16) | $131 | $512,710 |
| Affiliated Issuers | Dividend
Income | Capital Gain
Distributions |
| MFS Institutional Money Market Portfolio | $8,333 | $— |
(8) LIBOR Transition
Certain of the fund's investments, including investments in certain debt instruments and derivatives (if any), as well as borrowings by the fund and certain other contractual arrangements of the fund, may be based on the London Interbank Offered Rate (“LIBOR”). In 2017, the regulatory authority that oversees financial services firms in the United Kingdom announced plans to transition away from LIBOR by the end of 2021. In March 2021, the administrator of LIBOR announced the extension of the publication of the more commonly used U.S. dollar LIBOR settings to the end of June 2023. Although the full impacts of the transition away from LIBOR are not fully known, the transition may result in, among other things, an increase in volatility or illiquidity of the markets for instruments that currently rely on LIBOR to determine interest rates and this could have an adverse impact on the fund's performance. With respect to the fund's accounting for investments, including investments in certain debt instruments and derivatives, as well as borrowings by the fund and any other contractual arrangements of the fund that undergo reference rate-related modifications as a result of the transition, management will rely upon the relief provided by FASB Codification Topic 848 – Reference Rate Reform (Topic 848). The guidance in Topic 848 permits the fund to account for those modified contracts as a continuation of the existing contracts. Management is still evaluating the impact to the fund of the June 30, 2023 planned discontinuation of the more commonly used U.S. dollar LIBOR settings.
(9) Russia and Ukraine Conflict
The market disruptions, which began in late February 2022, associated with geopolitical events related to the conflict between Russia and Ukraine may adversely affect the value of the fund’s assets and thus the fund’s performance. Management continues to monitor these events and to evaluate the related impacts, if any, to the fund.
MFS New Discovery Value Portfolio
Report of Independent Registered Public Accounting Firm
To the Board of Trustees of MFS Variable Insurance Trust III and the Shareholders of MFS New Discovery Value Portfolio:
Opinion on the Financial Statements and Financial Highlights
We have audited the accompanying statement of assets and liabilities of MFS New Discovery Value Portfolio (the “Fund”), including the portfolio of investments, as of December 31, 2022, the related statement of operations for the year then ended, the statements of changes in net assets for each of the two years in the period then ended, the financial highlights for each of the five years in the period then ended, and the related notes. In our opinion, the financial statements and financial highlights present fairly, in all material respects, the financial position of the Fund as of December 31, 2022, and the results of its operations for the year then ended, the changes in its net assets for each of the two years in the period then ended, and the financial highlights for each of the five years in the period then ended, in conformity with accounting principles generally accepted in the United States of America.
Basis for Opinion
These financial statements and financial highlights are the responsibility of the Fund's management. Our responsibility is to express an opinion on the Fund's financial statements and financial highlights based on our audits. We are a public accounting firm registered with the Public Company Accounting Oversight Board (United States) (PCAOB) and are required to be independent with respect to the Fund in accordance with the U.S. federal securities laws and the applicable rules and regulations of the Securities and Exchange Commission and the PCAOB.
We conducted our audits in accordance with the standards of the PCAOB. Those standards require that we plan and perform the audit to obtain reasonable assurance about whether the financial statements and financial highlights are free of material misstatement, whether due to error or fraud. The Fund is not required to have, nor were we engaged to perform, an audit of its internal control over financial reporting. As part of our audits, we are required to obtain an understanding of internal control over financial reporting but not for the purpose of expressing an opinion on the effectiveness of the Fund's internal control over financial reporting. Accordingly, we express no such opinion.
Our audits included performing procedures to assess the risks of material misstatement of the financial statements and financial highlights, whether due to error or fraud, and performing procedures that respond to those risks. Such procedures included examining, on a test basis, evidence regarding the amounts and disclosures in the financial statements and financial highlights. Our audits also included evaluating the accounting principles used and significant estimates made by management, as well as evaluating the overall presentation of the financial statements and financial highlights. Our procedures included confirmation of securities owned as of December 31, 2022, by correspondence with the custodian and brokers. We believe that our audits provide a reasonable basis for our opinion.
DELOITTE & TOUCHE LLP
Boston, Massachusetts
February 15, 2023
We have served as the auditor of one or more of the MFS investment companies since 1924.
MFS New Discovery Value Portfolio
Trustees and Officers — Identification and Background
The Trustees and Officers of the Trust, as of February 1, 2023, are listed below, together with their principal occupations during the past five years. (Their titles may have varied during that period.) The address of each Trustee and Officer is 111 Huntington Avenue, Boston, Massachusetts 02199-7618.
| Name, Age | | Position(s) Held with Fund | | Trustee/Officer Since(h) | | Number of MFS Funds overseen by the Trustee | | Principal Occupations During
the Past Five Years | | Other Directorships During
the Past Five Years (j) |
| INTERESTED TRUSTEE | | | | | | | | | | |
Michael W. Roberge (k)
(age 56) | | Trustee | | January 2021 | | 136 | | Massachusetts Financial Services Company, Chairman (since January 2021); Chief Executive Officer (since January 2017); Director; Chairman of the Board (since January 2022); President (until December 2018); Chief Investment Officer (until December 2018) | | N/A |
| INDEPENDENT TRUSTEES | | | | | | | | | | |
John P. Kavanaugh
(age 68) | | Trustee and Chair of Trustees | | January 2009 | | 136 | | Private investor | | N/A |
Steven E. Buller
(age 71) | | Trustee | | February 2014 | | 136 | | Private investor | | N/A |
John A. Caroselli
(age 68) | | Trustee | | March 2017 | | 136 | | Private investor; JC Global Advisors, LLC (management consulting), President (since 2015) | | N/A |
Maureen R. Goldfarb
(age 67) | | Trustee | | January 2009 | | 136 | | Private investor | | N/A |
Peter D. Jones
(age 67) | | Trustee | | January 2019 | | 136 | | Private investor | | N/A |
James W. Kilman, Jr.
(age 61) | | Trustee | | January 2019 | | 136 | | Burford Capital Limited (finance and investment management), Senior Advisor (since May 3, 2021), Chief Financial Officer (2019 - May 2, 2021); KielStrand Capital LLC (family office), Chief Executive Officer (since 2016) | | Alpha-En Corporation, Director (2016-2019) |
Clarence Otis, Jr.
(age 66) | | Trustee | | March 2017 | | 136 | | Private investor | | VF Corporation, Director; Verizon Communications, Inc., Director; The Travelers Companies, Director |
Maryanne L. Roepke
(age 66) | | Trustee | | May 2014 | | 136 | | Private investor | | N/A |
Laurie J. Thomsen
(age 65) | | Trustee | | March 2005 | | 136 | | Private investor | | The Travelers Companies, Director; Dycom Industries, Inc., Director |
MFS New Discovery Value Portfolio
Trustees and Officers - continued
| Name, Age | | Position(s) Held with
Fund | | Trustee/Officer Since(h) | | Number of MFS Funds for which the Person is an Officer | | Principal Occupations During
the Past Five Years |
| OFFICERS | | | | | | | | |
Christopher R. Bohane (k)
(age 49) | | Assistant Secretary and Assistant Clerk | | July 2005 | | 136 | | Massachusetts Financial Services Company, Senior Vice President and Senior Managing Counsel |
Kino Clark (k)
(age 54) | | Assistant Treasurer | | January 2012 | | 136 | | Massachusetts Financial Services Company, Vice President |
John W. Clark, Jr. (k)
(age 55) | | Assistant Treasurer | | April 2017 | | 136 | | Massachusetts Financial Services Company, Vice President |
David L. DiLorenzo (k)
(age 54) | | President | | July 2005 | | 136 | | Massachusetts Financial Services Company, Senior Vice President |
Heidi W. Hardin (k)
(age 55) | | Secretary and Clerk | | April 2017 | | 136 | | Massachusetts Financial Services Company, Executive Vice President and General Counsel |
Brian E. Langenfeld (k)
(age 49) | | Assistant Secretary and Assistant Clerk | | June 2006 | | 136 | | Massachusetts Financial Services Company, Vice President and Managing Counsel |
Rosa E. Licea-Mailloux (k)
(age 46) | | Chief Compliance Officer | | March 2022 | | 136 | | Massachusetts Financial Services Company, Vice President (since 2018); Director of Corporate Compliance (2018-2021), Senior Director Compliance (2021-2022), Senior Managing Director of North American Compliance & Chief Compliance Officer (since March 2022); Natixis Investment Managers (investment management), Funds Chief Compliance Officer, Deputy General Counsel & Senior Vice President (until 2018) |
Amanda S. Mooradian (k)
(age 43) | | Assistant Secretary and Assistant Clerk | | September 2018 | | 136 | | Massachusetts Financial Services Company, Assistant Vice President and Senior Counsel |
Susan A. Pereira (k)
(age 52) | | Assistant Secretary and Assistant Clerk | | July 2005 | | 136 | | Massachusetts Financial Services Company, Vice President and Managing Counsel |
Kasey L. Phillips (k)
(age 52) | | Assistant Treasurer | | September 2012 | | 136 | | Massachusetts Financial Services Company, Vice President |
Matthew A. Stowe (k)
(age 48) | | Assistant Secretary and Assistant Clerk | | October 2014 | | 136 | | Massachusetts Financial Services Company, Vice President and Senior Managing Counsel |
William B. Wilson (k)
(age 40) | | Assistant Secretary and Assistant Clerk | | October 2022 | | 136 | | Massachusetts Financial Services Company, Assistant Vice President and Counsel |
James O. Yost (k)
(age 62) | | Treasurer | | September 1990 | | 136 | | Massachusetts Financial Services Company, Senior Vice President |
| (h) | Date first appointed to serve as Trustee/Officer of an MFS Fund. Each Trustee has served continuously since appointment unless indicated otherwise. From January 2012 through December 2016, Messrs. DiLorenzo and Yost served as Treasurer and Deputy Treasurer of the Funds, respectively. |
| (j) | Directorships or trusteeships of companies required to report to the Securities and Exchange Commission (i.e., “public companies”). |
| (k) | “Interested person” of the Trust within the meaning of the Investment Company Act of 1940 (referred to as the 1940 Act), which is the principal federal law governing investment companies like the fund, as a result of a position with MFS. The address of MFS is 111 Huntington Avenue, Boston, Massachusetts 02199-7618. |
Each Trustee (other than Messrs. Jones, Kilman and Roberge) has been elected by shareholders and each Trustee and Officer holds office until his or her successor is chosen and qualified or until his or her earlier death, resignation, retirement or removal. Mr. Roberge became a Trustee of the Funds on January 1, 2021 and Messrs. Jones and Kilman became Trustees of the Funds on January 1, 2019. The Trust does not hold annual meetings for the purpose of electing Trustees, and Trustees are not elected for fixed terms. Under the terms of the Board's retirement policy, an Independent Trustee shall retire at the end of the calendar year in which he or she reaches the earlier of 75 years of age or 15 years of service on the Board (or, in the case of any Independent Trustee who joined the Board prior to 2015, 20 years of service on the Board).
MFS New Discovery Value Portfolio
Trustees and Officers - continued
Messrs. Buller, Kilman and Otis and Ms. Roepke are members of the Trust’s Audit Committee.
Each of the Interested Trustees and certain Officers hold comparable officer positions with certain affiliates of MFS.
The Statement of Additional Information for a Fund includes further information about the Trustees and is available without charge upon request by calling 1-800-225-2606.
| Investment Adviser | Custodian |
Massachusetts Financial Services Company
111 Huntington Avenue
Boston, MA 02199-7618 | State Street Bank and Trust Company
1 Lincoln Street
Boston, MA 02111-2900 |
| Distributor | Independent Registered Public Accounting Firm |
MFS Fund Distributors, Inc.
111 Huntington Avenue
Boston, MA 02199-7618 | Deloitte & Touche LLP
200 Berkeley Street
Boston, MA 02116 |
| Portfolio Manager(s) | |
Richard Offen
Kevin Schmitz | |
MFS New Discovery Value Portfolio
Board Review of Investment Advisory Agreement
MFS New Discovery Value Portfolio
The Investment Company Act of 1940 requires that both the full Board of Trustees and a majority of the non-interested (“independent”) Trustees, voting separately, annually approve the continuation of the Fund’s investment advisory agreement with MFS. The Trustees consider matters bearing on the Fund and its advisory arrangements at their meetings throughout the year, including a review of performance data at each regular meeting. In addition, the independent Trustees met several times over the course of three months beginning in May and ending in July, 2022 (“contract review meetings”) for the specific purpose of considering whether to approve the continuation of the investment advisory agreement for the Fund and the other investment companies that the Board oversees (the “MFS Funds”). The independent Trustees were assisted in their evaluation of the Fund’s investment advisory agreement by independent legal counsel, from whom they received separate legal advice and with whom they met separately from MFS during various contract review meetings. The independent Trustees were also assisted in this process by an independent consultant who was retained by and reported to the independent Trustees.
In connection with their deliberations regarding the continuation of the investment advisory agreement, the Trustees, including the independent Trustees, considered such information and factors as they believed, in light of the legal advice furnished to them and their own business judgment, to be relevant. The investment advisory agreement for the Fund was considered separately, although the Trustees also took into account the common interests of all MFS Funds in their review. As described below, the Trustees considered the nature, quality, and extent of the various investment advisory, administrative, and shareholder services performed by MFS under the existing investment advisory agreement and other arrangements with the Fund.
In connection with their contract review meetings, the Trustees received and relied upon materials that included, among other items: (i) information provided by Broadridge Financial Solutions, Inc. (“Broadridge”), an independent third party, on the investment performance of the Fund for various time periods ended December 31, 2021 and the investment performance of a group of funds with substantially similar investment classifications/objectives (the “Broadridge performance universe”), (ii) information provided by Broadridge on the Fund’s advisory fees and other expenses and the advisory fees and other expenses of comparable funds identified by Broadridge as well as all other funds in the same investment classification/category (the “Broadridge expense group and universe”), (iii) information provided by MFS on the advisory fees of portfolios of other clients of MFS, including institutional separate accounts and other clients, (iv) information as to whether and to what extent applicable expense waivers, reimbursements or fee “breakpoints” are observed for the Fund, (v) information regarding MFS’ financial results and financial condition, including MFS’ and certain of its affiliates’ estimated profitability from services performed for the Fund and the MFS Funds as a whole, and compared to MFS’ institutional business, (vi) MFS’ views regarding the outlook for the mutual fund industry and the strategic business plans of MFS, (vii) descriptions of various functions performed by MFS for the Funds, such as compliance monitoring and portfolio trading practices, and (viii) information regarding the overall organization of MFS, including information about MFS’ senior management and other personnel providing investment advisory, administrative and other services to the Fund and the other MFS Funds. The comparative performance, fee and expense information prepared and provided by Broadridge was not independently verified and the independent Trustees did not independently verify any information provided to them by MFS.
The Trustees’ conclusion as to the continuation of the investment advisory agreement was based on a comprehensive consideration of all information provided to the Trustees and not the result of any single factor. Some of the factors that figured particularly in the Trustees’ deliberations are described below, although individual Trustees may have evaluated the information presented differently from one another, giving different weights to various factors. It is also important to recognize that the fee arrangements for the Fund and other MFS Funds are the result of years of review and discussion between the independent Trustees and MFS, that certain aspects of such arrangements may receive greater scrutiny in some years than in others, and that the Trustees’ conclusions may be based, in part, on their consideration of these same arrangements during the course of the year and in prior years.
Based on information provided by Broadridge and MFS, the Trustees reviewed the Fund’s total return investment performance as well as the Broadridge performance universe over various time periods. The Trustees placed particular emphasis on the total return performance of the Fund’s Initial Class shares in comparison to the performance of funds in its Broadridge performance universe over the five-year period ended December 31, 2021, which the Trustees believed was a long enough period to reflect differing market conditions. The total return performance of the Fund’s Initial Class shares was in the 1st quintile relative to the other funds in the universe for this five-year period (the 1st quintile being the best performers and the 5th quintile being the worst performers). The total return performance of the Fund’s Initial Class shares was in the 2nd quintile for the one-year period and the 1st quintile for the three-year period ended December 31, 2021 relative to the Broadridge performance universe. Because of the passage of time, these performance results may differ from the performance results for more recent periods, including those shown elsewhere in this report.
In the course of their deliberations, the Trustees took into account information provided by MFS in connection with the contract review meetings, as well as during investment review meetings conducted with portfolio management personnel during the course of the year regarding the Fund’s performance. After reviewing these and related factors, the Trustees concluded, within the context of their overall conclusions regarding the investment advisory agreement, that they were satisfied with MFS’ responses and efforts relating to investment performance.
MFS New Discovery Value Portfolio
Board Review of Investment Advisory Agreement - continued
In assessing the reasonableness of the Fund’s advisory fee, the Trustees considered, among other information, the Fund’s advisory fee and the total expense ratio of the Fund’s Initial Class shares as a percentage of average daily net assets and the advisory fee and total expense ratios of the Broadridge expense group based on information provided by Broadridge. The Trustees considered that MFS currently observes an expense limitation for the Fund, which may not be changed without the Trustees’ approval. The Trustees also considered that, according to the data provided by Broadridge (which takes into account any fee reductions or expense limitations that were in effect during the Fund’s last fiscal year), the Fund’s effective advisory fee rate was approximately at the Broadridge expense group median and the Fund’s total expense ratio was higher than the Broadridge expense group median.
The Trustees also considered the advisory fees charged by MFS to any institutional separate accounts advised by MFS (“separate accounts”) and unaffiliated investment companies for which MFS serves as subadviser (“subadvised funds”) that have comparable investment strategies to the Fund, if any. In comparing these fees, the Trustees considered information provided by MFS as to the generally broader scope of services provided by MFS to the Fund, as well as the more extensive regulatory burdens imposed on MFS in managing the Fund, in comparison to separate accounts and subadvised funds. The Trustees also considered the higher demands placed on MFS’ investment personnel and trading infrastructure as a result of the daily cash in-flows and out-flows of the Fund in comparison to separate accounts.
The Trustees also considered whether the Fund may benefit from any economies of scale in the management of the Fund in the event of growth in assets of the Fund and/or growth in assets of the MFS Funds as a whole. They noted that the Fund’s advisory fee rate schedule is subject to a contractual breakpoint that reduces the Fund’s advisory fee rate on average daily net assets over $250 million. The Trustees also noted that MFS has agreed in writing to waive a portion of the management fees of certain MFS Funds, including the Fund, if the total combined assets of certain funds within the MFS Funds’ complex increase above agreed upon thresholds (the “group fee waiver”), enabling the Fund’s shareholders to share in the benefits from any economies of scale at the complex level. The group fee waiver is reviewed and renewed annually between the Board and MFS. The Trustees concluded that the breakpoint and the group fee waiver were sufficient to allow the Fund to benefit from economies of scale as its assets and overall complex assets grow.
The Trustees also considered information prepared by MFS relating to MFS’ costs and profits with respect to the Fund, the MFS Funds considered as a group, and other investment companies and accounts advised by MFS, as well as MFS’ methodologies used to determine and allocate its costs to the MFS Funds, the Fund and other accounts and products for purposes of estimating profitability.
After reviewing these and other factors described herein, the Trustees concluded, within the context of their overall conclusions regarding the investment advisory agreement, that the advisory fees charged to the Fund represent reasonable compensation in light of the services being provided by MFS to the Fund.
In addition, the Trustees considered MFS’ resources and related efforts to continue to retain, attract and motivate capable personnel to serve the Fund. The Trustees also considered current and developing conditions in the financial services industry, including the presence of large and well-capitalized companies which are spending, and appear to be prepared to continue to spend, substantial sums to engage personnel and to provide services to competing investment companies. In this regard, the Trustees also considered the financial resources of MFS and its ultimate parent, Sun Life Financial Inc. The Trustees also considered the advantages and possible disadvantages to the Fund of having an adviser that also serves other investment companies as well as other accounts.
The Trustees also considered the nature, quality, cost, and extent of administrative, transfer agency, and distribution services provided to the Fund by MFS and its affiliates under agreements and plans other than the investment advisory agreement, including any 12b-1 fees the Fund pays to MFS Fund Distributors, Inc., an affiliate of MFS. The Trustees also considered the nature, extent and quality of certain other services MFS performs or arranges for on the Fund’s behalf, which may include securities lending programs, directed expense payment programs, class action recovery programs, and MFS’ interaction with third-party service providers, principally custodians and sub-custodians. The Trustees concluded that the various non-advisory services provided by MFS and its affiliates on behalf of the Fund were satisfactory.
The Trustees considered so-called “fall-out benefits” to MFS such as reputational value derived from serving as investment manager to the MFS Funds. The Trustees also considered that MFS discontinued its historic practice of obtaining investment research from portfolio brokerage commissions paid by certain MFS Funds effective January 2018, and directly pays or voluntarily reimburses a Fund, if applicable, for the costs of external research acquired through the use of the Fund’s portfolio brokerage commissions.
Based on their evaluation of factors that they deemed to be material, including those factors described above, the Board of Trustees, including the independent Trustees, concluded that the Fund’s investment advisory agreement with MFS should be continued for an additional one-year period, commencing August 1, 2022.
MFS New Discovery Value Portfolio
Proxy Voting Policies and Information
MFS votes proxies on behalf of the fund pursuant to proxy voting policies and procedures that are available without charge, upon request, by calling 1-800-225-2606, by visiting mfs.com/proxyvoting, or by visiting the SEC’s Web site at http://www.sec.gov.
Information regarding how the fund voted proxies relating to portfolio securities during the most recent twelve-month period ended June 30 is available by August 31 of each year without charge by visiting mfs.com/proxyvoting, or by visiting the SEC’s Web site at http://www.sec.gov.
Quarterly Portfolio Disclosure
The fund files a complete schedule of portfolio holdings with the SEC for the first and third quarters of each fiscal year as an exhibit to its reports on Form N-PORT. The fund’s Form N-PORT reports are available on the SEC’s Web site at http://www.sec.gov. A shareholder can obtain the portfolio holdings report for the first and third quarters of the fund's fiscal year at mfs.com/vit3 by choosing the fund's name and then scrolling to the “Resources” section and clicking on the “Prospectus and Reports” tab.
FURTHER INFORMATION
From time to time, MFS may post important information about the fund or the MFS Funds on the MFS Web site (mfs.com). This information is available at https://www.mfs.com/announcements or at mfs.com/vit3 by choosing the fund's name and then scrolling to the “Resources” section and clicking on the “Announcements” tab, if any.
Information About Fund Contracts and Legal Claims
The fund has entered into contractual arrangements with an investment adviser, administrator, distributor, shareholder servicing agent, and custodian who each provide services to the fund. Unless expressly stated otherwise, shareholders are not parties to, or intended beneficiaries of these contractual arrangements, and these contractual arrangements are not intended to create any shareholder right to enforce them against the service providers or to seek any remedy under them against the service providers, either directly or on behalf of the fund.
Under the Trust’s By-Laws and Declaration of Trust, any claims asserted against or on behalf of the MFS Funds, including claims against Trustees and Officers, must be brought in state and federal courts located within the Commonwealth of Massachusetts.
Federal Tax Information (unaudited)
The following information is provided pursuant to provisions of the Internal Revenue Code.
The fund designates $6,625,000 as capital gain dividends paid during the fiscal year.
For corporate shareholders, 11.98% of the ordinary income dividends paid during the fiscal year qualify for the corporate dividends received deduction.
| FACTS | WHAT DOES MFS DO WITH YOUR PERSONAL INFORMATION? |
| Why? | Financial companies choose how they share your personal information. Federal law gives consumers the right to limit some but not all sharing. Federal law also requires us to tell you how we collect, share, and protect your personal information. Please read this notice carefully to understand what we do. |
| What? | The types of personal information we collect and share depend on the product or service you have with us. This information can include: |
| • Social Security number and account balances |
| • Account transactions and transaction history |
| • Checking account information and wire transfer instructions |
| When you are no longer our customer, we continue to share your information as described in this notice. |
| How? | All financial companies need to share customers' personal information to run their everyday business. In the section below, we list the reasons financial companies can share their customers' personal information; the reasons MFS chooses to share; and whether you can limit this sharing. |
Reasons we can share your
personal information | Does MFS share? | Can you limit
this sharing? |
For our everyday business purposes –
such as to process your transactions, maintain your
account(s), respond to court orders and legal
investigations, or report to credit bureaus | Yes | No |
For our marketing purposes –
to offer our products and services to you | No | We don't share |
For joint marketing with other
financial companies | No | We don't share |
For our affiliates' everyday business purposes –
information about your transactions and experiences | No | We don't share |
For our affiliates' everyday business purposes –
information about your creditworthiness | No | We don't share |
| For nonaffiliates to market to you | No | We don't share |
| Questions? | Call 800-225-2606 or go to mfs.com. |
| Who we are |
| Who is providing this notice? | MFS Funds, MFS Investment Management, MFS Institutional Advisors, Inc., and MFS Heritage Trust Company. |
| What we do |
How does MFS
protect my personal
information? | To protect your personal information from unauthorized access and use, we use security measures that comply with federal law. These measures include procedural, electronic, and physical safeguards for the protection of the personal information we collect about you. |
How does MFS
collect my personal
information? | We collect your personal information, for example, when you |
| • open an account or provide account information |
| • direct us to buy securities or direct us to sell your securities |
| • make a wire transfer |
| We also collect your personal information from others, such as credit bureaus, affiliates, or other companies. |
| Why can't I limit all sharing? | Federal law gives you the right to limit only |
| • sharing for affiliates' everyday business purposes – information about your creditworthiness |
| • affiliates from using your information to market to you |
| • sharing for nonaffiliates to market to you |
| State laws and individual companies may give you additional rights to limit sharing. |
| Definitions |
| Affiliates | Companies related by common ownership or control. They can be financial and nonfinancial companies. |
| • MFS does not share personal information with affiliates, except for everyday business purposes as described on page one of this notice. |
| Nonaffiliates | Companies not related by common ownership or control. They can be financial and nonfinancial companies. |
| • MFS does not share with nonaffiliates so they can market to you. |
| Joint marketing | A formal agreement between nonaffiliated financial companies that together market financial products or services to you. |
| • MFS doesn't jointly market. |
| Other important information |
| If you own an MFS product or receive an MFS service in the name of a third party such as a bank or broker-dealer, their privacy policy may apply to you instead of ours. |
Item 1(b):
Not applicable.
ITEM 2. CODE OF ETHICS.
The Registrant has adopted a Code of Ethics (the "Code") pursuant to Section 406 of the Sarbanes-Oxley Act and as defined in Form N-CSR that applies to the Registrant's principal executive officer and principal financial and accounting officer. During the period covered by this report, the Registrant has not amended any provision in the Code that relates to an element of the Code's definition enumerated in paragraph
(b)of Item 2 of this Form N-CSR. During the period covered by this report, the Registrant did not grant a waiver, including an implicit waiver, from any provision of the Code.
A copy of the Code is attached hereto as EX-99.COE.
ITEM 3. AUDIT COMMITTEE FINANCIAL EXPERT.
Messrs. Steven E. Buller, James Kilman, and Clarence Otis, Jr. and Ms. Maryanne L. Roepke, members of the Audit Committee, have been determined by the Board of Trustees in their reasonable business judgment to meet the definition of "audit committee financial expert" as such term is defined in Form N-CSR. In addition, Messrs. Buller, Kilman, and Otis and Ms. Roepke are "independent" members of the Audit Committee (as such term has been defined by the Securities and Exchange Commission in regulations implementing Section 407 of the Sarbanes-Oxley Act of 2002). The Securities and Exchange Commission has stated that the designation of a person as an audit committee financial expert pursuant to this Item 3 on the Form N-CSR does not impose on such a person any duties, obligations or liability that are greater than the duties, obligations or liability imposed on such person as a member of the Audit Committee and the Board of Trustees in the absence of such designation or identification.
ITEM 4. PRINCIPAL ACCOUNTANT FEES AND SERVICES.
Items 4(a) through 4(d) and 4(g):
The Board of Trustees has appointed Deloitte & Touche LLP ("Deloitte") to serve as independent accountants to the Registrant (hereinafter the "Registrant" or the "Fund"). The tables below set forth the audit fees billed to the Fund as well as fees for non-audit services provided to the Fund and/or to the Fund's investment adviser, Massachusetts Financial Services Company ("MFS"), and to various entities either controlling, controlled by, or under common control with MFS that provide ongoing services to the Fund ("MFS Related Entities").
For the fiscal years ended December 31, 2022 and 2021, audit fees billed to the Fund by Deloitte were as follows:
Fees billed by Deloitte: | | Audit Fees |
| 2022 | | 2021 |
MFS Blended Research Small Cap Equity Portfolio | 49,786 | | 47,153 |
MFS Conservative Allocation Portfolio | 33,949 | | 32,128 |
MFS Global Real Estate Portfolio | 50,843 | | 48,156 |
MFS Growth Allocation Portfolio | 33,949 | | 32,128 |
MFS Inflation-Adjusted Bond Portfolio | 39,157 | | 37,069 |
MFS Limited Maturity Portfolio | 62,285 | | 59,012 |
MFS Mid Cap Value Portfolio | 51,303 | | 48,593 |
MFS Moderate Allocation Portfolio | 33,949 | | 32,128 |
MFS New Discovery Value Portfolio | 49,786 | | 47,153 |
Total | 405,007 | | 383,520 |
For the fiscal years ended December 31, 2022 and 2021, fees billed by Deloitte for audit-related, tax and other services provided to each Fund and for audit-related, tax and other services provided to MFS and MFS Related Entities were as follows:
Fees billed by Deloitte: | | Audit-Related Fees1 | | Tax Fees2 | All Other Fees3 |
| 2022 | 2021 | 2022 | 20214 | 2022 | | 2021 |
To MFS Blended Research Small | 2,400 | 2,400 | 0 | 710 | 0 | | 0 |
Cap Equity Portfolio | |
| | | | | | | | | | |
To MFS Conservative Allocation | 2,400 | 2,400 | 0 | 710 | 0 | | 0 |
Portfolio | |
| | | | | | | | | | |
To MFS Global Real Estate | 2,400 | 2,400 | 0 | 745 | 0 | | 0 |
Portfolio | |
| | | | | | | | | | |
To MFS Growth Allocation | 2,400 | 2,400 | 0 | 710 | 0 | | 0 |
Portfolio | |
| | | | | | | | | | |
To MFS Inflation-Adjusted Bond | 2,400 | 2,400 | 0 | 658 | 0 | | 0 |
Portfolio | |
| | | | | | | | | | |
To MFS Limited Maturity | 2,400 | 2,400 | 0 | 710 | 0 | | 0 |
Portfolio | |
| | | | | | | | | | |
To MFS Mid Cap Value Portfolio | 2,400 | 2,400 | 0 | 710 | 0 | | 0 |
| | | | | | | | | | | |
To MFS Moderate Allocation | 2,400 | 2,400 | 0 | 710 | 0 | | 0 |
Portfolio | |
| | | | | | | | | | |
To MFS New Discovery Value | 2,400 | 2,400 | 0 | 710 | 0 | | 0 |
Portfolio | |
| | | | | | | | | | |
Total fees billed by Deloitte | 21,600 | 21,600 | 0 | 6,373 | 0 | | 0 |
To above Funds: | | | | | | | | | | | |
| | | | | | | | |
Fees billed by Deloitte: | | Audit-Related Fees1 | | Tax Fees2 | All Other Fees3 |
| | 2022 | | 2021 | | 2022 | | 2021 | 2022 | | 2021 |
| | | | | | | | | | | |
To MFS and MFS Related Entities | | 0 | | 0 | | 0 | | 0 | 3,790 | | 5,390 |
of MFS Blended Research Small | | | | | | | | | | | |
Cap Equity Portfolio* | | | | | | | | | | | |
To MFS and MFS Related Entities | | 0 | | 0 | | 0 | | 0 | 3,790 | | 5,390 |
of MFS Conservative Allocation | | | | | | | | | | | |
Portfolio* | | | | | | | | | | | |
To MFS and MFS Related Entities | | 0 | | 0 | | 0 | | 0 | 3,790 | | 5,390 |
of MFS Global Real Estate | | | | | | | | | | | |
Portfolio* | | | | | | | | | | | |
To MFS and MFS Related Entities | | 0 | | 0 | | 0 | | 0 | 3,790 | | 5,390 |
of MFS Growth Allocation | | | | | | | | | | | |
Portfolio* | | | | | | | | | | | |

To MFS and MFS Related Entities | 0 | 0 | | 0 | 0 | 3,790 | 5,390 |
of MFS Inflation-Adjusted Bond | | | | | | | |
Portfolio* | | | | | | | |
To MFS and MFS Related Entities | 0 | 0 | | 0 | 0 | 3,790 | 5,390 |
of MFS Limited Maturity | | | | | | | |
Portfolio* | | | | | | | |
To MFS and MFS Related Entities | 0 | 0 | | 0 | 0 | 3,790 | 5,390 |
of MFS Mid Cap Value Portfolio* | | | | | | | |
To MFS and MFS Related Entities | 0 | 0 | | 0 | 0 | 3,790 | 5,390 |
of MFS Moderate Allocation | | | | | | | |
Portfolio* | | | | | | | |
To MFS and MFS Related Entities | 0 | 0 | | 0 | 0 | 3,790 | 5,390 |
of MFS New Discovery Value | | | | | | | |
Portfolio* | | | | | | | |
| | | | |
Fees billed by Deloitte: | | | | Aggregate fees for non-audit services: |
| | | | | 2022 | | 20214 |
To MFS Blended Research Small Cap Equity Portfolio, MFS and | | 6,190 | | 8,500 |
MFS Related Entities# | | | | | |
To MFS Conservative Allocation Portfolio, MFS and MFS Related | | 6,190 | | 8,500 |
Entities# | | | | | |
To MFS Global Real Estate Portfolio, MFS and MFS Related | | 6,190 | | 8,535 |
Entities# | | | | | |
To MFS Growth Allocation Portfolio, MFS and MFS Related | | 6,190 | | 8,500 |
Entities# | | | | | |
To MFS Inflation-Adjusted Bond Portfolio, MFS and MFS Related | | 6,190 | | 8,448 |
Entities# | | | | | |
To MFS Limited Maturity Portfolio, MFS and MFS Related | | 6,190 | | 8,500 |
Entities# | | | | | |
To MFS Mid Cap Value Portfolio, MFS and MFS Related Entities# | | 6,190 | | 8,500 |
To MFS Moderate Allocation Portfolio, MFS and MFS Related | | 6,190 | | 8,500 |
Entities# | | | | | |
To MFS New Discovery Value Portfolio, MFS and MFS Related | | 6,190 | | 8,500 |
Entities# | | | | | |
*This amount reflects the fees billed to MFS and MFS Related Entities for non-audit services relating directly to the operations and financial reporting of the Fund (portions of which services also related to the operations and financial reporting of other funds within the MFS Funds complex).
# This amount reflects the aggregate fees billed by Deloitte for non-audit services rendered to the Fund and for non-audit services rendered to MFS and the MFS Related Entities.
1 The fees included under "Audit-Related Fees" are fees related to assurance and related services that are reasonably related to the performance of the audit or review of financial statements, but not reported under ''Audit Fees,'' including accounting consultations, agreed- upon procedure reports, attestation reports, comfort letters and internal control reviews.
2 The fees included under "Tax Fees" are fees associated with tax compliance, tax advice and tax planning, including services relating to the filing or amendment of federal, state or local income tax returns, regulated investment company qualification reviews and tax distribution and analysis.
3 The fees included under "All Other Fees" are fees for products and services provided by Deloitte other than those reported under "Audit Fees," "Audit-Related Fees" and "Tax Fees".
4 Certain fees reported in 2021 have been restated in this filing from those reported in the Registrant's filing for the reporting period ended December 31, 2021.
Item 4(e)(1):
Set forth below are the policies and procedures established by the Audit Committee of the Board of Trustees relating to the pre-approval of audit and non-audit related services:
To the extent required by applicable law, pre-approval by the Audit Committee of the Board is needed for all audit and permissible non-audit services rendered to the Fund and all permissible non-audit services rendered to MFS or MFS Related Entities if the services relate directly to the operations and financial reporting of the Registrant. Pre-approval is currently on an engagement-by-engagement basis. In the event pre- approval of such services is necessary between regular meetings of the Audit Committee and it is not practical to wait to seek pre-approval at the next regular meeting of the Audit Committee, pre-approval of such services may be referred to the Chair of the Audit Committee for approval; provided that the Chair may not pre-approve any individual engagement for such services exceeding $50,000 or multiple engagements for such services in the aggregate exceeding $100,000 between such regular meetings of the Audit Committee. Any engagement pre-approved by the Chair between regular meetings of the Audit Committee shall be presented for ratification by the entire Audit Committee at its next regularly scheduled meeting.
Item 4(e)(2):
None, or 0%, of the services relating to the Audit-Related Fees, Tax Fees and All Other Fees paid by the Fund and MFS and MFS Related Entities relating directly to the operations and financial reporting of the Registrant disclosed above were approved by the audit committee pursuant to paragraphs (c)(7)(i)(C) of Rule 2-01 of Regulation S-X (which permits audit committee approval after the start of the engagement with respect to services other than audit, review or attest services, if certain conditions are satisfied).
Item 4(f):
Not applicable.
Item 4(h):
The Registrant's Audit Committee has considered whether the provision by a Registrant's independent registered public accounting firm of non-audit services to MFS and MFS Related Entities that were not pre-approved by the Committee (because such services were provided prior to the effectiveness of SEC rules requiring pre-approval or because such services did not relate directly to the operations and financial reporting of the Registrant) was compatible with maintaining the independence of the independent registered public accounting firm as the Registrant's principal auditors.
ITEM 5. AUDIT COMMITTEE OF LISTED REGISTRANTS.
Not applicable to the Registrant.
ITEM 6. INVESTMENTS
A schedule of investments for each series covered by this Form N-CSR is included as part of the report to shareholders of such series under Item 1(a) of this Form N-CSR.
ITEM 7. DISCLOSURE OF PROXY VOTING POLICIES AND PROCEDURES FOR CLOSED-END MANAGEMENT INVESTMENT COMPANIES.
Not applicable to the Registrant.
ITEM 8. PORTFOLIO MANAGERS OF CLOSED-END MANAGEMENT INVESTMENT COMPANIES.
Not applicable to the Registrant.
ITEM 9. PURCHASES OF EQUITY SECURITIES BY CLOSED-END MANAGEMENT INVESTMENT COMPANY AND AFFILIATED PURCHASERS.
Not applicable to the Registrant.
ITEM 10. SUBMISSION OF MATTERS TO A VOTE OF SECURITY HOLDERS.
There were no material changes to the procedures by which shareholders may send recommendations to the Board for nominees to the Registrant's Board since the Registrant last provided disclosure as to such procedures in response to the requirements of Item 407 (c)(2)(iv) of Regulation S-K or this Item.
ITEM 11. CONTROLS AND PROCEDURES.
(a)Based upon their evaluation of the effectiveness of the registrant's disclosure controls and procedures (as defined in Rule 30a-3(c) under the Investment Company Act of 1940 (the "Act")) as conducted within 90 days of the filing date of this report on Form N-CSR, the Registrant's principal financial officer and principal executive officer have concluded that those disclosure controls and procedures provide reasonable assurance that the material information required to be disclosed by the Registrant on this report is recorded, processed, summarized and reported within the time periods specified in the Securities and Exchange Commission's rules and forms.
(b)There were no changes in the Registrant's internal controls over financial reporting (as defined in Rule 30a-3(d) under the Act) that occurred during the period covered by the report that have materially affected, or are reasonably likely to materially affect, the Registrant's internal control over financial reporting.
ITEM 12. DISCLOSURE OF SECURITIES LENDING ACTIVITIES FOR CLOSED-END MANAGEMENT INVESTMENT COMPANIES.
Not applicable to the Registrant.
ITEM 13. EXHIBITS.
(a)(1) Any code of ethics, or amendment thereto, that is the subject of the disclosure required by Item 2, to the extent that the registrant intends to satisfy the Item 2 requirements through filing of an exhibit: Attached hereto as EX-99.COE.
(2)A separate certification for each principal executive officer and principal financial officer of the registrant as required by Rule 30a-2(a) under the Act (17 CFR 270.30a-2): Attached hereto as EX-99.302CERT.
(3)Any written solicitation to purchase securities under Rule 23c-1 under the Act (17 CFR 270.23c-1) sent or given during the period covered by the report by or on behalf of the registrant to 10 or more persons. Not applicable.
(4)Change in the registrant's independent public accountant. Not applicable.
(b)If the report is filed under Section 13(a) or 15(d) of the Exchange Act, provide the certifications required by Rule 30a-2(b) under the Act (17 CFR 270.30a-2(b)), Rule 13a-14(b) or Rule 15d-14(b) under the Exchange Act (17 CFR 240.13a-14(b) or 240.15d-14(b)) and Section 1350 of Chapter 63 of Title 18 of the United States Code (18 U.S.C. 1350) as an exhibit. A certification furnished pursuant to this paragraph will not be deemed "filed" for the purposes of Section 18 of the Exchange Act (15 U.S.C. 78r), or otherwise subject to the liability of that section. Such certification will not be deemed to be incorporated by reference into any filing under the Securities Act of 1933 or the Exchange Act, except to the extent that the registrant specifically incorporates it by reference. Attached hereto as EX-99.906CERT.
Notice
Notice is hereby given that this instrument is executed on behalf of the Registrant by an officer of the Registrant as an officer and not individually and the obligations of or arising out of this instrument are not binding upon any of the Trustees or shareholders individually, but are binding only upon the assets and property of the respective constituent series of the Registrant.
SIGNATURES
Pursuant to the requirements of the Securities Exchange Act of 1934 and the Investment Company Act of 1940, the registrant has duly caused this report to be signed on its behalf by the undersigned, thereunto duly authorized.
(Registrant) MFS VARIABLE INSURANCE TRUST III
By (Signature and Title)*
/S/ DAVID L. DILORENZO
David L. DiLorenzo, President
Date: February 15, 2023
Pursuant to the requirements of the Securities Exchange Act of 1934 and the Investment Company Act of 1940, this report has been signed below by the following persons on behalf of the registrant and in the capacities and on the dates indicated.
By (Signature and Title)*
/S/ DAVID L. DILORENZO
David L. DiLorenzo, President (Principal Executive Officer)
Date: February 15, 2023
By (Signature and Title)*
/S/ JAMES O. YOST
James O. Yost, Treasurer (Principal Financial Officer and Accounting Officer) Date: February 15, 2023
* Print name and title of each signing officer under his or her signature.