UNITED STATES
SECURITIES AND EXCHANGE COMMISSION
Washington, D.C. 20549
FORMN-CSR
CERTIFIED SHAREHOLDER REPORT OF
REGISTERED MANAGEMENT INVESTMENT COMPANIES
Investment Company Act file number811-08879
MFS VARIABLE INSURANCE TRUST III
(Exact name of registrant as specified in charter)
111 Huntington Avenue, Boston, Massachusetts 02199
(Address of principal executive offices) (Zip code)
Christopher R. Bohane
Massachusetts Financial Services Company
111 Huntington Avenue
Boston, Massachusetts 02199
(Name and address of agents for service)
Registrant’s telephone number, including area code: (617)954-5000
Date of fiscal year end: December 31
Date of reporting period: December 31, 2019
| ITEM 1. | REPORTS TO STOCKHOLDERS. |
Annual Report
December 31, 2019

MFS® Blended Research® Small Cap Equity Portfolio

MFS® Variable Insurance Trust III
Beginning on January 1, 2021, as permitted by regulations adopted by the U.S. Securities and Exchange Commission, the insurance company that offers your contract may determine that it will no longer send you paper copies of the fund’s annual and semiannual shareholder reports unless you specifically request paper copies from the insurance company or from your financial intermediary. Instead, the shareholder reports will be made available on a Web site (insurancefunds.mfs.com or other Web site of which you will be notified), and the insurance company will notify you by mail each time a report is posted and provide you with a Web site link to access the report. Instructions for requesting paper copies will be provided by your insurance company or financial intermediary.
If you already elected to receive shareholder reports by email, you will not be affected by this change and you need not take any action. If your insurance company or financial intermediary offers electronic delivery, you may elect to receive shareholder reports and other communications from the insurance company or financial intermediary by email by following the instructions provided by the insurance company or financial intermediary.
Beginning on January 1, 2019, you may elect to receive all future reports in paper free of charge from the insurance company or financial intermediary. You can inform the insurance company or financial intermediary that you wish to continue receiving paper copies of your shareholder reports by contacting your insurance company or financial intermediary. Your election to receive reports in paper will apply to all funds held in your account with your insurance company or financial intermediary.
VSC-ANN
MFS® Blended Research® Small Cap Equity Portfolio
CONTENTS
The report is prepared for the general information of contract owners. It is authorized for distribution to prospective investors only when preceded or accompanied by a current prospectus.
NOT FDIC INSURED• MAY LOSE VALUE• NO BANK OR CREDIT UNION GUARANTEE• NOT A DEPOSIT• NOT INSURED BY ANY FEDERAL GOVERNMENT AGENCY OR NCUA/NCUSIF
MFS Blended Research Small Cap Equity Portfolio
LETTER FROM THE EXECUTIVE CHAIR

Dear Contract Owners:
Slowing global growth, low inflation, and trade friction between the United States and China have been hallmarks of the past 12 months. After experiencing an uptick in market volatility in late 2018, markets steadied for most of 2019, thanks in large measure to the adoption of a dovish policy stance on the part of global central banks, focused on supporting economic growth. Negotiations aimed at a “phase one” trade deal between the U.S. and China bore fruit at the end of the period, boosting investor sentiment, while signs of stability emerging from the global manufacturing sector also lifted spirits. Uncertainty over Brexit, along with the ripple effects from the trade conflict, hampered business confidence and investment in the United Kingdom and Europe for much of the period, though investors expect greater clarity regarding Brexit as a result of December’s general election. The pro-Brexit Conservative Party won the election by a comfortable margin and set the stage for the U.K.’s departure from the EU at the end of January.
Markets expect the longest economic expansion in U.S. history will continue, albeit at a slower pace, as trade tensions recede. In an effort to prolong the expansion, the U.S. Federal Reserve lowered interest rates three times between July and October and the European Central Bank loosened policy in September. While the global monetary policy backdrop remains quite accommodative, signs of easing trade tensions and fading global recession fears led to improved market sentiment in late 2019 as investors grew less risk averse. In early 2020, an outbreak of coronavirus emanating from China reintroduced global growth fears, causing an uptick in volatility.
Here at MFS®, we aim to help our clients navigate the growing complexity of the markets and world economies. Our long-term investment philosophy and commitment to the responsible allocation of capital allow us to tune out the noise and uncover what we believe are the best, most durable investment opportunities in the market. Through our powerful global investment platform, we combine collective expertise, thoughtful risk management and long-term discipline to create sustainable value for investors.
Respectfully,

Robert J. Manning
Executive Chair
MFS Investment Management
February 14, 2020
The opinions expressed in this letter are subject to change and may not be relied upon for investment advice. No forecasts can be guaranteed.
1
MFS Blended Research Small Cap Equity Portfolio
PORTFOLIO COMPOSITION
Portfolio structure

| | | | |
| Top ten holdings | | | | |
| Paylocity Holding Corp. | | | 1.8% | |
| Five9, Inc. | | | 1.6% | |
| Skechers USA, Inc., “A” | | | 1.6% | |
| Cathay General Bancorp, Inc. | | | 1.5% | |
| Prestige Brands Holdings, Inc. | | | 1.4% | |
| Store Capital Corp., REIT | | | 1.4% | |
| Cable One, Inc. | | | 1.4% | |
| KBR, Inc. | | | 1.4% | |
| Tenet Healthcare Corp. | | | 1.4% | |
| Industrial Logistics Properties Trust, REIT | | | 1.4% | |
| | | | |
| Equity sectors (k) | | | | |
| Financial Services | | | 25.2% | |
| Health Care | | | 17.2% | |
| Technology | | | 14.9% | |
| Industrial Goods & Services | | | 6.7% | |
| Autos & Housing | | | 5.7% | |
| Special Products & Services | | | 5.4% | |
| Basic Materials | | | 4.4% | |
| Consumer Staples | | | 3.5% | |
| Energy | | | 3.5% | |
| Leisure | | | 3.4% | |
| Retailing | | | 3.4% | |
| Transportation | | | 2.7% | |
| Utilities | | | 2.4% | |
| Communications | | | 0.8% | |
| (k) | The sectors set forth above and the associated portfolio composition are based on MFS’ own custom sector classification methodology. |
Cash & Cash Equivalents includes any cash, investments in money market funds, short-term securities, and other assets less liabilities. Please see the Statement of Assets and Liabilities for additional information related to the fund’s cash position and other assets and liabilities.
Percentages are based on net assets as of December 31, 2019.
The portfolio is actively managed and current holdings may be different.
2
MFS Blended Research Small Cap Equity Portfolio
MANAGEMENT REVIEW
Summary of Results
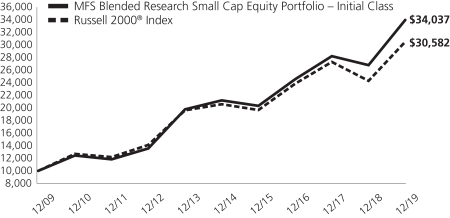
For the twelve months ended December 31, 2019, Initial Class shares of the MFS Blended Research Small Cap Equity Portfolio (fund) provided a total return of 26.78%, while Service Class shares of the fund provided a total return of 26.36%. These compare with a return of 25.52% over the same period for the fund’s benchmark, the Russell 2000® Index.
Market Environment
Fading fears of a near-term global recession, the announcement of a partial trade deal between the United States and China and the decline in uncertainty over Brexit helped bolster market sentiment late in the period. Changes in market sentiment, largely driven by uncertainty over the outcome of trade negotiations between the US and China, had contributed to periodic bouts of volatility during the reporting period. The global economy decelerated, led by weakness in China and Europe, although the pace of the slowdown moderated late in the period amid nascent signs of stabilization in the manufacturing sector.
The deteriorating global growth backdrop, along with declining inflationary pressures, prompted the US Federal Reserve to adopt a more dovish posture beginning in early 2019, resulting in the first interest rate cut in over a decade at the end of July, followed by additional cuts in September and October. The Fed’s actions led to a sharp decline in long-term interest rates during the period’s second half, causing the inversion of portions of the US Treasury yield curve for a time. Amid an improvement in risk sentiment in Q4 2019 and indications of a bottoming in growth and a potential upturn in activity, the Fed indicated in October that further rate cuts were unlikely unless the outlook for the economy materially worsened.
Globally, central banks have tilted more dovish as well, with the European Central Bank unveiling a package of easing measures, which included putting overnight rates deeper into negative territory, restarting its bond-buying program and lengthening the term of cheap loans to banks to three years from two. The central banks of India and Australia are among those that have cut rates several times in recent months, although China has been more cautious in increasing liquidity as it keeps trying to deleverage its economy, cutting rates only marginally.
Emerging markets experienced considerable volatility through the end of 2018, as tighter global financial conditions exposed structural weakness in some countries. Those conditions improved in 2019 as the Fed became more dovish. Notwithstanding the periodic headwinds on market sentiment from significant trade friction between the US and China over much of the year, emerging market hard currency debt and local rates benefited from relatively cheap valuations at the beginning of the period and easier global monetary conditions. These factors, plus the fading of certain global risk factors mentioned above, hastened spread tightening in the latter part of the period. At the same time, idiosyncratic risks spiked in some countries (e.g., Argentina and Lebanon), contributing to increased dispersion in performance among sovereign assets.
Contributors to Performance
Security selection and, to a lesser extent, an overweight position in both thetechnology and consumer staplessectors contributed to performance relative to the Russell 2000® Index. Within thetechnology sector, the fund’s overweight positions in cloud-based software solutions provider Paylocity Holding and security risk intelligence solutions provider Rapid7 (h), and holding shares of software engineering solutions and technology services provider EPAM Systems (b)(h), aided relative results. The stock price of Rapid7 appreciated during the period as the company reported strong financial results, driven by strength in average recurring revenues. Within theconsumer staplessector, holding shares of plant-based meats producer Beyond Meat (b)(h) and multi-national food company Pilgrim’s Pride (b) helped relative returns.
Security selection within theenergysector also bolstered relative performance, led by the timing of the fund’s ownership in shares of oilfield services company ProPetro Holding (h).
Elsewhere, the fund’s overweight positions in engineering, procurement and construction company KBR and hospital operator Tenet Healthcare supported relative results. The share price of KBR advanced, as the company reported solid financial results, due to strong performance in both of its energy solutions and government solutions segments. In addition, holding shares of lifestyle footwear developer Skechers USA (b) and internet and cable service provider Cable One (b) further benefited relative returns.
Detractors from Performance
During the reporting period, security selection within thehealth caresector detracted from relative performance. Within this sector, the fund’s overweight positions in biopharmaceutical company Acorda Therapeutics, global specialty pharmaceutical company Mallinckrodt (h) (United Kingdom), pharmaceutical company AMAG Pharmaceuticals (h) and medical technology company Avanos Medical weakened relative results. The stock price of Acorda Therapeutics declined after the company reported that revenues from its recently launched Parkinson’s drug Inbrija were slightly lower than expectations, which limited visibility about the future trajectory of its sales. Additionally, not holding shares of targeted small molecule pharmaceuticals developer Array Biopharma further weighed on relative returns.
3
MFS Blended Research Small Cap Equity Portfolio
Management Review – continued
Security selection in both thebasic materialsandspecial products & servicessectors also held back relative returns. Within thebasic materialssector, the timing of the fund’s ownership in shares of paper products manufacturer Verso (h) and renewable fuels provider Renewable Energy Group (h) detracted from relative returns. Within thespecial products & servicessector, an overweight position in research, data and advisory services provider Forrester Research dampened relative returns. The stock price of Forrester Research declined during the period, as management lowered its full-year 2019 guidance due to a lower-than-expected contribution from its SiriusDecisions business.
Stocks in other sectors that further hindered relative results included the timing of the fund’s overweight ownership in shares of firearms manufacturer American Outdoor Brands (h) and telecommunications company Shenandoah Telecommunications (h).
Respectfully,
Portfolio Manager(s)
Jim Fallon, Matt Krummell, Jonathan Sage, and Jed Stocks
| (b) | Security is not a benchmark constituent. |
| (h) | Security was not held in the portfolio at period end. |
The views expressed in this report are those of the portfolio manager(s) only through the end of the period of the report as stated on the cover and do not necessarily reflect the views of MFS or any other person in the MFS organization. These views are subject to change at any time based on market or other conditions, and MFS disclaims any responsibility to update such views. These views may not be relied upon as investment advice or an indication of trading intent on behalf of any MFS portfolio. References to specific securities are not recommendations of such securities, and may not be representative of any MFS portfolio’s current or future investments.
4
MFS Blended Research Small Cap Equity Portfolio
PERFORMANCE SUMMARY THROUGH 12/31/19
The following chart illustrates the historical performance of the fund in comparison to its benchmark(s). Benchmarks are unmanaged and may not be invested in directly. Benchmark returns do not reflect any fees or expenses. The performance of other share classes will be greater than or less than that of the class depicted below. (See Notes to Performance Summary.)
Performance data shown represents past performance and is no guarantee of future results. Investment return and principal value fluctuate so your units, when sold, may be worth more or less than the original cost; current performance may be lower or higher than quoted. The performance shown does not reflect the deduction of taxes, if any, that a contract holder would pay on fund distributions or the redemption of contract units. The returns for the fund shown also do not reflect the deduction of expenses associated with variable products, such as mortality and expense risk charges, separate account charges, and sales charges imposed by the insurance company separate accounts. Such expenses would reduce the overall returns shown.
Growth of a Hypothetical $10,000 Investment
Total Returns through 12/31/19
Average annual total returns
| | | | | | | | | | | | |
| | | Share Class | | Class Inception Date | | 1-yr | | 5-yr | | 10-yr | | |
| | | Initial Class | | 7/17/00 | | 26.78% | | 9.89% | | 13.03% | | |
| | | Service Class | | 5/01/06 | | 26.36% | | 9.60% | | 12.73% | | |
| | | | |
| Comparative benchmark(s) | | | | | | | | |
| | | Russell 2000® Index (f) | | 25.52% | | 8.23% | | 11.83% | | |
| (f) | Source: FactSet Research Systems Inc. |
Benchmark Definition(s)
Russell 2000® Index – constructed to provide a comprehensive barometer for securities in the small-cap segment of the U.S. equity universe. The index includes 2,000 of the smallest U.S. companies based on total market capitalization, representing approximately 10% of the investable U.S. equity market. Frank Russell Company (“Russell”) is the source and owner of the trademarks, service marks, and copyrights related to the Russell Indexes. Russell® is a trademark of Frank Russell Company. Neither Russell nor its licensors accept any liability for any errors or omissions in the Russell Indexes and/or Russell ratings or underlying data and no party may rely on any Russell Indexes and/or Russell ratings and/or underlying data contained in this document. No further distribution of Russell Data is permitted without Russell’s express written consent. Russell does not promote, sponsor, or endorse the content of this document.
It is not possible to invest directly in an index.
Notes to Performance Summary
Average annual total return represents the average annual change in value for each share class for the periods presented.
Performance results reflect any applicable expense subsidies and waivers in effect during the periods shown. Without such subsidies and waivers the fund’s performance results would be less favorable. Please see the prospectus and financial statements for complete details. All results are historical and assume the reinvestment of any dividends and capital gains distributions.
5
MFS Blended Research Small Cap Equity Portfolio
Performance Summary – continued
Performance prior to close of business December 7, 2012, reflects time periods when another adviser or subadviser was responsible for selecting investments for the fund under a different investment objective and different investment strategies.
Performance results do not include adjustments made for financial reporting purposes in accordance with U.S. generally accepted accounting principles and may differ from amounts reported in the financial highlights.
From time to time the fund may receive proceeds from litigation settlements, without which performance would be lower.
6
MFS Blended Research Small Cap Equity Portfolio
EXPENSE TABLE
Fund Expenses Borne by the Contract Holders during the Period,
July 1, 2019 through December 31, 2019
As a contract holder of the fund, you incur ongoing costs, including management fees; distribution and/or service(12b-1) fees; and other fund expenses. This example is intended to help you understand your ongoing costs (in dollars) of investing in the fund and to compare these costs with the ongoing costs of investing in other mutual funds.
The example is based on an investment of $1,000 invested at the beginning of the period and held for the entire period July 1, 2019 through December 31, 2019.
Actual Expenses
The first line for each share class in the following table provides information about actual account values and actual expenses. You may use the information in this line, together with the amount you invested, to estimate the expenses that you paid over the period. Simply divide your account value by $1,000 (for example, an $8,600 account value divided by $1,000 = 8.6), then multiply the result by the number in the first line under the heading entitled “Expenses Paid During Period” to estimate the expenses you paid on your account during this period.
Hypothetical Example for Comparison Purposes
The second line for each share class in the following table provides information about hypothetical account values and hypothetical expenses based on the fund’s actual expense ratio and an assumed rate of return of 5% per year before expenses, which is not the fund’s actual return. The hypothetical account values and expenses may not be used to estimate the actual ending account balance or expenses you paid for the period. You may use this information to compare the ongoing costs of investing in the fund and other funds. To do so, compare this 5% hypothetical example with the 5% hypothetical examples that appear in the shareholder reports of the other funds.
Please note that the expenses shown in the table are meant to highlight the fund’s ongoing costs only and do not take into account the fees and expenses imposed under the variable contracts through which your investment in the fund is made. Therefore, the second line for each share class in the table is useful in comparing ongoing costs associated with an investment in vehicles (such as the fund) which fund benefits under variable annuity and variable life insurance contracts and to qualified pension and retirement plans only, and will not help you determine the relative total costs of investing in the fund through variable annuity and variable life insurance contracts. If the fees and expenses imposed under the variable contracts were included, your costs would have been higher.
| | | | | | | | | | | | | | | | | | |
| Share Class | | | | Annualized
Expense Ratio | | | Beginning
Account Value
7/01/19 | | | Ending
Account Value
12/31/19 | | | Expenses Paid
During Period (p)
7/01/19-12/31/19 | |
| Initial Class | | Actual | | | 0.52% | | | | $1,000.00 | | | | $1,069.14 | | | | $2.71 | |
| | Hypothetical (h) | | | 0.52% | | | | $1,000.00 | | | | $1,022.58 | | | | $2.65 | |
| Service Class | | Actual | | | 0.77% | | | | $1,000.00 | | | | $1,066.31 | | | | $4.01 | |
| | Hypothetical (h) | | | 0.77% | | | | $1,000.00 | | | | $1,021.32 | | | | $3.92 | |
| (h) | 5% class return per year before expenses. |
| (p) | “Expenses Paid During Period” are equal to each class’s annualized expense ratio, as shown above, multiplied by the average account value over the period, multiplied by 184/365 (to reflect theone-half year period). |
7
MFS Blended Research Small Cap Equity Portfolio
PORTFOLIO OF INVESTMENTS – 12/31/19
The Portfolio of Investments is a complete list of all securities owned by your fund. It is categorized by broad-based asset classes.
| | | | | | | | |
| Issuer | | Shares/Par | | | Value ($) | |
| COMMON STOCKS – 99.2% | | | | | | | | |
| Aerospace – 1.3% | | | | | | | | |
| CACI International, Inc., “A” (a) | | | 5,200 | | | $ | 1,299,948 | |
| | | | | | | | |
| Apparel Manufacturers – 2.0% | | | | | | | | |
| Levi Strauss & Co., “A” | | | 19,638 | | | $ | 378,817 | |
| Skechers USA, Inc., “A” (a) | | | 35,426 | | | | 1,530,049 | |
| | | | | | | | |
| | | | | | $ | 1,908,866 | |
| | | | | | | | |
| Automotive – 2.0% | |
| IAA, Inc. (a) | | | 18,913 | | | $ | 890,046 | |
| Stoneridge, Inc. (a) | | | 34,573 | | | | 1,013,680 | |
| | | | | | | | |
| | | | | | $ | 1,903,726 | |
| | | | | | | | |
| Biotechnology – 6.1% | |
| Acorda Therapeutics, Inc. (a) | | | 60,139 | | | $ | 122,684 | |
| Adaptive Biotechnologies Corp. (a) | | | 5,232 | | | | 156,541 | |
| Akebia Therapeutics, Inc. (a) | | | 79,474 | | | | 502,276 | |
| Arena Pharmaceuticals, Inc. (a) | | | 10,165 | | | | 461,694 | |
| Bio-Techne Corp. | | | 5,108 | | | | 1,121,257 | |
| Bruker BioSciences Corp. | | | 10,493 | | | | 534,828 | |
| Coherus BioSciences, Inc. (a) | | | 28,916 | | | | 520,633 | |
| CytomX Therapeutics, Inc. (a) | | | 45,397 | | | | 377,249 | |
| Esperion Therapeutics, Inc. (a) | | | 12,400 | | | | 739,412 | |
| Exelixis, Inc. (a) | | | 8,418 | | | | 148,325 | |
| Macrogenics, Inc. (a) | | | 33,461 | | | | 364,056 | |
| Pieris Pharmaceuticals, Inc. (a) | | | 22,334 | | | | 80,849 | |
| Retrophin, Inc. (a) | | | 19,225 | | | | 272,995 | |
| Varex Imaging Corp. (a) | | | 17,336 | | | | 516,786 | |
| | | | | | | | |
| | | | | | $ | 5,919,585 | |
| | | | | | | | |
| Broadcasting – 0.4% | |
| Sinclair Broadcast Group, Inc. | | | 11,101 | | | $ | 370,107 | |
| | | | | | | | |
| Brokerage & Asset Managers – 0.1% | |
| LPL Financial Holdings, Inc. | | | 1,381 | | | $ | 127,397 | |
| | | | | | | | |
| Business Services – 1.0% | |
| Forrester Research, Inc. (a) | | | 21,230 | | | $ | 885,291 | |
| World Fuel Services Corp. | | | 2,930 | | | | 127,221 | |
| | | | | | | | |
| | | | | | $ | 1,012,512 | |
| | | | | | | | |
| Cable TV – 1.4% | |
| Cable One, Inc. | | | 915 | | | $ | 1,361,950 | |
| | | | | | | | |
| Chemicals – 0.4% | |
| Ingevity Corp. (a) | | | 3,912 | | | $ | 341,831 | |
| | | | | | | | |
| Computer Software – 4.3% | |
| Cornerstone OnDemand, Inc. (a) | | | 21,726 | | | $ | 1,272,057 | |
| Everbridge, Inc. (a) | | | 1,585 | | | | 123,757 | |
| Paylocity Holding Corp. (a) | | | 14,591 | | | | 1,762,885 | |
| RingCentral, Inc. (a) | | | 3,473 | | | | 585,791 | |
| SecureWorks Corp. (a)(l) | | | 22,111 | | | | 368,369 | |
| | | | | | | | |
| | | | | | $ | 4,112,859 | |
| | | | | | | | |
| Computer Software – Systems – 3.2% | | | | | | | | |
| Box, Inc., “A” (a) | | | 12,383 | | | $ | 207,787 | |
| Five9, Inc. (a) | | | 23,707 | | | | 1,554,705 | |
| | | | | | | | |
| | |
| Issuer | | Shares/Par | | | Value ($) | |
| COMMON STOCKS – continued | | | | | | | | |
| Computer Software – Systems – continued | | | | | |
| Insight Enterprises, Inc. (a) | | | 3,761 | | | $ | 264,360 | |
| Verint Systems, Inc. (a) | | | 18,425 | | | | 1,020,008 | |
| | | | | | | | |
| | | | | | $ | 3,046,860 | |
| | | | | | | | |
| Construction – 1.1% | |
| Eagle Materials, Inc. | | | 5,809 | | | $ | 526,644 | |
| Toll Brothers, Inc. | | | 14,425 | | | | 569,932 | |
| | | | | | | | |
| | | | | | $ | 1,096,576 | |
| | | | | | | | |
| Consumer Products – 1.6% | |
| Prestige Brands Holdings, Inc. (a) | | | 34,199 | | | $ | 1,385,060 | |
| USANA Health Sciences, Inc. (a) | | | 1,584 | | | | 124,423 | |
| | | | | | | | |
| | | | | | $ | 1,509,483 | |
| | | | | | | | |
| Consumer Services – 1.0% | |
| Grand Canyon Education, Inc. (a) | | | 9,760 | | | $ | 934,910 | |
| | | | | | | | |
| Electrical Equipment – 2.6% | |
| TriMas Corp. (a) | | | 39,666 | | | $ | 1,245,909 | |
| WESCO International, Inc. (a) | | | 20,686 | | | | 1,228,542 | |
| | | | | | | | |
| | | | | | $ | 2,474,451 | |
| | | | | | | | |
| Electronics – 3.6% | |
| Amkor Technology, Inc. (a) | | | 63,420 | | | $ | 824,460 | |
| Jabil Circuit, Inc. | | | 20,139 | | | | 832,345 | |
| Plexus Corp. (a) | | | 13,374 | | | | 1,028,996 | |
| Sanmina Corp. (a) | | | 13,754 | | | | 470,937 | |
| Silicon Laboratories, Inc. (a) | | | 2,626 | | | | 304,563 | |
| | | | | | | | |
| | | | | | $ | 3,461,301 | |
| | | | | | | | |
| Energy – Independent – 1.6% | |
| Arch Coal, Inc. | | | 5,880 | | | $ | 421,831 | |
| Delek U.S. Holdings, Inc. | | | 10,423 | | | | 349,483 | |
| Par Pacific Holdings, Inc. (a) | | | 9,215 | | | | 214,157 | |
| Warrior Met Coal, Inc. | | | 14,289 | | | | 301,926 | |
| WPX Energy, Inc. (a) | | | 20,105 | | | | 276,243 | |
| | | | | | | | |
| | | | | | $ | 1,563,640 | |
| | | | | | | | |
| Engineering – Construction – 3.9% | |
| Great Lakes Dredge & Dock Corp. (a) | | | 40,074 | | | $ | 454,038 | |
| KBR, Inc. | | | 44,432 | | | | 1,355,176 | |
| Matrix Service Co. (a) | | | 18,919 | | | | 432,867 | |
| Quanta Services, Inc. | | | 27,439 | | | | 1,117,042 | |
| Tutor Perini Corp. (a) | | | 32,528 | | | | 418,310 | |
| | | | | | | | |
| | | | | | $ | 3,777,433 | |
| | | | | | | | |
| Food & Beverages – 3.3% | |
| Hostess Brands, Inc. (a) | | | 88,794 | | | $ | 1,291,065 | |
| Ingredion, Inc. | | | 10,930 | | | | 1,015,944 | |
| Pilgrim’s Pride Corp. (a) | | | 27,325 | | | | 893,937 | |
| | | | | | | | |
| | | | | | $ | 3,200,946 | |
| | | | | | | | |
| Forest & Paper Products – 0.4% | |
| Boise Cascade Corp. | | | 11,466 | | | $ | 418,853 | |
| | | | | | | | |
8
MFS Blended Research Small Cap Equity Portfolio
Portfolio of Investments – continued
| | | | | | | | |
| | |
| Issuer | | Shares/Par | | | Value ($) | |
| COMMON STOCKS – continued | | | | | |
| Gaming & Lodging – 1.2% | | | | | | | | |
| Everi Holdings, Inc. (a) | | | 12,430 | | | $ | 166,935 | |
| Wyndham Hotels & Resorts, Inc. | | | 16,499 | | | | 1,036,302 | |
| | | | | | | | |
| | | | | | $ | 1,203,237 | |
| | | | | | | | |
| Health Maintenance Organizations – 1.0% | |
| Magellan Health Services, Inc. (a) | | | 3,091 | | | $ | 241,871 | |
| Molina Healthcare, Inc. (a) | | | 5,575 | | | | 756,471 | |
| | | | | | | | |
| | | | | | $ | 998,342 | |
| | | | | | | | |
| Insurance – 4.5% | | | | | | | | |
| American Equity Investment Life Holding Co. | | | 32,264 | | | $ | 965,661 | |
| Brighthouse Financial, Inc. (a) | | | 1,127 | | | | 44,212 | |
| CNO Financial Group, Inc. | | | 32,999 | | | | 598,272 | |
| Essent Group Ltd. | | | 15,580 | | | | 810,004 | |
| MGIC Investment Corp. | | | 53,727 | | | | 761,312 | |
| Radian Group, Inc. | | | 33,645 | | | | 846,508 | |
| Universal Insurance Holdings, Inc. | | | 12,406 | | | | 347,244 | |
| | | | | | | | |
| | | | | | $ | 4,373,213 | |
| | | | | | | | |
| Internet – 0.6% | |
| LogMeIn, Inc. | | | 6,786 | | | $ | 581,832 | |
| | | | | | | | |
| Leisure & Toys – 1.4% | | | | | | | | |
| Brunswick Corp. | | | 19,825 | | | $ | 1,189,103 | |
| Funko, Inc., “A” (a) | | | 10,879 | | | | 186,684 | |
| | | | | | | | |
| | | | | | $ | 1,375,787 | |
| | | | | | | | |
| Machinery & Tools – 4.3% | | | | | | | | |
| ACCO Brands Corp. | | | 24,011 | | | $ | 224,743 | |
| AGCO Corp. | | | 15,420 | | | | 1,191,195 | |
| Allison Transmission Holdings, Inc. | | | 6,705 | | | | 323,985 | |
| ITT, Inc. | | | 6,639 | | | | 490,688 | |
| Park-Ohio Holdings Corp. | | | 12,661 | | | | 426,043 | |
| Regal Beloit Corp. | | | 12,354 | | | | 1,057,626 | |
| Titan Machinery, Inc. (a) | | | 30,610 | | | | 452,416 | |
| | | | | | | | |
| | | | | | $ | 4,166,696 | |
| | | | | | | | |
| Medical & Health Technology & Services – 3.7% | |
| Allscripts Healthcare Solutions, Inc. (a) | | | 8,259 | | | $ | 81,062 | |
| HealthEquity, Inc. (a) | | | 8,642 | | | | 640,113 | |
| Medpace Holdings, Inc. (a) | | | 3,761 | | | | 316,150 | |
| Premier, Inc., “A” (a) | | | 32,396 | | | | 1,227,160 | |
| Tenet Healthcare Corp. (a) | | | 35,429 | | | | 1,347,365 | |
| | | | | | | | |
| | | | | | $ | 3,611,850 | |
| | | | | | | | |
| Medical Equipment – 3.8% | | | | | | | | |
| AngioDynamics, Inc. (a) | | | 24,658 | | | $ | 394,775 | |
| Avanos Medical, Inc. (a) | | | 13,423 | | | | 452,355 | |
| CONMED Corp. | | | 8,314 | | | | 929,755 | |
| CUTERA, Inc. (a) | | | 2,284 | | | | 81,790 | |
| Envista Holdings Corp. (a) | | | 16,540 | | | | 490,246 | |
| Integer Holdings Corp. (a) | | | 9,964 | | | | 801,404 | |
| IntriCon Corp. (a) | | | 5,849 | | | | 105,282 | |
| LivaNova PLC (a) | | | 1,587 | | | | 119,707 | |
| Orthofix Medical, Inc. (a) | | | 5,389 | | | | 248,864 | |
| | | | | | | | |
| | | | | | $ | 3,624,178 | |
| | | | | | | | |
| | | | | | | | |
| | |
| Issuer | | Shares/Par | | | Value ($) | |
| COMMON STOCKS – continued | | | | | |
| Metals & Mining – 0.3% | | | | | | | | |
| Olympic Steel, Inc. | | | 4,432 | | | $ | 79,421 | |
| Ryerson Holding Corp. (a) | | | 17,176 | | | | 203,192 | |
| Schnitzer Steel Industries, Inc., “A” | | | 2,216 | | | | 48,043 | |
| | | | | | | | |
| | | | | | $ | 330,656 | |
| | | | | | | | |
| Natural Gas – Distribution – 0.4% | | | | | | | | |
| MDU Resources Group, Inc. | | | 7,895 | | | $ | 234,561 | |
| Southwest Gas Holdings, Inc. | | | 1,395 | | | | 105,978 | |
| | | | | | | | |
| | | | | | $ | 340,539 | |
| | | | | | | | |
| Natural Gas – Pipeline – 0.3% | | | | | | | | |
| Equitrans Midstream Corp. | | | 23,026 | | | $ | 307,627 | |
| | | | | | | | |
| Oil Services – 2.8% | | | | | | | | |
| Cactus, Inc., “A” | | | 32,900 | | | $ | 1,129,128 | |
| Liberty Oilfield Services, Inc. | | | 65,720 | | | | 730,807 | |
| MRC Global, Inc. (a) | | | 58,663 | | | | 800,163 | |
| | | | | | | | |
| | | | | | $ | 2,660,098 | |
| | | | | | | | |
| Other Banks & Diversified Financials – 12.7% | | | | | |
| Bank OZK | | | 39,076 | | | $ | 1,192,013 | |
| Cathay General Bancorp, Inc. | | | 36,864 | | | | 1,402,675 | |
| Curo Group Holdings Corp. (a) | | | 40,562 | | | | 494,045 | |
| East West Bancorp, Inc. | | | 13,961 | | | | 679,901 | |
| Enova International, Inc. (a) | | | 21,425 | | | | 515,486 | |
| First Hawaiian, Inc. | | | 43,592 | | | | 1,257,629 | |
| Hanmi Financial Corp. | | | 55,896 | | | | 1,117,641 | |
| Herc Holdings, Inc. (a) | | | 15,174 | | | | 742,616 | |
| Navient Corp. | | | 10,634 | | | | 145,473 | |
| OFG Bancorp | | | 6,510 | | | | 153,701 | |
| OneMain Holdings, Inc. | | | 11,489 | | | | 484,261 | |
| Popular, Inc. | | | 10,775 | | | | 633,031 | |
| Regional Management Corp. (a) | | | 20,399 | | | | 612,582 | |
| Triton International Ltd. of Bermuda | | | 16,636 | | | | 668,767 | |
| UMB Financial Corp. | | | 4,657 | | | | 319,657 | |
| Umpqua Holdings Corp. | | | 46,259 | | | | 818,784 | |
| Wintrust Financial Corp. | | | 14,841 | | | | 1,052,227 | |
| | | | | | | | |
| | | | | | $ | 12,290,489 | |
| | | | | | | | |
| Pharmaceuticals – 2.7% | | | | | | | | |
| Assertio Therapeutics, Inc. (a) | | | 84,104 | | | $ | 105,130 | |
| Catalent, Inc. (a) | | | 5,192 | | | | 292,310 | |
| Horizon Therapeutics PLC (a) | | | 26,562 | | | | 961,544 | |
| Lannett Co., Inc. (a) | | | 38,574 | | | | 340,223 | |
| Phibro Animal Health Corp., “A” | | | 16,050 | | | | 398,521 | |
| United Therapeutics Corp. (a) | | | 5,245 | | | | 461,980 | |
| | | | | | | | |
| | | | | | $ | 2,559,708 | |
| | | | | | | | |
| Railroad & Shipping – 1.7% | | | | | | | | |
| DHT Holdings, Inc. | | | 59,997 | | | $ | 496,775 | |
| Dorian LPG Ltd. (a) | | | 43,760 | | | | 677,405 | |
| Teekay Tankers LTD., “A” (a) | | | 19,419 | | | | 465,473 | |
| | | | | | | | |
| | | | | | $ | 1,639,653 | |
| | | | | | | | |
| Real Estate – 9.3% | | | | | | | | |
| CoreCivic, Inc., REIT | | | 39,145 | | | $ | 680,340 | |
| Easterly Government Properties, REIT | | | 54,210 | | | | 1,286,403 | |
9
MFS Blended Research Small Cap Equity Portfolio
Portfolio of Investments – continued
| | | | | | | | |
| | |
| Issuer | | Shares/Par | | | Value ($) | |
| COMMON STOCKS – continued | | | | | |
| Real Estate – continued | | | | | | | | |
| Essential Properties Realty Trust, REIT | | | 21,976 | | | $ | 545,225 | |
| Industrial Logistics Properties Trust, REIT | | | 59,401 | | | | 1,331,770 | |
| Life Storage, Inc., REIT | | | 11,004 | | | | 1,191,513 | |
| Service Properties Trust, REIT | | | 19,869 | | | | 483,413 | |
| Spirit Realty Capital, Inc., REIT | | | 23,453 | | | | 1,153,419 | |
| STAG Industrial, Inc., REIT | | | 30,158 | | | | 952,088 | |
| STORE Capital Corp., REIT | | | 36,591 | | | | 1,362,649 | |
| | | | | | | | |
| | | | | | $ | 8,986,820 | |
| | | | | | | | |
| Restaurants – 0.7% | | | | | | | | |
| Wendy’s Co. | | | 31,036 | | | $ | 689,310 | |
| | | | | | | | |
| Specialty Chemicals – 1.6% | | | | | | | | |
| Element Solutions, Inc. (a) | | | 57,434 | | | $ | 670,829 | |
| Univar Solutions, Inc. (a) | | | 34,800 | | | | 843,552 | |
| | | | | | | | |
| | | | | | $ | 1,514,381 | |
| | | | | | | | |
| Specialty Stores – 0.3% | | | | | | | | |
| Hudson Ltd., “A” (a) | | | 18,538 | | | $ | 284,373 | |
| | | | | | | | |
| Telecommunications – Wireless – 0.4% | | | | | |
| Telephone and Data Systems, Inc. | | | 15,476 | | | $ | 393,555 | |
| | | | | | | | |
| Telephone Services – 0.5% | | | | | | | | |
| ATN International, Inc. | | | 8,915 | | | $ | 493,802 | |
| | | | | | | | |
| Trucking – 1.0% | | | | | | | | |
| Forward Air Corp. | | | 14,063 | | | $ | 983,707 | |
| | | | | | | | |
| Utilities – Electric Power – 2.7% | | | | | | | | |
| Clearway Energy, Inc., “A” | | | 50,384 | | | $ | 963,342 | |
| NRG Energy, Inc. | | | 18,759 | | | | 745,670 | |
| Portland General Electric Co. | | | 8,650 | | | | 482,584 | |
| Spark Energy, Inc., “A” | | | 40,119 | | | | 370,298 | |
| | | | | | | | |
| | | | | | $ | 2,561,894 | |
| | | | | | | | |
Total Common Stocks
(Identified Cost, $80,880,618) | | | | | | $ | 95,814,981 | |
| | | | | | | | |
| | | | | | | | |
| | |
| Issuer | | Shares/Par | | | Value ($) | |
| INVESTMENT COMPANIES (h) – 0.8% | | | | | |
| Money Market Funds – 0.8% | | | | | | | | |
| MFS Institutional Money Market Portfolio, 1.7% (v) (Identified Cost, $757,875) | | | 757,875 | | | $ | 757,875 | |
| | | | | | | | |
|
| COLLATERAL FOR SECURITIES LOANED – 0.1% | |
| State Street Navigator Securities Lending Government Money Market Portfolio, 1.58% (j) (Identified Cost, $96,250) | | | 96,250 | | | $ | 96,250 | |
| | | | | | | | |
OTHER ASSETS, LESS
LIABILITIES – (0.1)% | | | | | | | (129,797 | ) |
| | | | | | | | |
| NET ASSETS – 100.0% | | | | | | $ | 96,539,309 | |
| | | | | | | | |
| (a) | | Non-income producing security. |
| (h) | | An affiliated issuer, which may be considered one in which the fund owns 5% or more of the outstanding voting securities, or a company which is under common control. At period end, the aggregate values of the fund’s investments in affiliated issuers and in unaffiliated issuers were $757,875 and $95,911,231, respectively. |
| (j) | | The rate quoted is the annualizedseven-day yield of the fund at period end. |
| (l) | | A portion of this security is on loan. See Note 2 for additional information. |
| (v) | | Affiliated issuer that is available only to investment companies managed by MFS. The rate quoted for the MFS Institutional Money Market Portfolio is the annualizedseven-day yield of the fund at period end. |
The following abbreviations are used in this report and are defined:
| REIT | | Real Estate Investment Trust |
See Notes to Financial Statements
10
MFS Blended Research Small Cap Equity Portfolio
FINANCIAL STATEMENTS | STATEMENT OF ASSETS AND LIABILITIES
This statement represents your fund’s balance sheet, which details the assets and liabilities comprising the total value of the fund.
| | | | |
At 12/31/19 | | | | |
| |
Assets | | | | |
Investments in unaffiliated issuers, at value, including $164,318 of securities on loan (identified cost, $80,976,868) | | | $95,911,231 | |
Investments in affiliated issuers, at value (identified cost, $757,875) | | | 757,875 | |
Receivables for | | | | |
Fund shares sold | | | 11,854 | |
Interest and dividends | | | 90,699 | |
Other assets | | | 817 | |
Total assets | | | $96,772,476 | |
| |
Liabilities | | | | |
Payables for | | | | |
Fund shares reacquired | | | $80,433 | |
Collateral for securities loaned, at value (c) | | | 96,250 | |
Payable to affiliates | | | | |
Investment adviser | | | 2,059 | |
Administrative services fee | | | 127 | |
Shareholder servicing costs | | | 18 | |
Distribution and/or service fees | | | 836 | |
| Payable for independent Trustees’ compensation | | | 11 | |
Accrued expenses and other liabilities | | | 53,433 | |
Total liabilities | | | $233,167 | |
Net assets | | | $96,539,309 | |
| |
Net assets consist of | | | | |
Paid-in capital | | | $74,886,118 | |
Total distributable earnings (loss) | | | 21,653,191 | |
Net assets | | | $96,539,309 | |
Shares of beneficial interest outstanding | | | 8,474,411 | |
| | | | | | | | | | | | |
| | | |
| | | Net assets | | | Shares
outstanding | | | Net asset value
per share | |
Initial Class | | | $35,440,620 | | | | 3,040,726 | | | | $11.66 | |
Service Class | | | 61,098,689 | | | | 5,433,685 | | | | 11.24 | |
| (c) | Non-cash collateral is not included. |
See Notes to Financial Statements
11
MFS Blended Research Small Cap Equity Portfolio
FINANCIAL STATEMENTS | STATEMENT OF OPERATIONS
This statement describes how much your fund earned in investment income and accrued in expenses. It also describes any gains and/or losses generated by fund operations.
| | | | |
Year ended 12/31/19 | | | | |
| |
Net investment income (loss) | | | | |
Income | | | | |
Dividends | | | $1,184,560 | |
Income on securities loaned | | | 34,990 | |
Dividends from affiliated issuers | | | 18,901 | |
Other | | | 16,446 | |
Foreign taxes withheld | | | (1,542 | ) |
Total investment income | | | $1,253,355 | |
Expenses | | | | |
Management fee | | | $373,749 | |
Distribution and/or service fees | | | 149,917 | |
Shareholder servicing costs | | | 5,100 | |
Administrative services fee | | | 23,340 | |
Independent Trustees’ compensation | | | 3,100 | |
Custodian fee | | | 5,237 | |
Shareholder communications | | | 13,986 | |
Audit and tax fees | | | 54,887 | |
Legal fees | | | 807 | |
Miscellaneous | | | 26,137 | |
Total expenses | | | $656,260 | |
Reduction of expenses by investment adviser | | | (9,119 | ) |
Net expenses | | | $647,141 | |
Net investment income (loss) | | | $606,214 | |
| |
Realized and unrealized gain (loss) | | | | |
Realized gain (loss) (identified cost basis) | | | | |
Unaffiliated issuers | | | $6,772,411 | |
Affiliated issuers | | | 295 | |
Net realized gain (loss) | | | $6,772,706 | |
Change in unrealized appreciation or depreciation | | | | |
Unaffiliated issuers | | | $14,566,646 | |
Net realized and unrealized gain (loss) | | | $21,339,352 | |
Change in net assets from operations | | | $21,945,566 | |
See Notes to Financial Statements
12
MFS Blended Research Small Cap Equity Portfolio
FINANCIAL STATEMENTS | STATEMENTS OF CHANGES IN NET ASSETS
These statements describe the increases and/or decreases in net assets resulting from operations, any distributions, and any shareholder transactions.
| | | | | | | | |
| | | Year ended | |
| | | 12/31/19 | | | 12/31/18 | |
Change in net assets | | | | | | | | |
| | |
From operations | | | | | | | | |
Net investment income (loss) | | | $606,214 | | | | $531,740 | |
Net realized gain (loss) | | | 6,772,706 | | | | 15,299,479 | |
Net unrealized gain (loss) | | | 14,566,646 | | | | (18,798,977 | ) |
Change in net assets from operations | | | $21,945,566 | | | | $(2,967,758 | ) |
Total distributions to shareholders | | | $(15,999,143 | ) | | | $(12,885,061 | ) |
Change in net assets from fund share transactions | | | $5,008,803 | | | | $(6,124,153 | ) |
Total change in net assets | | | $10,955,226 | | | | $(21,976,972 | ) |
| | |
Net assets | | | | | | | | |
At beginning of period | | | 85,584,083 | | | | 107,561,055 | |
At end of period | | | $96,539,309 | | | | $85,584,083 | |
See Notes to Financial Statements
13
MFS Blended Research Small Cap Equity Portfolio
FINANCIAL STATEMENTS | FINANCIAL HIGHLIGHTS
The financial highlights table is intended to help you understand the fund’s financial performance for the past 5 years. Certain information reflects financial results for a single fund share. The total returns in the table represent the rate that an investor would have earned (or lost) on an investment in the fund share class (assuming reinvestment of all distributions) held for the entire period.
| | | | | | | | | | | | | | | | | | | | |
| Initial Class | | Year ended | |
| | | | | |
| | | 12/31/19 | | | 12/31/18 | | | 12/31/17 | | | 12/31/16 | | | 12/31/15 | |
| | | | | |
Net asset value, beginning of period | | | $11.25 | | | | $13.47 | | | | $13.23 | | | | $12.29 | | | | $16.04 | |
| | | | | |
| Income (loss) from investment operations | | | | | | | | | | | | | | | | | | | | |
Net investment income (loss) (d) | | | $0.10 | | | | $0.09 | | | | $0.11 | | | | $0.11 | (c) | | | $0.15 | |
Net realized and unrealized gain (loss) | | | 2.56 | | | | (0.40 | ) | | | 1.70 | | | | 2.35 | | | | (0.94 | ) |
Total from investment operations | | | $2.66 | | | | $(0.31 | ) | | | $1.81 | | | | $2.46 | | | | $(0.79 | ) |
| | | | | |
| Less distributions declared to shareholders | | | | | | | | | | | | | | | | | | | | |
From net investment income | | | $(0.10 | ) | | | $(0.13 | ) | | | $(0.12 | ) | | | $(0.16 | ) | | | $(0.10 | ) |
From net realized gain | | | (2.15 | ) | | | (1.78 | ) | | | (1.45 | ) | | | (1.36 | ) | | | (2.86 | ) |
Total distributions declared to shareholders | | | $(2.25 | ) | | | $(1.91 | ) | | | $(1.57 | ) | | | $(1.52 | ) | | | $(2.96 | ) |
Net asset value, end of period (x) | | | $11.66 | | | | $11.25 | | | | $13.47 | | | | $13.23 | | | | $12.29 | |
Total return (%) (k)(r)(s)(x) | | | 26.78 | | | | (5.11 | ) | | | 14.97 | | | | 20.90 | (c) | | | (4.15 | ) |
| | | | | |
Ratios (%) (to average net assets)
and Supplemental data: | | | | | | | | | | | | | | | | | | | | |
Expenses before expense reductions (f) | | | 0.54 | | | | 0.54 | | | | 0.53 | | | | 0.42 | (c) | | | 0.54 | |
Expenses after expense reductions (f) | | | 0.53 | | | | 0.53 | | | | 0.52 | | | | 0.41 | (c) | | | 0.53 | |
Net investment income (loss) | | | 0.81 | | | | 0.69 | | | | 0.82 | | | | 0.92 | (c) | | | 1.03 | |
Portfolio turnover | | | 59 | | | | 72 | | | | 81 | | | | 72 | | | | 78 | |
Net assets at end of period (000 omitted) | | | $35,441 | | | | $29,936 | | | | $36,195 | | | | $28,715 | | | | $27,795 | |
| |
| Service Class | | Year ended | |
| | | | | |
| | | 12/31/19 | | | 12/31/18 | | | 12/31/17 | | | 12/31/16 | | | 12/31/15 | |
| | | | | |
Net asset value, beginning of period | | | $10.92 | | | | $13.12 | | | | $12.92 | | | | $12.03 | | | | $15.75 | |
| | | | | |
| Income (loss) from investment operations | | | | | | | | | | | | | | | | | | | | |
Net investment income (loss) (d) | | | $0.07 | | | | $0.06 | | | | $0.07 | | | | $0.08 | (c) | | | $0.12 | |
Net realized and unrealized gain (loss) | | | 2.46 | | | | (0.39 | ) | | | 1.67 | | | | 2.29 | | | | (0.93 | ) |
Total from investment operations | | | $2.53 | | | | $(0.33 | ) | | | $1.74 | | | | $2.37 | | | | $(0.81 | ) |
| | | | | |
| Less distributions declared to shareholders | | | | | | | | | | | | | | | | | | | | |
From net investment income | | | $(0.06 | ) | | | $(0.09 | ) | | | $(0.09 | ) | | | $(0.12 | ) | | | $(0.05 | ) |
From net realized gain | | | (2.15 | ) | | | (1.78 | ) | | | (1.45 | ) | | | (1.36 | ) | | | (2.86 | ) |
Total distributions declared to shareholders | | | $(2.21 | ) | | | $(1.87 | ) | | | $(1.54 | ) | | | $(1.48 | ) | | | $(2.91 | ) |
Net asset value, end of period (x) | | | $11.24 | | | | $10.92 | | | | $13.12 | | | | $12.92 | | | | $12.03 | |
Total return (%) (k)(r)(s)(x) | | | 26.36 | | | | (5.35 | ) | | | 14.70 | | | | 20.58 | (c) | | | (4.38 | ) |
| | | | | |
Ratios (%) (to average net assets)
and Supplemental data: | | | | | | | | | | | | | | | | | | | | |
Expenses before expense reductions (f) | | | 0.79 | | | | 0.79 | | | | 0.78 | | | | 0.67 | (c) | | | 0.79 | |
Expenses after expense reductions (f) | | | 0.78 | | | | 0.78 | | | | 0.77 | | | | 0.66 | (c) | | | 0.78 | |
Net investment income (loss) | | | 0.56 | | | | 0.43 | | | | 0.55 | | | | 0.66 | (c) | | | 0.79 | |
Portfolio turnover | | | 59 | | | | 72 | | | | 81 | | | | 72 | | | | 78 | |
Net assets at end of period (000 omitted) | | | $61,099 | | | | $55,648 | | | | $71,366 | | | | $74,453 | | | | $82,794 | |
See Notes to Financial Statements
14
MFS Blended Research Small Cap Equity Portfolio
Financial Highlights – continued
| (c) | Amount reflects aone-time reimbursement of expenses by the custodian (or former custodian) without which net investment income and performance would be lower and expenses would be higher. |
| (d) | Per share data is based on average shares outstanding. |
| (f) | Ratios do not reflect reductions from fees paid indirectly, if applicable. |
| (k) | The total return does not reflect expenses that apply to separate accounts. Inclusion of these charges would reduce the total return figures for all periods shown. |
| (r) | Certain expenses have been reduced without which performance would have been lower. |
| (s) | From time to time the fund may receive proceeds from litigation settlements, without which performance would be lower. |
| (x) | The net asset values and total returns have been calculated on net assets which include adjustments made in accordance with U.S. generally accepted accounting principles required at period end for financial reporting purposes. |
See Notes to Financial Statements
15
MFS Blended Research Small Cap Equity Portfolio
NOTES TO FINANCIAL STATEMENTS
| (1) | | Business and Organization |
MFS Blended Research Small Cap Equity Portfolio (the fund) is a diversified series of MFS Variable Insurance Trust III (the trust). The trust is organized as a Delaware statutory trust and is registered under the Investment Company Act of 1940, as amended, as anopen-end management investment company. The shareholders of each series of the trust are separate accounts of insurance companies, which offer variable annuity and/or life insurance products, and qualified retirement and pension plans.
The fund is an investment company and accordingly follows the investment company accounting and reporting guidance of the Financial Accounting Standards Board (FASB) Accounting Standards Codification Topic 946 Financial Services – Investment Companies.
| (2) | | Significant Accounting Policies |
General– The preparation of financial statements in conformity with U.S. generally accepted accounting principles requires management to make estimates and assumptions that affect the reported amounts of assets and liabilities, and disclosure of contingent assets and liabilities at the date of the financial statements and the reported amounts of increases and decreases in net assets from operations during the reporting period. Actual results could differ from those estimates. In the preparation of these financial statements, management has evaluated subsequent events occurring after the date of the fund’s Statement of Assets and Liabilities through the date that the financial statements were issued. The fund will generally focus on securities of small size companies which may be more volatile than those of larger companies.
Balance Sheet Offsetting– The fund’s accounting policy with respect to balance sheet offsetting is that, absent an event of default by the counterparty or a termination of the agreement, the International Swaps and Derivatives Association (ISDA) Master Agreement, or similar agreement, does not result in an offset of reported amounts of financial assets and financial liabilities in the Statement of Assets and Liabilities across transactions between the fund and the applicable counterparty. The fund’s right to setoff may be restricted or prohibited by the bankruptcy or insolvency laws of the particular jurisdiction to which a specific master netting agreement counterparty is subject. Balance sheet offsetting disclosures, to the extent applicable to the fund, have been included in the fund’s Significant Accounting Policies note under the captions for each of the fund’sin-scope financial instruments and transactions.
Investment Valuations– Equity securities, including restricted equity securities, are generally valued at the last sale or official closing price on their primary market or exchange as provided by a third-party pricing service. Equity securities, for which there were no sales reported that day, are generally valued at the last quoted daily bid quotation on their primary market or exchange as provided by a third-party pricing service. Short-term instruments with a maturity at issuance of 60 days or less may be valued at amortized cost, which approximates market value.Open-end investment companies are generally valued at net asset value per share. Securities and other assets generally valued on the basis of information from a third-party pricing service may also be valued at a broker/dealer bid quotation. In determining values, third-party pricing services can utilize both transaction data and market information such as yield, quality, coupon rate, maturity, type of issue, trading characteristics, and other market data. The values of foreign securities and other assets and liabilities expressed in foreign currencies are converted to U.S. dollars using the mean of bid and asked prices for rates provided by a third-party pricing service.
The Board of Trustees has delegated primary responsibility for determining or causing to be determined the value of the fund’s investments (including any fair valuation) to the adviser pursuant to valuation policies and procedures approved by the Board. If the adviser determines that reliable market quotations are not readily available, investments are valued at fair value as determined in good faith by the adviser in accordance with such procedures under the oversight of the Board of Trustees. Under the fund’s valuation policies and procedures, market quotations are not considered to be readily available for most types of debt instruments and floating rate loans and many types of derivatives. These investments are generally valued at fair value based on information from third-party pricing services. In addition, investments may be valued at fair value if the adviser determines that an investment’s value has been materially affected by events occurring after the close of the exchange or market on which the investment is principally traded (such as foreign exchange or market) and prior to the determination of the fund’s net asset value, or after the halt of trading of a specific security where trading does not resume prior to the close of the exchange or market on which the security is principally traded. Events that occur after foreign markets close (such as developments in foreign markets and significant movements in the U.S. markets) and prior to the determination of the fund’s net asset value may be deemed to have a material effect on the value of securities traded in foreign markets. Accordingly, the fund’s foreign equity securities may often be valued at fair value. The adviser generally relies on third-party pricing services or other information (such as the correlation with price movements of similar securities in the same or other markets; the type, cost and investment characteristics of the security; the business and financial condition of the issuer; and trading and other market data) to assist in determining whether to fair value and at what value to fair value an investment. The value of an investment for purposes of calculating the fund’s net asset value can differ depending on the source and method used to determine value. When fair valuation is used, the value of an investment used to determine the fund’s net asset value may differ from quoted or published prices for the same investment. There can be no assurance that the fund could obtain the fair value assigned to an investment if it were to sell the investment at the same time at which the fund determines its net asset value per share.
16
MFS Blended Research Small Cap Equity Portfolio
Notes to Financial Statements – continued
Various inputs are used in determining the value of the fund’s assets or liabilities. These inputs are categorized into three broad levels. In certain cases, the inputs used to measure fair value may fall into different levels of the fair value hierarchy. In such cases, an investment’s level within the fair value hierarchy is based on the lowest level of input that is significant to the fair value measurement. The fund’s assessment of the significance of a particular input to the fair value measurement in its entirety requires judgment, and considers factors specific to the investment. Level 1 includes unadjusted quoted prices in active markets for identical assets or liabilities. Level 2 includes other significant observable market-based inputs (including quoted prices for similar securities, interest rates, prepayment speed, and credit risk). Level 3 includes unobservable inputs, which may include the adviser’s own assumptions in determining the fair value of investments. The following is a summary of the levels used as of December 31, 2019 in valuing the fund’s assets or liabilities:
| | | | | | | | | | | | | | | | |
| Financial Instruments | | Level 1 | | | Level 2 | | | Level 3 | | | Total | |
| Equity Securities | | | $95,814,981 | | | | $— | | | | $— | | | | $95,814,981 | |
| Mutual Funds | | | 854,125 | | | | — | | | | — | | | | 854,125 | |
| Total | | | $96,669,106 | | | | $— | | | | $— | | | | $96,669,106 | |
For further information regarding security characteristics, see the Portfolio of Investments. The fund held one worthless level 3 security at the beginning of the period which was disposed of during the period for $0 and no realized gain or loss.
Security Loans– Under its Securities Lending Agency Agreement with the fund, State Street Bank and Trust Company, as lending agent, loans the securities of the fund to certain qualified institutions (the “Borrowers”) approved by the fund. Security loans can be terminated at the discretion of either the lending agent or the fund and the related securities must be returned within the earlier of the standard trade settlement period for such securities or within three business days. The loans are collateralized by cash and/or U.S. Treasury and federal agency obligations in an amount typically at least equal to the market value of the securities loaned. On loans collateralized by cash, the cash collateral is invested in a money market fund. The market value of the loaned securities is determined at the close of business of the fund and any additional required collateral is delivered to the fund on the next business day. The lending agent provides the fund with indemnification against Borrower default. In the event of Borrower default, the lending agent will, for the benefit of the fund, either purchase securities identical to those loaned or, when such purchase is commercially impracticable, pay the fund the market value of the loaned securities. In return, the lending agent assumes the fund’s rights to the related collateral. If the collateral value is less than the cost to purchase identical securities, the lending agent is responsible for the shortfall, but only to the extent that such shortfall is not due to a decline in collateral value resulting from collateral reinvestment for which the fund bears the risk of loss. At period end, the fund had investment securities on loan, all of which were classified as equity securities in the fund’s Portfolio of Investments, with a fair value of $164,318. The fair value of the fund’s investment securities on loan and a related liability of $96,250 for cash collateral received on securities loaned are both presented gross in the Statement of Assets and Liabilities. Additionally, these loans were collateralized by U.S. Treasury Obligations of $75,959 held by the lending agent. The collateral on securities loaned exceeded the value of securities on loan at period end. The liability for cash collateral for securities loaned is carried at fair value, which is categorized as level 2 within the fair value hierarchy. A portion of the income generated upon investment of the collateral is remitted to the Borrowers, and the remainder is allocated between the fund and the lending agent. On loans collateralized by U.S. Treasury and/or federal agency obligations, a fee is received from the Borrower, and is allocated between the fund and the lending agent. Income from securities lending is separately reported in the Statement of Operations. The dividend and interest income earned on the securities loaned is accounted for in the same manner as other dividend and interest income.
Indemnifications– Under the fund’s organizational documents, its officers and Trustees may be indemnified against certain liabilities and expenses arising out of the performance of their duties to the fund. Additionally, in the normal course of business, the fund enters into agreements with service providers that may contain indemnification clauses. The fund’s maximum exposure under these agreements is unknown as this would involve future claims that may be made against the fund that have not yet occurred.
Investment Transactions and Income– Investment transactions are recorded on the trade date. Interest income is recorded on the accrual basis. Dividends received in cash are recorded on theex-dividend date. Certain dividends from foreign securities will be recorded when the fund is informed of the dividend if such information is obtained subsequent to theex-dividend date. Dividend payments received in additional securities are recorded on theex-dividend date in an amount equal to the value of the security on such date.
The fund may receive proceeds from litigation settlements. Any proceeds received from litigation involving portfolio holdings are reflected in the Statement of Operations in realized gain/loss if the security has been disposed of by the fund or in unrealized gain/loss if the security is still held by the fund. Any other proceeds from litigation not related to portfolio holdings are reflected as other income in the Statement of Operations.
Tax Matters and Distributions– The fund intends to qualify as a regulated investment company, as defined under Subchapter M of the Internal Revenue Code, and to distribute all of its taxable income, including realized capital gains. As a result, no provision for federal income tax is required. The fund’s federal tax returns, when filed, will remain subject to examination by the Internal Revenue Service for a three year period. Management has analyzed the fund’s tax positions taken on federal and state tax returns for all open
17
MFS Blended Research Small Cap Equity Portfolio
Notes to Financial Statements – continued
tax years and does not believe that there are any uncertain tax positions that require recognition of a tax liability. Foreign taxes, if any, have been accrued by the fund in the accompanying financial statements in accordance with the applicable foreign tax law. Foreign income taxes may be withheld by certain countries in which the fund invests. Additionally, capital gains realized by the fund on securities issued in or by certain foreign countries may be subject to capital gains tax imposed by those countries.
Distributions to shareholders are recorded on theex-dividend date. Income and capital gain distributions are determined in accordance with income tax regulations, which may differ from U.S. generally accepted accounting principles. Certain capital accounts in the financial statements are periodically adjusted for permanent differences in order to reflect their tax character. These adjustments have no impact on net assets or net asset value per share. Temporary differences which arise from recognizing certain items of income, expense, gain or loss in different periods for financial statement and tax purposes will reverse at some time in the future.
Book/tax differences primarily relate to wash sale loss deferrals.
The tax character of distributions declared to shareholders for the last two fiscal years is as follows:
| | | | | | | | |
| | | Year ended
12/31/19 | | | Year ended
12/31/18 | |
| Ordinary income (including any short-term capital gains) | | | $4,407,046 | | | | $2,614,042 | |
| Long-term capital gains | | | 11,592,097 | | | | 10,271,019 | |
| Total distributions | | | $15,999,143 | | | | $12,885,061 | |
The federal tax cost and the tax basis components of distributable earnings were as follows:
| | | | |
| As of 12/31/19 | | | | |
| |
| Cost of investments | | | $82,529,700 | |
| Gross appreciation | | | 18,350,955 | |
| Gross depreciation | | | (4,211,549 | ) |
| Net unrealized appreciation (depreciation) | | | $14,139,406 | |
| |
| Undistributed ordinary income | | | 1,856,313 | |
| Undistributed long-term capital gain | | | 5,657,472 | |
Multiple Classes of Shares of Beneficial Interest– The fund offers multiple classes of shares, which differ in their respective distribution and/or service fees. The fund’s income, realized and unrealized gain (loss), and common expenses are allocated to shareholders based on the daily net assets of each class. Dividends are declared separately for each class. Differences in per share dividend rates are generally due to differences in separate class expenses. The fund’s distributions declared to shareholders as reported in the Statements of Changes in Net Assets are presented by class as follows:
| | | | | | | | |
| | |
| | | Year ended
12/31/19 | | | Year ended
12/31/18 | |
| Initial Class | | | $5,626,679 | | | | $4,510,678 | |
| Service Class | | | 10,372,464 | | | | 8,374,383 | |
| Total | | | $15,999,143 | | | | $12,885,061 | |
| (3) | | Transactions with Affiliates |
Investment Adviser– The fund has an investment advisory agreement with MFS to provide overall investment management and related administrative services and facilities to the fund. The management fee is computed daily and paid monthly at an annual rate of 0.40% of the fund’s average daily net assets. MFS has agreed in writing to reduce its management fee by a specified amount if certain MFS mutual fund assets exceed thresholds agreed to by MFS and the fund’s Board of Trustees. For the year ended December 31, 2019, this management fee reduction amounted to $9,119, which is included in the reduction of total expenses in the Statement of Operations. The management fee incurred for the year ended December 31, 2019 was equivalent to an annual effective rate of 0.39% of the fund’s average daily net assets.
The investment adviser has agreed in writing to pay a portion of the fund’s total annual operating expenses, excluding interest, taxes, extraordinary expenses, brokerage and transaction costs, and investment-related expenses, such that total annual operating expenses do not exceed 0.60% of average daily net assets for the Initial Class shares and 0.85% of average daily net assets for the Service Class shares. This written agreement will continue until modified by the fund’s Board of Trustees, but such agreement will continue at least until April 30, 2021. For the year ended December 31, 2019, the fund’s actual operating expenses did not exceed the limit and therefore, the investment adviser did not pay any portion of the fund’s expenses related to this agreement.
Distributor– MFS Fund Distributors, Inc. (MFD), a wholly-owned subsidiary of MFS, is the distributor of shares of the fund. The Trustees have adopted a distribution plan for the Service Class shares pursuant to Rule12b-1 under the Investment Company Act of 1940.
18
MFS Blended Research Small Cap Equity Portfolio
Notes to Financial Statements – continued
The fund’s distribution plan provides that the fund will pay MFD distribution and/or service fees equal to 0.25% per annum of its average daily net assets attributable to Service Class shares as partial consideration for services performed and expenses incurred by MFD and financial intermediaries (including participating insurance companies that invest in the fund to fund variable annuity and variable life insurance contracts, sponsors of qualified retirement and pension plans that invest in the fund, and affiliates of these participating insurance companies and plan sponsors) in connection with the sale and distribution of the Service Class shares. MFD may subsequently pay all, or a portion, of the distribution and/or service fees to financial intermediaries.
Shareholder Servicing Agent– MFS Service Center, Inc. (MFSC), a wholly-owned subsidiary of MFS, receives a fee from the fund for its services as shareholder servicing agent. For the year ended December 31, 2019, the fee was $4,618, which equated to 0.0049% annually of the fund’s average daily net assets. MFSC also receives payment from the fund forout-of-pocket expenses paid by MFSC on behalf of the fund. For the year ended December 31, 2019, these costs amounted to $482.
Administrator– MFS provides certain financial, legal, shareholder communications, compliance, and other administrative services to the fund. Under an administrative services agreement, the fund reimburses MFS the costs incurred to provide these services. The fund is charged an annual fixed amount of $17,500 plus a fee based on average daily net assets. The administrative services fee incurred for the year ended December 31, 2019 was equivalent to an annual effective rate of 0.0250% of the fund’s average daily net assets.
Trustees’ and Officers’ Compensation– The fund pays compensation to independent Trustees in the form of a retainer, attendance fees, and additional compensation to Board and Committee chairpersons. The fund does not pay compensation directly to Trustees or officers of the fund who are also officers of the investment adviser, all of whom receive remuneration from MFS for their services to the fund. Certain officers and Trustees of the fund are officers or directors of MFS, MFD, and MFSC.
Other– This fund and certain other funds managed by MFS (the funds) had entered into a service agreement (the ISO Agreement) which provided for payment of fees solely by the funds to Tarantino LLC in return for the provision of services of an Independent Senior Officer (ISO) for the funds. Frank L. Tarantino served as the ISO and was an officer of the funds and the sole member of Tarantino LLC. Effective June 30, 2019, Mr. Tarantino retired from his position as ISO for the funds, and the ISO Agreement was terminated. For the year ended December 31, 2019, the fee paid by the fund under this agreement was $110 and is included in “Miscellaneous” expense in the Statement of Operations. MFS had agreed to bear all expenses associated with office space, other administrative support, and supplies provided to the ISO.
The fund invests in the MFS Institutional Money Market Portfolio which is managed by MFS and seeks current income consistent with preservation of capital and liquidity. This money market fund does not pay a management fee to MFS.
The fund is permitted to engage in purchase and sale transactions with funds and accounts for which MFS serves as investment adviser orsub-adviser (“cross-trades”) pursuant to a policy adopted by the Board of Trustees. This policy has been designed to ensure that cross-trades conducted by the fund comply with Rule17a-7 under the Investment Company Act of 1940. During the year ended December 31, 2019, the fund engaged in purchase transactions pursuant to this policy, which amounted to $1,273,878.
The adviser has voluntarily undertaken to reimburse the fund from its own resources on a quarterly basis for the cost of investment research embedded in the cost of the fund’s securities trades. This agreement may be rescinded at any time. For the year ended December 31, 2019, this reimbursement amounted to $14,851, which is included in “Other” income in the Statement of Operations.
For the year ended December 31, 2019, purchases and sales of investments, other than short-term obligations, aggregated $54,550,467 and $64,370,715, respectively.
19
MFS Blended Research Small Cap Equity Portfolio
Notes to Financial Statements – continued
| (5) | | Shares of Beneficial Interest |
The fund’s Declaration of Trust permits the Trustees to issue an unlimited number of full and fractional shares of beneficial interest. Transactions in fund shares were as follows:
| | | | | | | | | | | | | | | | |
| | | Year ended 12/31/19 | | | Year ended 12/31/18 | |
| | | | |
| | | Shares | | | Amount | | | Shares | | | Amount | |
| Shares sold | | | | | | | | | | | | | | | | |
Initial Class | | | 340,890 | | | | $4,063,323 | | | | 261,230 | | | | $3,403,663 | |
Service Class | | | 563,636 | | | | 6,702,429 | | | | 558,043 | | | | 6,746,807 | |
| | | 904,526 | | | | $10,765,752 | | | | 819,273 | | | | $10,150,470 | |
| | | | |
| Shares issued to shareholders in reinvestment of distributions | | | | | | | | | | | | | | | | |
Initial Class | | | 558,757 | | | | $5,626,679 | | | | 321,961 | | | | $4,510,678 | |
Service Class | | | 1,067,126 | | | | 10,372,463 | | | | 615,311 | | | | 8,374,383 | |
| | | 1,625,883 | | | | $15,999,142 | | | | 937,272 | | | | $12,885,061 | |
| | | | |
| Shares reacquired | | | | | | | | | | | | | | | | |
Initial Class | | | (520,733 | ) | | | $(6,389,300 | ) | | | (608,313 | ) | | | $(8,423,623 | ) |
Service Class | | | (1,294,674 | ) | | | (15,366,791 | ) | | | (1,515,630 | ) | | | (20,736,061 | ) |
| | | (1,815,407 | ) | | | $(21,756,091 | ) | | | (2,123,943 | ) | | | $(29,159,684 | ) |
| | | | |
| Net change | | | | | | | | | | | | | | | | |
Initial Class | | | 378,914 | | | | $3,300,702 | | | | (25,122 | ) | | | $(509,282 | ) |
Service Class | | | 336,088 | | | | 1,708,101 | | | | (342,276 | ) | | | (5,614,871 | ) |
| | | 715,002 | | | | $5,008,803 | | | | (367,398 | ) | | | $(6,124,153 | ) |
The fund and certain other funds managed by MFS participate in a $1.25 billion unsecured committed line of credit, subject to a $1 billion sublimit, provided by a syndicate of banks under a credit agreement. Borrowings may be made for temporary financing needs. Interest is charged to each fund, based on its borrowings, generally at a rate equal to the highest of one month LIBOR, the Federal Funds Effective Rate and the Overnight Bank Funding Rate, plus an agreed upon spread. A commitment fee, based on the average daily, unused portion of the committed line of credit, is allocated among the participating funds. In addition, the fund and other funds managed by MFS have established unsecured uncommitted borrowing arrangements with certain banks for temporary financing needs. Interest is charged to each fund, based on its borrowings, at rates equal to customary reference rates plus an agreed upon spread. For the year ended December 31, 2019, the fund’s commitment fee and interest expense were $508 and $0, respectively, and are included in “Miscellaneous” expense in the Statement of Operations.
| (7) | | Investments in Affiliated Issuers |
An affiliated issuer may be considered one in which the fund owns 5% or more of the outstanding voting securities, or a company which is under common control. For the purposes of this report, the following were affiliated issuers:
| | | | | | | | | | | | | | | | | | | | | | | | |
| Affiliated Issuers | | Beginning
Value | | | Purchases | | | Sales
Proceeds | | | Realized
Gain
(Loss) | | | Change in
Unrealized
Appreciation or
Depreciation | | | Ending
Value | |
| MFS Institutional Money Market Portfolio | | | $1,018,574 | | | | $19,459,105 | | | �� | $19,720,099 | | | | $295 | | | | $— | | | | $757,875 | |
| | | | | | |
| Affiliated Issuers | | | | | | | | | | | | | | Dividend
Income | | | Capital Gain
Distributions | |
| MFS Institutional Money Market Portfolio | | | | | | | | | | | | | | | | | | | $18,901 | | | | $— | |
20
MFS Blended Research Small Cap Equity Portfolio
REPORT OF INDEPENDENT REGISTERED PUBLIC ACCOUNTING FIRM
To the Board of Trustees of MFS Variable Insurance Trust III and the Shareholders of MFS Blended Research Small Cap Equity Portfolio:
Opinion on the Financial Statements and Financial Highlights
We have audited the accompanying statement of assets and liabilities of MFS Blended Research Small Cap Equity Portfolio (the “Fund”), including the portfolio of investments, as of December 31, 2019, the related statement of operations for the year then ended, the statements of changes in net assets for each of the two years in the period then ended, the financial highlights for each of the five years in the period then ended, and the related notes. In our opinion, the financial statements and financial highlights present fairly, in all material respects, the financial position of the Fund as of December 31, 2019, and the results of its operations for the year then ended, the changes in its net assets for each of the two years in the period then ended, and the financial highlights for each of the five years in the period then ended, in conformity with accounting principles generally accepted in the United States of America.
Basis for Opinion
These financial statements and financial highlights are the responsibility of the Fund’s management. Our responsibility is to express an opinion on the Fund’s financial statements and financial highlights based on our audits. We are a public accounting firm registered with the Public Company Accounting Oversight Board (United States) (PCAOB) and are required to be independent with respect to the Fund in accordance with the U.S. federal securities laws and the applicable rules and regulations of the Securities and Exchange Commission and the PCAOB.
We conducted our audits in accordance with the standards of the PCAOB. Those standards require that we plan and perform the audit to obtain reasonable assurance about whether the financial statements and financial highlights are free of material misstatement, whether due to error or fraud. The Fund is not required to have, nor were we engaged to perform, an audit of its internal control over financial reporting. As part of our audits we are required to obtain an understanding of internal control over financial reporting but not for the purpose of expressing an opinion on the effectiveness of the Fund’s internal control over financial reporting. Accordingly, we express no such opinion.
Our audits included performing procedures to assess the risks of material misstatement of the financial statements and financial highlights, whether due to error or fraud, and performing procedures that respond to those risks. Such procedures included examining, on a test basis, evidence regarding the amounts and disclosures in the financial statements and financial highlights. Our audits also included evaluating the accounting principles used and significant estimates made by management, as well as evaluating the overall presentation of the financial statements and financial highlights. Our procedures included confirmation of securities owned as of December 31, 2019, by correspondence with the custodian and brokers. We believe that our audits provide a reasonable basis for our opinion.
DELOITTE & TOUCHE LLP
Boston, Massachusetts
February 14, 2020
We have served as the auditor of one or more of the MFS investment companies since 1924.
21
MFS Blended Research Small Cap Equity Portfolio
TRUSTEES AND OFFICERS – IDENTIFICATION AND BACKGROUND
The Trustees and Officers of the Trust, as of February 1, 2020, are listed below, together with their principal occupations during the past five years. (Their titles may have varied during that period.) The address of each Trustee and Officer is 111 Huntington Avenue, Boston, Massachusetts 02199-7618.
| | | | | | | | | | |
Name, Age | | Position(s)
Held with Fund | | Trustee/Officer
Since (h) | | Number of MFS Funds
overseen by the
Trustee | | Principal Occupations
During the Past Five Years | | Other Directorships During the Past Five Years (j) |
| INTERESTED TRUSTEES |
Robert J. Manning (k)
(age 56) | | Trustee | | February 2004 | | 133 | | Massachusetts Financial Services Company, Executive Chairman (since January 2017); Director; Chairman of the Board; Chief Executive Officer (until 2015);Co-Chief Executive Officer(2015-2016) | | N/A |
| | | | | |
Robin A. Stelmach (k) (age 58) | | Trustee | | January 2014 | | 133 | | Massachusetts Financial Services Company, Vice Chair (since January 2017); Chief Operating Officer and Executive Vice President (until January 2017) | | N/A |
|
| INDEPENDENT TRUSTEES |
John P. Kavanaugh (age 65) | | Trustee and Chair of Trustees | | January 2009 | | 133 | | Private investor | | N/A |
| | | | | |
Steven E. Buller (age 68) | | Trustee | | February 2014 | | 133 | | Financial Accounting Standards Advisory Council, Chairman(2014-2015); Public Company Accounting Oversight Board, Standing Advisory Group, Member (until 2014); BlackRock, Inc. (investment management), Managing Director (until 2014), BlackRock Finco UK (investment management), Director (until 2014) | | N/A |
| | | | | |
John A. Caroselli (age 65) | | Trustee | | March 2017 | | 133 | | JC Global Advisors, LLC (management consulting), President (since 2015); First Capital Corporation (commercial finance), Executive Vice President (until 2015) | | N/A |
| | | | | |
Maureen R. Goldfarb (age 64) | | Trustee | | January 2009 | | 133 | | Private investor | | N/A |
| | | | | |
Peter D. Jones
(age 64) | | Trustee | | January 2019 | | 133 | | Franklin Templeton Distributors, Inc. (investment management), President (until 2015); Franklin Templeton Institutional, LLC (investment management), Chairman (until 2015) | | N/A |
| | | | | |
James W. Kilman, Jr.
(age 58) | | Trustee | | January 2019 | | 133 | | Burford Capital Limited (finance and investment management), Chief Financial Officer (since 2019); KielStrand Capital LLC (family office), Chief Executive Officer (since 2016); Morgan Stanley & Co. (financial services), Vice Chairman of Investment Banking,Co-Head of Diversified Financials Coverage – Financial Institutions Investment Banking Group (until 2016) | | Alpha-En Corporation, Director (2016-2019) |
22
MFS Blended Research Small Cap Equity Portfolio
Trustees and Officers – continued
| | | | | | | | | | |
Name, Age | | Position(s)
Held with Fund | | Trustee/Officer
Since (h) | | Number of MFS Funds
overseen by the
Trustee | | Principal Occupations
During the Past Five Years | | Other Directorships During the Past Five Years (j) |
Clarence Otis, Jr. (age 63) | | Trustee | | March 2017 | | 133 | | Darden Restaurants, Inc., Chief Executive Officer (until 2014) | | VF Corporation, Director; Verizon Communications, Inc., Director; The Travelers Companies, Director; Federal Reserve Bank of Atlanta, Director (until 2015) |
| | | | | |
Maryanne L. Roepke (age 63) | | Trustee | | May 2014 | | 133 | | American Century Investments (investment management), Senior Vice President and Chief Compliance Officer (until 2014) | | N/A |
| | | | | |
Laurie J. Thomsen
(age 62) | | Trustee | | March 2005 | | 133 | | Private investor | | The Travelers Companies, Director; Dycom Industries, Inc., Director (since 2015) |
| | | | | | | | |
Name, Age | | Position(s)
Held with Fund | | Trustee/Officer
Since (h) | | Number of
MFS Funds
for which the
Person is an
Officer | | Principal Occupations During the Past Five Years |
| OFFICERS | | | | | | |
Christopher R. Bohane (k)
(age 46) | | Assistant Secretary and Assistant Clerk | | July 2005 | | 133 | | Massachusetts Financial Services Company, Vice President and Assistant General Counsel |
| | | | |
Kino Clark (k) (age 51) | | Assistant Treasurer | | January 2012 | | 133 | | Massachusetts Financial Services Company, Vice President |
| | | | |
John W. Clark, Jr. (k) (age 52) | | Assistant Treasurer | | April 2017 | | 133 | | Massachusetts Financial Services Company, Vice President (since March 2017); Deutsche Bank (financial services), Department Head –Treasurer’s Office (until February 2017) |
| | | | |
Thomas H. Connors (k) (age 60) | | Assistant Secretary and Assistant Clerk | | September 2012 | | 133 | | Massachusetts Financial Services Company, Vice President and Senior Counsel |
| | | | |
David L. DiLorenzo (k)
(age 51) | | President | | July 2005 | | 133 | | Massachusetts Financial Services Company, Senior Vice President |
| | | | |
Heidi W. Hardin (k) (age 52) | | Secretary and Clerk | | April 2017 | | 133 | | Massachusetts Financial Services Company, Executive Vice President and General Counsel (since March 2017); Harris Associates (investment management), General Counsel (from September 2015 to January 2017); Janus Capital Management LLC (investment management), Senior Vice President and General Counsel (until September 2015) |
| | | | |
Brian E. Langenfeld (k) (age 46) | | Assistant
Secretary and Assistant Clerk | | June 2006 | | 133 | | Massachusetts Financial Services Company, Vice President and Senior Counsel |
| | | | |
Amanda S. Mooradian (k) (age 40) | | Assistant
Secretary and Assistant Clerk | | September 2018 | | 133 | | Massachusetts Financial Services Company, Assistant Vice President and Counsel |
| | | | |
Susan A. Pereira (k)
(age 49) | | Assistant
Secretary and Assistant Clerk | | July 2005 | | 133 | | Massachusetts Financial Services Company, Vice President and Assistant General Counsel |
| | | | |
Kasey L. Phillips (k) (age 49) | | Assistant Treasurer | | September 2012 | | 133 | | Massachusetts Financial Services Company, Vice President |
| | | | |
Matthew A. Stowe (k) (age 45) | | Assistant Secretary and Assistant Clerk | | October 2014 | | 133 | | Massachusetts Financial Services Company, Vice President and Assistant General Counsel |
23
MFS Blended Research Small Cap Equity Portfolio
Trustees and Officers – continued
| | | | | | | | |
Name, Age | | Position(s)
Held with Fund | | Trustee/Officer
Since (h) | | Number of
MFS Funds
for which the
Person is an
Officer | | Principal Occupations During the Past Five Years |
Martin J. Wolin (k) (age 52) | | Chief Compliance Officer | | July 2015 | | 133 | | Massachusetts Financial Services Company, Senior Vice President and Chief Compliance Officer (since July 2015); Mercer (financial service provider), Chief Risk and Compliance Officer, North America and Latin America (until June 2015) |
| | | | |
James O. Yost (k)
(age 59) | | Treasurer | | September 1990 | | 133 | | Massachusetts Financial Services Company, Senior Vice President |
| (h) | Date first appointed to serve as Trustee/officer of an MFS Fund. Each Trustee has served continuously since appointment unless indicated otherwise. For the period from December 15, 2004 until February 22, 2005, Mr. Manning served as Advisory Trustee. From January 2012 through December 2016, Messrs. DiLorenzo and Yost served as Treasurer and Deputy Treasurer of the Funds, respectively. |
| (j) | Directorships or trusteeships of companies required to report to the Securities and Exchange Commission (i.e., “public companies”). |
| (k) | “Interested person” of the Trust within the meaning of the Investment Company Act of 1940 (referred to as the 1940 Act), which is the principal federal law governing investment companies like the fund, as a result of a position with MFS. The address of MFS is 111 Huntington Avenue, Boston, Massachusetts 02199-7618. |
Each Trustee (other than Messrs. Jones and Kilman) has been elected by shareholders and each Trustee and Officer holds office until his or her successor is chosen and qualified or until his or her earlier death, resignation, retirement or removal. Messrs. Jones and Kilman became Trustees of the Funds on January 1, 2019. The Trust does not hold annual meetings for the purpose of electing Trustees, and Trustees are not elected for fixed terms. Under the terms of the Board’s retirement policy, an Independent Trustee shall retire at the end of the calendar year in which he or she reaches the earlier of 75 years of age or 15 years of service on the Board (or, in the case of any Independent Trustee who joined the Board prior to 2015, 20 years of service on the Board).
Messrs. Buller, Kilman and Otis and Ms. Roepke are members of the Trust’s Audit Committee.
Each of the Interested Trustees and certain Officers hold comparable officer positions with certain affiliates of MFS.
The Statement of Additional Information for a Fund includes further information about the Trustees and is available without charge upon request by calling1-800-225-2606.
| | |
Investment Adviser Massachusetts Financial Services Company 111 Huntington Avenue Boston, MA 02199-7618 | | Custodian State Street Bank and Trust Company 1 Lincoln Street Boston, MA 02111-2900 |
| |
Distributor MFS Fund Distributors, Inc. 111 Huntington Avenue Boston, MA 02199-7618 | | Independent Registered Public Accounting Firm Deloitte & Touche LLP 200 Berkeley Street Boston, MA 02116 |
| |
Portfolio Manager(s) Jim Fallon Matt Krummell Jonathan Sage Jed Stocks | | |
24
MFS Blended Research Small Cap Equity Portfolio
BOARD REVIEW OF INVESTMENT ADVISORY AGREEMENT
MFS Blended Research Small Cap Equity Portfolio
The Investment Company Act of 1940 requires that both the full Board of Trustees and a majority of thenon-interested (“independent”) Trustees, voting separately, annually approve the continuation of the Fund’s investment advisory agreement with MFS. The Trustees consider matters bearing on the Fund and its advisory arrangements at their meetings throughout the year, including a review of performance data at each regular meeting. In addition, the independent Trustees met several times over the course of three months beginning in May and ending in July, 2019 (“contract review meetings”) for the specific purpose of considering whether to approve the continuation of the investment advisory agreement for the Fund and the other investment companies that the Board oversees (the “MFS Funds”). The independent Trustees were assisted in their evaluation of the Fund’s investment advisory agreement by independent legal counsel, from whom they received separate legal advice and with whom they met separately from MFS during various contract review meetings. The independent Trustees were also assisted in this process by the MFS Funds’ Independent Senior Officer, a senior officer appointed by and reporting to the independent Trustees.
In connection with their deliberations regarding the continuation of the investment advisory agreement, the Trustees, including the independent Trustees, considered such information and factors as they believed, in light of the legal advice furnished to them and their own business judgment, to be relevant. The investment advisory agreement for the Fund was considered separately, although the Trustees also took into account the common interests of all MFS Funds in their review. As described below, the Trustees considered the nature, quality, and extent of the various investment advisory, administrative, and shareholder services performed by MFS under the existing investment advisory agreement and other arrangements with the Fund.
In connection with their contract review meetings, the Trustees received and relied upon materials that included, among other items: (i) information provided by Broadridge Financial Solutions, Inc. (“Broadridge”), an independent third party, on the investment performance of the Fund for various time periods ended December 31, 2018 and the investment performance of a group of funds with substantially similar investment classifications/objectives (the “Broadridge performance universe”), (ii) information provided by Broadridge on the Fund’s advisory fees and other expenses and the advisory fees and other expenses of comparable funds identified by Broadridge as well as all other funds in the same investment classification/category (the “Broadridge expense group and universe”), (iii) information provided by MFS on the advisory fees of portfolios of other clients of MFS, including institutional separate accounts and other clients, (iv) information as to whether and to what extent applicable expense waivers, reimbursements or fee “breakpoints” are observed for the Fund, (v) information regarding MFS’ financial results and financial condition, including MFS’ and certain of its affiliates’ estimated profitability from services performed for the Fund and the MFS Funds as a whole, and compared to MFS’ institutional business, (vi) MFS’ views regarding the outlook for the mutual fund industry and the strategic business plans of MFS, (vii) descriptions of various functions performed by MFS for the Funds, such as compliance monitoring and portfolio trading practices, and (viii) information regarding the overall organization of MFS, including information about MFS’ senior management and other personnel providing investment advisory, administrative and other services to the Fund and the other MFS Funds. The comparative performance, fee and expense information prepared and provided by Broadridge was not independently verified and the independent Trustees did not independently verify any information provided to them by MFS.
The Trustees’ conclusion as to the continuation of the investment advisory agreement was based on a comprehensive consideration of all information provided to the Trustees and not the result of any single factor. Some of the factors that figured particularly in the Trustees’ deliberations are described below, although individual Trustees may have evaluated the information presented differently from one another, giving different weights to various factors. It is also important to recognize that the fee arrangements for the Fund and other MFS Funds are the result of years of review and discussion between the independent Trustees and MFS, that certain aspects of such arrangements may receive greater scrutiny in some years than in others, and that the Trustees’ conclusions may be based, in part, on their consideration of these same arrangements during the course of the year and in prior years.
Based on information provided by Broadridge and MFS, the Trustees reviewed the Fund’s total return investment performance as well as the Broadridge performance universe over various time periods. The Trustees placed particular emphasis on the total return performance of the Fund’s Initial Class shares in comparison to the performance of funds in its Broadridge performance universe over the five-year period ended December 31, 2018, which the Trustees believed was a long enough period to reflect differing market conditions. The total return performance of the Fund’s Initial Class shares was in the 1st quintile relative to the other funds in the universe for this five-year period (the 1st quintile being the best performers and the 5th quintile being the worst performers). The total return performance of the Fund’s Initial Class shares was in the 1st quintile for each of theone- and three-year periods ended December 31, 2018 relative to the Broadridge performance universe. Because of the passage of time, these performance results may differ from the performance results for more recent periods, including those shown elsewhere in this report.
In the course of their deliberations, the Trustees took into account information provided by MFS in connection with the contract review meetings, as well as during investment review meetings conducted with portfolio management personnel during the course of the year regarding the Fund’s performance. After reviewing these and related factors, the Trustees concluded, within the context of their overall conclusions regarding the investment advisory agreement, that they were satisfied with MFS’ responses and efforts relating to investment performance.
25
MFS Blended Research Small Cap Equity Portfolio
Board Review of Investment Advisory Agreement – continued
In assessing the reasonableness of the Fund’s advisory fee, the Trustees considered, among other information, the Fund’s advisory fee and the total expense ratio of the Fund’s Initial Class shares as a percentage of average daily net assets and the advisory fee and total expense ratios of the Broadridge expense group based on information provided by Broadridge. The Trustees considered that MFS currently observes an expense limitation for the Fund, which may not be changed without the Trustees’ approval. The Trustees also considered that, according to the data provided by Broadridge (which takes into account any fee reductions or expense limitations that were in effect during the Fund’s last fiscal year), the Fund’s effective advisory fee rate and total expense ratio were each lower than the Broadridge expense group median.
The Trustees also considered the advisory fees charged by MFS to any institutional separate accounts advised by MFS (“separate accounts”) and unaffiliated investment companies for which MFS serves as subadviser (“subadvised funds”) that have comparable investment strategies to the Fund, if any. In comparing these fees, the Trustees considered information provided by MFS as to the generally broader scope of services provided by MFS to the Fund, as well as the more extensive regulatory burdens imposed on MFS in managing the Fund, in comparison to separate accounts and subadvised funds. The Trustees also considered the higher demands placed on MFS’ investment personnel and trading infrastructure as a result of the daily cashin-flows andout-flows of the Fund in comparison to separate accounts.
The Trustees also considered whether the Fund may benefit from any economies of scale in the management of the Fund in the event of growth in assets of the Fund and/or growth in assets of the MFS Funds as a whole. They noted that the Fund’s advisory fee rate schedule is not subject to any breakpoints. Taking into account the expense limitation noted above, the Trustees determined not to recommend any advisory fee breakpoints for the Fund at this time. The Trustees also noted that MFS has agreed in writing to waive a portion of the management fees of certain MFS Funds, including the Fund, if the total combined assets of certain funds within the MFS Funds’ complex increase above agreed upon thresholds (the “group fee waiver”), enabling the Fund’s shareholders to share in the benefits from any economies of scale at the complex level. The group fee waiver is reviewed and renewed annually between the Board and MFS. The Trustees concluded that the group fee waiver was sufficient to allow the Fund to benefit from economies of scale as its assets and overall complex assets grow.
The Trustees also considered information prepared by MFS relating to MFS’ costs and profits with respect to the Fund, the MFS Funds considered as a group, and other investment companies and accounts advised by MFS, as well as MFS’ methodologies used to determine and allocate its costs to the MFS Funds, the Fund and other accounts and products for purposes of estimating profitability.
After reviewing these and other factors described herein, the Trustees concluded, within the context of their overall conclusions regarding the investment advisory agreement, that the advisory fees charged to the Fund represent reasonable compensation in light of the services being provided by MFS to the Fund.
In addition, the Trustees considered MFS’ resources and related efforts to continue to retain, attract and motivate capable personnel to serve the Fund. The Trustees also considered current and developing conditions in the financial services industry, including the presence of large and well-capitalized companies which are spending, and appear to be prepared to continue to spend, substantial sums to engage personnel and to provide services to competing investment companies. In this regard, the Trustees also considered the financial resources of MFS and its ultimate parent, Sun Life Financial Inc. The Trustees also considered the advantages and possible disadvantages to the Fund of having an adviser that also serves other investment companies as well as other accounts.
The Trustees also considered the nature, quality, cost, and extent of administrative, transfer agency, and distribution services provided to the Fund by MFS and its affiliates under agreements and plans other than the investment advisory agreement, including any12b-1 fees the Fund pays to MFS Fund Distributors, Inc., an affiliate of MFS. The Trustees also considered the nature, extent and quality of certain other services MFS performs or arranges for on the Fund’s behalf, which may include securities lending programs, directed expense payment programs, class action recovery programs, and MFS’ interaction with third-party service providers, principally custodians andsub-custodians. The Trustees concluded that the variousnon-advisory services provided by MFS and its affiliates on behalf of the Fund were satisfactory.
The Trustees consideredso-called“fall-out benefits” to MFS such as reputational value derived from serving as investment manager to the MFS Funds. The Trustees also considered that, effective January 3, 2018, MFS had discontinued its historic practice of obtaining investment research from portfolio brokerage commissions paid by certain MFS Funds and would thereafter directly pay for or voluntarily reimburse a Fund, if applicable, for the costs of external research acquired through the use of the Fund’s portfolio brokerage commissions.
Based on their evaluation of factors that they deemed to be material, including those factors described above, the Board of Trustees, including the independent Trustees, concluded that the Fund’s investment advisory agreement with MFS should be continued for an additionalone-year period, commencing August 1, 2019.
26
MFS Blended Research Small Cap Equity Portfolio
PROXY VOTING POLICIES AND INFORMATION
MFS votes proxies on behalf of the fund pursuant to proxy voting policies and procedures that are available without charge, upon request, by calling 1-800-225-2606, by visitingmfs.com/proxyvoting, or by visiting the SEC’s Web site athttp://www.sec.gov.
Information regarding how the fund voted proxies relating to portfolio securities during the most recent twelve-month period ended June 30 is available by August 31 of each year without charge by visitingmfs.com/proxyvoting, or by visiting the SEC’s Web site athttp://www.sec.gov.
QUARTERLY PORTFOLIO DISCLOSURE
The fund files a complete schedule of portfolio holdings with the SEC for the first and third quarters of each fiscal year as an exhibit to its reports on Form N-PORT. The fund’s Form N-PORT reports are available on the SEC’s website athttp://www.sec.gov. A shareholder can obtain the portfolio holdings report for the first and third quarters of the fund’s fiscal year atmfs.com/vit3 by choosing the fund’s name and then selecting the “Resources” tab and clicking on “Prospectus and Reports”.
FURTHER INFORMATION
From time to time, MFS may post important information about the fund or the MFS funds on the MFS web site (mfs.com). This information is available athttps://www.mfs.com/en-us/what-we-do/announcements.html or at mfs.com/vit3by choosing the fund’s name.
INFORMATION ABOUT FUND CONTRACTS AND LEGAL CLAIMS
The fund has entered into contractual arrangements with an investment adviser, administrator, distributor, shareholder servicing agent, 529 program manager (if applicable), and custodian who each provide services to the fund. Unless expressly stated otherwise, shareholders are not parties to, or intended beneficiaries of these contractual arrangements, and these contractual arrangements are not intended to create any shareholder right to enforce them against the service providers or to seek any remedy under them against the service providers, either directly or on behalf of the fund.
Under the Trust’s By-Laws and Declaration of Trust, any claims asserted against or on behalf of the MFS Funds, including claims against Trustees and Officers, must be brought in state and federal courts located within the Commonwealth of Massachusetts.
FEDERAL TAX INFORMATION (unaudited)
The following information is provided pursuant to provisions of the Internal Revenue Code.
The fund designates $12,752,000 as capital gain dividends paid during the fiscal year.
For corporate shareholders, 17.33% of the ordinary income dividends paid during the fiscal year qualify for the corporate dividends received deduction.
27
rev. 3/16
| | | | |
| | | |
| FACTS | | WHAT DOES MFS DO WITH YOUR
PERSONAL INFORMATION? | |  |
| | |
| Why? | | Financial companies choose how they share your personal information. Federal law gives consumers the right to limit some but not all sharing. Federal law also requires us to tell you how we collect, share, and protect your personal information. Please read this notice carefully to understand what we do. |
| | |
| What? | | The types of personal information we collect and share depend on the product or service you have with us. This information can include: • Social Security number and account balances • Account transactions and transaction history • Checking account information and wire transfer instructions When you areno longer our customer, we continue to share your information as described in this notice. |
| | |
| How? | | All financial companies need to share customers’ personal information to run their everyday business. In the section below, we list the reasons financial companies can share their customers’ personal information; the reasons MFS chooses to share; and whether you can limit this sharing. |
| | | | |
Reasons we can share your
personal information | | Does MFS share? | | Can you limit this
sharing? |
For our everyday business purposes – such as to process your transactions, maintain your account(s), respond to court orders and legal investigations, or report to credit bureaus | | Yes | | No |
For our marketing purposes – to offer our products and services to you | | No | | We don’t share |
| For joint marketing with other financial companies | | No | | We don’t share |
For our affiliates’ everyday business purposes – information about your transactions and experiences | | No | | We don’t share |
For our affiliates’ everyday business purposes – information about your creditworthiness | | No | | We don’t share |
| For nonaffiliates to market to you | | No | | We don’t share |
| | |
| | |
| Questions? | | Call800-225-2606 or go tomfs.com. |
28
| | |
| Who we are |
| Who is providing this notice? | | MFS Funds, MFS Investment Management, MFS Institutional Advisors, Inc., and MFS Heritage Trust Company. |
| | |
| What we do |
| How does MFS protect my personal information? | | To protect your personal information from unauthorized access and use, we use security measures that comply with federal law. These measures include procedural, electronic, and physical safeguards for the protection of the personal information we collect about you. |
How does MFS
collect my personal information? | | We collect your personal information, for example, when you • open an account or provide account information • direct us to buy securities or direct us to sell your securities • make a wire transfer We also collect your personal information from others, such as credit bureaus, affiliates, or other companies. |
| Why can’t I limit all sharing? | | Federal law gives you the right to limit only • sharing for affiliates’ everyday business purposes – information about your creditworthiness • affiliates from using your information to market to you • sharing for nonaffiliates to market to you State laws and individual companies may give you additional rights to limit sharing. |
| | |
| Definitions |
| Affiliates | | Companies related by common ownership or control. They can be financial and nonfinancial companies. • MFS does not share personal information with affiliates, except for everyday business purposes as described on page one of this notice. |
| Nonaffiliates | | Companies not related by common ownership or control. They can be financial and nonfinancial companies. • MFS does not share with nonaffiliates so they can market to you. |
| Joint marketing | | A formal agreement between nonaffiliated financial companies that together market financial products or services to you. • MFS doesn’t jointly market. |
| | |
| Other important information |
| If you own an MFS product or receive an MFS service in the name of a third party such as a bank or broker-dealer, their privacy policy may apply to you instead of ours. |
29
Annual Report
December 31, 2019

MFS® Conservative Allocation Portfolio

MFS® Variable Insurance Trust III
Beginning on January 1, 2021, as permitted by regulations adopted by the U.S. Securities and Exchange Commission, the insurance company that offers your contract may determine that it will no longer send you paper copies of the fund’s annual and semiannual shareholder reports unless you specifically request paper copies from the insurance company or from your financial intermediary. Instead, the shareholder reports will be made available on a Web site (insurancefunds.mfs.com or other Web site of which you will be notified), and the insurance company will notify you by mail each time a report is posted and provide you with a Web site link to access the report. Instructions for requesting paper copies will be provided by your insurance company or financial intermediary.
If you already elected to receive shareholder reports by email, you will not be affected by this change and you need not take any action. If your insurance company or financial intermediary offers electronic delivery, you may elect to receive shareholder reports and other communications from the insurance company or financial intermediary by email by following the instructions provided by the insurance company or financial intermediary.
Beginning on January 1, 2019, you may elect to receive all future reports in paper free of charge from the insurance company or financial intermediary. You can inform the insurance company or financial intermediary that you wish to continue receiving paper copies of your shareholder reports by contacting your insurance company or financial intermediary. Your election to receive reports in paper will apply to all funds held in your account with your insurance company or financial intermediary.
VCA-ANN
MFS® Conservative Allocation Portfolio
CONTENTS
The report is prepared for the general information of contract owners. It is authorized for distribution to prospective investors only when preceded or accompanied by a current prospectus.
NOT FDIC INSURED• MAY LOSE VALUE• NO BANK OR CREDIT UNION GUARANTEE• NOT A DEPOSIT• NOT INSURED BY ANY FEDERAL GOVERNMENT AGENCY OR NCUA/NCUSIF
MFS Conservative Allocation Portfolio
LETTER FROM THE EXECUTIVE CHAIR

Dear Contract Owners:
Slowing global growth, low inflation, and trade friction between the United States and China have been hallmarks of the past 12 months. After experiencing an uptick in market volatility in late 2018, markets steadied for most of 2019, thanks in large measure to the adoption of a dovish policy stance on the part of global central banks, focused on supporting economic growth. Negotiations aimed at a “phase one” trade deal between the U.S. and China bore fruit at the end of the period, boosting investor sentiment, while signs of stability emerging from the global manufacturing sector also lifted spirits. Uncertainty over Brexit, along with the ripple effects from the trade conflict, hampered business confidence and investment in the United Kingdom and Europe for much of the period, though investors expect greater clarity regarding Brexit as a result of December’s general election. The pro-Brexit Conservative Party won the election by a comfortable margin and set the stage for the U.K.’s departure from the EU at the end of January.
Markets expect the longest economic expansion in U.S. history will continue, albeit at a slower pace, as trade tensions recede. In an effort to prolong the expansion, the U.S. Federal Reserve lowered interest rates three times between July and October and the European Central Bank loosened policy in September. While the global monetary policy backdrop remains quite accommodative, signs of easing trade tensions and fading global recession fears led to improved market sentiment in late 2019 as investors grew less risk averse. In early 2020, an outbreak of coronavirus emanating from China reintroduced global growth fears, causing an uptick in volatility.
Here at MFS®, we aim to help our clients navigate the growing complexity of the markets and world economies. Our long-term investment philosophy and commitment to the responsible allocation of capital allow us to tune out the noise and uncover what we believe are the best, most durable investment opportunities in the market. Through our powerful global investment platform, we combine collective expertise, thoughtful risk management and long-term discipline to create sustainable value for investors.
Respectfully,

Robert J. Manning
Executive Chair
MFS Investment Management
February 14, 2020
The opinions expressed in this letter are subject to change and may not be relied upon for investment advice. No forecasts can be guaranteed.
1
MFS Conservative Allocation Portfolio
PORTFOLIO COMPOSITION
Portfolio target allocation
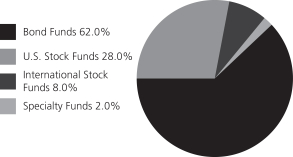
| | | | |
| Portfolio holdings | | | | |
| MFS Total Return Bond Series | | | 16.9% | |
| MFS Limited Maturity Portfolio | | | 12.0% | |
| MFS Inflation-Adjusted Bond Portfolio | | | 9.9% | |
| MFS Government Securities Portfolio | | | 9.9% | |
| MFS Global Governments Portfolio | | | 8.0% | |
| MFS Value Series | | | 6.0% | |
| MFS Research Series | | | 6.0% | |
| MFS Growth Series | | | 5.9% | |
| MFS High Yield Portfolio | | | 5.0% | |
| MFS Mid Cap Value Portfolio | | | 4.0% | |
| MFS Mid Cap Growth Series | | | 4.0% | |
| MFS Research International Portfolio | | | 4.0% | |
| MFS Global Real Estate Portfolio | | | 2.0% | |
| MFS International Growth Portfolio | | | 2.0% | |
| MFS International Intrinsic Value Portfolio | | | 2.0% | |
| MFS New Discovery Value Portfolio | | | 1.0% | |
| MFS New Discovery Series | | | 1.0% | |
| Cash & Cash Equivalents | | | 0.4% | |
Portfolio actual allocation
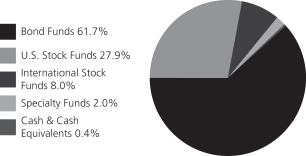
Cash & Cash Equivalents includes any cash, investments in money market funds, short-term securities, and other assets less liabilities. MFS endeavors to fully invest all MFSfunds-of-funds in underlying funds on a daily basis. Any divergence from 0.0% in Cash & Cash Equivalents is typically due to the timing of fund subscriptions/redemptions and the settlement of subsequent investment in/divestment from the underlying funds. While the MFSfunds-of-funds’ subscriptions/redemptions are processed at the same day NAV of the underlying funds, a positive/negative cash balance will be reflected on the MFSfunds-of-funds’ Statements of Assets and Liabilities until the trades with the underlying funds settle, which is typically two business days. Please see the Statements of Assets and Liabilities for additional information related to the fund’s cash position and other assets and liabilities.
Percentages are based on net assets as of December 31, 2019.
The portfolio is actively managed and current holdings may be different.
2
MFS Conservative Allocation Portfolio
MANAGEMENT REVIEW
Summary of Results
For the twelve months ended December 31, 2019, Initial Class shares of the MFS Conservative Allocation Portfolio (fund) provided a total return of 16.87%, while Service Class shares of the fund provided a total return of 16.48%. These compare with a return of 8.72% for the fund’s benchmark, the Bloomberg Barclays U.S. Aggregate Bond Index. The fund’s other benchmark, the MFS Conservative Allocation Portfolio Blended Index (Blended Index), generated a return of 16.28%. The Blended Index reflects the blended returns of various equity and fixed income market indices, with percentage allocations to each index designed to resemble the allocations of the fund. The market indices and related percentage allocations used to compile the Blended Index are set forth in the Performance Summary.
Market Environment
Fading fears of a near-term global recession, the announcement of a partial trade deal between the United States and China and the decline in uncertainty over Brexit helped bolster market sentiment late in the period. Changes in market sentiment, largely driven by uncertainty over the outcome of trade negotiations between the US and China, had contributed to periodic bouts of volatility during the reporting period. The global economy decelerated, led by weakness in China and Europe, although the pace of the slowdown moderated late in the period amid nascent signs of stabilization in the manufacturing sector.
The deteriorating global growth backdrop, along with declining inflationary pressures, prompted the US Federal Reserve to adopt a more dovish posture beginning in early 2019, resulting in the first interest rate cut in over a decade at the end of July, followed by additional cuts in September and October. The Fed’s actions led to a sharp decline in long-term interest rates during the period’s second half, causing the inversion of portions of the US Treasury yield curve for a time. Amid an improvement in risk sentiment in Q4 2019 and indications of a bottoming in growth and a potential upturn in activity, the Fed indicated in October that further rate cuts were unlikely unless the outlook for the economy materially worsened.
Globally, central banks have tilted more dovish as well, with the European Central Bank unveiling a package of easing measures, which included putting overnight rates deeper into negative territory, restarting its bond-buying program and lengthening the term of cheap loans to banks to three years from two. The central banks of India and Australia are among those that have cut rates several times in recent months, although China has been more cautious in increasing liquidity as it keeps trying to deleverage its economy, cutting rates only marginally.
Emerging markets experienced considerable volatility through the end of 2018, as tighter global financial conditions exposed structural weakness in some countries. Those conditions improved in 2019 as the Fed became more dovish. Notwithstanding the periodic headwinds on market sentiment from significant trade friction between the US and China over much of the year, emerging market hard currency debt and local rates benefited from relatively cheap valuations at the beginning of the period and easier global monetary conditions. These factors, plus the fading of certain global risk factors mentioned above, hastened spread tightening in the latter part of the period. At the same time, idiosyncratic risks spiked in some countries (e.g., Argentina and Lebanon), contributing to increased dispersion in performance among sovereign assets.
Factors Affecting Performance
During the reporting period, the fund outperformed its benchmark, the Bloomberg Barclays U.S. Aggregate Bond Index, primarily due to its allocation to both the equity and real estate markets, which performed strongly during the year. Over the same period, the fund outperformed the Blended Index.
Relative to the Blended Index, strong relative performance across all funds within the U.S. equity asset class strengthened returns, as all funds within this segment outpaced their respective benchmarks. Additionally, the fund’s exposure to large- and mid-capitalization growth funds, particularly the MFS Growth Series and MFS Mid Cap Growth Series, helped relative returns and offset weakness from the fund’s exposure to large- and mid-capitalization value strategies, most notably the MFS Value Series and MFS Mid Cap Value Portfolio.
The international equity segment was another positive factor for relative performance as both the MFS Research International Portfolio and MFS International Intrinsic Value Portfolio outperformed their respective benchmarks during the reporting period.
The fund’s exposure to the fixed income asset class weighed on relative returns, as strong bond market performance during the period hurt funds with shorter relative durations, particularly the MFS Limited Maturity Portfolio, and with lesser relative credit exposure, most notably the MFS Government Securities Portfolio. Additionally, the fund’s allocation to the MFS Global Governments
3
MFS Conservative Allocation Portfolio
Management Review – continued
Portfolio weakened relative performance, driven by this fund’s global exposure in a strong US dollar environment. This was partially offset by the fund’s allocation to the MFS High Yield Portfolio and strong relative performance of the MFS Total Return Bond Series.
Respectfully,
Portfolio Manager(s)
Joseph Flaherty and Natalie Shapiro
The views expressed in this report are those of the portfolio manager(s) only through the end of the period of the report as stated on the cover and do not necessarily reflect the views of MFS or any other person in the MFS organization. These views are subject to change at any time based on market or other conditions, and MFS disclaims any responsibility to update such views. These views may not be relied upon as investment advice or an indication of trading intent on behalf of any MFS portfolio. References to specific securities are not recommendations of such securities, and may not be representative of any MFS portfolio’s current or future investments.
4
MFS Conservative Allocation Portfolio
PERFORMANCE SUMMARY THROUGH 12/31/19
The following chart illustrates the historical performance of the fund in comparison to its benchmark(s). Benchmarks are unmanaged and may not be invested in directly. Benchmark returns do not reflect any fees or expenses. The performance of other share classes will be greater than or less than that of the class depicted below. (See Notes to Performance Summary.)
Performance data shown represents past performance and is no guarantee of future results. Investment return and principal value fluctuate so your units, when sold, may be worth more or less than the original cost; current performance may be lower or higher than quoted. The performance shown does not reflect the deduction of taxes, if any, that a contract holder would pay on fund distributions or the redemption of contract units. The returns for the fund shown also do not reflect the deduction of expenses associated with variable products, such as mortality and expense risk charges, separate account charges, and sales charges imposed by the insurance company separate accounts. Such expenses would reduce the overall returns shown.
Growth of a Hypothetical $10,000 Investment
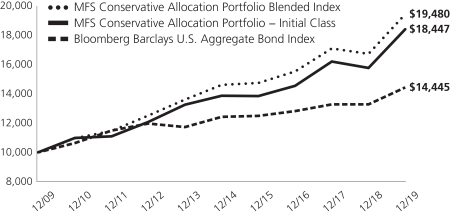
Total Returns through 12/31/19
Average annual total returns
| | | | | | | | | | | | |
| | | Share Class | | Class Inception Date | | 1-yr | | 5-yr | | 10-yr | | |
| | | Initial Class | | 10/01/08 | | 16.87% | | 5.85% | | 6.31% | | |
| | | Service Class | | 10/01/08 | | 16.48% | | 5.56% | | 6.04% | | |
| | | | |
| Comparative benchmark(s) | | | | | | | | |
| | | Bloomberg Barclays U.S. Aggregate Bond Index (f) | | 8.72% | | 3.05% | | 3.75% | | |
| | | MFS Conservative Allocation Portfolio Blended Index (f)(w) | | 16.28% | | 5.88% | | 6.90% | | |
| | | FTSE EPRA Nareit Developed Real Estate Index (net div) (f) | | 21.91% | | 5.56% | | 8.37% | | |
| | | MSCI EAFE Index (net div) (f) | | 22.01% | | 5.67% | | 5.50% | | |
| | | Standard & Poor’s 500 Stock Index (f) | | 31.49% | | 11.70% | | 13.56% | | |
| (f) | | Source: FactSet Research Systems Inc. |
| (w) | | As of December 31, 2019, the MFS Conservative Allocation Portfolio Blended Index (a custom index) was comprised of 62% Bloomberg Barclays U.S. Aggregate Bond Index, 28% Standard & Poor’s 500 Stock Index, 8% MSCI EAFE Index (net div), and 2% FTSE EPRA Nareit Developed Real Estate Index (net div). |
Benchmark Definition(s)
Bloomberg Barclays U.S. Aggregate Bond Index – a market capitalization-weighted index that measures the performance of the U.S. investment-grade, fixed rate bond market, with index components for government and corporate securities, mortgage pass-through securities, and asset-backed securities with at least one year to final maturity. BLOOMBERG® is a trademark and service mark of Bloomberg Finance L.P. and its affiliates (collectively “Bloomberg”). BARCLAYS® is a trademark and service mark of Barclays Bank Plc (collectively with its affiliates, “Barclays”), used under license. Bloomberg or Bloomberg’s licensors, including Barclays, own all proprietary rights in the Bloomberg Barclays Indices. Neither Bloomberg nor Barclays approves or endorses this material, or guarantees the accuracy or completeness of any information herein, or makes any warranty, express or implied, as to the results to be obtained therefrom, and, to the maximum extent allowed by law, neither shall have any liability or responsibility for injury or damages arising in connection therewith.
5
MFS Conservative Allocation Portfolio
Performance Summary – continued
FTSE EPRA Nareit Developed Real Estate Index (net div) – measures the performance of eligible real estate equities worldwide that generate a majority of their revenue and income through the ownership, disposure and development of income-producing real estate. FTSE International Limited (“FTSE”)© FTSE 2019. “FTSE®” is a trademark of the London Stock Exchange Group companies and is used by FTSE International Limited under license. “FT-SE®”, “FOOTSIE®” and “FTSE4GOOD®” are trademarks of the London Stock Exchange Group companies. “Nareit®” is a trademark of the National Association of Real Estate Investment Trusts (“Nareit”) and “EPRA®” is a trademark of the European Public Real Estate Association (“EPRA”) and all are used by FTSE under license. The FTSE EPRA Nareit Developed Real Estate Index is calculated by FTSE. Neither FTSE, Euronext N.V., Nareit, nor EPRA sponsor, endorse, or promote this product and are not in any way connected to it and do not accept any liability. All intellectual property rights in the index values and constituent list vests in FTSE, Euronext N.V., Nareit, and EPRA. Neither FTSE nor its licensors accept any liability for any errors or omissions in the FTSE indices and/or FTSE ratings or underlying data. No further distribution of FTSE Data is permitted without FTSE’s express written consent.
MSCI EAFE (Europe, Australasia, Far East) Index (net div) – a market capitalization index that is designed to measure equity market performance in the developed markets, excluding the U.S. and Canada. Morgan Stanley Capital International (“MSCI”) makes no express or implied warranties or representations and shall have no liability whatsoever with respect to any MSCI data contained herein. The MSCI data may not be further redistributed or used as a basis for other indices or any securities or financial products. This report is not approved, reviewed, or produced by MSCI.
Standard & Poor’s 500 Stock Index – a market capitalization index of 500 widely held equity securities, designed to measure broad U.S. equity performance. “Standard & Poor’s®” and “S&P®” are registered trademarks of Standard & Poor’s Financial Services LLC (“S&P”) and Dow Jones is a registered trademark of Dow Jones Trademark Holdings LLC (“Dow Jones”) and have been licensed for use by S&P Dow Jones Indices LLC and sublicensed for certain purposed by Massachusetts Financial Services Company. The S&P 500® is a product of S&P Dow Jones Indices LLC, and has been licensed for use by Massachusetts Financial Services Company. Massachusetts Financial Services Company’s product(s) is not sponsored, endorsed, sold, or promoted by S&P Dow Jones Indices LLC, Dow Jones, S&P, or their respective affiliates, and neither S&P Dow Jones Indices LLC, Dow Jones, S&P, nor their respective affiliates make any representation regarding the advisability of investing in such product(s).
It is not possible to invest directly in an index.
Notes to Performance Summary
Average annual total return represents the average annual change in value for each share class for the periods presented.
Performance prior to close of business December 7, 2012, reflects time periods when another adviser or subadviser was responsible for selecting investments for the fund under a different investment objective and different investment strategies, underlying fund selections, and underlying fund target weightings of the fund.
Performance results reflect any applicable expense subsidies and waivers in effect during the periods shown. Without such subsidies and waivers the fund’s performance results would be less favorable. Please see the prospectus and financial statements for complete details. All results are historical and assume the reinvestment of any dividends and capital gains distributions.
Performance results do not include adjustments made for financial reporting purposes in accordance with U.S. generally accepted accounting principles and may differ from amounts reported in the financial highlights.
From time to time the fund may receive proceeds from litigation settlements, without which performance would be lower.
6
MFS Conservative Allocation Portfolio
EXPENSE TABLE
Fund Expenses Borne by the Contract Holders during the Period,
July 1, 2019 through December 31, 2019
As a contract holder of the fund, you incur ongoing costs, including distribution and/or service(12b-1) fees; and other fund expenses. This example is intended to help you understand your ongoing costs (in dollars) of investing in the fund and to compare these costs with the ongoing costs of investing in other mutual funds.
In addition to the fees and expenses which the fund bears directly, the fund indirectly bears a pro rata share of the fees and expenses of the underlying funds in which the fund invests. Because the underlying funds have varied expenses and fee levels and the fund may own different proportions of the underlying funds at different times, the amount of fees and expenses incurred indirectly by the fund will vary. If these indirect costs were included, your costs would have been higher.
The example is based on an investment of $1,000 invested at the beginning of the period and held for the entire period July 1, 2019 through December 31, 2019.
Actual Expenses
The first line for each share class in the following table provides information about actual account values and actual expenses. You may use the information in this line, together with the amount you invested, to estimate the expenses that you paid over the period. Simply divide your account value by $1,000 (for example, an $8,600 account value divided by $1,000 = 8.6), then multiply the result by the number in the first line under the heading entitled “Expenses Paid During Period” to estimate the expenses you paid on your account during this period.
Hypothetical Example for Comparison Purposes
The second line for each share class in the following table provides information about hypothetical account values and hypothetical expenses based on the fund’s actual expense ratio and an assumed rate of return of 5% per year before expenses, which is not the fund’s actual return. The hypothetical account values and expenses may not be used to estimate the actual ending account balance or expenses you paid for the period. You may use this information to compare the ongoing costs of investing in the fund and other funds. To do so, compare this 5% hypothetical example with the 5% hypothetical examples that appear in the shareholder reports of the other funds.
Please note that the expenses shown in the table are meant to highlight the fund’s ongoing costs only and do not take into account the fees and expenses imposed under the variable contracts through which your investment in the fund is made. Therefore, the second line for each share class in the table is useful in comparing ongoing costs associated with an investment in vehicles (such as the fund) which fund benefits under variable annuity and variable life insurance contracts and to qualified pension and retirement plans only, and will not help you determine the relative total costs of investing in the fund through variable annuity and variable life insurance contracts. If the fees and expenses imposed under the variable contracts were included, your costs would have been higher.
| | | | | | | | | | | | | | | | | | |
| Share Class | | | | Annualized
Expense Ratio | | | Beginning
Account Value
7/01/19 | | | Ending
Account Value
12/31/19 | | | Expenses Paid
During Period (p)
7/01/19-12/31/19 | |
| Initial Class | | Actual | | | 0.03% | | | | $1,000.00 | | | | $1,046.10 | | | | $0.15 | |
| | Hypothetical (h) | | | 0.03% | | | | $1,000.00 | | | | $1,025.05 | | | | $0.15 | |
| Service Class | | Actual | | | 0.28% | | | | $1,000.00 | | | | $1,044.64 | | | | $1.44 | |
| | Hypothetical (h) | | | 0.28% | | | | $1,000.00 | | | | $1,023.79 | | | | $1.43 | |
| (h) | 5% class return per year before expenses. |
| (p) | “Expenses Paid During Period” are equal to each class’s annualized expense ratio, as shown above, multiplied by the average account value over the period, multiplied by 184/365 (to reflect theone-half year period). In addition to the fees and expenses which the fund bears directly, the fund indirectly bears a pro rata share of the fees and expenses of the underlying funds in which the fund invests. If these indirect costs were included, your costs would have been higher. |
7
MFS Conservative Allocation Portfolio
PORTFOLIO OF INVESTMENTS – 12/31/19
The Portfolio of Investments is a complete list of all securities owned by your fund. It is categorized by broad-based asset classes.
| | | | | | | | |
| | |
| Issuer | | Shares/Par | | | Value ($) | |
| INVESTMENT COMPANIES (h) – 100.0% | | | | | |
| Bond Funds – 61.7% | | | | | |
| MFS Global Governments Portfolio – Initial Class | | | 3,238,483 | | | $ | 34,684,158 | |
| MFS Government Securities Portfolio – Initial Class | | | 3,475,702 | | | | 43,272,484 | |
| MFS High Yield Portfolio – Initial Class | | | 3,790,981 | | | | 21,684,412 | |
| MFS Inflation-Adjusted Bond Portfolio – Initial Class | | | 4,007,201 | | | | 43,317,842 | |
| MFS Limited Maturity Portfolio – Initial Class | | | 5,033,006 | | | | 52,041,281 | |
| MFS Total Return Bond Series – Initial Class | | | 5,461,914 | | | | 73,626,602 | |
| | | | | | | | |
| | | | | | $ | 268,626,779 | |
| | | | | | | | |
| International Stock Funds – 8.0% | | | | | |
| MFS International Growth Portfolio – Initial Class | | | 608,717 | | | $ | 8,680,310 | |
| MFS International Intrinsic Value Portfolio – Initial Class | | | 289,701 | | | | 8,673,639 | |
| MFS Research International Portfolio – Initial Class | | | 1,023,445 | | | | 17,357,618 | |
| | | | | | | | |
| | | | | | $ | 34,711,567 | |
| | | | | | | | |
| Specialty Funds – 2.0% | | | | | |
| MFS Global Real Estate Portfolio – Initial Class | | | 547,635 | | | $ | 8,712,875 | |
| | | | | | | | |
| | | | | | | | |
| | |
| Issuer | | Shares/Par | | | Value ($) | |
| INVESTMENT COMPANIES (h) – continued | | | | | |
| U.S. Stock Funds – 27.9% | | | | | |
| MFS Growth Series – Initial Class | | | 438,372 | | | $ | 26,039,297 | |
| MFS Mid Cap Growth Series – Initial Class | | | 1,743,837 | | | | 17,368,614 | |
| MFS Mid Cap Value Portfolio – Initial Class | | | 1,988,983 | | | | 17,383,710 | |
| MFS New Discovery Series – Initial Class | | | 213,422 | | | | 4,328,209 | |
| MFS New Discovery Value Portfolio – Initial Class | | | 465,403 | | | | 4,342,216 | |
| MFS Research Series – Initial Class | | | 883,186 | | | | 26,045,148 | |
| MFS Value Series – Initial Class | | | 1,243,723 | | | | 26,055,991 | |
| | | | | | | | |
| | | | | | $ | 121,563,185 | |
| | | | | | | | |
| Money Market Funds – 0.4% | | | | | | | | |
| MFS Institutional Money Market Portfolio, 1.7% (v) | | | 1,669,745 | | | $ | 1,669,745 | |
| | | | | | | | |
Total Investment Companies
(Identified Cost, $382,258,172) | | | | | | $ | 435,284,151 | |
| | | | | | | | |
OTHER ASSETS, LESS
LIABILITIES – (0.0)% | | | | | | | (51,535 | ) |
| | | | | | | | |
| NET ASSETS – 100.0% | | | | | | $ | 435,232,616 | |
| | | | | | | | |
| (h) | | An affiliated issuer, which may be considered one in which the fund owns 5% or more of the outstanding voting securities, or a company which is under common control. At period end, the aggregate value of the fund’s investments in affiliated issuers was $435,284,151. |
| (v) | | Affiliated issuer that is available only to investment companies managed by MFS. The rate quoted for the MFS Institutional Money Market Portfolio is the annualizedseven-day yield of the fund at period end. |
See Notes to Financial Statements
8
MFS Conservative Allocation Portfolio
FINANCIAL STATEMENTS | STATEMENT OF ASSETS AND LIABILITIES
This statement represents your fund’s balance sheet, which details the assets and liabilities comprising the total value of the fund.
| | | | |
At 12/31/19 | | | | |
| |
Assets | | | | |
Investments in affiliated issuers, at value (identified cost, $382,258,172) | | | $435,284,151 | |
Receivables for | | | | |
Investments sold | | | 402,234 | |
Fund shares sold | | | 29 | |
Other assets | | | 2,457 | |
Total assets | | | $435,688,871 | |
| |
Liabilities | | | | |
Payables for | | | | |
Fund shares reacquired | | | $402,263 | |
Payable to affiliates | | | | |
Administrative services fee | | | 96 | |
Shareholder servicing costs | | | 15 | |
Distribution and/or service fees | | | 5,942 | |
Payable for independent Trustees’ compensation | | | 75 | |
Accrued expenses and other liabilities | | | 47,864 | |
Total liabilities | | | $456,255 | |
Net assets | | | $435,232,616 | |
| |
Net assets consist of | | | | |
Paid-in capital | | | $356,713,020 | |
Total distributable earnings (loss) | | | 78,519,596 | |
Net assets | | | $435,232,616 | |
Shares of beneficial interest outstanding | | | 37,940,532 | |
| | | | | | | | | | | | |
| | | |
| | | Net assets | | | Shares
outstanding | | | Net asset value
per share | |
Initial Class | | | $2,029,187 | | | | 177,438 | | | | $11.44 | |
Service Class | | | 433,203,429 | | | | 37,763,094 | | | | 11.47 | |
See Notes to Financial Statements
9
MFS Conservative Allocation Portfolio
FINANCIAL STATEMENTS | STATEMENT OF OPERATIONS
This statement describes how much your fund earned in investment income and accrued in expenses. It also describes any gains and/or losses generated by fund operations.
| | | | |
Year ended 12/31/19 | | | | |
| |
Net investment income (loss) | | | | |
Income | | | | |
Dividends from affiliated issuers | | | $11,020,729 | |
Other | | | 84 | |
Total investment income | | | $11,020,813 | |
Expenses | | | | |
Distribution and/or service fees | | | $1,114,963 | |
Shareholder servicing costs | | | 4,420 | |
Administrative services fee | | | 17,500 | |
Independent Trustees’ compensation | | | 10,592 | |
Custodian fee | | | 7,458 | |
Shareholder communications | | | 10,745 | |
Audit and tax fees | | | 39,751 | |
Legal fees | | | 3,757 | |
Miscellaneous | | | 29,591 | |
Total expenses | | | $1,238,777 | |
Net investment income (loss) | | | $9,782,036 | |
| |
Realized and unrealized gain (loss) | | | | |
Realized gain (loss) (identified cost basis) | | | | |
Investments in affiliated issuers | | | $6,026,906 | |
Capital gain distributions from underlying affiliated funds | | | 12,636,793 | |
Net realized gain (loss) | | | $18,663,699 | |
Change in unrealized appreciation or depreciation | | | | |
Affiliated issuers | | | $40,261,900 | |
Net realized and unrealized gain (loss) | | | $58,925,599 | |
Change in net assets from operations | | | $68,707,635 | |
See Notes to Financial Statements
10
MFS Conservative Allocation Portfolio
FINANCIAL STATEMENTS | STATEMENTS OF CHANGES IN NET ASSETS
These statements describe the increases and/or decreases in net assets resulting from operations, any distributions, and any shareholder transactions.
| | | | | | | | |
| | | Year ended | |
| | | 12/31/19 | | | 12/31/18 | |
Change in net assets | | | | | | | | |
| | |
From operations | | | | | | | | |
Net investment income (loss) | | | $9,782,036 | | | | $10,492,264 | |
Net realized gain (loss) | | | 18,663,699 | | | | 21,412,589 | |
Net unrealized gain (loss) | | | 40,261,900 | | | | (45,032,933 | ) |
Change in net assets from operations | | | $68,707,635 | | | | $(13,128,080 | ) |
Total distributions to shareholders | | | $(32,355,395 | ) | | | $(30,510,928 | ) |
Change in net assets from fund share transactions | | | $(46,169,562 | ) | | | $(66,228,101 | ) |
Total change in net assets | | | $(9,817,322 | ) | | | $(109,867,109 | ) |
| | |
Net assets | | | | | | | | |
At beginning of period | | | 445,049,938 | | | | 554,917,047 | |
At end of period | | | $435,232,616 | | | | $445,049,938 | |
See Notes to Financial Statements
11
MFS Conservative Allocation Portfolio
FINANCIAL STATEMENTS | FINANCIAL HIGHLIGHTS
The financial highlights table is intended to help you understand the fund’s financial performance for the past 5 years. Certain information reflects financial results for a single fund share. The total returns in the table represent the rate that an investor would have earned (or lost) on an investment in the fund share class (assuming reinvestment of all distributions) held for the entire period.
| | | | | | | | | | | | | | | | | | | | |
| Initial Class | | Year ended | |
| | | | | |
| | | 12/31/19 | | | 12/31/18 | | | 12/31/17 | | | 12/31/16 | | | 12/31/15 | |
| | | | | |
Net asset value, beginning of period | | | $10.58 | | | | $11.61 | | | | $10.95 | | | | $11.09 | | | | $11.79 | |
| | | | | |
| Income (loss) from investment operations | | | | | | | | | | | | | | | | | | | | |
Net investment income (loss) (d)(l) | | | $0.28 | | | | $0.27 | | | | $0.22 | | | | $0.22 | (c) | | | $0.24 | |
Net realized and unrealized gain (loss) | | | 1.47 | | | | (0.55 | ) | | | 1.02 | | | | 0.36 | | | | (0.27 | ) |
Total from investment operations | | | $1.75 | | | | $(0.28 | ) | | | $1.24 | | | | $0.58 | | | | $(0.03 | ) |
| | | | | |
| Less distributions declared to shareholders | | | | | | | | | | | | | | | | | | | | |
From net investment income | | | $(0.31 | ) | | | $(0.26 | ) | | | $(0.26 | ) | | | $(0.32 | ) | | | $(0.41 | ) |
From net realized gain | | | (0.58 | ) | | | (0.49 | ) | | | (0.32 | ) | | | (0.40 | ) | | | (0.26 | ) |
Total distributions declared to shareholders | | | $(0.89 | ) | | | $(0.75 | ) | | | $(0.58 | ) | | | $(0.72 | ) | | | $(0.67 | ) |
Net asset value, end of period (x) | | | $11.44 | | | | $10.58 | | | | $11.61 | | | | $10.95 | | | | $11.09 | |
Total return (%) (k)(r)(s)(x) | | | 16.87 | | | | (2.73 | ) | | | 11.48 | | | | 5.03 | (c) | | | (0.19 | ) |
| | | | | |
Ratios (%) (to average net assets)
and Supplemental data: | | | | | | | | | | | | | | | | | | | | |
Expenses before expense reductions (f)(h) | | | 0.03 | | | | 0.03 | | | | 0.02 | | | | 0.02 | (c) | | | 0.01 | |
Expenses after expense reductions (f)(h) | | | N/A | | | | N/A | | | | N/A | | | | N/A | | | | N/A | |
Net investment income (loss) (l) | | | 2.47 | | | | 2.34 | | | | 1.94 | | | | 1.92 | (c) | | | 2.06 | |
Portfolio turnover | | | 2 | | | | 1 | | | | 0 | (b) | | | 1 | | | | 2 | |
Net assets at end of period (000 omitted) | | | $2,029 | | | | $2,062 | | | | $2,338 | | | | $2,266 | | | | $2,419 | |
| |
| Service Class | | Year ended | |
| | | | | |
| | | 12/31/19 | | | 12/31/18 | | | 12/31/17 | | | 12/31/16 | | | 12/31/15 | |
| | | | | |
Net asset value, beginning of period | | | $10.61 | | | | $11.63 | | | | $10.96 | | | | $11.10 | | | | $11.80 | |
| | | | | |
| Income (loss) from investment operations | | | | | | | | | | | | | | | | | | | | |
Net investment income (loss) (d)(l) | | | $0.25 | | | | $0.23 | | | | $0.19 | | | | $0.19 | (c) | | | $0.21 | |
Net realized and unrealized gain (loss) | | | 1.47 | | | | (0.53 | ) | | | 1.02 | | | | 0.35 | | | | (0.28 | ) |
Total from investment operations | | | $1.72 | | | | $(0.30 | ) | | | $1.21 | | | | $0.54 | | | | $(0.07 | ) |
| | | | | |
| Less distributions declared to shareholders | | | | | | | | | | | | | | | | | | | | |
From net investment income | | | $(0.28 | ) | | | $(0.23 | ) | | | $(0.22 | ) | | | $(0.28 | ) | | | $(0.37 | ) |
From net realized gain | | | (0.58 | ) | | | (0.49 | ) | | | (0.32 | ) | | | (0.40 | ) | | | (0.26 | ) |
Total distributions declared to shareholders | | | $(0.86 | ) | | | $(0.72 | ) | | | $(0.54 | ) | | | $(0.68 | ) | | | $(0.63 | ) |
Net asset value, end of period (x) | | | $11.47 | | | | $10.61 | | | | $11.63 | | | | $10.96 | | | | $11.10 | |
Total return (%) (k)(r)(s)(x) | | | 16.48 | | | | (2.92 | ) | | | 11.24 | | | | 4.73 | (c) | | | (0.49 | ) |
| | | | | |
Ratios (%) (to average net assets)
and Supplemental data: | | | | | | | | | | | | | | | | | | | | |
Expenses before expense reductions (f)(h) | | | 0.28 | | | | 0.28 | | | | 0.27 | | | | 0.27 | (c) | | | 0.26 | |
Expenses after expense reductions (f)(h) | | | N/A | | | | N/A | | | | N/A | | | | N/A | | | | N/A | |
Net investment income (loss) (l) | | | 2.18 | | | | 2.05 | | | | 1.63 | | | | 1.66 | (c) | | | 1.80 | |
Portfolio turnover | | | 2 | | | | 1 | | | | 0 | (b) | | | 1 | | | | 2 | |
Net assets at end of period (000 omitted) | | | $433,203 | | | | $442,988 | | | | $552,579 | | | | $612,965 | | | | $691,195 | |
See Notes to Financial Statements
12
MFS Conservative Allocation Portfolio
Financial Highlights – continued
| (c) | Amount reflects aone-time reimbursement of expenses by the custodian (or former custodian) without which net investment income and performance would be lower and expenses would be higher. |
| (d) | Per share data is based on average shares outstanding. |
| (f) | Ratios do not reflect reductions from fees paid indirectly, if applicable. |
| (h) | In addition to the fees and expenses which the fund bears directly, the fund indirectly bears a pro rata share of the fees and expenses of the underlying affiliated funds in which the fund invests. Accordingly, the expense ratio for the fund reflects only those fees and expenses borne directly by the fund. Because the underlying affiliated funds have varied expense and fee levels and the fund may own different proportions of the underlying affiliated funds at different times, the amount of fees and expenses incurred indirectly by the fund will vary. |
| (k) | The total return does not reflect expenses that apply to separate accounts. Inclusion of these charges would reduce the total return figures for all periods shown. |
| (l) | The ratios and per share amounts do not include net investment income of the underlying affiliated funds in which the fund invests. |
| (r) | Certain expenses have been reduced without which performance would have been lower. |
| (s) | From time to time the fund may receive proceeds from litigation settlements, without which performance would be lower. |
| (x) | The net asset values and total returns have been calculated on net assets which include adjustments made in accordance with U.S. generally accepted accounting principles required at period end for financial reporting purposes. |
See Notes to Financial Statements
13
MFS Conservative Allocation Portfolio
NOTES TO FINANCIAL STATEMENTS
| (1) | | Business and Organization |
MFS Conservative Allocation Portfolio (the fund) is a diversified series of MFS Variable Insurance Trust III (the trust). The trust is organized as a Delaware statutory trust and is registered under the Investment Company Act of 1940, as amended, as anopen-end management investment company. The shareholders of each series of the trust are separate accounts of insurance companies, which offer variable annuity and/or life insurance products, and qualified retirement and pension plans.
The fund is an investment company and accordingly follows the investment company accounting and reporting guidance of the Financial Accounting Standards Board (FASB) Accounting Standards Codification Topic 946 Financial Services – Investment Companies.
| (2) | | Significant Accounting Policies |
General– The preparation of financial statements in conformity with U.S. generally accepted accounting principles requires management to make estimates and assumptions that affect the reported amounts of assets and liabilities, and disclosure of contingent assets and liabilities at the date of the financial statements and the reported amounts of increases and decreases in net assets from operations during the reporting period. Actual results could differ from those estimates. In the preparation of these financial statements, management has evaluated subsequent events occurring after the date of the fund’s Statement of Assets and Liabilities through the date that the financial statements were issued.
The fund is a “fund of funds”, which invests the majority of its assets in other MFS mutual funds (hereafter referred to as
“underlying affiliated funds” or “underlying funds”), which may have different fiscal year ends than the funds. The underlying funds, in turn, may engage in a number of investment techniques and practices, which involve certain risks. Certain underlying funds invest their portfolio in high-yield securities rated below investment grade. Investments in below investment grade quality securities can involve a substantially greater risk of default or can already be in default, and their values can decline significantly. Below investment grade quality securities tend to be more sensitive to adverse news about the issuer, or the market or economy in general, than higher quality debt instruments. Certain underlying funds invest a significant portion of their assets in asset-backed and/or mortgage-backed securities. For these securities, the value of the debt instrument also depends on the credit quality and adequacy of the underlying assets or collateral as well as whether there is a security interest in the underlying assets or collateral. Enforcing rights, if any, against the underlying assets or collateral may be difficult. U.S. Government securities not supported as to the payment of principal or interest by the U.S. Treasury, such as those issued by Fannie Mae, Freddie Mac, and the Federal Home Loan Banks, are subject to greater credit risk than are U.S. Government securities supported by the U.S. Treasury, such as those issued by Ginnie Mae. Certain underlying funds invest in foreign securities, including securities of emerging market issuers. Investments in foreign securities are vulnerable to the effects of changes in the relative values of the local currency and the U.S. dollar and to the effects of changes in each country’s market, economic, industrial, political, regulatory, geopolitical, and other conditions. Investments in emerging markets can involve additional and greater risks than the risks associated with investments in developed foreign markets. Emerging markets can have less developed markets, greater custody and operational risk, less developed legal, regulatory, and accounting systems, and greater political, social, and economic instability than developed markets.
The accounting policies of the underlying funds in which the fund invests are outlined in the underlying funds’ shareholder reports, which are available without charge by calling1-800-225-2606, at mfs.com and on the Securities and Exchange Commission (SEC) web site at http://www.sec.gov. The underlying funds’ shareholder reports are not covered by this report.
Investment Valuations–Open-end investment companies (underlying funds) are generally valued at their net asset value per share. The investments of underlying funds managed by the adviser are valued as described below. For purposes of this policy disclosure, “fund” also refers to the underlying funds in which thefund-of-funds invests.
Equity securities, including restricted equity securities and equity securities sold short, are generally valued at the last sale or official closing price on their primary market or exchange as provided by a third-party pricing service. Equity securities, for which there were no sales reported that day, are generally valued at the last quoted daily bid quotation on their primary market or exchange as provided by a third-party pricing service. Equity securities sold short, for which there were no sales reported for that day, are generally valued at the last quoted daily ask quotation on their primary market or exchange as provided by a third-party pricing service. Debt instruments and floating rate loans, including restricted debt instruments, are generally valued at an evaluated or composite bid as provided by a third-party pricing service. Debt instruments sold short are generally valued at an evaluated or composite mean as provided by a third-party pricing service. Short-term instruments with a maturity at issuance of 60 days or less may be valued at amortized cost, which approximates market value. Exchange-traded options are generally valued at the last sale or official closing price on their primary exchange as provided by a third-party pricing service. Exchange-traded options for which there were no sales reported that day are generally valued at the last daily bid quotation on their primary exchange as provided by athird-party pricing service. For put options, the position may be valued at the last daily ask quotation if there are no trades reported during the day. Options not traded on an exchange are generally valued at a broker/dealer bid quotation. Foreign currency options are generally valued at valuations provided by a third-party pricing service. Futures contracts are generally valued at last posted settlement price on their primary exchange as provided by a third-party pricing service. Futures contracts for which there were no
14
MFS Conservative Allocation Portfolio
Notes to Financial Statements – continued
trades that day for a particular position are generally valued at the closing bid quotation on their primary exchange as provided by a third-party pricing service. Forward foreign currency exchange contracts are generally valued at the mean of bid and asked prices for the time period interpolated from rates provided by a third-party pricing service for proximate time periods. Swap agreements are generally valued using valuations provided by a third-party pricing service, which for cleared swaps includes an evaluation of any trading activity at the clearinghouses.Open-end investment companies are generally valued at net asset value per share. Securities and other assets generally valued on the basis of information from a third-party pricing service may also be valued at a broker/dealer bid quotation. In determining values, third-party pricing services can utilize both transaction data and market information such as yield, quality, coupon rate, maturity, type of issue, trading characteristics, and other market data. The values of foreign securities and other assets and liabilities expressed in foreign currencies are converted to U.S. dollars using the mean of bid and asked prices for rates provided by a third-party pricing service.
The Board of Trustees has delegated primary responsibility for determining or causing to be determined the value of the fund’s investments (including any fair valuation) to the adviser pursuant to valuation policies and procedures approved by the Board. If the adviser determines that reliable market quotations are not readily available, investments are valued at fair value as determined in good faith by the adviser in accordance with such procedures under the oversight of the Board of Trustees. Under the fund’s valuation policies and procedures, market quotations are not considered to be readily available for most types of debt instruments and floating rate loans and many types of derivatives. These investments are generally valued at fair value based on information from third-party pricing services. In addition, investments may be valued at fair value if the adviser determines that an investment’s value has been materially affected by events occurring after the close of the exchange or market on which the investment is principally traded (such as foreign exchange or market) and prior to the determination of the fund’s net asset value, or after the halt of trading of a specific security where trading does not resume prior to the close of the exchange or market on which the security is principally traded. Events that occur after foreign markets close (such as developments in foreign markets and significant movements in the U.S. markets) and prior to the determination of the fund’s net asset value may be deemed to have a material effect on the value of securities traded in foreign markets. Accordingly, the fund’s foreign equity securities may often be valued at fair value. The adviser generally relies on third-party pricing services or other information (such as the correlation with price movements of similar securities in the same or other markets; the type, cost and investment characteristics of the security; the business and financial condition of the issuer; and trading and other market data) to assist in determining whether to fair value and at what value to fair value an investment. The value of an investment for purposes of calculating the fund’s net asset value can differ depending on the source and method used to determine value. When fair valuation is used, the value of an investment used to determine the fund’s net asset value may differ from quoted or published prices for the same investment. There can be no assurance that the fund could obtain the fair value assigned to an investment if it were to sell the investment at the same time at which the fund determines its net asset value per share.
Various inputs are used in determining the value of the fund’s assets or liabilities. These inputs are categorized into three broad levels. In certain cases, the inputs used to measure fair value may fall into different levels of the fair value hierarchy. In such cases, an investment’s level within the fair value hierarchy is based on the lowest level of input that is significant to the fair value measurement. The fund’s assessment of the significance of a particular input to the fair value measurement in its entirety requires judgment, and considers factors specific to the investment. Level 1 includes unadjusted quoted prices in active markets for identical assets or liabilities. Level 2 includes other significant observable market-based inputs (including quoted prices for similar securities, interest rates, prepayment speed, and credit risk). Level 3 includes unobservable inputs, which may include the adviser’s own assumptions in determining the fair value of investments. The following is a summary of the levels used as of December 31, 2019 in valuing the fund’s assets or liabilities:
| | | | | | | | | | | | | | | | |
| Financial Instruments | | Level 1 | | | Level 2 | | | Level 3 | | | Total | |
| Mutual Funds | | | $435,284,151 | | | | $— | | | | $— | | | | $435,284,151 | |
For further information regarding security characteristics, see the Portfolio of Investments. Please refer to the underlying funds’ shareholder reports for further information regarding the levels used in valuing the underlying funds’ assets or liabilities.
Derivatives– The fund does not invest in derivatives directly. The fund does invest in underlying funds that may use derivatives primarily to increase or decrease exposure to a particular market or segment of the market, or security, to increase or decrease interest rate or currency exposure, or as alternatives to direct investments. Derivatives are used for hedging ornon-hedging purposes. While hedging can reduce or eliminate losses, it can also reduce or eliminate gains. When the underlying funds use derivatives as an investment to increase market exposure, or for hedging purposes, gains and losses from derivative instruments may be substantially greater than the derivative’s original cost.
Indemnifications– Under the fund’s organizational documents, its officers and Trustees may be indemnified against certain liabilities and expenses arising out of the performance of their duties to the fund. Additionally, in the normal course of business, the fund enters into agreements with service providers that may contain indemnification clauses. The fund’s maximum exposure under these agreements is unknown as this would involve future claims that may be made against the fund that have not yet occurred.
15
MFS Conservative Allocation Portfolio
Notes to Financial Statements – continued
Investment Transactions and Income– Investment transactions are recorded on the trade date. Interest income is recorded on the accrual basis. All premium and discount is amortized or accreted for financial statement purposes in accordance with U.S. generally accepted accounting principles. Distributions of income and capital gains from the underlying funds are recorded on theex-dividend date. Recognition of net investment income by the fund is affected by the timing of the declaration of distributions by the underlying funds in which the fund invests. In determining the net gain or loss on securities sold, the cost of securities is determined on the identified cost basis.
The fund and/or the underlying funds may receive proceeds from litigation settlements. Any proceeds received from litigation involving portfolio holdings are reflected in the Statement of Operations in realized gain/loss if the security has been disposed of by the fund or in unrealized gain/loss if the security is still held by the fund. Any other proceeds from litigation not related to portfolio holdings are reflected as other income in the Statement of Operations.
Tax Matters and Distributions– The fund intends to qualify as a regulated investment company, as defined under Subchapter M of the Internal Revenue Code, and to distribute all of its taxable income, including realized capital gains. As a result, no provision for federal income tax is required. The fund’s federal tax returns, when filed, will remain subject to examination by the Internal Revenue Service for a three year period. Management has analyzed the fund’s tax positions taken on federal and state tax returns for all open tax years and does not believe that there are any uncertain tax positions that require recognition of a tax liability.
Distributions to shareholders are recorded on theex-dividend date. Income and capital gain distributions are determined in accordance with income tax regulations, which may differ from U.S. generally accepted accounting principles. Certain capital accounts in the financial statements are periodically adjusted for permanent differences in order to reflect their tax character. These adjustments have no impact on net assets or net asset value per share. Temporary differences which arise from recognizing certain items of income, expense, gain or loss in different periods for financial statement and tax purposes will reverse at some time in the future.
Book/tax differences primarily relate to wash sale loss deferrals.
The tax character of distributions declared to shareholders for the last two fiscal years is as follows:
| | | | | | | | |
| | | Year ended
12/31/19 | | | Year ended 12/31/18 | |
| Ordinary income (including any short-term capital gains) | | | $10,554,250 | | | | $10,086,518 | |
| Long-term capital gains | | | 21,801,145 | | | | 20,424,410 | |
| Total distributions | | | $32,355,395 | | | | $30,510,928 | |
The federal tax cost and the tax basis components of distributable earnings were as follows:
| | | | |
| As of 12/31/19 | | | | |
| |
| Cost of investments | | | $385,496,420 | |
| Gross appreciation | | | 53,477,281 | |
| Gross depreciation | | | (3,689,550 | ) |
| Net unrealized appreciation (depreciation) | | | $49,787,731 | |
| |
| Undistributed ordinary income | | | 10,460,697 | |
| Undistributed long-term capital gain | | | 18,271,168 | |
Multiple Classes of Shares of Beneficial Interest– The fund offers multiple classes of shares, which differ in their respective distribution and/or service fees. The fund’s income, realized and unrealized gain (loss), and common expenses are allocated to shareholders based on the daily net assets of each class. Dividends are declared separately for each class. Differences in per share dividend rates are generally due to differences in separate class expenses. The fund’s distributions declared to shareholders as reported in the Statements of Changes in Net Assets are presented by class as follows:
| | | | | | | | |
| | |
| | | Year ended
12/31/19 | | | Year ended
12/31/18 | |
| Initial Class | | | $147,454 | | | | $142,534 | |
| Service Class | | | 32,207,941 | | | | 30,368,394 | |
| Total | | | $32,355,395 | | | | $30,510,928 | |
| (3) | | Transactions with Affiliates |
Investment Adviser– The fund has an investment advisory agreement with MFS to provide overall investment management and related administrative services and facilities to the fund. MFS receives no compensation under this agreement; however MFS receives management fees from the underlying MFS funds.
16
MFS Conservative Allocation Portfolio
Notes to Financial Statements – continued
The investment adviser has agreed in writing to pay a portion of the fund’s operating expenses, excluding distribution and/or service fees, interest, taxes, extraordinary expenses, brokerage and transaction costs, and investment-related expenses such as fees and expenses associated with investments in investment companies and other similar investment vehicles such that fund operating expenses do not exceed 0.20% annually of the fund’s average daily net assets. This written agreement will continue until modified by the fund’s Board of Trustees, but such agreement will continue at least until April 30, 2021. For the year ended December 31, 2019, the fund’s actual operating expenses did not exceed the limit and therefore, the investment adviser did not pay any portion of the fund’s expenses related to this agreement.
In addition to the fees and expenses which the fund bears directly, the fund indirectly bears a pro rata share of the fees and expenses of the underlying funds in which the fund invests. Accordingly, the expense ratio for the fund reflects only those fees and expenses borne directly by the fund.
Distributor– MFS Fund Distributors, Inc. (MFD), a wholly-owned subsidiary of MFS, is the distributor of shares of the fund. The Trustees have adopted a distribution plan for the Service Class shares pursuant to Rule12b-1 under the Investment Company Act of 1940.
The fund’s distribution plan provides that the fund will pay MFD distribution and/or service fees equal to 0.25% per annum of its average daily net assets attributable to Service Class shares as partial consideration for services performed and expenses incurred by MFD and financial intermediaries (including participating insurance companies that invest in the fund to fund variable annuity and variable life insurance contracts, sponsors of qualified retirement and pension plans that invest in the fund, and affiliates of these participating insurance companies and plan sponsors) in connection with the sale and distribution of the Service Class shares. MFD may subsequently pay all, or a portion, of the distribution and/or service fees to financial intermediaries.
Shareholder Servicing Agent– MFS Service Center, Inc. (MFSC), a wholly-owned subsidiary of MFS, receives a fee from the fund for its services as shareholder servicing agent. For the year ended December 31, 2019, the fee was $4,320, which equated to 0.0010% annually of the fund’s average daily net assets. MFSC also receives payment from the fund forout-of-pocket expenses paid by MFSC on behalf of the fund. For the year ended December 31, 2019, these costs amounted to $100.
Administrator– MFS provides certain financial, legal, shareholder communications, compliance, and other administrative services to the fund. Under an administrative services agreement, the fund reimburses MFS the costs incurred to provide these services. The fund pays an annual fixed amount of $17,500. The administrative services fee incurred for the year ended December 31, 2019 was equivalent to an annual effective rate of 0.0039% of the fund’s average daily net assets.
Trustees’ and Officers’ Compensation– The fund pays compensation to independent Trustees in the form of a retainer, attendance fees, and additional compensation to Board and Committee chairpersons. The fund does not pay compensation directly to Trustees or officers of the fund who are also officers of the investment adviser, all of whom receive remuneration from MFS for their services to the fund. Certain officers and Trustees of the fund are officers or directors of MFS, MFD, and MFSC.
Other– This fund and certain other funds managed by MFS (the funds) had entered into a service agreement (the ISO Agreement) which provided for payment of fees solely by the funds to Tarantino LLC in return for the provision of services of an Independent Senior Officer (ISO) for the funds. Frank L. Tarantino served as the ISO and was an officer of the funds and the sole member of Tarantino LLC. Effective June 30, 2019, Mr. Tarantino retired from his position as ISO for the funds, and the ISO Agreement was terminated. For the year ended December 31, 2019, the fee paid by the fund under this agreement was $533 and is included in “Miscellaneous” expense in the Statement of Operations. MFS had agreed to bear all expenses associated with office space, other administrative support, and supplies provided to the ISO.
The fund invests in the MFS Institutional Money Market Portfolio which is managed by MFS and seeks current income consistent with preservation of capital and liquidity. This money market fund does not pay a management fee to MFS.
For the year ended December 31, 2019, purchases and sales of shares of underlying funds, excluding the MFS Institutional Money Market Portfolio, aggregated $10,735,930 and $90,490,087, respectively.
17
MFS Conservative Allocation Portfolio
Notes to Financial Statements – continued
| (5) | | Shares of Beneficial Interest |
The fund’s Declaration of Trust permits the Trustees to issue an unlimited number of full and fractional shares of beneficial interest. Transactions in fund shares were as follows:
| | | | | | | | | | | | | | | | |
| | | Year ended 12/31/19 | | | Year ended 12/31/18 | |
| | | | |
| | | Shares | | | Amount | | | Shares | | | Amount | |
| Shares sold | | | | | | | | | | | | | | | | |
Initial Class | | | 2,446 | | | | $28,344 | | | | 4,750 | | | | $54,877 | |
Service Class | | | 478,870 | | | | 5,577,424 | | | | 368,488 | | | | 4,244,692 | |
| | | 481,316 | | | | $5,605,768 | | | | 373,238 | | | | $4,299,569 | |
| | | | |
| Shares issued to shareholders in reinvestment of distributions | | | | | | | | | | | | | | | | |
Initial Class | | | 13,344 | | | | $147,454 | | | | 12,760 | | | | $142,534 | |
Service Class | | | 2,901,616 | | | | 32,207,941 | | | | 2,709,045 | | | | 30,368,394 | |
| | | 2,914,960 | | | | $32,355,395 | | | | 2,721,805 | | | | $30,510,928 | |
| | | | |
| Shares reacquired | | | | | | | | | | | | | | | | |
Initial Class | | | (33,251 | ) | | | $(360,901 | ) | | | (24,024 | ) | | | $(272,696 | ) |
Service Class | | | (7,379,617 | ) | | | (83,769,824 | ) | | | (8,825,257 | ) | | | (100,765,902 | ) |
| | | (7,412,868 | ) | | | $(84,130,725 | ) | | | (8,849,281 | ) | | | $(101,038,598 | ) |
| | | | |
| Net change | | | | | | | | | | | | | | | | |
Initial Class | | | (17,461 | ) | | | $(185,103 | ) | | | (6,514 | ) | | | $(75,285 | ) |
Service Class | | | (3,999,131 | ) | | | (45,984,459 | ) | | | (5,747,724 | ) | | | (66,152,816 | ) |
| | | (4,016,592 | ) | | | $(46,169,562 | ) | | | (5,754,238 | ) | | | $(66,228,101 | ) |
The fund and certain other funds managed by MFS participate in a $1.25 billion unsecured committed line of credit, subject to a $1 billion sublimit, provided by a syndicate of banks under a credit agreement. Borrowings may be made for temporary financing needs. Interest is charged to each fund, based on its borrowings, generally at a rate equal to the highest of one month LIBOR, the Federal Funds Effective Rate and the Overnight Bank Funding Rate, plus an agreed upon spread. A commitment fee, based on the average daily, unused portion of the committed line of credit, is allocated among the participating funds. In addition, the fund and other funds managed by MFS have established unsecured uncommitted borrowing arrangements with certain banks for temporary financing needs. Interest is charged to each fund, based on its borrowings, at rates equal to customary reference rates plus an agreed upon spread. For the year ended December 31, 2019, the fund’s commitment fee and interest expense were $2,461 and $0, respectively, and are included in “Miscellaneous” expense in the Statement of Operations.
18
MFS Conservative Allocation Portfolio
Notes to Financial Statements – continued
| (7) | | Investments in Affiliated Issuers |
An affiliated issuer may be considered one in which the fund owns 5% or more of the outstanding voting securities, or a company which is under common control. For the purposes of this report, the following were affiliated issuers:
| | | | | | | | | | | | | | | | | | | | | | | | |
| Affiliated Issuers | | Beginning
Value | | | Purchases | | | Sales
Proceeds | | | Realized
Gain (Loss) | | | Change in
Unrealized
Appreciation or
Depreciation | | | Ending Value | |
| MFS Global Governments Portfolio | | | $37,064,117 | | | | $1,348,012 | | | | $5,034,784 | | | | $(188,422 | ) | | | $1,495,235 | | | | $34,684,158 | |
| MFS Global Real Estate Portfolio | | | 8,774,121 | | | | 545,262 | | | | 2,369,479 | | | | 362,348 | | | | 1,400,623 | | | | 8,712,875 | |
| MFS Government Securities Portfolio | | | 46,065,959 | | | | 1,753,597 | | | | 6,083,658 | | | | (537,609 | ) | | | 2,074,195 | | | | 43,272,484 | |
| MFS Growth Series | | | 24,981,612 | | | | 3,591,847 | | | | 8,992,954 | | | | 2,757,119 | | | | 3,701,673 | | | | 26,039,297 | |
| MFS High Yield Portfolio | | | 22,389,339 | | | | 1,294,081 | | | | 3,829,760 | | | | (335,502 | ) | | | 2,166,254 | | | | 21,684,412 | |
| MFS Inflation-Adjusted Bond Portfolio | | | 45,562,924 | | | | 1,142,307 | | | | 6,279,403 | | | | 71,360 | | | | 2,820,654 | | | | 43,317,842 | |
| MFS Institutional Money Market Portfolio | | | 1,646,963 | | | | 1,655,855 | | | | 1,633,218 | | | | 10 | | | | 135 | | | | 1,669,745 | |
| MFS International Growth Portfolio | | | 8,656,994 | | | | 1,370,711 | | | | 2,436,407 | | | | 142,166 | | | | 946,846 | | | | 8,680,310 | |
| MFS International Intrinsic Value Portfolio | | | 8,708,429 | | | | 690,345 | | | | 2,367,615 | | | | 680,663 | | | | 961,817 | | | | 8,673,639 | |
| MFS Limited Maturity Portfolio | | | 54,697,894 | | | | 1,880,486 | | | | 5,817,065 | | | | 22,716 | | | | 1,257,250 | | | | 52,041,281 | |
| MFS Mid Cap Growth Series | | | 16,630,678 | | | | 3,253,582 | | | | 6,173,834 | | | | 700,416 | | | | 2,957,772 | | | | 17,368,614 | |
| MFS Mid Cap Value Portfolio | | | 16,618,320 | | | | 2,798,792 | | | | 5,140,034 | | | | 62,525 | | | | 3,044,107 | | | | 17,383,710 | |
| MFS New Discovery Series | | | 4,023,375 | | | | 1,140,234 | | | | 1,629,548 | | | | 128,594 | | | | 665,554 | | | | 4,328,209 | |
| MFS New Discovery Value Portfolio | | | 4,073,567 | | | | 1,078,273 | | | | 1,355,672 | | | | (67,957 | ) | | | 614,005 | | | | 4,342,216 | |
| MFS Research International Portfolio | | | 16,923,707 | | | | 1,813,996 | | | | 4,787,669 | | | | 541,959 | | | | 2,865,625 | | | | 17,357,618 | |
| MFS Research Series | | | 25,210,129 | | | | 4,229,640 | | | | 8,179,264 | | | | 728,993 | | | | 4,055,650 | | | | 26,045,148 | |
| MFS Total Return Bond Series | | | 77,896,999 | | | | 3,062,821 | | | | 12,241,649 | | | | (294,364 | ) | | | 5,202,795 | | | | 73,626,602 | |
| MFS Value Series | | | 25,181,234 | | | | 3,362,448 | | | | 7,771,292 | | | | 1,251,891 | | | | 4,031,710 | | | | 26,055,991 | |
| | | $445,106,361 | | | | $36,012,289 | | | | $92,123,305 | | | | $6,026,906 | | | | $40,261,900 | | | | $435,284,151 | |
| | | | | | |
| Affiliated Issuers | | | | | | | | | | | | | | Dividend
Income | | | Capital Gain
Distributions | |
| MFS Global Governments Portfolio | | | | | | | | | | | | | | | | | | | $860,918 | | | | $— | |
| MFS Global Real Estate Portfolio | | | | | | | | | | | | | | | | | | | 329,378 | | | | 57,948 | |
| MFS Government Securities Portfolio | | | | | | | | | | | | | | | | | | | 1,329,953 | | | | — | |
| MFS Growth Series | | | | | | | | | | | | | | | | | | | — | | | | 2,271,983 | |
| MFS High Yield Portfolio | | | | | | | | | | | | | | | | | | | 1,268,279 | | | | — | |
| MFS Inflation-Adjusted Bond Portfolio | | | | | | | | | | | | | | | | | | | 745,885 | | | | — | |
| MFS Institutional Money Market Portfolio | | | | | | | | | | | | | | | | | | | 37,018 | | | | — | |
| MFS International Growth Portfolio | | | | | | | | | | | | | | | | | | | 122,944 | | | | 962,267 | |
| MFS International Intrinsic Value Portfolio | | | | | | | | | | | | | | | | | | | 175,336 | | | | 262,215 | |
| MFS Limited Maturity Portfolio | | | | | | | | | | | | | | | | | | | 1,440,934 | | | | — | |
| MFS Mid Cap Growth Series | | | | | | | | | | | | | | | | | | | 156,825 | | | | 2,097,859 | |
| MFS Mid Cap Value Portfolio | | | | | | | | | | | | | | | | | | | 359,291 | | | | 1,406,464 | |
| MFS New Discovery Series | | | | | | | | | | | | | | | | | | | 261,941 | | | | 516,191 | |
| MFS New Discovery Value Portfolio | | | | | | | | | | | | | | | | | | | 184,013 | | | | 569,098 | |
| MFS Research International Portfolio | | | | | | | | | | | | | | | | | | | 265,378 | | | | 759,128 | |
| MFS Research Series | | | | | | | | | | | | | | | | | | | 359,563 | | | | 2,543,657 | |
| MFS Total Return Bond Series | | | | | | | | | | | | | | | | | | | 2,554,430 | | | | — | |
| MFS Value Series | | | | | | | | | | | | | | | | | | | 568,643 | | | | 1,189,983 | |
| | | | | | | | | | | | | | | | | | | $11,020,729 | | | | $12,636,793 | |
19
MFS Conservative Allocation Portfolio
REPORT OF INDEPENDENT REGISTERED PUBLIC ACCOUNTING FIRM
To the Board of Trustees of MFS Variable Insurance Trust III and the Shareholders of
MFS Conservative Allocation Portfolio:
Opinion on the Financial Statements and Financial Highlights
We have audited the accompanying statement of assets and liabilities of MFS Conservative Allocation Portfolio (the “Fund”), including the portfolio of investments, as of December 31, 2019, the related statement of operations for the year then ended, the statements of changes in net assets for each of the two years in the period then ended, the financial highlights for each of the five years in the period then ended, and the related notes. In our opinion, the financial statements and financial highlights present fairly, in all material respects, the financial position of the Fund as of December 31, 2019, and the results of its operations for the year then ended, the changes in its net assets for each of the two years in the period then ended, and the financial highlights for each of the five years in the period then ended, in conformity with accounting principles generally accepted in the United States of America.
Basis for Opinion
These financial statements and financial highlights are the responsibility of the Fund’s management. Our responsibility is to express an opinion on the Fund’s financial statements and financial highlights based on our audits. We are a public accounting firm registered with the Public Company Accounting Oversight Board (United States) (PCAOB) and are required to be independent with respect to the Fund in accordance with the U.S. federal securities laws and the applicable rules and regulations of the Securities and Exchange Commission and the PCAOB.
We conducted our audits in accordance with the standards of the PCAOB. Those standards require that we plan and perform the audit to obtain reasonable assurance about whether the financial statements and financial highlights are free of material misstatement, whether due to error or fraud. The Fund is not required to have, nor were we engaged to perform, an audit of its internal control over financial reporting. As part of our audits we are required to obtain an understanding of internal control over financial reporting but not for the purpose of expressing an opinion on the effectiveness of the Fund’s internal control over financial reporting. Accordingly, we express no such opinion.
Our audits included performing procedures to assess the risks of material misstatement of the financial statements and financial highlights, whether due to error or fraud, and performing procedures that respond to those risks. Such procedures included examining, on a test basis, evidence regarding the amounts and disclosures in the financial statements and financial highlights. Our audits also included evaluating the accounting principles used and significant estimates made by management, as well as evaluating the overall presentation of the financial statements and financial highlights. Our procedures included confirmation of securities owned as of December 31, 2019, by correspondence with the transfer agent. We believe that our audits provide a reasonable basis for our opinion.
DELOITTE & TOUCHE LLP
Boston, Massachusetts
February 14, 2020
We have served as the auditor of one or more of the MFS investment companies since 1924.
20
MFS Conservative Allocation Portfolio
TRUSTEES AND OFFICERS – IDENTIFICATION AND BACKGROUND
The Trustees and Officers of the Trust, as of February 1, 2020, are listed below, together with their principal occupations during the past five years. (Their titles may have varied during that period.) The address of each Trustee and Officer is 111 Huntington Avenue, Boston, Massachusetts 02199-7618.
| | | | | | | | | | |
Name, Age | | Position(s)
Held with Fund | | Trustee/Officer
Since (h) | | Number of MFS Funds
overseen by the
Trustee | | Principal Occupations
During the Past Five Years | | Other Directorships During the Past Five Years (j) |
| INTERESTED TRUSTEES |
Robert J. Manning (k)
(age 56) | | Trustee | | February 2004 | | 133 | | Massachusetts Financial Services Company, Executive Chairman (since January 2017); Director; Chairman of the Board; Chief Executive Officer (until 2015);Co-Chief Executive Officer(2015-2016) | | N/A |
| | | | | |
Robin A. Stelmach (k) (age 58) | | Trustee | | January 2014 | | 133 | | Massachusetts Financial Services Company, Vice Chair (since January 2017); Chief Operating Officer and Executive Vice President (until January 2017) | | N/A |
|
| INDEPENDENT TRUSTEES |
John P. Kavanaugh (age 65) | | Trustee and Chair of Trustees | | January 2009 | | 133 | | Private investor | | N/A |
| | | | | |
Steven E. Buller (age 68) | | Trustee | | February 2014 | | 133 | | Financial Accounting Standards Advisory Council, Chairman(2014-2015); Public Company Accounting Oversight Board, Standing Advisory Group, Member (until 2014); BlackRock, Inc. (investment management), Managing Director (until 2014), BlackRock Finco UK (investment management), Director (until 2014) | | N/A |
| | | | | |
John A. Caroselli (age 65) | | Trustee | | March 2017 | | 133 | | JC Global Advisors, LLC (management consulting), President (since 2015); First Capital Corporation (commercial finance), Executive Vice President (until 2015) | | N/A |
| | | | | |
Maureen R. Goldfarb (age 64) | | Trustee | | January 2009 | | 133 | | Private investor | | N/A |
| | | | | |
Peter D. Jones
(age 64) | | Trustee | | January 2019 | | 133 | | Franklin Templeton Distributors, Inc. (investment management), President (until 2015); Franklin Templeton Institutional, LLC (investment management), Chairman (until 2015) | | N/A |
| | | | | |
James W. Kilman, Jr.
(age 58) | | Trustee | | January 2019 | | 133 | | Burford Capital Limited (finance and investment management), Chief Financial Officer (since 2019); KielStrand Capital LLC (family office), Chief Executive Officer (since 2016); Morgan Stanley & Co. (financial services), Vice Chairman of Investment Banking,Co-Head of Diversified Financials Coverage – Financial Institutions Investment Banking Group (until 2016) | | Alpha-En Corporation, Director (2016-2019) |
21
MFS Conservative Allocation Portfolio
Trustees and Officers – continued
| | | | | | | | | | |
Name, Age | | Position(s)
Held with Fund | | Trustee/Officer
Since (h) | | Number of MFS Funds
overseen by the
Trustee | | Principal Occupations
During the Past Five Years | | Other Directorships During the Past Five Years (j) |
Clarence Otis, Jr. (age 63) | | Trustee | | March 2017 | | 133 | | Darden Restaurants, Inc., Chief Executive Officer (until 2014) | | VF Corporation, Director; Verizon Communications, Inc., Director; The Travelers Companies, Director; Federal Reserve Bank of Atlanta, Director (until 2015) |
| | | | | |
Maryanne L. Roepke (age 63) | | Trustee | | May 2014 | | 133 | | American Century Investments (investment management), Senior Vice President and Chief Compliance Officer (until 2014) | | N/A |
| | | | | |
Laurie J. Thomsen
(age 62) | | Trustee | | March 2005 | | 133 | | Private investor | | The Travelers Companies, Director; Dycom Industries, Inc., Director (since 2015) |
| | | | | | | | |
Name, Age | | Position(s)
Held with Fund | | Trustee/Officer
Since (h) | | Number of
MFS Funds
for which the
Person is an
Officer | | Principal Occupations During the Past Five Years |
| OFFICERS | | | | | | |
Christopher R. Bohane (k)
(age 46) | | Assistant Secretary and Assistant Clerk | | July 2005 | | 133 | | Massachusetts Financial Services Company, Vice President and Assistant General Counsel |
| | | | |
Kino Clark (k) (age 51) | | Assistant Treasurer | | January 2012 | | 133 | | Massachusetts Financial Services Company, Vice President |
| | | | |
John W. Clark, Jr. (k) (age 52) | | Assistant Treasurer | | April 2017 | | 133 | | Massachusetts Financial Services Company, Vice President (since March 2017); Deutsche Bank (financial services), Department Head –Treasurer’s Office (until February 2017) |
| | | | |
Thomas H. Connors (k) (age 60) | | Assistant Secretary and Assistant Clerk | | September 2012 | | 133 | | Massachusetts Financial Services Company, Vice President and Senior Counsel |
| | | | |
David L. DiLorenzo (k)
(age 51) | | President | | July 2005 | | 133 | | Massachusetts Financial Services Company, Senior Vice President |
| | | | |
Heidi W. Hardin (k) (age 52) | | Secretary and Clerk | | April 2017 | | 133 | | Massachusetts Financial Services Company, Executive Vice President and General Counsel (since March 2017); Harris Associates (investment management), General Counsel (from September 2015 to January 2017); Janus Capital Management LLC (investment management), Senior Vice President and General Counsel (until September 2015) |
| | | | |
Brian E. Langenfeld (k) (age 46) | | Assistant
Secretary and Assistant Clerk | | June 2006 | | 133 | | Massachusetts Financial Services Company, Vice President and Senior Counsel |
| | | | |
Amanda S. Mooradian (k) (age 40) | | Assistant
Secretary and Assistant Clerk | | September 2018 | | 133 | | Massachusetts Financial Services Company, Assistant Vice President and Counsel |
| | | | |
Susan A. Pereira (k)
(age 49) | | Assistant
Secretary and Assistant Clerk | | July 2005 | | 133 | | Massachusetts Financial Services Company, Vice President and Assistant General Counsel |
| | | | |
Kasey L. Phillips (k) (age 49) | | Assistant Treasurer | | September 2012 | | 133 | | Massachusetts Financial Services Company, Vice President |
| | | | |
Matthew A. Stowe (k) (age 45) | | Assistant Secretary and Assistant Clerk | | October 2014 | | 133 | | Massachusetts Financial Services Company, Vice President and Assistant General Counsel |
22
MFS Conservative Allocation Portfolio
Trustees and Officers – continued
| | | | | | | | |
Name, Age | | Position(s)
Held with Fund | | Trustee/Officer
Since (h) | | Number of
MFS Funds
for which the
Person is an
Officer | | Principal Occupations During the Past Five Years |
Martin J. Wolin (k) (age 52) | | Chief Compliance Officer | | July 2015 | | 133 | | Massachusetts Financial Services Company, Senior Vice President and Chief Compliance Officer (since July 2015); Mercer (financial service provider), Chief Risk and Compliance Officer, North America and Latin America (until June 2015) |
| | | | |
James O. Yost (k)
(age 59) | | Treasurer | | September 1990 | | 133 | | Massachusetts Financial Services Company, Senior Vice President |
| (h) | Date first appointed to serve as Trustee/officer of an MFS Fund. Each Trustee has served continuously since appointment unless indicated otherwise. For the period from December 15, 2004 until February 22, 2005, Mr. Manning served as Advisory Trustee. From January 2012 through December 2016, Messrs. DiLorenzo and Yost served as Treasurer and Deputy Treasurer of the Funds, respectively. |
| (j) | Directorships or trusteeships of companies required to report to the Securities and Exchange Commission (i.e., “public companies”). |
| (k) | “Interested person” of the Trust within the meaning of the Investment Company Act of 1940 (referred to as the 1940 Act), which is the principal federal law governing investment companies like the fund, as a result of a position with MFS. The address of MFS is 111 Huntington Avenue, Boston, Massachusetts 02199-7618. |
Each Trustee (other than Messrs. Jones and Kilman) has been elected by shareholders and each Trustee and Officer holds office until his or her successor is chosen and qualified or until his or her earlier death, resignation, retirement or removal. Messrs. Jones and Kilman became Trustees of the Funds on January 1, 2019. The Trust does not hold annual meetings for the purpose of electing Trustees, and Trustees are not elected for fixed terms. Under the terms of the Board’s retirement policy, an Independent Trustee shall retire at the end of the calendar year in which he or she reaches the earlier of 75 years of age or 15 years of service on the Board (or, in the case of any Independent Trustee who joined the Board prior to 2015, 20 years of service on the Board).
Messrs. Buller, Kilman and Otis and Ms. Roepke are members of the Trust’s Audit Committee.
Each of the Interested Trustees and certain Officers hold comparable officer positions with certain affiliates of MFS.
The Statement of Additional Information for a Fund includes further information about the Trustees and is available without charge upon request by calling1-800-225-2606.
| | |
Investment Adviser Massachusetts Financial Services Company 111 Huntington Avenue Boston, MA 02199-7618 | | Custodian State Street Bank and Trust Company 1 Lincoln Street Boston, MA 02111-2900 |
| |
Distributor MFS Fund Distributors, Inc. 111 Huntington Avenue Boston, MA 02199-7618 | | Independent Registered Public Accounting Firm Deloitte & Touche LLP 200 Berkeley Street Boston, MA 02116 |
| |
Portfolio Manager(s) Joseph Flaherty Natalie Shapiro | | |
23
MFS Conservative Allocation Portfolio
BOARD REVIEW OF INVESTMENT ADVISORY AGREEMENT
MFS Conservative Allocation Portfolio
The Investment Company Act of 1940 requires that both the full Board of Trustees and a majority of thenon-interested (“independent”) Trustees, voting separately, annually approve the continuation of the Fund’s investment advisory agreement with MFS. The Trustees consider matters bearing on the Fund and its advisory arrangements at their meetings throughout the year, including a review of performance data at each regular meeting. In addition, the independent Trustees met several times over the course of three months beginning in May and ending in July, 2019 (“contract review meetings”) for the specific purpose of considering whether to approve the continuation of the investment advisory agreement for the Fund and the other investment companies that the Board oversees (the “MFS Funds”). The independent Trustees were assisted in their evaluation of the Fund’s investment advisory agreement by independent legal counsel, from whom they received separate legal advice and with whom they met separately from MFS during various contract review meetings. The independent Trustees were also assisted in this process by the MFS Funds’ Independent Senior Officer, a senior officer appointed by and reporting to the independent Trustees.
In connection with their deliberations regarding the continuation of the investment advisory agreement, the Trustees, including the independent Trustees, considered such information and factors as they believed, in light of the legal advice furnished to them and their own business judgment, to be relevant. The investment advisory agreement for the Fund was considered separately, although the Trustees also took into account the common interests of all MFS Funds in their review. As described below, the Trustees considered the nature, quality, and extent of the various investment advisory, administrative, and shareholder services performed by MFS under the existing investment advisory agreement and other arrangements with the Fund.
In connection with their contract review meetings, the Trustees received and relied upon materials that included, among other items: (i) information provided by Broadridge Financial Solutions, Inc. (“Broadridge”), an independent third party, on the investment performance of the Fund for various time periods ended December 31, 2018 and the investment performance of a group of funds with substantially similar investment classifications/objectives (the “Broadridge performance universe”), (ii) information provided by Broadridge on the Fund’s fees and expenses and the fees and expenses of comparable funds identified by Broadridge as well as all other funds in the same investment classification/category (the “Broadridge expense group and universe”), (iii) information as to whether and to what extent applicable expense waivers and reimbursements are observed for the Fund, (iv) information regarding MFS’ financial results and financial condition, including MFS’ and certain of its affiliates’ estimated profitability from services performed for the Fund and the MFS Funds as a whole, and compared to MFS’ institutional business, (v) MFS’ views regarding the outlook for the mutual fund industry and the strategic business plans of MFS, (vi) descriptions of various functions performed by MFS for the Funds, such as compliance monitoring and portfolio trading practices, and (vii) information regarding the overall organization of MFS, including information about MFS’ senior management and other personnel providing investment advisory, administrative and other services to the Fund and the other MFS Funds. The comparative performance, fee and expense information prepared and provided by Broadridge was not independently verified and the independent Trustees did not independently verify any information provided to them by MFS.
The Trustees’ conclusion as to the continuation of the investment advisory agreement was based on a comprehensive consideration of all information provided to the Trustees and not the result of any single factor. Some of the factors that figured particularly in the Trustees’ deliberations are described below, although individual Trustees may have evaluated the information presented differently from one another, giving different weights to various factors. It is also important to recognize that the fee arrangements for the Fund and other MFS Funds are the result of years of review and discussion between the independent Trustees and MFS, that certain aspects of such arrangements may receive greater scrutiny in some years than in others, and that the Trustees’ conclusions may be based, in part, on their consideration of these same arrangements during the course of the year and in prior years.
Based on information provided by Broadridge and MFS, the Trustees reviewed the Fund’s total return investment performance as well as the Broadridge performance universe over various time periods. The Trustees placed particular emphasis on the total return performance of the Fund’s Initial Class shares in comparison to the performance of funds in its Broadridge performance universe over the five-year period ended December 31, 2018, which the Trustees believed was a long enough period to reflect differing market conditions. The total return performance of the Fund’s Initial Class shares was in the 1st quintile relative to the other funds in the universe for this five-year period (the 1st quintile being the best performers and the 5th quintile being the worst performers). The total return performance of the Fund’s Initial Class shares was in the 3rd quintile for theone-year period and the 1st quintile for the three-year period ended December 31, 2018 relative to the Broadridge performance universe. Because of the passage of time, these performance results may differ from the performance results for more recent periods, including those shown elsewhere in this report.
In the course of their deliberations, the Trustees took into account information provided by MFS in connection with the contract review meetings, as well as during investment review meetings conducted with portfolio management personnel during the course of the year regarding the Fund’s performance. After reviewing these and related factors, the Trustees concluded, within the context of their overall conclusions regarding the investment advisory agreement, that they were satisfied with MFS’ responses and efforts relating to investment performance.
24
MFS Conservative Allocation Portfolio
Board Review of Investment Advisory Agreement – continued
The Trustees considered that MFS does not charge an advisory fee for providing investment advisory services to the Fund, but that the Fund pays its pro rata share of the advisory fees paid by the underlying funds in which it invests (the “Underlying Funds”).
In assessing the reasonableness of the Fund’s expenses, the Trustees considered, among other information, the Fund’s total expense ratio of the Fund’s Initial Class shares as a percentage of average daily net assets and the total expense ratios of the Broadridge expense group based on information provided by Broadridge. The Trustees considered that MFS currently observes an expense limitation for the Fund, which may not be changed without the Trustees’ approval. The Trustees also considered that, according to the data provided by Broadridge (which takes into account any expense limitations that were in effect during the Fund’s last fiscal year), the Fund’s total expense ratio was lower than the Broadridge expense group median. Because the Fund does not pay an advisory fee, the Trustees did not consider the extent to which economies of scale would be realized due to the Fund’s growth of assets, whether fee levels reflect economies of scale for shareholders, or the fees paid by similar funds to other investment advisers or by similar clients of MFS.
The Trustees also considered information prepared by MFS relating to MFS’ costs and profits with respect to the Fund, the MFS Funds considered as a group, and other investment companies and accounts advised by MFS, as well as MFS’ methodologies used to determine and allocate its costs to the MFS Funds, the Fund and other accounts and products for purposes of estimating profitability.
In addition, the Trustees considered MFS’ resources and related efforts to continue to retain, attract and motivate capable personnel to serve the Fund. The Trustees also considered current and developing conditions in the financial services industry, including the presence of large and well-capitalized companies which are spending, and appear to be prepared to continue to spend, substantial sums to engage personnel and to provide services to competing investment companies. In this regard, the Trustees also considered the financial resources of MFS and its ultimate parent, Sun Life Financial Inc. The Trustees also considered the advantages and possible disadvantages to the Fund of having an adviser that also serves other investment companies as well as other accounts.
The Trustees also considered the nature, quality, cost, and extent of administrative, transfer agency, and distribution services provided to the Fund by MFS and its affiliates under agreements and plans other than the investment advisory agreement, including any12b-1 fees the Fund pays to MFS Fund Distributors, Inc., an affiliate of MFS. The Trustees also considered the nature, extent and quality of certain other services MFS performs or arranges for on the Fund’s or the Underlying Funds’ behalf, which may include securities lending programs, directed expense payment programs, class action recovery programs, and MFS’ interaction with third-party service providers, principally custodians andsub-custodians. The Trustees concluded that the variousnon-advisory services provided by MFS and its affiliates on behalf of the Fund were satisfactory.
The Trustees consideredso-called“fall-out benefits” to MFS such as reputational value derived from serving as investment manager to the MFS Funds. The Trustees also considered that, effective January 3, 2018, MFS had discontinued its historic practice of obtaining investment research from portfolio brokerage commissions paid by certain MFS Funds and would thereafter directly pay for or voluntarily reimburse a Fund, if applicable, for the costs of external research acquired through the use of the Fund’s portfolio brokerage commissions.
Based on their evaluation of factors that they deemed to be material, including those factors described above, the Board of Trustees, including the independent Trustees, concluded that the Fund’s investment advisory agreement with MFS should be continued for an additionalone-year period, commencing August 1, 2019.
25
MFS Conservative Allocation Portfolio
PROXY VOTING POLICIES AND INFORMATION
MFS votes proxies on behalf of the fund pursuant to proxy voting policies and procedures that are available without charge, upon request, by calling 1-800-225-2606, by visitingmfs.com/proxyvoting, or by visiting the SEC’s Web site athttp://www.sec.gov.
Information regarding how the fund voted proxies relating to portfolio securities during the most recent twelve-month period ended June 30 is available by August 31 of each year without charge by visitingmfs.com/proxyvoting, or by visiting the SEC’s Web site athttp://www.sec.gov.
QUARTERLY PORTFOLIO DISCLOSURE
The fund files a complete schedule of portfolio holdings with the SEC for the first and third quarters of each fiscal year as an exhibit to its reports on Form N-PORT. The fund’s Form N-PORT reports are available on the SEC’s website athttp://www.sec.gov. A shareholder can obtain the portfolio holdings report for the first and third quarters of the fund’s fiscal year atmfs.com/vit3 by choosing the fund’s name and then selecting the “Resources” tab and clicking on “Prospectus and Reports”.
FURTHER INFORMATION
From time to time, MFS may post important information about the fund or the MFS funds on the MFS web site (mfs.com). This information is available athttps://www.mfs.com/en-us/what-we-do/announcements.html or at mfs.com/vit3by choosing the fund’s name.
INFORMATION ABOUT FUND CONTRACTS AND LEGAL CLAIMS
The fund has entered into contractual arrangements with an investment adviser, administrator, distributor, shareholder servicing agent, 529 program manager (if applicable), and custodian who each provide services to the fund. Unless expressly stated otherwise, shareholders are not parties to, or intended beneficiaries of these contractual arrangements, and these contractual arrangements are not intended to create any shareholder right to enforce them against the service providers or to seek any remedy under them against the service providers, either directly or on behalf of the fund.
Under the Trust’s By-Laws and Declaration of Trust, any claims asserted against or on behalf of the MFS Funds, including claims against Trustees and Officers, must be brought in state and federal courts located within the Commonwealth of Massachusetts.
FEDERAL TAX INFORMATION (unaudited)
The following information is provided pursuant to provisions of the Internal Revenue Code.
The fund designates $23,982,000 as capital gain dividends paid during the fiscal year.
For corporate shareholders, 13.92% of the ordinary income dividends paid during the fiscal year qualify for the corporate dividends received deduction.
26
rev. 3/16
| | | | |
| | | |
| FACTS | | WHAT DOES MFS DO WITH YOUR
PERSONAL INFORMATION? | |  |
| | |
| Why? | | Financial companies choose how they share your personal information. Federal law gives consumers the right to limit some but not all sharing. Federal law also requires us to tell you how we collect, share, and protect your personal information. Please read this notice carefully to understand what we do. |
| | |
| What? | | The types of personal information we collect and share depend on the product or service you have with us. This information can include: • Social Security number and account balances • Account transactions and transaction history • Checking account information and wire transfer instructions When you areno longer our customer, we continue to share your information as described in this notice. |
| | |
| How? | | All financial companies need to share customers’ personal information to run their everyday business. In the section below, we list the reasons financial companies can share their customers’ personal information; the reasons MFS chooses to share; and whether you can limit this sharing. |
| | | | |
Reasons we can share your
personal information | | Does MFS share? | | Can you limit this
sharing? |
For our everyday business purposes – such as to process your transactions, maintain your account(s), respond to court orders and legal investigations, or report to credit bureaus | | Yes | | No |
For our marketing purposes – to offer our products and services to you | | No | | We don’t share |
| For joint marketing with other financial companies | | No | | We don’t share |
For our affiliates’ everyday business purposes – information about your transactions and experiences | | No | | We don’t share |
For our affiliates’ everyday business purposes – information about your creditworthiness | | No | | We don’t share |
| For nonaffiliates to market to you | | No | | We don’t share |
| | |
| | |
| Questions? | | Call800-225-2606 or go tomfs.com. |
27
| | |
| Who we are |
| Who is providing this notice? | | MFS Funds, MFS Investment Management, MFS Institutional Advisors, Inc., and MFS Heritage Trust Company. |
| | |
| What we do |
| How does MFS protect my personal information? | | To protect your personal information from unauthorized access and use, we use security measures that comply with federal law. These measures include procedural, electronic, and physical safeguards for the protection of the personal information we collect about you. |
How does MFS
collect my personal information? | | We collect your personal information, for example, when you • open an account or provide account information • direct us to buy securities or direct us to sell your securities • make a wire transfer We also collect your personal information from others, such as credit bureaus, affiliates, or other companies. |
| Why can’t I limit all sharing? | | Federal law gives you the right to limit only • sharing for affiliates’ everyday business purposes – information about your creditworthiness • affiliates from using your information to market to you • sharing for nonaffiliates to market to you State laws and individual companies may give you additional rights to limit sharing. |
| | |
| Definitions |
| Affiliates | | Companies related by common ownership or control. They can be financial and nonfinancial companies. • MFS does not share personal information with affiliates, except for everyday business purposes as described on page one of this notice. |
| Nonaffiliates | | Companies not related by common ownership or control. They can be financial and nonfinancial companies. • MFS does not share with nonaffiliates so they can market to you. |
| Joint marketing | | A formal agreement between nonaffiliated financial companies that together market financial products or services to you. • MFS doesn’t jointly market. |
| | |
| Other important information |
| If you own an MFS product or receive an MFS service in the name of a third party such as a bank or broker-dealer, their privacy policy may apply to you instead of ours. |
28
Annual Report
December 31, 2019

MFS® Global Real Estate Portfolio

MFS® Variable Insurance Trust III
Beginning on January 1, 2021, as permitted by regulations adopted by the U.S. Securities and Exchange Commission, the insurance company that offers your contract may determine that it will no longer send you paper copies of the fund’s annual and semiannual shareholder reports unless you specifically request paper copies from the insurance company or from your financial intermediary. Instead, the shareholder reports will be made available on a Web site (insurancefunds.mfs.com or other Web site of which you will be notified), and the insurance company will notify you by mail each time a report is posted and provide you with a Web site link to access the report. Instructions for requesting paper copies will be provided by your insurance company or financial intermediary.
If you already elected to receive shareholder reports by email, you will not be affected by this change and you need not take any action. If your insurance company or financial intermediary offers electronic delivery, you may elect to receive shareholder reports and other communications from the insurance company or financial intermediary by email by following the instructions provided by the insurance company or financial intermediary.
Beginning on January 1, 2019, you may elect to receive all future reports in paper free of charge from the insurance company or financial intermediary. You can inform the insurance company or financial intermediary that you wish to continue receiving paper copies of your shareholder reports by contacting your insurance company or financial intermediary. Your election to receive reports in paper will apply to all funds held in your account with your insurance company or financial intermediary.
VRE-ANN
MFS® Global Real Estate Portfolio
CONTENTS
The report is prepared for the general information of contract owners. It is authorized for distribution to prospective investors only when preceded or accompanied by a current prospectus.
NOT FDIC INSURED• MAY LOSE VALUE• NO BANK OR CREDIT UNION GUARANTEE• NOT A DEPOSIT• NOT INSURED BY ANY FEDERAL GOVERNMENT AGENCY OR NCUA/NCUSIF
MFS Global Real Estate Portfolio
LETTER FROM THE EXECUTIVE CHAIR

Dear Contract Owners:
Slowing global growth, low inflation, and trade friction between the United States and China have been hallmarks of the past 12 months. After experiencing an uptick in market volatility in late 2018, markets steadied for most of 2019, thanks in large measure to the adoption of a dovish policy stance on the part of global central banks, focused on supporting economic growth. Negotiations aimed at a “phase one” trade deal between the U.S. and China bore fruit at the end of the period, boosting investor sentiment, while signs of stability emerging from the global manufacturing sector also lifted spirits. Uncertainty over Brexit, along with the ripple effects from the trade conflict, hampered business confidence and investment in the United Kingdom and Europe for much of the period, though investors expect greater clarity regarding Brexit as a result of December’s general election. The pro-Brexit Conservative Party won the election by a comfortable margin and set the stage for the U.K.’s departure from the EU at the end of January.
Markets expect the longest economic expansion in U.S. history will continue, albeit at a slower pace, as trade tensions recede. In an effort to prolong the expansion, the U.S. Federal Reserve lowered interest rates three times between July and October and the European Central Bank loosened policy in September. While the global monetary policy backdrop remains quite accommodative, signs of easing trade tensions and fading global recession fears led to improved market sentiment in late 2019 as investors grew less risk averse. In early 2020, an outbreak of coronavirus emanating from China reintroduced global growth fears, causing an uptick in volatility.
Here at MFS®, we aim to help our clients navigate the growing complexity of the markets and world economies. Our long-term investment philosophy and commitment to the responsible allocation of capital allow us to tune out the noise and uncover what we believe are the best, most durable investment opportunities in the market. Through our powerful global investment platform, we combine collective expertise, thoughtful risk management and long-term discipline to create sustainable value for investors.
Respectfully,

Robert J. Manning
Executive Chair
MFS Investment Management
February 14, 2020
The opinions expressed in this letter are subject to change and may not be relied upon for investment advice. No forecasts can be guaranteed.
1
MFS Global Real Estate Portfolio
PORTFOLIO COMPOSITION
Portfolio structure
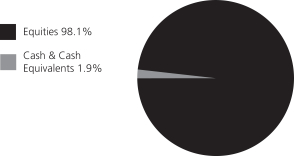
| | | | |
| Top ten holdings | | | | |
| Prologis, Inc., REIT | | | 4.2% | |
| Public Storage, Inc., REIT | | | 4.1% | |
| Link REIT | | | 3.1% | |
| AvalonBay Communities, Inc., REIT | | | 3.1% | |
| Welltower, Inc., REIT | | | 2.8% | |
| Alexandria Real Estate Equities, Inc., REIT | | | 2.8% | |
| Simon Property Group, Inc., REIT | | | 2.8% | |
| Sun Communities, Inc., REIT | | | 2.7% | |
| Mid-America Apartment Communities, Inc., REIT | | | 2.6% | |
| Equity Lifestyle Properties, Inc., REIT | | | 2.6% | |
| |
| GICS equity industries (g) | | | | |
| Real Estate | | | 97.1% | |
| Communication Services | | | 0.7% | |
| Consumer Discretionary | | | 0.3% | |
| | | | |
| Issuer country weightings (x) | | | | |
| United States | | | 51.8% | |
| Japan | | | 10.4% | |
| Hong Kong | | | 6.2% | |
| United Kingdom | | | 6.0% | |
| Australia | | | 5.5% | |
| Singapore | | | 3.8% | |
| Germany | | | 3.6% | |
| Belgium | | | 3.3% | |
| Canada | | | 2.5% | |
| Other Countries | | | 6.9% | |
| |
| Currency exposure weightings (y) | | | | |
| United States Dollar | | | 51.8% | |
| Japanese Yen | | | 10.4% | |
| Euro | | | 8.4% | |
| Hong Kong Dollar | | | 7.0% | |
| British Pound Sterling | | | 6.7% | |
| Australian Dollar | | | 5.5% | |
| Singapore Dollar | | | 3.8% | |
| Canadian Dollar | | | 2.5% | |
| Norwegian Krone | | | 1.5% | |
| Other Currencies | | | 2.4% | |
| (g) | The Global Industry Classification Standard (GICS®) was developed by and/or is the exclusive property of MSCI, Inc. and S&P Global Market Intelligence Inc. (“S&P Global Market Intelligence”). GICS is a service mark of MSCI and S&P Global Market Intelligence and has been licensed for use by MFS. |
| (x) | Represents the portfolio’s exposure to issuer countries as a percentage of a portfolio’s net assets. For purposes of this presentation, United States includes Cash & Cash Equivalents. |
| (y) | Represents the portfolio’s exposure to a particular currency as a percentage of a portfolio’s net assets. For purposes of this presentation, United States Dollar includes Cash & Cash Equivalents. |
Cash & Cash Equivalents includes any cash, investments in money market funds, short-term securities, and other assets less liabilities. Please see the Statement of Assets and Liabilities for additional information related to the fund’s cash position and other assets and liabilities.
Percentages are based on net assets as of December 31, 2019.
The portfolio is actively managed and current holdings may be different.
2
MFS Global Real Estate Portfolio
MANAGEMENT REVIEW
Summary of Results
For the twelve months ended December 31, 2019, Initial Class shares of the MFS Global Real Estate Portfolio (fund) provided a total return of 26.87%, while Service Class shares of the fund provided a total return of 26.68%. These compare with a return of 21.91% over the same period for the fund’s benchmark, the FTSE EPRA Nareit Developed Real Estate Index (net div) (FTSE Index).
Market Environment
Fading fears of a near-term global recession, the announcement of a partial trade deal between the United States and China and the decline in uncertainty over Brexit helped bolster market sentiment late in the period. Changes in market sentiment, largely driven by uncertainty over the outcome of trade negotiations between the US and China, had contributed to periodic bouts of volatility during the reporting period. The global economy decelerated, led by weakness in China and Europe, although the pace of the slowdown moderated late in the period amid nascent signs of stabilization in the manufacturing sector.
The deteriorating global growth backdrop, along with declining inflationary pressures, prompted the US Federal Reserve to adopt a more dovish posture beginning in early 2019, resulting in the first interest rate cut in over a decade at the end of July, followed by additional cuts in September and October. The Fed’s actions led to a sharp decline in long-term interest rates during the period’s second half, causing the inversion of portions of the US Treasury yield curve for a time. Amid an improvement in risk sentiment in Q4 2019 and indications of a bottoming in growth and a potential upturn in activity, the Fed indicated in October that further rate cuts were unlikely unless the outlook for the economy materially worsened.
Globally, central banks have tilted more dovish as well, with the European Central Bank unveiling a package of easing measures, which included putting overnight rates deeper into negative territory, restarting its bond-buying program and lengthening the term of cheap loans to banks to three years from two. The central banks of India and Australia are among those that have cut rates several times in recent months, although China has been more cautious in increasing liquidity as it keeps trying to deleverage its economy, cutting rates only marginally.
Emerging markets experienced considerable volatility through the end of 2018, as tighter global financial conditions exposed structural weakness in some countries. Those conditions improved in 2019 as the Fed became more dovish. Notwithstanding the periodic headwinds on market sentiment from significant trade friction between the US and China over much of the year, emerging market hard currency debt and local rates benefited from relatively cheap valuations at the beginning of the period and easier global monetary conditions. These factors, plus the fading of certain global risk factors mentioned above, hastened spread tightening in the latter part of the period. At the same time, idiosyncratic risks spiked in some countries (e.g., Argentina and Lebanon), contributing to increased dispersion in performance among sovereign assets.
Contributors to Performance
Relative to the FTSE Index, security selection within US real estate investments contributed to the fund’s performance. Here, the fund’s holding of data centers operator Equinix (b) boosted relative performance. The stock price of Equinix climbed as the company reported solid financial results, driven by record bookings in its cloud, information technology and financial divisions. Equinix also noted that it has the highest number of Fortune 500 and Global 2000 prospects in its pipeline, which led the company to increase its 2019 revenue guidance. The fund’s overweight positions in real estate investment trusts Brixmor Property Group,Mid-America Apartment Communities, Sun Communities, Equity Lifestyle Properties and Alexandria Real Estate Equities also aided relative returns.
Elsewhere, the fund’s overweight positions in real estate investment trusts Deutsche Wohnen (Germany), Mapletree Logistics Trust (Singapore) and Big Yellow Group (United Kingdom) supported relative results. The fund’s holding of Ascendas India Trust (b) (Singapore) further benefited relative returns.
Detractors from Performance
Security selection and, to a lesser extent, an underweight position in France-based real estate investments detracted from relative performance, led by the fund’s overweight holding of shopping destination developer Unibail-Rodamco-Westfield.
Stock selection in Japanese real estate investments also held back relative results. Here, the fund’s holding of real estate investment trust Daito Trust Construction (b) was a primary detractor.
Other notable relative detractors during the reporting period included the fund’s overweight positions in storage facility operator Public Storage, property development company Link (Hong Kong), real estate investment trust Fortune (Hong Kong) and Boston Properties (h). The stock price of Public Storage declined, following the company’s lower-than-expected financial results, which were driven by new supply pressure, property tax hikes and elevated marketing costs. The fund’s holding of real estate investment trust National Storage (b) (Australia) also weighed on relative performance. Not owning shares of strong-performing real estate investment
3
MFS Global Real Estate Portfolio
Management Review – continued
trusts, Segro (United Kingdom) and Invitation Homes, further weakened relative returns as both companies outperformed the benchmark during the reporting period. The stock price of Segro advanced as the company posted a trading update for the third quarter that highlighted its favorable forward-looking outlook and the successful development of new real estate space.
Respectfully,
Portfolio Manager(s)
Rick Gable
| (b) | Security is not a benchmark constituent. |
| (h) | Security was not held in the portfolio at period end. |
The views expressed in this report are those of the portfolio manager(s) only through the end of the period of the report as stated on the cover and do not necessarily reflect the views of MFS or any other person in the MFS organization. These views are subject to change at any time based on market or other conditions, and MFS disclaims any responsibility to update such views. These views may not be relied upon as investment advice or an indication of trading intent on behalf of any MFS portfolio. References to specific securities are not recommendations of such securities, and may not be representative of any MFS portfolio’s current or future investments.
4
MFS Global Real Estate Portfolio
PERFORMANCE SUMMARY THROUGH 12/31/19
The following chart illustrates the historical performance of the fund in comparison to its benchmark(s). Benchmarks are unmanaged and may not be invested in directly. Benchmark returns do not reflect any fees or expenses. The performance of other share classes will be greater than or less than that of the class depicted below. (See Notes to Performance Summary.)
Performance data shown represents past performance and is no guarantee of future results. Investment return and principal value fluctuate so your units, when sold, may be worth more or less than the original cost; current performance may be lower or higher than quoted. The performance shown does not reflect the deduction of taxes, if any, that a contract holder would pay on fund distributions or the redemption of contract units. The returns for the fund shown also do not reflect the deduction of expenses associated with variable products, such as mortality and expense risk charges, separate account charges, and sales charges imposed by the insurance company separate accounts. Such expenses would reduce the overall returns shown.
Growth of a Hypothetical $10,000 Investment
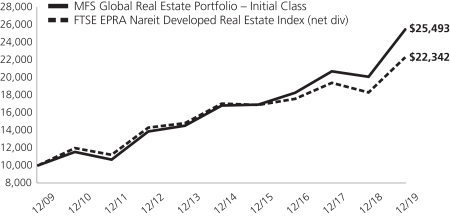
Total Returns through 12/31/19
Average annual total returns
| | | | | | | | | | | | |
| | | Share Class | | Class Inception Date | | 1-yr | | 5-yr | | 10-yr | | |
| | | Initial Class | | 12/07/98 | | 26.87% | | 8.68% | | 9.81% | | |
| | | Service Class | | 2/01/04 | | 26.68% | | 8.42% | | 9.54% | | |
| | | | |
| Comparative benchmark(s) | | | | | | | | |
| | | FTSE EPRA Nareit Developed Real Estate Index (net div) (f) | | 21.91% | | 5.56% | | 8.37% | | |
| (f) | Source: FactSet Research Systems Inc. |
Benchmark Definition(s)
FTSE EPRA Nareit Developed Real Estate Index (net div) – measures the performance of eligible real estate equities worldwide that generate a majority of their revenue and income through the ownership, disposure and development of income-producing real estate. FTSE International Limited (“FTSE”)© FTSE 2019. “FTSE®” is a trademark of the London Stock Exchange Group companies and is used by FTSE International Limited under license. “FT-SE®”, “FOOTSIE®” and “FTSE4GOOD®” are trademarks of the London Stock Exchange Group companies. “Nareit®” is a trademark of the National Association of Real Estate Investment Trusts (“Nareit”) and “EPRA®” is a trademark of the European Public Real Estate Association (“EPRA”) and all are used by FTSE under license. The FTSE EPRA Nareit Developed Real Estate Index is calculated by FTSE. Neither FTSE, Euronext N.V., Nareit, nor EPRA sponsor, endorse, or promote this product and are not in any way connected to it and do not accept any liability. All intellectual property rights in the index values and constituent list vests in FTSE, Euronext N.V., Nareit, and EPRA. Neither FTSE nor its licensors accept any liability for any errors or omissions in the FTSE indices and/or FTSE ratings or underlying data. No further distribution of FTSE Data is permitted without FTSE’s express written consent.
It is not possible to invest directly in an index.
Notes to Performance Summary
Average annual total return represents the average annual change in value for each share class for the periods presented.
5
MFS Global Real Estate Portfolio
Performance Summary – continued
Performance results reflect any applicable expense subsidies and waivers in effect during the periods shown. Without such subsidies and waivers the fund’s performance results would be less favorable. Please see the prospectus and financial statements for complete details. All results are historical and assume the reinvestment of any dividends and capital gains distributions.
Performance results do not include adjustments made for financial reporting purposes in accordance with U.S. generally accepted accounting principles and may differ from amounts reported in the financial highlights.
From time to time the fund may receive proceeds from litigation settlements, without which performance would be lower.
6
MFS Global Real Estate Portfolio
EXPENSE TABLE
Fund Expenses Borne by the Contract Holders during the Period,
July 1, 2019 through December 31, 2019
As a contract holder of the fund, you incur ongoing costs, including management fees; distribution and/or service(12b-1) fees; and other fund expenses. This example is intended to help you understand your ongoing costs (in dollars) of investing in the fund and to compare these costs with the ongoing costs of investing in other mutual funds.
The example is based on an investment of $1,000 invested at the beginning of the period and held for the entire period July 1, 2019 through December 31, 2019.
Actual Expenses
The first line for each share class in the following table provides information about actual account values and actual expenses. You may use the information in this line, together with the amount you invested, to estimate the expenses that you paid over the period. Simply divide your account value by $1,000 (for example, an $8,600 account value divided by $1,000 = 8.6), then multiply the result by the number in the first line under the heading entitled “Expenses Paid During Period” to estimate the expenses you paid on your account during this period.
Hypothetical Example for Comparison Purposes
The second line for each share class in the following table provides information about hypothetical account values and hypothetical expenses based on the fund’s actual expense ratio and an assumed rate of return of 5% per year before expenses, which is not the fund’s actual return. The hypothetical account values and expenses may not be used to estimate the actual ending account balance or expenses you paid for the period. You may use this information to compare the ongoing costs of investing in the fund and other funds. To do so, compare this 5% hypothetical example with the 5% hypothetical examples that appear in the shareholder reports of the other funds.
Please note that the expenses shown in the table are meant to highlight the fund’s ongoing costs only and do not take into account the fees and expenses imposed under the variable contracts through which your investment in the fund is made. Therefore, the second line for each share class in the table is useful in comparing ongoing costs associated with an investment in vehicles (such as the fund) which fund benefits under variable annuity and variable life insurance contracts and to qualified pension and retirement plans only, and will not help you determine the relative total costs of investing in the fund through variable annuity and variable life insurance contracts. If the fees and expenses imposed under the variable contracts were included, your costs would have been higher.
| | | | | | | | | | | | | | | | | | |
| Share Class | | | | Annualized
Expense Ratio | | | Beginning
Account Value
7/01/19 | | | Ending
Account Value
12/31/19 | | | Expenses Paid
During Period (p)
7/01/19-12/31/19 | |
| Initial Class | | Actual | | | 0.92% | | | | $1,000.00 | | | | $1,075.06 | | | | $4.81 | |
| | Hypothetical (h) | | | 0.92% | | | | $1,000.00 | | | | $1,020.57 | | | | $4.69 | |
| Service Class | | Actual | | | 1.17% | | | | $1,000.00 | | | | $1,074.16 | | | | $6.12 | |
| | Hypothetical (h) | | | 1.17% | | | | $1,000.00 | | | | $1,019.31 | | | | $5.96 | |
| (h) | 5% class return per year before expenses. |
| (p) | “Expenses Paid During Period” are equal to each class’s annualized expense ratio, as shown above, multiplied by the average account value over the period, multiplied by 184/365 (to reflect theone-half year period). |
7
MFS Global Real Estate Portfolio
PORTFOLIO OF INVESTMENTS – 12/31/19
The Portfolio of Investments is a complete list of all securities owned by your fund. It is categorized by broad-based asset classes.
| | | | | | | | |
| | |
| Issuer | | Shares/Par | | | Value ($) | |
| COMMON STOCKS – 98.1% | | | | | | | | |
| Construction – 8.5% | | | | | |
| American Homes 4 Rent, “A”, REIT | | | 178,986 | | | $ | 4,691,223 | |
| AvalonBay Communities, Inc., REIT | | | 28,366 | | | | 5,948,350 | |
| Mid-America Apartment Communities, Inc., REIT | | | 38,215 | | | | 5,039,030 | |
| Toll Brothers, Inc. | | | 12,503 | | | | 493,994 | |
| | | | | | | | |
| | | | | | $ | 16,172,597 | |
| | | | | | | | |
| Network & Telecom – 2.2% | | | | | |
| Equinix, Inc., REIT | | | 7,228 | | | $ | 4,218,983 | |
| | | | | | | | |
| Real Estate – 85.3% | | | | | |
| Advance Residence Investment Corp., REIT | | | 1,281 | | | $ | 4,060,732 | |
| Alexandria Real Estate Equities, Inc., REIT | | | 32,832 | | | | 5,304,995 | |
| Ascendas India Trust, REIT | | | 3,064,400 | | | | 3,531,596 | |
| Atrium European Real Estate Ltd. | | | 212,043 | | | | 820,578 | |
| Big Yellow Group PLC, REIT | | | 199,252 | | | | 3,167,150 | |
| Boardwalk REIT | | | 109,344 | | | | 3,867,521 | |
| Brixmor Property Group, Inc., REIT | | | 188,158 | | | | 4,066,094 | |
| Central Pattana PLC, “A” | | | 584,000 | | | | 1,213,671 | |
| Corporacion Inmobiliaria Vesta S.A.B. de C.V. | | | 828,120 | | | | 1,489,149 | |
| Daito Trust Construction Co. Ltd. | | | 28,600 | | | | 3,542,135 | |
| Daiwa House Industry Co. Ltd. | | | 144,000 | | | | 4,461,339 | |
| Deutsche Wohnen SE | | | 98,594 | | | | 4,027,793 | |
| Embassy Office Parks, REIT | | | 324,200 | | | | 1,922,177 | |
| Entra ASA | | | 172,328 | | | | 2,846,190 | |
| Equity Lifestyle Properties, Inc., REIT | | | 69,364 | | | | 4,882,532 | |
| ESR Cayman Ltd. (a) | | | 647,400 | | | | 1,462,244 | |
| Extra Space Storage, Inc., REIT | | | 21,610 | | | | 2,282,448 | |
| Farmland Partners, Inc., REIT | | | 75,826 | | | | 514,100 | |
| Fortune REIT | | | 2,114,000 | | | | 2,466,058 | |
| Goodman Group, REIT | | | 515,442 | | | | 4,836,081 | |
| Grainger PLC | | | 535,279 | | | | 2,220,683 | |
| Granite REIT | | | 18,531 | | | | 941,570 | |
| Hang Lung Properties Ltd. | | | 1,551,944 | | | | 3,405,701 | |
| Industrial Logistics Properties Trust, REIT | | | 82,897 | | | | 1,858,551 | |
| Japan Logistics Fund, Inc., REIT | | | 1,453 | | | | 3,705,548 | |
| Kenedix Office Investment Corp., REIT | | | 537 | | | | 4,148,815 | |
| LEG Immobilien AG | | | 23,204 | | | | 2,747,248 | |
| Link REIT | | | 564,264 | | | | 5,974,074 | |
| LondonMetric Property PLC, REIT | | | 354,925 | | | | 1,112,336 | |
| Mapletree Logistics Trust, REIT | | | 2,925,623 | | | | 3,784,962 | |
| Medical Properties Trust, Inc., REIT | | | 106,311 | | | | 2,244,225 | |
| Mirvac Group, REIT | | | 824,015 | | | | 1,838,843 | |
| National Storage, REIT | | | 2,976,572 | | | | 3,832,965 | |
| Prologis, Inc., REIT | | | 90,116 | | | | 8,032,940 | |
| Public Storage, Inc., REIT | | | 36,621 | | | | 7,798,808 | |
| Rexford Industrial Realty, Inc., REIT | | | 27,831 | | | | 1,271,042 | |
| Shaftesbury PLC, REIT | | | 283,504 | | | | 3,548,752 | |
| | | | | | | | |
| | |
Issuer | | Shares/Par | | | Value ($) | |
| COMMON STOCKS – continued | | | | | | | | |
| Real Estate – continued | | | | | |
| Shurgard Self Storage S.A. | | | 83,894 | | | $ | 3,199,532 | |
| Simon Property Group, Inc., REIT | | | 35,292 | | | | 5,257,096 | |
| STAG Industrial, Inc., REIT | | | 106,432 | | | | 3,360,058 | |
| STORE Capital Corp., REIT | | | 118,929 | | | | 4,428,916 | |
| Sun Communities, Inc., REIT | | | 33,744 | | | | 5,064,974 | |
| Unibail-Rodamco-Westfield, REIT | | | 12,965 | | | | 2,045,450 | |
| Unite Group PLC, REIT | | | 80,690 | | | | 1,346,713 | |
| Urban Edge Properties, REIT | | | 172,793 | | | | 3,314,170 | |
| VICI Properties, Inc., REIT | | | 160,667 | | | | 4,105,042 | |
| W.P. Carey, Inc., REIT | | | 38,392 | | | | 3,072,896 | |
| Warehouses De Pauw S.C.A. (a) | | | 17,012 | | | | 3,095,159 | |
| Welltower, Inc., REIT | | | 66,285 | | | | 5,420,787 | |
| | | | | | | | |
| | | | | | $ | 162,942,439 | |
| | | | | | | | |
| Telecommunications – Wireless – 1.4% | | | | | |
| American Tower Corp., REIT | | | 11,835 | | | $ | 2,719,920 | |
| | | | | | | | |
| Telephone Services – 0.7% | | | | | |
| Helios Tower PLC (a) | | | 647,536 | | | $ | 1,355,207 | |
| | | | | | | | |
Total Common Stocks
(Identified Cost, $139,879,553) | | | | | | $ | 187,409,146 | |
| | | | | | | | |
| |
| INVESTMENT COMPANIES (h) – 1.7% | | | | | |
| Money Market Funds – 1.7% | | | | | |
| MFS Institutional Money Market Portfolio, 1.7% (v) (Identified Cost, $3,254,887) | | | 3,254,887 | | | $ | 3,254,887 | |
| | | | | | | | |
OTHER ASSETS, LESS
LIABILITIES – 0.2% | | | | | | | 374,364 | |
| | | | | | | | |
| NET ASSETS – 100.0% | | | | | | $ | 191,038,397 | |
| | | | | | | | |
| (a) | | Non-income producing security. |
| (h) | | An affiliated issuer, which may be considered one in which the fund owns 5% or more of the outstanding voting securities, or a company which is under common control. At period end, the aggregate values of the fund’s investments in affiliated issuers and in unaffiliated issuers were $3,254,887 and $187,409,146, respectively. |
| (v) | | Affiliated issuer that is available only to investment companies managed by MFS. The rate quoted for the MFS Institutional Money Market Portfolio is the annualizedseven-day yield of the fund at period end. |
The following abbreviations are used in this report and are defined:
| REIT | | Real Estate Investment Trust |
See Notes to Financial Statements
8
MFS Global Real Estate Portfolio
FINANCIAL STATEMENTS | STATEMENT OF ASSETS AND LIABILITIES
This statement represents your fund’s balance sheet, which details the assets and liabilities comprising the total value of the fund.
| | | | |
At 12/31/19 | | | | |
| |
Assets | | | | |
Investments in unaffiliated issuers, at value (identified cost, $139,879,553) | | | $187,409,146 | |
Investments in affiliated issuers, at value (identified cost, $3,254,887) | | | 3,254,887 | |
Foreign currency, at value (identified cost, $5) | | | 5 | |
Receivables for | | | | |
Fund shares sold | | | 25,183 | |
Dividends | | | 620,278 | |
Receivable from investment adviser | | | 2,506 | |
Other assets | | | 1,299 | |
Total assets | | | $191,313,304 | |
| |
Liabilities | | | | |
Payables for | | | | |
Fund shares reacquired | | | $192,373 | |
Payable to affiliates | | | | |
Administrative services fee | | | 191 | |
Shareholder servicing costs | | | 22 | |
Distribution and/or service fees | | | 797 | |
Payable for independent Trustees’ compensation | | | 13 | |
Deferred country tax expense payable | | | 8,967 | |
Accrued expenses and other liabilities | | | 72,544 | |
Total liabilities | | | $274,907 | |
Net assets | | | $191,038,397 | |
| |
Net assets consist of | | | | |
Paid-in capital | | | $139,288,684 | |
Total distributable earnings (loss) | | | 51,749,713 | |
Net assets | | | $191,038,397 | |
Shares of beneficial interest outstanding | | | 11,480,286 | |
| | | | | | | | | | | | |
| | | |
| | | Net assets | | | Shares
outstanding | | | Net asset value
per share | |
Initial Class | | | $132,530,294 | | | | 8,327,550 | | | | $15.91 | |
Service Class | | | 58,508,103 | | | | 3,152,736 | | | | 18.56 | |
See Notes to Financial Statements
9
MFS Global Real Estate Portfolio
FINANCIAL STATEMENTS | STATEMENT OF OPERATIONS
This statement describes how much your fund earned in investment income and accrued in expenses. It also describes any gains and/or losses generated by fund operations.
| | | | |
Year ended 12/31/19 | | | | |
| |
Net investment income (loss) | | | | |
Income | | | | |
Dividends | | | $5,759,540 | |
Dividends from affiliated issuers | | | 38,205 | |
Other | | | 15,129 | |
Foreign taxes withheld | | | (277,746 | ) |
Total investment income | | | $5,535,128 | |
Expenses | | | | |
Management fee | | | $1,540,481 | |
Distribution and/or service fees | | | 145,165 | |
Shareholder servicing costs | | | 5,439 | |
Administrative services fee | | | 33,722 | |
Independent Trustees’ compensation | | | 5,147 | |
Custodian fee | | | 30,091 | |
Shareholder communications | | | 21,937 | |
Audit and tax fees | | | 56,714 | |
Legal fees | | | 1,448 | |
Miscellaneous | | | 33,949 | |
Total expenses | | | $1,874,093 | |
Reduction of expenses by investment adviser | | | (150,495 | ) |
Net expenses | | | $1,723,598 | |
Net investment income (loss) | | | $3,811,530 | |
| |
Realized and unrealized gain (loss) | | | | |
Realized gain (loss) (identified cost basis) | | | | |
Unaffiliated issuers | | | $5,129,854 | |
Affiliated issuers | | | 1,210 | |
Foreign currency | | | (3,905 | ) |
Net realized gain (loss) | | | $5,127,159 | |
Change in unrealized appreciation or depreciation | | | | |
Unaffiliated issuers (net of $8,967 increase in deferred country tax) | | | $30,649,256 | |
Translation of assets and liabilities in foreign currencies | | | 729 | |
Net unrealized gain (loss) | | | $30,649,985 | |
Net realized and unrealized gain (loss) | | | $35,777,144 | |
Change in net assets from operations | | | $39,588,674 | |
See Notes to Financial Statements
10
MFS Global Real Estate Portfolio
FINANCIAL STATEMENTS | STATEMENTS OF CHANGES IN NET ASSETS
These statements describe the increases and/or decreases in net assets resulting from operations, any distributions, and any shareholder transactions.
| | | | | | | | |
| | | Year ended | |
| | | 12/31/19 | | | 12/31/18 | |
Change in net assets | | | | | | | | |
| | |
From operations | | | | | | | | |
Net investment income (loss) | | | $3,811,530 | | | | $4,976,535 | |
Net realized gain (loss) | | | 5,127,159 | | | | 1,499,569 | |
Net unrealized gain (loss) | | | 30,649,985 | | | | (11,199,132 | ) |
Change in net assets from operations | | | $39,588,674 | | | | $(4,723,028 | ) |
Total distributions to shareholders | | | $(6,971,115 | ) | | | $(8,750,189 | ) |
Change in net assets from fund share transactions | | | $5,017,570 | | | | $(17,488,780 | ) |
Total change in net assets | | | $37,635,129 | | | | $(30,961,997 | ) |
| | |
Net assets | | | | | | | | |
At beginning of period | | | 153,403,268 | | | | 184,365,265 | |
At end of period | | | $191,038,397 | | | | $153,403,268 | |
See Notes to Financial Statements
11
MFS Global Real Estate Portfolio
FINANCIAL STATEMENTS | FINANCIAL HIGHLIGHTS
The financial highlights table is intended to help you understand the fund’s financial performance for the past 5 years. Certain information reflects financial results for a single fund share. The total returns in the table represent the rate that an investor would have earned (or lost) on an investment in the fund share class (assuming reinvestment of all distributions) held for the entire period.
| | | | | | | | | | | | | | | | | | | | |
| Initial Class | | Year ended | |
| | | | | |
| | | 12/31/19 | | | 12/31/18 | | | 12/31/17 | | | 12/31/16 | | | 12/31/15 | |
| | | | | |
Net asset value, beginning of period | | | $13.10 | | | | $14.27 | | | | $14.01 | | | | $13.55 | | | | $14.06 | |
| | | | | |
| Income (loss) from investment operations | | | | | | | | | | | | | | | | | | | | |
Net investment income (loss) (d) | | | $0.35 | | | | $0.42 | | | | $0.37 | | | | $0.37 | (c) | | | $0.29 | |
Net realized and unrealized gain (loss) | | | 3.14 | | | | (0.79 | ) | | | 1.42 | | | | 0.74 | | | | (0.23 | ) |
Total from investment operations | | | $3.49 | | | | $(0.37 | ) | | | $1.79 | | | | $1.11 | | | | $0.06 | |
| | | | | |
| Less distributions declared to shareholders | | | | | | | | | | | | | | | | | | | | |
From net investment income | | | $(0.58 | ) | | | $(0.58 | ) | | | $(0.63 | ) | | | $(0.39 | ) | | | $(0.57 | ) |
From net realized gain | | | (0.10 | ) | | | (0.22 | ) | | | (0.90 | ) | | | (0.26 | ) | | | — | |
Total distributions declared to shareholders | | | $(0.68 | ) | | | $(0.80 | ) | | | $(1.53 | ) | | | $(0.65 | ) | | | $(0.57 | ) |
Net asset value, end of period (x) | | | $15.91 | | | | $13.10 | | | | $14.27 | | | | $14.01 | | | | $13.55 | |
Total return (%) (k)(r)(s)(x) | | | 26.87 | | | | (3.03 | ) | | | 13.33 | | | | 7.94 | (c) | | | 0.74 | |
| | | | | |
Ratios (%) (to average net assets)
and Supplemental data: | | | | | | | | | | | | | | | | | | | | |
Expenses before expense reductions (f) | | | 1.01 | | | | 1.01 | | | | 1.00 | | | | 0.97 | (c) | | | 1.00 | |
Expenses after expense reductions (f) | | | 0.92 | | | | 0.92 | | | | 0.92 | | | | 0.91 | (c) | | | 0.94 | |
Net investment income (loss) | | | 2.31 | | | | 3.00 | | | | 2.56 | | | | 2.63 | (c) | | | 2.11 | |
Portfolio turnover | | | 36 | | | | 24 | | | | 24 | | | | 30 | | | | 40 | |
Net assets at end of period (000 omitted) | | | $132,530 | | | | $99,826 | | | | $114,198 | | | | $115,023 | | | | $124,563 | |
| |
| Service Class | | Year ended | |
| | | | | |
| | | 12/31/19 | | | 12/31/18 | | | 12/31/17 | | | 12/31/16 | | | 12/31/15 | |
| | | | | |
Net asset value, beginning of period | | | $15.17 | | | | $16.41 | | | | $15.89 | | | | $15.28 | | | | $15.77 | |
| | | | | |
| Income (loss) from investment operations | | | | | | | | | | | | | | | | | | | | |
Net investment income (loss) (d) | | | $0.36 | | | | $0.44 | | | | $0.38 | | | | $0.38 | (c) | | | $0.29 | |
Net realized and unrealized gain (loss) | | | 3.66 | | | | (0.93 | ) | | | 1.62 | | | | 0.83 | | | | (0.25 | ) |
Total from investment operations | | | $4.02 | | | | $(0.49 | ) | | | $2.00 | | | | $1.21 | | | | $0.04 | |
| | | | | |
| Less distributions declared to shareholders | | | | | | | | | | | | | | | | | | | | |
From net investment income | | | $(0.53 | ) | | | $(0.53 | ) | | | $(0.58 | ) | | | $(0.34 | ) | | | $(0.53 | ) |
From net realized gain | | | (0.10 | ) | | | (0.22 | ) | | | (0.90 | ) | | | (0.26 | ) | | | — | |
Total distributions declared to shareholders | | | $(0.63 | ) | | | $(0.75 | ) | | | $(1.48 | ) | | | $(0.60 | ) | | | $(0.53 | ) |
Net asset value, end of period (x) | | | $18.56 | | | | $15.17 | | | | $16.41 | | | | $15.89 | | | | $15.28 | |
Total return (%) (k)(r)(s)(x) | | | 26.68 | | | | (3.33 | ) | | | 13.07 | | | | 7.70 | (c) | | | 0.47 | |
| | | | | |
Ratios (%) (to average net assets)
and Supplemental data: | | | | | | | | | | | | | | | | | | | | |
Expenses before expense reductions (f) | | | 1.26 | | | | 1.26 | | | | 1.25 | | | | 1.22 | (c) | | | 1.25 | |
Expenses after expense reductions (f) | | | 1.17 | | | | 1.17 | | | | 1.17 | | | | 1.16 | (c) | | | 1.19 | |
Net investment income (loss) | | | 2.07 | | | | 2.74 | | | | 2.31 | | | | 2.37 | (c) | | | 1.84 | |
Portfolio turnover | | | 36 | | | | 24 | | | | 24 | | | | 30 | | | | 40 | |
Net assets at end of period (000 omitted) | | | $58,508 | | | | $53,577 | | | | $70,167 | | | | $75,253 | | | | $83,135 | |
See Notes to Financial Statements
12
MFS Global Real Estate Portfolio
Financial Highlights – continued
| (c) | Amount reflects aone-time reimbursement of expenses by the custodian (or former custodian) without which net investment income and performance would be lower and expenses would be higher. |
| (d) | Per share data is based on average shares outstanding. |
| (f) | Ratios do not reflect reductions from fees paid indirectly, if applicable. |
| (k) | The total return does not reflect expenses that apply to separate accounts. Inclusion of these charges would reduce the total return figures for all periods shown. |
| (r) | Certain expenses have been reduced without which performance would have been lower. |
| (s) | From time to time the fund may receive proceeds from litigation settlements, without which performance would be lower. |
| (x) | The net asset values and total returns have been calculated on net assets which include adjustments made in accordance with U.S. generally accepted accounting principles required at period end for financial reporting purposes. |
See Notes to Financial Statements
13
MFS Global Real Estate Portfolio
NOTES TO FINANCIAL STATEMENTS
| (1) | | Business and Organization |
MFS Global Real Estate Portfolio (the fund) is a diversified series of MFS Variable Insurance Trust III (the trust). The trust is organized as a Delaware statutory trust and is registered under the Investment Company Act of 1940, as amended, as anopen-end management investment company. The shareholders of each series of the trust are separate accounts of insurance companies, which offer variable annuity and/or life insurance products, and qualified retirement and pension plans.
The fund is an investment company and accordingly follows the investment company accounting and reporting guidance of the Financial Accounting Standards Board (FASB) Accounting Standards Codification Topic 946 Financial Services – Investment Companies.
| (2) | | Significant Accounting Policies |
General– The preparation of financial statements in conformity with U.S. generally accepted accounting principles requires management to make estimates and assumptions that affect the reported amounts of assets and liabilities, and disclosure of contingent assets and liabilities at the date of the financial statements and the reported amounts of increases and decreases in net assets from operations during the reporting period. Actual results could differ from those estimates. In the preparation of these financial statements, management has evaluated subsequent events occurring after the date of the fund’s Statement of Assets and Liabilities through the date that the financial statements were issued. The fund invests a significant amount of its net assets in U.S. and foreign real estate related investments and as a result is subject to certain risks associated with the direct ownership of real estate and the real estate industry in general. These include risks related to general, regional and local economic conditions; difficulties in valuing and disposing of real estate; fluctuations in interest rates and property tax rates, shifts in zoning laws, environmental regulations and other governmental action; cash flow dependency; increased operating expenses; lack of availability of mortgage funds; losses due to natural disasters; overbuilding; losses due to casualty or condemnation; changes in property values and rental rates; the management skill and creditworthiness of the manager; and other factors. The fund invests in foreign securities. Investments in foreign securities are vulnerable to the effects of changes in the relative values of the local currency and the U.S. dollar and to the effects of changes in each country’s market, economic, industrial, political, regulatory, geopolitical, and other conditions.
Balance Sheet Offsetting– The fund’s accounting policy with respect to balance sheet offsetting is that, absent an event of default by the counterparty or a termination of the agreement, the International Swaps and Derivatives Association (ISDA) Master Agreement, or similar agreement, does not result in an offset of reported amounts of financial assets and financial liabilities in the Statement of Assets and Liabilities across transactions between the fund and the applicable counterparty. The fund’s right to setoff may be restricted or prohibited by the bankruptcy or insolvency laws of the particular jurisdiction to which a specific master netting agreement counterparty is subject. Balance sheet offsetting disclosures, to the extent applicable to the fund, have been included in the fund’s Significant Accounting Policies note under the captions for each of the fund’sin-scope financial instruments and transactions.
Investment Valuations– Equity securities, including restricted equity securities, are generally valued at the last sale or official closing price on their primary market or exchange as provided by a third-party pricing service. Equity securities, for which there were no sales reported that day, are generally valued at the last quoted daily bid quotation on their primary market or exchange as provided by a third-party pricing service. Short-term instruments with a maturity at issuance of 60 days or less may be valued at amortized cost, which approximates market value.Open-end investment companies are generally valued at net asset value per share. Securities and other assets generally valued on the basis of information from a third-party pricing service may also be valued at a broker/dealer bid quotation. In determining values, third-party pricing services can utilize both transaction data and market information such as yield, quality, coupon rate, maturity, type of issue, trading characteristics, and other market data. The values of foreign securities and other assets and liabilities expressed in foreign currencies are converted to U.S. dollars using the mean of bid and asked prices for rates provided by a third-party pricing service.
The Board of Trustees has delegated primary responsibility for determining or causing to be determined the value of the fund’s investments (including any fair valuation) to the adviser pursuant to valuation policies and procedures approved by the Board. If the adviser determines that reliable market quotations are not readily available, investments are valued at fair value as determined in good faith by the adviser in accordance with such procedures under the oversight of the Board of Trustees. Under the fund’s valuation policies and procedures, market quotations are not considered to be readily available for most types of debt instruments and floating rate loans and many types of derivatives. These investments are generally valued at fair value based on information from third-party pricing services. In addition, investments may be valued at fair value if the adviser determines that an investment’s value has been materially affected by events occurring after the close of the exchange or market on which the investment is principally traded (such as foreign exchange or market) and prior to the determination of the fund’s net asset value, or after the halt of trading of a specific security where trading does not resume prior to the close of the exchange or market on which the security is principally traded. Events that occur after foreign markets close (such as developments in foreign markets and significant movements in the U.S. markets) and prior to the determination of the fund’s net asset value may be deemed to have a material effect on the value of
14
MFS Global Real Estate Portfolio
Notes to Financial Statements – continued
securities traded in foreign markets. Accordingly, the fund’s foreign equity securities may often be valued at fair value. The adviser generally relies on third-party pricing services or other information (such as the correlation with price movements of similar securities in the same or other markets; the type, cost and investment characteristics of the security; the business and financial condition of the issuer; and trading and other market data) to assist in determining whether to fair value and at what value to fair value an investment. The value of an investment for purposes of calculating the fund’s net asset value can differ depending on the source and method used to determine value. When fair valuation is used, the value of an investment used to determine the fund’s net asset value may differ from quoted or published prices for the same investment. There can be no assurance that the fund could obtain the fair value assigned to an investment if it were to sell the investment at the same time at which the fund determines its net asset value per share.
Various inputs are used in determining the value of the fund’s assets or liabilities. These inputs are categorized into three broad levels. In certain cases, the inputs used to measure fair value may fall into different levels of the fair value hierarchy. In such cases, an investment’s level within the fair value hierarchy is based on the lowest level of input that is significant to the fair value measurement. The fund’s assessment of the significance of a particular input to the fair value measurement in its entirety requires judgment, and considers factors specific to the investment. Level 1 includes unadjusted quoted prices in active markets for identical assets or liabilities. Level 2 includes other significant observable market-based inputs (including quoted prices for similar securities, interest rates, prepayment speed, and credit risk). Level 3 includes unobservable inputs, which may include the adviser’s own assumptions in determining the fair value of investments. The following is a summary of the levels used as of December 31, 2019 in valuing the fund’s assets or liabilities:
| | | | | | | | | | | | | | | | |
| Financial Instruments | | Level 1 | | | Level 2 | | | Level 3 | | | Total | |
| Equity Securities: | | | | | | | | | | | | | | | | |
United States | | | $95,391,174 | | | | $— | | | | $— | | | | $95,391,174 | |
Japan | | | 3,705,548 | | | | 16,213,021 | | | | — | | | | 19,918,569 | |
Hong Kong | | | 11,845,833 | | | | — | | | | — | | | | 11,845,833 | |
United Kingdom | | | 11,395,634 | | | | — | | | | — | | | | 11,395,634 | |
Australia | | | 10,507,889 | | | | — | | | | — | | | | 10,507,889 | |
Singapore | | | 7,316,558 | | | | — | | | | — | | | | 7,316,558 | |
Germany | | | 6,775,041 | | | | — | | | | — | | | | 6,775,041 | |
Belgium | | | 6,294,691 | | | | — | | | | — | | | | 6,294,691 | |
Canada | | | 4,809,091 | | | | — | | | | — | | | | 4,809,091 | |
Other Countries | | | 11,940,995 | | | | 1,213,671 | | | | — | | | | 13,154,666 | |
| Mutual Funds | | | 3,254,887 | | | | — | | | | — | | | | 3,254,887 | |
| Total | | | $173,237,341 | | | | $17,426,692 | | | | $— | | | | $190,664,033 | |
For further information regarding security characteristics, see the Portfolio of Investments.
Foreign Currency Translation– Purchases and sales of foreign investments, income, and expenses are converted into U.S. dollars based upon currency exchange rates prevailing on the respective dates of such transactions or on the reporting date for foreign denominated receivables and payables. Gains and losses attributable to foreign currency exchange rates on sales of securities are recorded for financial statement purposes as net realized gains and losses on investments. Gains and losses attributable to foreign exchange rate movements on receivables, payables, income and expenses are recorded for financial statement purposes as foreign currency transaction gains and losses. That portion of both realized and unrealized gains and losses on investments that results from fluctuations in foreign currency exchange rates is not separately disclosed.
Indemnifications– Under the fund’s organizational documents, its officers and Trustees may be indemnified against certain liabilities and expenses arising out of the performance of their duties to the fund. Additionally, in the normal course of business, the fund enters into agreements with service providers that may contain indemnification clauses. The fund’s maximum exposure under these agreements is unknown as this would involve future claims that may be made against the fund that have not yet occurred.
Investment Transactions and Income– Investment transactions are recorded on the trade date. Dividends received in cash are recorded on theex-dividend date. Certain dividends from foreign securities will be recorded when the fund is informed of the dividend if such information is obtained subsequent to theex-dividend date. Dividend payments received in additional securities are recorded on theex-dividend date in an amount equal to the value of the security on such date. Distributions from REITs may be characterized as ordinary income, net capital gain, or a return of capital to the fund. The proper characterization of REIT distributions is generally not known until after the end of each calendar year. As such, estimates are used in reporting the character of income and distributions for financial statement purposes. The fund receives substantial distributions from holdings in REITs.
The fund may receive proceeds from litigation settlements. Any proceeds received from litigation involving portfolio holdings are reflected in the Statement of Operations in realized gain/loss if the security has been disposed of by the fund or in unrealized gain/loss if the security is still held by the fund. Any other proceeds from litigation not related to portfolio holdings are reflected as other income in the Statement of Operations.
15
MFS Global Real Estate Portfolio
Notes to Financial Statements – continued
Tax Matters and Distributions– The fund intends to qualify as a regulated investment company, as defined under Subchapter M of the Internal Revenue Code, and to distribute all of its taxable income, including realized capital gains. As a result, no provision for federal income tax is required. The fund’s federal tax returns, when filed, will remain subject to examination by the Internal Revenue Service for a three year period. Management has analyzed the fund’s tax positions taken on federal and state tax returns for all open tax years and does not believe that there are any uncertain tax positions that require recognition of a tax liability. Foreign taxes, if any, have been accrued by the fund in the accompanying financial statements in accordance with the applicable foreign tax law. Foreign income taxes may be withheld by certain countries in which the fund invests. Additionally, capital gains realized by the fund on securities issued in or by certain foreign countries may be subject to capital gains tax imposed by those countries.
Distributions to shareholders are recorded on theex-dividend date. Income and capital gain distributions are determined in accordance with income tax regulations, which may differ from U.S. generally accepted accounting principles. Certain capital accounts in the financial statements are periodically adjusted for permanent differences in order to reflect their tax character. These adjustments have no impact on net assets or net asset value per share. Temporary differences which arise from recognizing certain items of income, expense, gain or loss in different periods for financial statement and tax purposes will reverse at some time in the future.
Book/tax differences primarily relate to passive foreign investment companies and wash sale loss deferrals.
The tax character of distributions declared to shareholders for the last two fiscal years is as follows:
| | | | | | | | |
| | | Year ended
12/31/19 | | | Year ended
12/31/18 | |
| Ordinary income (including any short-term capital gains) | | | $5,904,085 | | | | $7,658,174 | |
| Long-term capital gains | | | 1,067,030 | | | | 1,092,015 | |
| Total distributions | | | $6,971,115 | | | | $8,750,189 | |
The federal tax cost and the tax basis components of distributable earnings were as follows:
| | | | |
| As of 12/31/19 | | | | |
| |
| Cost of investments | | | $150,877,566 | |
| Gross appreciation | | | 40,882,614 | |
| Gross depreciation | | | (1,096,147 | ) |
| Net unrealized appreciation (depreciation) | | | $39,786,467 | |
| |
| Undistributed ordinary income | | | 8,776,928 | |
| Undistributed long-term capital gain | | | 3,196,400 | |
| Other temporary differences | | | (10,082 | ) |
Multiple Classes of Shares of Beneficial Interest– The fund offers multiple classes of shares, which differ in their respective distribution and/or service fees. The fund’s income, realized and unrealized gain (loss), and common expenses are allocated to shareholders based on the daily net assets of each class. Dividends are declared separately for each class. Differences in per share dividend rates are generally due to differences in separate class expenses. The fund’s distributions declared to shareholders as reported in the Statements of Changes in Net Assets are presented by class as follows:
| | | | | | | | |
| | |
| | | Year ended
12/31/19 | | | Year ended
12/31/18 | |
| Initial Class | | | $4,992,128 | | | | $5,874,343 | |
| Service Class | | | 1,978,987 | | | | 2,875,846 | |
| Total | | | $6,971,115 | | | | $8,750,189 | |
| (3) | | Transactions with Affiliates |
Investment Adviser– The fund has an investment advisory agreement with MFS to provide overall investment management and related administrative services and facilities to the fund. The management fee is computed daily and paid monthly at the following annual rates based on the fund’s average daily net assets:
| | | | |
| Up to $1 billion | | | 0.90% | |
| In excess of $1 billion and up to $2.5 billion | | | 0.75% | |
| In excess of $2.5 billion | | | 0.65% | |
MFS has agreed in writing to reduce its management fee by a specified amount if certain MFS mutual fund assets exceed thresholds agreed to by MFS and the fund’s Board of Trustees. For the year ended December 31, 2019, this management fee reduction amounted to $16,709, which is included in the reduction of total expenses in the Statement of Operations. The management fee incurred for the year ended December 31, 2019 was equivalent to an annual effective rate of 0.89% of the fund’s average daily net assets.
16
MFS Global Real Estate Portfolio
Notes to Financial Statements – continued
The investment adviser has agreed in writing to pay a portion of the fund’s total annual operating expenses, excluding interest, taxes, extraordinary expenses, brokerage and transaction costs, and investment-related expenses, such that total annual operating expenses do not exceed 0.92% of average daily net assets for the Initial Class shares and 1.17% of average daily net assets for the Service Class shares. This written agreement will continue until modified by the fund’s Board of Trustees, but such agreement will continue at least until April 30, 2021. For the year ended December 31, 2019, this reduction amounted to $133,786, which is included in the reduction of total expenses in the Statement of Operations.
Distributor– MFS Fund Distributors, Inc. (MFD), a wholly-owned subsidiary of MFS, is the distributor of shares of the fund. The Trustees have adopted a distribution plan for the Service Class shares pursuant to Rule12b-1 under the Investment Company Act of 1940.
The fund’s distribution plan provides that the fund will pay MFD distribution and/or service fees equal to 0.25% per annum of its average daily net assets attributable to Service Class shares as partial consideration for services performed and expenses incurred by MFD and financial intermediaries (including participating insurance companies that invest in the fund to fund variable annuity and variable life insurance contracts, sponsors of qualified retirement and pension plans that invest in the fund, and affiliates of these participating insurance companies and plan sponsors) in connection with the sale and distribution of the Service Class shares. MFD may subsequently pay all, or a portion, of the distribution and/or service fees to financial intermediaries.
Shareholder Servicing Agent– MFS Service Center, Inc. (MFSC), a wholly-owned subsidiary of MFS, receives a fee from the fund for its services as shareholder servicing agent. For the year ended December 31, 2019, the fee was $5,055, which equated to 0.0030% annually of the fund’s average daily net assets. MFSC also receives payment from the fund forout-of-pocket expenses paid by MFSC on behalf of the fund. For the year ended December 31, 2019, these costs amounted to $384.
Administrator– MFS provides certain financial, legal, shareholder communications, compliance, and other administrative services to the fund. Under an administrative services agreement, the fund reimburses MFS the costs incurred to provide these services. The fund is charged an annual fixed amount of $17,500 plus a fee based on average daily net assets. The administrative services fee incurred for the year ended December 31, 2019 was equivalent to an annual effective rate of 0.0197% of the fund’s average daily net assets.
Trustees’ and Officers’ Compensation– The fund pays compensation to independent Trustees in the form of a retainer, attendance fees, and additional compensation to Board and Committee chairpersons. The fund does not pay compensation directly to Trustees or officers of the fund who are also officers of the investment adviser, all of whom receive remuneration from MFS for their services to the fund. Certain officers and Trustees of the fund are officers or directors of MFS, MFD, and MFSC.
Other– This fund and certain other funds managed by MFS (the funds) had entered into a service agreement (the ISO Agreement) which provided for payment of fees solely by the funds to Tarantino LLC in return for the provision of services of an Independent Senior Officer (ISO) for the funds. Frank L. Tarantino served as the ISO and was an officer of the funds and the sole member of Tarantino LLC. Effective June 30, 2019, Mr. Tarantino retired from his position as ISO for the funds, and the ISO Agreement was terminated. For the year ended December 31, 2019, the fee paid by the fund under this agreement was $193 and is included in “Miscellaneous” expense in the Statement of Operations. MFS had agreed to bear all expenses associated with office space, other administrative support, and supplies provided to the ISO.
The fund invests in the MFS Institutional Money Market Portfolio which is managed by MFS and seeks current income consistent with preservation of capital and liquidity. This money market fund does not pay a management fee to MFS.
The fund is permitted to engage in purchase and sale transactions with funds and accounts for which MFS serves as investment adviser orsub-adviser (“cross-trades”) pursuant to a policy adopted by the Board of Trustees. This policy has been designed to ensure that cross-trades conducted by the fund comply with Rule17a-7 under the Investment Company Act of 1940. During the year ended December 31, 2019, the fund engaged in purchase and sale transactions pursuant to this policy, which amounted to $423,981 and $29,260, respectively. The sales transactions resulted in net realized gains (losses) of $(5,703).
The adviser has voluntarily undertaken to reimburse the fund from its own resources on a quarterly basis for the cost of investment research embedded in the cost of the fund’s securities trades. This agreement may be rescinded at any time. For the year ended December 31, 2019, this reimbursement amounted to $15,102, which is included in “Other” income in the Statement of Operations.
For the year ended December 31, 2019, purchases and sales of investments, other than short-term obligations, aggregated $64,007,771 and $60,128,188, respectively.
17
MFS Global Real Estate Portfolio
Notes to Financial Statements – continued
| (5) | | Shares of Beneficial Interest |
The fund’s Declaration of Trust permits the Trustees to issue an unlimited number of full and fractional shares of beneficial interest. Transactions in fund shares were as follows:
| | | | | | | | | | | | | | | | |
| | | Year ended 12/31/19 | | | Year ended 12/31/18 | |
| | | | |
| | | Shares | | | Amount | | | Shares | | | Amount | |
| Shares sold | | | | | | | | | | | | | | | | |
Initial Class | | | 1,801,254 | | | | $28,192,886 | | | | 638,619 | | | | $8,607,350 | |
Service Class | | | 218,233 | | | | 3,885,205 | | | | 302,157 | | | | 4,766,175 | |
| | | 2,019,487 | | | | $32,078,091 | | | | 940,776 | | | | $13,373,525 | |
| | | | |
| Shares issued to shareholders in reinvestment of distributions | | | | | | | | | | | | | | | | |
Initial Class | | | 328,646 | | | | $4,992,128 | | | | 414,270 | | | | $5,874,343 | |
Service Class | | | 111,618 | | | | 1,978,987 | | | | 174,930 | | | | 2,875,846 | |
| | | 440,264 | | | | $6,971,115 | | | | 589,200 | | | | $8,750,189 | |
| | | | |
| Shares reacquired | | | | | | | | | | | | | | | | |
Initial Class | | | (1,424,762 | ) | | | $(21,540,563 | ) | | | (1,431,815 | ) | | | $(20,009,623 | ) |
Service Class | | | (708,013 | ) | | | (12,491,073 | ) | | | (1,221,838 | ) | | | (19,602,871 | ) |
| | | (2,132,775 | ) | | | $(34,031,636 | ) | | | (2,653,653 | ) | | | $(39,612,494 | ) |
| | | | |
| Net change | | | | | | | | | | | | | | | | |
Initial Class | | | 705,138 | | | | $11,644,451 | | | | (378,926 | ) | | | $(5,527,930 | ) |
Service Class | | | (378,162 | ) | | | (6,626,881 | ) | | | (744,751 | ) | | | (11,960,850 | ) |
| | | 326,976 | | | | $5,017,570 | | | | (1,123,677 | ) | | | $(17,488,780 | ) |
The fund is one of several mutual funds in which certain MFS funds may invest. The MFS funds do not invest in the underlying funds for the purpose of exercising management or control. At the end of the period, the MFS Moderate Allocation Portfolio, the MFS Growth Allocation Portfolio, and the MFS Conservative Allocation Portfolio were the owners of record of approximately 22%, 9%, and 5%, respectively, of the value of outstanding voting shares of the fund.
The fund and certain other funds managed by MFS participate in a $1.25 billion unsecured committed line of credit, subject to a $1 billion sublimit, provided by a syndicate of banks under a credit agreement. Borrowings may be made for temporary financing needs. Interest is charged to each fund, based on its borrowings, generally at a rate equal to the highest of one month LIBOR, the Federal Funds Effective Rate and the Overnight Bank Funding Rate, plus an agreed upon spread. A commitment fee, based on the average daily, unused portion of the committed line of credit, is allocated among the participating funds. In addition, the fund and other funds managed by MFS have established unsecured uncommitted borrowing arrangements with certain banks for temporary financing needs. Interest is charged to each fund, based on its borrowings, at rates equal to customary reference rates plus an agreed upon spread. For the year ended December 31, 2019, the fund’s commitment fee and interest expense were $924 and $0, respectively, and are included in “Miscellaneous” expense in the Statement of Operations.
| (7) | | Investments in Affiliated Issuers |
An affiliated issuer may be considered one in which the fund owns 5% or more of the outstanding voting securities, or a company which is under common control. For the purposes of this report, the following were affiliated issuers:
| | | | | | | | | | | | | | | | | | | | | | | | |
| Affiliated Issuers | | Beginning
Value | | | Purchases | | | Sales
Proceeds | | | Realized
Gain
(Loss) | | | Change in
Unrealized
Appreciation or
Depreciation | | | Ending
Value | |
| MFS Institutional Money Market Portfolio | | | $4,741,034 | | | | $55,340,173 | | | | $56,827,530 | | | | $1,210 | | | | $— | | | | $3,254,887 | |
| | | | | | |
| Affiliated Issuers | | | | | | | | | | | | | | Dividend
Income | | | Capital Gain
Distributions | |
| MFS Institutional Money Market Portfolio | | | | | | | | | | | | | | | | | | | $38,205 | | | | $— | |
18
MFS Global Real Estate Portfolio
REPORT OF INDEPENDENT REGISTERED PUBLIC ACCOUNTING FIRM
To the Board of Trustees of MFS Variable Insurance Trust III and the Shareholders of
MFS Global Real Estate Portfolio:
Opinion on the Financial Statements and Financial Highlights
We have audited the accompanying statement of assets and liabilities of MFS Global Real Estate Portfolio (the “Fund”), including the portfolio of investments, as of December 31, 2019, the related statement of operations for the year then ended, the statements of changes in net assets for each of the two years in the period then ended, the financial highlights for each of the five years in the period then ended, and the related notes. In our opinion, the financial statements and financial highlights present fairly, in all material respects, the financial position of the Fund as of December 31, 2019, and the results of its operations for the year then ended, the changes in its net assets for each of the two years in the period then ended, and the financial highlights for each of the five years in the period then ended, in conformity with accounting principles generally accepted in the United States of America.
Basis for Opinion
These financial statements and financial highlights are the responsibility of the Fund’s management. Our responsibility is to express an opinion on the Fund’s financial statements and financial highlights based on our audits. We are a public accounting firm registered with the Public Company Accounting Oversight Board (United States) (PCAOB) and are required to be independent with respect to the Fund in accordance with the U.S. federal securities laws and the applicable rules and regulations of the Securities and Exchange Commission and the PCAOB.
We conducted our audits in accordance with the standards of the PCAOB. Those standards require that we plan and perform the audit to obtain reasonable assurance about whether the financial statements and financial highlights are free of material misstatement, whether due to error or fraud. The Fund is not required to have, nor were we engaged to perform, an audit of its internal control over financial reporting. As part of our audits we are required to obtain an understanding of internal control over financial reporting but not for the purpose of expressing an opinion on the effectiveness of the Fund’s internal control over financial reporting. Accordingly, we express no such opinion.
Our audits included performing procedures to assess the risks of material misstatement of the financial statements and financial highlights, whether due to error or fraud, and performing procedures that respond to those risks. Such procedures included examining, on a test basis, evidence regarding the amounts and disclosures in the financial statements and financial highlights. Our audits also included evaluating the accounting principles used and significant estimates made by management, as well as evaluating the overall presentation of the financial statements and financial highlights. Our procedures included confirmation of securities owned as of December 31, 2019, by correspondence with the custodian and brokers. We believe that our audits provide a reasonable basis for our opinion.
DELOITTE & TOUCHE LLP
Boston, Massachusetts
February 14, 2020
We have served as the auditor of one or more of the MFS investment companies since 1924.
19
MFS Global Real Estate Portfolio
TRUSTEES AND OFFICERS – IDENTIFICATION AND BACKGROUND
The Trustees and Officers of the Trust, as of February 1, 2020, are listed below, together with their principal occupations during the past five years. (Their titles may have varied during that period.) The address of each Trustee and Officer is 111 Huntington Avenue, Boston, Massachusetts 02199-7618.
| | | | | | | | | | |
Name, Age | | Position(s)
Held with Fund | | Trustee/Officer
Since (h) | | Number of MFS Funds
overseen by the
Trustee | | Principal Occupations
During the Past Five Years | | Other Directorships During the Past Five Years (j) |
| INTERESTED TRUSTEES |
Robert J. Manning (k)
(age 56) | | Trustee | | February 2004 | | 133 | | Massachusetts Financial Services Company, Executive Chairman (since January 2017); Director; Chairman of the Board; Chief Executive Officer (until 2015);Co-Chief Executive Officer(2015-2016) | | N/A |
| | | | | |
Robin A. Stelmach (k) (age 58) | | Trustee | | January 2014 | | 133 | | Massachusetts Financial Services Company, Vice Chair (since January 2017); Chief Operating Officer and Executive Vice President (until January 2017) | | N/A |
|
| INDEPENDENT TRUSTEES |
John P. Kavanaugh (age 65) | | Trustee and Chair of Trustees | | January 2009 | | 133 | | Private investor | | N/A |
| | | | | |
Steven E. Buller (age 68) | | Trustee | | February 2014 | | 133 | | Financial Accounting Standards Advisory Council, Chairman(2014-2015); Public Company Accounting Oversight Board, Standing Advisory Group, Member (until 2014); BlackRock, Inc. (investment management), Managing Director (until 2014), BlackRock Finco UK (investment management), Director (until 2014) | | N/A |
| | | | | |
John A. Caroselli (age 65) | | Trustee | | March 2017 | | 133 | | JC Global Advisors, LLC (management consulting), President (since 2015); First Capital Corporation (commercial finance), Executive Vice President (until 2015) | | N/A |
| | | | | |
Maureen R. Goldfarb (age 64) | | Trustee | | January 2009 | | 133 | | Private investor | | N/A |
| | | | | |
Peter D. Jones
(age 64) | | Trustee | | January 2019 | | 133 | | Franklin Templeton Distributors, Inc. (investment management), President (until 2015); Franklin Templeton Institutional, LLC (investment management), Chairman (until 2015) | | N/A |
| | | | | |
James W. Kilman, Jr.
(age 58) | | Trustee | | January 2019 | | 133 | | Burford Capital Limited (finance and investment management), Chief Financial Officer (since 2019); KielStrand Capital LLC (family office), Chief Executive Officer (since 2016); Morgan Stanley & Co. (financial services), Vice Chairman of Investment Banking,Co-Head of Diversified Financials Coverage – Financial Institutions Investment Banking Group (until 2016) | | Alpha-En Corporation, Director (2016-2019) |
20
MFS Global Real Estate Portfolio
Trustees and Officers – continued
| | | | | | | | | | |
Name, Age | | Position(s)
Held with Fund | | Trustee/Officer
Since (h) | | Number of MFS Funds
overseen by the
Trustee | | Principal Occupations
During the Past Five Years | | Other Directorships During the Past Five Years (j) |
Clarence Otis, Jr. (age 63) | | Trustee | | March 2017 | | 133 | | Darden Restaurants, Inc., Chief Executive Officer (until 2014) | | VF Corporation, Director; Verizon Communications, Inc., Director; The Travelers Companies, Director; Federal Reserve Bank of Atlanta, Director (until 2015) |
| | | | | |
Maryanne L. Roepke (age 63) | | Trustee | | May 2014 | | 133 | | American Century Investments (investment management), Senior Vice President and Chief Compliance Officer (until 2014) | | N/A |
| | | | | |
Laurie J. Thomsen
(age 62) | | Trustee | | March 2005 | | 133 | | Private investor | | The Travelers Companies, Director; Dycom Industries, Inc., Director (since 2015) |
| | | | | | | | |
Name, Age | | Position(s)
Held with Fund | | Trustee/Officer
Since (h) | | Number of
MFS Funds
for which the
Person is an
Officer | | Principal Occupations During the Past Five Years |
| OFFICERS | | | | | | |
Christopher R. Bohane (k)
(age 46) | | Assistant Secretary and Assistant Clerk | | July 2005 | | 133 | | Massachusetts Financial Services Company, Vice President and Assistant General Counsel |
| | | | |
Kino Clark (k) (age 51) | | Assistant Treasurer | | January 2012 | | 133 | | Massachusetts Financial Services Company, Vice President |
| | | | |
John W. Clark, Jr. (k) (age 52) | | Assistant Treasurer | | April 2017 | | 133 | | Massachusetts Financial Services Company, Vice President (since March 2017); Deutsche Bank (financial services), Department Head –Treasurer’s Office (until February 2017) |
| | | | |
Thomas H. Connors (k) (age 60) | | Assistant Secretary and Assistant Clerk | | September 2012 | | 133 | | Massachusetts Financial Services Company, Vice President and Senior Counsel |
| | | | |
David L. DiLorenzo (k)
(age 51) | | President | | July 2005 | | 133 | | Massachusetts Financial Services Company, Senior Vice President |
| | | | |
Heidi W. Hardin (k) (age 52) | | Secretary and Clerk | | April 2017 | | 133 | | Massachusetts Financial Services Company, Executive Vice President and General Counsel (since March 2017); Harris Associates (investment management), General Counsel (from September 2015 to January 2017); Janus Capital Management LLC (investment management), Senior Vice President and General Counsel (until September 2015) |
| | | | |
Brian E. Langenfeld (k) (age 46) | | Assistant
Secretary and Assistant Clerk | | June 2006 | | 133 | | Massachusetts Financial Services Company, Vice President and Senior Counsel |
| | | | |
Amanda S. Mooradian (k) (age 40) | | Assistant
Secretary and Assistant Clerk | | September 2018 | | 133 | | Massachusetts Financial Services Company, Assistant Vice President and Counsel |
| | | | |
Susan A. Pereira (k)
(age 49) | | Assistant
Secretary and Assistant Clerk | | July 2005 | | 133 | | Massachusetts Financial Services Company, Vice President and Assistant General Counsel |
| | | | |
Kasey L. Phillips (k) (age 49) | | Assistant Treasurer | | September 2012 | | 133 | | Massachusetts Financial Services Company, Vice President |
| | | | |
Matthew A. Stowe (k) (age 45) | | Assistant Secretary and Assistant Clerk | | October 2014 | | 133 | | Massachusetts Financial Services Company, Vice President and Assistant General Counsel |
21
MFS Global Real Estate Portfolio
Trustees and Officers – continued
| | | | | | | | |
Name, Age | | Position(s)
Held with Fund | | Trustee/Officer
Since (h) | | Number of
MFS Funds
for which the
Person is an
Officer | | Principal Occupations During the Past Five Years |
Martin J. Wolin (k) (age 52) | | Chief Compliance Officer | | July 2015 | | 133 | | Massachusetts Financial Services Company, Senior Vice President and Chief Compliance Officer (since July 2015); Mercer (financial service provider), Chief Risk and Compliance Officer, North America and Latin America (until June 2015) |
| | | | |
James O. Yost (k)
(age 59) | | Treasurer | | September 1990 | | 133 | | Massachusetts Financial Services Company, Senior Vice President |
| (h) | Date first appointed to serve as Trustee/officer of an MFS Fund. Each Trustee has served continuously since appointment unless indicated otherwise. For the period from December 15, 2004 until February 22, 2005, Mr. Manning served as Advisory Trustee. From January 2012 through December 2016, Messrs. DiLorenzo and Yost served as Treasurer and Deputy Treasurer of the Funds, respectively. |
| (j) | Directorships or trusteeships of companies required to report to the Securities and Exchange Commission (i.e., “public companies”). |
| (k) | “Interested person” of the Trust within the meaning of the Investment Company Act of 1940 (referred to as the 1940 Act), which is the principal federal law governing investment companies like the fund, as a result of a position with MFS. The address of MFS is 111 Huntington Avenue, Boston, Massachusetts 02199-7618. |
Each Trustee (other than Messrs. Jones and Kilman) has been elected by shareholders and each Trustee and Officer holds office until his or her successor is chosen and qualified or until his or her earlier death, resignation, retirement or removal. Messrs. Jones and Kilman became Trustees of the Funds on January 1, 2019. The Trust does not hold annual meetings for the purpose of electing Trustees, and Trustees are not elected for fixed terms. Under the terms of the Board’s retirement policy, an Independent Trustee shall retire at the end of the calendar year in which he or she reaches the earlier of 75 years of age or 15 years of service on the Board (or, in the case of any Independent Trustee who joined the Board prior to 2015, 20 years of service on the Board).
Messrs. Buller, Kilman and Otis and Ms. Roepke are members of the Trust’s Audit Committee.
Each of the Interested Trustees and certain Officers hold comparable officer positions with certain affiliates of MFS.
The Statement of Additional Information for a Fund includes further information about the Trustees and is available without charge upon request by calling1-800-225-2606.
| | |
Investment Adviser Massachusetts Financial Services Company 111 Huntington Avenue Boston, MA 02199-7618 | | Custodian State Street Bank and Trust Company 1 Lincoln Street Boston, MA 02111-2900 |
| |
Distributor MFS Fund Distributors, Inc. 111 Huntington Avenue Boston, MA 02199-7618 | | Independent Registered Public Accounting Firm Deloitte & Touche LLP 200 Berkeley Street Boston, MA 02116 |
| |
Portfolio Manager(s) Rick Gable | | |
22
MFS Global Real Estate Portfolio
BOARD REVIEW OF INVESTMENT ADVISORY AGREEMENT
MFS Global Real Estate Portfolio
The Investment Company Act of 1940 requires that both the full Board of Trustees and a majority of thenon-interested (“independent”) Trustees, voting separately, annually approve the continuation of the Fund’s investment advisory agreement with MFS. The Trustees consider matters bearing on the Fund and its advisory arrangements at their meetings throughout the year, including a review of performance data at each regular meeting. In addition, the independent Trustees met several times over the course of three months beginning in May and ending in July, 2019 (“contract review meetings”) for the specific purpose of considering whether to approve the continuation of the investment advisory agreement for the Fund and the other investment companies that the Board oversees (the “MFS Funds”). The independent Trustees were assisted in their evaluation of the Fund’s investment advisory agreement by independent legal counsel, from whom they received separate legal advice and with whom they met separately from MFS during various contract review meetings. The independent Trustees were also assisted in this process by the MFS Funds’ Independent Senior Officer, a senior officer appointed by and reporting to the independent Trustees.
In connection with their deliberations regarding the continuation of the investment advisory agreement, the Trustees, including the independent Trustees, considered such information and factors as they believed, in light of the legal advice furnished to them and their own business judgment, to be relevant. The investment advisory agreement for the Fund was considered separately, although the Trustees also took into account the common interests of all MFS Funds in their review. As described below, the Trustees considered the nature, quality, and extent of the various investment advisory, administrative, and shareholder services performed by MFS under the existing investment advisory agreement and other arrangements with the Fund.
In connection with their contract review meetings, the Trustees received and relied upon materials that included, among other items: (i) information provided by Broadridge Financial Solutions, Inc. (“Broadridge”), an independent third party, on the investment performance of the Fund for various time periods ended December 31, 2018 and the investment performance of a group of funds with substantially similar investment classifications/objectives (the “Broadridge performance universe”), (ii) information provided by Broadridge on the Fund’s advisory fees and other expenses and the advisory fees and other expenses of comparable funds identified by Broadridge as well as all other funds in the same investment classification/category (the “Broadridge expense group and universe”), (iii) information provided by MFS on the advisory fees of portfolios of other clients of MFS, including institutional separate accounts and other clients, (iv) information as to whether and to what extent applicable expense waivers, reimbursements or fee “breakpoints” are observed for the Fund, (v) information regarding MFS’ financial results and financial condition, including MFS’ and certain of its affiliates’ estimated profitability from services performed for the Fund and the MFS Funds as a whole, and compared to MFS’ institutional business, (vi) MFS’ views regarding the outlook for the mutual fund industry and the strategic business plans of MFS, (vii) descriptions of various functions performed by MFS for the Funds, such as compliance monitoring and portfolio trading practices, and (viii) information regarding the overall organization of MFS, including information about MFS’ senior management and other personnel providing investment advisory, administrative and other services to the Fund and the other MFS Funds. The comparative performance, fee and expense information prepared and provided by Broadridge was not independently verified and the independent Trustees did not independently verify any information provided to them by MFS.
The Trustees’ conclusion as to the continuation of the investment advisory agreement was based on a comprehensive consideration of all information provided to the Trustees and not the result of any single factor. Some of the factors that figured particularly in the Trustees’ deliberations are described below, although individual Trustees may have evaluated the information presented differently from one another, giving different weights to various factors. It is also important to recognize that the fee arrangements for the Fund and other MFS Funds are the result of years of review and discussion between the independent Trustees and MFS, that certain aspects of such arrangements may receive greater scrutiny in some years than in others, and that the Trustees’ conclusions may be based, in part, on their consideration of these same arrangements during the course of the year and in prior years.
Based on information provided by Broadridge and MFS, the Trustees reviewed the Fund’s total return investment performance as well as the Broadridge performance universe over various time periods. The Trustees placed particular emphasis on the total return performance of the Fund’s Initial Class shares in comparison to the performance of funds in its Broadridge performance universe over the five-year period ended December 31, 2018, which the Trustees believed was a long enough period to reflect differing market conditions. The total return performance of the Fund’s Initial Class shares was in the 1st quintile relative to the other funds in the universe for this five-year period (the 1st quintile being the best performers and the 5th quintile being the worst performers). The total return performance of the Fund’s Initial Class shares was in the 1st quintile for each of theone- and three-year periods ended December 31, 2018 relative to the Broadridge performance universe. Because of the passage of time, these performance results may differ from the performance results for more recent periods, including those shown elsewhere in this report.
In the course of their deliberations, the Trustees took into account information provided by MFS in connection with the contract review meetings, as well as during investment review meetings conducted with portfolio management personnel during the course of the year regarding the Fund’s performance. After reviewing these and related factors, the Trustees concluded, within the context of their overall conclusions regarding the investment advisory agreement, that they were satisfied with MFS’ responses and efforts relating to investment performance.
23
MFS Global Real Estate Portfolio
Board Review of Investment Advisory Agreement – continued
In assessing the reasonableness of the Fund’s advisory fee, the Trustees considered, among other information, the Fund’s advisory fee and the total expense ratio of the Fund’s Initial Class shares as a percentage of average daily net assets and the advisory fee and total expense ratios of the Broadridge expense group based on information provided by Broadridge. The Trustees considered that MFS currently observes an expense limitation for the Fund, which may not be changed without the Trustees’ approval. The Trustees also considered that, according to the data provided by Broadridge (which takes into account any fee reductions or expense limitations that were in effect during the Fund’s last fiscal year), the Fund’s effective advisory fee rate and total expense ratio were each approximately at the Broadridge expense group median.
The Trustees also considered the advisory fees charged by MFS to any institutional separate accounts advised by MFS (“separate accounts”) and unaffiliated investment companies for which MFS serves as subadviser (“subadvised funds”) that have comparable investment strategies to the Fund, if any. In comparing these fees, the Trustees considered information provided by MFS as to the generally broader scope of services provided by MFS to the Fund, as well as the more extensive regulatory burdens imposed on MFS in managing the Fund, in comparison to separate accounts and subadvised funds. The Trustees also considered the higher demands placed on MFS’ investment personnel and trading infrastructure as a result of the daily cashin-flows andout-flows of the Fund in comparison to separate accounts.
The Trustees also considered whether the Fund may benefit from any economies of scale in the management of the Fund in the event of growth in assets of the Fund and/or growth in assets of the MFS Funds as a whole. They noted that the Fund’s advisory fee rate schedule is subject to contractual breakpoints that reduce the Fund’s advisory fee rate on average daily net assets over $1 billion and $2.5 billion. The Trustees also noted that MFS has agreed in writing to waive a portion of the management fees of certain MFS Funds, including the Fund, if the total combined assets of certain funds within the MFS Funds’ complex increase above agreed upon thresholds (the “group fee waiver”), enabling the Fund’s shareholders to share in the benefits from any economies of scale at the complex level. The group fee waiver is reviewed and renewed annually between the Board and MFS. The Trustees concluded that the breakpoints and the group fee waiver were sufficient to allow the Fund to benefit from economies of scale as its assets and overall complex assets grow.
The Trustees also considered information prepared by MFS relating to MFS’ costs and profits with respect to the Fund, the MFS Funds considered as a group, and other investment companies and accounts advised by MFS, as well as MFS’ methodologies used to determine and allocate its costs to the MFS Funds, the Fund and other accounts and products for purposes of estimating profitability.
After reviewing these and other factors described herein, the Trustees concluded, within the context of their overall conclusions regarding the investment advisory agreement, that the advisory fees charged to the Fund represent reasonable compensation in light of the services being provided by MFS to the Fund.
In addition, the Trustees considered MFS’ resources and related efforts to continue to retain, attract and motivate capable personnel to serve the Fund. The Trustees also considered current and developing conditions in the financial services industry, including the presence of large and well-capitalized companies which are spending, and appear to be prepared to continue to spend, substantial sums to engage personnel and to provide services to competing investment companies. In this regard, the Trustees also considered the financial resources of MFS and its ultimate parent, Sun Life Financial Inc. The Trustees also considered the advantages and possible disadvantages to the Fund of having an adviser that also serves other investment companies as well as other accounts.
The Trustees also considered the nature, quality, cost, and extent of administrative, transfer agency, and distribution services provided to the Fund by MFS and its affiliates under agreements and plans other than the investment advisory agreement, including any12b-1 fees the Fund pays to MFS Fund Distributors, Inc., an affiliate of MFS. The Trustees also considered the nature, extent and quality of certain other services MFS performs or arranges for on the Fund’s behalf, which may include securities lending programs, directed expense payment programs, class action recovery programs, and MFS’ interaction with third-party service providers, principally custodians andsub-custodians. The Trustees concluded that the variousnon-advisory services provided by MFS and its affiliates on behalf of the Fund were satisfactory.
The Trustees consideredso-called“fall-out benefits” to MFS such as reputational value derived from serving as investment manager to the MFS Funds. The Trustees also considered that, effective January 3, 2018, MFS had discontinued its historic practice of obtaining investment research from portfolio brokerage commissions paid by certain MFS Funds and would thereafter directly pay for or voluntarily reimburse a Fund, if applicable, for the costs of external research acquired through the use of the Fund’s portfolio brokerage commissions.
Based on their evaluation of factors that they deemed to be material, including those factors described above, the Board of Trustees, including the independent Trustees, concluded that the Fund’s investment advisory agreement with MFS should be continued for an additionalone-year period, commencing August 1, 2019.
24
MFS Global Real Estate Portfolio
PROXY VOTING POLICIES AND INFORMATION
MFS votes proxies on behalf of the fund pursuant to proxy voting policies and procedures that are available without charge, upon request, by calling 1-800-225-2606, by visitingmfs.com/proxyvoting, or by visiting the SEC’s Web site athttp://www.sec.gov.
Information regarding how the fund voted proxies relating to portfolio securities during the most recent twelve-month period ended June 30 is available by August 31 of each year without charge by visitingmfs.com/proxyvoting, or by visiting the SEC’s Web site athttp://www.sec.gov.
QUARTERLY PORTFOLIO DISCLOSURE
The fund files a complete schedule of portfolio holdings with the SEC for the first and third quarters of each fiscal year as an exhibit to its reports on Form N-PORT. The fund’s Form N-PORT reports are available on the SEC’s website athttp://www.sec.gov.A shareholder can obtain the portfolio holdings report for the first and third quarters of the fund’s fiscal year atmfs.com/vit3 by choosing the fund’s name and then selecting the “Resources” tab and clicking on “Prospectus and Reports”.
FURTHER INFORMATION
From time to time, MFS may post important information about the fund or the MFS funds on the MFS web site (mfs.com). This information is available athttps://www.mfs.com/en-us/what-we-do/announcements.html or at mfs.com/vit3by choosing the fund’s name.
INFORMATION ABOUT FUND CONTRACTS AND LEGAL CLAIMS
The fund has entered into contractual arrangements with an investment adviser, administrator, distributor, shareholder servicing agent, 529 program manager (if applicable), and custodian who each provide services to the fund. Unless expressly stated otherwise, shareholders are not parties to, or intended beneficiaries of these contractual arrangements, and these contractual arrangements are not intended to create any shareholder right to enforce them against the service providers or to seek any remedy under them against the service providers, either directly or on behalf of the fund.
Under the Trust’s By-Laws and Declaration of Trust, any claims asserted against or on behalf of the MFS Funds, including claims against Trustees and Officers, must be brought in state and federal courts located within the Commonwealth of Massachusetts.
FEDERAL TAX INFORMATION (unaudited)
The following information is provided pursuant to provisions of the Internal Revenue Code.
The fund designates $1,174,000 as capital gain dividends paid during the fiscal year.
25
rev. 3/16
| | | | |
| | | |
| FACTS | | WHAT DOES MFS DO WITH YOUR
PERSONAL INFORMATION? | |  |
| | |
| Why? | | Financial companies choose how they share your personal information. Federal law gives consumers the right to limit some but not all sharing. Federal law also requires us to tell you how we collect, share, and protect your personal information. Please read this notice carefully to understand what we do. |
| | |
| What? | | The types of personal information we collect and share depend on the product or service you have with us. This information can include: • Social Security number and account balances • Account transactions and transaction history • Checking account information and wire transfer instructions When you areno longer our customer, we continue to share your information as described in this notice. |
| | |
| How? | | All financial companies need to share customers’ personal information to run their everyday business. In the section below, we list the reasons financial companies can share their customers’ personal information; the reasons MFS chooses to share; and whether you can limit this sharing. |
| | | | |
Reasons we can share your
personal information | | Does MFS share? | | Can you limit this
sharing? |
For our everyday business purposes – such as to process your transactions, maintain your account(s), respond to court orders and legal investigations, or report to credit bureaus | | Yes | | No |
For our marketing purposes – to offer our products and services to you | | No | | We don’t share |
| For joint marketing with other financial companies | | No | | We don’t share |
For our affiliates’ everyday business purposes – information about your transactions and experiences | | No | | We don’t share |
For our affiliates’ everyday business purposes – information about your creditworthiness | | No | | We don’t share |
| For nonaffiliates to market to you | | No | | We don’t share |
| | |
| | |
| Questions? | | Call800-225-2606 or go tomfs.com. |
26
| | |
| Who we are |
| Who is providing this notice? | | MFS Funds, MFS Investment Management, MFS Institutional Advisors, Inc., and MFS Heritage Trust Company. |
| | |
| What we do |
| How does MFS protect my personal information? | | To protect your personal information from unauthorized access and use, we use security measures that comply with federal law. These measures include procedural, electronic, and physical safeguards for the protection of the personal information we collect about you. |
How does MFS
collect my personal information? | | We collect your personal information, for example, when you • open an account or provide account information • direct us to buy securities or direct us to sell your securities • make a wire transfer We also collect your personal information from others, such as credit bureaus, affiliates, or other companies. |
| Why can’t I limit all sharing? | | Federal law gives you the right to limit only • sharing for affiliates’ everyday business purposes – information about your creditworthiness • affiliates from using your information to market to you • sharing for nonaffiliates to market to you State laws and individual companies may give you additional rights to limit sharing. |
| | |
| Definitions |
| Affiliates | | Companies related by common ownership or control. They can be financial and nonfinancial companies. • MFS does not share personal information with affiliates, except for everyday business purposes as described on page one of this notice. |
| Nonaffiliates | | Companies not related by common ownership or control. They can be financial and nonfinancial companies. • MFS does not share with nonaffiliates so they can market to you. |
| Joint marketing | | A formal agreement between nonaffiliated financial companies that together market financial products or services to you. • MFS doesn’t jointly market. |
| | |
| Other important information |
| If you own an MFS product or receive an MFS service in the name of a third party such as a bank or broker-dealer, their privacy policy may apply to you instead of ours. |
27
Annual Report
December 31, 2019

MFS® Growth Allocation Portfolio

MFS® Variable Insurance Trust III
Beginning on January 1, 2021, as permitted by regulations adopted by the U.S. Securities and Exchange Commission, the insurance company that offers your contract may determine that it will no longer send you paper copies of the fund’s annual and semiannual shareholder reports unless you specifically request paper copies from the insurance company or from your financial intermediary. Instead, the shareholder reports will be made available on a Web site (insurancefunds.mfs.com or other Web site of which you will be notified), and the insurance company will notify you by mail each time a report is posted and provide you with a Web site link to access the report. Instructions for requesting paper copies will be provided by your insurance company or financial intermediary.
If you already elected to receive shareholder reports by email, you will not be affected by this change and you need not take any action. If your insurance company or financial intermediary offers electronic delivery, you may elect to receive shareholder reports and other communications from the insurance company or financial intermediary by email by following the instructions provided by the insurance company or financial intermediary.
Beginning on January 1, 2019, you may elect to receive all future reports in paper free of charge from the insurance company or financial intermediary. You can inform the insurance company or financial intermediary that you wish to continue receiving paper copies of your shareholder reports by contacting your insurance company or financial intermediary. Your election to receive reports in paper will apply to all funds held in your account with your insurance company or financial intermediary.
VGA-ANN
MFS® Growth Allocation Portfolio
CONTENTS
The report is prepared for the general information of contract owners. It is authorized for distribution to prospective investors only when preceded or accompanied by a current prospectus.
NOT FDIC INSURED• MAY LOSE VALUE• NO BANK OR CREDIT UNION GUARANTEE• NOT A DEPOSIT• NOT INSURED BY ANY FEDERAL GOVERNMENT AGENCY OR NCUA/NCUSIF
MFS Growth Allocation Portfolio
LETTER FROM THE EXECUTIVE CHAIR

Dear Contract Owners:
Slowing global growth, low inflation, and trade friction between the United States and China have been hallmarks of the past 12 months. After experiencing an uptick in market volatility in late 2018, markets steadied for most of 2019, thanks in large measure to the adoption of a dovish policy stance on the part of global central banks, focused on supporting economic growth. Negotiations aimed at a “phase one” trade deal between the U.S. and China bore fruit at the end of the period, boosting investor sentiment, while signs of stability emerging from the global manufacturing sector also lifted spirits. Uncertainty over Brexit, along with the ripple effects from the trade conflict, hampered business confidence and investment in the United Kingdom and Europe for much of the period, though investors expect greater clarity regarding Brexit as a result of December’s general election. The pro-Brexit Conservative Party won the election by a comfortable margin and set the stage for the U.K.’s departure from the EU at the end of January.
Markets expect the longest economic expansion in U.S. history will continue, albeit at a slower pace, as trade tensions recede. In an effort to prolong the expansion, the U.S. Federal Reserve lowered interest rates three times between July and October and the European Central Bank loosened policy in September. While the global monetary policy backdrop remains quite accommodative, signs of easing trade tensions and fading global recession fears led to improved market sentiment in late 2019 as investors grew less risk averse. In early 2020, an outbreak of coronavirus emanating from China reintroduced global growth fears, causing an uptick in volatility.
Here at MFS®, we aim to help our clients navigate the growing complexity of the markets and world economies. Our long-term investment philosophy and commitment to the responsible allocation of capital allow us to tune out the noise and uncover what we believe are the best, most durable investment opportunities in the market. Through our powerful global investment platform, we combine collective expertise, thoughtful risk management and long-term discipline to create sustainable value for investors.
Respectfully,

Robert J. Manning
Executive Chair
MFS Investment Management
February 14, 2020
The opinions expressed in this letter are subject to change and may not be relied upon for investment advice. No forecasts can be guaranteed.
1
MFS Growth Allocation Portfolio
PORTFOLIO COMPOSITION
Portfolio target allocation
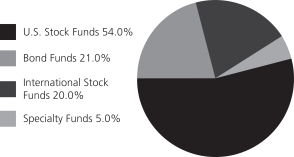
| | | | |
| Portfolio holdings | | | | |
| MFS Growth Series | | | 11.1% | |
| MFS Value Series | | | 11.1% | |
| MFS Research Series | | | 10.1% | |
| MFS Mid Cap Value Portfolio | | | 9.1% | |
| MFS Research International Portfolio | | | 9.1% | |
| MFS Mid Cap Growth Series | | | 9.0% | |
| MFS International Growth Portfolio | | | 5.0% | |
| MFS International Intrinsic Value Portfolio | | | 5.0% | |
| MFS High Yield Portfolio | | | 5.0% | |
| MFS Global Real Estate Portfolio | | | 4.9% | |
| MFS Total Return Bond Series | | | 4.9% | |
| MFS Inflation-Adjusted Bond Portfolio | | | 4.8% | |
| MFS Global Governments Portfolio | | | 3.8% | |
| MFS New Discovery Series | | | 2.0% | |
| MFS New Discovery Value Portfolio | | | 2.0% | |
| MFS Limited Maturity Portfolio | | | 2.0% | |
| MFS Emerging Markets Equity Portfolio | | | 1.0% | |
| Cash & Cash Equivalents | | | 0.1% | |
Portfolio actual allocation
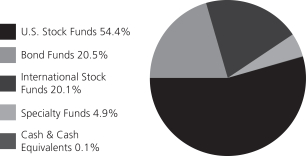
Cash & Cash Equivalents includes any cash, investments in money market funds, short-term securities, and other assets less liabilities. MFS endeavors to fully invest all MFSfunds-of-funds in underlying funds on a daily basis. Any divergence from 0.0% in Cash & Cash Equivalents is typically due to the timing of fund subscriptions/redemptions and the settlement of subsequent investment in/divestment from the underlying funds. While the MFSfunds-of-funds’ subscriptions/redemptions are processed at the same day NAV of the underlying funds, a positive/negative cash balance will be reflected on the MFSfunds-of-funds’ Statements of Assets and Liabilities until the trades with the underlying funds settle, which is typically two business days. Please see the Statements of Assets and Liabilities for additional information related to the fund’s cash position and other assets and liabilities.
Percentages are based on net assets as of December 31, 2019.
The portfolio is actively managed and current holdings may be different.
2
MFS Growth Allocation Portfolio
MANAGEMENT REVIEW
Summary of Results
For the twelve months ended December 31, 2019, Initial Class shares of the MFS Growth Allocation Portfolio (fund) provided a total return of 26.96%, while Service Class shares of the fund provided a total return of 26.66%. These compare with a return of 31.49% for the fund’s benchmark, the Standard & Poor’s 500 Stock Index (S&P 500 Index). The fund’s other benchmark, the MFS Growth Allocation Portfolio Blended Index (Blended Index), generated a return of 24.25%. The Blended Index reflects the blended returns of various equity and fixed income market indices, with percentage allocations to each index designed to resemble the allocations of the fund. The market indices and related percentage allocations used to compile the Blended Index are set forth in the Performance Summary.
Market Environment
Fading fears of a near-term global recession, the announcement of a partial trade deal between the United States and China and the decline in uncertainty over Brexit helped bolster market sentiment late in the period. Changes in market sentiment, largely driven by uncertainty over the outcome of trade negotiations between the US and China, had contributed to periodic bouts of volatility during the reporting period. The global economy decelerated, led by weakness in China and Europe, although the pace of the slowdown moderated late in the period amid nascent signs of stabilization in the manufacturing sector.
The deteriorating global growth backdrop, along with declining inflationary pressures, prompted the US Federal Reserve to adopt a more dovish posture beginning in early 2019, resulting in the first interest rate cut in over a decade at the end of July, followed by additional cuts in September and October. The Fed’s actions led to a sharp decline in long-term interest rates during the period’s second half, causing the inversion of portions of the US Treasury yield curve for a time. Amid an improvement in risk sentiment in Q4 2019 and indications of a bottoming in growth and a potential upturn in activity, the Fed indicated in October that further rate cuts were unlikely unless the outlook for the economy materially worsened.
Globally, central banks have tilted more dovish as well, with the European Central Bank unveiling a package of easing measures, which included putting overnight rates deeper into negative territory, restarting its bond-buying program and lengthening the term of cheap loans to banks to three years from two. The central banks of India and Australia are among those that have cut rates several times in recent months, although China has been more cautious in increasing liquidity as it keeps trying to deleverage its economy, cutting rates only marginally.
Emerging markets experienced considerable volatility through the end of 2018, as tighter global financial conditions exposed structural weakness in some countries. Those conditions improved in 2019 as the Fed became more dovish. Notwithstanding the periodic headwinds on market sentiment from significant trade friction between the US and China over much of the year, emerging market hard currency debt and local rates benefited from relatively cheap valuations at the beginning of the period and easier global monetary conditions. These factors, plus the fading of certain global risk factors mentioned above, hastened spread tightening in the latter part of the period. At the same time, idiosyncratic risks spiked in some countries (e.g., Argentina and Lebanon), contributing to increased dispersion in performance among sovereign assets.
Factors Affecting Performance
During the reporting period, the fund underperformed its benchmark, the S&P 500 Index, primarily due to its allocation to the fixed income markets, which lagged the exceptionally strong performance of the equity markets. Over the same period, the fund outperformed the Blended Index.
Relative to the Blended Index, strong relative performance across all funds within the U.S. equity asset class strengthened returns, as all funds within this segment outpaced their respective benchmarks. Additionally, the fund’s exposure to large- andmid-capitalization growth funds, particularly the MFS Growth Series and MFS Mid Cap Growth Series, helped relative returns and offset weakness from the fund’s exposure to large- and mid-capitalization value strategies, most notably the MFS Value Series and MFS Mid Cap Value Portfolio.
The international equity segment was another positive factor for relative performance as both the MFS Research International Portfolio and MFS International Intrinsic Value Portfolio outperformed their respective benchmarks during the reporting period.
Within the specialty segment, the fund’s relative performance of the Global Real Estate Fund also benefited relative returns as the fund outpaced its designated benchmark.
The fund’s exposure to the fixed income asset class marginally supported relative performance, led by the fund’s allocation to the MFS High Yield Portfolio. Conversely, strong bond market performance during the period hurt funds with shorter relative durations, particularly the MFS Limited Maturity Portfolio. Additionally, the fund’s allocation to the MFS Global Governments Portfolio weakened relative performance, driven by this fund’s global exposure to a strong US dollar environment.
Respectfully,
Portfolio Manager(s)
Joseph Flaherty and Natalie Shapiro
3
MFS Growth Allocation Portfolio
Management Review – continued
The views expressed in this report are those of the portfolio manager(s) only through the end of the period of the report as stated on the cover and do not necessarily reflect the views of MFS or any other person in the MFS organization. These views are subject to change at any time based on market or other conditions, and MFS disclaims any responsibility to update such views. These views may not be relied upon as investment advice or an indication of trading intent on behalf of any MFS portfolio. References to specific securities are not recommendations of such securities, and may not be representative of any MFS portfolio’s current or future investments.
4
MFS Growth Allocation Portfolio
PERFORMANCE SUMMARY THROUGH 12/31/19
The following chart illustrates the historical performance of the fund in comparison to its benchmark(s). Benchmarks are unmanaged and may not be invested in directly. Benchmark returns do not reflect any fees or expenses. The performance of other share classes will be greater than or less than that of the class depicted below. (See Notes to Performance Summary.)
Performance data shown represents past performance and is no guarantee of future results. Investment return and principal value fluctuate so your units, when sold, may be worth more or less than the original cost; current performance may be lower or higher than quoted. The performance shown does not reflect the deduction of taxes, if any, that a contract holder would pay on fund distributions or the redemption of contract units. The returns for the fund shown also do not reflect the deduction of expenses associated with variable products, such as mortality and expense risk charges, separate account charges, and sales charges imposed by the insurance company separate accounts. Such expenses would reduce the overall returns shown.
Growth of a Hypothetical $10,000 Investment
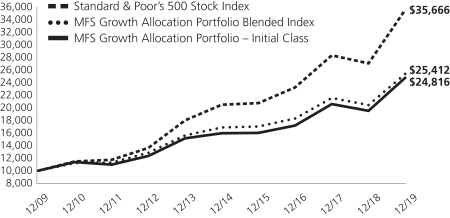
Total Returns through 12/31/19
Average annual total returns
| | | | | | | | | | | | |
| | | Share Class | | Class Inception Date | | 1-yr | | 5-yr | | 10-yr | | |
| | | Initial Class | | 10/01/08 | | 26.96% | | 9.22% | | 9.51% | | |
| | | Service Class | | 10/01/08 | | 26.66% | | 8.95% | | 9.25% | | |
| | | | |
| Comparative benchmark(s) | | | | | | | | |
| | | Standard & Poor’s 500 Stock Index (f) | | 31.49% | | 11.70% | | 13.56% | | |
| | | MFS Growth Allocation Portfolio Blended Index (f)(w) | | 24.25% | | 8.50% | | 9.77% | | |
| | | Bloomberg Barclays U.S. Aggregate Bond Index (f) | | 8.72% | | 3.05% | | 3.75% | | |
| | | FTSE EPRA Nareit Developed Real Estate Index (net div) (f) | | 21.91% | | 5.56% | | 8.37% | | |
| | | MSCI EAFE Index (net div) (f) | | 22.01% | | 5.67% | | 5.50% | | |
| (f) | | Source: FactSet Research Systems Inc. |
| (w) | | As of December 31, 2019, the MFS Growth Allocation Portfolio Blended Index (a custom index) was comprised of 54% Standard & Poor’s 500 Stock Index, 21% Bloomberg Barclays U.S. Aggregate Bond Index, 20% MSCI EAFE Index (net div), and 5% FTSE EPRA Nareit Developed Real Estate Index (net div). |
Benchmark Definition(s)
Bloomberg Barclays U.S. Aggregate Bond Index – a market capitalization-weighted index that measures the performance of the U.S. investment-grade, fixed rate bond market, with index components for government and corporate securities, mortgage pass-through securities, and asset-backed securities with at least one year to final maturity. BLOOMBERG® is a trademark and service mark of Bloomberg Finance L.P. and its affiliates (collectively “Bloomberg”). BARCLAYS® is a trademark and service mark of Barclays Bank Plc (collectively with its affiliates, “Barclays”), used under license. Bloomberg or Bloomberg’s licensors, including Barclays, own all proprietary rights in the Bloomberg Barclays Indices. Neither Bloomberg nor Barclays approves or endorses this material, or guarantees the accuracy or completeness of any information herein, or makes any warranty, express or implied, as to the results to be obtained therefrom, and, to the maximum extent allowed by law, neither shall have any liability or responsibility for injury or damages arising in connection therewith.
5
MFS Growth Allocation Portfolio
Performance Summary – continued
FTSE EPRA Nareit Developed Real Estate Index (net div) – measures the performance of eligible real estate equities worldwide that generate a majority of their revenue and income through the ownership, disposure and development of income-producing real estate. FTSE International Limited (“FTSE”)© FTSE 2019. “FTSE®” is a trademark of the London Stock Exchange Group companies and is used by FTSE International Limited under license. “FT-SE®”, “FOOTSIE®” and “FTSE4GOOD®” are trademarks of the London Stock Exchange Group companies. “Nareit®” is a trademark of the National Association of Real Estate Investment Trusts (“Nareit”) and “EPRA®” is a trademark of the European Public Real Estate Association (“EPRA”) and all are used by FTSE under license. The FTSE EPRA Nareit Developed Real Estate Index is calculated by FTSE. Neither FTSE, Euronext N.V., Nareit, nor EPRA sponsor, endorse, or promote this product and are not in any way connected to it and do not accept any liability. All intellectual property rights in the index values and constituent list vests in FTSE, Euronext N.V., Nareit, and EPRA. Neither FTSE nor its licensors accept any liability for any errors or omissions in the FTSE indices and/or FTSE ratings or underlying data. No further distribution of FTSE Data is permitted without FTSE’s express written consent.
MSCI EAFE (Europe, Australasia, Far East) Index (net div) – a market capitalization index that is designed to measure equity market performance in the developed markets, excluding the U.S. and Canada. Morgan Stanley Capital International (“MSCI”) makes no express or implied warranties or representations and shall have no liability whatsoever with respect to any MSCI data contained herein. The MSCI data may not be further redistributed or used as a basis for other indices or any securities or financial products. This report is not approved, reviewed, or produced by MSCI.
Standard & Poor’s 500 Stock Index – a market capitalization-weighted index of 500 widely held equity securities, designed to measure broad U.S. equity performance. “Standard & Poor’s®” and “S&P®” are registered trademarks of Standard & Poor’s Financial Services LLC (“S&P”) and Dow Jones is a registered trademark of Dow Jones Trademark Holdings LLC (“Dow Jones”) and have been licensed for use by S&P Dow Jones Indices LLC and sublicensed for certain purposes by Massachusetts Financial Services Company. The S&P 500® is a product of S&P Dow Jones Indices LLC, and has been licensed for use by Massachusetts Financial Services Company. Massachusetts Financial Services Company’s product(s) is not sponsored, endorsed, sold, or promoted by S&P Dow Jones Indices LLC, Dow Jones, S&P, or their respective affiliates, and neither S&P Dow Jones Indices LLC, Dow Jones, S&P, nor their respective affiliates make any representation regarding the advisability of investing in such product(s).
It is not possible to invest directly in an index.
Notes to Performance Summary
Average annual total return represents the average annual change in value for each share class for the periods presented.
Performance prior to close of business December 7, 2012, reflects time periods when another adviser or subadviser was responsible for selecting investments for the fund under a different investment objective and different investment strategies, underlying fund selections, and underlying fund target weightings of the fund.
Performance results reflect any applicable expense subsidies and waivers in effect during the periods shown. Without such subsidies and waivers the fund’s performance results would be less favorable. Please see the prospectus and financial statements for complete details. All results are historical and assume the reinvestment of any dividends and capital gains distributions.
Performance results do not include adjustments made for financial reporting purposes in accordance with U.S. generally accepted accounting principles and may differ from amounts reported in the financial highlights.
From time to time the fund may receive proceeds from litigation settlements, without which performance would be lower.
6
MFS Growth Allocation Portfolio
EXPENSE TABLE
Fund Expenses Borne by the Contract Holders during the Period,
July 1, 2019 through December 31, 2019
As a contract holder of the fund, you incur ongoing costs, including distribution and/or service(12b-1) fees; and other fundexpenses. This example is intended to help you understand your ongoing costs (in dollars) of investing in the fund and to compare these costs with the ongoing costs of investing in other mutual funds.
In addition to the fees and expenses which the fund bears directly, the fund indirectly bears a pro rata share of the fees and expenses of the underlying funds in which the fund invests. Because the underlying funds have varied expenses and fee levels and the fund may own different proportions of the underlying funds at different times, the amount of fees and expenses incurred indirectly by the fund will vary. If these indirect costs were included, your costs would have been higher.
The example is based on an investment of $1,000 invested at the beginning of the period and held for the entire period July 1, 2019 through December 31, 2019.
Actual Expenses
The first line for each share class in the following table provides information about actual account values and actual expenses. You may use the information in this line, together with the amount you invested, to estimate the expenses that you paid over the period. Simply divide your account value by $1,000 (for example, an $8,600 account value divided by $1,000 = 8.6), then multiply the result by the number in the first line under the heading entitled “Expenses Paid During Period” to estimate the expenses you paid on your account during this period.
Hypothetical Example for Comparison Purposes
The second line for each share class in the following table provides information about hypothetical account values and hypothetical expenses based on the fund’s actual expense ratio and an assumed rate of return of 5% per year before expenses, which is not the fund’s actual return. The hypothetical account values and expenses may not be used to estimate the actual ending account balance or expenses you paid for the period. You may use this information to compare the ongoing costs of investing in the fund and other funds. To do so, compare this 5% hypothetical example with the 5% hypothetical examples that appear in the shareholder reports of the other funds.
Please note that the expenses shown in the table are meant to highlight the fund’s ongoing costs only and do not take into account the fees and expenses imposed under the variable contracts through which your investment in the fund is made. Therefore, the second line for each share class in the table is useful in comparing ongoing costs associated with an investment in vehicles (such as the fund) which fund benefits under variable annuity and variable life insurance contracts and to qualified pension and retirement plans only, and will not help you determine the relative total costs of investing in the fund through variable annuity and variable life insurance contracts. If the fees and expenses imposed under the variable contracts were included, your costs would have been higher.
| | | | | | | | | | | | | | | | | | |
| Share Class | | | | Annualized
Expense Ratio | | | Beginning
Account Value
7/01/19 | | | Ending
Account Value
12/31/19 | | | Expenses Paid
During Period (p)
7/01/19-12/31/19 | |
| Initial Class | | Actual | | | 0.03% | | | | $1,000.00 | | | | $1,074.70 | | | | $0.16 | |
| | Hypothetical (h) | | | 0.03% | | | | $1,000.00 | | | | $1,025.05 | | | | $0.15 | |
| Service Class | | Actual | | | 0.28% | | | | $1,000.00 | | | | $1,073.16 | | | | $1.46 | |
| | Hypothetical (h) | | | 0.28% | | | | $1,000.00 | | | | $1,023.79 | | | | $1.43 | |
| (h) | 5% class return per year before expenses. |
| (p) | “Expenses Paid During Period” are equal to each class’s annualized expense ratio, as shown above, multiplied by the average account value over the period, multiplied by 184/365 (to reflect theone-half year period). In addition to the fees and expenses which the fund bears directly, the fund indirectly bears a pro rata share of the fees and expenses of the underlying funds in which the fund invests. If these indirect costs were included, your costs would have been higher. |
7
MFS Growth Allocation Portfolio
PORTFOLIO OF INVESTMENTS – 12/31/19
The Portfolio of Investments is a complete list of all securities owned by your fund. It is categorized by broad-based asset classes.
| | | | | | | | |
| | |
| Issuer | | Shares/Par | | | Value ($) | |
| INVESTMENT COMPANIES (h) – 100.0% | | | | | |
| Bond Funds – 20.5% | | | | | |
| MFS Global Governments Portfolio – Initial Class | | | 1,273,423 | | | $ | 13,638,361 | |
| MFS High Yield Portfolio – Initial Class | | | 3,093,744 | | | | 17,696,214 | |
| MFS Inflation-Adjusted Bond Portfolio – Initial Class | | | 1,590,916 | | | | 17,197,803 | |
| MFS Limited Maturity Portfolio – Initial Class | | | 673,239 | | | | 6,961,289 | |
| MFS Total Return Bond Series – Initial Class | | | 1,287,177 | | | | 17,351,149 | |
| | | | | | | | |
| | | | | | $ | 72,844,816 | |
| | | | | | | | |
| International Stock Funds – 20.1% | | | | | |
| MFS Emerging Markets Equity Portfolio – Initial Class | | | 211,150 | | | $ | 3,600,110 | |
| MFS International Growth Portfolio – Initial Class | | | 1,254,246 | | | | 17,885,547 | |
| MFS International Intrinsic Value Portfolio – Initial Class | | | 595,850 | | | | 17,839,754 | |
| MFS Research International Portfolio – Initial Class | | | 1,898,496 | | | | 32,198,485 | |
| | | | | | | | |
| | | | | | $ | 71,523,896 | |
| | | | | | | | |
| Specialty Funds – 4.9% | | | | | |
| MFS Global Real Estate Portfolio – Initial Class | | | 1,096,452 | | | $ | 17,444,547 | |
| | | | | | | | |
| U.S. Stock Funds – 54.4% | | | | | |
| MFS Growth Series – Initial Class | | | 662,991 | | | $ | 39,381,667 | |
| MFS Mid Cap Growth Series – Initial Class | | | 3,222,852 | | | | 32,099,606 | |
| MFS Mid Cap Value Portfolio – Initial Class | | | 3,686,115 | | | | 32,216,646 | |
| MFS New Discovery Series – Initial Class | | | 352,604 | | | | 7,150,811 | |
| MFS New Discovery Value Portfolio – Initial Class | | | 765,551 | | | | 7,142,586 | |
| MFS Research Series – Initial Class | | | 1,213,584 | | | | 35,788,600 | |
| MFS Value Series – Initial Class | | | 1,877,031 | | | | 39,323,802 | |
| | | | | | | | |
| | | | | | $ | 193,103,718 | |
| | | | | | | | |
| | | | | | | | |
| | |
| Issuer | | Shares/Par | | | Value ($) | |
| INVESTMENT COMPANIES (h) – continued | | | | | |
| Money Market Funds – 0.1% | | | | | |
| MFS Institutional Money Market Portfolio, 1.7% (v) | | | 263,585 | | | $ | 263,585 | |
| | | | | | | | |
Total Investment Companies
(Identified Cost, $268,457,780) | | | | | | $ | 355,180,562 | |
| | | | | | | | |
OTHER ASSETS, LESS
LIABILITIES – (0.0)% | | | | | | | (46,308 | ) |
| | | | | | | | |
| NET ASSETS – 100.0% | | | | | | $ | 355,134,254 | |
| | | | | | | | |
| (h) | | An affiliated issuer, which may be considered one in which the fund owns 5% or more of the outstanding voting securities, or a company which is under common control. At period end, the aggregate value of the fund’s investments in affiliated issuers was $355,180,562. |
| (v) | | Affiliated issuer that is available only to investment companies managed by MFS. The rate quoted for the MFS Institutional Money Market Portfolio is the annualizedseven-day yield of the fund at period end. |
See Notes to Financial Statements
8
MFS Growth Allocation Portfolio
FINANCIAL STATEMENTS | STATEMENT OF ASSETS AND LIABILITIES
This statement represents your fund’s balance sheet, which details the assets and liabilities comprising the total value of the fund.
| | | | |
At 12/31/19 | | | | |
| |
Assets | | | | |
Investments in affiliated issuers, at value (identified cost, $268,457,780) | | | $355,180,562 | |
Receivables for | | | | |
Investments sold | | | 587,642 | |
Fund shares sold | | | 791 | |
Other assets | | | 2,105 | |
Total assets | | | $355,771,100 | |
| |
Liabilities | | | | |
Payables for | | | | |
Fund shares reacquired | | | $588,433 | |
Payable to affiliates | | | | |
Administrative services fee | | | 96 | |
Shareholder servicing costs | | | 13 | |
Distribution and/or service fees | | | 4,817 | |
Payable for independent Trustees’ compensation | | | 19 | |
Accrued expenses and other liabilities | | | 43,468 | |
Total liabilities | | | $636,846 | |
Net assets | | | $355,134,254 | |
| |
Net assets consist of | | | | |
Paid-in capital | | | $235,426,350 | |
Total distributable earnings (loss) | | | 119,707,904 | |
Net assets | | | $355,134,254 | |
Shares of beneficial interest outstanding | | | 29,711,782 | |
| | | | | | | | | | | | |
| | | |
| | | Net assets | | | Shares
outstanding | | | Net asset value
per share | |
Initial Class | | | $3,904,834 | | | | 327,212 | | | | $11.93 | |
Service Class | | | 351,229,420 | | | | 29,384,570 | | | | 11.95 | |
See Notes to Financial Statements
9
MFS Growth Allocation Portfolio
FINANCIAL STATEMENTS | STATEMENT OF OPERATIONS
This statement describes how much your fund earned in investment income and accrued in expenses. It also describes any gains and/or losses generated by fund operations.
| | | | |
Year ended 12/31/19 | | | | |
| |
Net investment income (loss) | | | | |
Income | | | | |
Dividends from affiliated issuers | | | $7,019,070 | |
Other | | | 70 | |
Total investment income | | | $7,019,140 | |
Expenses | | | | |
Distribution and/or service fees | | | $875,038 | |
Shareholder servicing costs | | | 3,761 | |
Administrative services fee | | | 17,500 | |
Independent Trustees’ compensation | | | 10,336 | |
Custodian fee | | | 6,033 | |
Shareholder communications | | | 8,275 | |
Audit and tax fees | | | 39,728 | |
Legal fees | | | 3,021 | |
Miscellaneous | | | 28,415 | |
Total expenses | | | $992,107 | |
Net investment income (loss) | | | $6,027,033 | |
| |
Realized and unrealized gain (loss) | | | | |
Realized gain (loss) (identified cost basis) | | | | |
Investments in affiliated issuers | | | $8,333,248 | |
Capital gain distributions from underlying affiliated funds | | | 20,285,249 | |
Net realized gain (loss) | | | $28,618,497 | |
Change in unrealized appreciation or depreciation | | | | |
Affiliated issuers | | | $48,715,269 | |
Net realized and unrealized gain (loss) | | | $77,333,766 | |
Change in net assets from operations | | | $83,360,799 | |
See Notes to Financial Statements
10
MFS Growth Allocation Portfolio
FINANCIAL STATEMENTS | STATEMENTS OF CHANGES IN NET ASSETS
These statements describe the increases and/or decreases in net assets resulting from operations, any distributions, and any shareholder transactions.
| | | | | | | | |
| | | Year ended | |
| | | 12/31/19 | | | 12/31/18 | |
Change in net assets | | | | | | | | |
| | |
From operations | | | | | | | | |
Net investment income (loss) | | | $6,027,033 | | | | $7,018,153 | |
Net realized gain (loss) | | | 28,618,497 | | | | 32,678,338 | |
Net unrealized gain (loss) | | | 48,715,269 | | | | (57,580,295 | ) |
Change in net assets from operations | | | $83,360,799 | | | | $(17,883,804 | ) |
Total distributions to shareholders | | | $(39,693,390 | ) | | | $(30,865,393 | ) |
Change in net assets from fund share transactions | | | $(22,623,140 | ) | | | $(37,200,488 | ) |
Total change in net assets | | | $21,044,269 | | | | $(85,949,685 | ) |
| | |
Net assets | | | | | | | | |
At beginning of period | | | 334,089,985 | | | | 420,039,670 | |
At end of period | | | $355,134,254 | | | | $334,089,985 | |
See Notes to Financial Statements
11
MFS Growth Allocation Portfolio
FINANCIAL STATEMENTS | FINANCIAL HIGHLIGHTS
The financial highlights table is intended to help you understand the fund’s financial performance for the past 5 years. Certain information reflects financial results for a single fund share. The total returns in the table represent the rate that an investor would have earned (or lost) on an investment in the fund share class (assuming reinvestment of all distributions) held for the entire period.
| | | | | | | | | | | | | | | | | | | | |
| Initial Class | | Year ended | |
| | | | | |
| | | 12/31/19 | | | 12/31/18 | | | 12/31/17 | | | 12/31/16 | | | 12/31/15 | |
| | | | | |
Net asset value, beginning of period | | | $10.64 | | | | $12.21 | | | | $10.97 | | | | $11.27 | | | | $12.42 | |
| | | | | |
| Income (loss) from investment operations | | | | | | | | | | | | | | | | | | | | |
Net investment income (loss) (d)(l) | | | $0.22 | | | | $0.26 | | | | $0.21 | | | | $0.20 | (c) | | | $0.21 | |
Net realized and unrealized gain (loss) | | | 2.53 | | | | (0.78 | ) | | | 1.91 | | | | 0.62 | | | | (0.19 | ) |
Total from investment operations | | | $2.75 | | | | $(0.52 | ) | | | $2.12 | | | | $0.82 | | | | $0.02 | |
| | | | | |
| Less distributions declared to shareholders | | | | | | | | | | | | | | | | | | | | |
From net investment income | | | $(0.29 | ) | | | $(0.23 | ) | | | $(0.23 | ) | | | $(0.32 | ) | | | $(0.58 | ) |
From net realized gain | | | (1.17 | ) | | | (0.82 | ) | | | (0.65 | ) | | | (0.80 | ) | | | (0.59 | ) |
Total distributions declared to shareholders | | | $(1.46 | ) | | | $(1.05 | ) | | | $(0.88 | ) | | | $(1.12 | ) | | | $(1.17 | ) |
Net asset value, end of period (x) | | | $11.93 | | | | $10.64 | | | | $12.21 | | | | $10.97 | | | | $11.27 | |
Total return (%) (k)(r)(s)(x) | | | 26.96 | | | | (5.20 | ) | | | 19.86 | | | | 7.15 | (c) | | | 0.53 | |
| | | | | |
Ratios (%) (to average net assets)
and Supplemental data: | | | | | | | | | | | | | | | | | | | | |
Expenses before expense reductions (f)(h) | | | 0.03 | | | | 0.03 | | | | 0.03 | | | | 0.03 | (c) | | | 0.02 | |
Expenses after expense reductions (f)(h) | | | N/A | | | | N/A | | | | N/A | | | | N/A | | | | N/A | |
Net investment income (loss) (l) | | | 1.88 | | | | 2.13 | | | | 1.75 | | | | 1.81 | (c) | | | 1.75 | |
Portfolio turnover | | | 0 | (b) | | | 2 | | | | 2 | | | | 1 | | | | 1 | |
Net assets at end of period (000 omitted) | | | $3,905 | | | | $3,770 | | | | $4,116 | | | | $3,140 | | | | $2,908 | |
| |
| Service Class | | Year ended | |
| | | | | |
| | | 12/31/19 | | | 12/31/18 | | | 12/31/17 | | | 12/31/16 | | | 12/31/15 | |
| | | | | |
Net asset value, beginning of period | | | $10.65 | | | | $12.22 | | | | $10.98 | | | | $11.27 | | | | $12.41 | |
| | | | | |
| Income (loss) from investment operations | | | | | | | | | | | | | | | | | | | | |
Net investment income (loss) (d)(l) | | | $0.20 | | | | $0.22 | | | | $0.17 | | | | $0.17 | (c) | | | $0.17 | |
Net realized and unrealized gain (loss) | | | 2.52 | | | | (0.77 | ) | | | 1.92 | | | | 0.63 | | | | (0.18 | ) |
Total from investment operations | | | $2.72 | | | | $(0.55 | ) | | | $2.09 | | | | $0.80 | | | | $(0.01 | ) |
| | | | | |
| Less distributions declared to shareholders | | | | | | | | | | | | | | | | | | | | |
From net investment income | | | $(0.25 | ) | | | $(0.20 | ) | | | $(0.20 | ) | | | $(0.29 | ) | | | $(0.54 | ) |
From net realized gain | | | (1.17 | ) | | | (0.82 | ) | | | (0.65 | ) | | | (0.80 | ) | | | (0.59 | ) |
Total distributions declared to shareholders | | | $(1.42 | ) | | | $(1.02 | ) | | | $(0.85 | ) | | | $(1.09 | ) | | | $(1.13 | ) |
Net asset value, end of period (x) | | | $11.95 | | | | $10.65 | | | | $12.22 | | | | $10.98 | | | | $11.27 | |
Total return (%) (k)(r)(s)(x) | | | 26.66 | | | | (5.46 | ) | | | 19.51 | | | | 6.94 | (c) | | | 0.30 | |
| | | | | |
Ratios (%) (to average net assets)
and Supplemental data: | | | | | | | | | | | | | | | | | | | | |
Expenses before expense reductions (f)(h) | | | 0.28 | | | | 0.28 | | | | 0.28 | | | | 0.28 | (c) | | | 0.27 | |
Expenses after expense reductions (f)(h) | | | N/A | | | | N/A | | | | N/A | | | | N/A | | | | N/A | |
Net investment income (loss) (l) | | | 1.70 | | | | 1.80 | | | | 1.40 | | | | 1.50 | (c) | | | 1.40 | |
Portfolio turnover | | | 0 | (b) | | | 2 | | | | 2 | | | | 1 | | | | 1 | |
Net assets at end of period (000 omitted) | | | $351,229 | | | | $330,320 | | | | $415,923 | | | | $420,657 | | | | $468,237 | |
See Notes to Financial Statements
12
MFS Growth Allocation Portfolio
Financial Highlights – continued
| (c) | Amount reflects aone-time reimbursement of expenses by the custodian (or former custodian) without which net investment income and performance would be lower and expenses would be higher. |
| (d) | Per share data is based on average shares outstanding. |
| (f) | Ratios do not reflect reductions from fees paid indirectly, if applicable. |
| (h) | In addition to the fees and expenses which the fund bears directly, the fund indirectly bears a pro rata share of the fees and expenses of the underlying affiliated funds in which the fund invests. Accordingly, the expense ratio for the fund reflects only those fees and expenses borne directly by the fund. Because the underlying affiliated funds have varied expense and fee levels and the fund may own different proportions of the underlying affiliated funds at different times, the amount of fees and expenses incurred indirectly by the fund will vary. |
| (k) | The total return does not reflect expenses that apply to separate accounts. Inclusion of these charges would reduce the total return figures for all periods shown. |
| (l) | The ratios and per share amounts do not include net investment income of the underlying affiliated funds in which the fund invests. |
| (r) | Certain expenses have been reduced without which performance would have been lower. |
| (s) | From time to time the fund may receive proceeds from litigation settlements, without which performance would be lower. |
| (x) | The net asset values and total returns have been calculated on net assets which include adjustments made in accordance with U.S. generally accepted accounting principles required at period end for financial reporting purposes. |
See Notes to Financial Statements
13
MFS Growth Allocation Portfolio
NOTES TO FINANCIAL STATEMENTS
| (1) | | Business and Organization |
MFS Growth Allocation Portfolio (the fund) is a diversified series of MFS Variable Insurance Trust III (the trust). The trust is organized as a Delaware statutory trust and is registered under the Investment Company Act of 1940, as amended, as anopen-end management investment company. The shareholders of each series of the trust are separate accounts of insurance companies, which offer variable annuity and/or life insurance products, and qualified retirement and pension plans.
The fund is an investment company and accordingly follows the investment company accounting and reporting guidance of the Financial Accounting Standards Board (FASB) Accounting Standards Codification Topic 946 Financial Services – Investment Companies.
| (2) | | Significant Accounting Policies |
General– The preparation of financial statements in conformity with U.S. generally accepted accounting principles requires management to make estimates and assumptions that affect the reported amounts of assets and liabilities, and disclosure of contingent assets and liabilities at the date of the financial statements and the reported amounts of increases and decreases in net assets from operations during the reporting period. Actual results could differ from those estimates. In the preparation of these financial statements, management has evaluated subsequent events occurring after the date of the fund’s Statement of Assets and Liabilities through the date that the financial statements were issued.
The fund is a “fund of funds”, which invests the majority of its assets in other MFS mutual funds (hereafter referred to as “underlying affiliated funds” or “underlying funds”), which may have different fiscal year ends than the funds. The underlying funds, in turn, may engage in a number of investment techniques and practices, which involve certain risks. Certain underlying funds invest their portfolio in high-yield securities rated below investment grade. Investments in below investment grade quality securities can involve a substantially greater risk of default or can already be in default, and their values can decline significantly. Below investment grade quality securities tend to be more sensitive to adverse news about the issuer, or the market or economy in general, than higher quality debt instruments. Certain underlying funds invest a significant portion of their assets in asset-backed and/ormortgage-backed securities. For these securities, the value of the debt instrument also depends on the credit quality and adequacy of the underlying assets or collateral as well as whether there is a security interest in the underlying assets or collateral. Enforcing rights, if any, against the underlying assets or collateral may be difficult. U.S. Government securities not supported as to the payment of principal or interest by the U.S. Treasury, such as those issued by Fannie Mae, Freddie Mac, and the Federal Home Loan Banks, are subject to greater credit risk than are U.S. Government securities supported by the U.S. Treasury, such as those issued by Ginnie Mae. Certain underlying funds invest in foreign securities, including securities of emerging market issuers. Investments in foreign securities are vulnerable to the effects of changes in the relative values of the local currency and the U.S. dollar and to the effects of changes in each country’s market, economic, industrial, political, regulatory, geopolitical, and other conditions. Investments in emerging markets can involve additional and greater risks than the risks associated with investments in developed foreign markets. Emerging markets can have less developed markets, greater custody and operational risk, less developed legal, regulatory, and accounting systems, and greater political, social, and economic instability than developed markets.
The accounting policies of the underlying funds in which the fund invests are outlined in the underlying funds’ shareholder reports, which are available without charge by calling1-800-225-2606, at mfs.com and on the Securities and Exchange Commission (SEC) web site at http://www.sec.gov. The underlying funds’ shareholder reports are not covered by this report.
Investment Valuations–Open-end investment companies (underlying funds) are generally valued at their net asset value per share. The investments of underlying funds managed by the adviser are valued as described below. For purposes of this policy disclosure, “fund” also refers to the underlying funds in which thefund-of-funds invests.
Equity securities, including restricted equity securities and equity securities sold short, are generally valued at the last sale or official closing price on their primary market or exchange as provided by a third-party pricing service. Equity securities, for which there were no sales reported that day, are generally valued at the last quoted daily bid quotation on their primary market or exchange as provided by a third-party pricing service. Equity securities sold short, for which there were no sales reported for that day, are generally valued at the last quoted daily ask quotation on their primary market or exchange as provided by a third-party pricing service. Debt instruments and floating rate loans, including restricted debt instruments, are generally valued at an evaluated or composite bid as provided by a third-party pricing service. Debt instruments sold short are generally valued at an evaluated or composite mean as provided by a third-party pricing service. Short-term instruments with a maturity at issuance of 60 days or less may be valued at amortized cost, which approximates market value. Exchange-traded options are generally valued at the last sale or official closing price on their primary exchange as provided by a third-party pricing service. Exchange-traded options for which there were no sales reported that day are generally valued at the last daily bid quotation on their primary exchange as provided by athird-party pricing service. For put options, the position may be valued at the last daily ask quotation if there are no trades reported during the day. Options not traded on an exchange are generally valued at a broker/dealer bid quotation. Foreign currency options are generally valued at valuations provided by a third-party pricing service. Futures contracts are generally valued at last posted settlement price on their primary exchange as provided by a third-party pricing service. Futures contracts for which there were no
14
MFS Growth Allocation Portfolio
Notes to Financial Statements – continued
trades that day for a particular position are generally valued at the closing bid quotation on their primary exchange as provided by a third-party pricing service. Forward foreign currency exchange contracts are generally valued at the mean of bid and asked prices for the time period interpolated from rates provided by a third-party pricing service for proximate time periods. Swap agreements are generally valued using valuations provided by a third-party pricing service, which for cleared swaps includes an evaluation of any trading activity at the clearinghouses.Open-end investment companies are generally valued at net asset value per share. Securities and other assets generally valued on the basis of information from a third-party pricing service may also be valued at a broker/dealer bid quotation. In determining values, third-party pricing services can utilize both transaction data and market information such as yield, quality, coupon rate, maturity, type of issue, trading characteristics, and other market data. The values of foreign securities and other assets and liabilities expressed in foreign currencies are converted to U.S. dollars using the mean of bid and asked prices for rates provided by a third-party pricing service.
The Board of Trustees has delegated primary responsibility for determining or causing to be determined the value of the fund’s investments (including any fair valuation) to the adviser pursuant to valuation policies and procedures approved by the Board. If the adviser determines that reliable market quotations are not readily available, investments are valued at fair value as determined in good faith by the adviser in accordance with such procedures under the oversight of the Board of Trustees. Under the fund’s valuation policies and procedures, market quotations are not considered to be readily available for most types of debt instruments and floating rate loans and many types of derivatives. These investments are generally valued at fair value based on information from third-party pricing services. In addition, investments may be valued at fair value if the adviser determines that an investment’s value has been materially affected by events occurring after the close of the exchange or market on which the investment is principally traded (such as foreign exchange or market) and prior to the determination of the fund’s net asset value, or after the halt of trading of a specific security where trading does not resume prior to the close of the exchange or market on which the security is principally traded. Events that occur after foreign markets close (such as developments in foreign markets and significant movements in the U.S. markets) and prior to the determination of the fund’s net asset value may be deemed to have a material effect on the value of securities traded in foreign markets. Accordingly, the fund’s foreign equity securities may often be valued at fair value. The adviser generally relies on third-party pricing services or other information (such as the correlation with price movements of similar securities in the same or other markets; the type, cost and investment characteristics of the security; the business and financial condition of the issuer; and trading and other market data) to assist in determining whether to fair value and at what value to fair value an investment. The value of an investment for purposes of calculating the fund’s net asset value can differ depending on the source and method used to determine value. When fair valuation is used, the value of an investment used to determine the fund’s net asset value may differ from quoted or published prices for the same investment. There can be no assurance that the fund could obtain the fair value assigned to an investment if it were to sell the investment at the same time at which the fund determines its net asset value per share.
Various inputs are used in determining the value of the fund’s assets or liabilities. These inputs are categorized into three broad levels. In certain cases, the inputs used to measure fair value may fall into different levels of the fair value hierarchy. In such cases, an investment’s level within the fair value hierarchy is based on the lowest level of input that is significant to the fair value measurement. The fund’s assessment of the significance of a particular input to the fair value measurement in its entirety requires judgment, and considers factors specific to the investment. Level 1 includes unadjusted quoted prices in active markets for identical assets or liabilities. Level 2 includes other significant observable market-based inputs (including quoted prices for similar securities, interest rates, prepayment speed, and credit risk). Level 3 includes unobservable inputs, which may include the adviser’s own assumptions in determining the fair value of investments. The following is a summary of the levels used as of December 31, 2019 in valuing the fund’s assets or liabilities:
| | | | | | | | | | | | | | | | |
| Financial Instruments | | Level 1 | | | Level 2 | | | Level 3 | | | Total | |
| Mutual Funds | | | $355,180,562 | | | | $— | | | | $— | | | | $355,180,562 | |
For further information regarding security characteristics, see the Portfolio of Investments. Please refer to the underlying funds’ shareholder reports for further information regarding the levels used in valuing the underlying funds’ assets or liabilities.
Derivatives– The fund does not invest in derivatives directly. The fund does invest in underlying funds that may use derivatives primarily to increase or decrease exposure to a particular market or segment of the market, or security, to increase or decrease interest rate or currency exposure, or as alternatives to direct investments. Derivatives are used for hedging ornon-hedging purposes. While hedging can reduce or eliminate losses, it can also reduce or eliminate gains. When the underlying funds use derivatives as an investment to increase market exposure, or for hedging purposes, gains and losses from derivative instruments may be substantially greater than the derivative’s original cost.
Indemnifications– Under the fund’s organizational documents, its officers and Trustees may be indemnified against certain liabilities and expenses arising out of the performance of their duties to the fund. Additionally, in the normal course of business, the fund enters into agreements with service providers that may contain indemnification clauses. The fund’s maximum exposure under these agreements is unknown as this would involve future claims that may be made against the fund that have not yet occurred.
15
MFS Growth Allocation Portfolio
Notes to Financial Statements – continued
Investment Transactions and Income– Investment transactions are recorded on the trade date. Interest income is recorded on the accrual basis. All premium and discount is amortized or accreted for financial statement purposes in accordance with U.S. generally accepted accounting principles. Distributions of income and capital gains from the underlying funds are recorded on theex-dividend date. Recognition of net investment income by the fund is affected by the timing of the declaration of distributions by the underlying funds in which the fund invests. In determining the net gain or loss on securities sold, the cost of securities is determined on the identified cost basis.
The fund and/or the underlying funds may receive proceeds from litigation settlements. Any proceeds received from litigation involving portfolio holdings are reflected in the Statement of Operations in realized gain/loss if the security has been disposed of by the fund or in unrealized gain/loss if the security is still held by the fund. Any other proceeds from litigation not related to portfolio holdings are reflected as other income in the Statement of Operations.
Tax Matters and Distributions– The fund intends to qualify as a regulated investment company, as defined under Subchapter M of the Internal Revenue Code, and to distribute all of its taxable income, including realized capital gains. As a result, no provision for federal income tax is required. The fund’s federal tax returns, when filed, will remain subject to examination by the Internal Revenue Service for a three year period. Management has analyzed the fund’s tax positions taken on federal and state tax returns for all open tax years and does not believe that there are any uncertain tax positions that require recognition of a tax liability.
Distributions to shareholders are recorded on theex-dividend date. Income and capital gain distributions are determined in accordance with income tax regulations, which may differ from U.S. generally accepted accounting principles. Certain capital accounts in the financial statements are periodically adjusted for permanent differences in order to reflect their tax character. These adjustments have no impact on net assets or net asset value per share. Temporary differences which arise from recognizing certain items of income, expense, gain or loss in different periods for financial statement and tax purposes will reverse at some time in the future.
Book/tax differences primarily relate to wash sale loss deferrals.
The tax character of distributions declared to shareholders for the last two fiscal years is as follows:
| | | | | | | | |
| | | Year ended
12/31/19 | | | Year ended
12/31/18 | |
| Ordinary income (including any short-term capital gains) | | | $7,018,206 | | | | $6,786,173 | |
| Long-term capital gains | | | 32,675,184 | | | | 24,079,220 | |
| Total distributions | | | $39,693,390 | | | | $30,865,393 | |
The federal tax cost and the tax basis components of distributable earnings were as follows:
| | | | |
| As of 12/31/19 | | | | |
| |
| Cost of investments | | | $270,221,030 | |
| Gross appreciation | | | 85,452,687 | |
| Gross depreciation | | | (493,155 | ) |
| Net unrealized appreciation (depreciation) | | | $84,959,532 | |
| |
| Undistributed ordinary income | | | 6,587,471 | |
| Undistributed long-term capital gain | | | 28,160,901 | |
Multiple Classes of Shares of Beneficial Interest– The fund offers multiple classes of shares, which differ in their respective distribution and/or service fees. The fund’s income, realized and unrealized gain (loss), and common expenses are allocated to shareholders based on the daily net assets of each class. Dividends are declared separately for each class. Differences in per share dividend rates are generally due to differences in separate class expenses. The fund’s distributions declared to shareholders as reported in the Statements of Changes in Net Assets are presented by class as follows:
| | | | | | | | |
| | |
| | | Year ended
12/31/19 | | | Year ended
12/31/18 | |
| Initial Class | | | $439,473 | | | | $352,389 | |
| Service Class | | | 39,253,917 | | | | 30,513,004 | |
| Total | | | $39,693,390 | | | | $30,865,393 | |
| (3) | | Transactions with Affiliates |
Investment Adviser– The fund has an investment advisory agreement with MFS to provide overall investment management and related administrative services and facilities to the fund. MFS receives no compensation under this agreement; however MFS receives management fees from the underlying MFS funds.
The investment adviser has agreed in writing to pay a portion of the fund’s operating expenses, excluding distribution and/or service fees, interest, taxes, extraordinary expenses, brokerage and transaction costs, and investment-related expenses such as fees and
16
MFS Growth Allocation Portfolio
Notes to Financial Statements – continued
expenses associated with investments in investment companies and other similar investment vehicles such that fund operating expenses do not exceed 0.20% annually of the fund’s average daily net assets. This written agreement will continue until modified by the fund’s Board of Trustees, but such agreement will continue at least until April 30, 2021. For the year ended December 31, 2019, the fund’s actual operating expenses did not exceed the limit and therefore, the investment adviser did not pay any portion of the fund’s expenses related to this agreement.
In addition to the fees and expenses which the fund bears directly, the fund indirectly bears a pro rata share of the fees and expenses of the underlying funds in which the fund invests. Accordingly, the expense ratio for the fund reflects only those fees and expenses borne directly by the fund.
Distributor– MFS Fund Distributors, Inc. (MFD), a wholly-owned subsidiary of MFS, is the distributor of shares of the fund. The Trustees have adopted a distribution plan for the Service Class shares pursuant to Rule12b-1 under the Investment Company Act of 1940.
The fund’s distribution plan provides that the fund will pay MFD distribution and/or service fees equal to 0.25% per annum of its average daily net assets attributable to Service Class shares as partial consideration for services performed and expenses incurred by MFD and financial intermediaries (including participating insurance companies that invest in the fund to fund variable annuity and variable life insurance contracts, sponsors of qualified retirement and pension plans that invest in the fund, and affiliates of these participating insurance companies and plan sponsors) in connection with the sale and distribution of the Service Class shares. MFD may subsequently pay all, or a portion, of the distribution and/or service fees to financial intermediaries.
Shareholder Servicing Agent– MFS Service Center, Inc. (MFSC), a wholly-owned subsidiary of MFS, receives a fee from the fund for its services as shareholder servicing agent. For the year ended December 31, 2019, the fee was $3,641, which equated to 0.0010% annually of the fund’s average daily net assets. MFSC also receives payment from the fund forout-of-pocket expenses paid by MFSC on behalf of the fund. For the year ended December 31, 2019, these costs amounted to $120.
Administrator– MFS provides certain financial, legal, shareholder communications, compliance, and other administrative services to the fund. Under an administrative services agreement, the fund reimburses MFS the costs incurred to provide these services. The fund pays an annual fixed amount of $17,500. The administrative services fee incurred for the year ended December 31, 2019 was equivalent to an annual effective rate of 0.0049% of the fund’s average daily net assets.
Trustees’ and Officers’ Compensation– The fund pays compensation to independent Trustees in the form of a retainer, attendance fees, and additional compensation to Board and Committee chairpersons. The fund does not pay compensation directly to Trustees or officers of the fund who are also officers of the investment adviser, all of whom receive remuneration from MFS for their services to the fund. Certain officers and Trustees of the fund are officers or directors of MFS, MFD, and MFSC.
Other– This fund and certain other funds managed by MFS (the funds) had entered into a service agreement (the ISO Agreement) which provided for payment of fees solely by the funds to Tarantino LLC in return for the provision of services of an Independent Senior Officer (ISO) for the funds. Frank L. Tarantino served as the ISO and was an officer of the funds and the sole member of Tarantino LLC. Effective June 30, 2019, Mr. Tarantino retired from his position as ISO for the funds, and the ISO Agreement was terminated. For the year ended December 31, 2019, the fee paid by the fund under this agreement was $417 and is included in “Miscellaneous” expense in the Statement of Operations. MFS had agreed to bear all expenses associated with office space, other administrative support, and supplies provided to the ISO.
The fund invests in the MFS Institutional Money Market Portfolio which is managed by MFS and seeks current income consistent with preservation of capital and liquidity. This money market fund does not pay a management fee to MFS.
For the year ended December 31, 2019, purchases and sales of shares of underlying funds, excluding the MFS Institutional Money Market Portfolio, aggregated $1,446,281 and $64,748,325, respectively.
17
MFS Growth Allocation Portfolio
Notes to Financial Statements – continued
| (5) | | Shares of Beneficial Interest |
The fund’s Declaration of Trust permits the Trustees to issue an unlimited number of full and fractional shares of beneficial interest. Transactions in fund shares were as follows:
| | | | | | | | | | | | | | | | |
| | | Year ended 12/31/19 | | | Year ended 12/31/18 | |
| | | | |
| | | Shares | | | Amount | | | Shares | | | Amount | |
| Shares sold | | | | | | | | | | | | | | | | |
Initial Class | | | 12,218 | | | | $144,020 | | | | 13,965 | | | | $169,132 | |
Service Class | | | 152,356 | | | | 1,789,932 | | | | 658,752 | | | | 7,641,180 | |
| | | 164,574 | | | | $1,933,952 | | | | 672,717 | | | | $7,810,312 | |
| | | | |
| Shares issued to shareholders in reinvestment of distributions | | | | | | | | | | | | | | | | |
Initial Class | | | 39,843 | | | | $439,473 | | | | 29,489 | | | | $352,389 | |
Service Class | | | 3,549,179 | | | | 39,253,917 | | | | 2,549,123 | | | | 30,513,004 | |
| | | 3,589,022 | | | | $39,693,390 | | | | 2,578,612 | | | | $30,865,393 | |
| | | | |
| Shares reacquired | | | | | | | | | | | | | | | | |
Initial Class | | | (79,249 | ) | | | $(957,183 | ) | | | (26,098 | ) | | | $(312,340 | ) |
Service Class | | | (5,335,070 | ) | | | (63,293,299 | ) | | | (6,219,141 | ) | | | (75,563,853 | ) |
| | | (5,414,319 | ) | | | $(64,250,482 | ) | | | (6,245,239 | ) | | | $(75,876,193 | ) |
| | | | |
| Net change | | | | | | | | | | | | | | | | |
Initial Class | | | (27,188 | ) | | | $(373,690 | ) | | | 17,356 | | | | $209,181 | |
Service Class | | | (1,633,535 | ) | | | (22,249,450 | ) | | | (3,011,266 | ) | | | (37,409,669 | ) |
| | | (1,660,723 | ) | | | $(22,623,140 | ) | | | (2,993,910 | ) | | | $(37,200,488 | ) |
The fund and certain other funds managed by MFS participate in a $1.25 billion unsecured committed line of credit, subject to a $1 billion sublimit, provided by a syndicate of banks under a credit agreement. Borrowings may be made for temporary financing needs. Interest is charged to each fund, based on its borrowings, generally at a rate equal to the highest of one month LIBOR, the Federal Funds Effective Rate and the Overnight Bank Funding Rate, plus an agreed upon spread. A commitment fee, based on the average daily, unused portion of the committed line of credit, is allocated among the participating funds. In addition, the fund and other funds managed by MFS have established unsecured uncommitted borrowing arrangements with certain banks for temporary financing needs. Interest is charged to each fund, based on its borrowings, at rates equal to customary reference rates plus an agreed upon spread. For the year ended December 31, 2019, the fund’s commitment fee and interest expense were $1,936 and $0, respectively, and are included in “Miscellaneous” expense in the Statement of Operations.
18
MFS Growth Allocation Portfolio
Notes to Financial Statements – continued
| (7) | | Investments in Affiliated Issuers |
An affiliated issuer may be considered one in which the fund owns 5% or more of the outstanding voting securities, or a company which is under common control. For the purposes of this report, the following were affiliated issuers:
| | | | | | | | | | | | | | | | | | | | | | | | |
| Affiliated Issuers | | Beginning
Value | | | Purchases | | | Sales
Proceeds | | | Realized
Gain (Loss) | | | Change in
Unrealized
Appreciation or
Depreciation | | | Ending Value | |
| MFS Emerging Markets Equity Portfolio | | | $3,390,469 | | | | $148,963 | | | | $466,765 | | | | $48,590 | | | | $478,853 | | | | $3,600,110 | |
| MFS Global Governments Portfolio | | | 13,919,268 | | | | 626,934 | | | | 1,424,213 | | | | (30,648 | ) | | | 547,020 | | | | 13,638,361 | |
| MFS Global Real Estate Portfolio | | | 16,711,826 | | | | 817,295 | | | | 3,526,754 | | | | 625,110 | | | | 2,817,070 | | | | 17,444,547 | |
| MFS Growth Series | | | 36,489,353 | | | | 3,350,943 | | | | 9,839,854 | | | | 3,449,400 | | | | 5,931,825 | | | | 39,381,667 | |
| MFS High Yield Portfolio | | | 16,913,547 | | | | 1,112,465 | | | | 1,760,177 | | | | (130,827 | ) | | | 1,561,206 | | | | 17,696,214 | |
| MFS Inflation-Adjusted Bond Portfolio | | | 17,142,907 | | | | 630,485 | | | | 1,696,698 | | | | 46,358 | | | | 1,074,751 | | | | 17,197,803 | |
| MFS Institutional Money Market Portfolio | | | 265,700 | | | | 1,319,760 | | | | 1,321,882 | | | | 6 | | | | 1 | | | | 263,585 | |
| MFS International Growth Portfolio | | | 16,866,121 | | | | 2,152,785 | | | | 3,272,701 | | | | 124,549 | | | | 2,014,793 | | | | 17,885,547 | |
| MFS International Intrinsic Value Portfolio | | | 16,832,584 | | | | 906,996 | | | | 3,126,194 | | | | 920,873 | | | | 2,305,495 | | | | 17,839,754 | |
| MFS Limited Maturity Portfolio | | | 6,862,313 | | | | 312,307 | | | | 381,041 | | | | 5,705 | | | | 162,005 | | | | 6,961,289 | |
| MFS Mid Cap Growth Series | | | 29,834,478 | | | | 4,037,663 | | | | 8,258,421 | | | | 856,956 | | | | 5,628,930 | | | | 32,099,606 | |
| MFS Mid Cap Value Portfolio | | | 29,499,667 | | | | 3,142,309 | | | | 5,896,747 | | | | (55,435 | ) | | | 5,526,852 | | | | 32,216,646 | |
| MFS New Discovery Series | | | 6,538,988 | | | | 1,237,570 | | | | 1,890,544 | | | | 193,881 | | | | 1,070,916 | | | | 7,150,811 | |
| MFS New Discovery Value Portfolio | | | 6,517,153 | | | | 1,206,939 | | | | 1,438,479 | | | | (122,937 | ) | | | 979,910 | | | | 7,142,586 | |
| MFS Research International Portfolio | | | 29,974,372 | | | | 1,831,999 | | | | 5,643,302 | | | | 536,941 | | | | 5,498,475 | | | | 32,198,485 | |
| MFS Research Series | | | 33,003,221 | | | | 3,841,981 | | | | 7,314,862 | | | | 687,404 | | | | 5,570,856 | | | | 35,788,600 | |
| MFS Total Return Bond Series | | | 17,243,017 | | | | 802,306 | | | | 1,833,815 | | | | (43,308 | ) | | | 1,182,949 | | | | 17,351,149 | |
| MFS Value Series | | | 36,132,780 | | | | 2,584,788 | | | | 6,977,758 | | | | 1,220,630 | | | | 6,363,362 | | | | 39,323,802 | |
| | | $334,137,764 | | | | $30,064,488 | | | | $66,070,207 | | | | $8,333,248 | | | | $48,715,269 | | | | $355,180,562 | |
| | | | | | |
| Affiliated Issuers | | | | | | | | | | | | | | Dividend
Income | | | Capital Gain
Distributions | |
| MFS Emerging Markets Equity Portfolio | | | | | | | | | | | | | | | | | | | $23,292 | | | | $110,255 | |
| MFS Global Governments Portfolio | | | | | | | | | | | | | | | | | | | 331,467 | | | | — | |
| MFS Global Real Estate Portfolio | | | | | | | | | | | | | | | | | | | 637,741 | | | | 112,198 | |
| MFS Growth Series | | | | | | | | | | | | | | | | | | | — | | | | 3,279,645 | |
| MFS High Yield Portfolio | | | | | | | | | | | | | | | | | | | 986,369 | | | | — | |
| MFS Inflation-Adjusted Bond Portfolio | | | | | | | | | | | | | | | | | | | 287,142 | | | | — | |
| MFS Institutional Money Market Portfolio | | | | | | | | | | | | | | | | | | | 5,872 | | | | — | |
| MFS International Growth Portfolio | | | | | | | | | | | | | | | | | | | 242,684 | | | | 1,899,465 | |
| MFS International Intrinsic Value Portfolio | | | | | | | | | | | | | | | | | | | 347,006 | | | | 518,946 | |
| MFS Limited Maturity Portfolio | | | | | | | | | | | | | | | | | | | 186,406 | | | | — | |
| MFS Mid Cap Growth Series | | | | | | | | | | | | | | | | | | | 278,079 | | | | 3,719,867 | |
| MFS Mid Cap Value Portfolio | | | | | | | | | | | | | | | | | | | 637,920 | | | | 2,497,169 | |
| MFS New Discovery Series | | | | | | | | | | | | | | | | | | | 412,153 | | | | 812,206 | |
| MFS New Discovery Value Portfolio | | | | | | | | | | | | | | | | | | | 289,838 | | | | 896,384 | |
| MFS Research International Portfolio | | | | | | | | | | | | | | | | | | | 472,352 | | | | 1,351,187 | |
| MFS Research Series | | | | | | | | | | | | | | | | | | | 475,086 | | | | 3,360,911 | |
| MFS Total Return Bond Series | | | | | | | | | | | | | | | | | | | 580,395 | | | | — | |
| MFS Value Series | | | | | | | | | | | | | | | | | | | 825,268 | | | | 1,727,016 | |
| | | | | | | | | | | | | | | | | | | $7,019,070 | | | | $20,285,249 | |
19
MFS Growth Allocation Portfolio
REPORT OF INDEPENDENT REGISTERED PUBLIC ACCOUNTING FIRM
To the Board of Trustees of MFS Variable Insurance Trust III and the Shareholders of
MFS Growth Allocation Portfolio:
Opinion on the Financial Statements and Financial Highlights
We have audited the accompanying statement of assets and liabilities of MFS Growth Allocation Portfolio (the “Fund”), including the portfolio of investments, as of December 31, 2019, the related statement of operations for the year then ended, the statements of changes in net assets for each of the two years in the period then ended, the financial highlights for each of the five years in the period then ended, and the related notes. In our opinion, the financial statements and financial highlights present fairly, in all material respects, the financial position of the Fund as of December 31, 2019, and the results of its operations for the year then ended, the changes in its net assets for each of the two years in the period then ended, and the financial highlights for each of the five years in the period then ended, in conformity with accounting principles generally accepted in the United States of America.
Basis for Opinion
These financial statements and financial highlights are the responsibility of the Fund’s management. Our responsibility is to express an opinion on the Fund’s financial statements and financial highlights based on our audits. We are a public accounting firm registered with the Public Company Accounting Oversight Board (United States) (PCAOB) and are required to be independent with respect to the Fund in accordance with the U.S. federal securities laws and the applicable rules and regulations of the Securities and Exchange Commission and the PCAOB.
We conducted our audits in accordance with the standards of the PCAOB. Those standards require that we plan and perform the audit to obtain reasonable assurance about whether the financial statements and financial highlights are free of material misstatement, whether due to error or fraud. The Fund is not required to have, nor were we engaged to perform, an audit of its internal control over financial reporting. As part of our audits we are required to obtain an understanding of internal control over financial reporting but not for the purpose of expressing an opinion on the effectiveness of the Fund’s internal control over financial reporting. Accordingly, we express no such opinion.
Our audits included performing procedures to assess the risks of material misstatement of the financial statements and financial highlights, whether due to error or fraud, and performing procedures that respond to those risks. Such procedures included examining, on a test basis, evidence regarding the amounts and disclosures in the financial statements and financial highlights. Our audits also included evaluating the accounting principles used and significant estimates made by management, as well as evaluating the overall presentation of the financial statements and financial highlights. Our procedures included confirmation of securities owned as of December 31, 2019, by correspondence with the transfer agent. We believe that our audits provide a reasonable basis for our opinion.
DELOITTE & TOUCHE LLP
Boston, Massachusetts
February 14, 2020
We have served as the auditor of one or more of the MFS investment companies since 1924.
20
MFS Growth Allocation Portfolio
TRUSTEES AND OFFICERS – IDENTIFICATION AND BACKGROUND
The Trustees and Officers of the Trust, as of February 1, 2020, are listed below, together with their principal occupations during the past five years. (Their titles may have varied during that period.) The address of each Trustee and Officer is 111 Huntington Avenue, Boston, Massachusetts 02199-7618.
| | | | | | | | | | |
Name, Age | | Position(s)
Held with Fund | | Trustee/Officer
Since (h) | | Number of MFS Funds
overseen by the
Trustee | | Principal Occupations
During the Past Five Years | | Other Directorships During the Past Five Years (j) |
| INTERESTED TRUSTEES |
Robert J. Manning (k)
(age 56) | | Trustee | | February 2004 | | 133 | | Massachusetts Financial Services Company, Executive Chairman (since January 2017); Director; Chairman of the Board; Chief Executive Officer (until 2015);Co-Chief Executive Officer(2015-2016) | | N/A |
| | | | | |
Robin A. Stelmach (k) (age 58) | | Trustee | | January 2014 | | 133 | | Massachusetts Financial Services Company, Vice Chair (since January 2017); Chief Operating Officer and Executive Vice President (until January 2017) | | N/A |
|
| INDEPENDENT TRUSTEES |
John P. Kavanaugh (age 65) | | Trustee and Chair of Trustees | | January 2009 | | 133 | | Private investor | | N/A |
| | | | | |
Steven E. Buller (age 68) | | Trustee | | February 2014 | | 133 | | Financial Accounting Standards Advisory Council, Chairman(2014-2015); Public Company Accounting Oversight Board, Standing Advisory Group, Member (until 2014); BlackRock, Inc. (investment management), Managing Director (until 2014), BlackRock Finco UK (investment management), Director (until 2014) | | N/A |
| | | | | |
John A. Caroselli (age 65) | | Trustee | | March 2017 | | 133 | | JC Global Advisors, LLC (management consulting), President (since 2015); First Capital Corporation (commercial finance), Executive Vice President (until 2015) | | N/A |
| | | | | |
Maureen R. Goldfarb (age 64) | | Trustee | | January 2009 | | 133 | | Private investor | | N/A |
| | | | | |
Peter D. Jones
(age 64) | | Trustee | | January 2019 | | 133 | | Franklin Templeton Distributors, Inc. (investment management), President (until 2015); Franklin Templeton Institutional, LLC (investment management), Chairman (until 2015) | | N/A |
| | | | | |
James W. Kilman, Jr.
(age 58) | | Trustee | | January 2019 | | 133 | | Burford Capital Limited (finance and investment management), Chief Financial Officer (since 2019); KielStrand Capital LLC (family office), Chief Executive Officer (since 2016); Morgan Stanley & Co. (financial services), Vice Chairman of Investment Banking,Co-Head of Diversified Financials Coverage – Financial Institutions Investment Banking Group (until 2016) | | Alpha-En Corporation, Director (2016-2019) |
21
MFS Growth Allocation Portfolio
Trustees and Officers – continued
| | | | | | | | | | |
Name, Age | | Position(s)
Held with Fund | | Trustee/Officer
Since (h) | | Number of MFS Funds
overseen by the
Trustee | | Principal Occupations
During the Past Five Years | | Other Directorships During the Past Five Years (j) |
Clarence Otis, Jr. (age 63) | | Trustee | | March 2017 | | 133 | | Darden Restaurants, Inc., Chief Executive Officer (until 2014) | | VF Corporation, Director; Verizon Communications, Inc., Director; The Travelers Companies, Director; Federal Reserve Bank of Atlanta, Director (until 2015) |
| | | | | |
Maryanne L. Roepke (age 63) | | Trustee | | May 2014 | | 133 | | American Century Investments (investment management), Senior Vice President and Chief Compliance Officer (until 2014) | | N/A |
| | | | | |
Laurie J. Thomsen
(age 62) | | Trustee | | March 2005 | | 133 | | Private investor | | The Travelers Companies, Director; Dycom Industries, Inc., Director (since 2015) |
| | | | | | | | |
Name, Age | | Position(s)
Held with Fund | | Trustee/Officer
Since (h) | | Number of
MFS Funds
for which the
Person is an
Officer | | Principal Occupations During the Past Five Years |
| OFFICERS | | | | | | |
Christopher R. Bohane (k)
(age 46) | | Assistant Secretary and Assistant Clerk | | July 2005 | | 133 | | Massachusetts Financial Services Company, Vice President and Assistant General Counsel |
| | | | |
Kino Clark (k) (age 51) | | Assistant Treasurer | | January 2012 | | 133 | | Massachusetts Financial Services Company, Vice President |
| | | | |
John W. Clark, Jr. (k) (age 52) | | Assistant Treasurer | | April 2017 | | 133 | | Massachusetts Financial Services Company, Vice President (since March 2017); Deutsche Bank (financial services), Department Head –Treasurer’s Office (until February 2017) |
| | | | |
Thomas H. Connors (k) (age 60) | | Assistant Secretary and Assistant Clerk | | September 2012 | | 133 | | Massachusetts Financial Services Company, Vice President and Senior Counsel |
| | | | |
David L. DiLorenzo (k)
(age 51) | | President | | July 2005 | | 133 | | Massachusetts Financial Services Company, Senior Vice President |
| | | | |
Heidi W. Hardin (k) (age 52) | | Secretary and Clerk | | April 2017 | | 133 | | Massachusetts Financial Services Company, Executive Vice President and General Counsel (since March 2017); Harris Associates (investment management), General Counsel (from September 2015 to January 2017); Janus Capital Management LLC (investment management), Senior Vice President and General Counsel (until September 2015) |
| | | | |
Brian E. Langenfeld (k) (age 46) | | Assistant
Secretary and Assistant Clerk | | June 2006 | | 133 | | Massachusetts Financial Services Company, Vice President and Senior Counsel |
| | | | |
Amanda S. Mooradian (k) (age 40) | | Assistant
Secretary and Assistant Clerk | | September 2018 | | 133 | | Massachusetts Financial Services Company, Assistant Vice President and Counsel |
| | | | |
Susan A. Pereira (k)
(age 49) | | Assistant
Secretary and Assistant Clerk | | July 2005 | | 133 | | Massachusetts Financial Services Company, Vice President and Assistant General Counsel |
| | | | |
Kasey L. Phillips (k) (age 49) | | Assistant Treasurer | | September 2012 | | 133 | | Massachusetts Financial Services Company, Vice President |
| | | | |
Matthew A. Stowe (k) (age 45) | | Assistant Secretary and Assistant Clerk | | October 2014 | | 133 | | Massachusetts Financial Services Company, Vice President and Assistant General Counsel |
22
MFS Growth Allocation Portfolio
Trustees and Officers – continued
| | | | | | | | |
Name, Age | | Position(s)
Held with Fund | | Trustee/Officer
Since (h) | | Number of
MFS Funds
for which the
Person is an
Officer | | Principal Occupations During the Past Five Years |
Martin J. Wolin (k) (age 52) | | Chief Compliance Officer | | July 2015 | | 133 | | Massachusetts Financial Services Company, Senior Vice President and Chief Compliance Officer (since July 2015); Mercer (financial service provider), Chief Risk and Compliance Officer, North America and Latin America (until June 2015) |
| | | | |
James O. Yost (k)
(age 59) | | Treasurer | | September 1990 | | 133 | | Massachusetts Financial Services Company, Senior Vice President |
| (h) | Date first appointed to serve as Trustee/officer of an MFS Fund. Each Trustee has served continuously since appointment unless indicated otherwise. For the period from December 15, 2004 until February 22, 2005, Mr. Manning served as Advisory Trustee. From January 2012 through December 2016, Messrs. DiLorenzo and Yost served as Treasurer and Deputy Treasurer of the Funds, respectively. |
| (j) | Directorships or trusteeships of companies required to report to the Securities and Exchange Commission (i.e., “public companies”). |
| (k) | “Interested person” of the Trust within the meaning of the Investment Company Act of 1940 (referred to as the 1940 Act), which is the principal federal law governing investment companies like the fund, as a result of a position with MFS. The address of MFS is 111 Huntington Avenue, Boston, Massachusetts 02199-7618. |
Each Trustee (other than Messrs. Jones and Kilman) has been elected by shareholders and each Trustee and Officer holds office until his or her successor is chosen and qualified or until his or her earlier death, resignation, retirement or removal. Messrs. Jones and Kilman became Trustees of the Funds on January 1, 2019. The Trust does not hold annual meetings for the purpose of electing Trustees, and Trustees are not elected for fixed terms. Under the terms of the Board’s retirement policy, an Independent Trustee shall retire at the end of the calendar year in which he or she reaches the earlier of 75 years of age or 15 years of service on the Board (or, in the case of any Independent Trustee who joined the Board prior to 2015, 20 years of service on the Board).
Messrs. Buller, Kilman and Otis and Ms. Roepke are members of the Trust’s Audit Committee.
Each of the Interested Trustees and certain Officers hold comparable officer positions with certain affiliates of MFS.
The Statement of Additional Information for a Fund includes further information about the Trustees and is available without charge upon request by calling1-800-225-2606.
| | |
Investment Adviser Massachusetts Financial Services Company 111 Huntington Avenue Boston, MA 02199-7618 | | Custodian State Street Bank and Trust Company 1 Lincoln Street Boston, MA 02111-2900 |
| |
Distributor MFS Fund Distributors, Inc. 111 Huntington Avenue Boston, MA 02199-7618 | | Independent Registered Public Accounting Firm Deloitte & Touche LLP 200 Berkeley Street Boston, MA 02116 |
| |
Portfolio Manager(s) Joseph Flaherty Natalie Shapiro | | |
23
MFS Growth Allocation Portfolio
BOARD REVIEW OF INVESTMENT ADVISORY AGREEMENT
MFS Growth Allocation Portfolio
The Investment Company Act of 1940 requires that both the full Board of Trustees and a majority of thenon-interested (“independent”) Trustees, voting separately, annually approve the continuation of the Fund’s investment advisory agreement with MFS. The Trustees consider matters bearing on the Fund and its advisory arrangements at their meetings throughout the year, including a review of performance data at each regular meeting. In addition, the independent Trustees met several times over the course of three months beginning in May and ending in July, 2019 (“contract review meetings”) for the specific purpose of considering whether to approve the continuation of the investment advisory agreement for the Fund and the other investment companies that the Board oversees (the “MFS Funds”). The independent Trustees were assisted in their evaluation of the Fund’s investment advisory agreement by independent legal counsel, from whom they received separate legal advice and with whom they met separately from MFS during various contract review meetings. The independent Trustees were also assisted in this process by the MFS Funds’ Independent Senior Officer, a senior officer appointed by and reporting to the independent Trustees.
In connection with their deliberations regarding the continuation of the investment advisory agreement, the Trustees, including the independent Trustees, considered such information and factors as they believed, in light of the legal advice furnished to them and their own business judgment, to be relevant. The investment advisory agreement for the Fund was considered separately, although the Trustees also took into account the common interests of all MFS Funds in their review. As described below, the Trustees considered the nature, quality, and extent of the various investment advisory, administrative, and shareholder services performed by MFS under the existing investment advisory agreement and other arrangements with the Fund.
In connection with their contract review meetings, the Trustees received and relied upon materials that included, among other items: (i) information provided by Broadridge Financial Solutions, Inc. (“Broadridge”), an independent third party, on the investment performance of the Fund for various time periods ended December 31, 2018 and the investment performance of a group of funds with substantially similar investment classifications/objectives (the “Broadridge performance universe”), (ii) information provided by Broadridge on the Fund’s fees and expenses and the fees and expenses of comparable funds identified by Broadridge as well as all other funds in the same investment classification/category (the “Broadridge expense group and universe”), (iii) information as to whether and to what extent applicable expense waivers and reimbursements are observed for the Fund, (iv) information regarding MFS’ financial results and financial condition, including MFS’ and certain of its affiliates’ estimated profitability from services performed for the Fund and the MFS Funds as a whole, and compared to MFS’ institutional business, (v) MFS’ views regarding the outlook for the mutual fund industry and the strategic business plans of MFS, (vi) descriptions of various functions performed by MFS for the Funds, such as compliance monitoring and portfolio trading practices, and (vii) information regarding the overall organization of MFS, including information about MFS’ senior management and other personnel providing investment advisory, administrative and other services to the Fund and the other MFS Funds. The comparative performance, fee and expense information prepared and provided by Broadridge was not independently verified and the independent Trustees did not independently verify any information provided to them by MFS.
The Trustees’ conclusion as to the continuation of the investment advisory agreement was based on a comprehensive consideration of all information provided to the Trustees and not the result of any single factor. Some of the factors that figured particularly in the Trustees’ deliberations are described below, although individual Trustees may have evaluated the information presented differently from one another, giving different weights to various factors. It is also important to recognize that the fee arrangements for the Fund and other MFS Funds are the result of years of review and discussion between the independent Trustees and MFS, that certain aspects of such arrangements may receive greater scrutiny in some years than in others, and that the Trustees’ conclusions may be based, in part, on their consideration of these same arrangements during the course of the year and in prior years.
Based on information provided by Broadridge and MFS, the Trustees reviewed the Fund’s total return investment performance as well as the Broadridge performance universe over various time periods. The Trustees placed particular emphasis on the total return performance of the Fund’s Initial Class shares in comparison to the performance of funds in its Broadridge performance universe over the five-year period ended December 31, 2018, which the Trustees believed was a long enough period to reflect differing market conditions. The total return performance of the Fund’s Initial Class shares was in the 1st quintile relative to the other funds in the universe for this five-year period (the 1st quintile being the best performers and the 5th quintile being the worst performers). The total return performance of the Fund’s Initial Class shares was in the 2nd quintile for theone-year period and in the 1st quintile for the three-year period ended December 31, 2018 relative to the Broadridge performance universe. Because of the passage of time, these performance results may differ from the performance results for more recent periods, including those shown elsewhere in this report.
In the course of their deliberations, the Trustees took into account information provided by MFS in connection with the contract review meetings, as well as during investment review meetings conducted with portfolio management personnel during the course of the year regarding the Fund’s performance. After reviewing these and related factors, the Trustees concluded, within the context of their overall conclusions regarding the investment advisory agreement, that they were satisfied with MFS’ responses and efforts relating to investment performance.
24
MFS Growth Allocation Portfolio
Board Review of Investment Advisory Agreement – continued
The Trustees considered that MFS does not charge an advisory fee for providing investment advisory services to the Fund, but that the Fund pays its pro rata share of the advisory fees paid by the underlying funds in which it invests (the “Underlying Funds”).
In assessing the reasonableness of the Fund’s expenses, the Trustees considered, among other information, the Fund’s total expense ratio of the Fund’s Initial Class shares as a percentage of average daily net assets and the total expense ratios of the Broadridge expense group based on information provided by Broadridge. The Trustees considered that MFS currently observes an expense limitation for the Fund, which may not be changed without the Trustees’ approval. The Trustees also considered that, according to the data provided by Broadridge (which takes into account any expense limitations that were in effect during the Fund’s last fiscal year), the Fund’s total expense ratio was approximately at the Broadridge expense group median. Because the Fund does not pay an advisory fee, the Trustees did not consider the extent to which economies of scale would be realized due to the Fund’s growth of assets, whether fee levels reflect economies of scale for shareholders, or the fees paid by similar funds to other investment advisers or by similar clients of MFS.
The Trustees also considered information prepared by MFS relating to MFS’ costs and profits with respect to the Fund, the MFS Funds considered as a group, and other investment companies and accounts advised by MFS, as well as MFS’ methodologies used to determine and allocate its costs to the MFS Funds, the Fund and other accounts and products for purposes of estimating profitability.
In addition, the Trustees considered MFS’ resources and related efforts to continue to retain, attract and motivate capable personnel to serve the Fund. The Trustees also considered current and developing conditions in the financial services industry, including the presence of large and well-capitalized companies which are spending, and appear to be prepared to continue to spend, substantial sums to engage personnel and to provide services to competing investment companies. In this regard, the Trustees also considered the financial resources of MFS and its ultimate parent, Sun Life Financial Inc. The Trustees also considered the advantages and possible disadvantages to the Fund of having an adviser that also serves other investment companies as well as other accounts.
The Trustees also considered the nature, quality, cost, and extent of administrative, transfer agency, and distribution services provided to the Fund by MFS and its affiliates under agreements and plans other than the investment advisory agreement, including any12b-1 fees the Fund pays to MFS Fund Distributors, Inc., an affiliate of MFS. The Trustees also considered the nature, extent and quality of certain other services MFS performs or arranges for on the Fund’s or the Underlying Funds’ behalf, which may include securities lending programs, directed expense payment programs, class action recovery programs, and MFS’ interaction withthird-party service providers, principally custodians andsub-custodians. The Trustees concluded that the variousnon-advisory services provided by MFS and its affiliates on behalf of the Fund were satisfactory.
The Trustees consideredso-called“fall-out benefits” to MFS such as reputational value derived from serving as investment manager to the MFS Funds. The Trustees also considered that, effective January 3, 2018, MFS had discontinued its historic practice of obtaining investment research from portfolio brokerage commissions paid by certain MFS Funds and would thereafter directly pay for or voluntarily reimburse a Fund, if applicable, for the costs of external research acquired through the use of the Fund’s portfolio brokerage commissions.
Based on their evaluation of factors that they deemed to be material, including those factors described above, the Board of Trustees, including the independent Trustees, concluded that the Fund’s investment advisory agreement with MFS should be continued for an additionalone-year period, commencing August 1, 2019.
25
MFS Growth Allocation Portfolio
PROXY VOTING POLICIES AND INFORMATION
MFS votes proxies on behalf of the fund pursuant to proxy voting policies and procedures that are available without charge, upon request, by calling 1-800-225-2606, by visitingmfs.com/proxyvoting, or by visiting the SEC’s Web site athttp://www.sec.gov.
Information regarding how the fund voted proxies relating to portfolio securities during the most recent twelve-month period ended June 30 is available by August 31 of each year without charge by visitingmfs.com/proxyvoting, or by visiting the SEC’s Web site athttp://www.sec.gov.
QUARTERLY PORTFOLIO DISCLOSURE
The fund files a complete schedule of portfolio holdings with the SEC for the first and third quarters of each fiscal year as an exhibit to its reports on Form N-PORT. The fund’s Form N-PORT reports are available on the SEC’s website athttp://www.sec.gov. A shareholder can obtain the portfolio holdings report for the first and third quarters of the fund’s fiscal year atmfs.com/vit3 by choosing the fund’s name and then selecting the “Resources” tab and clicking on “Prospectus and Reports”.
FURTHER INFORMATION
From time to time, MFS may post important information about the fund or the MFS funds on the MFS web site (mfs.com). This information is available athttps://www.mfs.com/en-us/what-we-do/announcements.html or at mfs.com/vit3by choosing the fund’s name.
INFORMATION ABOUT FUND CONTRACTS AND LEGAL CLAIMS
The fund has entered into contractual arrangements with an investment adviser, administrator, distributor, shareholder servicing agent, 529 program manager (if applicable), and custodian who each provide services to the fund. Unless expressly stated otherwise, shareholders are not parties to, or intended beneficiaries of these contractual arrangements, and these contractual arrangements are not intended to create any shareholder right to enforce them against the service providers or to seek any remedy under them against the service providers, either directly or on behalf of the fund.
Under the Trust’s By-Laws and Declaration of Trust, any claims asserted against or on behalf of the MFS Funds, including claims against Trustees and Officers, must be brought in state and federal courts located within the Commonwealth of Massachusetts.
FEDERAL TAX INFORMATION (unaudited)
The following information is provided pursuant to provisions of the Internal Revenue Code.
The fund designates $35,943,000 as capital gain dividends paid during the fiscal year.
For corporate shareholders, 31.11% of the ordinary income dividends paid during the fiscal year qualify for the corporate dividends received deduction.
26
rev. 3/16
| | | | |
| | | |
| FACTS | | WHAT DOES MFS DO WITH YOUR
PERSONAL INFORMATION? | |  |
| | |
| Why? | | Financial companies choose how they share your personal information. Federal law gives consumers the right to limit some but not all sharing. Federal law also requires us to tell you how we collect, share, and protect your personal information. Please read this notice carefully to understand what we do. |
| | |
| What? | | The types of personal information we collect and share depend on the product or service you have with us. This information can include: • Social Security number and account balances • Account transactions and transaction history • Checking account information and wire transfer instructions When you areno longer our customer, we continue to share your information as described in this notice. |
| | |
| How? | | All financial companies need to share customers’ personal information to run their everyday business. In the section below, we list the reasons financial companies can share their customers’ personal information; the reasons MFS chooses to share; and whether you can limit this sharing. |
| | | | |
Reasons we can share your
personal information | | Does MFS share? | | Can you limit this
sharing? |
For our everyday business purposes – such as to process your transactions, maintain your account(s), respond to court orders and legal investigations, or report to credit bureaus | | Yes | | No |
For our marketing purposes – to offer our products and services to you | | No | | We don’t share |
| For joint marketing with other financial companies | | No | | We don’t share |
For our affiliates’ everyday business purposes – information about your transactions and experiences | | No | | We don’t share |
For our affiliates’ everyday business purposes – information about your creditworthiness | | No | | We don’t share |
| For nonaffiliates to market to you | | No | | We don’t share |
| | |
| | |
| Questions? | | Call800-225-2606 or go tomfs.com. |
27
| | |
| Who we are |
| Who is providing this notice? | | MFS Funds, MFS Investment Management, MFS Institutional Advisors, Inc., and MFS Heritage Trust Company. |
| | |
| What we do |
| How does MFS protect my personal information? | | To protect your personal information from unauthorized access and use, we use security measures that comply with federal law. These measures include procedural, electronic, and physical safeguards for the protection of the personal information we collect about you. |
How does MFS
collect my personal information? | | We collect your personal information, for example, when you • open an account or provide account information • direct us to buy securities or direct us to sell your securities • make a wire transfer We also collect your personal information from others, such as credit bureaus, affiliates, or other companies. |
| Why can’t I limit all sharing? | | Federal law gives you the right to limit only • sharing for affiliates’ everyday business purposes – information about your creditworthiness • affiliates from using your information to market to you • sharing for nonaffiliates to market to you State laws and individual companies may give you additional rights to limit sharing. |
| | |
| Definitions |
| Affiliates | | Companies related by common ownership or control. They can be financial and nonfinancial companies. • MFS does not share personal information with affiliates, except for everyday business purposes as described on page one of this notice. |
| Nonaffiliates | | Companies not related by common ownership or control. They can be financial and nonfinancial companies. • MFS does not share with nonaffiliates so they can market to you. |
| Joint marketing | | A formal agreement between nonaffiliated financial companies that together market financial products or services to you. • MFS doesn’t jointly market. |
| | |
| Other important information |
| If you own an MFS product or receive an MFS service in the name of a third party such as a bank or broker-dealer, their privacy policy may apply to you instead of ours. |
28
Annual Report
December 31, 2019

MFS® Inflation-Adjusted Bond Portfolio

MFS® Variable Insurance Trust III
Beginning on January 1, 2021, as permitted by regulations adopted by the U.S. Securities and Exchange Commission, the insurance company that offers your contract may determine that it will no longer send you paper copies of the fund’s annual and semiannual shareholder reports unless you specifically request paper copies from the insurance company or from your financial intermediary. Instead, the shareholder reports will be made available on a Web site (insurancefunds.mfs.com or other Web site of which you will be notified), and the insurance company will notify you by mail each time a report is posted and provide you with a Web site link to access the report. Instructions for requesting paper copies will be provided by your insurance company or financial intermediary.
If you already elected to receive shareholder reports by email, you will not be affected by this change and you need not take any action. If your insurance company or financial intermediary offers electronic delivery, you may elect to receive shareholder reports and other communications from the insurance company or financial intermediary by email by following the instructions provided by the insurance company or financial intermediary.
Beginning on January 1, 2019, you may elect to receive all future reports in paper free of charge from the insurance company or financial intermediary. You can inform the insurance company or financial intermediary that you wish to continue receiving paper copies of your shareholder reports by contacting your insurance company or financial intermediary. Your election to receive reports in paper will apply to all funds held in your account with your insurance company or financial intermediary.
VIA-ANN
MFS® Inflation-Adjusted Bond Portfolio
CONTENTS
The report is prepared for the general information of contract owners. It is authorized for distribution to prospective investors only when preceded or accompanied by a current prospectus.
NOT FDIC INSURED• MAY LOSE VALUE• NO BANK OR CREDIT UNION GUARANTEE• NOT A DEPOSIT• NOT INSURED BY ANY FEDERAL GOVERNMENT AGENCY OR NCUA/NCUSIF
MFS Inflation-Adjusted Bond Portfolio
LETTER FROM THE EXECUTIVE CHAIR

Dear Contract Owners:
Slowing global growth, low inflation, and trade friction between the United States and China have been hallmarks of the past 12 months. After experiencing an uptick in market volatility in late 2018, markets steadied for most of 2019, thanks in large measure to the adoption of a dovish policy stance on the part of global central banks, focused on supporting economic growth. Negotiations aimed at a “phase one��� trade deal between the U.S. and China bore fruit at the end of the period, boosting investor sentiment, while signs of stability emerging from the global manufacturing sector also lifted spirits. Uncertainty over Brexit, along with the ripple effects from the trade conflict, hampered business confidence and investment in the United Kingdom and Europe for much of the period, though investors expect greater clarity regarding Brexit as a result of December’s general election. The pro-Brexit Conservative Party won the election by a comfortable margin and set the stage for the U.K.’s departure from the EU at the end of January.
Markets expect the longest economic expansion in U.S. history will continue, albeit at a slower pace, as trade tensions recede. In an effort to prolong the expansion, the U.S. Federal Reserve lowered interest rates three times between July and October and the European Central Bank loosened policy in September. While the global monetary policy backdrop remains quite accommodative, signs of easing trade tensions and fading global recession fears led to improved market sentiment in late 2019 as investors grew less risk averse. In early 2020, an outbreak of coronavirus emanating from China reintroduced global growth fears, causing an uptick in volatility.
Here at MFS®, we aim to help our clients navigate the growing complexity of the markets and world economies. Our long-term investment philosophy and commitment to the responsible allocation of capital allow us to tune out the noise and uncover what we believe are the best, most durable investment opportunities in the market. Through our powerful global investment platform, we combine collective expertise, thoughtful risk management and long-term discipline to create sustainable value for investors.
Respectfully,

Robert J. Manning
Executive Chair
MFS Investment Management
February 14, 2020
The opinions expressed in this letter are subject to change and may not be relied upon for investment advice. No forecasts can be guaranteed.
1
MFS Inflation-Adjusted Bond Portfolio
PORTFOLIO COMPOSITION
Portfolio structure (i)
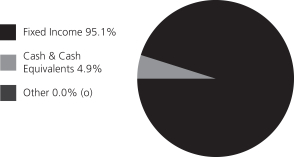
| | | | |
| Fixed income sectors (i) | | | | |
| Non-U.S. Government Bonds | | | 44.9% | |
| U.S. Treasury Securities | | | 43.5% | |
| Emerging Markets Bonds | | | 2.5% | |
| Collateralized Debt Obligations | | | 1.9% | |
| Mortgage-Backed Securities | | | 1.1% | |
| Investment Grade Corporates | | | 0.7% | |
| Commercial Mortgage-Backed Securities | | | 0.5% | |
|
| Composition including fixed income credit quality (a)(i) | |
| AAA | | | 7.1% | |
| AA | | | 27.8% | |
| A | | | 3.2% | |
| BBB | | | 7.6% | |
| BB | | | 2.5% | |
| U.S. Government | | | 43.5% | |
| Federal Agencies | | | 1.1% | |
| Not Rated | | | 2.3% | |
| Cash & Cash Equivalents | | | 4.9% | |
| Other (o) | | | 0.0% | |
| | | | |
| Portfolio facts (i) | | | | |
| Average Duration (d) | | | 8.0 | |
| Average Effective Maturity (m) | | | 13.8 yrs. | |
| |
| Issuer country weightings (i)(x) | | | | |
| United States | | | 52.4% | |
| United Kingdom | | | 24.9% | |
| Italy | | | 5.4% | |
| Japan | | | 3.0% | |
| Australia | | | 2.8% | |
| France | | | 2.7% | |
| Spain | | | 2.7% | |
| Greece | | | 2.5% | |
| Canada | | | 2.4% | |
| Other Countries | | | 1.2% | |
| |
| Currency exposure weightings (i)(y) | | | | |
| United States Dollar | | | 45.8% | |
| British Pound Sterling | | | 28.7% | |
| Euro | | | 18.7% | |
| New Zealand Dollar | | | 2.1% | |
| Canadian Dollar | | | 1.7% | |
| Japanese Yen | | | 1.2% | |
| Australian Dollar | | | 1.0% | |
| Swedish Krona | | | 0.6% | |
| Danish Krone | | | 0.2% | |
| (a) | | For all securities other than those specifically described below, ratings are assigned to underlying securities utilizing ratings from Moody’s, Fitch, and Standard & Poor’s rating agencies and applying the following hierarchy: If all three agencies provide a rating, the middle rating (after dropping the highest and lowest ratings) is assigned; if two of the three agencies rate a security, the lower of the two is assigned. Ratings are shown in the S&P and Fitch scale (e.g., AAA). Securities rated BBB or higher are considered investment grade. All ratings are subject to change. U.S. Government includes securities issued by the U.S. Department of the Treasury. Federal Agencies includes rated and unrated U.S. Agency fixed-income securities, U.S. Agency mortgage-backed securities, and collateralized mortgage obligations of U.S. Agency mortgage-backed securities. Not Rated includes fixed income securities and fixed income derivatives, which have not been rated by any rating agency. The fund may or may not have held all of these instruments on this date. The fund is not rated by these agencies. |
| (d) | | Duration is a measure of how much a bond’s price is likely to fluctuate with general changes in interest rates, e.g., if rates rise 1.00%, a bond with a5-year duration is likely to lose about 5.00% of its value due to the interest rate move. |
| (i) | | For purposes of this presentation, the components include the value of securities, and reflect the impact of the equivalent exposure of derivative positions, if any. These amounts may be negative from time to time. Equivalent exposure is a calculated amount that translates the derivative position into a reasonable approximation of the amount of the underlying asset that the portfolio would have to hold at a given point in time to have the same price sensitivity that results from the portfolio’s ownership of the derivative contract. When dealing with derivatives, equivalent exposure is a more representative measure of the potential impact of a position on portfolio performance than value. The bond component will include any accrued interest amounts. |
| (m) | | In determining each instrument’s effective maturity for purposes of calculating the fund’s dollar-weighted average effective maturity, MFS uses the instrument’s stated maturity or, if applicable, an earlier date on which MFS believes it is probable that a maturity-shortening device (such as a put,pre-refunding or prepayment) will cause the instrument to be repaid. Such an earlier date can be substantially shorter than the instrument’s stated maturity. |
2
MFS Inflation-Adjusted Bond Portfolio
Portfolio Composition – continued
| (x) | | Represents the portfolio’s exposure to issuer countries as a percentage of a portfolio’s net assets. For purposes of this presentation, United States includes Cash & Cash Equivalents and Other. |
| (y) | | Represents the portfolio’s exposure to a particular currency as a percentage of a portfolio’s net assets. For purposes of this presentation, United States Dollar includes Cash & Cash Equivalents. |
Where the fund holds convertible bonds, they are treated as part of the equity portion of the portfolio.
Cash & Cash Equivalents includes any cash, investments in money market funds, short-term securities, and other assets less liabilities. Please see the Statement of Assets and Liabilities for additional information related to the fund’s cash position and other assets and liabilities.
Other includes equivalent exposure from currency derivatives and/or any offsets to derivative positions.
Percentages are based on net assets as of December 31, 2019.
The portfolio is actively managed and current holdings may be different.
3
MFS Inflation-Adjusted Bond Portfolio
MANAGEMENT REVIEW
Summary of Results
For the twelve months ended December 31, 2019, Initial Class shares of the MFS Inflation-Adjusted Bond Portfolio (fund) provided a total return of 8.26%, while Service Class shares of the fund provided a total return of 8.05%. These compare with a return of 8.21% over the same period for the fund’s benchmark, the Bloomberg Barclays World Government Inflation-Linked Bond Index.
Market Environment
Fading fears of a near-term global recession, the announcement of a partial trade deal between the United States and China and the decline in uncertainty over Brexit helped bolster market sentiment late in the period. Changes in market sentiment, largely driven by uncertainty over the outcome of trade negotiations between the US and China, had contributed to periodic bouts of volatility during the reporting period. The global economy decelerated, led by weakness in China and Europe, although the pace of the slowdown moderated late in the period amid nascent signs of stabilization in the manufacturing sector.
The deteriorating global growth backdrop, along with declining inflationary pressures, prompted the US Federal Reserve to adopt a more dovish posture beginning in early 2019, resulting in the first interest rate cut in over a decade at the end of July, followed by additional cuts in September and October. The Fed’s actions led to a sharp decline in long-term interest rates during the period’s second half, causing the inversion of portions of the US Treasury yield curve for a time. Amid an improvement in risk sentiment in Q4 2019 and indications of a bottoming in growth and a potential upturn in activity, the Fed indicated in October that further rate cuts were unlikely unless the outlook for the economy materially worsened.
Globally, central banks have tilted more dovish as well, with the European Central Bank unveiling a package of easing measures, which included putting overnight rates deeper into negative territory, restarting its bond-buying program and lengthening the term of cheap loans to banks to three years from two. The central banks of India and Australia are among those that have cut rates several times in recent months, although China has been more cautious in increasing liquidity as it keeps trying to deleverage its economy, cutting rates only marginally.
Emerging markets experienced considerable volatility through the end of 2018, as tighter global financial conditions exposed structural weakness in some countries. Those conditions improved in 2019 as the Fed became more dovish. Notwithstanding the periodic headwinds on market sentiment from significant trade friction between the US and China over much of the year, emerging market hard currency debt and local rates benefited from relatively cheap valuations at the beginning of the period and easier global monetary conditions. These factors, plus the fading of certain global risk factors mentioned above, hastened spread tightening in the latter part of the period. At the same time, idiosyncratic risks spiked in some countries (e.g., Argentina and Lebanon), contributing to increased dispersion in performance among sovereign assets.
Factors Affecting Performance
Relative to the Bloomberg Barclays World Government Inflation-Linked Bond Index, the fund’s foreign currency exposure, notably to the euro, Norwegian krone and Canadian dollar, was a primary factor that detracted from performance. Both the Norwegian krone and euro depreciated against the U.S. dollar over the reporting period, while the Canadian dollar appreciated against the U.S. dollar.
Conversely, the fund’s duration (d) exposure, particularly its longer relative duration in both the United States and Australia, benefited relative returns, as interest rates generally declined. Additionally, bond allocation, notably the fund’s greater exposure to issuers in Portugal, Spain and Greece, and its lesser exposure to bonds in the United Kingdom, also supported relative returns and outweighed the negative impact of the fund’s lesser exposure to Italian bonds.
Respectfully,
Portfolio Manager(s)
Robert Spector and Erik Weisman
Note to Shareholders: Effective December 31, 2019, Robert Spector was added as a Portfolio Manager of the Fund.
| (d) | Duration is a measure of how much a bond’s price is likely to fluctuate with general changes in interest rates, e.g., if rates rise 1.00%, a bond with a5-year duration is likely to lose about 5.00% of its value. |
The views expressed in this report are those of the portfolio manager(s) only through the end of the period of the report as stated on the cover and do not necessarily reflect the views of MFS or any other person in the MFS organization. These views are subject to change at any time based on market or other conditions, and MFS disclaims any responsibility to update such views. These views may not be relied upon as investment advice or an indication of trading intent on behalf of any MFS portfolio. References to specific securities are not recommendations of such securities, and may not be representative of any MFS portfolio’s current or future investments.
4
MFS Inflation-Adjusted Bond Portfolio
PERFORMANCE SUMMARY THROUGH 12/31/19
The following chart illustrates the historical performance of the fund in comparison to its benchmark(s). Benchmarks are unmanaged and may not be invested in directly. Benchmark returns do not reflect any fees or expenses. The performance of other share classes will be greater than or less than that of the class depicted below. (See Notes to Performance Summary.)
Performance data shown represents past performance and is no guarantee of future results. Investment return and principal value fluctuate so your units, when sold, may be worth more or less than the original cost; current performance may be lower or higher than quoted. The performance shown does not reflect the deduction of taxes, if any, that a contract holder would pay on fund distributions or the redemption of contract units. The returns for the fund shown also do not reflect the deduction of expenses associated with variable products, such as mortality and expense risk charges, separate account charges, and sales charges imposed by the insurance company separate accounts. Such expenses would reduce the overall returns shown.
Growth of a Hypothetical $10,000 Investment
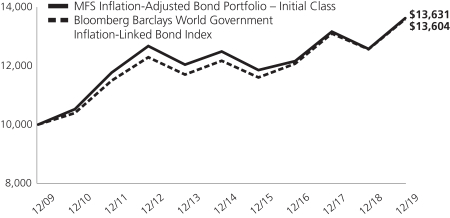
Total Returns through 12/31/19
Average annual total returns
| | | | | | | | | | | | |
| | | Share Class | | Class Inception Date | | 1-yr | | 5-yr | | 10-yr | | |
| | | Initial Class | | 10/01/08 | | 8.26% | | 1.76% | | 3.15% | | |
| | | Service Class | | 10/01/08 | | 8.05% | | 1.52% | | 2.89% | | |
| | | | |
| Comparative benchmark(s) | | | | | | | | |
| | | Bloomberg Barclays World Government Inflation-Linked Bond Index (f) | | 8.21% | | 2.23% | | 3.13% | | |
| (f) | Source: FactSet Research Systems Inc. |
Benchmark Definition(s)
Bloomberg Barclays World Government Inflation-Linked Bond Index – measures the performance of the major governmentinflation-linked bond markets. BLOOMBERG® is a trademark and service mark of Bloomberg Finance L.P. and its affiliates (collectively “Bloomberg”). BARCLAYS® is a trademark and service mark of Barclays Bank Plc (collectively with its affiliates, “Barclays”), used under license. Bloomberg or Bloomberg’s licensors, including Barclays, own all proprietary rights in the Bloomberg Barclays Indices. Neither Bloomberg nor Barclays approves or endorses this material, or guarantees the accuracy or completeness of any information herein, or makes any warranty, express or implied, as to the results to be obtained therefrom, and, to the maximum extent allowed by law, neither shall have any liability or responsibility for injury or damages arising in connection therewith.
It is not possible to invest directly in an index.
Notes to Performance Summary
Average annual total return represents the average annual change in value for each share class for the periods presented.
Performance results reflect any applicable expense subsidies and waivers in effect during the periods shown. Without such subsidies and waivers the fund’s performance results would be less favorable. Please see the prospectus and financial statements for complete details. All results are historical and assume the reinvestment of any dividends and capital gains distributions.
5
MFS Inflation-Adjusted Bond Portfolio
Performance Summary – continued
Performance prior to close of business December 7, 2012, reflects time periods when another adviser or subadviser was responsible for selecting investments for the fund under a different investment objective and different investment strategies.
Performance results do not include adjustments made for financial reporting purposes in accordance with U.S. generally accepted accounting principles and may differ from amounts reported in the financial highlights.
From time to time the fund may receive proceeds from litigation settlements, without which performance would be lower.
6
MFS Inflation-Adjusted Bond Portfolio
EXPENSE TABLE
Fund Expenses Borne by the Contract Holders during the Period,
July 1, 2019 through December 31, 2019
As a contract holder of the fund, you incur ongoing costs, including management fees; distribution and/or service(12b-1) fees; and other fund expenses. This example is intended to help you understand your ongoing costs (in dollars) of investing in the fund and to compare these costs with the ongoing costs of investing in other mutual funds.
The example is based on an investment of $1,000 invested at the beginning of the period and held for the entire period July 1, 2019 through December 31, 2019.
Actual Expenses
The first line for each share class in the following table provides information about actual account values and actual expenses. You may use the information in this line, together with the amount you invested, to estimate the expenses that you paid over the period. Simply divide your account value by $1,000 (for example, an $8,600 account value divided by $1,000 = 8.6), then multiply the result by the number in the first line under the heading entitled “Expenses Paid During Period” to estimate the expenses you paid on your account during this period.
Hypothetical Example for Comparison Purposes
The second line for each share class in the following table provides information about hypothetical account values and hypothetical expenses based on the fund’s actual expense ratio and an assumed rate of return of 5% per year before expenses, which is not the fund’s actual return. The hypothetical account values and expenses may not be used to estimate the actual ending account balance or expenses you paid for the period. You may use this information to compare the ongoing costs of investing in the fund and other funds. To do so, compare this 5% hypothetical example with the 5% hypothetical examples that appear in the shareholder reports of the other funds.
Please note that the expenses shown in the table are meant to highlight the fund’s ongoing costs only and do not take into account the fees and expenses imposed under the variable contracts through which your investment in the fund is made. Therefore, the second line for each share class in the table is useful in comparing ongoing costs associated with an investment in vehicles (such as the fund) which fund benefits under variable annuity and variable life insurance contracts and to qualified pension and retirement plans only, and will not help you determine the relative total costs of investing in the fund through variable annuity and variable life insurance contracts. If the fees and expenses imposed under the variable contracts were included, your costs would have been higher.
| | | | | | | | | | | | | | | | | | |
| Share Class | | | | Annualized
Expense Ratio | | | Beginning
Account Value
7/01/19 | | | Ending
Account Value
12/31/19 | | | Expenses Paid
During Period (p)
7/01/19-12/31/19 | |
| Initial Class | | Actual | | | 0.56% | | | | $1,000.00 | | | | $1,014.66 | | | | $2.84 | |
| | Hypothetical (h) | | | 0.56% | | | | $1,000.00 | | | | $1,022.38 | | | | $2.85 | |
| Service Class | | Actual | | | 0.81% | | | | $1,000.00 | | | | $1,013.80 | | | | $4.11 | |
| | Hypothetical (h) | | | 0.81% | | | | $1,000.00 | | | | $1,021.12 | | | | $4.13 | |
| (h) | 5% class return per year before expenses. |
| (p) | “Expenses Paid During Period” are equal to each class’s annualized expense ratio, as shown above, multiplied by the average account value over the period, multiplied by 184/365 (to reflect theone-half year period). |
7
MFS Inflation-Adjusted Bond Portfolio
PORTFOLIO OF INVESTMENTS – 12/31/19
The Portfolio of Investments is a complete list of all securities owned by your fund. It is categorized by broad-based asset classes.
| | | | | | | | |
| | |
| Issuer | | Shares/Par | | | Value ($) | |
| BONDS – 94.8% | | | | | | | | |
| Asset-Backed & Securitized – 2.4% | | | | | |
| Benchmark Mortgage Trust,2019-B12, “A5”, 3.115%, 8/15/2052 | | $ | 710,554 | | | $ | 737,156 | |
| Dryden Senior Loan Fund,2018-55A, “A1”, CLO, FLR, 3.02% (LIBOR - 3mo. + 1.02%), 4/15/2031 (n) | | | 725,000 | | | | 719,934 | |
| Galaxy CLO Ltd.,2018-29A, “A”, FLR, 2.7% (LIBOR - 3mo. + 0.79%), 11/15/2026 (n) | | | 449,619 | | | | 449,389 | |
| Loomis, Sayles & Co., CLO, “A2”, FLR, 3.4% (LIBOR - 3mo. + 1.4%), 4/15/2028 (n) | | | 854,664 | | | | 848,933 | |
| Madison Park Funding Ltd.,2014-13A, “BR2”, FLR, 3.465% (LIBOR - 3mo. + 1.5%), 4/19/2030 (n) | | | 901,666 | | | | 892,419 | |
| Symphony CLO Ltd.,2016-17A, “BR”, FLR, 3.2% (LIBOR - 3mo. + 1.2%), 4/15/2028 (n) | | | 764,124 | | | | 765,337 | |
| TICP CLO Ltd.,2018-13R, “A”, FLR, 2.805% (LIBOR - 3mo. + 0.8%), 4/20/2028 (n) | | | 1,283,440 | | | | 1,276,956 | |
| Wells Fargo Commercial Mortgage Trust,2019-C54, “A4”, 3.146%, 12/15/2052 | | | 392,680 | | | | 406,405 | |
| | | | | | | | |
| | | | | | $ | 6,096,529 | |
| | | | | | | | |
| Automotive – 0.4% | | | | | | | | |
| Hyundai Capital America, 2.85%, 11/01/2022 (n) | | $ | 444,000 | | | $ | 448,717 | |
| Volkswagen Group of America Co., 2.7%, 9/26/2022 (n) | | | 441,000 | | | | 445,803 | |
| | | | | | | | |
| | | | | | $ | 894,520 | |
| | | | | | | | |
| Consumer Services – 0.1% | | | | | | | | |
| Conservation Fund, 3.474%, 12/15/2029 | | $ | 312,000 | | | $ | 310,601 | |
| | | | | | | | |
| Emerging Market Sovereign – 2.5% | | | | | |
| Hellenic Republic (Republic of Greece), 3.875%, 3/12/2029 | | EUR | 4,700,000 | | | $ | 6,350,101 | |
| | | | | | | | |
| International Market Sovereign – 44.8% | | | | | |
| Commonwealth of Australia, Inflation Linked Bond, 3%, 9/20/2025 | | AUD | 790,956 | | | $ | 652,477 | |
| Commonwealth of Australia, Inflation Linked Bond, 0.75%, 11/21/2027 | | | 6,473,420 | | | | 4,802,250 | |
| Commonwealth of Australia, Inflation Linked Bond, 2.5%, 9/20/2030 | | | 765,513 | | | | 675,833 | |
| Commonwealth of Australia, Inflation Linked Bond, 1.25%, 8/21/2040 | | | 1,150,839 | | | | 952,433 | |
| Government of Canada, Inflation Linked Bond, 4.25%, 12/01/2026 | | CAD | 256,621 | | | | 250,712 | |
| Government of Canada, Inflation Linked Bond, 4%, 12/01/2031 | | | 2,162,903 | | | | 2,381,684 | |
| Government of Canada, Inflation Linked Bond, 3%, 12/01/2036 | | | 2,924,403 | | | | 3,212,036 | |
| | | | | | | | |
| | |
Issuer | | Shares/Par | | | Value ($) | |
| BONDS – continued | | | | | | | | |
| International Market Sovereign – continued | | | | | |
| Government of Canada, Inflation Linked Bond, 2%, 12/01/2041 | | CAD | 320,550 | | | $ | 328,279 | |
| Government of Japan, Inflation Linked Bond, 0.1%, 3/10/2026 | | JPY | 824,620,500 | | | | 7,748,723 | |
| Government of New Zealand, Inflation Linked Bond, 3%, 9/20/2030 | | NZD | 1,625,100 | | | | 1,361,653 | |
| Kingdom of Spain, Inflation Linked Bond, 1%, 11/30/2030 | | EUR | 3,191,130 | | | | 4,223,705 | |
| Kingdom of Spain, Inflation Linked Bond, 0.7%, 11/30/2033 (n) | | | 2,061,220 | | | | 2,695,740 | |
| Kingdom of Sweden, Inflation Linked Bond, 3.5%, 12/01/2028 | | SEK | 8,525,855 | | | | 1,371,150 | |
| Republic of France, Inflation Linked Bond, 0.7%, 7/25/2030 | | EUR | 2,262,617 | | | | 3,006,843 | |
| Republic of France, Inflation Linked Bond, 3.15%, 7/25/2032 | | | 193,329 | | | | 334,698 | |
| Republic of France, Inflation Linked Bond, 0.1%, 7/25/2036 (n) | | | 2,503,109 | | | | 3,212,591 | |
| Republic of France, Inflation Linked Bond, 0.1%, 7/25/2047 | | | 274,422 | | | | 366,502 | |
| Republic of Italy, Inflation Linked Bond, 3.1%, 9/15/2026 | | | 2,893,670 | | | | 3,900,461 | |
| Republic of Italy, Inflation Linked Bond, 1.3%, 5/15/2028 | | | 2,620,150 | | | | 3,151,513 | |
| Republic of Italy, Inflation Linked Bond, 2.35%, 9/15/2035 | | | 1,467,835 | | | | 2,052,787 | |
| Republic of Italy, Inflation Linked Bond, 2.55%, 9/15/2041 | | | 3,295,236 | | | | 4,712,887 | |
| United Kingdom Treasury, 4.125%, 7/22/2030 | | GBP | 899,067 | | | | 2,088,042 | |
| United Kingdom Treasury, Inflation Linked Bond, 1.25%, 11/22/2032 | | | 294,254 | | | | 596,448 | |
| United Kingdom Treasury, Inflation Linked Bond, 0.75%, 3/22/2034 | | | 2,632,450 | | | | 5,185,816 | |
| United Kingdom Treasury, Inflation Linked Bond, 2%, 1/26/2035 | | | 3,080,247 | | | | 7,114,360 | |
| United Kingdom Treasury, Inflation Linked Bond, 0.125%, 11/22/2036 | | | 2,010,438 | | | | 3,848,871 | |
| United Kingdom Treasury, Inflation Linked Bond, 1.125%, 11/22/2037 | | | 1,019,553 | | | | 2,289,030 | |
| United Kingdom Treasury, Inflation Linked Bond, 0.625%, 3/22/2040 | | | 1,130,708 | | | | 2,454,958 | |
| United Kingdom Treasury, Inflation Linked Bond, 0.625%, 11/22/2042 | | | 1,353,241 | | | | 3,100,413 | |
| United Kingdom Treasury, Inflation Linked Bond, 4.5%, 12/07/2042 | | | 1,800,000 | | | | 3,884,711 | |
| United Kingdom Treasury, Inflation Linked Bond, 0.125%, 3/22/2044 | | | 1,755,055 | | | | 3,728,541 | |
| United Kingdom Treasury, Inflation Linked Bond, 0.125%, 3/22/2046 | | | 906,889 | | | | 1,979,335 | |
| United Kingdom Treasury, Inflation Linked Bond, 0.75%, 11/22/2047 | | | 1,807,368 | | | | 4,610,437 | |
8
MFS Inflation-Adjusted Bond Portfolio
Portfolio of Investments – continued
| | | | | | | | |
| | |
| Issuer | | Shares/Par | | | Value ($) | |
| BONDS – continued | | | | | | | | |
| International Market Sovereign – continued | | | | | |
| United Kingdom Treasury, Inflation Linked Bond, 0.125%, 8/10/2048 | | GBP | 237,794 | | | $ | 537,634 | |
| United Kingdom Treasury, Inflation Linked Bond, 0.5%, 3/22/2050 | | | 1,424,883 | | | | 3,586,551 | |
| United Kingdom Treasury, Inflation Linked Bond, 0.25%, 3/22/2052 | | | 1,253,822 | | | | 3,089,942 | |
| United Kingdom Treasury, Inflation Linked Bond, 1.25%, 11/22/2055 | | | 1,063,765 | | | | 3,499,225 | |
| United Kingdom Treasury, Inflation Linked Bond, 0.125%, 11/22/2056 | | | 575,610 | | | | 1,480,931 | |
| United Kingdom Treasury, Inflation Linked Bond, 0.125%, 3/22/2058 | | | 936,334 | | | | 2,444,752 | |
| United Kingdom Treasury, Inflation Linked Bond, 0.375%, 3/22/2062 | | | 1,224,091 | | | | 3,633,763 | |
| United Kingdom Treasury, Inflation Linked Bond, 0.125%, 11/22/2065 | | | 429,325 | | | | 1,267,215 | |
| United Kingdom Treasury, Inflation Linked Bond, 0.125%, 3/22/2068 | | | 1,099,101 | | | | 3,429,866 | |
| | | | | | | | |
| | | | | | $ | 115,245,798 | |
| | | | | | | | |
| Medical & Health Technology & Services – 0.2% | | | | | |
| CommonSpirit Health, 2.76%, 10/01/2024 | | $ | 499,000 | | | $ | 503,180 | |
| | | | | | | | |
| Mortgage-Backed – 1.1% | | | | | | | | |
| Freddie Mac, 3.9%, 4/25/2028 | | $ | 1,669,632 | | | $ | 1,843,220 | |
| Freddie Mac, 3.85%, 5/25/2028 | | | 390,000 | | | | 429,116 | |
| Freddie Mac, 3.854%, 6/25/2028 | | | 555,000 | | | | 610,993 | |
| | | | | | | | |
| | | | | | $ | 2,883,329 | |
| | | | | | | | |
| U.S. Treasury Inflation Protected Securities – 43.3% | |
| U.S. Treasury Bonds, 0.375%, 7/15/2023 | | $ | 1,746,074 | | | $ | 1,770,112 | |
| U.S. Treasury Bonds, 0.625%, 1/15/2024 | | | 935,268 | | | | 955,014 | |
| U.S. Treasury Bonds, 0.25%, 1/15/2025 | | | 5,364,050 | | | | 5,411,351 | |
| U.S. Treasury Bonds, 2.375%, 1/15/2025 | | | 3,649,260 | | | | 4,066,793 | |
| U.S. Treasury Bonds, 0.625%, 1/15/2026 | | | 2,057,776 | | | | 2,120,673 | |
| U.S. Treasury Bonds, 2%, 1/15/2026 | | | 5,937,040 | | | | 6,598,813 | |
| U.S. Treasury Bonds, 0.375%, 1/15/2027 | | | 5,437,495 | | | | 5,519,517 | |
| U.S. Treasury Bonds, 2.375%, 1/15/2027 | | | 4,789,166 | | | | 5,527,403 | |
| U.S. Treasury Bonds, 1.75%, 1/15/2028 | | | 5,340,996 | | | | 5,999,375 | |
| U.S. Treasury Bonds, 3.625%, 4/15/2028 | | | 4,167,038 | | | | 5,329,921 | |
| U.S. Treasury Bonds, 2.5%, 1/15/2029 | | | 2,452,356 | | | | 2,955,177 | |
| | | | | | | | |
| | |
| Issuer | | Shares/Par | | | Value ($) | |
| BONDS – continued | | | | | | | | |
| U.S. Treasury Inflation Protected Securities – continued | |
| U.S. Treasury Bonds, 3.875%, 4/15/2029 | | $ | 5,782,588 | | | $ | 7,714,769 | |
| U.S. Treasury Bonds, 2.125%, 2/15/2040 | | | 2,324,110 | | | | 3,037,030 | |
| U.S. Treasury Bonds, 2.125%, 2/15/2041 | | | 1,465,375 | | | | 1,929,660 | |
| U.S. Treasury Bonds, 0.75%, 2/15/2042 | | | 8,025,687 | | | | 8,333,466 | |
| U.S. Treasury Bonds, 0.625%, 2/15/2043 | | | 3,005,347 | | | | 3,038,498 | |
| U.S. Treasury Bonds, 1.375%, 2/15/2044 | | | 2,413,759 | | | | 2,845,741 | |
| U.S. Treasury Notes, 0.125%, 4/15/2021 | | | 989,164 | | | | 987,103 | |
| U.S. Treasury Notes, 0.625%, 7/15/2021 | | | 2,732,303 | | | | 2,762,887 | |
| U.S. Treasury Notes, 0.125%, 1/15/2022 | | | 11,990,802 | | | | 11,984,039 | |
| U.S. Treasury Notes, 0.125%, 1/15/2023 | | | 2,244,274 | | | | 2,243,956 | |
| U.S. Treasury Notes, 0.125%, 7/15/2024 | | | 4,146,581 | | | | 4,171,017 | |
| U.S. Treasury Notes, 0.375%, 7/15/2025 | | | 3,785,073 | | | | 3,861,899 | |
| U.S. Treasury Notes, 0.125%, 7/15/2026 | | | 4,056,023 | | | | 4,068,484 | |
| U.S. Treasury Notes, 0.375%, 7/15/2027 | | | 3,156,030 | | | | 3,218,954 | |
| U.S. Treasury Notes, 0.5%, 1/15/2028 | | | 4,877,334 | | | | 5,002,878 | |
| | | | | | | | |
| | | | | | $ | 111,454,530 | |
| | | | | | | | |
Total Bonds
(Identified Cost, $223,730,232) | | | | | | $ | 243,738,588 | |
| | | | | | | | |
| |
| INVESTMENT COMPANIES (h) – 2.3% | | | | | |
| Money Market Funds – 2.3% | | | | | | | | |
MFS Institutional Money Market Portfolio, 1.7% (v)
(Identified Cost, $6,004,117) | | | 6,004,405 | | | $ | 6,004,405 | |
| | | | | | | | |
OTHER ASSETS, LESS
LIABILITIES – 2.9% | | | | | | | 7,403,681 | |
| | | | | | | | |
| NET ASSETS – 100.0% | | | | | | $ | 257,146,674 | |
| | | | | | | | |
| (h) | | An affiliated issuer, which may be considered one in which the fund owns 5% or more of the outstanding voting securities, or a company which is under common control. At period end, the aggregate values of the fund’s investments in affiliated issuers and in unaffiliated issuers were $6,004,405 and $243,738,588, respectively. |
| (n) | | Securities exempt from registration under Rule 144A of the Securities Act of 1933. These securities may be sold in the ordinary course of business in transactions exempt from registration, normally to qualified institutional buyers. At period end, the aggregate value of these securities was $11,755,819, representing 4.6% of net assets. |
| (v) | | Affiliated issuer that is available only to investment companies managed by MFS. The rate quoted for the MFS Institutional Money Market Portfolio is the annualizedseven-day yield of the fund at period end. |
The following abbreviations are used in this report and are defined:
| CLO | | Collateralized Loan Obligation |
| FLR | | Floating Rate. Interest rate resets periodically based on the parenthetically disclosed reference rate plus a spread (if any). Theperiod-end rate reported may not be the current rate. All reference rates are USD unless otherwise noted. |
| LIBOR | | London Interbank Offered Rate |
9
MFS Inflation-Adjusted Bond Portfolio
Portfolio of Investments – continued
Abbreviations indicate amounts shown in currencies other than the U.S. dollar. All amounts are stated in U.S. dollars unless otherwise indicated. A list of abbreviations is shown below:
Derivative Contracts at 12/31/19
Forward Foreign Currency Exchange Contracts
| | | | | | | | | | | | | | | | | | | | |
Currency Purchased | | Currency Sold | | Counterparty | | Settlement Date | | | Unrealized
Appreciation
(Depreciation) | |
| Asset Derivatives | | | | | | | | | | |
| AUD | | | 932,000 | | | | | USD | | 644,091 | | Merrill Lynch International | | | 2/28/2020 | | | | $10,846 | |
| AUD | | | 1,035,000 | | | | | USD | | 719,304 | | Morgan Stanley Capital Services, Inc. | | | 2/28/2020 | | | | 8,014 | |
| AUD | | | 1,657,898 | | | | | USD | | 1,161,064 | | State Street Bank Corp. | | | 2/28/2020 | | | | 3,977 | |
| CAD | | | 842,000 | | | | | USD | | 644,799 | | Brown Brothers Harriman | | | 2/28/2020 | | | | 3,757 | |
| CAD | | | 893,000 | | | | | USD | | 681,587 | | Morgan Stanley Capital Services, Inc. | | | 2/28/2020 | | | | 6,252 | |
| CAD | | | 2,554,691 | | | | | USD | | 1,947,712 | | UBS AG | | | 2/28/2020 | | | | 20,056 | |
| DKK | | | 3,969,186 | | | | | USD | | 592,855 | | Merrill Lynch International | | | 2/28/2020 | | | | 5,255 | |
| EUR | | | 406,471 | | | | | USD | | 457,443 | | Barclays Bank PLC | | | 2/28/2020 | | | | 89 | |
| EUR | | | 16,520,310 | | | | | USD | | 18,415,438 | | BNP Paribas S.A. | | | 2/28/2020 | | | | 180,123 | |
| EUR | | | 623,000 | | | | | USD | | 693,757 | | State Street Bank Corp. | | | 2/28/2020 | | | | 7,503 | |
| GBP | | | 6,718,376 | | | | | USD | | 8,884,817 | | Merrill Lynch International | | | 2/28/2020 | | | | 28,177 | |
| GBP | | | 868,000 | | | | | USD | | 1,134,016 | | State Street Bank Corp. | | | 2/28/2020 | | | | 17,524 | |
| NOK | | | 240,000 | | | | | USD | | 26,236 | | Merrill Lynch International | | | 2/28/2020 | | | | 1,107 | |
| NZD | | | 5,909,376 | | | | | USD | | 3,877,142 | | Citibank N.A. | | | 2/28/2020 | | | | 104,122 | |
| SEK | | | 2,323,693 | | | | | USD | | 245,733 | | Deutsche Bank AG | | | 2/28/2020 | | | | 3,025 | |
| USD | | | 5,075,196 | | | | | JPY | | 550,000,000 | | State Street Bank Corp. | | | 1/06/2020 | | | | 13,303 | |
| | | | | | | | | | | | | | | | | | | | |
| | | | | | | | | | | | | | | | | | | $413,130 | |
| | | | | | | | | | | | | | | | | | | | |
| Liability Derivatives | | | | | | | | | | |
| CAD | | | 841,000 | | | | | USD | | 648,882 | | State Street Bank Corp. | | | 2/28/2020 | | | | $(1,096 | ) |
| GBP | | | 324,876 | | | | | USD | | 434,301 | | Morgan Stanley Capital Services, Inc. | | | 2/28/2020 | | | | (3,301 | ) |
| JPY | | | 315,403,014 | | | | | USD | | 2,916,483 | | Deutsche Bank AG | | | 2/28/2020 | | | | (5,408 | ) |
| USD | | | 6,915,278 | | | | | AUD | | 10,110,376 | | State Street Bank Corp. | | | 2/28/2020 | | | | (189,509 | ) |
| USD | | | 5,650,351 | | | | | CAD | | 7,475,359 | | JPMorgan Chase Bank N.A. | | | 2/28/2020 | | | | (107,593 | ) |
| USD | | | 436,166 | | | | | EUR | | 390,157 | | Morgan Stanley Capital Services, Inc. | | | 2/28/2020 | | | | (3,003 | ) |
| USD | | | 5,322,369 | | | | | EUR | | 4,786,759 | | UBS AG | | | 2/28/2020 | | | | (65,694 | ) |
| USD | | | 738,908 | | | | | GBP | | 567,000 | | State Street Bank Corp. | | | 2/28/2020 | | | | (13,307 | ) |
| USD | | | 1,278,474 | | | | | JPY | | 139,483,000 | | Barclays Bank PLC | | | 2/28/2020 | | | | (8,912 | ) |
| USD | | | 1,231,710 | | | | | JPY | | 134,478,000 | | Morgan Stanley Capital Services, Inc. | | | 2/28/2020 | | | | (9,482 | ) |
| | | | | | | | | | | | | | | | | | | | |
| | | | | | | | | | | | | | | | | | | $(407,305 | ) |
| | | | | | | | | | | | | | | | | | | | |
See Notes to Financial Statements
10
MFS Inflation-Adjusted Bond Portfolio
FINANCIAL STATEMENTS | STATEMENT OF ASSETS AND LIABILITIES
This statement represents your fund’s balance sheet, which details the assets and liabilities comprising the total value of the fund.
| | | | |
At 12/31/19 | | | | |
| |
Assets | | | | |
Investments in unaffiliated issuers, at value (identified cost, $223,730,232) | | | $243,738,588 | |
Investments in affiliated issuers, at value (identified cost, $6,004,117) | | | 6,004,405 | |
Cash | | | 6 | |
Foreign currency, at value (identified cost, $5,063,291) | | | 5,061,893 | |
Receivables for | | | | |
Forward foreign currency exchange contracts | | | 413,130 | |
Investments sold | | | 1,615,280 | |
Fund shares sold | | | 674 | |
Interest | | | 866,692 | |
Other assets | | | 1,765 | |
Total assets | | | $257,702,433 | |
| |
Liabilities | | | | |
Payables for | | | | |
Forward foreign currency exchange contracts | | | $407,305 | |
Fund shares reacquired | | | 70,407 | |
Payable to affiliates | | | | |
Investment adviser | | | 6,907 | |
Administrative services fee | | | 237 | |
Shareholder servicing costs | | | 10 | |
Distribution and/or service fees | | | 1,727 | |
Payable for independent Trustees’ compensation | | | 64 | |
Accrued expenses and other liabilities | | | 69,102 | |
Total liabilities | | | $555,759 | |
Net assets | | | $257,146,674 | |
| |
Net assets consist of | | | | |
Paid-in capital | | | $233,784,359 | |
Total distributable earnings (loss) | | | 23,362,315 | |
Net assets | | | $257,146,674 | |
Shares of beneficial interest outstanding | | | 23,918,780 | |
| | | | | | | | | | | | |
| | | |
| | | Net assets | | | Shares
outstanding | | | Net asset value
per share | |
Initial Class | | | $131,220,664 | | | | 12,136,096 | | | | $10.81 | |
Service Class | | | 125,926,010 | | | | 11,782,684 | | | | 10.69 | |
See Notes to Financial Statements
11
MFS Inflation-Adjusted Bond Portfolio
FINANCIAL STATEMENTS | STATEMENT OF OPERATIONS
This statement describes how much your fund earned in investment income and accrued in expenses. It also describes any gains and/or losses generated by fund operations.
| | | | |
Year ended 12/31/19 | | | | |
| |
Net investment income (loss) | | | | |
Income | | | | |
Interest | | | $4,127,420 | |
Dividends from affiliated issuers | | | 264,158 | |
Other | | | 60 | |
Total investment income | | | $4,391,638 | |
Expenses | | | | |
Management fee | | | $1,315,740 | |
Distribution and/or service fees | | | 323,611 | |
Shareholder servicing costs | | | 2,885 | |
Administrative services fee | | | 46,164 | |
Independent Trustees’ compensation | | | 10,217 | |
Custodian fee | | | 30,613 | |
Shareholder communications | | | 16,135 | |
Audit and tax fees | | | 43,901 | |
Legal fees | | | 2,230 | |
Miscellaneous | | | 33,119 | |
Total expenses | | | $1,824,615 | |
Reduction of expenses by investment adviser | | | (25,670 | ) |
Net expenses | | | $1,798,945 | |
Net investment income (loss) | | | $2,592,693 | |
| |
Realized and unrealized gain (loss) | | | | |
Realized gain (loss) (identified cost basis) | | | | |
Unaffiliated issuers | | | $3,954,636 | |
Affiliated issuers | | | (1,168 | ) |
Forward foreign currency exchange contracts | | | (1,486,726 | ) |
Foreign currency | | | (112,144 | ) |
Net realized gain (loss) | | | $2,354,598 | |
Change in unrealized appreciation or depreciation | | | | |
Unaffiliated issuers | | | $15,262,436 | |
Affiliated issuers | | | 288 | |
Forward foreign currency exchange contracts | | | 705,044 | |
Translation of assets and liabilities in foreign currencies | | | 8,493 | |
Net unrealized gain (loss) | | | $15,976,261 | |
Net realized and unrealized gain (loss) | | | $18,330,859 | |
Change in net assets from operations | | | $20,923,552 | |
See Notes to Financial Statements
12
MFS Inflation-Adjusted Bond Portfolio
FINANCIAL STATEMENTS | STATEMENTS OF CHANGES IN NET ASSETS
These statements describe the increases and/or decreases in net assets resulting from operations, any distributions, and any shareholder transactions.
| | | | | | | | |
| | | Year ended | |
| | | 12/31/19 | | | 12/31/18 | |
Change in net assets | | | | | | | | |
| | |
From operations | | | | | | | | |
Net investment income (loss) | | | $2,592,693 | | | | $4,999,098 | |
Net realized gain (loss) | | | 2,354,598 | | | | 2,052,579 | |
Net unrealized gain (loss) | | | 15,976,261 | | | | (21,024,132 | ) |
Change in net assets from operations | | | $20,923,552 | | | | $(13,972,455 | ) |
Total distributions to shareholders | | | $(4,025,008 | ) | | | $(4,685,058 | ) |
Change in net assets from fund share transactions | | | $(26,028,674 | ) | | | $(42,912,583 | ) |
Total change in net assets | | | $(9,130,130 | ) | | | $(61,570,096 | ) |
| | |
Net assets | | | | | | | | |
At beginning of period | | | 266,276,804 | | | | 327,846,900 | |
At end of period | | | $257,146,674 | | | | $266,276,804 | |
See Notes to Financial Statements
13
MFS Inflation-Adjusted Bond Portfolio
FINANCIAL STATEMENTS | FINANCIAL HIGHLIGHTS
The financial highlights table is intended to help you understand the fund’s financial performance for the past 5 years. Certain information reflects financial results for a single fund share. The total returns in the table represent the rate that an investor would have earned (or lost) on an investment in the fund share class (assuming reinvestment of all distributions) held for the entire period.
| | | | | | | | | | | | | | | | | | | | |
| Initial Class | | Year ended | |
| | | | | |
| | | 12/31/19 | | | 12/31/18 | | | 12/31/17 | | | 12/31/16 | | | 12/31/15 | |
| | | | | |
Net asset value, beginning of period | | | $10.15 | | | | $10.81 | | | | $9.98 | | | | $9.73 | | | | $10.32 | |
| | | | | |
| Income (loss) from investment operations | | | | | | | | | | | | | | | | | | | | |
Net investment income (loss) (d) | | | $0.12 | | | | $0.19 | | | | $0.13 | | | | $0.07 | (c) | | | $(0.01 | ) |
Net realized and unrealized gain (loss) | | | 0.72 | | | | (0.67 | ) | | | 0.70 | | | | 0.18 | | | | (0.51 | ) |
Total from investment operations | | | $0.84 | | | | $(0.48 | ) | | | $0.83 | | | | $0.25 | | | | $(0.52 | ) |
| | | | | |
| Less distributions declared to shareholders | | | | | | | | | | | | | | | | | | | | |
From net investment income | | | $(0.18 | ) | | | $(0.18 | ) | | | $— | | | | $— | | | | $(0.07 | ) |
Net asset value, end of period (x) | | | $10.81 | | | | $10.15 | | | | $10.81 | | | | $9.98 | | | | $9.73 | |
Total return (%) (k)(r)(s)(x) | | | 8.26 | | | | (4.47 | ) | | | 8.32 | | | | 2.57 | (c) | | | (5.04 | ) |
| | | | | |
Ratios (%) (to average net assets)
and Supplemental data: | | | | | | | | | | | | | | | | | | | | |
Expenses before expense reductions (f) | | | 0.57 | | | | 0.57 | | | | 0.56 | | | | 0.55 | (c) | | | 0.56 | |
Expenses after expense reductions (f) | | | 0.56 | | | | 0.56 | | | | 0.55 | | | | 0.54 | (c) | | | 0.55 | |
Net investment income (loss) | | | 1.11 | | | | 1.78 | | | | 1.28 | | | | 0.65 | (c) | | | (0.11 | ) |
Portfolio turnover | | | 62 | | | | 63 | | | | 40 | | | | 47 | | | | 44 | |
Net assets at end of period (000 omitted) | | | $131,221 | | | | $134,599 | | | | $162,429 | | | | $168,857 | | | | $184,691 | |
| |
| Service Class | | Year ended | |
| | | | | |
| | | 12/31/19 | | | 12/31/18 | | | 12/31/17 | | | 12/31/16 | | | 12/31/15 | |
| | | | | |
Net asset value, beginning of period | | | $10.03 | | | | $10.68 | | | | $9.89 | | | | $9.66 | | | | $10.24 | |
| | | | | |
| Income (loss) from investment operations | | | | | | | | | | | | | | | | | | | | |
Net investment income (loss) (d) | | | $0.09 | | | | $0.16 | | | | $0.11 | | | | $0.04 | (c) | | | $(0.04 | ) |
Net realized and unrealized gain (loss) | | | 0.72 | | | | (0.66 | ) | | | 0.68 | | | | 0.19 | | | | (0.50 | ) |
Total from investment operations | | | $0.81 | | | | $(0.50 | ) | | | $0.79 | | | | $0.23 | | | | $(0.54 | ) |
| | | | | |
| Less distributions declared to shareholders | | | | | | | | | | | | | | | | | | | | |
From net investment income | | | $(0.15 | ) | | | $(0.15 | ) | | | $— | | | | $— | | | | $(0.04 | ) |
Net asset value, end of period (x) | | | $10.69 | | | | $10.03 | | | | $10.68 | | | | $9.89 | | | | $9.66 | |
Total return (%) (k)(r)(s)(x) | | | 8.05 | | | | (4.70 | ) | | | 7.99 | | | | 2.38 | (c) | | | (5.27 | ) |
| | | | | |
Ratios (%) (to average net assets)
and Supplemental data: | | | | | | | | | | | | | | | | | | | | |
Expenses before expense reductions (f) | | | 0.82 | | | | 0.82 | | | | 0.81 | | | | 0.80 | (c) | | | 0.81 | |
Expenses after expense reductions (f) | | | 0.81 | | | | 0.81 | | | | 0.80 | | | | 0.79 | (c) | | | 0.80 | |
Net investment income (loss) | | | 0.86 | | | | 1.54 | | | | 1.03 | | | | 0.40 | (c) | | | (0.37 | ) |
Portfolio turnover | | | 62 | | | | 63 | | | | 40 | | | | 47 | | | | 44 | |
Net assets at end of period (000 omitted) | | | $125,926 | | | | $131,678 | | | | $165,418 | | | | $169,077 | | | | $176,909 | |
See Notes to Financial Statements
14
MFS Inflation-Adjusted Bond Portfolio
Financial Highlights – continued
| (c) | Amount reflects aone-time reimbursement of expenses by the custodian (or former custodian) without which net investment income and performance would be lower and expenses would be higher. |
| (d) | Per share data is based on average shares outstanding. |
| (f) | Ratios do not reflect reductions from fees paid indirectly, if applicable. |
| (k) | The total return does not reflect expenses that apply to separate accounts. Inclusion of these charges would reduce the total return figures for all periods shown. |
| (r) | Certain expenses have been reduced without which performance would have been lower. |
| (s) | From time to time the fund may receive proceeds from litigation settlements, without which performance would be lower. |
| (x) | The net asset values and total returns have been calculated on net assets which include adjustments made in accordance with U.S. generally accepted accounting principles required at period end for financial reporting purposes. |
See Notes to Financial Statements
15
MFS Inflation-Adjusted Bond Portfolio
NOTES TO FINANCIAL STATEMENTS
| (1) | | Business and Organization |
MFS Inflation-Adjusted Bond Portfolio (the fund) is anon-diversified series of MFS Variable Insurance Trust III (the trust). The trust is organized as a Delaware statutory trust and is registered under the Investment Company Act of 1940, as amended, as anopen-end management investment company. The shareholders of each series of the trust are separate accounts of insurance companies, which offer variable annuity and/or life insurance products, and qualified retirement and pension plans.
The fund is an investment company and accordingly follows the investment company accounting and reporting guidance of the Financial Accounting Standards Board (FASB) Accounting Standards Codification Topic 946 Financial Services – Investment Companies.
| (2) | | Significant Accounting Policies |
General– The preparation of financial statements in conformity with U.S. generally accepted accounting principles requires management to make estimates and assumptions that affect the reported amounts of assets and liabilities, and disclosure of contingent assets and liabilities at the date of the financial statements and the reported amounts of increases and decreases in net assets from operations during the reporting period. Actual results could differ from those estimates. In the preparation of these financial statements, management has evaluated subsequent events occurring after the date of the fund’s Statement of Assets and Liabilities through the date that the financial statements were issued. The fund invests in foreign securities. Investments in foreign securities are vulnerable to the effects of changes in the relative values of the local currency and the U.S. dollar and to the effects of changes in each country’s market, economic, industrial, political, regulatory, geopolitical, and other conditions.
Balance Sheet Offsetting– The fund’s accounting policy with respect to balance sheet offsetting is that, absent an event of default by the counterparty or a termination of the agreement, the International Swaps and Derivatives Association (ISDA) Master Agreement, or similar agreement, does not result in an offset of reported amounts of financial assets and financial liabilities in the Statement of Assets and Liabilities across transactions between the fund and the applicable counterparty. The fund’s right to setoff may be restricted or prohibited by the bankruptcy or insolvency laws of the particular jurisdiction to which a specific master netting agreement counterparty is subject. Balance sheet offsetting disclosures, to the extent applicable to the fund, have been included in the fund’s Significant Accounting Policies note under the captions for each of the fund’sin-scope financial instruments and transactions.
Investment Valuations– Debt instruments and floating rate loans, including restricted debt instruments, are generally valued at an evaluated or composite bid as provided by a third-party pricing service. Short-term instruments with a maturity at issuance of 60 days or less may be valued at amortized cost, which approximates market value. Forward foreign currency exchange contracts are generally valued at the mean of bid and asked prices for the time period interpolated from rates provided by a third-party pricing service for proximate time periods.Open-end investment companies are generally valued at net asset value per share. Securities and other assets generally valued on the basis of information from a third-party pricing service may also be valued at a broker/dealer bid quotation. In determining values, third-party pricing services can utilize both transaction data and market information such as yield, quality, coupon rate, maturity, type of issue, trading characteristics, and other market data. The values of foreign securities and other assets and liabilities expressed in foreign currencies are converted to U.S. dollars using the mean of bid and asked prices for rates provided by a third-party pricing service.
The Board of Trustees has delegated primary responsibility for determining or causing to be determined the value of the fund’s investments (including any fair valuation) to the adviser pursuant to valuation policies and procedures approved by the Board. If the adviser determines that reliable market quotations are not readily available, investments are valued at fair value as determined in good faith by the adviser in accordance with such procedures under the oversight of the Board of Trustees. Under the fund’s valuation policies and procedures, market quotations are not considered to be readily available for most types of debt instruments and floating rate loans and many types of derivatives. These investments are generally valued at fair value based on information from third-party pricing services. In addition, investments may be valued at fair value if the adviser determines that an investment’s value has been materially affected by events occurring after the close of the exchange or market on which the investment is principally traded (such as foreign exchange or market) and prior to the determination of the fund’s net asset value, or after the halt of trading of a specific security where trading does not resume prior to the close of the exchange or market on which the security is principally traded. The adviser generally relies on third-party pricing services or other information (such as the correlation with price movements of similar securities in the same or other markets; the type, cost and investment characteristics of the security; the business and financial condition of the issuer; and trading and other market data) to assist in determining whether to fair value and at what value to fair value an investment. The value of an investment for purposes of calculating the fund’s net asset value can differ depending on
the source and method used to determine value. When fair valuation is used, the value of an investment used to determine the fund’s net asset value may differ from quoted or published prices for the same investment. There can be no assurance that the fund could obtain the fair value assigned to an investment if it were to sell the investment at the same time at which the fund determines its net asset value per share.
16
MFS Inflation-Adjusted Bond Portfolio
Notes to Financial Statements – continued
Various inputs are used in determining the value of the fund’s assets or liabilities. These inputs are categorized into three broad levels. In certain cases, the inputs used to measure fair value may fall into different levels of the fair value hierarchy. In such cases, an investment’s level within the fair value hierarchy is based on the lowest level of input that is significant to the fair value measurement. The fund’s assessment of the significance of a particular input to the fair value measurement in its entirety requires judgment, and considers factors specific to the investment. Level 1 includes unadjusted quoted prices in active markets for identical assets or liabilities. Level 2 includes other significant observable market-based inputs (including quoted prices for similar securities, interest rates, prepayment speed, and credit risk). Level 3 includes unobservable inputs, which may include the adviser’s own assumptions in determining the fair value of investments. Other financial instruments are derivative instruments, such as forward foreign currency exchange contracts. The following is a summary of the levels used as of December 31, 2019 in valuing the fund’s assets or liabilities:
| | | | | | | | | | | | | | | | |
| Financial Instruments | | Level 1 | | | Level 2 | | | Level 3 | | | Total | |
| U.S. Treasury Bonds & U.S. Government Agencies & Equivalents | | | $— | | | | $111,454,530 | | | | $— | | | | $111,454,530 | |
| Non-U.S. Sovereign Debt | | | — | | | | 121,595,899 | | | | — | | | | 121,595,899 | |
| U.S. Corporate Bonds | | | — | | | | 1,262,498 | | | | — | | | | 1,262,498 | |
| Residential Mortgage-Backed Securities | | | — | | | | 2,883,329 | | | | — | | | | 2,883,329 | |
| Commercial Mortgage-Backed Securities | | | — | | | | 1,143,561 | | | | — | | | | 1,143,561 | |
| Asset-Backed Securities (including CDOs) | | | — | | | | 4,952,968 | | | | — | | | | 4,952,968 | |
| Foreign Bonds | | | — | | | | 445,803 | | | | — | | | | 445,803 | |
| Mutual Funds | | | 6,004,405 | | | | — | | | | — | | | | 6,004,405 | |
| Total | | | $6,004,405 | | | | $243,738,588 | | | | $— | | | | $249,742,993 | |
| | | | |
| Other Financial Instruments | | | | | | | | | | | | |
| Forward Foreign Currency Exchange Contracts – Assets | | | $— | | | | $413,130 | | | | $— | | | | $413,130 | |
| Forward Foreign Currency Exchange Contracts – Liabilities | | | — | | | | (407,305 | ) | | | — | | | | (407,305 | ) |
For further information regarding security characteristics, see the Portfolio of Investments.
Inflation-Adjusted Debt Securities– The fund invests in inflation-adjusted debt securities issued by the U.S. Treasury. The fund also invests in inflation-adjusted debt securities issued by U.S. Government agencies and instrumentalities other than the U.S. Treasury and by other entities such as U.S. and foreign corporations and foreign governments. The principal value of these debt securities is adjusted through income according to changes in the Consumer Price Index or another general price or wage index. These debt securities typically pay a fixed rate of interest, but this fixed rate is applied to the inflation-adjusted principal amount. The principal paid at maturity of the debt security is typically equal to the inflation-adjusted principal amount, or the security’s original par value, whichever is greater. Other types of inflation-adjusted securities may use other methods to adjust for other measures of inflation.
Foreign Currency Translation– Purchases and sales of foreign investments, income, and expenses are converted into U.S. dollars based upon currency exchange rates prevailing on the respective dates of such transactions or on the reporting date for foreign denominated receivables and payables. Gains and losses attributable to foreign currency exchange rates on sales of securities are recorded for financial statement purposes as net realized gains and losses on investments. Gains and losses attributable to foreign exchange rate movements on receivables, payables, income and expenses are recorded for financial statement purposes as foreign currency transaction gains and losses. That portion of both realized and unrealized gains and losses on investments that results from fluctuations in foreign currency exchange rates is not separately disclosed.
Derivatives– The fund uses derivatives primarily to increase or decrease exposure to a particular market or segment of the market, or security, to increase or decrease interest rate or currency exposure, or as alternatives to direct investments. Derivatives are used for hedging ornon-hedging purposes. While hedging can reduce or eliminate losses, it can also reduce or eliminate gains. When the fund uses derivatives as an investment to increase market exposure, or for hedging purposes, gains and losses from derivative instruments may be substantially greater than the derivative’s original cost.
The derivative instruments used by the fund during the period were forward foreign currency exchange contracts. Depending on the type of derivative, the fund may exit a derivative position by entering into an offsetting transaction with a counterparty or exchange, negotiating an agreement with the derivative counterparty, or novating the position to a third party. The fund’s period end derivatives, as presented in the Portfolio of Investments and the associated Derivative Contract tables, generally are indicative of the volume of its derivative activity during the period.
17
MFS Inflation-Adjusted Bond Portfolio
Notes to Financial Statements – continued
The following table presents, by major type of derivative contract, the fair value, on a gross basis, of the asset and liability components of derivatives held by the fund at December 31, 2019 as reported in the Statement of Assets and Liabilities:
| | | | | | | | | | |
| | | | | Fair Value | |
| Risk | | Derivative Contracts | | Asset Derivatives | | | Liability Derivatives | |
| Foreign Exchange | | Forward Foreign Currency Exchange Contracts | | | $413,130 | | | | $(407,305 | ) |
The following table presents, by major type of derivative contract, the realized gain (loss) on derivatives held by the fund for the year ended December 31, 2019 as reported in the Statement of Operations:
| | | | |
| Risk | | Forward Foreign
Currency
Exchange
Contracts | |
| Foreign Exchange | | | $(1,486,726 | ) |
The following table presents, by major type of derivative contract, the change in unrealized appreciation or depreciation on derivatives held by the fund for the year ended December 31, 2019 as reported in the Statement of Operations:
| | | | |
| Risk | | Forward Foreign
Currency
Exchange
Contracts | |
| Foreign Exchange | | | $705,044 | |
Derivative counterparty credit risk is managed through formal evaluation of the creditworthiness of all potential counterparties. On certain, but not all, uncleared derivatives, the fund attempts to reduce its exposure to counterparty credit risk whenever possible by entering into an ISDA Master Agreement on a bilateral basis. The ISDA Master Agreement gives each party to the agreement the right to terminate all transactions traded under such agreement if there is a specified deterioration in the credit quality of the other party. Upon an event of default or a termination of the ISDA Master Agreement, thenon-defaulting party has the right to close out all transactions traded under such agreement and to net amounts owed under each agreement to one net amount payable by one party to the other. This right to close out and net payments across all transactions traded under the ISDA Master Agreement could result in a reduction of the fund’s credit risk to such counterparty equal to any amounts payable by the fund under the applicable transactions, if any.
Collateral and margin requirements differ by type of derivative. For cleared derivatives (e.g., futures contracts, cleared swaps, and exchange-traded options), margin requirements are set by the clearing broker and the clearing house and collateral, in the form of cash or securities, is posted by the fund directly with the clearing broker. Collateral terms are counterparty agreement specific for uncleared derivatives (e.g., forward foreign currency exchange contracts, uncleared swap agreements, and uncleared options) and collateral, in the form of cash and securities, is held in segregated accounts with the fund’s custodian in connection with these agreements. For derivatives traded under an ISDA Master Agreement, which contains a collateral support annex, the collateral requirements are netted across all transactions traded under such counterparty-specific agreement and an amount is posted from one party to the other to collateralize such obligations. Cash that has been segregated or delivered to cover the fund’s collateral or margin obligations under derivative contracts, if any, will be reported separately in the Statement of Assets and Liabilities as restricted cash for uncleared derivatives and/or deposits with brokers for cleared derivatives. Securities pledged as collateral or margin for the same purpose, if any, are noted in the Portfolio of Investments. The fund may be required to make payments of interest on uncovered collateral or margin obligations with the broker. Any such payments are included in “Miscellaneous” expense in the Statement of Operations.
Forward Foreign Currency Exchange Contracts– The fund entered into forward foreign currency exchange contracts for the purchase or sale of a specific foreign currency at a fixed price on a future date. These contracts may be used to hedge the fund’s currency risk or fornon-hedging purposes. For hedging purposes, the fund may enter into contracts to deliver or receive foreign currency that the fund will receive from or use in its normal investment activities. The fund may also use contracts to hedge against declines in the value of foreign currency denominated securities due to unfavorable exchange rate movements. Fornon-hedging purposes, the fund may enter into contracts with the intent of changing the relative exposure of the fund’s portfolio of securities to different currencies to take advantage of anticipated exchange rate changes.
Forward foreign currency exchange contracts are adjusted by the daily exchange rate of the underlying currency and any unrealized gains or losses are recorded as a receivable or payable for forward foreign currency exchange contracts until the contract settlement date. On contract settlement date, any gain or loss on the contract is recorded as realized gains or losses on forward foreign currency exchange contracts.
18
MFS Inflation-Adjusted Bond Portfolio
Notes to Financial Statements – continued
Risks may arise upon entering into these contracts from unanticipated movements in the value of the contract and from the potential inability of counterparties to meet the terms of their contracts. Generally, the fund’s maximum risk due to counterparty credit risk is the unrealized gain on the contract due to the use of Continuous Linked Settlement, a multicurrency cash settlement system for the centralized settlement of foreign transactions. This risk is mitigated in cases where there is an ISDA Master Agreement between the fund and the counterparty providing for netting as described above and, where applicable, by the posting of collateral by the counterparty to the fund to cover the fund’s exposure to the counterparty under such ISDA Master Agreement.
Indemnifications– Under the fund’s organizational documents, its officers and Trustees may be indemnified against certain liabilities and expenses arising out of the performance of their duties to the fund. Additionally, in the normal course of business, the fund enters into agreements with service providers that may contain indemnification clauses. The fund’s maximum exposure under these agreements is unknown as this would involve future claims that may be made against the fund that have not yet occurred.
Investment Transactions and Income– Investment transactions are recorded on the trade date. Interest income is recorded on the accrual basis. All premium and discount is amortized or accreted for financial statement purposes in accordance with U.S. generally accepted accounting principles. Inflation-indexed bonds are fixed-income securities whose principal value is periodically adjusted upward or downward based on the rate of inflation. Interest is accrued based on the principal value, which is adjusted for inflation. Any increase or decrease in the principal amount of an inflation-indexed bond is generally recorded as an increase or decrease in interest income, respectively, even though the adjusted principal is not received until maturity. Interest payments received in additional securities are recorded on theex-interest date in an amount equal to the value of the security on such date.
The fund may receive proceeds from litigation settlements. Any proceeds received from litigation involving portfolio holdings are reflected in the Statement of Operations in realized gain/loss if the security has been disposed of by the fund or in unrealized gain/loss if the security is still held by the fund. Any other proceeds from litigation not related to portfolio holdings are reflected as other income in the Statement of Operations.
Tax Matters and Distributions– The fund intends to qualify as a regulated investment company, as defined under Subchapter M of the Internal Revenue Code, and to distribute all of its taxable income, including realized capital gains. As a result, no provision for federal income tax is required. The fund’s federal tax returns, when filed, will remain subject to examination by the Internal Revenue Service for a three year period. Management has analyzed the fund’s tax positions taken on federal and state tax returns for all open tax years and does not believe that there are any uncertain tax positions that require recognition of a tax liability. Foreign taxes, if any, have been accrued by the fund in the accompanying financial statements in accordance with the applicable foreign tax law. Foreign income taxes may be withheld by certain countries in which the fund invests. Additionally, capital gains realized by the fund on securities issued in or by certain foreign countries may be subject to capital gains tax imposed by those countries.
Distributions to shareholders are recorded on theex-dividend date. Income and capital gain distributions are determined in accordance with income tax regulations, which may differ from U.S. generally accepted accounting principles. Certain capital accounts in the financial statements are periodically adjusted for permanent differences in order to reflect their tax character. These adjustments have no impact on net assets or net asset value per share. Temporary differences which arise from recognizing certain items of income, expense, gain or loss in different periods for financial statement and tax purposes will reverse at some time in the future.
Book/tax differences primarily relate to wash sale loss deferrals.
The tax character of distributions declared to shareholders for the last two fiscal years is as follows:
| | | | | | | | |
| | | Year ended
12/31/19 | | | Year ended
12/31/18 | |
| Ordinary income (including any short-term capital gains) | | | $4,025,008 | | | | $4,685,058 | |
The federal tax cost and the tax basis components of distributable earnings were as follows:
| | | | |
| As of 12/31/19 | | | | |
| |
| Cost of investments | | | $230,449,919 | |
| Gross appreciation | | | 19,516,054 | |
| Gross depreciation | | | (217,155 | ) |
| Net unrealized appreciation (depreciation) | | | $19,298,899 | |
| |
| Undistributed ordinary income | | | 1,152,545 | |
| Undistributed long-term capital gain | | | 2,905,932 | |
| Other temporary differences | | | 4,939 | |
Multiple Classes of Shares of Beneficial Interest– The fund offers multiple classes of shares, which differ in their respective distribution and/or service fees. The fund’s income, realized and unrealized gain (loss), and common expenses are allocated to shareholders based on the daily net assets of each class. Dividends are declared separately for each class. Differences in per share
19
MFS Inflation-Adjusted Bond Portfolio
Notes to Financial Statements – continued
dividend rates are generally due to differences in separate class expenses. The fund’s distributions declared to shareholders as reported in the Statements of Changes in Net Assets are presented by class as follows:
| | | | | | | | |
| | |
| | | Year ended
12/31/19 | | | Year ended
12/31/18 | |
| Initial Class | | | $2,224,301 | | | | $2,528,387 | |
| Service Class | | | 1,800,707 | | | | 2,156,671 | |
| Total | | | $4,025,008 | | | | $4,685,058 | |
| (3) | | Transactions with Affiliates |
Investment Adviser– The fund has an investment advisory agreement with MFS to provide overall investment management and related administrative services and facilities to the fund. The management fee is computed daily and paid monthly at an annual rate of 0.50% of the fund’s average daily net assets.
MFS has agreed in writing to reduce its management fee by a specified amount if certain MFS mutual fund assets exceed thresholds agreed to by MFS and the fund’s Board of Trustees. For the year ended December 31, 2019, this management fee reduction amounted to $25,670, which is included in the reduction of total expenses in the Statement of Operations. The management fee incurred for the year ended December 31, 2019 was equivalent to an annual effective rate of 0.49% of the fund’s average daily net assets.
Distributor– MFS Fund Distributors, Inc. (MFD), a wholly-owned subsidiary of MFS, is the distributor of shares of the fund. The Trustees have adopted a distribution plan for the Service Class shares pursuant to Rule12b-1 under the Investment Company Act of 1940.
The fund’s distribution plan provides that the fund will pay MFD distribution and/or service fees equal to 0.25% per annum of its average daily net assets attributable to Service Class shares as partial consideration for services performed and expenses incurred by MFD and financial intermediaries (including participating insurance companies that invest in the fund to fund variable annuity and variable life insurance contracts, sponsors of qualified retirement and pension plans that invest in the fund, and affiliates of these participating insurance companies and plan sponsors) in connection with the sale and distribution of the Service Class shares. MFD may subsequently pay all, or a portion, of the distribution and/or service fees to financial intermediaries.
Shareholder Servicing Agent– MFS Service Center, Inc. (MFSC), a wholly-owned subsidiary of MFS, receives a fee from the fund for its services as shareholder servicing agent. For the year ended December 31, 2019, the fee was $2,730, which equated to 0.0010% annually of the fund’s average daily net assets. MFSC also receives payment from the fund forout-of-pocket expenses paid by MFSC on behalf of the fund. For the year ended December 31, 2019, these costs amounted to $155.
Administrator– MFS provides certain financial, legal, shareholder communications, compliance, and other administrative services to the fund. Under an administrative services agreement, the fund reimburses MFS the costs incurred to provide these services. The fund is charged an annual fixed amount of $17,500 plus a fee based on average daily net assets. The administrative services fee incurred for the year ended December 31, 2019 was equivalent to an annual effective rate of 0.0175% of the fund’s average daily net assets.
Trustees’ and Officers’ Compensation– The fund pays compensation to independent Trustees in the form of a retainer, attendance fees, and additional compensation to Board and Committee chairpersons. The fund does not pay compensation directly to Trustees or officers of the fund who are also officers of the investment adviser, all of whom receive remuneration from MFS for their services to the fund. Certain officers and Trustees of the fund are officers or directors of MFS, MFD, and MFSC.
Other– This fund and certain other funds managed by MFS (the funds) had entered into a service agreement (the ISO Agreement) which provided for payment of fees solely by the funds to Tarantino LLC in return for the provision of services of an Independent Senior Officer (ISO) for the funds. Frank L. Tarantino served as the ISO and was an officer of the funds and the sole member of Tarantino LLC. Effective June 30, 2019, Mr. Tarantino retired from his position as ISO for the funds, and the ISO Agreement was terminated. For the year ended December 31, 2019, the fee paid by the fund under this agreement was $316 and is included in “Miscellaneous” expense in the Statement of Operations. MFS had agreed to bear all expenses associated with office space, other administrative support, and supplies provided to the ISO.
The fund invests in the MFS Institutional Money Market Portfolio which is managed by MFS and seeks current income consistent with preservation of capital and liquidity. This money market fund does not pay a management fee to MFS.
For the year ended December 31, 2019, purchases and sales of investments, other than short-term obligations, were as follows:
| | | | | | | | |
| | | Purchases | | | Sales | |
| U.S. Government securities | | | $53,076,690 | | | | $62,075,814 | |
| Non-U.S. Government securities | | | $103,242,716 | | | | $134,626,787 | |
20
MFS Inflation-Adjusted Bond Portfolio
Notes to Financial Statements – continued
| (5) | | Shares of Beneficial Interest |
The fund’s Declaration of Trust permits the Trustees to issue an unlimited number of full and fractional shares of beneficial interest. Transactions in fund shares were as follows:
| | | | | | | | | | | | | | | | |
| | | Year ended 12/31/19 | | | Year ended 12/31/18 | |
| | | | |
| | | Shares | | | Amount | | | Shares | | | Amount | |
| Shares sold | | | | | | | | | | | | | | | | |
Initial Class | | | 93,016 | | | | $988,416 | | | | 65,473 | | | | $692,556 | |
Service Class | | | 818,315 | | | | 8,634,490 | | | | 856,820 | | | | 8,882,666 | |
| | | 911,331 | | | | $9,622,906 | | | | 922,293 | | | | $9,575,222 | |
| | | | |
| Shares issued to shareholders in reinvestment of distributions | | | | | | | | | | | | | | | | |
Initial Class | | | 201,112 | | | | $2,224,301 | | | | 244,999 | | | | $2,528,387 | |
Service Class | | | 164,598 | | | | 1,800,707 | | | | 211,231 | | | | 2,156,671 | |
| | | 365,710 | | | | $4,025,008 | | | | 456,230 | | | | $4,685,058 | |
| | | | |
| Shares reacquired | | | | | | | | | | | | | | | | |
Initial Class | | | (1,416,512 | ) | | | $(15,199,661 | ) | | | (2,077,892 | ) | | | $(21,819,363 | ) |
Service Class | | | (2,325,801 | ) | | | (24,476,927 | ) | | | (3,429,568 | ) | | | (35,353,500 | ) |
| | | (3,742,313 | ) | | | $(39,676,588 | ) | | | (5,507,460 | ) | | | $(57,172,863 | ) |
| | | | |
| Net change | | | | | | | | | | | | | | | | |
Initial Class | | | (1,122,384 | ) | | | $(11,986,944 | ) | | | (1,767,420 | ) | | | $(18,598,420 | ) |
Service Class | | | (1,342,888 | ) | | | (14,041,730 | ) | | | (2,361,517 | ) | | | (24,314,163 | ) |
| | | (2,465,272 | ) | | | $(26,028,674 | ) | | | (4,128,937 | ) | | | $(42,912,583 | ) |
The fund is one of several mutual funds in which certain MFS funds may invest. The MFS funds do not invest in the underlying funds for the purpose of exercising management or control. At the end of the period, the MFS Moderate Allocation Portfolio, the MFS Conservative Allocation Portfolio, and the MFS Growth Allocation Portfolio were the owners of record of approximately 27%, 17%, and 7%, respectively, of the value of outstanding voting shares of the fund.
The fund and certain other funds managed by MFS participate in a $1.25 billion unsecured committed line of credit, subject to a $1 billion sublimit, provided by a syndicate of banks under a credit agreement. Borrowings may be made for temporary financing needs. Interest is charged to each fund, based on its borrowings, generally at a rate equal to the highest of one month LIBOR, the Federal Funds Effective Rate and the Overnight Bank Funding Rate, plus an agreed upon spread. A commitment fee, based on the average daily, unused portion of the committed line of credit, is allocated among the participating funds. In addition, the fund and other funds managed by MFS have established unsecured uncommitted borrowing arrangements with certain banks for temporary financing needs. Interest is charged to each fund, based on its borrowings, at rates equal to customary reference rates plus an agreed upon spread. For the year ended December 31, 2019, the fund’s commitment fee and interest expense were $1,449 and $0, respectively, and are included in “Miscellaneous” expense in the Statement of Operations.
| (7) | | Investments in Affiliated Issuers |
An affiliated issuer may be considered one in which the fund owns 5% or more of the outstanding voting securities, or a company which is under common control. For the purposes of this report, the following were affiliated issuers:
| | | | | | | | | | | | | | | | | | | | | | | | |
| Affiliated Issuers | | Beginning
Value | | | Purchases | | | Sales
Proceeds | | | Realized
Gain
(Loss) | | | Change in
Unrealized
Appreciation or
Depreciation | | | Ending
Value | |
| MFS Institutional Money Market Portfolio | | | $950,035 | | | | $128,062,577 | | | | $123,007,327 | | | | $(1,168 | ) | | | $288 | | | | $6,004,405 | |
| | | | | | |
| Affiliated Issuers | | | | | | | | | | | | | | Dividend
Income | | | Capital Gain
Distributions | |
| MFS Institutional Money Market Portfolio | | | | | | | | | | | | | | | | | | | $264,158 | | | | $— | |
21
MFS Inflation-Adjusted Bond Portfolio
REPORT OF INDEPENDENT REGISTERED PUBLIC ACCOUNTING FIRM
To the Board of Trustees of MFS Variable Insurance Trust III and the Shareholders of
MFS Inflation-Adjusted Bond Portfolio:
Opinion on the Financial Statements and Financial Highlights
We have audited the accompanying statement of assets and liabilities of MFS Inflation-Adjusted Bond Portfolio (the “Fund”), including the portfolio of investments, as of December 31, 2019, the related statement of operations for the year then ended, the statements of changes in net assets for each of the two years in the period then ended, the financial highlights for each of the five years in the period then ended, and the related notes. In our opinion, the financial statements and financial highlights present fairly, in all material respects, the financial position of the Fund as of December 31, 2019, and the results of its operations for the year then ended, the changes in its net assets for each of the two years in the period then ended, and the financial highlights for each of the five years in the period then ended, in conformity with accounting principles generally accepted in the United States of America.
Basis for Opinion
These financial statements and financial highlights are the responsibility of the Fund’s management. Our responsibility is to express an opinion on the Fund’s financial statements and financial highlights based on our audits. We are a public accounting firm registered with the Public Company Accounting Oversight Board (United States) (PCAOB) and are required to be independent with respect to the Fund in accordance with the U.S. federal securities laws and the applicable rules and regulations of the Securities and Exchange Commission and the PCAOB.
We conducted our audits in accordance with the standards of the PCAOB. Those standards require that we plan and perform the audit to obtain reasonable assurance about whether the financial statements and financial highlights are free of material misstatement, whether due to error or fraud. The Fund is not required to have, nor were we engaged to perform, an audit of its internal control over financial reporting. As part of our audits we are required to obtain an understanding of internal control over financial reporting but not for the purpose of expressing an opinion on the effectiveness of the Fund’s internal control over financial reporting. Accordingly, we express no such opinion.
Our audits included performing procedures to assess the risks of material misstatement of the financial statements and financial highlights, whether due to error or fraud, and performing procedures that respond to those risks. Such procedures included examining, on a test basis, evidence regarding the amounts and disclosures in the financial statements and financial highlights. Our audits also included evaluating the accounting principles used and significant estimates made by management, as well as evaluating the overall presentation of the financial statements and financial highlights. Our procedures included confirmation of securities owned as of December 31, 2019, by correspondence with the custodian and brokers. We believe that our audits provide a reasonable basis for our opinion.
DELOITTE & TOUCHE LLP
Boston, Massachusetts
February 14, 2020
We have served as the auditor of one or more of the MFS investment companies since 1924.
22
MFS Inflation-Adjusted Bond Portfolio
TRUSTEES AND OFFICERS – IDENTIFICATION AND BACKGROUND
The Trustees and Officers of the Trust, as of February 1, 2020, are listed below, together with their principal occupations during the past five years. (Their titles may have varied during that period.) The address of each Trustee and Officer is 111 Huntington Avenue, Boston, Massachusetts 02199-7618.
| | | | | | | | | | |
Name, Age | | Position(s)
Held with Fund | | Trustee/Officer
Since (h) | | Number of MFS Funds
overseen by the
Trustee | | Principal Occupations
During the Past Five Years | | Other Directorships During the Past Five Years (j) |
| INTERESTED TRUSTEES |
Robert J. Manning (k)
(age 56) | | Trustee | | February 2004 | | 133 | | Massachusetts Financial Services Company, Executive Chairman (since January 2017); Director; Chairman of the Board; Chief Executive Officer (until 2015);Co-Chief Executive Officer(2015-2016) | | N/A |
| | | | | |
Robin A. Stelmach (k) (age 58) | | Trustee | | January 2014 | | 133 | | Massachusetts Financial Services Company, Vice Chair (since January 2017); Chief Operating Officer and Executive Vice President (until January 2017) | | N/A |
|
| INDEPENDENT TRUSTEES |
John P. Kavanaugh (age 65) | | Trustee and Chair of Trustees | | January 2009 | | 133 | | Private investor | | N/A |
| | | | | |
Steven E. Buller (age 68) | | Trustee | | February 2014 | | 133 | | Financial Accounting Standards Advisory Council, Chairman(2014-2015); Public Company Accounting Oversight Board, Standing Advisory Group, Member (until 2014); BlackRock, Inc. (investment management), Managing Director (until 2014), BlackRock Finco UK (investment management), Director (until 2014) | | N/A |
| | | | | |
John A. Caroselli (age 65) | | Trustee | | March 2017 | | 133 | | JC Global Advisors, LLC (management consulting), President (since 2015); First Capital Corporation (commercial finance), Executive Vice President (until 2015) | | N/A |
| | | | | |
Maureen R. Goldfarb (age 64) | | Trustee | | January 2009 | | 133 | | Private investor | | N/A |
| | | | | |
Peter D. Jones
(age 64) | | Trustee | | January 2019 | | 133 | | Franklin Templeton Distributors, Inc. (investment management), President (until 2015); Franklin Templeton Institutional, LLC (investment management), Chairman (until 2015) | | N/A |
| | | | | |
James W. Kilman, Jr.
(age 58) | | Trustee | | January 2019 | | 133 | | Burford Capital Limited (finance and investment management), Chief Financial Officer (since 2019); KielStrand Capital LLC (family office), Chief Executive Officer (since 2016); Morgan Stanley & Co. (financial services), Vice Chairman of Investment Banking,Co-Head of Diversified Financials Coverage – Financial Institutions Investment Banking Group (until 2016) | | Alpha-En Corporation, Director (2016-2019) |
23
MFS Inflation-Adjusted Bond Portfolio
Trustees and Officers – continued
| | | | | | | | | | |
Name, Age | | Position(s)
Held with Fund | | Trustee/Officer
Since (h) | | Number of MFS Funds
overseen by the
Trustee | | Principal Occupations
During the Past Five Years | | Other Directorships During the Past Five Years (j) |
Clarence Otis, Jr. (age 63) | | Trustee | | March 2017 | | 133 | | Darden Restaurants, Inc., Chief Executive Officer (until 2014) | | VF Corporation, Director; Verizon Communications, Inc., Director; The Travelers Companies, Director; Federal Reserve Bank of Atlanta, Director (until 2015) |
| | | | | |
Maryanne L. Roepke (age 63) | | Trustee | | May 2014 | | 133 | | American Century Investments (investment management), Senior Vice President and Chief Compliance Officer (until 2014) | | N/A |
| | | | | |
Laurie J. Thomsen
(age 62) | | Trustee | | March 2005 | | 133 | | Private investor | | The Travelers Companies, Director; Dycom Industries, Inc., Director (since 2015) |
| | | | | | | | |
Name, Age | | Position(s)
Held with Fund | | Trustee/Officer
Since (h) | | Number of
MFS Funds
for which the
Person is an
Officer | | Principal Occupations During the Past Five Years |
| OFFICERS | | | | | | |
Christopher R. Bohane (k)
(age 46) | | Assistant Secretary and Assistant Clerk | | July 2005 | | 133 | | Massachusetts Financial Services Company, Vice President and Assistant General Counsel |
| | | | |
Kino Clark (k) (age 51) | | Assistant Treasurer | | January 2012 | | 133 | | Massachusetts Financial Services Company, Vice President |
| | | | |
John W. Clark, Jr. (k) (age 52) | | Assistant Treasurer | | April 2017 | | 133 | | Massachusetts Financial Services Company, Vice President (since March 2017); Deutsche Bank (financial services), Department Head –Treasurer’s Office (until February 2017) |
| | | | |
Thomas H. Connors (k) (age 60) | | Assistant Secretary and Assistant Clerk | | September 2012 | | 133 | | Massachusetts Financial Services Company, Vice President and Senior Counsel |
| | | | |
David L. DiLorenzo (k)
(age 51) | | President | | July 2005 | | 133 | | Massachusetts Financial Services Company, Senior Vice President |
| | | | |
Heidi W. Hardin (k) (age 52) | | Secretary and Clerk | | April 2017 | | 133 | | Massachusetts Financial Services Company, Executive Vice President and General Counsel (since March 2017); Harris Associates (investment management), General Counsel (from September 2015 to January 2017); Janus Capital Management LLC (investment management), Senior Vice President and General Counsel (until September 2015) |
| | | | |
Brian E. Langenfeld (k) (age 46) | | Assistant
Secretary and Assistant Clerk | | June 2006 | | 133 | | Massachusetts Financial Services Company, Vice President and Senior Counsel |
| | | | |
Amanda S. Mooradian (k) (age 40) | | Assistant
Secretary and Assistant Clerk | | September 2018 | | 133 | | Massachusetts Financial Services Company, Assistant Vice President and Counsel |
| | | | |
Susan A. Pereira (k)
(age 49) | | Assistant
Secretary and Assistant Clerk | | July 2005 | | 133 | | Massachusetts Financial Services Company, Vice President and Assistant General Counsel |
| | | | |
Kasey L. Phillips (k) (age 49) | | Assistant Treasurer | | September 2012 | | 133 | | Massachusetts Financial Services Company, Vice President |
| | | | |
Matthew A. Stowe (k) (age 45) | | Assistant Secretary and Assistant Clerk | | October 2014 | | 133 | | Massachusetts Financial Services Company, Vice President and Assistant General Counsel |
24
MFS Inflation-Adjusted Bond Portfolio
Trustees and Officers – continued
| | | | | | | | |
Name, Age | | Position(s)
Held with Fund | | Trustee/Officer
Since (h) | | Number of
MFS Funds
for which the
Person is an
Officer | | Principal Occupations During the Past Five Years |
Martin J. Wolin (k) (age 52) | | Chief Compliance Officer | | July 2015 | | 133 | | Massachusetts Financial Services Company, Senior Vice President and Chief Compliance Officer (since July 2015); Mercer (financial service provider), Chief Risk and Compliance Officer, North America and Latin America (until June 2015) |
| | | | |
James O. Yost (k)
(age 59) | | Treasurer | | September 1990 | | 133 | | Massachusetts Financial Services Company, Senior Vice President |
| (h) | Date first appointed to serve as Trustee/officer of an MFS Fund. Each Trustee has served continuously since appointment unless indicated otherwise. For the period from December 15, 2004 until February 22, 2005, Mr. Manning served as Advisory Trustee. From January 2012 through December 2016, Messrs. DiLorenzo and Yost served as Treasurer and Deputy Treasurer of the Funds, respectively. |
| (j) | Directorships or trusteeships of companies required to report to the Securities and Exchange Commission (i.e., “public companies”). |
| (k) | “Interested person” of the Trust within the meaning of the Investment Company Act of 1940 (referred to as the 1940 Act), which is the principal federal law governing investment companies like the fund, as a result of a position with MFS. The address of MFS is 111 Huntington Avenue, Boston, Massachusetts 02199-7618. |
Each Trustee (other than Messrs. Jones and Kilman) has been elected by shareholders and each Trustee and Officer holds office until his or her successor is chosen and qualified or until his or her earlier death, resignation, retirement or removal. Messrs. Jones and Kilman became Trustees of the Funds on January 1, 2019. The Trust does not hold annual meetings for the purpose of electing Trustees, and Trustees are not elected for fixed terms. Under the terms of the Board’s retirement policy, an Independent Trustee shall retire at the end of the calendar year in which he or she reaches the earlier of 75 years of age or 15 years of service on the Board (or, in the case of any Independent Trustee who joined the Board prior to 2015, 20 years of service on the Board).
Messrs. Buller, Kilman and Otis and Ms. Roepke are members of the Trust’s Audit Committee.
Each of the Interested Trustees and certain Officers hold comparable officer positions with certain affiliates of MFS.
The Statement of Additional Information for a Fund includes further information about the Trustees and is available without charge upon request by calling1-800-225-2606.
| | |
Investment Adviser Massachusetts Financial Services Company 111 Huntington Avenue Boston, MA 02199-7618 | | Custodian State Street Bank and Trust Company 1 Lincoln Street Boston, MA 02111-2900 |
| |
Distributor MFS Fund Distributors, Inc. 111 Huntington Avenue Boston, MA 02199-7618 | | Independent Registered Public Accounting Firm Deloitte & Touche LLP 200 Berkeley Street Boston, MA 02116 |
| |
Portfolio Manager(s) Robert Spector Erik weisman | | |
25
MFS Inflation-Adjusted Bond Portfolio
BOARD REVIEW OF INVESTMENT ADVISORY AGREEMENT
MFS Inflation-Adjusted Bond Portfolio
The Investment Company Act of 1940 requires that both the full Board of Trustees and a majority of thenon-interested (“independent”) Trustees, voting separately, annually approve the continuation of the Fund’s investment advisory agreement with MFS. The Trustees consider matters bearing on the Fund and its advisory arrangements at their meetings throughout the year, including a review of performance data at each regular meeting. In addition, the independent Trustees met several times over the course of three months beginning in May and ending in July, 2019 (“contract review meetings”) for the specific purpose of considering whether to approve the continuation of the investment advisory agreement for the Fund and the other investment companies that the Board oversees (the “MFS Funds”). The independent Trustees were assisted in their evaluation of the Fund’s investment advisory agreement by independent legal counsel, from whom they received separate legal advice and with whom they met separately from MFS during various contract review meetings. The independent Trustees were also assisted in this process by the MFS Funds’ Independent Senior Officer, a senior officer appointed by and reporting to the independent Trustees.
In connection with their deliberations regarding the continuation of the investment advisory agreement, the Trustees, including the independent Trustees, considered such information and factors as they believed, in light of the legal advice furnished to them and their own business judgment, to be relevant. The investment advisory agreement for the Fund was considered separately, although the Trustees also took into account the common interests of all MFS Funds in their review. As described below, the Trustees considered the nature, quality, and extent of the various investment advisory, administrative, and shareholder services performed by MFS under the existing investment advisory agreement and other arrangements with the Fund.
In connection with their contract review meetings, the Trustees received and relied upon materials that included, among other items: (i) information provided by Broadridge Financial Solutions, Inc. (“Broadridge”), an independent third party, on the investment performance of the Fund for various time periods ended December 31, 2018 and the investment performance of a group of funds with substantially similar investment classifications/objectives (the “Broadridge performance universe”), (ii) information provided by Broadridge on the Fund’s advisory fees and other expenses and the advisory fees and other expenses of comparable funds identified by Broadridge as well as all other funds in the same investment classification/category (the “Broadridge expense group and universe”), (iii) information provided by MFS on the advisory fees of portfolios of other clients of MFS, including institutional separate accounts and other clients, (iv) information as to whether and to what extent applicable expense waivers, reimbursements or fee “breakpoints” are observed for the Fund, (v) information regarding MFS’ financial results and financial condition, including MFS’ and certain of its affiliates’ estimated profitability from services performed for the Fund and the MFS Funds as a whole, and compared to MFS’ institutional business, (vi) MFS’ views regarding the outlook for the mutual fund industry and the strategic business plans of MFS, (vii) descriptions of various functions performed by MFS for the Funds, such as compliance monitoring and portfolio trading practices, and (viii) information regarding the overall organization of MFS, including information about MFS’ senior management and other personnel providing investment advisory, administrative and other services to the Fund and the other MFS Funds. The comparative performance, fee and expense information prepared and provided by Broadridge was not independently verified and the independent Trustees did not independently verify any information provided to them by MFS.
The Trustees’ conclusion as to the continuation of the investment advisory agreement was based on a comprehensive consideration of all information provided to the Trustees and not the result of any single factor. Some of the factors that figured particularly in the Trustees’ deliberations are described below, although individual Trustees may have evaluated the information presented differently from one another, giving different weights to various factors. It is also important to recognize that the fee arrangements for the Fund and other MFS Funds are the result of years of review and discussion between the independent Trustees and MFS, that certain aspects of such arrangements may receive greater scrutiny in some years than in others, and that the Trustees’ conclusions may be based, in part, on their consideration of these same arrangements during the course of the year and in prior years.
Based on information provided by Broadridge and MFS, the Trustees reviewed the Fund’s total return investment performance as well as the Broadridge performance universe over various time periods. The Trustees placed particular emphasis on the total return performance of the Fund’s Initial Class shares in comparison to the performance of funds in its Broadridge performance universe over the five-year period ended December 31, 2018, which the Trustees believed was a long enough period to reflect differing market conditions. The total return performance of the Fund’s Initial Class shares was in the 5th quintile relative to the other funds in the universe for this five-year period (the 1st quintile being the best performers and the 5th quintile being the worst performers). The total return performance of the Fund’s Initial Class shares was in the 5th quintile for theone-year period and in the 3rd quintile for the three-year period ended December 31, 2018 relative to the Broadridge performance universe. Because of the passage of time, these performance results may differ from the performance results for more recent periods, including those shown elsewhere in this report.
In the course of their deliberations, the Trustees took into account information provided by MFS in connection with the contract review meetings, as well as during investment review meetings conducted with portfolio management personnel during the course of the year regarding the Fund’s performance. The Trustees noted that the total return performance (Class A shares) of the Fund’s retail counterpart Inflation-Adjusted Bond Fund, which has substantially similar investment strategies, was in the 3rd quintile relative
26
MFS Inflation-Adjusted Bond Portfolio
Board Review of Investment Advisory Agreement – continued
to the other Funds in its Broadridge performance universe for the five-year period ended December, 2018. After reviewing these and related factors, the Trustees concluded, within the context of their overall conclusions regarding the investment advisory agreement, that they were satisfied with MFS’ responses and efforts relating to investment performance.
In assessing the reasonableness of the Fund’s advisory fee, the Trustees considered, among other information, the Fund’s advisory fee and the total expense ratio of the Fund’s Initial Class shares as a percentage of average daily net assets and the advisory fee and total expense ratios of the Broadridge expense group based on information provided by Broadridge. The Trustees considered that, according to the data provided by Broadridge (which takes into account any fee reductions or expense limitations that were in effect during the Fund’s last fiscal year), the Fund’s effective advisory fee rate and total expense ratio were each approximately at the Broadridge expense group median.
The Trustees also considered the advisory fees charged by MFS to any institutional separate accounts advised by MFS (“separate accounts”) and unaffiliated investment companies for which MFS serves as subadviser (“subadvised funds”) that have comparable investment strategies to the Fund, if any. In comparing these fees, the Trustees considered information provided by MFS as to the generally broader scope of services provided by MFS to the Fund, as well as the more extensive regulatory burdens imposed on MFS in managing the Fund, in comparison to separate accounts and subadvised funds. The Trustees also considered the higher demands placed on MFS’ investment personnel and trading infrastructure as a result of the daily cashin-flows andout-flows of the Fund in comparison to separate accounts.
The Trustees also considered whether the Fund may benefit from any economies of scale in the management of the Fund in the event of growth in assets of the Fund and/or growth in assets of the MFS Funds as a whole. They noted that the Fund’s advisory fee rate schedule is not subject to any breakpoints. Taking into account that the Fund’s effective advisory fee rate was approximately at the Broadridge expense group median described above, the Trustees determined not to recommend any advisory fee breakpoints for the Fund at this time. The Trustees also noted that MFS has agreed in writing to waive a portion of the management fees of certain MFS Funds, including the Fund, if the total combined assets of certain funds within the MFS Funds’ complex increase above agreed upon thresholds (the “group fee waiver”), enabling the Fund’s shareholders to share in the benefits from any economies of scale at the complex level. The group fee waiver is reviewed and renewed annually between the Board and MFS. The Trustees concluded that the group fee waiver was sufficient to allow the Fund to benefit from economies of scale as its assets and overall complex assets grow.
The Trustees also considered information prepared by MFS relating to MFS’ costs and profits with respect to the Fund, the MFS Funds considered as a group, and other investment companies and accounts advised by MFS, as well as MFS’ methodologies used to determine and allocate its costs to the MFS Funds, the Fund and other accounts and products for purposes of estimating profitability.
After reviewing these and other factors described herein, the Trustees concluded, within the context of their overall conclusions regarding the investment advisory agreement, that the advisory fees charged to the Fund represent reasonable compensation in light of the services being provided by MFS to the Fund.
In addition, the Trustees considered MFS’ resources and related efforts to continue to retain, attract and motivate capable personnel to serve the Fund. The Trustees also considered current and developing conditions in the financial services industry, including the presence of large and well-capitalized companies which are spending, and appear to be prepared to continue to spend, substantial sums to engage personnel and to provide services to competing investment companies. In this regard, the Trustees also considered the financial resources of MFS and its ultimate parent, Sun Life Financial Inc. The Trustees also considered the advantages and possible disadvantages to the Fund of having an adviser that also serves other investment companies as well as other accounts.
The Trustees also considered the nature, quality, cost, and extent of administrative, transfer agency, and distribution services provided to the Fund by MFS and its affiliates under agreements and plans other than the investment advisory agreement, including any12b-1 fees the Fund pays to MFS Fund Distributors, Inc., an affiliate of MFS. The Trustees also considered the nature, extent and quality of certain other services MFS performs or arranges for on the Fund’s behalf, which may include securities lending programs, directed expense payment programs, class action recovery programs, and MFS’ interaction with third-party service providers, principally custodians andsub-custodians. The Trustees concluded that the variousnon-advisory services provided by MFS and its affiliates on behalf of the Fund were satisfactory.
The Trustees consideredso-called“fall-out benefits” to MFS such as reputational value derived from serving as investment manager to the MFS Funds. The Trustees also considered that, effective January 3, 2018, MFS had discontinued its historic practice of obtaining investment research from portfolio brokerage commissions paid by certain MFS Funds and would thereafter directly pay for or voluntarily reimburse a Fund, if applicable, for the costs of external research acquired through the use of the Fund’s portfolio brokerage commissions.
Based on their evaluation of factors that they deemed to be material, including those factors described above, the Board of Trustees, including the independent Trustees, concluded that the Fund’s investment advisory agreement with MFS should be continued for an additionalone-year period, commencing August 1, 2019.
27
MFS Inflation-Adjusted Bond Portfolio
PROXY VOTING POLICIES AND INFORMATION
MFS votes proxies on behalf of the fund pursuant to proxy voting policies and procedures that are available without charge, upon request, by calling 1-800-225-2606, by visitingmfs.com/proxyvoting, or by visiting the SEC’s Web site athttp://www.sec.gov.
Information regarding how the fund voted proxies relating to portfolio securities during the most recent twelve-month period ended June 30 is available by August 31 of each year without charge by visitingmfs.com/proxyvoting, or by visiting the SEC’s Web site athttp://www.sec.gov.
QUARTERLY PORTFOLIO DISCLOSURE
The fund files a complete schedule of portfolio holdings with the SEC for the first and third quarters of each fiscal year as an exhibit to its reports on Form N-PORT. The fund’s Form N-PORT reports are available on the SEC’s website athttp://www.sec.gov. A shareholder can obtain the portfolio holdings report for the first and third quarters of the fund’s fiscal year atmfs.com/vit3 by choosing the fund’s name and then selecting the “Resources” tab and clicking on “Prospectus and Reports”.
FURTHER INFORMATION
From time to time, MFS may post important information about the fund or the MFS funds on the MFS web site (mfs.com). This information is available athttps://www.mfs.com/en-us/what-we-do/announcements.html or at mfs.com/vit3by choosing the fund’s name.
INFORMATION ABOUT FUND CONTRACTS AND LEGAL CLAIMS
The fund has entered into contractual arrangements with an investment adviser, administrator, distributor, shareholder servicing agent, 529 program manager (if applicable), and custodian who each provide services to the fund. Unless expressly stated otherwise, shareholders are not parties to, or intended beneficiaries of these contractual arrangements, and these contractual arrangements are not intended to create any shareholder right to enforce them against the service providers or to seek any remedy under them against the service providers, either directly or on behalf of the fund.
Under the Trust’s By-Laws and Declaration of Trust, any claims asserted against or on behalf of the MFS Funds, including claims against Trustees and Officers, must be brought in state and federal courts located within the Commonwealth of Massachusetts.
28
rev. 3/16
| | | | |
| | | |
| FACTS | | WHAT DOES MFS DO WITH YOUR
PERSONAL INFORMATION? | |  |
| | |
| Why? | | Financial companies choose how they share your personal information. Federal law gives consumers the right to limit some but not all sharing. Federal law also requires us to tell you how we collect, share, and protect your personal information. Please read this notice carefully to understand what we do. |
| | |
| What? | | The types of personal information we collect and share depend on the product or service you have with us. This information can include: • Social Security number and account balances • Account transactions and transaction history • Checking account information and wire transfer instructions When you areno longer our customer, we continue to share your information as described in this notice. |
| | |
| How? | | All financial companies need to share customers’ personal information to run their everyday business. In the section below, we list the reasons financial companies can share their customers’ personal information; the reasons MFS chooses to share; and whether you can limit this sharing. |
| | | | |
Reasons we can share your
personal information | | Does MFS share? | | Can you limit this
sharing? |
For our everyday business purposes – such as to process your transactions, maintain your account(s), respond to court orders and legal investigations, or report to credit bureaus | | Yes | | No |
For our marketing purposes – to offer our products and services to you | | No | | We don’t share |
| For joint marketing with other financial companies | | No | | We don’t share |
For our affiliates’ everyday business purposes – information about your transactions and experiences | | No | | We don’t share |
For our affiliates’ everyday business purposes – information about your creditworthiness | | No | | We don’t share |
| For nonaffiliates to market to you | | No | | We don’t share |
| | |
| | |
| Questions? | | Call800-225-2606 or go tomfs.com. |
29
| | |
| Who we are |
| Who is providing this notice? | | MFS Funds, MFS Investment Management, MFS Institutional Advisors, Inc., and MFS Heritage Trust Company. |
| | |
| What we do |
| How does MFS protect my personal information? | | To protect your personal information from unauthorized access and use, we use security measures that comply with federal law. These measures include procedural, electronic, and physical safeguards for the protection of the personal information we collect about you. |
How does MFS
collect my personal information? | | We collect your personal information, for example, when you • open an account or provide account information • direct us to buy securities or direct us to sell your securities • make a wire transfer We also collect your personal information from others, such as credit bureaus, affiliates, or other companies. |
| Why can’t I limit all sharing? | | Federal law gives you the right to limit only • sharing for affiliates’ everyday business purposes – information about your creditworthiness • affiliates from using your information to market to you • sharing for nonaffiliates to market to you State laws and individual companies may give you additional rights to limit sharing. |
| | |
| Definitions |
| Affiliates | | Companies related by common ownership or control. They can be financial and nonfinancial companies. • MFS does not share personal information with affiliates, except for everyday business purposes as described on page one of this notice. |
| Nonaffiliates | | Companies not related by common ownership or control. They can be financial and nonfinancial companies. • MFS does not share with nonaffiliates so they can market to you. |
| Joint marketing | | A formal agreement between nonaffiliated financial companies that together market financial products or services to you. • MFS doesn’t jointly market. |
| | |
| Other important information |
| If you own an MFS product or receive an MFS service in the name of a third party such as a bank or broker-dealer, their privacy policy may apply to you instead of ours. |
30
Annual Report
December 31, 2019

MFS® Limited Maturity Portfolio

MFS® Variable Insurance Trust III
Beginning on January 1, 2021, as permitted by regulations adopted by the U.S. Securities and Exchange Commission, the insurance company that offers your contract may determine that it will no longer send you paper copies of the fund’s annual and semiannual shareholder reports unless you specifically request paper copies from the insurance company or from your financial intermediary. Instead, the shareholder reports will be made available on a Web site (insurancefunds.mfs.com or other Web site of which you will be notified), and the insurance company will notify you by mail each time a report is posted and provide you with a Web site link to access the report. Instructions for requesting paper copies will be provided by your insurance company or financial intermediary.
If you already elected to receive shareholder reports by email, you will not be affected by this change and you need not take any action. If your insurance company or financial intermediary offers electronic delivery, you may elect to receive shareholder reports and other communications from the insurance company or financial intermediary by email by following the instructions provided by the insurance company or financial intermediary.
Beginning on January 1, 2019, you may elect to receive all future reports in paper free of charge from the insurance company or financial intermediary. You can inform the insurance company or financial intermediary that you wish to continue receiving paper copies of your shareholder reports by contacting your insurance company or financial intermediary. Your election to receive reports in paper will apply to all funds held in your account with your insurance company or financial intermediary.
VLT-ANN
MFS® Limited Maturity Portfolio
CONTENTS
The report is prepared for the general information of contract owners. It is authorized for distribution to prospective investors only when preceded or accompanied by a current prospectus.
NOT FDIC INSURED• MAY LOSE VALUE• NO BANK OR CREDIT UNION GUARANTEE• NOT A DEPOSIT• NOT INSURED BY ANY FEDERAL GOVERNMENT AGENCY OR NCUA/NCUSIF
MFS Limited Maturity Portfolio
LETTER FROM THE EXECUTIVE CHAIR

Dear Contract Owners:
Slowing global growth, low inflation, and trade friction between the United States and China have been hallmarks of the past 12 months. After experiencing an uptick in market volatility in late 2018, markets steadied for most of 2019, thanks in large measure to the adoption of a dovish policy stance on the part of global central banks, focused on supporting economic growth. Negotiations aimed at a “phase one” trade deal between the U.S. and China bore fruit at the end of the period, boosting investor sentiment, while signs of stability emerging from the global manufacturing sector also lifted spirits. Uncertainty over Brexit, along with the ripple effects from the trade conflict, hampered business confidence and investment in the United Kingdom and Europe for much of the period, though investors expect greater clarity regarding Brexit as a result of December’s general election. The pro-Brexit Conservative Party won the election by a comfortable margin and set the stage for the U.K.’s departure from the EU at the end of January.
Markets expect the longest economic expansion in U.S. history will continue, albeit at a slower pace, as trade tensions recede. In an effort to prolong the expansion, the U.S. Federal Reserve lowered interest rates three times between July and October and the European Central Bank loosened policy in September. While the global monetary policy backdrop remains quite accommodative, signs of easing trade tensions and fading global recession fears led to improved market sentiment in late 2019 as investors grew less risk averse. In early 2020, an outbreak of coronavirus emanating from China reintroduced global growth fears, causing an uptick in volatility.
Here at MFS®, we aim to help our clients navigate the growing complexity of the markets and world economies. Our long-term investment philosophy and commitment to the responsible allocation of capital allow us to tune out the noise and uncover what we believe are the best, most durable investment opportunities in the market. Through our powerful global investment platform, we combine collective expertise, thoughtful risk management and long-term discipline to create sustainable value for investors.
Respectfully,

Robert J. Manning
Executive Chair
MFS Investment Management
February 14, 2020
The opinions expressed in this letter are subject to change and may not be relied upon for investment advice. No forecasts can be guaranteed.
1
MFS Limited Maturity Portfolio
PORTFOLIO COMPOSITION
Portfolio structure at value (v)
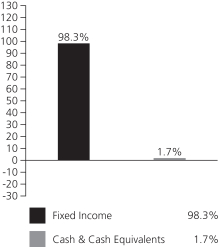
| | | | |
| Fixed income sectors (i) | | | | |
| Investment Grade Corporates | | | 47.9% | |
| U.S. Treasury Securities | | | 32.5% | |
| Commercial Mortgage-Backed Securities | | | 10.8% | |
| Collateralized Debt Obligations | | | 9.4% | |
| Asset-Backed Securities | | | 9.2% | |
| Emerging Markets Bonds | | | 2.6% | |
| Residential Mortgage-Backed Securities | | | 2.4% | |
| Non-U.S. Government Bonds | | | 1.7% | |
| Mortgage-Backed Securities | | | 1.6% | |
| Municipal Bonds | | | 1.1% | |
| U.S. Government Agencies | | | 0.3% | |
Portfolio structure reflecting equivalent exposure of derivative positions (i)
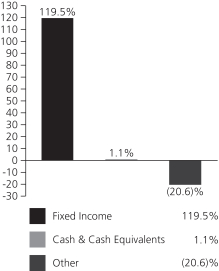
| | | | |
| Composition including fixed income credit quality (a)(i) | |
| AAA | | | 12.4% | |
| AA | | | 11.8% | |
| A | | | 22.7% | |
| BBB | | | 32.7% | |
| U.S. Government | | | 11.9% | |
| Federal Agencies | | | 1.9% | |
| Not Rated | | | 26.1% | |
| Cash & Cash Equivalents | | | 1.1% | |
| Other | | | (20.6)% | |
| |
| Portfolio facts (i) | | | | |
| Average Duration (d) | | | 1.8 | |
| Average Effective Maturity (m) | | | 2.2 yrs. | |
| (a) | | For all securities other than those specifically described below, ratings are assigned to underlying securities utilizing ratings from Moody’s, Fitch, and Standard & Poor’s rating agencies and applying the following hierarchy: If all three agencies provide a rating, the middle rating (after dropping the highest and lowest ratings) is assigned; if two of the three agencies rate a security, the lower of the two is assigned. Ratings are shown in the S&P and Fitch scale (e.g., AAA). Securities rated BBB or higher are considered investment grade. All ratings are subject to change. U.S. Government includes securities issued by the U.S. Department of the Treasury. Federal Agencies includes rated and unrated U.S. Agency fixed-income securities, U.S. Agency mortgage-backed securities, and collateralized mortgage obligations of U.S. Agency mortgage-backed securities. Not Rated includes fixed income securities and fixed income derivatives, which have not been rated by any rating agency. The fund may or may not have held all of these instruments on this date. The fund is not rated by these agencies. |
| (d) | | Duration is a measure of how much a bond’s price is likely to fluctuate with general changes in interest rates, e.g., if rates rise 1.00%, a bond with a5-year duration is likely to lose about 5.00% of its value due to the interest rate move. |
| (i) | | For purposes of this presentation, the components include the value of securities, and reflect the impact of the equivalent exposure of derivative positions, if any. These amounts may be negative from time to time. Equivalent exposure is a calculated amount that translates the derivative position into a reasonable approximation of the amount of the underlying asset that the portfolio would have to hold at a given point in time to have the same price sensitivity that results from the portfolio’s ownership of the derivative contract. When dealing with derivatives, equivalent exposure is a more representative measure of the potential impact of a position on portfolio performance than value. The bond component will include any accrued interest amounts. |
| (m) | | In determining each instrument’s effective maturity for purposes of calculating the fund’s dollar-weighted average effective maturity, MFS uses the instrument’s stated maturity or, if applicable, an earlier date on which MFS believes it is probable that a maturity-shortening device (such as a put,pre-refunding or prepayment) will cause the instrument to be repaid. Such an earlier date can be substantially shorter than the instrument’s stated maturity. |
2
MFS Limited Maturity Portfolio
Portfolio Composition – continued
| (v) | | For purposes of this presentation, market value of fixed income and/or equity derivatives, if any, is included in Cash & Cash Equivalents. |
Where the fund holds convertible bonds, they are treated as part of the equity portion of the portfolio.
Cash & Cash Equivalents includes any cash, investments in money market funds, short-term securities, and other assets less liabilities. Please see the Statement of Assets and Liabilities for additional information related to the fund’s cash position and other assets and liabilities.
Other includes equivalent exposure from currency derivatives and/or any offsets to derivative positions and may be negative.
Percentages are based on net assets as of December 31, 2019.
The portfolio is actively managed and current holdings may be different.
3
MFS Limited Maturity Portfolio
MANAGEMENT REVIEW
Summary of Results
For the twelve months ended December 31, 2019, Initial Class shares of the MFS Limited Maturity Portfolio (fund) provided a total return of 5.19%, while Service Class shares of the fund provided a total return of 4.90%. These compare with a return of 4.03% over the same period for the fund’s benchmark, the Bloomberg Barclays1-3 Year U.S. Government/Credit Bond Index.
Market Environment
Fading fears of a near-term global recession, the announcement of a partial trade deal between the United States and China and the decline in uncertainty over Brexit helped bolster market sentiment late in the period. Changes in market sentiment, largely driven by uncertainty over the outcome of trade negotiations between the US and China, had contributed to periodic bouts of volatility during the reporting period. The global economy decelerated, led by weakness in China and Europe, although the pace of the slowdown moderated late in the period amid nascent signs of stabilization in the manufacturing sector.
The deteriorating global growth backdrop, along with declining inflationary pressures, prompted the US Federal Reserve to adopt a more dovish posture beginning in early 2019, resulting in the first interest rate cut in over a decade at the end of July, followed by additional cuts in September and October. The Fed’s actions led to a sharp decline in long-term interest rates during the period’s second half, causing the inversion of portions of the US Treasury yield curve for a time. Amid an improvement in risk sentiment in Q4 2019 and indications of a bottoming in growth and a potential upturn in activity, the Fed indicated in October that further rate cuts were unlikely unless the outlook for the economy materially worsened.
Globally, central banks have tilted more dovish as well, with the European Central Bank unveiling a package of easing measures, which included putting overnight rates deeper into negative territory, restarting its bond-buying program and lengthening the term of cheap loans to banks to three years from two. The central banks of India and Australia are among those that have cut rates several times in recent months, although China has been more cautious in increasing liquidity as it keeps trying to deleverage its economy, cutting rates only marginally.
Emerging markets experienced considerable volatility through the end of 2018, as tighter global financial conditions exposed structural weakness in some countries. Those conditions improved in 2019 as the Fed became more dovish. Notwithstanding the periodic headwinds on market sentiment from significant trade friction between the US and China over much of the year, emerging market hard currency debt and local rates benefited from relatively cheap valuations at the beginning of the period and easier global monetary conditions. These factors, plus the fading of certain global risk factors mentioned above, hastened spread tightening in the latter part of the period. At the same time, idiosyncratic risks spiked in some countries (e.g., Argentina and Lebanon), contributing to increased dispersion in performance among sovereign assets.
Factors Affecting Performance
Relative to the Bloomberg Barclays1-3 Year U.S. Government/Credit Bond Index, the fund’s asset allocation decisions benefited relative performance over the reporting period. From a sector perspective, the fund’s greater exposure tocollateralized mortgage obligations (CMO),financial institutions andindustrials, as well as a lesser exposure totreasury bonds, positively impacted relative returns. From a credit quality perspective, the fund’s greater exposure to both “BBB” and “A” rated (r) securities further supported relative results.
Bond selection was another factor that contributed to the fund’s relative performance over the reporting period. From a sector perspective, selection within both theindustrials andfinancial institutions sectors aided relative results. From a credit quality perspective, selection within both “BBB” and “A” rated issues helped relative returns.
Conversely, the fund’s shorter relative duration (d) stance slightly detracted from relative returns over the reporting period.
Respectfully,
Portfolio Manager(s)
Philipp Burgener and Alexander Mackey
| (d) | Duration is a measure of how much a bond’s price is likely to fluctuate with general changes in interest rates, e.g., if rates rise 1.00%, a bond with a5-year duration is likely to lose about 5.00% of its value. |
| (r) | Bonds rated “BBB”, “Baa”, or higher are considered investment grade; bonds rated “BB”, “Ba”, or below are considerednon-investment grade. The source for bond quality ratings is Moody’s Investors Service, Standard & Poor’s and Fitch, Inc. and are applied using the following hierarchy: If all three agencies provide a rating, the middle rating (after dropping the highest and lowest ratings) is assigned; if two of the three agencies rate a security, the lower of the two is assigned. Ratings are shown in the S&P and Fitch scale (e.g., AAA). For securities which are not rated by any of the three agencies, the security is considered Not Rated. |
4
MFS Limited Maturity Portfolio
Management Review – continued
The views expressed in this report are those of the portfolio manager(s) only through the end of the period of the report as stated on the cover and do not necessarily reflect the views of MFS or any other person in the MFS organization. These views are subject to change at any time based on market or other conditions, and MFS disclaims any responsibility to update such views. These views may not be relied upon as investment advice or an indication of trading intent on behalf of any MFS portfolio. References to specific securities are not recommendations of such securities, and may not be representative of any MFS portfolio’s current or future investments.
5
MFS Limited Maturity Portfolio
PERFORMANCE SUMMARY THROUGH 12/31/19
The following chart illustrates the historical performance of the fund in comparison to its benchmark(s). Benchmarks are unmanaged and may not be invested in directly. Benchmark returns do not reflect any fees or expenses. The performance of other share classes will be greater than or less than that of the class depicted below. (See Notes to Performance Summary.)
Performance data shown represents past performance and is no guarantee of future results. Investment return and principal value fluctuate so your units, when sold, may be worth more or less than the original cost; current performance may be lower or higher than quoted. The performance shown does not reflect the deduction of taxes, if any, that a contract holder would pay on fund distributions or the redemption of contract units. The returns for the fund shown also do not reflect the deduction of expenses associated with variable products, such as mortality and expense risk charges, separate account charges, and sales charges imposed by the insurance company separate accounts. Such expenses would reduce the overall returns shown.
Growth of a Hypothetical $10,000 Investment
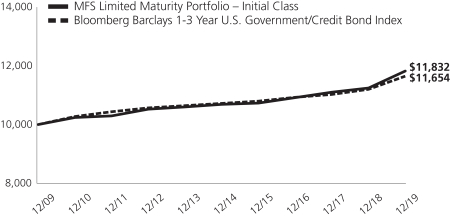
Total Returns through 12/31/19
Average annual total returns
| | | | | | | | | | | | |
| | | Share Class | | Class Inception Date | | 1-yr | | 5-yr | | 10-yr | | |
| | | Initial Class | | 3/07/08 | | 5.19% | | 2.06% | | 1.70% | | |
| | | Service Class | | 3/07/08 | | 4.90% | | 1.81% | | 1.43% | | |
| | | | |
| Comparative benchmark(s) | | | | | | | | |
| | | Bloomberg Barclays1-3 Year U.S. Government/Credit Bond Index (f) | | 4.03% | | 1.67% | | 1.54% | | |
| (f) | Source: FactSet Research Systems Inc. |
Benchmark Definition(s)
Bloomberg Barclays 1-3 Year U.S. Government/Credit Bond Index – a market capitalization-weighted index that measures the performance of the short-term (1 to 3 years) investment-grade corporate and U.S. government bond markets. BLOOMBERG® is a trademark and service mark of Bloomberg Finance L.P. and its affiliates (collectively “Bloomberg”). BARCLAYS® is a trademark and service mark of Barclays Bank Plc (collectively with its affiliates, “Barclays”), used under license. Bloomberg or Bloomberg’s licensors, including Barclays, own all proprietary rights in the Bloomberg Barclays Indices. Neither Bloomberg nor Barclays approves or endorses this material, or guarantees the accuracy or completeness of any information herein, or makes any warranty, express or implied, as to the results to be obtained therefrom, and, to the maximum extent allowed by law, neither shall have any liability or responsibility for injury or damages arising in connection therewith.
It is not possible to invest directly in an index.
Notes to Performance Summary
Average annual total return represents the average annual change in value for each share class for the periods presented.
Performance results reflect any applicable expense subsidies and waivers in effect during the periods shown. Without such subsidies and waivers the fund’s performance results would be less favorable. Please see the prospectus and financial statements for complete details. All results are historical and assume the reinvestment of any dividends and capital gains distributions.
6
MFS Limited Maturity Portfolio
Performance Summary – continued
Performance prior to close of business December 7, 2012, reflects time periods when another adviser or subadviser was responsible for selecting investments for the fund under a different investment objective and different investment strategies.
Performance results do not include adjustments made for financial reporting purposes in accordance with U.S. generally accepted accounting principles and may differ from amounts reported in the financial highlights.
From time to time the fund may receive proceeds from litigation settlements, without which performance would be lower.
7
MFS Limited Maturity Portfolio
EXPENSE TABLE
Fund Expenses Borne by the Contract Holders during the Period,
July 1, 2019 through December 31, 2019
As a contract holder of the fund, you incur ongoing costs, including management fees; distribution and/or service(12b-1) fees; and other fund expenses. This example is intended to help you understand your ongoing costs (in dollars) of investing in the fund and to compare these costs with the ongoing costs of investing in other mutual funds.
The example is based on an investment of $1,000 invested at the beginning of the period and held for the entire period July 1, 2019 through December 31, 2019.
Actual Expenses
The first line for each share class in the following table provides information about actual account values and actual expenses. You may use the information in this line, together with the amount you invested, to estimate the expenses that you paid over the period. Simply divide your account value by $1,000 (for example, an $8,600 account value divided by $1,000 = 8.6), then multiply the result by the number in the first line under the heading entitled “Expenses Paid During Period” to estimate the expenses you paid on your account during this period.
Hypothetical Example for Comparison Purposes
The second line for each share class in the following table provides information about hypothetical account values and hypothetical expenses based on the fund’s actual expense ratio and an assumed rate of return of 5% per year before expenses, which is not the fund’s actual return. The hypothetical account values and expenses may not be used to estimate the actual ending account balance or expenses you paid for the period. You may use this information to compare the ongoing costs of investing in the fund and other funds. To do so, compare this 5% hypothetical example with the 5% hypothetical examples that appear in the shareholder reports of the other funds.
Please note that the expenses shown in the table are meant to highlight the fund’s ongoing costs only and do not take into account the fees and expenses imposed under the variable contracts through which your investment in the fund is made. Therefore, the second line for each share class in the table is useful in comparing ongoing costs associated with an investment in vehicles (such as the fund) which fund benefits under variable annuity and variable life insurance contracts and to qualified pension and retirement plans only, and will not help you determine the relative total costs of investing in the fund through variable annuity and variable life insurance contracts. If the fees and expenses imposed under the variable contracts were included, your costs would have been higher.
| | | | | | | | | | | | | | | | | | |
| Share Class | | | | Annualized
Expense Ratio | | | Beginning
Account Value
7/01/19 | | | Ending Account Value
12/31/19 | | | Expenses Paid During Period (p)
7/01/19-12/31/19 | |
| Initial Class | | Actual | | | 0.44% | | | | $1,000.00 | | | | $1,015.67 | | | | $2.24 | |
| | Hypothetical (h) | | | 0.44% | | | | $1,000.00 | | | | $1,022.99 | | | | $2.24 | |
| Service Class | | Actual | | | 0.69% | | | | $1,000.00 | | | | $1,013.79 | | | | $3.50 | |
| | Hypothetical (h) | | | 0.69% | | | | $1,000.00 | | | | $1,021.73 | | | | $3.52 | |
| (h) | 5% class return per year before expenses. |
| (p) | “Expenses Paid During Period” are equal to each class’s annualized expense ratio, as shown above, multiplied by the average account value over the period, multiplied by 184/365 (to reflect theone-half year period). |
8
MFS Limited Maturity Portfolio
PORTFOLIO OF INVESTMENTS – 12/31/19
The Portfolio of Investments is a complete list of all securities owned by your fund. It is categorized by broad-based asset classes.
| | | | | | | | |
| | |
| Issuer | | Shares/Par | | | Value ($) | |
| BONDS – 98.3% | | | | | | | | |
| Asset-Backed & Securitized – 31.7% | | | | | | | | |
| ALM Loan Funding, CLO,2015-12A, “A2A2”, FLR, 3.35% (LIBOR - 3mo. + 1.35%), 4/16/2027 (n) | | $ | 3,511,841 | | | $ | 3,491,931 | |
| ALM Loan Funding, CLO,2015-16A, “BR2”, FLR, 3.9% (LIBOR - 3mo. + 1.9%), 7/15/2027 (n) | | | 1,900,315 | | | | 1,882,731 | |
| Americredit Automobile Receivables Trust,2017-2, “C”, 2.97%, 3/20/2023 | | | 1,837,000 | | | | 1,855,284 | |
| Arbor Realty Trust, Inc., CLO,2019-FL1, “A”, FLR, 2.889% (LIBOR - 1mo. + 1.15%), 5/15/2037 (n) | | | 2,210,000 | | | | 2,210,000 | |
| AREIT CRE Trust, 2019-CRE3, “AS” FLR, 3.04% (LIBOR - 1mo. + 1.3%), 9/14/2036 (n) | | | 647,000 | | | | 647,125 | |
| AREIT CRE Trust, 2019-CRE3, “B”, FLR, 3.29% (LIBOR - 1mo. + 1.55%), 9/14/2036 (n) | | | 319,500 | | | | 319,497 | |
| AREIT CRE Trust, 2019-CRE3, “C”, FLR, 3.639% (LIBOR - 1mo. + 1.9%), 9/14/2036 (n) | | | 264,000 | | | | 263,997 | |
| Avery Point CLO Ltd.,2014-1A, “CR”, FLR, 4.289% (LIBOR - 3mo. + 2.35%), 4/25/2026 (n) | | | 1,720,000 | | | | 1,718,077 | |
| Ballyrock Ltd., CLO,2018-1A, “A2”, FLR, 3.565% (LIBOR - 3mo. + 1.6%), 4/20/2031 (n) | | | 1,748,737 | | | | 1,698,302 | |
| Ballyrock Ltd., CLO,2018-1A, “B”, FLR, 3.865% (LIBOR - 3mo. + 1.9%), 4/20/2031 (n) | | | 741,069 | | | | 713,405 | |
| Bancorp Commercial Mortgage Trust, 2018-CRE3, “B”, FLR, 3.289% (LIBOR - 1mo. + 1.55%), 1/15/2033 (n) | | | 1,605,087 | | | | 1,609,373 | |
| Bancorp Commercial Mortgage Trust, 2018-CRE4, “AS”, FLR, 2.839% (LIBOR - 1mo. + 1.1%), 9/15/2035 (n) | | | 1,736,000 | | | | 1,737,821 | |
| Bancorp Commercial Mortgage Trust, 2019-CRE5, “AS”, FLR, 3.09% (LIBOR - 1mo. + 1.35%), 3/15/2036 (n) | | | 1,247,481 | | | | 1,247,479 | |
| Bancorp Commercial Mortgage Trust, 2019-CRE5, “B”, FLR, 3.239% (LIBOR - 1mo. + 1.5%), 3/15/2036 (n) | | | 1,727,281 | | | | 1,727,278 | |
| Bancorp Commercial Mortgage Trust, 2019-CRE6, “AS”, FLR, 3.065% (LIBOR -1mo. + 1.3%), 9/15/2036 (n) | | | 1,410,155 | | | | 1,410,121 | |
| Bancorp Commercial Mortgage Trust, 2019-CRE6, “B”, FLR, 3.315% (LIBOR - 1mo. + 1.55%), 9/15/2036 (n) | | | 1,776,462 | | | | 1,776,458 | |
| Barclays Commercial Mortgage Securities LLC,2018-C2, “XA”, 0.771%, 12/15/2051 (i)(n) | | | 22,143,982 | | | | 1,275,992 | |
| BSPRT Ltd.,2018-FL4, “A”, FLR, 3.839% (LIBOR - 1mo. + 2.1%), 9/15/2035 (n) | | | 2,076,000 | | | | 2,077,303 | |
| | | | | | | | |
| | |
Issuer | | Shares/Par | | | Value ($) | |
| BONDS – continued | | | | | | | | |
| Asset-Backed & Securitized – continued | | | | | |
| Business Jet Securities LLC,2018-1, “A”, 4.335%, 2/15/2033 (n) | | $ | 1,545,588 | | | $ | 1,562,144 | |
| BXMT Ltd.,2017-FL1 “A”, FLR, 2.607% (LIBOR - 1mo. + 0.87%), 6/15/2035 (n) | | | 1,230,537 | | | | 1,229,766 | |
| Caravana Auto Receivables Trust,2019-1A, “B”, 3.29%, 8/15/2023 (n) | | | 2,927,000 | | | | 2,963,572 | |
| CD Commercial Mortgage Trust,2017-CD4, “XA”, 1.309%, 5/10/2050 (i) | | | 17,486,939 | | | | 1,214,681 | |
| Chesapeake Funding II LLC,2017-2A, “B”, 2.81%, 5/15/2029 (n) | | | 1,200,000 | | | | 1,206,330 | |
| Chesapeake Funding II LLC,2017-2A, “C”, 3.01%, 5/15/2029 (n) | | | 536,000 | | | | 539,255 | |
| Chesapeake Funding II LLC,2017-3A, “B”, 2.57%, 8/15/2029 (n) | | | 869,000 | | | | 870,296 | |
| Chesapeake Funding II LLC,2017-4A, “B”, 2.59%, 11/15/2029 (n) | | | 741,000 | | | | 742,847 | |
| Chesapeake Funding II LLC,2017-4A, “C”, 2.76%, 11/15/2029 (n) | | | 994,000 | | | | 997,554 | |
| Commercial Mortgage Pass-Through Certificates, 2019-BN24 ,“XA”, 0.767%, 11/15/2062 (i) | | | 8,938,418 | | | | 489,101 | |
| CPS Auto Trust,2017-C, “C”, 2.86%, 6/15/2023 (n) | | | 1,183,141 | | | | 1,184,287 | |
| Credit Acceptance Auto Loan Trust,2017-2A, “B”, 3.02%, 4/15/2026 (n) | | | 2,607,000 | | | | 2,619,640 | |
| Cutwater CLO Ltd.,2015-1A, “AR”, FLR, 3.221% (LIBOR - 3mo. + 1.22%), 1/15/2029 (n) | | | 2,579,418 | | | | 2,579,279 | |
| Dell Equipment Finance Trust,2017-2, “B”, 2.47%, 10/24/2022 (n) | | | 692,000 | | | | 692,876 | |
| Dell Equipment Finance Trust,2018-2, “B”, 3.55%, 10/22/2023 (n) | | | 1,843,000 | | | | 1,877,763 | |
| DLL Securitization Trust,2017-A, “A3”, 2.14%, 12/15/2021 (n) | | | 612,464 | | | | 612,574 | |
| DT Auto Owner Trust,2017-1A, “D”, 3.55%, 11/15/2022 (n) | | | 814,843 | | | | 819,285 | |
| DT Auto Owner Trust,2017-3A, “C”, 3.01%, 5/15/2023 (n) | | | 349,955 | | | | 350,244 | |
| DT Auto Owner Trust,2017-3A, “D”, 3.58%, 5/15/2023 (n) | | | 1,621,000 | | | | 1,630,621 | |
| DT Auto Owner Trust,2018-2A, “C”, 3.67%, 3/15/2024 (n) | | | 803,000 | | | | 810,528 | |
| Exantas Capital Corp. CLO Ltd., 2019-RS07, “B”, FLR, 3.437% (LIBOR - 1mo. + 1.7%), 4/15/2036 (n) | | | 1,927,000 | | | | 1,931,292 | |
| Exeter Automobile Receivables Trust,2018-1A, “B”, 2.75%, 4/15/2022 (n) | | | 474,368 | | | | 474,544 | |
| Figueroa CLO Ltd.,2014-1A, “BR”, FLR, 3.5% (LIBOR - 3mo. + 1.5%), 1/15/2027 (n) | | | 2,520,000 | | | | 2,514,169 | |
| Fort CRE LLC,2018-1A, “A1”, FLR, 3.135% (LIBOR - 1mo. + 1.35%), 11/16/2035 (n) | | | 2,596,500 | | | | 2,596,495 | |
9
MFS Limited Maturity Portfolio
Portfolio of Investments – continued
| | | | | | | | |
| | |
| Issuer | | Shares/Par | | | Value ($) | |
| BONDS – continued | | | | | | | | |
| Asset-Backed & Securitized – continued | | | | | |
| Freedom Financial,2019-1, “A”, 3.42%, 6/18/2026 (n) | | $ | 420,213 | | | $ | 421,572 | |
| General Motors,2019-1, “B”, 2.86%, 4/15/2024 (n) | | | 1,228,000 | | | | 1,243,830 | |
| General Motors,2019-1, “C”, 3.06%, 4/15/2024 (n) | | | 945,000 | | | | 958,788 | |
| Grand Avenue CRE Ltd.,2019-FL1, “A”, FLR, 2.86% (LIBOR - 1mo. + 1.12%), 6/15/2037 (n) | | | 1,512,500 | | | | 1,512,500 | |
| Granite Point Mortgage Trust, Inc., FLR, 2.664% (LIBOR - 1mo. + 0.9%), 11/21/2035 (n) | | | 1,130,539 | | | | 1,127,808 | |
| GS Mortgage Securities Trust, 2015-GC32, “A2”, 3.062%, 7/10/2048 | | | 1,679,000 | | | | 1,681,611 | |
| GS Mortgage Securities Trust,2017-GS6, “XA”, 1.042%, 5/10/2050 (i) | | | 15,788,417 | | | | 1,042,072 | |
| GS Mortgage Securities Trust,2017-GS7, “XA”, 1.129%, 8/10/2050 (i) | | | 15,751,610 | | | | 1,051,795 | |
| Hertz Fleet Lease Funding LP,2018-1, “B”, 3.64%, 5/10/2032 (n) | | | 1,106,000 | | | | 1,123,115 | |
| Hertz Fleet Lease Funding LP,2018-1, “C”, 3.77%, 5/10/2032 (n) | | | 635,000 | | | | 644,424 | |
| Invitation Homes Trust, 2018-SFR1, “B”, FLR, 2.687% (LIBOR - 1mo. + 0.95%), 3/17/2037 (n) | | | 1,366,000 | | | | 1,353,274 | |
| Invitation Homes Trust, 2018-SFR2, “A”, FLR, 2.587% (LIBOR - 1mo. + 0.85%), 12/17/2036 (n) | | | 2,621,218 | | | | 2,611,252 | |
| Invitation Homes Trust, 2018-SFR2, “A”, FLR, 2.639% (LIBOR - 1mo. + 0.9%), 6/17/2037 (n) | | | 1,899,917 | | | | 1,896,969 | |
| JPMorgan Chase Commercial Mortgage Securities Corp., 1.072%, 9/15/2050 (i) | | | 15,044,593 | | | | 889,727 | |
| KKR Real Estate Financial Trust, Inc.,2018-FL1, “C”, FLR, 3.737% (LIBOR - 1mo. + 2%), 6/15/2036 (n) | | | 1,355,500 | | | | 1,356,347 | |
| LoanCore Ltd., 2018-CRE1, “AS”, FLR, 3.239% (LIBOR - 1mo. + 1.5%), 5/15/2028 (n) | | | 2,225,000 | | | | 2,227,940 | |
| LoanCore Ltd., 2018-CRE1, “C”, FLR, 4.29% (LIBOR - 1mo. + 2.55%), 5/15/2028 (n) | | | 741,500 | | | | 743,739 | |
| LoanCore Ltd., 2019-CRE3, “AS”, FLR, 3.109% (LIBOR - 1mo. + 1.37%), 4/15/2034 (n) | | | 2,200,500 | | | | 2,200,496 | |
| Loomis, Sayles & Co., CLO, “A2”, FLR, 3.4% (LIBOR - 3mo. + 1.4%), 4/15/2028 (n) | | | 1,854,111 | | | | 1,841,677 | |
| Loomis, Sayles & Co., CLO,2015-2A, “A1R”, FLR, 2.9% (LIBOR - 3mo. + 0.9%), 4/15/2028 (n) | | | 1,646,843 | | | | 1,641,252 | |
| Madison Park Funding Ltd.,2014-13A, “BR2”, FLR, 3.465% (LIBOR - 3mo. + 1.5%), 4/19/2030 (n) | | | 2,779,008 | | | | 2,750,507 | |
| | | | | | | | |
| | |
| Issuer | | Shares/Par | | | Value ($) | |
| BONDS – continued | | | | | | | | |
| Asset-Backed & Securitized – continued | | | | | |
| Magnetite CLO Ltd.,2015-16A, “BR”, FLR, 3.203% (LIBOR - 3mo. + 1.2%), 1/18/2028 (n) | | $ | 3,559,000 | | | $ | 3,541,056 | |
| Man GLG U.S. CLO2018-2 Ltd.,2018-2A, “BR”, FLR, 4.45% (LIBOR - 3mo. + 2.45%), 10/15/2028 | | | 2,309,265 | | | | 2,293,504 | |
| MF1 CLO Ltd.,2019-FL2, “A”, FLR, 2.922% (LIBOR - 1mo. + 1.13%), 12/25/2034 (n) | | | 1,307,000 | | | | 1,307,396 | |
| MF1 CLO Ltd.,2019-FL2, “AS”, FLR, 3.222% (LIBOR - 1mo. + 1.43%), 12/25/2034 (n) | | | 1,307,000 | | | | 1,307,403 | |
| Morgan Stanley Bank of America Merrill Lynch Trust,2017-C33, “XA”, 1.42%, 5/15/2050 (i) | | | 17,182,778 | | | | 1,160,814 | |
| Morgan Stanley Capital I Trust,2017-H1, “XA”, 1.435%, 6/15/2050 (i) | | | 7,771,570 | | | | 567,248 | |
| Morgan Stanley Capital I Trust,2018-H4, “XA”, 0.864%, 12/15/2051 (i) | | | 18,045,572 | | | | 1,135,824 | |
| Mountain Hawk CLO Ltd.,2014-3A, “BR”, FLR, 3.803% (LIBOR - 3mo. + 1.8%), 4/18/2025 (n) | | | 3,468,000 | | | | 3,465,004 | |
| Nationstar HECM Loan Trust,2019-1A, “A”, 2.651%, 6/25/2029 (n) | | | 664,429 | | | | 664,714 | |
| Navistar Financial Dealer Note Master Owner (NAVMT),2019-1, “C”, FLR, 2.742% (LIBOR - 1mo. + 0.95%), 5/25/2024 (n) | | | 432,000 | | | | 432,806 | |
| Navistar Financial Dealer Note Master Owner Trust II,2018-1, “B”, FLR, 2.592% (LIBOR - 1mo. + 0.8%), 9/25/2023 (n) | | | 347,000 | | | | 347,357 | |
| Navistar Financial Dealer Note Master Owner Trust II,2018-1, “C”, FLR, 2.842% (LIBOR - 1mo. + 1.05%), 9/25/2023 (n) | | | 391,000 | | | | 391,537 | |
| Neuberger Berman CLO Ltd.,2016-21A, “CR”, FLR, 3.565% (LIBOR - 3mo. + 1.6%), 4/20/2027 (n) | | | 2,056,577 | | | | 1,984,249 | |
| NextGear Floorplan Master Owner Trust,2017-1A, “A2”, 2.54%, 4/18/2022 (n) | | | 1,378,000 | | | | 1,379,075 | |
| NextGear Floorplan Master Owner Trust,2017-2A, “B”, 3.02%, 10/17/2022 (n) | | | 1,038,000 | | | | 1,043,489 | |
| NextGear Floorplan Master Owner Trust,2019-2A, “A2”, 2.07%, 10/15/2024 (n) | | | 1,050,000 | | | | 1,042,600 | |
| OneMain Financial Issuance Trust,2017-1A, “A1”, 2.37%, 9/14/2032 (n) | | | 1,695,056 | | | | 1,694,761 | |
| Oscar U.S. Funding Trust,2017-1A, “A3”, 2.82%, 6/10/2021 (n) | | | 552,836 | | | | 553,468 | |
| Santander Drive Auto Receivables Trust,2017-2, “C”, 2.79%, 8/15/2022 | | | 628,938 | | | | 629,936 | |
| Santander Drive Auto Receivables Trust,2018-1, “B”, 2.63%, 7/15/2022 | | | 784,632 | | | | 785,140 | |
| Santander Drive Auto Receivables Trust,2019-2, “B”, 2.79%, 1/16/2024 | | | 1,474,000 | | | | 1,486,170 | |
| Santander Retail Auto Lease Trust,2017-A, “B”, 2.68%, 1/20/2022 (n) | | | 1,288,000 | | | | 1,290,324 | |
10
MFS Limited Maturity Portfolio
Portfolio of Investments – continued
| | | | | | | | |
| | |
| Issuer | | Shares/Par | | | Value ($) | |
| BONDS – continued | | | | | | | | |
| Asset-Backed & Securitized – continued | | | | | |
| Securitized Term Auto Receivable Trust 2019-CRTA, “B”, 2.453%, 3/25/2026 (n) | | $ | 410,969 | | | $ | 410,241 | |
| Securitized Term Auto Receivable Trust 2019-CRTA, “C”, 2.849%, 3/25/2026 (n) | | | 526,931 | | | | 526,000 | |
| Shackelton CLO Ltd.,2013-4RA, “B”, FLR, 3.9% (LIBOR - 3mo. + 1.9%), 4/13/2031 (n) | | | 927,055 | | | | 884,019 | |
| Shackleton CLO Ltd.,2015-8A, “CR”, FLR, 3.615% (LIBOR - 3mo. + 1.65%), 10/20/2027 (n) | | | 709,957 | | | | 700,833 | |
| Shelter Growth CRE,2018-FL1, “A”, FLR, 2.739% (LIBOR - 1mo. + 1%), 1/15/2035 (n) | | | 214,344 | | | | 214,287 | |
| Shelter Growth CRE,2019-FL2, “A”, FLR, 2.839% (LIBOR - 1mo. + 1.1%), 5/15/2036 (n) | | | 2,828,213 | | | | 2,827,364 | |
| SPS Servicer Advance Receivables Trust, 2.24%, 10/15/2051 (n) | | | 1,208,000 | | | | 1,207,837 | |
| SPS Servicer Advance Receivables Trust, 2.34%, 10/15/2051 (n) | | | 219,000 | | | | 218,936 | |
| SPS Servicer Advance Receivables Trust, 2.39%, 10/15/2051 (n) | | | 262,000 | | | | 261,924 | |
| Starwood Waypoint Homes Trust,2017-1, “B”, FLR, 2.909% (LIBOR - 1mo. + 1.17%), 1/17/2035 (n) | | | 2,055,201 | | | | 2,052,814 | |
| Student Loan Consolidation Center, “A”, FLR, 3.012% (LIBOR - 1mo. + 1.22%), 10/25/2027 (n) | | | 302,474 | | | | 302,399 | |
| Thacher Park CLO Ltd.,2014-1A, “CR”, FLR, 4.165% (LIBOR - 3mo. +2.2%), 10/20/2026 (n) | | | 1,743,000 | | | | 1,743,598 | |
| TICP CLO Ltd.,2018-3R, “B”, FLR, 3.315% (LIBOR - 3mo. + 1.35%), 4/20/2028 (n) | | | 870,756 | | | | 870,053 | |
| TICP CLO Ltd.,2018-3R, “C”, FLR, 3.765% (LIBOR - 3mo. + 1.8%), 4/20/2028 (n) | | | 1,528,084 | | | | 1,510,866 | |
| TPG Real Estate Finance,2018-FL2, “AS”, FLR, 3.187% (LIBOR - 1mo. + 1.45%), 11/15/2037 (n) | | | 2,192,500 | | | | 2,196,276 | |
| Tricon American Homes Trust, 2015-SFR1, “1A”, 2.589%, 11/17/2033 (n) | | | 2,960,184 | | | | 2,953,833 | |
| UBS Commercial Mortgage Trust,2017-C1, “XA”, 1.012%, 11/15/2050 (i) | | | 12,003,989 | | | | 679,731 | |
| UBS Commercial Mortgage Trust,2018-C14, “XA”, 1.003%, 12/15/2051 (i) | | | 9,108,741 | | | | 653,324 | |
| Verizon Owner Trust,2017-3A, “B”, 2.38%, 4/20/2022 (n) | | | 1,230,000 | | | | 1,233,346 | |
| Veros Auto Receivables Trust,2018-1, “A”, 3.63%, 5/15/2023 (n) | | | 445,627 | | | | 446,684 | |
| West CLO Ltd.,2013-1A, “A2BR”, 3.393%, 11/07/2025 (n) | | | 981,604 | | | | 981,551 | |
| West CLO Ltd.,2014-2A, “A1BR”, 2.724%, 1/16/2027 (n) | | | 1,123,397 | | | | 1,124,093 | |
| Wind River CLO Ltd.,2012-1A, “BR2”, FLR, 3.45% (LIBOR - 3mo. + 1.45%), 1/15/2026 (n) | | | 2,251,428 | | | | 2,251,545 | |
| | | | | | | | |
| | |
| Issuer | | Shares/Par | | | Value ($) | |
| BONDS – continued | | | | | | | | |
| Asset-Backed & Securitized – continued | | | | | |
| Wind River CLO Ltd.,2015-2A, “CR”, FLR, 3.686% (LIBOR - 1mo. + 1.7%), 10/15/2027 (n) | | $ | 864,053 | | | $ | 852,476 | |
| | | | | | | | |
| | | | | | $ | 146,099,917 | |
| | | | | | | | |
| Automotive – 2.7% | | | | | | | | |
| Ford Motor Credit Co. LLC, 5.085%, 1/07/2021 | | $ | 1,088,000 | | | $ | 1,113,843 | |
| Ford Motor Credit Co. LLC, 5.75%, 2/01/2021 | | | 1,192,000 | | | | 1,230,277 | |
| Ford Motor Credit Co. LLC, 4.063%, 11/01/2024 | | | 1,878,000 | | | | 1,915,311 | |
| Harley-Davidson Financial Services, 4.05%, 2/04/2022 (n) | | | 1,351,000 | | | | 1,394,330 | |
| Harley-Davidson Financial Services, FLR, 2.846% (LIBOR - 3mo. + 0.94%), 3/02/2021 (n) | | | 1,672,000 | | | | 1,681,738 | |
| Hyundai Capital America, 3.75%, 7/08/2021 (n) | | | 976,000 | | | | 995,318 | |
| Hyundai Capital America, 2.85%, 11/01/2022 (n) | | | 355,000 | | | | 358,772 | |
| Volkswagen Group of America Co., 3.875%, 11/13/2020 (n) | | | 1,356,000 | | | | 1,378,069 | |
| Volkswagen Group of America Co., 4%, 11/12/2021 (n) | | | 1,356,000 | | | | 1,402,104 | |
| Volkswagen Group of America Co., 2.85%, 9/26/2024 (n) | | | 1,120,000 | | | | 1,136,748 | |
| | | | | | | | |
| | | | | | $ | 12,606,510 | |
| | | | | | | | |
| Broadcasting – 0.5% | | | | | | | | |
| Fox Corp., 3.666%, 1/25/2022 (n) | | $ | 778,000 | | | $ | 803,150 | |
| Interpublic Group of Companies, Inc., 3.5%, 10/01/2020 | | | 1,734,000 | | | | 1,752,496 | |
| | | | | | | | |
| | | | | | $ | 2,555,646 | |
| | | | | | | | |
| Brokerage & Asset Managers – 1.1% | | | | | |
| E*TRADE Financial Corp., 2.95%, 8/24/2022 | | $ | 2,297,000 | | | $ | 2,338,947 | |
| Intercontinental Exchange, Inc., 2.75%, 12/01/2020 | | | 2,516,000 | | | | 2,531,781 | |
| | | | | | | | |
| | | | | | $ | 4,870,728 | |
| | | | | | | | |
| Cable TV – 1.8% | | | | | | | | |
| Comcast Corp., 3.45%, 10/01/2021 | | $ | 1,718,000 | | | $ | 1,767,981 | |
| NBCUniversal Media LLC, 4.375%, 4/01/2021 | | | 1,087,000 | | | | 1,120,870 | |
| SES S.A., 3.6%, 4/04/2023 (n) | | | 2,738,000 | | | | 2,797,422 | |
| Time Warner Cable, Inc., 5%, 2/01/2020 | | | 2,543,000 | | | | 2,547,762 | |
| | | | | | | | |
| | | | | | $ | 8,234,035 | |
| | | | | | | | |
| Computer Software – 1.0% | | | | | | | | |
| Dell Investments LLC/EMC Corp., 4.42%, 6/15/2021 | | $ | 3,089,000 | | | $ | 3,178,238 | |
| Dell Investments LLC/EMC Corp., 4%, 7/15/2024 (n) | | | 1,503,000 | | | | 1,573,398 | |
| | | | | | | | |
| | | | | | $ | 4,751,636 | |
| | | | | | | | |
11
MFS Limited Maturity Portfolio
Portfolio of Investments – continued
| | | | | | | | |
| | |
| Issuer | | Shares/Par | | | Value ($) | |
| BONDS – continued | | | | | | | | |
| Computer Software – Systems – 0.6% | | | | | |
| Apple, Inc., 1.7%, 9/11/2022 | | $ | 1,373,000 | | | $ | 1,371,309 | |
| Panasonic Corp., 2.536%, 7/19/2022 (n) | | | 1,430,000 | | | | 1,441,736 | |
| | | | | | | | |
| | | | | | $ | 2,813,045 | |
| | | | | | | | |
| Conglomerates – 2.0% | | | | | | | | |
| Roper Technologies, Inc., 2.8%, 12/15/2021 | | $ | 1,694,000 | | | $ | 1,718,735 | |
| United Technologies Corp., 3.1%, 6/01/2022 | | | 956,000 | | | | 980,061 | |
| United Technologies Corp., 3.65%, 8/16/2023 | | | 3,349,000 | | | | 3,527,940 | |
| Westinghouse Air Brake Technologies Corp., 4.4%, 3/15/2024 | | | 2,237,000 | | | | 2,374,980 | |
| Westinghouse Air Brake Technologies Corp., FLR, 3.193% (LIBOR - 3mo. + 1.05%), 9/15/2021 | | | 871,000 | | | | 871,132 | |
| | | | | | | | |
| | | | | | $ | 9,472,848 | |
| | | | | | | | |
| Consumer Products – 0.2% | | | | | | | | |
| Reckitt Benckiser Treasury Services PLC, 2.375%, 6/24/2022 (n) | | $ | 750,000 | | | $ | 755,226 | |
| | | | | | | | |
| | | | | | | | |
| Consumer Services – 0.7% | | | | | | | | |
| Alibaba Group Holding Ltd., 2.8%, 6/06/2023 | | $ | 1,223,000 | | | $ | 1,239,149 | |
| QVC, Inc., 5.125%, 7/02/2022 | | | 1,805,000 | | | | 1,898,353 | |
| | | | | | | | |
| | | | | | $ | 3,137,502 | |
| | | | | | | | |
| Electrical Equipment – 0.3% | | | | | | | | |
| Molex Electronic Technologies LLC, 2.878%, 4/15/2020 (n) | | $ | 1,198,000 | | | $ | 1,199,600 | |
| | | | | | | | |
| Electronics – 1.4% | | | | | | | | |
| Broadcom Corp./Broadcom Cayman Finance Ltd., 3%, 1/15/2022 | | $ | 3,369,000 | | | $ | 3,417,539 | |
| Broadcom, Inc., 3.125%, 4/15/2021 (n) | | | 1,222,000 | | | | 1,236,583 | |
| Microchip Technology, Inc., 3.922%, 6/01/2021 | | | 1,607,000 | | | | 1,643,080 | |
| | | | | | | | |
| | | | | | $ | 6,297,202 | |
| | | | | | | | |
| Emerging Market Quasi-Sovereign – 0.6% | | | | | |
| Bharat Petroleum Corp. Ltd., 4.625%, 10/25/2022 | | $ | 1,865,000 | | | $ | 1,936,709 | |
| Indian Oil Corp. Ltd., 5.75%, 8/01/2023 | | | 933,000 | | | | 1,014,302 | |
| | | | | | | | |
| | | | | | $ | 2,951,011 | |
| | | | | | | | |
| Energy – Integrated – 1.2% | | | | | | | | |
| BP Capital Markets PLC, 2.521%, 1/15/2020 | | $ | 1,371,000 | | | $ | 1,371,164 | |
| Cenovus Energy, Inc., 3%, 8/15/2022 | | | 2,319,000 | | | | 2,350,298 | |
| Cenovus Energy, Inc., 3.8%, 9/15/2023 | | | 738,000 | | | | 763,093 | |
| Eni S.p.A., 4%, 9/12/2023 (n) | | | 860,000 | | | | 906,606 | |
| | | | | | | | |
| | | | | | $ | 5,391,161 | |
| | | | | | | | |
| Entertainment – 0.3% | | | | | | | | |
| Royal Caribbean Cruises Ltd., 2.65%, 11/28/2020 | | $ | 1,207,000 | | | $ | 1,213,116 | |
| | | | | | | | |
| | | | | | | | |
| | |
| Issuer | | Shares/Par | | | Value ($) | |
| BONDS – continued | | | | | | | | |
| Financial Institutions – 2.7% | | | | | | | | |
| AerCap Ireland Capital Ltd., 4.45%, 12/16/2021 | | $ | 1,873,000 | | | $ | 1,951,557 | |
| Avolon Holdings Funding Ltd., 3.625%, 5/01/2022 (n) | | | 1,955,000 | | | | 2,003,093 | |
| Avolon Holdings Funding Ltd., 3.95%, 7/01/2024 (n) | | | 1,214,000 | | | | 1,265,109 | |
| Century Housing Corp., 3.995%, 11/01/2021 | | | 748,000 | | | | 770,254 | |
| GE Capital International Funding Co., 2.342%, 11/15/2020 | | | 6,578,000 | | | | 6,582,966 | |
| | | | | | | | |
| | | | | | $ | 12,572,979 | |
| | | | | | | | |
| Food & Beverages – 1.0% | | | | | | | | |
| Conagra Brands, Inc., 3.8%, 10/22/2021 | | $ | 1,197,000 | | | $ | 1,234,908 | |
| Conagra Brands, Inc., FLR, 2.703% (LIBOR - 3mo. + 0.75%), 10/22/2020 | | | 855,000 | | | | 855,078 | |
| Constellation Brands, Inc., FLR, 2.609% (LIBOR - 3mo. + 0.7%), 11/15/2021 | | | 852,000 | | | | 852,149 | |
| Diageo PLC, 3%, 5/18/2020 | | | 1,460,000 | | | | 1,465,928 | |
| | | | | | | | |
| | | | | | $ | 4,408,063 | |
| | | | | | | | |
| Gaming & Lodging – 0.4% | | | | | | | | |
| GLP Capital LP/GLP Financing II, Inc., 4.375%, 4/15/2021 | | $ | 201,000 | | | $ | 204,903 | |
| GLP Capital LP/GLP Financing II, Inc., 5.375%, 11/01/2023 | | | 1,459,000 | | | | 1,587,509 | |
| | | | | | | | |
| | | | | | $ | 1,792,412 | |
| | | | | | | | |
| Insurance – 0.3% | | | | | | | | |
| Metropolitan Life Global Funding I, 2%, 4/14/2020 (n) | | $ | 1,216,000 | | | $ | 1,216,215 | |
| | | | | | | | |
| Insurance – Health – 0.6% | | | | | | | | |
| UnitedHealth Group, Inc., 1.95%, 10/15/2020 | | $ | 2,580,000 | | | $ | 2,580,015 | |
| | | | | | | | |
| Insurance – Property & Casualty – 0.4% | | | | | |
| Aon PLC, 2.2%, 11/15/2022 | | $ | 874,000 | | | $ | 877,624 | |
| Marsh & McLennan Cos., Inc., 2.75%, 1/30/2022 | | | 860,000 | | | | 873,445 | |
| | | | | | | | |
| | | | | | $ | 1,751,069 | |
| | | | | | | | |
| International Market Quasi-Sovereign – 1.7% | | | | | |
| Caisse d’Amortissement de la Dette Sociale (Republic of France), 1.875%, 1/13/2020 (n) | | $ | 4,000,000 | | | $ | 4,000,030 | |
| Dexia Credit Local S.A. (Kingdom of Belgium), 2.25%, 2/18/2020 (n) | | | 3,880,000 | | | | 3,881,675 | |
| | | | | | | | |
| | | | | | $ | 7,881,705 | |
| | | | | | | | |
| Internet – 0.3% | | | | | | | | |
| Baidu, Inc., 3.875%, 9/29/2023 | | $ | 1,263,000 | | | $ | 1,316,064 | |
| | | | | | | | |
| Machinery & Tools – 0.6% | | | | | | | | |
| CNH Industrial Capital LLC, 4.2%, 1/15/2024 | | $ | 2,496,000 | | | $ | 2,642,212 | |
| | | | | | | | |
12
MFS Limited Maturity Portfolio
Portfolio of Investments – continued
| | | | | | | | |
| | |
| Issuer | | Shares/Par | | | Value ($) | |
| BONDS – continued | | | | | | | | |
| Major Banks – 11.0% | | | | | | | | |
| ABN AMRO Bank N.V., 2.65%, 1/19/2021 (n) | | $ | 2,079,000 | | | $ | 2,091,474 | |
| Bank of America Corp., 2.369%, 7/21/2021 | | | 2,408,000 | | | | 2,413,235 | |
| Bank of America Corp., 2.738%, 1/23/2022 | | | 1,454,000 | | | | 1,464,846 | |
| Bank of America Corp., 2.881%, 4/24/2023 | | | 3,106,000 | | | | 3,159,730 | |
| Bank of Montreal, 2.05%, 11/01/2022 | | | 1,266,000 | | | | 1,270,485 | |
| Barclays PLC, 4.61%, 2/15/2023 | | | 4,371,000 | | | | 4,563,802 | |
| Citibank N.A., 2.125%, 10/20/2020 | | | 2,381,000 | | | | 2,383,767 | |
| Credit Agricole, “A”, FLR, 3.439% (LIBOR - 3mo. + 1.43%), 1/10/2022 (n) | | | 1,270,000 | | | | 1,292,398 | |
| Credit Suisse Group AG, 3.8%, 9/15/2022 | | | 1,027,000 | | | | 1,068,704 | |
| Credit Suisse Group AG, 3.574%, 1/09/2023 (n) | | | 2,020,000 | | | | 2,074,450 | |
| Goldman Sachs Group, Inc., 3%, 4/26/2022 | | | 2,470,000 | | | | 2,500,396 | |
| HSBC Holdings PLC, 3.262% to 3/13/2022, FLR (LIBOR - 3mo. + 1.055%) to 3/13/2023 | | | 1,745,000 | | | | 1,784,137 | |
| HSBC Holdings PLC, 3.033% to 11/22/2022, FLR (LIBOR - 3mo. + 0.923%) to 11/22/2023 | | | 1,294,000 | | | | 1,323,475 | |
| JPMorgan Chase & Co., 3.207% to 4/01/2022, FLR (LIBOR - 3mo. + 0.695%) to 4/01/2023 | | | 3,030,000 | | | | 3,101,135 | |
| JPMorgan Chase & Co., 2.776% to 4/25/2022, FLR (LIBOR - 3mo. + 0.935%) to 4/25/2023 | | | 2,896,000 | | | | 2,940,630 | |
| Mitsubishi UFJ Financial Group, Inc., 2.95%, 3/01/2021 | | | 771,000 | | | | 779,207 | |
| Mitsubishi UFJ Financial Group, Inc., 3.535%, 7/26/2021 | | | 1,749,000 | | | | 1,789,456 | |
| Mitsubishi UFJ Financial Group, Inc., 2.623%, 7/18/2022 | | | 2,145,000 | | | | 2,173,252 | |
| Morgan Stanley, 2.65%, 1/27/2020 | | | 2,300,000 | | | | 2,300,755 | |
| NatWest Markets PLC, 3.625%, 9/29/2022 (n) | | | 895,000 | | | | 926,738 | |
| Royal Bank of Scotland Group PLC, 4.269% to 3/22/2024, FLR (LIBOR - 3mo. + 1.762%) to 3/22/2025 | | | 1,367,000 | | | | 1,451,251 | |
| UBS Group Funding (Switzerland) AG, 3.491%, 5/23/2023 (n) | | | 4,518,000 | | | | 4,647,505 | |
| UBS Group Funding Ltd., 3%, 4/15/2021 (n) | | | 1,590,000 | | | | 1,610,880 | |
| UniCredito Italiano S.p.A., 3.75%, 4/12/2022 (n) | | | 1,687,000 | | | | 1,728,095 | |
| | | | | | | | |
| | | | | | $ | 50,839,803 | |
| | | | | | | | |
| Medical & Health Technology & Services – 0.9% | | | | | |
| Becton, Dickinson and Co., 2.404%, 6/05/2020 | | $ | 1,234,000 | | | $ | 1,235,308 | |
| Becton, Dickinson and Co., 2.894%, 6/06/2022 | | | 1,367,000 | | | | 1,389,131 | |
| Cigna Corp., FLR, 2.549% (LIBOR - 3mo. + 0.65%), 9/17/2021 | | | 1,734,000 | | | | 1,734,097 | |
| | | | | | | | |
| | | | | | $ | 4,358,536 | |
| | | | | | | | |
| Medical Equipment – 0.4% | | | | | | | | |
| Zimmer Biomet Holdings, Inc., 2.7%, 4/01/2020 | | $ | 1,289,000 | | | $ | 1,289,836 | |
| | | | | | | | |
| | |
| Issuer | | Shares/Par | | | Value ($) | |
| BONDS – continued | | | | | | | | |
| Medical Equipment – continued | | | | | | | | |
| Zimmer Biomet Holdings, Inc., FLR, 2.652% (LIBOR - 3mo. + 0.75%), 3/19/2021 | | $ | 511,000 | | | $ | 511,050 | |
| | | | | | | | |
| | | | | | $ | 1,800,886 | |
| | | | | | | | |
| Metals & Mining – 1.2% | | | | | | | | |
| Glencore Finance (Canada) Ltd., 4.95%, 11/15/2021 (n) | | $ | 899,000 | | | $ | 940,149 | |
| Glencore Funding LLC, 3%, 10/27/2022 (n) | | | 886,000 | | | | 888,539 | |
| Glencore Funding LLC, 4.125%, 3/12/2024 (n) | | | 1,354,000 | | | | 1,417,062 | |
| Steel Dynamics, Inc., 4.125%, 9/15/2025 | | | 2,420,000 | | | | 2,486,219 | |
| | | | | | | | |
| | | | | | $ | 5,731,969 | |
| | | | | | | | |
| Midstream – 1.5% | | | | | | | | |
| Kinder Morgan (Delaware), Inc., 6.5%, 9/15/2020 | | $ | 2,578,000 | | | $ | 2,656,716 | |
| MPLX LP, 3.5%, 12/01/2022 (n) | | | 2,340,000 | | | | 2,407,825 | |
| MPLX LP, 3.375%, 3/15/2023 | | | 690,000 | | | | 708,195 | |
| MPLX LP, FLR, 2.785% (LIBOR - 3mo. + 0.9%), 9/09/2021 | | | 961,000 | | | | 963,941 | |
| | | | | | | | |
| | | | | | $ | 6,736,677 | |
| | | | | | | | |
| Mortgage-Backed – 1.6% | | | | | | | | |
| Fannie Mae, 5.5%, 5/01/2025 | | $ | 16,546 | | | $ | 16,864 | |
| Fannie Mae, 5%, 7/01/2039 - 3/01/2042 | | | 1,010,839 | | | | 1,113,384 | |
| Fannie Mae, 2%, 5/25/2044 | | | 1,974,924 | | | | 1,967,371 | |
| Freddie Mac, 0.879%, 4/25/2024 (i) | | | 620,380 | | | | 18,681 | |
| Freddie Mac, 3%, 4/15/2033 - 6/15/2045 | | | 3,425,170 | | | | 3,521,930 | |
| Freddie Mac, 2%, 7/15/2042 | | | 669,287 | | | | 666,120 | |
| | | | | | | | |
| | | | | | $ | 7,304,350 | |
| | | | | | | | |
| Municipals – 1.1% | | | | | | | | |
| New Jersey Economic Development Authority State Pension Funding Rev., Capital Appreciation, “B”, 0%, 2/15/2023 | | $ | 4,091,000 | | | $ | 3,792,316 | |
| New Jersey Transportation Trust Fund Authority, Transportation System, “B”, 2.384%, 6/15/2022 | | | 455,000 | | | | 456,729 | |
| New Jersey Transportation Trust Fund Authority, Transportation System, “B”, 2.551%, 6/15/2023 | | | 465,000 | | | | 466,395 | |
| New Jersey Transportation Trust Fund Authority, Transportation System, “B”, 2.631%, 6/15/2024 | | | 440,000 | | | | 441,417 | |
| | | | | | | | |
| | | | | | $ | 5,156,857 | |
| | | | | | | | |
| Network & Telecom – 0.3% | | | | | | | | |
| AT&T, Inc., 3.2%, 3/01/2022 | | $ | 1,291,000 | | | $ | 1,321,872 | |
| | | | | | | | |
| Oils – 0.7% | | | | | | | | |
| Marathon Petroleum Corp., 4.75%, 12/15/2023 | | $ | 2,018,000 | | | $ | 2,191,564 | |
| Phillips 66, FLR, 2.517% (LIBOR - 3mo. + 0.6%), 2/26/2021 | | | 1,196,000 | | | | 1,196,072 | |
| | | | | | | | |
| | | | | | $ | 3,387,636 | |
| | | | | | | | |
| Other Banks & Diversified Financials – 4.5% | | | | | |
| American Express Co., 3.7%, 11/05/2021 | | $ | 1,704,000 | | | $ | 1,755,508 | |
| Banque Federative du Credit Mutuel S.A., 2.2%, 7/20/2020 (n) | | | 2,614,000 | | | | 2,616,286 | |
13
MFS Limited Maturity Portfolio
Portfolio of Investments – continued
| | | | | | | | |
| | |
| Issuer | | Shares/Par | | | Value ($) | |
| BONDS – continued | | | | | | | | |
| Other Banks & Diversified Financials – continued | |
| BBVA USA, 3.5%, 6/11/2021 | | $ | 1,920,000 | | | $ | 1,952,878 | |
| BBVA USA, 2.875%, 6/29/2022 | | | 2,717,000 | | | | 2,754,506 | |
| BBVA USA Bancshares, Inc., 2.5%, 8/27/2024 | | | 1,183,000 | | | | 1,172,400 | |
| Citigroup, Inc., 2.4%, 2/18/2020 | | | 4,151,000 | | | | 4,152,670 | |
| Groupe BPCE S.A., 4%, 9/12/2023 (n) | | | 1,385,000 | | | | 1,459,398 | |
| Groupe BPCE S.A., FLR, 3.127% (LIBOR - 3mo. + 1.24%), 9/12/2023 (n) | | | 1,385,000 | | | | 1,405,692 | |
| National Bank of Canada, 2.15%, 10/07/2022 (n) | | | 1,348,000 | | | | 1,346,981 | |
| Truist Financial Corp., 2.8%, 5/17/2022 | | | 2,209,000 | | | | 2,250,128 | |
| | | | | | | | |
| | | | | | $ | 20,866,447 | |
| | | | | | | | |
| Pharmaceuticals – 2.0% | | | | | | | | |
| AbbVie, Inc., 2.15%, 11/19/2021 (n) | | $ | 874,000 | | | $ | 875,608 | |
| AbbVie, Inc., 2.3%, 11/21/2022 (n) | | | 874,000 | | | | 878,146 | |
| Allergan Funding SCS, 3.45%, 3/15/2022 | | | 886,000 | | | | 905,988 | |
| Bayer U.S. Finance II LLC, 3.5%, 6/25/2021 (n) | | | 3,162,000 | | | | 3,218,971 | |
| Bristol-Myers Squibb Co., 2.875%, 8/15/2020 (n) | | | 1,091,000 | | | | 1,096,978 | |
| Bristol-Myers Squibb Co., 2.75%, 2/15/2023 (n) | | | 1,806,000 | | | | 1,839,534 | |
| Bristol-Myers Squibb Co., FLR, 2.284% | | | | | | | | |
| (LIBOR - 3mo. + 0.38%), 5/16/2022 (n) | | | 444,000 | | | | 445,435 | |
| | | | | | | | |
| | | | | | $ | 9,260,660 | |
| | | | | | | | |
| Printing & Publishing – 0.4% | | | | | | | | |
| Moody’s Corp., 3.25%, 6/07/2021 | | $ | 1,626,000 | | | $ | 1,655,659 | |
| | | | | | | | |
| Retailers – 0.1% | | | | | | | | |
| Macy’s Retail Holdings, Inc., 3.875%, 1/15/2022 | | $ | 352,000 | | | $ | 358,623 | |
| | | | | | | | |
| Telecommunications – Wireless – 1.4% | | | | | |
| American Tower Corp., REIT, 2.8%, 6/01/2020 | | $ | 857,000 | | | $ | 859,466 | |
| American Tower Corp., REIT, 2.25%, 1/15/2022 | | | 500,000 | | | | 501,425 | |
| American Tower Corp., REIT, 3%, 6/15/2023 | | | 2,118,000 | | | | 2,167,759 | |
| Crown Castle International Corp., 3.4%, 2/15/2021 | | | 1,000,000 | | | | 1,013,440 | |
| Crown Castle International Corp., 3.15%, 7/15/2023 | | | 1,093,000 | | | | 1,127,246 | |
| SBA Tower Trust, 2.877%, 7/09/2021 (n) | | | 629,000 | | | | 630,971 | |
| | | | | | | | |
| | | | | | $ | 6,300,307 | |
| | | | | | | | |
| Tobacco – 0.9% | | | | | | | | |
| B.A.T Capital Corp., 2.764%, 8/15/2022 | | $ | 756,000 | | | $ | 766,767 | |
| Imperial Tobacco Finance PLC, 2.95%, 7/21/2020 (n) | | | 1,343,000 | | | | 1,346,766 | |
| Imperial Tobacco Finance PLC, 3.75%, 7/21/2022 (n) | | | 2,045,000 | | | | 2,104,655 | |
| | | | | | | | |
| | | | | | $ | 4,218,188 | |
| | | | | | | | |
| | | | | | | | |
| | |
| Issuer | | Shares/Par | | | Value ($) | |
| BONDS – continued | | | | | | | | |
| Transportation – Services – 0.9% | | | | | | | | |
| Adani Ports & Special Economic Zone Ltd., 3.95%, 1/19/2022 | | $ | 2,656,000 | | | $ | 2,719,463 | |
| TTX Co., 2.6%, 6/15/2020 (n) | | | 1,660,000 | | | | 1,663,179 | |
| | | | | | | | |
| | | | | | $ | 4,382,642 | |
| | | | | | | | |
| U.S. Government Agencies and Equivalents – 0.3% | |
| National Credit Union Administration,“1-A”, FLR, 2.163% (LIBOR - 1mo. + 0.45%), 1/08/2020 | | $ | 294,860 | | | $ | 294,867 | |
| National Credit Union Administration, FLR, 2.117% (LIBOR - 1mo. + 0.4%), 3/11/2020 | | | 530,909 | | | | 530,908 | |
| National Credit Union Administration, FLR, 2.163% (LIBOR - 1mo. + 0.45%), 10/07/2020 | | | 174,174 | | | | 174,495 | |
| National Credit Union Administration, FLR, 2.067% (LIBOR - 1mo. + 0.35%), 12/07/2020 | | | 335,919 | | | | 335,817 | |
| | | | | | | | |
| | | | | | $ | 1,336,087 | |
| | | | | | | | |
| U.S. Treasury Obligations – 11.8% | | | | | |
| U.S. Treasury Notes, 2.625%, 12/15/2021 | | $ | 5,500,000 | | | $ | 5,607,578 | |
| U.S. Treasury Notes, 1.875%, 2/28/2022 (f) | | | 28,239,000 | | | | 28,402,181 | |
| U.S. Treasury Notes, 2.375%, 1/31/2023 | | | 20,154,000 | | | | 20,599,264 | |
| | | | | | | | |
| | | | | | $ | 54,609,023 | |
| | | | | | | | |
| Utilities – Electric Power – 3.2% | | | | | | | | |
| Dominion Energy, Inc., 2.579%, 7/01/2020 | | $ | 1,761,000 | | | $ | 1,764,635 | |
| Emera U.S. Finance LP, 2.7%, 6/15/2021 | | | 503,000 | | | | 507,553 | |
| Enel Finance International N.V., 2.875%, 5/25/2022 (n) | | | 2,670,000 | | | | 2,703,232 | |
| Engie Energia Chile S.A., 5.625%, 1/15/2021 | | | 3,341,000 | | | | 3,443,337 | |
| FirstEnergy Corp., 2.85%, 7/15/2022 | | | 856,000 | | | | 869,561 | |
| Florida Power & Light Co., FLR, 2.308% (LIBOR - 3mo. + 0.4%), 5/06/2022 | | | 1,486,000 | | | | 1,486,045 | |
| NextEra Energy, Inc., 2.9%, 4/01/2022 | | | 1,516,000 | | | | 1,546,574 | |
| WEC Energy Group, Inc., 3.375%, 6/15/2021 | | | 1,635,000 | | | | 1,667,650 | |
| WEC Energy Group, Inc., 3.1%, 3/08/2022 | | | 875,000 | | | | 893,318 | |
| | | | | | | | |
| | | | | | $ | 14,881,905 | |
| | | | | | | | |
Total Bonds
(Identified Cost, $447,727,657) | | | $ | 453,018,044 | |
| | | | | | | | |
|
| INVESTMENT COMPANIES (h) – 1.1% | |
| Money Market Funds – 1.1% | | | | | | | | |
| MFS Institutional Money Market Portfolio, 1.7% (v) (Identified Cost, $5,138,866) | | | 5,138,857 | | | $ | 5,138,857 | |
| | | | | | | | |
OTHER ASSETS, LESS
LIABILITIES – 0.6% | | | | | | | 2,711,838 | |
| | | | | | | | |
| NET ASSETS – 100.0% | | | | | | $ | 460,868,739 | |
| | | | | | | | |
14
MFS Limited Maturity Portfolio
Portfolio of Investments – continued
| (f) | | All or a portion of the security has been segregated as collateral for open futures contracts and cleared swap agreements. |
| (h) | | An affiliated issuer, which may be considered one in which the fund owns 5% or more of the outstanding voting securities, or a company which is under common control. At period end, the aggregate values of the fund’s investments in affiliated issuers and in unaffiliated issuers were $5,138,857 and $453,018,044, respectively. |
| (i) | | Interest only security for which the fund receives interest on notional principal (Par amount). Par amount shown is the notional principal and does not reflect the cost of the security. |
| (n) | | Securities exempt from registration under Rule 144A of the Securities Act of 1933. These securities may be sold in the ordinary course of business in transactions exempt from registration, normally to qualified institutional buyers. At period end, the aggregate value of these securities was $203,567,824, representing 44.2% of net assets. |
| (v) | | Affiliated issuer that is available only to investment companies managed by MFS. The rate quoted for the MFS Institutional Money Market Portfolio is the annualizedseven-day yield of the fund at period end. |
The following abbreviations are used in this report and are defined:
| CLO | | Collateralized Loan Obligation |
| FLR | | Floating Rate. Interest rate resets periodically based on the parenthetically disclosed reference rate plus a spread (if any). Theperiod-end rate reported may not be the current rate. All reference rates are USD unless otherwise noted. |
| LIBOR | | London Interbank Offered Rate |
| REIT | | Real Estate Investment Trust |
Derivative Contracts at 12/31/19
Futures Contracts
| | | | | | | | | | | | | | | | | | | | | | |
| Description | | Long/ Short | | | Currency | | | Contracts | | Notional Amount | | | Expiration Date | | | Value/Unrealized Appreciation (Depreciation) | |
| Liability Derivatives | | | | | | | | | | | | | | | | | | | | | | |
| Interest Rate Futures | | | | | | | | | | | | | | | | | | | | | | |
| U.S. Treasury Note 2 yr | | | Long | | | | USD | | | 153 | | | $32,971,500 | | | | March - 2020 | | | | $(27,004 | ) |
| | | | | | | | | | | | | | | | | | | | | | |
Cleared Swap Agreements
| | | | | | | | | | | | | | | | | | | | | | |
Maturity
Date | | Notional
Amount | | | Counterparty | | Cash Flows to Receive/
Frequency | | Cash Flows to Pay/ Frequency | | Unrealized
Appreciation
(Depreciation) | | | Net Unamortized
Upfront Payments
(Receipts) | | | Value | |
| Asset Derivatives | | | | | | | | | | | | | | | | | | | |
| Interest Rate Swaps | | | | | | | | | | | | | | | | | | | |
| 7/15/21 | | USD | 38,000,000 | | | centrally cleared | | 1.88%/Semi-annually | | 2.00% FLR (3-Month LIBOR)/ Quarterly | | | $264,422 | | | | $— | | | | $264,422 | |
| 9/19/21 | | USD | 23,300,000 | | | centrally cleared | | 1.57%/Semi-annually | | 1.73% FLR (1-Month LIBOR)/ Monthly | | | 87,462 | | | | — | | | | 87,462 | |
| | | | | | | | | | | | | | | | | | | | | | |
| | | | | | | | | | | | | $351,884 | | | | $— | | | | $351,884 | |
| | | | | | | | | | | | | | | | | | | | | | |
At December 31, 2019, the fund had liquid securities with an aggregate value of $426,504 to cover any collateral or margin obligations for certain derivative contracts.
See Notes to Financial Statements
15
MFS Limited Maturity Portfolio
FINANCIAL STATEMENTS | STATEMENT OF ASSETS AND LIABILITIES
This statement represents your fund’s balance sheet, which details the assets and liabilities comprising the total value of the fund.
| | | | |
At 12/31/19 | | | | |
| |
Assets | | | | |
Investments in unaffiliated issuers, at value (identified cost, $447,727,657) | | | $453,018,044 | |
Investments in affiliated issuers, at value (identified cost, $5,138,866) | | | 5,138,857 | |
Cash | | | 11,370 | |
Receivables for | | | | |
Net daily variation margin on open futures contracts | | | 7,156 | |
Fund shares sold | | | 16,020 | |
Interest | | | 3,005,717 | |
Other assets | | | 2,533 | |
Total assets | | | $461,199,697 | |
| |
Liabilities | | | | |
Payables for | | | | |
Net daily variation margin on open cleared swap agreements | | | $5,306 | |
Fund shares reacquired | | | 222,271 | |
Payable to affiliates | | | | |
Investment adviser | | | 9,845 | |
Administrative services fee | | | 375 | |
Shareholder servicing costs | | | 13 | |
Distribution and/or service fees | | | 1,608 | |
Payable for independent Trustees’ compensation | | | 62 | |
Accrued expenses and other liabilities | | | 91,478 | |
Total liabilities | | | $330,958 | |
Net assets | | | $460,868,739 | |
| |
Net assets consist of | | | | |
Paid-in capital | | | $445,042,675 | |
Total distributable earnings (loss) | | | 15,826,064 | |
Net assets | | | $460,868,739 | |
Shares of beneficial interest outstanding | | | 44,582,635 | |
| | | | | | | | | | | | |
| | | |
| | | Net assets | | | Shares
outstanding | | | Net asset value
per share | |
Initial Class | | | $343,507,213 | | | | 33,224,572 | | | | $10.34 | |
Service Class | | | 117,361,526 | | | | 11,358,063 | | | | 10.33 | |
See Notes to Financial Statements
16
MFS Limited Maturity Portfolio
FINANCIAL STATEMENTS | STATEMENT OF OPERATIONS
This statement describes how much your fund earned in investment income and accrued in expenses. It also describes any gains and/or losses generated by fund operations.
| | | | |
Year ended 12/31/19 | | | | |
| |
Net investment income (loss) | | | | |
Income | | | | |
Interest | | | $15,227,510 | |
Dividends from affiliated issuers | | | 103,250 | |
Other | | | 2,992 | |
Total investment income | | | $15,333,752 | |
Expenses | | | | |
Management fee | | | $1,883,559 | |
Distribution and/or service fees | | | 296,785 | |
Shareholder servicing costs | | | 3,886 | |
Administrative services fee | | | 74,093 | |
Independent Trustees’ compensation | | | 10,610 | |
Custodian fee | | | 27,120 | |
Shareholder communications | | | 29,699 | |
Audit and tax fees | | | 66,095 | |
Legal fees | | | 3,988 | |
Miscellaneous | | | 36,043 | |
Total expenses | | | $2,431,878 | |
Reduction of expenses by investment adviser | | | (45,942 | ) |
Net expenses | | | $2,385,936 | |
Net investment income (loss) | | | $12,947,816 | |
| |
Realized and unrealized gain (loss) | | | | |
| Realized gain (loss) (identified cost basis) | | | | |
Unaffiliated issuers | | | $592,638 | |
Affiliated issuers | | | 877 | |
Futures contracts | | | 194,110 | |
Swap agreements | | | (337,045 | ) |
Net realized gain (loss) | | | $450,580 | |
| Change in unrealized appreciation or depreciation | | | | |
Unaffiliated issuers | | | $10,010,748 | |
Affiliated issuers | | | (9 | ) |
Futures contracts | | | (119,313 | ) |
Swap agreements | | | 351,884 | |
Net unrealized gain (loss) | | | $10,243,310 | |
Net realized and unrealized gain (loss) | | | $10,693,890 | |
Change in net assets from operations | | | $23,641,706 | |
See Notes to Financial Statements
17
MFS Limited Maturity Portfolio
FINANCIAL STATEMENTS | STATEMENTS OF CHANGES IN NET ASSETS
These statements describe the increases and/or decreases in net assets resulting from operations, any distributions, and any shareholder transactions.
| | | | | | | | |
| | | Year ended | |
| | | 12/31/19 | | | 12/31/18 | |
Change in net assets | | | | | | | | |
| | |
From operations | | | | | | | | |
Net investment income (loss) | | | $12,947,816 | | | | $12,096,002 | |
Net realized gain (loss) | | | 450,580 | | | | (2,323,436 | ) |
Net unrealized gain (loss) | | | 10,243,310 | | | | (3,773,224 | ) |
Change in net assets from operations | | | $23,641,706 | | | | $5,999,342 | |
Total distributions to shareholders | | | $(12,198,184 | ) | | | $(10,355,191 | ) |
Change in net assets from fund share transactions | | | $(28,281,631 | ) | | | $(94,953,212 | ) |
Total change in net assets | | | $(16,838,109 | ) | | | $(99,309,061 | ) |
| | |
Net assets | | | | | | | | |
At beginning of period | | | 477,706,848 | | | | 577,015,909 | |
At end of period | | | $460,868,739 | | | | $477,706,848 | |
See Notes to Financial Statements
18
MFS Limited Maturity Portfolio
FINANCIAL STATEMENTS | FINANCIAL HIGHLIGHTS
The financial highlights table is intended to help you understand the fund’s financial performance for the past 5 years. Certain information reflects financial results for a single fund share. The total returns in the table represent the rate that an investor would have earned (or lost) on an investment in the fund share class (assuming reinvestment of all distributions) held for the entire period.
| | | | | | | | | | | | | | | | | | | | |
| Initial Class | | Year ended | |
| | | | | |
| | | 12/31/19 | | | 12/31/18 | | | 12/31/17 | | | 12/31/16 | | | 12/31/15 | |
| | | | | |
Net asset value, beginning of period | | | $10.10 | | | | $10.18 | | | | $10.17 | | | | $10.14 | | | | $10.23 | |
| | | | | |
| Income (loss) from investment operations | | | | | | | | | | | | | | | | | | | | |
Net investment income (loss) (d) | | | $0.29 | | | | $0.23 | | | | $0.18 | | | | $0.15 | (c) | | | $0.12 | |
Net realized and unrealized gain (loss) | | | 0.23 | | | | (0.10 | ) | | | (0.00 | )(w) | | | 0.02 | | | | (0.07 | ) |
Total from investment operations | | | $0.52 | | | | $0.13 | | | | $0.18 | | | | $0.17 | | | | $0.05 | |
| | | | | |
| Less distributions declared to shareholders | | | | | | | | | | | | | | | | | | | | |
From net investment income | | | $(0.28 | ) | | | $(0.21 | ) | | | $(0.17 | ) | | | $(0.14 | ) | | | $(0.14 | ) |
Net asset value, end of period (x) | | | $10.34 | | | | $10.10 | | | | $10.18 | | | | $10.17 | | | | $10.14 | |
Total return (%) (k)(r)(s)(x) | | | 5.19 | | | | 1.28 | | | | 1.73 | | | | 1.68 | (c) | | | 0.48 | |
| | | | | |
Ratios (%) (to average net assets)
and Supplemental data: | | | | | | | | | | | | | | | | | | | | |
Expenses before expense reductions (f) | | | 0.45 | | | | 0.45 | | | | 0.45 | | | | 0.42 | (c) | | | 0.45 | |
Expenses after expense reductions (f) | | | 0.44 | | | | 0.44 | | | | 0.45 | | | | 0.42 | (c) | | | 0.44 | |
Net investment income (loss) | | | 2.81 | | | | 2.31 | | | | 1.77 | | | | 1.43 | (c) | | | 1.13 | |
Portfolio turnover | | | 39 | | | | 62 | | | | 54 | | | | 30 | | | | 26 | |
Net assets at end of period (000 omitted) | | | $343,507 | | | | $359,909 | | | | $434,320 | | | | $473,730 | | | | $520,750 | |
| |
| Service Class | | Year ended | |
| | | | | |
| | | 12/31/19 | | | 12/31/18 | | | 12/31/17 | | | 12/31/16 | | | 12/31/15 | |
| | | | | |
Net asset value, beginning of period | | | $10.09 | | | | $10.17 | | | | $10.16 | | | | $10.12 | | | | $10.20 | |
| | | | | |
| Income (loss) from investment operations | | | | | | | | | | | | | | | | | | | | |
Net investment income (loss) (d) | | | $0.26 | | | | $0.21 | | | | $0.16 | | | | $0.12 | (c) | | | $0.09 | |
Net realized and unrealized gain (loss) | | | 0.23 | | | | (0.11 | ) | | | (0.01 | ) | | | 0.03 | | | | (0.06 | ) |
Total from investment operations | | | $0.49 | | | | $0.10 | | | | $0.15 | | | | $0.15 | | | | $0.03 | |
| | | | | |
| Less distributions declared to shareholders | | | | | | | | | | | | | | | | | | | | |
From net investment income | | | $(0.25 | ) | | | $(0.18 | ) | | | $(0.14 | ) | | | $(0.11 | ) | | | $(0.11 | ) |
Net asset value, end of period (x) | | | $10.33 | | | | $10.09 | | | | $10.17 | | | | $10.16 | | | | $10.12 | |
Total return (%) (k)(r)(s)(x) | | | 4.90 | | | | 0.99 | | | | 1.45 | | | | 1.48 | (c) | | | 0.28 | |
| | | | | |
Ratios (%) (to average net assets)
and Supplemental data: | | | | | | | | | | | | | | | | | | | | |
Expenses before expense reductions (f) | | | 0.70 | | | | 0.70 | | | | 0.70 | | | | 0.68 | (c) | | | 0.70 | |
Expenses after expense reductions (f) | | | 0.69 | | | | 0.69 | | | | 0.70 | | | | 0.67 | (c) | | | 0.69 | |
Net investment income (loss) | | | 2.56 | | | | 2.06 | | | | 1.52 | | | | 1.18 | (c) | | | 0.88 | |
Portfolio turnover | | | 39 | | | | 62 | | | | 54 | | | | 30 | | | | 26 | |
Net assets at end of period (000 omitted) | | | $117,362 | | | | $117,798 | | | | $142,696 | | | | $153,979 | | | | $172,581 | |
See Notes to Financial Statements
19
MFS Limited Maturity Portfolio
Financial Highlights – continued
| (c) | | Amount reflects aone-time reimbursement of expenses by the custodian (or former custodian) without which net investment income and performance would be lower and expenses would be higher. |
| (d) | | Per share data is based on average shares outstanding. |
| (f) | | Ratios do not reflect reductions from fees paid indirectly, if applicable. |
| (k) | | The total return does not reflect expenses that apply to separate accounts. Inclusion of these charges would reduce the total return figures for all periods shown. |
| (r) | | Certain expenses have been reduced without which performance would have been lower. |
| (s) | | From time to time the fund may receive proceeds from litigation settlements, without which performance would be lower. |
| (w) | | Per share amount was less than $0.01. |
| (x) | | The net asset values and total returns have been calculated on net assets which include adjustments made in accordance with U.S. generally accepted accounting principles required at period end for financial reporting purposes. |
See Notes to Financial Statements
20
MFS Limited Maturity Portfolio
NOTES TO FINANCIAL STATEMENTS
| (1) | | Business and Organization |
MFS Limited Maturity Portfolio (the fund) is a diversified series of MFS Variable Insurance Trust III (the trust). The trust is organized as a Delaware statutory trust and is registered under the Investment Company Act of 1940, as amended, as anopen-end management investment company. The shareholders of each series of the trust are separate accounts of insurance companies, which offer variable annuity and/or life insurance products, and qualified retirement and pension plans.
The fund is an investment company and accordingly follows the investment company accounting and reporting guidance of the Financial Accounting Standards Board (FASB) Accounting Standards Codification Topic 946 Financial Services – Investment Companies.
| (2) | | Significant Accounting Policies |
General– The preparation of financial statements in conformity with U.S. generally accepted accounting principles requires management to make estimates and assumptions that affect the reported amounts of assets and liabilities, and disclosure of contingent assets and liabilities at the date of the financial statements and the reported amounts of increases and decreases in net assets from operations during the reporting period. Actual results could differ from those estimates. In the preparation of these financial statements, management has evaluated subsequent events occurring after the date of the fund’s Statement of Assets and Liabilities through the date that the financial statements were issued. The fund invests in foreign securities. Investments in foreign securities are vulnerable to the effects of changes in the relative values of the local currency and the U.S. dollar and to the effects of changes in each country’s market, economic, industrial, political, regulatory, geopolitical, and other conditions.
In March 2017, the FASB issued Accounting Standards Update2017-08, Receivables – Nonrefundable Fees and Other Costs (Subtopic310-20) – Premium Amortization on Purchased Callable Debt Securities (“ASU2017-08”). For callable debt securities purchased at a premium that have explicit,non-contingent call features and that are callable at fixed prices on preset dates,ASU 2017-08 requires the premium to be amortized to the earliest call date. The fund adopted ASU2017-08 as of the beginning of the reporting period on a modified retrospective basis. The adoption resulted in a change in accounting principle, since the fund had historically amortized such premiums to maturity for U.S. GAAP. As a result of the adoption, the fund recognized a cumulative effect adjustment that decreased the beginning of period cost of investments and increased the unrealized appreciation on investments by offsetting amounts. Adoption had no impact on the fund’s net assets or any prior period information presented in the financial statements. With respect to the fund’s results of operations, amortization of premium to first call date under ASU2017-08 accelerates amortization with the intent of more closely aligning the recognition of income on such bonds with the economics of the instrument.
Balance Sheet Offsetting– The fund’s accounting policy with respect to balance sheet offsetting is that, absent an event of default by the counterparty or a termination of the agreement, the International Swaps and Derivatives Association (ISDA) Master Agreement, or similar agreement, does not result in an offset of reported amounts of financial assets and financial liabilities in the Statement of Assets and Liabilities across transactions between the fund and the applicable counterparty. The fund’s right to setoff may be restricted or prohibited by the bankruptcy or insolvency laws of the particular jurisdiction to which a specific master netting agreement counterparty is subject. Balance sheet offsetting disclosures, to the extent applicable to the fund, have been included in the fund’s Significant Accounting Policies note under the captions for each of the fund’sin-scope financial instruments and transactions.
Investment Valuations– Debt instruments and floating rate loans, including restricted debt instruments, are generally valued at an evaluated or composite bid as provided by a third-party pricing service. Short-term instruments with a maturity at issuance of 60 days or less may be valued at amortized cost, which approximates market value. Futures contracts are generally valued at last posted settlement price on their primary exchange as provided by a third-party pricing service. Futures contracts for which there were no trades that day for a particular position are generally valued at the closing bid quotation on their primary exchange as provided by a third-party pricing service. Swap agreements are generally valued using valuations provided by a third-party pricing service, which for cleared swaps includes an evaluation of any trading activity at the clearinghouses.Open-end investment companies are generally valued at net asset value per share. Securities and other assets generally valued on the basis of information from a third-party pricing service may also be valued at a broker/dealer bid quotation. In determining values, third-party pricing services can utilize both transaction data and market information such as yield, quality, coupon rate, maturity, type of issue, trading characteristics, and other market data. The values of foreign securities and other assets and liabilities expressed in foreign currencies are converted to U.S. dollars using the mean of bid and asked prices for rates provided by a third-party pricing service.
The Board of Trustees has delegated primary responsibility for determining or causing to be determined the value of the fund’s investments (including any fair valuation) to the adviser pursuant to valuation policies and procedures approved by the Board. If the adviser determines that reliable market quotations are not readily available, investments are valued at fair value as determined in good faith by the adviser in accordance with such procedures under the oversight of the Board of Trustees. Under the fund’s valuation policies and procedures, market quotations are not considered to be readily available for most types of debt instruments and floating rate loans and many types of derivatives. These investments are generally valued at fair value based on information from
21
MFS Limited Maturity Portfolio
Notes to Financial Statements – continued
third-party pricing services. In addition, investments may be valued at fair value if the adviser determines that an investment’s value has been materially affected by events occurring after the close of the exchange or market on which the investment is principally traded (such as foreign exchange or market) and prior to the determination of the fund’s net asset value, or after the halt of trading of a specific security where trading does not resume prior to the close of the exchange or market on which the security is principally traded. The adviser generally relies on third-party pricing services or other information (such as the correlation with price movements of similar securities in the same or other markets; the type, cost and investment characteristics of the security; the business and financial condition of the issuer; and trading and other market data) to assist in determining whether to fair value and at what value to fair value an investment. The value of an investment for purposes of calculating the fund’s net asset value can differ depending on the source and method used to determine value. When fair valuation is used, the value of an investment used to determine the fund’s net asset value may differ from quoted or published prices for the same investment. There can be no assurance that the fund could obtain the fair value assigned to an investment if it were to sell the investment at the same time at which the fund determines its net asset value per share.
Various inputs are used in determining the value of the fund’s assets or liabilities. These inputs are categorized into three broad levels. In certain cases, the inputs used to measure fair value may fall into different levels of the fair value hierarchy. In such cases, an investment’s level within the fair value hierarchy is based on the lowest level of input that is significant to the fair value measurement. The fund’s assessment of the significance of a particular input to the fair value measurement in its entirety requires judgment, and considers factors specific to the investment. Level 1 includes unadjusted quoted prices in active markets for identical assets or liabilities. Level 2 includes other significant observable market-based inputs (including quoted prices for similar securities, interest rates, prepayment speed, and credit risk). Level 3 includes unobservable inputs, which may include the adviser’s own assumptions in determining the fair value of investments. Other financial instruments are derivative instruments, such as futures contracts and swap agreements. The following is a summary of the levels used as of December 31, 2019 in valuing the fund’s assets or liabilities:
| | | | | | | | | | | | | | | | |
| Financial Instruments | | Level 1 | | | Level 2 | | | Level 3 | | | Total | |
| U.S. Treasury Bonds & U.S. Government Agencies & Equivalents | | | $— | | | | $55,945,110 | | | | $— | | | | $55,945,110 | |
| Non-U.S. Sovereign Debt | | | — | | | | 10,832,716 | | | | — | | | | 10,832,716 | |
| Municipal Bonds | | | — | | | | 5,156,857 | | | | — | | | | 5,156,857 | |
| U.S. Corporate Bonds | | | — | | | | 146,675,568 | | | | — | | | | 146,675,568 | |
| Residential Mortgage-Backed Securities | | | — | | | | 18,172,492 | | | | — | | | | 18,172,492 | |
| Commercial Mortgage-Backed Securities | | | — | | | | 49,647,481 | | | | — | | | | 49,647,481 | |
| Asset-Backed Securities (including CDOs) | | | — | | | | 85,584,294 | | | | — | | | | 85,584,294 | |
| Foreign Bonds | | | — | | | | 81,003,526 | | | | — | | | | 81,003,526 | |
| Mutual Funds | | | 5,138,857 | | | | — | | | | — | | | | 5,138,857 | |
| Total | | | $5,138,857 | | | | $453,018,044 | | | | $— | | | | $458,156,901 | |
| | | | |
| Other Financial Instruments | | | | | | | | | | | | |
| Futures Contracts – Liabilities | | | $(27,004 | ) | | | $— | | | | $— | | | | $(27,004 | ) |
| Swap Agreements – Assets | | | — | | | | 351,884 | | | | — | | | | 351,884 | |
For further information regarding security characteristics, see the Portfolio of Investments.
Foreign Currency Translation– Purchases and sales of foreign investments, income, and expenses are converted into U.S. dollars based upon currency exchange rates prevailing on the respective dates of such transactions or on the reporting date for foreign denominated receivables and payables. Gains and losses attributable to foreign currency exchange rates on sales of securities are recorded for financial statement purposes as net realized gains and losses on investments. Gains and losses attributable to foreign exchange rate movements on receivables, payables, income and expenses are recorded for financial statement purposes as foreign currency transaction gains and losses. That portion of both realized and unrealized gains and losses on investments that results from fluctuations in foreign currency exchange rates is not separately disclosed.
Derivatives– The fund uses derivatives primarily to increase or decrease exposure to a particular market or segment of the market, or security, to increase or decrease interest rate or currency exposure, or as alternatives to direct investments. Derivatives are used for hedging ornon-hedging purposes. While hedging can reduce or eliminate losses, it can also reduce or eliminate gains. When the fund uses derivatives as an investment to increase market exposure, or for hedging purposes, gains and losses from derivative instruments may be substantially greater than the derivative’s original cost.
The derivative instruments used by the fund during the period were futures contracts and swap agreements. Depending on the type of derivative, the fund may exit a derivative position by entering into an offsetting transaction with a counterparty or exchange, negotiating an agreement with the derivative counterparty, or novating the position to a third party. The fund may be unable to promptly close out a futures position in instances where the daily fluctuation in the price for that type of future exceeds the daily limit set by the exchange. The fund’s period end derivatives, as presented in the Portfolio of Investments and the associated Derivative Contract tables, generally are indicative of the volume of its derivative activity during the period.
22
MFS Limited Maturity Portfolio
Notes to Financial Statements – continued
The following table presents, by major type of derivative contract, the fair value, on a gross basis, of the asset and liability components of derivatives held by the fund at December 31, 2019 as reported in the Statement of Assets and Liabilities:
| | | | | | | | | | |
| | | | | Fair Value (a) | |
| Risk | | Derivative Contracts | | Asset Derivatives | | | Liability Derivatives | |
| Interest Rate | | Interest Rate Futures | | | $— | | | | $(27,004 | ) |
| Interest Rate | | Interest Rate Swaps | | | 351,884 | | | | — | |
| Total | | | | | $351,884 | | | | $(27,004 | ) |
| (a) | Values presented in this table for futures contracts and cleared swap agreements correspond to the values reported in the fund’s Portfolio of Investments. Only the current day net variation margin for futures contracts and cleared swap agreements is separately reported within the fund��s Statement of Assets and Liabilities. |
The following table presents, by major type of derivative contract, the realized gain (loss) on derivatives held by the fund for the year ended December 31, 2019 as reported in the Statement of Operations:
| | | | | | | | |
| Risk | | Futures Contracts | | | Swap Agreements | |
| Interest Rate | | | $194,110 | | | | $(337,045 | ) |
The following table presents, by major type of derivative contract, the change in unrealized appreciation or depreciation on derivatives held by the fund for the year ended December 31, 2019 as reported in the Statement of Operations:
| | | | | | | | |
| Risk | | Futures Contracts | | | Swap Agreements | |
| Interest Rate | | | $(119,313 | ) | | | $351,884 | |
Derivative counterparty credit risk is managed through formal evaluation of the creditworthiness of all potential counterparties. On certain, but not all, uncleared derivatives, the fund attempts to reduce its exposure to counterparty credit risk whenever possible by entering into an ISDA Master Agreement on a bilateral basis. The ISDA Master Agreement gives each party to the agreement the right to terminate all transactions traded under such agreement if there is a specified deterioration in the credit quality of the other party. Upon an event of default or a termination of the ISDA Master Agreement, thenon-defaulting party has the right to close out all transactions traded under such agreement and to net amounts owed under each agreement to one net amount payable by one party to the other. This right to close out and net payments across all transactions traded under the ISDA Master Agreement could result in a reduction of the fund’s credit risk to such counterparty equal to any amounts payable by the fund under the applicable transactions, if any.
Collateral and margin requirements differ by type of derivative. For cleared derivatives (e.g., futures contracts, cleared swaps, and exchange-traded options), margin requirements are set by the clearing broker and the clearing house and collateral, in the form of cash or securities, is posted by the fund directly with the clearing broker. Collateral terms are counterparty agreement specific for uncleared derivatives (e.g., forward foreign currency exchange contracts, uncleared swap agreements, and uncleared options) and collateral, in the form of cash and securities, is held in segregated accounts with the fund’s custodian in connection with these agreements. For derivatives traded under an ISDA Master Agreement, which contains a collateral support annex, the collateral requirements are netted across all transactions traded under such counterparty-specific agreement and an amount is posted from one party to the other to collateralize such obligations. Cash that has been segregated or delivered to cover the fund’s collateral or margin obligations under derivative contracts, if any, will be reported separately in the Statement of Assets and Liabilities as restricted cash for uncleared derivatives and/or deposits with brokers for cleared derivatives. Securities pledged as collateral or margin for the same purpose, if any, are noted in the Portfolio of Investments. The fund may be required to make payments of interest on uncovered collateral or margin obligations with the broker. Any such payments are included in “Miscellaneous” expense in the Statement of Operations.
Futures Contracts– The fund entered into futures contracts which may be used to hedge against or obtain broad market exposure, interest rate exposure, currency exposure, or to manage duration. A futures contract represents a commitment for the future purchase or sale of an asset at a specified price on a specified date.
Upon entering into a futures contract, the fund is required to deposit with the broker, either in cash or securities, an initial margin in an amount equal to a specified percentage of the notional amount of the contract. Subsequent payments (variation margin) are made or received by the fund each day, depending on the daily fluctuations in the value of the contract, and are recorded for financial statement purposes as unrealized gain or loss by the fund until the contract is closed or expires at which point the gain or loss on futures contracts is realized.
The fund bears the risk of interest rates, exchange rates or securities prices moving unexpectedly, in which case, the fund may not achieve the anticipated benefits of the futures contracts and may realize a loss. While futures contracts may present less counterparty risk to the fund since the contracts are exchange traded and the exchange’s clearinghouse guarantees payments to the broker, there
23
MFS Limited Maturity Portfolio
Notes to Financial Statements – continued
is still counterparty credit risk due to the insolvency of the broker. The fund’s maximum risk of loss due to counterparty credit risk is equal to the margin posted by the fund to the broker plus any gains or minus any losses on the outstanding futures contracts.
Swap Agreements– During the period the fund entered into swap agreements. Swap agreements generally involve a periodic exchange of cash payments on a net basis, at specified intervals or upon the occurrence of specified events, between the fund and a counterparty. Certain swap agreements may be entered into as a bilateral contract (“uncleared swaps”) while others are required to be centrally cleared (“cleared swaps”). In a cleared swap transaction, the ultimate counterparty to the transaction is a clearinghouse (the “clearinghouse”). The contract is transferred and accepted by the clearinghouse immediately following execution of the swap contract with an executing broker. Thereafter, throughout the term of the cleared swap, the fund interfaces indirectly with the clearinghouse through a clearing broker and has counterparty risk to the clearing broker as well.
Both cleared and uncleared swap agreements are marked to market daily. The value of uncleared swap agreements is reported in the Statement of Assets and Liabilities as “Uncleared swaps, at value” which includes any related interest accruals to be paid or received by the fund. For cleared swaps, payments (variation margin) are made or received by the fund each day, depending on the daily fluctuations in the value of the cleared swap, such that only the current day net receivable or payable for variation margin is reported in the Statement of Assets and Liabilities.
For both cleared and uncleared swaps, the periodic exchange of net cash payments, at specified intervals or upon the occurrence of specified events as stipulated by the agreement, is recorded as realized gain or loss on swap agreements in the Statement of Operations. Premiums paid or received at the inception of the agreements are amortized using the effective interest method over the term of the agreement as realized gain or loss on swap agreements in the Statement of Operations. A liquidation payment received or made upon early termination is recorded as a realized gain or loss on swap agreements in the Statement of Operations. The change in unrealized appreciation or depreciation on swap agreements in the Statement of Operations reflects the aggregate change over the reporting period in the value of swaps net of any unamortized premiums paid or received.
Risks related to swap agreements include the possible lack of a liquid market, unfavorable market and interest rate movements of the underlying instrument and the failure of the counterparty to perform under the terms of the agreements. The fund’s maximum risk of loss from counterparty credit risk is the discounted net value of the cash flows to be received from/paid to the counterparty over the contract’s remaining life, to the extent that the amount is positive. To address counterparty risk, uncleared swap agreements are limited to only highly-rated counterparties. Risk is further reduced by having an ISDA Master Agreement between the fund and the counterparty providing for netting as described above and, where applicable, by the posting of collateral by the counterparty to the fund to cover the fund’s exposure to the counterparty under such ISDA Master Agreement. The fund’s counterparty risk due to cleared swaps is mitigated by the fact that the clearinghouse is the true counterparty to the transaction and the regulatory requirement safeguards in the event of a clearing broker bankruptcy.
The fund entered into interest rate swap agreements in order to manage its exposure to interest or foreign exchange rate fluctuations. Interest rate swap agreements involve the periodic exchange of cash flows, between the fund and a counterparty, based on the difference between two interest rates applied to a notional principal amount. The two interest rates exchanged may either be a fixed rate and a floating rate or two floating rates based on different indices.
Indemnifications– Under the fund’s organizational documents, its officers and Trustees may be indemnified against certain liabilities and expenses arising out of the performance of their duties to the fund. Additionally, in the normal course of business, the fund enters into agreements with service providers that may contain indemnification clauses. The fund’s maximum exposure under these agreements is unknown as this would involve future claims that may be made against the fund that have not yet occurred.
Investment Transactions and Income– Investment transactions are recorded on the trade date. Interest income is recorded on the accrual basis. All premium and discount is amortized or accreted for financial statement purposes in accordance with U.S. generally accepted accounting principles. Interest payments received in additional securities are recorded on theex-interest date in an amount equal to the value of the security on such date.
The fund may receive proceeds from litigation settlements. Any proceeds received from litigation involving portfolio holdings are reflected in the Statement of Operations in realized gain/loss if the security has been disposed of by the fund or in unrealized gain/loss if the security is still held by the fund. Any other proceeds from litigation not related to portfolio holdings are reflected as other income in the Statement of Operations.
The fund invests a significant portion of its assets in asset-backed and/or mortgage-backed securities. For these securities, the value of the debt instrument also depends on the credit quality and adequacy of the underlying assets or collateral as well as whether there is a security interest in the underlying assets or collateral. Enforcing rights, if any, against the underlying assets or collateral may be difficult. U.S. Government securities not supported as to the payment of principal or interest by the U.S. Treasury, such as those issued by Fannie Mae, Freddie Mac, and the Federal Home Loan Banks, are subject to greater credit risk than are U.S. Government securities supported by the U.S. Treasury, such as those issued by Ginnie Mae.
24
MFS Limited Maturity Portfolio
Notes to Financial Statements – continued
The fund purchased or sold debt securities on a when-issued or delayed delivery basis, or in a “To Be Announced” (TBA) or “forward commitment” transaction with delivery or payment to occur at a later date beyond the normal settlement period. When the fund sells securities on a when-issued, delayed delivery, or forward commitment basis, the fund typically owns or has the right to acquire securities equivalent in kind and amount to the delivered securities. At the time a fund enters into a commitment to purchase or sell a security, the transaction is recorded and the value of the security acquired or sold is reflected in the fund’s net asset value. The price of such security and the date that the security will be delivered and paid for are fixed at the time the transaction is negotiated. The value of the security may vary with market fluctuations. No interest accrues to the fund until payment takes place. At the time that a fund enters into this type of transaction, the fund is required to have sufficient cash and/or liquid securities to cover its commitments. Losses may arise due to changes in the value of the underlying securities prior to settlement date or if the counterparty does not perform under the contract’s terms, or if the issuer does not issue the securities due to political, economic or other factors.
To mitigate the counterparty credit risk on TBA securities and other types of forward settling mortgage-backed securities, the fund whenever possible enters into a Master Securities Forward Transaction Agreement (“MSFTA”) on a bilateral basis with each of the counterparties with whom it undertakes a significant volume of transactions. The MSFTA gives each party to the agreement the right to terminate all transactions traded under such agreement if there is a specified deterioration in the credit quality of the other party. Upon an event of default or a termination of the MSFTA, thenon-defaulting party has the right to close out all transactions traded under such agreement and to net amounts owed under each transaction to one net amount payable by one party to the other. This right to close out and net payments across all transactions traded under the MSFTA could result in a reduction of the fund’s credit risk to such counterparty equal to any amounts payable by the fund under the applicable transactions, if any.
For mortgage-backed securities traded under a MSFTA, the collateral and margining requirements are contract specific. Collateral amounts across all transactions traded under such agreement are netted and an amount is posted from one party to the other to collateralize such obligations. Cash that has been pledged to cover the fund’s collateral or margin obligations under a MSFTA, if any, will be reported separately on the Statement of Assets and Liabilities as restricted cash. Securities pledged as collateral or margin for the same purpose, if any, are noted in the Portfolio of Investments.
Tax Matters and Distributions– The fund intends to qualify as a regulated investment company, as defined under Subchapter M of the Internal Revenue Code, and to distribute all of its taxable income, including realized capital gains. As a result, no provision for federal income tax is required. The fund’s federal tax returns, when filed, will remain subject to examination by the Internal Revenue Service for a three year period. Management has analyzed the fund’s tax positions taken on federal and state tax returns for all open tax years and does not believe that there are any uncertain tax positions that require recognition of a tax liability. Foreign taxes, if any, have been accrued by the fund in the accompanying financial statements in accordance with the applicable foreign tax law. Foreign income taxes may be withheld by certain countries in which the fund invests. Additionally, capital gains realized by the fund on securities issued in or by certain foreign countries may be subject to capital gains tax imposed by those countries.
Distributions to shareholders are recorded on theex-dividend date. Income and capital gain distributions are determined in accordance with income tax regulations, which may differ from U.S. generally accepted accounting principles. Certain capital accounts in the financial statements are periodically adjusted for permanent differences in order to reflect their tax character. These adjustments have no impact on net assets or net asset value per share. Temporary differences which arise from recognizing certain items of income, expense, gain or loss in different periods for financial statement and tax purposes will reverse at some time in the future.
Book/tax differences primarily relate to derivative transactions.
The tax character of distributions declared to shareholders for the last two fiscal years is as follows:
| | | | | | | | |
| | | Year ended
12/31/19 | | | Year ended
12/31/18 | |
| Ordinary income (including any short-term capital gains) | | | $12,198,184 | | | | $10,355,191 | |
The federal tax cost and the tax basis components of distributable earnings were as follows:
| | | | |
| As of 12/31/19 | | | | |
| |
| Cost of investments | | | $453,124,915 | |
| Gross appreciation | | | 5,820,374 | |
| Gross depreciation | | | (463,508 | ) |
| Net unrealized appreciation (depreciation) | | | $5,356,866 | |
| |
| Undistributed ordinary income | | | 12,888,030 | |
| Capital loss carryforwards | | | (2,418,832 | ) |
25
MFS Limited Maturity Portfolio
Notes to Financial Statements – continued
As of December 31, 2019, the fund had capital loss carryforwards available to offset future realized gains. These net capital losses may be carried forward indefinitely and their character is retained as short-term and/or long-term losses. Such losses are characterized as follows:
| | | | |
| Short-Term | | | $(646,654 | ) |
| Long-Term | | | (1,772,178 | ) |
| Total | | | $(2,418,832 | ) |
Multiple Classes of Shares of Beneficial Interest– The fund offers multiple classes of shares, which differ in their respective distribution and/or service fees. The fund’s income, realized and unrealized gain (loss), and common expenses are allocated to shareholders based on the daily net assets of each class. Dividends are declared separately for each class. Differences in per share dividend rates are generally due to differences in separate class expenses. The fund’s distributions declared to shareholders as reported in the Statements of Changes in Net Assets are presented by class as follows:
| | | | | | | | |
| | |
| | | Year ended
12/31/19 | | | Year ended
12/31/18 | |
| Initial Class | | | $9,355,557 | | | | $8,077,594 | |
| Service Class | | | 2,842,627 | | | | 2,277,597 | |
| Total | | | $12,198,184 | | | | $10,355,191 | |
| (3) | | Transactions with Affiliates |
Investment Adviser– The fund has an investment advisory agreement with MFS to provide overall investment management and related administrative services and facilities to the fund. The management fee is computed daily and paid monthly at an annual rate of 0.40% of the fund’s average daily net assets.
MFS has also agreed in writing to reduce its management fee by a specified amount if certain MFS mutual fund assets exceed thresholds agreed to by MFS and the fund’s Board of Trustees. For the year ended December 31, 2019, this management fee reduction amounted to $45,942, which is included in the reduction of total expenses in the Statement of Operations. The management fee incurred for the year ended December 31, 2019 was equivalent to an annual effective rate of 0.39% of the fund’s average daily net assets.
Distributor– MFS Fund Distributors, Inc. (MFD), a wholly-owned subsidiary of MFS, is the distributor of shares of the fund. The Trustees have adopted a distribution plan for the Service Class shares pursuant to Rule12b-1 under the Investment Company Act of 1940.
The fund’s distribution plan provides that the fund will pay MFD distribution and/or service fees equal to 0.25% per annum of its average daily net assets attributable to Service Class shares as partial consideration for services performed and expenses incurred by MFD and financial intermediaries (including participating insurance companies that invest in the fund to fund variable annuity and variable life insurance contracts, sponsors of qualified retirement and pension plans that invest in the fund, and affiliates of these participating insurance companies and plan sponsors) in connection with the sale and distribution of the Service Class shares. MFD may subsequently pay all, or a portion, of the distribution and/or service fees to financial intermediaries.
Shareholder Servicing Agent– MFS Service Center, Inc. (MFSC), a wholly-owned subsidiary of MFS, receives a fee from the fund for its services as shareholder servicing agent. For the year ended December 31, 2019, the fee was $3,688, which equated to 0.0008% annually of the fund’s average daily net assets. MFSC also receives payment from the fund forout-of-pocket expenses paid by MFSC on behalf of the fund. For the year ended December 31, 2019, these costs amounted to $198.
Administrator– MFS provides certain financial, legal, shareholder communications, compliance, and other administrative services to the fund. Under an administrative services agreement, the fund reimburses MFS the costs incurred to provide these services. The fund is charged an annual fixed amount of $17,500 plus a fee based on average daily net assets. The administrative services fee incurred for the year ended December 31, 2019 was equivalent to an annual effective rate of 0.0157% of the fund’s average daily net assets.
Trustees’ and Officers’ Compensation– The fund pays compensation to independent Trustees in the form of a retainer, attendance fees, and additional compensation to Board and Committee chairpersons. The fund does not pay compensation directly to Trustees or officers of the fund who are also officers of the investment adviser, all of whom receive remuneration from MFS for their services to the fund. Certain officers and Trustees of the fund are officers or directors of MFS, MFD, and MFSC.
Other– This fund and certain other funds managed by MFS (the funds) had entered into a service agreement (the ISO Agreement) which provided for payment of fees solely by the funds to Tarantino LLC in return for the provision of services of an Independent Senior Officer (ISO) for the funds. Frank L. Tarantino served as the ISO and was an officer of the funds and the sole member of Tarantino LLC. Effective June 30, 2019, Mr. Tarantino retired from his position as ISO for the funds, and the ISO Agreement was terminated. For the year ended December 31, 2019, the fee paid by the fund under this agreement was $564 and is included in “Miscellaneous” expense in the Statement of Operations. MFS had agreed to bear all expenses associated with office space, other administrative support, and supplies provided to the ISO.
26
MFS Limited Maturity Portfolio
Notes to Financial Statements – continued
The fund invests in the MFS Institutional Money Market Portfolio which is managed by MFS and seeks current income consistent with preservation of capital and liquidity. This money market fund does not pay a management fee to MFS.
For the year ended December 31, 2019, purchases and sales of investments, other than short-term obligations, were as follows:
| | | | | | | | |
| | | Purchases | | | Sales | |
| U.S. Government securities | | | $38,984,646 | | | | $20,738,667 | |
| Non-U.S. Government securities | | | $144,620,805 | | | | $192,755,945 | |
| (5) | | Shares of Beneficial Interest |
The fund’s Declaration of Trust permits the Trustees to issue an unlimited number of full and fractional shares of beneficial interest. Transactions in fund shares were as follows:
| | | | | | | | | | | | | | | | |
| | | Year ended 12/31/19 | | | Year ended 12/31/18 | |
| | | | |
| | | Shares | | | Amount | | | Shares | | | Amount | |
| Shares sold | | | | | | | | | | | | | | | | |
Initial Class | | | 1,861,837 | | | | $19,155,293 | | | | 848,249 | | | | $8,593,262 | |
Service Class | | | 1,130,805 | | | | 11,633,874 | | | | 431,006 | | | | 4,357,141 | |
| | | 2,992,642 | | | | $30,789,167 | | | | 1,279,255 | | | | $12,950,403 | |
| | | | |
| Shares issued to shareholders in reinvestment of distributions | | | | | | | | | | | | | | | | |
Initial Class | | | 910,960 | | | | $9,355,557 | | | | 804,541 | | | | $8,077,594 | |
Service Class | | | 276,789 | | | | 2,842,627 | | | | 226,852 | | | | 2,277,597 | |
| | | 1,187,749 | | | | $12,198,184 | | | | 1,031,393 | | | | $10,355,191 | |
| | | | |
| Shares reacquired | | | | | | | | | | | | | | | | |
Initial Class | | | (5,185,694 | ) | | | $(53,476,536 | ) | | | (8,670,149 | ) | | | $(87,766,829 | ) |
Service Class | | | (1,724,145 | ) | | | (17,792,446 | ) | | | (3,014,572 | ) | | | (30,491,977 | ) |
| | | (6,909,839 | ) | | | $(71,268,982 | ) | | | (11,684,721 | ) | | | $(118,258,806 | ) |
| | | | |
| Net change | | | | | | | | | | | | | | | | |
Initial Class | | | (2,412,897 | ) | | | $(24,965,686 | ) | | | (7,017,359 | ) | | | $(71,095,973 | ) |
Service Class | | | (316,551 | ) | | | (3,315,945 | ) | | | (2,356,714 | ) | | | (23,857,239 | ) |
| | | (2,729,448 | ) | | | $(28,281,631 | ) | | | (9,374,073 | ) | | | $(94,953,212 | ) |
The fund is one of several mutual funds in which certain MFS funds may invest. The MFS funds do not invest in the underlying funds for the purpose of exercising management or control. At the end of the period, the MFS Moderate Allocation Portfolio, the MFS Conservative Allocation Portfolio, and the MFS Growth Allocation Portfolio were the owners of record of approximately 12%, 11%, and 2%, respectively, of the value of outstanding voting shares of the fund.
The fund and certain other funds managed by MFS participate in a $1.25 billion unsecured committed line of credit, subject to a $1 billion sublimit, provided by a syndicate of banks under a credit agreement. Borrowings may be made for temporary financing needs. Interest is charged to each fund, based on its borrowings, generally at a rate equal to the highest of one month LIBOR, the Federal Funds Effective Rate and the Overnight Bank Funding Rate, plus an agreed upon spread. A commitment fee, based on the average daily, unused portion of the committed line of credit, is allocated among the participating funds. In addition, the fund and other funds managed by MFS have established unsecured uncommitted borrowing arrangements with certain banks for temporary financing needs. Interest is charged to each fund, based on its borrowings, at rates equal to customary reference rates plus an agreed upon spread. For the year ended December 31, 2019, the fund’s commitment fee and interest expense were $2,583 and $0, respectively, and are included in “Miscellaneous” expense in the Statement of Operations.
| (7) | | Investments in Affiliated Issuers |
An affiliated issuer may be considered one in which the fund owns 5% or more of the outstanding voting securities, or a company which is under common control. For the purposes of this report, the following were affiliated issuers:
| | | | | | | | | | | | | | | | | | | | | | | | |
| Affiliated Issuers | | Beginning
Value | | | Purchases | | | Sales
Proceeds | | | Realized
Gain
(Loss) | | | Change in
Unrealized
Appreciation or
Depreciation | | | Ending
Value | |
| MFS Institutional Money Market Portfolio | | | $2,322,779 | | | | $145,190,267 | | | | $142,375,057 | | | | $877 | | | | $(9 | ) | | | $5,138,857 | |
| | | | | | |
| Affiliated Issuers | | | | | | | | | | | | | | Dividend
Income | | | Capital Gain
Distributions | |
| MFS Institutional Money Market Portfolio | | | | | | | | | | | | $103,250 | | | | $— | |
27
MFS Limited Maturity Portfolio
REPORT OF INDEPENDENT REGISTERED PUBLIC ACCOUNTING FIRM
To the Board of Trustees of MFS Variable Insurance Trust III and the Shareholders of
MFS Limited Maturity Portfolio:
Opinion on the Financial Statements and Financial Highlights
We have audited the accompanying statement of assets and liabilities of MFS Limited Maturity Portfolio (the “Fund”), including the portfolio of investments, as of December 31, 2019, the related statement of operations for the year then ended, the statements of changes in net assets for each of the two years in the period then ended, the financial highlights for each of the five years in the period then ended, and the related notes. In our opinion, the financial statements and financial highlights present fairly, in all material respects, the financial position of the Fund as of December 31, 2019, and the results of its operations for the year then ended, the changes in its net assets for each of the two years in the period then ended, and the financial highlights for each of the five years in the period then ended, in conformity with accounting principles generally accepted in the United States of America.
Basis for Opinion
These financial statements and financial highlights are the responsibility of the Fund’s management. Our responsibility is to express an opinion on the Fund’s financial statements and financial highlights based on our audits. We are a public accounting firm registered with the Public Company Accounting Oversight Board (United States) (PCAOB) and are required to be independent with respect to the Fund in accordance with the U.S. federal securities laws and the applicable rules and regulations of the Securities and Exchange Commission and the PCAOB.
We conducted our audits in accordance with the standards of the PCAOB. Those standards require that we plan and perform the audit to obtain reasonable assurance about whether the financial statements and financial highlights are free of material misstatement, whether due to error or fraud. The Fund is not required to have, nor were we engaged to perform, an audit of its internal control over financial reporting. As part of our audits we are required to obtain an understanding of internal control over financial reporting but not for the purpose of expressing an opinion on the effectiveness of the Fund’s internal control over financial reporting. Accordingly, we express no such opinion.
Our audits included performing procedures to assess the risks of material misstatement of the financial statements and financial highlights, whether due to error or fraud, and performing procedures that respond to those risks. Such procedures included examining, on a test basis, evidence regarding the amounts and disclosures in the financial statements and financial highlights. Our audits also included evaluating the accounting principles used and significant estimates made by management, as well as evaluating the overall presentation of the financial statements and financial highlights. Our procedures included confirmation of securities owned as of December 31, 2019, by correspondence with the custodian and brokers. We believe that our audits provide a reasonable basis for our opinion.
DELOITTE & TOUCHE LLP
Boston, Massachusetts
February 14, 2020
We have served as the auditor of one or more of the MFS investment companies since 1924.
28
MFS Limited Maturity Portfolio
TRUSTEES AND OFFICERS – IDENTIFICATION AND BACKGROUND
The Trustees and Officers of the Trust, as of February 1, 2020, are listed below, together with their principal occupations during the past five years. (Their titles may have varied during that period.) The address of each Trustee and Officer is 111 Huntington Avenue, Boston, Massachusetts 02199-7618.
| | | | | | | | | | |
Name, Age | | Position(s)
Held with Fund | | Trustee/Officer
Since (h) | | Number of MFS Funds
overseen by the
Trustee | | Principal Occupations
During the Past Five Years | | Other Directorships During the Past Five Years (j) |
| INTERESTED TRUSTEES |
Robert J. Manning (k)
(age 56) | | Trustee | | February 2004 | | 133 | | Massachusetts Financial Services Company, Executive Chairman (since January 2017); Director; Chairman of the Board; Chief Executive Officer (until 2015);Co-Chief Executive Officer(2015-2016) | | N/A |
| | | | | |
Robin A. Stelmach (k) (age 58) | | Trustee | | January 2014 | | 133 | | Massachusetts Financial Services Company, Vice Chair (since January 2017); Chief Operating Officer and Executive Vice President (until January 2017) | | N/A |
|
| INDEPENDENT TRUSTEES |
John P. Kavanaugh (age 65) | | Trustee and Chair of Trustees | | January 2009 | | 133 | | Private investor | | N/A |
| | | | | |
Steven E. Buller (age 68) | | Trustee | | February 2014 | | 133 | | Financial Accounting Standards Advisory Council, Chairman(2014-2015); Public Company Accounting Oversight Board, Standing Advisory Group, Member (until 2014); BlackRock, Inc. (investment management), Managing Director (until 2014), BlackRock Finco UK (investment management), Director (until 2014) | | N/A |
| | | | | |
John A. Caroselli (age 65) | | Trustee | | March 2017 | | 133 | | JC Global Advisors, LLC (management consulting), President (since 2015); First Capital Corporation (commercial finance), Executive Vice President (until 2015) | | N/A |
| | | | | |
Maureen R. Goldfarb (age 64) | | Trustee | | January 2009 | | 133 | | Private investor | | N/A |
| | | | | |
Peter D. Jones
(age 64) | | Trustee | | January 2019 | | 133 | | Franklin Templeton Distributors, Inc. (investment management), President (until 2015); Franklin Templeton Institutional, LLC (investment management), Chairman (until 2015) | | N/A |
| | | | | |
James W. Kilman, Jr.
(age 58) | | Trustee | | January 2019 | | 133 | | Burford Capital Limited (finance and investment management), Chief Financial Officer (since 2019); KielStrand Capital LLC (family office), Chief Executive Officer (since 2016); Morgan Stanley & Co. (financial services), Vice Chairman of Investment Banking,Co-Head of Diversified Financials Coverage – Financial Institutions Investment Banking Group (until 2016) | | Alpha-En Corporation, Director (2016-2019) |
29
MFS Limited Maturity Portfolio
Trustees and Officers – continued
| | | | | | | | | | |
Name, Age | | Position(s)
Held with Fund | | Trustee/Officer
Since (h) | | Number of MFS Funds
overseen by the
Trustee | | Principal Occupations
During the Past Five Years | | Other Directorships During the Past Five Years (j) |
Clarence Otis, Jr. (age 63) | | Trustee | | March 2017 | | 133 | | Darden Restaurants, Inc., Chief Executive Officer (until 2014) | | VF Corporation, Director; Verizon Communications, Inc., Director; The Travelers Companies, Director; Federal Reserve Bank of Atlanta, Director (until 2015) |
| | | | | |
Maryanne L. Roepke (age 63) | | Trustee | | May 2014 | | 133 | | American Century Investments (investment management), Senior Vice President and Chief Compliance Officer (until 2014) | | N/A |
| | | | | |
Laurie J. Thomsen
(age 62) | | Trustee | | March 2005 | | 133 | | Private investor | | The Travelers Companies, Director; Dycom Industries, Inc., Director (since 2015) |
| | | | | | | | |
Name, Age | | Position(s)
Held with Fund | | Trustee/Officer
Since (h) | | Number of
MFS Funds
for which the
Person is an
Officer | | Principal Occupations During the Past Five Years |
| OFFICERS | | | | | | |
Christopher R. Bohane (k)
(age 46) | | Assistant Secretary and Assistant Clerk | | July 2005 | | 133 | | Massachusetts Financial Services Company, Vice President and Assistant General Counsel |
| | | | |
Kino Clark (k) (age 51) | | Assistant Treasurer | | January 2012 | | 133 | | Massachusetts Financial Services Company, Vice President |
| | | | |
John W. Clark, Jr. (k) (age 52) | | Assistant Treasurer | | April 2017 | | 133 | | Massachusetts Financial Services Company, Vice President (since March 2017); Deutsche Bank (financial services), Department Head –Treasurer’s Office (until February 2017) |
| | | | |
Thomas H. Connors (k) (age 60) | | Assistant Secretary and Assistant Clerk | | September 2012 | | 133 | | Massachusetts Financial Services Company, Vice President and Senior Counsel |
| | | | |
David L. DiLorenzo (k)
(age 51) | | President | | July 2005 | | 133 | | Massachusetts Financial Services Company, Senior Vice President |
| | | | |
Heidi W. Hardin (k) (age 52) | | Secretary and Clerk | | April 2017 | | 133 | | Massachusetts Financial Services Company, Executive Vice President and General Counsel (since March 2017); Harris Associates (investment management), General Counsel (from September 2015 to January 2017); Janus Capital Management LLC (investment management), Senior Vice President and General Counsel (until September 2015) |
| | | | |
Brian E. Langenfeld (k) (age 46) | | Assistant
Secretary and Assistant Clerk | | June 2006 | | 133 | | Massachusetts Financial Services Company, Vice President and Senior Counsel |
| | | | |
Amanda S. Mooradian (k) (age 40) | | Assistant
Secretary and Assistant Clerk | | September 2018 | | 133 | | Massachusetts Financial Services Company, Assistant Vice President and Counsel |
| | | | |
Susan A. Pereira (k)
(age 49) | | Assistant
Secretary and Assistant Clerk | | July 2005 | | 133 | | Massachusetts Financial Services Company, Vice President and Assistant General Counsel |
| | | | |
Kasey L. Phillips (k) (age 49) | | Assistant Treasurer | | September 2012 | | 133 | | Massachusetts Financial Services Company, Vice President |
| | | | |
Matthew A. Stowe (k) (age 45) | | Assistant Secretary and Assistant Clerk | | October 2014 | | 133 | | Massachusetts Financial Services Company, Vice President and Assistant General Counsel |
30
MFS Limited Maturity Portfolio
Trustees and Officers – continued
| | | | | | | | |
Name, Age | | Position(s)
Held with Fund | | Trustee/Officer
Since (h) | | Number of
MFS Funds
for which the
Person is an
Officer | | Principal Occupations During the Past Five Years |
Martin J. Wolin (k) (age 52) | | Chief Compliance Officer | | July 2015 | | 133 | | Massachusetts Financial Services Company, Senior Vice President and Chief Compliance Officer (since July 2015); Mercer (financial service provider), Chief Risk and Compliance Officer, North America and Latin America (until June 2015) |
| | | | |
James O. Yost (k)
(age 59) | | Treasurer | | September 1990 | | 133 | | Massachusetts Financial Services Company, Senior Vice President |
| (h) | Date first appointed to serve as Trustee/officer of an MFS Fund. Each Trustee has served continuously since appointment unless indicated otherwise. For the period from December 15, 2004 until February 22, 2005, Mr. Manning served as Advisory Trustee. From January 2012 through December 2016, Messrs. DiLorenzo and Yost served as Treasurer and Deputy Treasurer of the Funds, respectively. |
| (j) | Directorships or trusteeships of companies required to report to the Securities and Exchange Commission (i.e., “public companies”). |
| (k) | “Interested person” of the Trust within the meaning of the Investment Company Act of 1940 (referred to as the 1940 Act), which is the principal federal law governing investment companies like the fund, as a result of a position with MFS. The address of MFS is 111 Huntington Avenue, Boston, Massachusetts 02199-7618. |
Each Trustee (other than Messrs. Jones and Kilman) has been elected by shareholders and each Trustee and Officer holds office until his or her successor is chosen and qualified or until his or her earlier death, resignation, retirement or removal. Messrs. Jones and Kilman became Trustees of the Funds on January 1, 2019. The Trust does not hold annual meetings for the purpose of electing Trustees, and Trustees are not elected for fixed terms. Under the terms of the Board’s retirement policy, an Independent Trustee shall retire at the end of the calendar year in which he or she reaches the earlier of 75 years of age or 15 years of service on the Board (or, in the case of any Independent Trustee who joined the Board prior to 2015, 20 years of service on the Board).
Messrs. Buller, Kilman and Otis and Ms. Roepke are members of the Trust’s Audit Committee.
Each of the Interested Trustees and certain Officers hold comparable officer positions with certain affiliates of MFS.
The Statement of Additional Information for a Fund includes further information about the Trustees and is available without charge upon request by calling1-800-225-2606.
| | |
Investment Adviser Massachusetts Financial Services Company 111 Huntington Avenue Boston, MA 02199-7618 | | Custodian State Street Bank and Trust Company 1 Lincoln Street Boston, MA 02111-2900 |
| |
Distributor MFS Fund Distributors, Inc. 111 Huntington Avenue Boston, MA 02199-7618 | | Independent Registered Public Accounting Firm Deloitte & Touche LLP 200 Berkeley Street Boston, MA 02116 |
| |
Portfolio Manager(s) Philipp Burgener Alexander Mackey | | |
31
MFS Limited Maturity Portfolio
BOARD REVIEW OF INVESTMENT ADVISORY AGREEMENT
MFS Limited Maturity Portfolio
The Investment Company Act of 1940 requires that both the full Board of Trustees and a majority of thenon-interested (“independent”) Trustees, voting separately, annually approve the continuation of the Fund’s investment advisory agreement with MFS. The Trustees consider matters bearing on the Fund and its advisory arrangements at their meetings throughout the year, including a review of performance data at each regular meeting. In addition, the independent Trustees met several times over the course of three months beginning in May and ending in July, 2019 (“contract review meetings”) for the specific purpose of considering whether to approve the continuation of the investment advisory agreement for the Fund and the other investment companies that the Board oversees (the “MFS Funds”). The independent Trustees were assisted in their evaluation of the Fund’s investment advisory agreement by independent legal counsel, from whom they received separate legal advice and with whom they met separately from MFS during various contract review meetings. The independent Trustees were also assisted in this process by the MFS Funds’ Independent Senior Officer, a senior officer appointed by and reporting to the independent Trustees.
In connection with their deliberations regarding the continuation of the investment advisory agreement, the Trustees, including the independent Trustees, considered such information and factors as they believed, in light of the legal advice furnished to them and their own business judgment, to be relevant. The investment advisory agreement for the Fund was considered separately, although the Trustees also took into account the common interests of all MFS Funds in their review. As described below, the Trustees considered the nature, quality, and extent of the various investment advisory, administrative, and shareholder services performed by MFS under the existing investment advisory agreement and other arrangements with the Fund.
In connection with their contract review meetings, the Trustees received and relied upon materials that included, among other items: (i) information provided by Broadridge Financial Solutions, Inc. (“Broadridge”), an independent third party, on the investment performance of the Fund for various time periods ended December 31, 2018 and the investment performance of a group of funds with substantially similar investment classifications/objectives (the “Broadridge performance universe”), (ii) information provided by Broadridge on the Fund’s advisory fees and other expenses and the advisory fees and other expenses of comparable funds identified by Broadridge as well as all other funds in the same investment classification/category (the “Broadridge expense group and universe”), (iii) information provided by MFS on the advisory fees of portfolios of other clients of MFS, including institutional separate accounts and other clients, (iv) information as to whether and to what extent applicable expense waivers, reimbursements or fee “breakpoints” are observed for the Fund, (v) information regarding MFS’ financial results and financial condition, including MFS’ and certain of its affiliates’ estimated profitability from services performed for the Fund and the MFS Funds as a whole, and compared to MFS’ institutional business, (vi) MFS’ views regarding the outlook for the mutual fund industry and the strategic business plans of MFS, (vii) descriptions of various functions performed by MFS for the Funds, such as compliance monitoring and portfolio trading practices, and (viii) information regarding the overall organization of MFS, including information about MFS’ senior management and other personnel providing investment advisory, administrative and other services to the Fund and the other MFS Funds. The comparative performance, fee and expense information prepared and provided by Broadridge was not independently verified and the independent Trustees did not independently verify any information provided to them by MFS.
The Trustees’ conclusion as to the continuation of the investment advisory agreement was based on a comprehensive consideration of all information provided to the Trustees and not the result of any single factor. Some of the factors that figured particularly in the Trustees’ deliberations are described below, although individual Trustees may have evaluated the information presented differently from one another, giving different weights to various factors. It is also important to recognize that the fee arrangements for the Fund and other MFS Funds are the result of years of review and discussion between the independent Trustees and MFS, that certain aspects of such arrangements may receive greater scrutiny in some years than in others, and that the Trustees’ conclusions may be based, in part, on their consideration of these same arrangements during the course of the year and in prior years.
Based on information provided by Broadridge and MFS, the Trustees reviewed the Fund’s total return investment performance as well as the Broadridge performance universe over various time periods. The Trustees placed particular emphasis on the total return performance of the Fund’s Initial Class shares in comparison to the performance of funds in its Broadridge performance universe over the five-year period ended December 31, 2018, which the Trustees believed was a long enough period to reflect differing market conditions. The total return performance of the Fund’s Initial Class shares was in the 1st quintile relative to the other funds in the universe for this five-year period (the 1st quintile being the best performers and the 5th quintile being the worst performers). The total return performance of the Fund’s Initial Class shares was in the 3rd quintile for theone-year period and the 2nd quintile for thethree-year period ended December 31, 2018 relative to the Broadridge performance universe. Because of the passage of time, these performance results may differ from the performance results for more recent periods, including those shown elsewhere in this report.
In the course of their deliberations, the Trustees took into account information provided by MFS in connection with the contract review meetings, as well as during investment review meetings conducted with portfolio management personnel during the course of the year regarding the Fund’s performance. After reviewing these and related factors, the Trustees concluded, within the context of their overall conclusions regarding the investment advisory agreement, that they were satisfied with MFS’ responses and efforts relating to investment performance.
32
MFS Limited Maturity Portfolio
Board Review of Investment Advisory Agreement – continued
In assessing the reasonableness of the Fund’s advisory fee, the Trustees considered, among other information, the Fund’s advisory fee and the total expense ratio of the Fund’s Initial Class shares as a percentage of average daily net assets and the advisory fee and total expense ratios of the Broadridge expense group based on information provided by Broadridge. The Trustees considered that, according to the data provided by Broadridge (which takes into account any fee reductions or expense limitations that were in effect during the Fund’s last fiscal year), the Fund’s effective advisory fee rate and total expense ratio were each approximately at the Broadridge expense group median.
The Trustees also considered the advisory fees charged by MFS to any institutional separate accounts advised by MFS (“separate accounts”) and unaffiliated investment companies for which MFS serves as subadviser (“subadvised funds”) that have comparable investment strategies to the Fund, if any. In comparing these fees, the Trustees considered information provided by MFS as to the generally broader scope of services provided by MFS to the Fund, as well as the more extensive regulatory burdens imposed on MFS in managing the Fund, in comparison to separate accounts and subadvised funds. The Trustees also considered the higher demands placed on MFS’ investment personnel and trading infrastructure as a result of the daily cashin-flows andout-flows of the Fund in comparison to separate accounts.
The Trustees also considered whether the Fund may benefit from any economies of scale in the management of the Fund in the event of growth in assets of the Fund and/or growth in assets of the MFS Funds as a whole. They noted that the Fund’s advisory fee rate schedule is not subject to any breakpoints. Taking into account that the Fund’s effective advisory fee rate was approximately at the Broadridge expense group median described above, the Trustees determined not to recommend any advisory fee breakpoints for the Fund at this time. The Trustees also noted that MFS has agreed in writing to waive a portion of the management fees of certain MFS Funds, including the Fund, if the total combined assets of certain funds within the MFS Funds’ complex increase above agreed upon thresholds (the “group fee waiver”), enabling the Fund’s shareholders to share in the benefits from any economies of scale at the complex level. The group fee waiver is reviewed and renewed annually between the Board and MFS. The Trustees concluded that the group fee waiver was sufficient to allow the Fund to benefit from economies of scale as its assets and overall complex assets grow.
The Trustees also considered information prepared by MFS relating to MFS’ costs and profits with respect to the Fund, the MFS Funds considered as a group, and other investment companies and accounts advised by MFS, as well as MFS’ methodologies used to determine and allocate its costs to the MFS Funds, the Fund and other accounts and products for purposes of estimating profitability.
After reviewing these and other factors described herein, the Trustees concluded, within the context of their overall conclusions regarding the investment advisory agreement, that the advisory fees charged to the Fund represent reasonable compensation in light of the services being provided by MFS to the Fund.
In addition, the Trustees considered MFS’ resources and related efforts to continue to retain, attract and motivate capable personnel to serve the Fund. The Trustees also considered current and developing conditions in the financial services industry, including the presence of large and well-capitalized companies which are spending, and appear to be prepared to continue to spend, substantial sums to engage personnel and to provide services to competing investment companies. In this regard, the Trustees also considered the financial resources of MFS and its ultimate parent, Sun Life Financial Inc. The Trustees also considered the advantages and possible disadvantages to the Fund of having an adviser that also serves other investment companies as well as other accounts.
The Trustees also considered the nature, quality, cost, and extent of administrative, transfer agency, and distribution services provided to the Fund by MFS and its affiliates under agreements and plans other than the investment advisory agreement, including any12b-1 fees the Fund pays to MFS Fund Distributors, Inc., an affiliate of MFS. The Trustees also considered the nature, extent and quality of certain other services MFS performs or arranges for on the Fund’s behalf, which may include securities lending programs, directed expense payment programs, class action recovery programs, and MFS’ interaction with third-party service providers, principally custodians andsub-custodians. The Trustees concluded that the variousnon-advisory services provided by MFS and its affiliates on behalf of the Fund were satisfactory.
The Trustees consideredso-called“fall-out benefits” to MFS such as reputational value derived from serving as investment manager to the MFS Funds. The Trustees also considered that, effective January 3, 2018, MFS had discontinued its historic practice of obtaining investment research from portfolio brokerage commissions paid by certain MFS Funds and would thereafter directly pay for or voluntarily reimburse a Fund, if applicable, for the costs of external research acquired through the use of the Fund’s portfolio brokerage commissions.
Based on their evaluation of factors that they deemed to be material, including those factors described above, the Board of Trustees, including the independent Trustees, concluded that the Fund’s investment advisory agreement with MFS should be continued for an additionalone-year period, commencing August 1, 2019.
33
MFS Limited Maturity Portfolio
PROXY VOTING POLICIES AND INFORMATION
MFS votes proxies on behalf of the fund pursuant to proxy voting policies and procedures that are available without charge, upon request, by calling 1-800-225-2606, by visitingmfs.com/proxyvoting, or by visiting the SEC’s Web site athttp://www.sec.gov.
Information regarding how the fund voted proxies relating to portfolio securities during the most recent twelve-month period ended June 30 is available by August 31 of each year without charge by visitingmfs.com/proxyvoting, or by visiting the SEC’s Web site athttp://www.sec.gov.
QUARTERLY PORTFOLIO DISCLOSURE
The fund files a complete schedule of portfolio holdings with the SEC for the first and third quarters of each fiscal year as an exhibit to its reports on Form N-PORT. The fund’s Form N-PORT reports are available on the SEC’s website athttp://www.sec.gov. A shareholder can obtain the portfolio holdings report for the first and third quarters of the fund’s fiscal year atmfs.com/vit3 by choosing the fund’s name and then selecting the “Resources” tab and clicking on “Prospectus and Reports”.
FURTHER INFORMATION
From time to time, MFS may post important information about the fund or the MFS funds on the MFS web site (mfs.com). This information is available athttps://www.mfs.com/en-us/what-we-do/announcements.html or at mfs.com/vit3by choosing the fund’s name.
INFORMATION ABOUT FUND CONTRACTS AND LEGAL CLAIMS
The fund has entered into contractual arrangements with an investment adviser, administrator, distributor, shareholder servicing agent, 529 program manager (if applicable), and custodian who each provide services to the fund. Unless expressly stated otherwise, shareholders are not parties to, or intended beneficiaries of these contractual arrangements, and these contractual arrangements are not intended to create any shareholder right to enforce them against the service providers or to seek any remedy under them against the service providers, either directly or on behalf of the fund.
Under the Trust’s By-Laws and Declaration of Trust, any claims asserted against or on behalf of the MFS Funds, including claims against Trustees and Officers, must be brought in state and federal courts located within the Commonwealth of Massachusetts.
34
rev. 3/16
| | | | |
| | | |
| FACTS | | WHAT DOES MFS DO WITH YOUR
PERSONAL INFORMATION? | |  |
| | |
| Why? | | Financial companies choose how they share your personal information. Federal law gives consumers the right to limit some but not all sharing. Federal law also requires us to tell you how we collect, share, and protect your personal information. Please read this notice carefully to understand what we do. |
| | |
| What? | | The types of personal information we collect and share depend on the product or service you have with us. This information can include: • Social Security number and account balances • Account transactions and transaction history • Checking account information and wire transfer instructions When you areno longer our customer, we continue to share your information as described in this notice. |
| | |
| How? | | All financial companies need to share customers’ personal information to run their everyday business. In the section below, we list the reasons financial companies can share their customers’ personal information; the reasons MFS chooses to share; and whether you can limit this sharing. |
| | | | |
Reasons we can share your
personal information | | Does MFS share? | | Can you limit this
sharing? |
For our everyday business purposes – such as to process your transactions, maintain your account(s), respond to court orders and legal investigations, or report to credit bureaus | | Yes | | No |
For our marketing purposes – to offer our products and services to you | | No | | We don’t share |
| For joint marketing with other financial companies | | No | | We don’t share |
For our affiliates’ everyday business purposes – information about your transactions and experiences | | No | | We don’t share |
For our affiliates’ everyday business purposes – information about your creditworthiness | | No | | We don’t share |
| For nonaffiliates to market to you | | No | | We don’t share |
| | |
| | |
| Questions? | | Call800-225-2606 or go tomfs.com. |
35
| | |
| Who we are |
| Who is providing this notice? | | MFS Funds, MFS Investment Management, MFS Institutional Advisors, Inc., and MFS Heritage Trust Company. |
| | |
| What we do |
| How does MFS protect my personal information? | | To protect your personal information from unauthorized access and use, we use security measures that comply with federal law. These measures include procedural, electronic, and physical safeguards for the protection of the personal information we collect about you. |
How does MFS
collect my personal information? | | We collect your personal information, for example, when you • open an account or provide account information • direct us to buy securities or direct us to sell your securities • make a wire transfer We also collect your personal information from others, such as credit bureaus, affiliates, or other companies. |
| Why can’t I limit all sharing? | | Federal law gives you the right to limit only • sharing for affiliates’ everyday business purposes – information about your creditworthiness • affiliates from using your information to market to you • sharing for nonaffiliates to market to you State laws and individual companies may give you additional rights to limit sharing. |
| | |
| Definitions |
| Affiliates | | Companies related by common ownership or control. They can be financial and nonfinancial companies. • MFS does not share personal information with affiliates, except for everyday business purposes as described on page one of this notice. |
| Nonaffiliates | | Companies not related by common ownership or control. They can be financial and nonfinancial companies. • MFS does not share with nonaffiliates so they can market to you. |
| Joint marketing | | A formal agreement between nonaffiliated financial companies that together market financial products or services to you. • MFS doesn’t jointly market. |
| | |
| Other important information |
| If you own an MFS product or receive an MFS service in the name of a third party such as a bank or broker-dealer, their privacy policy may apply to you instead of ours. |
36
Annual Report
December 31, 2019

MFS® Mid Cap Value Portfolio

MFS® Variable Insurance Trust III
Beginning on January 1, 2021, as permitted by regulations adopted by the U.S. Securities and Exchange Commission, the insurance company that offers your contract may determine that it will no longer send you paper copies of the fund’s annual and semiannual shareholder reports unless you specifically request paper copies from the insurance company or from your financial intermediary. Instead, the shareholder reports will be made available on a Web site (insurancefunds.mfs.com or other Web site of which you will be notified), and the insurance company will notify you by mail each time a report is posted and provide you with a Web site link to access the report. Instructions for requesting paper copies will be provided by your insurance company or financial intermediary.
If you already elected to receive shareholder reports by email, you will not be affected by this change and you need not take any action. If your insurance company or financial intermediary offers electronic delivery, you may elect to receive shareholder reports and other communications from the insurance company or financial intermediary by email by following the instructions provided by the insurance company or financial intermediary.
Beginning on January 1, 2019, you may elect to receive all future reports in paper free of charge from the insurance company or financial intermediary. You can inform the insurance company or financial intermediary that you wish to continue receiving paper copies of your shareholder reports by contacting your insurance company or financial intermediary. Your election to receive reports in paper will apply to all funds held in your account with your insurance company or financial intermediary.
VMC-ANN
MFS® Mid Cap Value Portfolio
CONTENTS
The report is prepared for the general information of contract owners. It is authorized for distribution to prospective investors only when preceded or accompanied by a current prospectus.
NOT FDIC INSURED• MAY LOSE VALUE• NO BANK OR CREDIT UNION GUARANTEE• NOT A DEPOSIT• NOT INSURED BY ANY FEDERAL GOVERNMENT AGENCY OR NCUA/NCUSIF
MFS Mid Cap Value Portfolio
LETTER FROM THE EXECUTIVE CHAIR

Dear Contract Owners:
Slowing global growth, low inflation, and trade friction between the United States and China have been hallmarks of the past 12 months. After experiencing an uptick in market volatility in late 2018, markets steadied for most of 2019, thanks in large measure to the adoption of a dovish policy stance on the part of global central banks, focused on supporting economic growth. Negotiations aimed at a “phase one” trade deal between the U.S. and China bore fruit at the end of the period, boosting investor sentiment, while signs of stability emerging from the global manufacturing sector also lifted spirits. Uncertainty over Brexit, along with the ripple effects from the trade conflict, hampered business confidence and investment in the United Kingdom and Europe for much of the period, though investors expect greater clarity regarding Brexit as a result of December’s general election. The pro-Brexit Conservative Party won the election by a comfortable margin and set the stage for the U.K.’s departure from the EU at the end of January.
Markets expect the longest economic expansion in U.S. history will continue, albeit at a slower pace, as trade tensions recede. In an effort to prolong the expansion, the U.S. Federal Reserve lowered interest rates three times between July and October and the European Central Bank loosened policy in September. While the global monetary policy backdrop remains quite accommodative, signs of easing trade tensions and fading global recession fears led to improved market sentiment in late 2019 as investors grew less risk averse. In early 2020, an outbreak of coronavirus emanating from China reintroduced global growth fears, causing an uptick in volatility.
Here at MFS®, we aim to help our clients navigate the growing complexity of the markets and world economies. Our long-term investment philosophy and commitment to the responsible allocation of capital allow us to tune out the noise and uncover what we believe are the best, most durable investment opportunities in the market. Through our powerful global investment platform, we combine collective expertise, thoughtful risk management and long-term discipline to create sustainable value for investors.
Respectfully,

Robert J. Manning
Executive Chair
MFS Investment Management
February 14, 2020
The opinions expressed in this letter are subject to change and may not be relied upon for investment advice. No forecasts can be guaranteed.
1
MFS Mid Cap Value Portfolio
PORTFOLIO COMPOSITION
Portfolio structure

| | | | |
| Top ten holdings | | | | |
| NASDAQ, Inc. | | | 1.4% | |
| Hartford Financial Services Group, Inc. | | | 1.3% | |
| Stanley Black & Decker, Inc. | | | 1.2% | |
| L3Harris Technologies, Inc. | | | 1.2% | |
| KeyCorp | | | 1.2% | |
| KBR, Inc. | | | 1.2% | |
| Zimmer Biomet Holdings, Inc. | | | 1.1% | |
| Truist Financial Corp. | | | 1.1% | |
| Huntington Bancshares, Inc. | | | 1.0% | |
| Eversource Energy | | | 1.0% | |
| | | | |
| GICS equity sectors (g) | | | | |
| Financials | | | 21.3% | |
| Industrials | | | 13.7% | |
| Information Technology | | | 10.2% | |
| Consumer Discretionary | | | 9.7% | |
| Utilities | | | 9.5% | |
| Materials | | | 7.7% | |
| Real Estate | | | 7.4% | |
| Health Care | | | 6.8% | |
| Energy | | | 6.3% | |
| Consumer Staples | | | 6.0% | |
| Communication Services | | | 1.0% | |
| (g) | The Global Industry Classification Standard (GICS®) was developed by and/or is the exclusive property of MSCI, Inc. and S&P Global Market Intelligence Inc. (“S&P Global Market Intelligence”). GICS is a service mark of MSCI and S&P Global Market Intelligence and has been licensed for use by MFS. |
Cash & Cash Equivalents includes any cash, investments in money market funds, short-term securities, and other assets less liabilities. Please see the Statement of Assets and Liabilities for additional information related to the fund’s cash position and other assets and liabilities.
Percentages are based on net assets as of December 31, 2019.
The portfolio is actively managed and current holdings may be different.
2
MFS Mid Cap Value Portfolio
MANAGEMENT REVIEW
Summary of Results
For the twelve months ended December 31, 2019, Initial Class shares of the MFS Mid Cap Value Portfolio (fund) provided a total return of 31.12%, while Service Class shares of the fund provided a total return of 30.71%. These compare with a return of 27.06% over the same period for the fund’s benchmark, the Russell Midcap® Value Index.
Market Environment
Fading fears of a near-term global recession, the announcement of a partial trade deal between the United States and China and the decline in uncertainty over Brexit helped bolster market sentiment late in the period. Changes in market sentiment, largely driven by uncertainty over the outcome of trade negotiations between the US and China, had contributed to periodic bouts of volatility during the reporting period. The global economy decelerated, led by weakness in China and Europe, although the pace of the slowdown moderated late in the period amid nascent signs of stabilization in the manufacturing sector.
The deteriorating global growth backdrop, along with declining inflationary pressures, prompted the US Federal Reserve to adopt a more dovish posture beginning in early 2019, resulting in the first interest rate cut in over a decade at the end of July, followed by additional cuts in September and October. The Fed’s actions led to a sharp decline in long-term interest rates during the period’s second half, causing the inversion of portions of the US Treasury yield curve for a time. Amid an improvement in risk sentiment in Q4 2019 and indications of a bottoming in growth and a potential upturn in activity, the Fed indicated in October that further rate cuts were unlikely unless the outlook for the economy materially worsened.
Globally, central banks have tilted more dovish as well, with the European Central Bank unveiling a package of easing measures, which included putting overnight rates deeper into negative territory, restarting its bond-buying program and lengthening the term of cheap loans to banks to three years from two. The central banks of India and Australia are among those that have cut rates several times in recent months, although China has been more cautious in increasing liquidity as it keeps trying to deleverage its economy, cutting rates only marginally.
Emerging markets experienced considerable volatility through the end of 2018, as tighter global financial conditions exposed structural weakness in some countries. Those conditions improved in 2019 as the Fed became more dovish. Notwithstanding the periodic headwinds on market sentiment from significant trade friction between the US and China over much of the year, emerging market hard currency debt and local rates benefited from relatively cheap valuations at the beginning of the period and easier global monetary conditions. These factors, plus the fading of certain global risk factors mentioned above, hastened spread tightening in the latter part of the period. At the same time, idiosyncratic risks spiked in some countries (e.g., Argentina and Lebanon), contributing to increased dispersion in performance among sovereign assets.
Contributors to Performance
Security selection and an overweight position in theinformation technology sector benefited performance relative to the Russell Midcap® Value Index. Within this sector, the fund’s holdings of engineering, procurement, and construction company KBR (b), payment processing company First Data (b)(h) and electronic payment services company Global Payments (b) supported relative returns. The stock price of First Data advanced during the period as the company reported solid financial results. The announcement that financial technology services provider Fiserv would acquire the company in anall-stock deal further supported the stock price appreciation. Additionally, overweight positions in information technology services provider Leidos Holdings and electronics components manufacturer Keysight Technologies aided relative performance.
Security selection in both thereal estateandmaterials sectors bolstered relative results. However, there were no individual stocks within either sector that were among the fund’s largest relative contributors during the period.
Elsewhere, holdings of alternative investment manager Apollo Global Management (b) and poultry producer Sanderson Farms (b), and not holding shares of natural gas provider PG&E, buoyed relative returns. The stock price of Apollo Global Management rose as the company completed its conversion from a publicly-traded partnership to a corporation, broadening its base of potential investors. The timing of the fund’s ownership in shares of aerospace and defense technology company L3Harris Technologies and grocery store chain Kroger further supported relative results.
Detractors from Performance
Stock selection in thehealth care sector held back relative performance. However, there were no individual stocks within this sector that were among the fund’s largest relative detractors during the period.
Stocks in other sectors that hindered relative results included the fund’s overweight positions in independent oil and gas company Cabot Oil & Gas, arts and crafts specialty retailer Michaels Companies (h), industrial distributor HD Supply Holdings and packaging company Berry Global Group. The stock price of Cabot Oil & Gas depreciated during the period due to a decline in gas prices, coupled with the company’s disappointing production growth guidance. The stock price of Michaels Companies came under
3
MFS Mid Cap Value Portfolio
Management Review – continued
pressure as the company reported declining gross margins and a further reduction to its earnings per share guidance figures, due to a challenging arts/crafts industry environment. The fund’s holdings of oil transportation and storage company Plains GP Holdings (b), independent petroleum products company Marathon Petroleum (b) and electronic brokerage firm TD Ameritrade (b)(h) also weakened relative performance. Not holding shares of payments processing technology and solutions provider Worldpay, and the timing of the fund’s ownership in shares of food producer Tyson Foods (h), further dampened relative returns.
The fund’s cash and/or cash equivalents position during the period detracted from relative performance. Under normal market conditions, the fund strives to be fully invested and generally holds cash to buy new holdings and to provide liquidity. In a period when equity markets rose, as measured by the fund’s benchmark, holding cash hurt performance versus the benchmark, which has no cash position.
Respectfully,
Portfolio Manager(s)
Kevin Schmitz and Brooks Taylor
| (b) | Security is not a benchmark constituent. |
| (h) | Security was not held in the portfolio at period end. |
The views expressed in this report are those of the portfolio manager(s) only through the end of the period of the report as stated on the cover and do not necessarily reflect the views of MFS or any other person in the MFS organization. These views are subject to change at any time based on market or other conditions, and MFS disclaims any responsibility to update such views. These views may not be relied upon as investment advice or an indication of trading intent on behalf of any MFS portfolio. References to specific securities are not recommendations of such securities, and may not be representative of any MFS portfolio’s current or future investments.
4
MFS Mid Cap Value Portfolio
PERFORMANCE SUMMARY THROUGH 12/31/19
The following chart illustrates the historical performance of the fund in comparison to its benchmark(s). Benchmarks are unmanaged and may not be invested in directly. Benchmark returns do not reflect any fees or expenses. The performance of other share classes will be greater than or less than that of the class depicted below. (See Notes to Performance Summary.)
Performance data shown represents past performance and is no guarantee of future results. Investment return and principal value fluctuate so your units, when sold, may be worth more or less than the original cost; current performance may be lower or higher than quoted. The performance shown does not reflect the deduction of taxes, if any, that a contract holder would pay on fund distributions or the redemption of contract units. The returns for the fund shown also do not reflect the deduction of expenses associated with variable products, such as mortality and expense risk charges, separate account charges, and sales charges imposed by the insurance company separate accounts. Such expenses would reduce the overall returns shown.
Growth of a Hypothetical $10,000 Investment
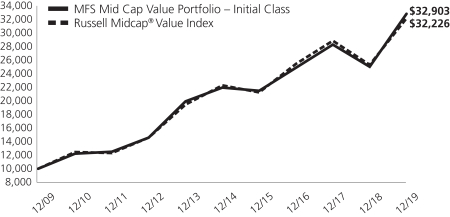
Total Returns through 12/31/19
Average annual total returns
| | | | | | | | | | | | |
| | | Share Class | | Class Inception Date | | 1-yr | | 5-yr | | 10-yr | | |
| | | Initial Class | | 3/07/08 | | 31.12% | | 8.38% | | 12.65% | | |
| | | Service Class | | 3/07/08 | | 30.71% | | 8.10% | | 12.36% | | |
| | | | |
| Comparative benchmark(s) | | | | | | | | |
| | | Russell Midcap® Value Index (f) | | 27.06% | | 7.62% | | 12.41% | | |
| (f) | Source: FactSet Research Systems Inc. |
Benchmark Definition(s)
Russell Midcap® Value Index – constructed to provide a comprehensive barometer for value securities in the mid-cap segment of the U.S. equity universe. Companies in this index generally have lower price-to-book ratios and lower forecasted growth values. Frank Russell Company (“Russell”) is the source and owner of the trademarks, service marks, and copyrights related to the Russell Indexes. Russell® is a trademark of Frank Russell Company. Neither Russell nor its licensors accept any liability for any errors or omissions in the Russell Indexes and/or Russell ratings or underlying data and no party may rely on any Russell Indexes and/or Russell ratings and/or underlying data contained in this document. No further distribution of Russell Data is permitted without Russell’s express written consent. Russell does not promote, sponsor, or endorse the content of this document.
It is not possible to invest directly in an index.
Notes to Performance Summary
Average annual total return represents the average annual change in value for each share class for the periods presented.
Performance results reflect any applicable expense subsidies and waivers in effect during the periods shown. Without such subsidies and waivers the fund’s performance results would be less favorable. Please see the prospectus and financial statements for complete details. All results are historical and assume the reinvestment of any dividends and capital gains distributions.
5
MFS Mid Cap Value Portfolio
Performance Summary – continued
Performance prior to close of business December 7, 2012, reflects time periods when another adviser or subadviser was responsible for selecting investments for the fund under a different investment objective and different investment strategies.
Performance results do not include adjustments made for financial reporting purposes in accordance with U.S. generally accepted accounting principles and may differ from amounts reported in the financial highlights.
From time to time the fund may receive proceeds from litigation settlements, without which performance would be lower.
6
MFS Mid Cap Value Portfolio
EXPENSE TABLE
Fund Expenses Borne by the Contract Holders during the Period,
July 1, 2019 through December 31, 2019
As a contract holder of the fund, you incur ongoing costs, including management fees; distribution and/or service(12b-1) fees; and other fund expenses. This example is intended to help you understand your ongoing costs (in dollars) of investing in the fund and to compare these costs with the ongoing costs of investing in other mutual funds.
The example is based on an investment of $1,000 invested at the beginning of the period and held for the entire period July 1, 2019 through December 31, 2019.
Actual Expenses
The first line for each share class in the following table provides information about actual account values and actual expenses. You may use the information in this line, together with the amount you invested, to estimate the expenses that you paid over the period. Simply divide your account value by $1,000 (for example, an $8,600 account value divided by $1,000 = 8.6), then multiply the result by the number in the first line under the heading entitled “Expenses Paid During Period” to estimate the expenses you paid on your account during this period.
Hypothetical Example for Comparison Purposes
The second line for each share class in the following table provides information about hypothetical account values and hypothetical expenses based on the fund’s actual expense ratio and an assumed rate of return of 5% per year before expenses, which is not the fund’s actual return. The hypothetical account values and expenses may not be used to estimate the actual ending account balance or expenses you paid for the period. You may use this information to compare the ongoing costs of investing in the fund and other funds. To do so, compare this 5% hypothetical example with the 5% hypothetical examples that appear in the shareholder reports of the other funds.
Please note that the expenses shown in the table are meant to highlight the fund’s ongoing costs only and do not take into account the fees and expenses imposed under the variable contracts through which your investment in the fund is made. Therefore, the second line for each share class in the table is useful in comparing ongoing costs associated with an investment in vehicles (such as the fund) which fund benefits under variable annuity and variable life insurance contracts and to qualified pension and retirement plans only, and will not help you determine the relative total costs of investing in the fund through variable annuity and variable life insurance contracts. If the fees and expenses imposed under the variable contracts were included, your costs would have been higher.
| | | | | | | | | | | | | | | | | | |
| Share Class | | | | Annualized
Expense Ratio | | | Beginning
Account Value
7/01/19 | | | Ending
Account Value
12/31/19 | | | Expenses Paid
During Period (p)
7/01/19-12/31/19 | |
| Initial Class | | Actual | | | 0.80% | | | | $1,000.00 | | | | $1,093.15 | | | | $4.22 | |
| | Hypothetical (h) | | | 0.80% | | | | $1,000.00 | | | | $1,021.17 | | | | $4.08 | |
| Service Class | | Actual | | | 1.05% | | | | $1,000.00 | | | | $1,091.69 | | | | $5.54 | |
| | Hypothetical (h) | | | 1.05% | | | | $1,000.00 | | | | $1,019.91 | | | | $5.35 | |
| (h) | 5% class return per year before expenses. |
| (p) | “Expenses Paid During Period” are equal to each class’s annualized expense ratio, as shown above, multiplied by the average account value over the period, multiplied by 184/365 (to reflect theone-half year period). |
7
MFS Mid Cap Value Portfolio
PORTFOLIO OF INVESTMENTS – 12/31/19
The Portfolio of Investments is a complete list of all securities owned by your fund. It is categorized by broad-based asset classes.
| | | | | | | | |
| | |
| Issuer | | Shares/Par | | | Value ($) | |
| COMMON STOCKS – 99.6% | | | | | | | | |
| Aerospace – 2.7% | | | | | | | | |
| Huntington Ingalls Industries, Inc. | | | 7,370 | | | $ | 1,848,985 | |
| L3Harris Technologies, Inc. | | | 20,395 | | | | 4,035,559 | |
| Leidos Holdings, Inc. | | | 30,844 | | | | 3,019,319 | |
| | | | | | | | |
| | | | | | $ | 8,903,863 | |
| | | | | | | | |
| Airlines – 1.2% | | | | | | | | |
| Alaska Air Group, Inc. | | | 17,875 | | | $ | 1,211,031 | |
| Delta Air Lines, Inc. | | | 49,408 | | | | 2,889,380 | |
| | | | | | | | |
| | | | | | $ | 4,100,411 | |
| | | | | | | | |
| Alcoholic Beverages – 0.3% | | | | | | | | |
| Molson Coors Brewing Co. | | | 20,248 | | | $ | 1,091,367 | |
| | | | | | | | |
| Apparel Manufacturers – 1.2% | | | | | | | | |
| PVH Corp. | | | 17,013 | | | $ | 1,788,917 | |
| Skechers USA, Inc., “A” (a) | | | 47,916 | | | | 2,069,492 | |
| | | | | | | | |
| | | | | | $ | 3,858,409 | |
| | | | | | | | |
| Automotive – 1.4% | | | | | | | | |
| Lear Corp. | | | 15,142 | | | $ | 2,077,482 | |
| LKQ Corp. (a) | | | 70,384 | | | | 2,512,709 | |
| | | | | | | | |
| | | | | | $ | 4,590,191 | |
| | | | | | | | |
| Brokerage & Asset Managers – 3.9% | | | | | | | | |
| Apollo Global Management, Inc. | | | 68,965 | | | $ | 3,290,320 | |
| E*TRADE Financial Corp. | | | 14,846 | | | | 673,563 | |
| Invesco Ltd. | | | 102,871 | | | | 1,849,621 | |
| NASDAQ, Inc. | | | 44,278 | | | | 4,742,174 | |
| Raymond James Financial, Inc. | | | 28,676 | | | | 2,565,355 | |
| | | | | | | | |
| | | | | | $ | 13,121,033 | |
| | | | | | | | |
| Business Services – 1.7% | | | | | | | | |
| Amdocs Ltd. | | | 47,212 | | | $ | 3,408,234 | |
| Global Payments, Inc. | | | 12,202 | | | | 2,227,597 | |
| | | | | | | | |
| | | | | | $ | 5,635,831 | |
| | | | | | | | |
| Cable TV – 0.4% | �� | | | | | | | |
| Altice USA, Inc., “A” (a) | | | 49,726 | | | $ | 1,359,509 | |
| | | | | | | | |
| Chemicals – 3.4% | | | | | | | | |
| Celanese Corp. | | | 18,110 | | | $ | 2,229,703 | |
| Eastman Chemical Co. | | | 38,334 | | | | 3,038,353 | |
| FMC Corp. | | | 31,659 | | | | 3,160,201 | |
| PPG Industries, Inc. | | | 22,381 | | | | 2,987,640 | |
| | | | | | | | |
| | | | | | $ | 11,415,897 | |
| | | | | | | | |
| Computer Software – 0.4% | | | | | | | | |
| Change Healthcare, Inc. (a) | | | 75,085 | | | $ | 1,230,643 | |
| | | | | | | | |
| Computer Software – Systems – 1.1% | | | | | |
| Verint Systems, Inc. (a) | | | 30,654 | | | $ | 1,697,006 | |
| Zebra Technologies Corp., “A” (a) | | | 7,903 | | | | 2,018,742 | |
| | | | | | | | |
| | | | | | $ | 3,715,748 | |
| | | | | | | | |
| Construction – 6.2% | | | | | | | | |
| Fortune Brands Home & Security, Inc. | | | 18,609 | | | $ | 1,215,912 | |
| Masco Corp. | | | 55,888 | | | | 2,682,065 | |
| | | | | | | | |
| | |
Issuer | | Shares/Par | | | Value ($) | |
| COMMON STOCKS – continued | | | | | |
| Construction – continued | | | | | | | | |
| Mid-America Apartment Communities, Inc., REIT | | | 23,946 | | | $ | 3,157,520 | |
| Owens Corning | | | 40,021 | | | | 2,606,168 | |
| Stanley Black & Decker, Inc. | | | 24,833 | | | | 4,115,821 | |
| Toll Brothers, Inc. | | | 74,380 | | | | 2,938,754 | |
| Vulcan Materials Co. | | | 14,859 | | | | 2,139,547 | |
| Whirlpool Corp. | | | 13,163 | | | | 1,941,937 | |
| | | | | | | | |
| | | | | | $ | 20,797,724 | |
| | | | | | | | |
| Consumer Products – 1.3% | |
| Energizer Holdings, Inc. | | | 36,074 | | | $ | 1,811,636 | |
| International Flavors & Fragrances, Inc. | | | 5,466 | | | | 705,223 | |
| Newell Brands, Inc. | | | 92,940 | | | | 1,786,307 | |
| | | | | | | | |
| | | | | | $ | 4,303,166 | |
| | | | | | | | |
| Consumer Services – 0.3% | |
| Grand Canyon Education, Inc. (a) | | | 11,572 | | | $ | 1,108,482 | |
| | | | | | | | |
| Containers – 2.0% | |
| Berry Global Group, Inc. (a) | | | 38,757 | | | $ | 1,840,570 | |
| Graphic Packaging Holding Co. | | | 172,688 | | | | 2,875,255 | |
| WestRock Co. | | | 44,262 | | | | 1,899,283 | |
| | | | | | | | |
| | | | | | $ | 6,615,108 | |
| | | | | | | | |
| Electrical Equipment – 2.1% | |
| HD Supply Holdings, Inc. (a) | | | 71,570 | | | $ | 2,878,545 | |
| Sensata Technologies Holding PLC (a) | | | 39,668 | | | | 2,136,915 | |
| TE Connectivity Ltd. | | | 19,627 | | | | 1,881,052 | |
| | | | | | | | |
| | | | | | $ | 6,896,512 | |
| | | | | | | | |
| Electronics – 3.9% | |
| Analog Devices, Inc. | | | 29,051 | | | $ | 3,452,421 | |
| Corning, Inc. | | | 23,644 | | | | 688,277 | |
| Keysight Technologies, Inc. (a) | | | 18,068 | | | | 1,854,319 | |
| Marvell Technology Group Ltd. | | | 98,063 | | | | 2,604,553 | |
| Maxim Integrated Products, Inc. | | | 41,348 | | | | 2,543,316 | |
| NXP Semiconductors N.V. | | | 16,336 | | | | 2,078,919 | |
| | | | | | | | |
| | | | | | $ | 13,221,805 | |
| | | | | | | | |
| Energy – Independent – 3.1% | |
| Cabot Oil & Gas Corp. | | | 88,846 | | | $ | 1,546,809 | |
| Diamondback Energy, Inc. | | | 6,600 | | | | 612,876 | |
| Marathon Petroleum Corp. | | | 47,507 | | | | 2,862,297 | |
| Pioneer Natural Resources Co. | | | 20,883 | | | | 3,161,060 | |
| WPX Energy, Inc. (a) | | | 165,583 | | | | 2,275,110 | |
| | | | | | | | |
| | | | | | $ | 10,458,152 | |
| | | | | | | | |
| Energy – Integrated – 0.7% | |
| Hess Corp. | | | 35,992 | | | $ | 2,404,626 | |
| | | | | | | | |
| Engineering – Construction – 1.5% | |
| KBR, Inc. | | | 127,247 | | | $ | 3,881,034 | |
| Quanta Services, Inc. | | | 25,076 | | | | 1,020,844 | |
| | | | | | | | |
| | | | | | $ | 4,901,878 | |
| | | | | | | | |
8
MFS Mid Cap Value Portfolio
Portfolio of Investments – continued
| | | | | | | | |
| | |
| Issuer | | Shares/Par | | | Value ($) | |
| COMMON STOCKS – continued | | | | | |
| Entertainment – 0.2% | | | | | | | | |
| Six Flags Entertainment Corp. | | | 14,472 | | | $ | 652,832 | |
| | | | | | | | |
| Food & Beverages – 4.2% | | | | | | | | |
| Archer Daniels Midland Co. | | | 63,341 | | | $ | 2,935,855 | |
| Coca-Cola European Partners PLC | | | 40,870 | | | | 2,079,466 | |
| Ingredion, Inc. | | | 22,001 | | | | 2,044,993 | |
| J.M. Smucker Co. | | | 19,046 | | | | 1,983,260 | |
| Kellogg Co. | | | 26,799 | | | | 1,853,419 | |
| Post Holdings, Inc. (a) | | | 13,343 | | | | 1,455,721 | |
| Sanderson Farms, Inc. | | | 9,933 | | | | 1,750,393 | |
| | | | | | | | |
| | | | | | $ | 14,103,107 | |
| | | | | | | | |
| Food & Drug Stores – 0.7% | | | | | | | | |
| Kroger Co. | | | 79,238 | | | $ | 2,297,110 | |
| | | | | | | | |
| Gaming & Lodging – 1.8% | | | | | | | | |
| Marriott International, Inc., “A” | | | 11,464 | | | $ | 1,735,994 | |
| Royal Caribbean Cruises Ltd. | | | 20,415 | | | | 2,725,607 | |
| Wyndham Hotels & Resorts, Inc. | | | 25,287 | | | | 1,588,276 | |
| | | | | | | | |
| | | | | | $ | 6,049,877 | |
| | | | | | | | |
| General Merchandise – 0.6% | | | | | | | | |
| Dollar Tree, Inc. (a) | | | 21,780 | | | $ | 2,048,409 | |
| | | | | | | | |
| Insurance – 7.4% | | | | | | | | |
| Arthur J. Gallagher & Co. | | | 34,475 | | | $ | 3,283,054 | |
| Assurant, Inc. | | | 23,654 | | | | 3,100,566 | |
| Athene Holding Ltd. (a) | | | 50,651 | | | | 2,382,117 | |
| Everest Re Group Ltd. | | | 11,622 | | | | 3,217,435 | |
| Hanover Insurance Group, Inc. | | | 13,637 | | | | 1,863,769 | |
| Hartford Financial Services Group, Inc. | | | 72,468 | | | | 4,403,880 | |
| Lincoln National Corp. | | | 43,173 | | | | 2,547,639 | |
| Reinsurance Group of America, Inc. | | | 13,298 | | | | 2,168,372 | |
| Willis Towers Watson PLC | | | 9,692 | | | | 1,957,202 | |
| | | | | | | | |
| | | | | | $ | 24,924,034 | |
| | | | | | | | |
| Leisure & Toys – 1.7% | | | | | | | | |
| Brunswick Corp. | | | 36,692 | | | $ | 2,200,786 | |
| Electronic Arts, Inc. (a) | | | 19,384 | | | | 2,083,974 | |
| Harley-Davidson, Inc. | | | 36,463 | | | | 1,356,059 | |
| | | | | | | | |
| | | | | | $ | 5,640,819 | |
| | | | | | | | |
| Machinery & Tools – 2.9% | | | | | | | | |
| AGCO Corp. | | | 32,558 | | | $ | 2,515,106 | |
| Eaton Corp. PLC | | | 34,253 | | | | 3,244,444 | |
| ITT, Inc. | | | 31,431 | | | | 2,323,065 | |
| Regal Beloit Corp. | | | 20,937 | | | | 1,792,417 | |
| | | | | | | | |
| | | | | | $ | 9,875,032 | |
| | | | | | | | |
| Major Banks – 3.6% | | | | | | | | |
| Comerica, Inc. | | | 34,929 | | | $ | 2,506,156 | |
| Huntington Bancshares, Inc. | | | 231,706 | | | | 3,494,126 | |
| KeyCorp | | | 192,314 | | | | 3,892,435 | |
| State Street Corp. | | | 29,106 | | | | 2,302,285 | |
| | | | | | | | |
| | | | | | $ | 12,195,002 | |
| | | | | | | | |
| Medical & Health Technology & Services – 3.8% | | | | | |
| AmerisourceBergen Corp. | | | 25,109 | | | $ | 2,134,767 | |
| Laboratory Corp. of America Holdings (a) | | | 4,527 | | | | 765,832 | |
| | | | | | | | |
| | |
| Issuer | | Shares/Par | | | Value ($) | |
| COMMON STOCKS – continued | | | | | |
| Medical & Health Technology & Services – continued | |
| PRA Health Sciences, Inc. (a) | | | 18,793 | | | $ | 2,088,842 | |
| Premier, Inc., “A” (a) | | | 60,290 | | | | 2,283,785 | |
| Quest Diagnostics, Inc. | | | 23,530 | | | | 2,512,769 | |
| Universal Health Services, Inc. | | | 21,271 | | | | 3,051,538 | |
| | | | | | | | |
| | | | | | $ | 12,837,533 | |
| | | | | | | | |
| Medical Equipment – 1.9% | | | | | | | | |
| Envista Holdings Corp. (a) | | | 18,075 | | | $ | 535,743 | |
| PerkinElmer, Inc. | | | 20,728 | | | | 2,012,689 | |
| Zimmer Biomet Holdings, Inc. | | | 25,630 | | | | 3,836,298 | |
| | | | | | | | |
| | | | | | $ | 6,384,730 | |
| | | | | | | | |
| Natural Gas – Distribution – 1.4% | | | | | | | | |
| NiSource, Inc. | | | 65,617 | | | $ | 1,826,777 | |
| Sempra Energy | | | 18,812 | | | | 2,849,642 | |
| | | | | | | | |
| | | | | | $ | 4,676,419 | |
| | | | | | | | |
| Natural Gas – Pipeline – 1.6% | | | | | | | | |
| Equitrans Midstream Corp. | | | 59,077 | | | $ | 789,269 | |
| Plains GP Holdings LP | | | 148,559 | | | | 2,815,193 | |
| Targa Resources Corp. | | | 42,773 | | | | 1,746,421 | |
| | | | | | | | |
| | | | | | $ | 5,350,883 | |
| | | | | | | | |
| Network & Telecom – 0.8% | | | | | | | | |
| Motorola Solutions, Inc. | | | 17,117 | | | $ | 2,758,233 | |
| | | | | | | | |
| Oil Services – 1.1% | | | | | | | | |
| Frank’s International N.V. (a) | | | 109,788 | | | $ | 567,604 | |
| Halliburton Co. | | | 42,490 | | | | 1,039,730 | |
| NOW, Inc. (a) | | | 75,263 | | | | 845,956 | |
| Patterson-UTI Energy, Inc. | | | 108,564 | | | | 1,139,922 | |
| | | | | | | | |
| | | | | | $ | 3,593,212 | |
| | | | | | | | |
| Other Banks & Diversified Financials – 6.0% | | | | | |
| Discover Financial Services | | | 34,691 | | | $ | 2,942,491 | |
| Element Fleet Management Corp. | | | 146,752 | | | | 1,253,305 | |
| M&T Bank Corp. | | | 14,741 | | | | 2,502,285 | |
| Northern Trust Corp. | | | 28,942 | | | | 3,074,798 | |
| Prosperity Bancshares, Inc. | | | 23,586 | | | | 1,695,598 | |
| Signature Bank | | | 21,917 | | | | 2,994,081 | |
| Truist Financial Corp. | | | 66,796 | | | | 3,761,951 | |
| Wintrust Financial Corp. | | | 29,259 | | | | 2,074,463 | |
| | | | | | | | |
| | | | | | $ | 20,298,972 | |
| | | | | | | | |
| Pharmaceuticals – 0.7% | | | | | | | | |
| Elanco Animal Health, Inc. (a) | | | 50,061 | | | $ | 1,474,297 | |
| Mylan N.V. (a) | | | 50,264 | | | | 1,010,306 | |
| | | | | | | | |
| | | | | | $ | 2,484,603 | |
| | | | | | | | |
| Pollution Control – 0.4% | | | | | | | | |
| Stericycle, Inc. (a) | | | 21,755 | | | $ | 1,388,187 | |
| | | | | | | | |
| Railroad & Shipping – 1.0% | | | | | | | | |
| Kansas City Southern Co. | | | 22,534 | | | $ | 3,451,307 | |
| | | | | | | | |
| Real Estate – 6.8% | | | | | | | | |
| Annaly Capital Management, Inc., REIT | | | 106,252 | | | $ | 1,000,894 | |
| Brixmor Property Group, Inc., REIT | | | 117,509 | | | | 2,539,369 | |
| EPR Properties, REIT | | | 31,922 | | | | 2,254,970 | |
9
MFS Mid Cap Value Portfolio
Portfolio of Investments – continued
| | | | | | | | |
| | |
| Issuer | | Shares/Par | | | Value ($) | |
| COMMON STOCKS – continued | | | | | |
| Real Estate – continued | | | | | | | | |
| Life Storage, Inc., REIT | | | 31,780 | | | $ | 3,441,138 | |
| Medical Properties Trust, Inc., REIT | | | 120,842 | | | | 2,550,975 | |
| Spirit Realty Capital, Inc., REIT | | | 35,551 | | | | 1,748,398 | |
| Sun Communities, Inc., REIT | | | 21,410 | | | | 3,213,641 | |
| VICI Properties, Inc., REIT | | | 118,347 | | | | 3,023,766 | |
| W.P. Carey, Inc., REIT | | | 36,494 | | | | 2,920,980 | |
| | | | | | | | |
| | | | | | $ | 22,694,131 | |
| | | | | | | | |
| Restaurants – 0.6% | | | | | | | | |
| Wendy’s Co. | | | 87,876 | | | $ | 1,951,726 | |
| | | | | | | | |
| Specialty Chemicals – 2.2% | | | | | | | | |
| Axalta Coating Systems Ltd. (a) | | | 86,391 | | | $ | 2,626,286 | |
| Corteva, Inc. | | | 76,422 | | | | 2,259,034 | |
| Univar Solutions, Inc. (a) | | | 97,398 | | | | 2,360,928 | |
| | | | | | | | |
| | | | | | $ | 7,246,248 | |
| | | | | | | | |
| Specialty Stores – 0.9% | | | | | | | | |
| BJ’s Wholesale Club Holdings, Inc. (a) | | | 42,163 | | | $ | 958,787 | |
| Tractor Supply Co. | | | 11,328 | | | | 1,058,488 | |
| Urban Outfitters, Inc. (a) | | | 37,977 | | | | 1,054,621 | |
| | | | | | | | |
| | | | | | $ | 3,071,896 | |
| | | | | | | | |
| Trucking – 0.4% | | | | | | | | |
| Knight-Swift Transportation Holdings, Inc. | | | 41,210 | | | $ | 1,476,966 | |
| | | | | | | | |
| Utilities – Electric Power – 8.1% | | | | | | | | |
| AES Corp. | | | 120,037 | | | $ | 2,388,736 | |
| CenterPoint Energy, Inc. | | | 83,403 | | | | 2,274,400 | |
| CMS Energy Corp. | | | 54,778 | | | | 3,442,249 | |
| Edison International | | | 21,090 | | | | 1,590,397 | |
| Eversource Energy | | | 40,824 | | | | 3,472,898 | |
| FirstEnergy Corp. | | | 50,183 | | | | 2,438,894 | |
| Pinnacle West Capital Corp. | | | 38,314 | | | | 3,445,578 | |
| | | | | | | | |
| | |
| Issuer | | Shares/Par | | | Value ($) | |
| COMMON STOCKS – continued | | | | | |
| Utilities – Electric Power – continued | | | | | | | | |
| Public Service Enterprise Group, Inc. | | | 58,095 | | | $ | 3,430,510 | |
| Southern Co. | | | 40,660 | | | | 2,590,042 | |
| WEC Energy Group, Inc. | | | 23,654 | | | | 2,181,608 | |
| | | | | | | | |
| | | | | | $ | 27,255,312 | |
| | | | | | | | |
Total Common Stocks
(Identified Cost, $241,794,158) | | | $ | 334,436,935 | |
| | | | | | | | |
|
| INVESTMENT COMPANIES (h) – 0.4% | |
| Money Market Funds – 0.4% | | | | | | | | |
| MFS Institutional Money Market Portfolio, 1.7% (v) (Identified Cost, $1,410,369) | | | 1,410,369 | | | $ | 1,410,369 | |
| | | | | | | | |
OTHER ASSETS, LESS
LIABILITIES – 0.0% | | | | | | | 1,894 | |
| | | | | | | | |
| NET ASSETS – 100.0% | | | | | | $ | 335,849,198 | |
| | | | | | | | |
| (a) | | Non-income producing security. |
| (h) | | An affiliated issuer, which may be considered one in which the fund owns 5% or more of the outstanding voting securities, or a company which is under common control. At period end, the aggregate values of the fund’s investments in affiliated issuers and in unaffiliated issuers were $1,410,369 and $334,436,935, respectively. |
| (v) | | Affiliated issuer that is available only to investment companies managed by MFS. The rate quoted for the MFS Institutional Money Market Portfolio is the annualizedseven-day yield of the fund at period end. |
The following abbreviations are used in this report and are defined:
| REIT | | Real Estate Investment Trust |
See Notes to Financial Statements
10
MFS Mid Cap Value Portfolio
FINANCIAL STATEMENTS | STATEMENT OF ASSETS AND LIABILITIES
This statement represents your fund’s balance sheet, which details the assets and liabilities comprising the total value of the fund.
| | | | |
At 12/31/19 | | | | |
| |
Assets | | | | |
Investments in unaffiliated issuers, at value (identified cost, $241,794,158) | | | $334,436,935 | |
Investments in affiliated issuers, at value (identified cost, $1,410,369) | | | 1,410,369 | |
Receivables for | | | | |
Fund shares sold | | | 129,911 | |
Interest and dividends | | | 532,044 | |
Other assets | | | 1,989 | |
Total assets | | | $336,511,248 | |
| |
Liabilities | | | | |
Payables for | | | | |
Investments purchased | | | $24 | |
Fund shares reacquired | | | 584,020 | |
Payable to affiliates | | | | |
Investment adviser | | | 13,595 | |
Administrative services fee | | | 289 | |
Shareholder servicing costs | | | 34 | |
Distribution and/or service fees | | | 1,011 | |
Payable for independent Trustees’ compensation | | | 38 | |
Accrued expenses and other liabilities | | | 63,039 | |
Total liabilities | | | $662,050 | |
Net assets | | | $335,849,198 | |
| |
Net assets consist of | | | | |
Paid-in capital | | | $227,797,940 | |
Total distributable earnings (loss) | | | 108,051,258 | |
Net assets | | | $335,849,198 | |
Shares of beneficial interest outstanding | | | 38,519,215 | |
| | | | | | | | | | | | |
| | | |
| | | Net assets | | | Shares
outstanding | | | Net asset value
per share | |
Initial Class | | | $261,831,688 | | | | 29,961,954 | | | | $8.74 | |
Service Class | | | 74,017,510 | | | | 8,557,261 | | | | 8.65 | |
See Notes to Financial Statements
11
MFS Mid Cap Value Portfolio
FINANCIAL STATEMENTS | STATEMENT OF OPERATIONS
This statement describes how much your fund earned in investment income and accrued in expenses. It also describes any gains and/or losses generated by fund operations.
| | | | |
Year ended 12/31/19 | | | | |
| |
Net investment income (loss) | | | | |
Income | | | | |
Dividends | | | $6,267,652 | |
Dividends from affiliated issuers | | | 85,084 | |
Other | | | 24,551 | |
Income on securities loaned | | | 6,682 | |
Foreign taxes withheld | | | (4,718 | ) |
Total investment income | | | $6,379,251 | |
Expenses | | | | |
Management fee | | | $2,264,044 | |
Distribution and/or service fees | | | 162,597 | |
Shareholder servicing costs | | | 8,812 | |
Administrative services fee | | | 51,241 | |
Independent Trustees’ compensation | | | 10,259 | |
Custodian fee | | | 16,299 | |
Shareholder communications | | | 14,106 | |
Audit and tax fees | | | 56,365 | |
Legal fees | | | 2,468 | |
Miscellaneous | | | 30,607 | |
Total expenses | | | $2,616,798 | |
Reduction of expenses by investment adviser | | | (29,481 | ) |
Net expenses | | | $2,587,317 | |
Net investment income (loss) | | | $3,791,934 | |
| |
Realized and unrealized gain (loss) | | | | |
Realized gain (loss) (identified cost basis) | | | | |
Unaffiliated issuers | | | $13,250,151 | |
Affiliated issuers | | | 723 | |
Foreign currency | | | (182 | ) |
Net realized gain (loss) | | | $13,250,692 | |
Change in unrealized appreciation or depreciation | | | | |
Unaffiliated issuers | | | $64,174,123 | |
Affiliated issuers | | | 8 | |
Translation of assets and liabilities in foreign currencies | | | 254 | |
Net unrealized gain (loss) | | | $64,174,385 | |
Net realized and unrealized gain (loss) | | | $77,425,077 | |
Change in net assets from operations | | | $81,217,011 | |
See Notes to Financial Statements
12
MFS Mid Cap Value Portfolio
FINANCIAL STATEMENTS | STATEMENTS OF CHANGES IN NET ASSETS
These statements describe the increases and/or decreases in net assets resulting from operations, any distributions, and any shareholder transactions.
| | | | | | | | |
| | | Year ended | |
| | | 12/31/19 | | | 12/31/18 | |
Change in net assets | | | | | | | | |
| | |
From operations | | | | | | | | |
Net investment income (loss) | | | $3,791,934 | | | | $3,514,067 | |
Net realized gain (loss) | | | 13,250,692 | | | | 25,286,869 | |
Net unrealized gain (loss) | | | 64,174,385 | | | | (62,853,455 | ) |
Change in net assets from operations | | | $81,217,011 | | | | $(34,052,519 | ) |
Total distributions to shareholders | | | $(28,645,592 | ) | | | $(23,606,272 | ) |
Change in net assets from fund share transactions | | | $17,222,164 | | | | $(30,219,129 | ) |
Total change in net assets | | | $69,793,583 | | | | $(87,877,920 | ) |
| | |
Net assets | | | | | | | | |
At beginning of period | | | 266,055,615 | | | | 353,933,535 | |
At end of period | | | $335,849,198 | | | | $266,055,615 | |
See Notes to Financial Statements
13
MFS Mid Cap Value Portfolio
FINANCIAL STATEMENTS | FINANCIAL HIGHLIGHTS
The financial highlights table is intended to help you understand the fund’s financial performance for the past 5 years. Certain information reflects financial results for a single fund share. The total returns in the table represent the rate that an investor would have earned (or lost) on an investment in the fund share class (assuming reinvestment of all distributions) held for the entire period.
| | | | | | | | | | | | | | | | | | | | |
| Initial Class | | Year ended | |
| | | | | |
| | | 12/31/19 | | | 12/31/18 | | | 12/31/17 | | | 12/31/16 | | | 12/31/15 | |
| | | | | |
Net asset value, beginning of period | | | $7.42 | | | | $9.01 | | | | $8.29 | | | | $7.84 | | | | $9.80 | |
| | | | | |
| Income (loss) from investment operations | | | | | | | | | | | | | | | | | | | | |
Net investment income (loss) (d) | | | $0.11 | | | | $0.10 | | | | $0.07 | | | | $0.10 | (c) | | | $0.08 | |
Net realized and unrealized gain (loss) | | | 2.09 | | | | (1.03 | ) | | | 1.03 | | | | 1.12 | | | | (0.37 | ) |
Total from investment operations | | | $2.20 | | | | $(0.93 | ) | | | $1.10 | | | | $1.22 | | | | $(0.29 | ) |
| | | | | |
| Less distributions declared to shareholders | | | | | | | | | | | | | | | | | | | | |
From net investment income | | | $(0.12 | ) | | | $(0.08 | ) | | | $(0.11 | ) | | | $(0.07 | ) | | | $(0.10 | ) |
From net realized gain | | | (0.76 | ) | | | (0.58 | ) | | | (0.27 | ) | | | (0.70 | ) | | | (1.57 | ) |
Total distributions declared to shareholders | | | $(0.88 | ) | | | $(0.66 | ) | | | $(0.38 | ) | | | $(0.77 | ) | | | $(1.67 | ) |
Net asset value, end of period (x) | | | $8.74 | | | | $7.42 | | | | $9.01 | | | | $8.29 | | | | $7.84 | |
Total return (%) (k)(r)(s)(x) | | | 31.12 | | | | (11.45 | ) | | | 13.67 | | | | 15.98 | (c) | | | (2.33 | ) |
| | | | | |
Ratios (%) (to average net assets)
and Supplemental data: | | | | | | | | | | | | | | | | | | | | |
Expenses before expense reductions (f) | | | 0.81 | | | | 0.81 | | | | 0.81 | | | | 0.77 | (c) | | | 0.82 | |
Expenses after expense reductions (f) | | | 0.80 | | | | 0.80 | | | | 0.81 | | | | 0.76 | (c) | | | 0.81 | |
Net investment income (loss) | | | 1.31 | | | | 1.13 | | | | 0.82 | | | | 1.31 | (c) | | | 0.82 | |
Portfolio turnover | | | 30 | | | | 32 | | | | 36 | | | | 32 | | | | 51 | |
Net assets at end of period (000 omitted) | | | $261,832 | | | | $210,218 | | | | $268,291 | | | | $271,001 | | | | $274,753 | |
| |
| Service Class | | Year ended | |
| | | | | |
| | | 12/31/19 | | | 12/31/18 | | | 12/31/17 | | | 12/31/16 | | | 12/31/15 | |
| | | | | |
Net asset value, beginning of period | | | $7.35 | | | | $8.93 | | | | $8.22 | | | | $7.78 | | | | $9.74 | |
| | | | | |
| Income (loss) from investment operations | | | | | | | | | | | | | | | | | | | | |
Net investment income (loss) (d) | | | $0.09 | | | | $0.08 | | | | $0.05 | | | | $0.08 | (c) | | | $0.06 | |
Net realized and unrealized gain (loss) | | | 2.06 | | | | (1.02 | ) | | | 1.02 | | | | 1.12 | | | | (0.38 | ) |
Total from investment operations | | | $2.15 | | | | $(0.94 | ) | | | $1.07 | | | | $1.20 | | | | $(0.32 | ) |
| | | | | |
| Less distributions declared to shareholders | | | | | | | | | | | | | | | | | | | | |
From net investment income | | | $(0.09 | ) | | | $(0.06 | ) | | | $(0.09 | ) | | | $(0.06 | ) | | | $(0.07 | ) |
From net realized gain | | | (0.76 | ) | | | (0.58 | ) | | | (0.27 | ) | | | (0.70 | ) | | | (1.57 | ) |
Total distributions declared to shareholders | | | $(0.85 | ) | | | $(0.64 | ) | | | $(0.36 | ) | | | $(0.76 | ) | | | $(1.64 | ) |
Net asset value, end of period (x) | | | $8.65 | | | | $7.35 | | | | $8.93 | | | | $8.22 | | | | $7.78 | |
Total return (%) (k)(r)(s)(x) | | | 30.71 | | | | (11.61 | ) | | | 13.41 | | | | 15.76 | (c) | | | (2.66 | ) |
| | | | | |
Ratios (%) (to average net assets)
and Supplemental data: | | | | | | | | | | | | | | | | | | | | |
Expenses before expense reductions (f) | | | 1.06 | | | | 1.06 | | | | 1.06 | | | | 1.02 | (c) | | | 1.07 | |
Expenses after expense reductions (f) | | | 1.05 | | | | 1.05 | | | | 1.05 | | | | 1.01 | (c) | | | 1.06 | |
Net investment income (loss) | | | 1.06 | | | | 0.86 | | | | 0.59 | | | | 1.06 | (c) | | | 0.62 | |
Portfolio turnover | | | 30 | | | | 32 | | | | 36 | | | | 32 | | | | 51 | |
Net assets at end of period (000 omitted) | | | $74,018 | | | | $55,837 | | | | $85,643 | | | | $59,545 | | | | $55,100 | |
See Notes to Financial Statements
14
MFS Mid Cap Value Portfolio
Financial Highlights – continued
| (c) | Amount reflects aone-time reimbursement of expenses by the custodian (or former custodian) without which net investment income and performance would be lower and expenses would be higher. |
| (d) | Per share data is based on average shares outstanding. |
| (f) | Ratios do not reflect reductions from fees paid indirectly, if applicable. |
| (k) | The total return does not reflect expenses that apply to separate accounts. Inclusion of these charges would reduce the total return figures for all periods shown. |
| (r) | Certain expenses have been reduced without which performance would have been lower. |
| (s) | From time to time the fund may receive proceeds from litigation settlements, without which performance would be lower. |
| (x) | The net asset values and total returns have been calculated on net assets which include adjustments made in accordance with U.S. generally accepted accounting principles required at period end for financial reporting purposes. |
See Notes to Financial Statements
15
MFS Mid Cap Value Portfolio
NOTES TO FINANCIAL STATEMENTS
| (1) | | Business and Organization |
MFS Mid Cap Value Portfolio (the fund) is a diversified series of MFS Variable Insurance Trust III (the trust). The trust is organized as a Delaware statutory trust and is registered under the Investment Company Act of 1940, as amended, as anopen-end management investment company. The shareholders of each series of the trust are separate accounts of insurance companies, which offer variable annuity and/or life insurance products, and qualified retirement and pension plans.
The fund is an investment company and accordingly follows the investment company accounting and reporting guidance of the Financial Accounting Standards Board (FASB) Accounting Standards Codification Topic 946 Financial Services – Investment Companies.
| (2) | | Significant Accounting Policies |
General– The preparation of financial statements in conformity with U.S. generally accepted accounting principles requires management to make estimates and assumptions that affect the reported amounts of assets and liabilities, and disclosure of contingent assets and liabilities at the date of the financial statements and the reported amounts of increases and decreases in net assets from operations during the reporting period. Actual results could differ from those estimates. In the preparation of these financial statements, management has evaluated subsequent events occurring after the date of the fund’s Statement of Assets and Liabilities through the date that the financial statements were issued.
Balance Sheet Offsetting– The fund’s accounting policy with respect to balance sheet offsetting is that, absent an event of default by the counterparty or a termination of the agreement, the International Swaps and Derivatives Association (ISDA) Master Agreement, or similar agreement, does not result in an offset of reported amounts of financial assets and financial liabilities in the Statement of Assets and Liabilities across transactions between the fund and the applicable counterparty. The fund’s right to setoff may be restricted or prohibited by the bankruptcy or insolvency laws of the particular jurisdiction to which a specific master netting agreement counterparty is subject. Balance sheet offsetting disclosures, to the extent applicable to the fund, have been included in the fund’s Significant Accounting Policies note under the captions for each of the fund’sin-scope financial instruments and transactions.
Investment Valuations– Equity securities, including restricted equity securities, are generally valued at the last sale or official closing price on their primary market or exchange as provided by a third-party pricing service. Equity securities, for which there were no sales reported that day, are generally valued at the last quoted daily bid quotation on their primary market or exchange as provided by a third-party pricing service. Short-term instruments with a maturity at issuance of 60 days or less may be valued at amortized cost, which approximates market value.Open-end investment companies are generally valued at net asset value per share. Securities and other assets generally valued on the basis of information from a third-party pricing service may also be valued at a broker/dealer bid quotation. In determining values, third-party pricing services can utilize both transaction data and market information such as yield, quality, coupon rate, maturity, type of issue, trading characteristics, and other market data. The values of foreign securities and other assets and liabilities expressed in foreign currencies are converted to U.S. dollars using the mean of bid and asked prices for rates provided by a third-party pricing service.
The Board of Trustees has delegated primary responsibility for determining or causing to be determined the value of the fund’s investments (including any fair valuation) to the adviser pursuant to valuation policies and procedures approved by the Board. If the adviser determines that reliable market quotations are not readily available, investments are valued at fair value as determined in good faith by the adviser in accordance with such procedures under the oversight of the Board of Trustees. Under the fund’s valuation policies and procedures, market quotations are not considered to be readily available for most types of debt instruments and floating rate loans and many types of derivatives. These investments are generally valued at fair value based on information from third-party pricing services. In addition, investments may be valued at fair value if the adviser determines that an investment’s value has been materially affected by events occurring after the close of the exchange or market on which the investment is principally traded (such as foreign exchange or market) and prior to the determination of the fund’s net asset value, or after the halt of trading of a specific security where trading does not resume prior to the close of the exchange or market on which the security is principally traded. Events that occur after foreign markets close (such as developments in foreign markets and significant movements in the U.S. markets) and prior to the determination of the fund’s net asset value may be deemed to have a material effect on the value of securities traded in foreign markets. Accordingly, the fund’s foreign equity securities may often be valued at fair value. The adviser generally relies on third-party pricing services or other information (such as the correlation with price movements of similar securities in the same or other markets; the type, cost and investment characteristics of the security; the business and financial condition of the issuer; and trading and other market data) to assist in determining whether to fair value and at what value to fair value an investment. The value of an investment for purposes of calculating the fund’s net asset value can differ depending on the source and method used to determine value. When fair valuation is used, the value of an investment used to determine the fund’s net asset value may differ from quoted or published prices for the same investment. There can be no assurance that the fund could obtain the fair value assigned to an investment if it were to sell the investment at the same time at which the fund determines its net asset value per share.
16
MFS Mid Cap Value Portfolio
Notes to Financial Statements – continued
Various inputs are used in determining the value of the fund’s assets or liabilities. These inputs are categorized into three broad levels. In certain cases, the inputs used to measure fair value may fall into different levels of the fair value hierarchy. In such cases, an investment’s level within the fair value hierarchy is based on the lowest level of input that is significant to the fair value measurement. The fund’s assessment of the significance of a particular input to the fair value measurement in its entirety requires judgment, and considers factors specific to the investment. Level 1 includes unadjusted quoted prices in active markets for identical assets or liabilities. Level 2 includes other significant observable market-based inputs (including quoted prices for similar securities, interest rates, prepayment speed, and credit risk). Level 3 includes unobservable inputs, which may include the adviser’s own assumptions in determining the fair value of investments. The following is a summary of the levels used as of December 31, 2019 in valuing the fund’s assets or liabilities:
| | | | | | | | | | | | | | | | |
| Financial Instruments | | Level 1 | | | Level 2 | | | Level 3 | | | Total | |
| Equity Securities | | | $334,436,935 | | | | $— | | | | $— | | | | $334,436,935 | |
| Mutual Funds | | | 1,410,369 | | | | — | | | | — | | | | 1,410,369 | |
| Total | | | $335,847,304 | | | | $— | | | | $— | | | | $335,847,304 | |
For further information regarding security characteristics, see the Portfolio of Investments.
Foreign Currency Translation– Purchases and sales of foreign investments, income, and expenses are converted into U.S. dollars based upon currency exchange rates prevailing on the respective dates of such transactions or on the reporting date for foreign denominated receivables and payables. Gains and losses attributable to foreign currency exchange rates on sales of securities are recorded for financial statement purposes as net realized gains and losses on investments. Gains and losses attributable to foreign exchange rate movements on receivables, payables, income and expenses are recorded for financial statement purposes as foreign currency transaction gains and losses. That portion of both realized and unrealized gains and losses on investments that results from fluctuations in foreign currency exchange rates is not separately disclosed.
Security Loans– Under its Securities Lending Agency Agreement with the fund, State Street Bank and Trust Company, as lending agent, loans the securities of the fund to certain qualified institutions (the “Borrowers”) approved by the fund. Security loans can be terminated at the discretion of either the lending agent or the fund and the related securities must be returned within the earlier of the standard trade settlement period for such securities or within three business days. The loans are collateralized by cash and/or U.S. Treasury and federal agency obligations in an amount typically at least equal to the market value of the securities loaned. On loans collateralized by cash, the cash collateral is invested in a money market fund. The market value of the loaned securities is determined at the close of business of the fund and any additional required collateral is delivered to the fund on the next business day. The lending agent provides the fund with indemnification against Borrower default. In the event of Borrower default, the lending agent will, for the benefit of the fund, either purchase securities identical to those loaned or, when such purchase is commercially impracticable, pay the fund the market value of the loaned securities. In return, the lending agent assumes the fund’s rights to the related collateral. If the collateral value is less than the cost to purchase identical securities, the lending agent is responsible for the shortfall, but only to the extent that such shortfall is not due to a decline in collateral value resulting from collateral reinvestment for which the fund bears the risk of loss. A portion of the income generated upon investment of the collateral is remitted to the Borrowers, and the remainder is allocated between the fund and the lending agent. On loans collateralized by U.S. Treasury and/or federal agency obligations, a fee is received from the Borrower, and is allocated between the fund and the lending agent. Income from securities lending is separately reported in the Statement of Operations. The dividend and interest income earned on the securities loaned is accounted for in the same manner as other dividend and interest income. At December 31, 2019, there were no securities on loan or collateral outstanding.
Indemnifications– Under the fund’s organizational documents, its officers and Trustees may be indemnified against certain liabilities and expenses arising out of the performance of their duties to the fund. Additionally, in the normal course of business, the fund enters into agreements with service providers that may contain indemnification clauses. The fund’s maximum exposure under these agreements is unknown as this would involve future claims that may be made against the fund that have not yet occurred.
Investment Transactions and Income– Investment transactions are recorded on the trade date. Interest income is recorded on the accrual basis. Dividends received in cash are recorded on theex-dividend date. Certain dividends from foreign securities will be recorded when the fund is informed of the dividend if such information is obtained subsequent to theex-dividend date. Dividend payments received in additional securities are recorded on theex-dividend date in an amount equal to the value of the security on such date.
The fund may receive proceeds from litigation settlements. Any proceeds received from litigation involving portfolio holdings are reflected in the Statement of Operations in realized gain/loss if the security has been disposed of by the fund or in unrealized gain/loss if the security is still held by the fund. Any other proceeds from litigation not related to portfolio holdings are reflected as other income in the Statement of Operations.
Tax Matters and Distributions– The fund intends to qualify as a regulated investment company, as defined under Subchapter M of the Internal Revenue Code, and to distribute all of its taxable income, including realized capital gains. As a result, no provision for
17
MFS Mid Cap Value Portfolio
Notes to Financial Statements – continued
federal income tax is required. The fund’s federal tax returns, when filed, will remain subject to examination by the Internal Revenue Service for a three year period. Management has analyzed the fund’s tax positions taken on federal and state tax returns for all open tax years and does not believe that there are any uncertain tax positions that require recognition of a tax liability. Foreign taxes, if any, have been accrued by the fund in the accompanying financial statements in accordance with the applicable foreign tax law. Foreign income taxes may be withheld by certain countries in which the fund invests. Additionally, capital gains realized by the fund on securities issued in or by certain foreign countries may be subject to capital gains tax imposed by those countries.
Distributions to shareholders are recorded on theex-dividend date. Income and capital gain distributions are determined in accordance with income tax regulations, which may differ from U.S. generally accepted accounting principles. Certain capital accounts in the financial statements are periodically adjusted for permanent differences in order to reflect their tax character. These adjustments have no impact on net assets or net asset value per share. Temporary differences which arise from recognizing certain items of income, expense, gain or loss in different periods for financial statement and tax purposes will reverse at some time in the future.
Book/tax differences primarily relate to wash sale loss deferrals.
The tax character of distributions declared to shareholders for the last two fiscal years is as follows:
| | | | | | | | |
| | | Year ended
12/31/19 | | | Year ended
12/31/18 | |
| Ordinary income (including any short-term capital gains) | | | $5,670,312 | | | | $6,261,207 | |
| Long-term capital gains | | | 22,975,280 | | | | 17,345,065 | |
| Total distributions | | | $28,645,592 | | | | $23,606,272 | |
The federal tax cost and the tax basis components of distributable earnings were as follows:
| | | | |
| As of 12/31/19 | | | | |
| |
| Cost of investments | | | $244,864,112 | |
| Gross appreciation | | | 97,738,509 | |
| Gross depreciation | | | (6,755,317 | ) |
| Net unrealized appreciation (depreciation) | | | $90,983,192 | |
| |
| Undistributed ordinary income | | | 6,024,139 | |
| Undistributed long-term capital gain | | | 11,044,012 | |
| Other temporary differences | | | (85 | ) |
Multiple Classes of Shares of Beneficial Interest– The fund offers multiple classes of shares, which differ in their respective distribution and/or service fees. The fund’s income, realized and unrealized gain (loss), and common expenses are allocated to shareholders based on the daily net assets of each class. Dividends are declared separately for each class. Differences in per share dividend rates are generally due to differences in separate class expenses. The fund’s distributions declared to shareholders as reported in the Statements of Changes in Net Assets are presented by class as follows:
| | | | | | | | |
| | |
| | | Year ended
12/31/19 | | | Year ended
12/31/18 | |
| Initial Class | | | $22,502,110 | | | | $17,712,563 | |
| Service Class | | | 6,143,482 | | | | 5,893,709 | |
| Total | | | $28,645,592 | | | | $23,606,272 | |
| (3) | | Transactions with Affiliates |
Investment Adviser– The fund has an investment advisory agreement with MFS to provide overall investment management and related administrative services and facilities to the fund. The management fee is computed daily and paid monthly at the following annual rates based on the fund’s average daily net assets:
| | | | |
| Up to $1 billion | | | 0.75% | |
| In excess of $1 billion | | | 0.70% | |
MFS has agreed in writing to reduce its management fee by a specified amount if certain MFS mutual fund assets exceed thresholds agreed to by MFS and the fund’s Board of Trustees. For the year ended December 31, 2019, this management fee reduction amounted to $29,481, which is included in the reduction of total expenses in the Statement of Operations. The management fee incurred for the year ended December 31, 2019 was equivalent to an annual effective rate of 0.74% of the fund’s average daily net assets.
Distributor– MFS Fund Distributors, Inc. (MFD), a wholly-owned subsidiary of MFS, is the distributor of shares of the fund. The Trustees have adopted a distribution plan for the Service Class shares pursuant to Rule12b-1 under the Investment Company Act of 1940.
18
MFS Mid Cap Value Portfolio
Notes to Financial Statements – continued
The fund’s distribution plan provides that the fund will pay MFD distribution and/or service fees equal to 0.25% per annum of its average daily net assets attributable to Service Class shares as partial consideration for services performed and expenses incurred by MFD and financial intermediaries (including participating insurance companies that invest in the fund to fund variable annuity and variable life insurance contracts, sponsors of qualified retirement and pension plans that invest in the fund, and affiliates of these participating insurance companies and plan sponsors) in connection with the sale and distribution of the Service Class shares. MFD may subsequently pay all, or a portion, of the distribution and/or service fees to financial intermediaries.
Shareholder Servicing Agent– MFS Service Center, Inc. (MFSC), a wholly-owned subsidiary of MFS, receives a fee from the fund for its services as shareholder servicing agent. For the year ended December 31, 2019, the fee was $8,073, which equated to 0.0027% annually of the fund’s average daily net assets. MFSC also receives payment from the fund forout-of-pocket expenses paid by MFSC on behalf of the fund. For the year ended December 31, 2019, these costs amounted to $739.
Administrator– MFS provides certain financial, legal, shareholder communications, compliance, and other administrative services to the fund. Under an administrative services agreement, the fund reimburses MFS the costs incurred to provide these services. The fund is charged an annual fixed amount of $17,500 plus a fee based on average daily net assets. The administrative services fee incurred for the year ended December 31, 2019 was equivalent to an annual effective rate of 0.0170% of the fund’s average daily net assets.
Trustees’ and Officers’ Compensation– The fund pays compensation to independent Trustees in the form of a retainer, attendance fees, and additional compensation to Board and Committee chairpersons. The fund does not pay compensation directly to Trustees or officers of the fund who are also officers of the investment adviser, all of whom receive remuneration from MFS for their services to the fund. Certain officers and Trustees of the fund are officers or directors of MFS, MFD, and MFSC.
Other– This fund and certain other funds managed by MFS (the funds) had entered into a service agreement (the ISO Agreement) which provided for payment of fees solely by the funds to Tarantino LLC in return for the provision of services of an Independent Senior Officer (ISO) for the funds. Frank L. Tarantino served as the ISO and was an officer of the funds and the sole member of Tarantino LLC. Effective June 30, 2019, Mr. Tarantino retired from his position as ISO for the funds, and the ISO Agreement was terminated. For the year ended December 31, 2019, the fee paid by the fund under this agreement was $343 and is included in “Miscellaneous” expense in the Statement of Operations. MFS had agreed to bear all expenses associated with office space, other administrative support, and supplies provided to the ISO.
The fund invests in the MFS Institutional Money Market Portfolio which is managed by MFS and seeks current income consistent with preservation of capital and liquidity. This money market fund does not pay a management fee to MFS.
The fund is permitted to engage in purchase and sale transactions with funds and accounts for which MFS serves as investment adviser orsub-adviser (“cross-trades”) pursuant to a policy adopted by the Board of Trustees. This policy has been designed to ensure that cross-trades conducted by the fund comply with Rule17a-7 under the Investment Company Act of 1940. During the year ended December 31, 2019, the fund engaged in purchase and sale transactions pursuant to this policy, which amounted to $74,160 and $277,539, respectively. The sales transactions resulted in net realized gains (losses) of $179,801.
The adviser has voluntarily undertaken to reimburse the fund from its own resources on a quarterly basis for the cost of investment research embedded in the cost of the fund’s securities trades. This agreement may be rescinded at any time. For the year ended December 31, 2019, this reimbursement amounted to $21,707, which is included in “Other” income in the Statement of Operations.
For the year ended December 31, 2019, purchases and sales of investments, other than short-term obligations, aggregated $87,619,544 and $91,441,593, respectively.
| (5) | | Shares of Beneficial Interest |
The fund’s Declaration of Trust permits the Trustees to issue an unlimited number of full and fractional shares of beneficial interest. Transactions in fund shares were as follows:
| | | | | | | | | | | | | | | | |
| | | Year ended 12/31/19 | | | Year ended 12/31/18 | |
| | | | |
| | | Shares | | | Amount | | | Shares | | | Amount | |
| Shares sold | | | | | | | | | | | | | | | | |
Initial Class | | | 5,000,384 | | | | $40,867,519 | | | | 1,537,323 | | | | $12,807,175 | |
Service Class | | | 1,262,425 | | | | 10,332,654 | | | | 704,611 | | | | 5,837,659 | |
| | | 6,262,809 | | | | $51,200,173 | | | | 2,241,934 | | | | $18,644,834 | |
| | | | |
| Shares issued to shareholders in reinvestment of distributions | | | | | | | | | | | | | | | | |
Initial Class | | | 2,918,562 | | | | $22,502,110 | | | | 2,003,667 | | | | $17,712,418 | |
Service Class | | | 804,121 | | | | 6,143,482 | | | | 673,567 | | | | 5,893,709 | |
| | | 3,722,683 | | | | $28,645,592 | | | | 2,677,234 | | | | $23,606,127 | |
19
MFS Mid Cap Value Portfolio
Notes to Financial Statements – continued
| | | | | | | | | | | | | | | | |
| | | Year ended 12/31/19 | | | Year ended 12/31/18 | |
| | | | |
| | | Shares | | | Amount | | | Shares | | | Amount | |
| Shares reacquired | | | | | | | | | | | | | | | | |
Initial Class | | | (6,280,151 | ) | | | $(53,313,116 | ) | | | (4,984,368 | ) | | | $(44,609,006 | ) |
Service Class | | | (1,108,297 | ) | | | (9,310,485 | ) | | | (3,367,267 | ) | | | (27,861,084 | ) |
| | | (7,388,448 | ) | | | $(62,623,601 | ) | | | (8,351,635 | ) | | | $(72,470,090 | ) |
| | | | |
| Net change | | | | | | | | | | | | | | | | |
Initial Class | | | 1,638,795 | | | | $10,056,513 | | | | (1,443,378 | ) | | | $(14,089,413 | ) |
Service Class | | | 958,249 | | | | 7,165,651 | | | | (1,989,089 | ) | | | (16,129,716 | ) |
| | | 2,597,044 | | | | $17,222,164 | | | | (3,432,467 | ) | | | $(30,219,129 | ) |
The fund is one of several mutual funds in which certain MFS funds may invest. The MFS funds do not invest in the underlying funds for the purpose of exercising management or control. At the end of the period, the MFS Moderate Allocation Portfolio, the MFS Growth Allocation Portfolio, and the MFS Conservative Allocation Portfolio were the owners of record of approximately 30%, 10%, and 5%, respectively, of the value of outstanding voting shares of the fund.
The fund and certain other funds managed by MFS participate in a $1.25 billion unsecured committed line of credit, subject to a $1 billion sublimit, provided by a syndicate of banks under a credit agreement. Borrowings may be made for temporary financing needs. Interest is charged to each fund, based on its borrowings, generally at a rate equal to the highest of one month LIBOR, the Federal Funds Effective Rate and the Overnight Bank Funding Rate, plus an agreed upon spread. A commitment fee, based on the average daily, unused portion of the committed line of credit, is allocated among the participating funds. In addition, the fund and other funds managed by MFS have established unsecured uncommitted borrowing arrangements with certain banks for temporary financing needs. Interest is charged to each fund, based on its borrowings, at rates equal to customary reference rates plus an agreed upon spread. For the year ended December 31, 2019, the fund’s commitment fee and interest expense were $1,604 and $0, respectively, and are included in “Miscellaneous” expense in the Statement of Operations.
| (7) | | Investments in Affiliated Issuers |
An affiliated issuer may be considered one in which the fund owns 5% or more of the outstanding voting securities, or a company which is under common control. For the purposes of this report, the following were affiliated issuers:
| | | | | | | | | | | | | | | | | | | | | | | | |
| Affiliated Issuers | | Beginning
Value | | | Purchases | | | Sales
Proceeds | | | Realized
Gain
(Loss) | | | Change in
Unrealized
Appreciation or
Depreciation | | | Ending
Value | |
| MFS Institutional Money Market Portfolio | | | $4,541,238 | | | | $75,438,169 | | | | $78,569,769 | | | | $723 | | | | $8 | | | | $1,410,369 | |
| | | | | | |
| Affiliated Issuers | | | | | | | | | | | | | | Dividend
Income | | | Capital Gain
Distributions | |
| MFS Institutional Money Market Portfolio | | | | | | | | | | | | | | | | | | | $85,084 | | | | $— | |
20
MFS Mid Cap Value Portfolio
REPORT OF INDEPENDENT REGISTERED PUBLIC ACCOUNTING FIRM
To the Board of Trustees of MFS Variable Insurance Trust III and the Shareholders of MFS Mid Cap Value Portfolio:
Opinion on the Financial Statements and Financial Highlights
We have audited the accompanying statement of assets and liabilities of MFS Mid Cap Value Portfolio (the “Fund”), including the portfolio of investments, as of December 31, 2019, the related statement of operations for the year then ended, the statements of changes in net assets for each of the two years in the period then ended, the financial highlights for each of the five years in the period then ended, and the related notes. In our opinion, the financial statements and financial highlights present fairly, in all material respects, the financial position of the Fund as of December 31, 2019, and the results of its operations for the year then ended, the changes in its net assets for each of the two years in the period then ended, and the financial highlights for each of the five years in the period then ended, in conformity with accounting principles generally accepted in the United States of America.
Basis for Opinion
These financial statements and financial highlights are the responsibility of the Fund’s management. Our responsibility is to express an opinion on the Fund’s financial statements and financial highlights based on our audits. We are a public accounting firm registered with the Public Company Accounting Oversight Board (United States) (PCAOB) and are required to be independent with respect to the Fund in accordance with the U.S. federal securities laws and the applicable rules and regulations of the Securities and Exchange Commission and the PCAOB.
We conducted our audits in accordance with the standards of the PCAOB. Those standards require that we plan and perform the audit to obtain reasonable assurance about whether the financial statements and financial highlights are free of material misstatement, whether due to error or fraud. The Fund is not required to have, nor were we engaged to perform, an audit of its internal control over financial reporting. As part of our audits we are required to obtain an understanding of internal control over financial reporting but not for the purpose of expressing an opinion on the effectiveness of the Fund’s internal control over financial reporting. Accordingly, we express no such opinion.
Our audits included performing procedures to assess the risks of material misstatement of the financial statements and financial highlights, whether due to error or fraud, and performing procedures that respond to those risks. Such procedures included examining, on a test basis, evidence regarding the amounts and disclosures in the financial statements and financial highlights. Our audits also included evaluating the accounting principles used and significant estimates made by management, as well as evaluating the overall presentation of the financial statements and financial highlights. Our procedures included confirmation of securities owned as of December 31, 2019, by correspondence with the custodian and brokers; when replies were not received from brokers, we performed other auditing procedures. We believe that our audits provide a reasonable basis for our opinion.
DELOITTE & TOUCHE LLP
Boston, Massachusetts
February 14, 2020
We have served as the auditor of one or more of the MFS investment companies since 1924.
21
MFS Mid Cap Value Portfolio
TRUSTEES AND OFFICERS – IDENTIFICATION AND BACKGROUND
The Trustees and Officers of the Trust, as of February 1, 2020, are listed below, together with their principal occupations during the past five years. (Their titles may have varied during that period.) The address of each Trustee and Officer is 111 Huntington Avenue, Boston, Massachusetts 02199-7618.
| | | | | | | | | | |
Name, Age | | Position(s)
Held with Fund | | Trustee/Officer
Since (h) | | Number of MFS Funds
overseen by the
Trustee | | Principal Occupations
During the Past Five Years | | Other Directorships During the Past Five Years (j) |
| INTERESTED TRUSTEES |
Robert J. Manning (k)
(age 56) | | Trustee | | February 2004 | | 133 | | Massachusetts Financial Services Company, Executive Chairman (since January 2017); Director; Chairman of the Board; Chief Executive Officer (until 2015);Co-Chief Executive Officer(2015-2016) | | N/A |
| | | | | |
Robin A. Stelmach (k) (age 58) | | Trustee | | January 2014 | | 133 | | Massachusetts Financial Services Company, Vice Chair (since January 2017); Chief Operating Officer and Executive Vice President (until January 2017) | | N/A |
|
| INDEPENDENT TRUSTEES |
John P. Kavanaugh (age 65) | | Trustee and Chair of Trustees | | January 2009 | | 133 | | Private investor | | N/A |
| | | | | |
Steven E. Buller (age 68) | | Trustee | | February 2014 | | 133 | | Financial Accounting Standards Advisory Council, Chairman(2014-2015); Public Company Accounting Oversight Board, Standing Advisory Group, Member (until 2014); BlackRock, Inc. (investment management), Managing Director (until 2014), BlackRock Finco UK (investment management), Director (until 2014) | | N/A |
| | | | | |
John A. Caroselli (age 65) | | Trustee | | March 2017 | | 133 | | JC Global Advisors, LLC (management consulting), President (since 2015); First Capital Corporation (commercial finance), Executive Vice President (until 2015) | | N/A |
| | | | | |
Maureen R. Goldfarb (age 64) | | Trustee | | January 2009 | | 133 | | Private investor | | N/A |
| | | | | |
Peter D. Jones
(age 64) | | Trustee | | January 2019 | | 133 | | Franklin Templeton Distributors, Inc. (investment management), President (until 2015); Franklin Templeton Institutional, LLC (investment management), Chairman (until 2015) | | N/A |
| | | | | |
James W. Kilman, Jr.
(age 58) | | Trustee | | January 2019 | | 133 | | Burford Capital Limited (finance and investment management), Chief Financial Officer (since 2019); KielStrand Capital LLC (family office), Chief Executive Officer (since 2016); Morgan Stanley & Co. (financial services), Vice Chairman of Investment Banking,Co-Head of Diversified Financials Coverage – Financial Institutions Investment Banking Group (until 2016) | | Alpha-En Corporation, Director (2016-2019) |
22
MFS Mid Cap Value Portfolio
Trustees and Officers – continued
| | | | | | | | | | |
Name, Age | | Position(s)
Held with Fund | | Trustee/Officer
Since (h) | | Number of MFS Funds
overseen by the
Trustee | | Principal Occupations
During the Past Five Years | | Other Directorships During the Past Five Years (j) |
Clarence Otis, Jr. (age 63) | | Trustee | | March 2017 | | 133 | | Darden Restaurants, Inc., Chief Executive Officer (until 2014) | | VF Corporation, Director; Verizon Communications, Inc., Director; The Travelers Companies, Director; Federal Reserve Bank of Atlanta, Director (until 2015) |
| | | | | |
Maryanne L. Roepke (age 63) | | Trustee | | May 2014 | | 133 | | American Century Investments (investment management), Senior Vice President and Chief Compliance Officer (until 2014) | | N/A |
| | | | | |
Laurie J. Thomsen
(age 62) | | Trustee | | March 2005 | | 133 | | Private investor | | The Travelers Companies, Director; Dycom Industries, Inc., Director (since 2015) |
| | | | | | | | |
Name, Age | | Position(s)
Held with Fund | | Trustee/Officer
Since (h) | | Number of
MFS Funds
for which the
Person is an
Officer | | Principal Occupations During the Past Five Years |
| OFFICERS | | | | | | |
Christopher R. Bohane (k)
(age 46) | | Assistant Secretary and Assistant Clerk | | July 2005 | | 133 | | Massachusetts Financial Services Company, Vice President and Assistant General Counsel |
| | | | |
Kino Clark (k) (age 51) | | Assistant Treasurer | | January 2012 | | 133 | | Massachusetts Financial Services Company, Vice President |
| | | | |
John W. Clark, Jr. (k) (age 52) | | Assistant Treasurer | | April 2017 | | 133 | | Massachusetts Financial Services Company, Vice President (since March 2017); Deutsche Bank (financial services), Department Head –Treasurer’s Office (until February 2017) |
| | | | |
Thomas H. Connors (k) (age 60) | | Assistant Secretary and Assistant Clerk | | September 2012 | | 133 | | Massachusetts Financial Services Company, Vice President and Senior Counsel |
| | | | |
David L. DiLorenzo (k)
(age 51) | | President | | July 2005 | | 133 | | Massachusetts Financial Services Company, Senior Vice President |
| | | | |
Heidi W. Hardin (k) (age 52) | | Secretary and Clerk | | April 2017 | | 133 | | Massachusetts Financial Services Company, Executive Vice President and General Counsel (since March 2017); Harris Associates (investment management), General Counsel (from September 2015 to January 2017); Janus Capital Management LLC (investment management), Senior Vice President and General Counsel (until September 2015) |
| | | | |
Brian E. Langenfeld (k) (age 46) | | Assistant
Secretary and Assistant Clerk | | June 2006 | | 133 | | Massachusetts Financial Services Company, Vice President and Senior Counsel |
| | | | |
Amanda S. Mooradian (k) (age 40) | | Assistant
Secretary and Assistant Clerk | | September 2018 | | 133 | | Massachusetts Financial Services Company, Assistant Vice President and Counsel |
| | | | |
Susan A. Pereira (k)
(age 49) | | Assistant
Secretary and Assistant Clerk | | July 2005 | | 133 | | Massachusetts Financial Services Company, Vice President and Assistant General Counsel |
| | | | |
Kasey L. Phillips (k) (age 49) | | Assistant Treasurer | | September 2012 | | 133 | | Massachusetts Financial Services Company, Vice President |
| | | | |
Matthew A. Stowe (k) (age 45) | | Assistant Secretary and Assistant Clerk | | October 2014 | | 133 | | Massachusetts Financial Services Company, Vice President and Assistant General Counsel |
23
MFS Mid Cap Value Portfolio
Trustees and Officers – continued
| | | | | | | | |
Name, Age | | Position(s)
Held with Fund | | Trustee/Officer
Since (h) | | Number of
MFS Funds
for which the
Person is an
Officer | | Principal Occupations During the Past Five Years |
Martin J. Wolin (k) (age 52) | | Chief Compliance Officer | | July 2015 | | 133 | | Massachusetts Financial Services Company, Senior Vice President and Chief Compliance Officer (since July 2015); Mercer (financial service provider), Chief Risk and Compliance Officer, North America and Latin America (until June 2015) |
| | | | |
James O. Yost (k)
(age 59) | | Treasurer | | September 1990 | | 133 | | Massachusetts Financial Services Company, Senior Vice President |
| (h) | Date first appointed to serve as Trustee/officer of an MFS Fund. Each Trustee has served continuously since appointment unless indicated otherwise. For the period from December 15, 2004 until February 22, 2005, Mr. Manning served as Advisory Trustee. From January 2012 through December 2016, Messrs. DiLorenzo and Yost served as Treasurer and Deputy Treasurer of the Funds, respectively. |
| (j) | Directorships or trusteeships of companies required to report to the Securities and Exchange Commission (i.e., “public companies”). |
| (k) | “Interested person” of the Trust within the meaning of the Investment Company Act of 1940 (referred to as the 1940 Act), which is the principal federal law governing investment companies like the fund, as a result of a position with MFS. The address of MFS is 111 Huntington Avenue, Boston, Massachusetts 02199-7618. |
Each Trustee (other than Messrs. Jones and Kilman) has been elected by shareholders and each Trustee and Officer holds office until his or her successor is chosen and qualified or until his or her earlier death, resignation, retirement or removal. Messrs. Jones and Kilman became Trustees of the Funds on January 1, 2019. The Trust does not hold annual meetings for the purpose of electing Trustees, and Trustees are not elected for fixed terms. Under the terms of the Board’s retirement policy, an Independent Trustee shall retire at the end of the calendar year in which he or she reaches the earlier of 75 years of age or 15 years of service on the Board (or, in the case of any Independent Trustee who joined the Board prior to 2015, 20 years of service on the Board).
Messrs. Buller, Kilman and Otis and Ms. Roepke are members of the Trust’s Audit Committee.
Each of the Interested Trustees and certain Officers hold comparable officer positions with certain affiliates of MFS.
The Statement of Additional Information for a Fund includes further information about the Trustees and is available without charge upon request by calling1-800-225-2606.
| | |
Investment Adviser Massachusetts Financial Services Company 111 Huntington Avenue Boston, MA 02199-7618 | | Custodian State Street Bank and Trust Company 1 Lincoln Street Boston, MA 02111-2900 |
| |
Distributor MFS Fund Distributors, Inc. 111 Huntington Avenue Boston, MA 02199-7618 | | Independent Registered Public Accounting Firm Deloitte & Touche LLP 200 Berkeley Street Boston, MA 02116 |
| |
Portfolio Manager(s) Kevin Schmitz Brooks Taylor | | |
24
MFS Mid Cap Value Portfolio
BOARD REVIEW OF INVESTMENT ADVISORY AGREEMENT
MFS Mid Cap Value Portfolio
The Investment Company Act of 1940 requires that both the full Board of Trustees and a majority of thenon-interested (“independent”) Trustees, voting separately, annually approve the continuation of the Fund’s investment advisory agreement with MFS. The Trustees consider matters bearing on the Fund and its advisory arrangements at their meetings throughout the year, including a review of performance data at each regular meeting. In addition, the independent Trustees met several times over the course of three months beginning in May and ending in July, 2019 (“contract review meetings”) for the specific purpose of considering whether to approve the continuation of the investment advisory agreement for the Fund and the other investment companies that the Board oversees (the “MFS Funds”). The independent Trustees were assisted in their evaluation of the Fund’s investment advisory agreement by independent legal counsel, from whom they received separate legal advice and with whom they met separately from MFS during various contract review meetings. The independent Trustees were also assisted in this process by the MFS Funds’ Independent Senior Officer, a senior officer appointed by and reporting to the independent Trustees.
In connection with their deliberations regarding the continuation of the investment advisory agreement, the Trustees, including the independent Trustees, considered such information and factors as they believed, in light of the legal advice furnished to them and their own business judgment, to be relevant. The investment advisory agreement for the Fund was considered separately, although the Trustees also took into account the common interests of all MFS Funds in their review. As described below, the Trustees considered the nature, quality, and extent of the various investment advisory, administrative, and shareholder services performed by MFS under the existing investment advisory agreement and other arrangements with the Fund.
In connection with their contract review meetings, the Trustees received and relied upon materials that included, among other items: (i) information provided by Broadridge Financial Solutions, Inc. (“Broadridge”), an independent third party, on the investment performance of the Fund for various time periods ended December 31, 2018 and the investment performance of a group of funds with substantially similar investment classifications/objectives (the “Broadridge performance universe”), (ii) information provided by Broadridge on the Fund’s advisory fees and other expenses and the advisory fees and other expenses of comparable funds identified by Broadridge as well as all other funds in the same investment classification/category (the “Broadridge expense group and universe”), (iii) information provided by MFS on the advisory fees of portfolios of other clients of MFS, including institutional separate accounts and other clients, (iv) information as to whether and to what extent applicable expense waivers, reimbursements or fee “breakpoints” are observed for the Fund, (v) information regarding MFS’ financial results and financial condition, including MFS’ and certain of its affiliates’ estimated profitability from services performed for the Fund and the MFS Funds as a whole, and compared to MFS’ institutional business, (vi) MFS’ views regarding the outlook for the mutual fund industry and the strategic business plans of MFS, (vii) descriptions of various functions performed by MFS for the Funds, such as compliance monitoring and portfolio trading practices, and (viii) information regarding the overall organization of MFS, including information about MFS’ senior management and other personnel providing investment advisory, administrative and other services to the Fund and the other MFS Funds. The comparative performance, fee and expense information prepared and provided by Broadridge was not independently verified and the independent Trustees did not independently verify any information provided to them by MFS.
The Trustees’ conclusion as to the continuation of the investment advisory agreement was based on a comprehensive consideration of all information provided to the Trustees and not the result of any single factor. Some of the factors that figured particularly in the Trustees’ deliberations are described below, although individual Trustees may have evaluated the information presented differently from one another, giving different weights to various factors. It is also important to recognize that the fee arrangements for the Fund and other MFS Funds are the result of years of review and discussion between the independent Trustees and MFS, that certain aspects of such arrangements may receive greater scrutiny in some years than in others, and that the Trustees’ conclusions may be based, in part, on their consideration of these same arrangements during the course of the year and in prior years.
Based on information provided by Broadridge and MFS, the Trustees reviewed the Fund’s total return investment performance as well as the Broadridge performance universe over various time periods. The Trustees placed particular emphasis on the total return performance of the Fund’s Initial Class shares in comparison to the performance of funds in its Broadridge performance universe over the five-year period ended December 31, 2018, which the Trustees believed was a long enough period to reflect differing market conditions. The total return performance of the Fund’s Initial Class shares was in the 2nd quintile relative to the other funds in the universe for this five-year period (the 1st quintile being the best performers and the 5th quintile being the worst performers). The total return performance of the Fund’s Initial Class shares was in the 1st quintile for theone-year period and the 2nd quintile for the three-year period ended December 31, 2018 relative to the Broadridge performance universe. Because of the passage of time, these performance results may differ from the performance results for more recent periods, including those shown elsewhere in this report.
In the course of their deliberations, the Trustees took into account information provided by MFS in connection with the contract review meetings, as well as during investment review meetings conducted with portfolio management personnel during the course of the year regarding the Fund’s performance. After reviewing these and related factors, the Trustees concluded, within the context of their overall conclusions regarding the investment advisory agreement, that they were satisfied with MFS’ responses and efforts relating to investment performance.
25
MFS Mid Cap Value Portfolio
Board Review of Investment Advisory Agreement – continued
In assessing the reasonableness of the Fund’s advisory fee, the Trustees considered, among other information, the Fund’s advisory fee and the total expense ratio of the Fund’s Initial Class shares as a percentage of average daily net assets and the advisory fee and total expense ratios of the Broadridge expense group based on information provided by Broadridge. The Trustees considered that, according to the data provided by Broadridge (which takes into account any fee reductions or expense limitations that were in effect during the Fund’s last fiscal year), the Fund’s effective advisory fee rate was approximately at the Broadridge expense group median and the Fund’s total expense ratios was lower than the Broadridge expense group median.
The Trustees also considered the advisory fees charged by MFS to any institutional separate accounts advised by MFS (“separate accounts”) and unaffiliated investment companies for which MFS serves as subadviser (“subadvised funds”) that have comparable investment strategies to the Fund, if any. In comparing these fees, the Trustees considered information provided by MFS as to the generally broader scope of services provided by MFS to the Fund, as well as the more extensive regulatory burdens imposed on MFS in managing the Fund, in comparison to separate accounts and subadvised funds. The Trustees also considered the higher demands placed on MFS’ investment personnel and trading infrastructure as a result of the daily cashin-flows andout-flows of the Fund in comparison to separate accounts.
The Trustees also considered whether the Fund may benefit from any economies of scale in the management of the Fund in the event of growth in assets of the Fund and/or growth in assets of the MFS Funds as a whole. They noted that the Fund’s advisory fee rate schedule is subject to a contractual breakpoint that reduces the Fund’s advisory fee rate on average daily net assets over $1 billion. The Trustees also noted that MFS has agreed in writing to waive a portion of the management fees of certain MFS Funds, including the Fund, if the total combined assets of certain funds within the MFS Funds’ complex increase above agreed upon thresholds (the “group fee waiver”), enabling the Fund’s shareholders to share in the benefits from any economies of scale at the complex level. The group fee waiver is reviewed and renewed annually between the Board and MFS. The Trustees concluded that the breakpoint and the group fee waiver were sufficient to allow the Fund to benefit from economies of scale as its assets and overall complex assets grow.
The Trustees also considered information prepared by MFS relating to MFS’ costs and profits with respect to the Fund, the MFS Funds considered as a group, and other investment companies and accounts advised by MFS, as well as MFS’ methodologies used to determine and allocate its costs to the MFS Funds, the Fund and other accounts and products for purposes of estimating profitability.
After reviewing these and other factors described herein, the Trustees concluded, within the context of their overall conclusions regarding the investment advisory agreement, that the advisory fees charged to the Fund represent reasonable compensation in light of the services being provided by MFS to the Fund.
In addition, the Trustees considered MFS’ resources and related efforts to continue to retain, attract and motivate capable personnel to serve the Fund. The Trustees also considered current and developing conditions in the financial services industry, including the presence of large and well-capitalized companies which are spending, and appear to be prepared to continue to spend, substantial sums to engage personnel and to provide services to competing investment companies. In this regard, the Trustees also considered the financial resources of MFS and its ultimate parent, Sun Life Financial Inc. The Trustees also considered the advantages and possible disadvantages to the Fund of having an adviser that also serves other investment companies as well as other accounts.
The Trustees also considered the nature, quality, cost, and extent of administrative, transfer agency, and distribution services provided to the Fund by MFS and its affiliates under agreements and plans other than the investment advisory agreement, including any12b-1 fees the Fund pays to MFS Fund Distributors, Inc., an affiliate of MFS. The Trustees also considered the nature, extent and quality of certain other services MFS performs or arranges for on the Fund’s behalf, which may include securities lending programs, directed expense payment programs, class action recovery programs, and MFS’ interaction with third-party service providers, principally custodians andsub-custodians. The Trustees concluded that the variousnon-advisory services provided by MFS and its affiliates on behalf of the Fund were satisfactory.
The Trustees consideredso-called“fall-out benefits” to MFS such as reputational value derived from serving as investment manager to the MFS Funds. The Trustees also considered that, effective January 3, 2018, MFS had discontinued its historic practice of obtaining investment research from portfolio brokerage commissions paid by certain MFS Funds and would thereafter directly pay for or voluntarily reimburse a Fund, if applicable, for the costs of external research acquired through the use of the Fund’s portfolio brokerage commissions.
Based on their evaluation of factors that they deemed to be material, including those factors described above, the Board of Trustees, including the independent Trustees, concluded that the Fund’s investment advisory agreement with MFS should be continued for an additionalone-year period, commencing August 1, 2019.
26
MFS Mid Cap Value Portfolio
PROXY VOTING POLICIES AND INFORMATION
MFS votes proxies on behalf of the fund pursuant to proxy voting policies and procedures that are available without charge, upon request, by calling 1-800-225-2606, by visitingmfs.com/proxyvoting, or by visiting the SEC’s Web site athttp://www.sec.gov.
Information regarding how the fund voted proxies relating to portfolio securities during the most recent twelve-month period ended June 30 is available by August 31 of each year without charge by visitingmfs.com/proxyvoting, or by visiting the SEC’s Web site athttp://www.sec.gov.
QUARTERLY PORTFOLIO DISCLOSURE
The fund files a complete schedule of portfolio holdings with the SEC for the first and third quarters of each fiscal year as an exhibit to its reports on Form N-PORT. The fund’s Form N-PORT reports are available on the SEC’s website athttp://www.sec.gov.A shareholder can obtain the portfolio holdings report for the first and third quarters of the fund’s fiscal year atmfs.com/vit3 by choosing the fund’s name and then selecting the “Resources” tab and clicking on “Prospectus and Reports”.
FURTHER INFORMATION
From time to time, MFS may post important information about the fund or the MFS funds on the MFS web site (mfs.com). This information is available athttps://www.mfs.com/en-us/what-we-do/announcements.html or at mfs.com/vit3by choosing the fund’s name.
INFORMATION ABOUT FUND CONTRACTS AND LEGAL CLAIMS
The fund has entered into contractual arrangements with an investment adviser, administrator, distributor, shareholder servicing agent, 529 program manager (if applicable), and custodian who each provide services to the fund. Unless expressly stated otherwise, shareholders are not parties to, or intended beneficiaries of these contractual arrangements, and these contractual arrangements are not intended to create any shareholder right to enforce them against the service providers or to seek any remedy under them against the service providers, either directly or on behalf of the fund.
Under the Trust’s By-Laws and Declaration of Trust, any claims asserted against or on behalf of the MFS Funds, including claims against Trustees and Officers, must be brought in state and federal courts located within the Commonwealth of Massachusetts.
FEDERAL TAX INFORMATION (unaudited)
The following information is provided pursuant to provisions of the Internal Revenue Code.
The fund designates $25,273,000 as capital gain dividends paid during the fiscal year.
For corporate shareholders, 81.56% of the ordinary income dividends paid during the fiscal year qualify for the corporate dividends received deduction.
27
rev. 3/16
| | | | |
| | | |
| FACTS | | WHAT DOES MFS DO WITH YOUR
PERSONAL INFORMATION? | |  |
| | |
| Why? | | Financial companies choose how they share your personal information. Federal law gives consumers the right to limit some but not all sharing. Federal law also requires us to tell you how we collect, share, and protect your personal information. Please read this notice carefully to understand what we do. |
| | |
| What? | | The types of personal information we collect and share depend on the product or service you have with us. This information can include: • Social Security number and account balances • Account transactions and transaction history • Checking account information and wire transfer instructions When you areno longer our customer, we continue to share your information as described in this notice. |
| | |
| How? | | All financial companies need to share customers’ personal information to run their everyday business. In the section below, we list the reasons financial companies can share their customers’ personal information; the reasons MFS chooses to share; and whether you can limit this sharing. |
| | | | |
Reasons we can share your
personal information | | Does MFS share? | | Can you limit this
sharing? |
For our everyday business purposes – such as to process your transactions, maintain your account(s), respond to court orders and legal investigations, or report to credit bureaus | | Yes | | No |
For our marketing purposes – to offer our products and services to you | | No | | We don’t share |
| For joint marketing with other financial companies | | No | | We don’t share |
For our affiliates’ everyday business purposes – information about your transactions and experiences | | No | | We don’t share |
For our affiliates’ everyday business purposes – information about your creditworthiness | | No | | We don’t share |
| For nonaffiliates to market to you | | No | | We don’t share |
| | |
| | |
| Questions? | | Call800-225-2606 or go tomfs.com. |
28
| | |
| Who we are |
| Who is providing this notice? | | MFS Funds, MFS Investment Management, MFS Institutional Advisors, Inc., and MFS Heritage Trust Company. |
| | |
| What we do |
| How does MFS protect my personal information? | | To protect your personal information from unauthorized access and use, we use security measures that comply with federal law. These measures include procedural, electronic, and physical safeguards for the protection of the personal information we collect about you. |
How does MFS
collect my personal information? | | We collect your personal information, for example, when you • open an account or provide account information • direct us to buy securities or direct us to sell your securities • make a wire transfer We also collect your personal information from others, such as credit bureaus, affiliates, or other companies. |
| Why can’t I limit all sharing? | | Federal law gives you the right to limit only • sharing for affiliates’ everyday business purposes – information about your creditworthiness • affiliates from using your information to market to you • sharing for nonaffiliates to market to you State laws and individual companies may give you additional rights to limit sharing. |
| | |
| Definitions |
| Affiliates | | Companies related by common ownership or control. They can be financial and nonfinancial companies. • MFS does not share personal information with affiliates, except for everyday business purposes as described on page one of this notice. |
| Nonaffiliates | | Companies not related by common ownership or control. They can be financial and nonfinancial companies. • MFS does not share with nonaffiliates so they can market to you. |
| Joint marketing | | A formal agreement between nonaffiliated financial companies that together market financial products or services to you. • MFS doesn’t jointly market. |
| | |
| Other important information |
| If you own an MFS product or receive an MFS service in the name of a third party such as a bank or broker-dealer, their privacy policy may apply to you instead of ours. |
29
Annual Report
December 31, 2019

MFS® Moderate Allocation Portfolio

MFS® Variable Insurance Trust III
Beginning on January 1, 2021, as permitted by regulations adopted by the U.S. Securities and Exchange Commission, the insurance company that offers your contract may determine that it will no longer send you paper copies of the fund’s annual and semiannual shareholder reports unless you specifically request paper copies from the insurance company or from your financial intermediary. Instead, the shareholder reports will be made available on a Web site (insurancefunds.mfs.com or other Web site of which you will be notified), and the insurance company will notify you by mail each time a report is posted and provide you with a Web site link to access the report. Instructions for requesting paper copies will be provided by your insurance company or financial intermediary.
If you already elected to receive shareholder reports by email, you will not be affected by this change and you need not take any action. If your insurance company or financial intermediary offers electronic delivery, you may elect to receive shareholder reports and other communications from the insurance company or financial intermediary by email by following the instructions provided by the insurance company or financial intermediary.
Beginning on January 1, 2019, you may elect to receive all future reports in paper free of charge from the insurance company or financial intermediary. You can inform the insurance company or financial intermediary that you wish to continue receiving paper copies of your shareholder reports by contacting your insurance company or financial intermediary. Your election to receive reports in paper will apply to all funds held in your account with your insurance company or financial intermediary.
VMA-ANN
MFS® Moderate Allocation Portfolio
CONTENTS
The report is prepared for the general information of contract owners. It is authorized for distribution to prospective investors only when preceded or accompanied by a current prospectus.
NOT FDIC INSURED• MAY LOSE VALUE• NO BANK OR CREDIT UNION GUARANTEE• NOT A DEPOSIT• NOT INSURED BY ANY FEDERAL GOVERNMENT AGENCY OR NCUA/NCUSIF
MFS Moderate Allocation Portfolio
LETTER FROM THE EXECUTIVE CHAIR

Dear Contract Owners:
Slowing global growth, low inflation, and trade friction between the United States and China have been hallmarks of the past 12 months. After experiencing an uptick in market volatility in late 2018, markets steadied for most of 2019, thanks in large measure to the adoption of a dovish policy stance on the part of global central banks, focused on supporting economic growth. Negotiations aimed at a “phase one” trade deal between the U.S. and China bore fruit at the end of the period, boosting investor sentiment, while signs of stability emerging from the global manufacturing sector also lifted spirits. Uncertainty over Brexit, along with the ripple effects from the trade conflict, hampered business confidence and investment in the United Kingdom and Europe for much of the period, though investors expect greater clarity regarding Brexit as a result of December’s general election. The pro-Brexit Conservative Party won the election by a comfortable margin and set the stage for the U.K.’s departure from the EU at the end of January.
Markets expect the longest economic expansion in U.S. history will continue, albeit at a slower pace, as trade tensions recede. In an effort to prolong the expansion, the U.S. Federal Reserve lowered interest rates three times between July and October and the European Central Bank loosened policy in September. While the global monetary policy backdrop remains quite accommodative, signs of easing trade tensions and fading global recession fears led to improved market sentiment in late 2019 as investors grew less risk averse. In early 2020, an outbreak of coronavirus emanating from China reintroduced global growth fears, causing an uptick in volatility.
Here at MFS®, we aim to help our clients navigate the growing complexity of the markets and world economies. Our long-term investment philosophy and commitment to the responsible allocation of capital allow us to tune out the noise and uncover what we believe are the best, most durable investment opportunities in the market. Through our powerful global investment platform, we combine collective expertise, thoughtful risk management and long-term discipline to create sustainable value for investors.
Respectfully,

Robert J. Manning
Executive Chair
MFS Investment Management
February 14, 2020
The opinions expressed in this letter are subject to change and may not be relied upon for investment advice. No forecasts can be guaranteed.
1
MFS Moderate Allocation Portfolio
PORTFOLIO COMPOSITION
Portfolio target allocation
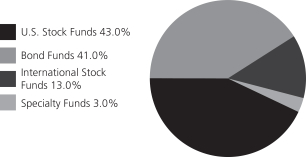
| | | | |
| Portfolio holdings | | | | |
| MFS Total Return Bond Series | | | 11.9% | |
| MFS Government Securities Portfolio | | | 9.8% | |
| MFS Growth Series | | | 9.1% | |
| MFS Value Series | | | 9.1% | |
| MFS Research Series | | | 8.1% | |
| MFS Mid Cap Value Portfolio | | | 7.1% | |
| MFS Research International Portfolio | | | 7.1% | |
| MFS Mid Cap Growth Series | | | 7.0% | |
| MFS High Yield Portfolio | | | 5.0% | |
| MFS Inflation-Adjusted Bond Portfolio | | | 4.9% | |
| MFS Global Governments Portfolio | | | 4.9% | |
| MFS Limited Maturity Portfolio | | | 3.9% | |
| MFS International Growth Portfolio | | | 3.0% | |
| MFS International Intrinsic Value Portfolio | | | 3.0% | |
| MFS Global Real Estate Portfolio | | | 3.0% | |
| MFS New Discovery Series | | | 1.5% | |
| MFS New Discovery Value Portfolio | | | 1.5% | |
| Cash & Cash Equivalents | | | 0.1% | |
Portfolio actual allocation
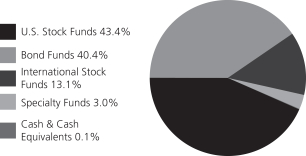
Cash & Cash Equivalents includes any cash, investments in money market funds, short-term securities, and other assets less liabilities. MFS endeavors to fully invest all MFSfunds-of-funds in underlying funds on a daily basis. Any divergence from 0.0% in Cash & Cash Equivalents is typically due to the timing of fund subscriptions/redemptions and the settlement of subsequent investment in/divestment from the underlying funds. While the MFSfunds-of-funds’ subscriptions/redemptions are processed at the same day NAV of the underlying funds, a positive/negative cash balance will be reflected on the MFSfunds-of-funds’ Statements of Assets and Liabilities until the trades with the underlying funds settle, which is typically two business days. Please see the Statements of Assets and Liabilities for additional information related to the fund’s cash position and other assets and liabilities.
Percentages are based on net assets as of December 31, 2019.
The portfolio is actively managed and current holdings may be different.
2
MFS Moderate Allocation Portfolio
MANAGEMENT REVIEW
Summary of Results
For the twelve months ended December 31, 2019, Initial Class shares of the MFS Moderate Allocation Portfolio (fund) provided a total return of 22.23%, while Service Class shares of the fund provided a total return of 21.90%. These compare with a return of 31.49% for the fund’s benchmark, the Standard & Poor’s 500 Stock Index (S&P 500 Index). The fund’s other benchmark, the MFS Moderate Allocation Portfolio Blended Index (Blended Index), generated a return of 20.50%. The Blended Index reflects the blended returns of various equity and fixed income market indices, with percentage allocations to each index designed to resemble the allocations of the fund. The market indices and related percentage allocations used to compile the Blended Index are set forth in the Performance Summary.
Market Environment
Fading fears of a near-term global recession, the announcement of a partial trade deal between the United States and China and the decline in uncertainty over Brexit helped bolster market sentiment late in the period. Changes in market sentiment, largely driven by uncertainty over the outcome of trade negotiations between the US and China, had contributed to periodic bouts of volatility during the reporting period. The global economy decelerated, led by weakness in China and Europe, although the pace of the slowdown moderated late in the period amid nascent signs of stabilization in the manufacturing sector.
The deteriorating global growth backdrop, along with declining inflationary pressures, prompted the US Federal Reserve to adopt a more dovish posture beginning in early 2019, resulting in the first interest rate cut in over a decade at the end of July, followed by additional cuts in September and October. The Fed’s actions led to a sharp decline in long-term interest rates during the period’s second half, causing the inversion of portions of the US Treasury yield curve for a time. Amid an improvement in risk sentiment in Q4 2019 and indications of a bottoming in growth and a potential upturn in activity, the Fed indicated in October that further rate cuts were unlikely unless the outlook for the economy materially worsened.
Globally, central banks have tilted more dovish as well, with the European Central Bank unveiling a package of easing measures, which included putting overnight rates deeper into negative territory, restarting its bond-buying program and lengthening the term of cheap loans to banks to three years from two. The central banks of India and Australia are among those that have cut rates several times in recent months, although China has been more cautious in increasing liquidity as it keeps trying to deleverage its economy, cutting rates only marginally.
Emerging markets experienced considerable volatility through the end of 2018, as tighter global financial conditions exposed structural weakness in some countries. Those conditions improved in 2019 as the Fed became more dovish. Notwithstanding the periodic headwinds on market sentiment from significant trade friction between the US and China over much of the year, emerging market hard currency debt and local rates benefited from relatively cheap valuations at the beginning of the period and easier global monetary conditions. These factors, plus the fading of certain global risk factors mentioned above, hastened spread tightening in the latter part of the period. At the same time, idiosyncratic risks spiked in some countries (e.g., Argentina and Lebanon), contributing to increased dispersion in performance among sovereign assets.
Factors Affecting Performance
During the reporting period, the fund underperformed its benchmark, the S&P 500 Index, primarily due to its allocation to the fixed income markets, which lagged the exceptionally strong performance of the equity markets. Over the same period, the fund outperformed the Blended Index.
Relative to the Blended Index, strong relative performance across all funds within the U.S. equity asset class strengthened returns, as all funds within this segment outpaced their respective benchmarks. Additionally, the fund’s exposure to large- andmid-capitalization growth funds, particularly the MFS Growth Series and MFS Mid Cap Growth Series, helped relative returns and offset weakness from the fund’s exposure to large- and mid-capitalization value strategies, most notably the MFS Value Series and MFS Mid Cap Value Portfolio.
The international equity segment was another positive factor for relative performance as both the MFS Research International Portfolio and MFS International Intrinsic Value Portfolio outperformed their respective benchmarks during the reporting period.
The fund’s exposure to the fixed income asset class weighed on relative returns, as strong bond market performance during the period hurt funds with shorter relative durations, particularly the MFS Limited Maturity Portfolio, and with no credit exposure, most notably the MFS Government Securities Portfolio. Additionally, the fund’s allocation to the MFS Global Governments Portfolio weakened relative performance, driven by this fund’s global exposure in a strong US dollar environment. This was partially offset by the fund’s positive allocation to the MFS High Yield Portfolio and strong relative performance of the MFS Total Return Bond Series.
Respectfully,
Portfolio Manager(s)
Joseph Flaherty and Natalie Shapiro
3
MFS Moderate Allocation Portfolio
Management Review – continued
The views expressed in this report are those of the portfolio manager(s) only through the end of the period of the report as stated on the cover and do not necessarily reflect the views of MFS or any other person in the MFS organization. These views are subject to change at any time based on market or other conditions, and MFS disclaims any responsibility to update such views. These views may not be relied upon as investment advice or an indication of trading intent on behalf of any MFS portfolio. References to specific securities are not recommendations of such securities, and may not be representative of any MFS portfolio’s current or future investments.
4
MFS Moderate Allocation Portfolio
PERFORMANCE SUMMARY THROUGH 12/31/19
The following chart illustrates the historical performance of the fund in comparison to its benchmark(s). Benchmarks are unmanaged and may not be invested in directly. Benchmark returns do not reflect any fees or expenses. The performance of other share classes will be greater than or less than that of the class depicted below. (See Notes to Performance Summary.)
Performance data shown represents past performance and is no guarantee of future results. Investment return and principal value fluctuate so your units, when sold, may be worth more or less than the original cost; current performance may be lower or higher than quoted. The performance shown does not reflect the deduction of taxes, if any, that a contract holder would pay on fund distributions or the redemption of contract units. The returns for the fund shown also do not reflect the deduction of expenses associated with variable products, such as mortality and expense risk charges, separate account charges, and sales charges imposed by the insurance company separate accounts. Such expenses would reduce the overall returns shown.
Growth of a Hypothetical $10,000 Investment
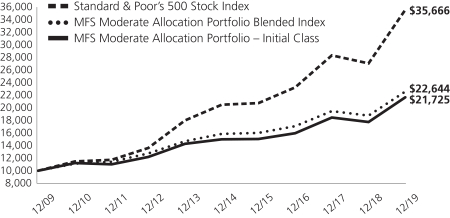
Total Returns through 12/31/19
Average annual total returns
| | | | | | | | | | | | |
| | | Share Class | | Class Inception Date | | 1-yr | | 5-yr | | 10-yr | | |
| | | Initial Class | | 10/01/08 | | 22.23% | | 7.66% | | 8.07% | | |
| | | Service Class | | 10/01/08 | | 21.90% | | 7.38% | | 7.79% | | |
| | | | |
| Comparative benchmark(s) | | | | | | | | |
| | | Standard & Poor’s 500 Stock Index (f) | | 31.49% | | 11.70% | | 13.56% | | |
| | | MFS Moderate Allocation Portfolio Blended Index (f)(w) | | 20.50% | | 7.35% | | 8.52% | | |
| | | Bloomberg Barclays U.S. Aggregate Bond Index (f) | | 8.72% | | 3.05% | | 3.75% | | |
| | | FTSE EPRA Nareit Developed Real Estate Index (net div) (f) | | 21.91% | | 5.56% | | 8.37% | | |
| | | MSCI EAFE Index (net div) (f) | | 22.01% | | 5.67% | | 5.50% | | |
| (f) | | Source: FactSet Research Systems Inc. |
| (w) | | As of December 31, 2019, the MFS Moderate Allocation Portfolio Blended Index (a custom index) was comprised of 43% Standard & Poor’s 500 Stock Index, 41% Bloomberg Barclays U.S. Aggregate Bond Index, 13% MSCI EAFE Index (net div), and 3% FTSE EPRA Nareit Developed Real Estate Index (net div). |
Benchmark Definition(s)
Bloomberg Barclays U.S. Aggregate Bond Index – a market capitalization-weighted index that measures the performance of the U.S. investment-grade, fixed rate bond market, with index components for government and corporate securities, mortgage pass-through securities, and asset-backed securities with at least one year to final maturity. BLOOMBERG® is a trademark and service mark of Bloomberg Finance L.P. and its affiliates (collectively “Bloomberg”). BARCLAYS® is a trademark and service mark of Barclays Bank Plc (collectively with its affiliates, “Barclays”), used under license. Bloomberg or Bloomberg’s licensors, including Barclays, own all proprietary rights in the Bloomberg Barclays Indices. Neither Bloomberg nor Barclays approves or endorses this material, or guarantees the accuracy or completeness of any information herein, or makes any warranty, express or implied, as to the results to be obtained therefrom, and, to the maximum extent allowed by law, neither shall have any liability or responsibility for injury or damages arising in connection therewith.
5
MFS Moderate Allocation Portfolio
Performance Summary – continued
FTSE EPRA Nareit Developed Real Estate Index (net div) – measures the performance of eligible real estate equities worldwide that generate a majority of their revenue and income through the ownership, disposure and development of income-producing real estate. FTSE International Limited (“FTSE”)© FTSE 2019. “FTSE®” is a trademark of the London Stock Exchange Group companies and is used by FTSE International Limited under license. “FT-SE®”, “FOOTSIE®” and “FTSE4GOOD®” are trademarks of the London Stock Exchange Group companies. “Nareit®” is a trademark of the National Association of Real Estate Investment Trusts (“Nareit”) and “EPRA®” is a trademark of the European Public Real Estate Association (“EPRA”) and all are used by FTSE under license. The FTSE EPRA Nareit Developed Real Estate Index is calculated by FTSE. Neither FTSE, Euronext N.V., Nareit, nor EPRA sponsor, endorse, or promote this product and are not in any way connected to it and do not accept any liability. All intellectual property rights in the index values and constituent list vests in FTSE, Euronext N.V., Nareit, and EPRA. Neither FTSE nor its licensors accept any liability for any errors or omissions in the FTSE indices and/or FTSE ratings or underlying data. No further distribution of FTSE Data is permitted without FTSE’s express written consent.
MSCI EAFE (Europe, Australasia, Far East) Index (net div) – a market capitalization index that is designed to measure equity market performance in the developed markets, excluding the U.S. and Canada. Morgan Stanley Capital International (“MSCI”) makes no express or implied warranties or representations and shall have no liability whatsoever with respect to any MSCI data contained herein. The MSCI data may not be further redistributed or used as a basis for other indices or any securities or financial products. This report is not approved, reviewed, or produced by MSCI.
Standard & Poor’s 500 Stock Index – a market capitalization-weighted index of 500 widely held equity securities, designed to measure broad U.S. equity performance. “Standard & Poor’s®” and “S&P®” are registered trademarks of Standard & Poor’s Financial Services LLC (“S&P”) and Dow Jones is a registered trademark of Dow Jones Trademark Holdings LLC (“Dow Jones”) and have been licensed for use by S&P Dow Jones Indices LLC and sublicensed for certain purposes by Massachusetts Financial Services Company. The S&P 500® is a product of S&P Dow Jones Indices LLC, and has been licensed for use by Massachusetts Financial Services Company. Massachusetts Financial Services Company’s product(s) is not sponsored, endorsed, sold, or promoted by S&P Dow Jones Indices LLC, Dow Jones, S&P, or their respective affiliates, and neither S&P Dow Jones Indices LLC, Dow Jones, S&P, nor their respective affiliates make any representation regarding the advisability of investing in such product(s).
It is not possible to invest directly in an index.
Notes to Performance Summary
Average annual total return represents the average annual change in value for each share class for the periods presented.
Performance prior to close of business December 7, 2012, reflects time periods when another adviser or subadviser was responsible for selecting investments for the fund under a different investment objective and different investment strategies, underlying fund selections, and underlying fund target weightings of the fund.
Performance results reflect any applicable expense subsidies and waivers in effect during the periods shown. Without such subsidies and waivers the fund’s performance results would be less favorable. Please see the prospectus and financial statements for complete details. All results are historical and assume the reinvestment of any dividends and capital gains distributions.
Performance results do not include adjustments made for financial reporting purposes in accordance with U.S. generally accepted accounting principles and may differ from amounts reported in the financial highlights.
From time to time the fund may receive proceeds from litigation settlements, without which performance would be lower.
6
MFS Moderate Allocation Portfolio
EXPENSE TABLE
Fund Expenses Borne by the Contract Holders during the Period,
July 1, 2019 through December 31, 2019
As a contract holder of the fund, you incur ongoing costs, including distribution and/or service(12b-1) fees; and other fund expenses. This example is intended to help you understand your ongoing costs (in dollars) of investing in the fund and to compare these costs with the ongoing costs of investing in other mutual funds.
In addition to the fees and expenses which the fund bears directly, the fund indirectly bears a pro rata share of the fees and expenses of the underlying funds in which the fund invests. Because the underlying funds have varied expenses and fee levels and the fund may own different proportions of the underlying funds at different times, the amount of fees and expenses incurred indirectly by the fund will vary. If these indirect costs were included, your costs would have been higher.
The example is based on an investment of $1,000 invested at the beginning of the period and held for the entire period July 1, 2019 through December 31, 2019.
Actual Expenses
The first line for each share class in the following table provides information about actual account values and actual expenses. You may use the information in this line, together with the amount you invested, to estimate the expenses that you paid over the period. Simply divide your account value by $1,000 (for example, an $8,600 account value divided by $1,000 = 8.6), then multiply the result by the number in the first line under the heading entitled “Expenses Paid During Period” to estimate the expenses you paid on your account during this period.
Hypothetical Example for Comparison Purposes
The second line for each share class in the following table provides information about hypothetical account values and hypothetical expenses based on the fund’s actual expense ratio and an assumed rate of return of 5% per year before expenses, which is not the fund’s actual return. The hypothetical account values and expenses may not be used to estimate the actual ending account balance or expenses you paid for the period. You may use this information to compare the ongoing costs of investing in the fund and other funds. To do so, compare this 5% hypothetical example with the 5% hypothetical examples that appear in the shareholder reports of the other funds.
Please note that the expenses shown in the table are meant to highlight the fund’s ongoing costs only and do not take into account the fees and expenses imposed under the variable contracts through which your investment in the fund is made. Therefore, the second line for each share class in the table is useful in comparing ongoing costs associated with an investment in vehicles (such as the fund) which fund benefits under variable annuity and variable life insurance contracts and to qualified pension and retirement plans only, and will not help you determine the relative total costs of investing in the fund through variable annuity and variable life insurance contracts. If the fees and expenses imposed under the variable contracts were included, your costs would have been higher.
| | | | | | | | | | | | | | | | | | |
| Share Class | | | | Annualized
Expense Ratio | | | Beginning
Account Value
7/01/19 | | | Ending Account Value
12/31/19 | | | Expenses Paid
During Period (p)
7/01/19-12/31/19 | |
| Initial Class | | Actual | | | 0.01% | | | | $1,000.00 | | | | $1,061.49 | | | | $0.05 | |
| | Hypothetical (h) | | | 0.01% | | | | $1,000.00 | | | | $1,025.16 | | | | $0.05 | |
| Service Class | | Actual | | | 0.26% | | | | $1,000.00 | | | | $1,059.30 | | | | $1.35 | |
| | Hypothetical (h) | | | 0.26% | | | | $1,000.00 | | | | $1,023.89 | | | | $1.33 | |
| (h) | 5% class return per year before expenses. |
| (p) | “Expenses Paid During Period” are equal to each class’s annualized expense ratio, as shown above, multiplied by the average account value over the period, multiplied by 184/365 (to reflect theone-half year period). In addition to the fees and expenses which the fund bears directly, the fund indirectly bears a pro rata share of the fees and expenses of the underlying funds in which the fund invests. If these indirect costs were included, your costs would have been higher. |
7
MFS Moderate Allocation Portfolio
PORTFOLIO OF INVESTMENTS – 12/31/19
The Portfolio of Investments is a complete list of all securities owned by your fund. It is categorized by broad-based asset classes.
| | | | | | | | |
| | |
| Issuer | | Shares/Par | | | Value ($) | |
| INVESTMENT COMPANIES (h) – 100.0% | | | | | |
| Bond Funds – 40.4% | | | | | |
| MFS Global Governments Portfolio – Initial Class | | | 6,460,148 | | | $ | 69,188,179 | |
| MFS Government Securities Portfolio –Initial Class | | | 11,216,777 | | | | 139,648,867 | |
| MFS High Yield Portfolio – Initial Class | | | 12,432,896 | | | | 71,116,166 | |
| MFS Inflation-Adjusted Bond Portfolio – Initial Class | | | 6,447,537 | | | | 69,697,879 | |
| MFS Limited Maturity Portfolio – Initial Class | | | 5,447,076 | | | | 56,322,769 | |
| MFS Total Return Bond Series – Initial Class | | | 12,521,716 | | | | 168,792,734 | |
| | | | | | | | |
| | | | | | $ | 574,766,594 | |
| | | | | | | | |
| International Stock Funds – 13.1% | | | | | |
| MFS International Growth Portfolio – Initial Class | | | 3,017,403 | | | $ | 43,028,167 | |
| MFS International Intrinsic Value Portfolio – Initial Class | | | 1,433,207 | | | | 42,910,215 | |
| MFS Research International Portfolio – Initial Class | | | 5,921,726 | | | | 100,432,483 | |
| | | | | | | | |
| | | | | | $ | 186,370,865 | |
| | | | | | | | |
| Specialty Funds – 3.0% | | | | | |
| MFS Global Real Estate Portfolio – Initial Class | | | 2,653,250 | | | $ | 42,213,211 | |
| | | | | | | | |
| U.S. Stock Funds – 43.4% | | | | | |
| MFS Growth Series – Initial Class | | | 2,175,217 | | | $ | 129,207,879 | |
| MFS Mid Cap Growth Series – Initial Class | | | 10,051,698 | | | | 100,114,910 | |
| MFS Mid Cap Value Portfolio – Initial Class | | | 11,499,060 | | | | 100,501,786 | |
| | | | | | | | |
| | |
| Issuer | | Shares/Par | | | Value ($) | |
| INVESTMENT COMPANIES (h) – continued | |
| U.S. Stock Funds – continued | | | | | |
| MFS New Discovery Series – Initial Class | | | 1,060,416 | | | $ | 21,505,233 | |
| MFS New Discovery Value Portfolio – Initial Class | | | 2,303,097 | | | | 21,487,891 | |
| MFS Research Series – Initial Class | | | 3,892,687 | | | | 114,795,342 | |
| MFS Value Series – Initial Class | | | 6,156,989 | | | | 128,988,929 | |
| | | | | | | | |
| | | | | | $ | 616,601,970 | |
| | | | | | | | |
| Money Market Funds – 0.1% | | | | | |
| MFS Institutional Money Market Portfolio, 1.7% (v) | | | 1,570,637 | | | $ | 1,570,637 | |
| | | | | | | | |
Total Investment Companies
(Identified Cost, $1,169,672,418) | | | | | | $ | 1,421,523,277 | |
| | | | | | | | |
OTHER ASSETS, LESS
LIABILITIES – (0.0)% | | | | | | | (86,410 | ) |
| | | | | | | | |
| NET ASSETS – 100.0% | | | | | | $ | 1,421,436,867 | |
| | | | | | | | |
| (h) | | An affiliated issuer, which may be considered one in which the fund owns 5% or more of the outstanding voting securities, or a company which is under common control. At period end, the aggregate value of the fund’s investments in affiliated issuers was $1,421,523,277. |
| (v) | | Affiliated issuer that is available only to investment companies managed by MFS. The rate quoted for the MFS Institutional Money Market Portfolio is the annualizedseven-day yield of the fund at period end. |
See Notes to Financial Statements
8
MFS Moderate Allocation Portfolio
FINANCIAL STATEMENTS | STATEMENT OF ASSETS AND LIABILITIES
This statement represents your fund’s balance sheet, which details the assets and liabilities comprising the total value of the fund.
| | | | |
At 12/31/19 | | | | |
| |
Assets | | | | |
Investments in affiliated issuers, at value (identified cost, $1,169,672,418) | | | $1,421,523,277 | |
Receivables for | | | | |
Investments sold | | | 1,959,859 | |
Fund shares sold | | | 1,639 | |
Other assets | | | 6,654 | |
Total assets | | | $1,423,491,429 | |
| |
Liabilities | | | | |
Payables for | | | | |
Fund shares reacquired | | | $1,959,859 | |
Payable to affiliates | | | | |
Administrative services fee | | | 96 | |
Shareholder servicing costs | | | 43 | |
Distribution and/or service fees | | | 19,409 | |
Payable for independent Trustees’ compensation | | | 98 | |
Accrued expenses and other liabilities | | | 75,057 | |
Total liabilities | | | $2,054,562 | |
Net assets | | | $1,421,436,867 | |
| |
Net assets consist of | | | | |
Paid-in capital | | | $1,062,910,898 | |
Total distributable earnings (loss) | | | 358,525,969 | |
Net assets | | | $1,421,436,867 | |
Shares of beneficial interest outstanding | | | 107,483,976 | |
| | | | | | | | | | | | |
| | | |
| | | Net assets | | | Shares
outstanding | | | Net asset value
per share | |
Initial Class | | | $6,448,283 | | | | 487,314 | | | | $13.23 | |
Service Class | | | 1,414,988,584 | | | | 106,996,662 | | | | 13.22 | |
See Notes to Financial Statements
9
MFS Moderate Allocation Portfolio
FINANCIAL STATEMENTS | STATEMENT OF OPERATIONS
This statement describes how much your fund earned in investment income and accrued in expenses. It also describes any gains and/or losses generated by fund operations.
| | | | |
Year ended 12/31/19 | | | | |
| |
Net investment income (loss) | | | | |
Income | | | | |
Dividends from affiliated issuers | | | $32,038,527 | |
Other | | | 235 | |
Total investment income | | | $32,038,762 | |
Expenses | | | | |
Distribution and/or service fees | | | $3,556,068 | |
Shareholder servicing costs | | | 11,894 | |
Administrative services fee | | | 17,500 | |
Independent Trustees’ compensation | | | 27,710 | |
Custodian fee | | | 22,938 | |
Shareholder communications | | | 23,628 | |
Audit and tax fees | | | 40,099 | |
Legal fees | | | 12,198 | |
Miscellaneous | | | 42,613 | |
Total expenses | | | $3,754,648 | |
Net investment income (loss) | | | $28,284,114 | |
| |
Realized and unrealized gain (loss) | | | | |
Realized gain (loss) (identified cost basis) | | | | |
Investments in affiliated issuers | | | $21,102,270 | |
Capital gain distributions from underlying affiliated funds | | | 62,393,798 | |
Net realized gain (loss) | | | $83,496,068 | |
Change in unrealized appreciation or depreciation | | | | |
Affiliated issuers | | | $170,337,950 | |
Net realized and unrealized gain (loss) | | | $253,834,018 | |
Change in net assets from operations | | | $282,118,132 | |
See Notes to Financial Statements
10
MFS Moderate Allocation Portfolio
FINANCIAL STATEMENTS | STATEMENTS OF CHANGES IN NET ASSETS
These statements describe the increases and/or decreases in net assets resulting from operations, any distributions, and any shareholder transactions.
| | | | | | | | |
| | | Year ended | |
| | | 12/31/19 | | | 12/31/18 | |
Change in net assets | | | | | | | | |
| | |
From operations | | | | | | | | |
Net investment income (loss) | | | $28,284,114 | | | | $31,610,578 | |
Net realized gain (loss) | | | 83,496,068 | | | | 97,595,633 | |
Net unrealized gain (loss) | | | 170,337,950 | | | | (183,982,990 | ) |
Change in net assets from operations | | | $282,118,132 | | | | $(54,776,779 | ) |
Total distributions to shareholders | | | $(129,684,645 | ) | | | $(101,853,938 | ) |
Change in net assets from fund share transactions | | | $(101,203,589 | ) | | | $(165,219,330 | ) |
Total change in net assets | | | $51,229,898 | | | | $(321,850,047 | ) |
| | |
Net assets | | | | | | | | |
At beginning of period | | | 1,370,206,969 | | | | 1,692,057,016 | |
At end of period | | | $1,421,436,867 | | | | $1,370,206,969 | |
See Notes to Financial Statements
11
MFS Moderate Allocation Portfolio
FINANCIAL STATEMENTS | FINANCIAL HIGHLIGHTS
The financial highlights table is intended to help you understand the fund’s financial performance for the past 5 years. Certain information reflects financial results for a single fund share. The total returns in the table represent the rate that an investor would have earned (or lost) on an investment in the fund share class (assuming reinvestment of all distributions) held for the entire period.
| | | | | | | | | | | | | | | | | | | | |
| Initial Class | | Year ended | |
| | | | | |
| | | 12/31/19 | | | 12/31/18 | | | 12/31/17 | | | 12/31/16 | | | 12/31/15 | |
| | | | | |
Net asset value, beginning of period | | | $11.95 | | | | $13.33 | | | | $12.25 | | | | $12.48 | | | | $13.34 | |
| | | | | |
| Income (loss) from investment operations | | | | | | | | | | | | | | | | | | | | |
Net investment income (loss) (d)(l) | | | $0.30 | | | | $0.30 | | | | $0.26 | | | | $0.24 | (c) | | | $0.29 | |
Net realized and unrealized gain (loss) | | | 2.28 | | | | (0.74 | ) | | | 1.60 | | | | 0.55 | | | | (0.27 | ) |
Total from investment operations | | | $2.58 | | | | $(0.44 | ) | | | $1.86 | | | | $0.79 | | | | $0.02 | |
| | | | | |
| Less distributions declared to shareholders | | | | | | | | | | | | | | | | | | | | |
From net investment income | | | $(0.35 | ) | | | $(0.29 | ) | | | $(0.28 | ) | | | $(0.37 | ) | | | $(0.55 | ) |
From net realized gain | | | (0.95 | ) | | | (0.65 | ) | | | (0.50 | ) | | | (0.65 | ) | | | (0.33 | ) |
Total distributions declared to shareholders | | | $(1.30 | ) | | | $(0.94 | ) | | | $(0.78 | ) | | | $(1.02 | ) | | | $(0.88 | ) |
Net asset value, end of period (x) | | | $13.23 | | | | $11.95 | | | | $13.33 | | | | $12.25 | | | | $12.48 | |
Total return (%) (k)(s)(x) | | | 22.23 | | | | (3.85 | ) | | | 15.52 | | | | 6.16 | (c) | | | 0.35 | |
| | | | | |
Ratios (%) (to average net assets)
and Supplemental data: | | | | | | | | | | | | | | | | | | | | |
Expenses before expense reductions (f)(h) | | | 0.01 | | | | 0.01 | | | | 0.01 | | | | 0.02 | (c) | | | 0.01 | |
Expenses after expense reductions (f)(h) | | | N/A | | | | N/A | | | | N/A | | | | N/A | | | | N/A | |
Net investment income (loss) (l) | | | 2.28 | | | | 2.29 | | | | 1.98 | | | | 1.95 | (c) | | | 2.16 | |
Portfolio turnover | | | 1 | | | | 1 | | | | 0 | (b) | | | 0 | (b) | | | 1 | |
Net assets at end of period (000 omitted) | | | $6,448 | | | | $5,333 | | | | $6,053 | | | | $5,460 | | | | $5,509 | |
| |
| Service Class | | Year ended | |
| | | | | |
| | | 12/31/19 | | | 12/31/18 | | | 12/31/17 | | | 12/31/16 | | | 12/31/15 | |
| | | | | |
Net asset value, beginning of period | | | $11.94 | | | | $13.32 | | | | $12.24 | | | | $12.47 | | | | $13.32 | |
| | | | | |
| Income (loss) from investment operations | | | | | | | | | | | | | | | | | | | | |
Net investment income (loss) (d)(l) | | | $0.26 | | | | $0.27 | | | | $0.22 | | | | $0.21 | (c) | | | $0.22 | |
Net realized and unrealized gain (loss) | | | 2.28 | | | | (0.75 | ) | | | 1.60 | | | | 0.54 | | | | (0.23 | ) |
Total from investment operations | | | $2.54 | | | | $(0.48 | ) | | | $1.82 | | | | $0.75 | | | | $(0.01 | ) |
| | | | | |
| Less distributions declared to shareholders | | | | | | | | | | | | | | | | | | | | |
From net investment income | | | $(0.31 | ) | | | $(0.25 | ) | | | $(0.24 | ) | | | $(0.33 | ) | | | $(0.51 | ) |
From net realized gain | | | (0.95 | ) | | | (0.65 | ) | | | (0.50 | ) | | | (0.65 | ) | | | (0.33 | ) |
Total distributions declared to shareholders | | | $(1.26 | ) | | | $(0.90 | ) | | | $(0.74 | ) | | | $(0.98 | ) | | | $(0.84 | ) |
Net asset value, end of period (x) | | | $13.22 | | | | $11.94 | | | | $13.32 | | | | $12.24 | | | | $12.47 | |
Total return (%) (k)(s)(x) | | | 21.90 | | | | (4.13 | ) | | | 15.23 | | | | 5.87 | (c) | | | 0.13 | |
| | | | | |
Ratios (%) (to average net assets)
and Supplemental data: | | | | | | | | | | | | | | | | | | | | |
Expenses before expense reductions (f)(h) | | | 0.26 | | | | 0.26 | | | | 0.26 | | | | 0.27 | (c) | | | 0.26 | |
Expenses after expense reductions (f)(h) | | | N/A | | | | N/A | | | | N/A | | | | N/A | | | | N/A | |
Net investment income (loss) (l) | | | 1.98 | | | | 2.02 | | | | 1.66 | | | | 1.71 | (c) | | | 1.69 | |
Portfolio turnover | | | 1 | | | | 1 | | | | 0 | (b) | | | 0 | (b) | | | 1 | |
Net assets at end of period (000 omitted) | | | $1,414,989 | | | | $1,364,874 | | | | $1,686,004 | | | | $1,721,397 | | | | $1,837,130 | |
See Notes to Financial Statements
12
MFS Moderate Allocation Portfolio
Financial Highlights – continued
| (c) | Amount reflects aone-time reimbursement of expenses by the custodian (or former custodian) without which net investment income and performance would be lower and expenses would be higher. |
| (d) | Per share data is based on average shares outstanding. |
| (f) | Ratios do not reflect reductions from fees paid indirectly, if applicable. |
| (h) | In addition to the fees and expenses which the fund bears directly, the fund indirectly bears a pro rata share of the fees and expenses of the underlying affiliated funds in which the fund invests. Accordingly, the expense ratio for the fund reflects only those fees and expenses borne directly by the fund. Because the underlying affiliated funds have varied expense and fee levels and the fund may own different proportions of the underlying affiliated funds at different times, the amount of fees and expenses incurred indirectly by the fund will vary. |
| (k) | The total return does not reflect expenses that apply to separate accounts. Inclusion of these charges would reduce the total return figures for all periods shown. |
| (l) | The ratios and per share amounts do not include net investment income of the underlying affiliated funds in which the fund invests. |
| (s) | From time to time the fund may receive proceeds from litigation settlements, without which performance would be lower. |
| (x) | The net asset values and total returns have been calculated on net assets which include adjustments made in accordance with U.S. generally accepted accounting principles required at period end for financial reporting purposes. |
See Notes to Financial Statements
13
MFS Moderate Allocation Portfolio
NOTES TO FINANCIAL STATEMENTS
| (1) | | Business and Organization |
MFS Moderate Allocation Portfolio (the fund) is a diversified series of MFS Variable Insurance Trust III (the trust). The trust is organized as a Delaware statutory trust and is registered under the Investment Company Act of 1940, as amended, as anopen-end management investment company. The shareholders of each series of the trust are separate accounts of insurance companies, which offer variable annuity and/or life insurance products, and qualified retirement and pension plans.
The fund is an investment company and accordingly follows the investment company accounting and reporting guidance of the Financial Accounting Standards Board (FASB) Accounting Standards Codification Topic 946 Financial Services – Investment Companies.
| (2) | | Significant Accounting Policies |
General– The preparation of financial statements in conformity with U.S. generally accepted accounting principles requires management to make estimates and assumptions that affect the reported amounts of assets and liabilities, and disclosure of contingent assets and liabilities at the date of the financial statements and the reported amounts of increases and decreases in net assets from operations during the reporting period. Actual results could differ from those estimates. In the preparation of these financial statements, management has evaluated subsequent events occurring after the date of the fund’s Statement of Assets and Liabilities through the date that the financial statements were issued.
The fund is a “fund of funds”, which invests the majority of its assets in other MFS mutual funds (hereafter referred to as “underlying affiliated funds” or “underlying funds”), which may have different fiscal year ends than the funds. The underlying funds, in turn, may engage in a number of investment techniques and practices, which involve certain risks. Certain underlying funds invest their portfolio in high-yield securities rated below investment grade. Investments in below investment grade quality securities can involve a substantially greater risk of default or can already be in default, and their values can decline significantly. Below investment grade quality securities tend to be more sensitive to adverse news about the issuer, or the market or economy in general, than higher quality debt instruments. Certain underlying funds invest a significant portion of their assets in asset-backed and/ormortgage-backed securities. For these securities, the value of the debt instrument also depends on the credit quality and adequacy of the underlying assets or collateral as well as whether there is a security interest in the underlying assets or collateral. Enforcing rights, if any, against the underlying assets or collateral may be difficult. U.S. Government securities not supported as to the payment of principal or interest by the U.S. Treasury, such as those issued by Fannie Mae, Freddie Mac, and the Federal Home Loan Banks, are subject to greater credit risk than are U.S. Government securities supported by the U.S. Treasury, such as those issued by Ginnie Mae. Certain underlying funds invest in foreign securities, including securities of emerging market issuers. Investments in foreign securities are vulnerable to the effects of changes in the relative values of the local currency and the U.S. dollar and to the effects of changes in each country’s market, economic, industrial, political, regulatory, geopolitical, and other conditions. Investments in emerging markets can involve additional and greater risks than the risks associated with investments in developed foreign markets. Emerging markets can have less developed markets, greater custody and operational risk, less developed legal, regulatory, and accounting systems, and greater political, social, and economic instability than developed markets.
The accounting policies of the underlying funds in which the fund invests are outlined in the underlying funds’ shareholder reports, which are available without charge by calling1-800-225-2606, at mfs.com and on the Securities and Exchange Commission (SEC) web site at http://www.sec.gov. The underlying funds’ shareholder reports are not covered by this report.
Investment Valuations–Open-end investment companies (underlying funds) are generally valued at their net asset value per share. The investments of underlying funds managed by the adviser are valued as described below. For purposes of this policy disclosure, “fund” also refers to the underlying funds in which thefund-of-funds invests.
Equity securities, including restricted equity securities and equity securities sold short, are generally valued at the last sale or official closing price on their primary market or exchange as provided by a third-party pricing service. Equity securities, for which there were no sales reported that day, are generally valued at the last quoted daily bid quotation on their primary market or exchange as provided by a third-party pricing service. Equity securities sold short, for which there were no sales reported for that day, are generally valued at the last quoted daily ask quotation on their primary market or exchange as provided by a third-party pricing service. Debt instruments and floating rate loans, including restricted debt instruments, are generally valued at an evaluated or composite bid as provided by a third-party pricing service. Debt instruments sold short are generally valued at an evaluated or composite mean as provided by a third-party pricing service. Short-term instruments with a maturity at issuance of 60 days or less may be valued at amortized cost, which approximates market value. Exchange-traded options are generally valued at the last sale or official closing price on their primary exchange as provided by a third-party pricing service. Exchange-traded options for which there were no sales reported that day are generally valued at the last daily bid quotation on their primary exchange as provided by athird-party pricing service. For put options, the position may be valued at the last daily ask quotation if there are no trades reported during the day. Options not traded on an exchange are generally valued at a broker/dealer bid quotation. Foreign currency options are generally valued at valuations provided by a third-party pricing service. Futures contracts are generally valued at last posted settlement price on their primary exchange as provided by a third-party pricing service. Futures contracts for which there were no
14
MFS Moderate Allocation Portfolio
Notes to Financial Statements – continued
trades that day for a particular position are generally valued at the closing bid quotation on their primary exchange as provided by a third-party pricing service. Forward foreign currency exchange contracts are generally valued at the mean of bid and asked prices for the time period interpolated from rates provided by a third-party pricing service for proximate time periods. Swap agreements are generally valued using valuations provided by a third-party pricing service, which for cleared swaps includes an evaluation of any trading activity at the clearinghouses.Open-end investment companies are generally valued at net asset value per share. Securities and other assets generally valued on the basis of information from a third-party pricing service may also be valued at a broker/dealer bid quotation. In determining values, third-party pricing services can utilize both transaction data and market information such as yield, quality, coupon rate, maturity, type of issue, trading characteristics, and other market data. The values of foreign securities and other assets and liabilities expressed in foreign currencies are converted to U.S. dollars using the mean of bid and asked prices for rates provided by a third-party pricing service.
The Board of Trustees has delegated primary responsibility for determining or causing to be determined the value of the fund’s investments (including any fair valuation) to the adviser pursuant to valuation policies and procedures approved by the Board. If the adviser determines that reliable market quotations are not readily available, investments are valued at fair value as determined in good faith by the adviser in accordance with such procedures under the oversight of the Board of Trustees. Under the fund’s valuation policies and procedures, market quotations are not considered to be readily available for most types of debt instruments and floating rate loans and many types of derivatives. These investments are generally valued at fair value based on information from third-party pricing services. In addition, investments may be valued at fair value if the adviser determines that an investment’s value has been materially affected by events occurring after the close of the exchange or market on which the investment is principally traded (such as foreign exchange or market) and prior to the determination of the fund’s net asset value, or after the halt of trading of a specific security where trading does not resume prior to the close of the exchange or market on which the security is principally traded. Events that occur after foreign markets close (such as developments in foreign markets and significant movements in the U.S. markets) and prior to the determination of the fund’s net asset value may be deemed to have a material effect on the value of securities traded in foreign markets. Accordingly, the fund’s foreign equity securities may often be valued at fair value. The adviser generally relies on third-party pricing services or other information (such as the correlation with price movements of similar securities in the same or other markets; the type, cost and investment characteristics of the security; the business and financial condition of the issuer; and trading and other market data) to assist in determining whether to fair value and at what value to fair value an investment. The value of an investment for purposes of calculating the fund’s net asset value can differ depending on the source and method used to determine value. When fair valuation is used, the value of an investment used to determine the fund’s net asset value may differ from quoted or published prices for the same investment. There can be no assurance that the fund could obtain the fair value assigned to an investment if it were to sell the investment at the same time at which the fund determines its net asset value per share.
Various inputs are used in determining the value of the fund’s assets or liabilities. These inputs are categorized into three broad levels. In certain cases, the inputs used to measure fair value may fall into different levels of the fair value hierarchy. In such cases, an investment’s level within the fair value hierarchy is based on the lowest level of input that is significant to the fair value measurement. The fund’s assessment of the significance of a particular input to the fair value measurement in its entirety requires judgment, and considers factors specific to the investment. Level 1 includes unadjusted quoted prices in active markets for identical assets or liabilities. Level 2 includes other significant observable market-based inputs (including quoted prices for similar securities, interest rates, prepayment speed, and credit risk). Level 3 includes unobservable inputs, which may include the adviser’s own assumptions in determining the fair value of investments. The following is a summary of the levels used as of December 31, 2019 in valuing the fund’s assets or liabilities:
| | | | | | | | | | | | | | | | |
| Financial Instruments | | Level 1 | | | Level 2 | | | Level 3 | | | Total | |
| Mutual Funds | | | $1,421,523,277 | | | | $— | | | | $— | | | | $1,421,523,277 | |
For further information regarding security characteristics, see the Portfolio of Investments. Please refer to the underlying funds’ shareholder reports for further information regarding the levels used in valuing the underlying funds’ assets or liabilities.
Derivatives– The fund does not invest in derivatives directly. The fund does invest in underlying funds that may use derivatives primarily to increase or decrease exposure to a particular market or segment of the market, or security, to increase or decrease interest rate or currency exposure, or as alternatives to direct investments. Derivatives are used for hedging ornon-hedging purposes. While hedging can reduce or eliminate losses, it can also reduce or eliminate gains. When the underlying funds use derivatives as an investment to increase market exposure, or for hedging purposes, gains and losses from derivative instruments may be substantially greater than the derivative’s original cost.
Indemnifications– Under the fund’s organizational documents, its officers and Trustees may be indemnified against certain liabilities and expenses arising out of the performance of their duties to the fund. Additionally, in the normal course of business, the fund enters into agreements with service providers that may contain indemnification clauses. The fund’s maximum exposure under these agreements is unknown as this would involve future claims that may be made against the fund that have not yet occurred.
15
MFS Moderate Allocation Portfolio
Notes to Financial Statements – continued
Investment Transactions and Income– Investment transactions are recorded on the trade date. Interest income is recorded on the accrual basis. All premium and discount is amortized or accreted for financial statement purposes in accordance with U.S. generally accepted accounting principles. Distributions of income and capital gains from the underlying funds are recorded on theex-dividend date. Recognition of net investment income by the fund is affected by the timing of the declaration of distributions by the underlying funds in which the fund invests. In determining the net gain or loss on securities sold, the cost of securities is determined on the identified cost basis.
The fund and/or the underlying funds may receive proceeds from litigation settlements. Any proceeds received from litigation involving portfolio holdings are reflected in the Statement of Operations in realized gain/loss if the security has been disposed of by the fund or in unrealized gain/loss if the security is still held by the fund. Any other proceeds from litigation not related to portfolio holdings are reflected as other income in the Statement of Operations.
Tax Matters and Distributions– The fund intends to qualify as a regulated investment company, as defined under Subchapter M of the Internal Revenue Code, and to distribute all of its taxable income, including realized capital gains. As a result, no provision for federal income tax is required. The fund’s federal tax returns, when filed, will remain subject to examination by the Internal Revenue Service for a three year period. Management has analyzed the fund’s tax positions taken on federal and state tax returns for all open tax years and does not believe that there are any uncertain tax positions that require recognition of a tax liability.
Distributions to shareholders are recorded on theex-dividend date. Income and capital gain distributions are determined in accordance with income tax regulations, which may differ from U.S. generally accepted accounting principles. Certain capital accounts in the financial statements are periodically adjusted for permanent differences in order to reflect their tax character. These adjustments have no impact on net assets or net asset value per share. Temporary differences which arise from recognizing certain items of income, expense, gain or loss in different periods for financial statement and tax purposes will reverse at some time in the future.
Book/tax differences primarily relate to wash sale loss deferrals.
The tax character of distributions declared to shareholders for the last two fiscal years is as follows:
| | | | | | | | |
| | | Year ended
12/31/19 | | | Year ended
12/31/18 | |
| Ordinary income (including any short-term capital gains) | | | $31,668,625 | | | | $31,476,824 | |
| Long-term capital gains | | | 98,016,020 | | | | 70,377,114 | |
| Total distributions | | | $129,684,645 | | | | $101,853,938 | |
The federal tax cost and the tax basis components of distributable earnings were as follows:
| | | | |
| As of 12/31/19 | | | | |
| |
| Cost of investments | | | $1,175,734,573 | |
| Gross appreciation | | | 256,860,780 | |
| Gross depreciation | | | (11,072,076 | ) |
| Net unrealized appreciation (depreciation) | | | $245,788,704 | |
| |
| Undistributed ordinary income | | | 31,751,073 | |
| Undistributed long-term capital gain | | | 80,986,192 | |
Multiple Classes of Shares of Beneficial Interest– The fund offers multiple classes of shares, which differ in their respective distribution and/or service fees. The fund’s income, realized and unrealized gain (loss), and common expenses are allocated to shareholders based on the daily net assets of each class. Dividends are declared separately for each class. Differences in per share dividend rates are generally due to differences in separate class expenses. The fund’s distributions declared to shareholders as reported in the Statements of Changes in Net Assets are presented by class as follows:
| | | | | | | | |
| | |
| | | Year ended
12/31/19 | | | Year ended
12/31/18 | |
| Initial Class | | | $563,100 | | | | $398,314 | |
| Service Class | | | 129,121,545 | | | | 101,455,624 | |
| Total | | | $129,684,645 | | | | $101,853,938 | |
| (3) | | Transactions with Affiliates |
Investment Adviser– The fund has an investment advisory agreement with MFS to provide overall investment management and related administrative services and facilities to the fund. MFS receives no compensation under this agreement; however MFS receives management fees from the underlying MFS funds.
The investment adviser has agreed in writing to pay a portion of the fund’s operating expenses, excluding distribution and/or service fees, interest, taxes, extraordinary expenses, brokerage and transaction costs, and investment-related expenses such as fees and
16
MFS Moderate Allocation Portfolio
Notes to Financial Statements – continued
expenses associated with investments in investment companies and other similar investment vehicles such that fund operating expenses do not exceed 0.20% annually of the fund’s average daily net assets. This written agreement will continue until modified by the fund’s Board of Trustees, but such agreement will continue at least until April 30, 2021. For the year ended December 31, 2019, the fund’s actual operating expenses did not exceed the limit and therefore, the investment adviser did not pay any portion of the fund’s expenses related to this agreement.
In addition to the fees and expenses which the fund bears directly, the fund indirectly bears a pro rata share of the fees and expenses of the underlying funds in which the fund invests. Accordingly, the expense ratio for the fund reflects only those fees and expenses borne directly by the fund.
Distributor– MFS Fund Distributors, Inc. (MFD), a wholly-owned subsidiary of MFS, is the distributor of shares of the fund. The Trustees have adopted a distribution plan for the Service Class shares pursuant to Rule12b-1 under the Investment Company Act of 1940.
The fund’s distribution plan provides that the fund will pay MFD distribution and/or service fees equal to 0.25% per annum of its average daily net assets attributable to Service Class shares as partial consideration for services performed and expenses incurred by MFD and financial intermediaries (including participating insurance companies that invest in the fund to fund variable annuity and variable life insurance contracts, sponsors of qualified retirement and pension plans that invest in the fund, and affiliates of these participating insurance companies and plan sponsors) in connection with the sale and distribution of the Service Class shares. MFD may subsequently pay all, or a portion, of the distribution and/or service fees to financial intermediaries.
Shareholder Servicing Agent– MFS Service Center, Inc. (MFSC), a wholly-owned subsidiary of MFS, receives a fee from the fund for its services as shareholder servicing agent. For the year ended December 31, 2019, the fee was $11,787, which equated to 0.0008% annually of the fund’s average daily net assets. MFSC also receives payment from the fund forout-of-pocket expenses paid by MFSC on behalf of the fund. For the year ended December 31, 2019, these costs amounted to $107.
Administrator– MFS provides certain financial, legal, shareholder communications, compliance, and other administrative services to the fund. Under an administrative services agreement, the fund reimburses MFS the costs incurred to provide these services. The fund pays an annual fixed amount of $17,500. The administrative services fee incurred for the year ended December 31, 2019 was equivalent to an annual effective rate of 0.0012% of the fund’s average daily net assets.
Trustees’ and Officers’ Compensation– The fund pays compensation to independent Trustees in the form of a retainer, attendance fees, and additional compensation to Board and Committee chairpersons. The fund does not pay compensation directly to Trustees or officers of the fund who are also officers of the investment adviser, all of whom receive remuneration from MFS for their services to the fund. Certain officers and Trustees of the fund are officers or directors of MFS, MFD, and MFSC.
Other– This fund and certain other funds managed by MFS (the funds) had entered into a service agreement (the ISO Agreement) which provided for payment of fees solely by the funds to Tarantino LLC in return for the provision of services of an Independent Senior Officer (ISO) for the funds. Frank L. Tarantino served as the ISO and was an officer of the funds and the sole member of Tarantino LLC. Effective June 30, 2019, Mr. Tarantino retired from his position as ISO for the funds, and the ISO Agreement was terminated. For the year ended December 31, 2019, the fee paid by the fund under this agreement was $1,688 and is included in “Miscellaneous” expense in the Statement of Operations. MFS had agreed to bear all expenses associated with office space, other administrative support, and supplies provided to the ISO.
The fund invests in the MFS Institutional Money Market Portfolio which is managed by MFS and seeks current income consistent with preservation of capital and liquidity. This money market fund does not pay a management fee to MFS.
For the year ended December 31, 2019, purchases and sales of shares of underlying funds, excluding the MFS Institutional Money Market Portfolio, aggregated $15,568,218 and $250,197,971, respectively.
17
MFS Moderate Allocation Portfolio
Notes to Financial Statements – continued
| (5) | | Shares of Beneficial Interest |
The fund’s Declaration of Trust permits the Trustees to issue an unlimited number of full and fractional shares of beneficial interest. Transactions in fund shares were as follows:
| | | | | | | | | | | | | | | | |
| | | Year ended 12/31/19 | | | Year ended 12/31/18 | |
| | | | |
| | | Shares | | | Amount | | | Shares | | | Amount | |
| Shares sold | | | | | | | | | | | | | | | | |
Initial Class | | | 27,059 | | | | $351,818 | | | | 15,595 | | | | $205,746 | |
Service Class | | | 133,868 | | | | 1,765,070 | | | | 1,127,406 | | | | 14,024,178 | |
| | | 160,927 | | | | $2,116,888 | | | | 1,143,001 | | | | $14,229,924 | |
| | | | |
| Shares issued to shareholders in reinvestment of distributions | | | | | | | | | | | | | | | | |
Initial Class | | | 45,048 | | | | $563,100 | | | | 30,592 | | | | $398,314 | |
Service Class | | | 10,329,723 | | | | 129,121,545 | | | | 7,792,291 | | | | 101,455,624 | |
| | | 10,374,771 | | | | $129,684,645 | | | | 7,822,883 | | | | $101,853,938 | |
| | | | |
| Shares reacquired | | | | | | | | | | | | | | | | |
Initial Class | | | (30,872 | ) | | | $(397,056 | ) | | | (54,192 | ) | | | $(721,918 | ) |
Service Class | | | (17,736,864 | ) | | | (232,608,066 | ) | | | (21,261,806 | ) | | | (280,581,274 | ) |
| | | (17,767,736 | ) | | | $(233,005,122 | ) | | | (21,315,998 | ) | | | $(281,303,192 | ) |
| | | | |
| Net change | | | | | | | | | | | | | | | | |
Initial Class | | | 41,235 | | | | $517,862 | | | | (8,005 | ) | | | $(117,858 | ) |
Service Class | | | (7,273,273 | ) | | | (101,721,451 | ) | | | (12,342,109 | ) | | | (165,101,472 | ) |
| | | (7,232,038 | ) | | | $(101,203,589 | ) | | | (12,350,114 | ) | | | $(165,219,330 | ) |
The fund and certain other funds managed by MFS participate in a $1.25 billion unsecured committed line of credit, subject to a $1 billion sublimit, provided by a syndicate of banks under a credit agreement. Borrowings may be made for temporary financing needs. Interest is charged to each fund, based on its borrowings, generally at a rate equal to the highest of one month LIBOR, the Federal Funds Effective Rate and the Overnight Bank Funding Rate, plus an agreed upon spread. A commitment fee, based on the average daily, unused portion of the committed line of credit, is allocated among the participating funds. In addition, the fund and other funds managed by MFS have established unsecured uncommitted borrowing arrangements with certain banks for temporary financing needs. Interest is charged to each fund, based on its borrowings, at rates equal to customary reference rates plus an agreed upon spread. For the year ended December 31, 2019, the fund’s commitment fee and interest expense were $7,820 and $0, respectively, and are included in “Miscellaneous” expense in the Statement of Operations.
18
MFS Moderate Allocation Portfolio
Notes to Financial Statements – continued
| (7) | | Investments in Affiliated Issuers |
An affiliated issuer may be considered one in which the fund owns 5% or more of the outstanding voting securities, or a company which is under common control. For the purposes of this report, the following were affiliated issuers:
| | | | | | | | | | | | | | | | | | | | | | | | |
| Affiliated Issuers | | Beginning
Value | | | Purchases | | | Sales
Proceeds | | | Realized
Gain
(Loss) | | | Change in
Unrealized
Appreciation or
Depreciation | | | Ending
Value | |
| MFS Global Governments Portfolio | | | $72,191,316 | | | | $1,879,350 | | | | $7,457,767 | | | | $(245,032 | ) | | | $2,820,312 | | | | $69,188,179 | |
| MFS Global Real Estate Portfolio | | | 40,998,536 | | | | 1,866,154 | | | | 9,046,173 | | | | 1,614,191 | | | | 6,780,503 | | | | 42,213,211 | |
| MFS Government Securities Portfolio | | | 143,681,547 | | | | 4,430,108 | | | | 13,316,119 | | | | (1,130,444 | ) | | | 5,983,775 | | | | 139,648,867 | |
| MFS Growth Series | | | 119,215,888 | | | | 12,732,449 | | | | 33,773,516 | | | | 9,231,781 | | | | 21,801,277 | | | | 129,207,879 | |
| MFS High Yield Portfolio | | | 69,619,240 | | | | 4,065,142 | | | | 8,360,040 | | | | (704,941 | ) | | | 6,496,765 | | | | 71,116,166 | |
| MFS Inflation-Adjusted Bond Portfolio | | | 70,937,202 | | | | 1,339,565 | | | | 7,108,495 | | | | (44,320 | ) | | | 4,573,927 | | | | 69,697,879 | |
| MFS Institutional Money Market Portfolio | | | 1,565,905 | | | | 5,040,518 | | | | 5,035,918 | | | | 94 | | | | 38 | | | | 1,570,637 | |
| MFS International Growth Portfolio | | | 41,060,583 | | | | 5,201,342 | | | | 8,453,280 | | | | 318,188 | | | | 4,901,334 | | | | 43,028,167 | |
| MFS International Intrinsic Value Portfolio | | | 41,120,873 | | | | 2,218,858 | | | | 8,282,678 | | | | 2,421,027 | | | | 5,432,135 | | | | 42,910,215 | |
| MFS Limited Maturity Portfolio | | | 56,740,356 | | | | 1,610,586 | | | | 3,372,889 | | | | 17,684 | | | | 1,327,032 | | | | 56,322,769 | |
| MFS Mid Cap Growth Series | | | 92,378,020 | | | | 14,854,594 | | | | 27,571,440 | | | | 2,472,465 | | | | 17,981,271 | | | | 100,114,910 | |
| MFS Mid Cap Value Portfolio | | | 91,914,038 | | | | 11,790,588 | | | | 20,497,683 | | | | (196,595 | ) | | | 17,491,438 | | | | 100,501,786 | |
| MFS New Discovery Series | | | 19,333,252 | | | | 4,296,768 | | | | 5,969,033 | | | | 602,116 | | | | 3,242,130 | | | | 21,505,233 | |
| MFS New Discovery Value Portfolio | | | 19,362,771 | | | | 4,077,267 | | | | 4,554,913 | | | | (358,903 | ) | | | 2,961,669 | | | | 21,487,891 | |
| MFS Research International Portfolio | | | 93,601,861 | | | | 7,067,959 | | | | 19,249,883 | | | | 1,864,782 | | | | 17,147,764 | | | | 100,432,483 | |
| MFS Research Series | | | 106,220,785 | | | | 14,389,296 | | | | 26,190,986 | | | | 2,072,892 | | | | 18,303,355 | | | | 114,795,342 | |
| MFS Total Return Bond Series | | | 171,364,336 | | | | 5,855,304 | | | | 19,432,734 | | | | (686,598 | ) | | | 11,692,426 | | | | 168,792,734 | |
| MFS Value Series | | | 119,004,128 | | | | 12,290,460 | | | | 27,560,341 | | | | 3,853,883 | | | | 21,400,799 | | | | 128,988,929 | |
| | | $1,370,310,637 | | | | $115,006,308 | | | | $255,233,888 | | | | $21,102,270 | | | | $170,337,950 | | | | $1,421,523,277 | |
| | | | | | |
| Affiliated Issuers | | | | | | | | | | | | | | Dividend
Income | | | Capital Gain
Distributions | |
| MFS Global Governments Portfolio | | | | | | | | | | | | | | | | | | | $1,693,899 | | | | $— | |
| MFS Global Real Estate Portfolio | | | | | | | | | | | | | | | | | | | 1,561,520 | | | | 274,718 | |
| MFS Government Securities Portfolio | | | | | | | | | | | | | | | | | | | 4,197,854 | | | | — | |
| MFS Growth Series | | | | | | | | | | | | | | | | | | | — | | | | 10,865,137 | |
| MFS High Yield Portfolio | | | | | | | | | | | | | | | | | | | 4,023,020 | | | | — | |
| MFS Inflation-Adjusted Bond Portfolio | | | | | | | | | | | | | | | | | | | 1,174,376 | | | | — | |
| MFS Institutional Money Market Portfolio | | | | | | | | | | | | | | | | | | | 34,752 | | | | — | |
| MFS International Growth Portfolio | | | | | | | | | | | | | | | | | | | 586,898 | | | | 4,593,589 | |
| MFS International Intrinsic Value Portfolio | | | | | | | | | | | | | | | | | | | 838,866 | | | | 1,254,522 | |
| MFS Limited Maturity Portfolio | | | | | | | | | | | | | | | | | | | 1,519,620 | | | | — | |
| MFS Mid Cap Growth Series | | | | | | | | | | | | | | | | | | | 875,871 | | | | 11,716,546 | |
| MFS Mid Cap Value Portfolio | | | | | | | | | | | | | | | | | | | 1,994,741 | | | | 7,808,512 | |
| MFS New Discovery Series | | | | | | | | | | | | | | | | | | | 1,243,065 | | | | 2,449,635 | |
| MFS New Discovery Value Portfolio | | | | | | | | | | | | | | | | | | | 875,124 | | | | 2,706,501 | |
| MFS Research International Portfolio | | | | | | | | | | | | | | | | | | | 1,478,871 | | | | 4,230,384 | |
| MFS Research Series | | | | | | | | | | | | | | | | | | | 1,527,605 | | | | 10,806,749 | |
| MFS Total Return Bond Series | | | | | | | | | | | | | | | | | | | 5,694,627 | | | | — | |
| MFS Value Series | | | | | | | | | | | | | | | | | | | 2,717,818 | | | | 5,687,505 | |
| | | | | | | | | | | | | | | | | | | $32,038,527 | | | | $62,393,798 | |
19
MFS Moderate Allocation Portfolio
REPORT OF INDEPENDENT REGISTERED PUBLIC ACCOUNTING FIRM
To the Board of Trustees of MFS Variable Insurance Trust III and the Shareholders of
MFS Moderate Allocation Portfolio:
Opinion on the Financial Statements and Financial Highlights
We have audited the accompanying statement of assets and liabilities of MFS Moderate Allocation Portfolio (the “Fund”), including the portfolio of investments, as of December 31, 2019, the related statement of operations for the year then ended, the statements of changes in net assets for each of the two years in the period then ended, the financial highlights for each of the five years in the period then ended, and the related notes. In our opinion, the financial statements and financial highlights present fairly, in all material respects, the financial position of the Fund as of December 31, 2019, and the results of its operations for the year then ended, the changes in its net assets for each of the two years in the period then ended, and the financial highlights for each of the five years in the period then ended, in conformity with accounting principles generally accepted in the United States of America.
Basis for Opinion
These financial statements and financial highlights are the responsibility of the Fund’s management. Our responsibility is to express an opinion on the Fund’s financial statements and financial highlights based on our audits. We are a public accounting firm registered with the Public Company Accounting Oversight Board (United States) (PCAOB) and are required to be independent with respect to the Fund in accordance with the U.S. federal securities laws and the applicable rules and regulations of the Securities and Exchange Commission and the PCAOB.
We conducted our audits in accordance with the standards of the PCAOB. Those standards require that we plan and perform the audit to obtain reasonable assurance about whether the financial statements and financial highlights are free of material misstatement, whether due to error or fraud. The Fund is not required to have, nor were we engaged to perform, an audit of its internal control over financial reporting. As part of our audits we are required to obtain an understanding of internal control over financial reporting but not for the purpose of expressing an opinion on the effectiveness of the Fund’s internal control over financial reporting. Accordingly, we express no such opinion.
Our audits included performing procedures to assess the risks of material misstatement of the financial statements and financial highlights, whether due to error or fraud, and performing procedures that respond to those risks. Such procedures included examining, on a test basis, evidence regarding the amounts and disclosures in the financial statements and financial highlights. Our audits also included evaluating the accounting principles used and significant estimates made by management, as well as evaluating the overall presentation of the financial statements and financial highlights. Our procedures included confirmation of securities owned as of December 31, 2019, by correspondence with the transfer agent. We believe that our audits provide a reasonable basis for our opinion.
DELOITTE & TOUCHE LLP
Boston, Massachusetts
February 14, 2020
We have served as the auditor of one or more of the MFS investment companies since 1924.
20
MFS Moderate Allocation Portfolio
TRUSTEES AND OFFICERS – IDENTIFICATION AND BACKGROUND
The Trustees and Officers of the Trust, as of February 1, 2020, are listed below, together with their principal occupations during the past five years. (Their titles may have varied during that period.) The address of each Trustee and Officer is 111 Huntington Avenue, Boston, Massachusetts 02199-7618.
| | | | | | | | | | |
Name, Age | | Position(s)
Held with Fund | | Trustee/Officer
Since (h) | | Number of MFS Funds
overseen by the
Trustee | | Principal Occupations
During the Past Five Years | | Other Directorships During the Past Five Years (j) |
| INTERESTED TRUSTEES |
Robert J. Manning (k)
(age 56) | | Trustee | | February 2004 | | 133 | | Massachusetts Financial Services Company, Executive Chairman (since January 2017); Director; Chairman of the Board; Chief Executive Officer (until 2015);Co-Chief Executive Officer(2015-2016) | | N/A |
| | | | | |
Robin A. Stelmach (k) (age 58) | | Trustee | | January 2014 | | 133 | | Massachusetts Financial Services Company, Vice Chair (since January 2017); Chief Operating Officer and Executive Vice President (until January 2017) | | N/A |
|
| INDEPENDENT TRUSTEES |
John P. Kavanaugh (age 65) | | Trustee and Chair of Trustees | | January 2009 | | 133 | | Private investor | | N/A |
| | | | | |
Steven E. Buller (age 68) | | Trustee | | February 2014 | | 133 | | Financial Accounting Standards Advisory Council, Chairman(2014-2015); Public Company Accounting Oversight Board, Standing Advisory Group, Member (until 2014); BlackRock, Inc. (investment management), Managing Director (until 2014), BlackRock Finco UK (investment management), Director (until 2014) | | N/A |
| | | | | |
John A. Caroselli (age 65) | | Trustee | | March 2017 | | 133 | | JC Global Advisors, LLC (management consulting), President (since 2015); First Capital Corporation (commercial finance), Executive Vice President (until 2015) | | N/A |
| | | | | |
Maureen R. Goldfarb (age 64) | | Trustee | | January 2009 | | 133 | | Private investor | | N/A |
| | | | | |
Peter D. Jones
(age 64) | | Trustee | | January 2019 | | 133 | | Franklin Templeton Distributors, Inc. (investment management), President (until 2015); Franklin Templeton Institutional, LLC (investment management), Chairman (until 2015) | | N/A |
| | | | | |
James W. Kilman, Jr.
(age 58) | | Trustee | | January 2019 | | 133 | | Burford Capital Limited (finance and investment management), Chief Financial Officer (since 2019); KielStrand Capital LLC (family office), Chief Executive Officer (since 2016); Morgan Stanley & Co. (financial services), Vice Chairman of Investment Banking,Co-Head of Diversified Financials Coverage – Financial Institutions Investment Banking Group (until 2016) | | Alpha-En Corporation, Director (2016-2019) |
21
MFS Moderate Allocation Portfolio
Trustees and Officers – continued
| | | | | | | | | | |
Name, Age | | Position(s)
Held with Fund | | Trustee/Officer
Since (h) | | Number of MFS Funds
overseen by the
Trustee | | Principal Occupations
During the Past Five Years | | Other Directorships During the Past Five Years (j) |
Clarence Otis, Jr. (age 63) | | Trustee | | March 2017 | | 133 | | Darden Restaurants, Inc., Chief Executive Officer (until 2014) | | VF Corporation, Director; Verizon Communications, Inc., Director; The Travelers Companies, Director; Federal Reserve Bank of Atlanta, Director (until 2015) |
| | | | | |
Maryanne L. Roepke (age 63) | | Trustee | | May 2014 | | 133 | | American Century Investments (investment management), Senior Vice President and Chief Compliance Officer (until 2014) | | N/A |
| | | | | |
Laurie J. Thomsen
(age 62) | | Trustee | | March 2005 | | 133 | | Private investor | | The Travelers Companies, Director; Dycom Industries, Inc., Director (since 2015) |
| | | | | | | | |
Name, Age | | Position(s)
Held with Fund | | Trustee/Officer
Since (h) | | Number of
MFS Funds
for which the
Person is an
Officer | | Principal Occupations During the Past Five Years |
| OFFICERS | | | | | | |
Christopher R. Bohane (k)
(age 46) | | Assistant Secretary and Assistant Clerk | | July 2005 | | 133 | | Massachusetts Financial Services Company, Vice President and Assistant General Counsel |
| | | | |
Kino Clark (k) (age 51) | | Assistant Treasurer | | January 2012 | | 133 | | Massachusetts Financial Services Company, Vice President |
| | | | |
John W. Clark, Jr. (k) (age 52) | | Assistant Treasurer | | April 2017 | | 133 | | Massachusetts Financial Services Company, Vice President (since March 2017); Deutsche Bank (financial services), Department Head – Treasurer’s Office (until February 2017) |
| | | | |
Thomas H. Connors (k) (age 60) | | Assistant Secretary and Assistant Clerk | | September 2012 | | 133 | | Massachusetts Financial Services Company, Vice President and Senior Counsel |
| | | | |
David L. DiLorenzo (k)
(age 51) | | President | | July 2005 | | 133 | | Massachusetts Financial Services Company, Senior Vice President |
| | | | |
Heidi W. Hardin (k) (age 52) | | Secretary and Clerk | | April 2017 | | 133 | | Massachusetts Financial Services Company, Executive Vice President and General Counsel (since March 2017); Harris Associates (investment management), General Counsel (from September 2015 to January 2017); Janus Capital Management LLC (investment management), Senior Vice President and General Counsel (until September 2015) |
| | | | |
Brian E. Langenfeld (k) (age 46) | | Assistant
Secretary and Assistant Clerk | | June 2006 | | 133 | | Massachusetts Financial Services Company, Vice President and Senior Counsel |
| | | | |
Amanda S. Mooradian (k) (age 40) | | Assistant
Secretary and Assistant Clerk | | September 2018 | | 133 | | Massachusetts Financial Services Company, Assistant Vice President and Counsel |
| | | | |
Susan A. Pereira (k)
(age 49) | | Assistant
Secretary and Assistant Clerk | | July 2005 | | 133 | | Massachusetts Financial Services Company, Vice President and Assistant General Counsel |
| | | | |
Kasey L. Phillips (k) (age 49) | | Assistant Treasurer | | September 2012 | | 133 | | Massachusetts Financial Services Company, Vice President |
| | | | |
Matthew A. Stowe (k) (age 45) | | Assistant Secretary and Assistant Clerk | | October 2014 | | 133 | | Massachusetts Financial Services Company, Vice President and Assistant General Counsel |
22
MFS Moderate Allocation Portfolio
Trustees and Officers – continued
| | | | | | | | |
Name, Age | | Position(s)
Held with Fund | | Trustee/Officer
Since (h) | | Number of
MFS Funds
for which the
Person is an
Officer | | Principal Occupations During the Past Five Years |
Martin J. Wolin (k) (age 52) | | Chief Compliance Officer | | July 2015 | | 133 | | Massachusetts Financial Services Company, Senior Vice President and Chief Compliance Officer (since July 2015); Mercer (financial service provider), Chief Risk and Compliance Officer, North America and Latin America (until June 2015) |
| | | | |
James O. Yost (k)
(age 59) | | Treasurer | | September 1990 | | 133 | | Massachusetts Financial Services Company, Senior Vice President |
| (h) | Date first appointed to serve as Trustee/officer of an MFS Fund. Each Trustee has served continuously since appointment unless indicated otherwise. For the period from December 15, 2004 until February 22, 2005, Mr. Manning served as Advisory Trustee. From January 2012 through December 2016, Messrs. DiLorenzo and Yost served as Treasurer and Deputy Treasurer of the Funds, respectively. |
| (j) | Directorships or trusteeships of companies required to report to the Securities and Exchange Commission (i.e., “public companies”). |
| (k) | “Interested person” of the Trust within the meaning of the Investment Company Act of 1940 (referred to as the 1940 Act), which is the principal federal law governing investment companies like the fund, as a result of a position with MFS. The address of MFS is 111 Huntington Avenue, Boston, Massachusetts 02199-7618. |
Each Trustee (other than Messrs. Jones and Kilman) has been elected by shareholders and each Trustee and Officer holds office until his or her successor is chosen and qualified or until his or her earlier death, resignation, retirement or removal. Messrs. Jones and Kilman became Trustees of the Funds on January 1, 2019. The Trust does not hold annual meetings for the purpose of electing Trustees, and Trustees are not elected for fixed terms. Under the terms of the Board’s retirement policy, an Independent Trustee shall retire at the end of the calendar year in which he or she reaches the earlier of 75 years of age or 15 years of service on the Board (or, in the case of any Independent Trustee who joined the Board prior to 2015, 20 years of service on the Board).
Messrs. Buller, Kilman and Otis and Ms. Roepke are members of the Trust’s Audit Committee.
Each of the Interested Trustees and certain Officers hold comparable officer positions with certain affiliates of MFS.
The Statement of Additional Information for a Fund includes further information about the Trustees and is available without charge upon request by calling1-800-225-2606.
| | |
Investment Adviser Massachusetts Financial Services Company 111 Huntington Avenue Boston, MA 02199-7618 | | Custodian State Street Bank and Trust Company 1 Lincoln Street Boston, MA 02111-2900 |
| |
Distributor MFS Fund Distributors, Inc. 111 Huntington Avenue Boston, MA 02199-7618 | | Independent Registered Public Accounting Firm Deloitte & Touche LLP 200 Berkeley Street Boston, MA 02116 |
| |
Portfolio Manager(s) Joseph Flaherty Natalie Shapiro | | |
23
MFS Moderate Allocation Portfolio
BOARD REVIEW OF INVESTMENT ADVISORY AGREEMENT
MFS Moderate Allocation Portfolio
The Investment Company Act of 1940 requires that both the full Board of Trustees and a majority of thenon-interested (“independent”) Trustees, voting separately, annually approve the continuation of the Fund’s investment advisory agreement with MFS. The Trustees consider matters bearing on the Fund and its advisory arrangements at their meetings throughout the year, including a review of performance data at each regular meeting. In addition, the independent Trustees met several times over the course of three months beginning in May and ending in July, 2019 (“contract review meetings”) for the specific purpose of considering whether to approve the continuation of the investment advisory agreement for the Fund and the other investment companies that the Board oversees (the “MFS Funds”). The independent Trustees were assisted in their evaluation of the Fund’s investment advisory agreement by independent legal counsel, from whom they received separate legal advice and with whom they met separately from MFS during various contract review meetings. The independent Trustees were also assisted in this process by the MFS Funds’ Independent Senior Officer, a senior officer appointed by and reporting to the independent Trustees.
In connection with their deliberations regarding the continuation of the investment advisory agreement, the Trustees, including the independent Trustees, considered such information and factors as they believed, in light of the legal advice furnished to them and their own business judgment, to be relevant. The investment advisory agreement for the Fund was considered separately, although the Trustees also took into account the common interests of all MFS Funds in their review. As described below, the Trustees considered the nature, quality, and extent of the various investment advisory, administrative, and shareholder services performed by MFS under the existing investment advisory agreement and other arrangements with the Fund.
In connection with their contract review meetings, the Trustees received and relied upon materials that included, among other items: (i) information provided by Broadridge Financial Solutions, Inc. (“Broadridge”), an independent third party, on the investment performance of the Fund for various time periods ended December 31, 2018 and the investment performance of a group of funds with substantially similar investment classifications/objectives (the “Broadridge performance universe”), (ii) information provided by Broadridge on the Fund’s fees and expenses and the fees and expenses of comparable funds identified by Broadridge as well as all other funds in the same investment classification/category (the “Broadridge expense group and universe”), (iii) information as to whether and to what extent applicable expense waivers and reimbursements are observed for the Fund, (iv) information regarding MFS’ financial results and financial condition, including MFS’ and certain of its affiliates’ estimated profitability from services performed for the Fund and the MFS Funds as a whole, and compared to MFS’ institutional business, (v) MFS’ views regarding the outlook for the mutual fund industry and the strategic business plans of MFS, (vi) descriptions of various functions performed by MFS for the Funds, such as compliance monitoring and portfolio trading practices, and (vii) information regarding the overall organization of MFS, including information about MFS’ senior management and other personnel providing investment advisory, administrative and other services to the Fund and the other MFS Funds. The comparative performance, fee and expense information prepared and provided by Broadridge was not independently verified and the independent Trustees did not independently verify any information provided to them by MFS.
The Trustees’ conclusion as to the continuation of the investment advisory agreement was based on a comprehensive consideration of all information provided to the Trustees and not the result of any single factor. Some of the factors that figured particularly in the Trustees’ deliberations are described below, although individual Trustees may have evaluated the information presented differently from one another, giving different weights to various factors. It is also important to recognize that the fee arrangements for the Fund and other MFS Funds are the result of years of review and discussion between the independent Trustees and MFS, that certain aspects of such arrangements may receive greater scrutiny in some years than in others, and that the Trustees’ conclusions may be based, in part, on their consideration of these same arrangements during the course of the year and in prior years.
Based on information provided by Broadridge and MFS, the Trustees reviewed the Fund’s total return investment performance as well as the Broadridge performance universe over various time periods. The Trustees placed particular emphasis on the total return performance of the Fund’s Initial Class shares in comparison to the performance of funds in its Broadridge performance universe over the five-year period ended December 31, 2018, which the Trustees believed was a long enough period to reflect differing market conditions. The total return performance of the Fund’s Initial Class shares was in the 1st quintile relative to the other funds in the universe for this five-year period (the 1st quintile being the best performers and the 5th quintile being the worst performers). The total return performance of the Fund’s Initial Class shares was in the 1st quintile for each of theone- and three-year periods ended December 31, 2018 relative to the Broadridge performance universe. Because of the passage of time, these performance results may differ from the performance results for more recent periods, including those shown elsewhere in this report.
In the course of their deliberations, the Trustees took into account information provided by MFS in connection with the contract review meetings, as well as during investment review meetings conducted with portfolio management personnel during the course of the year regarding the Fund’s performance. After reviewing these and related factors, the Trustees concluded, within the context of their overall conclusions regarding the investment advisory agreement, that they were satisfied with MFS’ responses and efforts relating to investment performance.
24
MFS Moderate Allocation Portfolio
Board Review of Investment Advisory Agreement – continued
The Trustees considered that MFS does not charge an advisory fee for providing investment advisory services to the Fund, but that the Fund pays its pro rata share of the advisory fees paid by the underlying funds in which it invests (the “Underlying Funds”).
In assessing the reasonableness of the Fund’s expenses, the Trustees considered, among other information, the Fund’s total expense ratio of the Fund’s Initial Class shares as a percentage of average daily net assets and the total expense ratios of the Broadridge expense group based on information provided by Broadridge. The Trustees considered that MFS currently observes an expense limitation for the Fund, which may not be changed without the Trustees’ approval. The Trustees also considered that, according to the data provided by Broadridge (which takes into account any expense limitations that were in effect during the Fund’s last fiscal year), the Fund’s total expense ratio was lower than the Broadridge expense group median. Because the Fund does not pay an advisory fee, the Trustees did not consider the extent to which economies of scale would be realized due to the Fund’s growth of assets, whether fee levels reflect economies of scale for shareholders, or the fees paid by similar funds to other investment advisers or by similar clients of MFS.
The Trustees also considered information prepared by MFS relating to MFS’ costs and profits with respect to the Fund, the MFS Funds considered as a group, and other investment companies and accounts advised by MFS, as well as MFS’ methodologies used to determine and allocate its costs to the MFS Funds, the Fund and other accounts and products for purposes of estimating profitability.
In addition, the Trustees considered MFS’ resources and related efforts to continue to retain, attract and motivate capable personnel to serve the Fund. The Trustees also considered current and developing conditions in the financial services industry, including the presence of large and well-capitalized companies which are spending, and appear to be prepared to continue to spend, substantial sums to engage personnel and to provide services to competing investment companies. In this regard, the Trustees also considered the financial resources of MFS and its ultimate parent, Sun Life Financial Inc. The Trustees also considered the advantages and possible disadvantages to the Fund of having an adviser that also serves other investment companies as well as other accounts.
The Trustees also considered the nature, quality, cost, and extent of administrative, transfer agency, and distribution services provided to the Fund by MFS and its affiliates under agreements and plans other than the investment advisory agreement, including any12b-1 fees the Fund pays to MFS Fund Distributors, Inc., an affiliate of MFS. The Trustees also considered the nature, extent and quality of certain other services MFS performs or arranges for on the Fund’s or the Underlying Funds’ behalf, which may include securities lending programs, directed expense payment programs, class action recovery programs, and MFS’ interaction withthird-party service providers, principally custodians andsub-custodians. The Trustees concluded that the variousnon-advisory services provided by MFS and its affiliates on behalf of the Fund were satisfactory.
The Trustees consideredso-called“fall-out benefits” to MFS such as reputational value derived from serving as investment manager to the MFS Funds. The Trustees also considered that, effective January 3, 2018, MFS had discontinued its historic practice of obtaining investment research from portfolio brokerage commissions paid by certain MFS Funds and would thereafter directly pay for or voluntarily reimburse a Fund, if applicable, for the costs of external research acquired through the use of the Fund’s portfolio brokerage commissions.
Based on their evaluation of factors that they deemed to be material, including those factors described above, the Board of Trustees, including the independent Trustees, concluded that the Fund’s investment advisory agreement with MFS should be continued for an additionalone-year period, commencing August 1, 2019.
25
MFS Moderate Allocation Portfolio
PROXY VOTING POLICIES AND INFORMATION
MFS votes proxies on behalf of the fund pursuant to proxy voting policies and procedures that are available without charge, upon request, by calling 1-800-225-2606, by visitingmfs.com/proxyvoting, or by visiting the SEC’s Web site athttp://www.sec.gov.
Information regarding how the fund voted proxies relating to portfolio securities during the most recent twelve-month period ended June 30 is available by August 31 of each year without charge by visitingmfs.com/proxyvoting, or by visiting the SEC’s Web site athttp://www.sec.gov.
QUARTERLY PORTFOLIO DISCLOSURE
The fund files a complete schedule of portfolio holdings with the SEC for the first and third quarters of each fiscal year as an exhibit to its reports on Form N-PORT. The fund’s Form N-PORT reports are available on the SEC’s website athttp://www.sec.gov. A shareholder can obtain the portfolio holdings report for the first and third quarters of the fund’s fiscal year atmfs.com/vit3 by choosing the fund’s name and then selecting the “Resources” tab and clicking on “Prospectus and Reports”.
FURTHER INFORMATION
From time to time, MFS may post important information about the fund or the MFS funds on the MFS web site (mfs.com). This information is available athttps://www.mfs.com/en-us/what-we-do/announcements.html or at mfs.com/vit3by choosing the fund’s name.
INFORMATION ABOUT FUND CONTRACTS AND LEGAL CLAIMS
The fund has entered into contractual arrangements with an investment adviser, administrator, distributor, shareholder servicing agent, 529 program manager (if applicable), and custodian who each provide services to the fund. Unless expressly stated otherwise, shareholders are not parties to, or intended beneficiaries of these contractual arrangements, and these contractual arrangements are not intended to create any shareholder right to enforce them against the service providers or to seek any remedy under them against the service providers, either directly or on behalf of the fund.
Under the Trust’s By-Laws and Declaration of Trust, any claims asserted against or on behalf of the MFS Funds, including claims against Trustees and Officers, must be brought in state and federal courts located within the Commonwealth of Massachusetts.
FEDERAL TAX INFORMATION (unaudited)
The following information is provided pursuant to provisions of the Internal Revenue Code.
The fund designates $107,818,000 as capital gain dividends paid during the fiscal year.
For corporate shareholders, 21.88% of the ordinary income dividends paid during the fiscal year qualify for the corporate dividends received deduction.
26
rev. 3/16
| | | | |
| | | |
| FACTS | | WHAT DOES MFS DO WITH YOUR
PERSONAL INFORMATION? | |  |
| | |
| Why? | | Financial companies choose how they share your personal information. Federal law gives consumers the right to limit some but not all sharing. Federal law also requires us to tell you how we collect, share, and protect your personal information. Please read this notice carefully to understand what we do. |
| | |
| What? | | The types of personal information we collect and share depend on the product or service you have with us. This information can include: • Social Security number and account balances • Account transactions and transaction history • Checking account information and wire transfer instructions When you areno longer our customer, we continue to share your information as described in this notice. |
| | |
| How? | | All financial companies need to share customers’ personal information to run their everyday business. In the section below, we list the reasons financial companies can share their customers’ personal information; the reasons MFS chooses to share; and whether you can limit this sharing. |
| | | | |
Reasons we can share your
personal information | | Does MFS share? | | Can you limit this
sharing? |
For our everyday business purposes – such as to process your transactions, maintain your account(s), respond to court orders and legal investigations, or report to credit bureaus | | Yes | | No |
For our marketing purposes – to offer our products and services to you | | No | | We don’t share |
| For joint marketing with other financial companies | | No | | We don’t share |
For our affiliates’ everyday business purposes – information about your transactions and experiences | | No | | We don’t share |
For our affiliates’ everyday business purposes – information about your creditworthiness | | No | | We don’t share |
| For nonaffiliates to market to you | | No | | We don’t share |
| | |
| | |
| Questions? | | Call800-225-2606 or go tomfs.com. |
27
| | |
| Who we are |
| Who is providing this notice? | | MFS Funds, MFS Investment Management, MFS Institutional Advisors, Inc., and MFS Heritage Trust Company. |
| | |
| What we do |
| How does MFS protect my personal information? | | To protect your personal information from unauthorized access and use, we use security measures that comply with federal law. These measures include procedural, electronic, and physical safeguards for the protection of the personal information we collect about you. |
How does MFS
collect my personal information? | | We collect your personal information, for example, when you • open an account or provide account information • direct us to buy securities or direct us to sell your securities • make a wire transfer We also collect your personal information from others, such as credit bureaus, affiliates, or other companies. |
| Why can’t I limit all sharing? | | Federal law gives you the right to limit only • sharing for affiliates’ everyday business purposes – information about your creditworthiness • affiliates from using your information to market to you • sharing for nonaffiliates to market to you State laws and individual companies may give you additional rights to limit sharing. |
| | |
| Definitions |
| Affiliates | | Companies related by common ownership or control. They can be financial and nonfinancial companies. • MFS does not share personal information with affiliates, except for everyday business purposes as described on page one of this notice. |
| Nonaffiliates | | Companies not related by common ownership or control. They can be financial and nonfinancial companies. • MFS does not share with nonaffiliates so they can market to you. |
| Joint marketing | | A formal agreement between nonaffiliated financial companies that together market financial products or services to you. • MFS doesn’t jointly market. |
| | |
| Other important information |
| If you own an MFS product or receive an MFS service in the name of a third party such as a bank or broker-dealer, their privacy policy may apply to you instead of ours. |
28
Annual Report
December 31, 2019

MFS® New Discovery Value Portfolio

MFS® Variable Insurance Trust III
Beginning on January 1, 2021, as permitted by regulations adopted by the U.S. Securities and Exchange Commission, the insurance company that offers your contract may determine that it will no longer send you paper copies of the fund’s annual and semiannual shareholder reports unless you specifically request paper copies from the insurance company or from your financial intermediary. Instead, the shareholder reports will be made available on a Web site (insurancefunds.mfs.com or other Web site of which you will be notified), and the insurance company will notify you by mail each time a report is posted and provide you with a Web site link to access the report. Instructions for requesting paper copies will be provided by your insurance company or financial intermediary.
If you already elected to receive shareholder reports by email, you will not be affected by this change and you need not take any action. If your insurance company or financial intermediary offers electronic delivery, you may elect to receive shareholder reports and other communications from the insurance company or financial intermediary by email by following the instructions provided by the insurance company or financial intermediary.
Beginning on January 1, 2019, you may elect to receive all future reports in paper free of charge from the insurance company or financial intermediary. You can inform the insurance company or financial intermediary that you wish to continue receiving paper copies of your shareholder reports by contacting your insurance company or financial intermediary. Your election to receive reports in paper will apply to all funds held in your account with your insurance company or financial intermediary.
VDV-ANN
MFS® New Discovery Value Portfolio
CONTENTS
The report is prepared for the general information of contract owners. It is authorized for distribution to prospective investors only when preceded or accompanied by a current prospectus.
NOT FDIC INSURED• MAY LOSE VALUE• NO BANK OR CREDIT UNION GUARANTEE• NOT A DEPOSIT• NOT INSURED BY ANY FEDERAL GOVERNMENT AGENCY OR NCUA/NCUSIF
MFS New Discovery Value Portfolio
LETTER FROM THE EXECUTIVE CHAIR

Dear Contract Owners:
Slowing global growth, low inflation, and trade friction between the United States and China have been hallmarks of the past 12 months. After experiencing an uptick in market volatility in late 2018, markets steadied for most of 2019, thanks in large measure to the adoption of a dovish policy stance on the part of global central banks, focused on supporting economic growth. Negotiations aimed at a “phase one” trade deal between the U.S. and China bore fruit at the end of the period, boosting investor sentiment, while signs of stability emerging from the global manufacturing sector also lifted spirits. Uncertainty over Brexit, along with the ripple effects from the trade conflict, hampered business confidence and investment in the United Kingdom and Europe for much of the period, though investors expect greater clarity regarding Brexit as a result of December’s general election. The pro-Brexit Conservative Party won the election by a comfortable margin and set the stage for the U.K.’s departure from the EU at the end of January.
Markets expect the longest economic expansion in U.S. history will continue, albeit at a slower pace, as trade tensions recede. In an effort to prolong the expansion, the U.S. Federal Reserve lowered interest rates three times between July and October and the European Central Bank loosened policy in September. While the global monetary policy backdrop remains quite accommodative, signs of easing trade tensions and fading global recession fears led to improved market sentiment in late 2019 as investors grew less risk averse. In early 2020, an outbreak of coronavirus emanating from China reintroduced global growth fears, causing an uptick in volatility.
Here at MFS®, we aim to help our clients navigate the growing complexity of the markets and world economies. Our long-term investment philosophy and commitment to the responsible allocation of capital allow us to tune out the noise and uncover what we believe are the best, most durable investment opportunities in the market. Through our powerful global investment platform, we combine collective expertise, thoughtful risk management and long-term discipline to create sustainable value for investors.
Respectfully,

Robert J. Manning
Executive Chair
MFS Investment Management
February 14, 2020
The opinions expressed in this letter are subject to change and may not be relied upon for investment advice. No forecasts can be guaranteed.
1
MFS New Discovery Value Portfolio
PORTFOLIO COMPOSITION
Portfolio structure
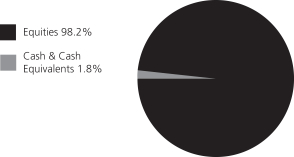
| | | | |
| Top ten holdings | | | | |
| Toll Brothers, Inc. | | | 2.0% | |
| Premier, Inc., “A” | | | 1.8% | |
| KBR, Inc. | | | 1.8% | |
| South Jersey Industries, Inc. | | | 1.8% | |
| Black Hills Corp. | | | 1.6% | |
| First Hawaiian, Inc. | | | 1.6% | |
| Graphic Packaging Holding Co. | | | 1.6% | |
| Portland General Electric Co. | | | 1.5% | |
| Verint Systems, Inc. | | | 1.5% | |
| Berry Global Group, Inc. | | | 1.4% | |
| | | | |
| GICS equity sectors (g) | | | | |
| Financials | | | 24.5% | |
| Industrials | | | 16.0% | |
| Consumer Discretionary | | | 13.8% | |
| Real Estate | | | 8.6% | |
| Information Technology | | | 7.6% | |
| Materials | | | 7.1% | |
| Utilities | | | 5.6% | |
| Energy | | | 5.0% | |
| Consumer Staples | | | 4.7% | |
| Health Care | | | 4.4% | |
| Communication Services | | | 0.9% | |
| (g) | The Global Industry Classification Standard (GICS®) was developed by and/or is the exclusive property of MSCI, Inc. and S&P Global Market Intelligence Inc. (“S&P Global Market Intelligence”). GICS is a service mark of MSCI and S&P Global Market Intelligence and has been licensed for use by MFS. |
Cash & Cash Equivalents includes any cash, investments in money market funds, short-term securities, and other assets less liabilities. Please see the Statement of Assets and Liabilities for additional information related to the fund’s cash position and other assets and liabilities.
Percentages are based on net assets as of December 31, 2019.
The portfolio is actively managed and current holdings may be different.
2
MFS New Discovery Value Portfolio
MANAGEMENT REVIEW
Summary of Results
For the twelve months ended December 31, 2019, Initial Class shares of the MFS New Discovery Value Portfolio (fund) provided a total return of 33.65%, while Service Class shares of the fund provided a total return of 33.43%. These compare with a return of 22.39% over the same period for the fund’s benchmark, the Russell 2000® Value Index.
Market Environment
Fading fears of a near-term global recession, the announcement of a partial trade deal between the United States and China and the decline in uncertainty over Brexit helped bolster market sentiment late in the period. Changes in market sentiment, largely driven by uncertainty over the outcome of trade negotiations between the US and China, had contributed to periodic bouts of volatility during the reporting period. The global economy decelerated, led by weakness in China and Europe, although the pace of the slowdown moderated late in the period amid nascent signs of stabilization in the manufacturing sector.
The deteriorating global growth backdrop, along with declining inflationary pressures, prompted the US Federal Reserve to adopt a more dovish posture beginning in early 2019, resulting in the first interest rate cut in over a decade at the end of July, followed by additional cuts in September and October. The Fed’s actions led to a sharp decline in long-term interest rates during the period’s second half, causing the inversion of portions of the US Treasury yield curve for a time. Amid an improvement in risk sentiment in Q4 2019 and indications of a bottoming in growth and a potential upturn in activity, the Fed indicated in October that further rate cuts were unlikely unless the outlook for the economy materially worsened.
Globally, central banks have tilted more dovish as well, with the European Central Bank unveiling a package of easing measures, which included putting overnight rates deeper into negative territory, restarting its bond-buying program and lengthening the term of cheap loans to banks to three years from two. The central banks of India and Australia are among those that have cut rates several times in recent months, although China has been more cautious in increasing liquidity as it keeps trying to deleverage its economy, cutting rates only marginally.
Emerging markets experienced considerable volatility through the end of 2018, as tighter global financial conditions exposed structural weakness in some countries. Those conditions improved in 2019 as the Fed became more dovish. Notwithstanding the periodic headwinds on market sentiment from significant trade friction between the US and China over much of the year, emerging market hard currency debt and local rates benefited from relatively cheap valuations at the beginning of the period and easier global monetary conditions. These factors, plus the fading of certain global risk factors mentioned above, hastened spread tightening in the latter part of the period. At the same time, idiosyncratic risks spiked in some countries (e.g., Argentina and Lebanon), contributing to increased dispersion in performance among sovereign assets.
Contributors to Performance
Security selection and, to a lesser extent, overweight positions in both theindustrials andconsumer discretionary sectors contributed to the fund’s performance relative to the Russell 2000® Value Index. Within theindustrialssector, holding shares of residential and commercial building materials manufacturer Owens Corning (b), and the fund’s overweight position in commercial landscaping services provider BrightView Holdings, buoyed relative results. Within theconsumer discretionarysector, holding shares of lifestyle footwear developer Skechers USA (b), and an overweight position in youth apparel retailer Zumiez, benefited relative returns. The stock price of Skechers USA advanced as the company reported strong revenue results, driven by growth in its international wholesale and retail segments.
Security selection in thefinancialssector also bolstered relative performance. Within this sector, holding shares of financial services firms, TMX Group (b) (Canada) and Element Fleet Management (b) (Canada), contributed to relative returns.
The combination of an underweight position and stock selection in theenergysector supported relative performance. Within this sector, there were no individual stocks that were among the fund’s largest relative contributors during the period.
Elsewhere, the fund’s overweight positions in engineering, procurement and construction company KBR and poultry processing company Sanderson Farms aided relative results. The share price of KBR advanced after the company reported solid financial results, driven by strong performance in both its energy solutions and government solutions segments. In addition, holding shares ofpaper-based packaging solutions provider Graphic Packaging Holding (b) and automotive cloud services provider Model N (b)(h) further benefited relative returns.
Detractors from Performance
Individual stocks that were among the fund’s top relative detractors during the reporting period included holding shares of health care services provider Premier (b), onshore contract drilling services providerPatterson-UTI Energy (b), specialty materials firm Berry Global Group (b) and apparel retailer Urban Outfitters (b). The fund’s holdings of arts and crafts specialty retailer Michaels Co., which was not a constituent of the Russell 2000 Value Index for the entire reporting period, also held back relative returns. The stock price
3
MFS New Discovery Value Portfolio
Management Review – continued
of Michaels Co. declined as the company reported weak gross margins and announced a further reduction in its earnings outlook, as a result of a challenging arts and crafts industry environment. Additionally, the fund’s overweight positions in industrial coatings and pigment producer Ferro and oil and gas services provider Frank’s International, and not holding shares of strong-performing semiconductor manufacturer Cirrus Logic, biopharmaceutical firm The Medicines Company and optical and photonics products manufacturer Lumentum, weakened relative returns. The stock price of Ferro depreciated as the company reported lower-than-expected sales and weak customer demand in its key construction and automobile end markets.
Respectfully,
Portfolio Manager(s)
Richard Offen and Kevin Schmitz
Note to Shareholders: Effective December 31, 2019, Richard Offen was added as a Portfolio Manager of the Fund.
| (b) | Security is not a benchmark constituent. |
| (h) | Security was not held in the portfolio at period end. |
The views expressed in this report are those of the portfolio manager(s) only through the end of the period of the report as stated on the cover and do not necessarily reflect the views of MFS or any other person in the MFS organization. These views are subject to change at any time based on market or other conditions, and MFS disclaims any responsibility to update such views. These views may not be relied upon as investment advice or an indication of trading intent on behalf of any MFS portfolio. References to specific securities are not recommendations of such securities, and may not be representative of any MFS portfolio’s current or future investments.
4
MFS New Discovery Value Portfolio
PERFORMANCE SUMMARY THROUGH 12/31/19
The following chart illustrates the historical performance of the fund in comparison to its benchmark(s). Benchmarks are unmanaged and may not be invested in directly. Benchmark returns do not reflect any fees or expenses. The performance of other share classes will be greater than or less than that of the class depicted below. (See Notes to Performance Summary.)
Performance data shown represents past performance and is no guarantee of future results. Investment return and principal value fluctuate so your units, when sold, may be worth more or less than the original cost; current performance may be lower or higher than quoted. The performance shown does not reflect the deduction of taxes, if any, that a contract holder would pay on fund distributions or the redemption of contract units. The returns for the fund shown also do not reflect the deduction of expenses associated with variable products, such as mortality and expense risk charges, separate account charges, and sales charges imposed by the insurance company separate accounts. Such expenses would reduce the overall returns shown.
Growth of a Hypothetical $10,000 Investment
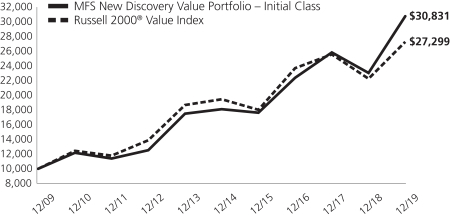
Total Returns through 12/31/19
Average annual total returns
| | | | | | | | | | | | |
| | | Share Class | | Class Inception Date | | 1-yr | | 5-yr | | 10-yr | | |
| | | Initial Class | | 10/01/08 | | 33.65% | | 11.21% | | 11.92% | | |
| | | Service Class | | 10/01/08 | | 33.43% | | 10.94% | | 11.66% | | |
| | | | |
| Comparative benchmark(s) | | | | | | | | |
| | | Russell 2000® Value Index (f) | | 22.39% | | 6.99% | | 10.56% | | |
| (f) | Source: FactSet Research Systems Inc. |
Benchmark Definition(s)
Russell 2000® Value Index – a market-capitalization-weighted, value-oriented index that measures the performance of small-capitalization stocks that have relatively low price-to-book ratios and lower forecasted growth values. Frank Russell Company (“Russell”) is the source and owner of the trademarks, service marks, and copyrights related to the Russell Indexes. Russell® is a trademark of Frank Russell Company. Neither Russell nor its licensors accept any liability for any errors or omissions in the Russell Indexes and/or Russell ratings or underlying data and no party may rely on any Russell Indexes and/or Russell ratings and/or underlying data contained in this document. No further distribution of Russell Data is permitted without Russell’s express written consent. Russell does not promote, sponsor, or endorse the content of this document.
It is not possible to invest directly in an index.
Notes to Performance Summary
Average annual total return represents the average annual change in value for each share class for the periods presented.
Performance results reflect any applicable expense subsidies and waivers in effect during the periods shown. Without such subsidies and waivers the fund’s performance results would be less favorable. Please see the prospectus and financial statements for complete details. All results are historical and assume the reinvestment of any dividends and capital gains distributions.
5
MFS New Discovery Value Portfolio
Performance Summary – continued
Performance prior to close of business December 7, 2012, reflects time periods when another adviser or subadviser was responsible for selecting investments for the fund under a different investment objective and different investment strategies.
Performance results do not include adjustments made for financial reporting purposes in accordance with U.S. generally accepted accounting principles and may differ from amounts reported in the financial highlights.
From time to time the fund may receive proceeds from litigation settlements, without which performance would be lower.
6
MFS New Discovery Value Portfolio
EXPENSE TABLE
Fund Expenses Borne by the Contract Holders during the Period,
July 1, 2019 through December 31, 2019
As a contract holder of the fund, you incur ongoing costs, including management fees; distribution and/or service(12b-1) fees; and other fund expenses. This example is intended to help you understand your ongoing costs (in dollars) of investing in the fund and to compare these costs with the ongoing costs of investing in other mutual funds.
The example is based on an investment of $1,000 invested at the beginning of the period and held for the entire period July 1, 2019 through December 31, 2019.
Actual Expenses
The first line for each share class in the following table provides information about actual account values and actual expenses. You may use the information in this line, together with the amount you invested, to estimate the expenses that you paid over the period. Simply divide your account value by $1,000 (for example, an $8,600 account value divided by $1,000 = 8.6), then multiply the result by the number in the first line under the heading entitled “Expenses Paid During Period” to estimate the expenses you paid on your account during this period.
Hypothetical Example for Comparison Purposes
The second line for each share class in the following table provides information about hypothetical account values and hypothetical expenses based on the fund’s actual expense ratio and an assumed rate of return of 5% per year before expenses, which is not the fund’s actual return. The hypothetical account values and expenses may not be used to estimate the actual ending account balance or expenses you paid for the period. You may use this information to compare the ongoing costs of investing in the fund and other funds. To do so, compare this 5% hypothetical example with the 5% hypothetical examples that appear in the shareholder reports of the other funds.
Please note that the expenses shown in the table are meant to highlight the fund’s ongoing costs only and do not take into account the fees and expenses imposed under the variable contracts through which your investment in the fund is made. Therefore, the second line for each share class in the table is useful in comparing ongoing costs associated with an investment in vehicles (such as the fund) which fund benefits under variable annuity and variable life insurance contracts and to qualified pension and retirement plans only, and will not help you determine the relative total costs of investing in the fund through variable annuity and variable life insurance contracts. If the fees and expenses imposed under the variable contracts were included, your costs would have been higher.
| | | | | | | | | | | | | | | | | | |
| Share Class | | | | Annualized
Expense Ratio | | | Beginning
Account Value
7/01/19 | | | Ending Account Value
12/31/19 | | | Expenses Paid
During Period (p)
7/01/19-12/31/19 | |
| Initial Class | | Actual | | | 0.88% | | | | $1,000.00 | | | | $1,120.36 | | | | $4.70 | |
| | Hypothetical (h) | | | 0.88% | | | | $1,000.00 | | | | $1,020.77 | | | | $4.48 | |
| Service Class | | Actual | | | 1.13% | | | | $1,000.00 | | | | $1,120.35 | | | | $6.04 | |
| | Hypothetical (h) | | | 1.13% | | | | $1,000.00 | | | | $1,019.51 | | | | $5.75 | |
| (h) | 5% class return per year before expenses. |
| (p) | “Expenses Paid During Period” are equal to each class’s annualized expense ratio, as shown above, multiplied by the average account value over the period, multiplied by 184/365 (to reflect theone-half year period). |
7
MFS New Discovery Value Portfolio
PORTFOLIO OF INVESTMENTS – 12/31/19
The Portfolio of Investments is a complete list of all securities owned by your fund. It is categorized by broad-based asset classes.
| | | | | | | | |
| | |
| Issuer | | Shares/Par | | | Value ($) | |
| COMMON STOCKS – 98.2% | | | | | | | | |
| Aerospace – 1.3% | | | | | | | | |
| CACI International, Inc., “A” (a) | | | 1,881 | | | $ | 470,231 | |
| ManTech International Corp., “A” | | | 2,375 | | | | 189,715 | |
| | | | | | | | |
| | | | | | $ | 659,946 | |
| | | | | | | | |
| Apparel Manufacturers – 1.9% | | | | | | | | |
| PVH Corp. | | | 4,078 | | | $ | 428,802 | |
| Skechers USA, Inc., “A” (a) | | | 12,913 | | | | 557,712 | |
| | | | | | | | |
| | | | | | $ | 986,514 | |
| | | | | | | | |
| Automotive – 2.7% | | | | | | | | |
| LKQ Corp. (a) | | | 15,729 | | | $ | 561,525 | |
| Methode Electronics, Inc. | | | 6,676 | | | | 262,701 | |
| Stoneridge, Inc. (a) | | | 6,854 | | | | 200,959 | |
| Visteon Corp. (a) | | | 4,035 | | | | 349,391 | |
| | | | | | | | |
| | | | | | $ | 1,374,576 | |
| | | | | | | | |
| Brokerage & Asset Managers – 1.0% | | | | | | | | |
| TMX Group Ltd. | | | 5,619 | | | $ | 486,586 | |
| | | | | | | | |
| Business Services – 1.7% | | | | | | | | |
| BrightView Holdings, Inc. (a) | | | 18,248 | | | $ | 307,844 | |
| PRA Group, Inc. (a) | | | 14,675 | | | | 532,702 | |
| | | | | | | | |
| | | | | | $ | 840,546 | |
| | | | | | | | |
| Computer Software – 0.2% | | | | | | | | |
| 8x8, Inc. (a) | | | 5,934 | | | $ | 108,592 | |
| | | | | | | | |
| Computer Software – Systems – 1.5% | | | | | |
| Verint Systems, Inc. (a) | | | 13,394 | | | $ | 741,492 | |
| | | | | | | | |
| Construction – 3.7% | | | | | | | | |
| GMS, Inc. (a) | | | 9,598 | | | $ | 259,914 | |
| Owens Corning | | | 9,555 | | | | 622,221 | |
| Toll Brothers, Inc. | | | 25,412 | | | | 1,004,028 | |
| | | | | | | | |
| | | | | | $ | 1,886,163 | |
| | | | | | | | |
| Consumer Products – 3.5% | | | | | | | | |
| Energizer Holdings, Inc. | | | 7,050 | | | $ | 354,051 | |
| Newell Brands, Inc. | | | 29,934 | | | | 575,331 | |
| Prestige Brands Holdings, Inc. (a) | | | 10,642 | | | | 431,001 | |
| Sensient Technologies Corp. | | | 6,330 | | | | 418,350 | |
| | | | | | | | |
| | | | | | $ | 1,778,733 | |
| | | | | | | | |
| Consumer Services – 1.2% | | | | | | | | |
| Grand Canyon Education, Inc. (a) | | | 3,391 | | | $ | 324,824 | |
| Regis Corp. (a) | | | 15,089 | | | | 269,640 | |
| | | | | | | | |
| | | | | | $ | 594,464 | |
| | | | | | | | |
| Containers – 3.1% | | | | | | | | |
| Berry Global Group, Inc. (a) | | | 15,176 | | | $ | 720,708 | |
| Graphic Packaging Holding Co. | | | 49,604 | | | | 825,907 | |
| | | | | | | | |
| | | | | | $ | 1,546,615 | |
| | | | | | | | |
| Electrical Equipment – 3.1% | | | | | | | | |
| HD Supply Holdings, Inc. (a) | | | 12,730 | | | $ | 512,001 | |
| Littlefuse, Inc. | | | 1,358 | | | | 259,785 | |
| | | | | | | | |
| | |
Issuer | | Shares/Par | | | Value ($) | |
| COMMON STOCKS – continued | | | | | | | | |
| Electrical Equipment – continued | | | | | | | | |
| TriMas Corp. (a) | | | 13,566 | | | $ | 426,108 | |
| WESCO International, Inc. (a) | | | 6,685 | | | | 397,022 | |
| | | | | | | | |
| | | | | | $ | 1,594,916 | |
| | | | | | | | |
| Electronics – 1.8% | | | | | | | | |
| nLIGHT, Inc. (a) | | | 16,400 | | | $ | 332,592 | |
| Plexus Corp. (a) | | | 7,504 | | | | 577,358 | |
| | | | | | | | |
| | | | | | $ | 909,950 | |
| | | | | | | | |
| Energy – Independent – 1.7% | | | | | | | | |
| Matador Resources Co. (a) | | | 9,926 | | | $ | 178,370 | |
| WPX Energy, Inc. (a) | | | 48,825 | | | | 670,856 | |
| | | | | | | | |
| | | | | | $ | 849,226 | |
| | | | | | | | |
| Engineering – Construction – 3.1% | | | | | | | | |
| Construction Partners, Inc., “A” (a) | | | 17,668 | | | $ | 298,059 | |
| KBR, Inc. | | | 29,192 | | | | 890,356 | |
| Quanta Services, Inc. | | | 9,893 | | | | 402,744 | |
| | | | | | | | |
| | | | | | $ | 1,591,159 | |
| | | | | | | | |
| Entertainment – 1.4% | | | | | | | | |
| IMAX Corp. (a) | | | 22,763 | | | $ | 465,048 | |
| Six Flags Entertainment Corp. | | | 5,453 | | | | 245,985 | |
| | | | | | | | |
| | | | | | $ | 711,033 | |
| | | | | | | | |
| Food & Beverages – 3.4% | | | | | | | | |
| Cal-Maine Foods, Inc. | | | 8,119 | | | $ | 347,087 | |
| Hostess Brands, Inc. (a) | | | 38,718 | | | | 562,960 | |
| Nomad Foods Ltd. (a) | | | 26,274 | | | | 587,749 | |
| Sanderson Farms, Inc. | | | 1,202 | | | | 211,817 | |
| | | | | | | | |
| | | | | | $ | 1,709,613 | |
| | | | | | | | |
| Gaming & Lodging – 0.8% | | | | | | | | |
| Wyndham Hotels & Resorts, Inc. | | | 6,214 | | | $ | 390,301 | |
| | | | | | | | |
| Insurance – 2.8% | | | | | | | | |
| CNO Financial Group, Inc. | | | 20,355 | | | $ | 369,036 | |
| Everest Re Group Ltd. | | | 962 | | | | 266,320 | |
| Hanover Insurance Group, Inc. | | | 2,248 | | | | 307,234 | |
| Safety Insurance Group, Inc. | | | 1,167 | | | | 107,983 | |
| Third Point Reinsurance Ltd. (a) | | | 36,819 | | | | 387,336 | |
| | | | | | | | |
| | | | | | $ | 1,437,909 | |
| | | | | | | | |
| Internet – 0.5% | | | | | | | | |
| Stamps.com, Inc. (a) | | | 2,967 | | | $ | 247,804 | |
| | | | | | | | |
| Leisure & Toys – 1.3% | | | | | | | | |
| Brunswick Corp. | | | 10,943 | | | $ | 656,361 | |
| | | | | | | | |
| Machinery & Tools – 4.3% | | | | | | | | |
| Actuant Corp., “A” | | | 10,547 | | | $ | 274,538 | |
| AGCO Corp. | | | 5,774 | | | | 446,042 | |
| ITT, Inc. | | | 4,919 | | | | 363,563 | |
| Kennametal, Inc. | | | 17,956 | | | | 662,397 | |
| Regal Beloit Corp. | | | 4,847 | | | | 414,952 | |
| | | | | | | | |
| | | | | | $ | 2,161,492 | |
| | | | | | | | |
8
MFS New Discovery Value Portfolio
Portfolio of Investments – continued
| | | | | | | | |
| | |
| Issuer | | Shares/Par | | | Value ($) | |
| COMMON STOCKS – continued | | | | | |
| Major Banks – 1.4% | | | | | | | | |
| TCF Financial Corp. | | | 14,856 | | | $ | 695,261 | |
| | | | | | | | |
| Medical & Health Technology & Services – 1.8% | | | | | |
| Premier, Inc., “A” (a) | | | 23,709 | | | $ | 898,097 | |
| | | | | | | | |
| Medical Equipment – 1.5% | | | | | | | | |
| Envista Holdings Corp. (a) | | | 15,208 | | | $ | 450,765 | |
| Merit Medical Systems, Inc. (a) | | | 9,755 | | | | 304,551 | |
| | | | | | | | |
| | | | | | $ | 755,316 | |
| | | | | | | | |
| Natural Gas – Distribution – 2.4% | | | | | | | | |
| New Jersey Resources Corp. | | | 7,906 | | | $ | 352,371 | |
| South Jersey Industries, Inc. | | | 26,889 | | | | 886,799 | |
| | | | | | | | |
| | | | | | $ | 1,239,170 | |
| | | | | | | | |
| Natural Gas – Pipeline – 0.5% | | | | | | | | |
| Plains GP Holdings LP | | | 13,803 | | | $ | 261,567 | |
| | | | | | | | |
| Oil Services – 3.5% | | | | | | | | |
| Apergy Corp. (a) | | | 4,961 | | | $ | 167,583 | |
| Frank’s International N.V. (a) | | | 81,985 | | | | 423,862 | |
| Helmerich & Payne | | | 4,783 | | | | 217,292 | |
| NOW, Inc. (a) | | | 29,460 | | | | 331,130 | |
| Patterson-UTI Energy, Inc. | | | 59,815 | | | | 628,058 | |
| | | | | | | | |
| | | | | | $ | 1,767,925 | |
| | | | | | | | |
| Other Banks & Diversified Financials – 18.1% | | | | | |
| Air Lease Corp. | | | 11,112 | | | $ | 528,042 | |
| Bank of Hawaii Corp. | | | 6,879 | | | | 654,606 | |
| Brookline Bancorp, Inc. | | | 33,806 | | | | 556,447 | |
| Cathay General Bancorp, Inc. | | | 14,588 | | | | 555,073 | |
| Cullen/Frost Bankers, Inc. | | | 3,217 | | | | 314,558 | |
| CVB Financial Corp. | | | 10,549 | | | | 227,648 | |
| Element Fleet Management Corp. | | | 66,625 | | | | 568,997 | |
| First Hawaiian, Inc. | | | 28,659 | | | | 826,812 | |
| Hanmi Financial Corp. | | | 21,967 | | | | 439,230 | |
| Lakeland Financial Corp. | | | 14,362 | | | | 702,733 | |
| Prosperity Bancshares, Inc. | | | 9,938 | | | | 714,443 | |
| Sandy Spring Bancorp, Inc. | | | 5,851 | | | | 221,636 | |
| Signature Bank | | | 4,615 | | | | 630,455 | |
| SLM Corp. | | | 33,330 | | | | 296,970 | |
| Textainer Group Holdings Ltd. (a) | | | 23,237 | | | | 248,868 | |
| UMB Financial Corp. | | | 10,307 | | | | 707,473 | |
| Umpqua Holdings Corp. | | | 18,314 | | | | 324,158 | |
| Wintrust Financial Corp. | | | 8,797 | | | | 623,707 | |
| | | | | | | | |
| | | | | | $ | 9,141,856 | |
| | | | | | | | |
| Pharmaceuticals – 0.2% | | | | | | | | |
| Genomma Lab Internacional S.A., “B” (a) | | | 113,923 | | | $ | 112,733 | |
| | | | | | | | |
| Pollution Control – 0.7% | | | | | | | | |
| Stericycle, Inc. (a) | | | 5,702 | | | $ | 363,845 | |
| | | | | | | | |
| Real Estate – 10.4% | | | | | | | | |
| Brixmor Property Group, Inc., REIT | | | 17,443 | | | $ | 376,943 | |
| Corporate Office Properties Trust, REIT | | | 19,546 | | | | 574,261 | |
| Equity Commonwealth, REIT | | | 15,129 | | | | 496,685 | |
| Industrial Logistics Properties Trust, REIT | | | 28,275 | | | | 633,925 | |
| Invesco Mortgage Capital, Inc., REIT | | | 21,544 | | | | 358,708 | |
| Lexington Realty Trust, REIT | | | 30,436 | | | | 323,230 | |
| | | | | | | | |
| | |
| Issuer | | Shares/Par | | | Value ($) | |
| COMMON STOCKS – continued | | | | | |
| Real Estate – continued | | | | | | | | |
| Life Storage, Inc., REIT | | | 4,653 | | | $ | 503,827 | |
| Medical Properties Trust, Inc., REIT | | | 12,187 | | | | 257,268 | |
| Office Properties Income Trust, REIT | | | 14,686 | | | | 472,008 | |
| Spirit Realty Capital, Inc., REIT | | | 7,277 | | | | 357,883 | |
| STAG Industrial, Inc., REIT | | | 11,774 | | | | 371,705 | |
| Two Harbors Investment Corp., REIT | | | 35,685 | | | | 521,715 | |
| | | | | | | | |
| | | | | | $ | 5,248,158 | |
| | | | | | | | |
| Specialty Chemicals – 4.5% | | | | | | | | |
| Axalta Coating Systems Ltd. (a) | | | 8,252 | | | $ | 250,861 | |
| Compass Minerals International, Inc. | | | 6,855 | | | | 417,881 | |
| Element Solutions, Inc. (a) | | | 29,940 | | | | 349,699 | |
| Ferro Corp. (a) | | | 39,181 | | | | 581,054 | |
| Ferroglobe PLC (a) | | | 35,793 | | | | 33,646 | |
| Univar Solutions, Inc. (a) | | | 27,551 | | | | 667,836 | |
| | | | | | | | |
| | | | | | $ | 2,300,977 | |
| | | | | | | | |
| Specialty Stores – 3.0% | | | | | | | | |
| BJ’s Wholesale Club Holdings, Inc. (a) | | | 14,123 | | | $ | 321,157 | |
| Michaels Co., Inc. (a) | | | 17,988 | | | | 145,523 | |
| Urban Outfitters, Inc. (a) | | | 21,230 | | | | 589,557 | |
| Zumiez, Inc. (a) | | | 12,804 | | | | 442,250 | |
| | | | | | | | |
| | | | | | $ | 1,498,487 | |
| | | | | | | | |
| Trucking – 1.1% | | | | | | | | |
| Schneider National, Inc. | | | 25,726 | | | $ | 561,341 | |
| | | | | | | | |
| Utilities – Electric Power – 3.1% | | | | | | | | |
| Black Hills Corp. | | | 10,590 | | | $ | 831,739 | |
| Portland General Electric Co. | | | 13,531 | | | | 754,894 | |
| | | | | | | | |
| | | | | | $ | 1,586,633 | |
| | | | | | | | |
Total Common Stocks
(Identified Cost, $40,713,041) | | | | | | $ | 49,695,357 | |
| | | | | | | | |
| |
| INVESTMENT COMPANIES (h) – 1.9% | | | | | |
| Money Market Funds – 1.9% | | | | | | | | |
| MFS Institutional Money Market Portfolio, 1.7% (v) (Identified Cost, $954,852) | | | 954,852 | | | $ | 954,852 | |
| | | | | | | | |
OTHER ASSETS, LESS
LIABILITIES – (0.1)% | | | | | | | (34,538 | ) |
| | | | | | | | |
| NET ASSETS – 100.0% | | | | | | $ | 50,615,671 | |
| | | | | | | | |
| (a) | | Non-income producing security. |
| (h) | | An affiliated issuer, which may be considered one in which the fund owns 5% or more of the outstanding voting securities, or a company which is under common control. At period end, the aggregate values of the fund’s investments in affiliated issuers and in unaffiliated issuers were $954,852 and $49,695,357, respectively. |
| (v) | | Affiliated issuer that is available only to investment companies managed by MFS. The rate quoted for the MFS Institutional Money Market Portfolio is the annualizedseven-day yield of the fund at period end. |
The following abbreviations are used in this report and are defined:
| REIT | | Real Estate Investment Trust |
See Notes to Financial Statements
9
MFS New Discovery Value Portfolio
FINANCIAL STATEMENTS | STATEMENT OF ASSETS AND LIABILITIES
This statement represents your fund’s balance sheet, which details the assets and liabilities comprising the total value of the fund.
| | | | |
At 12/31/19 | | | | |
| |
Assets | | | | |
Investments in unaffiliated issuers, at value (identified cost, $40,713,041) | | | $49,695,357 | |
Investments in affiliated issuers, at value (identified cost, $954,852) | | | 954,852 | |
Cash | | | 18,174 | |
Receivables for | | | | |
Fund shares sold | | | 60 | |
Interest and dividends | | | 79,309 | |
Receivable from investment adviser | | | 7,674 | |
Other assets | | | 551 | |
Total assets | | | $50,755,977 | |
| |
Liabilities | | | | |
Payables for | | | | |
Fund shares reacquired | | | $98,252 | |
Payable to affiliates | | | | |
Administrative services fee | | | 96 | |
Shareholder servicing costs | | | 7 | |
Distribution and/or service fees | | | 131 | |
Accrued expenses and other liabilities | | | 41,820 | |
Total liabilities | | | $140,306 | |
Net assets | | | $50,615,671 | |
| |
Net assets consist of | | | | |
Paid-in capital | | | $37,624,208 | |
Total distributable earnings (loss) | | | 12,991,463 | |
Net assets | | | $50,615,671 | |
Shares of beneficial interest outstanding | | | 5,432,248 | |
| | | | | | | | | | | | |
| | | |
| | | Net assets | | | Shares
outstanding | | | Net asset value
per share | |
Initial Class | | | $41,097,993 | | | | 4,402,800 | | | | $9.33 | |
Service Class | | | 9,517,678 | | | | 1,029,448 | | | | 9.25 | |
See Notes to Financial Statements
10
MFS New Discovery Value Portfolio
FINANCIAL STATEMENTS | STATEMENT OF OPERATIONS
This statement describes how much your fund earned in investment income and accrued in expenses. It also describes any gains and/or losses generated by fund operations.
| | | | |
Year ended 12/31/19 | | | | |
| |
Net investment income (loss) | | | | |
Income | | | | |
Dividends | | | $913,990 | |
Dividends from affiliated issuers | | | 15,508 | |
Income on securities loaned | | | 6,623 | |
Other | | | 3,251 | |
Foreign taxes withheld | | | (4,971 | ) |
Total investment income | | | $934,401 | |
Expenses | | | | |
Management fee | | | $441,297 | |
Distribution and/or service fees | | | 22,709 | |
Shareholder servicing costs | | | 1,990 | |
Administrative services fee | | | 17,518 | |
Independent Trustees’ compensation | | | 1,379 | |
Custodian fee | | | 5,403 | |
Shareholder communications | | | 3,051 | |
Audit and tax fees | | | 54,869 | |
Legal fees | | | 426 | |
Miscellaneous | | | 27,667 | |
Total expenses | | | $576,309 | |
Reduction of expenses by investment adviser | | | (121,735 | ) |
Net expenses | | | $454,574 | |
Net investment income (loss) | | | $479,827 | |
| |
Realized and unrealized gain (loss) | | | | |
Realized gain (loss) (identified cost basis) | | | | |
Unaffiliated issuers | | | $3,851,983 | |
Affiliated issuers | | | (30 | ) |
Foreign currency | | | (162 | ) |
Net realized gain (loss) | | | $3,851,791 | |
Change in unrealized appreciation or depreciation | | | | |
Unaffiliated issuers | | | $9,877,982 | |
Translation of assets and liabilities in foreign currencies | | | 14 | |
Net unrealized gain (loss) | | | $9,877,996 | |
Net realized and unrealized gain (loss) | | | $13,729,787 | |
Change in net assets from operations | | | $14,209,614 | |
See Notes to Financial Statements
11
MFS New Discovery Value Portfolio
FINANCIAL STATEMENTS | STATEMENTS OF CHANGES IN NET ASSETS
These statements describe the increases and/or decreases in net assets resulting from operations, any distributions, and any shareholder transactions.
| | | | | | | | |
| | | Year ended | |
| | | 12/31/19 | | | 12/31/18 | |
Change in net assets | | | | | | | | |
| | |
From operations | | | | | | | | |
Net investment income (loss) | | | $479,827 | | | | $354,243 | |
Net realized gain (loss) | | | 3,851,791 | | | | 7,784,108 | |
Net unrealized gain (loss) | | | 9,877,996 | | | | (13,225,145 | ) |
Change in net assets from operations | | | $14,209,614 | | | | $(5,086,794 | ) |
Total distributions to shareholders | | | $(8,140,140 | ) | | | $(8,120,059 | ) |
Change in net assets from fund share transactions | | | $(506,413 | ) | | | $1,882,024 | |
Total change in net assets | | | $5,563,061 | | | | $(11,324,829 | ) |
| | |
Net assets | | | | | | | | |
At beginning of period | | | 45,052,610 | | | | 56,377,439 | |
At end of period | | | $50,615,671 | | | | $45,052,610 | |
See Notes to Financial Statements
12
MFS New Discovery Value Portfolio
FINANCIAL STATEMENTS | FINANCIAL HIGHLIGHTS
The financial highlights table is intended to help you understand the fund’s financial performance for the past 5 years. Certain information reflects financial results for a single fund share. The total returns in the table represent the rate that an investor would have earned (or lost) on an investment in the fund share class (assuming reinvestment of all distributions) held for the entire period.
| | | | | | | | | | | | | | | | | | | | |
| Initial Class | | Year ended | |
| | | | | |
| | | 12/31/19 | | | 12/31/18 | | | 12/31/17 | | | 12/31/16 | | | 12/31/15 | |
| | | | | |
Net asset value, beginning of period | | | $8.45 | | | | $11.13 | | | | $10.79 | | | | $9.44 | | | | $10.74 | |
| | | | | |
| Income (loss) from investment operations | | | | | | | | | | | | | | | | | | | | |
Net investment income (loss) (d) | | | $0.10 | | | | $0.08 | | | | $0.05 | | | | $0.09 | (c) | | | $0.09 | |
Net realized and unrealized gain (loss) | | | 2.46 | | | | (0.94 | ) | | | 1.44 | | | | 2.34 | | | | (0.40 | ) |
Total from investment operations | | | $2.56 | | | | $(0.86 | ) | | | $1.49 | | | | $2.43 | | | | $(0.31 | ) |
| | | | | |
| Less distributions declared to shareholders | | | | | | | | | | | | | | | | | | | | |
From net investment income | | | $(0.08 | ) | | | $(0.06 | ) | | | $(0.11 | ) | | | $(0.10 | ) | | | $(0.07 | ) |
From net realized gain | | | (1.60 | ) | | | (1.76 | ) | | | (1.04 | ) | | | (0.98 | ) | | | (0.92 | ) |
Total distributions declared to shareholders | | | $(1.68 | ) | | | $(1.82 | ) | | | $(1.15 | ) | | | $(1.08 | ) | | | $(0.99 | ) |
Net asset value, end of period (x) | | | $9.33 | | | | $8.45 | | | | $11.13 | | | | $10.79 | | | | $9.44 | |
Total return (%) (k)(r)(s)(x) | | | 33.65 | | | | (10.78 | ) | | | 15.24 | | | | 27.03 | (c) | | | (2.56 | ) |
| | | | | |
Ratios (%) (to average net assets)
and Supplemental data: | | | | | | | | | | | | | | | | | | | | |
Expenses before expense reductions (f) | | | 1.13 | | | | 1.11 | | | | 1.08 | | | | 1.05 | (c) | | | 1.10 | |
Expenses after expense reductions (f) | | | 0.88 | | | | 0.88 | | | | 0.88 | | | | 0.87 | (c) | | | 0.88 | |
Net investment income (loss) | | | 1.02 | | | | 0.72 | | | | 0.48 | | | | 0.91 | (c) | | | 0.83 | |
Portfolio turnover | | | 38 | | | | 55 | | | | 52 | | | | 48 | | | | 53 | |
Net assets at end of period (000 omitted) | | | $41,098 | | | | $36,665 | | | | $45,470 | | | | $46,635 | | | | $47,068 | |
| |
| Service Class | | Year ended | |
| | | | | |
| | | 12/31/19 | | | 12/31/18 | | | 12/31/17 | | | 12/31/16 | | | 12/31/15 | |
| | | | | |
Net asset value, beginning of period | | | $8.38 | | | | $11.05 | | | | $10.72 | | | | $9.38 | | | | $10.68 | |
| | | | | |
| Income (loss) from investment operations | | | | | | | | | | | | | | | | | | | | |
Net investment income (loss) (d) | | | $0.07 | | | | $0.05 | | | | $0.03 | | | | $0.06 | (c) | | | $0.06 | |
Net realized and unrealized gain (loss) | | | 2.45 | | | | (0.93 | ) | | | 1.43 | | | | 2.33 | | | | (0.40 | ) |
Total from investment operations | | | $2.52 | | | | $(0.88 | ) | | | $1.46 | | | | $2.39 | | | | $(0.34 | ) |
| | | | | |
| Less distributions declared to shareholders | | | | | | | | | | | | | | | | | | | | |
From net investment income | | | $(0.05 | ) | | | $(0.03 | ) | | | $(0.09 | ) | | | $(0.07 | ) | | | $(0.04 | ) |
From net realized gain | | | (1.60 | ) | | | (1.76 | ) | | | (1.04 | ) | | | (0.98 | ) | | | (0.92 | ) |
Total distributions declared to shareholders | | | $(1.65 | ) | | | $(1.79 | ) | | | $(1.13 | ) | | | $(1.05 | ) | | | $(0.96 | ) |
Net asset value, end of period (x) | | | $9.25 | | | | $8.38 | | | | $11.05 | | | | $10.72 | | | | $9.38 | |
Total return (%) (k)(r)(s)(x) | | | 33.43 | | | | (11.00 | ) | | | 15.01 | | | | 26.73 | (c) | | | (2.90 | ) |
| | | | | |
Ratios (%) (to average net assets)
and Supplemental data: | | | | | | | | | | | | | | | | | | | | |
Expenses before expense reductions (f) | | | 1.38 | | | | 1.36 | | | | 1.33 | | | | 1.30 | (c) | | | 1.35 | |
Expenses after expense reductions (f) | | | 1.13 | | | | 1.13 | | | | 1.13 | | | | 1.12 | (c) | | | 1.13 | |
Net investment income (loss) | | | 0.78 | | | | 0.45 | | | | 0.24 | | | | 0.66 | (c) | | | 0.58 | |
Portfolio turnover | | | 38 | | | | 55 | | | | 52 | | | | 48 | | | | 53 | |
Net assets at end of period (000 omitted) | | | $9,518 | | | | $8,387 | | | | $10,907 | | | | $8,376 | | | | $8,437 | |
See Notes to Financial Statements
13
MFS New Discovery Value Portfolio
Financial Highlights – continued
| (c) | Amount reflects aone-time reimbursement of expenses by the custodian (or former custodian) without which net investment income and performance would be lower and expenses would be higher. |
| (d) | Per share data is based on average shares outstanding. |
| (f) | Ratios do not reflect reductions from fees paid indirectly, if applicable. |
| (k) | The total return does not reflect expenses that apply to separate accounts. Inclusion of these charges would reduce the total return figures for all periods shown. |
| (r) | Certain expenses have been reduced without which performance would have been lower. |
| (s) | From time to time the fund may receive proceeds from litigation settlements, without which performance would be lower. |
| (x) | The net asset values and total returns have been calculated on net assets which include adjustments made in accordance with U.S. generally accepted accounting principles required at period end for financial reporting purposes. |
See Notes to Financial Statements
14
MFS New Discovery Value Portfolio
NOTES TO FINANCIAL STATEMENTS
| (1) | | Business and Organization |
MFS New Discovery Value Portfolio (the fund) is a diversified series of MFS Variable Insurance Trust III (the trust). The trust is organized as a Delaware statutory trust and is registered under the Investment Company Act of 1940, as amended, as anopen-end management investment company. The shareholders of each series of the trust are separate accounts of insurance companies, which offer variable annuity and/or life insurance products, and qualified retirement and pension plans.
The fund is an investment company and accordingly follows the investment company accounting and reporting guidance of the Financial Accounting Standards Board (FASB) Accounting Standards Codification Topic 946 Financial Services – Investment Companies.
| (2) | | Significant Accounting Policies |
General– The preparation of financial statements in conformity with U.S. generally accepted accounting principles requires management to make estimates and assumptions that affect the reported amounts of assets and liabilities, and disclosure of contingent assets and liabilities at the date of the financial statements and the reported amounts of increases and decreases in net assets from operations during the reporting period. Actual results could differ from those estimates. In the preparation of these financial statements, management has evaluated subsequent events occurring after the date of the fund’s Statement of Assets and Liabilities through the date that the financial statements were issued. The fund will generally focus on securities of small size companies which may be more volatile than those of larger companies.
Balance Sheet Offsetting– The fund’s accounting policy with respect to balance sheet offsetting is that, absent an event of default by the counterparty or a termination of the agreement, the International Swaps and Derivatives Association (ISDA) Master Agreement, or similar agreement, does not result in an offset of reported amounts of financial assets and financial liabilities in the Statement of Assets and Liabilities across transactions between the fund and the applicable counterparty. The fund’s right to setoff may be restricted or prohibited by the bankruptcy or insolvency laws of the particular jurisdiction to which a specific master netting agreement counterparty is subject. Balance sheet offsetting disclosures, to the extent applicable to the fund, have been included in the fund’s Significant Accounting Policies note under the captions for each of the fund’sin-scope financial instruments and transactions.
Investment Valuations– Equity securities, including restricted equity securities, are generally valued at the last sale or official closing price on their primary market or exchange as provided by a third-party pricing service. Equity securities, for which there were no sales reported that day, are generally valued at the last quoted daily bid quotation on their primary market or exchange as provided by a third-party pricing service. Short-term instruments with a maturity at issuance of 60 days or less may be valued at amortized cost, which approximates market value.Open-end investment companies are generally valued at net asset value per share. Securities and other assets generally valued on the basis of information from a third-party pricing service may also be valued at a broker/dealer bid quotation. In determining values, third-party pricing services can utilize both transaction data and market information such as yield, quality, coupon rate, maturity, type of issue, trading characteristics, and other market data. The values of foreign securities and other assets and liabilities expressed in foreign currencies are converted to U.S. dollars using the mean of bid and asked prices for rates provided by a third-party pricing service.
The Board of Trustees has delegated primary responsibility for determining or causing to be determined the value of the fund’s investments (including any fair valuation) to the adviser pursuant to valuation policies and procedures approved by the Board. If the adviser determines that reliable market quotations are not readily available, investments are valued at fair value as determined in good faith by the adviser in accordance with such procedures under the oversight of the Board of Trustees. Under the fund’s valuation policies and procedures, market quotations are not considered to be readily available for most types of debt instruments and floating rate loans and many types of derivatives. These investments are generally valued at fair value based on information from third-party pricing services. In addition, investments may be valued at fair value if the adviser determines that an investment’s value has been materially affected by events occurring after the close of the exchange or market on which the investment is principally traded (such as foreign exchange or market) and prior to the determination of the fund’s net asset value, or after the halt of trading of a specific security where trading does not resume prior to the close of the exchange or market on which the security is principally traded. Events that occur after foreign markets close (such as developments in foreign markets and significant movements in the U.S. markets) and prior to the determination of the fund’s net asset value may be deemed to have a material effect on the value of securities traded in foreign markets. Accordingly, the fund’s foreign equity securities may often be valued at fair value. The adviser generally relies on third-party pricing services or other information (such as the correlation with price movements of similar securities in the same or other markets; the type, cost and investment characteristics of the security; the business and financial condition of the issuer; and trading and other market data) to assist in determining whether to fair value and at what value to fair value an investment. The value of an investment for purposes of calculating the fund’s net asset value can differ depending on the source and method used to determine value. When fair valuation is used, the value of an investment used to determine the fund’s net asset value may differ from quoted or published prices for the same investment. There can be no assurance that the fund could obtain the fair value assigned to an investment if it were to sell the investment at the same time at which the fund determines its net asset value per share.
15
MFS New Discovery Value Portfolio
Notes to Financial Statements – continued
Various inputs are used in determining the value of the fund’s assets or liabilities. These inputs are categorized into three broad levels. In certain cases, the inputs used to measure fair value may fall into different levels of the fair value hierarchy. In such cases, an investment’s level within the fair value hierarchy is based on the lowest level of input that is significant to the fair value measurement. The fund’s assessment of the significance of a particular input to the fair value measurement in its entirety requires judgment, and considers factors specific to the investment. Level 1 includes unadjusted quoted prices in active markets for identical assets or liabilities. Level 2 includes other significant observable market-based inputs (including quoted prices for similar securities, interest rates, prepayment speed, and credit risk). Level 3 includes unobservable inputs, which may include the adviser’s own assumptions in determining the fair value of investments. The following is a summary of the levels used as of December 31, 2019 in valuing the fund’s assets or liabilities:
| | | | | | | | | | | | | | | | |
| Financial Instruments | | Level 1 | | | Level 2 | | | Level 3 | | | Total | |
| Equity Securities | | | $49,695,357 | | | | $— | | | | $— | | | | $49,695,357 | |
| Mutual Funds | | | 954,852 | | | | — | | | | — | | | | 954,852 | |
| Total | | | $50,650,209 | | | | $— | | | | $— | | | | $50,650,209 | |
For further information regarding security characteristics, see the Portfolio of Investments.
Foreign Currency Translation– Purchases and sales of foreign investments, income, and expenses are converted into U.S. dollars based upon currency exchange rates prevailing on the respective dates of such transactions or on the reporting date for foreign denominated receivables and payables. Gains and losses attributable to foreign currency exchange rates on sales of securities are recorded for financial statement purposes as net realized gains and losses on investments. Gains and losses attributable to foreign exchange rate movements on receivables, payables, income and expenses are recorded for financial statement purposes as foreign currency transaction gains and losses. That portion of both realized and unrealized gains and losses on investments that results from fluctuations in foreign currency exchange rates is not separately disclosed.
Security Loans– Under its Securities Lending Agency Agreement with the fund, State Street Bank and Trust Company, as lending agent, loans the securities of the fund to certain qualified institutions (the “Borrowers”) approved by the fund. Security loans can be terminated at the discretion of either the lending agent or the fund and the related securities must be returned within the earlier of the standard trade settlement period for such securities or within three business days. The loans are collateralized by cash and/or U.S. Treasury and federal agency obligations in an amount typically at least equal to the market value of the securities loaned. On loans collateralized by cash, the cash collateral is invested in a money market fund. The market value of the loaned securities is determined at the close of business of the fund and any additional required collateral is delivered to the fund on the next business day. The lending agent provides the fund with indemnification against Borrower default. In the event of Borrower default, the lending agent will, for the benefit of the fund, either purchase securities identical to those loaned or, when such purchase is commercially impracticable, pay the fund the market value of the loaned securities. In return, the lending agent assumes the fund’s rights to the related collateral. If the collateral value is less than the cost to purchase identical securities, the lending agent is responsible for the shortfall, but only to the extent that such shortfall is not due to a decline in collateral value resulting from collateral reinvestment for which the fund bears the risk of loss. A portion of the income generated upon investment of the collateral is remitted to the Borrowers, and the remainder is allocated between the fund and the lending agent. On loans collateralized by U.S. Treasury and/or federal agency obligations, a fee is received from the Borrower, and is allocated between the fund and the lending agent. Income from securities lending is separately reported in the Statement of Operations. The dividend and interest income earned on the securities loaned is accounted for in the same manner as other dividend and interest income. At December 31, 2019, there were no securities on loan or collateral outstanding.
Indemnifications– Under the fund’s organizational documents, its officers and Trustees may be indemnified against certain liabilities and expenses arising out of the performance of their duties to the fund. Additionally, in the normal course of business, the fund enters into agreements with service providers that may contain indemnification clauses. The fund’s maximum exposure under these agreements is unknown as this would involve future claims that may be made against the fund that have not yet occurred.
Investment Transactions and Income– Investment transactions are recorded on the trade date. Interest income is recorded on the accrual basis. Dividends received in cash are recorded on theex-dividend date. Certain dividends from foreign securities will be recorded when the fund is informed of the dividend if such information is obtained subsequent to theex-dividend date. Dividend payments received in additional securities are recorded on theex-dividend date in an amount equal to the value of the security on such date.
The fund may receive proceeds from litigation settlements. Any proceeds received from litigation involving portfolio holdings are reflected in the Statement of Operations in realized gain/loss if the security has been disposed of by the fund or in unrealized gain/loss if the security is still held by the fund. Any other proceeds from litigation not related to portfolio holdings are reflected as other income in the Statement of Operations.
16
MFS New Discovery Value Portfolio
Notes to Financial Statements – continued
Tax Matters and Distributions– The fund intends to qualify as a regulated investment company, as defined under Subchapter M of the Internal Revenue Code, and to distribute all of its taxable income, including realized capital gains. As a result, no provision for federal income tax is required. The fund’s federal tax returns, when filed, will remain subject to examination by the Internal Revenue Service for a three year period. Management has analyzed the fund’s tax positions taken on federal and state tax returns for all open tax years and does not believe that there are any uncertain tax positions that require recognition of a tax liability. Foreign taxes, if any, have been accrued by the fund in the accompanying financial statements in accordance with the applicable foreign tax law. Foreign income taxes may be withheld by certain countries in which the fund invests. Additionally, capital gains realized by the fund on securities issued in or by certain foreign countries may be subject to capital gains tax imposed by those countries.
Distributions to shareholders are recorded on theex-dividend date. Income and capital gain distributions are determined in accordance with income tax regulations, which may differ from U.S. generally accepted accounting principles. Certain capital accounts in the financial statements are periodically adjusted for permanent differences in order to reflect their tax character. These adjustments have no impact on net assets or net asset value per share. Temporary differences which arise from recognizing certain items of income, expense, gain or loss in different periods for financial statement and tax purposes will reverse at some time in the future.
Book/tax differences primarily relate to wash sale loss deferrals.
The tax character of distributions declared to shareholders for the last two fiscal years is as follows:
| | | | | | | | |
| | | Year ended
12/31/19 | | | Year ended
12/31/18 | |
| Ordinary income (including any short-term capital gains) | | | $1,970,102 | | | | $1,718,040 | |
| Long-term capital gains | | | 6,170,038 | | | | 6,402,019 | |
| Total distributions | | | $8,140,140 | | | | $8,120,059 | |
The federal tax cost and the tax basis components of distributable earnings were as follows:
| | | | |
| As of 12/31/19 | | | | |
| |
| Cost of investments | | | $42,343,973 | |
| Gross appreciation | | | 10,156,004 | |
| Gross depreciation | | | (1,849,768 | ) |
| Net unrealized appreciation (depreciation) | | | $8,306,236 | |
| |
| Undistributed ordinary income | | | 1,227,565 | |
| Undistributed long-term capital gain | | | 3,457,651 | |
| Other temporary differences | | | 11 | |
Multiple Classes of Shares of Beneficial Interest– The fund offers multiple classes of shares, which differ in their respective distribution and/or service fees. The fund’s income, realized and unrealized gain (loss), and common expenses are allocated to shareholders based on the daily net assets of each class. Dividends are declared separately for each class. Differences in per share dividend rates are generally due to differences in separate class expenses. The fund’s distributions declared to shareholders as reported in the Statements of Changes in Net Assets are presented by class as follows:
| | | | | | | | |
| | |
| | | Year ended
12/31/19 | | | Year ended
12/31/18 | |
| Initial Class | | | $6,657,895 | | | | $6,553,852 | |
| Service Class | | | 1,482,245 | | | | 1,566,207 | |
| Total | | | $8,140,140 | | | | $8,120,059 | |
| (3) | | Transactions with Affiliates |
Investment Adviser– The fund has an investment advisory agreement with MFS to provide overall investment management and related administrative services and facilities to the fund. The management fee is computed daily and paid monthly at the following annual rates based on the fund’s average daily net assets:
| | | | |
| Up to $250 million | | | 0.90% | |
| In excess of $250 million | | | 0.85% | |
MFS has agreed in writing to reduce its management fee by a specified amount if certain MFS mutual fund assets exceed thresholds agreed to by MFS and the fund’s Board of Trustees. For the year ended December 31, 2019, this management fee reduction amounted to $4,781, which is included in the reduction of total expenses in the Statement of Operations. The management fee incurred for the year ended December 31, 2019 was equivalent to an annual effective rate of 0.89% of the fund’s average daily net assets.
17
MFS New Discovery Value Portfolio
Notes to Financial Statements – continued
The investment adviser has agreed in writing to pay a portion of the fund’s total annual operating expenses, excluding interest, taxes, extraordinary expenses, brokerage and transaction costs, and investment-related expenses, such that total annual operating expenses do not exceed 0.88% of average daily net assets for the Initial Class shares and 1.13% of average daily net assets for the Service Class shares. This written agreement will continue until modified by the fund’s Board of Trustees, but such agreement will continue at least until April 30, 2021. For the year ended December 31, 2019, this reduction amounted to $116,954, which is included in the reduction of total expenses in the Statement of Operations.
Distributor– MFS Fund Distributors, Inc. (MFD), a wholly-owned subsidiary of MFS, is the distributor of shares of the fund. The Trustees have adopted a distribution plan for the Service Class shares pursuant to Rule12b-1 under the Investment Company Act of 1940.
The fund’s distribution plan provides that the fund will pay MFD distribution and/or service fees equal to 0.25% per annum of its average daily net assets attributable to Service Class shares as partial consideration for services performed and expenses incurred by MFD and financial intermediaries (including participating insurance companies that invest in the fund to fund variable annuity and variable life insurance contracts, sponsors of qualified retirement and pension plans that invest in the fund, and affiliates of these participating insurance companies and plan sponsors) in connection with the sale and distribution of the Service Class shares. MFD may subsequently pay all, or a portion, of the distribution and/or service fees to financial intermediaries.
Shareholder Servicing Agent– MFS Service Center, Inc. (MFSC), a wholly-owned subsidiary of MFS, receives a fee from the fund for its services as shareholder servicing agent. For the year ended December 31, 2019, the fee was $1,774, which equated to 0.0036% annually of the fund’s average daily net assets. MFSC also receives payment from the fund forout-of-pocket expenses paid by MFSC on behalf of the fund. For the year ended December 31, 2019, these costs amounted to $216.
Administrator– MFS provides certain financial, legal, shareholder communications, compliance, and other administrative services to the fund. Under an administrative services agreement, the fund reimburses MFS the costs incurred to provide these services. The fund is charged an annual fixed amount of $17,500 plus a fee based on average daily net assets. The administrative services fee incurred for the year ended December 31, 2019 was equivalent to an annual effective rate of 0.0357% of the fund’s average daily net assets.
Trustees’ and Officers’ Compensation– The fund pays compensation to independent Trustees in the form of a retainer, attendance fees, and additional compensation to Board and Committee chairpersons. The fund does not pay compensation directly to Trustees or officers of the fund who are also officers of the investment adviser, all of whom receive remuneration from MFS for their services to the fund. Certain officers and Trustees of the fund are officers or directors of MFS, MFD, and MFSC.
Other– This fund and certain other funds managed by MFS (the funds) had entered into a service agreement (the ISO Agreement) which provided for payment of fees solely by the funds to Tarantino LLC in return for the provision of services of an Independent Senior Officer (ISO) for the funds. Frank L. Tarantino served as the ISO and was an officer of the funds and the sole member of Tarantino LLC. Effective June 30, 2019, Mr. Tarantino retired from his position as ISO for the funds, and the ISO Agreement was terminated. For the year ended December 31, 2019, the fee paid by the fund under this agreement was $57 and is included in “Miscellaneous” expense in the Statement of Operations. MFS had agreed to bear all expenses associated with office space, other administrative support, and supplies provided to the ISO.
The fund invests in the MFS Institutional Money Market Portfolio which is managed by MFS and seeks current income consistent with preservation of capital and liquidity. This money market fund does not pay a management fee to MFS.
The fund is permitted to engage in purchase and sale transactions with funds and accounts for which MFS serves as investment adviser orsub-adviser (“cross-trades”) pursuant to a policy adopted by the Board of Trustees. This policy has been designed to ensure that cross-trades conducted by the fund comply with Rule17a-7 under the Investment Company Act of 1940. During the year ended December 31, 2019, the fund engaged in purchase and sale transactions pursuant to this policy, which amounted to $216,497 and $134,170, respectively. The sales transactions resulted in net realized gains (losses) of $(35,079).
The adviser has voluntarily undertaken to reimburse the fund from its own resources on a quarterly basis for the cost of investment research embedded in the cost of the fund’s securities trades. This agreement may be rescinded at any time. For the year ended December 31, 2019, this reimbursement amounted to $3,232, which is included in “Other” income in the Statement of Operations.
For the year ended December 31, 2019, purchases and sales of investments, other than short-term obligations, aggregated $18,094,964 and $26,652,052, respectively.
18
MFS New Discovery Value Portfolio
Notes to Financial Statements – continued
| (5) | | Shares of Beneficial Interest |
The fund’s Declaration of Trust permits the Trustees to issue an unlimited number of full and fractional shares of beneficial interest. Transactions in fund shares were as follows:
| | | | | | | | | | | | | | | | |
| | | Year ended 12/31/19 | | | Year ended 12/31/18 | |
| | | | |
| | | Shares | | | Amount | | | Shares | | | Amount | |
| Shares sold | | | | | | | | | | | | | | | | |
Initial Class | | | 189,404 | | | | $1,751,071 | | | | 294,759 | | | | $2,955,370 | |
Service Class | | | 124,339 | | | | 1,127,071 | | | | 176,624 | | | | 1,734,797 | |
| | | 313,743 | | | | $2,878,142 | | | | 471,383 | | | | $4,690,167 | |
| | | | |
| Shares issued to shareholders in reinvestment of distributions | | | | | | | | | | | | | | | | |
Initial Class | | | 832,237 | | | | $6,657,895 | | | | 632,611 | | | | $6,553,852 | |
Service Class | | | 186,916 | | | | 1,482,245 | | | | 152,355 | | | | 1,566,207 | |
| | | 1,019,153 | | | | $8,140,140 | | | | 784,966 | | | | $8,120,059 | |
| | | | |
| Shares reacquired | | | | | | | | | | | | | | | | |
Initial Class | | | (957,300 | ) | | | $(8,904,637 | ) | | | (675,413 | ) | | | $(7,576,858 | ) |
Service Class | | | (282,688 | ) | | | (2,620,058 | ) | | | (315,574 | ) | | | (3,351,344 | ) |
| | | (1,239,988 | ) | | | $(11,524,695 | ) | | | (990,987 | ) | | | $(10,928,202 | ) |
| | | | |
| Net change | | | | | | | | | | | | | | | | |
Initial Class | | | 64,341 | | | | $(495,671 | ) | | | 251,957 | | | | $1,932,364 | |
Service Class | | | 28,567 | | | | (10,742 | ) | | | 13,405 | | | | (50,340 | ) |
| | | 92,908 | | | | $(506,413 | ) | | | 265,362 | | | | $1,882,024 | |
Effective at the close of business on August 14, 2019, the fund is closed to new investors subject to certain exceptions. Please see the fund’s prospectus for details.
The fund is one of several mutual funds in which certain MFS funds may invest. The MFS funds do not invest in the underlying funds for the purpose of exercising management or control. At the end of the period, the MFS Moderate Allocation Portfolio, the MFS Growth Allocation Portfolio, and the MFS Conservative Allocation Portfolio were the owners of record of approximately 42%, 14%, and 9%, respectively, of the value of outstanding voting shares of the fund.
The fund and certain other funds managed by MFS participate in a $1.25 billion unsecured committed line of credit, subject to a $1 billion sublimit, provided by a syndicate of banks under a credit agreement. Borrowings may be made for temporary financing needs. Interest is charged to each fund, based on its borrowings, generally at a rate equal to the highest of one month LIBOR, the Federal Funds Effective Rate and the Overnight Bank Funding Rate, plus an agreed upon spread. A commitment fee, based on the average daily, unused portion of the committed line of credit, is allocated among the participating funds. In addition, the fund and other funds managed by MFS have established unsecured uncommitted borrowing arrangements with certain banks for temporary financing needs. Interest is charged to each fund, based on its borrowings, at rates equal to customary reference rates plus an agreed upon spread. For the year ended December 31, 2019, the fund’s commitment fee and interest expense were $266 and $0, respectively, and are included in “Miscellaneous” expense in the Statement of Operations.
| (7) | | Investments in Affiliated Issuers |
An affiliated issuer may be considered one in which the fund owns 5% or more of the outstanding voting securities, or a company which is under common control. For the purposes of this report, the following were affiliated issuers:
| | | | | | | | | | | | | | | | | | | | | | | | |
| Affiliated Issuers | | Beginning
Value | | | Purchases | | | Sales
Proceeds | | | Realized
Gain
(Loss) | | | Change in
Unrealized
Appreciation or
Depreciation | | | Ending
Value | |
| MFS Institutional Money Market Portfolio | | | $429,251 | | | | $13,002,349 | | | | $12,476,718 | | | | $(30 | ) | | | $— | | | | $954,852 | |
| | | | | | |
| Affiliated Issuers | | | | | | | | | | | | | | Dividend
Income | | | Capital Gain
Distributions | |
| MFS Institutional Money Market Portfolio | | | | | | | | | | | | | | | | | | | $15,508 | | | | $— | |
19
MFS New Discovery Value Portfolio
REPORT OF INDEPENDENT REGISTERED PUBLIC ACCOUNTING FIRM
To the Board of Trustees of MFS Variable Insurance Trust III and the Shareholders of MFS New Discovery Value Portfolio:
Opinion on the Financial Statements and Financial Highlights
We have audited the accompanying statement of assets and liabilities of MFS New Discovery Value Portfolio (the “Fund”), including the portfolio of investments, as of December 31, 2019, the related statement of operations for the year then ended, the statements of changes in net assets for each of the two years in the period then ended, the financial highlights for each of the five years in the period then ended, and the related notes. In our opinion, the financial statements and financial highlights present fairly, in all material respects, the financial position of the Fund as of December 31, 2019, and the results of its operations for the year then ended, the changes in its net assets for each of the two years in the period then ended, and the financial highlights for each of the five years in the period then ended, in conformity with accounting principles generally accepted in the United States of America.
Basis for Opinion
These financial statements and financial highlights are the responsibility of the Fund’s management. Our responsibility is to express an opinion on the Fund’s financial statements and financial highlights based on our audits. We are a public accounting firm registered with the Public Company Accounting Oversight Board (United States) (PCAOB) and are required to be independent with respect to the Fund in accordance with the U.S. federal securities laws and the applicable rules and regulations of the Securities and Exchange Commission and the PCAOB.
We conducted our audits in accordance with the standards of the PCAOB. Those standards require that we plan and perform the audit to obtain reasonable assurance about whether the financial statements and financial highlights are free of material misstatement, whether due to error or fraud. The Fund is not required to have, nor were we engaged to perform, an audit of its internal control over financial reporting. As part of our audits we are required to obtain an understanding of internal control over financial reporting but not for the purpose of expressing an opinion on the effectiveness of the Fund’s internal control over financial reporting. Accordingly, we express no such opinion.
Our audits included performing procedures to assess the risks of material misstatement of the financial statements and financial highlights, whether due to error or fraud, and performing procedures that respond to those risks. Such procedures included examining, on a test basis, evidence regarding the amounts and disclosures in the financial statements and financial highlights. Our audits also included evaluating the accounting principles used and significant estimates made by management, as well as evaluating the overall presentation of the financial statements and financial highlights. Our procedures included confirmation of securities owned as of December 31, 2019, by correspondence with the custodian. We believe that our audits provide a reasonable basis for our opinion.
DELOITTE & TOUCHE LLP
Boston, Massachusetts
February 14, 2020
We have served as the auditor of one or more of the MFS investment companies since 1924.
20
MFS New Discovery Value Portfolio
TRUSTEES AND OFFICERS – IDENTIFICATION AND BACKGROUND
The Trustees and Officers of the Trust, as of February 1, 2020, are listed below, together with their principal occupations during the past five years. (Their titles may have varied during that period.) The address of each Trustee and Officer is 111 Huntington Avenue, Boston, Massachusetts 02199-7618.
| | | | | | | | | | |
Name, Age | | Position(s)
Held with Fund | | Trustee/Officer
Since (h) | | Number of MFS Funds
overseen by the
Trustee | | Principal Occupations
During the Past Five Years | | Other Directorships During the Past Five Years (j) |
| INTERESTED TRUSTEES |
Robert J. Manning (k)
(age 56) | | Trustee | | February 2004 | | 133 | | Massachusetts Financial Services Company, Executive Chairman (since January 2017); Director; Chairman of the Board; Chief Executive Officer (until 2015);Co-Chief Executive Officer(2015-2016) | | N/A |
| | | | | |
Robin A. Stelmach (k) (age 58) | | Trustee | | January 2014 | | 133 | | Massachusetts Financial Services Company, Vice Chair (since January 2017); Chief Operating Officer and Executive Vice President (until January 2017) | | N/A |
|
| INDEPENDENT TRUSTEES |
John P. Kavanaugh (age 65) | | Trustee and Chair of Trustees | | January 2009 | | 133 | | Private investor | | N/A |
| | | | | |
Steven E. Buller (age 68) | | Trustee | | February 2014 | | 133 | | Financial Accounting Standards Advisory Council, Chairman(2014-2015); Public Company Accounting Oversight Board, Standing Advisory Group, Member (until 2014); BlackRock, Inc. (investment management), Managing Director (until 2014), BlackRock Finco UK (investment management), Director (until 2014) | | N/A |
| | | | | |
John A. Caroselli (age 65) | | Trustee | | March 2017 | | 133 | | JC Global Advisors, LLC (management consulting), President (since 2015); First Capital Corporation (commercial finance), Executive Vice President (until 2015) | | N/A |
| | | | | |
Maureen R. Goldfarb (age 64) | | Trustee | | January 2009 | | 133 | | Private investor | | N/A |
| | | | | |
Peter D. Jones
(age 64) | | Trustee | | January 2019 | | 133 | | Franklin Templeton Distributors, Inc. (investment management), President (until 2015); Franklin Templeton Institutional, LLC (investment management), Chairman (until 2015) | | N/A |
| | | | | |
James W. Kilman, Jr.
(age 58) | | Trustee | | January 2019 | | 133 | | Burford Capital Limited (finance and investment management), Chief Financial Officer (since 2019); KielStrand Capital LLC (family office), Chief Executive Officer (since 2016); Morgan Stanley & Co. (financial services), Vice Chairman of Investment Banking,Co-Head of Diversified Financials Coverage – Financial Institutions Investment Banking Group (until 2016) | | Alpha-En Corporation, Director (2016-2019) |
21
MFS New Discovery Value Portfolio
Trustees and Officers – continued
| | | | | | | | | | |
Name, Age | | Position(s)
Held with Fund | | Trustee/Officer
Since (h) | | Number of MFS Funds
overseen by the
Trustee | | Principal Occupations
During the Past Five Years | | Other Directorships During the Past Five Years (j) |
Clarence Otis, Jr. (age 63) | | Trustee | | March 2017 | | 133 | | Darden Restaurants, Inc., Chief Executive Officer (until 2014) | | VF Corporation, Director; Verizon Communications, Inc., Director; The Travelers Companies, Director; Federal Reserve Bank of Atlanta, Director (until 2015) |
| | | | | |
Maryanne L. Roepke (age 63) | | Trustee | | May 2014 | | 133 | | American Century Investments (investment management), Senior Vice President and Chief Compliance Officer (until 2014) | | N/A |
| | | | | |
Laurie J. Thomsen
(age 62) | | Trustee | | March 2005 | | 133 | | Private investor | | The Travelers Companies, Director; Dycom Industries, Inc., Director (since 2015) |
| | | | | | | | |
Name, Age | | Position(s)
Held with Fund | | Trustee/Officer
Since (h) | | Number of
MFS Funds
for which the
Person is an
Officer | | Principal Occupations During the Past Five Years |
| OFFICERS | | | | | | |
Christopher R. Bohane (k)
(age 46) | | Assistant Secretary and Assistant Clerk | | July 2005 | | 133 | | Massachusetts Financial Services Company, Vice President and Assistant General Counsel |
| | | | |
Kino Clark (k) (age 51) | | Assistant Treasurer | | January 2012 | | 133 | | Massachusetts Financial Services Company, Vice President |
| | | | |
John W. Clark, Jr. (k) (age 52) | | Assistant Treasurer | | April 2017 | | 133 | | Massachusetts Financial Services Company, Vice President (since March 2017); Deutsche Bank (financial services), Department Head – Treasurer’s Office (until February 2017) |
| | | | |
Thomas H. Connors (k) (age 60) | | Assistant Secretary and Assistant Clerk | | September 2012 | | 133 | | Massachusetts Financial Services Company, Vice President and Senior Counsel |
| | | | |
David L. DiLorenzo (k)
(age 51) | | President | | July 2005 | | 133 | | Massachusetts Financial Services Company, Senior Vice President |
| | | | |
Heidi W. Hardin (k) (age 52) | | Secretary and Clerk | | April 2017 | | 133 | | Massachusetts Financial Services Company, Executive Vice President and General Counsel (since March 2017); Harris Associates (investment management), General Counsel (from September 2015 to January 2017); Janus Capital Management LLC (investment management), Senior Vice President and General Counsel (until September 2015) |
| | | | |
Brian E. Langenfeld (k) (age 46) | | Assistant
Secretary and Assistant Clerk | | June 2006 | | 133 | | Massachusetts Financial Services Company, Vice President and Senior Counsel |
| | | | |
Amanda S. Mooradian (k) (age 40) | | Assistant
Secretary and Assistant Clerk | | September 2018 | | 133 | | Massachusetts Financial Services Company, Assistant Vice President and Counsel |
| | | | |
Susan A. Pereira (k)
(age 49) | | Assistant
Secretary and Assistant Clerk | | July 2005 | | 133 | | Massachusetts Financial Services Company, Vice President and Assistant General Counsel |
| | | | |
Kasey L. Phillips (k) (age 49) | | Assistant Treasurer | | September 2012 | | 133 | | Massachusetts Financial Services Company, Vice President |
| | | | |
Matthew A. Stowe (k) (age 45) | | Assistant Secretary and Assistant Clerk | | October 2014 | | 133 | | Massachusetts Financial Services Company, Vice President and Assistant General Counsel |
22
MFS New Discovery Value Portfolio
Trustees and Officers – continued
| | | | | | | | |
Name, Age | | Position(s)
Held with Fund | | Trustee/Officer
Since (h) | | Number of
MFS Funds
for which the
Person is an
Officer | | Principal Occupations During the Past Five Years |
Martin J. Wolin (k) (age 52) | | Chief Compliance Officer | | July 2015 | | 133 | | Massachusetts Financial Services Company, Senior Vice President and Chief Compliance Officer (since July 2015); Mercer (financial service provider), Chief Risk and Compliance Officer, North America and Latin America (until June 2015) |
| | | | |
James O. Yost (k)
(age 59) | | Treasurer | | September 1990 | | 133 | | Massachusetts Financial Services Company, Senior Vice President |
| (h) | Date first appointed to serve as Trustee/officer of an MFS Fund. Each Trustee has served continuously since appointment unless indicated otherwise. For the period from December 15, 2004 until February 22, 2005, Mr. Manning served as Advisory Trustee. From January 2012 through December 2016, Messrs. DiLorenzo and Yost served as Treasurer and Deputy Treasurer of the Funds, respectively. |
| (j) | Directorships or trusteeships of companies required to report to the Securities and Exchange Commission (i.e., “public companies”). |
| (k) | “Interested person” of the Trust within the meaning of the Investment Company Act of 1940 (referred to as the 1940 Act), which is the principal federal law governing investment companies like the fund, as a result of a position with MFS. The address of MFS is 111 Huntington Avenue, Boston, Massachusetts 02199-7618. |
Each Trustee (other than Messrs. Jones and Kilman) has been elected by shareholders and each Trustee and Officer holds office until his or her successor is chosen and qualified or until his or her earlier death, resignation, retirement or removal. Messrs. Jones and Kilman became Trustees of the Funds on January 1, 2019. The Trust does not hold annual meetings for the purpose of electing Trustees, and Trustees are not elected for fixed terms. Under the terms of the Board’s retirement policy, an Independent Trustee shall retire at the end of the calendar year in which he or she reaches the earlier of 75 years of age or 15 years of service on the Board (or, in the case of any Independent Trustee who joined the Board prior to 2015, 20 years of service on the Board).
Messrs. Buller, Kilman and Otis and Ms. Roepke are members of the Trust’s Audit Committee.
Each of the Interested Trustees and certain Officers hold comparable officer positions with certain affiliates of MFS.
The Statement of Additional Information for a Fund includes further information about the Trustees and is available without charge upon request by calling1-800-225-2606.
| | |
Investment Adviser Massachusetts Financial Services Company 111 Huntington Avenue Boston, MA 02199-7618 | | Custodian State Street Bank and Trust Company 1 Lincoln Street Boston, MA 02111-2900 |
| |
Distributor MFS Fund Distributors, Inc. 111 Huntington Avenue Boston, MA 02199-7618 | | Independent Registered Public Accounting Firm Deloitte & Touche LLP 200 Berkeley Street Boston, MA 02116 |
| |
Portfolio Manager(s) Richard Offen Kevin Schmitz | | |
23
MFS New Discovery Value Portfolio
BOARD REVIEW OF INVESTMENT ADVISORY AGREEMENT
MFS New Discovery Value Portfolio
The Investment Company Act of 1940 requires that both the full Board of Trustees and a majority of thenon-interested (“independent”) Trustees, voting separately, annually approve the continuation of the Fund’s investment advisory agreement with MFS. The Trustees consider matters bearing on the Fund and its advisory arrangements at their meetings throughout the year, including a review of performance data at each regular meeting. In addition, the independent Trustees met several times over the course of three months beginning in May and ending in July, 2019 (“contract review meetings”) for the specific purpose of considering whether to approve the continuation of the investment advisory agreement for the Fund and the other investment companies that the Board oversees (the “MFS Funds”). The independent Trustees were assisted in their evaluation of the Fund’s investment advisory agreement by independent legal counsel, from whom they received separate legal advice and with whom they met separately from MFS during various contract review meetings. The independent Trustees were also assisted in this process by the MFS Funds’ Independent Senior Officer, a senior officer appointed by and reporting to the independent Trustees.
In connection with their deliberations regarding the continuation of the investment advisory agreement, the Trustees, including the independent Trustees, considered such information and factors as they believed, in light of the legal advice furnished to them and their own business judgment, to be relevant. The investment advisory agreement for the Fund was considered separately, although the Trustees also took into account the common interests of all MFS Funds in their review. As described below, the Trustees considered the nature, quality, and extent of the various investment advisory, administrative, and shareholder services performed by MFS under the existing investment advisory agreement and other arrangements with the Fund.
In connection with their contract review meetings, the Trustees received and relied upon materials that included, among other items: (i) information provided by Broadridge Financial Solutions, Inc. (“Broadridge”), an independent third party, on the investment performance of the Fund for various time periods ended December 31, 2018 and the investment performance of a group of funds with substantially similar investment classifications/objectives (the “Broadridge performance universe”), (ii) information provided by Broadridge on the Fund’s advisory fees and other expenses and the advisory fees and other expenses of comparable funds identified by Broadridge as well as all other funds in the same investment classification/category (the “Broadridge expense group and universe”), (iii) information provided by MFS on the advisory fees of portfolios of other clients of MFS, including institutional separate accounts and other clients, (iv) information as to whether and to what extent applicable expense waivers, reimbursements or fee “breakpoints” are observed for the Fund, (v) information regarding MFS’ financial results and financial condition, including MFS’ and certain of its affiliates’ estimated profitability from services performed for the Fund and the MFS Funds as a whole, and compared to MFS’ institutional business, (vi) MFS’ views regarding the outlook for the mutual fund industry and the strategic business plans of MFS, (vii) descriptions of various functions performed by MFS for the Funds, such as compliance monitoring and portfolio trading practices, and (viii) information regarding the overall organization of MFS, including information about MFS’ senior management and other personnel providing investment advisory, administrative and other services to the Fund and the other MFS Funds. The comparative performance, fee and expense information prepared and provided by Broadridge was not independently verified and the independent Trustees did not independently verify any information provided to them by MFS.
The Trustees’ conclusion as to the continuation of the investment advisory agreement was based on a comprehensive consideration of all information provided to the Trustees and not the result of any single factor. Some of the factors that figured particularly in the Trustees’ deliberations are described below, although individual Trustees may have evaluated the information presented differently from one another, giving different weights to various factors. It is also important to recognize that the fee arrangements for the Fund and other MFS Funds are the result of years of review and discussion between the independent Trustees and MFS, that certain aspects of such arrangements may receive greater scrutiny in some years than in others, and that the Trustees’ conclusions may be based, in part, on their consideration of these same arrangements during the course of the year and in prior years.
Based on information provided by Broadridge and MFS, the Trustees reviewed the Fund’s total return investment performance as well as the Broadridge performance universe over various time periods. The Trustees placed particular emphasis on the total return performance of the Fund’s Initial Class shares in comparison to the performance of funds in its Broadridge performance universe over the five-year period ended December 31, 2018, which the Trustees believed was a long enough period to reflect differing market conditions. The total return performance of the Fund’s Initial Class shares was in the 1st quintile relative to the other funds in the universe for this five-year period (the 1st quintile being the best performers and the 5th quintile being the worst performers). The total return performance of the Fund’s Initial Class shares was in the 1st quintile for each of theone- and three-year periods ended December 31, 2018 relative to the Broadridge performance universe. Because of the passage of time, these performance results may differ from the performance results for more recent periods, including those shown elsewhere in this report.
In the course of their deliberations, the Trustees took into account information provided by MFS in connection with the contract review meetings, as well as during investment review meetings conducted with portfolio management personnel during the course of the year regarding the Fund’s performance. After reviewing these and related factors, the Trustees concluded, within the context of their overall conclusions regarding the investment advisory agreement, that they were satisfied with MFS’ responses and efforts relating to investment performance.
24
MFS New Discovery Value Portfolio
Board Review of Investment Advisory Agreement – continued
In assessing the reasonableness of the Fund’s advisory fee, the Trustees considered, among other information, the Fund’s advisory fee and the total expense ratio of the Fund’s Initial Class shares as a percentage of average daily net assets and the advisory fee and total expense ratios of the Broadridge expense group based on information provided by Broadridge. The Trustees considered that MFS currently observes an expense limitation for the Fund, which may not be changed without the Trustees’ approval. The Trustees also considered that, according to the data provided by Broadridge (which takes into account any fee reductions or expense limitations that were in effect during the Fund’s last fiscal year), the Fund’s effective advisory fee rate and total expense ratio were each approximately at the Broadridge expense group median.
The Trustees also considered the advisory fees charged by MFS to any institutional separate accounts advised by MFS (“separate accounts”) and unaffiliated investment companies for which MFS serves as subadviser (“subadvised funds”) that have comparable investment strategies to the Fund, if any. In comparing these fees, the Trustees considered information provided by MFS as to the generally broader scope of services provided by MFS to the Fund, as well as the more extensive regulatory burdens imposed on MFS in managing the Fund, in comparison to separate accounts and subadvised funds. The Trustees also considered the higher demands placed on MFS’ investment personnel and trading infrastructure as a result of the daily cashin-flows andout-flows of the Fund in comparison to separate accounts.
The Trustees also considered whether the Fund may benefit from any economies of scale in the management of the Fund in the event of growth in assets of the Fund and/or growth in assets of the MFS Funds as a whole. They noted that the Fund’s advisory fee rate schedule is subject to a contractual breakpoint that reduces the Fund’s advisory fee rate on average daily net assets over $250 million. The Trustees also noted that MFS has agreed in writing to waive a portion of the management fees of certain MFS Funds, including the Fund, if the total combined assets of certain funds within the MFS Funds’ complex increase above agreed upon thresholds (the “group fee waiver”), enabling the Fund’s shareholders to share in the benefits from any economies of scale at the complex level. The group fee waiver is reviewed and renewed annually between the Board and MFS. The Trustees concluded that the breakpoint and the group fee waiver were sufficient to allow the Fund to benefit from economies of scale as its assets and overall complex assets grow.
The Trustees also considered information prepared by MFS relating to MFS’ costs and profits with respect to the Fund, the MFS Funds considered as a group, and other investment companies and accounts advised by MFS, as well as MFS’ methodologies used to determine and allocate its costs to the MFS Funds, the Fund and other accounts and products for purposes of estimating profitability.
After reviewing these and other factors described herein, the Trustees concluded, within the context of their overall conclusions regarding the investment advisory agreement, that the advisory fees charged to the Fund represent reasonable compensation in light of the services being provided by MFS to the Fund.
In addition, the Trustees considered MFS’ resources and related efforts to continue to retain, attract and motivate capable personnel to serve the Fund. The Trustees also considered current and developing conditions in the financial services industry, including the presence of large and well-capitalized companies which are spending, and appear to be prepared to continue to spend, substantial sums to engage personnel and to provide services to competing investment companies. In this regard, the Trustees also considered the financial resources of MFS and its ultimate parent, Sun Life Financial Inc. The Trustees also considered the advantages and possible disadvantages to the Fund of having an adviser that also serves other investment companies as well as other accounts.
The Trustees also considered the nature, quality, cost, and extent of administrative, transfer agency, and distribution services provided to the Fund by MFS and its affiliates under agreements and plans other than the investment advisory agreement, including any12b-1 fees the Fund pays to MFS Fund Distributors, Inc., an affiliate of MFS. The Trustees also considered the nature, extent and quality of certain other services MFS performs or arranges for on the Fund’s behalf, which may include securities lending programs, directed expense payment programs, class action recovery programs, and MFS’ interaction with third-party service providers, principally custodians andsub-custodians. The Trustees concluded that the variousnon-advisory services provided by MFS and its affiliates on behalf of the Fund were satisfactory.
The Trustees consideredso-called“fall-out benefits” to MFS such as reputational value derived from serving as investment manager to the MFS Funds. The Trustees also considered that, effective January 3, 2018, MFS had discontinued its historic practice of obtaining investment research from portfolio brokerage commissions paid by certain MFS Funds and would thereafter directly pay for or voluntarily reimburse a Fund, if applicable, for the costs of external research acquired through the use of the Fund’s portfolio brokerage commissions.
Based on their evaluation of factors that they deemed to be material, including those factors described above, the Board of Trustees, including the independent Trustees, concluded that the Fund’s investment advisory agreement with MFS should be continued for an additionalone-year period, commencing August 1, 2019.
25
MFS New Discovery Value Portfolio
PROXY VOTING POLICIES AND INFORMATION
MFS votes proxies on behalf of the fund pursuant to proxy voting policies and procedures that are available without charge, upon request, by calling 1-800-225-2606, by visitingmfs.com/proxyvoting, or by visiting the SEC’s Web site athttp://www.sec.gov.
Information regarding how the fund voted proxies relating to portfolio securities during the most recent twelve-month period ended June 30 is available by August 31 of each year without charge by visitingmfs.com/proxyvoting, or by visiting the SEC’s Web site athttp://www.sec.gov.
QUARTERLY PORTFOLIO DISCLOSURE
The fund files a complete schedule of portfolio holdings with the SEC for the first and third quarters of each fiscal year as an exhibit to its reports on Form N-PORT. The fund’s Form N-PORT reports are available on the SEC’s website athttp://www.sec.gov. A shareholder can obtain the portfolio holdings report for the first and third quarters of the fund’s fiscal year atmfs.com/vit3 by choosing the fund’s name and then selecting the “Resources” tab and clicking on “Prospectus and Reports”.
FURTHER INFORMATION
From time to time, MFS may post important information about the fund or the MFS funds on the MFS web site (mfs.com). This information is available athttps://www.mfs.com/en-us/what-we-do/announcements.html or at mfs.com/vit3by choosing the fund’s name.
INFORMATION ABOUT FUND CONTRACTS AND LEGAL CLAIMS
The fund has entered into contractual arrangements with an investment adviser, administrator, distributor, shareholder servicing agent, 529 program manager (if applicable), and custodian who each provide services to the fund. Unless expressly stated otherwise, shareholders are not parties to, or intended beneficiaries of these contractual arrangements, and these contractual arrangements are not intended to create any shareholder right to enforce them against the service providers or to seek any remedy under them against the service providers, either directly or on behalf of the fund.
Under the Trust’s By-Laws and Declaration of Trust, any claims asserted against or on behalf of the MFS Funds, including claims against Trustees and Officers, must be brought in state and federal courts located within the Commonwealth of Massachusetts.
FEDERAL TAX INFORMATION (unaudited)
The following information is provided pursuant to provisions of the Internal Revenue Code.
The fund designates $6,788,000 as capital gain dividends paid during the fiscal year.
For corporate shareholders, 24.98% of the ordinary income dividends paid during the fiscal year qualify for the corporate dividends received deduction.
26
rev. 3/16
| | | | |
| | | |
| FACTS | | WHAT DOES MFS DO WITH YOUR
PERSONAL INFORMATION? | |  |
| | |
| Why? | | Financial companies choose how they share your personal information. Federal law gives consumers the right to limit some but not all sharing. Federal law also requires us to tell you how we collect, share, and protect your personal information. Please read this notice carefully to understand what we do. |
| | |
| What? | | The types of personal information we collect and share depend on the product or service you have with us. This information can include: • Social Security number and account balances • Account transactions and transaction history • Checking account information and wire transfer instructions When you areno longer our customer, we continue to share your information as described in this notice. |
| | |
| How? | | All financial companies need to share customers’ personal information to run their everyday business. In the section below, we list the reasons financial companies can share their customers’ personal information; the reasons MFS chooses to share; and whether you can limit this sharing. |
| | | | |
Reasons we can share your
personal information | | Does MFS share? | | Can you limit this
sharing? |
For our everyday business purposes – such as to process your transactions, maintain your account(s), respond to court orders and legal investigations, or report to credit bureaus | | Yes | | No |
For our marketing purposes – to offer our products and services to you | | No | | We don’t share |
| For joint marketing with other financial companies | | No | | We don’t share |
For our affiliates’ everyday business purposes – information about your transactions and experiences | | No | | We don’t share |
For our affiliates’ everyday business purposes – information about your creditworthiness | | No | | We don’t share |
| For nonaffiliates to market to you | | No | | We don’t share |
| | |
| | |
| Questions? | | Call800-225-2606 or go tomfs.com. |
27
| | |
| Who we are |
| Who is providing this notice? | | MFS Funds, MFS Investment Management, MFS Institutional Advisors, Inc., and MFS Heritage Trust Company. |
| | |
| What we do |
| How does MFS protect my personal information? | | To protect your personal information from unauthorized access and use, we use security measures that comply with federal law. These measures include procedural, electronic, and physical safeguards for the protection of the personal information we collect about you. |
How does MFS
collect my personal information? | | We collect your personal information, for example, when you • open an account or provide account information • direct us to buy securities or direct us to sell your securities • make a wire transfer We also collect your personal information from others, such as credit bureaus, affiliates, or other companies. |
| Why can’t I limit all sharing? | | Federal law gives you the right to limit only • sharing for affiliates’ everyday business purposes – information about your creditworthiness • affiliates from using your information to market to you • sharing for nonaffiliates to market to you State laws and individual companies may give you additional rights to limit sharing. |
| | |
| Definitions |
| Affiliates | | Companies related by common ownership or control. They can be financial and nonfinancial companies. • MFS does not share personal information with affiliates, except for everyday business purposes as described on page one of this notice. |
| Nonaffiliates | | Companies not related by common ownership or control. They can be financial and nonfinancial companies. • MFS does not share with nonaffiliates so they can market to you. |
| Joint marketing | | A formal agreement between nonaffiliated financial companies that together market financial products or services to you. • MFS doesn’t jointly market. |
| | |
| Other important information |
| If you own an MFS product or receive an MFS service in the name of a third party such as a bank or broker-dealer, their privacy policy may apply to you instead of ours. |
28
The Registrant has adopted a Code of Ethics (the “Code”) pursuant to Section 406 of the Sarbanes-Oxley Act and as defined in FormN-CSR that applies to the Registrant’s principal executive officer and principal financial and accounting officer. During the period covered by this report, the Registrant has not amended any provision in the Code that relates to an element of the Code’s definition enumerated in paragraph (b) of Item 2 of this FormN-CSR. During the period covered by this report, the Registrant did not grant a waiver, including an implicit waiver, from any provision of the Code.
A copy of the Code is filed as an exhibit to this FormN-CSR.
| ITEM 3. | AUDIT COMMITTEE FINANCIAL EXPERT. |
Messrs. Steven E. Buller, James Kilman, and Clarence Otis, Jr. and Ms. Maryanne L. Roepke, members of the Audit Committee, have been determined by the Board of Trustees in their reasonable business judgment to meet the definition of “audit committee financial expert” as such term is defined in FormN-CSR. In addition, Messrs. Buller, Kilman, and Otis and Ms. Roepke are “independent” members of the Audit Committee (as such term has been defined by the Securities and Exchange Commission in regulations implementing Section 407 of the Sarbanes-Oxley Act of 2002). The Securities and Exchange Commission has stated that the designation of a person as an audit committee financial expert pursuant to this Item 3 on the FormN-CSR does not impose on such a person any duties, obligations or liability that are greater than the duties, obligations or liability imposed on such person as a member of the Audit Committee and the Board of Trustees in the absence of such designation or identification.
| ITEM 4. | PRINCIPAL ACCOUNTANT FEES AND SERVICES. |
Items 4(a) through 4(d) and 4(g):
The Board of Trustees has appointed Deloitte & Touche LLP (“Deloitte”) to serve as independent accountants to the Registrant (hereinafter the “Registrant” or the “Fund”). The tables below set forth the audit fees billed to the Fund as well as fees fornon-audit services provided to the Fund and/or to the Fund’s investment adviser, Massachusetts Financial Services Company (“MFS”), and to various entities either controlling, controlled by, or under common control with MFS that provide ongoing services to the Fund (“MFS Related Entities”).
For the fiscal years ended December 31, 2019 and 2019, audit fees billed to the Fund by Deloitte were as follows:
| | | | | | | | |
| | | Audit Fees | |
| | | 2019 | | | 2018 | |
Fees billed by Deloitte: | | | | | | | | |
MFS Blended Research Small Cap Equity Portfolio | | | 45,676 | | | | 44,613 | |
MFS Conservative Allocation Portfolio | | | 31,106 | | | | 30,371 | |
MFS Global Real Estate Portfolio | | | 46,649 | | | | 45,564 | |
MFS Growth Allocation Portfolio | | | 31,106 | | | | 30,371 | |
MFS Inflation-Adjusted Bond Portfolio | | | 35,898 | | | | 35,055 | |
MFS Limited Maturity Portfolio | | | 57,176 | | | | 55,855 | |
MFS Mid Cap Value Portfolio | | | 47,073 | | | | 45,979 | |
MFS Moderate Allocation Portfolio | | | 31,106 | | | | 30,371 | |
MFS New Discovery Value Portfolio | | | 45,676 | | | | 44,613 | |
| | | | | | | | |
Total | | | 371,466 | | | | 362,792 | |
For the fiscal years ended December 31, 2019 and 2018, fees billed by Deloitte for audit-related, tax and other services provided to each Fund and for audit-related, tax and other services provided to MFS and MFS Related Entities were as follows:
| | | | | | | | | | | | | | | | | | | | | | | | |
| | | Audit-Related Fees1 | | | Tax Fees2 | | | All Other Fees3 | |
| | | 2019 | | | 2018 | | | 2019 | | | 2018 | | | 2019 | | | 2018 | |
Fees billed by Deloitte: | | | | | | | | | | | | | | | | | | | | | | | | |
To MFS Blended Research Small Cap Equity Portfolio | | | 2,400 | | | | 2,400 | | | | 5,100 | | | | 4,985 | | | | 0 | | | | 0 | |
To MFS Conservative Allocation Portfolio | | | 2,400 | | | | 2,400 | | | | 5,100 | | | | 4,985 | | | | 0 | | | | 0 | |
To MFS Global Real Estate Portfolio | | | 2,400 | | | | 2,400 | | | | 5,436 | | | | 5,314 | | | | 0 | | | | 0 | |
To MFS Growth Allocation Portfolio | | | 2,400 | | | | 2,400 | | | | 5,100 | | | | 4,985 | | | | 0 | | | | 0 | |
To MFS Inflation-Adjusted Bond Portfolio | | | 2,400 | | | | 2,400 | | | | 4,249 | | | | 4,153 | | | | 0 | | | | 0 | |
To MFS Limited Maturity Portfolio | | | 2,400 | | | | 2,400 | | | | 5,100 | | | | 4,985 | | | | 0 | | | | 0 | |
To MFS Mid Cap Value Portfolio | | | 2,400 | | | | 2,400 | | | | 5,100 | | | | 4,985 | | | | 0 | | | | 0 | |
To MFS Moderate Allocation Portfolio | | | 2,400 | | | | 2,400 | | | | 5,100 | | | | 4,985 | | | | 0 | | | | 0 | |
To MFS New Discovery Value Portfolio | | | 2,400 | | | | 2,400 | | | | 5,100 | | | | 4,985 | | | | 0 | | | | 0 | |
Total fees billed by Deloitte To above Funds: | | | 21,600 | | | | 21,600 | | | | 45,385 | | | | 44,362 | | | | 0 | | | | 0 | |
| | | | | | | | | | | | | | | | | | | | | | | | |
| | | |
| | | Audit-Related Fees1 | | | Tax Fees2 | | | All Other Fees3 | |
| | | 2019 | | | 2018 | | | 2019 | | | 2018 | | | 2019 | | | 2018 | |
Fees billed by Deloitte: | | | | | | | | | | | | | | | | | | | | | | | | |
To MFS and MFS Related Entities of MFS Blended Research Small Cap Equity Portfolio* | | | 0 | | | | 0 | | | | 0 | | | | 0 | | | | 3,790 | | | | 5,390 | |
To MFS and MFS Related Entities of MFS Conservative Allocation Portfolio* | | | 0 | | | | 0 | | | | 0 | | | | 0 | | | | 3,790 | | | | 5,390 | |
To MFS and MFS Related Entities of MFS Global Real Estate Portfolio* | | | 0 | | | | 0 | | | | 0 | | | | 0 | | | | 3,790 | | | | 5,390 | |
To MFS and MFS Related Entities of MFS Growth Allocation Portfolio* | | | 0 | | | | 0 | | | | 0 | | | | 0 | | | | 3,790 | | | | 5,390 | |
To MFS and MFS Related Entities of MFS Inflation-Adjusted Bond Portfolio* | | | 0 | | | | 0 | | | | 0 | | | | 0 | | | | 3,790 | | | | 5,390 | |
To MFS and MFS Related Entities of MFS Limited Maturity Portfolio* | | | 0 | | | | 0 | | | | 0 | | | | 0 | | | | 3,790 | | | | 5,390 | |
To MFS and MFS Related Entities of MFS Mid Cap Value Portfolio* | | | 0 | | | | 0 | | | | 0 | | | | 0 | | | | 3,790 | | | | 5,390 | |
To MFS and MFS Related Entities of MFS Moderate Allocation Portfolio* | | | 0 | | | | 0 | | | | 0 | | | | 0 | | | | 3,790 | | | | 5,390 | |
To MFS and MFS Related Entities of MFS New Discovery Value Portfolio* | | | 0 | | | | 0 | | | | 0 | | | | 0 | | | | 3,790 | | | | 5,390 | |
| | | | | | | | |
| | | Aggregate fees for non-audit
services: | |
| | | 2019 | | | 2018 | |
Fees billed by Deloitte: | | | | | | | | |
To MFS Blended Research Small Cap Equity Portfolio, MFS and MFS Related Entities# | | | 361,290 | | | | 12,775 | |
To MFS Conservative Allocation Portfolio, MFS and MFS Related Entities# | | | 361,290 | | | | 12,775 | |
To MFS Global Real Estate Portfolio, MFS and MFS Related Entities# | | | 361,626 | | | | 13,104 | |
To MFS Growth Allocation Portfolio, MFS and MFS Related Entities# | | | 361,290 | | | | 12,775 | |
To MFS Inflation-Adjusted Bond Portfolio, MFS and MFS Related Entities# | | | 360,439 | | | | 11,943 | |
To MFS Limited Maturity Portfolio, MFS and MFS Related Entities# | | | 361,290 | | | | 12,775 | |
To MFS Mid Cap Value Portfolio, MFS and MFS Related Entities# | | | 361,290 | | | | 12,775 | |
To MFS Moderate Allocation Portfolio, MFS and MFS Related Entities# | | | 361,290 | | | | 12,775 | |
To MFS New Discovery Value Portfolio, MFS and MFS Related Entities# | | | 361,290 | | | | 12,775 | |
| * | This amount reflects the fees billed to MFS and MFS Related Entities fornon-audit services relating directly to the operations and financial reporting of the Fund (portions of which services also related to the operations and financial reporting of other funds within the MFS Funds complex). |
| # | This amount reflects the aggregate fees billed by Deloitte fornon-audit services rendered to the Fund and fornon-audit services rendered to MFS and the MFS Related Entities. |
| 1 | The fees included under “Audit-Related Fees” are fees related to assurance and related services that are reasonably related to the performance of the audit or review of financial statements, but not reported under ‘‘Audit Fees,’’ including accounting consultations, agreed-upon procedure reports, attestation reports, comfort letters and internal control reviews. |
| 2 | The fees included under “Tax Fees” are fees associated with tax compliance, tax advice and tax planning, including services relating to the filing or amendment of federal, state or local income tax returns, regulated investment company qualification reviews and tax distribution and analysis. |
| 3 | The fees included under “All Other Fees” are fees for products and services provided by Deloitte other than those reported under “Audit Fees,” “Audit-Related Fees” and “Tax Fees”. |
Item 4(e)(1):
Set forth below are the policies and procedures established by the Audit Committee of the Board of Trustees relating to thepre-approval of audit andnon-audit related services:
To the extent required by applicable law,pre-approval by the Audit Committee of the Board is needed for all audit and permissiblenon-audit services rendered to the Fund and all permissiblenon-audit services rendered to MFS or MFS Related Entities if the services relate directly to the operations and financial reporting of the Registrant.Pre-approval is currently on anengagement-by-engagement basis. In the eventpre-approval of such services is necessary between regular meetings of the Audit Committee and it is not practical to wait to seekpre-approval at the next regular meeting of the Audit Committee,pre-approval of such services may be referred to the Chair of the Audit Committee for approval; provided that the Chair may notpre-approve any individual engagement for such services exceeding $50,000 or multiple engagements for such services in the aggregate exceeding $100,000 between such regular meetings of the Audit Committee. Any engagementpre-approved by the Chair between regular meetings of the Audit Committee shall be presented for ratification by the entire Audit Committee at its next regularly scheduled meeting.
Item 4(e)(2):
None, or 0%, of the services relating to the Audit-Related Fees, Tax Fees and All Other Fees paid by the Fund and MFS and MFS Related Entities relating directly to the operations and financial reporting of the Registrant disclosed above were approved by the audit committee pursuant to paragraphs (c)(7)(i)(C) of Rule2-01 of RegulationS-X (which permits audit committee approval after the start of the engagement with respect to services other than audit, review or attest services, if certain conditions are satisfied).
Item 4(f):
Not applicable.
Item 4(h):
The Registrant’s Audit Committee has considered whether the provision by a Registrant’s independent registered public accounting firm ofnon-audit services to MFS and MFS Related Entities that were notpre-approved by the Committee (because such services were provided prior to the effectiveness of SEC rules requiringpre-approval or because such services did not relate directly to the operations and financial reporting of the Registrant) was compatible with maintaining the independence of the independent registered public accounting firm as the Registrant’s principal auditors.
| ITEM 5. | AUDIT COMMITTEE OF LISTED REGISTRANTS. |
Not applicable to the Registrant.
| ITEM 6. | SCHEDULE OF INVESTMENTS |
A schedule of investments of each series of the Registrant is included as part of the report to shareholders of such series under Item 1 of this FormN-CSR.
| ITEM 7. | DISCLOSURE OF PROXY VOTING POLICIES AND PROCEDURES FORCLOSED-END MANAGEMENT INVESTMENT COMPANIES. |
Not applicable to the Registrant.
| ITEM 8. | PORTFOLIO MANAGERS OFCLOSED-END MANAGEMENT INVESTMENT COMPANIES. |
Not applicable to the Registrant.
| ITEM 9. | PURCHASES OF EQUITY SECURITIES BYCLOSED-END MANAGEMENT INVESTMENT COMPANY AND AFFILIATED PURCHASERS. |
Not applicable to the Registrant.
| ITEM 10. | SUBMISSION OF MATTERS TO A VOTE OF SECURITY HOLDERS. |
There were no material changes to the procedures by which shareholders may send recommendations to the Board for nominees to the Registrant’s Board since the Registrant last provided disclosure as to such procedures in response to the requirements of Item 407 (c)(2)(iv) of RegulationS-K or this Item.
| ITEM 11. | CONTROLS AND PROCEDURES. |
| (a) | Based upon their evaluation of the effectiveness of the registrant’s disclosure controls and procedures (as defined in Rule30a-3(c) under the Investment Company Act of 1940 (the “Act”)) as conducted within 90 days of the filing date of this report on FormN-CSR, the registrant’s principal financial officer and principal executive officer have concluded that those disclosure controls and procedures provide reasonable assurance that the material information required to be disclosed by the registrant on this report is recorded, processed, summarized and reported within the time periods specified in the Securities and Exchange Commission’s rules and forms. |
| (b) | There were no changes in the Registrant’s internal controls over financial reporting (as defined in Rule30a-3(d) under the Act) that occurred during the period covered by the report that have materially affected, or are reasonably likely to materially affect, the Registrant’s internal control over financial reporting. |
| ITEM 12. | DISCLOSURE OF SECURITIES LENDING ACTIVITIES FORCLOSED-END MANAGEMENT INVESTMENT COMPANIES. |
Not applicable to the Registrant.
| (a) (1) | Any code of ethics, or amendment thereto, that is the subject of the disclosure required by Item 2, to the extent that the registrant intends to satisfy the Item 2 requirements through filing of an exhibit: Attached hereto asEX-99.COE. |
| | (2) | A separate certification for each principal executive officer and principal financial officer of the registrant as required by Rule30a-2(a) under the Act (17 CFR270.30a-2): Attached hereto asEX-99.302CERT. |
| | (3) | Any written solicitation to purchase securities under Rule23c-1 under the Act (17 CFR270.23c-1) sent or given during the period covered by the report by or on behalf of the registrant to 10 or more persons. Not applicable. |
| | (4) | Change in the registrant’s independent public accountant. Not applicable. |
| (b) | If the report is filed under Section 13(a) or 15(d) of the Exchange Act, provide the certifications required by Rule30a-2(b) under the Act (17 CFR270.30a-2(b)), Rule13a-14(b) or Rule15d-14(b) under the Exchange Act (17 CFR240.13a-14(b) or240.15d-14(b)) and Section 1350 of Chapter 63 of Title 18 of the United States Code (18 U.S.C. 1350) as an exhibit. A certification furnished pursuant to this paragraph will not be deemed “filed” for the purposes of Section 18 of the Exchange Act (15 U.S.C. 78r), or otherwise subject to the liability of that section. Such certification will not be deemed to be incorporated by reference into any filing under the Securities Act of 1933 or the Exchange Act, except to the extent that the registrant specifically incorporates it by reference. Attached hereto asEX-99.906CERT. |
Notice
Notice is hereby given that this instrument is executed on behalf of the Registrant by an officer of the Registrant as an officer and not individually and the obligations of or arising out of this instrument are not binding upon any of the Trustees or shareholders individually, but are binding only upon the assets and property of the respective constituent series of the Registrant.
SIGNATURES
Pursuant to the requirements of the Securities Exchange Act of 1934 and the Investment Company Act of 1940, the registrant has duly caused this report to be signed on its behalf by the undersigned, thereunto duly authorized.
(Registrant) MFS VARIABLE INSURANCE TRUST III
| | |
| By (Signature and Title)* | | DAVID L. DILORENZO |
| | David L. DiLorenzo, President |
Date: February 14, 2020
Pursuant to the requirements of the Securities Exchange Act of 1934 and the Investment Company Act of 1940, this report has been signed below by the following persons on behalf of the registrant and in the capacities and on the dates indicated.
| | |
| By (Signature and Title)* | | DAVID L. DILORENZO |
| | David L. DiLorenzo, President (Principal Executive Officer) |
Date: February 14, 2020
| | |
| By (Signature and Title)* | | JAMES O. YOST |
| | James O. Yost, Treasurer (Principal Financial Officer and Accounting Officer) |
Date: February 14, 2020
| * | Print name and title of each signing officer under his or her signature. |