UNITED STATES
SECURITIES AND EXCHANGE COMMISSION
Washington, D.C. 20549
FORM N-CSR
CERTIFIED SHAREHOLDER REPORT OF
REGISTERED MANAGEMENT INVESTMENT COMPANIES
Investment Company Act file number 811-08879
MFS VARIABLE INSURANCE TRUST III
(Exact name of registrant as specified in charter)
111 Huntington Avenue, Boston, Massachusetts 02199
(Address of principal executive offices) (Zip code)
Christopher R. Bohane
Massachusetts Financial Services Company
111 Huntington Avenue
Boston, Massachusetts 02199
(Name and address of agents for service)
Registrant’s telephone number, including area code: (617) 954-5000
Date of fiscal year end: December 31
Date of reporting period: December 31, 2017
| ITEM 1. | REPORTS TO STOCKHOLDERS. |
ANNUAL REPORT
December 31, 2017

MFS® BLENDED RESEARCH® SMALL CAP EQUITY PORTFOLIO
MFS® Variable Insurance Trust III

VSC-ANN
MFS® BLENDED RESEARCH® SMALL CAP EQUITY PORTFOLIO
CONTENTS
The report is prepared for the general information of contract owners. It is authorized for distribution to prospective investors only when preceded or accompanied by a current prospectus.
NOT FDIC INSURED • MAY LOSE VALUE • NO BANK OR CREDIT UNION GUARANTEE • NOT A DEPOSIT • NOT INSURED BY ANY FEDERAL GOVERNMENT AGENCY OR NCUA/NCUSIF
MFS Blended Research Small Cap Equity Portfolio
LETTER FROM THE EXECUTIVE CHAIRMAN

Dear Contract Owners:
Rising bond yields have led to a measurable uptick in market volatility, which has been a departure from the low-volatility environment that prevailed for much of 2017. In spite of this, global markets remain elevated amid synchronized economic growth. Although the U.S. Federal Reserve continues to gradually raise interest rates and shrink its balance sheet, monetary policy remains accommodative around the world, with many central banks taking only tentative steps toward tighter policies. However, interest rates have begun to rise globally of late as investors anticipate that central policy shifts may be necessary in the months ahead.
Newly enacted U.S. tax reforms have been welcomed by equity markets while emerging market economies have been boosted by a weaker U.S. dollar. Around the world, inflation remains largely subdued but tight labor markets and solid global demand have investors on the lookout for its potential resurgence amid robust global trade and recovering commodity prices.
At MFS®, we believe having a disciplined, long-term investment approach through a full market cycle is essential to capturing the best opportunities while also managing risk. In our view, such a strategy, along with the professional guidance of a financial advisor, will help you reach your investment objectives.
Respectfully,

Robert J. Manning
Executive Chairman
MFS Investment Management
February 15, 2018
The opinions expressed in this letter are subject to change and may not be relied upon for investment advice. No forecasts can be guaranteed.
1
MFS Blended Research Small Cap Equity Portfolio
PORTFOLIO COMPOSITION
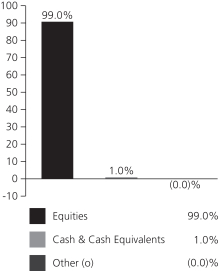
Portfolio structure
| | | | |
| Top ten holdings | | | | |
| KBR, Inc. | | | 1.5% | |
| Michaels Co., Inc. | | | 1.5% | |
| WESCO International, Inc. | | | 1.5% | |
| Wintrust Financial Corp. | | | 1.5% | |
| East West Bancorp, Inc. | | | 1.5% | |
| Tech Data Corp. | | | 1.4% | |
| SPX FLOW, Inc. | | | 1.4% | |
| Trex Co., Inc. | | | 1.4% | |
| Univar, Inc. | | | 1.3% | |
| RE/MAX Holdings, Inc., “A” | | | 1.3% | |
| | | | |
| Equity sectors | | | | |
| Financial Services | | | 24.9% | |
| Technology | | | 15.4% | |
| Industrial Goods & Services | | | 13.2% | |
| Health Care | | | 12.2% | |
| Basic Materials | | | 6.0% | |
| Special Products & Services | | | 5.4% | |
| Leisure | | | 4.4% | |
| Retailing | | | 4.1% | |
| Utilities & Communications | | | 4.0% | |
| Consumer Staples | | | 3.5% | |
| Energy | | | 3.3% | |
| Autos & Housing | | | 2.1% | |
| Transportation | | | 0.5% | |
Cash & Cash Equivalents includes any cash, investments in money market funds, short-term securities, and other assets less liabilities. Please see the Statement of Assets and Liabilities for additional information related to the fund’s cash position and other assets and liabilities.
Other includes equivalent exposure from currency derivatives and/or any offsets to derivative positions and may be negative.
Percentages are based on net assets as of December 31, 2017.
The portfolio is actively managed and current holdings may be different.
2
MFS Blended Research Small Cap Equity Portfolio
MANAGEMENT REVIEW
Summary of Results
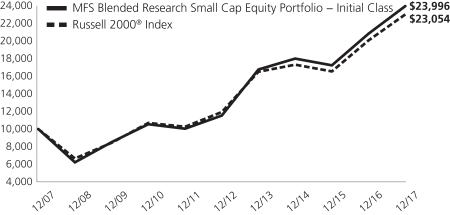
For the twelve months ended December 31, 2017, Initial Class shares of the MFS Blended Research Small Cap Equity Portfolio (“fund”) provided a total return of 14.97%, while Service Class shares of the fund provided a total return of 14.70%. These compare with a return of 14.65% over the same period for the fund’s benchmark, the Russell 2000® Index.
Market Environment
For the first time in many years, the global economy experienced a period of synchronized economic growth over the reporting period. The rebound in emerging markets (“EM”) economies was more pronounced (despite the slight deceleration in Chinese growth at the end of the period), helped by larger economies, such as Brazil and Russia, emerging from recessions. At the same time, developed markets (“DM”) economies continued to grow at or above potential. Market confidence increased in the US during the period fueled, in part, by a more lenient US regulatory backdrop and hopes for a significant cut in corporate tax rates, which came to fruition at the end of the period.
Globally, markets benefited from a reflation trade as commodity prices strengthened, activity and growth prospects improved, and inflation moved higher, though within moderate bounds. As a result, there were more tightening signals and actions by DM central banks. The US Federal Reserve increased interest rates by 25 basis points three times during the period, bringing the total number of quarter-percent hikes in the federal funds rate to five, since December 2015. The European Central Bank announced an extension of its quantitative easing program at the end of the period, but reduced the pace of its monthly asset purchases by half. In addition, the Bank of England hiked its base rate for the first time in a decade, late in the end of the period. Markets were comforted, along with central banks, by the decline in fears of a populist surge in Europe after establishment candidates won the Dutch and French elections, though a right-wing populist party gained seats in the German parliament for the first time in the post-World War II era. Additionally, European growth reflected a generally calmer political economic backdrop.
In recent months, the US dollar reversed the sharp rise seen early in the period, easing what had been a substantial headwind to earnings for multinationals. US consumer spending held up well during the second half of the period amid a modest increase in real wages and relatively low gasoline prices. However, demand for autos cooled from the record level logged early in the period, while the housing market improved, albeit constrained by below-average inventory levels. Global trade, which was sluggish early in the period, showed signs of improvement in the period’s second half, a positive indicator of global economic activity and prospects. Early in the period, there was a selloff in EM due to fears that President Trump would follow through on various campaign threats and promises that were judged to be detrimental to EM. While President Trump withdrew the US from the Trans-Pacific Partnership and began the renegotiation of the North American Free Trade Agreement, significant additional policy action was lacking on economic issues involving EM. As a result, EM resumed their upward trajectory, powered by strong inflows throughout 2017.
Contributors to Performance
Strong stock selection in both the industrial goods & services and utilities & communications sectors lifted performance relative to the Russell 2000® Index. Within the industrial goods & services sector, the fund’s holdings of high-performance laser manufacturer IPG Photonics (b) contributed positively to relative returns as stronger-than-expected demand for fiber lasers, notably from China, helped drive robust corporate earnings. Within the utilities & communications sector, owning shares of power generation company NRG Energy (b) benefited relative results. Shares of NRG climbed, particularly mid-period, as investors appeared to have reacted favorably to the announcement of a business transformation plan that would involve divesting non-core business lines and re-focusing on being an integrated retail-wholesale power company.
Elsewhere, the fund’s overweight positions in molecular diagnostic company Exact Sciences, manufacturer of oral fluid diagnostic products Orasure Technologies (h), biopharmaceutical company MiMedx Group, composite decking manufacturer Trex Company, cloud-based software solutions provider Paylocity and software engineering solutions provider EPAM Systems supported relative returns. Holding shares of retail bakery-cafes operator Panera Bread (b)(h) and airline services provider Copa Holdings (b)(h) (Panama) also helped relative results. Shares of Panera Bread rose early in the period as the company announced it would be acquired by JAB Holdings in an all-cash deal valued at $7.5 billion.
Detractors from Performance
Security selection in both the financial services and consumer staples sectors hurt relative performance during the reporting period. Within the financial services sector, an overweight position in retail shopping center operator Washington Prime Group and owning shares of residential real estate franchising and brokerage company Realogy (b) detracted from relative returns. Shares of Realogy declined after higher-than-expected commission split costs appeared to have weighed on investor sentiment. Within the consumer staples sector, the fund’s overweight position in dairy products producer Dean Foods, and holding shares of food manufacturer Treehouse Foods (b), weighed on relative results. Shares of Treehouse Foods came under pressure as increased price competition translated into lower sales and earnings that missed expectations.
3
MFS Blended Research Small Cap Equity Portfolio
Management Review – continued
Stocks in other sectors that dampened relative returns included the fund’s overweight positions in biopharmaceutical company AMAG Pharmaceuticals, casual dining restaurant company Brinker International, industrial energy products supplier Now (h), infrastructure services provider Chicago Bridge & Iron (h) and energy company Westmoreland Coal (h). Not holding shares of pharmaceutical company Nektar Therapeutics further hindered relative results as the stock advanced after the company announced that phase-three trials for its non-addictive opioid painkiller were successful.
Respectfully,
Portfolio Manager(s)
Jim Fallon, Matt Krummell, Jonathan Sage, and Jed Stocks
| (b) | Security is not a benchmark constituent. |
| (h) | Security was not held in the portfolio at period end. |
The views expressed in this report are those of the portfolio manager(s) only through the end of the period of the report as stated on the cover and do not necessarily reflect the views of MFS or any other person in the MFS organization. These views are subject to change at any time based on market or other conditions, and MFS disclaims any responsibility to update such views. These views may not be relied upon as investment advice or an indication of trading intent on behalf of any MFS portfolio. References to specific securities are not recommendations of such securities, and may not be representative of any MFS portfolio’s current or future investments.
4
MFS Blended Research Small Cap Equity Portfolio
PERFORMANCE SUMMARY THROUGH 12/31/17
The following chart illustrates the historical performance of the fund in comparison to its benchmark(s). Benchmarks are unmanaged and may not be invested in directly. Benchmark returns do not reflect any fees or expenses. The performance of other share classes will be greater than or less than that of the class depicted below. (See Notes to Performance Summary.)
Performance data shown represents past performance and is no guarantee of future results. Investment return and principal value fluctuate so your units, when sold, may be worth more or less than the original cost; current performance may be lower or higher than quoted. The performance shown does not reflect the deduction of taxes, if any, that a contract holder would pay on fund distributions or the redemption of contract units. The returns for the fund shown also do not reflect the deduction of expenses associated with variable products, such as mortality and expense risk charges, separate account charges, and sales charges imposed by the insurance company separate accounts. Such expenses would reduce the overall returns shown.
Growth of a Hypothetical $10,000 Investment
Total Returns through 12/31/17
Average annual total returns
| | | | | | | | | | | | |
| | | Share Class | | Class Inception Date | | 1-yr | | 5-yr | | 10-yr | | |
| | | Initial Class | | 7/17/00 | | 14.97% | | 15.80% | | 9.15% | | |
| | | Service Class | | 5/01/06 | | 14.70% | | 15.52% | | 8.87% | | |
| | | | |
| Comparative benchmark(s) | | | | | | | | |
| | | Russell 2000® Index (f) | | 14.65% | | 14.12% | | 8.71% | | |
| (f) | Source: FactSet Research Systems Inc. |
Benchmark Definition(s)
Russell 2000® Index – constructed to provide a comprehensive barometer for securities in the small-cap segment of the U.S. equity universe. The index includes 2,000 of the smallest U.S. companies based on total market capitalization, representing approximately 10% of the investable U.S. equity market. The Russell 2000® Index is a trademark/service mark of the Frank Russell Company. Russell® is a trademark of the Frank Russell Company.
It is not possible to invest directly in an index.
Notes to Performance Summary
Average annual total return represents the average annual change in value for each share class for the periods presented.
Performance results reflect any applicable expense subsidies and waivers in effect during the periods shown. Without such subsidies and waivers the fund’s performance results would be less favorable. Please see the prospectus and financial statements for complete details. All results are historical and assume the reinvestment of any dividends and capital gains distributions.
Performance prior to close of business December 7, 2012, reflects time periods when another adviser or subadviser was responsible for selecting investments for the fund under a different investment objective and different investment strategies.
Performance results do not include adjustments made for financial reporting purposes in accordance with U.S. generally accepted accounting principles and may differ from amounts reported in the financial highlights.
From time to time the fund may receive proceeds from litigation settlements, without which performance would be lower.
5
MFS Blended Research Small Cap Equity Portfolio
EXPENSE TABLE
Fund Expenses Borne by the Contract Holders during the Period, July 1, 2017 through December 31, 2017
As a contract holder of the fund, you incur ongoing costs, including management fees; distribution and/or service (12b-1) fees; and other fund expenses. This example is intended to help you understand your ongoing costs (in dollars) of investing in the fund and to compare these costs with the ongoing costs of investing in other mutual funds.
The example is based on an investment of $1,000 invested at the beginning of the period and held for the entire period July 1, 2017 through December 31, 2017.
Actual Expenses
The first line for each share class in the following table provides information about actual account values and actual expenses. You may use the information in this line, together with the amount you invested, to estimate the expenses that you paid over the period. Simply divide your account value by $1,000 (for example, an $8,600 account value divided by $1,000 = 8.6), then multiply the result by the number in the first line under the heading entitled “Expenses Paid During Period” to estimate the expenses you paid on your account during this period.
Hypothetical Example for Comparison Purposes
The second line for each share class in the following table provides information about hypothetical account values and hypothetical expenses based on the fund’s actual expense ratio and an assumed rate of return of 5% per year before expenses, which is not the fund’s actual return. The hypothetical account values and expenses may not be used to estimate the actual ending account balance or expenses you paid for the period. You may use this information to compare the ongoing costs of investing in the fund and other funds. To do so, compare this 5% hypothetical example with the 5% hypothetical examples that appear in the shareholder reports of the other funds.
Please note that the expenses shown in the table are meant to highlight the fund’s ongoing costs only and do not take into account the fees and expenses imposed under the variable contracts through which your investment in the fund is made. Therefore, the second line for each share class in the table is useful in comparing ongoing costs associated with an investment in vehicles (such as the fund) which fund benefits under variable annuity and variable life insurance contracts and to qualified pension and retirement plans only, and will not help you determine the relative total costs of investing in the fund through variable annuity and variable life insurance contracts. If the fees and expenses imposed under the variable contracts were included, your costs would have been higher.
| | | | | | | | | | | | | | | | | | |
| Share Class | | | | Annualized
Expense Ratio | | | Beginning
Account Value
7/01/17 | | | Ending
Account Value
12/31/17 | | | Expenses Paid
During Period (p)
7/01/17-12/31/17 | |
| Initial Class | | Actual | | | 0.52% | | | | $1,000.00 | | | | $1,096.61 | | | | $2.75 | |
| | Hypothetical (h) | | | 0.52% | | | | $1,000.00 | | | | $1,022.58 | | | | $2.65 | |
| Service Class | | Actual | | | 0.77% | | | | $1,000.00 | | | | $1,095.25 | | | | $4.07 | |
| | Hypothetical (h) | | | 0.77% | | | | $1,000.00 | | | | $1,021.32 | | | | $3.92 | |
| (h) | 5% class return per year before expenses. |
| (p) | “Expenses Paid During Period” are equal to each class’s annualized expense ratio, as shown above, multiplied by the average account value over the period, multiplied by 184/365 (to reflect the one-half year period). |
6
MFS Blended Research Small Cap Equity Portfolio
PORTFOLIO OF INVESTMENTS – 12/31/17
The Portfolio of Investments is a complete list of all securities owned by your fund. It is categorized by broad-based asset classes.
| | | | | | | | |
| Issuer | | Shares/Par | | | Value ($) | |
| COMMON STOCKS – 99.0% | | | | | | | | |
| Biotechnology – 4.2% | | | | | |
| Acorda Therapeutics, Inc. (a) | | | 25,435 | | | $ | 545,571 | |
| AMAG Pharmaceuticals, Inc. (a) | | | 42,166 | | | | 558,700 | |
| Bruker BioSciences Corp. | | | 17,341 | | | | 595,143 | |
| Emergent BioSolutions, Inc. (a) | | | 14,297 | | | | 664,382 | |
| Exact Sciences Corp. (a) | | | 25,012 | | | | 1,314,130 | |
| MiMedx Group, Inc. (a)(l) | | | 48,297 | | | | 609,025 | |
| Natera, Inc. (a) | | | 9,946 | | | | 89,415 | |
| Vanda Pharmaceuticals, Inc. (a) | | | 6,699 | | | | 101,825 | |
| | | | | | | | |
| | | | | | $ | 4,478,191 | |
| | | | | | | | |
| Broadcasting – 0.2% | | | | | |
| MDC Partners, Inc. (a) | | | 25,567 | | | $ | 249,278 | |
| | | | | | | | |
| Brokerage & Asset Managers – 0.4% | | | | | |
| Hamilton Lane, Inc., “A” | | | 7,762 | | | $ | 274,697 | |
| Legg Mason, Inc. | | | 1,323 | | | | 55,540 | |
| OM Asset Management PLC | | | 3,267 | | | | 54,722 | |
| | | | | | | | |
| | | | | | $ | 384,959 | |
| | | | | | | | |
| Business Services – 4.1% | | | | | |
| Conduent, Inc. (a) | | | 62,678 | | | $ | 1,012,876 | |
| Forrester Research, Inc. | | | 27,647 | | | | 1,221,997 | |
| Grand Canyon Education, Inc. (a) | | | 15,369 | | | | 1,375,987 | |
| Travelport Worldwide Ltd. | | | 62,464 | | | | 816,404 | |
| | | | | | | | |
| | | | | | $ | 4,427,264 | |
| | | | | | | | |
| Cable TV – 0.1% | | | | | |
| Cable One, Inc. | | | 202 | | | $ | 142,077 | |
| | | | | | | | |
| Chemicals – 0.7% | | | | | |
| Ingevity Corp. (a) | | | 10,049 | | | $ | 708,153 | |
| | | | | | | | |
| Computer Software – 2.8% | | | | | |
| Aspen Technology, Inc. (a) | | | 15,181 | | | $ | 1,004,982 | |
| Cornerstone OnDemand, Inc. (a) | | | 19,258 | | | | 680,385 | |
| Paylocity Holding Corp. (a) | | | 29,090 | | | | 1,371,884 | |
| | | | | | | | |
| | | | | | $ | 3,057,251 | |
| | | | | | | | |
| Computer Software – Systems – 7.3% | | | | | |
| Avnet, Inc. | | | 3,486 | | | $ | 138,115 | |
| EPAM Systems, Inc. (a) | | | 10,914 | | | | 1,172,491 | |
| NCR Corp. (a) | | | 30,215 | | | | 1,027,008 | |
| Pitney Bowes, Inc. | | | 18,964 | | | | 212,018 | |
| Presidio, Inc. (a) | | | 33,907 | | | | 649,997 | |
| Rapid7, Inc. (a) | | | 75,115 | | | | 1,401,646 | |
| Tech Data Corp. (a) | | | 15,831 | | | | 1,550,963 | |
| Varonis Systems, Inc. (a) | | | 9,553 | | | | 463,798 | |
| Verint Systems, Inc. (a) | | | 29,623 | | | | 1,239,723 | |
| | | | | | | | |
| | | | | | $ | 7,855,759 | |
| | | | | | | | |
| Construction – 2.1% | | | | | |
| Armstrong World Industries, Inc. (a) | | | 5,261 | | | $ | 318,554 | |
| GMS, Inc. (a) | | | 5,367 | | | | 202,014 | |
| KB Home | | | 8,638 | | | | 275,984 | |
| Trex Co., Inc. (a) | | | 13,406 | | | | 1,453,076 | |
| | | | | | | | |
| | | | | | $ | 2,249,628 | |
| | | | | | | | |
| | | | | | | | |
| Issuer | | Shares/Par | | | Value ($) | |
| COMMON STOCKS – continued | | | | | | | | |
| Consumer Products – 0.3% | | | | | |
| Herbalife Ltd. (a) | | | 4,549 | | | $ | 308,058 | |
| | | | | | | | |
| Consumer Services – 1.3% | | | | | |
| Carriage Services, Inc. | | | 20,982 | | | $ | 539,447 | |
| ServiceMaster Global Holdings, Inc. (a) | | | 16,826 | | | | 862,669 | |
| | | | | | | | |
| | | | | | $ | 1,402,116 | |
| | | | | | | | |
| Electrical Equipment – 2.7% | | | | | |
| TriMas Corp. (a) | | | 50,044 | | | $ | 1,338,677 | |
| WESCO International, Inc. (a) | | | 23,689 | | | | 1,614,405 | |
| | | | | | | | |
| | | | | | $ | 2,953,082 | |
| | | | | | | | |
| Electronics – 2.8% | | | | | |
| Amkor Technology, Inc. (a) | | | 44,843 | | | $ | 450,672 | |
| Benchmark Electronics, Inc. (a) | | | 13,275 | | | | 386,303 | |
| Integrated Device Technology, Inc. (a) | | | 9,152 | | | | 272,089 | |
| Jabil Circuit, Inc. | | | 26,150 | | | | 686,438 | |
| OSI Systems, Inc. (a) | | | 4,823 | | | | 310,505 | |
| Sanmina Corp. (a) | | | 17,910 | | | | 591,030 | |
| TTM Technologies, Inc. (a) | | | 22,159 | | | | 347,232 | |
| | | | | | | | |
| | | | | | $ | 3,044,269 | |
| | | | | | | | |
| Energy – Independent – 2.3% | | | | | |
| Delek U.S. Holdings, Inc. | | | 26,930 | | | $ | 940,934 | |
| Energen Corp. (a) | | | 8,310 | | | | 478,407 | |
| Par Pacific Holdings, Inc. (a) | | | 29,379 | | | | 566,427 | |
| PBF Energy, Inc., “A” | | | 12,897 | | | | 457,199 | |
| | | | | | | | |
| | | | | | $ | 2,442,967 | |
| | | | | | | | |
| Engineering – Construction – 2.0% | | | | | |
| KBR, Inc. | | | 82,649 | | | $ | 1,638,930 | |
| Matrix Service Co. (a) | | | 31,750 | | | | 565,150 | |
| | | | | | | | |
| | | | | | $ | 2,204,080 | |
| | | | | | | | |
| Entertainment – 0.2% | | | | | |
| Madison Square Garden Co., “A” (a) | | | 1,130 | | | $ | 238,261 | |
| | | | | | | | |
| Food & Beverages – 3.2% | | | | | |
| Dean Foods Co. | | | 28,012 | | | $ | 323,819 | |
| Hostess Brands, Inc. (a) | | | 25,061 | | | | 371,153 | |
| Sanderson Farms, Inc. | | | 3,724 | | | | 516,817 | |
| Snyders-Lance, Inc. | | | 22,114 | | | | 1,107,469 | |
| SpartanNash Co. | | | 16,182 | | | | 431,736 | |
| TreeHouse Foods, Inc. (a) | | | 13,788 | | | | 681,954 | |
| | | | | | | | |
| | | | | | $ | 3,432,948 | |
| | | | | | | | |
| Forest & Paper Products – 1.2% | | | | | |
| Boise Cascade Corp. | | | 14,935 | | | $ | 595,907 | |
| Verso Corp., “A” (a) | | | 40,629 | | | | 713,852 | |
| | | | | | | | |
| | | | | | $ | 1,309,759 | |
| | | | | | | | |
| Gaming & Lodging – 0.5% | | | | | |
| Caesars Entertainment Corp. (a) | | | 43,645 | | | $ | 552,109 | |
| | | | | | | | |
7
MFS Blended Research Small Cap Equity Portfolio
Portfolio of Investments – continued
| | | | | | | | |
| Issuer | | Shares/Par | | | Value ($) | |
| COMMON STOCKS – continued | | | | | |
| Health Maintenance Organizations – 0.6% | | | | | |
| Molina Healthcare, Inc. (a) | | | 8,463 | | | $ | 648,943 | |
| | | | | | | | |
| Insurance – 3.7% | | | | | |
| American Equity Investment Life Holding Co. | | | 35,526 | | | $ | 1,091,714 | |
| Hanover Insurance Group, Inc. | | | 1,058 | | | | 114,349 | |
| Heritage Insurance Holdings, Inc. (l) | | | 32,988 | | | | 594,444 | |
| Safety Insurance Group, Inc. | | | 7,635 | | | | 613,854 | |
| Third Point Reinsurance Ltd. (a) | | | 70,396 | | | | 1,031,301 | |
| Universal Insurance Holdings, Inc. | | | 20,847 | | | | 570,165 | |
| | | | | | | | |
| | | | | | $ | 4,015,827 | |
| | | | | | | | |
| Internet – 2.4% | | | | | |
| Blucora, Inc. (a) | | | 33,733 | | | $ | 745,499 | |
| LogMeIn, Inc. | | | 11,206 | | | | 1,283,087 | |
| Web.Com Group, Inc. (a) | | | 25,240 | | | | 550,232 | |
| | | | | | | | |
| | | | | | $ | 2,578,818 | |
| | | | | | | | |
| Leisure & Toys – 0.5% | | | | | |
| Malibu Boats, Inc., “A” (a) | | | 17,903 | | | $ | 532,256 | |
| | | | | | | | |
| Machinery & Tools – 8.4% | | | | | |
| ACCO Brands Corp. (a) | | | 39,960 | | | $ | 487,512 | |
| Greenbrier Cos., Inc. | | | 11,371 | | | | 606,074 | |
| Herman Miller, Inc. | | | 25,090 | | | | 1,004,855 | |
| IPG Photonics Corp. (a) | | | 6,121 | | | | 1,310,690 | |
| ITT, Inc. | | | 24,091 | | | | 1,285,737 | |
| Knoll, Inc. | | | 21,184 | | | | 488,079 | |
| Park-Ohio Holdings Corp. | | | 7,358 | | | | 338,100 | |
| Regal Beloit Corp. | | | 16,090 | | | | 1,232,494 | |
| SPX FLOW, Inc. (a) | | | 31,513 | | | | 1,498,443 | |
| Steelcase, Inc., “A” | | | 12,501 | | | | 190,015 | |
| Titan Machinery, Inc. (a) | | | 29,117 | | | | 616,407 | |
| | | | | | | | |
| | | | | | $ | 9,058,406 | |
| | | | | | | | |
| Medical & Health Technology & Services – 1.0% | | | | | |
| American Renal Associates Holdings, Inc. (a) | | | 23,544 | | | $ | 409,666 | |
| Kindred Healthcare, Inc. | | | 65,125 | | | | 631,713 | |
| | | | | | | | |
| | | | | | $ | 1,041,379 | |
| | | | | | | | |
| Medical Equipment – 5.2% | | | | | |
| Analogic Corp. | | | 6,877 | | | $ | 575,949 | |
| AngioDynamics, Inc. (a) | | | 32,114 | | | | 534,056 | |
| Biotelemetry, Inc. (a) | | | 25,763 | | | | 770,314 | |
| CONMED Corp. | | | 25,460 | | | | 1,297,696 | |
| Halyard Health, Inc. (a) | | | 21,374 | | | | 987,051 | |
| Integer Holdings Corp. (a) | | | 17,957 | | | | 813,452 | |
| Integra LifeSciences Holdings Corp. (a) | | | 12,801 | | | | 612,656 | |
| | | | | | | | |
| | | | | | $ | 5,591,174 | |
| | | | | | | | |
| Metals & Mining – 0.2% | | | | | |
| Ryerson Holding Corp. (a) | | | 22,371 | | | $ | 232,658 | |
| | | | | | | | |
| Natural Gas – Distribution – 0.2% | | | | | |
| Southwest Gas Holdings, Inc. | | | 2,977 | | | $ | 239,589 | |
| | | | | | | | |
| Oil Services – 1.1% | | | | | |
| Exterran Holdings, Inc. (a) | | | 19,445 | | | $ | 611,351 | |
| McDermott International, Inc. (a) | | | 81,813 | | | | 538,330 | |
| | | | | | | | |
| | | | | | $ | 1,149,681 | |
| | | | | | | | |
| | | | | | | | |
| Issuer | | Shares/Par | | | Value ($) | |
| COMMON STOCKS – continued | | | | | |
| Other Banks & Diversified Financials – 12.1% | | | | | |
| BancFirst Corp. | | | 6,467 | | | $ | 330,787 | |
| Bank of N.T. Butterfield & Son Ltd. | | | 16,688 | | | | 605,608 | |
| CAI International, Inc. (a) | | | 23,024 | | | | 652,040 | |
| Cathay General Bancorp, Inc. | | | 30,072 | | | | 1,268,136 | |
| East West Bancorp, Inc. | | | 25,871 | | | | 1,573,733 | |
| Enova International, Inc. (a) | | | 40,021 | | | | 608,319 | |
| First Interstate BancSystem, Inc. | | | 30,290 | | | | 1,213,115 | |
| Glacier Bancorp, Inc. | | | 3,579 | | | | 140,977 | |
| OneMain Holdings, Inc. (a) | | | 19,398 | | | | 504,154 | |
| PennyMac Financial Services, Inc., “A “ (a) | | | 25,081 | | | | 560,560 | |
| Popular, Inc. | | | 14,032 | | | | 497,996 | |
| Preferred Bank | | | 18,586 | | | | 1,092,485 | |
| Regional Management Corp. (a) | | | 26,569 | | | | 699,030 | |
| Triton International Ltd. of Bermuda | | | 19,087 | | | | 714,808 | |
| Western Alliance Bancorp. (a) | | | 14,306 | | | | 810,006 | |
| Wintrust Financial Corp. | | | 19,329 | | | | 1,592,130 | |
| World Acceptance Corp. (a) | | | 2,262 | | | | 182,589 | |
| | | | | | | | |
| | | | | | $ | 13,046,473 | |
| | | | | | | | |
| Pharmaceuticals – 1.3% | | | | | |
| Catalent, Inc. (a) | | | 6,760 | | | $ | 277,701 | |
| Endo International PLC (a) | | | 23,640 | | | | 183,210 | |
| Horizon Pharma PLC (a) | | | 49,179 | | | | 718,013 | |
| Impax Laboratories, Inc. (a) | | | 2,698 | | | | 44,922 | |
| Mallinckrodt PLC (a) | | | 2,428 | | | | 54,776 | |
| Sucampo Pharmaceuticals, Inc. (a) | | | 5,274 | | | | 94,668 | |
| | | | | | | | |
| | | | | | $ | 1,373,290 | |
| | | | | | | | |
| Printing & Publishing – 1.2% | | | | | |
| Gannett Co., Inc. | | | 51,560 | | | $ | 597,580 | |
| LSC Communications, Inc. | | | 3,293 | | | | 49,889 | |
| Quad/Graphics, Inc. | | | 27,101 | | | | 612,483 | |
| | | | | | | | |
| | | | | | $ | 1,259,952 | |
| | | | | | | | |
| Real Estate – 8.7% | | | | | |
| Ashford Hospitality Trust, REIT | | | 77,576 | | | $ | 522,086 | |
| CoreCivic, Inc., REIT | | | 16,295 | | | | 366,638 | |
| Gramercy Property Trust, REIT | | | 51,566 | | | | 1,374,750 | |
| Hospitality Properties Trust, REIT | | | 14,745 | | | | 440,138 | |
| Medical Properties Trust, Inc., REIT | | | 96,074 | | | | 1,323,900 | |
| Preferred Apartment Communities, Inc., “A”, REIT | | | 27,281 | | | | 552,440 | |
| RE/MAX Holdings, Inc., “A” | | | 29,361 | | | | 1,424,009 | |
| Realogy Holdings Corp. | | | 2,444 | | | | 64,766 | |
| RLJ Lodging Trust, REIT | | | 16,759 | | | | 368,195 | |
| Sabra Healthcare, REIT | | | 35,066 | | | | 658,189 | |
| STAG Industrial, Inc., REIT | | | 10,044 | | | | 274,503 | |
| Washington Prime Group, Inc., REIT | | | 197,699 | | | | 1,407,617 | |
| Xenia Hotels & Resorts Inc., REIT | | | 27,291 | | | | 589,213 | |
| | | | | | | | |
| | | | | | $ | 9,366,444 | |
| | | | | | | | |
| Restaurants – 1.7% | | | | | |
| BJ’s Restaurants, Inc. | | | 4,894 | | | $ | 178,142 | |
| Bloomin Brands, Inc. | | | 33,984 | | | | 725,219 | |
| Brinker International, Inc. | | | 23,059 | | | | 895,612 | |
| | | | | | | | |
| | | | | | $ | 1,798,973 | |
| | | | | | | | |
8
MFS Blended Research Small Cap Equity Portfolio
Portfolio of Investments – continued
| | | | | | | | |
| Issuer | | Shares/Par | | | Value ($) | |
| COMMON STOCKS – continued | | | | | |
| Specialty Chemicals – 3.9% | | | | | |
| Andersons, Inc. | | | 16,177 | | | $ | 503,914 | |
| Chemours Co. | | | 5,991 | | | | 299,909 | |
| Kronos Worldwide, Inc. | | | 26,807 | | | | 690,816 | |
| Renewable Energy Group, Inc. (a) | | | 19,384 | | | | 228,731 | |
| Trinseo S.A. | | | 13,861 | | | | 1,006,309 | |
| Univar, Inc. (a) | | | 46,794 | | | | 1,448,742 | |
| | | | | | | | |
| | | | | | $ | 4,178,421 | |
| | | | | | | | |
| Specialty Stores – 4.1% | | | | | | | | |
| Citi Trends, Inc. | | | 22,680 | | | $ | 600,113 | |
| Express, Inc. (a) | | | 39,671 | | | | 402,661 | |
| Michaels Co., Inc. (a) | | | 67,078 | | | | 1,622,617 | |
| Sally Beauty Holdings, Inc. (a) | | | 13,710 | | | | 257,200 | |
| Urban Outfitters, Inc. (a) | | | 34,226 | | | | 1,199,964 | |
| Zumiez, Inc. (a) | | | 13,524 | | | | 281,637 | |
| | | | | | | | |
| | | | | | $ | 4,364,192 | |
| | | | | | | | |
| Telecommunications – Wireless – 0.5% | | | | | | | | |
| Telephone and Data Systems, Inc. | | | 17,932 | | | $ | 498,510 | |
| | | | | | | | |
| Trucking – 0.5% | | | | | | | | |
| Hub Group, Inc., “A” (a) | | | 8,684 | | | $ | 415,964 | |
| Werner Enterprises, Inc. | | | 1,948 | | | | 75,290 | |
| | | | | | | | |
| | | | | | $ | 491,254 | |
| | | | | | | | |
| Utilities – Electric Power – 3.3% | | | | | | | | |
| Atlantica Yield PLC | | | 37,542 | | | $ | 796,266 | |
| NRG Energy, Inc. | | | 43,559 | | | | 1,240,560 | |
| NRG Yield, Inc., “A” | | | 20,396 | | | | 384,465 | |
| PNM Resources, Inc. | | | 17,810 | | | | 720,415 | |
| Spark Energy, Inc., “A” (l) | | | 36,234 | | | | 449,302 | |
| | | | | | | | |
| | | | | | $ | 3,591,008 | |
| | | | | | | | |
Total Common Stocks
(Identified Cost, $87,330,766) | | | | | | $ | 106,497,457 | |
| | | | | | | | |
| | | | | | | | | | | | | | | | |
| | | Strike
Price | | | First
Exercise | | | | | | | |
| WARRANTS – 0.0% | | | | | | | | | |
| OTHER BANKS & DIVERSIFIED FINANCIALS – 0.0% | |
| Emergent Capital, Inc. (1 share for 1 warrant) (Identified Cost, $0) (a)(u) | | $ | 10.75 | | | | 11/06/14 | | | | 318 | | | $ | 3 | |
| | | | | | | | | | | | | | | | |
| | | | | | | | | | | | |
| Issuer | | | | | | Shares/Par | | | Value ($) | |
| INVESTMENT COMPANIES (h) – 0.8% | | | | | |
| MONEY MARKET FUNDS – 0.8% | | | | | |
| MFS Institutional Money Market Portfolio, 1.25% (v) (Identified Cost, $844,530) | | | 844,615 | | | $ | 844,530 | |
| | | | | | | | | | | | |
|
| COLLATERAL FOR SECURITIES LOANED – 1.1% | |
State Street Navigator Securities Lending Government Money Market Portfolio,
1.3% (j) (Identified Cost, $1,238,961) | | | 1,238,961 | | | $ | 1,238,961 | |
| | | | | | | | | | | | |
OTHER ASSETS, LESS
LIABILITIES – (0.9)% | | | | | | | (1,019,896 | ) |
| | | | | | | | | | | | |
| NET ASSETS – 100.0% | | | | | | $ | 107,561,055 | |
| | | | | | | | | | | | |
| (a) | | Non-income producing security. |
| (h) | | An affiliated issuer may be considered one in which the fund owns 5% or more of the outstanding voting securities, or a company which is under common control. At period end, the aggregate values of the fund’s investments in affiliated issuers and in unaffiliated issuers were $844,530 and $107,736,421, respectively. |
| (j) | | The rate quoted is the annualized seven-day yield of the fund at period end. |
| (l) | | A portion of this security is on loan. |
| (u) | | The security was valued using significant unobservable inputs and is considered level 3 under the fair value hierarchy. |
| (v) | | Affiliated issuer that is available only to investment companies managed by MFS. The rate quoted for the MFS Institutional Money Market Portfolio is the annualized seven-day yield of the fund at period end. |
The following abbreviations are used in this report and are defined:
| PLC | | Public Limited Company |
| REIT | | Real Estate Investment Trust |
See Notes to Financial Statements
9
MFS Blended Research Small Cap Equity Portfolio
FINANCIAL STATEMENTS | STATEMENT OF ASSETS AND LIABILITIES
This statement represents your fund’s balance sheet, which details the assets and liabilities comprising the total value of the fund.
| | | | |
At 12/31/17 | | | | |
Assets | | | | |
Investments in unaffiliated issuers, at value, including $1,341,195 of securities on loan (identified cost, $88,569,727) | | | $107,736,421 | |
Investments in affiliated issuers, at value (identified cost, $844,530) | | | 844,530 | |
Receivables for | | | | |
Investments sold | | | 164,138 | |
Fund shares sold | | | 61,191 | |
Interest and dividends | | | 110,633 | |
Other assets | | | 1,087 | |
Total assets | | | $108,918,000 | |
Liabilities | | | | |
Payable for fund shares reacquired | | | $66,689 | |
Collateral for securities loaned, at value (c) | | | 1,238,961 | |
Payable to affiliates | | | | |
Investment adviser | | | 4,918 | |
Shareholder servicing costs | | | 96 | |
Distribution and/or service fees | | | 1,967 | |
Payable for independent Trustees’ compensation | | | 36 | |
Accrued expenses and other liabilities | | | 44,278 | |
Total liabilities | | | $1,356,945 | |
Net assets | | | $107,561,055 | |
Net assets consist of | | | | |
Paid-in capital | | | $76,001,468 | |
Unrealized appreciation (depreciation) | | | 19,166,694 | |
Accumulated net realized gain (loss) | | | 11,712,775 | |
Undistributed net investment income | | | 680,118 | |
Net assets | | | $107,561,055 | |
Shares of beneficial interest outstanding | | | 8,126,807 | |
| | | | | | | | | | | | |
| | | Net assets | | | Shares
outstanding | | | Net asset value
per share | |
Initial Class | | | $36,194,719 | | | | 2,686,934 | | | | $13.47 | |
Service Class | | | 71,366,336 | | | | 5,439,873 | | | | 13.12 | |
| (c) | Non-cash collateral is not included. |
Net asset value per share is calculated using actual net assets and shares outstanding rather than amounts that have been rounded for presentation purposes.
See Notes to Financial Statements
10
MFS Blended Research Small Cap Equity Portfolio
FINANCIAL STATEMENTS | STATEMENT OF OPERATIONS
This statement describes how much your fund earned in investment income and accrued in expenses. It also describes any gains and/or losses generated by fund operations.
| | | | |
Year ended 12/31/17 | |
Net investment income (loss) | |
Income | | | | |
Dividends | | | $1,309,910 | |
Dividends from affiliated issuers | | | 8,712 | |
Income on securities loaned | | | 110,953 | |
Foreign taxes withheld | | | (2,232 | ) |
Total investment income | | | $1,427,343 | |
Expenses | | | | |
Management fee | | | $429,428 | |
Distribution and/or service fees | | | 185,125 | |
Shareholder servicing costs | | | 8,698 | |
Administrative services fee | | | 26,557 | |
Independent Trustees’ compensation | | | 4,334 | |
Custodian fee | | | 6,421 | |
Shareholder communications | | | 29,242 | |
Audit and tax fees | | | 51,641 | |
Legal fees | | | 2,262 | |
Miscellaneous | | | 11,978 | |
Total expenses | | | $755,686 | |
Reduction of expenses by investment adviser | | | (8,597 | ) |
Net expenses | | | $747,089 | |
Net investment income (loss) | | | $680,254 | |
Realized and unrealized gain (loss) | | | | |
Realized gain (loss) (identified cost basis) | | | | |
Unaffiliated issuers | | | $12,100,424 | |
Affiliated issuers | | | 645 | |
Net realized gain (loss) | | | $12,101,069 | |
Change in unrealized appreciation (depreciation) on unaffiliated issuers | | | $2,075,039 | |
Net realized and unrealized gain (loss) | | | $14,176,108 | |
Change in net assets from operations | | | $14,856,362 | |
See Notes to Financial Statements
11
MFS Blended Research Small Cap Equity Portfolio
FINANCIAL STATEMENTS | STATEMENTS OF CHANGES IN NET ASSETS
These statements describe the increases and/or decreases in net assets resulting from operations, any distributions, and any shareholder transactions.
| | | | | | | | |
| | | Year ended | |
| | | 12/31/17 | | | | 12/31/16 | |
Change in net assets | | | | | | | | |
From operations | | | | | | | | |
Net investment income (loss) | | | $680,254 | | | | $763,886 | |
Net realized gain (loss) | | | 12,101,069 | | | | 11,388,941 | |
Net unrealized gain (loss) | | | 2,075,039 | | | | 7,487,812 | |
Change in net assets from operations | | | $14,856,362 | | | | $19,640,639 | |
Distributions declared to shareholders | | | | | | | | |
From net investment income | | | $(764,011 | ) | | | $(1,047,437 | ) |
From net realized gain | | | (11,410,140 | ) | | | (10,876,539 | ) |
Total distributions declared to shareholders | | | $(12,174,151 | ) | | | $(11,923,976 | ) |
Change in net assets from fund share transactions | | | $1,710,788 | | | | $(15,137,767 | ) |
Total change in net assets | | | $4,392,999 | | | | $(7,421,104 | ) |
Net assets | | | | | | | | |
At beginning of period | | | 103,168,056 | | | | 110,589,160 | |
At end of period (including undistributed net investment income of $680,118 and
$763,875, respectively) | | | $107,561,055 | | | | $103,168,056 | |
See Notes to Financial Statements
12
MFS Blended Research Small Cap Equity Portfolio
FINANCIAL STATEMENTS | FINANCIAL HIGHLIGHTS
The financial highlights table is intended to help you understand the fund’s financial performance for the past 5 years. Certain information reflects financial results for a single fund share. The total returns in the table represent the rate that an investor would have earned (or lost) on an investment in the fund share class (assuming reinvestment of all distributions) held for the entire period.
| | | | | | | | | | | | | | | | | | | | |
| Initial Class | | Year ended | |
| | | 12/31/17 | | | 12/31/16 | | | 12/31/15 | | | 12/31/14 | | | 12/31/13 | |
Net asset value, beginning of period | | | $13.23 | | | | $12.29 | | | | $16.04 | | | | $18.24 | | | | $13.57 | |
| Income (loss) from investment operations | | | | | | | | | | | | | | | | | | | | |
Net investment income (loss) (d) | | | $0.11 | | | | $0.11 | (c) | | | $0.15 | | | | $0.10 | | | | $0.11 | |
Net realized and unrealized gain (loss) | | | 1.70 | | | | 2.35 | | | | (0.94 | ) | | | 1.16 | | | | 5.91 | |
Total from investment operations | | | $1.81 | | | | $2.46 | | | | $(0.79 | ) | | | $1.26 | | | | $6.02 | |
| Less distributions declared to shareholders | | | | | | | | | | | | | | | | | | | | |
From net investment income | | | $(0.12 | ) | | | $(0.16 | ) | | | $(0.10 | ) | | | $(0.18 | ) | | | $(0.28 | ) |
From net realized gain | | | (1.45 | ) | | | (1.36 | ) | | | (2.86 | ) | | | (3.28 | ) | | | (1.07 | ) |
Total distributions declared to shareholders | | | $(1.57 | ) | | | $(1.52 | ) | | | $(2.96 | ) | | | $(3.46 | ) | | | $(1.35 | ) |
Net asset value, end of period (x) | | | $13.47 | | | | $13.23 | | | | $12.29 | | | | $16.04 | | | | $18.24 | |
Total return (%) (k)(r)(s)(x) | | | 14.97 | | | | 20.90 | (c) | | | (4.15 | ) | | | 7.29 | | | | 45.71 | |
Ratios (%) (to average net assets)
and Supplemental data: | | | | | | | | | | | | | | | | | | | | |
Expenses before expense reductions (f) | | | 0.53 | | | | 0.42 | (c) | | | 0.54 | | | | 0.51 | | | | 0.51 | |
Expenses after expense reductions (f) | | | 0.52 | | | | 0.41 | (c) | | | 0.53 | | | | 0.50 | | | | 0.51 | |
Net investment income (loss) | | | 0.82 | | | | 0.92 | (c) | | | 1.03 | | | | 0.56 | | | | 0.68 | |
Portfolio turnover | | | 81 | | | | 72 | | | | 78 | | | | 67 | | | | 69 | |
Net assets at end of period (000 omitted) | | | $36,195 | | | | $28,715 | | | | $27,795 | | | | $31,323 | | | | $33,401 | |
| |
| Service Class | | Year ended | |
| | | 12/31/17 | | | 12/31/16 | | | 12/31/15 | | | 12/31/14 | | | 12/31/13 | |
Net asset value, beginning of period | | | $12.92 | | | | $12.03 | | | | $15.75 | | | | $17.96 | | | | $13.38 | |
| Income (loss) from investment operations | | | | | | | | | | | | | | | | | | | | |
Net investment income (loss) (d) | | | $0.07 | | | | $0.08 | (c) | | | $0.12 | | | | $0.05 | | | | $0.07 | |
Net realized and unrealized gain (loss) | | | 1.67 | | | | 2.29 | | | | (0.93 | ) | | | 1.15 | | | | 5.82 | |
Total from investment operations | | | $1.74 | | | | $2.37 | | | | $(0.81 | ) | | | $1.20 | | | | $5.89 | |
| Less distributions declared to shareholders | | | | | | | | | | | | | | | | | | | | |
From net investment income | | | $(0.09 | ) | | | $(0.12 | ) | | | $(0.05 | ) | | | $(0.13 | ) | | | $(0.24 | ) |
From net realized gain | | | (1.45 | ) | | | (1.36 | ) | | | (2.86 | ) | | | (3.28 | ) | | | (1.07 | ) |
Total distributions declared to shareholders | | | $(1.54 | ) | | | $(1.48 | ) | | | $(2.91 | ) | | | $(3.41 | ) | | | $(1.31 | ) |
Net asset value, end of period (x) | | | $13.12 | | | | $12.92 | | | | $12.03 | | | | $15.75 | | | | $17.96 | |
Total return (%) (k)(r)(s)(x) | | | 14.70 | | | | 20.58 | (c) | | | (4.38 | ) | | | 7.04 | | | | 45.33 | |
Ratios (%) (to average net assets)
and Supplemental data: | | | | | | | | | | | | | | | | | | | | |
Expenses before expense reductions (f) | | | 0.78 | | | | 0.67 | (c) | | | 0.79 | | | | 0.76 | | | | 0.76 | |
Expenses after expense reductions (f) | | | 0.77 | | | | 0.66 | (c) | | | 0.78 | | | | 0.75 | | | | 0.76 | |
Net investment income (loss) | | | 0.55 | | | | 0.66 | (c) | | | 0.79 | | | | 0.30 | | | | 0.42 | |
Portfolio turnover | | | 81 | | | | 72 | | | | 78 | | | | 67 | | | | 69 | |
Net assets at end of period (000 omitted) | | | $71,366 | | | | $74,453 | | | | $82,794 | | | | $104,221 | | | | $121,036 | |
See Notes to Financial Statements
13
MFS Blended Research Small Cap Equity Portfolio
Financial Highlights – continued
| (c) | Amount reflects a one-time reimbursement of expenses by the custodian (or former custodian) without which net investment income and performance would be lower and expenses would be higher. |
| (d) | Per share data is based on average shares outstanding. |
| (f) | Ratios do not reflect reductions from fees paid indirectly, if applicable. |
| (k) | The total return does not reflect expenses that apply to separate accounts. Inclusion of these charges would reduce the total return figures for all periods shown. |
| (r) | Certain expenses have been reduced without which performance would have been lower. |
| (s) | From time to time the fund may receive proceeds from litigation settlements, without which performance would be lower. |
| (x) | The net asset values and total returns have been calculated on net assets which include adjustments made in accordance with U.S. generally accepted accounting principles required at period end for financial reporting purposes. |
See Notes to Financial Statements
14
MFS Blended Research Small Cap Equity Portfolio
NOTES TO FINANCIAL STATEMENTS
| (1) | | Business and Organization |
MFS Blended Research Small Cap Equity Portfolio (the fund) is a diversified series of MFS Variable Insurance Trust III (the trust). The trust is organized as a Delaware statutory trust and is registered under the Investment Company Act of 1940, as amended, as an open-end management investment company. The shareholders of each series of the trust are separate accounts of insurance companies, which offer variable annuity and/or life insurance products, and qualified retirement and pension plans.
The fund is an investment company and accordingly follows the investment company accounting and reporting guidance of the Financial Accounting Standards Board (FASB) Accounting Standards Codification Topic 946 Financial Services – Investment Companies.
| (2) | | Significant Accounting Policies |
General – The preparation of financial statements in conformity with U.S. generally accepted accounting principles requires management to make estimates and assumptions that affect the reported amounts of assets and liabilities, and disclosure of contingent assets and liabilities at the date of the financial statements and the reported amounts of increases and decreases in net assets from operations during the reporting period. Actual results could differ from those estimates. In the preparation of these financial statements, management has evaluated subsequent events occurring after the date of the fund’s Statement of Assets and Liabilities through the date that the financial statements were issued. The fund will generally focus on securities of small size companies which may be more volatile than those of larger companies.
In October 2016, the Securities and Exchange Commission (SEC) released its final rule on Investment Company Reporting Modernization (the “Rule”). The Rule, which introduced two new regulatory reporting forms for investment companies – Form N-PORT and Form N-CEN – also contained amendments to Regulation S-X which impact financial statement presentation, particularly the presentation of derivative investments, for all reporting periods ending after August 1, 2017. The fund has adopted the Rule’s Regulation S-X amendments and believes that the fund’s financial statements are in compliance with those amendments.
Balance Sheet Offsetting – The fund’s accounting policy with respect to balance sheet offsetting is that, absent an event of default by the counterparty or a termination of the agreement, the International Swaps and Derivatives Association (ISDA) Master Agreement, or similar agreement, does not result in an offset of reported amounts of financial assets and financial liabilities in the Statement of Assets and Liabilities across transactions between the fund and the applicable counterparty. The fund’s right to setoff may be restricted or prohibited by the bankruptcy or insolvency laws of the particular jurisdiction to which a specific master netting agreement counterparty is subject. Balance sheet offsetting disclosures, to the extent applicable to the fund, have been included in the fund’s Significant Accounting Policies note under the captions for each of the fund’s in-scope financial instruments and transactions.
Investment Valuations – Equity securities, including restricted equity securities, are generally valued at the last sale or official closing price on their primary market or exchange as provided by a third-party pricing service. Equity securities, for which there were no sales reported that day, are generally valued at the last quoted daily bid quotation on their primary market or exchange as provided by a third-party pricing service. Short-term instruments with a maturity at issuance of 60 days or less may be valued at amortized cost, which approximates market value. Open-end investment companies are generally valued at net asset value per share. Securities and other assets generally valued on the basis of information from a third-party pricing service may also be valued at a broker/dealer bid quotation. Values obtained from third-party pricing services can utilize both transaction data and market information such as yield, quality, coupon rate, maturity, type of issue, trading characteristics, and other market data. The values of foreign securities and other assets and liabilities expressed in foreign currencies are converted to U.S. dollars using the mean of bid and asked prices for rates provided by a third-party pricing service.
The Board of Trustees has delegated primary responsibility for determining or causing to be determined the value of the fund’s investments (including any fair valuation) to the adviser pursuant to valuation policies and procedures approved by the Board. If the adviser determines that reliable market quotations are not readily available, investments are valued at fair value as determined in good faith by the adviser in accordance with such procedures under the oversight of the Board of Trustees. Under the fund’s valuation policies and procedures, market quotations are not considered to be readily available for most types of debt instruments and floating rate loans and many types of derivatives. These investments are generally valued at fair value based on information from third-party pricing services. In addition, investments may be valued at fair value if the adviser determines that an investment’s value has been materially affected by events occurring after the close of the exchange or market on which the investment is principally traded (such as foreign exchange or market) and prior to the determination of the fund’s net asset value, or after the halting of trading of a specific security where trading does not resume prior to the close of the exchange or market on which the security is principally traded. Events that occur on a frequent basis after foreign markets close (such as developments in foreign markets and significant movements in the U.S. markets) and prior to the determination of the fund’s net asset value may be deemed to have a material effect on the value of securities traded in foreign markets. Accordingly, the fund’s foreign equity securities may often be valued at fair value. The adviser generally relies on third-party pricing services or other information (such as the correlation with price movements of similar securities in the same or other markets; the type, cost and investment characteristics of the security; the
15
MFS Blended Research Small Cap Equity Portfolio
Notes to Financial Statements – continued
business and financial condition of the issuer; and trading and other market data) to assist in determining whether to fair value and at what value to fair value an investment. The value of an investment for purposes of calculating the fund’s net asset value can differ depending on the source and method used to determine value. When fair valuation is used, the value of an investment used to determine the fund’s net asset value may differ from quoted or published prices for the same investment. There can be no assurance that the fund could obtain the fair value assigned to an investment if it were to sell the investment at the same time at which the fund determines its net asset value per share.
Various inputs are used in determining the value of the fund’s assets or liabilities. These inputs are categorized into three broad levels. In certain cases, the inputs used to measure fair value may fall into different levels of the fair value hierarchy. In such cases, an investment’s level within the fair value hierarchy is based on the lowest level of input that is significant to the fair value measurement. The fund’s assessment of the significance of a particular input to the fair value measurement in its entirety requires judgment, and considers factors specific to the investment. Level 1 includes unadjusted quoted prices in active markets for identical assets or liabilities. Level 2 includes other significant observable market-based inputs (including quoted prices for similar securities, interest rates, prepayment speed, and credit risk). Level 3 includes unobservable inputs, which may include the adviser’s own assumptions in determining the fair value of investments. The following is a summary of the levels used as of December 31, 2017 in valuing the fund’s assets or liabilities:
| | | | | | | | | | | | | | | | |
| Financial Instruments | | Level 1 | | | Level 2 | | | Level 3 | | | Total | |
| Equity Securities: | | | | | | | | | | | | | | | | |
United States | | | $105,095,583 | | | | $— | | | | $3 | | | | $105,095,586 | |
United Kingdom | | | 796,266 | | | | — | | | | — | | | | 796,266 | |
Bermuda | | | 605,608 | | | | — | | | | — | | | | 605,608 | |
| Mutual Funds | | | 2,083,491 | | | | — | | | | — | | | | 2,083,491 | |
| Total | | | $108,580,948 | | | | $— | | | | $3 | | | | $108,580,951 | |
For further information regarding security characteristics, see the Portfolio of Investments.
The following is a reconciliation of level 3 assets for which significant unobservable inputs were used to determine fair value. The fund’s policy is to recognize transfers between the levels as of the end of the period. The table presents the activity of level 3 securities held at the beginning and the end of the period.
| | | | |
| | | Equity Securities | |
| Balance as of 12/31/16 | | | $3 | |
Change in unrealized appreciation (depreciation) | | | — | |
| Balance as of 12/31/17 | | | $3 | |
The net change in unrealized appreciation (depreciation) from investments still held as level 3 at December 31, 2017 is $0. At December 31, 2017, the fund held one level 3 security.
Security Loans – Under its Securities Lending Agency Agreement with the fund, State Street Bank and Trust Company (“State Street”), as lending agent, loans the securities of the fund to certain qualified institutions (the “Borrowers”) approved by the fund. Security loans can be terminated at the discretion of either the lending agent or the fund and the related securities must be returned within the earlier of the standard trade settlement period for such securities or within three business days. The loans are collateralized by cash and/or U.S. Treasury and federal agency obligations in an amount typically at least equal to the market value of the securities loaned. On loans collateralized by cash, the cash collateral is invested in a money market fund. The market value of the loaned securities is determined at the close of business of the fund and any additional required collateral is delivered to the fund on the next business day. State Street provides the fund with indemnification against Borrower default. In the event of Borrower default, State Street will, for the benefit of the fund, either purchase securities identical to those loaned or, when such purchase is commercially impracticable, pay the fund the market value of the loaned securities. In return, State Street assumes the fund’s rights to the related collateral. If the collateral value is less than the cost to purchase identical securities, State Street is responsible for the shortfall, but only to the extent that such shortfall is not due to a decline in collateral value resulting from collateral reinvestment for which the fund bears the risk of loss. At period end, the fund had investment securities on loan, all of which were classified as equity securities in the fund’s Portfolio of Investments, with a fair value of $1,341,195. The fair value of the fund’s investment securities on loan and a related liability of $1,238,961 for cash collateral received on securities loaned are both presented gross in the Statement of Assets and Liabilities. Additionally, these loans were collateralized by U.S. Treasury Obligations of $134,825. The collateral on securities loaned exceeded the value of securities on loan at period end. The liability for cash collateral for securities loaned is carried at fair value, which is categorized as level 2 within the fair value hierarchy. A portion of the income generated upon investment of the collateral is remitted to the Borrowers, and the remainder is allocated between the fund and the lending agent. On loans collateralized by U.S. Treasury and/or federal agency obligations, a fee is received from the Borrower, and is allocated between the fund and the lending agent. Income from securities lending is separately reported in the Statement of Operations. The dividend and interest income earned on the securities loaned is accounted for in the same manner as other dividend and interest income.
16
MFS Blended Research Small Cap Equity Portfolio
Notes to Financial Statements – continued
Indemnifications – Under the fund’s organizational documents, its officers and Trustees may be indemnified against certain liabilities and expenses arising out of the performance of their duties to the fund. Additionally, in the normal course of business, the fund enters into agreements with service providers that may contain indemnification clauses. The fund’s maximum exposure under these agreements is unknown as this would involve future claims that may be made against the fund that have not yet occurred.
Investment Transactions and Income – Investment transactions are recorded on the trade date. Interest income is recorded on the accrual basis. Dividends received in cash are recorded on the ex-dividend date. Certain dividends from foreign securities will be recorded when the fund is informed of the dividend if such information is obtained subsequent to the ex-dividend date. Dividend and interest payments received in additional securities are recorded on the ex-dividend or ex-interest date in an amount equal to the value of the security on such date.
The fund may receive proceeds from litigation settlements. Any proceeds received from litigation involving portfolio holdings are reflected in the Statement of Operations in realized gain/loss if the security has been disposed of by the fund or in unrealized gain/loss if the security is still held by the fund. Any other proceeds from litigation not related to portfolio holdings are reflected as other income in the Statement of Operations.
Tax Matters and Distributions – The fund intends to qualify as a regulated investment company, as defined under Subchapter M of the Internal Revenue Code, and to distribute all of its taxable income, including realized capital gains. As a result, no provision for federal income tax is required. The fund’s federal tax returns, when filed, will remain subject to examination by the Internal Revenue Service for a three year period. Management has analyzed the fund’s tax positions taken on federal and state tax returns for all open tax years and does not believe that there are any uncertain tax positions that require recognition of a tax liability. Foreign taxes, if any, have been accrued by the fund in the accompanying financial statements in accordance with the applicable foreign tax law. Foreign income taxes may be withheld by certain countries in which the fund invests. Additionally, capital gains realized by the fund on securities issued in or by certain foreign countries may be subject to capital gains tax imposed by those countries.
Distributions to shareholders are recorded on the ex-dividend date. Income and capital gain distributions are determined in accordance with income tax regulations, which may differ from U.S. generally accepted accounting principles. Certain capital accounts in the financial statements are periodically adjusted for permanent differences in order to reflect their tax character. These adjustments have no impact on net assets or net asset value per share. Temporary differences which arise from recognizing certain items of income, expense, gain or loss in different periods for financial statement and tax purposes will reverse at some time in the future. Distributions in excess of net investment income or net realized gains are temporary overdistributions for financial statement purposes resulting from differences in the recognition or classification of income or distributions for financial statement and tax purposes.
Book/tax differences primarily relate to wash sale loss deferrals.
The tax character of distributions declared to shareholders for the last two fiscal years is as follows:
| | | | | | | | |
| | | Year ended
12/31/17 | | | Year ended
12/31/16 | |
| Ordinary income (including any short-term capital gains) | | | $2,113,078 | | | | $1,047,437 | |
| Long-term capital gains | | | 10,061,073 | | | | 10,876,539 | |
| Total distributions | | | $12,174,151 | | | | $11,923,976 | |
The federal tax cost and the tax basis components of distributable earnings were as follows:
| | | | |
| As of 12/31/17 | | | | |
| Cost of investments | | | $89,909,477 | |
| Gross appreciation | | | 21,554,480 | |
| Gross depreciation | | | (2,883,006 | ) |
| Net unrealized appreciation (depreciation) | | | $18,671,474 | |
| Undistributed ordinary income | | | 2,612,841 | |
| Undistributed long-term capital gain | | | 10,270,925 | |
| Other temporary differences | | | 4,347 | |
Multiple Classes of Shares of Beneficial Interest – The fund offers multiple classes of shares, which differ in their respective distribution and/or service fees. The fund’s income, realized and unrealized gain (loss), and common expenses are allocated to shareholders based on the daily net assets of each class. Dividends are declared separately for each class. Differences in per share
17
MFS Blended Research Small Cap Equity Portfolio
Notes to Financial Statements – continued
dividend rates are generally due to differences in separate class expenses. The fund’s distributions declared to shareholders as reported in the Statements of Changes in Net Assets are presented by class as follows:
| | | | | | | | | | | | | | | | |
| | | From net investment
income | | | From net realized gain on
investments | |
| | | Year ended
12/31/17 | | | Year ended
12/31/16 | | | Year ended
12/31/17 | | | Year ended
12/31/16 | |
| Initial Class | | | $312,130 | | | | $332,420 | | | | $3,720,235 | | | | $2,827,655 | |
| Service Class | | | 451,881 | | | | 715,017 | | | | 7,689,905 | | | | 8,048,884 | |
| Total | | | $764,011 | | | | $1,047,437 | | | | $11,410,140 | | | | $10,876,539 | |
| (3) | | Transactions with Affiliates |
Investment Adviser – The fund has an investment advisory agreement with MFS to provide overall investment management and related administrative services and facilities to the fund. The management fee is computed daily and paid monthly at an annual rate of 0.40% of the fund’s average daily net assets.
MFS has agreed in writing to reduce its management fee by a specified amount if certain MFS mutual fund assets exceed thresholds agreed to by MFS and the fund’s Board of Trustees. For the year ended December 31, 2017, this management fee reduction amounted to $8,597, which is included in the reduction of total expenses in the Statement of Operations. The management fee incurred for the year ended December 31, 2017 was equivalent to an annual effective rate of 0.39% of the fund’s average daily net assets.
The investment adviser has agreed in writing to pay a portion of the fund’s total annual operating expenses, excluding interest, taxes, extraordinary expenses, brokerage and transaction costs, and investment-related expenses, such that total annual operating expenses do not exceed 0.60% of average daily net assets for the Initial Class shares and 0.85% of average daily net assets for the Service Class shares. This written agreement will continue until modified by the fund’s Board of Trustees, but such agreement will continue at least until April 30, 2019. For the year ended December 31, 2017, the fund’s actual operating expenses did not exceed the limit and therefore, the investment adviser did not pay any portion of the fund’s expenses related to this agreement.
Distributor – MFS Fund Distributors, Inc. (MFD), a wholly-owned subsidiary of MFS, is the distributor of shares of the fund. The Trustees have adopted a distribution plan for the Service Class shares pursuant to Rule 12b-1 under the Investment Company Act of 1940.
The fund’s distribution plan provides that the fund will pay MFD distribution and/or service fees equal to 0.25% per annum of its average daily net assets attributable to Service Class shares as partial consideration for services performed and expenses incurred by MFD and financial intermediaries (including participating insurance companies that invest in the fund to fund variable annuity and variable life insurance contracts, sponsors of qualified retirement and pension plans that invest in the fund, and affiliates of these participating insurance companies and plan sponsors) in connection with the sale and distribution of the Service Class shares. MFD may subsequently pay all, or a portion, of the distribution and/or service fees to financial intermediaries.
Shareholder Servicing Agent – MFS Service Center, Inc. (MFSC), a wholly-owned subsidiary of MFS, receives a fee from the fund for its services as shareholder servicing agent. For the year ended December 31, 2017, the fee was $7,707, which equated to 0.0072% annually of the fund’s average daily net assets. MFSC also receives payment from the fund for out-of-pocket expenses paid by MFSC on behalf of the fund. For the year ended December 31, 2017, these costs amounted to $991.
Administrator – MFS provides certain financial, legal, shareholder communications, compliance, and other administrative services to the fund. Under an administrative services agreement, the fund reimburses MFS the costs incurred to provide these services. The fund is charged an annual fixed amount of $17,500 plus a fee based on average daily net assets. The administrative services fee incurred for the year ended December 31, 2017 was equivalent to an annual effective rate of 0.0247% of the fund’s average daily net assets.
Trustees’ and Officers’ Compensation – The fund pays compensation to independent Trustees in the form of a retainer, attendance fees, and additional compensation to Board and Committee chairpersons. The fund does not pay compensation directly to Trustees or officers of the fund who are also officers of the investment adviser, all of whom receive remuneration for their services to the fund from MFS. Certain officers and Trustees of the fund are officers or directors of MFS, MFD, and MFSC.
Other – This fund and certain other funds managed by MFS (the funds) have entered into a service agreement (the ISO Agreement) which provides for payment of fees solely by the funds to Tarantino LLC in return for the provision of services of an Independent Senior Officer (ISO) for the funds. Frank L. Tarantino serves as the ISO and is an officer of the funds and the sole member of Tarantino LLC. The funds can terminate the ISO Agreement with Tarantino LLC at any time under the terms of the ISO Agreement. For the year ended December 31, 2017, the fee paid by the fund under this agreement was $190 and is included in “Miscellaneous” expense in the Statement of Operations. MFS has agreed to bear all expenses associated with office space, other administrative support, and supplies provided to the ISO.
18
MFS Blended Research Small Cap Equity Portfolio
Notes to Financial Statements – continued
The fund invests in the MFS Institutional Money Market Portfolio which is managed by MFS and seeks current income consistent with preservation of capital and liquidity. This money market fund does not pay a management fee to MFS.
For the year ended December 31, 2017, purchases and sales of investments, other than short-term obligations, aggregated $86,245,957 and $95,580,685, respectively.
| (5) | | Shares of Beneficial Interest |
The fund’s Declaration of Trust permits the Trustees to issue an unlimited number of full and fractional shares of beneficial interest. Transactions in fund shares were as follows:
| | | | | | | | | | | | | | | | |
| | | Year ended 12/31/17 | | | Year ended 12/31/16 | |
| | | Shares | | | Amount | | | Shares | | | Amount | |
| Shares sold | | | | | | | | | | | | | | | | |
Initial Class | | | 656,127 | | | | $8,983,200 | | | | 227,042 | | | | $2,906,832 | |
Service Class | | | 366,000 | | | | 4,715,043 | | | | 140,305 | | | | 1,746,230 | |
| | | 1,022,127 | | | | $13,698,243 | | | | 367,347 | | | | $4,653,062 | |
| Shares issued to shareholders in reinvestment of distributions | | | | | | | | | | | | | | | | |
Initial Class | | | 330,522 | | | | $4,032,365 | | | | 256,917 | | | | $3,160,075 | |
Service Class | | | 684,759 | | | | 8,141,786 | | | | 729,110 | | | | 8,763,901 | |
| | | 1,015,281 | | | | $12,174,151 | | | | 986,027 | | | | $11,923,976 | |
| Shares reacquired | | | | | | | | | | | | | | | | |
Initial Class | | | (470,190 | ) | | | $(6,195,645 | ) | | | (575,061 | ) | | | $(7,148,347 | ) |
Service Class | | | (1,373,684 | ) | | | (17,965,961 | ) | | | (1,990,124 | ) | | | (24,566,458 | ) |
| | | (1,843,874 | ) | | | $(24,161,606 | ) | | | (2,565,185 | ) | | | $(31,714,805 | ) |
| Net change | | | | | | | | | | | | | | | | |
Initial Class | | | 516,459 | | | | $6,819,920 | | | | (91,102 | ) | | | $(1,081,440 | ) |
Service Class | | | (322,925 | ) | | | (5,109,132 | ) | | | (1,120,709 | ) | | | (14,056,327 | ) |
| | | 193,534 | | | | $1,710,788 | | | | (1,211,811 | ) | | | $(15,137,767 | ) |
The fund and certain other funds managed by MFS participate in a $1.25 billion unsecured committed line of credit, subject to a $1 billion sublimit, provided by a syndication of banks under a credit agreement. Borrowings may be made for temporary financing needs. Interest is charged to each fund, based on its borrowings, generally at a rate equal to the higher of the Overnight Federal Reserve funds rate or daily one month LIBOR plus an agreed upon spread. A commitment fee, based on the average daily, unused portion of the committed line of credit, is allocated among the participating funds at the end of each calendar quarter. In addition, the fund and other funds managed by MFS have established unsecured uncommitted borrowing arrangements with certain banks for temporary financing needs. Interest is charged to each fund, based on its borrowings, at a rate equal to the Overnight Federal Reserve funds rate plus an agreed upon spread. For the year ended December 31, 2017, the fund’s commitment fee and interest expense were $717 and $0, respectively, and are included in “Miscellaneous” expense in the Statement of Operations.
| (7) | | Investments in Affiliated Issuers |
An affiliated issuer may be considered one in which the fund owns 5% or more of the outstanding voting securities, or a company which is under common control. For the purposes of this report, the fund assumes the following to be affiliated issuers:
| | | | | | | | | | | | | | | | | | |
| Affiliated Issuers | | | | Beginning
Shares/Par
Amount | | | Acquisitions
Shares/Par
Amount | | | Dispositions
Shares/Par
Amount | | | Ending
Shares/Par
Amount | |
| MFS Institutional Money Market Portfolio | | | | | 1,052,191 | | | | 27,806,514 | | | | (28,014,090 | ) | | | 844,615 | |
| | | | | |
| Affiliated Issuers | | Realized
Gain (Loss) | | Change in
Unrealized
Appreciation
(Depreciation) | | | Capital Gain
Distributions | | | Dividend
Income | | | Ending
Value | |
| MFS Institutional Money Market Portfolio | | $645 | | | $— | | | | $— | | | | $8,712 | | | | $844,530 | |
19
MFS Blended Research Small Cap Equity Portfolio
REPORT OF INDEPENDENT REGISTERED PUBLIC ACCOUNTING FIRM
To the Board of Trustees of MFS Variable Insurance Trust III and the Shareholders of
MFS Blended Research Small Cap Equity Portfolio:
Opinion on the Financial Statements and Financial Highlights
We have audited the accompanying statement of assets and liabilities of MFS Blended Research Small Cap Equity Portfolio (one of the series of MFS Variable Insurance Trust III) (the “Fund”), including the portfolio of investments, as of December 31, 2017, the related statement of operations for the year then ended, the statements of changes in net assets for each of the two years in the period then ended, the financial highlights for each of the five years in the period then ended, and the related notes. In our opinion, the financial statements and financial highlights present fairly, in all material respects, the financial position of the Fund as of December 31, 2017, and the results of its operations for the year then ended, the changes in its net assets for each of the two years in the period then ended, and the financial highlights for each of the five years in the period then ended, in conformity with accounting principles generally accepted in the United States of America.
Basis for Opinion
These financial statements and financial highlights are the responsibility of the Fund’s management. Our responsibility is to express an opinion on the Fund’s financial statements and financial highlights based on our audits. We are a public accounting firm registered with the Public Company Accounting Oversight Board (United States) (PCAOB) and are required to be independent with respect to the Fund in accordance with the U.S. federal securities laws and the applicable rules and regulations of the Securities and Exchange Commission and the PCAOB.
We conducted our audits in accordance with the standards of the PCAOB. Those standards require that we plan and perform the audit to obtain reasonable assurance about whether the financial statements and financial highlights are free of material misstatement, whether due to error or fraud. The Fund is not required to have, nor were we engaged to perform, an audit of its internal control over financial reporting. As part of our audits we are required to obtain an understanding of internal control over financial reporting but not for the purpose of expressing an opinion on the effectiveness of the Fund’s internal control over financial reporting. Accordingly, we express no such opinion.
Our audits included performing procedures to assess the risks of material misstatement of the financial statements and financial highlights, whether due to error or fraud, and performing procedures that respond to those risks. Such procedures included examining, on a test basis, evidence regarding the amounts and disclosures in the financial statements and financial highlights. Our audits also included evaluating the accounting principles used and significant estimates made by management, as well as evaluating the overall presentation of the financial statements and financial highlights. Our procedures included confirmation of securities owned as of December 31, 2017, by correspondence with the custodian and brokers. We believe that our audits provide a reasonable basis for our opinion.
DELOITTE & TOUCHE LLP
Boston, Massachusetts
February 15, 2018
We have served as the auditor of one or more of the MFS investment companies since 1924.
20
MFS Blended Research Small Cap Equity Portfolio
TRUSTEES AND OFFICERS – IDENTIFICATION AND BACKGROUND
The Trustees and Officers of the Trust, as of February 1, 2018, are listed below, together with their principal occupations during the past five years. (Their titles may have varied during that period.) The address of each Trustee and Officer is 111 Huntington Avenue, Boston, Massachusetts 02199-7618.
| | | | | | | | | | |
Name, Age | | Position(s)
Held with Fund | | Trustee/Officer
Since (h) | | Number of
MFS Funds
overseen by the
Trustee | | Principal Occupations
During the Past Five Years | | Other Directorships
During the Past Five Years (j) |
| INTERESTED TRUSTEES |
Robert J. Manning (k) (age 54) | | Trustee | | February 2004 | | 137 | | Massachusetts Financial Services Company, Executive Chairman (since January 2017); Director; Chairman of the Board; Chief Executive Officer (until 2015); Co-Chief Executive Officer (2015-2016) | | N/A |
| | | | | |
Robin A. Stelmach (k) (age 56) | | Trustee | | January 2014 | | 137 | | Massachusetts Financial Services Company, Vice Chair (since January 2017); Chief Operating Officer and Executive Vice President (until January 2017) | | N/A |
| | | | |
| INDEPENDENT TRUSTEES | | | | | | | | |
John P. Kavanaugh (age 63) | | Trustee and Chair of Trustees | | January 2009 | | 137 | | Private investor | | N/A |
| | | | | |
Steven E. Buller (age 66) | | Trustee | | February 2014 | | 137 | | Financial Accounting Standards Advisory Council, Chairman (2014-2015); Public Company Accounting Oversight Board, Standing Advisory Group, Member (until 2014); BlackRock, Inc. (investment management), Managing Director (until 2014), BlackRock Finco UK (investment management), Director (until 2014) | | N/A |
| | | | | |
John A. Caroselli (age 63) | | Trustee | | March 2017 | | 137 | | JC Global Advisors, LLC (management consulting), President (since 2015); First Capital Corporation (commercial finance), Executive Vice President (until 2015) | | N/A |
| | | | | |
Maureen R. Goldfarb (age 62) | | Trustee | | January 2009 | | 137 | | Private investor | | N/A |
| | | | | |
Michael Hegarty (age 73) | | Trustee | | December 2004 | | 137 | | Private investor | | Rouse Properties Inc., Director (until 2016); Capmark Financial Group Inc., Director (until 2015) |
| | | | | |
Clarence Otis, Jr. (age 61) | | Trustee | | March 2017 | | 137 | | Darden Restaurants, Inc., Chief Executive Officer (until 2014) | | VF Corporation, Director; Verizon Communications, Inc., Director; The Travelers Companies, Director; Federal Reserve Bank of Atlanta, Director (until 2015) |
| | | | | |
Maryanne L. Roepke (age 61) | | Trustee | | May 2014 | | 137 | | American Century Investments (investment management), Senior Vice President and Chief Compliance Officer (until 2014) | | N/A |
| | | | | |
Laurie J. Thomsen (age 60) | | Trustee | | March 2005 | | 137 | | Private investor | | The Travelers Companies, Director; Dycom Industries, Inc., Director (since 2015) |
21
MFS Blended Research Small Cap Equity Portfolio
Trustees and Officers – continued
| | | | | | | | |
Name, Age | | Position(s)
Held with Fund | | Trustee/Officer
Since (h) | | Number of
MFS Funds
for which the
Person is an
Officer | | Principal Occupations During the Past Five Years |
| OFFICERS | | | | | | | | |
Christopher R. Bohane (k) (age 44) | | Assistant Secretary and Assistant Clerk | | July 2005 | | 137 | | Massachusetts Financial Services Company, Vice President and Assistant General Counsel |
| | | | |
Kino Clark (k) (age 49) | | Assistant Treasurer | | January 2012 | | 137 | | Massachusetts Financial Services Company, Vice President |
| | | | |
John W. Clark, Jr. (k) (age 50) | | Assistant Treasurer | | April 2017 | | 137 | | Massachusetts Financial Services Company, Vice President (since March 2017); Deutsche Bank (financial services), Department Head – Treasurer’s Office (until February 2017) |
| | | | |
Thomas H. Connors (k) (age 58) | | Assistant Secretary and Assistant Clerk | | September 2012 | | 137 | | Massachusetts Financial Services Company, Vice President and Senior Counsel |
| | | | |
Ethan D. Corey (k) (age 54) | | Assistant Secretary and Assistant Clerk | | July 2005 | | 137 | | Massachusetts Financial Services Company, Senior Vice President and Associate General Counsel |
| | | | |
David L. DiLorenzo (k) (age 49) | | President | | July 2005 | | 137 | | Massachusetts Financial Services Company, Senior Vice President |
| | | | |
Heidi W. Hardin (k) (age 50) | | Secretary and Clerk | | April 2017 | | 137 | | Massachusetts Financial Services Company, Executive Vice President and General Counsel (since March 2017); Harris Associates (investment management), General Counsel (from September 2015 to January 2017); Janus Capital Management LLC (investment management), Senior Vice President and General Counsel (until September 2015) |
| | | | |
Brian E. Langenfeld (k) (age 44) | | Assistant Secretary and Assistant Clerk | | June 2006 | | 137 | | Massachusetts Financial Services Company, Vice President and Senior Counsel |
| | | | |
Susan A. Pereira (k) (age 47) | | Assistant Secretary and Assistant Clerk | | July 2005 | | 137 | | Massachusetts Financial Services Company, Vice President and Senior Counsel |
| | | | |
Kasey L. Phillips (k) (age 47) | | Assistant Treasurer | | September 2012 | | 137 | | Massachusetts Financial Services Company, Vice President |
| | | | |
Matthew A. Stowe (k) (age 43) | | Assistant Secretary and Assistant Clerk | | October 2014 | | 137 | | Massachusetts Financial Services Company, Vice President and Assistant General Counsel |
| | | | |
Frank L. Tarantino (age 73) | | Independent Senior Officer | | June 2004 | | 137 | | Tarantino LLC (provider of compliance services), Principal |
| | | | |
Richard S. Weitzel (k) (age 47) | | Assistant Secretary and Assistant Clerk | | October 2007 | | 137 | | Massachusetts Financial Services Company, Senior Vice President and Associate General Counsel |
| | | | |
Martin J. Wolin (k) (age 50) | | Chief Compliance Officer | | July 2015 | | 137 | | Massachusetts Financial Services Company, Senior Vice President and Chief Compliance Officer (since July 2015); Mercer (financial service provider), Chief Risk and Compliance Officer, North America and Latin America (until June 2015) |
| | | | |
James O. Yost (k) (age 57) | | Treasurer | | September 1990 | | 137 | | Massachusetts Financial Services Company, Senior Vice President |
| (h) | Date first appointed to serve as Trustee/officer of an MFS Fund. Each Trustee has served continuously since appointment unless indicated otherwise. For the period from December 15, 2004 until February 22, 2005, Mr. Manning served as Advisory Trustee. Prior to January 2012, Messrs. DiLorenzo and Yost served as Assistant Treasurers of the Funds. From January 2012 through December 2016, Messrs. DiLorenzo and Yost served as Treasurer and Deputy Treasurer of the Funds, respectively. |
| (j) | Directorships or trusteeships of companies required to report to the Securities and Exchange Commission (i.e., “public companies”). |
| (k) | “Interested person” of the Trust within the meaning of the Investment Company Act of 1940 (referred to as the 1940 Act), which is the principal federal law governing investment companies like the fund, as a result of a position with MFS. The address of MFS is 111 Huntington Avenue, Boston, Massachusetts 02199-7618. |
22
MFS Blended Research Small Cap Equity Portfolio
Trustees and Officers – continued
Each Trustee has been elected by shareholders and each Trustee and officer holds office until his or her successor is chosen and qualified or until his or her earlier death, resignation, retirement or removal. The Trust does not hold annual meetings for the purpose of electing Trustees, and Trustees are not elected for fixed terms. Under the terms of the Board’s retirement policy, an Independent Trustee shall retire at the end of the calendar year in which he or she reaches the earlier of 75 years of age or 15 years of service on the Board (or, in the case of any Independent Trustee who joined the Board prior to 2015, 20 years of service on the Board).
Messrs. Buller and Otis and Ms. Roepke are members of the Trust’s Audit Committee.
Each of the Interested Trustees and certain Officers hold comparable officer positions with certain affiliates of MFS.
The Statement of Additional Information for a Fund includes further information about the Trustees and is available without charge upon request by calling 1-800-225-2606.
| | |
Investment Adviser Massachusetts Financial Services Company 111 Huntington Avenue Boston, MA 02199-7618 | | Custodian State Street Bank and Trust Company 1 Lincoln Street Boston, MA 02111-2900 |
Distributor MFS Fund Distributors, Inc. 111 Huntington Avenue Boston, MA 02199-7618 | | Independent Registered Public Accounting Firm Deloitte & Touche LLP 200 Berkeley Street Boston, MA 02116 |
Portfolio Manager(s) Jim Fallon Matt Krummell Jonathan Sage Jed Stocks | | |
23
MFS Blended Research Small Cap Equity Portfolio
BOARD REVIEW OF INVESTMENT ADVISORY AGREEMENT
The Investment Company Act of 1940 requires that both the full Board of Trustees and a majority of the non-interested (“independent”) Trustees, voting separately, annually approve the continuation of the Fund’s investment advisory agreement with MFS. The Trustees consider matters bearing on the Fund and its advisory arrangements at their meetings throughout the year, including a review of performance data at each regular meeting. In addition, the independent Trustees met several times over the course of three months beginning in May and ending in July, 2017 (“contract review meetings”) for the specific purpose of considering whether to approve the continuation of the investment advisory agreement for the Fund and the other investment companies that the Board oversees (the “MFS Funds”). The independent Trustees were assisted in their evaluation of the Fund’s investment advisory agreement by independent legal counsel, from whom they received separate legal advice and with whom they met separately from MFS during various contract review meetings. The independent Trustees were also assisted in this process by the MFS Funds’ Independent Senior Officer, a senior officer appointed by and reporting to the independent Trustees.
In connection with their deliberations regarding the continuation of the investment advisory agreement, the Trustees, including the independent Trustees, considered such information and factors as they believed, in light of the legal advice furnished to them and their own business judgment, to be relevant. The investment advisory agreement for the Fund was considered separately, although the Trustees also took into account the common interests of all MFS Funds in their review. As described below, the Trustees considered the nature, quality, and extent of the various investment advisory, administrative, and shareholder services performed by MFS under the existing investment advisory agreement and other arrangements with the Fund.
In connection with their contract review meetings, the Trustees received and relied upon materials that included, among other items: (i) information provided by Broadridge Financial Solutions, Inc. (“Broadridge”), an independent third party, on the investment performance of the Fund for various time periods ended December 31, 2016 and the investment performance of a group of funds with substantially similar investment classifications/objectives (the “Lipper performance universe”), (ii) information provided by Broadridge on the Fund’s advisory fees and other expenses and the advisory fees and other expenses of comparable funds identified by Broadridge (the “Broadridge expense group”), (iii) information provided by MFS on the advisory fees of portfolios of other clients of MFS, including institutional separate accounts and other clients, (iv) information as to whether and to what extent applicable expense waivers, reimbursements or fee “breakpoints” are observed for the Fund, (v) information regarding MFS’ financial results and financial condition, including MFS’ and certain of its affiliates’ estimated profitability from services performed for the Fund and the MFS Funds as a whole, and compared to MFS’ institutional business, (vi) MFS’ views regarding the outlook for the mutual fund industry and the strategic business plans of MFS, (vii) descriptions of various functions performed by MFS for the Funds, such as compliance monitoring and portfolio trading practices, and (viii) information regarding the overall organization of MFS, including information about MFS’ senior management and other personnel providing investment advisory, administrative and other services to the Fund and the other MFS Funds. The comparative performance, fee and expense information prepared and provided by Broadridge was not independently verified and the independent Trustees did not independently verify any information provided to them by MFS.
The Trustees’ conclusion as to the continuation of the investment advisory agreement was based on a comprehensive consideration of all information provided to the Trustees and not the result of any single factor. Some of the factors that figured particularly in the Trustees’ deliberations are described below, although individual Trustees may have evaluated the information presented differently from one another, giving different weights to various factors. It is also important to recognize that the fee arrangements for the Fund and other MFS Funds are the result of years of review and discussion between the independent Trustees and MFS, that certain aspects of such arrangements may receive greater scrutiny in some years than in others, and that the Trustees’ conclusions may be based, in part, on their consideration of these same arrangements during the course of the year and in prior years.
Based on information provided by Broadridge and MFS, the Trustees reviewed the Fund’s total return investment performance as well as the performance of peer groups of funds over various time periods. The Trustees placed particular emphasis on the total return performance of the Fund’s Initial Class shares in comparison to the performance of funds in its Lipper performance universe over the three-year period ended December 31, 2016, which the Trustees believed was a long enough period to reflect differing market conditions. The total return performance of the Fund’s Initial Class shares was in the 2nd quintile relative to the other funds in the universe for this three-year period (the 1st quintile being the best performers and the 5th quintile being the worst performers). The total return performance of the Fund’s Initial Class shares was in the 3rd quintile for the one-year period and the 1st quintile for the five-year period ended December 31, 2016 relative to the Lipper performance universe. Because of the passage of time, these performance results may differ from the performance results for more recent periods, including those shown elsewhere in this report.
In the course of their deliberations, the Trustees took into account information provided by MFS in connection with the contract review meetings, as well as during investment review meetings conducted with portfolio management personnel during the course of the year regarding the Fund’s performance. After reviewing these and related factors, the Trustees concluded, within the context of their overall conclusions regarding the investment advisory agreement, that they were satisfied with MFS’ responses and efforts relating to investment performance.
24
MFS Blended Research Small Cap Equity Portfolio
Board Review of Investment Advisory Agreement – continued
In assessing the reasonableness of the Fund’s advisory fee, the Trustees considered, among other information, the Fund’s advisory fee and the total expense ratio of the Fund’s Initial Class shares as a percentage of average daily net assets and the advisory fee and total expense ratios of peer groups of funds based on information provided by Broadridge. The Trustees considered that MFS currently observes an expense limitation for the Fund, which may not be changed without the Trustees’ approval. The Trustees also considered that, according to the data provided by Broadridge (which takes into account any fee reductions or expense limitations that were in effect during the Fund’s last fiscal year), the Fund’s effective advisory fee rate and total expense ratio were each lower than the Broadridge expense group median.
The Trustees also considered the advisory fees charged by MFS to any institutional separate accounts advised by MFS (“separate accounts”) and unaffiliated investment companies for which MFS serves as subadviser (“subadvised funds”) that have comparable investment strategies to the Fund, if any. In comparing these fees, the Trustees considered information provided by MFS as to the generally broader scope of services provided by MFS to the Fund, as well as the more extensive regulatory burdens imposed on MFS in managing the Fund, in comparison to separate accounts and subadvised funds. The Trustees also considered the higher demands placed on MFS’ investment personnel and trading infrastructure as a result of the daily cash in-flows and out-flows of the Fund in comparison to separate accounts.
The Trustees also considered whether the Fund may benefit from any economies of scale in the management of the Fund in the event of growth in assets of the Fund and/or growth in assets of the MFS Funds as a whole. They noted that the Fund’s advisory fee rate schedule is not subject to any breakpoints. Taking into account the expense limitation noted above, the Trustees determined not to recommend any advisory fee breakpoints for the Fund at this time. The Trustees also noted that MFS has agreed in writing to waive a portion of the management fees of certain MFS Funds, including the Fund, if the total combined assets of certain funds within the MFS Funds’ complex increase above agreed upon thresholds (the “group fee waiver”), enabling the Fund’s shareholders to share in the benefits from any economies of scale at the complex level. The group fee waiver is reviewed and renewed annually between the Board and MFS. The Trustees concluded that the group fee waiver was sufficient to allow the Fund to benefit from economies of scale as its assets and overall complex assets grow.
The Trustees also considered information prepared by MFS relating to MFS’ costs and profits with respect to the Fund, the MFS Funds considered as a group, and other investment companies and accounts advised by MFS, as well as MFS’ methodologies used to determine and allocate its costs to the MFS Funds, the Fund and other accounts and products for purposes of estimating profitability.
After reviewing these and other factors described herein, the Trustees concluded, within the context of their overall conclusions regarding the investment advisory agreement, that the advisory fees charged to the Fund represent reasonable compensation in light of the services being provided by MFS to the Fund.
In addition, the Trustees considered MFS’ resources and related efforts to continue to retain, attract and motivate capable personnel to serve the Fund. The Trustees also considered current and developing conditions in the financial services industry, including the presence of large and well-capitalized companies which are spending, and appear to be prepared to continue to spend, substantial sums to engage personnel and to provide services to competing investment companies. In this regard, the Trustees also considered the financial resources of MFS and its ultimate parent, Sun Life Financial Inc. The Trustees also considered the advantages and possible disadvantages to the Fund of having an adviser that also serves other investment companies as well as other accounts.
The Trustees also considered the nature, quality, cost, and extent of administrative, transfer agency, and distribution services provided to the Fund by MFS and its affiliates under agreements and plans other than the investment advisory agreement, including any 12b-1 fees the Fund pays to MFS Fund Distributors, Inc., an affiliate of MFS. The Trustees also considered the nature, extent and quality of certain other services MFS performs or arranges for on the Fund’s behalf, which may include securities lending programs, directed expense payment programs, class action recovery programs, and MFS’ interaction with third-party service providers, principally custodians and sub-custodians. The Trustees concluded that the various non-advisory services provided by MFS and its affiliates on behalf of the Fund were satisfactory.
The Trustees also considered benefits to MFS from the use of the Fund’s portfolio brokerage commissions, if applicable, to pay for investment research and various other factors. Additionally, the Trustees considered so-called “fall-out benefits” to MFS such as reputational value derived from serving as investment manager to the Fund.
Based on their evaluation of factors that they deemed to be material, including those factors described above, the Board of Trustees, including the independent Trustees, concluded that the Fund’s investment advisory agreement with MFS should be continued for an additional one-year period, commencing August 1, 2017.
25
MFS Blended Research Small Cap Equity Portfolio
PROXY VOTING POLICIES AND INFORMATION
MFS votes proxies on behalf of the fund pursuant to proxy voting policies and procedures that are available without charge, upon request, by calling 1-800-225-2606, by visiting mfs.com/proxyvoting, or by visiting the SEC’s Web site at http://www.sec.gov.
Information regarding how the fund voted proxies relating to portfolio securities during the most recent twelve-month period ended June 30 is available by August 31 of each year without charge by visiting mfs.com/proxyvoting, or by visiting the SEC’s Web site at http://www.sec.gov.
QUARTERLY PORTFOLIO DISCLOSURE
The fund will file a complete schedule of portfolio holdings with the Securities and Exchange Commission (the Commission) for the first and third quarters of each fiscal year on Form N-Q. The fund’s Form N-Q is available on the EDGAR database on the Commission’s Internet Web site at http://www.sec.gov, and may be reviewed and copied at the:
Public Reference Room
Securities and Exchange Commission
100 F Street, NE, Room 1580
Washington, D.C. 20549
Information on the operation of the Public Reference Room may be obtained by calling the Commission at 1-800-SEC-0330. Copies of the fund’s Form N-Q also may be obtained, upon payment of a duplicating fee, by electronic request at the following e-mail address: publicinfo@sec.gov or by writing the Public Reference Section at the above address.
FURTHER INFORMATION
From time to time, MFS may post important information about the fund or the MFS funds on the MFS web site (mfs.com). This information is available at https://www.mfs.com/en-us/what-we-do/announcements.html or at mfs.com/vit3 by choosing the fund’s name.
INFORMATION ABOUT FUND CONTRACTS AND LEGAL CLAIMS
The fund has entered into contractual arrangements with an investment adviser, administrator, distributor, shareholder servicing agent, 529 program manager (if applicable), and custodian who each provide services to the fund. Unless expressly stated otherwise, shareholders are not parties to, or intended beneficiaries of these contractual arrangements, and these contractual arrangements are not intended to create any shareholder right to enforce them against the service providers or to seek any remedy under them against the service providers, either directly or on behalf of the fund.
Under the Trust’s By-Laws and Declaration of Trust, any claims asserted against or on behalf of the MFS Funds, including claims against Trustees and Officers, must be brought in state and federal courts located within the Commonwealth of Massachusetts.
FEDERAL TAX INFORMATION (unaudited)
The following information is provided pursuant to provisions of the Internal Revenue Code.
The fund designates $11,068,000 as capital gain dividends paid during the fiscal year.
For corporate shareholders, 39.11% of the ordinary income dividends paid during the fiscal year qualify for the corporate dividends received deduction.
26
rev. 3/16
| | | | |
| FACTS | | WHAT DOES MFS DO WITH YOUR
PERSONAL INFORMATION? | |  |
| | |
| Why? | | Financial companies choose how they share your personal information. Federal law gives consumers the right to limit some but not all sharing. Federal law also requires us to tell you how we collect, share, and protect your personal information. Please read this notice carefully to understand what we do. |
| | |
| What? | | The types of personal information we collect and share depend on the product or service you have with us. This information can include: • Social Security number and account balances • Account transactions and transaction history • Checking account information and wire transfer instructions When you are no longer our customer, we continue to share your information as described in this notice. |
| | |
| How? | | All financial companies need to share customers’ personal information to run their everyday business. In the section below, we list the reasons financial companies can share their customers’ personal information; the reasons MFS chooses to share; and whether you can limit this sharing. |
| | | | |
Reasons we can share your
personal information | | Does MFS share? | | Can you limit this
sharing? |
For our everyday business purposes – such as to process your transactions, maintain your account(s), respond to court orders and legal investigations, or report to credit bureaus | | Yes | | No |
For our marketing purposes – to offer our products and services to you | | No | | We don’t share |
| For joint marketing with other financial companies | | No | | We don’t share |
For our affiliates’ everyday business purposes – information about your transactions and experiences | | No | | We don’t share |
For our affiliates’ everyday business purposes – information about your creditworthiness | | No | | We don’t share |
| For nonaffiliates to market to you | | No | | We don’t share |
| | |
| Questions? | | Call 800-225-2606 or go to mfs.com. |
27
| | |
| Who we are |
| Who is providing this notice? | | MFS Funds, MFS Investment Management, MFS Institutional Advisors, Inc., and MFS Heritage Trust Company. |
| | |
| What we do |
| How does MFS protect my personal information? | | To protect your personal information from unauthorized access and use, we use security measures that comply with federal law. These measures include procedural, electronic, and physical safeguards for the protection of the personal information we collect about you. |
How does MFS
collect my personal information? | | We collect your personal information, for example, when you • open an account or provide account information • direct us to buy securities or direct us to sell your securities • make a wire transfer We also collect your personal information from others, such as credit bureaus, affiliates, or other companies. |
| Why can’t I limit all sharing? | | Federal law gives you the right to limit only • sharing for affiliates’ everyday business purposes – information about your creditworthiness • affiliates from using your information to market to you • sharing for nonaffiliates to market to you State laws and individual companies may give you additional rights to limit sharing. |
| | |
| Definitions |
| Affiliates | | Companies related by common ownership or control. They can be financial and nonfinancial companies. • MFS does not share personal information with affiliates, except for everyday business purposes as described on page one of this notice. |
| Nonaffiliates | | Companies not related by common ownership or control. They can be financial and nonfinancial companies. • MFS does not share with nonaffiliates so they can market to you. |
| Joint marketing | | A formal agreement between nonaffiliated financial companies that together market financial products or services to you. • MFS doesn’t jointly market. |
| | |
| Other important information |
| If you own an MFS product or receive an MFS service in the name of a third party such as a bank or broker-dealer, their privacy policy may apply to you instead of ours. |
28
ANNUAL REPORT
December 31, 2017

MFS® CONSERVATIVE ALLOCATION PORTFOLIO
MFS® Variable Insurance Trust III

VCA-ANN
MFS® CONSERVATIVE ALLOCATION PORTFOLIO
CONTENTS
The report is prepared for the general information of contract owners. It is authorized for distribution to prospective investors only when preceded or accompanied by a current prospectus.
NOT FDIC INSURED • MAY LOSE VALUE • NO BANK OR CREDIT UNION GUARANTEE • NOT A DEPOSIT • NOT INSURED BY ANY FEDERAL GOVERNMENT AGENCY OR NCUA/NCUSIF
MFS Conservative Allocation Portfolio
LETTER FROM THE EXECUTIVE CHAIRMAN

Dear Contract Owners:
Rising bond yields have led to a measurable uptick in market volatility, which has been a departure from the low-volatility environment that prevailed for much of 2017. In spite of this, global markets remain elevated amid synchronized economic growth. Although the U.S. Federal Reserve continues to gradually raise interest rates and shrink its balance sheet, monetary policy remains accommodative around the world, with many central banks taking only tentative steps toward tighter policies. However, interest rates have begun to rise globally of late as investors anticipate that central policy shifts may be necessary in the months ahead.
Newly enacted U.S. tax reforms have been welcomed by equity markets while emerging market economies have been boosted by a weaker U.S. dollar. Around the world, inflation remains largely subdued but tight labor markets and solid global demand have investors on the lookout for its potential resurgence amid robust global trade and recovering commodity prices.
At MFS®, we believe having a disciplined, long-term investment approach through a full market cycle is essential to capturing the best opportunities while also managing risk. In our view, such a strategy, along with the professional guidance of a financial advisor, will help you reach your investment objectives.
Respectfully,

Robert J. Manning
Executive Chairman
MFS Investment Management
February 15, 2018
The opinions expressed in this letter are subject to change and may not be relied upon for investment advice. No forecasts can be guaranteed.
1
MFS Conservative Allocation Portfolio
PORTFOLIO COMPOSITION
Portfolio target allocation
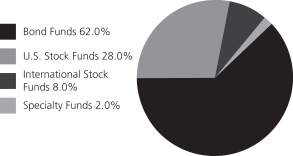
| | | | |
| Portfolio holdings | | | | |
| MFS Total Return Bond Series | | | 17.0% | |
| MFS Limited Maturity Portfolio | | | 11.9% | |
| MFS Inflation-Adjusted Bond Portfolio | | | 10.0% | |
| MFS Government Securities Portfolio | | | 10.0% | |
| MFS Global Governments Portfolio | | | 8.0% | |
| MFS Value Series | | | 6.0% | |
| MFS Research Series | | | 5.9% | |
| MFS Growth Series | | | 5.9% | |
| MFS High Yield Portfolio | | | 5.0% | |
| MFS Research International Portfolio | | | 4.0% | |
| MFS Mid Cap Growth Series | | | 4.0% | |
| MFS Mid Cap Value Portfolio | | | 4.0% | |
| MFS International Growth Portfolio | | | 2.0% | |
| MFS International Value Portfolio | | | 2.0% | |
| MFS Global Real Estate Portfolio | | | 2.0% | |
| MFS New Discovery Value Portfolio | | | 1.0% | |
| MFS New Discovery Series | | | 1.0% | |
| Cash & Cash Equivalents | | | 0.3% | |
Portfolio actual allocation
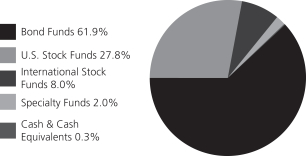
Cash & Cash Equivalents includes any cash, investments in money market funds, short-term securities, and other assets less liabilities. MFS endeavors to fully invest all MFS funds-of-funds in underlying funds on a daily basis. Any divergence from 0.0% in Cash & Cash Equivalents is typically due to the timing of fund subscriptions/redemptions and the settlement of subsequent investment in/divestment from the underlying funds. While the MFS funds-of-funds’ subscriptions/redemptions are processed at the same day NAV of the underlying funds, a positive/negative cash balance will be reflected on the MFS funds-of-funds’ Statement of Assets and Liabilities until the trades with the underlying funds settle. Please see the Statement of Assets and Liabilities for additional information related to the fund’s cash position and other assets and liabilities.
Percentages are based on net assets as of December 31, 2017.
The portfolio is actively managed and current holdings may be different.
2
MFS Conservative Allocation Portfolio
MANAGEMENT REVIEW
Summary of Results
For the twelve months ended December 31, 2017, Initial Class shares of the MFS Conservative Allocation Portfolio (“fund”) provided a total return of 11.48%, while Service Class shares of the fund provided a total return of 11.24%. These compare with a return of 3.54% for the fund’s benchmark, the Bloomberg Barclays U.S. Aggregate Bond Index. The fund’s other benchmark, the MFS Conservative Allocation Portfolio Blended Index (“Blended Index”), generated a return of 10.21%. The Blended Index reflects the blended returns of various equity and fixed income market indices, with percentage allocations to each index designed to resemble the allocations of the fund. The market indices and related percentage allocations used to compile the Blended Index are set forth in the Performance Summary.
Market Environment
For the first time in many years, the global economy experienced a period of synchronized economic growth over the reporting period. The rebound in emerging markets (“EM”) economies was more pronounced (despite the slight deceleration in Chinese growth at the end of the period), helped by larger economies, such as Brazil and Russia, emerging from recessions. At the same time, developed markets (“DM”) economies continued to grow at or above potential. Market confidence increased in the US during the period fueled, in part, by a more lenient US regulatory backdrop and hopes for a significant cut in corporate tax rates, which came to fruition at the end of the period.
Globally, markets benefited from a reflation trade as commodity prices strengthened, activity and growth prospects improved, and inflation moved higher, though within moderate bounds. As a result, there were more tightening signals and actions by DM central banks. The US Federal Reserve increased interest rates by 25 basis points three times during the period, bringing the total number of quarter-percent hikes in the federal funds rate to five, since December 2015. The European Central Bank announced an extension of its quantitative easing program at the end of the period, but reduced the pace of its monthly asset purchases by half. In addition, the Bank of England hiked its base rate for the first time in a decade, late in the end of the period. Markets were comforted, along with central banks, by the decline in fears of a populist surge in Europe after establishment candidates won the Dutch and French elections, though a right-wing populist party gained seats in the German parliament for the first time in the post-World War II era. Additionally, European growth reflected a generally calmer political economic backdrop.
In recent months, the US dollar reversed the sharp rise seen early in the period, easing what had been a substantial headwind to earnings for multinationals. US consumer spending held up well during the second half of the period amid a modest increase in real wages and relatively low gasoline prices. However, demand for autos cooled from the record level logged early in the period, while the housing market improved, albeit constrained by below-average inventory levels. Global trade, which was sluggish early in the period, showed signs of improvement in the period’s second half, a positive indicator of global economic activity and prospects. Early in the period, there was a selloff in EM due to fears that President Trump would follow through on various campaign threats and promises that were judged to be detrimental to EM. While President Trump withdrew the US from the Trans-Pacific Partnership and began the renegotiation of the North American Free Trade Agreement, significant additional policy action was lacking on economic issues involving EM. As a result, EM resumed their upward trajectory, powered by strong inflows throughout 2017.
Factors Affecting Performance
During the reporting period, the fund outperformed both the Bloomberg Barclays U.S. Aggregate Bond Index and the Blended Index.
Relative to the Blended Index, the fixed income asset class was a primary contributor to performance. The fund’s allocation to the MFS Inflation-Adjusted Bond Portfolio and MFS Global Governments Portfolio benefited relative performance, as global markets in US dollar terms, performed well over the reporting period. Additionally, the fund’s allocation to the MFS High Yield Portfolio also strengthened relative returns, as credit markets outperformed the broad Bloomberg Barclays U.S. Aggregate Bond Index. Conversely, the fund’s exposure to the MFS Limited Maturity Portfolio and MFS Government Securities Portfolio, which underperformed the Bloomberg Barclays U.S. Aggregate Bond Index, held back relative performance.
The U.S. equity asset class benefited relative returns, led by strong active performance across most of the fund’s underlying portfolios, with the MFS Mid Cap Value Portfolio a notable standout. Although the fund’s diversification down the market capitalization spectrum held back relative performance, this was more than offset by the positive relative performance of the fund’s underlying US equity portfolios.
The international equity segment was another positive factor for relative performance, as the MFS Research International Portfolio and the MFS International Value Portfolio outperformed their respective benchmarks during the reporting period.
3
MFS Conservative Allocation Portfolio
Management Review – continued
Respectfully,
Portfolio Manager(s)
Joseph Flaherty
The views expressed in this report are those of the portfolio manager(s) only through the end of the period of the report as stated on the cover and do not necessarily reflect the views of MFS or any other person in the MFS organization. These views are subject to change at any time based on market or other conditions, and MFS disclaims any responsibility to update such views. These views may not be relied upon as investment advice or an indication of trading intent on behalf of any MFS portfolio. References to specific securities are not recommendations of such securities, and may not be representative of any MFS portfolio’s current or future investments.
4
MFS Conservative Allocation Portfolio
PERFORMANCE SUMMARY THROUGH 12/31/17
The following chart illustrates the historical performance of the fund in comparison to its benchmark(s). Benchmarks are unmanaged and may not be invested in directly. Benchmark returns do not reflect any fees or expenses. The performance of other share classes will be greater than or less than that of the class depicted below. (See Notes to Performance Summary.)
Performance data shown represents past performance and is no guarantee of future results. Investment return and principal value fluctuate so your units, when sold, may be worth more or less than the original cost; current performance may be lower or higher than quoted. The performance shown does not reflect the deduction of taxes, if any, that a contract holder would pay on fund distributions or the redemption of contract units. The returns for the fund shown also do not reflect the deduction of expenses associated with variable products, such as mortality and expense risk charges, separate account charges, and sales charges imposed by the insurance company separate accounts. Such expenses would reduce the overall returns shown.
Growth of a Hypothetical $10,000 Investment (t)
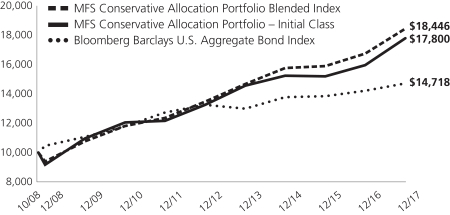
Total Returns through 12/31/17
Average annual total returns
| | | | | | | | | | | | |
| | | Share Class | | Class Inception Date | | 1-yr | | 5-yr | | Life (t) | | |
| | | Initial Class | | 10/01/08 | | 11.48% | | 6.07% | | 6.43% | | |
| | | Service Class | | 10/01/08 | | 11.24% | | 5.80% | | 6.17% | | |
| | | | |
| Comparative benchmark(s) | | | | | | | | |
| | | Bloomberg Barclays U.S. Aggregate Bond Index (f) | | 3.54% | | 2.10% | | 4.26% | | |
| | | MFS Conservative Allocation Portfolio Blended Index (f)(w) | | 10.21% | | 6.47% | | 6.84% | | |
| | | FTSE EPRA/NAREIT Developed Real Estate Index (net div) (f) | | 10.36% | | 6.32% | | 6.53% | | |
| | | MSCI EAFE Index (net div) (f) | | | | 25.03% | | 7.90% | | 5.99% | | |
| | | Standard & Poor’s 500 Stock Index (f) | | | | 21.83% | | 15.79% | | 11.77% | | |
| (f) | | Source: FactSet Research Systems Inc. |
| (t) | | For the period from the class inception date through the stated period end. (See Notes to Performance Summary.) |
| (w) | | As of December 31, 2017, the MFS Conservative Allocation Portfolio Blended Index was comprised of 62% Bloomberg Barclays U.S. Aggregate Bond Index, 28% Standard & Poor’s 500 Stock Index, 8% MSCI EAFE Index (net div), and 2% FTSE EPRA/NAREIT Developed Real Estate Index (net div). |
Benchmark Definition(s)
Bloomberg Barclays U.S. Aggregate Bond Index – a market capitalization-weighted index that measures the performance of the U.S. investment-grade, fixed rate bond market, with index components for government and corporate securities, mortgage pass-through securities, and asset-backed securities with at least one year to final maturity.
FTSE EPRA/NAREIT Developed Real Estate Index (net div) – measures the performance of eligible real estate equities worldwide that generate a majority of their revenue and income through the ownership, disposure and development of income-producing real estate.
5
MFS Conservative Allocation Portfolio
Performance Summary – continued
MSCI EAFE (Europe, Australasia, Far East) Index (net div) – a market capitalization index that is designed to measure equity market performance in the developed markets, excluding the U.S. and Canada.
Standard & Poor’s 500 Stock Index – a market capitalization index of 500 widely held equity securities, designed to measure broad U.S. equity performance.
It is not possible to invest directly in an index.
Notes to Performance Summary
Average annual total return represents the average annual change in value for each share class for the periods presented. Life returns are presented where the share class has less than 10 years of performance history and represent the average annual total return from the class inception date to the stated period end date.
Performance results reflect any applicable expense subsidies and waivers in effect during the periods shown. Without such subsidies and waivers the fund’s performance results would be less favorable. Please see the prospectus and financial statements for complete details. All results are historical and assume the reinvestment of any dividends and capital gains distributions.
Performance prior to close of business December 7, 2012, reflects time periods when another adviser or subadviser was responsible for selecting investments for the fund under a different investment objective and different investment strategies, underlying fund selections, and underlying fund target weightings of the fund.
Performance results do not include adjustments made for financial reporting purposes in accordance with U.S. generally accepted accounting principles and may differ from amounts reported in the financial highlights.
From time to time the fund may receive proceeds from litigation settlements, without which performance would be lower.
6
MFS Conservative Allocation Portfolio
EXPENSE TABLE
Fund Expenses Borne by the Contract Holders during the Period, July 1, 2017 through December 31, 2017
As a contract holder of the fund, you incur ongoing costs, including distribution and/or service (12b-1) fees; and other fund expenses. This example is intended to help you understand your ongoing costs (in dollars) of investing in the fund and to compare these costs with the ongoing costs of investing in other mutual funds.
In addition to the fees and expenses which the fund bears directly, the fund indirectly bears a pro rata share of the fees and expenses of the underlying funds in which the fund invests. Because the underlying funds have varied expenses and fee levels and the fund may own different proportions of the underlying funds at different times, the amount of fees and expenses incurred indirectly by the fund will vary. If these indirect costs were included, your costs would have been higher.
The example is based on an investment of $1,000 invested at the beginning of the period and held for the entire period July 1, 2017 through December 31, 2017.
Actual Expenses
The first line for each share class in the following table provides information about actual account values and actual expenses. You may use the information in this line, together with the amount you invested, to estimate the expenses that you paid over the period. Simply divide your account value by $1,000 (for example, an $8,600 account value divided by $1,000 = 8.6), then multiply the result by the number in the first line under the heading entitled “Expenses Paid During Period” to estimate the expenses you paid on your account during this period.
Hypothetical Example for Comparison Purposes
The second line for each share class in the following table provides information about hypothetical account values and hypothetical expenses based on the fund’s actual expense ratio and an assumed rate of return of 5% per year before expenses, which is not the fund’s actual return. The hypothetical account values and expenses may not be used to estimate the actual ending account balance or expenses you paid for the period. You may use this information to compare the ongoing costs of investing in the fund and other funds. To do so, compare this 5% hypothetical example with the 5% hypothetical examples that appear in the shareholder reports of the other funds.
Please note that the expenses shown in the table are meant to highlight the fund’s ongoing costs only and do not take into account the fees and expenses imposed under the variable contracts through which your investment in the fund is made. Therefore, the second line for each share class in the table is useful in comparing ongoing costs associated with an investment in vehicles (such as the fund) which fund benefits under variable annuity and variable life insurance contracts and to qualified pension and retirement plans only, and will not help you determine the relative total costs of investing in the fund through variable annuity and variable life insurance contracts. If the fees and expenses imposed under the variable contracts were included, your costs would have been higher.
| | | | | | | | | | | | | | | | | | |
| Share Class | | | | Annualized
Expense Ratio | | | Beginning
Account Value
7/01/17 | | | Ending
Account Value
12/31/17 | | | Expenses Paid
During Period (p)
7/01/17-12/31/17 | |
| Initial Class | | Actual | | | 0.02% | | | | $1,000.00 | | | | $1,048.69 | | | | $0.10 | |
| | Hypothetical (h) | | | 0.02% | | | | $1,000.00 | | | | $1,025.10 | | | | $0.10 | |
| Service Class | | Actual | | | 0.27% | | | | $1,000.00 | | | | $1,046.47 | | | | $1.39 | |
| | Hypothetical (h) | | | 0.27% | | | | $1,000.00 | | | | $1,023.84 | | | | $1.38 | |
| (h) | 5% class return per year before expenses. |
| (p) | “Expenses Paid During Period” are equal to each class’s annualized expense ratio, as shown above, multiplied by the average account value over the period, multiplied by 184/365 (to reflect the one-half year period). In addition to the fees and expenses which the fund bears directly, the fund indirectly bears a pro rata share of the fees and expenses of the underlying funds in which the fund invests. If these indirect costs were included, your costs would have been higher. |
7
MFS Conservative Allocation Portfolio
PORTFOLIO OF INVESTMENTS – 12/31/17
The Portfolio of Investments is a complete list of all securities owned by your fund. It is categorized by broad-based asset classes.
| | | | | | | | |
| Issuer | | Shares/Par | | | Value ($) | |
| INVESTMENT COMPANIES (h) – 100.0% | |
| Bond Funds – 61.9% | |
| MFS Global Governments Portfolio – Initial Class (a) | | | 4,199,849 | | | $ | 44,350,403 | |
| MFS Government Securities Portfolio – Initial Class | | | 4,473,015 | | | | 55,420,661 | |
| MFS High Yield Portfolio – Initial Class | | | 4,796,242 | | | | 27,674,316 | |
| MFS Inflation-Adjusted Bond Portfolio – Initial Class (a) | | | 5,136,227 | | | | 55,522,618 | |
| MFS Limited Maturity Portfolio – Initial Class | | | 6,520,227 | | | | 66,375,916 | |
| MFS Total Return Bond Series – Initial Class | | | 7,126,269 | | | | 94,209,270 | |
| | | | | | | | |
| | | $ | 343,553,184 | |
| | | | | | | | |
| International Stock Funds – 8.0% | |
| MFS International Growth Portfolio – Initial Class | | | 716,142 | | | $ | 11,100,203 | |
| MFS International Value Portfolio – Initial Class | | | 392,455 | | | | 11,086,866 | |
| MFS Research International Portfolio – Initial Class | | | 1,301,754 | | | | 22,194,900 | |
| | | | | | | | |
| | | $ | 44,381,969 | |
| | | | | | | | |
| Specialty Funds – 2.0% | |
| MFS Global Real Estate Portfolio – Initial Class | | | 776,900 | | | $ | 11,086,366 | |
| | | | | | | | |
| U.S. Stock Funds – 27.8% | |
| MFS Growth Series – Initial Class | | | 675,751 | | | $ | 33,044,220 | |
| MFS Mid Cap Growth Series – Initial Class | | | 2,318,834 | | | | 22,052,116 | |
| MFS Mid Cap Value Portfolio – Initial Class | | | 2,446,894 | | | | 22,046,515 | |
| MFS New Discovery Series – Initial Class | | | 274,606 | | | | 5,519,571 | |
| MFS New Discovery Value Portfolio – Initial Class | | | 496,034 | | | | 5,520,858 | |
| MFS Research Series – Initial Class | | | 1,120,543 | | | | 33,056,023 | |
| MFS Value Series – Initial Class | | | 1,581,540 | | | | 33,085,823 | |
| | | | | | | | |
| | | $ | 154,325,126 | |
| | | | | | | | |
| | | | | | | | |
| Issuer | | Shares/Par | | | Value ($) | |
| INVESTMENT COMPANIES (h) – continued | |
| Money Market Funds – 0.3% | |
| MFS Institutional Money Market Portfolio, 1.25% (v) | | | 1,624,261 | | | $ | 1,624,098 | |
| | | | | | | | |
Total Investment Companies
(Identified Cost, $497,173,731) | | | $ | 554,970,743 | |
| | | | | | | | |
OTHER ASSETS, LESS
LIABILITIES – (0.0)% | | | | | | | (53,696 | ) |
| | | | | | | | |
| NET ASSETS – 100.0% | | | | | | $ | 554,917,047 | |
| | | | | | | | |
| (a) | | Non-income producing security. |
| (h) | | An affiliated issuer may be considered one in which the fund owns 5% or more of the outstanding voting securities, or a company which is under common control. At period end, the aggregate values of the fund’s investments in affiliated issuers and in unaffiliated issuers were $554,970,743 and $0, respectively. |
| (v) | | Affiliated issuer that is available only to investment companies managed by MFS. The rate quoted for the MFS Institutional Money Market Portfolio is the annualized seven-day yield of the fund at period end. |
See Notes to Financial Statements
8
MFS Conservative Allocation Portfolio
FINANCIAL STATEMENTS | STATEMENT OF ASSETS AND LIABILITIES
This statement represents your fund’s balance sheet, which details the assets and liabilities comprising the total value of the fund.
| | | | |
At 12/31/17 | | | | |
Assets | | | | |
Investments in affiliated issuers, at value (identified cost, $497,173,731) | | | $554,970,743 | |
Receivables for | | | | |
Investments sold | | | 1,001,467 | |
Fund shares sold | | | 303 | |
Other assets | | | 3,710 | |
Total assets | | | $555,976,223 | |
Liabilities | | | | |
Payable for fund shares reacquired | | | $1,001,770 | |
Payable to affiliates | | | | |
Administrator | | | 190 | |
Shareholder servicing costs | | | 110 | |
Distribution and/or service fees | | | 15,146 | |
Payable for independent Trustees’ compensation | | | 47 | |
Accrued expenses and other liabilities | | | 41,913 | |
Total liabilities | | | $1,059,176 | |
Net assets | | | $554,917,047 | |
Net assets consist of | | | | |
Paid-in capital | | | $469,110,683 | |
Unrealized appreciation (depreciation) | | | 57,797,012 | |
Accumulated net realized gain (loss) | | | 18,328,334 | |
Undistributed net investment income | | | 9,681,018 | |
Net assets | | | $554,917,047 | |
Shares of beneficial interest outstanding | | | 47,711,362 | |
| | | | | | | | | | | | |
| | | Net assets | | | Shares
outstanding | | | Net asset value
per share | |
Initial Class | | | $2,338,245 | | | | 201,413 | | | | $11.61 | |
Service Class | | | 552,578,802 | | | | 47,509,949 | | | | 11.63 | |
Net asset value per share is calculated using actual net assets and shares outstanding rather than amounts that have been rounded for presentation purposes.
See Notes to Financial Statements
9
MFS Conservative Allocation Portfolio
FINANCIAL STATEMENTS | STATEMENT OF OPERATIONS
This statement describes how much your fund earned in investment income and accrued in expenses. It also describes any gains and/or losses generated by fund operations.
| | | | |
Year ended 12/31/17 | | | | |
Net investment income (loss) | | | | |
Dividends from affiliated issuers | | | $11,294,899 | |
Expenses | | | | |
Distribution and/or service fees | | | $1,473,856 | |
Shareholder servicing costs | | | 12,116 | |
Administrative services fee | | | 17,500 | |
Independent Trustees’ compensation | | | 15,214 | |
Custodian fee | | | 9,637 | |
Shareholder communications | | | 18,005 | |
Audit and tax fees | | | 37,675 | |
Legal fees | | | 7,649 | |
Miscellaneous | | | 21,025 | |
Total expenses | | | $1,612,677 | |
Net investment income (loss) | | | $9,682,222 | |
Realized and unrealized gain (loss) | | | | |
Realized gain (loss) (identified cost basis) | | | | |
Affiliated issuers | | | $12,359,388 | |
Capital gain distributions from affiliated issuers | | | 8,298,493 | |
Net realized gain (loss) | | | $20,657,881 | |
Change in unrealized appreciation (depreciation) | | | | |
Affiliated issuers | | | 32,920,622 | |
Net realized and unrealized gain (loss) | | | $53,578,503 | |
Change in net assets from operations | | | $63,260,725 | |
See Notes to Financial Statements
10
MFS Conservative Allocation Portfolio
FINANCIAL STATEMENTS | STATEMENTS OF CHANGES IN NET ASSETS
These statements describe the increases and/or decreases in net assets resulting from operations, any distributions, and any shareholder transactions.
| | | | | | | | |
| | | Year ended | |
| | | 12/31/17 | | | | 12/31/16 | |
Change in net assets | | | | | | | | |
| From operations | | | | | | | | |
Net investment income (loss) | | | $9,682,222 | | | | $10,988,313 | |
Net realized gain (loss) | | | 20,657,881 | | | | 15,444,977 | |
Net unrealized gain (loss) | | | 32,920,622 | | | | 5,301,508 | |
Change in net assets from operations | | | $63,260,725 | | | | $31,734,798 | |
| Distributions declared to shareholders | | | | | | | | |
From net investment income | | | $(10,989,398 | ) | | | $(16,110,618 | ) |
From net realized gain | | | (15,777,594 | ) | | | (22,418,780 | ) |
Total distributions declared to shareholders | | | $(26,766,992 | ) | | | $(38,529,398 | ) |
Change in net assets from fund share transactions | | | $(96,807,155 | ) | | | $(71,588,922 | ) |
Total change in net assets | | | $(60,313,422 | ) | | | $(78,383,522 | ) |
| Net assets | | | | | | | | |
At beginning of period | | | 615,230,469 | | | | 693,613,991 | |
At end of period (including undistributed net investment income of $9,681,018 and
$10,988,194, respectively) | | | $554,917,047 | | | | $615,230,469 | |
See Notes to Financial Statements
11
MFS Conservative Allocation Portfolio
FINANCIAL STATEMENTS | FINANCIAL HIGHLIGHTS
The financial highlights table is intended to help you understand the fund’s financial performance for the past 5 years. Certain information reflects financial results for a single fund share. The total returns in the table represent the rate that an investor would have earned (or lost) on an investment in the fund share class (assuming reinvestment of all distributions) held for the entire period.
| | | | | | | | | | | | | | | | | | | | |
| Initial Class | | Year ended | |
| | | 12/31/17 | | | 12/31/16 | | | 12/31/15 | | | 12/31/14 | | | 12/31/13 | |
Net asset value, beginning of period | | | $10.95 | | | | $11.09 | | | | $11.79 | | | | $11.61 | | | | $11.80 | |
| Income (loss) from investment operations | | | | | | | | | | | | | | | | | | | | |
Net investment income (loss) (d)(l) | | | $0.22 | | | | $0.22 | (c) | | | $0.24 | | | | $0.20 | | | | $0.11 | |
Net realized and unrealized gain (loss) | | | 1.02 | | | | 0.36 | | | | (0.27 | ) | | | 0.34 | | | | 0.97 | |
Total from investment operations | | | $1.24 | | | | $0.58 | | | | $(0.03 | ) | | | $0.54 | | | | $1.08 | |
| Less distributions declared to shareholders | | | | | | | | | | | | | | | | | | | | |
From net investment income | | | $(0.26 | ) | | | $(0.32 | ) | | | $(0.41 | ) | | | $(0.22 | ) | | | $(0.37 | ) |
From net realized gain | | | (0.32 | ) | | | (0.40 | ) | | | (0.26 | ) | | | (0.14 | ) | | | (0.90 | ) |
Total distributions declared to shareholders | | | $(0.58 | ) | | | $(0.72 | ) | | | $(0.67 | ) | | | $(0.36 | ) | | | $(1.27 | ) |
Net asset value, end of period (x) | | | $11.61 | | | | $10.95 | | | | $11.09 | | | | $11.79 | | | | $11.61 | |
Total return (%) (k)(r)(s)(x) | | | 11.48 | | | | 5.03 | (c) | | | (0.19 | ) | | | 4.61 | | | | 9.82 | |
Ratios (%) (to average net assets)
and Supplemental data: | | | | | | | | | | | | | | | | | | | | |
Expenses before expense reductions (f)(h) | | | 0.02 | | | | 0.02 | (c) | | | 0.01 | | | | 0.02 | | | | 0.03 | |
Expenses after expense reductions (f)(h) | | | N/A | | | | N/A | | | | N/A | | | | 0.02 | | | | 0.03 | |
Net investment income (loss) (l) | | | 1.94 | | | | 1.92 | (c) | | | 2.06 | | | | 1.66 | | | | 0.93 | |
Portfolio turnover | | | 0 | (b) | | | 1 | | | | 2 | | | | 1 | | | | 1 | |
Net assets at end of period (000 omitted) | | | $2,338 | | | | $2,266 | | | | $2,419 | | | | $2,948 | | | | $4,167 | |
| |
| Service Class | | Year ended | |
| | | 12/31/17 | | | 12/31/16 | | | 12/31/15 | | | 12/31/14 | | | 12/31/13 | |
Net asset value, beginning of period | | | $10.96 | | | | $11.10 | | | | $11.80 | | | | $11.61 | | | | $11.80 | |
| Income (loss) from investment operations | | | | | | | | | | | | | | | | | | | | |
Net investment income (loss) (d)(l) | | | $0.19 | | | | $0.19 | (c) | | | $0.21 | | | | $0.16 | | | | $0.07 | |
Net realized and unrealized gain (loss) | | | 1.02 | | | | 0.35 | | | | (0.28 | ) | | | 0.36 | | | | 0.98 | |
Total from investment operations | | | $1.21 | | | | $0.54 | | | | $(0.07 | ) | | | $0.52 | | | | $1.05 | |
| Less distributions declared to shareholders | | | | | | | | | | | | | | | | | | | | |
From net investment income | | | $(0.22 | ) | | | $(0.28 | ) | | | $(0.37 | ) | | | $(0.19 | ) | | | $(0.34 | ) |
From net realized gain | | | (0.32 | ) | | | (0.40 | ) | | | (0.26 | ) | | | (0.14 | ) | | | (0.90 | ) |
Total distributions declared to shareholders | | | $(0.54 | ) | | | $(0.68 | ) | | | $(0.63 | ) | | | $(0.33 | ) | | | $(1.24 | ) |
Net asset value, end of period (x) | | | $11.63 | | | | $10.96 | | | | $11.10 | | | | $11.80 | | | | $11.61 | |
Total return (%) (k)(r)(s)(x) | | | 11.24 | | | | 4.73 | (c) | | | (0.49 | ) | | | 4.41 | | | | 9.52 | |
Ratios (%) (to average net assets)
and Supplemental data: | | | | | | | | | | | | | | | | | | | | |
Expenses before expense reductions (f)(h) | | | 0.27 | | | | 0.27 | (c) | | | 0.26 | | | | 0.27 | | | | 0.28 | |
Expenses after expense reductions (f)(h) | | | N/A | | | | N/A | | | | N/A | | | | 0.27 | | | | 0.28 | |
Net investment income (loss) (l) | | | 1.63 | | | | 1.66 | (c) | | | 1.80 | | | | 1.36 | | | | 0.62 | |
Portfolio turnover | | | 0 | (b) | | | 1 | | | | 2 | | | | 1 | | | | 1 | |
Net assets at end of period (000 omitted) | | | $552,579 | | | | $612,965 | | | | $691,195 | | | | $801,775 | | | | $896,495 | |
See Notes to Financial Statements
12
MFS Conservative Allocation Portfolio
Financial Highlights – continued
| (c) | Amount reflects a one-time reimbursement of expenses by the custodian (or former custodian) without which net investment income and performance would be lower and expenses would be higher. |
| (d) | Per share data is based on average shares outstanding. |
| (f) | Ratios do not reflect reductions from fees paid indirectly, if applicable. |
| (h) | In addition to the fees and expenses which the fund bears directly, the fund indirectly bears a pro rata share of the fees and expenses of the underlying affiliated funds in which the fund invests. Accordingly, the expense ratio for the fund reflects only those fees and expenses borne directly by the fund. Because the underlying affiliated funds have varied expense and fee levels and the fund may own different proportions of the underlying affiliated funds at different times, the amount of fees and expenses incurred indirectly by the fund will vary. |
| (k) | The total return does not reflect expenses that apply to separate accounts. Inclusion of these charges would reduce the total return figures for all periods shown. |
| (l) | Recognition of net investment income by the fund may be affected by the timing of the declaration of dividends by the underlying affiliated funds in which the fund invests. The ratios and per share amounts do not include net investment income of the underlying affiliated funds in which the fund invests. |
| (r) | Certain expenses have been reduced without which performance would have been lower. |
| (s) | From time to time the fund may receive proceeds from litigation settlements, without which performance would be lower. |
| (x) | The net asset values and total returns have been calculated on net assets which include adjustments made in accordance with U.S. generally accepted accounting principles required at period end for financial reporting purposes. |
See Notes to Financial Statements
13
MFS Conservative Allocation Portfolio
NOTES TO FINANCIAL STATEMENTS
| (1) | | Business and Organization |
MFS Conservative Allocation Portfolio (the fund) is a diversified series of MFS Variable Insurance Trust III (the trust). The trust is organized as a Delaware statutory trust and is registered under the Investment Company Act of 1940, as amended, as an open-end management investment company. The shareholders of each series of the trust are separate accounts of insurance companies, which offer variable annuity and/or life insurance products, and qualified retirement and pension plans.
The fund is an investment company and accordingly follows the investment company accounting and reporting guidance of the Financial Accounting Standards Board (FASB) Accounting Standards Codification Topic 946 Financial Services – Investment Companies.
| (2) | | Significant Accounting Policies |
General – The preparation of financial statements in conformity with U.S. generally accepted accounting principles requires management to make estimates and assumptions that affect the reported amounts of assets and liabilities, and disclosure of contingent assets and liabilities at the date of the financial statements and the reported amounts of increases and decreases in net assets from operations during the reporting period. Actual results could differ from those estimates. In the preparation of these financial statements, management has evaluated subsequent events occurring after the date of the fund’s Statement of Assets and Liabilities through the date that the financial statements were issued.
The fund is a “fund of funds”, which invests the majority of its assets in other MFS mutual funds (hereafter referred to as “underlying affiliated funds” or “underlying funds”), which may have different fiscal year ends than the funds. The underlying funds, in turn, may engage in a number of investment techniques and practices, which involve certain risks. Certain underlying funds invest their portfolio in high-yield securities rated below investment grade. Investments in below investment grade quality securities can involve a substantially greater risk of default or can already be in default, and their values can decline significantly. Below investment grade quality securities tend to be more sensitive to adverse news about the issuer, or the market or economy in general, than higher quality debt instruments. Certain underlying funds invest a significant portion of their assets in asset-backed and/or mortgage-backed securities. For these securities, the value of the debt instrument also depends on the credit quality and adequacy of the underlying assets or collateral as well as whether there is a security interest in the underlying assets or collateral. Enforcing rights, if any, against the underlying assets or collateral may be difficult. U.S. Government securities not supported as to the payment of principal or interest by the U.S. Treasury, such as those issued by Fannie Mae, Freddie Mac, and the Federal Home Loan Banks, are subject to greater credit risk than are U.S. Government securities supported by the U.S. Treasury, such as those issued by Ginnie Mae. Certain underlying funds invest in foreign securities, including securities of emerging market issuers. Investments in foreign securities are vulnerable to the effects of changes in the relative values of the local currency and the U.S. dollar and to the effects of changes in each country’s market, economic, industry, political, regulatory, geopolitical, and other conditions. Investments in emerging markets can involve additional and greater risks than the risks associated with investments in developed foreign markets. Emerging markets can have less developed markets, greater custody and operational risk, less developed legal, regulatory, and accounting systems, and greater political, social, and economic instability than developed markets.
The accounting policies of the underlying funds in which the fund invests are outlined in the underlying funds’ shareholder reports, which are available without charge by calling 1-800-225-2606, at mfs.com and on the Securities and Exchange Commission (SEC) web site at http://www.sec.gov or at the SEC’s public reference room in Washington, D.C. The underlying funds’ shareholder reports are not covered by this report.
In October 2016, the Securities and Exchange Commission (SEC) released its final rule on Investment Company Reporting Modernization (the “Rule”). The Rule, which introduced two new regulatory reporting forms for investment companies – Form N-PORT and Form N-CEN – also contained amendments to Regulation S-X which impact financial statement presentation, particularly the presentation of derivative investments, for all reporting periods ending after August 1, 2017. The fund has adopted the Rule’s Regulation S-X amendments and believes that the fund’s financial statements are in compliance with those amendments.
Investment Valuations – Open-end investment companies (underlying funds) are generally valued at their net asset value per share. The investments of underlying funds managed by the adviser are valued as described below. For purposes of this policy disclosure, “fund” also refers to the underlying funds in which the fund-of-funds invests.
Equity securities, including restricted equity securities and equity securities held short, are generally valued at the last sale or official closing price on their primary market or exchange as provided by a third-party pricing service. Equity securities, for which there were no sales reported that day, are generally valued at the last quoted daily bid quotation on their primary market or exchange as provided by a third-party pricing service. Equity securities held short, for which there were no sales reported for that day, are generally valued at the last quoted daily ask quotation on their primary market or exchange as provided by a third-party pricing service. Debt instruments and floating rate loans, including restricted debt instruments, are generally valued at an evaluated or composite bid as provided by a third-party pricing service. Short-term instruments with a maturity at issuance of 60 days or less may be valued at amortized cost, which approximates market value. Exchange-traded options are generally valued at the last sale or
14
MFS Conservative Allocation Portfolio
Notes to Financial Statements – continued
official closing price on their primary exchange as provided by a third-party pricing service. Exchange-traded options for which there were no sales reported that day are generally valued at the last daily bid quotation on their primary exchange as provided by a third-party pricing service. Options not traded on an exchange are generally valued at a broker/dealer bid quotation. Foreign currency options are generally valued at valuations provided by a third-party pricing service. Futures contracts are generally valued at last posted settlement price on their primary exchange as provided by a third-party pricing service. Futures contracts for which there were no trades that day for a particular position are generally valued at the closing bid quotation on their primary exchange as provided by a third-party pricing service. Forward foreign currency exchange contracts are generally valued at the mean of bid and asked prices for the time period interpolated from rates provided by a third-party pricing service for proximate time periods. Swap agreements are generally valued at valuations provided by a third-party pricing service, which for cleared swaps includes an evaluation of any trading activity at the clearinghouses. Open-end investment companies are generally valued at net asset value per share. Securities and other assets generally valued on the basis of information from a third-party pricing service may also be valued at a broker/dealer bid quotation. Values obtained from third-party pricing services can utilize both transaction data and market information such as yield, quality, coupon rate, maturity, type of issue, trading characteristics, and other market data. The values of foreign securities and other assets and liabilities expressed in foreign currencies are converted to U.S. dollars using the mean of bid and asked prices for rates provided by a third-party pricing service.
The Board of Trustees has delegated primary responsibility for determining or causing to be determined the value of the fund’s investments (including any fair valuation) to the adviser pursuant to valuation policies and procedures approved by the Board. If the adviser determines that reliable market quotations are not readily available, investments are valued at fair value as determined in good faith by the adviser in accordance with such procedures under the oversight of the Board of Trustees. Under the fund’s valuation policies and procedures, market quotations are not considered to be readily available for most types of debt instruments and floating rate loans and many types of derivatives. These investments are generally valued at fair value based on information from third-party pricing services. In addition, investments may be valued at fair value if the adviser determines that an investment’s value has been materially affected by events occurring after the close of the exchange or market on which the investment is principally traded (such as foreign exchange or market) and prior to the determination of the fund’s net asset value, or after the halting of trading of a specific security where trading does not resume prior to the close of the exchange or market on which the security is principally traded. Events that occur on a frequent basis after foreign markets close (such as developments in foreign markets and significant movements in the U.S. markets) and prior to the determination of the fund’s net asset value may be deemed to have a material effect on the value of securities traded in foreign markets. Accordingly, the fund’s foreign equity securities may often be valued at fair value. The adviser generally relies on third-party pricing services or other information (such as the correlation with price movements of similar securities in the same or other markets; the type, cost and investment characteristics of the security; the business and financial condition of the issuer; and trading and other market data) to assist in determining whether to fair value and at what value to fair value an investment. The value of an investment for purposes of calculating the fund’s net asset value can differ depending on the source and method used to determine value. When fair valuation is used, the value of an investment used to determine the fund’s net asset value may differ from quoted or published prices for the same investment. There can be no assurance that the fund could obtain the fair value assigned to an investment if it were to sell the investment at the same time at which the fund determines its net asset value per share.
Various inputs are used in determining the value of the fund’s assets or liabilities. These inputs are categorized into three broad levels. In certain cases, the inputs used to measure fair value may fall into different levels of the fair value hierarchy. In such cases, an investment’s level within the fair value hierarchy is based on the lowest level of input that is significant to the fair value measurement. The fund’s assessment of the significance of a particular input to the fair value measurement in its entirety requires judgment, and considers factors specific to the investment. Level 1 includes unadjusted quoted prices in active markets for identical assets or liabilities. Level 2 includes other significant observable market-based inputs (including quoted prices for similar securities, interest rates, prepayment speed, and credit risk). Level 3 includes unobservable inputs, which may include the adviser’s own assumptions in determining the fair value of investments. The following is a summary of the levels used as of December 31, 2017 in valuing the fund’s assets or liabilities:
| | | | | | | | | | | | | | | | |
| Financial Instruments | | Level 1 | | | Level 2 | | | Level 3 | | | Total | |
| Mutual Funds | | | $554,970,743 | | | | $— | | | | $— | | | | $554,970,743 | |
For further information regarding security characteristics, see the Portfolio of Investments. Please refer to the underlying funds’ shareholder reports for further information regarding the levels used in valuing the underlying funds’ assets or liabilities.
Derivatives – The fund does not invest in derivatives directly. The fund does invest in underlying funds that may use derivatives for different purposes, primarily to increase or decrease exposure to a particular market or segment of the market, or security, to increase or decrease interest rate or currency exposure, or as alternatives to direct investments. Derivatives are used for hedging or non-hedging purposes. While hedging can reduce or eliminate losses, it can also reduce or eliminate gains. When the underlying funds use derivatives as an investment to increase market exposure, or for hedging purposes, gains and losses from derivative instruments may be substantially greater than the derivative’s original cost.
15
MFS Conservative Allocation Portfolio
Notes to Financial Statements – continued
Indemnifications – Under the fund’s organizational documents, its officers and Trustees may be indemnified against certain liabilities and expenses arising out of the performance of their duties to the fund. Additionally, in the normal course of business, the fund enters into agreements with service providers that may contain indemnification clauses. The fund’s maximum exposure under these agreements is unknown as this would involve future claims that may be made against the fund that have not yet occurred.
Investment Transactions and Income – Investment transactions are recorded on the trade date. Interest income is recorded on an accrual basis. All premium and discount is amortized or accreted for financial statement purposes in accordance with U.S. generally accepted accounting principles. Distributions of income and capital gains from the underlying funds are recorded on the ex-dividend date. Recognition of net investment income by the fund is affected by the timing of the declaration of distributions by the underlying funds in which the fund invests. In determining the net gain or loss on securities sold, the cost of securities is determined on the identified cost basis.
The fund and/or the underlying funds may receive proceeds from litigation settlements. Any proceeds received from litigation involving portfolio holdings are reflected in the Statement of Operations in realized gain/loss if the security has been disposed of by the fund or in unrealized gain/loss if the security is still held by the fund. Any other proceeds from litigation not related to portfolio holdings are reflected as other income in the Statement of Operations.
Tax Matters and Distributions – The fund intends to qualify as a regulated investment company, as defined under Subchapter M of the Internal Revenue Code, and to distribute all of its taxable income, including realized capital gains. As a result, no provision for federal income tax is required. The fund’s federal tax returns, when filed, will remain subject to examination by the Internal Revenue Service for a three year period. Management has analyzed the fund’s tax positions taken on federal and state tax returns for all open tax years and does not believe that there are any uncertain tax positions that require recognition of a tax liability.
Distributions to shareholders are recorded on the ex-dividend date. Income and capital gain distributions are determined in accordance with income tax regulations, which may differ from U.S. generally accepted accounting principles. Certain capital accounts in the financial statements are periodically adjusted for permanent differences in order to reflect their tax character. These adjustments have no impact on net assets or net asset value per share. Temporary differences which arise from recognizing certain items of income, expense, gain or loss in different periods for financial statement and tax purposes will reverse at some time in the future. Distributions in excess of net investment income or net realized gains are temporary overdistributions for financial statement purposes resulting from differences in the recognition or classification of income or distributions for financial statement and tax purposes.
Book/tax differences primarily relate to wash sale loss deferrals.
The tax character of distributions declared to shareholders for the last two fiscal years is as follows:
| | | | | | | | |
| | | Year ended
12/31/17 | | | Year ended
12/31/16 | |
| Ordinary income (including any short-term capital gains) | | | $11,663,511 | | | | $17,225,958 | |
| Long-term capital gains | | | 15,103,481 | | | | 21,303,440 | |
| Total distributions | | | $26,766,992 | | | | $38,529,398 | |
The federal tax cost and the tax basis components of distributable earnings were as follows:
| | | | |
| As of 12/31/17 | | | | |
| Cost of investments | | | $499,669,583 | |
| Gross appreciation | | | 64,088,711 | |
| Gross depreciation | | | (8,787,551 | ) |
| Net unrealized appreciation (depreciation) | | | $55,301,160 | |
| Undistributed ordinary income | | | 10,084,263 | |
| Undistributed long-term capital gain | | | 20,420,941 | |
Multiple Classes of Shares of Beneficial Interest – The fund offers multiple classes of shares, which differ in their respective distribution and/or service fees. The fund’s income, realized and unrealized gain (loss), and common expenses are allocated to shareholders based on the daily net assets of each class. Dividends are declared separately for each class. Differences in per share
16
MFS Conservative Allocation Portfolio
Notes to Financial Statements – continued
dividend rates are generally due to differences in separate class expenses. The fund’s distributions declared to shareholders as reported in the Statements of Changes in Net Assets are presented by class as follows:
| | | | | | | | | | | | | | | | |
| | | From net investment
income | | | From net realized gain on
investments | |
| | | Year ended
12/31/17 | | | Year ended
12/31/16 | | | Year ended
12/31/17 | | | Year ended
12/31/16 | |
| Initial Class | | | $49,416 | | | | $63,216 | | | | $61,677 | | | | $78,776 | |
| Service Class | | | 10,939,982 | | | | 16,047,402 | | | | 15,715,917 | | | | 22,340,004 | |
| Total | | | $10,989,398 | | | | $16,110,618 | | | | $15,777,594 | | | | $22,418,780 | |
| (3) | | Transactions with Affiliates |
Investment Adviser – The fund has an investment advisory agreement with MFS to provide overall investment management and related administrative services and facilities to the fund. MFS receives no compensation under this agreement; however MFS receives management fees from the underlying MFS funds.
The investment adviser has agreed in writing to pay a portion of the fund’s operating expenses, excluding distribution and/or service fees, interest, taxes, extraordinary expenses, brokerage and transaction costs, and investment-related expenses such as fees and expenses associated with investments in investment companies and other similar investment vehicles such that fund operating expenses do not exceed 0.20% annually of the fund’s average daily net assets. This written agreement will continue until modified by the fund’s Board of Trustees, but such agreement will continue at least until April 30, 2019. For the year ended December 31, 2017, the fund’s actual operating expenses did not exceed the limit and therefore, the investment adviser did not pay any portion of the fund’s expenses related to this agreement.
In addition to the fees and expenses which the fund bears directly, the fund indirectly bears a pro rata share of the fees and expenses of the underlying funds in which a fund invests. Accordingly, the expense ratio for the fund reflects only those fees and expenses borne directly by the fund.
Distributor – MFS Fund Distributors, Inc. (MFD), a wholly-owned subsidiary of MFS, is the distributor of shares of the fund. The Trustees have adopted a distribution plan for the Service Class shares pursuant to Rule 12b-1 under the Investment Company Act of 1940.
The fund’s distribution plan provides that the fund will pay MFD distribution and/or service fees equal to 0.25% per annum of its average daily net assets attributable to Service Class shares as partial consideration for services performed and expenses incurred by MFD and financial intermediaries (including participating insurance companies that invest in the fund to fund variable annuity and variable life insurance contracts, sponsors of qualified retirement and pension plans that invest in the fund, and affiliates of these participating insurance companies and plan sponsors) in connection with the sale and distribution of the Service Class shares. MFD may subsequently pay all, or a portion, of the distribution and/or service fees to financial intermediaries.
Shareholder Servicing Agent – MFS Service Center, Inc. (MFSC), a wholly-owned subsidiary of MFS, receives a fee from the fund for its services as shareholder servicing agent. For the year ended December 31, 2017, the fee was $11,752, which equated to 0.0020% annually of the fund’s average daily net assets. MFSC also receives payment from the fund for out-of-pocket expenses paid by MFSC on behalf of the fund. For the year ended December 31, 2017, these costs amounted to $364.
Administrator – MFS provides certain financial, legal, shareholder communications, compliance, and other administrative services to the fund. Under an administrative services agreement, the fund reimburses MFS the costs incurred to provide these services. The fund pays an annual fixed amount of $17,500. The administrative services fee incurred for the year ended December 31, 2017 was equivalent to an annual effective rate of 0.0030% of the fund’s average daily net assets.
Trustees’ and Officers’ Compensation – The fund pays compensation to independent Trustees in the form of a retainer, attendance fees, and additional compensation to Board and Committee chairpersons. The fund does not pay compensation directly to Trustees or officers of the fund who are also officers of the investment adviser, all of whom receive remuneration for their services to the fund from MFS. Certain officers and Trustees of the fund are officers or directors of MFS, MFD, and MFSC.
Other – This fund and certain other funds managed by MFS (the funds) have entered into a service agreement (the ISO Agreement) which provides for payment of fees solely by the funds to Tarantino LLC in return for the provision of services of an Independent Senior Officer (ISO) for the funds. Frank L. Tarantino serves as the ISO and is an officer of the funds and the sole member of Tarantino LLC. The funds can terminate the ISO Agreement with Tarantino LLC at any time under the terms of the ISO Agreement. For the year ended December 31, 2017, the fee paid by the fund under this agreement was $1,055 and is included in “Miscellaneous” expense in the Statement of Operations. MFS has agreed to bear all expenses associated with office space, other administrative support, and supplies provided to the ISO.
17
MFS Conservative Allocation Portfolio
Notes to Financial Statements – continued
The fund invests in the MFS Institutional Money Market Portfolio which is managed by MFS and seeks current income consistent with preservation of capital and liquidity. This money market fund does not pay a management fee to MFS.
For the year ended December 31, 2017, purchases and sales of shares of underlying funds aggregated $1,885,752 and $127,067,266, respectively.
| (5) | | Shares of Beneficial Interest |
The fund’s Declaration of Trust permits the Trustees to issue an unlimited number of full and fractional shares of beneficial interest. Transactions in fund shares were as follows:
| | | | | | | | | | | | | | | | |
| | | Year ended 12/31/17 | | | Year ended 12/31/16 | |
| | | Shares | | | Amount | | | Shares | | | Amount | |
| Shares sold | | | | | | | | | | | | | | | | |
Initial Class | | | 10,169 | | | | $115,023 | | | | 4,714 | | | | $53,379 | |
Service Class | | | 423,197 | | | | 4,768,408 | | | | 1,740,149 | | | | 19,371,122 | |
| | | 433,366 | | | | $4,883,431 | | | | 1,744,863 | | | | $19,424,501 | |
| Shares issued to shareholders in reinvestment of distributions | | | | | | | | | | | | | | | | |
Initial Class | | | 9,901 | | | | $111,093 | | | | 12,667 | | | | $141,992 | |
Service Class | | | 2,369,413 | | | | 26,655,899 | | | | 3,418,291 | | | | 38,387,406 | |
| | | 2,379,314 | | | | $26,766,992 | | | | 3,430,958 | | | | $38,529,398 | |
| Shares reacquired | | | | | | | | | | | | | | | | |
Initial Class | | | (25,609 | ) | | | $(286,704 | ) | | | (28,643 | ) | | | $(322,731 | ) |
Service Class | | | (11,197,619 | ) | | | (128,170,874 | ) | | | (11,535,443 | ) | | | (129,220,090 | ) |
| | | (11,223,228 | ) | | | $(128,457,578 | ) | | | (11,564,086 | ) | | | $(129,542,821 | ) |
| Net change | | | | | | | | | | | | | | | | |
Initial Class | | | (5,539 | ) | | | $(60,588 | ) | | | (11,262 | ) | | | $(127,360 | ) |
Service Class | | | (8,405,009 | ) | | | (96,746,567 | ) | | | (6,377,003 | ) | | | (71,461,562 | ) |
| | | (8,410,548 | ) | | | $(96,807,155 | ) | | | (6,388,265 | ) | | | $(71,588,922 | ) |
The fund and certain other funds managed by MFS participate in a $1.25 billion unsecured committed line of credit, subject to a $1 billion sublimit, provided by a syndication of banks under a credit agreement. Borrowings may be made for temporary financing needs. Interest is charged to each fund, based on its borrowings, generally at a rate equal to the higher of the Overnight Federal Reserve funds rate or daily one month LIBOR plus an agreed upon spread. A commitment fee, based on the average daily, unused portion of the committed line of credit, is allocated among the participating funds at the end of each calendar quarter. In addition, the fund and other funds managed by MFS have established unsecured uncommitted borrowing arrangements with certain banks for temporary financing needs. Interest is charged to each fund, based on its borrowings, at a rate equal to the Overnight Federal Reserve funds rate plus an agreed upon spread. For the year ended December 31, 2017, the fund’s commitment fee and interest expense were $3,993 and $0, respectively, and are included in “Miscellaneous” expense in the Statement of Operations.
18
MFS Conservative Allocation Portfolio
Notes to Financial Statements – continued
| (7) | | Investments in Affiliated Issuers |
An affiliated issuer may be considered one in which the fund owns 5% or more of the outstanding voting securities, or a company which is under common control. For the purposes of this report, the fund assumes the following to be affiliated issuers:
| | | | | | | | | | | | | | | | | | | | |
| Underlying Affiliated Funds | | | | | Beginning
Share/Par
Amount | | | Acquisitions
Share/Par
Amount | | | Dispositions
Share/Par
Amount | | | Ending
Share/Par
Amount | |
| MFS Global Governments Portfolio | | | | | | | 4,938,466 | | | | 16,270 | | | | (754,887 | ) | | | 4,199,849 | |
| MFS Global Real Estate Portfolio | | | | | | | 890,228 | | | | 91,730 | | | | (205,058 | ) | | | 776,900 | |
| MFS Government Securities Portfolio | | | | | | | 4,926,875 | | | | 154,594 | | | | (608,454 | ) | | | 4,473,015 | |
| MFS Growth Series | | | | | | | 938,398 | | | | 32,297 | | | | (294,944 | ) | | | 675,751 | |
| MFS High Yield Portfolio | | | | | | | 5,316,638 | | | | 342,065 | | | | (862,461 | ) | | | 4,796,242 | |
| MFS Inflation-Adjusted Bond Portfolio | | | | | | | 6,208,240 | | | | 29,808 | | | | (1,101,821 | ) | | | 5,136,227 | |
| MFS Institutional Money Market Portfolio | | | | | | | 1,174,771 | | | | 28,222,937 | | | | (27,773,447 | ) | | | 1,624,261 | |
| MFS International Growth Portfolio | | | | | | | 1,018,004 | | | | 29,994 | | | | (331,856 | ) | | | 716,142 | |
| MFS International Value Portfolio | | | | | | | 545,861 | | | | 7,858 | | | | (161,264 | ) | | | 392,455 | |
| MFS Limited Maturity Portfolio | | | | | | | 7,249,706 | | | | 120,123 | | | | (849,602 | ) | | | 6,520,227 | |
| MFS Mid Cap Growth Series | | | | | | | 3,055,327 | | | | 166,501 | | | | (902,994 | ) | | | 2,318,834 | |
| MFS Mid Cap Value Portfolio | | | | | | | 2,941,536 | | | | 152,369 | | | | (647,011 | ) | | | 2,446,894 | |
| MFS New Discovery Series | | | | | | | 376,974 | | | | 9,259 | | | | (111,627 | ) | | | 274,606 | |
| MFS New Discovery Value Portfolio | | | | | | | 566,503 | | | | 72,382 | | | | (142,851 | ) | | | 496,034 | |
| MFS Research International Portfolio | | | | | | | 1,818,764 | | | | 29,222 | | | | (546,232 | ) | | | 1,301,754 | |
| MFS Research Series | | | | | | | 1,404,106 | | | | 106,286 | | | | (389,849 | ) | | | 1,120,543 | |
| MFS Total Return Bond Series | | | | | | | 8,000,609 | | | | 259,318 | | | | (1,133,658 | ) | | | 7,126,269 | |
| MFS Value Series | | | | | | | 1,935,497 | | | | 114,560 | | | | (468,517 | ) | | | 1,581,540 | |
| | | | | |
| Underlying Affiliated Funds | | Realized
Gain (Loss) | | | Change in
Unrealized
Appreciation
(Depreciation) | | | Capital Gain
Distributions | | | Dividend
Income | | | Ending
Value | |
| MFS Global Governments Portfolio | | | $(591,894 | ) | | | $3,836,002 | | | | $— | | | | $— | | | | $44,350,403 | |
| MFS Global Real Estate Portfolio | | | 292,693 | | | | 29,019 | | | | 543,232 | | | | 627,346 | | | | 11,086,366 | |
| MFS Government Securities Portfolio | | | (565,571 | ) | | | 82,318 | | | | — | | | | 1,807,626 | | | | 55,420,661 | |
| MFS Growth Series | | | 4,540,736 | | | | 3,914,805 | | | | 1,353,838 | | | | 35,777 | | | | 33,044,220 | |
| MFS High Yield Portfolio | | | (173,336 | ) | | | 252,681 | | | | — | | | | 1,865,565 | | | | 27,674,316 | |
| MFS Inflation-Adjusted Bond Portfolio | | | (244,469 | ) | | | 4,985,451 | | | | — | | | | — | | | | 55,522,618 | |
| MFS Institutional Money Market Portfolio | | | (279 | ) | | | (26 | ) | | | — | | | | 13,268 | | | | 1,624,098 | |
| MFS International Growth Portfolio | | | 698,865 | | | | 2,266,837 | | | | 224,936 | | | | 197,610 | | | | 11,100,203 | |
| MFS International Value Portfolio | | | 1,323,118 | | | | 1,374,867 | | | | — | | | | 179,660 | | | | 11,086,866 | |
| MFS Limited Maturity Portfolio | | | (34,227 | ) | | | 150,603 | | | | — | | | | 1,116,851 | | | | 66,375,916 | |
| MFS Mid Cap Growth Series | | | 1,728,255 | | | | 2,627,059 | | | | 1,346,894 | | | | 28,125 | | | | 22,052,116 | |
| MFS Mid Cap Value Portfolio | | | 211,802 | | | | 1,831,139 | | | | 665,583 | | | | 337,664 | | | | 22,046,515 | |
| MFS New Discovery Series | | | 93,361 | | | | 1,203,113 | | | | 111,471 | | | | — | | | | 5,519,571 | |
| MFS New Discovery Value Portfolio | | | 175,095 | | | | 62,671 | | | | 455,166 | | | | 148,920 | | | | 5,520,858 | |
| MFS Research International Portfolio | | | 1,138,867 | | | | 4,410,485 | | | | — | | | | 425,631 | | | | 22,194,900 | |
| MFS Research Series | | | 2,030,847 | | | | 2,703,175 | | | | 2,250,061 | | | | 540,271 | | | | 33,056,023 | |
| MFS Total Return Bond Series | | | (556,912 | ) | | | 1,712,402 | | | | — | | | | 3,273,841 | | | | 94,209,270 | |
| MFS Value Series | | | 2,292,437 | | | | 1,478,021 | | | | 1,347,312 | | | | 696,744 | | | | 33,085,823 | |
| | | | | | | | | | | | | | | | | | | | |
| | | $12,359,388 | | | | $32,920,622 | | | | $8,298,493 | | | | $11,294,899 | | | | $554,970,743 | |
| | | | | | | | | | | | | | | | | | | | |
19
MFS Conservative Allocation Portfolio
REPORT OF INDEPENDENT REGISTERED PUBLIC ACCOUNTING FIRM
To the Board of Trustees of MFS Variable Insurance Trust III and the Shareholders of MFS Conservative Allocation Portfolio:
Opinion on the Financial Statements and Financial Highlights
We have audited the accompanying statement of assets and liabilities of MFS Conservative Allocation Portfolio (one of the series of MFS Variable Insurance Trust III) (the “Fund”), including the portfolio of investments, as of December 31, 2017, the related statement of operations for the year then ended, the statements of changes in net assets for each of the two years in the period then ended, the financial highlights for each of the five years in the period then ended, and the related notes. In our opinion, the financial statements and financial highlights present fairly, in all material respects, the financial position of the Fund as of December 31, 2017, and the results of its operations for the year then ended, the changes in its net assets for each of the two years in the period then ended, and the financial highlights for each of the five years in the period then ended, in conformity with accounting principles generally accepted in the United States of America.
Basis for Opinion
These financial statements and financial highlights are the responsibility of the Fund’s management. Our responsibility is to express an opinion on the Fund’s financial statements and financial highlights based on our audits. We are a public accounting firm registered with the Public Company Accounting Oversight Board (United States) (PCAOB) and are required to be independent with respect to the Fund in accordance with the U.S. federal securities laws and the applicable rules and regulations of the Securities and Exchange Commission and the PCAOB.
We conducted our audits in accordance with the standards of the PCAOB. Those standards require that we plan and perform the audit to obtain reasonable assurance about whether the financial statements and financial highlights are free of material misstatement, whether due to error or fraud. The Fund is not required to have, nor were we engaged to perform, an audit of its internal control over financial reporting. As part of our audits we are required to obtain an understanding of internal control over financial reporting but not for the purpose of expressing an opinion on the effectiveness of the Fund’s internal control over financial reporting. Accordingly, we express no such opinion.
Our audits included performing procedures to assess the risks of material misstatement of the financial statements and financial highlights, whether due to error or fraud, and performing procedures that respond to those risks. Such procedures included examining, on a test basis, evidence regarding the amounts and disclosures in the financial statements and financial highlights. Our audits also included evaluating the accounting principles used and significant estimates made by management, as well as evaluating the overall presentation of the financial statements and financial highlights. Our procedures included confirmation of securities owned as of December 31, 2017, by correspondence with the transfer agent. We believe that our audits provide a reasonable basis for our opinion.
DELOITTE & TOUCHE LLP
Boston, Massachusetts
February 15, 2018
We have served as the auditor of one or more of the MFS investment companies since 1924.
20
MFS Conservative Allocation Portfolio
TRUSTEES AND OFFICERS – IDENTIFICATION AND BACKGROUND
The Trustees and Officers of the Trust, as of February 1, 2018, are listed below, together with their principal occupations during the past five years. (Their titles may have varied during that period.) The address of each Trustee and Officer is 111 Huntington Avenue, Boston, Massachusetts 02199-7618.
| | | | | | | | | | |
Name, Age | | Position(s)
Held with Fund | | Trustee/Officer
Since (h) | | Number of
MFS Funds
overseen by the
Trustee | | Principal Occupations
During the Past Five Years | | Other Directorships
During the Past Five Years (j) |
| INTERESTED TRUSTEES |
Robert J. Manning (k) (age 54) | | Trustee | | February 2004 | | 137 | | Massachusetts Financial Services Company, Executive Chairman (since January 2017); Director; Chairman of the Board; Chief Executive Officer (until 2015); Co-Chief Executive Officer (2015-2016) | | N/A |
| | | | | |
Robin A. Stelmach (k) (age 56) | | Trustee | | January 2014 | | 137 | | Massachusetts Financial Services Company, Vice Chair (since January 2017); Chief Operating Officer and Executive Vice President (until January 2017) | | N/A |
| | | | |
| INDEPENDENT TRUSTEES | | | | | | | | |
John P. Kavanaugh (age 63) | | Trustee and Chair of Trustees | | January 2009 | | 137 | | Private investor | | N/A |
| | | | | |
Steven E. Buller (age 66) | | Trustee | | February 2014 | | 137 | | Financial Accounting Standards Advisory Council, Chairman (2014-2015); Public Company Accounting Oversight Board, Standing Advisory Group, Member (until 2014); BlackRock, Inc. (investment management), Managing Director (until 2014), BlackRock Finco UK (investment management), Director (until 2014) | | N/A |
| | | | | |
John A. Caroselli (age 63) | | Trustee | | March 2017 | | 137 | | JC Global Advisors, LLC (management consulting), President (since 2015); First Capital Corporation (commercial finance), Executive Vice President (until 2015) | | N/A |
| | | | | |
Maureen R. Goldfarb (age 62) | | Trustee | | January 2009 | | 137 | | Private investor | | N/A |
| | | | | |
Michael Hegarty (age 73) | | Trustee | | December 2004 | | 137 | | Private investor | | Rouse Properties Inc., Director (until 2016); Capmark Financial Group Inc., Director (until 2015) |
| | | | | |
Clarence Otis, Jr. (age 61) | | Trustee | | March 2017 | | 137 | | Darden Restaurants, Inc., Chief Executive Officer (until 2014) | | VF Corporation, Director; Verizon Communications, Inc., Director; The Travelers Companies, Director; Federal Reserve Bank of Atlanta, Director (until 2015) |
| | | | | |
Maryanne L. Roepke (age 61) | | Trustee | | May 2014 | | 137 | | American Century Investments (investment management), Senior Vice President and Chief Compliance Officer (until 2014) | | N/A |
| | | | | |
Laurie J. Thomsen (age 60) | | Trustee | | March 2005 | | 137 | | Private investor | | The Travelers Companies, Director; Dycom Industries, Inc., Director (since 2015) |
21
MFS Conservative Allocation Portfolio
Trustees and Officers – continued
| | | | | | | | |
Name, Age | | Position(s)
Held with Fund | | Trustee/Officer
Since (h) | | Number of
MFS Funds
for which the
Person is an
Officer | | Principal Occupations During the Past Five Years |
| OFFICERS | | | | | | | | |
Christopher R. Bohane (k) (age 44) | | Assistant Secretary and Assistant Clerk | | July 2005 | | 137 | | Massachusetts Financial Services Company, Vice President and Assistant General Counsel |
| | | | |
Kino Clark (k) (age 49) | | Assistant Treasurer | | January 2012 | | 137 | | Massachusetts Financial Services Company, Vice President |
| | | | |
John W. Clark, Jr. (k) (age 50) | | Assistant Treasurer | | April 2017 | | 137 | | Massachusetts Financial Services Company, Vice President (since March 2017); Deutsche Bank (financial services), Department Head – Treasurer’s Office (until February 2017) |
| | | | |
Thomas H. Connors (k) (age 58) | | Assistant Secretary and Assistant Clerk | | September 2012 | | 137 | | Massachusetts Financial Services Company, Vice President and Senior Counsel |
| | | | |
Ethan D. Corey (k) (age 54) | | Assistant Secretary and Assistant Clerk | | July 2005 | | 137 | | Massachusetts Financial Services Company, Senior Vice President and Associate General Counsel |
| | | | |
David L. DiLorenzo (k) (age 49) | | President | | July 2005 | | 137 | | Massachusetts Financial Services Company, Senior Vice President |
| | | | |
Heidi W. Hardin (k) (age 50) | | Secretary and Clerk | | April 2017 | | 137 | | Massachusetts Financial Services Company, Executive Vice President and General Counsel (since March 2017); Harris Associates (investment management), General Counsel (from September 2015 to January 2017); Janus Capital Management LLC (investment management), Senior Vice President and General Counsel (until September 2015) |
| | | | |
Brian E. Langenfeld (k) (age 44) | | Assistant Secretary and Assistant Clerk | | June 2006 | | 137 | | Massachusetts Financial Services Company, Vice President and Senior Counsel |
| | | | |
Susan A. Pereira (k) (age 47) | | Assistant Secretary and Assistant Clerk | | July 2005 | | 137 | | Massachusetts Financial Services Company, Vice President and Senior Counsel |
| | | | |
Kasey L. Phillips (k) (age 47) | | Assistant Treasurer | | September 2012 | | 137 | | Massachusetts Financial Services Company, Vice President |
| | | | |
Matthew A. Stowe (k) (age 43) | | Assistant Secretary and Assistant Clerk | | October 2014 | | 137 | | Massachusetts Financial Services Company, Vice President and Assistant General Counsel |
| | | | |
Frank L. Tarantino (age 73) | | Independent Senior Officer | | June 2004 | | 137 | | Tarantino LLC (provider of compliance services), Principal |
| | | | |
Richard S. Weitzel (k) (age 47) | | Assistant Secretary and Assistant Clerk | | October 2007 | | 137 | | Massachusetts Financial Services Company, Senior Vice President and Associate General Counsel |
| | | | |
Martin J. Wolin (k) (age 50) | | Chief Compliance Officer | | July 2015 | | 137 | | Massachusetts Financial Services Company, Senior Vice President and Chief Compliance Officer (since July 2015); Mercer (financial service provider), Chief Risk and Compliance Officer, North America and Latin America (until June 2015) |
| | | | |
James O. Yost (k) (age 57) | | Treasurer | | September 1990 | | 137 | | Massachusetts Financial Services Company, Senior Vice President |
| (h) | Date first appointed to serve as Trustee/officer of an MFS Fund. Each Trustee has served continuously since appointment unless indicated otherwise. For the period from December 15, 2004 until February 22, 2005, Mr. Manning served as Advisory Trustee. Prior to January 2012, Messrs. DiLorenzo and Yost served as Assistant Treasurers of the Funds. From January 2012 through December 2016, Messrs. DiLorenzo and Yost served as Treasurer and Deputy Treasurer of the Funds, respectively. |
| (j) | Directorships or trusteeships of companies required to report to the Securities and Exchange Commission (i.e., “public companies”). |
| (k) | “Interested person” of the Trust within the meaning of the Investment Company Act of 1940 (referred to as the 1940 Act), which is the principal federal law governing investment companies like the fund, as a result of a position with MFS. The address of MFS is 111 Huntington Avenue, Boston, Massachusetts 02199-7618. |
22
MFS Conservative Allocation Portfolio
Trustees and Officers – continued
Each Trustee has been elected by shareholders and each Trustee and officer holds office until his or her successor is chosen and qualified or until his or her earlier death, resignation, retirement or removal. The Trust does not hold annual meetings for the purpose of electing Trustees, and Trustees are not elected for fixed terms. Under the terms of the Board’s retirement policy, an Independent Trustee shall retire at the end of the calendar year in which he or she reaches the earlier of 75 years of age or 15 years of service on the Board (or, in the case of any Independent Trustee who joined the Board prior to 2015, 20 years of service on the Board).
Messrs. Buller and Otis and Ms. Roepke are members of the Trust’s Audit Committee.
Each of the Interested Trustees and certain Officers hold comparable officer positions with certain affiliates of MFS.
The Statement of Additional Information for a Fund includes further information about the Trustees and is available without charge upon request by calling 1-800-225-2606.
| | |
Investment Adviser Massachusetts Financial Services Company 111 Huntington Avenue Boston, MA 02199-7618 | | Custodian State Street Bank and Trust Company 1 Lincoln Street Boston, MA 02111-2900 |
Distributor MFS Fund Distributors, Inc. 111 Huntington Avenue Boston, MA 02199-7618 | | Independent Registered Public Accounting Firm Deloitte & Touche LLP 200 Berkeley Street Boston, MA 02116 |
Portfolio Manager(s) Joseph Flaherty | | |
23
MFS Conservative Allocation Portfolio
BOARD REVIEW OF INVESTMENT ADVISORY AGREEMENT
The Investment Company Act of 1940 requires that both the full Board of Trustees and a majority of the non-interested (“independent”) Trustees, voting separately, annually approve the continuation of the Fund’s investment advisory agreement with MFS. The Trustees consider matters bearing on the Fund and its advisory arrangements at their meetings throughout the year, including a review of performance data at each regular meeting. In addition, the independent Trustees met several times over the course of three months beginning in May and ending in July, 2017 (“contract review meetings”) for the specific purpose of considering whether to approve the continuation of the investment advisory agreement for the Fund and the other investment companies that the Board oversees (the “MFS Funds”). The independent Trustees were assisted in their evaluation of the Fund’s investment advisory agreement by independent legal counsel, from whom they received separate legal advice and with whom they met separately from MFS during various contract review meetings. The independent Trustees were also assisted in this process by the MFS Funds’ Independent Senior Officer, a senior officer appointed by and reporting to the independent Trustees.
In connection with their deliberations regarding the continuation of the investment advisory agreement, the Trustees, including the independent Trustees, considered such information and factors as they believed, in light of the legal advice furnished to them and their own business judgment, to be relevant. The investment advisory agreement for the Fund was considered separately, although the Trustees also took into account the common interests of all MFS Funds in their review. As described below, the Trustees considered the nature, quality, and extent of the various investment advisory, administrative, and shareholder services performed by MFS under the existing investment advisory agreement and other arrangements with the Fund.
In connection with their contract review meetings, the Trustees received and relied upon materials that included, among other items: (i) information provided by Broadridge Financial Solutions, Inc. (“Broadridge”), an independent third party, on the investment performance of the Fund for various time periods ended December 31, 2016 and the investment performance of a group of funds with substantially similar investment classifications/objectives (the “Lipper performance universe”), (ii) information provided by Broadridge on the Fund’s fees and expenses and the fees and expenses of comparable funds identified by Broadridge (the “Broadridge expense group”), (iii) information as to whether and to what extent applicable expense waivers and reimbursements are observed for the Fund, (iv) information regarding MFS’ financial results and financial condition, including MFS’ and certain of its affiliates’ estimated profitability from services performed for the Fund and the MFS Funds as a whole, and compared to MFS’ institutional business, (v) MFS’ views regarding the outlook for the mutual fund industry and the strategic business plans of MFS, (vi) descriptions of various functions performed by MFS for the Funds, such as compliance monitoring and portfolio trading practices, and (vii) information regarding the overall organization of MFS, including information about MFS’ senior management and other personnel providing investment advisory, administrative and other services to the Fund and the other MFS Funds. The comparative performance, fee and expense information prepared and provided by Broadridge was not independently verified and the independent Trustees did not independently verify any information provided to them by MFS.
The Trustees’ conclusion as to the continuation of the investment advisory agreement was based on a comprehensive consideration of all information provided to the Trustees and not the result of any single factor. Some of the factors that figured particularly in the Trustees’ deliberations are described below, although individual Trustees may have evaluated the information presented differently from one another, giving different weights to various factors. It is also important to recognize that the fee arrangements for the Fund and other MFS Funds are the result of years of review and discussion between the independent Trustees and MFS, that certain aspects of such arrangements may receive greater scrutiny in some years than in others, and that the Trustees’ conclusions may be based, in part, on their consideration of these same arrangements during the course of the year and in prior years.
Based on information provided by Broadridge and MFS, the Trustees reviewed the Fund’s total return investment performance as well as the performance of peer groups of funds over various time periods. The Trustees placed particular emphasis on the total return performance of the Fund’s Initial Class shares in comparison to the performance of funds in its Lipper performance universe over the three-year period ended December 31, 2016, which the Trustees believed was a long enough period to reflect differing market conditions. The total return performance of the Fund’s Initial Class shares was in the 2nd quintile relative to the other funds in the universe for this three-year period (the 1st quintile being the best performers and the 5th quintile being the worst performers). The total return performance of the Fund’s Initial Class shares was in the 3rd quintile for the one-year period and the 2nd quintile for the five-year period ended December 31, 2016 relative to the Lipper performance universe. Because of the passage of time, these performance results may differ from the performance results for more recent periods, including those shown elsewhere in this report.
In the course of their deliberations, the Trustees took into account information provided by MFS in connection with the contract review meetings, as well as during investment review meetings conducted with portfolio management personnel during the course of the year regarding the Fund’s performance. After reviewing these and related factors, the Trustees concluded, within the context of their overall conclusions regarding the investment advisory agreement, that they were satisfied with MFS’ responses and efforts relating to investment performance.
The Trustees considered that MFS does not charge an advisory fee for providing investment advisory services to the Fund, but that the Fund pays its pro rata share of the advisory fees paid by the underlying funds in which it invests (the “Underlying Funds”).
24
MFS Conservative Allocation Portfolio
Board Review of Investment Advisory Agreement – continued
In assessing the reasonableness of the Fund’s expenses, the Trustees considered, among other information, the Fund’s total expense ratio of the Fund’s Initial Class shares as a percentage of average daily net assets and the total expense ratios of peer groups of funds based on information provided by Broadridge. The Trustees considered that MFS currently observes an expense limitation for the Fund, which may not be changed without the Trustees’ approval. The Trustees also considered that, according to the data provided by Broadridge (which takes into account any expense limitations that were in effect during the Fund’s last fiscal year), the Fund’s total expense ratio was approximately at the Broadridge expense group median. Because the Fund does not pay an advisory fee, the Trustees did not consider the extent to which economies of scale would be realized due to the Fund’s growth of assets, whether fee levels reflect economies of scale for shareholders, or the fees paid by similar funds to other investment advisers or by similar clients of MFS.
The Trustees also considered information prepared by MFS relating to MFS’ costs and profits with respect to the Fund, the MFS Funds considered as a group, and other investment companies and accounts advised by MFS, as well as MFS’ methodologies used to determine and allocate its costs to the MFS Funds, the Fund and other accounts and products for purposes of estimating profitability.
In addition, the Trustees considered MFS’ resources and related efforts to continue to retain, attract and motivate capable personnel to serve the Fund. The Trustees also considered current and developing conditions in the financial services industry, including the presence of large and well-capitalized companies which are spending, and appear to be prepared to continue to spend, substantial sums to engage personnel and to provide services to competing investment companies. In this regard, the Trustees also considered the financial resources of MFS and its ultimate parent, Sun Life Financial Inc. The Trustees also considered the advantages and possible disadvantages to the Fund of having an adviser that also serves other investment companies as well as other accounts.
The Trustees also considered the nature, quality, cost, and extent of administrative, transfer agency, and distribution services provided to the Fund by MFS and its affiliates under agreements and plans other than the investment advisory agreement, including any 12b-1 fees the Fund pays to MFS Fund Distributors, Inc., an affiliate of MFS. The Trustees also considered the nature, extent and quality of certain other services MFS performs or arranges for on the Fund’s or the Underlying Funds’ behalf, which may include securities lending programs, directed expense payment programs, class action recovery programs, and MFS’ interaction with third-party service providers, principally custodians and sub-custodians. The Trustees concluded that the various non-advisory services provided by MFS and its affiliates on behalf of the Fund were satisfactory.
The Trustees also considered benefits to MFS from the use of the Underlying Funds’ portfolio brokerage commissions, if applicable, to pay for investment research and various other factors. Additionally, the Trustees considered so-called “fall-out benefits” to MFS such as reputational value derived from serving as investment manager to the Fund.
Based on their evaluation of factors that they deemed to be material, including those factors described above, the Board of Trustees, including the independent Trustees, concluded that the Fund’s investment advisory agreement with MFS should be continued for an additional one-year period, commencing August 1, 2017.
25
MFS Conservative Allocation Portfolio
PROXY VOTING POLICIES AND INFORMATION
MFS votes proxies on behalf of the fund pursuant to proxy voting policies and procedures that are available without charge, upon request, by calling 1-800-225-2606, by visiting mfs.com/proxyvoting, or by visiting the SEC’s Web site at http://www.sec.gov.
Information regarding how the fund voted proxies relating to portfolio securities during the most recent twelve-month period ended June 30 is available by August 31 of each year without charge by visiting mfs.com/proxyvoting, or by visiting the SEC’s Web site at http://www.sec.gov.
QUARTERLY PORTFOLIO DISCLOSURE
The fund will file a complete schedule of portfolio holdings with the Securities and Exchange Commission (the Commission) for the first and third quarters of each fiscal year on Form N-Q. The fund’s Form N-Q is available on the EDGAR database on the Commission’s Internet Web site at http://www.sec.gov, and may be reviewed and copied at the:
Public Reference Room
Securities and Exchange Commission
100 F Street, NE, Room 1580
Washington, D.C. 20549
Information on the operation of the Public Reference Room may be obtained by calling the Commission at 1-800-SEC-0330. Copies of the fund’s Form N-Q also may be obtained, upon payment of a duplicating fee, by electronic request at the following e-mail address: publicinfo@sec.gov or by writing the Public Reference Section at the above address.
FURTHER INFORMATION
From time to time, MFS may post important information about the fund or the MFS funds on the MFS web site (mfs.com). This information is available at https://www.mfs.com/en-us/what-we-do/announcements.html or at mfs.com/vit3 by choosing the fund’s name.
INFORMATION ABOUT FUND CONTRACTS AND LEGAL CLAIMS
The fund has entered into contractual arrangements with an investment adviser, administrator, distributor, shareholder servicing agent, 529 program manager (if applicable), and custodian who each provide services to the fund. Unless expressly stated otherwise, shareholders are not parties to, or intended beneficiaries of these contractual arrangements, and these contractual arrangements are not intended to create any shareholder right to enforce them against the service providers or to seek any remedy under them against the service providers, either directly or on behalf of the fund.
Under the Trust’s By-Laws and Declaration of Trust, any claims asserted against or on behalf of the MFS Funds, including claims against Trustees and Officers, must be brought in state and federal courts located within the Commonwealth of Massachusetts.
FEDERAL TAX INFORMATION (unaudited)
The following information is provided pursuant to provisions of the Internal Revenue Code.
The fund designates $16,614,000 as capital gain dividends paid during the fiscal year.
For corporate shareholders, 17.05% of the ordinary income dividends paid during the fiscal year qualify for the corporate dividends received deduction.
26
rev. 3/16
| | | | |
| FACTS | | WHAT DOES MFS DO WITH YOUR
PERSONAL INFORMATION? | |  |
| | |
| Why? | | Financial companies choose how they share your personal information. Federal law gives consumers the right to limit some but not all sharing. Federal law also requires us to tell you how we collect, share, and protect your personal information. Please read this notice carefully to understand what we do. |
| | |
| What? | | The types of personal information we collect and share depend on the product or service you have with us. This information can include: • Social Security number and account balances • Account transactions and transaction history • Checking account information and wire transfer instructions When you are no longer our customer, we continue to share your information as described in this notice. |
| | |
| How? | | All financial companies need to share customers’ personal information to run their everyday business. In the section below, we list the reasons financial companies can share their customers’ personal information; the reasons MFS chooses to share; and whether you can limit this sharing. |
| | | | |
Reasons we can share your
personal information | | Does MFS share? | | Can you limit this
sharing? |
For our everyday business purposes – such as to process your transactions, maintain your account(s), respond to court orders and legal investigations, or report to credit bureaus | | Yes | | No |
For our marketing purposes – to offer our products and services to you | | No | | We don’t share |
| For joint marketing with other financial companies | | No | | We don’t share |
For our affiliates’ everyday business purposes – information about your transactions and experiences | | No | | We don’t share |
For our affiliates’ everyday business purposes – information about your creditworthiness | | No | | We don’t share |
| For nonaffiliates to market to you | | No | | We don’t share |
| | |
| Questions? | | Call 800-225-2606 or go to mfs.com. |
27
| | |
| Who we are |
| Who is providing this notice? | | MFS Funds, MFS Investment Management, MFS Institutional Advisors, Inc., and MFS Heritage Trust Company. |
| | |
| What we do |
| How does MFS protect my personal information? | | To protect your personal information from unauthorized access and use, we use security measures that comply with federal law. These measures include procedural, electronic, and physical safeguards for the protection of the personal information we collect about you. |
How does MFS
collect my personal information? | | We collect your personal information, for example, when you • open an account or provide account information • direct us to buy securities or direct us to sell your securities • make a wire transfer We also collect your personal information from others, such as credit bureaus, affiliates, or other companies. |
| Why can’t I limit all sharing? | | Federal law gives you the right to limit only • sharing for affiliates’ everyday business purposes – information about your creditworthiness • affiliates from using your information to market to you • sharing for nonaffiliates to market to you State laws and individual companies may give you additional rights to limit sharing. |
| | |
| Definitions |
| Affiliates | | Companies related by common ownership or control. They can be financial and nonfinancial companies. • MFS does not share personal information with affiliates, except for everyday business purposes as described on page one of this notice. |
| Nonaffiliates | | Companies not related by common ownership or control. They can be financial and nonfinancial companies. • MFS does not share with nonaffiliates so they can market to you. |
| Joint marketing | | A formal agreement between nonaffiliated financial companies that together market financial products or services to you. • MFS doesn’t jointly market. |
| | |
| Other important information |
| If you own an MFS product or receive an MFS service in the name of a third party such as a bank or broker-dealer, their privacy policy may apply to you instead of ours. |
28
ANNUAL REPORT
December 31, 2017

MFS® GLOBAL REAL ESTATE PORTFOLIO
MFS® Variable Insurance Trust III

VRE-ANN
MFS® GLOBAL REAL ESTATE PORTFOLIO
CONTENTS
The report is prepared for the general information of contract owners. It is authorized for distribution to prospective investors only when preceded or accompanied by a current prospectus.
NOT FDIC INSURED • MAY LOSE VALUE • NO BANK OR CREDIT UNION GUARANTEE • NOT A DEPOSIT • NOT INSURED BY ANY FEDERAL GOVERNMENT AGENCY OR NCUA/NCUSIF
MFS Global Real Estate Portfolio
LETTER FROM THE EXECUTIVE CHAIRMAN

Dear Contract Owners:
Rising bond yields have led to a measurable uptick in market volatility, which has been a departure from the low-volatility environment that prevailed for much of 2017. In spite of this, global markets remain elevated amid synchronized economic growth. Although the U.S. Federal Reserve continues to gradually raise interest rates and shrink its balance sheet, monetary policy remains accommodative around the world, with many central banks taking only tentative steps toward tighter policies. However, interest rates have begun to rise globally of late as investors anticipate that central policy shifts may be necessary in the months ahead.
Newly enacted U.S. tax reforms have been welcomed by equity markets while emerging market economies have been boosted by a weaker U.S. dollar. Around the world, inflation remains largely subdued but tight labor markets and solid global demand have investors on the lookout for its potential resurgence amid robust global trade and recovering commodity prices.
At MFS®, we believe having a disciplined, long-term investment approach through a full market cycle is essential to capturing the best opportunities while also managing risk. In our view, such a strategy, along with the professional guidance of a financial advisor, will help you reach your investment objectives.
Respectfully,

Robert J. Manning
Executive Chairman
MFS Investment Management
February 15, 2018
The opinions expressed in this letter are subject to change and may not be relied upon for investment advice. No forecasts can be guaranteed.
1
MFS Global Real Estate Portfolio
PORTFOLIO COMPOSITION
Portfolio structure

| | | | |
| Top ten holdings | | | | |
| Simon Property Group, Inc., REIT | | | 5.5% | |
| Public Storage, Inc., REIT | | | 4.3% | |
| Unibail-Rodamco, REIT | | | 4.0% | |
| Mitsui Fudosan Co. Ltd. | | | 3.2% | |
| Link REIT | | | 3.2% | |
| Gateway Lifestyle Group Stapled Security | | | 2.9% | |
| Medical Properties Trust, Inc., REIT | | | 2.7% | |
| Sun Communities, Inc., REIT | | | 2.7% | |
| Hang Lung Properties Ltd. | | | 2.7% | |
| Mid-America Apartment Communities, Inc., REIT | | | 2.6% | |
| |
| Equity industries | | | | |
| Real Estate | | | 97.4% | |
| Telecommunications – Wireless | | | 1.8% | |
| | | | |
| Issuer country weightings (x) | | | | |
| United States | | | 52.4% | |
| Japan | | | 8.5% | |
| United Kingdom | | | 7.6% | |
| Hong Kong | | | 6.9% | |
| Australia | | | 5.2% | |
| Singapore | | | 4.3% | |
| France | | | 4.0% | |
| Germany | | | 3.4% | |
| Canada | | | 2.3% | |
| Other Countries | | | 5.4% | |
| |
| Currency exposure weightings (y) | | | | |
| United States Dollar | | | 52.4% | |
| Euro | | | 11.4% | |
| Japanese Yen | | | 8.5% | |
| British Pound Sterling | | | 7.6% | |
| Hong Kong Dollar | | | 6.9% | |
| Australian Dollar | | | 5.2% | |
| Singapore Dollar | | | 4.3% | |
| Canadian Dollar | | | 2.3% | |
| Norwegian Krone | | | 1.4% | |
| (x) | Represents the portfolio’s exposure to issuer countries as a percentage of a portfolio’s net assets. For purposes of this presentation, United States includes Cash & Cash Equivalents. |
| (y) | Represents the portfolio’s exposure to a particular currency as a percentage of a portfolio’s net assets. For purposes of this presentation, United States Dollar includes Cash & Cash Equivalents. |
Cash & Cash Equivalents includes any cash, investments in money market funds, short-term securities, and other assets less liabilities. Please see the Statement of Assets and Liabilities for additional information related to the fund’s cash position and other assets and liabilities.
Percentages are based on net assets as of December 31, 2017.
The portfolio is actively managed and current holdings may be different.
2
MFS Global Real Estate Portfolio
MANAGEMENT REVIEW
Summary of Results
For the twelve months ended December 31, 2017, Initial Class shares of the MFS Global Real Estate Portfolio (“fund”) provided a total return of 13.33%, while Service Class shares of the fund provided a total return of 13.07%. These compare with a return of 10.36% over the same period for the fund’s benchmark, the FTSE EPRA/NAREIT Developed Real Estate Index (net div).
Market Environment
For the first time in many years, the global economy experienced a period of synchronized economic growth over the reporting period. The rebound in emerging markets (“EM”) economies was more pronounced (despite the slight deceleration in Chinese growth at the end of the period), helped by larger economies, such as Brazil and Russia, emerging from recessions. At the same time, developed markets (“DM”) economies continued to grow at or above potential. Market confidence increased in the US during the period fueled, in part, by a more lenient US regulatory backdrop and hopes for a significant cut in corporate tax rates, which came to fruition at the end of the period.
Globally, markets benefited from a reflation trade as commodity prices strengthened, activity and growth prospects improved, and inflation moved higher, though within moderate bounds. As a result, there were more tightening signals and actions by DM central banks. The US Federal Reserve increased interest rates by 25 basis points three times during the period, bringing the total number of quarter-percent hikes in the federal funds rate to five, since December 2015. The European Central Bank announced an extension of its quantitative easing program at the end of the period, but reduced the pace of its monthly asset purchases by half. In addition, the Bank of England hiked its base rate for the first time in a decade, late in the end of the period. Markets were comforted, along with central banks, by the decline in fears of a populist surge in Europe after establishment candidates won the Dutch and French elections, though a right-wing populist party gained seats in the German parliament for the first time in the post-World War II era. Additionally, European growth reflected a generally calmer political economic backdrop.
In recent months, the US dollar reversed the sharp rise seen early in the period, easing what had been a substantial headwind to earnings for multinationals. US consumer spending held up well during the second half of the period amid a modest increase in real wages and relatively low gasoline prices. However, demand for autos cooled from the record level logged early in the period, while the housing market improved, albeit constrained by below-average inventory levels. Global trade, which was sluggish early in the period, showed signs of improvement in the period’s second half, a positive indicator of global economic activity and prospects. Early in the period, there was a selloff in EM due to fears that President Trump would follow through on various campaign threats and promises that were judged to be detrimental to EM. While President Trump withdrew the US from the Trans-Pacific Partnership and began the renegotiation of the North American Free Trade Agreement, significant additional policy action was lacking on economic issues involving EM. As a result, EM resumed their upward trajectory, powered by strong inflows throughout 2017.
Contributors to Performance
Strong security selection within both United States and United Kingdom real estate investments contributed to performance relative to the FTSE EPRA/NAREIT Developed Real Estate Index. Within the United States, the fund’s position in wireless communications infrastructure provider American Tower (b) bolstered relative results. Within the United Kingdom, overweight positions in self-storage company Big Yellow Group and property investment and development business Derwent London further supported relative results.
The fund’s overweight positions in both Norway and Singapore real estate investments also benefited relative performance. Within Norway, an overweight position in real estate company Entra ASA aided relative results. Within Singapore, an overweight position in real estate development, investment and capital management company Mapletree Logistics Trust bolstered relative returns.
Elsewhere, the fund’s overweight positions in property development company Kerry Properties (h) (Hong Kong), real estate investment trust Link REIT (Hong Kong), property developer Hang Lung Properties (Hong Kong) and real estate company Grand City Properties buoyed relative results. Additionally, not holding shares of poor-performing real estate developer Mitsubishi Estate (Japan) further contributed to relative performance.
Detractors from Performance
Weak security selection in both Canadian-based and French-based real estate investments detracted from relative performance. However, there were no individual stocks within either country that were among the fund’s largest relative detractors during the reporting period.
An underweight position and security selection in German real estate investments also hindered relative results. Here, not holding shares of housing association Vonovia weighed on relative returns.
3
MFS Global Real Estate Portfolio
Management Review – continued
Other notable detractors from relative performance included the fund’s overweight positions in real estate investment trust Washington Prime Group, real estate companies Tanger Factory Outlet Centers (h), Advance Residence Investment (Japan) and Mitsui Fudosan, Real Estate Investment Trust Japan Logistics Fund (Japan) and self-storage company Public Storage. Additionally, not holding shares of real estate companies Sun Hung Kai Properties (Hong Kong) and Prologis, and an underweight position in property developer CK Asset Holdings (h) (Hong Kong), hindered relative performance.
Respectfully,
Portfolio Manager(s)
Rick Gable
| (b) | Security is not a benchmark constituent. |
| (h) | Security was not held in the portfolio at period end. |
The views expressed in this report are those of the portfolio manager(s) only through the end of the period of the report as stated on the cover and do not necessarily reflect the views of MFS or any other person in the MFS organization. These views are subject to change at any time based on market or other conditions, and MFS disclaims any responsibility to update such views. These views may not be relied upon as investment advice or an indication of trading intent on behalf of any MFS portfolio. References to specific securities are not recommendations of such securities, and may not be representative of any MFS portfolio’s current or future investments.
4
MFS Global Real Estate Portfolio
PERFORMANCE SUMMARY THROUGH 12/31/17
The following chart illustrates the historical performance of the fund in comparison to its benchmark(s). Benchmarks are unmanaged and may not be invested in directly. Benchmark returns do not reflect any fees or expenses. The performance of other share classes will be greater than or less than that of the class depicted below. (See Notes to Performance Summary.)
Performance data shown represents past performance and is no guarantee of future results. Investment return and principal value fluctuate so your units, when sold, may be worth more or less than the original cost; current performance may be lower or higher than quoted. The performance shown does not reflect the deduction of taxes, if any, that a contract holder would pay on fund distributions or the redemption of contract units. The returns for the fund shown also do not reflect the deduction of expenses associated with variable products, such as mortality and expense risk charges, separate account charges, and sales charges imposed by the insurance company separate accounts. Such expenses would reduce the overall returns shown.
Growth of a Hypothetical $10,000 Investment
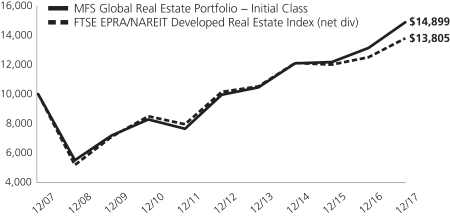
Total Returns through 12/31/17
Average annual total returns
| | | | | | | | | | | | |
| | | Share Class | | Class Inception Date | | 1-yr | | 5-yr | | 10-yr | | |
| | | Initial Class | | 12/07/98 | | 13.33% | | 8.39% | | 4.07% | | |
| | | Service Class | | 2/01/04 | | 13.07% | | 8.13% | | 3.81% | | |
| | | | |
| Comparative benchmark(s) | | | | | | | | |
| | | FTSE EPRA/NAREIT Developed Real Estate Index (net div) (f) | | 10.36% | | 6.32% | | 3.28% | | |
| (f) | Source: FactSet Research Systems Inc. |
Benchmark Definition(s)
FTSE EPRA/NAREIT Developed Real Estate Index (net div) – measures the performance of eligible real estate equities worldwide that generate a majority of their revenue and income through the ownership, disposure and development of income-producing real estate.
It is not possible to invest directly in an index.
Notes to Performance Summary
Average annual total return represents the average annual change in value for each share class for the periods presented.
Performance results reflect any applicable expense subsidies and waivers in effect during the periods shown. Without such subsidies and waivers the fund’s performance results would be less favorable. Please see the prospectus and financial statements for complete details. All results are historical and assume the reinvestment of any dividends and capital gains distributions.
Performance results do not include adjustments made for financial reporting purposes in accordance with U.S. generally accepted accounting principles and may differ from amounts reported in the financial highlights.
From time to time the fund may receive proceeds from litigation settlements, without which performance would be lower.
5
MFS Global Real Estate Portfolio
EXPENSE TABLE
Fund Expenses Borne by the Contract Holders during the Period, July 1, 2017 through December 31, 2017
As a contract holder of the fund, you incur ongoing costs, including management fees; distribution and/or service (12b-1) fees; and other fund expenses. This example is intended to help you understand your ongoing costs (in dollars) of investing in the fund and to compare these costs with the ongoing costs of investing in other mutual funds.
The example is based on an investment of $1,000 invested at the beginning of the period and held for the entire period July 1, 2017 through December 31, 2017.
Actual Expenses
The first line for each share class in the following table provides information about actual account values and actual expenses. You may use the information in this line, together with the amount you invested, to estimate the expenses that you paid over the period. Simply divide your account value by $1,000 (for example, an $8,600 account value divided by $1,000 = 8.6), then multiply the result by the number in the first line under the heading entitled “Expenses Paid During Period” to estimate the expenses you paid on your account during this period.
Hypothetical Example for Comparison Purposes
The second line for each share class in the following table provides information about hypothetical account values and hypothetical expenses based on the fund’s actual expense ratio and an assumed rate of return of 5% per year before expenses, which is not the fund’s actual return. The hypothetical account values and expenses may not be used to estimate the actual ending account balance or expenses you paid for the period. You may use this information to compare the ongoing costs of investing in the fund and other funds. To do so, compare this 5% hypothetical example with the 5% hypothetical examples that appear in the shareholder reports of the other funds.
Please note that the expenses shown in the table are meant to highlight the fund’s ongoing costs only and do not take into account the fees and expenses imposed under the variable contracts through which your investment in the fund is made. Therefore, the second line for each share class in the table is useful in comparing ongoing costs associated with an investment in vehicles (such as the fund) which fund benefits under variable annuity and variable life insurance contracts and to qualified pension and retirement plans only, and will not help you determine the relative total costs of investing in the fund through variable annuity and variable life insurance contracts. If the fees and expenses imposed under the variable contracts were included, your costs would have been higher.
| | | | | | | | | | | | | | | | | | |
| Share Class | | | | Annualized
Expense Ratio | | | Beginning
Account Value
7/01/17 | | | Ending
Account Value
12/31/17 | | | Expenses Paid
During Period (p)
7/01/17-12/31/17 | |
| Initial Class | | Actual | | | 0.92% | | | | $1,000.00 | | | | $1,060.63 | | | | $4.78 | |
| | Hypothetical (h) | | | 0.92% | | | | $1,000.00 | | | | $1,020.57 | | | | $4.69 | |
| Service Class | | Actual | | | 1.17% | | | | $1,000.00 | | | | $1,059.33 | | | | $6.07 | |
| | Hypothetical (h) | | | 1.17% | | | | $1,000.00 | | | | $1,019.31 | | | | $5.96 | |
| (h) | 5% class return per year before expenses. |
| (p) | “Expenses Paid During Period” are equal to each class’s annualized expense ratio, as shown above, multiplied by the average account value over the period, multiplied by 184/365 (to reflect the one-half year period). |
6
MFS Global Real Estate Portfolio
PORTFOLIO OF INVESTMENTS – 12/31/17
The Portfolio of Investments is a complete list of all securities owned by your fund. It is categorized by broad-based asset classes.
| | | | | | | | |
| Issuer | | Shares/Par | | | Value ($) | |
| COMMON STOCKS – 99.2% | | | | | | | | |
| Real Estate – 97.4% | | | | | | | | |
| Advance Residence Investment Corp., REIT | | | 1,630 | | | $ | 4,008,635 | |
| Alexandria Real Estate Equities, Inc., REIT | | | 34,447 | | | | 4,498,434 | |
| American Homes 4 Rent, “A”, REIT | | | 145,429 | | | | 3,176,169 | |
| Ascendas India Trust, REIT | | | 4,361,000 | | | | 3,749,785 | |
| Atrium European Real Estate Ltd. | | | 687,174 | | | | 3,421,697 | |
| AvalonBay Communities, Inc., REIT | | | 26,212 | | | | 4,676,483 | |
| Big Yellow Group PLC, REIT | | | 318,242 | | | | 3,736,021 | |
| Boardwalk, REIT | | | 122,914 | | | | 4,213,496 | |
| Brixmor Property Group Inc., REIT | | | 215,525 | | | | 4,021,697 | |
| Derwent London PLC, REIT | | | 114,198 | | | | 4,807,473 | |
| Entra ASA | | | 170,480 | | | | 2,533,135 | |
| Equity Lifestyle Properties, Inc., REIT | | | 45,078 | | | | 4,012,844 | |
| Fortune REIT | | | 1,541,000 | | | | 1,905,330 | |
| Gateway Lifestyle Group Stapled Security | | | 3,135,641 | | | | 5,333,555 | |
| Gramercy Property Trust, REIT | | | 151,208 | | | | 4,031,205 | |
| Grand City Properties S.A. | | | 145,019 | | | | 3,411,049 | |
| Hang Lung Properties Ltd. | | | 1,999,944 | | | | 4,889,244 | |
| Hibernia PLC, REIT | | | 1,145,704 | | | | 2,095,000 | |
| Japan Logistics Fund, Inc., REIT | | | 1,394 | | | | 2,570,874 | |
| Kenedix Office Investment Corp., REIT | | | 541 | | | | 3,072,909 | |
| LEG Immobilien AG | | | 25,347 | | | | 2,893,120 | |
| Life Storage, Inc., REIT | | | 47,130 | | | | 4,197,869 | |
| Link REIT | | | 632,764 | | | | 5,867,737 | |
| LondonMetric Property PLC, REIT | | | 1,075,583 | | | | 2,701,091 | |
| Mapletree Logistics Trust, REIT | | | 4,308,023 | | | | 4,251,815 | |
| Medical Properties Trust, Inc., REIT | | | 365,186 | | | | 5,032,263 | |
| Mid-America Apartment Communities, Inc., REIT | | | 48,329 | | | | 4,859,964 | |
| Mitsui Fudosan Co. Ltd. | | | 266,575 | | | | 5,973,835 | |
| National Storage, REIT | | | 3,650,484 | | | | 4,372,127 | |
| OUTFRONT Media, Inc., REIT | | | 56,966 | | | | 1,321,611 | |
| Public Storage, Inc., REIT | | | 37,869 | | | | 7,914,621 | |
| Ramco-Gershenson Properties Trust, REIT | | | 241,333 | | | | 3,554,835 | |
| Rexford Industrial Realty, Inc., REIT | | | 51,758 | | | | 1,509,263 | |
| Shaftesbury PLC, REIT | | | 198,948 | | | | 2,804,286 | |
| Simon Property Group, Inc., REIT | | | 58,775 | | | | 10,094,021 | |
| STAG Industrial, Inc., REIT | | | 144,932 | | | | 3,960,992 | |
| Starwood Property Trust, Inc., REIT | | | 143,191 | | | | 3,057,128 | |
| Store Capital Corp., REIT | | | 164,686 | | | | 4,288,423 | |
| Sun Communities, Inc., REIT | | | 52,732 | | | | 4,892,475 | |
| Unibail-Rodamco, REIT | | | 29,001 | | | | 7,307,334 | |
| Urban Edge Properties, REIT | | | 115,571 | | | | 2,945,905 | |
| Warehouses De Pauw, REIT | | | 16,581 | | | | 1,858,762 | |
| Washington Prime Group, Inc., REIT | | | 564,575 | | | | 4,019,774 | |
| Welltower, Inc., REIT | | | 69,619 | | | | 4,439,604 | |
| Weyerhaeuser Co., REIT | | | 38,788 | | | | 1,367,665 | |
| | | | | | | | |
| | | $ | 179,651,555 | |
| | | | | | | | |
| | | | | | | | |
| Issuer | | Shares/Par | | | Value ($) | |
| COMMON STOCKS – continued | | | | | |
| Telecommunications – Wireless – 1.8% | |
| American Tower Corp., REIT | | | 23,096 | | | $ | 3,295,106 | |
| | | | | | | | |
Total Common Stocks
(Identified Cost, $154,878,561) | | | | | | $ | 182,946,661 | |
| | | | | | | | |
| |
| INVESTMENT COMPANIES (h) – 0.7% | | | | | |
| MUTUAL FUNDS – 0.7% | |
| MFS Institutional Money Market Portfolio, 1.25% (v) (Identified Cost, $1,208,768) | | | 1,208,889 | | | $ | 1,208,768 | |
| | | | | | | | |
OTHER ASSETS, LESS
LIABILITIES – 0.1% | | | | 209,836 | |
| | | | | | | | |
| NET ASSETS – 100.0% | | | | | | $ | 184,365,265 | |
| | | | | | | | |
| (h) | | An affiliated issuer may be considered one in which the fund owns 5% or more of the outstanding voting securities, or a company which is under common control. At period end, the aggregate values of the fund’s investments in affiliated issuers and in unaffiliated issuers were $1,208,768 and $182,946,661, respectively. |
| (v) | | Affiliated issuer that is available only to investment companies managed by MFS. The rate quoted for the MFS Institutional Money Market Portfolio is the annualized seven-day yield of the fund at period end. |
The following abbreviations are used in this report and are defined:
| PLC | | Public Limited Company |
| REIT | | Real Estate Investment Trust |
See Notes to Financial Statements
7
MFS Global Real Estate Portfolio
FINANCIAL STATEMENTS | STATEMENT OF ASSETS AND LIABILITIES
This statement represents your fund’s balance sheet, which details the assets and liabilities comprising the total value of the fund.
| | | | |
At 12/31/17 | | | | |
Assets | | | | |
Investments in unaffiliated issuers, at value (identified cost, $154,878,561) | | | $182,946,661 | |
Investments in affiliated issuers, at value (identified cost, $1,208,768) | | | 1,208,768 | |
Receivables for | | | | |
Fund shares sold | | | 19,817 | |
Dividends | | | 807,076 | |
Other assets | | | 1,503 | |
Total assets | | | $184,983,825 | |
Liabilities | | | | |
Payable to custodian | | | $2,561 | |
Payable for fund shares reacquired | | | 536,316 | |
Payable to affiliates | | | | |
Investment adviser | | | 12,082 | |
Shareholder servicing costs | | | 85 | |
Distribution and/or service fees | | | 1,919 | |
Payable for independent Trustees’ compensation | | | 33 | |
Accrued expenses and other liabilities | | | 65,564 | |
Total liabilities | | | $618,560 | |
Net assets | | | $184,365,265 | |
Net assets consist of | | | | |
Paid-in capital | | | $151,759,930 | |
Unrealized appreciation (depreciation) | | | 28,068,658 | |
Accumulated distributions in excess of net realized gain | | | (2,089,900 | ) |
Undistributed net investment income | | | 6,626,577 | |
Net assets | | | $184,365,265 | |
Shares of beneficial interest outstanding | | | 12,276,987 | |
| | | | | | | | | | | | |
| | | Net assets | | | Shares
outstanding | | | Net asset value
per share | |
Initial Class | | | $114,197,788 | | | | 8,001,338 | | | | $14.27 | |
Service Class | | | 70,167,477 | | | | 4,275,649 | | | | 16.41 | |
Net asset value per share is calculated using actual net assets and shares outstanding rather than amounts that have been rounded for presentation purposes.
See Notes to Financial Statements
8
MFS Global Real Estate Portfolio
FINANCIAL STATEMENTS | STATEMENT OF OPERATIONS
This statement describes how much your fund earned in investment income and accrued in expenses. It also describes any gains and/or losses generated by fund operations.
| | | | |
Year ended 12/31/17 | | | | |
Net investment income (loss) | | | | |
Income | | | | |
Dividends | | | $6,819,781 | |
Dividends from affiliated issuers | | | 12,788 | |
Foreign taxes withheld | | | (300,668 | ) |
Total investment income | | | $6,531,901 | |
Expenses | | | | |
Management fee | | | $1,687,185 | |
Distribution and/or service fees | | | 181,277 | |
Shareholder servicing costs | | | 7,931 | |
Administrative services fee | | | 39,229 | |
Independent Trustees’ compensation | | | 4,519 | |
Custodian fee | | | 25,199 | |
Shareholder communications | | | 42,444 | |
Audit and tax fees | | | 52,951 | |
Legal fees | | | 3,129 | |
Miscellaneous | | | 15,017 | |
Total expenses | | | $2,058,881 | |
Reduction of expenses by investment adviser | | | (151,165 | ) |
Net expenses | | | $1,907,716 | |
Net investment income (loss) | | | $4,624,185 | |
Realized and unrealized gain (loss) | | | | |
Realized gain (loss) (identified cost basis) | | | | |
Unaffiliated issuers | | | $3,019,077 | |
Affiliated issuers | | | 64 | |
Foreign currency | | | (2,879 | ) |
Net realized gain (loss) | | | $3,016,262 | |
Change in unrealized appreciation (depreciation) | | | | |
Unaffiliated issuers | | | $15,784,354 | |
Affiliated issuers | | | (125 | ) |
Translation of assets and liabilities in foreign currencies | | | 16,768 | |
Net unrealized gain (loss) | | | $15,800,997 | |
Net realized and unrealized gain (loss) | | | $18,817,259 | |
Change in net assets from operations | | | $23,441,444 | |
See Notes to Financial Statements
9
MFS Global Real Estate Portfolio
FINANCIAL STATEMENTS | STATEMENTS OF CHANGES IN NET ASSETS
These statements describe the increases and/or decreases in net assets resulting from operations, any distributions, and any shareholder transactions.
| | | | | | | | |
| | | Year ended | |
| | | 12/31/17 | | | | 12/31/16 | |
Change in net assets | | | | | | | | |
| From operations | | | | | | | | |
Net investment income (loss) | | | $4,624,185 | | | | $4,991,786 | |
Net realized gain (loss) | | | 3,016,262 | | | | 11,269,493 | |
Net unrealized gain (loss) | | | 15,800,997 | | | | (394,920 | ) |
Change in net assets from operations | | | $23,441,444 | | | | $15,866,359 | |
| Distributions declared to shareholders | | | | | | | | |
From net investment income | | | $(7,173,022 | ) | | | $(4,607,565 | ) |
From net realized gain | | | (10,457,204 | ) | | | (3,314,243 | ) |
Total distributions declared to shareholders | | | $(17,630,226 | ) | | | $(7,921,808 | ) |
Change in net assets from fund share transactions | | | $(11,722,179 | ) | | | $(25,366,300 | ) |
Total change in net assets | | | $(5,910,961 | ) | | | $(17,421,749 | ) |
| Net assets | | | | | | | | |
At beginning of period | | | 190,276,226 | | | | 207,697,975 | |
At end of period (including undistributed net investment income of $6,626,577 and
$7,501,834, respectively) | | | $184,365,265 | | | | $190,276,226 | |
See Notes to Financial Statements
10
MFS Global Real Estate Portfolio
FINANCIAL STATEMENTS | FINANCIAL HIGHLIGHTS
The financial highlights table is intended to help you understand the fund’s financial performance for the past 5 years. Certain information reflects financial results for a single fund share. The total returns in the table represent the rate that an investor would have earned (or lost) on an investment in the fund share class (assuming reinvestment of all distributions) held for the entire period.
| | | | | | | | | | | | | | | | | | | | |
| Initial Class | | Year ended | |
| | | 12/31/17 | | | 12/31/16 | | | 12/31/15 | | | 12/31/14 | | | 12/31/13 | |
Net asset value, beginning of period | | | $14.01 | | | | $13.55 | | | | $14.06 | | | | $12.43 | | | | $12.54 | |
| Income (loss) from investment operations | | | | | | | | | | | | | | | | | | | | |
Net investment income (loss) (d) | | | $0.37 | | | | $0.37 | (c) | | | $0.29 | | | | $0.26 | | | | $0.26 | |
Net realized and unrealized gain (loss) | | | 1.42 | | | | 0.74 | | | | (0.23 | ) | | | 1.68 | | | | 0.34 | |
Total from investment operations | | | $1.79 | | | | $1.11 | | | | $0.06 | | | | $1.94 | | | | $0.60 | |
| Less distributions declared to shareholders | | | | | | | | | | | | | | | | | | | | |
From net investment income | | | $(0.63 | ) | | | $(0.39 | ) | | | $(0.57 | ) | | | $(0.31 | ) | | | $(0.71 | ) |
From net realized gain | | | (0.90 | ) | | | (0.26 | ) | | | — | | | | — | | | | — | |
Total distributions declared to shareholders | | | $(1.53 | ) | | | $(0.65 | ) | | | $(0.57 | ) | | | $(0.31 | ) | | | $(0.71 | ) |
Net asset value, end of period (x) | | | $14.27 | | | | $14.01 | | | | $13.55 | | | | $14.06 | | | | $12.43 | |
Total return (%) (k)(r)(s)(x) | | | 13.33 | | | | 7.94 | (c) | | | 0.74 | | | | 15.62 | | | | 5.07 | |
Ratios (%) (to average net assets)
and Supplemental data: | | | | | | | | | | | | | | | | | | | | |
Expenses before expense reductions (f) | | | 1.00 | | | | 0.97 | (c) | | | 1.00 | | | | 0.98 | | | | 1.01 | |
Expenses after expense reductions (f) | | | 0.92 | | | | 0.91 | (c) | | | 0.94 | | | | 0.95 | | | | 0.95 | |
Net investment income (loss) | | | 2.56 | | | | 2.63 | (c) | | | 2.11 | | | | 1.93 | | | | 2.02 | |
Portfolio turnover | | | 24 | | | | 30 | | | | 40 | | | | 25 | | | | 34 | |
Net assets at end of period (000 omitted) | | | $114,198 | | | | $115,023 | | | | $124,563 | | | | $143,090 | | | | $151,176 | |
| |
| Service Class | | Year ended | |
| | | 12/31/17 | | | 12/31/16 | | | 12/31/15 | | | 12/31/14 | | | 12/31/13 | |
Net asset value, beginning of period | | | $15.89 | | | | $15.28 | | | | $15.77 | | | | $13.91 | | | | $13.94 | |
| Income (loss) from investment operations | | | | | | | | | | | | | | | | | | | | |
Net investment income (loss) (d) | | | $0.38 | | | | $0.38 | (c) | | | $0.29 | | | | $0.25 | | | | $0.26 | |
Net realized and unrealized gain (loss) | | | 1.62 | | | | 0.83 | | | | (0.25 | ) | | | 1.88 | | | | 0.38 | |
Total from investment operations | | | $2.00 | | | | $1.21 | | | | $0.04 | | | | $2.13 | | | | $0.64 | |
| Less distributions declared to shareholders | | | | | | | | | | | | | | | | | | | | |
From net investment income | | | $(0.58 | ) | | | $(0.34 | ) | | | $(0.53 | ) | | | $(0.27 | ) | | | $(0.67 | ) |
From net realized gain | | | (0.90 | ) | | | (0.26 | ) | | | — | | | | — | | | | — | |
Total distributions declared to shareholders | | | $(1.48 | ) | | | $(0.60 | ) | | | $(0.53 | ) | | | $(0.27 | ) | | | $(0.67 | ) |
Net asset value, end of period (x) | | | $16.41 | | | | $15.89 | | | | $15.28 | | | | $15.77 | | | | $13.91 | |
Total return (%) (k)(r)(s)(x) | | | 13.07 | | | | 7.70 | (c) | | | 0.47 | | | | 15.31 | | | | 4.84 | |
Ratios (%) (to average net assets)
and Supplemental data: | | | | | | | | | | | | | | | | | | | | |
Expenses before expense reductions (f) | | | 1.25 | | | | 1.22 | (c) | | | 1.25 | | | | 1.23 | | | | 1.26 | |
Expenses after expense reductions (f) | | | 1.17 | | | | 1.16 | (c) | | | 1.19 | | | | 1.20 | | | | 1.20 | |
Net investment income (loss) | | | 2.31 | | | | 2.37 | (c) | | | 1.84 | | | | 1.67 | | | | 1.78 | |
Portfolio turnover | | | 24 | | | | 30 | | | | 40 | | | | 25 | | | | 34 | |
Net assets at end of period (000 omitted) | | | $70,167 | | | | $75,253 | | | | $83,135 | | | | $99,204 | | | | $114,111 | |
See Notes to Financial Statements
11
MFS Global Real Estate Portfolio
Financial Highlights – continued
| (c) | Amount reflects a one-time reimbursement of expenses by the custodian (or former custodian) without which net investment income and performance would be lower and expenses would be higher. |
| (d) | Per share data is based on average shares outstanding. |
| (f) | Ratios do not reflect reductions from fees paid indirectly, if applicable. |
| (k) | The total return does not reflect expenses that apply to separate accounts. Inclusion of these charges would reduce the total return figures for all periods shown. |
| (r) | Certain expenses have been reduced without which performance would have been lower. |
| (s) | From time to time the fund may receive proceeds from litigation settlements, without which performance would be lower. |
| (x) | The net asset values and total returns have been calculated on net assets which include adjustments made in accordance with U.S. generally accepted accounting principles required at period end for financial reporting purposes. |
See Notes to Financial Statements
12
MFS Global Real Estate Portfolio
NOTES TO FINANCIAL STATEMENTS
| (1) | | Business and Organization |
MFS Global Real Estate Portfolio (the fund) is a diversified series of MFS Variable Insurance Trust III (the trust). The trust is organized as a Delaware statutory trust and is registered under the Investment Company Act of 1940, as amended, as an open-end management investment company. The shareholders of each series of the trust are separate accounts of insurance companies, which offer variable annuity and/or life insurance products, and qualified retirement and pension plans.
The fund is an investment company and accordingly follows the investment company accounting and reporting guidance of the Financial Accounting Standards Board (FASB) Accounting Standards Codification Topic 946 Financial Services – Investment Companies.
| (2) | | Significant Accounting Policies |
General – The preparation of financial statements in conformity with U.S. generally accepted accounting principles requires management to make estimates and assumptions that affect the reported amounts of assets and liabilities, and disclosure of contingent assets and liabilities at the date of the financial statements and the reported amounts of increases and decreases in net assets from operations during the reporting period. Actual results could differ from those estimates. In the preparation of these financial statements, management has evaluated subsequent events occurring after the date of the fund’s Statement of Assets and Liabilities through the date that the financial statements were issued. The fund invests a significant amount of its net assets in U.S. and foreign real estate related investments and as a result is subject to certain risks associated with the direct ownership of real estate and the real estate industry in general. These include risks related to general, regional and local economic conditions; fluctuations in interest rates; property tax rates, zoning laws, environmental regulations and other governmental action; cash flow dependency; increased operating expenses; lack of availability of mortgage funds; losses due to natural disasters; changes in property values and rental rates; and other factors. The fund invests in foreign securities. Investments in foreign securities are vulnerable to the effects of changes in the relative values of the local currency and the U.S. dollar and to the effects of changes in each country’s market, economic, industry, political, regulatory, geopolitical, and other conditions.
In October 2016, the Securities and Exchange Commission (SEC) released its final rule on Investment Company Reporting Modernization (the “Rule”). The Rule, which introduced two new regulatory reporting forms for investment companies – Form N-PORT and Form N-CEN – also contained amendments to Regulation S-X which impact financial statement presentation, particularly the presentation of derivative investments, for all reporting periods ending after August 1, 2017. The fund has adopted the Rule’s Regulation S-X amendments and believes that the fund’s financial statements are in compliance with those amendments.
Balance Sheet Offsetting – The fund’s accounting policy with respect to balance sheet offsetting is that, absent an event of default by the counterparty or a termination of the agreement, the International Swaps and Derivatives Association (ISDA) Master Agreement, or similar agreement, does not result in an offset of reported amounts of financial assets and financial liabilities in the Statement of Assets and Liabilities across transactions between the fund and the applicable counterparty. The fund’s right to setoff may be restricted or prohibited by the bankruptcy or insolvency laws of the particular jurisdiction to which a specific master netting agreement counterparty is subject. Balance sheet offsetting disclosures, to the extent applicable to the fund, have been included in the fund’s Significant Accounting Policies note under the captions for each of the fund’s in-scope financial instruments and transactions.
Investment Valuations – Equity securities, including restricted equity securities, are generally valued at the last sale or official closing price on their primary market or exchange as provided by a third-party pricing service. Equity securities, for which there were no sales reported that day, are generally valued at the last quoted daily bid quotation on their primary market or exchange as provided by a third-party pricing service. Short-term instruments with a maturity at issuance of 60 days or less may be valued at amortized cost, which approximates market value. Open-end investment companies are generally valued at net asset value per share. Securities and other assets generally valued on the basis of information from a third-party pricing service may also be valued at a broker/dealer bid quotation. Values obtained from third-party pricing services can utilize both transaction data and market information such as yield, quality, coupon rate, maturity, type of issue, trading characteristics, and other market data. The values of foreign securities and other assets and liabilities expressed in foreign currencies are converted to U.S. dollars using the mean of bid and asked prices for rates provided by a third-party pricing service.
The Board of Trustees has delegated primary responsibility for determining or causing to be determined the value of the fund’s investments (including any fair valuation) to the adviser pursuant to valuation policies and procedures approved by the Board. If the adviser determines that reliable market quotations are not readily available, investments are valued at fair value as determined in good faith by the adviser in accordance with such procedures under the oversight of the Board of Trustees. Under the fund’s valuation policies and procedures, market quotations are not considered to be readily available for most types of debt instruments and floating rate loans and many types of derivatives. These investments are generally valued at fair value based on information from third-party pricing services. In addition, investments may be valued at fair value if the adviser determines that an investment’s value has been materially affected by events occurring after the close of the exchange or market on which the investment is principally
13
MFS Global Real Estate Portfolio
Notes to Financial Statements – continued
traded (such as foreign exchange or market) and prior to the determination of the fund’s net asset value, or after the halting of trading of a specific security where trading does not resume prior to the close of the exchange or market on which the security is principally traded. Events that occur on a frequent basis after foreign markets close (such as developments in foreign markets and significant movements in the U.S. markets) and prior to the determination of the fund’s net asset value may be deemed to have a material effect on the value of securities traded in foreign markets. Accordingly, the fund’s foreign equity securities may often be valued at fair value. The adviser generally relies on third-party pricing services or other information (such as the correlation with price movements of similar securities in the same or other markets; the type, cost and investment characteristics of the security; the business and financial condition of the issuer; and trading and other market data) to assist in determining whether to fair value and at what value to fair value an investment. The value of an investment for purposes of calculating the fund’s net asset value can differ depending on the source and method used to determine value. When fair valuation is used, the value of an investment used to determine the fund’s net asset value may differ from quoted or published prices for the same investment. There can be no assurance that the fund could obtain the fair value assigned to an investment if it were to sell the investment at the same time at which the fund determines its net asset value per share.
Various inputs are used in determining the value of the fund’s assets or liabilities. These inputs are categorized into three broad levels. In certain cases, the inputs used to measure fair value may fall into different levels of the fair value hierarchy. In such cases, an investment’s level within the fair value hierarchy is based on the lowest level of input that is significant to the fair value measurement. The fund’s assessment of the significance of a particular input to the fair value measurement in its entirety requires judgment, and considers factors specific to the investment. Level 1 includes unadjusted quoted prices in active markets for identical assets or liabilities. Level 2 includes other significant observable market-based inputs (including quoted prices for similar securities, interest rates, prepayment speed, and credit risk). Level 3 includes unobservable inputs, which may include the adviser’s own assumptions in determining the fair value of investments. The following is a summary of the levels used as of December 31, 2017 in valuing the fund’s assets or liabilities:
| | | | | | | | | | | | | | | | |
| Financial Instruments | | Level 1 | | | Level 2 | | | Level 3 | | | Total | |
| Equity Securities: | | | | | | | | | | | | | | | | |
United States | | | $95,168,351 | | | | $— | | | | $— | | | | $95,168,351 | |
Japan | | | 15,626,253 | | | | — | | | | — | | | | 15,626,253 | |
United Kingdom | | | 14,048,871 | | | | — | | | | — | | | | 14,048,871 | |
Hong Kong | | | 12,662,311 | | | | — | | | | — | | | | 12,662,311 | |
Australia | | | 9,705,682 | | | | — | | | | — | | | | 9,705,682 | |
Singapore | | | 8,001,600 | | | | — | | | | — | | | | 8,001,600 | |
France | | | 7,307,334 | | | | — | | | | — | | | | 7,307,334 | |
Germany | | | — | | | | 6,304,169 | | | | — | | | | 6,304,169 | |
Canada | | | 4,213,496 | | | | — | | | | — | | | | 4,213,496 | |
Other Countries | | | 9,908,594 | | | | — | | | | — | | | | 9,908,594 | |
| Mutual Funds | | | 1,208,768 | | | | — | | | | — | | | | 1,208,768 | |
| Total | | | $177,851,260 | | | | $6,304,169 | | | | $— | | | | $184,155,429 | |
For further information regarding security characteristics, see the Portfolio of Investments.
Of the level 2 investments presented above, equity investments amounting to $3,411,049 would have been considered level 1 investments at the beginning of the period. Of the level 1 investments presented above, equity investments amounting to $48,224,150 would have been considered level 2 investments at the beginning of the period. The primary reason for changes in the classifications between levels 1 and 2 occurs when foreign equity securities are fair valued using other observable market-based inputs in place of the closing exchange price due to events occurring after the close of the exchange or market on which the investment is principally traded. The fund’s foreign equity securities may often be valued using other observable market-based inputs. The fund’s policy is to recognize transfers between the levels as of the end of the period.
Foreign Currency Translation – Purchases and sales of foreign investments, income, and expenses are converted into U.S. dollars based upon currency exchange rates prevailing on the respective dates of such transactions or on the reporting date for foreign denominated receivables and payables. Gains and losses attributable to foreign currency exchange rates on sales of securities are recorded for financial statement purposes as net realized gains and losses on investments. Gains and losses attributable to foreign exchange rate movements on receivables, payables, income and expenses are recorded for financial statement purposes as foreign currency transaction gains and losses. That portion of both realized and unrealized gains and losses on investments that results from fluctuations in foreign currency exchange rates is not separately disclosed.
Indemnifications – Under the fund’s organizational documents, its officers and Trustees may be indemnified against certain liabilities and expenses arising out of the performance of their duties to the fund. Additionally, in the normal course of business, the fund enters into agreements with service providers that may contain indemnification clauses. The fund’s maximum exposure under these agreements is unknown as this would involve future claims that may be made against the fund that have not yet occurred.
14
MFS Global Real Estate Portfolio
Notes to Financial Statements – continued
Investment Transactions and Income – Investment transactions are recorded on the trade date. Dividends received in cash are recorded on the ex-dividend date. Certain dividends from foreign securities will be recorded when the fund is informed of the dividend if such information is obtained subsequent to the ex-dividend date. Dividend payments received in additional securities are recorded on the ex-dividend date in an amount equal to the value of the security on such date.
The fund may receive proceeds from litigation settlements. Any proceeds received from litigation involving portfolio holdings are reflected in the Statement of Operations in realized gain/loss if the security has been disposed of by the fund or in unrealized gain/loss if the security is still held by the fund. Any other proceeds from litigation not related to portfolio holdings are reflected as other income in the Statement of Operations.
Tax Matters and Distributions – The fund intends to qualify as a regulated investment company, as defined under Subchapter M of the Internal Revenue Code, and to distribute all of its taxable income, including realized capital gains. As a result, no provision for federal income tax is required. The fund’s federal tax returns, when filed, will remain subject to examination by the Internal Revenue Service for a three year period. Management has analyzed the fund’s tax positions taken on federal and state tax returns for all open tax years and does not believe that there are any uncertain tax positions that require recognition of a tax liability. Foreign taxes, if any, have been accrued by the fund in the accompanying financial statements in accordance with the applicable foreign tax law. Foreign income taxes may be withheld by certain countries in which the fund invests. Additionally, capital gains realized by the fund on securities issued in or by certain foreign countries may be subject to capital gains tax imposed by those countries.
Distributions to shareholders are recorded on the ex-dividend date. Income and capital gain distributions are determined in accordance with income tax regulations, which may differ from U.S. generally accepted accounting principles. Certain capital accounts in the financial statements are periodically adjusted for permanent differences in order to reflect their tax character. These adjustments have no impact on net assets or net asset value per share. Temporary differences which arise from recognizing certain items of income, expense, gain or loss in different periods for financial statement and tax purposes will reverse at some time in the future. Distributions in excess of net investment income or net realized gains are temporary overdistributions for financial statement purposes resulting from differences in the recognition or classification of income or distributions for financial statement and tax purposes.
Book/tax differences primarily relate to real estate investment trusts, passive foreign investment companies, and wash sale loss deferrals.
The tax character of distributions declared to shareholders for the last two fiscal years is as follows:
| | | | | | | | |
| | | Year ended
12/31/17 | | | Year ended
12/31/16 | |
| Ordinary income (including any short-term capital gains) | | | $9,358,136 | | | | $4,607,565 | |
| Long-term capital gains | | | 8,272,090 | | | | 3,314,243 | |
| Total distributions | | | $17,630,226 | | | | $7,921,808 | |
The federal tax cost and the tax basis components of distributable earnings were as follows:
| | | | |
| As of 12/31/17 | | | | |
| Cost of investments | | | $160,630,194 | |
| Gross appreciation | | | 28,684,894 | |
| Gross depreciation | | | (5,159,659 | ) |
| Net unrealized appreciation (depreciation) | | | $23,525,235 | |
| Undistributed ordinary income | | | 7,656,242 | |
| Undistributed long-term capital gain | | | 1,092,015 | |
| Other temporary differences | | | 331,843 | |
Multiple Classes of Shares of Beneficial Interest – The fund offers multiple classes of shares, which differ in their respective distribution and/or service fees. The fund’s income, realized and unrealized gain (loss), and common expenses are allocated to shareholders based on the daily net assets of each class. Dividends are declared separately for each class. Differences in per share dividend rates are generally due to differences in separate class expenses. The fund’s distributions declared to shareholders as reported in the Statements of Changes in Net Assets are presented by class as follows:
| | | | | | | | | | | | | | | | |
| | | From net investment
income | | | From net realized gain on
investments | |
| | | Year ended
12/31/17 | | | Year ended
12/31/16 | | | Year ended
12/31/17 | | | Year ended
12/31/16 | |
| Initial Class | | | $4,760,935 | | | | $3,072,515 | | | | $6,757,227 | | | | $2,103,171 | |
| Service Class | | | 2,412,087 | | | | 1,535,050 | | | | 3,699,977 | | | | 1,211,072 | |
| Total | | | $7,173,022 | | | | $4,607,565 | | | | $10,457,204 | | | | $3,314,243 | |
15
MFS Global Real Estate Portfolio
Notes to Financial Statements – continued
| (3) | | Transactions with Affiliates |
Investment Adviser – The fund has an investment advisory agreement with MFS to provide overall investment management and related administrative services and facilities to the fund. The management fee is computed daily and paid monthly at the following annual rates based on the fund’s average daily net assets:
| | | | |
| Up to $1 billion | | | 0.90% | |
| In excess of $1 billion and up to $2.5 billion | | | 0.75% | |
| In excess of $2.5 billion | | | 0.65% | |
MFS has agreed in writing to reduce its management fee by a specified amount if certain MFS mutual fund assets exceed thresholds agreed to by MFS and the fund’s Board of Trustees. For the year ended December 31, 2017, this management fee reduction amounted to $14,983, which is included in the reduction of total expenses in the Statement of Operations. The management fee incurred for the year ended December 31, 2017 was equivalent to an annual effective rate of 0.89% of the fund’s average daily net assets.
The investment adviser has agreed in writing to pay a portion of the fund’s total annual operating expenses, excluding interest, taxes, extraordinary expenses, brokerage and transaction costs, and investment-related expenses, such that total annual operating expenses do not exceed 0.92% of average daily net assets for the Initial Class shares and 1.17% of average daily net assets for the Service Class shares. This written agreement will continue until modified by the fund’s Board of Trustees, but such agreement will continue at least until April 30, 2019. For the year ended December 31, 2017, this reduction amounted to $136,182, which is included in the reduction of total expenses in the Statement of Operations.
Distributor – MFS Fund Distributors, Inc. (MFD), a wholly-owned subsidiary of MFS, is the distributor of shares of the fund. The Trustees have adopted a distribution plan for the Service Class shares pursuant to Rule 12b-1 under the Investment Company Act of 1940.
The fund’s distribution plan provides that the fund will pay MFD distribution and/or service fees equal to 0.25% per annum of its average daily net assets attributable to Service Class shares as partial consideration for services performed and expenses incurred by MFD and financial intermediaries (including participating insurance companies that invest in the fund to fund variable annuity and variable life insurance contracts, sponsors of qualified retirement and pension plans that invest in the fund, and affiliates of these participating insurance companies and plan sponsors) in connection with the sale and distribution of the Service Class shares. MFD may subsequently pay all, or a portion, of the distribution and/or service fees to financial intermediaries.
Shareholder Servicing Agent – MFS Service Center, Inc. (MFSC), a wholly-owned subsidiary of MFS, receives a fee from the fund for its services as shareholder servicing agent. For the year ended December 31, 2017, the fee was $6,912, which equated to 0.0037% annually of the fund’s average daily net assets. MFSC also receives payment from the fund for out-of-pocket expenses paid by MFSC on behalf of the fund. For the year ended December 31, 2017, these costs amounted to $1,019.
Administrator – MFS provides certain financial, legal, shareholder communications, compliance, and other administrative services to the fund. Under an administrative services agreement, the fund reimburses MFS the costs incurred to provide these services. The fund is charged an annual fixed amount of $17,500 plus a fee based on average daily net assets. The administrative services fee incurred for the year ended December 31, 2017 was equivalent to an annual effective rate of 0.0209% of the fund’s average daily net assets.
Trustees’ and Officers’ Compensation – The fund pays compensation to independent Trustees in the form of a retainer, attendance fees, and additional compensation to Board and Committee chairpersons. The fund does not pay compensation directly to Trustees or officers of the fund who are also officers of the investment adviser, all of whom receive remuneration for their services to the fund from MFS. Certain officers and Trustees of the fund are officers or directors of MFS, MFD, and MFSC.
Other – This fund and certain other funds managed by MFS (the funds) have entered into a service agreement (the ISO Agreement) which provides for payment of fees solely by the funds to Tarantino LLC in return for the provision of services of an Independent Senior Officer (ISO) for the funds. Frank L. Tarantino serves as the ISO and is an officer of the funds and the sole member of Tarantino LLC. The funds can terminate the ISO Agreement with Tarantino LLC at any time under the terms of the ISO Agreement. For the year ended December 31, 2017, the fee paid by the fund under this agreement was $330 and is included in “Miscellaneous” expense in the Statement of Operations. MFS has agreed to bear all expenses associated with office space, other administrative support, and supplies provided to the ISO.
The fund invests in the MFS Institutional Money Market Portfolio which is managed by MFS and seeks current income consistent with preservation of capital and liquidity. This money market fund does not pay a management fee to MFS.
The fund is permitted to engage in purchase and sale transactions with funds and accounts for which MFS serves as investment adviser or sub-adviser (“cross-trades”) pursuant to a policy adopted by the Board of Trustees. This policy has been designed to
16
MFS Global Real Estate Portfolio
Notes to Financial Statements – continued
ensure that cross-trades conducted by the fund comply with Rule 17a-7 under the Investment Company Act of 1940. During the year ended December 31, 2017, the fund engaged in sale transactions pursuant to this policy, which amounted to $1,077,637. The sales transactions resulted in net realized gains (losses) of $174,261.
For the year ended December 31, 2017, purchases and sales of investments, other than short-term obligations, aggregated $45,103,378 and $66,983,477, respectively.
| (5) | | Shares of Beneficial Interest |
The fund’s Declaration of Trust permits the Trustees to issue an unlimited number of full and fractional shares of beneficial interest. Transactions in fund shares were as follows:
| | | | | | | | | | | | | | | | |
| | | Year ended 12/31/17 | | | Year ended 12/31/16 | |
| | | Shares | | | Amount | | | Shares | | | Amount | |
| Shares sold | | | | | | | | | | | | | | | | |
Initial Class | | | 150,081 | | | | $2,133,782 | | | | 284,283 | | | | $4,031,253 | |
Service Class | | | 236,313 | | | | 3,775,753 | | | | 372,899 | | | | 5,924,989 | |
| | | 386,394 | | | | $5,909,535 | | | | 657,182 | | | | $9,956,242 | |
| Shares issued to shareholders in reinvestment of distributions | | | | | | | | | | | | | | | | |
Initial Class | | | 850,049 | | | | $11,518,162 | | | | 349,001 | | | | $5,175,686 | |
Service Class | | | 391,799 | | | | 6,112,064 | | | | 163,168 | | | | 2,746,122 | |
| | | 1,241,848 | | | | $17,630,226 | | | | 512,169 | | | | $7,921,808 | |
| Shares reacquired | | | | | | | | | | | | | | | | |
Initial Class | | | (1,207,552 | ) | | | $(17,436,759 | ) | | | (1,618,412 | ) | | | $(23,330,710 | ) |
Service Class | | | (1,087,364 | ) | | | (17,825,181 | ) | | | (1,240,603 | ) | | | (19,913,640 | ) |
| | | (2,294,916 | ) | | | $(35,261,940 | ) | | | (2,859,015 | ) | | | $(43,244,350 | ) |
| Net change | | | | | | | | | | | | | | | | |
Initial Class | | | (207,422 | ) | | | $(3,784,815 | ) | | | (985,128 | ) | | | $(14,123,771 | ) |
Service Class | | | (459,252 | ) | | | (7,937,364 | ) | | | (704,536 | ) | | | (11,242,529 | ) |
| | | (666,674 | ) | | | $(11,722,179 | ) | | | (1,689,664 | ) | | | $(25,366,300 | ) |
The fund is one of several mutual funds in which certain MFS funds may invest. The MFS funds do not invest in the underlying funds for the purpose of exercising management or control. At the end of the period, the MFS Moderate Allocation Portfolio, the MFS Growth Allocation Portfolio, and the MFS Conservative Allocation Portfolio were the owners of record of approximately 28%, 11%, and 6%, respectively, of the value of outstanding voting shares of the fund.
The fund and certain other funds managed by MFS participate in a $1.25 billion unsecured committed line of credit, subject to a $1 billion sublimit, provided by a syndication of banks under a credit agreement. Borrowings may be made for temporary financing needs. Interest is charged to each fund, based on its borrowings, generally at a rate equal to the higher of the Overnight Federal Reserve funds rate or daily one month LIBOR plus an agreed upon spread. A commitment fee, based on the average daily, unused portion of the committed line of credit, is allocated among the participating funds at the end of each calendar quarter. In addition, the fund and other funds managed by MFS have established unsecured uncommitted borrowing arrangements with certain banks for temporary financing needs. Interest is charged to each fund, based on its borrowings, at a rate equal to the Overnight Federal Reserve funds rate plus an agreed upon spread. For the year ended December 31, 2017, the fund’s commitment fee and interest expense were $1,257 and $0, respectively, and are included in “Miscellaneous” expense in the Statement of Operations.
| (7) | | Investments in Affiliated Issuers |
An affiliated issuer may be considered one in which the fund owns 5% or more of the outstanding voting securities, or a company which is under common control. For the purposes of this report, the fund assumes the following to be affiliated issuers:
| | | | | | | | | | | | | | | | | | |
| Affiliated Issuers | | | | Beginning
Shares/Par
Amount | | | Acquisitions
Shares/Par
Amount | | | Dispositions
Shares/Par
Amount | | | Ending
Shares/Par
Amount | |
| MFS Institutional Money Market Portfolio | | | | | 2,776,118 | | | | 29,847,727 | | | | (31,414,956 | ) | | | 1,208,889 | |
| | | | | |
| Affiliated Issuers | | Realized
Gain (Loss) | | Change in
Unrealized
Appreciation
(Depreciation) | | | Capital Gain
Distributions | | | Dividend
Income | | | Ending
Value | |
| MFS Institutional Money Market Portfolio | | $64 | | | $(125 | ) | | | $— | | | | $12,788 | | | | $1,208,768 | |
17
MFS Global Real Estate Portfolio
REPORT OF INDEPENDENT REGISTERED PUBLIC ACCOUNTING FIRM
To the Board of Trustees of MFS Variable Insurance Trust III and the Shareholders of MFS Global Real Estate Portfolio:
Opinion on the Financial Statements and Financial Highlights
We have audited the accompanying statement of assets and liabilities of MFS Global Real Estate Portfolio (one of the series of MFS Variable Insurance Trust III) (the “Fund”), including the portfolio of investments, as of December 31, 2017, the related statement of operations for the year then ended, the statements of changes in net assets for each of the two years in the period then ended, the financial highlights for each of the five years in the period then ended, and the related notes. In our opinion, the financial statements and financial highlights present fairly, in all material respects, the financial position of the Fund as of December 31, 2017, and the results of its operations for the year then ended, the changes in its net assets for each of the two years in the period then ended, and the financial highlights for each of the five years in the period then ended, in conformity with accounting principles generally accepted in the United States of America.
Basis for Opinion
These financial statements and financial highlights are the responsibility of the Fund’s management. Our responsibility is to express an opinion on the Fund’s financial statements and financial highlights based on our audits. We are a public accounting firm registered with the Public Company Accounting Oversight Board (United States) (PCAOB) and are required to be independent with respect to the Fund in accordance with the U.S. federal securities laws and the applicable rules and regulations of the Securities and Exchange Commission and the PCAOB.
We conducted our audits in accordance with the standards of the PCAOB. Those standards require that we plan and perform the audit to obtain reasonable assurance about whether the financial statements and financial highlights are free of material misstatement, whether due to error or fraud. The Fund is not required to have, nor were we engaged to perform, an audit of its internal control over financial reporting. As part of our audits we are required to obtain an understanding of internal control over financial reporting but not for the purpose of expressing an opinion on the effectiveness of the Fund’s internal control over financial reporting. Accordingly, we express no such opinion.
Our audits included performing procedures to assess the risks of material misstatement of the financial statements and financial highlights, whether due to error or fraud, and performing procedures that respond to those risks. Such procedures included examining, on a test basis, evidence regarding the amounts and disclosures in the financial statements and financial highlights. Our audits also included evaluating the accounting principles used and significant estimates made by management, as well as evaluating the overall presentation of the financial statements and financial highlights. Our procedures included confirmation of securities owned as of December 31, 2017, by correspondence with the custodian and brokers. We believe that our audits provide a reasonable basis for our opinion.
DELOITTE & TOUCHE LLP
Boston, Massachusetts
February 15, 2018
We have served as the auditor of one or more of the MFS investment companies since 1924.
18
MFS Global Real Estate Portfolio
TRUSTEES AND OFFICERS – IDENTIFICATION AND BACKGROUND
The Trustees and Officers of the Trust, as of February 1, 2018, are listed below, together with their principal occupations during the past five years. (Their titles may have varied during that period.) The address of each Trustee and Officer is 111 Huntington Avenue, Boston, Massachusetts 02199-7618.
| | | | | | | | | | |
Name, Age | | Position(s)
Held with Fund | | Trustee/Officer
Since (h) | | Number of
MFS Funds
overseen by the
Trustee | | Principal Occupations
During the Past Five Years | | Other Directorships
During the Past Five Years (j) |
| INTERESTED TRUSTEES |
Robert J. Manning (k) (age 54) | | Trustee | | February 2004 | | 137 | | Massachusetts Financial Services Company, Executive Chairman (since January 2017); Director; Chairman of the Board; Chief Executive Officer (until 2015); Co-Chief Executive Officer (2015-2016) | | N/A |
| | | | | |
Robin A. Stelmach (k) (age 56) | | Trustee | | January 2014 | | 137 | | Massachusetts Financial Services Company, Vice Chair (since January 2017); Chief Operating Officer and Executive Vice President (until January 2017) | | N/A |
| | | | |
| INDEPENDENT TRUSTEES | | | | | | | | |
John P. Kavanaugh (age 63) | | Trustee and Chair of Trustees | | January 2009 | | 137 | | Private investor | | N/A |
| | | | | |
Steven E. Buller (age 66) | | Trustee | | February 2014 | | 137 | | Financial Accounting Standards Advisory Council, Chairman (2014-2015); Public Company Accounting Oversight Board, Standing Advisory Group, Member (until 2014); BlackRock, Inc. (investment management), Managing Director (until 2014), BlackRock Finco UK (investment management), Director (until 2014) | | N/A |
| | | | | |
John A. Caroselli (age 63) | | Trustee | | March 2017 | | 137 | | JC Global Advisors, LLC (management consulting), President (since 2015); First Capital Corporation (commercial finance), Executive Vice President (until 2015) | | N/A |
| | | | | |
Maureen R. Goldfarb (age 62) | | Trustee | | January 2009 | | 137 | | Private investor | | N/A |
| | | | | |
Michael Hegarty (age 73) | | Trustee | | December 2004 | | 137 | | Private investor | | Rouse Properties Inc., Director (until 2016); Capmark Financial Group Inc., Director (until 2015) |
| | | | | |
Clarence Otis, Jr. (age 61) | | Trustee | | March 2017 | | 137 | | Darden Restaurants, Inc., Chief Executive Officer (until 2014) | | VF Corporation, Director; Verizon Communications, Inc., Director; The Travelers Companies, Director; Federal Reserve Bank of Atlanta, Director (until 2015) |
| | | | | |
Maryanne L. Roepke (age 61) | | Trustee | | May 2014 | | 137 | | American Century Investments (investment management), Senior Vice President and Chief Compliance Officer (until 2014) | | N/A |
| | | | | |
Laurie J. Thomsen (age 60) | | Trustee | | March 2005 | | 137 | | Private investor | | The Travelers Companies, Director; Dycom Industries, Inc., Director (since 2015) |
19
MFS Global Real Estate Portfolio
Trustees and Officers – continued
| | | | | | | | |
Name, Age | | Position(s)
Held with Fund | | Trustee/Officer
Since (h) | | Number of
MFS Funds
for which the
Person is an
Officer | | Principal Occupations During the Past Five Years |
| OFFICERS | | | | | | | | |
Christopher R. Bohane (k) (age 44) | | Assistant Secretary and Assistant Clerk | | July 2005 | | 137 | | Massachusetts Financial Services Company, Vice President and Assistant General Counsel |
| | | | |
Kino Clark (k) (age 49) | | Assistant Treasurer | | January 2012 | | 137 | | Massachusetts Financial Services Company, Vice President |
| | | | |
John W. Clark, Jr. (k) (age 50) | | Assistant Treasurer | | April 2017 | | 137 | | Massachusetts Financial Services Company, Vice President (since March 2017); Deutsche Bank (financial services), Department Head – Treasurer’s Office (until February 2017) |
| | | | |
Thomas H. Connors (k) (age 58) | | Assistant Secretary and Assistant Clerk | | September 2012 | | 137 | | Massachusetts Financial Services Company, Vice President and Senior Counsel |
| | | | |
Ethan D. Corey (k) (age 54) | | Assistant Secretary and Assistant Clerk | | July 2005 | | 137 | | Massachusetts Financial Services Company, Senior Vice President and Associate General Counsel |
| | | | |
David L. DiLorenzo (k) (age 49) | | President | | July 2005 | | 137 | | Massachusetts Financial Services Company, Senior Vice President |
| | | | |
Heidi W. Hardin (k) (age 50) | | Secretary and Clerk | | April 2017 | | 137 | | Massachusetts Financial Services Company, Executive Vice President and General Counsel (since March 2017); Harris Associates (investment management), General Counsel (from September 2015 to January 2017); Janus Capital Management LLC (investment management), Senior Vice President and General Counsel (until September 2015) |
| | | | |
Brian E. Langenfeld (k) (age 44) | | Assistant Secretary and Assistant Clerk | | June 2006 | | 137 | | Massachusetts Financial Services Company, Vice President and Senior Counsel |
| | | | |
Susan A. Pereira (k) (age 47) | | Assistant Secretary and Assistant Clerk | | July 2005 | | 137 | | Massachusetts Financial Services Company, Vice President and Senior Counsel |
| | | | |
Kasey L. Phillips (k) (age 47) | | Assistant Treasurer | | September 2012 | | 137 | | Massachusetts Financial Services Company, Vice President |
| | | | |
Matthew A. Stowe (k) (age 43) | | Assistant Secretary and Assistant Clerk | | October 2014 | | 137 | | Massachusetts Financial Services Company, Vice President and Assistant General Counsel |
| | | | |
Frank L. Tarantino (age 73) | | Independent Senior Officer | | June 2004 | | 137 | | Tarantino LLC (provider of compliance services), Principal |
| | | | |
Richard S. Weitzel (k) (age 47) | | Assistant Secretary and Assistant Clerk | | October 2007 | | 137 | | Massachusetts Financial Services Company, Senior Vice President and Associate General Counsel |
| | | | |
Martin J. Wolin (k) (age 50) | | Chief Compliance Officer | | July 2015 | | 137 | | Massachusetts Financial Services Company, Senior Vice President and Chief Compliance Officer (since July 2015); Mercer (financial service provider), Chief Risk and Compliance Officer, North America and Latin America (until June 2015) |
| | | | |
James O. Yost (k) (age 57) | | Treasurer | | September 1990 | | 137 | | Massachusetts Financial Services Company, Senior Vice President |
| (h) | Date first appointed to serve as Trustee/officer of an MFS Fund. Each Trustee has served continuously since appointment unless indicated otherwise. For the period from December 15, 2004 until February 22, 2005, Mr. Manning served as Advisory Trustee. Prior to January 2012, Messrs. DiLorenzo and Yost served as Assistant Treasurers of the Funds. From January 2012 through December 2016, Messrs. DiLorenzo and Yost served as Treasurer and Deputy Treasurer of the Funds, respectively. |
| (j) | Directorships or trusteeships of companies required to report to the Securities and Exchange Commission (i.e., “public companies”). |
| (k) | “Interested person” of the Trust within the meaning of the Investment Company Act of 1940 (referred to as the 1940 Act), which is the principal federal law governing investment companies like the fund, as a result of a position with MFS. The address of MFS is 111 Huntington Avenue, Boston, Massachusetts 02199-7618. |
20
MFS Global Real Estate Portfolio
Trustees and Officers – continued
Each Trustee has been elected by shareholders and each Trustee and officer holds office until his or her successor is chosen and qualified or until his or her earlier death, resignation, retirement or removal. The Trust does not hold annual meetings for the purpose of electing Trustees, and Trustees are not elected for fixed terms. Under the terms of the Board’s retirement policy, an Independent Trustee shall retire at the end of the calendar year in which he or she reaches the earlier of 75 years of age or 15 years of service on the Board (or, in the case of any Independent Trustee who joined the Board prior to 2015, 20 years of service on the Board).
Messrs. Buller and Otis and Ms. Roepke are members of the Trust’s Audit Committee.
Each of the Interested Trustees and certain Officers hold comparable officer positions with certain affiliates of MFS.
The Statement of Additional Information for a Fund includes further information about the Trustees and is available without charge upon request by calling 1-800-225-2606.
| | |
Investment Adviser Massachusetts Financial Services Company 111 Huntington Avenue Boston, MA 02199-7618 | | Custodian State Street Bank and Trust Company 1 Lincoln Street Boston, MA 02111-2900 |
Distributor MFS Fund Distributors, Inc. 111 Huntington Avenue Boston, MA 02199-7618 | | Independent Registered Public Accounting Firm Deloitte & Touche LLP 200 Berkeley Street Boston, MA 02116 |
Portfolio Manager(s) Rick Gable | | |
21
MFS Global Real Estate Portfolio
BOARD REVIEW OF INVESTMENT ADVISORY AGREEMENT
The Investment Company Act of 1940 requires that both the full Board of Trustees and a majority of the non-interested (“independent”) Trustees, voting separately, annually approve the continuation of the Fund’s investment advisory agreement with MFS. The Trustees consider matters bearing on the Fund and its advisory arrangements at their meetings throughout the year, including a review of performance data at each regular meeting. In addition, the independent Trustees met several times over the course of three months beginning in May and ending in July, 2017 (“contract review meetings”) for the specific purpose of considering whether to approve the continuation of the investment advisory agreement for the Fund and the other investment companies that the Board oversees (the “MFS Funds”). The independent Trustees were assisted in their evaluation of the Fund’s investment advisory agreement by independent legal counsel, from whom they received separate legal advice and with whom they met separately from MFS during various contract review meetings. The independent Trustees were also assisted in this process by the MFS Funds’ Independent Senior Officer, a senior officer appointed by and reporting to the independent Trustees.
In connection with their deliberations regarding the continuation of the investment advisory agreement, the Trustees, including the independent Trustees, considered such information and factors as they believed, in light of the legal advice furnished to them and their own business judgment, to be relevant. The investment advisory agreement for the Fund was considered separately, although the Trustees also took into account the common interests of all MFS Funds in their review. As described below, the Trustees considered the nature, quality, and extent of the various investment advisory, administrative, and shareholder services performed by MFS under the existing investment advisory agreement and other arrangements with the Fund.
In connection with their contract review meetings, the Trustees received and relied upon materials that included, among other items: (i) information provided by Broadridge Financial Solutions, Inc. (“Broadridge”), an independent third party, on the investment performance of the Fund for various time periods ended December 31, 2016 and the investment performance of a group of funds with substantially similar investment classifications/objectives (the “Lipper performance universe”), (ii) information provided by Broadridge on the Fund’s advisory fees and other expenses and the advisory fees and other expenses of comparable funds identified by Broadridge (the “Broadridge expense group”), (iii) information provided by MFS on the advisory fees of portfolios of other clients of MFS, including institutional separate accounts and other clients, (iv) information as to whether and to what extent applicable expense waivers, reimbursements or fee “breakpoints” are observed for the Fund, (v) information regarding MFS’ financial results and financial condition, including MFS’ and certain of its affiliates’ estimated profitability from services performed for the Fund and the MFS Funds as a whole, and compared to MFS’ institutional business, (vi) MFS’ views regarding the outlook for the mutual fund industry and the strategic business plans of MFS, (vii) descriptions of various functions performed by MFS for the Funds, such as compliance monitoring and portfolio trading practices, and (viii) information regarding the overall organization of MFS, including information about MFS’ senior management and other personnel providing investment advisory, administrative and other services to the Fund and the other MFS Funds. The comparative performance, fee and expense information prepared and provided by Broadridge was not independently verified and the independent Trustees did not independently verify any information provided to them by MFS.
The Trustees’ conclusion as to the continuation of the investment advisory agreement was based on a comprehensive consideration of all information provided to the Trustees and not the result of any single factor. Some of the factors that figured particularly in the Trustees’ deliberations are described below, although individual Trustees may have evaluated the information presented differently from one another, giving different weights to various factors. It is also important to recognize that the fee arrangements for the Fund and other MFS Funds are the result of years of review and discussion between the independent Trustees and MFS, that certain aspects of such arrangements may receive greater scrutiny in some years than in others, and that the Trustees’ conclusions may be based, in part, on their consideration of these same arrangements during the course of the year and in prior years.
Based on information provided by Broadridge and MFS, the Trustees reviewed the Fund’s total return investment performance as well as the performance of peer groups of funds over various time periods. The Trustees placed particular emphasis on the total return performance of the Fund’s Initial Class shares in comparison to the performance of funds in its Lipper performance universe over the three-year period ended December 31, 2016, which the Trustees believed was a long enough period to reflect differing market conditions. The total return performance of the Fund’s Initial Class shares was in the 1st quintile relative to the other funds in the universe for this three-year period (the 1st quintile being the best performers and the 5th quintile being the worst performers). The total return performance of the Fund’s Initial Class shares was in the 1st quintile for each of the one- and five-year periods ended December 31, 2016 relative to the Lipper performance universe. Because of the passage of time, these performance results may differ from the performance results for more recent periods, including those shown elsewhere in this report.
In the course of their deliberations, the Trustees took into account information provided by MFS in connection with the contract review meetings, as well as during investment review meetings conducted with portfolio management personnel during the course of the year regarding the Fund’s performance. After reviewing these and related factors, the Trustees concluded, within the context of their overall conclusions regarding the investment advisory agreement, that they were satisfied with MFS’ responses and efforts relating to investment performance.
22
MFS Global Real Estate Portfolio
Board Review of Investment Advisory Agreement – continued
In assessing the reasonableness of the Fund’s advisory fee, the Trustees considered, among other information, the Fund’s advisory fee and the total expense ratio of the Fund’s Initial Class shares as a percentage of average daily net assets and the advisory fee and total expense ratios of peer groups of funds based on information provided by Broadridge. The Trustees considered that MFS currently observes an expense limitation for the Fund, which may not be changed without the Trustees’ approval. The Trustees also considered that, according to the data provided by Broadridge (which takes into account any fee reductions or expense limitations that were in effect during the Fund’s last fiscal year), the Fund’s effective advisory fee rate and total expense ratio were each approximately at the Broadridge expense group median.
The Trustees also considered the advisory fees charged by MFS to any institutional separate accounts advised by MFS (“separate accounts”) and unaffiliated investment companies for which MFS serves as subadviser (“subadvised funds”) that have comparable investment strategies to the Fund, if any. In comparing these fees, the Trustees considered information provided by MFS as to the generally broader scope of services provided by MFS to the Fund, as well as the more extensive regulatory burdens imposed on MFS in managing the Fund, in comparison to separate accounts and subadvised funds. The Trustees also considered the higher demands placed on MFS’ investment personnel and trading infrastructure as a result of the daily cash in-flows and out-flows of the Fund in comparison to separate accounts.
The Trustees also considered whether the Fund may benefit from any economies of scale in the management of the Fund in the event of growth in assets of the Fund and/or growth in assets of the MFS Funds as a whole. They noted that the Fund’s advisory fee rate schedule is subject to contractual breakpoints that reduce the Fund’s advisory fee rate on average daily net assets over $1 billion and $2.5 billion. The Trustees also noted that MFS has agreed in writing to waive a portion of the management fees of certain MFS Funds, including the Fund, if the total combined assets of certain funds within the MFS Funds’ complex increase above agreed upon thresholds (the “group fee waiver”), enabling the Fund’s shareholders to share in the benefits from any economies of scale at the complex level. The group fee waiver is reviewed and renewed annually between the Board and MFS. The Trustees concluded that the breakpoints and the group fee waiver were sufficient to allow the Fund to benefit from economies of scale as its assets and overall complex assets grow.
The Trustees also considered information prepared by MFS relating to MFS’ costs and profits with respect to the Fund, the MFS Funds considered as a group, and other investment companies and accounts advised by MFS, as well as MFS’ methodologies used to determine and allocate its costs to the MFS Funds, the Fund and other accounts and products for purposes of estimating profitability.
After reviewing these and other factors described herein, the Trustees concluded, within the context of their overall conclusions regarding the investment advisory agreement, that the advisory fees charged to the Fund represent reasonable compensation in light of the services being provided by MFS to the Fund.
In addition, the Trustees considered MFS’ resources and related efforts to continue to retain, attract and motivate capable personnel to serve the Fund. The Trustees also considered current and developing conditions in the financial services industry, including the presence of large and well-capitalized companies which are spending, and appear to be prepared to continue to spend, substantial sums to engage personnel and to provide services to competing investment companies. In this regard, the Trustees also considered the financial resources of MFS and its ultimate parent, Sun Life Financial Inc. The Trustees also considered the advantages and possible disadvantages to the Fund of having an adviser that also serves other investment companies as well as other accounts.
The Trustees also considered the nature, quality, cost, and extent of administrative, transfer agency, and distribution services provided to the Fund by MFS and its affiliates under agreements and plans other than the investment advisory agreement, including any 12b-1 fees the Fund pays to MFS Fund Distributors, Inc., an affiliate of MFS. The Trustees also considered the nature, extent and quality of certain other services MFS performs or arranges for on the Fund’s behalf, which may include securities lending programs, directed expense payment programs, class action recovery programs, and MFS’ interaction with third-party service providers, principally custodians and sub-custodians. The Trustees concluded that the various non-advisory services provided by MFS and its affiliates on behalf of the Fund were satisfactory.
The Trustees also considered benefits to MFS from the use of the Fund’s portfolio brokerage commissions, if applicable, to pay for investment research and various other factors. Additionally, the Trustees considered so-called “fall-out benefits” to MFS such as reputational value derived from serving as investment manager to the Fund.
Based on their evaluation of factors that they deemed to be material, including those factors described above, the Board of Trustees, including the independent Trustees, concluded that the Fund’s investment advisory agreement with MFS should be continued for an additional one-year period, commencing August 1, 2017.
23
MFS Global Real Estate Portfolio
PROXY VOTING POLICIES AND INFORMATION
MFS votes proxies on behalf of the fund pursuant to proxy voting policies and procedures that are available without charge, upon request, by calling 1-800-225-2606, by visiting mfs.com/proxyvoting, or by visiting the SEC’s Web site at http://www.sec.gov.
Information regarding how the fund voted proxies relating to portfolio securities during the most recent twelve-month period ended June 30 is available by August 31 of each year without charge by visiting mfs.com/proxyvoting, or by visiting the SEC’s Web site at http://www.sec.gov.
QUARTERLY PORTFOLIO DISCLOSURE
The fund will file a complete schedule of portfolio holdings with the Securities and Exchange Commission (the Commission) for the first and third quarters of each fiscal year on Form N-Q. The fund’s Form N-Q is available on the EDGAR database on the Commission’s Internet Web site at http://www.sec.gov, and may be reviewed and copied at the:
Public Reference Room
Securities and Exchange Commission
100 F Street, NE, Room 1580
Washington, D.C. 20549
Information on the operation of the Public Reference Room may be obtained by calling the Commission at 1-800-SEC-0330. Copies of the fund’s Form N-Q also may be obtained, upon payment of a duplicating fee, by electronic request at the following e-mail address: publicinfo@sec.gov or by writing the Public Reference Section at the above address.
FURTHER INFORMATION
From time to time, MFS may post important information about the fund or the MFS funds on the MFS web site (mfs.com). This information is available at https://www.mfs.com/en-us/what-we-do/announcements.html or at mfs.com/vit3 by choosing the fund’s name.
INFORMATION ABOUT FUND CONTRACTS AND LEGAL CLAIMS
The fund has entered into contractual arrangements with an investment adviser, administrator, distributor, shareholder servicing agent, 529 program manager (if applicable), and custodian who each provide services to the fund. Unless expressly stated otherwise, shareholders are not parties to, or intended beneficiaries of these contractual arrangements, and these contractual arrangements are not intended to create any shareholder right to enforce them against the service providers or to seek any remedy under them against the service providers, either directly or on behalf of the fund.
Under the Trust’s By-Laws and Declaration of Trust, any claims asserted against or on behalf of the MFS Funds, including claims against Trustees and Officers, must be brought in state and federal courts located within the Commonwealth of Massachusetts.
FEDERAL TAX INFORMATION (unaudited)
The following information is provided pursuant to provisions of the Internal Revenue Code.
The fund designates $9,100,000 as capital gain dividends paid during the fiscal year.
24
rev. 3/16
| | | | |
| FACTS | | WHAT DOES MFS DO WITH YOUR
PERSONAL INFORMATION? | |  |
| | |
| Why? | | Financial companies choose how they share your personal information. Federal law gives consumers the right to limit some but not all sharing. Federal law also requires us to tell you how we collect, share, and protect your personal information. Please read this notice carefully to understand what we do. |
| | |
| What? | | The types of personal information we collect and share depend on the product or service you have with us. This information can include: • Social Security number and account balances • Account transactions and transaction history • Checking account information and wire transfer instructions When you are no longer our customer, we continue to share your information as described in this notice. |
| | |
| How? | | All financial companies need to share customers’ personal information to run their everyday business. In the section below, we list the reasons financial companies can share their customers’ personal information; the reasons MFS chooses to share; and whether you can limit this sharing. |
| | | | |
Reasons we can share your
personal information | | Does MFS share? | | Can you limit this
sharing? |
For our everyday business purposes – such as to process your transactions, maintain your account(s), respond to court orders and legal investigations, or report to credit bureaus | | Yes | | No |
For our marketing purposes – to offer our products and services to you | | No | | We don’t share |
| For joint marketing with other financial companies | | No | | We don’t share |
For our affiliates’ everyday business purposes – information about your transactions and experiences | | No | | We don’t share |
For our affiliates’ everyday business purposes – information about your creditworthiness | | No | | We don’t share |
| For nonaffiliates to market to you | | No | | We don’t share |
| | |
| Questions? | | Call 800-225-2606 or go to mfs.com. |
25
| | |
| Who we are |
| Who is providing this notice? | | MFS Funds, MFS Investment Management, MFS Institutional Advisors, Inc., and MFS Heritage Trust Company. |
| | |
| What we do |
| How does MFS protect my personal information? | | To protect your personal information from unauthorized access and use, we use security measures that comply with federal law. These measures include procedural, electronic, and physical safeguards for the protection of the personal information we collect about you. |
How does MFS
collect my personal information? | | We collect your personal information, for example, when you • open an account or provide account information • direct us to buy securities or direct us to sell your securities • make a wire transfer We also collect your personal information from others, such as credit bureaus, affiliates, or other companies. |
| Why can’t I limit all sharing? | | Federal law gives you the right to limit only • sharing for affiliates’ everyday business purposes – information about your creditworthiness • affiliates from using your information to market to you • sharing for nonaffiliates to market to you State laws and individual companies may give you additional rights to limit sharing. |
| | |
| Definitions |
| Affiliates | | Companies related by common ownership or control. They can be financial and nonfinancial companies. • MFS does not share personal information with affiliates, except for everyday business purposes as described on page one of this notice. |
| Nonaffiliates | | Companies not related by common ownership or control. They can be financial and nonfinancial companies. • MFS does not share with nonaffiliates so they can market to you. |
| Joint marketing | | A formal agreement between nonaffiliated financial companies that together market financial products or services to you. • MFS doesn’t jointly market. |
| | |
| Other important information |
| If you own an MFS product or receive an MFS service in the name of a third party such as a bank or broker-dealer, their privacy policy may apply to you instead of ours. |
26
ANNUAL REPORT
December 31, 2017

MFS® GROWTH
ALLOCATION PORTFOLIO
MFS® Variable Insurance Trust III

VGA-ANN
MFS® GROWTH ALLOCATION PORTFOLIO
CONTENTS
The report is prepared for the general information of contract owners. It is authorized for distribution to prospective investors only when preceded or accompanied by a current prospectus.
NOT FDIC INSURED • MAY LOSE VALUE • NO BANK OR CREDIT UNION GUARANTEE • NOT A DEPOSIT • NOT INSURED BY ANY FEDERAL GOVERNMENT AGENCY OR NCUA/NCUSIF
MFS Growth Allocation Portfolio
LETTER FROM THE EXECUTIVE CHAIRMAN

Dear Contract Owners:
Rising bond yields have led to a measurable uptick in market volatility, which has been a departure from the low-volatility environment that prevailed for much of 2017. In spite of this, global markets remain elevated amid synchronized economic growth. Although the U.S. Federal Reserve continues to gradually raise interest rates and shrink its balance sheet, monetary policy remains accommodative around the world, with many central banks taking only tentative steps toward tighter policies. However, interest rates have begun to rise globally of late as investors anticipate that central policy shifts may be necessary in the months ahead.
Newly enacted U.S. tax reforms have been welcomed by equity markets while emerging market economies have been boosted by a weaker U.S. dollar. Around the world, inflation remains largely subdued but tight labor markets and solid global demand have investors on the lookout for its potential resurgence amid robust global trade and recovering commodity prices.
At MFS®, we believe having a disciplined, long-term investment approach through a full market cycle is essential to capturing the best opportunities while also managing risk. In our view, such a strategy, along with the professional guidance of a financial advisor, will help you reach your investment objectives.
Respectfully,

Robert J. Manning
Executive Chairman
MFS Investment Management
February 15, 2018
The opinions expressed in this letter are subject to change and may not be relied upon for investment advice. No forecasts can be guaranteed.
1
MFS Growth Allocation Portfolio
PORTFOLIO COMPOSITION
Portfolio target allocation
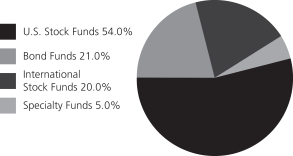
| | | | |
| Portfolio holdings | | | | |
| MFS Value Series | | | 11.0% | |
| MFS Growth Series | | | 10.9% | |
| MFS Research Series | | | 9.9% | |
| MFS Research International Portfolio | | | 9.1% | |
| MFS Mid Cap Growth Series | | | 9.0% | |
| MFS Mid Cap Value Portfolio | | | 9.0% | |
| MFS Inflation-Adjusted Bond Portfolio | | | 5.0% | |
| MFS International Growth Portfolio | | | 5.0% | |
| MFS Global Real Estate Portfolio | | | 5.0% | |
| MFS International Value Portfolio | | | 5.0% | |
| MFS High Yield Portfolio | | | 5.0% | |
| MFS Total Return Bond Series | | | 5.0% | |
| MFS Global Governments Portfolio | | | 4.0% | |
| MFS Limited Maturity Portfolio | | | 2.0% | |
| MFS New Discovery Value Portfolio | | | 2.0% | |
| MFS New Discovery Series | | | 2.0% | |
| MFS Emerging Markets Equity Portfolio | | | 1.0% | |
| Cash & Cash Equivalents | | | 0.1% | |
Portfolio actual allocation
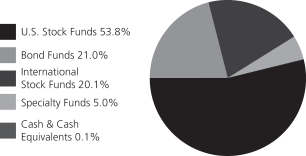
Cash & Cash Equivalents includes any cash, investments in money market funds, short-term securities, and other assets less liabilities. MFS endeavors to fully invest all MFS funds-of-funds in underlying funds on a daily basis. Any divergence from 0.0% in Cash & Cash Equivalents is typically due to the timing of fund subscriptions/redemptions and the settlement of subsequent investment in/divestment from the underlying funds. While the MFS funds-of-funds’ subscriptions/redemptions are processed at the same day NAV of the underlying funds, a positive/negative cash balance will be reflected on the MFS funds-of-funds’ Statement of Assets and Liabilities until the trades with the underlying funds settle. Please see the Statement of Assets and Liabilities for additional information related to the fund’s cash position and other assets and liabilities.
Percentages are based on net assets as of December 31, 2017.
The portfolio is actively managed and current holdings may be different.
2
MFS Growth Allocation Portfolio
MANAGEMENT REVIEW
Summary of Results
For the twelve months ended December 31, 2017, Initial Class shares of the MFS Growth Allocation Portfolio (“fund”) provided a total return of 19.86%, while Service Class shares of the fund provided a total return of 19.51%. These compare with a return of 21.83% for the fund’s benchmark, the Standard & Poor’s 500 Stock Index (“S&P 500 Index”). The fund’s other benchmark, the MFS Growth Allocation Portfolio Blended Index (“Blended Index”), generated a return of 17.83%. The Blended Index reflects the blended returns of various equity and fixed income market indices, with percentage allocations to each index designed to resemble the allocations of the fund. The market indices and related percentage allocations used to compile the Blended Index are set forth in the Performance Summary.
Market Environment
For the first time in many years, the global economy experienced a period of synchronized economic growth over the reporting period. The rebound in emerging markets (“EM”) economies was more pronounced (despite the slight deceleration in Chinese growth at the end of the period), helped by larger economies, such as Brazil and Russia, emerging from recessions. At the same time, developed markets (“DM”) economies continued to grow at or above potential. Market confidence increased in the US during the period fueled, in part, by a more lenient US regulatory backdrop and hopes for a significant cut in corporate tax rates, which came to fruition at the end of the period.
Globally, markets benefited from a reflation trade as commodity prices strengthened, activity and growth prospects improved, and inflation moved higher, though within moderate bounds. As a result, there were more tightening signals and actions by DM central banks. The US Federal Reserve increased interest rates by 25 basis points three times during the period, bringing the total number of quarter-percent hikes in the federal funds rate to five, since December 2015. The European Central Bank announced an extension of its quantitative easing program at the end of the period, but reduced the pace of its monthly asset purchases by half. In addition, the Bank of England hiked its base rate for the first time in a decade, late in the end of the period. Markets were comforted, along with central banks, by the decline in fears of a populist surge in Europe after establishment candidates won the Dutch and French elections, though a right-wing populist party gained seats in the German parliament for the first time in the post-World War II era. Additionally, European growth reflected a generally calmer political economic backdrop.
In recent months, the US dollar reversed the sharp rise seen early in the period, easing what had been a substantial headwind to earnings for multinationals. US consumer spending held up well during the second half of the period amid a modest increase in real wages and relatively low gasoline prices. However, demand for autos cooled from the record level logged early in the period, while the housing market improved, albeit constrained by below-average inventory levels. Global trade, which was sluggish early in the period, showed signs of improvement in the period’s second half, a positive indicator of global economic activity and prospects. Early in the period, there was a selloff in EM due to fears that President Trump would follow through on various campaign threats and promises that were judged to be detrimental to EM. While President Trump withdrew the US from the Trans-Pacific Partnership and began the renegotiation of the North American Free Trade Agreement, significant additional policy action was lacking on economic issues involving EM. As a result, EM resumed their upward trajectory, powered by strong inflows throughout 2017.
Factors Affecting Performance
During the reporting period, the fund underperformed its benchmark, the S&P 500 Index, as equities outpaced both the fixed income and real estate markets. However, the fund outperformed the Blended Index.
Within the U.S. equity asset class, the fund’s diversification down the market capitalization spectrum held back performance relative to the Blended Index. However, this was more than offset by strong active performance across most of the fund’s underlying portfolios, with the MFS Mid Cap Value Portfolio a notable standout.
The international equity segment also strengthened relative performance, as the MFS Research International Portfolio and the MFS International Value Portfolio outperformed their respective benchmarks during the reporting period. Additionally, the fund’s allocation to both the MFS International Growth Portfolio and MFS Emerging Markets Equity Portfolio benefited relative returns, driven by the strong performance of emerging markets.
3
MFS Growth Allocation Portfolio
Management Review – continued
Within the fixed income asset class, the fund’s allocation to the MFS Inflation-Adjusted Bond Portfolio and MFS Global Governments Portfolio benefited relative performance, as global markets in US dollar terms, performed well over the reporting period. The fund’s allocation to the MFS High Yield Portfolio also strengthened relative returns, as credit markets also performed well.
Respectfully,
Portfolio Manager(s)
Joseph Flaherty
The views expressed in this report are those of the portfolio manager(s) only through the end of the period of the report as stated on the cover and do not necessarily reflect the views of MFS or any other person in the MFS organization. These views are subject to change at any time based on market or other conditions, and MFS disclaims any responsibility to update such views. These views may not be relied upon as investment advice or an indication of trading intent on behalf of any MFS portfolio. References to specific securities are not recommendations of such securities, and may not be representative of any MFS portfolio’s current or future investments.
4
MFS Growth Allocation Portfolio
PERFORMANCE SUMMARY THROUGH 12/31/17
The following chart illustrates the historical performance of the fund in comparison to its benchmark(s). Benchmarks are unmanaged and may not be invested in directly. Benchmark returns do not reflect any fees or expenses. The performance of other share classes will be greater than or less than that of the class depicted below. (See Notes to Performance Summary.)
Performance data shown represents past performance and is no guarantee of future results. Investment return and principal value fluctuate so your units, when sold, may be worth more or less than the original cost; current performance may be lower or higher than quoted. The performance shown does not reflect the deduction of taxes, if any, that a contract holder would pay on fund distributions or the redemption of contract units. The returns for the fund shown also do not reflect the deduction of expenses associated with variable products, such as mortality and expense risk charges, separate account charges, and sales charges imposed by the insurance company separate accounts. Such expenses would reduce the overall returns shown.
Growth of a Hypothetical $10,000 Investment (t)
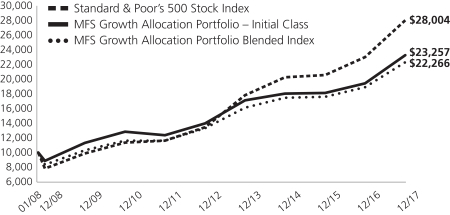
Total Returns through 12/31/17
Average annual total returns
| | | | | | | | | | | | |
| | | Share Class | | Class Inception Date | | 1-yr | | 5-yr | | Life (t) | | |
| | | Initial Class | | 10/01/08 | | 19.86% | | 10.77% | | 9.55% | | |
| | | Service Class | | 10/01/08 | | 19.51% | | 10.50% | | 9.28% | | |
| | | | |
| Comparative benchmark(s) | | | | | | | | |
| | | Standard & Poor’s 500 Stock Index (f) | | 21.83% | | 15.79% | | 11.77% | | |
| | | MFS Growth Allocation Portfolio Blended Index (f)(w) | | 17.83% | | 10.88% | | 9.03% | | |
| | | Bloomberg Barclays U.S. Aggregate Bond Index (f) | | 3.54% | | 2.10% | | 4.26% | | |
| | | FTSE EPRA/NAREIT Developed Real Estate Index (net div) (f) | | 10.36% | | 6.32% | | 6.53% | | |
| | | MSCI EAFE Index (net div) (f) | | 25.03% | | 7.90% | | 5.99% | | |
| (f) | | Source: FactSet Research Systems Inc. |
| (t) | | For the period from the class inception date through the stated period end. (See Notes to Performance Summary.) |
| (w) | | As of December 31, 2017, the MFS Growth Allocation Portfolio Blended Index was comprised of 54% Standard & Poor’s 500 Stock Index, 21% Bloomberg Barclays U.S. Aggregate Bond Index, 20% MSCI EAFE Index (net div), and 5% FTSE EPRA/NAREIT Developed Real Estate Index (net div). |
Benchmark Definition(s)
Bloomberg Barclays U.S. Aggregate Bond Index – a market capitalization-weighted index that measures the performance of the U.S. investment-grade, fixed rate bond market, with index components for government and corporate securities, mortgage pass-through securities, and asset-backed securities with at least one year to final maturity.
FTSE EPRA/NAREIT Developed Real Estate Index (net div) – measures the performance of eligible real estate equities worldwide that generate a majority of their revenue and income through the ownership, disposure and development of income-producing real estate.
5
MFS Growth Allocation Portfolio
Performance Summary – continued
MSCI EAFE (Europe, Australasia, Far East) Index (net div) – a market capitalization index that is designed to measure equity market performance in the developed markets, excluding the U.S. and Canada.
Standard & Poor’s 500 Stock Index – a market capitalization-weighted index of 500 widely held equity securities, designed to measure broad U.S. equity performance.
It is not possible to invest directly in an index.
Notes to Performance Summary
Average annual total return represents the average annual change in value for each share class for the periods presented. Life returns are presented where the share class has less than 10 years of performance history and represent the average annual total return from the class inception date to the stated period end date.
Performance results reflect any applicable expense subsidies and waivers in effect during the periods shown. Without such subsidies and waivers the fund’s performance results would be less favorable. Please see the prospectus and financial statements for complete details. All results are historical and assume the reinvestment of any dividends and capital gains distributions.
Performance prior to close of business December 7, 2012, reflects time periods when another adviser or subadviser was responsible for selecting investments for the fund under a different investment objective and different investment strategies, underlying fund selections, and underlying fund target weightings of the fund.
Performance results do not include adjustments made for financial reporting purposes in accordance with U.S. generally accepted accounting principles and may differ from amounts reported in the financial highlights.
From time to time the fund may receive proceeds from litigation settlements, without which performance would be lower.
6
MFS Growth Allocation Portfolio
EXPENSE TABLE
Fund Expenses Borne by the Contract Holders during the Period,
July 1, 2017 through December 31, 2017
As a contract holder of the fund, you incur ongoing costs, including distribution and/or service (12b-1) fees; and other fund expenses. This example is intended to help you understand your ongoing costs (in dollars) of investing in the fund and to compare these costs with the ongoing costs of investing in other mutual funds.
In addition to the fees and expenses which the fund bears directly, the fund indirectly bears a pro rata share of the fees and expenses of the underlying funds in which the fund invests. Because the underlying funds have varied expenses and fee levels and the fund may own different proportions of the underlying funds at different times, the amount of fees and expenses incurred indirectly by the fund will vary. If these indirect costs were included, your costs would have been higher.
The example is based on an investment of $1,000 invested at the beginning of the period and held for the entire period July 1, 2017 through December 31, 2017.
Actual Expenses
The first line for each share class in the following table provides information about actual account values and actual expenses. You may use the information in this line, together with the amount you invested, to estimate the expenses that you paid over the period. Simply divide your account value by $1,000 (for example, an $8,600 account value divided by $1,000 = 8.6), then multiply the result by the number in the first line under the heading entitled “Expenses Paid During Period” to estimate the expenses you paid on your account during this period.
Hypothetical Example for Comparison Purposes
The second line for each share class in the following table provides information about hypothetical account values and hypothetical expenses based on the fund’s actual expense ratio and an assumed rate of return of 5% per year before expenses, which is not the fund’s actual return. The hypothetical account values and expenses may not be used to estimate the actual ending account balance or expenses you paid for the period. You may use this information to compare the ongoing costs of investing in the fund and other funds. To do so, compare this 5% hypothetical example with the 5% hypothetical examples that appear in the shareholder reports of the other funds.
Please note that the expenses shown in the table are meant to highlight the fund’s ongoing costs only and do not take into account the fees and expenses imposed under the variable contracts through which your investment in the fund is made. Therefore, the second line for each share class in the table is useful in comparing ongoing costs associated with an investment in vehicles (such as the fund) which fund benefits under variable annuity and variable life insurance contracts and to qualified pension and retirement plans only, and will not help you determine the relative total costs of investing in the fund through variable annuity and variable life insurance contracts. If the fees and expenses imposed under the variable contracts were included, your costs would have been higher.
| | | | | | | | | | | | | | | | | | |
| Share Class | | | | Annualized
Expense Ratio | | | Beginning
Account Value
7/01/17 | | | Ending
Account Value
12/31/17 | | | Expenses Paid
During Period (p)
7/01/17-12/31/17 | |
| Initial Class | | Actual | | | 0.03% | | | | $1,000.00 | | | | $1,082.16 | | | | $0.16 | |
| | Hypothetical (h) | | | 0.03% | | | | $1,000.00 | | | | $1,025.05 | | | | $0.15 | |
| Service Class | | Actual | | | 0.28% | | | | $1,000.00 | | | | $1,080.90 | | | | $1.47 | |
| | Hypothetical (h) | | | 0.28% | | | | $1,000.00 | | | | $1,023.79 | | | | $1.43 | |
| (h) | 5% class return per year before expenses. |
| (p) | “Expenses Paid During Period” are equal to each class’s annualized expense ratio, as shown above, multiplied by the average account value over the period, multiplied by 184/365 (to reflect the one-half year period). In addition to the fees and expenses which the fund bears directly, the fund indirectly bears a pro rata share of the fees and expenses of the underlying funds in which the fund invests. If these indirect costs were included, your costs would have been higher. |
7
MFS Growth Allocation Portfolio
PORTFOLIO OF INVESTMENTS – 12/31/17
The Portfolio of Investments is a complete list of all securities owned by your fund. It is categorized by broad-based asset classes.
| | | | | | | | |
| Issuer | | Shares/Par | | | Value ($) | |
| INVESTMENT COMPANIES (h) – 100.0% | | | | | |
| Bond Funds – 21.0% | | | | | | | | |
| MFS Global Governments Portfolio – Initial Class (a) | | | 1,594,242 | | | $ | 16,835,196 | |
| MFS High Yield Portfolio – Initial Class | | | 3,643,033 | | | | 21,020,300 | |
| MFS Inflation-Adjusted Bond Portfolio – Initial Class (a) | | | 1,949,655 | | | | 21,075,773 | |
| MFS Limited Maturity Portfolio – Initial Class | | | 825,077 | | | | 8,399,288 | |
| MFS Total Return Bond Series – Initial Class | | | 1,589,342 | | | | 21,011,098 | |
| | | | | | | | |
| | | | | | $ | 88,341,655 | |
| | | | | | | | |
| International Stock Funds – 20.1% | | | | | | | | |
| MFS Emerging Markets Equity Portfolio – Initial Class | | | 244,952 | | | $ | 4,213,170 | |
| MFS International Growth Portfolio – Initial Class | | | 1,359,489 | | | | 21,072,087 | |
| MFS International Value Portfolio – Initial Class | | | 744,930 | | | | 21,044,282 | |
| MFS Research International Portfolio – Initial Class | | | 2,224,083 | | | | 37,920,621 | |
| | | | | | | | |
| | | | | | $ | 84,250,160 | |
| | | | | | | | |
| Specialty Funds – 5.0% | | | | | | | | |
| MFS Global Real Estate Portfolio – Initial Class | | | 1,475,141 | | | $ | 21,050,257 | |
| | | | | | | | |
| U.S. Stock Funds – 53.8% | | | | | | | | |
| MFS Growth Series – Initial Class | | | 941,343 | | | $ | 46,031,655 | |
| MFS Mid Cap Growth Series – Initial Class | | | 3,965,067 | | | | 37,707,790 | |
| MFS Mid Cap Value Portfolio – Initial Class | | | 4,184,248 | | | | 37,700,078 | |
| MFS New Discovery Series – Initial Class | | | 417,359 | | | | 8,388,920 | |
| MFS New Discovery Value Portfolio – Initial Class | | | 753,947 | | | | 8,391,430 | |
| MFS Research Series – Initial Class | | | 1,419,152 | | | | 41,864,995 | |
| MFS Value Series – Initial Class | | | 2,203,345 | | | | 46,093,973 | |
| | | | | | | | |
| | | | | | $ | 226,178,841 | |
| | | | | | | | |
| | | | | | | | |
| Issuer | | Shares/Par | | | Value ($) | |
| INVESTMENT COMPANIES (h) – continued | | | | | |
| Money Market Funds – 0.1% | | | | | |
MFS Institutional Money Market Portfolio,
1.25% (v) | | | 263,952 | | | $ | 263,926 | |
| | | | | | | | |
Total Investment Companies
(Identified Cost, $324,497,031) | | | | | | $ | 420,084,839 | |
| | | | | | | | |
OTHER ASSETS, LESS
LIABILITIES – (0.0)% | | | | | | | (45,169 | ) |
| | | | | | | | |
| NET ASSETS – 100.0% | | | | | | $ | 420,039,670 | |
| | | | | | | | |
| (a) | | Non-income producing security. |
| (h) | | An affiliated issuer may be considered one in which the fund owns 5% or more of the outstanding voting securities, or a company which is under common control. At period end, the aggregate values of the fund’s investments in affiliated issuers and in unaffiliated issuers were $420,084,839 and $0, respectively. |
| (v) | | Affiliated issuer that is available only to investment companies managed by MFS. The rate quoted for the MFS Institutional Money Market Portfolio is the annualized seven-day yield of the fund at period end. |
See Notes to Financial Statements
8
MFS Growth Allocation Portfolio
FINANCIAL STATEMENTS | STATEMENT OF ASSETS AND LIABILITIES
This statement represents your fund’s balance sheet, which details the assets and liabilities comprising the total value of the fund.
| | | | |
At 12/31/17 | | | | |
Assets | | | | |
Investments in affiliated issuers, at value (identified cost, $324,497,031) | | | $420,084,839 | |
Receivables for | | | | |
Investments sold | | | 626,932 | |
Fund shares sold | | | 235 | |
Other assets | | | 2,832 | |
Total assets | | | $420,714,838 | |
Liabilities | | | | |
Payable for fund shares reacquired | | | $627,167 | |
Payable to affiliates | | | | |
Administrator | | | 190 | |
Shareholder servicing costs | | | 88 | |
Distribution and/or service fees | | | 11,413 | |
Payable for independent Trustees’ compensation | | | 60 | |
Accrued expenses and other liabilities | | | 36,250 | |
Total liabilities | | | $675,168 | |
Net assets | | | $420,039,670 | |
Net assets consist of | | | | |
Paid-in capital | | | $295,249,978 | |
Unrealized appreciation (depreciation) | | | 95,587,808 | |
Accumulated net realized gain (loss) | | | 23,226,594 | |
Undistributed net investment income | | | 5,975,290 | |
Net assets | | | $420,039,670 | |
Shares of beneficial interest outstanding | | | 34,366,415 | |
| | | | | | | | | | | | |
| | | Net assets | | | Shares
outstanding | | | Net asset value
per share | |
Initial Class | | | $4,116,487 | | | | 337,044 | | | | $12.21 | |
Service Class | | | 415,923,183 | | | | 34,029,371 | | | | 12.22 | |
Net asset value per share is calculated using actual net assets and shares outstanding rather than amounts that have been rounded for presentation purposes.
See Notes to Financial Statements
9
MFS Growth Allocation Portfolio
FINANCIAL STATEMENTS | STATEMENT OF OPERATIONS
This statement describes how much your fund earned in investment income and accrued in expenses. It also describes any gains and/or losses generated by fund operations.
| | | | |
Year ended 12/31/17 | | | | |
Net investment income (loss) | | | | |
Dividends from affiliated issuers | | | $7,148,617 | |
Expenses | | | | |
Distribution and/or service fees | | | $1,055,508 | |
Shareholder servicing costs | | | 9,580 | |
Administrative services fee | | | 17,500 | |
Independent Trustees’ compensation | | | 9,160 | |
Custodian fee | | | 6,573 | |
Shareholder communications | | | 13,554 | |
Audit and tax fees | | | 37,543 | |
Legal fees | | | 5,804 | |
Miscellaneous | | | 17,874 | |
Total expenses | | | $1,173,096 | |
Net investment income (loss) | | | $5,975,521 | |
Realized and unrealized gain (loss) | | | | |
Realized gain (loss) (identified cost basis) | | | | |
Affiliated issuers | | | $13,067,584 | |
Capital gain distributions from affiliated issuers | | | 11,758,518 | |
Net realized gain (loss) | | | $24,826,102 | |
Change in unrealized appreciation (depreciation) | | | | |
Affiliated issuers | | | 45,331,921 | |
Net realized and unrealized gain (loss) | | | $70,158,023 | |
Change in net assets from operations | | | $76,133,544 | |
See Notes to Financial Statements
10
MFS Growth Allocation Portfolio
FINANCIAL STATEMENTS | STATEMENTS OF CHANGES IN NET ASSETS
These statements describe the increases and/or decreases in net assets resulting from operations, any distributions, and any shareholder transactions.
| | | | | | | | |
| | | Year ended | |
| | | 12/31/17 | | | | 12/31/16 | |
Change in net assets | | | | | | | | |
From operations | | | | | | | | |
Net investment income (loss) | | | $5,975,521 | | | | $6,733,946 | |
Net realized gain (loss) | | | 24,826,102 | | | | 21,721,064 | |
Net unrealized gain (loss) | | | 45,331,921 | | | | 1,399,771 | |
Change in net assets from operations | | | $76,133,544 | | | | $29,854,781 | |
Distributions declared to shareholders | | | | | | | | |
From net investment income | | | $(6,734,034 | ) | | | $(10,983,900 | ) |
From net realized gain | | | (21,973,275 | ) | | | (30,256,616 | ) |
Total distributions declared to shareholders | | | $(28,707,309 | ) | | | $(41,240,516 | ) |
Change in net assets from fund share transactions | | | $(51,183,005 | ) | | | $(35,961,954 | ) |
Total change in net assets | | | $(3,756,770 | ) | | | $(47,347,689 | ) |
Net assets | | | | | | | | |
At beginning of period | | | 423,796,440 | | | | 471,144,129 | |
At end of period (including undistributed net investment income of $5,975,290 and
$6,733,803, respectively) | | | $420,039,670 | | | | $423,796,440 | |
See Notes to Financial Statements
11
MFS Growth Allocation Portfolio
FINANCIAL STATEMENTS | FINANCIAL HIGHLIGHTS
The financial highlights table is intended to help you understand the fund’s financial performance for the past 5 years. Certain information reflects financial results for a single fund share. The total returns in the table represent the rate that an investor would have earned (or lost) on an investment in the fund share class (assuming reinvestment of all distributions) held for the entire period.
| | | | | | | | | | | | | | | | | | | | |
| Initial Class | | Year ended | |
| | | 12/31/17 | | | 12/31/16 | | | 12/31/15 | | | 12/31/14 | | | 12/31/13 | |
Net asset value, beginning of period | | | $10.97 | | | | $11.27 | | | | $12.42 | | | | $12.19 | | | | $11.22 | |
| Income (loss) from investment operations | | | | | | | | | | | | | | | | | | | | |
Net investment income (loss) (d)(l) | | | $0.21 | | | | $0.20 | (c) | | | $0.21 | | | | $0.16 | | | | $0.12 | |
Net realized and unrealized gain (loss) | | | 1.91 | | | | 0.62 | | | | (0.19 | ) | | | 0.50 | | | | 2.28 | |
Total from investment operations | | | $2.12 | | | | $0.82 | | | | $0.02 | | | | $0.66 | | | | $2.40 | |
| Less distributions declared to shareholders | | | | | | | | | | | | | | | | | | | | |
From net investment income | | | $(0.23 | ) | | | $(0.32 | ) | | | $(0.58 | ) | | | $(0.21 | ) | | | $(0.32 | ) |
From net realized gain | | | (0.65 | ) | | | (0.80 | ) | | | (0.59 | ) | | | (0.22 | ) | | | (1.11 | ) |
Total distributions declared to shareholders | | | $(0.88 | ) | | | $(1.12 | ) | | | $(1.17 | ) | | | $(0.43 | ) | | | $(1.43 | ) |
Net asset value, end of period (x) | | | $12.21 | | | | $10.97 | | | | $11.27 | | | | $12.42 | | | | $12.19 | |
Total return (%) (k)(r)(s)(x) | | | 19.86 | | | | 7.15 | (c) | | | 0.53 | | | | 5.39 | | | | 22.56 | |
Ratios (%) (to average net assets)
and Supplemental data: | | | | | | | | | | | | | | | | | | | | |
Expenses before expense reductions (f)(h) | | | 0.03 | | | | 0.03 | (c) | | | 0.02 | | | | 0.03 | | | | 0.03 | |
Expenses after expense reductions (f)(h) | | | N/A | | | | N/A | | | | N/A | | | | 0.03 | | | | 0.03 | |
Net investment income (loss) (l) | | | 1.75 | | | | 1.81 | (c) | | | 1.75 | | | | 1.29 | | | | 0.98 | |
Portfolio turnover | | | 2 | | | | 1 | | | | 1 | | | | 1 | | | | 4 | |
Net assets at end of period (000 omitted) | | | $4,116 | | | | $3,140 | | | | $2,908 | | | | $2,939 | | | | $2,858 | |
| |
| Service Class | | Year ended | |
| | | 12/31/17 | | | 12/31/16 | | | 12/31/15 | | | 12/31/14 | | | 12/31/13 | |
Net asset value, beginning of period | | | $10.98 | | | | $11.27 | | | | $12.41 | | | | $12.19 | | | | $11.21 | |
| Income (loss) from investment operations | | | | | | | | | | | | | | | | | | | | |
Net investment income (loss) (d)(l) | | | $0.17 | | | | $0.17 | (c) | | | $0.17 | | | | $0.12 | | | | $0.08 | |
Net realized and unrealized gain (loss) | | | 1.92 | | | | 0.63 | | | | (0.18 | ) | | | 0.50 | | | | 2.30 | |
Total from investment operations | | | $2.09 | | | | $0.80 | | | | $(0.01 | ) | | | $0.62 | | | | $2.38 | |
| Less distributions declared to shareholders | | | | | | | | | | | | | | | | | | | | |
From net investment income | | | $(0.20 | ) | | | $(0.29 | ) | | | $(0.54 | ) | | | $(0.18 | ) | | | $(0.29 | ) |
From net realized gain | | | (0.65 | ) | | | (0.80 | ) | | | (0.59 | ) | | | (0.22 | ) | | | (1.11 | ) |
Total distributions declared to shareholders | | | $(0.85 | ) | | | $(1.09 | ) | | | $(1.13 | ) | | | $(0.40 | ) | | | $(1.40 | ) |
Net asset value, end of period (x) | | | $12.22 | | | | $10.98 | | | | $11.27 | | | | $12.41 | | | | $12.19 | |
Total return (%) (k)(r)(s)(x) | | | 19.51 | | | | 6.94 | (c) | | | 0.30 | | | | 5.04 | | | | 22.38 | |
Ratios (%) (to average net assets)
and Supplemental data: | | | | | | | | | | | | | | | | | | | | |
Expenses before expense reductions (f)(h) | | | 0.28 | | | | 0.28 | (c) | | | 0.27 | | | | 0.28 | | | | 0.28 | |
Expenses after expense reductions (f)(h) | | | N/A | | | | N/A | | | | N/A | | | | 0.28 | | | | 0.28 | |
Net investment income (loss) (l) | | | 1.40 | | | | 1.50 | (c) | | | 1.40 | | | | 1.00 | | | | 0.71 | |
Portfolio turnover | | | 2 | | | | 1 | | | | 1 | | | | 1 | | | | 4 | |
Net assets at end of period (000 omitted) | | | $415,923 | | | | $420,657 | | | | $468,237 | | | | $538,164 | | | | $618,967 | |
See Notes to Financial Statements
12
MFS Growth Allocation Portfolio
Financial Highlights – continued
| (c) | Amount reflects a one-time reimbursement of expenses by the custodian (or former custodian) without which net investment income and performance would be lower and expenses would be higher. |
| (d) | Per share data is based on average shares outstanding. |
| (f) | Ratios do not reflect reductions from fees paid indirectly, if applicable. |
| (h) | In addition to the fees and expenses which the fund bears directly, the fund indirectly bears a pro rata share of the fees and expenses of the underlying affiliated funds in which the fund invests. Accordingly, the expense ratio for the fund reflects only those fees and expenses borne directly by the fund. Because the underlying affiliated funds have varied expense and fee levels and the fund may own different proportions of the underlying affiliated funds at different times, the amount of fees and expenses incurred indirectly by the fund will vary. |
| (k) | The total return does not reflect expenses that apply to separate accounts. Inclusion of these charges would reduce the total return figures for all periods shown. |
| (l) | Recognition of net investment income by the fund may be affected by the timing of the declaration of dividends by the underlying affiliated funds in which the fund invests. The ratios and per share amounts do not include net investment income of the underlying affiliated funds in which the fund invests. |
| (r) | Certain expenses have been reduced without which performance would have been lower. |
| (s) | From time to time the fund may receive proceeds from litigation settlements, without which performance would be lower. |
| (x) | The net asset values and total returns have been calculated on net assets which include adjustments made in accordance with U.S. generally accepted accounting principles required at period end for financial reporting purposes. |
See Notes to Financial Statements
13
MFS Growth Allocation Portfolio
NOTES TO FINANCIAL STATEMENTS
| (1) | | Business and Organization |
MFS Growth Allocation Portfolio (the fund) is a diversified series of MFS Variable Insurance Trust III (the trust). The trust is organized as a Delaware statutory trust and is registered under the Investment Company Act of 1940, as amended, as an open-end management investment company. The shareholders of each series of the trust are separate accounts of insurance companies, which offer variable annuity and/or life insurance products, and qualified retirement and pension plans.
The fund is an investment company and accordingly follows the investment company accounting and reporting guidance of the Financial Accounting Standards Board (FASB) Accounting Standards Codification Topic 946 Financial Services – Investment Companies.
| (2) | | Significant Accounting Policies |
General – The preparation of financial statements in conformity with U.S. generally accepted accounting principles requires management to make estimates and assumptions that affect the reported amounts of assets and liabilities, and disclosure of contingent assets and liabilities at the date of the financial statements and the reported amounts of increases and decreases in net assets from operations during the reporting period. Actual results could differ from those estimates. In the preparation of these financial statements, management has evaluated subsequent events occurring after the date of the fund’s Statement of Assets and Liabilities through the date that the financial statements were issued.
The fund is a “fund of funds”, which invests the majority of its assets in other MFS mutual funds (hereafter referred to as “underlying affiliated funds” or “underlying funds”), which may have different fiscal year ends than the funds. The underlying funds, in turn, may engage in a number of investment techniques and practices, which involve certain risks. Certain underlying funds invest their portfolio in high-yield securities rated below investment grade. Investments in below investment grade quality securities can involve a substantially greater risk of default or can already be in default, and their values can decline significantly. Below investment grade quality securities tend to be more sensitive to adverse news about the issuer, or the market or economy in general, than higher quality debt instruments. Certain underlying funds invest a significant portion of their assets in asset-backed and/or mortgage-backed securities. For these securities, the value of the debt instrument also depends on the credit quality and adequacy of the underlying assets or collateral as well as whether there is a security interest in the underlying assets or collateral. Enforcing rights, if any, against the underlying assets or collateral may be difficult. U.S. Government securities not supported as to the payment of principal or interest by the U.S. Treasury, such as those issued by Fannie Mae, Freddie Mac, and the Federal Home Loan Banks, are subject to greater credit risk than are U.S. Government securities supported by the U.S. Treasury, such as those issued by Ginnie Mae. Certain underlying funds invest in foreign securities, including securities of emerging market issuers. Investments in foreign securities are vulnerable to the effects of changes in the relative values of the local currency and the U.S. dollar and to the effects of changes in each country’s market, economic, industry, political, regulatory, geopolitical, and other conditions. Investments in emerging markets can involve additional and greater risks than the risks associated with investments in developed foreign markets. Emerging markets can have less developed markets, greater custody and operational risk, less developed legal, regulatory, and accounting systems, and greater political, social, and economic instability than developed markets.
The accounting policies of the underlying funds in which the fund invests are outlined in the underlying funds’ shareholder reports, which are available without charge by calling 1-800-225-2606, at mfs.com and on the Securities and Exchange Commission (SEC) web site at http://www.sec.gov or at the SEC’s public reference room in Washington, D.C. The underlying funds’ shareholder reports are not covered by this report.
In October 2016, the Securities and Exchange Commission (SEC) released its final rule on Investment Company Reporting Modernization (the “Rule”). The Rule, which introduced two new regulatory reporting forms for investment companies – Form N-PORT and Form N-CEN – also contained amendments to Regulation S-X which impact financial statement presentation, particularly the presentation of derivative investments, for all reporting periods ending after August 1, 2017. The fund has adopted the Rule’s Regulation S-X amendments and believes that the fund’s financial statements are in compliance with those amendments.
Investment Valuations – Open-end investment companies (underlying funds) are generally valued at their net asset value per share. The investments of underlying funds managed by the adviser are valued as described below. For purposes of this policy disclosure, “fund” also refers to the underlying funds in which the fund-of-funds invests.
Equity securities, including restricted equity securities and equity securities held short, are generally valued at the last sale or official closing price on their primary market or exchange as provided by a third-party pricing service. Equity securities, for which there were no sales reported that day, are generally valued at the last quoted daily bid quotation on their primary market or exchange as provided by a third-party pricing service. Equity securities held short, for which there were no sales reported for that day, are generally valued at the last quoted daily ask quotation on their primary market or exchange as provided by a third-party pricing service. Debt instruments and floating rate loans, including restricted debt instruments, are generally valued at an evaluated or composite bid as provided by a third-party pricing service. Short-term instruments with a maturity at issuance of 60 days or less may be valued at amortized cost, which approximates market value. Exchange-traded options are generally valued at the last sale or
14
MFS Growth Allocation Portfolio
Notes to Financial Statements – continued
official closing price on their primary exchange as provided by a third-party pricing service. Exchange-traded options for which there were no sales reported that day are generally valued at the last daily bid quotation on their primary exchange as provided by a third-party pricing service. Options not traded on an exchange are generally valued at a broker/dealer bid quotation. Foreign currency options are generally valued at valuations provided by a third-party pricing service. Futures contracts are generally valued at last posted settlement price on their primary exchange as provided by a third-party pricing service. Futures contracts for which there were no trades that day for a particular position are generally valued at the closing bid quotation on their primary exchange as provided by a third-party pricing service. Forward foreign currency exchange contracts are generally valued at the mean of bid and asked prices for the time period interpolated from rates provided by a third-party pricing service for proximate time periods. Swap agreements are generally valued at valuations provided by a third-party pricing service, which for cleared swaps includes an evaluation of any trading activity at the clearinghouses. Open-end investment companies are generally valued at net asset value per share. Securities and other assets generally valued on the basis of information from a third-party pricing service may also be valued at a broker/dealer bid quotation. Values obtained from third-party pricing services can utilize both transaction data and market information such as yield, quality, coupon rate, maturity, type of issue, trading characteristics, and other market data. The values of foreign securities and other assets and liabilities expressed in foreign currencies are converted to U.S. dollars using the mean of bid and asked prices for rates provided by a third-party pricing service.
The Board of Trustees has delegated primary responsibility for determining or causing to be determined the value of the fund’s investments (including any fair valuation) to the adviser pursuant to valuation policies and procedures approved by the Board. If the adviser determines that reliable market quotations are not readily available, investments are valued at fair value as determined in good faith by the adviser in accordance with such procedures under the oversight of the Board of Trustees. Under the fund’s valuation policies and procedures, market quotations are not considered to be readily available for most types of debt instruments and floating rate loans and many types of derivatives. These investments are generally valued at fair value based on information from third-party pricing services. In addition, investments may be valued at fair value if the adviser determines that an investment’s value has been materially affected by events occurring after the close of the exchange or market on which the investment is principally traded (such as foreign exchange or market) and prior to the determination of the fund’s net asset value, or after the halting of trading of a specific security where trading does not resume prior to the close of the exchange or market on which the security is principally traded. Events that occur on a frequent basis after foreign markets close (such as developments in foreign markets and significant movements in the U.S. markets) and prior to the determination of the fund’s net asset value may be deemed to have a material effect on the value of securities traded in foreign markets. Accordingly, the fund’s foreign equity securities may often be valued at fair value. The adviser generally relies on third-party pricing services or other information (such as the correlation with price movements of similar securities in the same or other markets; the type, cost and investment characteristics of the security; the business and financial condition of the issuer; and trading and other market data) to assist in determining whether to fair value and at what value to fair value an investment. The value of an investment for purposes of calculating the fund’s net asset value can differ depending on the source and method used to determine value. When fair valuation is used, the value of an investment used to determine the fund’s net asset value may differ from quoted or published prices for the same investment. There can be no assurance that the fund could obtain the fair value assigned to an investment if it were to sell the investment at the same time at which the fund determines its net asset value per share.
Various inputs are used in determining the value of the fund’s assets or liabilities. These inputs are categorized into three broad levels. In certain cases, the inputs used to measure fair value may fall into different levels of the fair value hierarchy. In such cases, an investment’s level within the fair value hierarchy is based on the lowest level of input that is significant to the fair value measurement. The fund’s assessment of the significance of a particular input to the fair value measurement in its entirety requires judgment, and considers factors specific to the investment. Level 1 includes unadjusted quoted prices in active markets for identical assets or liabilities. Level 2 includes other significant observable market-based inputs (including quoted prices for similar securities, interest rates, prepayment speed, and credit risk). Level 3 includes unobservable inputs, which may include the adviser’s own assumptions in determining the fair value of investments. The following is a summary of the levels used as of December 31, 2017 in valuing the fund’s assets or liabilities:
| | | | | | | | | | | | | | | | |
| Financial Instruments | | Level 1 | | | Level 2 | | | Level 3 | | | Total | |
| Mutual Funds | | | $420,084,839 | | | | $��� | | | | $— | | | | $420,084,839 | |
For further information regarding security characteristics, see the Portfolio of Investments. Please refer to the underlying funds’ shareholder reports for further information regarding the levels used in valuing the underlying funds’ assets or liabilities.
Derivatives – The fund does not invest in derivatives directly. The fund does invest in underlying funds that may use derivatives for different purposes, primarily to increase or decrease exposure to a particular market or segment of the market, or security, to increase or decrease interest rate or currency exposure, or as alternatives to direct investments. Derivatives are used for hedging or non-hedging purposes. While hedging can reduce or eliminate losses, it can also reduce or eliminate gains. When the underlying funds use derivatives as an investment to increase market exposure, or for hedging purposes, gains and losses from derivative instruments may be substantially greater than the derivative’s original cost.
15
MFS Growth Allocation Portfolio
Notes to Financial Statements – continued
Indemnifications – Under the fund’s organizational documents, its officers and Trustees may be indemnified against certain liabilities and expenses arising out of the performance of their duties to the fund. Additionally, in the normal course of business, the fund enters into agreements with service providers that may contain indemnification clauses. The fund’s maximum exposure under these agreements is unknown as this would involve future claims that may be made against the fund that have not yet occurred.
Investment Transactions and Income – Investment transactions are recorded on the trade date. Interest income is recorded on an accrual basis. All premium and discount is amortized or accreted for financial statement purposes in accordance with U.S. generally accepted accounting principles. Distributions of income and capital gains from the underlying funds are recorded on the ex-dividend date. Recognition of net investment income by the fund is affected by the timing of the declaration of distributions by the underlying funds in which the fund invests. In determining the net gain or loss on securities sold, the cost of securities is determined on the identified cost basis.
The fund and/or the underlying funds may receive proceeds from litigation settlements. Any proceeds received from litigation involving portfolio holdings are reflected in the Statement of Operations in realized gain/loss if the security has been disposed of by the fund or in unrealized gain/loss if the security is still held by the fund. Any other proceeds from litigation not related to portfolio holdings are reflected as other income in the Statement of Operations.
Tax Matters and Distributions – The fund intends to qualify as a regulated investment company, as defined under Subchapter M of the Internal Revenue Code, and to distribute all of its taxable income, including realized capital gains. As a result, no provision for federal income tax is required. The fund’s federal tax returns, when filed, will remain subject to examination by the Internal Revenue Service for a three year period. Management has analyzed the fund’s tax positions taken on federal and state tax returns for all open tax years and does not believe that there are any uncertain tax positions that require recognition of a tax liability.
Distributions to shareholders are recorded on the ex-dividend date. Income and capital gain distributions are determined in accordance with income tax regulations, which may differ from U.S. generally accepted accounting principles. Certain capital accounts in the financial statements are periodically adjusted for permanent differences in order to reflect their tax character. These adjustments have no impact on net assets or net asset value per share. Temporary differences which arise from recognizing certain items of income, expense, gain or loss in different periods for financial statement and tax purposes will reverse at some time in the future. Distributions in excess of net investment income or net realized gains are temporary overdistributions for financial statement purposes resulting from differences in the recognition or classification of income or distributions for financial statement and tax purposes.
Book/tax differences primarily relate to wash sale loss deferrals.
The tax character of distributions declared to shareholders for the last two fiscal years is as follows:
| | | | | | | | |
| | | Year ended | | | Year ended | |
| | | 12/31/17 | | | 12/31/16 | |
| Ordinary income (including any short-term capital gains) | | | $6,853,058 | | | | $12,020,610 | |
| Long-term capital gains | | | 21,854,251 | | | | 29,219,906 | |
| Total distributions | | | $28,707,309 | | | | $41,240,516 | |
The federal tax cost and the tax basis components of distributable earnings were as follows:
| | | | |
| As of 12/31/17 | | | | |
| Cost of investments | | | $326,158,929 | |
| Gross appreciation | | | 95,484,801 | |
| Gross depreciation | | | (1,558,891 | ) |
| Net unrealized appreciation (depreciation) | | | $93,925,910 | |
| Undistributed ordinary income | | | 6,785,025 | |
| Undistributed long-term capital gain | | | 24,078,757 | |
Multiple Classes of Shares of Beneficial Interest – The fund offers multiple classes of shares, which differ in their respective distribution and/or service fees. The fund’s income, realized and unrealized gain (loss), and common expenses are allocated to shareholders based on the daily net assets of each class. Dividends are declared separately for each class. Differences in per share
16
MFS Growth Allocation Portfolio
Notes to Financial Statements – continued
dividend rates are generally due to differences in separate class expenses. The fund’s distributions declared to shareholders as reported in the Statements of Changes in Net Assets are presented by class as follows:
| | | | | | | | | | | | | | | | |
| | | From net investment
income | | | From net realized gain on
investments | |
| | | Year ended
12/31/17 | | | Year ended
12/31/16 | | | Year ended
12/31/17 | | | Year ended
12/31/16 | |
| Initial Class | | | $73,606 | | | | $87,692 | | | | $206,198 | | | | $216,265 | |
| Service Class | | | 6,660,428 | | | | 10,896,208 | | | | 21,767,077 | | | | 30,040,351 | |
| Total | | | $6,734,034 | | | | $10,983,900 | | | | $21,973,275 | | | | $30,256,616 | |
| (3) | | Transactions with Affiliates |
Investment Adviser – The fund has an investment advisory agreement with MFS to provide overall investment management and related administrative services and facilities to the funds. MFS receives no compensation under this agreement; however MFS receives management fees from the underlying MFS funds.
The investment adviser has agreed in writing to pay a portion of the fund’s operating expenses, excluding distribution and/or service fees, interest, taxes, extraordinary expenses, brokerage and transaction costs, and investment-related expenses such as fees and expenses associated with investments in investment companies and other similar investment vehicles, such that fund operating expenses do not exceed 0.20% annually of the fund’s average daily net assets. This written agreement will continue until modified by the fund’s Board of Trustees, but such agreement will continue at least until April 30, 2019. For the year ended December 31, 2017, the fund’s actual operating expenses did not exceed the limit and therefore, the investment adviser did not pay any portion of the fund’s expenses related to this agreement.
In addition to the fees and expenses which the fund bears directly, the fund indirectly bears a pro rata share of the fees and expenses of the underlying funds in which a fund invests. Accordingly, the expense ratio for the fund reflects only those fees and expenses borne directly by the fund.
Distributor – MFS Fund Distributors, Inc. (MFD), a wholly-owned subsidiary of MFS, is the distributor of shares of the fund. The Trustees have adopted a distribution plan for the Service Class shares pursuant to Rule 12b-1 under the Investment Company Act of 1940.
The fund’s distribution plan provides that the fund will pay MFD distribution and/or service fees equal to 0.25% per annum of its average daily net assets attributable to Service Class shares as partial consideration for services performed and expenses incurred by MFD and financial intermediaries (including participating insurance companies that invest in the fund to fund variable annuity and variable life insurance contracts, sponsors of qualified retirement and pension plans that invest in the fund, and affiliates of these participating insurance companies and plan sponsors) in connection with the sale and distribution of the Service Class shares. MFD may subsequently pay all, or a portion, of the distribution and/or service fees to financial intermediaries.
Shareholder Servicing Agent – MFS Service Center, Inc. (MFSC), a wholly-owned subsidiary of MFS, receives a fee from the fund for its services as shareholder servicing agent. For the year ended December 31, 2017, the fee was $9,191, which equated to 0.0022% annually of the fund’s average daily net assets. MFSC also receives payment from the fund for out-of-pocket expenses paid by MFSC on behalf of the fund. For the year ended December 31, 2017, these costs amounted to $389.
Administrator – MFS provides certain financial, legal, shareholder communications, compliance, and other administrative services to the fund. Under an administrative services agreement, the fund reimburses MFS the costs incurred to provide these services. The fund pays an annual fixed amount of $17,500. The administrative services fee incurred for the year ended December 31, 2017 was equivalent to an annual effective rate of 0.0041% the fund’s average daily net assets.
Trustees’ and Officers’ Compensation – The fund pays compensation to independent Trustees in the form of a retainer, attendance fees, and additional compensation to Board and Committee chairpersons. The fund does not pay compensation directly to Trustees or officers of the fund who are also officers of the investment adviser, all of whom receive remuneration for their services to the fund from MFS. Certain officers and Trustees of the fund are officers or directors of MFS, MFD, and MFSC.
Other – This fund and certain other funds managed by MFS (the funds) have entered into a service agreement (the ISO Agreement) which provides for payment of fees solely by the funds to Tarantino LLC in return for the provision of services of an Independent Senior Officer (ISO) for the funds. Frank L. Tarantino serves as the ISO and is an officer of the funds and the sole member of Tarantino LLC. The funds can terminate the ISO Agreement with Tarantino LLC at any time under the terms of the ISO Agreement. For the year ended December 31, 2017, the fee paid by the fund under this agreement was $756 and is included in “Miscellaneous” expense in the Statement of Operations. MFS has agreed to bear all expenses associated with office space, other administrative support, and supplies provided to the ISO.
The fund invests in the MFS Institutional Money Market Portfolio which is managed by MFS and seeks current income consistent with preservation of capital and liquidity. This money market fund does not pay a management fee to MFS.
17
MFS Growth Allocation Portfolio
Notes to Financial Statements – continued
For the year ended December 31, 2017, purchases and sales of shares of underlying funds aggregated $9,832,100 and $90,891,511, respectively.
| (5) | | Shares of Beneficial Interest |
The fund’s Declaration of Trust permits the Trustees to issue an unlimited number of full and fractional shares of beneficial interest. Transactions in fund shares were as follows:
| | | | | | | | | | | | | | | | |
| | | Year ended 12/31/17 | | | Year ended 12/31/16 | |
| | | Shares | | | Amount | | | Shares | | | Amount | |
| Shares sold | | | | | | | | | | | | | | | | |
Initial Class | | | 52,316 | | | | $607,045 | | | | 30,929 | | | | $342,169 | |
Service Class | | | 1,144,381 | | | | 13,421,704 | | | | 1,222,192 | | | | 13,813,513 | |
| | | 1,196,697 | | | | $14,028,749 | | | | 1,253,121 | | | | $14,155,682 | |
| Shares issued to shareholders in reinvestment of distributions | | | | | | | | | | | | | | | | |
Initial Class | | | 24,523 | | | | $279,804 | | | | 27,285 | | | | $303,957 | |
Service Class | | | 2,487,096 | | | | 28,427,505 | | | | 3,671,440 | | | | 40,936,559 | |
| | | 2,511,619 | | | | $28,707,309 | | | | 3,698,725 | | | | $41,240,516 | |
| Shares reacquired | | | | | | | | | | | | | | | | |
Initial Class | | | (25,904 | ) | | | $(303,523 | ) | | | (30,130 | ) | | | $(336,968 | ) |
Service Class | | | (7,917,693 | ) | | | (93,615,540 | ) | | | (8,127,901 | ) | | | (91,021,184 | ) |
| | | (7,943,597 | ) | | | $(93,919,063 | ) | | | (8,158,031 | ) | | | $(91,358,152 | ) |
| Net change | | | | | | | | | | | | | | | | |
Initial Class | | | 50,935 | | | | $583,326 | | | | 28,084 | | | | $309,158 | |
Service Class | | | (4,286,216 | ) | | | (51,766,331 | ) | | | (3,234,269 | ) | | | (36,271,112 | ) |
| | | (4,235,281 | ) | | | $(51,183,005 | ) | | | (3,206,185 | ) | | | $(35,961,954 | ) |
The fund and certain other funds managed by MFS participate in a $1.25 billion unsecured committed line of credit, subject to a $1 billion sublimit, provided by a syndication of banks under a credit agreement. Borrowings may be made for temporary financing needs. Interest is charged to each fund, based on its borrowings, generally at a rate equal to the higher of the Overnight Federal Reserve funds rate or daily one month LIBOR plus an agreed upon spread. A commitment fee, based on the average daily, unused portion of the committed line of credit, is allocated among the participating funds at the end of each calendar quarter. In addition, the fund and other funds managed by MFS have established unsecured uncommitted borrowing arrangements with certain banks for temporary financing needs. Interest is charged to each fund, based on its borrowings, at a rate equal to the Overnight Federal Reserve funds rate plus an agreed upon spread. For the year ended December 31, 2017, the fund’s commitment fee and interest expense were $2,855 and $0, respectively, and are included in “Miscellaneous” expense in the Statement of Operations.
18
MFS Growth Allocation Portfolio
Notes to Financial Statements – continued
| (7) | | Investments in Affiliated Issuers |
An affiliated issuer may be considered one in which the fund owns 5% or more of the outstanding voting securities, or a company which is under common control. For the purposes of this report, the fund assumes the following to be affiliated issuers:
| | | | | | | | | | | | | | | | | | | | |
| Underlying Affiliated Funds | | | | | Beginning
Shares/Par
Amount | | | Acquisitions
Shares/Par
Amount | | | Dispositions
Shares/Par
Amount | | | Ending
Shares/Par
Amount | |
| MFS Emerging Markets Equity Portfolio | | | | | | | 332,359 | | | | 7,659 | | | | (95,066 | ) | | | 244,952 | |
| MFS Global Governments Portfolio | | | | | | | 1,644,025 | | | | 125,218 | | | | (175,001 | ) | | | 1,594,242 | |
| MFS Global Real Estate Portfolio | | | | | | | 1,519,359 | | | | 210,276 | | | | (254,494 | ) | | | 1,475,141 | |
| MFS Growth Series | | | | | | | 1,198,827 | | | | 56,155 | | | | (313,639 | ) | | | 941,343 | |
| MFS High Yield Portfolio | | | | | | | 3,691,362 | | | | 315,042 | | | | (363,371 | ) | | | 3,643,033 | |
| MFS Inflation-Adjusted Bond Portfolio | | | | | | | 2,086,034 | | | | 115,797 | | | | (252,176 | ) | | | 1,949,655 | |
| MFS Institutional Money Market Portfolio | | | | | | | 416,288 | | | | 11,442,668 | | | | (11,595,004 | ) | | | 263,952 | |
| MFS International Growth Portfolio | | | | | | | 1,741,544 | | | | 70,260 | | | | (452,315 | ) | | | 1,359,489 | |
| MFS International Value Portfolio | | | | | | | 935,257 | | | | 23,223 | | | | (213,550 | ) | | | 744,930 | |
| MFS Limited Maturity Portfolio | | | | | | | 832,134 | | | | 52,850 | | | | (59,907 | ) | | | 825,077 | |
| MFS Mid Cap Growth Series | | | | | | | 4,796,751 | | | | 309,256 | | | | (1,140,940 | ) | | | 3,965,067 | |
| MFS Mid Cap Value Portfolio | | | | | | | 4,649,648 | | | | 292,535 | | | | (757,935 | ) | | | 4,184,248 | |
| MFS New Discovery Series | | | | | | | 526,593 | | | | 16,045 | | | | (125,279 | ) | | | 417,359 | |
| MFS New Discovery Value Portfolio | | | | | | | 799,029 | | | | 115,119 | | | | (160,201 | ) | | | 753,947 | |
| MFS Research International Portfolio | | | | | | | 2,822,484 | | | | 81,978 | | | | (680,379 | ) | | | 2,224,083 | |
| MFS Research Series | | | | | | | 1,635,509 | | | | 143,136 | | | | (359,493 | ) | | | 1,419,152 | |
| MFS Total Return Bond Series | | | | | | | 1,599,853 | | | | 126,003 | | | | (136,514 | ) | | | 1,589,342 | |
| MFS Value Series | | | | | | | 2,487,093 | | | | 169,533 | | | | (453,281 | ) | | | 2,203,345 | |
| | | | | |
| Underlying Affiliated Funds | | Realized
Gain (Loss) | | | Change in
Unrealized
Appreciation
(Depreciation) | | | Capital Gain
Distributions | | | Dividend
Income | | | Ending
Value | |
| MFS Emerging Markets Equity Portfolio | | | $78,323 | | | | $1,260,980 | | | | $— | | | | $43,492 | | | | $4,213,170 | |
| MFS Global Governments Portfolio | | | (131,098 | ) | | | 1,282,078 | | | | — | | | | — | | | | 16,835,196 | |
| MFS Global Real Estate Portfolio | | | 332,901 | | | | 240,184 | | | | 976,404 | | | | 1,127,590 | | | | 21,050,257 | |
| MFS Growth Series | | | 4,066,422 | | | | 7,038,234 | | | | 1,788,950 | | | | 47,276 | | | | 46,031,655 | |
| MFS High Yield Portfolio | | | (59,396 | ) | | | 93,709 | | | | — | | | | 1,342,707 | | | | 21,020,300 | |
| MFS Inflation-Adjusted Bond Portfolio | | | (38,901 | ) | | | 1,737,403 | | | | — | | | | — | | | | 21,075,773 | |
| MFS Institutional Money Market Portfolio | | | (262 | ) | | | (9 | ) | | | — | | | | 1,827 | | | | 263,926 | |
| MFS International Growth Portfolio | | | 723,254 | | | | 4,596,924 | | | | 404,593 | | | | 355,440 | | | | 21,072,087 | |
| MFS International Value Portfolio | | | 1,653,106 | | | | 3,191,265 | | | | — | | | | 323,472 | | | | 21,044,282 | |
| MFS Limited Maturity Portfolio | | | 1,347 | | | | 10,337 | | | | — | | | �� | 134,036 | | | | 8,399,288 | |
| MFS Mid Cap Growth Series | | | 1,643,327 | | | | 5,365,754 | | | | 2,182,526 | | | | 45,574 | | | | 37,707,790 | |
| MFS Mid Cap Value Portfolio | | | 174,460 | | | | 3,129,663 | | | | 1,090,410 | | | | 553,188 | | | | 37,700,078 | |
| MFS New Discovery Series | | | 168,422 | | | | 1,693,240 | | | | 160,867 | | | | — | | | | 8,388,920 | |
| MFS New Discovery Value Portfolio | | | 138,790 | | | | 203,778 | | | | 660,076 | | | | 215,963 | | | | 8,391,430 | |
| MFS Research International Portfolio | | | 1,333,543 | | | | 7,628,469 | | | | — | | | | 689,673 | | | | 37,920,621 | |
| MFS Research Series | | | 1,104,251 | | | | 4,536,025 | | | | 2,704,817 | | | | 649,465 | | | | 41,864,995 | |
| MFS Total Return Bond Series | | | (79,967 | ) | | | 311,922 | | | | — | | | | 693,058 | | | | 21,011,098 | |
| MFS Value Series | | | 1,959,062 | | | | 3,011,965 | | | | 1,789,875 | | | | 925,856 | | | | 46,093,973 | |
| | | | | | | | | | | | | | | | | | | | |
| | | $13,067,584 | | | | 45,331,921 | | | | $11,758,518 | | | | $7,148,617 | | | | $420,084,839 | |
| | | | | | | | | | | | | | | | | | | | |
19
MFS Growth Allocation Portfolio
REPORT OF INDEPENDENT REGISTERED PUBLIC ACCOUNTING FIRM
To the Board of Trustees of MFS Variable Insurance Trust III and the Shareholders of MFS Growth Allocation Portfolio:
Opinion on the Financial Statements and Financial Highlights
We have audited the accompanying statement of assets and liabilities of MFS Growth Allocation Portfolio (one of the series of MFS Variable Insurance Trust III) (the “Fund”), including the portfolio of investments, as of December 31, 2017, the related statement of operations for the year then ended, the statements of changes in net assets for each of the two years in the period then ended, the financial highlights for each of the five years in the period then ended, and the related notes. In our opinion, the financial statements and financial highlights present fairly, in all material respects, the financial position of the Fund as of December 31, 2017, and the results of its operations for the year then ended, the changes in its net assets for each of the two years in the period then ended, and the financial highlights for each of the five years in the period then ended, in conformity with accounting principles generally accepted in the United States of America.
Basis for Opinion
These financial statements and financial highlights are the responsibility of the Fund’s management. Our responsibility is to express an opinion on the Fund’s financial statements and financial highlights based on our audits. We are a public accounting firm registered with the Public Company Accounting Oversight Board (United States) (PCAOB) and are required to be independent with respect to the Fund in accordance with the U.S. federal securities laws and the applicable rules and regulations of the Securities and Exchange Commission and the PCAOB.
We conducted our audits in accordance with the standards of the PCAOB. Those standards require that we plan and perform the audit to obtain reasonable assurance about whether the financial statements and financial highlights are free of material misstatement, whether due to error or fraud. The Fund is not required to have, nor were we engaged to perform, an audit of its internal control over financial reporting. As part of our audits we are required to obtain an understanding of internal control over financial reporting but not for the purpose of expressing an opinion on the effectiveness of the Fund’s internal control over financial reporting. Accordingly, we express no such opinion.
Our audits included performing procedures to assess the risks of material misstatement of the financial statements and financial highlights, whether due to error or fraud, and performing procedures that respond to those risks. Such procedures included examining, on a test basis, evidence regarding the amounts and disclosures in the financial statements and financial highlights. Our audits also included evaluating the accounting principles used and significant estimates made by management, as well as evaluating the overall presentation of the financial statements and financial highlights. Our procedures included confirmation of securities owned as of December 31, 2017, by correspondence with the transfer agent. We believe that our audits provide a reasonable basis for our opinion.
DELOITTE & TOUCHE LLP
Boston, Massachusetts
February 15, 2018
We have served as the auditor of one or more of the MFS investment companies since 1924.
20
MFS Growth Allocation Portfolio
TRUSTEES AND OFFICERS – IDENTIFICATION AND BACKGROUND
The Trustees and Officers of the Trust, as of February 1, 2018, are listed below, together with their principal occupations during the past five years. (Their titles may have varied during that period.) The address of each Trustee and Officer is 111 Huntington Avenue, Boston, Massachusetts 02199-7618.
| | | | | | | | | | |
Name, Age | | Position(s)
Held with Fund | | Trustee/Officer
Since (h) | | Number of
MFS Funds
overseen by the
Trustee | | Principal Occupations
During the Past Five Years | | Other Directorships
During the Past Five Years (j) |
| INTERESTED TRUSTEES |
Robert J. Manning (k) (age 54) | | Trustee | | February 2004 | | 137 | | Massachusetts Financial Services Company, Executive Chairman (since January 2017); Director; Chairman of the Board; Chief Executive Officer (until 2015); Co-Chief Executive Officer (2015-2016) | | N/A |
| | | | | |
Robin A. Stelmach (k) (age 56) | | Trustee | | January 2014 | | 137 | | Massachusetts Financial Services Company, Vice Chair (since January 2017); Chief Operating Officer and Executive Vice President (until January 2017) | | N/A |
| | | | |
| INDEPENDENT TRUSTEES | | | | | | | | |
John P. Kavanaugh (age 63) | | Trustee and Chair of Trustees | | January 2009 | | 137 | | Private investor | | N/A |
| | | | | |
Steven E. Buller (age 66) | | Trustee | | February 2014 | | 137 | | Financial Accounting Standards Advisory Council, Chairman (2014-2015); Public Company Accounting Oversight Board, Standing Advisory Group, Member (until 2014); BlackRock, Inc. (investment management), Managing Director (until 2014), BlackRock Finco UK (investment management), Director (until 2014) | | N/A |
| | | | | |
John A. Caroselli (age 63) | | Trustee | | March 2017 | | 137 | | JC Global Advisors, LLC (management consulting), President (since 2015); First Capital Corporation (commercial finance), Executive Vice President (until 2015) | | N/A |
| | | | | |
Maureen R. Goldfarb (age 62) | | Trustee | | January 2009 | | 137 | | Private investor | | N/A |
| | | | | |
Michael Hegarty (age 73) | | Trustee | | December 2004 | | 137 | | Private investor | | Rouse Properties Inc., Director (until 2016); Capmark Financial Group Inc., Director (until 2015) |
| | | | | |
Clarence Otis, Jr. (age 61) | | Trustee | | March 2017 | | 137 | | Darden Restaurants, Inc., Chief Executive Officer (until 2014) | | VF Corporation, Director; Verizon Communications, Inc., Director; The Travelers Companies, Director; Federal Reserve Bank of Atlanta, Director (until 2015) |
| | | | | |
Maryanne L. Roepke (age 61) | | Trustee | | May 2014 | | 137 | | American Century Investments (investment management), Senior Vice President and Chief Compliance Officer (until 2014) | | N/A |
| | | | | |
Laurie J. Thomsen (age 60) | | Trustee | | March 2005 | | 137 | | Private investor | | The Travelers Companies, Director; Dycom Industries, Inc., Director (since 2015) |
21
MFS Growth Allocation Portfolio
Trustees and Officers – continued
| | | | | | | | |
Name, Age | | Position(s)
Held with Fund | | Trustee/Officer
Since (h) | | Number of
MFS Funds
for which the
Person is an
Officer | | Principal Occupations During the Past Five Years |
| OFFICERS | | | | | | | | |
Christopher R. Bohane (k) (age 44) | | Assistant Secretary and Assistant Clerk | | July 2005 | | 137 | | Massachusetts Financial Services Company, Vice President and Assistant General Counsel |
| | | | |
Kino Clark (k) (age 49) | | Assistant Treasurer | | January 2012 | | 137 | | Massachusetts Financial Services Company, Vice President |
| | | | |
John W. Clark, Jr. (k) (age 50) | | Assistant Treasurer | | April 2017 | | 137 | | Massachusetts Financial Services Company, Vice President (since March 2017); Deutsche Bank (financial services), Department Head – Treasurer’s Office (until February 2017) |
| | | | |
Thomas H. Connors (k) (age 58) | | Assistant Secretary and Assistant Clerk | | September 2012 | | 137 | | Massachusetts Financial Services Company, Vice President and Senior Counsel |
| | | | |
Ethan D. Corey (k) (age 54) | | Assistant Secretary and Assistant Clerk | | July 2005 | | 137 | | Massachusetts Financial Services Company, Senior Vice President and Associate General Counsel |
| | | | |
David L. DiLorenzo (k) (age 49) | | President | | July 2005 | | 137 | | Massachusetts Financial Services Company, Senior Vice President |
| | | | |
Heidi W. Hardin (k) (age 50) | | Secretary and Clerk | | April 2017 | | 137 | | Massachusetts Financial Services Company, Executive Vice President and General Counsel (since March 2017); Harris Associates (investment management), General Counsel (from September 2015 to January 2017); Janus Capital Management LLC (investment management), Senior Vice President and General Counsel (until September 2015) |
| | | | |
Brian E. Langenfeld (k) (age 44) | | Assistant Secretary and Assistant Clerk | | June 2006 | | 137 | | Massachusetts Financial Services Company, Vice President and Senior Counsel |
| | | | |
Susan A. Pereira (k) (age 47) | | Assistant Secretary and Assistant Clerk | | July 2005 | | 137 | | Massachusetts Financial Services Company, Vice President and Senior Counsel |
| | | | |
Kasey L. Phillips (k) (age 47) | | Assistant Treasurer | | September 2012 | | 137 | | Massachusetts Financial Services Company, Vice President |
| | | | |
Matthew A. Stowe (k) (age 43) | | Assistant Secretary and Assistant Clerk | | October 2014 | | 137 | | Massachusetts Financial Services Company, Vice President and Assistant General Counsel |
| | | | |
Frank L. Tarantino (age 73) | | Independent Senior Officer | | June 2004 | | 137 | | Tarantino LLC (provider of compliance services), Principal |
| | | | |
Richard S. Weitzel (k) (age 47) | | Assistant Secretary and Assistant Clerk | | October 2007 | | 137 | | Massachusetts Financial Services Company, Senior Vice President and Associate General Counsel |
| | | | |
Martin J. Wolin (k) (age 50) | | Chief Compliance Officer | | July 2015 | | 137 | | Massachusetts Financial Services Company, Senior Vice President and Chief Compliance Officer (since July 2015); Mercer (financial service provider), Chief Risk and Compliance Officer, North America and Latin America (until June 2015) |
| | | | |
James O. Yost (k) (age 57) | | Treasurer | | September 1990 | | 137 | | Massachusetts Financial Services Company, Senior Vice President |
| (h) | Date first appointed to serve as Trustee/officer of an MFS Fund. Each Trustee has served continuously since appointment unless indicated otherwise. For the period from December 15, 2004 until February 22, 2005, Mr. Manning served as Advisory Trustee. Prior to January 2012, Messrs. DiLorenzo and Yost served as Assistant Treasurers of the Funds. From January 2012 through December 2016, Messrs. DiLorenzo and Yost served as Treasurer and Deputy Treasurer of the Funds, respectively. |
| (j) | Directorships or trusteeships of companies required to report to the Securities and Exchange Commission (i.e., “public companies”). |
| (k) | “Interested person” of the Trust within the meaning of the Investment Company Act of 1940 (referred to as the 1940 Act), which is the principal federal law governing investment companies like the fund, as a result of a position with MFS. The address of MFS is 111 Huntington Avenue, Boston, Massachusetts 02199-7618. |
22
MFS Growth Allocation Portfolio
Trustees and Officers – continued
Each Trustee has been elected by shareholders and each Trustee and officer holds office until his or her successor is chosen and qualified or until his or her earlier death, resignation, retirement or removal. The Trust does not hold annual meetings for the purpose of electing Trustees, and Trustees are not elected for fixed terms. Under the terms of the Board’s retirement policy, an Independent Trustee shall retire at the end of the calendar year in which he or she reaches the earlier of 75 years of age or 15 years of service on the Board (or, in the case of any Independent Trustee who joined the Board prior to 2015, 20 years of service on the Board).
Messrs. Buller and Otis and Ms. Roepke are members of the Trust’s Audit Committee.
Each of the Interested Trustees and certain Officers hold comparable officer positions with certain affiliates of MFS.
The Statement of Additional Information for a Fund includes further information about the Trustees and is available without charge upon request by calling 1-800-225-2606.
| | |
Investment Adviser Massachusetts Financial Services Company 111 Huntington Avenue Boston, MA 02199-7618 | | Custodian State Street Bank and Trust Company 1 Lincoln Street Boston, MA 02111-2900 |
Distributor MFS Fund Distributors, Inc. 111 Huntington Avenue Boston, MA 02199-7618 | | Independent Registered Public Accounting Firm Deloitte & Touche LLP 200 Berkeley Street Boston, MA 02116 |
Portfolio Manager(s) Joseph Flaherty | | |
23
MFS Growth Allocation Portfolio
BOARD REVIEW OF INVESTMENT ADVISORY AGREEMENT
The Investment Company Act of 1940 requires that both the full Board of Trustees and a majority of the non-interested (“independent”) Trustees, voting separately, annually approve the continuation of the Fund’s investment advisory agreement with MFS. The Trustees consider matters bearing on the Fund and its advisory arrangements at their meetings throughout the year, including a review of performance data at each regular meeting. In addition, the independent Trustees met several times over the course of three months beginning in May and ending in July, 2017 (“contract review meetings”) for the specific purpose of considering whether to approve the continuation of the investment advisory agreement for the Fund and the other investment companies that the Board oversees (the “MFS Funds”). The independent Trustees were assisted in their evaluation of the Fund’s investment advisory agreement by independent legal counsel, from whom they received separate legal advice and with whom they met separately from MFS during various contract review meetings. The independent Trustees were also assisted in this process by the MFS Funds’ Independent Senior Officer, a senior officer appointed by and reporting to the independent Trustees.
In connection with their deliberations regarding the continuation of the investment advisory agreement, the Trustees, including the independent Trustees, considered such information and factors as they believed, in light of the legal advice furnished to them and their own business judgment, to be relevant. The investment advisory agreement for the Fund was considered separately, although the Trustees also took into account the common interests of all MFS Funds in their review. As described below, the Trustees considered the nature, quality, and extent of the various investment advisory, administrative, and shareholder services performed by MFS under the existing investment advisory agreement and other arrangements with the Fund.
In connection with their contract review meetings, the Trustees received and relied upon materials that included, among other items: (i) information provided by Broadridge Financial Solutions, Inc. (“Broadridge”), an independent third party, on the investment performance of the Fund for various time periods ended December 31, 2016 and the investment performance of a group of funds with substantially similar investment classifications/objectives (the “Lipper performance universe”), (ii) information provided by Broadridge on the Fund’s fees and expenses and the fees and expenses of comparable funds identified by Broadridge (the “Broadridge expense group”), (iii) information as to whether and to what extent applicable expense waivers and reimbursements are observed for the Fund, (iv) information regarding MFS’ financial results and financial condition, including MFS’ and certain of its affiliates’ estimated profitability from services performed for the Fund and the MFS Funds as a whole, and compared to MFS’ institutional business, (v) MFS’ views regarding the outlook for the mutual fund industry and the strategic business plans of MFS, (vi) descriptions of various functions performed by MFS for the Funds, such as compliance monitoring and portfolio trading practices, and (vii) information regarding the overall organization of MFS, including information about MFS’ senior management and other personnel providing investment advisory, administrative and other services to the Fund and the other MFS Funds. The comparative performance, fee and expense information prepared and provided by Broadridge was not independently verified and the independent Trustees did not independently verify any information provided to them by MFS.
The Trustees’ conclusion as to the continuation of the investment advisory agreement was based on a comprehensive consideration of all information provided to the Trustees and not the result of any single factor. Some of the factors that figured particularly in the Trustees’ deliberations are described below, although individual Trustees may have evaluated the information presented differently from one another, giving different weights to various factors. It is also important to recognize that the fee arrangements for the Fund and other MFS Funds are the result of years of review and discussion between the independent Trustees and MFS, that certain aspects of such arrangements may receive greater scrutiny in some years than in others, and that the Trustees’ conclusions may be based, in part, on their consideration of these same arrangements during the course of the year and in prior years.
Based on information provided by Broadridge and MFS, the Trustees reviewed the Fund’s total return investment performance as well as the performance of peer groups of funds over various time periods. The Trustees placed particular emphasis on the total return performance of the Fund’s Initial Class shares in comparison to the performance of funds in its Lipper performance universe over the three-year period ended December 31, 2016, which the Trustees believed was a long enough period to reflect differing market conditions. The total return performance of the Fund’s Initial Class shares was in the 2nd quintile relative to the other funds in the universe for this three-year period (the 1st quintile being the best performers and the 5th quintile being the worst performers). The total return performance of the Fund’s Initial Class shares was in the 3rd quintile for the one-year period and in the 2nd quintile for the five-year period ended December 31, 2016 relative to the Lipper performance universe. Because of the passage of time, these performance results may differ from the performance results for more recent periods, including those shown elsewhere in this report.
In the course of their deliberations, the Trustees took into account information provided by MFS in connection with the contract review meetings, as well as during investment review meetings conducted with portfolio management personnel during the course of the year regarding the Fund’s performance. After reviewing these and related factors, the Trustees concluded, within the context of their overall conclusions regarding the investment advisory agreement, that they were satisfied with MFS’ responses and efforts relating to investment performance.
The Trustees considered that MFS does not charge an advisory fee for providing investment advisory services to the Fund, but that the Fund pays its pro rata share of the advisory fees paid by the underlying funds in which it invests (the “Underlying Funds”).
24
MFS Growth Allocation Portfolio
Board Review of Investment Advisory Agreement – continued
In assessing the reasonableness of the Fund’s expenses, the Trustees considered, among other information, the Fund’s total expense ratio of the Fund’s Initial Class shares as a percentage of average daily net assets and the total expense ratios of peer groups of funds based on information provided by Broadridge. The Trustees considered that MFS currently observes an expense limitation for the Fund, which may not be changed without the Trustees’ approval. The Trustees also considered that, according to the data provided by Broadridge (which takes into account any expense limitations that were in effect during the Fund’s last fiscal year), the Fund’s total expense ratio was approximately at the Broadridge expense group median. Because the Fund does not pay an advisory fee, the Trustees did not consider the extent to which economies of scale would be realized due to the Fund’s growth of assets, whether fee levels reflect economies of scale for shareholders, or the fees paid by similar funds to other investment advisers or by similar clients of MFS.
The Trustees also considered information prepared by MFS relating to MFS’ costs and profits with respect to the Fund, the MFS Funds considered as a group, and other investment companies and accounts advised by MFS, as well as MFS’ methodologies used to determine and allocate its costs to the MFS Funds, the Fund and other accounts and products for purposes of estimating profitability.
In addition, the Trustees considered MFS’ resources and related efforts to continue to retain, attract and motivate capable personnel to serve the Fund. The Trustees also considered current and developing conditions in the financial services industry, including the presence of large and well-capitalized companies which are spending, and appear to be prepared to continue to spend, substantial sums to engage personnel and to provide services to competing investment companies. In this regard, the Trustees also considered the financial resources of MFS and its ultimate parent, Sun Life Financial Inc. The Trustees also considered the advantages and possible disadvantages to the Fund of having an adviser that also serves other investment companies as well as other accounts.
The Trustees also considered the nature, quality, cost, and extent of administrative, transfer agency, and distribution services provided to the Fund by MFS and its affiliates under agreements and plans other than the investment advisory agreement, including any 12b-1 fees the Fund pays to MFS Fund Distributors, Inc., an affiliate of MFS. The Trustees also considered the nature, extent and quality of certain other services MFS performs or arranges for on the Fund’s or the Underlying Funds’ behalf, which may include securities lending programs, directed expense payment programs, class action recovery programs, and MFS’ interaction with third-party service providers, principally custodians and sub-custodians. The Trustees concluded that the various non-advisory services provided by MFS and its affiliates on behalf of the Fund were satisfactory.
The Trustees also considered benefits to MFS from the use of the Underlying Funds’ portfolio brokerage commissions, if applicable, to pay for investment research and various other factors. Additionally, the Trustees considered so-called “fall-out benefits” to MFS such as reputational value derived from serving as investment manager to the Fund.
Based on their evaluation of factors that they deemed to be material, including those factors described above, the Board of Trustees, including the independent Trustees, concluded that the Fund’s investment advisory agreement with MFS should be continued for an additional one-year period, commencing August 1, 2017.
25
MFS Growth Allocation Portfolio
PROXY VOTING POLICIES AND INFORMATION
MFS votes proxies on behalf of the fund pursuant to proxy voting policies and procedures that are available without charge, upon request, by calling 1-800-225-2606, by visiting mfs.com/proxyvoting, or by visiting the SEC’s Web site at http://www.sec.gov.
Information regarding how the fund voted proxies relating to portfolio securities during the most recent twelve-month period ended June 30 is available by August 31 of each year without charge by visiting mfs.com/proxyvoting, or by visiting the SEC’s Web site at http://www.sec.gov.
QUARTERLY PORTFOLIO DISCLOSURE
The fund will file a complete schedule of portfolio holdings with the Securities and Exchange Commission (the Commission) for the first and third quarters of each fiscal year on Form N-Q. The fund’s Form N-Q is available on the EDGAR database on the Commission’s Internet Web site at http://www.sec.gov, and may be reviewed and copied at the:
Public Reference Room
Securities and Exchange Commission
100 F Street, NE, Room 1580
Washington, D.C. 20549
Information on the operation of the Public Reference Room may be obtained by calling the Commission at 1-800-SEC-0330. Copies of the fund’s Form N-Q also may be obtained, upon payment of a duplicating fee, by electronic request at the following e-mail address: publicinfo@sec.gov or by writing the Public Reference Section at the above address.
FURTHER INFORMATION
From time to time, MFS may post important information about the fund or the MFS funds on the MFS web site (mfs.com). This information is available at https://www.mfs.com/en-us/what-we-do/announcements.html or at mfs.com/vit3 by choosing the fund’s name.
INFORMATION ABOUT FUND CONTRACTS AND LEGAL CLAIMS
The fund has entered into contractual arrangements with an investment adviser, administrator, distributor, shareholder servicing agent, 529 program manager (if applicable), and custodian who each provide services to the fund. Unless expressly stated otherwise, shareholders are not parties to, or intended beneficiaries of these contractual arrangements, and these contractual arrangements are not intended to create any shareholder right to enforce them against the service providers or to seek any remedy under them against the service providers, either directly or on behalf of the fund.
Under the Trust’s By-Laws and Declaration of Trust, any claims asserted against or on behalf of the MFS Funds, including claims against Trustees and Officers, must be brought in state and federal courts located within the Commonwealth of Massachusetts.
FEDERAL TAX INFORMATION (unaudited)
The following information is provided pursuant to provisions of the Internal Revenue Code.
The fund designates $24,040,000 as capital gain dividends paid during the fiscal year.
For corporate shareholders, 37.39% of the ordinary income dividends paid during the fiscal year qualify for the corporate dividends received deduction.
26
rev. 3/16
| | | | |
| FACTS | | WHAT DOES MFS DO WITH YOUR
PERSONAL INFORMATION? | |  |
| | |
| Why? | | Financial companies choose how they share your personal information. Federal law gives consumers the right to limit some but not all sharing. Federal law also requires us to tell you how we collect, share, and protect your personal information. Please read this notice carefully to understand what we do. |
| | |
| What? | | The types of personal information we collect and share depend on the product or service you have with us. This information can include: • Social Security number and account balances • Account transactions and transaction history • Checking account information and wire transfer instructions When you are no longer our customer, we continue to share your information as described in this notice. |
| | |
| How? | | All financial companies need to share customers’ personal information to run their everyday business. In the section below, we list the reasons financial companies can share their customers’ personal information; the reasons MFS chooses to share; and whether you can limit this sharing. |
| | | | |
Reasons we can share your
personal information | | Does MFS share? | | Can you limit this
sharing? |
For our everyday business purposes – such as to process your transactions, maintain your account(s), respond to court orders and legal investigations, or report to credit bureaus | | Yes | | No |
For our marketing purposes – to offer our products and services to you | | No | | We don’t share |
| For joint marketing with other financial companies | | No | | We don’t share |
For our affiliates’ everyday business purposes – information about your transactions and experiences | | No | | We don’t share |
For our affiliates’ everyday business purposes – information about your creditworthiness | | No | | We don’t share |
| For nonaffiliates to market to you | | No | | We don’t share |
| | |
| Questions? | | Call 800-225-2606 or go to mfs.com. |
27
| | |
| Who we are |
| Who is providing this notice? | | MFS Funds, MFS Investment Management, MFS Institutional Advisors, Inc., and MFS Heritage Trust Company. |
| | |
| What we do |
| How does MFS protect my personal information? | | To protect your personal information from unauthorized access and use, we use security measures that comply with federal law. These measures include procedural, electronic, and physical safeguards for the protection of the personal information we collect about you. |
How does MFS
collect my personal information? | | We collect your personal information, for example, when you • open an account or provide account information • direct us to buy securities or direct us to sell your securities • make a wire transfer We also collect your personal information from others, such as credit bureaus, affiliates, or other companies. |
| Why can’t I limit all sharing? | | Federal law gives you the right to limit only • sharing for affiliates’ everyday business purposes – information about your creditworthiness • affiliates from using your information to market to you • sharing for nonaffiliates to market to you State laws and individual companies may give you additional rights to limit sharing. |
| | |
| Definitions |
| Affiliates | | Companies related by common ownership or control. They can be financial and nonfinancial companies. • MFS does not share personal information with affiliates, except for everyday business purposes as described on page one of this notice. |
| Nonaffiliates | | Companies not related by common ownership or control. They can be financial and nonfinancial companies. • MFS does not share with nonaffiliates so they can market to you. |
| Joint marketing | | A formal agreement between nonaffiliated financial companies that together market financial products or services to you. • MFS doesn’t jointly market. |
| | |
| Other important information |
| If you own an MFS product or receive an MFS service in the name of a third party such as a bank or broker-dealer, their privacy policy may apply to you instead of ours. |
28
ANNUAL REPORT
December 31, 2017

MFS® INFLATION-ADJUSTED BOND PORTFOLIO
MFS® Variable Insurance Trust III

VIA-ANN
MFS® INFLATION-ADJUSTED BOND PORTFOLIO
CONTENTS
The report is prepared for the general information of contract owners. It is authorized for distribution to prospective investors only when preceded or accompanied by a current prospectus.
NOT FDIC INSURED • MAY LOSE VALUE • NO BANK OR CREDIT UNION GUARANTEE • NOT A DEPOSIT • NOT INSURED BY ANY FEDERAL GOVERNMENT AGENCY OR NCUA/NCUSIF
MFS Inflation-Adjusted Bond Portfolio
LETTER FROM THE EXECUTIVE CHAIRMAN

Dear Contract Owners:
Rising bond yields have led to a measurable uptick in market volatility, which has been a departure from the low-volatility environment that prevailed for much of 2017. In spite of this, global markets remain elevated amid synchronized economic growth. Although the U.S. Federal Reserve continues to gradually raise interest rates and shrink its balance sheet, monetary policy remains accommodative around the world, with many central banks taking only tentative steps toward tighter policies. However, interest rates have begun to rise globally of late as investors anticipate that central policy shifts may be necessary in the months ahead.
Newly enacted U.S. tax reforms have been welcomed by equity markets while emerging market economies have been boosted by a weaker U.S. dollar. Around the world, inflation remains largely subdued but tight labor markets and solid global demand have investors on the lookout for its potential resurgence amid robust global trade and recovering commodity prices.
At MFS®, we believe having a disciplined, long-term investment approach through a full market cycle is essential to capturing the best opportunities while also managing risk. In our view, such a strategy, along with the professional guidance of a financial advisor, will help you reach your investment objectives.
Respectfully,

Robert J. Manning
Executive Chairman
MFS Investment Management
February 15, 2018
The opinions expressed in this letter are subject to change and may not be relied upon for investment advice. No forecasts can be guaranteed.
1
MFS Inflation-Adjusted Bond Portfolio
PORTFOLIO COMPOSITION
Portfolio structure (i)
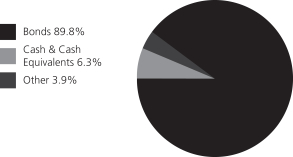
| | | | |
| Fixed income sectors (i) | | | | |
| Non-U.S. Government Bonds | | | 55.2% | |
| U.S. Treasury Securities | | | 34.6% | |
| |
Composition including fixed income credit
quality (a)(i) | | | | |
| AAA | | | 5.8% | |
| AA | | | 31.8% | |
| A | | | 2.9% | |
| BBB | | | 14.7% | |
| U.S. Government | | | 38.5% | |
| Not Rated | | | (3.9)% | |
| Cash & Cash Equivalents | | | 6.3% | |
| Other | | | 3.9% | |
| | | | |
| Portfolio facts (i) | | | | |
| Average Duration (d) | | | 9.4 | |
| Average Effective Maturity (m) | | | 14.5 yrs. | |
| |
| Issuer country weightings (i)(x) | | | | |
| United States | | | 44.9% | |
| United Kingdom | | | 24.8% | |
| Italy | | | 11.6% | |
| France | | | 5.4% | |
| Canada | | | 3.2% | |
| Spain | | | 3.1% | |
| Japan | | | 2.9% | |
| New Zealand | | | 1.5% | |
| Sweden | | | 1.1% | |
| Other Countries | | | 1.5% | |
| |
| Currency exposure weightings (i)(y) | | | | |
| United States Dollar | | | 42.4% | |
| British Pound Sterling | | | 29.2% | |
| Euro | | | 20.1% | |
| Swedish Krona | | | 2.5% | |
| Japanese Yen | | | 2.4% | |
| Canadian Dollar | | | 1.5% | |
| Australian Dollar | | | 1.1% | |
| New Zealand Dollar | | | 0.5% | |
| Danish Krone | | | 0.3% | |
| (a) | | For all securities other than those specifically described below, ratings are assigned to underlying securities utilizing ratings from Moody’s, Fitch, and Standard & Poor’s rating agencies and applying the following hierarchy: If all three agencies provide a rating, the middle rating (after dropping the highest and lowest ratings) is assigned; if two of the three agencies rate a security, the lower of the two is assigned. Ratings are shown in the S&P and Fitch scale (e.g., AAA). Securities rated BBB or higher are considered investment grade. All ratings are subject to change. U.S. Government includes securities issued by the U.S. Department of the Treasury. Not Rated includes fixed income securities, including fixed income futures contracts, which have not been rated by any rating agency. The fund may or may not have held all of these instruments on this date. The fund is not rated by these agencies. |
| (d) | | Duration is a measure of how much a bond’s price is likely to fluctuate with general changes in interest rates, e.g., if rates rise 1.00%, a bond with a 5-year duration is likely to lose about 5.00% of its value due to the interest rate move. |
| (i) | | For purposes of this presentation, the components include the value of securities, and reflect the impact of the equivalent exposure of derivative positions, if any. These amounts may be negative from time to time. Equivalent exposure is a calculated amount that translates the derivative position into a reasonable approximation of the amount of the underlying asset that the portfolio would have to hold at a given point in time to have the same price sensitivity that results from the portfolio’s ownership of the derivative contract. When dealing with derivatives, equivalent exposure is a more representative measure of the potential impact of a position on portfolio performance than value. The bond component will include any accrued interest amounts. |
| (m) | | In determining an instrument’s effective maturity for purposes of calculating the fund’s dollar-weighted average effective maturity, MFS uses the instrument’s stated maturity or, if applicable, an earlier date on which MFS believes it is probable that a maturity-shortening device (such as a put, pre-refunding or prepayment) will cause the instrument to be repaid. Such an earlier date can be substantially shorter than the instrument’s stated maturity. |
| (x) | | Represents the portfolio’s exposure to issuer countries as a percentage of a portfolio’s net assets. For purposes of this presentation, United States includes Cash & Cash Equivalents and Other. |
| (y) | | Represents the portfolio’s exposure to a particular currency as a percentage of a portfolio’s net assets. For purposes of this presentation, United States Dollar includes Cash & Cash Equivalents and Other. |
Where the fund holds convertible bonds, they are treated as part of the equity portion of the portfolio.
Cash & Cash Equivalents includes any cash, investments in money market funds, short-term securities, and other assets less liabilities. Please see the Statement of Assets and Liabilities for additional information related to the fund’s cash position and other assets and liabilities.
Other includes equivalent exposure from currency derivatives and/or any offsets to derivative positions.
Percentages are based on net assets as of December 31, 2017.
The portfolio is actively managed and current holdings may be different.
2
MFS Inflation-Adjusted Bond Portfolio
MANAGEMENT REVIEW
Summary of Results
For the twelve months ended December 31, 2017, Initial Class shares of the MFS Inflation-Adjusted Bond Portfolio (“fund”) provided a total return of 8.32%, while Service Class shares of the fund provided a total return of 7.99%. These compare with a return of 8.51% over the same period for the fund’s benchmark, the Bloomberg Barclays World Government Inflation-Linked Bond Index.
Market Environment
For the first time in many years, the global economy experienced a period of synchronized economic growth over the reporting period. The rebound in emerging markets (“EM”) economies was more pronounced (despite the slight deceleration in Chinese growth at the end of the period), helped by larger economies, such as Brazil and Russia, emerging from recessions. At the same time, developed markets (“DM”) economies continued to grow at or above potential. Market confidence increased in the US during the period fueled, in part, by a more lenient US regulatory backdrop and hopes for a significant cut in corporate tax rates, which came to fruition at the end of the period.
Globally, markets benefited from a reflation trade as commodity prices strengthened, activity and growth prospects improved, and inflation moved higher, though within moderate bounds. As a result, there were more tightening signals and actions by DM central banks. The US Federal Reserve increased interest rates by 25 basis points three times during the period, bringing the total number of quarter-percent hikes in the federal funds rate to five, since December 2015. The European Central Bank announced an extension of its quantitative easing program at the end of the period, but reduced the pace of its monthly asset purchases by half. In addition, the Bank of England hiked its base rate for the first time in a decade, late in the end of the period. Markets were comforted, along with central banks, by the decline in fears of a populist surge in Europe after establishment candidates won the Dutch and French elections, though a right-wing populist party gained seats in the German parliament for the first time in the post-World War II era. Additionally, European growth reflected a generally calmer political economic backdrop.
In recent months, the US dollar reversed the sharp rise seen early in the period, easing what had been a substantial headwind to earnings for multinationals. US consumer spending held up well during the second half of the period amid a modest increase in real wages and relatively low gasoline prices. However, demand for autos cooled from the record level logged early in the period, while the housing market improved, albeit constrained by below-average inventory levels. Global trade, which was sluggish early in the period, showed signs of improvement in the period’s second half, a positive indicator of global economic activity and prospects. Early in the period, there was a selloff in EM due to fears that President Trump would follow through on various campaign threats and promises that were judged to be detrimental to EM. While President Trump withdrew the US from the Trans-Pacific Partnership and began the renegotiation of the North American Free Trade Agreement, significant additional policy action was lacking on economic issues involving EM. As a result, EM resumed their upward trajectory, powered by strong inflows throughout 2017.
Factors Affecting Performance
Relative to the Bloomberg Barclays World Government Inflation-Linked Bond Index, security selection, most notably within Japanese bonds, detracted from performance. Additionally, bonds with maturities shorter than three years also held back relative results. The combination of an overweight allocation and security selection of bonds with maturities of 10-15 years was another negative factor for relative performance.
Conversely, the fund’s yield curve (y) positioning, particularly its longer relative duration (d) exposure to the British pound yield curve, and shorter relative duration exposure to both the Canadian dollar and New Zealand dollar yield curves, contributed to relative returns. Additionally, the fund’s overweight exposure to bonds issued in Spain also helped relative returns.
Respectfully,
Portfolio Manager(s)
Erik Weisman
| (d) | Duration is a measure of how much a bond’s price is likely to fluctuate with general changes in interest rates, e.g., if rates rise 1.00%, a bond with a 5-year duration is likely to lose about 5.00% of its value. |
| (y) | A yield curve graphically depicts the yields of different maturity bonds of the same credit quality and type; a normal yield curve is upward sloping, with short-term rates lower than long-term rates. |
The views expressed in this report are those of the portfolio manager(s) only through the end of the period of the report as stated on the cover and do not necessarily reflect the views of MFS or any other person in the MFS organization. These views are subject to change at any time based on market or other conditions, and MFS disclaims any responsibility to update such views. These views may not be relied upon as investment advice or an indication of trading intent on behalf of any MFS portfolio. References to specific securities are not recommendations of such securities, and may not be representative of any MFS portfolio’s current or future investments.
3
MFS Inflation-Adjusted Bond Portfolio
PERFORMANCE SUMMARY THROUGH 12/31/17
The following chart illustrates the historical performance of the fund in comparison to its benchmark(s). Benchmarks are unmanaged and may not be invested in directly. Benchmark returns do not reflect any fees or expenses. The performance of other share classes will be greater than or less than that of the class depicted below. (See Notes to Performance Summary.)
Performance data shown represents past performance and is no guarantee of future results. Investment return and principal value fluctuate so your units, when sold, may be worth more or less than the original cost; current performance may be lower or higher than quoted. The performance shown does not reflect the deduction of taxes, if any, that a contract holder would pay on fund distributions or the redemption of contract units. The returns for the fund shown also do not reflect the deduction of expenses associated with variable products, such as mortality and expense risk charges, separate account charges, and sales charges imposed by the insurance company separate accounts. Such expenses would reduce the overall returns shown.
Growth of a Hypothetical $10,000 Investment (t)
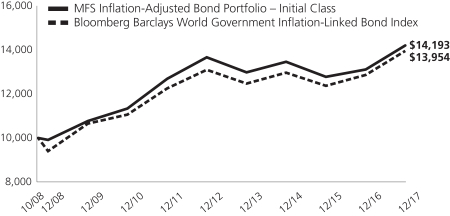
Total Returns through 12/31/17
Average annual total returns
| | | | | | | | | | | | |
| | | Share Class | | Class Inception Date | | 1-yr | | 5-yr | | Life (t) | | |
| | | Initial Class | | 10/01/08 | | 8.32% | | 0.76% | | 3.86% | | |
| | | Service Class | | 10/01/08 | | 7.99% | | 0.52% | | 3.59% | | |
| | | | |
| Comparative benchmark(s) | | | | | | | | |
| | | Bloomberg Barclays World Government Inflation-Linked Bond Index (f) | | 8.51% | | 1.28% | | 3.66% | | |
| (f) | Source: FactSet Research Systems Inc. |
| (t) | For the period from the class inception date through the stated period end. (See Notes to Performance Summary.) |
Benchmark Definition(s)
Bloomberg Barclays World Government Inflation-Linked Bond Index – measures the performance of the major government inflation-linked bond markets.
It is not possible to invest directly in an index.
Notes to Performance Summary
Average annual total return represents the average annual change in value for each share class for the periods presented. Life returns are presented where the share class has less than 10 years of performance history and represent the average annual total return from the class inception date to the stated period end date.
Performance results reflect any applicable expense subsidies and waivers in effect during the periods shown. Without such subsidies and waivers the fund’s performance results would be less favorable. Please see the prospectus and financial statements for complete details. All results are historical and assume the reinvestment of any dividends and capital gains distributions.
Performance prior to close of business December 7, 2012, reflects time periods when another adviser or subadviser was responsible for selecting investments for the fund under a different investment objective and different investment strategies.
4
MFS Inflation-Adjusted Bond Portfolio
Performance Summary – continued
Performance results do not include adjustments made for financial reporting purposes in accordance with U.S. generally accepted accounting principles and may differ from amounts reported in the financial highlights.
From time to time the fund may receive proceeds from litigation settlements, without which performance would be lower.
5
MFS Inflation-Adjusted Bond Portfolio
EXPENSE TABLE
Fund Expenses Borne by the Contract Holders during the Period,
July 1, 2017 through December 31, 2017
As a contract holder of the fund, you incur ongoing costs, including management fees; distribution and/or service (12b-1) fees; and other fund expenses. This example is intended to help you understand your ongoing costs (in dollars) of investing in the fund and to compare these costs with the ongoing costs of investing in other mutual funds.
The example is based on an investment of $1,000 invested at the beginning of the period and held for the entire period July 1, 2017 through December 31, 2017.
Actual Expenses
The first line for each share class in the following table provides information about actual account values and actual expenses. You may use the information in this line, together with the amount you invested, to estimate the expenses that you paid over the period. Simply divide your account value by $1,000 (for example, an $8,600 account value divided by $1,000 = 8.6), then multiply the result by the number in the first line under the heading entitled “Expenses Paid During Period” to estimate the expenses you paid on your account during this period.
Hypothetical Example for Comparison Purposes
The second line for each share class in the following table provides information about hypothetical account values and hypothetical expenses based on the fund’s actual expense ratio and an assumed rate of return of 5% per year before expenses, which is not the fund’s actual return. The hypothetical account values and expenses may not be used to estimate the actual ending account balance or expenses you paid for the period. You may use this information to compare the ongoing costs of investing in the fund and other funds. To do so, compare this 5% hypothetical example with the 5% hypothetical examples that appear in the shareholder reports of the other funds.
Please note that the expenses shown in the table are meant to highlight the fund’s ongoing costs only and do not take into account the fees and expenses imposed under the variable contracts through which your investment in the fund is made. Therefore, the second line for each share class in the table is useful in comparing ongoing costs associated with an investment in vehicles (such as the fund) which fund benefits under variable annuity and variable life insurance contracts and to qualified pension and retirement plans only, and will not help you determine the relative total costs of investing in the fund through variable annuity and variable life insurance contracts. If the fees and expenses imposed under the variable contracts were included, your costs would have been higher.
| | | | | | | | | | | | | | | | | | |
| Share Class | | | | Annualized
Expense Ratio | | | Beginning
Account Value
7/01/17 | | | Ending
Account Value
12/31/17
| | | Expenses Paid
During Period (p)
7/01/17-12/31/17 | |
| Initial Class | | Actual | | | 0.55% | | | | $1,000.00 | | | | $1,046.47 | | | | $2.84 | |
| | Hypothetical (h) | | | 0.55% | | | | $1,000.00 | | | | $1,022.43 | | | | $2.80 | |
| Service Class | | Actual | | | 0.80% | | | | $1,000.00 | | | | $1,045.01 | | | | $4.12 | |
| | Hypothetical (h) | | | 0.80% | | | | $1,000.00 | | | | $1,021.17 | | | | $4.08 | |
| (h) | 5% class return per year before expenses. |
| (p) | “Expenses Paid During Period” are equal to each class’s annualized expense ratio, as shown above, multiplied by the average account value over the period, multiplied by 184/365 (to reflect the one-half year period). |
6
MFS Inflation-Adjusted Bond Portfolio
PORTFOLIO OF INVESTMENTS – 12/31/17
The Portfolio of Investments is a complete list of all securities owned by your fund. It is categorized by broad-based asset classes.
| | | | | | | | |
| Issuer | | Shares/Par | | | Value ($) | |
| BONDS – 93.4% | | | | | | | | |
| International Market Sovereign – 55.0% | |
| Commonwealth of Australia, Inflation Linked Bond, 2.5%, 9/20/2030 | | AUD | 820,540 | | | $ | 768,726 | |
| Commonwealth of Australia, Inflation Linked Bond, 2%, 8/21/2035 | | AUD | 1,684,075 | | | | 1,540,446 | |
| Commonwealth of Australia, Inflation Linked Bond, 1.25%, 8/21/2040 | | AUD | 1,042,500 | | | | 895,338 | |
| Federal Republic of Germany, Inflation Linked Bond, 0.1%, 4/15/2046 | | EUR | 403,693 | | | | 569,318 | |
| Government of Canada, Inflation Linked Bond, 4.25%, 12/01/2026 | | CAD | 5,403,425 | | | | 5,759,742 | |
| Government of Canada, Inflation Linked Bond, 4%, 12/01/2031 | | CAD | 902,525 | | | | 1,058,741 | |
| Government of Canada, Inflation Linked Bond, 3%, 12/01/2036 | | CAD | 889,770 | | | | 1,017,091 | |
| Government of Canada, Inflation Linked Bond, 2%, 12/01/2041 | | CAD | 954,612 | | | | 996,594 | |
| Government of Canada, Inflation Linked Bond, 1.5%, 12/01/2044 | | CAD | 792,722 | | | | 772,964 | |
| Government of Canada, Inflation Linked Bond, 1.25%, 12/01/2047 | | CAD | 955,647 | | | | 899,578 | |
| Government of Japan, Inflation Linked Bond, 1.4%, 3/10/2018 | | JPY | 205,400,000 | | | | 1,824,765 | |
| Government of Japan, Inflation Linked Bond, 0.1%, 3/10/2026 | | JPY | 813,499,200 | | | | 7,642,236 | |
| Government of New Zealand, Inflation Linked Bond, 2%, 9/20/2025 | | NZD | 3,385,920 | | | | 2,533,870 | |
| Government of New Zealand, Inflation Linked Bond, 3%, 9/20/2030 | | NZD | 1,573,350 | | | | 1,295,534 | |
| Government of New Zealand, Inflation Linked Bond, 2.5%, 9/20/2035 | | NZD | 1,548,900 | | | | 1,212,547 | |
| Kingdom of Denmark, Inflation Linked Bond, 0.1%, 11/15/2023 | | DKK | 6,360,540 | | | | 1,101,598 | |
| Kingdom of Spain, Inflation Linked Bond, 0.55%, 11/30/2019 | | EUR | 4,593,735 | | | | 5,727,510 | |
| Kingdom of Spain, Inflation Linked Bond, 0.3%, 11/30/2021 | | EUR | 1,835,442 | | | | 2,327,958 | |
| Kingdom of Spain, Inflation Linked Bond, 0.65%, 11/30/2027 | | EUR | 1,625,712 | | | | 2,036,050 | |
| Kingdom of Sweden, Inflation Linked Bond, 4%, 12/01/2020 | | SEK | 13,194,696 | | | | 1,914,007 | |
| Kingdom of Sweden, Inflation Linked Bond, 3.5%, 12/01/2028 | | SEK | 8,204,969 | | | | 1,547,255 | |
| Republic of France, Inflation Linked Bond, 2.25%, 7/25/2020 | | EUR | 2,487,980 | | | | 3,298,850 | |
| Republic of France, Inflation Linked Bond, 1.1%, 7/25/2022 | | EUR | 2,432,914 | | | | 3,278,183 | |
| Republic of France, Inflation Linked Bond, 2.1%, 7/25/2023 | | EUR | 1,949,308 | | | | 2,792,112 | |
| Republic of France, Inflation Linked Bond, 0.25%, 7/25/2024 | | EUR | 3,158,580 | | | | 4,171,455 | |
| Republic of France, Inflation Linked Bond, 3.4%, 7/25/2029 | | EUR | 1,269,840 | | | | 2,272,221 | |
| | | | | | | | |
| Issuer | | Shares/Par | | | Value ($) | |
| BONDS – continued | | | | | | | | |
| International Market Sovereign – continued | |
| Republic of France, Inflation Linked Bond, 3.15%, 7/25/2032 | | EUR | 1,007,068 | | | $ | 1,882,195 | |
| Republic of Italy, Inflation Linked Bond, 2.1%, 9/15/2021 | | EUR | 3,313,470 | | | | 4,406,428 | |
| Republic of Italy, Inflation Linked Bond, 2.6%, 9/15/2023 | | EUR | 3,142,503 | | | | 4,357,602 | |
| Republic of Italy, Inflation Linked Bond, 2.35%, 9/15/2024 | | EUR | 10,603,679 | | | | 14,546,988 | |
| Republic of Italy, Inflation Linked Bond, 3.1%, 9/15/2026 | | EUR | 4,156,945 | | | | 6,056,413 | |
| Republic of Italy, Inflation Linked Bond, 1.3%, 5/15/2028 | | EUR | 2,799,748 | | | | 3,501,104 | |
| Republic of Italy, Inflation Linked Bond, 1.25%, 9/15/2032 | | EUR | 305,505 | | | | 373,224 | |
| Republic of Italy, Inflation Linked Bond, 2.35%, 9/15/2035 | | EUR | 2,193,642 | | | | 3,125,810 | |
| Republic of Italy, Inflation Linked Bond, 2.55%, 9/15/2041 | | EUR | 1,107,620 | | | | 1,581,961 | |
| United Kingdom Treasury, 4.75%, 12/07/2030 | | GBP | 2,149,000 | | | | 4,043,619 | |
United Kingdom Treasury, 4.25%, 3/07/2036 | | GBP | 1,000,000 | | | | 1,897,738 | |
United Kingdom Treasury, 3.25%, 1/22/2044 | | GBP | 1,000,000 | | | | 1,758,301 | |
| United Kingdom Treasury, Inflation Linked Bond, 1.25%, 11/22/2032 | | GBP | 1,136,101 | | | | 2,322,183 | |
| United Kingdom Treasury, Inflation Linked Bond, 0.75%, 3/22/2034 | | GBP | 2,193,249 | | | | 4,333,978 | |
| United Kingdom Treasury, Inflation Linked Bond, 2%, 1/26/2035 | | GBP | 2,330,422 | | | | 5,448,736 | |
| United Kingdom Treasury, Inflation Linked Bond, 1.125%, 11/22/2037 | | GBP | 2,532,037 | | | | 5,715,900 | |
| United Kingdom Treasury, Inflation Linked Bond, 0.625%, 3/22/2040 | | GBP | 2,661,333 | | | | 5,851,887 | |
| United Kingdom Treasury, Inflation Linked Bond, 0.625%, 11/22/2042 | | GBP | 1,930,772 | | | | 4,477,497 | |
| United Kingdom Treasury, Inflation Linked Bond, 0.125%, 3/22/2044 | | GBP | 2,231,631 | | | | 4,759,594 | |
| United Kingdom Treasury, Inflation Linked Bond, 0.125%, 3/22/2046 | | GBP | 1,580,625 | | | | 3,466,518 | |
| United Kingdom Treasury, Inflation Linked Bond, 0.75%, 11/22/2047 | | GBP | 2,018,158 | | | | 5,215,491 | |
| United Kingdom Treasury, Inflation Linked Bond, 0.5%, 3/22/2050 | | GBP | 1,834,579 | | | | 4,700,995 | |
| United Kingdom Treasury, Inflation Linked Bond, 0.25%, 3/22/2052 | | GBP | 1,586,715 | | | | 3,974,039 | |
| United Kingdom Treasury, Inflation Linked Bond, 1.25%, 11/22/2055 | | GBP | 1,803,455 | | | | 6,080,974 | |
| United Kingdom Treasury, Inflation Linked Bond, 0.125%, 11/22/2056 | | GBP | 207,878 | | | | 541,959 | |
| United Kingdom Treasury, Inflation Linked Bond, 0.125%, 3/22/2058 | | GBP | 1,409,468 | | | | 3,770,757 | |
7
MFS Inflation-Adjusted Bond Portfolio
Portfolio of Investments – continued
| | | | | | | | |
| Issuer | | Shares/Par | | | Value ($) | |
| BONDS – continued | | | | | | | | |
| International Market Sovereign – continued | |
| United Kingdom Treasury, Inflation Linked Bond, 0.375%, 3/22/2062 | | GBP | 1,720,807 | | | $ | 5,336,104 | |
| United Kingdom Treasury, Inflation Linked Bond, 0.125%, 11/22/2065 | | GBP | 745,284 | | | | 2,291,241 | |
| United Kingdom Treasury, Inflation Linked Bond, 0.125%, 3/22/2068 | | GBP | 1,609,781 | | | | 5,220,752 | |
| | | | | | | | |
| | | | | | $ | 180,294,677 | |
| | | | | | | | |
| U.S. Treasury Inflation Protected Securities – 38.4% | |
| U.S. Treasury Bonds, 0.125%, 4/15/2020 | | $ | 6,846,450 | | | $ | 6,833,771 | |
| U.S. Treasury Bonds, 1.125%, 1/15/2021 | | | 3,774,044 | | | | 3,887,672 | |
| U.S. Treasury Bonds, 0.375%, 7/15/2023 | | | 4,588,394 | | | | 4,624,960 | |
| U.S. Treasury Bonds, 0.625%, 1/15/2024 (f) | | | 4,896,672 | | | | 4,984,869 | |
| U.S. Treasury Bonds, 0.125%, 7/15/2024 | | | 4,270,589 | | | | 4,222,674 | |
| U.S. Treasury Bonds, 0.25%, 1/15/2025 | | | 6,703,556 | | | | 6,647,989 | |
| U.S. Treasury Bonds, 2.375%, 1/15/2025 | | | 4,806,414 | | | | 5,480,098 | |
| U.S. Treasury Bonds, 0.375%, 7/15/2025 | | | 6,748,428 | | | | 6,762,781 | |
| U.S. Treasury Bonds, 0.625%, 1/15/2026 | | | 7,162,890 | | | | 7,282,073 | |
| U.S. Treasury Bonds, 2%, 1/15/2026 | | | 2,894,435 | | | | 3,257,628 | |
| U.S. Treasury Bonds, 2.375%, 1/15/2027 | | | 2,560,032 | | | | 2,997,069 | |
| U.S. Treasury Bonds, 1.75%, 1/15/2028 | | | 3,353,264 | | | | 3,771,584 | |
| U.S. Treasury Bonds, 3.625%, 4/15/2028 | | | 2,534,650 | | | | 3,327,861 | |
| U.S. Treasury Bonds, 2.5%, 1/15/2029 | | | 1,769,275 | | | | 2,147,817 | |
| U.S. Treasury Bonds, 3.875%, 4/15/2029 | | | 3,817,145 | | | | 5,207,682 | |
| U.S. Treasury Bonds, 3.375%, 4/15/2032 | | | 337,685 | | | | 467,552 | |
| U.S. Treasury Bonds, 2.125%, 2/15/2040 | | | 1,765,467 | | | | 2,300,156 | |
| | | | | | | | |
| Issuer | | Shares/Par | | | Value ($) | |
| BONDS – continued | | | | | | | | |
| U.S. Treasury Inflation Protected Securities – continued | |
| U.S. Treasury Bonds, 2.125%, 2/15/2041 | | $ | 3,229,274 | | | $ | 4,236,614 | |
| U.S. Treasury Bonds, 0.75%, 2/15/2042 | | | 2,452,870 | | | | 2,480,446 | |
| U.S. Treasury Bonds, 0.625%, 2/15/2043 | | | 3,175,666 | | | | 3,112,223 | |
| U.S. Treasury Bonds, 1.375%, 2/15/2044 | | | 3,276,714 | | | | 3,788,511 | |
| U.S. Treasury Bonds, 0.75%, 2/15/2045 | | | 3,283,850 | | | | 3,305,797 | |
| U.S. Treasury Bonds, 1%, 2/15/2046 | | | 3,084,542 | | | | 3,300,569 | |
| U.S. Treasury Notes, 1.875%, 7/15/2019 | | | 895,303 | | | | 923,225 | |
| U.S. Treasury Notes, 1.375%, 1/15/2020 | | | 2,017,828 | | | | 2,071,018 | |
| U.S. Treasury Notes, 1.25%, 7/15/2020 | | | 3,502,831 | | | | 3,617,659 | |
| U.S. Treasury Notes, 0.125%, 4/15/2021 | | | 4,630,252 | | | | 4,612,449 | |
| U.S. Treasury Notes, 0.625%, 7/15/2021 | | | 5,354,948 | | | | 5,459,572 | |
| U.S. Treasury Notes, 0.125%, 1/15/2022 | | | 1,684,862 | | | | 1,678,638 | |
| U.S. Treasury Notes, 0.125%, 7/15/2022 | | | 2,111,989 | | | | 2,109,938 | |
| U.S. Treasury Notes, 0.125%, 1/15/2023 | | | 6,238,662 | | | | 6,192,783 | |
| U.S. Treasury Notes, 0.125%, 7/15/2026 | | | 4,865,301 | | | | 4,757,012 | |
| | | | | | | | |
| | | | | | $ | 125,850,690 | |
| | | | | | | | |
Total Bonds
(Identified Cost, $281,267,729) | | | $ | 306,145,367 | |
| | | | | | | | |
| |
| INVESTMENT COMPANIES (h) – 5.8% | | | | | |
| MONEY MARKET FUNDS – 5.8% | | | | | | | | |
| MFS Institutional Money Market Portfolio, 1.25% (v) (Identified Cost, $18,949,940) | | | 18,951,029 | | | $ | 18,949,134 | |
| | | | | | | | |
OTHER ASSETS, LESS
LIABILITIES – 0.8% | | | | | | | 2,752,399 | |
| | | | | | | | |
| NET ASSETS – 100.0% | | | | | | $ | 327,846,900 | |
| | | | | | | | |
| (f) | | All or a portion of the security has been segregated as collateral for open futures contracts. |
| (h) | | An affiliated issuer may be considered one in which the fund owns 5% or more of the outstanding voting securities, or a company which is under common control. At period end, the aggregate values of the fund’s investments in affiliated issuers and in unaffiliated issuers were $18,949,134 and $306,145,367, respectively. |
| (v) | | Affiliated issuer that is available only to investment companies managed by MFS. The rate quoted for the MFS Institutional Money Market Portfolio is the annualized seven-day yield of the fund at period end. |
Abbreviations indicate amounts shown in currencies other than the U.S. dollar. All amounts are stated in U.S. dollars unless otherwise indicated. A list of abbreviations is shown below:
| CNH | | Chinese Yuan Renminbi (Offshore) |
8
MFS Inflation-Adjusted Bond Portfolio
Portfolio of Investments – continued
Derivative Contracts at 12/31/17
Forward Foreign Currency Exchange Contracts
| | | | | | | | | | | | | | | | | | | | |
Currency
Purchased | | Currency
Sold | | Counterparty | | Settlement
Date | | | Unrealized
Appreciation
(Depreciation) | |
| Asset Derivatives | | | | | | | | | | | | |
| AUD | | | 4,314,000 | | | | | USD | | 3,295,571 | | Barclays Bank PLC | | | 1/12/2018 | | | | $70,398 | |
| AUD | | | 6,220,000 | | | | | USD | | 4,811,662 | | Goldman Sachs International | | | 1/12/2018 | | | | 41,447 | |
| CAD | | | 1,634,000 | | | | | USD | | 1,284,879 | | Brown Brothers Harriman | | | 1/12/2018 | | | | 15,326 | |
| CAD | | | 2,074,000 | | | | | USD | | 1,647,157 | | Goldman Sachs International | | | 1/12/2018 | | | | 3,165 | |
| CNH | | | 11,888,000 | | | | | USD | | 1,661,955 | | JPMorgan Chase Bank N.A. | | | 1/5/2018 | | | | 162,921 | |
| EUR | | | 1,844,684 | | | | | USD | | 2,180,274 | | Brown Brothers Harriman | | | 1/12/2018 | | | | 34,243 | |
| EUR | | | 2,224,000 | | | | | USD | | 2,642,457 | | Deutsche Bank AG | | | 1/12/2018 | | | | 27,424 | |
| EUR | | | 5,325,226 | | | | | USD | | 6,333,014 | | Goldman Sachs International | | | 1/12/2018 | | | | 59,846 | |
| EUR | | | 1,542,155 | | | | | USD | | 1,833,445 | | HSBC Bank | | | 1/12/2018 | | | | 17,891 | |
| EUR | | | 1,174,735 | | | | | USD | | 1,403,332 | | Morgan Stanley Capital Services, Inc. | | | 1/12/2018 | | | | 6,921 | |
| EUR | | | 824,000 | | | | | USD | | 982,521 | | State Street Bank Corp. | | | 1/12/2018 | | | | 6,679 | |
| GBP | | | 1,468,622 | | | | | USD | | 1,972,987 | | Brown Brothers Harriman | | | 1/12/2018 | | | | 10,430 | |
| GBP | | | 1,602,507 | | | | | USD | | 2,159,035 | | Citibank N.A. | | | 1/12/2018 | | | | 5,197 | |
| GBP | | | 9,811,309 | | | | | USD | | 13,004,264 | | Goldman Sachs International | | | 1/12/2018 | | | | 246,195 | |
| GBP | | | 1,339,531 | | | | | USD | | 1,801,354 | | HSBC Bank | | | 1/12/2018 | | | | 7,721 | |
| JPY | | | 370,538,000 | | | | | USD | | 3,289,227 | | Brown Brothers Harriman | | | 1/12/2018 | | | | 496 | |
| NZD | | | 4,750,000 | | | | | USD | | 3,297,260 | | Morgan Stanley Capital Services, Inc. | | | 1/12/2018 | | | | 68,737 | |
| SEK | | | 27,593,000 | | | | | USD | | 3,310,303 | | Brown Brothers Harriman | | | 1/12/2018 | | | | 55,205 | |
| SEK | | | 13,601,000 | | | | | USD | | 1,643,237 | | Deutsche Bank AG | | | 1/12/2018 | | | | 15,672 | |
| USD | | | 1,475,405 | | | | | CAD | | 1,842,500 | | Citibank N.A. | | | 1/12/2018 | | | | 9,292 | |
| USD | | | 190,190 | | | | | SEK | | 1,526,010 | | Deutsche Bank AG | | | 1/12/2018 | | | | 4,063 | |
| USD | | | 2,111,136 | | | | | CAD | | 2,632,796 | | Goldman Sachs International | | | 1/12/2018 | | | | 16,170 | |
| USD | | | 1,889,133 | | | | | JPY | | 210,915,986 | | Goldman Sachs International | | | 1/12/2018 | | | | 16,571 | |
| USD | | | 3,293,634 | | | | | SEK | | 26,740,000 | | Goldman Sachs International | | | 1/12/2018 | | | | 32,167 | |
| USD | | | 1,475,110 | | | | | CAD | | 1,842,500 | | Merrill Lynch International | | | 1/12/2018 | | | | 8,997 | |
| | | | | | | | | | | | | | | | | | | | |
| | | | | | | | | | | | | | | | | | | $943,174 | |
| | | | | | | | | | | | | | | | | | | | |
| Liability Derivatives | | | | | | | | | | | | |
| JPY | | | 184,764,000 | | | | | USD | | 1,649,234 | | Goldman Sachs International | | | 1/12/2018 | | | | $(8,856 | ) |
| MXN | | | 133,881 | | | | | USD | | 7,045 | | Deutsche Bank AG | | | 1/12/2018 | | | | (247 | ) |
| NZD | | | 162,000 | | | | | USD | | 115,251 | | Barclays Bank PLC | | | 1/12/2018 | | | | (453 | ) |
| SEK | | | 26,470,000 | | | | | USD | | 3,305,717 | | Brown Brothers Harriman | | | 1/12/2018 | | | | (77,182 | ) |
| USD | | | 1,634,463 | | | | | GBP | | 1,220,000 | | Brown Brothers Harriman | | | 1/12/2018 | | | | (13,182 | ) |
| USD | | | 1,987,512 | | | | | AUD | | 2,645,000 | | Citibank N.A. | | | 1/12/2018 | | | | (76,229 | ) |
| USD | | | 1,956,599 | | | | | CAD | | 2,473,802 | | Citibank N.A. | | | 1/12/2018 | | | | (11,853 | ) |
| USD | | | 224,593 | | | | | DKK | | 1,406,894 | | Citibank N.A. | | | 1/12/2018 | | | | (2,280 | ) |
| USD | | | 3,269,761 | | | | | EUR | | 2,761,000 | | Citibank N.A. | | | 1/12/2018 | | | | (44,781 | ) |
| USD | | | 2,434,627 | | | | | GBP | | 1,859,146 | | Citibank N.A. | | | 1/12/2018 | | | | (76,204 | ) |
| USD | | | 1,144,730 | | | | | JPY | | 129,765,000 | | Citibank N.A. | | | 1/12/2018 | | | | (7,354 | ) |
| USD | | | 324,894 | | | | | NZD | | 474,000 | | Citibank N.A. | | | 1/12/2018 | | | | (10,997 | ) |
| USD | | | 2,270,516 | | | | | AUD | | 2,917,186 | | Deutsche Bank AG | | | 1/12/2018 | | | | (5,597 | ) |
| USD | | | 1,628,539 | | | | | CAD | | 2,051,000 | | Deutsche Bank AG | | | 1/12/2018 | | | | (3,481 | ) |
| USD | | | 5,813,599 | | | | | EUR | | 4,969,482 | | Deutsche Bank AG | | | 1/12/2018 | | | | (152,195 | ) |
| USD | | | 3,292,115 | | | | | AUD | | 4,291,000 | | Goldman Sachs International | | | 1/12/2018 | | | | (55,906 | ) |
| USD | | | 6,895,893 | | | | | EUR | | 5,824,002 | | Goldman Sachs International | | | 1/12/2018 | | | | (95,740 | ) |
| USD | | | 658,647 | | | | | GBP | | 499,000 | | Goldman Sachs International | | | 1/12/2018 | | | | (15,267 | ) |
| USD | | | 1,634,475 | | | | | JPY | | 185,159,000 | | Goldman Sachs International | | | 1/12/2018 | | | | (9,411 | ) |
| USD | | | 6,710,220 | | | | | NZD | | 9,502,112 | | Goldman Sachs International | | | 1/12/2018 | | | | (23,271 | ) |
| USD | | | 1,667,438 | | | | | CNH | | 11,888,000 | | JPMorgan Chase Bank N.A. | | | 1/5/2018 | | | | (157,438 | ) |
| USD | | | 1,794,047 | | | | | JPY | | 202,801,000 | | Morgan Stanley Capital Services, Inc. | | | 1/12/2018 | | | | (6,468 | ) |
| | | | | | | | | | | | | | | | | | | | |
| | | | | | | | | | | | | | | | | | | $(854,392 | ) |
| | | | | | | | | | | | | | | | | | | | |
9
MFS Inflation-Adjusted Bond Portfolio
Portfolio of Investments – continued
Futures Contracts
| | | | | | | | | | | | | | | | | | |
| Description | | Long/ Short | | Currency | | Contracts | | | Notional
Amount | | | Expiration
Date | | Value/
Unrealized
Appreciation
(Depreciation) | |
| Asset Derivatives | | | | | | | | | | | | | | | | | | |
| Interest Rate Futures | | | | | | | | | | | |
| U.S. Treasury Ultra Note 10 yr | | Short | | USD | | | 14 | | | | $1,869,875 | | | March - 2018 | | | $10,532 | |
| U.S. Treasury Note 10 yr | | Short | | USD | | | 88 | | | | 10,916,125 | | | March - 2018 | | | 82,175 | |
| | | | | | | | | | | | | | | | | | |
| | | | | | | | | | | | | | | | | $92,707 | |
| | | | | | | | | | | | | | | | | | |
At December 31, 2017, the fund had liquid securities with an aggregate value of $121,613 to cover any collateral or margin obligations for certain derivative contracts.
See Notes to Financial Statements
10
MFS Inflation-Adjusted Bond Portfolio
FINANCIAL STATEMENTS | STATEMENT OF ASSETS AND LIABILITIES
This statement represents your fund’s balance sheet, which details the assets and liabilities comprising the total value of the fund.
| | | | |
At 12/31/17 | | | | |
Assets | | | | |
Investments in unaffiliated issuers, at value (identified cost, $281,267,729) | | | $306,145,367 | |
Investments in affiliated issuers, at value (identified cost, $18,949,940) | | | 18,949,134 | |
Foreign currency, at value (identified cost, $21) | | | 21 | |
Receivables for | |
Forward foreign currency exchange contracts | | | 943,174 | |
Investments sold | | | 2,481,795 | |
Fund shares sold | | | 172 | |
Interest | | | 952,911 | |
Other assets | | | 2,359 | |
Total assets | | | $329,474,933 | |
Liabilities | | | | |
Payables for | | | | |
Forward foreign currency exchange contracts | | | $854,392 | |
Daily variation margin on open futures contracts | | | 21,809 | |
Fund shares reacquired | | | 661,218 | |
Payable to affiliates | | | | |
Investment adviser | | | 18,219 | |
Shareholder servicing costs | | | 57 | |
Distribution and/or service fees | | | 4,518 | |
Payable for independent Trustees’ compensation | | | 67 | |
Accrued expenses and other liabilities | | | 67,753 | |
Total liabilities | | | $1,628,033 | |
Net assets | | | $327,846,900 | |
Net assets consist of | | | | |
Paid-in capital | | | $302,725,616 | |
Unrealized appreciation (depreciation) | | | 25,067,279 | |
Accumulated net realized gain (loss) | | | (4,462,651 | ) |
Undistributed net investment income | | | 4,516,656 | |
Net assets | | | $327,846,900 | |
Shares of beneficial interest outstanding | | | 30,512,989 | |
| | | | | | | | | | | | |
| | | Net assets | | | Shares
outstanding | | | Net asset value
per share | |
Initial Class | | | $162,429,111 | | | | 15,025,900 | | | | $10.81 | |
Service Class | | | 165,417,789 | | | | 15,487,089 | | | | 10.68 | |
Net asset value per share is calculated using actual net assets and shares outstanding rather than amounts that have been rounded for presentation purposes.
See Notes to Financial Statements
11
MFS Inflation-Adjusted Bond Portfolio
FINANCIAL STATEMENTS | STATEMENT OF OPERATIONS
This statement describes how much your fund earned in investment income and accrued in expenses. It also describes any gains and/or losses generated by fund operations.
| | | | |
Year ended 12/31/17 | |
Net investment income (loss) | |
Income | |
Interest | | | $6,058,780 | |
Dividends from affiliated issuers | | | 69,187 | |
Total investment income | | | $6,127,967 | |
Expenses | | | | |
Management fee | | | $1,671,231 | |
Distribution and/or service fees | | | 419,327 | |
Shareholder servicing costs | | | 6,399 | |
Administrative services fee | | | 62,428 | |
Independent Trustees’ compensation | | | 9,000 | |
Custodian fee | | | 38,750 | |
Shareholder communications | | | 27,437 | |
Audit and tax fees | | | 41,251 | |
Legal fees | | | 4,817 | |
Miscellaneous | | | 20,621 | |
Total expenses | | | $2,301,261 | |
Reduction of expenses by investment adviser | | | (26,719 | ) |
Net expenses | | | $2,274,542 | |
Net investment income (loss) | | | $3,853,425 | |
Realized and unrealized gain (loss) | |
Realized gain (loss) (identified cost basis) | | | | |
Unaffiliated issuers | | | $1,518,856 | |
Affiliated issuers | | | (992 | ) |
Futures contracts | | | 87,024 | |
Forward foreign currency exchange contracts | | | 694,657 | |
Foreign currency | | | (205,798 | ) |
Net realized gain (loss) | | | $2,093,747 | |
Change in unrealized appreciation (depreciation) | |
Unaffiliated issuers | | | $20,271,879 | |
Affiliated issuers | | | (806 | ) |
Futures contracts | | | 92,707 | |
Forward foreign currency exchange contracts | | | (94,657 | ) |
Translation of assets and liabilities in foreign currencies | | | 23,669 | |
Net unrealized gain (loss) | | | $20,292,792 | |
Net realized and unrealized gain (loss) | | | $22,386,539 | |
Change in net assets from operations | | | $26,239,964 | |
See Notes to Financial Statements
12
MFS Inflation-Adjusted Bond Portfolio
FINANCIAL STATEMENTS | STATEMENTS OF CHANGES IN NET ASSETS
These statements describe the increases and/or decreases in net assets resulting from operations, any distributions, and any shareholder transactions.
| | | | | | | | |
| | | Year ended | |
| | | 12/31/17 | | | | 12/31/16 | |
Change in net assets | |
From operations | |
Net investment income (loss) | | | $3,853,425 | | | | $1,846,895 | |
Net realized gain (loss) | | | 2,093,747 | | | | (9,640,570 | ) |
Net unrealized gain (loss) | | | 20,292,792 | | | | 17,862,614 | |
Change in net assets from operations | | | $26,239,964 | | | | $10,068,939 | |
Change in net assets from fund share transactions | | | $(36,327,130 | ) | | | $(33,733,905 | ) |
Total change in net assets | | | $(10,087,166 | ) | | | $(23,664,966 | ) |
Net assets | |
At beginning of period | | | 337,934,066 | | | | 361,599,032 | |
At end of period (including undistributed net investment income of $4,516,656 and
accumulated net investment loss of $366,250, respectively) | | | $327,846,900 | | | | $337,934,066 | |
See Notes to Financial Statements
13
MFS Inflation-Adjusted Bond Portfolio
FINANCIAL STATEMENTS | FINANCIAL HIGHLIGHTS
The financial highlights table is intended to help you understand the fund’s financial performance for the past 5 years. Certain information reflects financial results for a single fund share. The total returns in the table represent the rate that an investor would have earned (or lost) on an investment in the fund share class (assuming reinvestment of all distributions) held for the entire period.
| | | | | | | | | | | | | | | | | | | | |
| Initial Class | | Year ended | |
| | | 12/31/17 | | | 12/31/16 | | | 12/31/15 | | | 12/31/14 | | | 12/31/13 | |
Net asset value, beginning of period | | | $9.98 | | | | $9.73 | | | | $10.32 | | | | $10.04 | | | | $11.29 | |
| Income (loss) from investment operations | | | | | | | | | | | | | | | | | | | | |
Net investment income (loss) (d) | | | $0.13 | | | | $0.07 | (c) | | | $(0.01 | ) | | | $0.08 | | | | $0.02 | |
Net realized and unrealized gain (loss) | | | 0.70 | | | | 0.18 | | | | (0.51 | ) | | | 0.29 | | | | (0.61 | ) |
Total from investment operations | | | $0.83 | | | | $0.25 | | | | $(0.52 | ) | | | $0.37 | | | | $(0.59 | ) |
| Less distributions declared to shareholders | | | | | | | | | | | | | | | | | | | | |
From net investment income | | | $— | | | | $— | | | | $(0.07 | ) | | | $(0.09 | ) | | | $— | |
From net realized gain | | | — | | | | — | | | | — | | | | — | | | | (0.66 | ) |
Total distributions declared to shareholders | | | $— | | | | $— | | | | $(0.07 | ) | | | $(0.09 | ) | | | $(0.66 | ) |
Net asset value, end of period (x) | | | $10.81 | | | | $9.98 | | | | $9.73 | | | | $10.32 | | | | $10.04 | |
Total return (%) (k)(r)(s)(x) | | | 8.32 | | | | 2.57 | (c) | | | (5.04 | ) | | | 3.71 | | | | (5.07 | ) |
Ratios (%) (to average net assets)
and Supplemental data: | | | | | | | | | | | | | | | | | | | | |
Expenses before expense reductions (f) | | | 0.56 | | | | 0.55 | (c) | | | 0.56 | | | | 0.55 | | | | 0.56 | |
Expenses after expense reductions (f) | | | 0.55 | | | | 0.54 | (c) | | | 0.55 | | | | 0.54 | | | | 0.56 | |
Net investment income (loss) | | | 1.28 | | | | 0.65 | (c) | | | (0.11 | ) | | | 0.72 | | | | 0.22 | |
Portfolio turnover | | | 40 | | | | 47 | | | | 44 | | | | 24 | | | | 51 | |
Net assets at end of period (000 omitted) | | | $162,429 | | | | $168,857 | | | | $184,691 | | | | $214,183 | | | | $230,805 | |
| |
| Service Class | | Year ended | |
| | | 12/31/17 | | | 12/31/16 | | | 12/31/15 | | | 12/31/14 | | | 12/31/13 | |
| | | | | | | | | | | | | | | | |
Net asset value, beginning of period | | | $9.89 | | | | $9.66 | | | | $10.24 | | | | $9.96 | | | | $11.23 | |
| Income (loss) from investment operations | | | | | | | | | | | | | | | | | | | | |
Net investment income (loss) (d) | | | $0.11 | | | | $0.04 | (c) | | | $(0.04 | ) | | | $0.05 | | | | $(0.00 | )(w) |
Net realized and unrealized gain (loss) | | | 0.68 | | | | 0.19 | | | | (0.50 | ) | | | 0.29 | | | | (0.61 | ) |
Total from investment operations | | | $0.79 | | | | $0.23 | | | | $(0.54 | ) | | | $0.34 | | | | $(0.61 | ) |
| Less distributions declared to shareholders | | | | | | | | | | | | | | | | | | | | |
From net investment income | | | $— | | | | $— | | | | $(0.04 | ) | | | $(0.06 | ) | | | $— | |
From net realized gain | | | — | | | | — | | | | — | | | | — | | | | (0.66 | ) |
Total distributions declared to shareholders | | | $— | | | | $— | | | | $(0.04 | ) | | | $(0.06 | ) | | | $(0.66 | ) |
Net asset value, end of period (x) | | | $10.68 | | | | $9.89 | | | | $9.66 | | | | $10.24 | | | | $9.96 | |
Total return (%) (k)(r)(s)(x) | | | 7.99 | | | | 2.38 | (c) | | | (5.27 | ) | | | 3.43 | | | | (5.28 | ) |
Ratios (%) (to average net assets)
and Supplemental data: | | | | | | | | | | | | | | | | | | | | |
Expenses before expense reductions (f) | | | 0.81 | | | | 0.80 | (c) | | | 0.81 | | | | 0.80 | | | | 0.81 | |
Expenses after expense reductions (f) | | | 0.80 | | | | 0.79 | (c) | | | 0.80 | | | | 0.79 | | | | 0.81 | |
Net investment income (loss) | | | 1.03 | | | | 0.40 | (c) | | | (0.37 | ) | | | 0.46 | | | | (0.00 | )(w) |
Portfolio turnover | | | 40 | | | | 47 | | | | 44 | | | | 24 | | | | 51 | |
Net assets at end of period (000 omitted) | | | $165,418 | | | | $169,077 | | | | $176,909 | | | | $217,249 | | | | $248,127 | |
See Notes to Financial Statements
14
MFS Inflation-Adjusted Bond Portfolio
Financial Highlights – continued
| (c) | | Amount reflects a one-time reimbursement of expenses by the custodian (or former custodian) without which net investment income and performance would be lower and expenses would be higher. |
| (d) | | Per share data is based on average shares outstanding. |
| (f) | | Ratios do not reflect reductions from fees paid indirectly, if applicable. |
| (k) | | The total return does not reflect expenses that apply to separate accounts. Inclusion of these charges would reduce the total return figures for all periods shown. |
| (r) | | Certain expenses have been reduced without which performance would have been lower. |
| (s) | | From time to time the fund may receive proceeds from litigation settlements, without which performance would be lower. |
| (w) | | Per share amount was less than $0.01 and total return or ratio was less than 0.01%, as applicable. |
| (x) | | The net asset values and total returns have been calculated on net assets which include adjustments made in accordance with U.S. generally accepted accounting principles required at period end for financial reporting purposes. |
See Notes to Financial Statements
15
MFS Inflation-Adjusted Bond Portfolio
NOTES TO FINANCIAL STATEMENTS
| (1) | | Business and Organization |
MFS Inflation-Adjusted Bond Portfolio (the fund) is a non-diversified series of MFS Variable Insurance Trust III (the trust). The trust is organized as a Delaware statutory trust and is registered under the Investment Company Act of 1940, as amended, as an open-end management investment company. The shareholders of each series of the trust are separate accounts of insurance companies, which offer variable annuity and/or life insurance products, and qualified retirement and pension plans.
The fund is an investment company and accordingly follows the investment company accounting and reporting guidance of the Financial Accounting Standards Board (FASB) Accounting Standards Codification Topic 946 Financial Services – Investment Companies.
| (2) | | Significant Accounting Policies |
General – The preparation of financial statements in conformity with U.S. generally accepted accounting principles requires management to make estimates and assumptions that affect the reported amounts of assets and liabilities, and disclosure of contingent assets and liabilities at the date of the financial statements and the reported amounts of increases and decreases in net assets from operations during the reporting period. Actual results could differ from those estimates. In the preparation of these financial statements, management has evaluated subsequent events occurring after the date of the fund’s Statement of Assets and Liabilities through the date that the financial statements were issued. The fund invests in foreign securities. Investments in foreign securities are vulnerable to the effects of changes in the relative values of the local currency and the U.S. dollar and to the effects of changes in each country’s market, economic, industry, political, regulatory, geopolitical, and other conditions.
In October 2016, the Securities and Exchange Commission (SEC) released its final rule on Investment Company Reporting Modernization (the “Rule”). The Rule, which introduced two new regulatory reporting forms for investment companies – Form N-PORT and Form N-CEN – also contained amendments to Regulation S-X which impact financial statement presentation, particularly the presentation of derivative investments, for all reporting periods ending after August 1, 2017. The fund has adopted the Rule’s Regulation S-X amendments and believes that the fund’s financial statements are in compliance with those amendments.
Balance Sheet Offsetting – The fund’s accounting policy with respect to balance sheet offsetting is that, absent an event of default by the counterparty or a termination of the agreement, the International Swaps and Derivatives Association (ISDA) Master Agreement, or similar agreement, does not result in an offset of reported amounts of financial assets and financial liabilities in the Statement of Assets and Liabilities across transactions between the fund and the applicable counterparty. The fund’s right to setoff may be restricted or prohibited by the bankruptcy or insolvency laws of the particular jurisdiction to which a specific master netting agreement counterparty is subject. Balance sheet offsetting disclosures, to the extent applicable to the fund, have been included in the fund’s Significant Accounting Policies note under the captions for each of the fund’s in-scope financial instruments and transactions.
Investment Valuations – Debt instruments and floating rate loans, including restricted debt instruments, are generally valued at an evaluated or composite bid as provided by a third-party pricing service. Short-term instruments with a maturity at issuance of 60 days or less may be valued at amortized cost, which approximates market value. Futures contracts are generally valued at last posted settlement price on their primary exchange as provided by a third-party pricing service. Futures contracts for which there were no trades that day for a particular position are generally valued at the closing bid quotation on their primary exchange as provided by a third-party pricing service. Forward foreign currency exchange contracts are generally valued at the mean of bid and asked prices for the time period interpolated from rates provided by a third-party pricing service for proximate time periods. Open-end investment companies are generally valued at net asset value per share. Securities and other assets generally valued on the basis of information from a third-party pricing service may also be valued at a broker/dealer bid quotation. Values obtained from third-party pricing services can utilize both transaction data and market information such as yield, quality, coupon rate, maturity, type of issue, trading characteristics, and other market data. The values of foreign securities and other assets and liabilities expressed in foreign currencies are converted to U.S. dollars using the mean of bid and asked prices for rates provided by a third-party pricing service.
The Board of Trustees has delegated primary responsibility for determining or causing to be determined the value of the fund’s investments (including any fair valuation) to the adviser pursuant to valuation policies and procedures approved by the Board. If the adviser determines that reliable market quotations are not readily available, investments are valued at fair value as determined in good faith by the adviser in accordance with such procedures under the oversight of the Board of Trustees. Under the fund’s valuation policies and procedures, market quotations are not considered to be readily available for most types of debt instruments and floating rate loans and many types of derivatives. These investments are generally valued at fair value based on information from third-party pricing services. In addition, investments may be valued at fair value if the adviser determines that an investment’s value has been materially affected by events occurring after the close of the exchange or market on which the investment is principally traded (such as foreign exchange or market) and prior to the determination of the fund’s net asset value, or after the halting of trading of a specific security where trading does not resume prior to the close of the exchange or market on which the security is principally traded. The adviser generally relies on third-party pricing services or other information (such as the correlation with price movements of similar securities in the same or other markets; the type, cost and investment characteristics of the security; the
16
MFS Inflation-Adjusted Bond Portfolio
Notes to Financial Statements – continued
business and financial condition of the issuer; and trading and other market data) to assist in determining whether to fair value and at what value to fair value an investment. The value of an investment for purposes of calculating the fund’s net asset value can differ depending on the source and method used to determine value. When fair valuation is used, the value of an investment used to determine the fund’s net asset value may differ from quoted or published prices for the same investment. There can be no assurance that the fund could obtain the fair value assigned to an investment if it were to sell the investment at the same time at which the fund determines its net asset value per share.
Various inputs are used in determining the value of the fund’s assets or liabilities. These inputs are categorized into three broad levels. In certain cases, the inputs used to measure fair value may fall into different levels of the fair value hierarchy. In such cases, an investment’s level within the fair value hierarchy is based on the lowest level of input that is significant to the fair value measurement. The fund’s assessment of the significance of a particular input to the fair value measurement in its entirety requires judgment, and considers factors specific to the investment. Level 1 includes unadjusted quoted prices in active markets for identical assets or liabilities. Level 2 includes other significant observable market-based inputs (including quoted prices for similar securities, interest rates, prepayment speed, and credit risk). Level 3 includes unobservable inputs, which may include the adviser’s own assumptions in determining the fair value of investments. Other financial instruments are derivative instruments, such as futures contracts and forward foreign currency exchange contracts. The following is a summary of the levels used as of December 31, 2017 in valuing the fund’s assets or liabilities:
| | | | | | | | | | | | | | | | |
| Financial Instruments | | Level 1 | | | Level 2 | | | Level 3 | | | Total | |
| U.S. Treasury Bonds & U.S. Government Agency & Equivalents | | | $— | | | | $125,850,690 | | | | $— | | | | $125,850,690 | |
| Non-U.S. Sovereign Debt | | | — | | | | 180,294,677 | | | | — | | | | 180,294,677 | |
| Mutual Funds | | | 18,949,134 | | | | — | | | | — | | | | 18,949,134 | |
| Total | | | $18,949,134 | | | | $306,145,367 | | | | $— | | | | $325,094,501 | |
| | | | |
| Other Financial Instruments | | | | | | | | | | | | |
| Futures Contracts – Assets | | | $92,707 | | | | $— | | | | $— | | | | $92,707 | |
| Forward Foreign Currency Exchange Contracts – Assets | | | — | | | | 943,174 | | | | — | | | | 943,174 | |
| Forward Foreign Currency Exchange Contracts – Liabilities | | | — | | | | (854,392 | ) | | | — | | | | (854,392 | ) |
For further information regarding security characteristics, see the Portfolio of Investments.
Inflation-Adjusted Debt Securities – The fund invests in inflation-adjusted debt securities issued by the U.S. Treasury. The fund also invests in inflation-adjusted debt securities issued by U.S. Government agencies and instrumentalities other than the U.S. Treasury and by other entities such as U.S. and foreign corporations and foreign governments. The principal value of these debt securities is adjusted through income according to changes in the Consumer Price Index or another general price or wage index. These debt securities typically pay a fixed rate of interest, but this fixed rate is applied to the inflation-adjusted principal amount. The principal paid at maturity of the debt security is typically equal to the inflation-adjusted principal amount, or the security’s original par value, whichever is greater. Other types of inflation-adjusted securities may use other methods to adjust for other measures of inflation.
Foreign Currency Translation – Purchases and sales of foreign investments, income, and expenses are converted into U.S. dollars based upon currency exchange rates prevailing on the respective dates of such transactions or on the reporting date for foreign denominated receivables and payables. Gains and losses attributable to foreign currency exchange rates on sales of securities are recorded for financial statement purposes as net realized gains and losses on investments. Gains and losses attributable to foreign exchange rate movements on receivables, payables, income and expenses are recorded for financial statement purposes as foreign currency transaction gains and losses. That portion of both realized and unrealized gains and losses on investments that results from fluctuations in foreign currency exchange rates is not separately disclosed.
Derivatives – The fund uses derivatives for different purposes, primarily to increase or decrease exposure to a particular market or segment of the market, or security, to increase or decrease interest rate or currency exposure, or as alternatives to direct investments. Derivatives are used for hedging or non-hedging purposes. While hedging can reduce or eliminate losses, it can also reduce or eliminate gains. When the fund uses derivatives as an investment to increase market exposure, or for hedging purposes, gains and losses from derivative instruments may be substantially greater than the derivative’s original cost.
The derivative instruments used by the fund were futures contracts and forward foreign currency exchange contracts. Depending on the type of derivative, the fund may exit a derivative position by entering into an offsetting transaction with a counterparty or exchange, negotiating an agreement with the derivative counterparty, or novating the position to a third party. The fund may be unable to promptly close out a futures position in instances where the daily fluctuation in the price for that type of future exceeds the daily limit set by the exchange. The fund may be unable to promptly close out a futures position in instances where the daily fluctuation in the price for that type of future exceeds the daily limit set by the exchange. The fund’s period end derivatives, as presented in the Portfolio of Investments and the associated Derivative Contract tables, generally are indicative of the volume of its derivative activity during the period.
17
MFS Inflation-Adjusted Bond Portfolio
Notes to Financial Statements – continued
The following table presents, by major type of derivative contract, the fair value, on a gross basis, of the asset and liability components of derivatives held by the fund at December 31, 2017 as reported in the Statement of Assets and Liabilities:
| | | | | | | | | | |
| | | | | Fair Value (a) | |
| Risk | | Derivative Contracts | | Asset Derivatives | | | Liability Derivatives | |
| Interest Rate | | Interest Rate Futures | | | $92,707 | | | | $— | |
| Foreign Exchange | | Forward Foreign Currency Exchange | | | 943,174 | | | | (854,392 | ) |
| Total | | | | | $1,035,881 | | | | $(854,392 | ) |
| (a) | Values presented in this table for futures contracts correspond to the values reported in the fund’s Portfolio of Investments. Only the current day net variation margin for futures contracts is separately reported within the fund’s Statement of Assets and Liabilities. |
The following table presents, by major type of derivative contract, the realized gain (loss) on derivatives held by the fund for the year ended December 31, 2017 as reported in the Statement of Operations:
| | | | | | | | |
| Risk | | Futures Contracts | | | Forward
Foreign Currency
Exchange Contracts | |
| Interest Rate | | | $87,024 | | | | $— | |
| Foreign Exchange | | | — | | | | 694,657 | |
| Total | | | $87,024 | | | | $694,657 | |
The following table presents, by major type of derivative contract, the change in unrealized appreciation (depreciation) on derivatives held by the fund for the year ended December 31, 2017 as reported in the Statement of Operations:
| | | | | | | | |
| Risk | | Futures Contracts | | | Forward
Foreign Currency
Exchange Contracts | |
| Interest Rate | | | $92,707 | | | | $— | |
| Foreign Exchange | | | — | | | | (94,657 | ) |
| Total | | | $92,707 | | | | $(94,657 | ) |
Derivative counterparty credit risk is managed through formal evaluation of the creditworthiness of all potential counterparties. On certain, but not all, uncleared derivatives, the fund attempts to reduce its exposure to counterparty credit risk whenever possible by entering into an ISDA Master Agreement on a bilateral basis. The ISDA Master Agreement gives each party to the agreement the right to terminate all transactions traded under such agreement if there is a specified deterioration in the credit quality of the other party. Upon an event of default or a termination of the ISDA Master Agreement, the non-defaulting party has the right to close out all transactions traded under such agreement and to net amounts owed under each agreement to one net amount payable by one party to the other. This right to close out and net payments across all transactions traded under the ISDA Master Agreement could result in a reduction of the fund’s credit risk to such counterparty equal to any amounts payable by the fund under the applicable transactions, if any.
Collateral and margin requirements differ by type of derivative. For cleared derivatives (e.g., futures contracts, cleared swaps, and exchange-traded options), margin requirements are set by the clearing broker and the clearing house and collateral, in the form of cash or securities, is posted by the fund directly with the clearing broker. Collateral terms are counterparty agreement specific for uncleared derivatives (e.g., forward foreign currency exchange contracts, uncleared swap agreements, and uncleared options) and collateral, in the form of cash and securities, is held in segregated accounts with the fund’s custodian in connection with these agreements. For derivatives traded under an ISDA Master Agreement, which contains a collateral support annex, the collateral requirements are netted across all transactions traded under such counterparty-specific agreement and one amount is posted from one party to the other to collateralize such obligations. Cash that has been segregated or delivered to cover the fund’s collateral or margin obligations under derivative contracts, if any, will be reported separately in the Statement of Assets and Liabilities as restricted cash for uncleared derivatives and/or deposits with brokers for cleared derivatives, respectively. Securities pledged as collateral or margin for the same purpose, if any, are noted in the Portfolio of Investments. The fund may be required to make payments of interest on uncovered collateral or margin obligations with the broker. Any such payments are included in “Miscellaneous” expense in the Statement of Operations.
Futures Contracts – The fund entered into futures contracts which may be used to hedge against or obtain broad market exposure, interest rate exposure, currency exposure, or to manage duration. A futures contract represents a commitment for the future purchase or sale of an asset at a specified price on a specified date.
Upon entering into a futures contract, the fund is required to deposit with the broker, either in cash or securities, an initial margin in an amount equal to a certain percentage of the notional amount of the contract. Subsequent payments (variation margin) are made
18
MFS Inflation-Adjusted Bond Portfolio
Notes to Financial Statements – continued
or received by the fund each day, depending on the daily fluctuations in the value of the contract, and are recorded for financial statement purposes as unrealized gain or loss by the fund until the contract is closed or expires at which point the gain or loss on futures contracts is realized.
The fund bears the risk of interest rates, exchange rates or securities prices moving unexpectedly, in which case, the fund may not achieve the anticipated benefits of the futures contracts and may realize a loss. While futures contracts may present less counterparty risk to the fund since the contracts are exchange traded and the exchange’s clearinghouse guarantees payments to the broker, there is still counterparty credit risk due to the insolvency of the broker. The fund’s maximum risk of loss due to counterparty credit risk is equal to the margin posted by the fund to the broker plus any gains or minus any losses on the outstanding futures contracts.
Forward Foreign Currency Exchange Contracts – The fund entered into forward foreign currency exchange contracts for the purchase or sale of a specific foreign currency at a fixed price on a future date. These contracts may be used to hedge the fund’s currency risk or for non-hedging purposes. For hedging purposes, the fund may enter into contracts to deliver or receive foreign currency that the fund will receive from or use in its normal investment activities. The fund may also use contracts to hedge against declines in the value of foreign currency denominated securities due to unfavorable exchange rate movements. For non-hedging purposes, the fund may enter into contracts with the intent of changing the relative exposure of the fund’s portfolio of securities to different currencies to take advantage of anticipated exchange rate changes.
Forward foreign currency exchange contracts are adjusted by the daily exchange rate of the underlying currency and any unrealized gains or losses are recorded as a receivable or payable for forward foreign currency exchange contracts until the contract settlement date. On contract settlement date, any gain or loss on the contract is recorded as realized gains or losses on forward foreign currency exchange contracts.
Risks may arise upon entering into these contracts from unanticipated movements in the value of the contract and from the potential inability of counterparties to meet the terms of their contracts. Generally, the fund’s maximum risk due to counterparty credit risk is the unrealized gain on the contract due to the use of Continuous Linked Settlement, a multicurrency cash settlement system for the centralized settlement of foreign transactions. This risk is mitigated in cases where there is an ISDA Master Agreement between the fund and the counterparty providing for netting as described above and, where applicable, by the posting of collateral by the counterparty to the fund to cover the fund’s exposure to the counterparty under such ISDA Master Agreement.
Indemnifications – Under the fund’s organizational documents, its officers and Trustees may be indemnified against certain liabilities and expenses arising out of the performance of their duties to the fund. Additionally, in the normal course of business, the fund enters into agreements with service providers that may contain indemnification clauses. The fund’s maximum exposure under these agreements is unknown as this would involve future claims that may be made against the fund that have not yet occurred.
Investment Transactions and Income – Investment transactions are recorded on the trade date. Interest income is recorded on the accrual basis. All premium and discount is amortized or accreted for financial statement purposes in accordance with U.S. generally accepted accounting principles. Inflation-indexed bonds are fixed-income securities whose principal value is periodically adjusted upward or downward based on the rate of inflation. Interest is accrued based on the principal value, which is adjusted for inflation. Any increase or decrease in the principal amount of an inflation-indexed bond is generally recorded as an increase or decrease in interest income, respectively, even though the adjusted principal is not received until maturity. Interest payments received in additional securities are recorded on the ex-interest date in an amount equal to the value of the security on such date.
The fund may receive proceeds from litigation settlements. Any proceeds received from litigation involving portfolio holdings are reflected in the Statement of Operations in realized gain/loss if the security has been disposed of by the fund or in unrealized gain/loss if the security is still held by the fund. Any other proceeds from litigation not related to portfolio holdings are reflected as other income in the Statement of Operations.
Tax Matters and Distributions – The fund intends to qualify as a regulated investment company, as defined under Subchapter M of the Internal Revenue Code, and to distribute all of its taxable income, including realized capital gains. As a result, no provision for federal income tax is required. The fund’s federal tax returns, when filed, will remain subject to examination by the Internal Revenue Service for a three year period. Management has analyzed the fund’s tax positions taken on federal and state tax returns for all open tax years and does not believe that there are any uncertain tax positions that require recognition of a tax liability. Foreign taxes, if any, have been accrued by the fund in the accompanying financial statements in accordance with the applicable foreign tax law. Foreign income taxes may be withheld by certain countries in which the fund invests. Additionally, capital gains realized by the fund on securities issued in or by certain foreign countries may be subject to capital gains tax imposed by those countries.
Distributions to shareholders are recorded on the ex-dividend date. Income and capital gain distributions are determined in accordance with income tax regulations, which may differ from U.S. generally accepted accounting principles. Certain capital accounts in the financial statements are periodically adjusted for permanent differences in order to reflect their tax character. These adjustments have no impact on net assets or net asset value per share. Temporary differences which arise from recognizing certain items of income, expense, gain or loss in different periods for financial statement and tax purposes will reverse at some time in the
19
MFS Inflation-Adjusted Bond Portfolio
Notes to Financial Statements – continued
future. Distributions in excess of net investment income or net realized gains are temporary overdistributions for financial statement purposes resulting from differences in the recognition or classification of income or distributions for financial statement and tax purposes.
Book/tax differences primarily relate to wash sale loss deferrals and derivative transactions.
The fund declared no distributions for the years ended December 31, 2017 and December 31, 2016.
The federal tax cost and the tax basis components of distributable earnings were as follows:
| | | | |
| As of 12/31/17 | | | | |
| Cost of investments | | | $301,322,787 | |
| Gross appreciation | | | 25,497,088 | |
| Gross depreciation | | | (1,543,885 | ) |
| Net unrealized appreciation (depreciation) | | | $23,953,203 | |
| Undistributed ordinary income | | | 4,683,345 | |
| Capital loss carryforwards | | | (3,524,222 | ) |
| Other temporary differences | | | 8,958 | |
As of December 31, 2017, the fund had capital loss carryforwards available to offset future realized gains. These net capital losses may be carried forward indefinitely and their character is retained as short-term and/or long-term losses. Such losses are characterized as follows:
Multiple Classes of Shares of Beneficial Interest – The fund offers multiple classes of shares, which differ in their respective distribution and/or service fees. The fund’s income, realized and unrealized gain (loss), and common expenses are allocated to shareholders based on the daily net assets of each class. Dividends are declared separately for each class. Differences in per share dividend rates are generally due to differences in separate class expenses.
| (3) | | Transactions with Affiliates |
Investment Adviser – The fund has an investment advisory agreement with MFS to provide overall investment management and related administrative services and facilities to the fund. The management fee is computed daily and paid monthly at an annual rate of 0.50% of the fund’s average daily net assets.
MFS has agreed in writing to reduce its management fee by a specified amount if certain MFS mutual fund assets exceed thresholds agreed to by MFS and the fund’s Board of Trustees. For the year ended December 31, 2017, this management fee reduction amounted to $26,719, which is included in the reduction of total expenses in the Statement of Operations. The management fee incurred for the year ended December 31, 2017 was equivalent to an annual effective rate of 0.49% of the fund’s average daily net assets.
Distributor – MFS Fund Distributors, Inc. (MFD), a wholly-owned subsidiary of MFS, is the distributor of shares of the fund. The Trustees have adopted a distribution plan for the Service Class shares pursuant to Rule 12b-1 under the Investment Company Act of 1940.
The fund’s distribution plan provides that the fund will pay MFD distribution and/or service fees equal to 0.25% per annum of its average daily net assets attributable to Service Class shares as partial consideration for services performed and expenses incurred by MFD and financial intermediaries (including participating insurance companies that invest in the fund to fund variable annuity and variable life insurance contracts, sponsors of qualified retirement and pension plans that invest in the fund, and affiliates of these participating insurance companies and plan sponsors) in connection with the sale and distribution of the Service Class shares. MFD may subsequently pay all, or a portion, of the distribution and/or service fees to financial intermediaries.
Shareholder Servicing Agent – MFS Service Center, Inc. (MFSC), a wholly-owned subsidiary of MFS, receives a fee from the fund for its services as shareholder servicing agent. For the year ended December 31, 2017, the fee was $5,961, which equated to 0.0018% annually of the fund’s average daily net assets. MFSC also receives payment from the fund for out-of-pocket expenses paid by MFSC on behalf of the fund. For the year ended December 31, 2017, these costs amounted to $438.
Administrator – MFS provides certain financial, legal, shareholder communications, compliance, and other administrative services to the fund. Under an administrative services agreement, the fund reimburses MFS the costs incurred to provide these services. The fund is charged an annual fixed amount of $17,500 plus a fee based on average daily net assets. The administrative services fee incurred for the year ended December 31, 2017 was equivalent to an annual effective rate of 0.0187% of the fund’s average daily net assets.
20
MFS Inflation-Adjusted Bond Portfolio
Notes to Financial Statements – continued
Trustees’ and Officers’ Compensation – The fund pays compensation to independent Trustees in the form of a retainer, attendance fees, and additional compensation to Board and Committee chairpersons. The fund does not pay compensation directly to Trustees or officers of the fund who are also officers of the investment adviser, all of whom receive remuneration for their services to the fund from MFS. Certain officers and Trustees of the fund are officers or directors of MFS, MFD, and MFSC.
Other – This fund and certain other funds managed by MFS (the funds) have entered into a service agreement (the ISO Agreement) which provides for payment of fees solely by the funds to Tarantino LLC in return for the provision of services of an Independent Senior Officer (ISO) for the funds. Frank L. Tarantino serves as the ISO and is an officer of the funds and the sole member of Tarantino LLC. The funds can terminate the ISO Agreement with Tarantino LLC at any time under the terms of the ISO Agreement. For the year ended December 31, 2017, the fee paid by the fund under this agreement was $595 and is included in “Miscellaneous” expense in the Statement of Operations. MFS has agreed to bear all expenses associated with office space, other administrative support, and supplies provided to the ISO.
The fund invests in the MFS Institutional Money Market Portfolio which is managed by MFS and seeks current income consistent with preservation of capital and liquidity. This money market fund does not pay a management fee to MFS.
For the year ended December 31, 2017, purchases and sales of investments, other than short-term obligations, were as follows:
| | | | | | | | |
| | | Purchases | | | Sales | |
| U.S. Government securities | | | $47,653,332 | | | | $72,074,493 | |
| Non-U.S. Government securities | | | $83,138,671 | | | | $111,936,269 | |
| (5) | | Shares of Beneficial Interest |
The fund’s Declaration of Trust permits the Trustees to issue an unlimited number of full and fractional shares of beneficial interest. Transactions in fund shares were as follows:
| | | | | | | | | | | | | | | | |
| | | Year ended 12/31/17 | | | Year ended 12/31/16 | |
| | | Shares | | | Amount | | | Shares | | | Amount | |
| Shares sold | | | | | | | | | | | | | | | | |
Initial Class | | | 182,892 | | | | $1,884,961 | | | | 257,954 | | | | $2,594,615 | |
Service Class | | | 1,081,322 | | | | 10,987,114 | | | | 1,856,045 | | | | 18,332,975 | |
| | | 1,264,214 | | | | $12,872,075 | | | | 2,113,999 | | | | $20,927,590 | |
| Shares reacquired | | | | | | | | | | | | | | | | |
Initial Class | | | (2,068,811 | ) | | | $(21,629,213 | ) | | | (2,327,493 | ) | | | $(23,708,840 | ) |
Service Class | | | (2,689,558 | ) | | | (27,569,992 | ) | | | (3,069,800 | ) | | | (30,952,655 | ) |
| | | (4,758,369 | ) | | | $(49,199,205 | ) | | | (5,397,293 | ) | | | $(54,661,495 | ) |
| Net change | | | | | | | | | | | | | | | | |
Initial Class | | | (1,885,919 | ) | | | $(19,744,252 | ) | | | (2,069,539 | ) | | | $(21,114,225 | ) |
Service Class | | | (1,608,236 | ) | | | (16,582,878 | ) | | | (1,213,755 | ) | | | (12,619,680 | ) |
| | | (3,494,155 | ) | | | $(36,327,130 | ) | | | (3,283,294 | ) | | | $(33,733,905 | ) |
The fund is one of several mutual funds in which certain MFS funds may invest. The MFS funds do not invest in the underlying funds for the purpose of exercising management or control. At the end of the period, the MFS Moderate Allocation Portfolio, the MFS Conservative Allocation Portfolio, and the MFS Growth Allocation Portfolio were the owners of record of approximately 26%, 17%, and 6%, respectively, of the value of outstanding voting shares of the fund.
The fund and certain other funds managed by MFS participate in a $1.25 billion unsecured committed line of credit, subject to a $1 billion sublimit, provided by a syndication of banks under a credit agreement. Borrowings may be made for temporary financing needs. Interest is charged to each fund, based on its borrowings, generally at a rate equal to the higher of the Overnight Federal Reserve funds rate or daily one month LIBOR plus an agreed upon spread. A commitment fee, based on the average daily, unused portion of the committed line of credit, is allocated among the participating funds at the end of each calendar quarter. In addition, the fund and other funds managed by MFS have established unsecured uncommitted borrowing arrangements with certain banks for temporary financing needs. Interest is charged to each fund, based on its borrowings, at a rate equal to the Overnight Federal Reserve funds rate plus an agreed upon spread. For the year ended December 31, 2017, the fund’s commitment fee and interest expense were $2,255 and $0, respectively, and are included in “Miscellaneous” expense in the Statement of Operations.
21
MFS Inflation-Adjusted Bond Portfolio
Notes to Financial Statements – continued
| (7) | | Investments in Affiliated Issuers |
An affiliated issuer may be considered one in which the fund owns 5% or more of the outstanding voting securities, or a company which is under common control. For the purposes of this report, the fund assumes the following to be affiliated issuers:
| | | | | | | | | | | | | | | | | | |
| Affiliated Issuers | | | | Beginning
Shares/Par
Amount | | | Acquisitions
Shares/Par
Amount | | | Dispositions
Shares/Par
Amount | | | Ending
Shares/Par
Amount | |
| MFS Institutional Money Market Portfolio | | | | | 2,064,011 | | | | 128,812,640 | | | | (111,925,622 | ) | | | 18,951,029 | |
| | | | | |
| Affilated Issuers | | Realized
Gain (Loss) | | Change in Unrealized
Appreciation
(Depreciation) | | | Capital Gain
Distributions | | | Dividend
Income | | | Ending
Value | |
| MFS Institutional Money Market Portfolio | | $(992) | | | $(806 | ) | | | $— | | | | $69,187 | | | | $18,949,134 | |
22
MFS Inflation-Adjusted Bond Portfolio
REPORT OF INDEPENDENT REGISTERED PUBLIC ACCOUNTING FIRM
To the Board of Trustees of MFS Variable Insurance Trust III and the Shareholders of MFS Inflation-Adjusted Bond Portfolio:
Opinion on the Financial Statements and Financial Highlights
We have audited the accompanying statement of assets and liabilities of MFS Inflation-Adjusted Bond Portfolio (one of the series of MFS Variable Insurance Trust III) (the “Fund”), including the portfolio of investments, as of December 31, 2017, the related statement of operations for the year then ended, the statements of changes in net assets for each of the two years in the period then ended, the financial highlights for each of the five years in the period then ended, and the related notes. In our opinion, the financial statements and financial highlights present fairly, in all material respects, the financial position of the Fund as of December 31, 2017, and the results of its operations for the year then ended, the changes in its net assets for each of the two years in the period then ended, and the financial highlights for each of the five years in the period then ended, in conformity with accounting principles generally accepted in the United States of America.
Basis for Opinion
These financial statements and financial highlights are the responsibility of the Fund’s management. Our responsibility is to express an opinion on the Fund’s financial statements and financial highlights based on our audits. We are a public accounting firm registered with the Public Company Accounting Oversight Board (United States) (PCAOB) and are required to be independent with respect to the Fund in accordance with the U.S. federal securities laws and the applicable rules and regulations of the Securities and Exchange Commission and the PCAOB.
We conducted our audits in accordance with the standards of the PCAOB. Those standards require that we plan and perform the audit to obtain reasonable assurance about whether the financial statements and financial highlights are free of material misstatement, whether due to error or fraud. The Fund is not required to have, nor were we engaged to perform, an audit of its internal control over financial reporting. As part of our audits we are required to obtain an understanding of internal control over financial reporting but not for the purpose of expressing an opinion on the effectiveness of the Fund’s internal control over financial reporting. Accordingly, we express no such opinion.
Our audits included performing procedures to assess the risks of material misstatement of the financial statements and financial highlights, whether due to error or fraud, and performing procedures that respond to those risks. Such procedures included examining, on a test basis, evidence regarding the amounts and disclosures in the financial statements and financial highlights. Our audits also included evaluating the accounting principles used and significant estimates made by management, as well as evaluating the overall presentation of the financial statements and financial highlights. Our procedures included confirmation of securities owned as of December 31, 2017, by correspondence with the custodian and brokers. We believe that our audits provide a reasonable basis for our opinion.
DELOITTE & TOUCHE LLP
Boston, Massachusetts
February 15, 2018
We have served as the auditor of one or more of the MFS investment companies since 1924.
23
MFS Inflation-Adjusted Bond Portfolio
TRUSTEES AND OFFICERS – IDENTIFICATION AND BACKGROUND
The Trustees and Officers of the Trust, as of February 1, 2018, are listed below, together with their principal occupations during the past five years. (Their titles may have varied during that period.) The address of each Trustee and Officer is 111 Huntington Avenue, Boston, Massachusetts 02199-7618.
| | | | | | | | | | |
Name, Age | | Position(s)
Held with Fund | | Trustee/Officer
Since (h) | | Number of
MFS Funds
overseen by the
Trustee | | Principal Occupations
During the Past Five Years | | Other Directorships
During the Past Five Years (j) |
| INTERESTED TRUSTEES |
Robert J. Manning (k) (age 54) | | Trustee | | February 2004 | | 137 | | Massachusetts Financial Services Company, Executive Chairman (since January 2017); Director; Chairman of the Board; Chief Executive Officer (until 2015); Co-Chief Executive Officer (2015-2016) | | N/A |
| | | | | |
Robin A. Stelmach (k) (age 56) | | Trustee | | January 2014 | | 137 | | Massachusetts Financial Services Company, Vice Chair (since January 2017); Chief Operating Officer and Executive Vice President (until January 2017) | | N/A |
| | | | |
| INDEPENDENT TRUSTEES | | | | | | | | |
John P. Kavanaugh (age 63) | | Trustee and Chair of Trustees | | January 2009 | | 137 | | Private investor | | N/A |
| | | | | |
Steven E. Buller (age 66) | | Trustee | | February 2014 | | 137 | | Financial Accounting Standards Advisory Council, Chairman (2014-2015); Public Company Accounting Oversight Board, Standing Advisory Group, Member (until 2014); BlackRock, Inc. (investment management), Managing Director (until 2014), BlackRock Finco UK (investment management), Director (until 2014) | | N/A |
| | | | | |
John A. Caroselli (age 63) | | Trustee | | March 2017 | | 137 | | JC Global Advisors, LLC (management consulting), President (since 2015); First Capital Corporation (commercial finance), Executive Vice President (until 2015) | | N/A |
| | | | | |
Maureen R. Goldfarb (age 62) | | Trustee | | January 2009 | | 137 | | Private investor | | N/A |
| | | | | |
Michael Hegarty (age 73) | | Trustee | | December 2004 | | 137 | | Private investor | | Rouse Properties Inc., Director (until 2016); Capmark Financial Group Inc., Director (until 2015) |
| | | | | |
Clarence Otis, Jr. (age 61) | | Trustee | | March 2017 | | 137 | | Darden Restaurants, Inc., Chief Executive Officer (until 2014) | | VF Corporation, Director; Verizon Communications, Inc., Director; The Travelers Companies, Director; Federal Reserve Bank of Atlanta, Director (until 2015) |
| | | | | |
Maryanne L. Roepke (age 61) | | Trustee | | May 2014 | | 137 | | American Century Investments (investment management), Senior Vice President and Chief Compliance Officer (until 2014) | | N/A |
| | | | | |
Laurie J. Thomsen (age 60) | | Trustee | | March 2005 | | 137 | | Private investor | | The Travelers Companies, Director; Dycom Industries, Inc., Director (since 2015) |
24
MFS Inflation-Adjusted Bond Portfolio
Trustees and Officers – continued
| | | | | | | | |
Name, Age | | Position(s)
Held with Fund | | Trustee/Officer
Since (h) | | Number of
MFS Funds
for which the
Person is an
Officer | | Principal Occupations During the Past Five Years |
| OFFICERS | | | | | | | | |
Christopher R. Bohane (k) (age 44) | | Assistant Secretary and Assistant Clerk | | July 2005 | | 137 | | Massachusetts Financial Services Company, Vice President and Assistant General Counsel |
| | | | |
Kino Clark (k) (age 49) | | Assistant Treasurer | | January 2012 | | 137 | | Massachusetts Financial Services Company, Vice President |
| | | | |
John W. Clark, Jr. (k) (age 50) | | Assistant Treasurer | | April 2017 | | 137 | | Massachusetts Financial Services Company, Vice President (since March 2017); Deutsche Bank (financial services), Department Head – Treasurer’s Office (until February 2017) |
| | | | |
Thomas H. Connors (k) (age 58) | | Assistant Secretary and Assistant Clerk | | September 2012 | | 137 | | Massachusetts Financial Services Company, Vice President and Senior Counsel |
| | | | |
Ethan D. Corey (k) (age 54) | | Assistant Secretary and Assistant Clerk | | July 2005 | | 137 | | Massachusetts Financial Services Company, Senior Vice President and Associate General Counsel |
| | | | |
David L. DiLorenzo (k) (age 49) | | President | | July 2005 | | 137 | | Massachusetts Financial Services Company, Senior Vice President |
| | | | |
Heidi W. Hardin (k) (age 50) | | Secretary and Clerk | | April 2017 | | 137 | | Massachusetts Financial Services Company, Executive Vice President and General Counsel (since March 2017); Harris Associates (investment management), General Counsel (from September 2015 to January 2017); Janus Capital Management LLC (investment management), Senior Vice President and General Counsel (until September 2015) |
| | | | |
Brian E. Langenfeld (k) (age 44) | | Assistant Secretary and Assistant Clerk | | June 2006 | | 137 | | Massachusetts Financial Services Company, Vice President and Senior Counsel |
| | | | |
Susan A. Pereira (k) (age 47) | | Assistant Secretary and Assistant Clerk | | July 2005 | | 137 | | Massachusetts Financial Services Company, Vice President and Senior Counsel |
| | | | |
Kasey L. Phillips (k) (age 47) | | Assistant Treasurer | | September 2012 | | 137 | | Massachusetts Financial Services Company, Vice President |
| | | | |
Matthew A. Stowe (k) (age 43) | | Assistant Secretary and Assistant Clerk | | October 2014 | | 137 | | Massachusetts Financial Services Company, Vice President and Assistant General Counsel |
| | | | |
Frank L. Tarantino (age 73) | | Independent Senior Officer | | June 2004 | | 137 | | Tarantino LLC (provider of compliance services), Principal |
| | | | |
Richard S. Weitzel (k) (age 47) | | Assistant Secretary and Assistant Clerk | | October 2007 | | 137 | | Massachusetts Financial Services Company, Senior Vice President and Associate General Counsel |
| | | | |
Martin J. Wolin (k) (age 50) | | Chief Compliance Officer | | July 2015 | | 137 | | Massachusetts Financial Services Company, Senior Vice President and Chief Compliance Officer (since July 2015); Mercer (financial service provider), Chief Risk and Compliance Officer, North America and Latin America (until June 2015) |
| | | | |
James O. Yost (k) (age 57) | | Treasurer | | September 1990 | | 137 | | Massachusetts Financial Services Company, Senior Vice President |
| (h) | Date first appointed to serve as Trustee/officer of an MFS Fund. Each Trustee has served continuously since appointment unless indicated otherwise. For the period from December 15, 2004 until February 22, 2005, Mr. Manning served as Advisory Trustee. Prior to January 2012, Messrs. DiLorenzo and Yost served as Assistant Treasurers of the Funds. From January 2012 through December 2016, Messrs. DiLorenzo and Yost served as Treasurer and Deputy Treasurer of the Funds, respectively. |
| (j) | Directorships or trusteeships of companies required to report to the Securities and Exchange Commission (i.e., “public companies”). |
| (k) | “Interested person” of the Trust within the meaning of the Investment Company Act of 1940 (referred to as the 1940 Act), which is the principal federal law governing investment companies like the fund, as a result of a position with MFS. The address of MFS is 111 Huntington Avenue, Boston, Massachusetts 02199-7618. |
25
MFS Inflation-Adjusted Bond Portfolio
Trustees and Officers – continued
Each Trustee has been elected by shareholders and each Trustee and officer holds office until his or her successor is chosen and qualified or until his or her earlier death, resignation, retirement or removal. The Trust does not hold annual meetings for the purpose of electing Trustees, and Trustees are not elected for fixed terms. Under the terms of the Board’s retirement policy, an Independent Trustee shall retire at the end of the calendar year in which he or she reaches the earlier of 75 years of age or 15 years of service on the Board (or, in the case of any Independent Trustee who joined the Board prior to 2015, 20 years of service on the Board).
Messrs. Buller and Otis and Ms. Roepke are members of the Trust’s Audit Committee.
Each of the Interested Trustees and certain Officers hold comparable officer positions with certain affiliates of MFS.
The Statement of Additional Information for a Fund includes further information about the Trustees and is available without charge upon request by calling 1-800-225-2606.
| | |
Investment Adviser Massachusetts Financial Services Company 111 Huntington Avenue Boston, MA 02199-7618 | | Custodian State Street Bank and Trust Company 1 Lincoln Street Boston, MA 02111-2900 |
Distributor MFS Fund Distributors, Inc. 111 Huntington Avenue Boston, MA 02199-7618 | | Independent Registered Public Accounting Firm Deloitte & Touche LLP 200 Berkeley Street Boston, MA 02116 |
Portfolio Manager(s) Erik Weisman | | |
26
MFS Inflation-Adjusted Bond Portfolio
BOARD REVIEW OF INVESTMENT ADVISORY AGREEMENT
The Investment Company Act of 1940 requires that both the full Board of Trustees and a majority of the non-interested (“independent”) Trustees, voting separately, annually approve the continuation of the Fund’s investment advisory agreement with MFS. The Trustees consider matters bearing on the Fund and its advisory arrangements at their meetings throughout the year, including a review of performance data at each regular meeting. In addition, the independent Trustees met several times over the course of three months beginning in May and ending in July, 2017 (“contract review meetings”) for the specific purpose of considering whether to approve the continuation of the investment advisory agreement for the Fund and the other investment companies that the Board oversees (the “MFS Funds”). The independent Trustees were assisted in their evaluation of the Fund’s investment advisory agreement by independent legal counsel, from whom they received separate legal advice and with whom they met separately from MFS during various contract review meetings. The independent Trustees were also assisted in this process by the MFS Funds’ Independent Senior Officer, a senior officer appointed by and reporting to the independent Trustees.
In connection with their deliberations regarding the continuation of the investment advisory agreement, the Trustees, including the independent Trustees, considered such information and factors as they believed, in light of the legal advice furnished to them and their own business judgment, to be relevant. The investment advisory agreement for the Fund was considered separately, although the Trustees also took into account the common interests of all MFS Funds in their review. As described below, the Trustees considered the nature, quality, and extent of the various investment advisory, administrative, and shareholder services performed by MFS under the existing investment advisory agreement and other arrangements with the Fund.
In connection with their contract review meetings, the Trustees received and relied upon materials that included, among other items: (i) information provided by Broadridge Financial Solutions, Inc. (“Broadridge”), an independent third party, on the investment performance of the Fund for various time periods ended December 31, 2016 and the investment performance of a group of funds with substantially similar investment classifications/objectives (the “Lipper performance universe”), (ii) information provided by Broadridge on the Fund’s advisory fees and other expenses and the advisory fees and other expenses of comparable funds identified by Broadridge (the “Broadridge expense group”), (iii) information provided by MFS on the advisory fees of portfolios of other clients of MFS, including institutional separate accounts and other clients, (iv) information as to whether and to what extent applicable expense waivers, reimbursements or fee “breakpoints” are observed for the Fund, (v) information regarding MFS’ financial results and financial condition, including MFS’ and certain of its affiliates’ estimated profitability from services performed for the Fund and the MFS Funds as a whole, and compared to MFS’ institutional business, (vi) MFS’ views regarding the outlook for the mutual fund industry and the strategic business plans of MFS, (vii) descriptions of various functions performed by MFS for the Funds, such as compliance monitoring and portfolio trading practices, and (viii) information regarding the overall organization of MFS, including information about MFS’ senior management and other personnel providing investment advisory, administrative and other services to the Fund and the other MFS Funds. The comparative performance, fee and expense information prepared and provided by Broadridge was not independently verified and the independent Trustees did not independently verify any information provided to them by MFS.
The Trustees’ conclusion as to the continuation of the investment advisory agreement was based on a comprehensive consideration of all information provided to the Trustees and not the result of any single factor. Some of the factors that figured particularly in the Trustees’ deliberations are described below, although individual Trustees may have evaluated the information presented differently from one another, giving different weights to various factors. It is also important to recognize that the fee arrangements for the Fund and other MFS Funds are the result of years of review and discussion between the independent Trustees and MFS, that certain aspects of such arrangements may receive greater scrutiny in some years than in others, and that the Trustees’ conclusions may be based, in part, on their consideration of these same arrangements during the course of the year and in prior years.
Based on information provided by Broadridge and MFS, the Trustees reviewed the Fund’s total return investment performance as well as the performance of peer groups of funds over various time periods. The Trustees placed particular emphasis on the total return performance of the Fund’s Initial Class shares in comparison to the performance of funds in its Lipper performance universe over the three-year period ended December 31, 2016, which the Trustees believed was a long enough period to reflect differing market conditions. The total return performance of the Fund’s Initial Class shares was in the 5th quintile relative to the other funds in the universe for this three-year period (the 1st quintile being the best performers and the 5th quintile being the worst performers). The total return performance of the Fund’s Initial Class shares was in the 5th quintile for the one-year period and the 4th quintile for the five-year period ended December 31, 2016 relative to the Lipper performance universe. Because of the passage of time, these performance results may differ from the performance results for more recent periods, including those shown elsewhere in this report.
In the course of their deliberations, the Trustees took into account information provided by MFS in connection with the contract review meetings, as well as during investment review meetings conducted with portfolio management personnel during the course of the year regarding the Fund’s performance. The Trustees noted that the total return performance (Class A shares) of the Fund’s retail counterpart, MFS Inflation-Adjusted Bond Fund, which has substantially similar investment strategies, was in the 3rd quintile relative to the other Funds in its Lipper performance universe for the three-year period ended December 31, 2016. After reviewing
27
MFS Inflation-Adjusted Bond Portfolio
Board Review of Investment Advisory Agreement – continued
these and related factors, the Trustees concluded, within the context of their overall conclusions regarding the investment advisory agreement, that they were satisfied with MFS’ responses and efforts relating to investment performance.
In assessing the reasonableness of the Fund’s advisory fee, the Trustees considered, among other information, the Fund’s advisory fee and the total expense ratio of the Fund’s Initial Class shares as a percentage of average daily net assets and the advisory fee and total expense ratios of peer groups of funds based on information provided by Broadridge. The Trustees considered that, according to the data provided by Broadridge (which takes into account any fee reductions or expense limitations that were in effect during the Fund’s last fiscal year), the Fund’s effective advisory fee rate and total expense ratio were each approximately at the Broadridge expense group median.
The Trustees also considered the advisory fees charged by MFS to any institutional separate accounts advised by MFS (“separate accounts”) and unaffiliated investment companies for which MFS serves as subadviser (“subadvised funds”) that have comparable investment strategies to the Fund, if any. In comparing these fees, the Trustees considered information provided by MFS as to the generally broader scope of services provided by MFS to the Fund, as well as the more extensive regulatory burdens imposed on MFS in managing the Fund, in comparison to separate accounts and subadvised funds. The Trustees also considered the higher demands placed on MFS’ investment personnel and trading infrastructure as a result of the daily cash in-flows and out-flows of the Fund in comparison to separate accounts.
The Trustees also considered whether the Fund may benefit from any economies of scale in the management of the Fund in the event of growth in assets of the Fund and/or growth in assets of the MFS Funds as a whole. They noted that the Fund’s advisory fee rate schedule is not subject to any breakpoints. Taking into account that the Fund’s effective advisory fee rate was approximately at the Broadridge expense group median described above, the Trustees determined not to recommend any advisory fee breakpoints for the Fund at this time. The Trustees also noted that MFS has agreed in writing to waive a portion of the management fees of certain MFS Funds, including the Fund, if the total combined assets of certain funds within the MFS Funds’ complex increase above agreed upon thresholds (the “group fee waiver”), enabling the Fund’s shareholders to share in the benefits from any economies of scale at the complex level. The group fee waiver is reviewed and renewed annually between the Board and MFS. The Trustees concluded that the group fee waiver was sufficient to allow the Fund to benefit from economies of scale as its assets and overall complex assets grow.
The Trustees also considered information prepared by MFS relating to MFS’ costs and profits with respect to the Fund, the MFS Funds considered as a group, and other investment companies and accounts advised by MFS, as well as MFS’ methodologies used to determine and allocate its costs to the MFS Funds, the Fund and other accounts and products for purposes of estimating profitability.
After reviewing these and other factors described herein, the Trustees concluded, within the context of their overall conclusions regarding the investment advisory agreement, that the advisory fees charged to the Fund represent reasonable compensation in light of the services being provided by MFS to the Fund.
In addition, the Trustees considered MFS’ resources and related efforts to continue to retain, attract and motivate capable personnel to serve the Fund. The Trustees also considered current and developing conditions in the financial services industry, including the presence of large and well-capitalized companies which are spending, and appear to be prepared to continue to spend, substantial sums to engage personnel and to provide services to competing investment companies. In this regard, the Trustees also considered the financial resources of MFS and its ultimate parent, Sun Life Financial Inc. The Trustees also considered the advantages and possible disadvantages to the Fund of having an adviser that also serves other investment companies as well as other accounts.
The Trustees also considered the nature, quality, cost, and extent of administrative, transfer agency, and distribution services provided to the Fund by MFS and its affiliates under agreements and plans other than the investment advisory agreement, including any 12b-1 fees the Fund pays to MFS Fund Distributors, Inc., an affiliate of MFS. The Trustees also considered the nature, extent and quality of certain other services MFS performs or arranges for on the Fund’s behalf, which may include securities lending programs, directed expense payment programs, class action recovery programs, and MFS’ interaction with third-party service providers, principally custodians and sub-custodians. The Trustees concluded that the various non-advisory services provided by MFS and its affiliates on behalf of the Fund were satisfactory.
The Trustees also considered benefits to MFS from the use of the Fund’s portfolio brokerage commissions, if applicable, to pay for investment research and various other factors. Additionally, the Trustees considered so-called “fall-out benefits” to MFS such as reputational value derived from serving as investment manager to the Fund.
Based on their evaluation of factors that they deemed to be material, including those factors described above, the Board of Trustees, including the independent Trustees, concluded that the Fund’s investment advisory agreement with MFS should be continued for an additional one-year period, commencing August 1, 2017.
28
MFS Inflation-Adjusted Bond Portfolio
PROXY VOTING POLICIES AND INFORMATION
MFS votes proxies on behalf of the fund pursuant to proxy voting policies and procedures that are available without charge, upon request, by calling 1-800-225-2606, by visiting mfs.com/proxyvoting, or by visiting the SEC’s Web site at http://www.sec.gov.
Information regarding how the fund voted proxies relating to portfolio securities during the most recent twelve-month period ended June 30 is available by August 31 of each year without charge by visiting mfs.com/proxyvoting, or by visiting the SEC’s Web site at http://www.sec.gov.
QUARTERLY PORTFOLIO DISCLOSURE
The fund will file a complete schedule of portfolio holdings with the Securities and Exchange Commission (the Commission) for the first and third quarters of each fiscal year on Form N-Q. The fund’s Form N-Q is available on the EDGAR database on the Commission’s Internet Web site at http://www.sec.gov, and may be reviewed and copied at the:
Public Reference Room
Securities and Exchange Commission
100 F Street, NE, Room 1580
Washington, D.C. 20549
Information on the operation of the Public Reference Room may be obtained by calling the Commission at 1-800-SEC-0330. Copies of the fund’s Form N-Q also may be obtained, upon payment of a duplicating fee, by electronic request at the following e-mail address: publicinfo@sec.gov or by writing the Public Reference Section at the above address.
FURTHER INFORMATION
From time to time, MFS may post important information about the fund or the MFS funds on the MFS web site (mfs.com). This information is available at https://www.mfs.com/en-us/what-we-do/announcements.html or at mfs.com/vit3 by choosing the fund’s name.
INFORMATION ABOUT FUND CONTRACTS AND LEGAL CLAIMS
The fund has entered into contractual arrangements with an investment adviser, administrator, distributor, shareholder servicing agent, 529 program manager (if applicable), and custodian who each provide services to the fund. Unless expressly stated otherwise, shareholders are not parties to, or intended beneficiaries of these contractual arrangements, and these contractual arrangements are not intended to create any shareholder right to enforce them against the service providers or to seek any remedy under them against the service providers, either directly or on behalf of the fund.
Under the Trust’s By-Laws and Declaration of Trust, any claims asserted against or on behalf of the MFS Funds, including claims against Trustees and Officers, must be brought in state and federal courts located within the Commonwealth of Massachusetts.
29
rev. 3/16
| | | | |
| FACTS | | WHAT DOES MFS DO WITH YOUR
PERSONAL INFORMATION? | |  |
| | |
| Why? | | Financial companies choose how they share your personal information. Federal law gives consumers the right to limit some but not all sharing. Federal law also requires us to tell you how we collect, share, and protect your personal information. Please read this notice carefully to understand what we do. |
| | |
| What? | | The types of personal information we collect and share depend on the product or service you have with us. This information can include: • Social Security number and account balances • Account transactions and transaction history • Checking account information and wire transfer instructions When you are no longer our customer, we continue to share your information as described in this notice. |
| | |
| How? | | All financial companies need to share customers’ personal information to run their everyday business. In the section below, we list the reasons financial companies can share their customers’ personal information; the reasons MFS chooses to share; and whether you can limit this sharing. |
| | | | |
Reasons we can share your
personal information | | Does MFS share? | | Can you limit this
sharing? |
For our everyday business purposes – such as to process your transactions, maintain your account(s), respond to court orders and legal investigations, or report to credit bureaus | | Yes | | No |
For our marketing purposes – to offer our products and services to you | | No | | We don’t share |
| For joint marketing with other financial companies | | No | | We don’t share |
For our affiliates’ everyday business purposes – information about your transactions and experiences | | No | | We don’t share |
For our affiliates’ everyday business purposes – information about your creditworthiness | | No | | We don’t share |
| For nonaffiliates to market to you | | No | | We don’t share |
| | |
| Questions? | | Call 800-225-2606 or go to mfs.com. |
30
| | |
| Who we are |
| Who is providing this notice? | | MFS Funds, MFS Investment Management, MFS Institutional Advisors, Inc., and MFS Heritage Trust Company. |
| | |
| What we do |
| How does MFS protect my personal information? | | To protect your personal information from unauthorized access and use, we use security measures that comply with federal law. These measures include procedural, electronic, and physical safeguards for the protection of the personal information we collect about you. |
How does MFS
collect my personal information? | | We collect your personal information, for example, when you • open an account or provide account information • direct us to buy securities or direct us to sell your securities • make a wire transfer We also collect your personal information from others, such as credit bureaus, affiliates, or other companies. |
| Why can’t I limit all sharing? | | Federal law gives you the right to limit only • sharing for affiliates’ everyday business purposes – information about your creditworthiness • affiliates from using your information to market to you • sharing for nonaffiliates to market to you State laws and individual companies may give you additional rights to limit sharing. |
| | |
| Definitions |
| Affiliates | | Companies related by common ownership or control. They can be financial and nonfinancial companies. • MFS does not share personal information with affiliates, except for everyday business purposes as described on page one of this notice. |
| Nonaffiliates | | Companies not related by common ownership or control. They can be financial and nonfinancial companies. • MFS does not share with nonaffiliates so they can market to you. |
| Joint marketing | | A formal agreement between nonaffiliated financial companies that together market financial products or services to you. • MFS doesn’t jointly market. |
| | |
| Other important information |
| If you own an MFS product or receive an MFS service in the name of a third party such as a bank or broker-dealer, their privacy policy may apply to you instead of ours. |
31
ANNUAL REPORT
December 31, 2017

MFS® LIMITED MATURITY PORTFOLIO
MFS® Variable Insurance Trust III

VLT-ANN
MFS® LIMITED MATURITY PORTFOLIO
CONTENTS
The report is prepared for the general information of contract owners. It is authorized for distribution to prospective investors only when preceded or accompanied by a current prospectus.
NOT FDIC INSURED • MAY LOSE VALUE • NO BANK OR CREDIT UNION GUARANTEE • NOT A DEPOSIT • NOT INSURED BY ANY FEDERAL GOVERNMENT AGENCY OR NCUA/NCUSIF
MFS Limited Maturity Portfolio
LETTER FROM THE EXECUTIVE CHAIRMAN

Dear Contract Owners:
Rising bond yields have led to a measurable uptick in market volatility, which has been a departure from the low-volatility environment that prevailed for much of 2017. In spite of this, global markets remain elevated amid synchronized economic growth. Although the U.S. Federal Reserve continues to gradually raise interest rates and shrink its balance sheet, monetary policy remains accommodative around the world, with many central banks taking only tentative steps toward tighter policies. However, interest rates have begun to rise globally of late as investors anticipate that central policy shifts may be necessary in the months ahead.
Newly enacted U.S. tax reforms have been welcomed by equity markets while emerging market economies have been boosted by a weaker U.S. dollar. Around the world, inflation remains largely subdued but tight labor markets and solid global demand have investors on the lookout for its potential resurgence amid robust global trade and recovering commodity prices.
At MFS®, we believe having a disciplined, long-term investment approach through a full market cycle is essential to capturing the best opportunities while also managing risk. In our view, such a strategy, along with the professional guidance of a financial advisor, will help you reach your investment objectives.
Respectfully,

Robert J. Manning
Executive Chairman
MFS Investment Management
February 15, 2018
The opinions expressed in this letter are subject to change and may not be relied upon for investment advice. No forecasts can be guaranteed.
1
MFS Limited Maturity Portfolio
PORTFOLIO COMPOSITION
Portfolio structure (i)
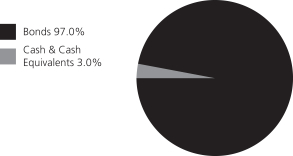
| | | | |
| Fixed income sectors (i) | | | | |
| Investment Grade Corporates | | | 56.3% | |
| Asset-Backed Securities | | | 10.8% | |
| Collateralized Debt Obligations | | | 9.5% | |
| U.S. Treasury Securities | | | 6.5% | |
| Emerging Markets Bonds | | | 3.1% | |
| Non-U.S. Government Bonds | | | 3.0% | |
| Commercial Mortgage-Backed Securities | | | 2.8% | |
| Mortgage-Backed Securities | | | 2.0% | |
| Residential Mortgage-Backed Securities | | | 1.2% | |
| U.S. Government Agencies | | | 0.8% | |
| Municipal Bonds | | | 0.6% | |
| High Yield Corporates | | | 0.4% | |
| | | | |
| Composition including fixed income credit quality (a)(i) | |
| AAA | | | 9.8% | |
| AA | | | 17.8% | |
| A | | | 31.3% | |
| BBB | | | 28.1% | |
| BB | | | 0.4% | |
| U.S. Government | | | 6.5% | |
| Federal Agencies | | | 2.8% | |
| Not Rated | | | 0.3% | |
| Cash & Cash Equivalents | | | 3.0% | |
| |
| Portfolio facts (i) | | | | |
| Average Duration (d) | | | 1.8 | |
| Average Effective Maturity (m) | | | 2.9 yrs. | |
| |
| Issuer country weightings (i)(x) | | | | |
| United States | | | 71.8% | |
| United Kingdom | | | 5.3% | |
| Canada | | | 3.5% | |
| France | | | 3.2% | |
| Japan | | | 2.8% | |
| Switzerland | | | 2.6% | |
| Netherlands | | | 2.1% | |
| Sweden | | | 1.5% | |
| Australia | | | 1.4% | |
| Other Countries | | | 5.8% | |
| (a) | | For all securities other than those specifically described below, ratings are assigned to underlying securities utilizing ratings from Moody’s, Fitch, and Standard & Poor’s rating agencies and applying the following hierarchy: If all three agencies provide a rating, the middle rating (after dropping the highest and lowest ratings) is assigned; if two of the three agencies rate a security, the lower of the two is assigned. Ratings are shown in the S&P and Fitch scale (e.g., AAA). Securities rated BBB or higher are considered investment grade. All ratings are subject to change. U.S. Government includes securities issued by the U.S. Department of the Treasury. Federal Agencies includes rated and unrated U.S. Agency fixed-income securities, U.S. Agency mortgage-backed securities, and collateralized mortgage obligations of U.S. Agency mortgage-backed securities. Not Rated includes fixed income securities, including fixed income futures contracts, which have not been rated by any rating agency. The fund may or may not have held all of these instruments on this date. The fund is not rated by these agencies. |
| (d) | | Duration is a measure of how much a bond’s price is likely to fluctuate with general changes in interest rates, e.g., if rates rise 1.00%, a bond with a 5-year duration is likely to lose about 5.00% of its value due to the interest rate move. |
| (i) | | For purposes of this presentation, the components include the value of securities, and reflect the impact of the equivalent exposure of derivative positions, if any. These amounts may be negative from time to time. Equivalent exposure is a calculated amount that translates the derivative position into a reasonable approximation of the amount of the underlying asset that the portfolio would have to hold at a given point in time to have the same price sensitivity that results from the portfolio’s ownership of the derivative contract. When dealing with derivatives, equivalent exposure is a more representative measure of the potential impact of a position on portfolio performance than value. The bond component will include any accrued interest amounts. |
| (m) | | In determining an instrument’s effective maturity for purposes of calculating the fund’s dollar-weighted average effective maturity, MFS uses the instrument’s stated maturity or, if applicable, an earlier date on which MFS believes it is probable that a maturity-shortening device (such as a put, pre-refunding or prepayment) will cause the instrument to be repaid. Such an earlier date can be substantially shorter than the instrument’s stated maturity. |
| (x) | | Represents the portfolio’s exposure to issuer countries as a percentage of a portfolio’s net assets. For purposes of this presentation, United States includes Cash & Cash Equivalents. |
Where the fund holds convertible bonds, they are treated as part of the equity portion of the portfolio.
Cash & Cash Equivalents includes any cash, investments in money market funds, short-term securities, and other assets less liabilities. Please see the Statement of Assets and Liabilities for additional information related to the fund’s cash position and other assets and liabilities.
Percentages are based on net assets as of December 31, 2017.
The portfolio is actively managed and current holdings may be different.
2
MFS Limited Maturity Portfolio
MANAGEMENT REVIEW
Summary of Results
For the twelve months ended December 31, 2017, Initial Class shares of the MFS Limited Maturity Portfolio (“fund”) provided a total return of 1.73%, while Service Class shares of the fund provided a total return of 1.45%. These compare with a return of 0.84% over the same period for the fund’s benchmark, the Bloomberg Barclays 1-3 Year U.S. Government/Credit Bond Index.
Market Environment
For the first time in many years, the global economy experienced a period of synchronized economic growth over the reporting period. The rebound in emerging markets (“EM”) economies was more pronounced (despite the slight deceleration in Chinese growth at the end of the period), helped by larger economies, such as Brazil and Russia, emerging from recessions. At the same time, developed markets (“DM”) economies continued to grow at or above potential. Market confidence increased in the US during the period fueled, in part, by a more lenient US regulatory backdrop and hopes for a significant cut in corporate tax rates, which came to fruition at the end of the period.
Globally, markets benefited from a reflation trade as commodity prices strengthened, activity and growth prospects improved, and inflation moved higher, though within moderate bounds. As a result, there were more tightening signals and actions by DM central banks. The US Federal Reserve increased interest rates by 25 basis points three times during the period, bringing the total number of quarter-percent hikes in the federal funds rate to five, since December 2015. The European Central Bank announced an extension of its quantitative easing program at the end of the period, but reduced the pace of its monthly asset purchases by half. In addition, the Bank of England hiked its base rate for the first time in a decade, late in the end of the period. Markets were comforted, along with central banks, by the decline in fears of a populist surge in Europe after establishment candidates won the Dutch and French elections, though a right-wing populist party gained seats in the German parliament for the first time in the post-World War II era. Additionally, European growth reflected a generally calmer political economic backdrop.
In recent months, the US dollar reversed the sharp rise seen early in the period, easing what had been a substantial headwind to earnings for multinationals. US consumer spending held up well during the second half of the period amid a modest increase in real wages and relatively low gasoline prices. However, demand for autos cooled from the record level logged early in the period, while the housing market improved, albeit constrained by below-average inventory levels. Global trade, which was sluggish early in the period, showed signs of improvement in the period’s second half, a positive indicator of global economic activity and prospects. Early in the period, there was a selloff in EM due to fears that President Trump would follow through on various campaign threats and promises that were judged to be detrimental to EM. While President Trump withdrew the US from the Trans-Pacific Partnership and began the renegotiation of the North American Free Trade Agreement, significant additional policy action was lacking on economic issues involving EM. As a result, EM resumed their upward trajectory, powered by strong inflows throughout 2017.
Factors Affecting Performance
During the reporting period, the fund’s overweight allocation to both the industrials and financial institutions sectors, and an out-of-benchmark exposure to the asset-backed securities (ABS) sector, contributed to performance relative to the Bloomberg Barclays 1-3 Year U.S. Government/Credit Bond Index. An underweight exposure to the treasury sector additionally aided relative returns. The fund’s yield curve (y) positioning, particularly a duration (d) overweight to the 5-year segment of the yield curve, benefited relative performance, as yields tightened in the second quarter. Additionally, security selection within the financial institutions and industrials sectors, as well as within “BBB” and “A” rated (r) securities, buoyed relative returns.
There were no factors that materially detracted from the fund’s relative performance during the reporting period.
Respectfully,
Portfolio Manager(s)
Philipp Burgener and Alexander Mackey
| (d) | Duration is a measure of how much a bond’s price is likely to fluctuate with general changes in interest rates, e.g., if rates rise 1.00%, a bond with a 5-year duration is likely to lose about 5.00% of its value. |
| (r) | Bonds rated “BBB”, “Baa”, or higher are considered investment grade; bonds rated “BB”, “Ba”, or below are considered non-investment grade. The source for bond quality ratings is Moody’s Investors Service, Standard & Poor’s and Fitch, Inc. and are applied using the following hierarchy: If all three agencies provide a rating, the middle rating (after dropping the highest and lowest ratings) is assigned; if two of the three agencies rate a security, the lower of the two is assigned. Ratings are shown in the S&P and Fitch scale (e.g., AAA). For securities which are not rated by any of the three agencies, the security is considered Not Rated. |
| (y) | A yield curve graphically depicts the yields of different maturity bonds of the same credit quality and type; a normal yield curve is upward sloping, with short-term rates lower than long-term rates. |
Note to Shareholders: Effective February 1, 2017, James Calmas was no longer a Portfolio Manager of the Fund. Effective February 1, 2017, Philipp Burgener and Alexander Mackey became Portfolio Managers of the Fund.
3
MFS Limited Maturity Portfolio
Management Review – continued
The views expressed in this report are those of the portfolio manager(s) only through the end of the period of the report as stated on the cover and do not necessarily reflect the views of MFS or any other person in the MFS organization. These views are subject to change at any time based on market or other conditions, and MFS disclaims any responsibility to update such views. These views may not be relied upon as investment advice or an indication of trading intent on behalf of any MFS portfolio. References to specific securities are not recommendations of such securities, and may not be representative of any MFS portfolio’s current or future investments.
4
MFS Limited Maturity Portfolio
PERFORMANCE SUMMARY THROUGH 12/31/17
The following chart illustrates the historical performance of the fund in comparison to its benchmark(s). Benchmarks are unmanaged and may not be invested in directly. Benchmark returns do not reflect any fees or expenses. The performance of other share classes will be greater than or less than that of the class depicted below. (See Notes to Performance Summary.)
Performance data shown represents past performance and is no guarantee of future results. Investment return and principal value fluctuate so your units, when sold, may be worth more or less than the original cost; current performance may be lower or higher than quoted. The performance shown does not reflect the deduction of taxes, if any, that a contract holder would pay on fund distributions or the redemption of contract units. The returns for the fund shown also do not reflect the deduction of expenses associated with variable products, such as mortality and expense risk charges, separate account charges, and sales charges imposed by the insurance company separate accounts. Such expenses would reduce the overall returns shown.
Growth of a Hypothetical $10,000 Investment (t)
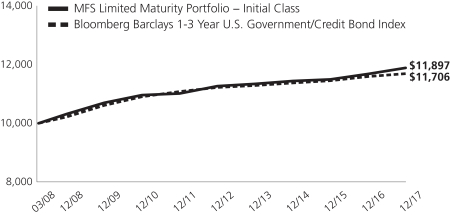
Total Returns through 12/31/17
Average annual total returns
| | | | | | | | | | | | |
| | | Share Class | | Class Inception Date | | 1-yr | | 5-yr | | Life (t) | | |
| | | Initial Class | | 3/07/08 | | 1.73% | | 1.08% | | 1.78% | | |
| | | Service Class | | 3/07/08 | | 1.45% | | 0.83% | | 1.52% | | |
| | | | |
| Comparative benchmark(s) | | | | | | | | |
| | | Bloomberg Barclays 1-3 Year U.S. Government/Credit Bond Index (f) | | 0.84% | | 0.84% | | 1.62% | | |
| (f) | Source: FactSet Research Systems Inc. |
| (t) | For the period from the class inception date through the stated period end. (See Notes to Performance Summary.) |
Benchmark Definition(s)
Bloomberg Barclays 1-3 Year U.S. Government/Credit Bond Index – a market capitalization-weighted index that measures the performance of the short-term (1 to 3 years) investment-grade corporate and U.S. government bond markets.
It is not possible to invest directly in an index.
Notes to Performance Summary
Average annual total return represents the average annual change in value for each share class for the periods presented. Life returns are presented where the share class has less than 10 years of performance history and represent the average annual total return from the class inception date to the stated period end date.
Performance results reflect any applicable expense subsidies and waivers in effect during the periods shown. Without such subsidies and waivers the fund’s performance results would be less favorable. Please see the prospectus and financial statements for complete details. All results are historical and assume the reinvestment of any dividends and capital gains distributions.
Performance prior to close of business December 7, 2012, reflects time periods when another adviser or subadviser was responsible for selecting investments for the fund under a different investment objective and different investment strategies.
5
MFS Limited Maturity Portfolio
Performance Summary – continued
Performance results do not include adjustments made for financial reporting purposes in accordance with U.S. generally accepted accounting principles and may differ from amounts reported in the financial highlights.
From time to time the fund may receive proceeds from litigation settlements, without which performance would be lower.
6
MFS Limited Maturity Portfolio
EXPENSE TABLE
Fund Expenses Borne by the Contract Holders during the Period, July 1, 2017 through December 31, 2017
As a contract holder of the fund, you incur ongoing costs, including management fees; distribution and/or service (12b-1) fees; and other fund expenses. This example is intended to help you understand your ongoing costs (in dollars) of investing in the fund and to compare these costs with the ongoing costs of investing in other mutual funds.
The example is based on an investment of $1,000 invested at the beginning of the period and held for the entire period July 1, 2017 through December 31, 2017.
Actual Expenses
The first line for each share class in the following table provides information about actual account values and actual expenses. You may use the information in this line, together with the amount you invested, to estimate the expenses that you paid over the period. Simply divide your account value by $1,000 (for example, an $8,600 account value divided by $1,000 = 8.6), then multiply the result by the number in the first line under the heading entitled “Expenses Paid During Period” to estimate the expenses you paid on your account during this period.
Hypothetical Example for Comparison Purposes
The second line for each share class in the following table provides information about hypothetical account values and hypothetical expenses based on the fund’s actual expense ratio and an assumed rate of return of 5% per year before expenses, which is not the fund’s actual return. The hypothetical account values and expenses may not be used to estimate the actual ending account balance or expenses you paid for the period. You may use this information to compare the ongoing costs of investing in the fund and other funds. To do so, compare this 5% hypothetical example with the 5% hypothetical examples that appear in the shareholder reports of the other funds.
Please note that the expenses shown in the table are meant to highlight the fund’s ongoing costs only and do not take into account the fees and expenses imposed under the variable contracts through which your investment in the fund is made. Therefore, the second line for each share class in the table is useful in comparing ongoing costs associated with an investment in vehicles (such as the fund) which fund benefits under variable annuity and variable life insurance contracts and to qualified pension and retirement plans only, and will not help you determine the relative total costs of investing in the fund through variable annuity and variable life insurance contracts. If the fees and expenses imposed under the variable contracts were included, your costs would have been higher.
| | | | | | | | | | | | | | | | | | |
| Share Class | | | | Annualized
Expense Ratio | | | Beginning
Account Value
7/01/17 | | | Ending Account Value
12/31/17 | | | Expenses Paid
During Period (p)
7/01/17-12/31/17 | |
| Initial Class | | Actual | | | 0.45% | | | | $1,000.00 | | | | $1,005.43 | | | | $2.27 | |
| | Hypothetical (h) | | | 0.45% | | | | $1,000.00 | | | | $1,022.94 | | | | $2.29 | |
| Service Class | | Actual | | | 0.70% | | | | $1,000.00 | | | | $1,003.60 | | | | $3.54 | |
| | Hypothetical (h) | | | 0.70% | | | | $1,000.00 | | | | $1,021.68 | | | | $3.57 | |
| (h) | 5% class return per year before expenses. |
| (p) | “Expenses Paid During Period” are equal to each class’s annualized expense ratio, as shown above, multiplied by the average account value over the period, multiplied by 184/365 (to reflect the one-half year period). |
7
MFS Limited Maturity Portfolio
PORTFOLIO OF INVESTMENTS – 12/31/17
The Portfolio of Investments is a complete list of all securities owned by your fund. It is categorized by broad-based asset classes.
| | | | | | | | |
| Issuer | | Shares/Par | | | Value ($) | |
| BONDS – 96.5% | | | | | | | | |
| Asset-Backed & Securitized – 24.2% | | | | | | | | |
| A Voce CLO Ltd., 2014-1A, “A2R”, FLR, 2.909% (U.S. LIBOR-3mo. + 1.55%), 7/15/2026 (n) | | $ | 1,735,000 | | | $ | 1,737,707 | |
| A Voce CLO Ltd., 2014-1A, “BR”, FLR, 3.509% (U.S. LIBOR-3mo. + 2.15%), 7/15/2026 (n) | | | 2,276,000 | | | | 2,279,305 | |
| AIMCO Properties CLO LP, 2014-AA, “B1R”, FLR, 2.962% (U.S. LIBOR-3mo. + 1.6%), 7/20/2026 (n) | | | 1,715,000 | | | | 1,716,067 | |
| AIMCO Properties CLO LP, 2014-AA, “B2R”, 3.49%, 7/20/2026 (n) | | | 545,000 | | | | 545,531 | |
| AmeriCredit Automobile Receivables Trust, 2016-3, “A2A”, 1.37%, 11/08/2019 | | | 340,682 | | | | 340,535 | |
| AmeriCredit Automobile Receivables Trust, 2017-2, “C”, 2.97%, 3/20/2023 | | | 1,837,000 | | | | 1,846,457 | |
| Ares CLO Ltd., 2013-3A, “B1R”, FLR, 2.853% (U.S. LIBOR-3mo. + 1.5%), 10/17/2024 (n) | | | 2,162,000 | | | | 2,160,584 | |
| ARI Fleet Lease Trust, 2016-A, “A2”, 1.82%, 7/15/2024 (n) | | | 807,285 | | | | 806,896 | |
| Atrium CDO Corp., 2010-A, “B1R”, FLR, 2.809% (U.S. LIBOR-3mo. + 1.45%), 7/16/2025 (n) | | | 2,575,000 | | | | 2,572,829 | |
| Atrium CDO Corp., 2011-A, “BR”, FLR, 2.862% (U.S. LIBOR-3mo. + 1.5%), 10/23/2025 (n) | | | 1,735,000 | | | | 1,734,344 | |
| Avery Point CLO Ltd., 2014-1A, “CR”, FLR, 3.717% (U.S. LIBOR-3mo. + 2.35%), 4/25/2026 (n) | | | 1,720,000 | | | | 1,733,743 | |
| Babson CLO Ltd., 2013-IIA, “A2R”, FLR, 2.903% (U.S. LIBOR-3mo. + 1.55%), 1/18/2025 (n) | | | 1,488,327 | | | | 1,491,240 | |
| Babson CLO Ltd., 2013-IIA, “BR”, FLR, 2.853% (U.S. LIBOR-3mo. + 1.5%), 10/17/2026 (n) | | | 2,609,000 | | | | 2,606,782 | |
| Babson CLO Ltd., 2013-IIA, “BR”, FLR, 3.603% (U.S. LIBOR-3mo. + 2.25%), 1/18/2025 (n) | | | 1,488,327 | | | | 1,485,708 | |
| Ballyrock Ltd., 2014-1A, “A2R”, FLR, 3.062% (U.S. LIBOR-3mo. + 1.7%), 10/20/2026 (n) | | | 1,724,000 | | | | 1,723,998 | |
| Ballyrock Ltd., 2014-1A, “BR”, FLR, 3.462% (U.S. LIBOR-3mo. + 2.1%), 10/20/2026 (n) | | | 730,000 | | | | 729,999 | |
| Capital One Multi-Asset Execution Trust, 2016-A4, “A4”, 1.33%, 6/15/2022 | | | 4,180,000 | | | | 4,128,089 | |
| CD Commercial Mortgage Trust, 2017-CD4, “XA”, 1.327%, 5/10/2050 (i) | | | 17,708,009 | | | | 1,594,712 | |
| Cent CLO LP, 2014-21A, “A2AR”, FLR, 3.074% (U.S. LIBOR-3mo. + 1.7%), 7/27/2026 (n) | | | 1,060,053 | | | | 1,066,009 | |
| | | | | | | | |
| Issuer | | Shares/Par | | | Value ($) | |
| BONDS – continued | | | | | | | | |
| Asset-Backed & Securitized – continued | | | | | |
| Cent CLO LP, 2014-21A, “BR”, FLR, 3.774% (U.S. LIBOR-3mo. + 2.4%), 7/27/2026 (n) | | $ | 1,439,531 | | | $ | 1,437,303 | |
| Chesapeake Funding II LLC, 2016-1A, “A2”, FLR, 2.627% (U.S. LIBOR-1mo. + 1.15%), 3/15/2028 (n) | | | 1,108,691 | | | | 1,113,636 | |
| Chesapeake Funding II LLC, 2017-2A, “B”, 2.81%, 5/15/2029 (n) | | | 1,200,000 | | | | 1,207,170 | |
| Chesapeake Funding II LLC, 2017-2A, “C”, 3.01%, 5/15/2029 (n) | | | 536,000 | | | | 537,945 | |
| Chesapeake Funding II LLC, 2017-3A, “B”, 2.57%, 8/15/2029 (n) | | | 869,000 | | | | 867,862 | |
| Chesapeake Funding II LLC, 2017-4A, “C”, 2.76%, 11/15/2029 (n) | | | 438,000 | | | | 435,050 | |
| Chrysler Capital Auto Receivables Trust 2016-B, “A2”, 1.36%, 1/15/2020 (n) | | | 441,104 | | | | 440,593 | |
| Colony Starwood Homes, 2016-2A, “A”, FLR, 2.727% (LIBOR-1mo. + 1.25%), 12/17/2033 (n) | | | 2,517,848 | | | | 2,532,702 | |
| CPS Auto Trust, 2016-D, “B”, 2.11%, 3/15/2021 (n) | | | 2,062,000 | | | | 2,052,330 | |
| CPS Auto Trust, 2017-C, “C”, 2.86%, 6/15/2023 (n) | | | 1,340,000 | | | | 1,328,998 | |
| Credit Acceptance Auto Loan Trust, 2015-2A, “A”, 2.4%, 2/15/2023 (n) | | | 1,629,479 | | | | 1,631,087 | |
| Credit Acceptance Auto Loan Trust, 2016-3A, “A”, 2.15%, 4/15/2024 (n) | | | 2,525,000 | | | | 2,514,158 | |
| Credit Acceptance Auto Loan Trust, 2017-2A, “B”, 3.02%, 4/15/2026 (n) | | | 2,607,000 | | | | 2,580,510 | |
| Dell Equipment Finance Trust, 2017-2, “B”, 2.47%, 10/24/2022 (n) | | | 692,000 | | | | 687,871 | |
| DLL Securitization Trust, 2017-A, “A3”, 2.14%, 12/15/2021 (n) | | | 868,000 | | | | 863,559 | |
| Drive Auto Receivables Trust, 2016-CA, “A3”, 1.67%, 11/15/2019 (n) | | | 657,202 | | | | 657,116 | |
| Drive Auto Receivables Trust, 2017-1, “B”, 2.36%, 3/15/2021 | | | 846,000 | | | | 846,756 | |
| Dryden Senior Loan Fund, 2014-31A, “CR”, FLR, 3.453% (LIBOR-3mo. + 2.1%), 4/18/2026 (n) | | | 790,000 | | | | 788,710 | |
| Dryden Senior Loan Fund, 2014-34A, “BR”, FLR, 2.909% (LIBOR-3mo. + 1.55%), 10/15/2026 (n) | | | 1,064,000 | | | | 1,063,296 | |
| Dryden Senior Loan Fund, 2014-34A, “CR”, CLO, FLR, 3.509% (LIBOR-3mo. + 2.15%), 10/15/2026 (n) | | | 1,364,684 | | | | 1,372,445 | |
| DT Auto Owner Trust, 2017-2A, “C”, 3.03%, 1/17/2023 (n) | | | 2,017,000 | | | | 2,017,190 | |
| DT Auto Owner Trust, 2017-3A, “C”, 3.01%, 5/15/2023 (n) | | | 1,461,000 | | | | 1,463,166 | |
| Eaton Vance CLO Ltd., 2014-1A, “BR”, FLR, 2.959% (U.S. LIBOR-3mo. + 1.6%), 7/15/2026 (n) | | | 1,284,737 | | | | 1,283,606 | |
8
MFS Limited Maturity Portfolio
Portfolio of Investments – continued
| | | | | | | | |
| Issuer | | Shares/Par | | | Value ($) | |
| BONDS – continued | | | | | | | | |
| Asset-Backed & Securitized – continued | | | | | |
| Eaton Vance CLO Ltd., 2014-1A, “CR”, FLR, 3.609% (U.S. LIBOR-3mo. + 2.25%), 7/15/2026 (n) | | $ | 2,569,474 | | | $ | 2,564,962 | |
| Enterprise Fleet Financing LLC, 1.74%, 2/22/2022 (n) | | | 1,059,360 | | | | 1,057,252 | |
| Exeter Automobile Receivables Trust, 2016-1A, “A”, 2.35%, 7/15/2020 (n) | | | 100,688 | | | | 100,756 | |
| Exeter Automobile Receivables Trust, 2016-3A, “A”, 1.84%, 11/16/2020 (n) | | | 1,058,633 | | | | 1,057,414 | |
| Exeter Automobile Receivables Trust, 2017-1A, “A”, 1.96%, 3/15/2021 (n) | | | 546,500 | | | | 545,998 | |
| Flagship Credit Auto Trust, 2016-1, “A”, 2.77%, 12/15/2020 (n) | | | 666,616 | | | | 669,244 | |
| Ford Credit Auto Owner Trust, 2014-1, “A”, 2.26%, 11/15/2025 (n) | | | 1,104,000 | | | | 1,106,238 | |
| Ford Credit Auto Owner Trust, 2014-2, “A”, 2.31%, 4/15/2026 (n) | | | 3,515,000 | | | | 3,520,082 | |
| GMF Floorplan Owner Revolving Trust, 2017-A1, “A”, 2.22%, 1/18/2022 (n) | | | 1,730,000 | | | | 1,725,223 | |
| GS Mortgage Securities Trust, 2010-C1, “A2”, 4.592%, 8/10/2043 (n) | | | 2,890,000 | | | | 3,012,464 | |
| GS Mortgage Securities Trust, 2017-GS6, “XA”, 1.051%, 5/10/2050 (i) | | | 15,883,248 | | | | 1,280,149 | |
| GS Mortgage Securities Trust, 2017-GS7, “XA”, 1.141%, 8/10/2050 (i) | | | 15,850,002 | | | | 1,328,289 | |
| HarbourView CLO VII Ltd., “B1R”, FLR, 3.085% (U.S. LIBOR-3mo. + 1.65%), 11/18/2026 (n) | | | 2,716,743 | | | | 2,715,616 | |
| HarbourView CLO VII Ltd., 7A, “CR”, FLR, 3.815% (U.S. LIBOR-3mo. + 2.38%), 11/18/2026 (n) | | | 1,759,743 | | | | 1,757,661 | |
| Hertz Fleet Lease Funding LP, 2016-1, “A2”, 1.96%, 4/10/2030 (n) | | | 1,170,170 | | | | 1,169,956 | |
| Invitation Homes Trust, 2017-SFR2, “A”, FLR, 2.34% (LIBOR-1mo. + 1.00%), 12/17/2036 (n) | | | 2,798,258 | | | | 2,807,239 | |
| JPMorgan Chase Commercial Mortgage Securities Corp., 1.093%, 9/15/2050 (i) | | | 33,041,694 | | | | 2,484,002 | |
| JPMorgan Chase Commercial Mortgage Securities Corp., 2011-C3, “A4”, 4.717%, 2/15/2046 (n) | | | 2,755,372 | | | | 2,904,739 | |
| Loomis, Sayles & Co., CLO, “A1”, FLR, 2.889% (U.S. LIBOR-3mo. + 1.53%), 10/15/2027 (n) | | | 1,619,932 | | | | 1,629,067 | |
| Madison Park Funding XIV Ltd., 2014-14A, “C1R”, FLR, 3.412% (U.S. LIBOR-3mo. + 2.05%), 7/20/2026 (n) | | | 2,418,000 | | | | 2,429,558 | |
| Magnetite XI Ltd., 2014-11A, “BR”, FLR, 3.453% (U.S. LIBOR-3mo. + 2.1%), 1/18/2027 (n) | | | 1,204,000 | | | | 1,210,296 | |
| Morgan Stanley Bank of America Merrill Lynch Trust, 2017-C33, “XA”, 1.447%, 5/15/2050 (i) | | | 17,543,798 | | | | 1,575,568 | |
| Morgan Stanley Capital I Trust, 2017-H1, “XA”, 1.46%, 6/15/2050 (i) | | | 7,897,426 | | | | 747,750 | |
| | | | | | | | |
| Issuer | | Shares/Par | | | Value ($) | |
| BONDS – continued | | | | | | | | |
| Asset-Backed & Securitized – continued | | | | | |
| Mountain Hawk CLO Ltd., 2014-3A, “BR”, FLR, 3.153% (U.S. LIBOR-3mo. + 1.8%), 4/18/2025 (n) | | $ | 3,468,000 | | | $ | 3,473,837 | |
| Nationstar HECM Loan Trust, 2016-2A, “A”, 2.239%, 6/25/2026 (n) | | | 226,092 | | | | 225,668 | |
| Navient Student Loan Trust, 2016-3A, “A1”, FLR, 2.152% (U.S. LIBOR-1mo. + 0.6%), 6/25/2065 (n) | | | 396,982 | | | | 397,715 | |
| NextGear Floorplan Master Owner Trust, 2017-1A, “A2”, 2.54%, 4/18/2022 (n) | | | 1,378,000 | | | | 1,374,420 | |
| NextGear Floorplan Master Owner Trust, 2017-2A, “B”, 3.02%, 10/17/2022 (n) | | | 1,038,000 | | | | 1,031,273 | |
| Oaktree CLO Ltd., 2014-2A, “BR”, FLR, 3.912% (U.S. LIBOR-3mo. + 2.55%), 10/20/2026 (n) | | | 1,752,000 | | | | 1,758,468 | |
| OneMain Direct Auto Receivables Trust, 2016-1A, “A”, 2.04%, 1/15/2021 (n) | | | 196,804 | | | | 196,871 | |
| OneMain Financial Issuance Trust, 2017-1A, “A1”, 2.37%, 9/14/2032 (n) | | | 2,089,000 | | | | 2,070,095 | |
| Oscar U.S. Funding Trust, 2016-2A, “A”, 2.31%, 11/15/2019 (n) | | | 409,884 | | | | 409,467 | |
| Oscar U.S. Funding Trust, 2017-1A, “A3”, 2.82%, 6/10/2021 (n) | | | 1,980,000 | | | | 1,979,083 | |
| Oscar U.S. Funding Trust, 2017-2A, “A2B”, FLR, 2.081% (U.S. LIBOR-1mo. + 6.5%), 11/10/2020 (n) | | | 1,420,000 | | | | 1,420,214 | |
| PFS Financing Corp., 2017-C, “A”, FLR, 1.947% (LIBOR-1mo. + 0.47%), 10/15/2021 (n) | | | 908,000 | | | | 906,544 | |
| Santander Drive Auto Receivables Trust, 2017-2, “C”, 2.79%, 8/15/2022 | | | 1,109,000 | | | | 1,112,332 | |
| Santander Retail Auto Lease Trust, 2017-A, “B”, 2.68%, 1/20/2022 (n) | | | 866,000 | | | | 864,988 | |
| Securitized Term Auto Receivables Trust, 2016-1A, “A2A”, 1.284%, 11/26/2018 (n) | | | 194,763 | | | | 194,624 | |
| Shackelton CLO Ltd., 2013-4A, “CR”, FLR, 3.458% (U.S. LIBOR-3mo. + 2.1%), 1/13/2025 (n) | | | 880,000 | | | | 881,463 | |
| Sierra Receivables Funding Co. LLC, 2015-1A, “A”, 2.4%, 3/22/2032 (n) | | | 634,615 | | | | 632,235 | |
| Silver Spring CLO Ltd., FLR, 4.109% (LIBOR-3mo. + 2.75%), 10/15/2026 (n) | | | 1,393,000 | | | | 1,389,263 | |
| SPS Servicer Advance Receivables Trust, 2016-T1, “AT1”, 2.53%, 11/16/2048 (n) | | | 3,150,000 | | | | 3,122,352 | |
| Student Loan Consolidation Center, “A”, FLR, 2.772% (LIBOR-1mo. + 1.22%), 10/25/2027 (n) | | | 618,927 | | | | 626,409 | |
| Thacher Park CLO Ltd. 2014-1A. “CR”, FLR, 3.562% (U.S. LIBOR-3mo. + 2.2%), 10/20/2026 (n) | | | 1,743,000 | | | | 1,748,619 | |
| TICP CLO Ltd., FLR, 3.612% (U.S. LIBOR-3mo. + 2.25%), 1/20/2027 (n) | | | 1,528,000 | | | | 1,536,891 | |
| Tricon American Homes 2015-SFR1, Trust “1A”, 2.589%, 11/17/2033 (n) | | | 1,710,000 | | | | 1,685,790 | |
| UBS Commercial Mortgage Trust, 2017-C1, “XA”, 1.022%, 11/15/2050 (i) | | | 12,088,525 | | | | 867,095 | |
9
MFS Limited Maturity Portfolio
Portfolio of Investments – continued
| | | | | | | | |
| Issuer | | Shares/Par | | | Value ($) | |
| BONDS – continued | | | | | | | | |
| Asset-Backed & Securitized – continued | | | | | |
| Verizon Owner Trust, 2017-3a, “B”, 2.38%, 4/20/2022 (n) | | $ | 1,230,000 | | | $ | 1,225,450 | |
| Veros Auto Receivables Trust, 2017-1, “A”, 2.84%, 4/17/2023 (n) | | | 916,416 | | | | 914,654 | |
| Volvo Financial Equipment LLC, “A2”, 1.44%, 10/15/2018 (n) | | | 18,598 | | | | 18,595 | |
| Volvo Financial Equipment Master Owner Trust, 2017-A, “A”, FLR, 1.977% (LIBOR-1mo. + 0.50%), 11/15/2022 (n) | | | 1,354,000 | | | | 1,357,852 | |
| West CLO Ltd., 2013-1A, “A2BR”, 3.393%, 11/07/2025 (n) | | | 1,720,000 | | | | 1,699,164 | |
| World Financial Network Credit Card Master Trust, 2017-B, “A”, 1.98%, 6/15/2023 | | | 3,012,000 | | | | 3,000,180 | |
| | | | | | | | |
| | | | | | $ | 139,544,728 | |
| | | | | | | | |
| Automotive – 3.6% | | | | | |
| Ford Motor Credit Co. LLC, 2.262%, 3/28/2019 | | $ | 2,220,000 | | | $ | 2,216,492 | |
| Ford Motor Credit Co. LLC, 2.021%, 5/03/2019 | | | 1,530,000 | | | | 1,522,936 | |
| Ford Motor Credit Co. LLC, 2.343%, 11/02/2020 | | | 1,723,000 | | | | 1,706,524 | |
| Ford Motor Credit Co. LLC, FLR, 2.29% (U.S. LIBOR-3mo. + 0.94%), 1/09/2018 | | | 1,940,000 | | | | 1,940,170 | |
| General Motors Financial Co., Inc., 2.65%, 4/13/2020 | | | 2,643,000 | | | | 2,643,400 | |
| General Motors Financial Co., Inc., 3.15%, 6/30/2022 | | | 1,207,000 | | | | 1,205,908 | |
| Hyundai Capital America, 2%, 3/19/2018 (n) | | | 2,863,000 | | | | 2,862,098 | |
| Hyundai Capital America, 2.4%, 10/30/2018 (n) | | | 1,820,000 | | | | 1,818,232 | |
| Toyota Motor Credit Corp., 1.7%, 2/19/2019 | | | 1,510,000 | | | | 1,503,170 | |
| Toyota Motor Credit Corp., FLR, 1.743% (U.S. LIBOR-3mo. + 0.39%), 1/17/2019 | | | 3,370,000 | | | | 3,382,202 | |
| | | | | | | | |
| | | | | | $ | 20,801,132 | |
| | | | | | | | |
| Broadcasting – 0.2% | | | | | |
| SES Global Americas Holdings GP, 2.5%, 3/25/2019 (n) | | $ | 1,141,000 | | | $ | 1,136,735 | |
| | | | | | | | |
| Brokerage & Asset Managers – 0.4% | | | | | |
| Intercontinental Exchange, Inc., 2.75%, 12/01/2020 | | $ | 2,516,000 | | | $ | 2,540,026 | |
| | | | | | | | |
| Building – 0.3% | | | | | |
| Stanley Black & Decker, Inc., 1.622%, 11/17/2018 | | $ | 1,780,000 | | | $ | 1,773,462 | |
| | | | | | | | |
| Business Services – 0.3% | | | | | |
| Fidelity National Information Services, Inc., 2.25%, 8/15/2021 | | $ | 1,810,000 | | | $ | 1,779,295 | |
| | | | | | | | |
| Cable TV – 0.6% | | | | | |
| Time Warner Cable, Inc., 5%, 2/01/2020 | | $ | 3,475,000 | | | $ | 3,626,342 | |
| | | | | | | | |
| | | | | | | | |
| Issuer | | Shares/Par | | | Value ($) | |
| BONDS – continued | | | | | | | | |
| Chemicals – 1.8% | | | | | |
| Chevron Phillips Chemical Co. LLC, 1.7%, 5/01/2018 (n) | | $ | 2,350,000 | | | $ | 2,348,485 | |
| Dow Chemical Co., 8.55%, 5/15/2019 | | | 1,570,000 | | | | 1,700,449 | |
| E.I. du Pont de Nemours & Co., 2.2%, 5/01/2020 | | | 2,145,000 | | | | 2,142,978 | |
| LyondellBasell Industries N.V., 5%, 4/15/2019 | | | 1,267,000 | | | | 1,300,779 | |
| Sherwin-Williams Co., 2.25%, 5/15/2020 | | | 2,652,000 | | | | 2,642,957 | |
| | | | | | | | |
| | | | | | $ | 10,135,648 | |
| | | | | | | | |
| Computer Software – 0.3% | | | | | |
| Diamond 1 Finance Corp./Diamond 2 Finance Corp., 3.48%, 6/01/2019 (n) | | $ | 1,660,000 | | | $ | 1,680,647 | |
| | | | | | | | |
| Conglomerates – 0.1% | | | | | |
| Roper Technologies, Inc., 2.8%, 12/15/2021 | | $ | 783,000 | | | $ | 784,292 | |
| | | | | | | | |
| Consumer Products – 1.4% | | | | | |
| Mattel, Inc., 1.7%, 3/15/2018 | | $ | 1,232,000 | | | $ | 1,227,380 | |
| Reckitt Benckiser Treasury Services PLC, 2.125%, 9/21/2018 (n) | | | 2,480,000 | | | | 2,482,189 | |
| Reckitt Benckiser Treasury Services PLC, 2.375%, 6/24/2022 (n) | | | 4,352,000 | | | | 4,266,095 | |
| | | | | | | | |
| | | | | | $ | 7,975,664 | |
| | | | | | | | |
| Consumer Services – 0.4% | | | | | |
| Alibaba Group Holding Ltd., 2.8%, 6/06/2023 | | $ | 2,521,000 | | | $ | 2,513,438 | |
| | | | | | | | |
| Electrical Equipment – 0.6% | | | | | |
| Arrow Electronics, Inc., 3%, 3/01/2018 | | $ | 919,000 | | | $ | 920,155 | |
| Molex Electronic Technologies LLC, 2.878%, 4/15/2020 (n) | | | 2,430,000 | | | | 2,430,386 | |
| | | | | | | | |
| | | | | | $ | 3,350,541 | |
| | | | | | | | |
| Electronics – 0.4% | | | | | |
| Tyco Electronics Group S.A., 2.375%, 12/17/2018 | | $ | 971,000 | | | $ | 973,178 | |
| Xilinx, Inc., 2.125%, 3/15/2019 | | | 1,490,000 | | | | 1,485,129 | |
| | | | | | | | |
| | | | | | $ | 2,458,307 | |
| | | | | | | | |
| Emerging Market Quasi-Sovereign – 0.8% | | | | | |
| Corporacion Financiera de Desarrollo S.A., 3.25%, 7/15/2019 (n) | | $ | 2,022,000 | | | $ | 2,037,165 | |
| State Grid International Development Co. Ltd., 1.75%, 5/22/2018 (n) | | | 2,429,000 | | | | 2,423,555 | |
| | | | | | | | |
| | | | | | $ | 4,460,720 | |
| | | | | | | | |
| Energy – Integrated – 0.7% | | | | | |
| BP Capital Markets PLC, 2.521%, 1/15/2020 | | $ | 1,371,000 | | | $ | 1,382,436 | |
| Shell International Finance B.V., 1.375%, 5/10/2019 | | | 2,640,000 | | | | 2,617,042 | |
| | | | | | | | |
| | | | | | $ | 3,999,478 | |
| | | | | | | | |
| Entertainment – 0.2% | | | | | |
| Royal Caribbean Cruises Ltd., 2.65%, 11/28/2020 | | $ | 1,207,000 | | | $ | 1,206,015 | |
| | | | | | | | |
10
MFS Limited Maturity Portfolio
Portfolio of Investments – continued
| | | | | | | | |
| Issuer | | Shares/Par | | | Value ($) | |
| BONDS – continued | | | | | | | | |
| Financial Institutions – 0.5% | | | | | |
| LeasePlan Corp. N.V., 2.5%, 5/16/2018 (n) | | $ | 2,949,000 | | | $ | 2,949,337 | |
| | | | | | | | |
| Food & Beverages – 2.1% | | | | | |
| Anheuser-Busch InBev Finance, Inc., 1.9%, 2/01/2019 | | $ | 2,405,000 | | | $ | 2,399,850 | |
| Anheuser-Busch InBev Finance, Inc., 2.65%, 2/01/2021 | | | 2,528,000 | | | | 2,540,462 | |
| Mondelez International, Inc., FLR, 1.988% (LIBOR-3mo. + 0.61%), 10/28/2019 (n) | | | 3,160,000 | | | | 3,171,629 | |
| Pernod Ricard S.A., 5.75%, 4/07/2021 (n) | | | 810,000 | | | | 888,995 | |
| Want Want China Finance Co., 1.875%, 5/14/2018 (n) | | | 2,722,000 | | | | 2,714,771 | |
| Wm. Wrigley Jr. Co., 2.4%, 10/21/2018 (n) | | | 334,000 | | | | 334,933 | |
| | | | | | | | |
| | | | | | $ | 12,050,640 | |
| | | | | | | | |
| Insurance – 1.2% | | | | | |
| American International Group, Inc., 2.3%, 7/16/2019 | | $ | 408,000 | | | $ | 407,655 | |
| American International Group, Inc., 3.3%, 3/01/2021 | | | 3,039,000 | | | | 3,097,758 | |
| Metropolitan Life Global Funding I, 2%, 4/14/2020 (n) | | | 2,660,000 | | | | 2,639,470 | |
| Voya Financial, Inc., 2.9%, 2/15/2018 | | | 573,000 | | | | 573,560 | |
| | | | | | | | |
| | | | | | $ | 6,718,443 | |
| | | | | | | | |
| Insurance – Health – 0.4% | | | | | |
| UnitedHealth Group, Inc., 1.95%, 10/15/2020 | | $ | 2,580,000 | | | $ | 2,556,233 | |
| | | | | | | | |
| International Market Quasi-Sovereign – 2.8% | | | | | |
| Caisse d’Amortissement de la Dette Sociale, 1.875%, 1/13/2020 (n) | | $ | 4,000,000 | | | $ | 3,976,314 | |
| Dexia Credit Local S.A., 2.25%, 1/30/2019 (n) | | | 1,390,000 | | | | 1,391,404 | |
| Dexia Credit Local S.A., 2.25%, 2/18/2020 (n) | | | 3,880,000 | | | | 3,870,880 | |
| Electricite de France, 2.15%, 1/22/2019 (n) | | | 2,500,000 | | | | 2,500,146 | |
| Swedish Export Credit Corp., 1.125%, 8/28/2019 | | | 4,510,000 | | | | 4,438,999 | |
| | | | | | | | |
| | | | | | $ | 16,177,743 | |
| | | | | | | | |
| International Market Sovereign – 0.2% | | | | | |
| Republic of Finland, 1%, 4/23/2019 (n) | | $ | 1,190,000 | | | $ | 1,175,139 | |
| | | | | | | | |
| Internet – 0.1% | | | | | |
| Baidu, Inc., 2.75%, 6/09/2019 | | $ | 440,000 | | | $ | 440,554 | |
| | | | | | | | |
| Major Banks – 16.9% | | | | | |
| ABN AMRO Bank N.V., 2.1%, 1/18/2019 (n) | | $ | 3,280,000 | | | $ | 3,275,710 | |
| Bank of America Corp., 6.875%, 4/25/2018 | | | 1,000,000 | | | | 1,015,275 | |
| Bank of America Corp., 2.151%, 11/09/2020 | | | 1,300,000 | | | | 1,293,950 | |
| Bank of America Corp., 2.369% to 7/21/2020, FLR to 7/21/2021 | | | 3,937,000 | | | | 3,929,842 | |
| Bank of America Corp., 2.881% to 4/24/2022, FLR to 4/24/2023 | | | 3,106,000 | | | | 3,110,185 | |
| Bank of Montreal, FLR, 1.95% (LIBOR-3mo. + 0.6%), 4/09/2018 | | | 1,380,000 | | | | 1,381,712 | |
| | | | | | | | |
| Issuer | | Shares/Par | | | Value ($) | |
| BONDS – continued | | | | | | | | |
| Major Banks – continued | | | | | |
| Bank of Montreal, FLR, 2.003% (LIBOR-3mo. + 0.65%), 7/18/2019 | | $ | 2,110,000 | | | $ | 2,124,675 | |
| Barclays PLC, 3.25%, 1/12/2021 | | | 4,360,000 | | | | 4,401,869 | |
| Citibank N.A., 2.125%, 10/20/2020 | | | 2,381,000 | | | | 2,358,081 | |
| Commonwealth Bank of Australia, 1.75%, 11/02/2018 | | | 610,000 | | | | 608,644 | |
| Commonwealth Bank of Australia, 2.3%, 9/06/2019 | | | 2,579,000 | | | | 2,582,244 | |
| Credit Agricole, “A”, FLR, 2.78% (LIBOR-3mo. + 1.43%), 1/10/2022 (n) | | | 1,270,000 | | | | 1,300,935 | |
| Credit Suisse Group AG, “A”, 3.574%, 1/09/2023 (n) | | | 2,020,000 | | | | 2,053,522 | |
| Credit Suisse New York, 1.75%, 1/29/2018 | | | 2,170,000 | | | | 2,170,016 | |
| DNB Bank A.S.A., 2.125%, 10/02/2020 (n) | | | 2,620,000 | | | | 2,594,871 | |
| Goldman Sachs Group, Inc., 2%, 4/25/2019 | | | 60,000 | | | | 59,814 | |
| Goldman Sachs Group, Inc., 2.55%, 10/23/2019 | | | 6,227,000 | | | | 6,238,010 | |
| Goldman Sachs Group, Inc., 2.6%, 12/27/2020 | | | 2,544,000 | | | | 2,543,524 | |
| Goldman Sachs Group, Inc., 3%, 4/26/2022 | | | 1,970,000 | | | | 1,977,533 | |
| HSBC Holdings PLC, 3.262% to 3/13/2022, FLR to 3/13/2023 | | | 1,745,000 | | | | 1,769,080 | |
| HSBC Holdings PLC, 3.033% to 3/13/2022, FLR to 11/22/2023 | | | 1,294,000 | | | | 1,296,426 | |
| ING Bank N.V., 1.8%, 3/16/2018 (n) | | | 3,290,000 | | | | 3,289,736 | |
| JPMorgan Chase & Co., 2.776% to 4/25/2022, FLR to 4/25/2023 | | | 2,896,000 | | | | 2,898,449 | |
| Mitsubishi UFJ Financial Group, Inc., 2.95%, 3/01/2021 | | | 1,340,000 | | | | 1,352,105 | |
| Mitsubishi UFJ Financial Group, Inc., 2.998%, 2/22/2022 | | | 1,340,000 | | | | 1,348,353 | |
| Mizuho Bank Ltd., FLR, 2.552% (U.S. LIBOR-3mo. + 1.19%), 10/20/2018 (n) | | | 2,390,000 | | | | 2,407,315 | |
| Morgan Stanley, 2.375%, 7/23/2019 | | | 4,566,000 | | | | 4,570,691 | |
| Morgan Stanley, 2.65%, 1/27/2020 | | | 2,300,000 | | | | 2,310,260 | |
| National Australia Bank Ltd., 1.375%, 7/12/2019 | | | 1,900,000 | | | | 1,876,128 | |
| PNC Bank N.A., 2.25%, 7/02/2019 | | | 3,080,000 | | | | 3,081,550 | |
| Royal Bank of Canada, 1.5%, 7/29/2019 | | | 3,527,000 | | | | 3,486,335 | |
| Skandinaviska Enskilda, 1.75%, 3/19/2018 (n) | | | 1,721,000 | | | | 1,720,466 | |
| Sumitomo Mitsui Banking Corp., FLR, 2.027% (U.S. LIBOR-3mo. + 0.67%), 10/19/2018 | | | 2,710,000 | | | | 2,719,992 | |
| Svenska Handelsbanken AB, 2.25%, 6/17/2019 | | | 2,580,000 | | | | 2,580,894 | |
| Toronto-Dominion Bank, 1.45%, 9/06/2018 | | | 3,040,000 | | | | 3,029,059 | |
| Toronto-Dominion Bank, FLR, 2.062% (U.S. LIBOR-3mo. + 0.65%), 8/13/2019 | | | 2,770,000 | | | | 2,789,886 | |
| UBS AG, 2.375%, 8/14/2019 | | | 1,660,000 | | | | 1,661,198 | |
| UBS Group Funding (Jersey) Ltd., 3%, 4/15/2021 (n) | | | 2,915,000 | | | | 2,935,183 | |
| UBS Group Funding (Switzerland) AG, 3.491%, 5/23/2023 (n) | | | 3,498,000 | | | | 3,553,227 | |
11
MFS Limited Maturity Portfolio
Portfolio of Investments – continued
| | | | | | | | |
| Issuer | | Shares/Par | | | Value ($) | |
| BONDS – continued | | | | | | | | |
| Major Banks – continued | | | | | |
| Wells Fargo Bank N.A., FLR, 2.102% (U.S. LIBOR-3mo. + 0.74%), 1/22/2018 | | $ | 250,000 | | | $ | 250,061 | |
| Westpac Banking Corp., 1.55%, 5/25/2018 | | | 1,580,000 | | | | 1,579,854 | |
| | | | | | | | |
| | | | | | $ | 97,526,660 | |
| | | | | | | | |
| Medical & Health Technology & Services – 1.3% | | | | | |
| Becton, Dickinson and Co., 2.675%, 12/15/2019 | | $ | 2,571,000 | | | $ | 2,579,978 | |
| Becton, Dickinson and Co., 2.404%, 6/05/2020 | | | 1,234,000 | | | | 1,227,230 | |
| Becton, Dickinson and Co., 2.894%, 6/06/2022 | | | 1,367,000 | | | | 1,358,277 | |
| Laboratory Corp. of America Holdings, 2.625%, 2/01/2020 | | | 2,460,000 | | | | 2,466,342 | |
| | | | | | | | |
| | | | | | $ | 7,631,827 | |
| | | | | | | | |
| Medical Equipment – 1.4% | | | | | |
| Abbott Laboratories, 2.35%, 11/22/2019 | | $ | 2,680,000 | | | $ | 2,680,278 | |
| Abbott Laboratories, 2.9%, 11/30/2021 | | | 2,030,000 | | | | 2,053,275 | |
| Medtronic, Inc., 1.5%, 3/15/2018 | | | 1,320,000 | | | | 1,319,050 | |
| Zimmer Holdings, Inc., 2%, 4/01/2018 | | | 1,740,000 | | | | 1,740,631 | |
| | | | | | | | |
| | | | | | $ | 7,793,234 | |
| | | | | | | | |
| Metals & Mining – 0.6% | | | | | |
| Freeport-McMoRan, Inc., 2.375%, 3/15/2018 | | $ | 800,000 | | | $ | 799,000 | |
| Glencore Funding LLC, 2.125%, 4/16/2018 (n) | | | 1,650,000 | | | | 1,649,615 | |
| Glencore Funding LLC, 3%, 10/27/2022 (n) | | | 886,000 | | | | 877,362 | |
| | | | | | | | |
| | | | | | $ | 3,325,977 | |
| | | | | | | | |
| Midstream – 1.2% | | | | | |
| Andeavor Logistics LP/Tesoro Logistics Finance Corp., 3.5%, 12/01/2022 | | $ | 1,712,000 | | | $ | 1,708,518 | |
| EL Paso LLC, 6.5%, 9/15/2020 | | | 2,578,000 | | | | 2,818,696 | |
| EnLink Midstream Partners LP, 2.7%, 4/01/2019 | | | 1,342,000 | | | | 1,340,694 | |
| Enterprise Products Operating LP, 6.5%, 1/31/2019 | | | 630,000 | | | | 658,288 | |
| TransCanada PipeLines Ltd., 1.875%, 1/12/2018 | | | 195,000 | | | | 194,996 | |
| | | | | | | | |
| | | | | | $ | 6,721,192 | |
| | | | | | | | |
| Mortgage-Backed – 2.0% | | | | | |
| Fannie Mae, 2.8%, 3/01/2018 | | $ | 2,915,997 | | | $ | 2,912,575 | |
| Fannie Mae, 3.766%, 6/01/2018 | | | 3,267,658 | | | | 3,272,386 | |
| Fannie Mae, 5.5%, 5/01/2025 | | | 246,879 | | | | 251,921 | |
| Fannie Mae, 5%, 7/01/2039 - 3/01/2042 | | | 1,480,791 | | | | 1,598,741 | |
| Fannie Mae, 2%, 5/25/2044 | | | 3,296,424 | | | | 3,234,688 | |
| Fannie Mae, FLR, 1.487%, 5/25/2018 | | | 165,619 | | | | 165,479 | |
| Freddie Mac, 0.882%, 4/25/2024 (i) | | | 628,961 | | | | 28,718 | |
| | | | | | | | |
| | | | | | $ | 11,464,508 | |
| | | | | | | | |
| Municipals – 0.6% | | | | | |
| New Jersey Economic Development Authority State Pension Funding Rev., “B”, AGM, 0%, 2/15/2023 | | $ | 4,091,000 | | | $ | 3,422,531 | |
| | | | | | | | |
| | | | | | | | |
| Issuer | | Shares/Par | | | Value ($) | |
| BONDS – continued | | | | | | | | |
| Network & Telecom – 1.7% | | | | | |
| AT&T, Inc., 2.3%, 3/11/2019 | | $ | 1,530,000 | | | $ | 1,531,520 | |
| AT&T, Inc., 2.45%, 6/30/2020 | | | 3,240,000 | | | | 3,236,244 | |
| AT&T, Inc., 3.2%, 3/01/2022 | | | 2,171,000 | | | | 2,194,172 | |
| AT&T, Inc., 2.85%, 2/14/2023 | | | 1,194,000 | | | | 1,198,563 | |
| British Telecommunications PLC, 2.35%, 2/14/2019 | | | 1,860,000 | | | | 1,861,839 | |
| | | | | | | | |
| | | | | | $ | 10,022,338 | |
| | | | | | | | |
| Oils – 0.5% | | | | | |
| Marathon Petroleum Corp., 2.7%, 12/14/2018 | | $ | 2,908,000 | | | $ | 2,918,427 | |
| | | | | | | | |
| Other Banks & Diversified Financials – 7.6% | | | | | |
| Banque Federative du Credit Mutuel, 2.75%, 1/22/2019 (n) | | $ | 798,000 | | | $ | 802,620 | |
| Banque Federative du Credit Mutuel, 2%, 4/12/2019 (n) | | | 2,430,000 | | | | 2,420,857 | |
| Banque Federative du Credit Mutuel, 2.2%, 7/20/2020 (n) | | | 2,614,000 | | | | 2,597,054 | |
| BNZ International Funding Ltd. London, 1.9%, 2/26/2018 (n) | | | 2,470,000 | | | | 2,470,194 | |
| BPCE S.A., 1.625%, 1/26/2018 | | | 840,000 | | | | 839,748 | |
| Branch Banking & Trust Co., 1.45%, 5/10/2019 | | | 2,610,000 | | | | 2,585,059 | |
| Capital One Financial Corp., 2.5%, 5/12/2020 | | | 1,708,000 | | | | 1,705,756 | |
| Capital One Financial Corp., 2.4%, 10/30/2020 | | | 868,000 | | | | 862,609 | |
| Citigroup, Inc., 2.4%, 2/18/2020 | | | 4,151,000 | | | | 4,150,153 | |
| Citizens Bank N.A., 2.3%, 12/03/2018 | | | 1,380,000 | | | | 1,380,936 | |
| Citizens Bank N.A., 2.25%, 3/02/2020 | | | 1,400,000 | | | | 1,393,254 | |
| Citizens Bank N.A., 2.55%, 5/13/2021 | | | 374,000 | | | | 372,579 | |
| Compass Bank, 2.875%, 6/29/2022 | | | 2,717,000 | | | | 2,688,248 | |
| Discover Bank, 3.1%, 6/04/2020 | | | 1,705,000 | | | | 1,725,130 | |
| Fifth Third Bancorp, 2.3%, 3/01/2019 | | | 1,171,000 | | | | 1,171,873 | |
| Fifth Third Bancorp, 2.3%, 3/15/2019 | | | 1,200,000 | | | | 1,200,823 | |
| First Republic Bank, 2.375%, 6/17/2019 | | | 849,000 | | | | 847,377 | |
| Groupe BPCE S.A., 2.5%, 12/10/2018 | | | 2,980,000 | | | | 2,988,359 | |
| Lloyds Bank PLC, FLR, 2.362% (U.S. LIBOR-3mo. + 1%), 1/22/2019 | | | 730,000 | | | | 736,100 | |
| National Bank of Canada, FLR, 2.413% (LIBOR-3mo. + 0.84%), 12/14/2018 | | | 2,480,000 | | | | 2,495,808 | |
| Santander UK Group Holdings PLC, 2.875%, 8/05/2021 | | | 3,090,000 | | | | 3,082,430 | |
| SunTrust Banks, Inc., 2.7%, 1/27/2022 | | | 2,255,000 | | | | 2,254,657 | |
| U.S. Bank NA Cincinnati, 2.05%, 10/23/2020 | | | 2,945,000 | | | | 2,923,569 | |
| | | | | | | | |
| | | | | | $ | 43,695,193 | |
| | | | | | | | |
| Pharmaceuticals – 3.5% | | | | | |
| Actavis Funding SCS, 2.35%, 3/12/2018 | | $ | 1,038,000 | | | $ | 1,038,809 | |
| Amgen, Inc., 2.2%, 5/11/2020 | | | 3,420,000 | | | | 3,400,886 | |
| Biogen, Inc., 2.9%, 9/15/2020 | | | 1,780,000 | | | | 1,804,120 | |
| Celgene Corp., 2.875%, 8/15/2020 | | | 2,591,000 | | | | 2,614,970 | |
| Celgene Corp., 2.75%, 2/15/2023 | | | 1,806,000 | | | | 1,790,833 | |
| EMD Finance LLC, 1.7%, 3/19/2018 (n) | | | 2,790,000 | | | | 2,789,351 | |
12
MFS Limited Maturity Portfolio
Portfolio of Investments – continued
| | | | | | | | |
| Issuer | | Shares/Par | | | Value ($) | |
| BONDS – continued | | | | | |
| Pharmaceuticals – continued | | | | | |
| Gilead Sciences, Inc., 1.85%, 9/04/2018 | | $ | 2,490,000 | | | $ | 2,489,741 | |
| Shire Acquisitions Investments Ireland Designated Activity Co., 1.9%, 9/23/2019 | | | 4,540,000 | | | | 4,498,410 | |
| | | | | | | | |
| | | | | | $ | 20,427,120 | |
| | | | | | | | |
| Real Estate – Retail – 0.2% | | | | | |
| Simon Property Group, Inc., REIT, 1.5%, 2/01/2018 (n) | | $ | 1,208,000 | | | $ | 1,207,856 | |
| | | | | | | | |
| Retailers – 0.8% | | | | | |
| Alimentation Couche-Tard, Inc., 2.35%, 12/13/2019 (n) | | $ | 2,587,000 | | | $ | 2,586,529 | |
| Dollar General Corp., 1.875%, 4/15/2018 | | | 365,000 | | | | 364,782 | |
| Wesfarmers Ltd., 1.874%, 3/20/2018 (n) | | | 1,593,000 | | | | 1,592,945 | |
| | | | | | | | |
| | | | | | $ | 4,544,256 | |
| | | | | | | | |
| Supranational – 0.5% | | | | | |
| Corporacion Andina de Fomento, 2%, 5/10/2019 | | $ | 1,330,000 | | | $ | 1,325,218 | |
| Corporacion Andina de Fomento, FLR, 1.928% (U.S. LIBOR-3mo. + 0.55%), 1/29/2018 | | | 1,490,000 | | | | 1,490,310 | |
| | | | | | | | |
| | | | | | $ | 2,815,528 | |
| | | | | | | | |
| Telecommunications – Wireless – 2.0% | | | | | |
| American Tower Corp., REIT, 2.8%, 6/01/2020 | | $ | 857,000 | | | $ | 862,287 | |
| American Tower Corp., REIT, 3%, 6/15/2023 | | | 2,118,000 | | | | 2,112,130 | |
| American Tower Trust I, REIT, 1.551%, 3/15/2018 (n) | | | 1,900,000 | | | | 1,897,423 | |
| Crown Castle International Corp., 3.4%, 2/15/2021 | | | 1,000,000 | | | | 1,021,149 | |
| Crown Castle Towers LLC, 4.883%, 8/15/2020 (n) | | | 2,680,000 | | | | 2,802,582 | |
| SBA Tower Trust, 2.877%, 7/09/2021 (n) | | | 629,000 | | | | 624,283 | |
| SBA Tower Trust, 2.898%, 10/15/2044 (n) | | | 2,395,000 | | | | 2,400,689 | |
| | | | | | | | |
| | | | | | $ | 11,720,543 | |
| | | | | | | | |
| Tobacco – 1.5% | | | | | |
| BAT Capital Corp., 2.297%, 8/14/2020 (n) | | $ | 2,930,000 | | | $ | 2,913,684 | |
| Imperial Tobacco Finance PLC, 2.05%, 7/20/2018 (n) | | | 2,494,000 | | | | 2,491,743 | |
| Imperial Tobacco Finance PLC, 2.95%, 7/21/2020 (n) | | | 3,388,000 | | | | 3,420,480 | |
| | | | | | | | |
| | | | | | $ | 8,825,907 | |
| | | | | | | | |
| Transportation – Services – 0.6% | | | | | |
| TTX Co., 2.6%, 6/15/2020 (n) | | $ | 3,160,000 | | | $ | 3,146,036 | |
| | | | | | | | |
| U.S. Government Agencies and Equivalents – 0.8% | |
| Hashemite Kingdom of Jordan, 1.945%, 6/23/2019 | | $ | 2,040,000 | | | $ | 2,038,433 | |
| National Credit Union Administration, “1-A”, FLR, 1.778% (LIBOR-1mo. + 0.45%), 1/08/2020 | | | 764,542 | | | | 766,139 | |
| National Credit Union Administration, FLR, 1.728% (LIBOR-1mo. + 0.4%), 3/11/2020 | | | 1,137,582 | | | | 1,139,334 | |
| | | | | | | | |
| Issuer | | Shares/Par | | | Value ($) | |
| BONDS – continued | | | | | |
| U.S. Government Agencies and Equivalents – continued | |
| National Credit Union Administration, FLR, 2.005% (LIBOR-1mo. + 0.45%), 10/07/2020 | | $ | 368,186 | | | $ | 368,764 | |
| National Credit Union Administration, FLR, 1.756% (LIBOR-1mo. + 0.35%), 12/07/2020 | | | 450,246 | | | | 450,500 | |
| | | | | | | | |
| | | | | | $ | 4,763,170 | |
| | | | | | | | |
| U.S. Treasury Obligations – 6.5% | | | | | |
| U.S. Treasury Notes, 1.625%, 8/31/2019 | | $ | 9,000,000 | | | $ | 8,962,614 | |
| U.S. Treasury Notes, 1.375%, 2/15/2020 | | | 24,900,000 | | | | 24,622,580 | |
| U.S. Treasury Notes, 1.875%, 2/28/2022 | | | 4,000,000 | | | | 3,956,431 | |
| | | | | | | | |
| | | | | | $ | 37,541,625 | |
| | | | | | | | |
| Utilities – Electric Power – 2.7% | | | | | |
| Dominion Energy, Inc., 2.962%, 7/01/2019 | | $ | 1,310,000 | | | $ | 1,320,018 | |
| Dominion Energy, Inc., 1.6%, 8/15/2019 | | | 1,070,000 | | | | 1,058,118 | |
| Dominion Energy, Inc., 2.579%, 7/01/2020 | | | 1,761,000 | | | | 1,761,622 | |
| Emera U.S. Finance LP, 2.15%, 6/15/2019 | | | 2,021,000 | | | | 2,012,954 | |
| Eversource Energy, 2.5%, 3/15/2021 | | | 1,240,000 | | | | 1,232,025 | |
| FirstEnergy Corp., 2.85%, 7/15/2022 | | | 856,000 | | | | 848,108 | |
| NextEra Energy Capital Holdings, Inc., 2.3%, 4/01/2019 | | | 1,722,000 | | | | 1,720,930 | |
| Southern Co., 1.85%, 7/01/2019 | | | 2,600,000 | | | | 2,584,027 | |
| Virginia Electric & Power Co., 1.2%, 1/15/2018 | | | 2,790,000 | | | | 2,789,208 | |
| | | | | | | | |
| | | | | | $ | 15,327,010 | |
| | | | | | | | |
Total Bonds
(Identified Cost, $557,539,342) | | | $ | 556,675,497 | |
| | | | | | | | |
| |
| INVESTMENT COMPANIES (h) – 3.1% | | | | | |
| MONEY MARKET FUNDS – 3.1% | | | | | |
| MFS Institutional Money Market Portfolio, 1.25% (v) (Identified Cost, $17,895,193) | | | 17,896,983 | | | $ | 17,895,193 | |
| | | | | | | | |
OTHER ASSETS, LESS
LIABILITIES – 0.4% | | | | | | | 2,445,219 | |
| | | | | | | | |
| NET ASSETS – 100.0% | | | $ | 577,015,909 | |
| | | | | | | | |
| (h) | | An affiliated issuer may be considered one in which the fund owns 5% or more of the outstanding voting securities, or a company which is under common control. At period end, the aggregate values of the fund’s investments in affiliated issuers and in unaffiliated issuers were $17,895,193 and $556,675,497, respectively. |
| (i) | | Interest only security for which the fund receives interest on notional principal (Par amount). Par amount shown is the notional principal and does not reflect the cost of the security. |
| (n) | | Securities exempt from registration under Rule 144A of the Securities Act of 1933. These securities may be sold in the ordinary course of business in transactions exempt from registration, normally to qualified institutional buyers. At period end, the aggregate value of these securities was $229,313,687, representing 39.7% of net assets. |
| (v) | | Affiliated issuer that is available only to investment companies managed by MFS. The rate quoted for the MFS Institutional Money Market Portfolio is the annualized seven-day yield of the fund at period end. |
13
MFS Limited Maturity Portfolio
Portfolio of Investments – continued
The following abbreviations are used in this report and are defined:
| CDO | | Collateralized Debt Obligation |
| CLO | | Collateralized Loan Obligation |
| FLR | | Floating rate. Interest rate resets periodically based on the parenthetically disclosed reference rate plus a spread (if any). The period-end rate reported may not be the current rate. |
| PLC | | Public Limited Company |
| REIT | | Real Estate Investment Trust |
| | |
| Insurers | | |
| AGM | | Assured Guaranty Municipal |
See Notes to Financial Statements
14
MFS Limited Maturity Portfolio
FINANCIAL STATEMENTS | STATEMENT OF ASSETS AND LIABILITIES
This statement represents your fund’s balance sheet, which details the assets and liabilities comprising the total value of the fund.
| | | | |
At 12/31/17 | | | | |
Assets | | | | |
Investments in unaffiliated issuers, at value (identified cost, $557,539,342) | | | $556,675,497 | |
Investments in affiliated issuers, at value (identified cost, $17,895,193) | | | 17,895,193 | |
Cash | | | 148 | |
Receivables for | | | | |
Fund shares sold | | | 38,081 | |
Interest | | | 3,048,189 | |
Other assets | | | 3,737 | |
Total assets | | | $577,660,845 | |
Liabilities | | | | |
Payable for fund shares reacquired | | | $523,074 | |
Payable to affiliates | | | | |
Investment adviser | | | 25,726 | |
Shareholder servicing costs | | | 89 | |
Distribution and/or service fees | | | 3,908 | |
Payable for independent Trustees’ compensation | | | 47 | |
Accrued expenses and other liabilities | | | 92,092 | |
Total liabilities | | | $644,936 | |
Net assets | | | $577,015,909 | |
Net assets consist of | | | | |
Paid-in capital | | | $568,277,518 | |
Unrealized appreciation (depreciation) | | | (863,845 | ) |
Accumulated net realized gain (loss) | | | (752,237 | ) |
Undistributed net investment income | | | 10,354,473 | |
Net assets | | | $577,015,909 | |
Shares of beneficial interest outstanding | | | 56,686,156 | |
| | | | | | | | | | | | |
| | | Net assets | | | Shares
outstanding | | | Net asset value
per share | |
Initial Class | | | $434,319,963 | | | | 42,654,828 | | | | $10.18 | |
Service Class | | | 142,695,946 | | | | 14,031,328 | | | | 10.17 | |
Net asset value per share is calculated using actual net assets and shares outstanding rather than amounts that have been rounded for presentation purposes.
See Notes to Financial Statements
15
MFS Limited Maturity Portfolio
FINANCIAL STATEMENTS | STATEMENT OF OPERATIONS
This statement describes how much your fund earned in investment income and accrued in expenses. It also describes any gains and/or losses generated by fund operations.
| | | | |
Year ended 12/31/17 | | | | |
Net investment income (loss) | | | | |
Income | | | | |
Interest | | | $13,231,744 | |
Dividends from affiliated issuers | | | 112,595 | |
Total investment income | | | $13,344,339 | |
Expenses | | | | |
Management fee | | | $2,408,959 | |
Distribution and/or service fees | | | 369,497 | |
Shareholder servicing costs | | | 10,325 | |
Administrative services fee | | | 104,803 | |
Independent Trustees’ compensation | | | 15,241 | |
Custodian fee | | | 33,753 | |
Shareholder communications | | | 61,107 | |
Audit and tax fees | | | 62,603 | |
Legal fees | | | 8,613 | |
Miscellaneous | | | 32,057 | |
Total expenses | | | $3,106,958 | |
Reduction of expenses by investment adviser | | | (48,111 | ) |
Net expenses | | | $3,058,847 | |
Net investment income (loss) | | | $10,285,492 | |
Realized and unrealized gain (loss) | | | | |
Realized gain (loss) (identified cost basis) | | | | |
Unaffiliated issuers | | | $393,714 | |
Affiliated issuers | | | (3,878 | ) |
Futures contracts | | | 553,572 | |
Net realized gain (loss) | | | $943,408 | |
Change in unrealized appreciation (depreciation) | |
Unaffiliated issuers | | | $(1,130,349 | ) |
Affiliated issuers | | | (272 | ) |
Futures contracts | | | (48,122 | ) |
Net unrealized gain (loss) | | | $(1,178,743 | ) |
Net realized and unrealized gain (loss) | | | $(235,335 | ) |
Change in net assets from operations | | | $10,050,157 | |
See Notes to Financial Statements
16
MFS Limited Maturity Portfolio
FINANCIAL STATEMENTS | STATEMENTS OF CHANGES IN NET ASSETS
These statements describe the increases and/or decreases in net assets resulting from operations, any distributions, and any shareholder transactions.
| | | | | | | | |
| | | Year ended | |
| | | 12/31/17 | | | | 12/31/16 | |
Change in net assets | |
| From operations | |
Net investment income (loss) | | | $10,285,492 | | | | $9,011,152 | |
Net realized gain (loss) | | | 943,408 | | | | (345,999 | ) |
Net unrealized gain (loss) | | | (1,178,743 | ) | | | 2,653,650 | |
Change in net assets from operations | | | $10,050,157 | | | | $11,318,803 | |
| Distributions declared to shareholders | |
From net investment income | | | $(9,144,192 | ) | | | $(8,450,814 | ) |
Change in net assets from fund share transactions | | | $(51,599,224 | ) | | | $(68,490,037 | ) |
Total change in net assets | | | $(50,693,259 | ) | | | $(65,622,048 | ) |
| Net assets | |
At beginning of period | | | 627,709,168 | | | | 693,331,216 | |
At end of period (including undistributed net investment income of $10,354,473 and
$9,142,960, respectively) | | | $577,015,909 | | | | $627,709,168 | |
See Notes to Financial Statements
17
MFS Limited Maturity Portfolio
FINANCIAL STATEMENTS | FINANCIAL HIGHLIGHTS
The financial highlights table is intended to help you understand the fund’s financial performance for the past 5 years. Certain information reflects financial results for a single fund share. The total returns in the table represent the rate that an investor would have earned (or lost) on an investment in the fund share class (assuming reinvestment of all distributions) held for the entire period.
| | | | | | | | | | | | | | | | | | | | |
| Initial Class | | Year ended | |
| | | 12/31/17 | | | 12/31/16 | | | 12/31/15 | | | 12/31/14 | | | 12/31/13 | |
Net asset value, beginning of period | | | $10.17 | | | | $10.14 | | | | $10.23 | | | | $10.32 | | | | $10.29 | |
| Income (loss) from investment operations | | | | | | | | | | | | | | | | | | | | |
Net investment income (loss) (d) | | | $0.18 | | | | $0.15 | (c) | | | $0.12 | | | | $0.11 | | | | $0.12 | |
Net realized and unrealized gain (loss) | | | (0.00 | )(w) | | | 0.02 | | | | (0.07 | ) | | | (0.03 | ) | | | (0.05 | ) |
Total from investment operations | | | $0.18 | | | | $0.17 | | | | $0.05 | | | | $0.08 | | | | $0.07 | |
| Less distributions declared to shareholders | | | | | | | | | | | | | | | | | | | | |
From net investment income | | | $(0.17 | ) | | | $(0.14 | ) | | | $(0.14 | ) | | | $(0.13 | ) | | | $(0.01 | ) |
From net realized gain | | | — | | | | — | | | | — | | | | (0.04 | ) | | | (0.03 | ) |
Total distributions declared to shareholders | | | $(0.17 | ) | | | $(0.14 | ) | | | $(0.14 | ) | | | $(0.17 | ) | | | $(0.04 | ) |
Net asset value, end of period (x) | | | $10.18 | | | | $10.17 | | | | $10.14 | | | | $10.23 | | | | $10.32 | |
Total return (%) (k)(r)(s)(x) | | | 1.73 | | | | 1.68 | (c) | | | 0.48 | | | | 0.80 | | | | 0.71 | |
Ratios (%) (to average net assets)
and Supplemental data: | | | | | | | | | | | | | | | | | | | | |
Expenses before expense reductions (f) | | | 0.45 | | | | 0.42 | (c) | | | 0.45 | | | | 0.44 | | | | 0.45 | |
Expenses after expense reductions (f) | | | 0.45 | | | | 0.42 | (c) | | | 0.44 | | | | 0.44 | | | | 0.45 | |
Net investment income (loss) | | | 1.77 | | | | 1.43 | (c) | | | 1.13 | | | | 1.10 | | | | 1.19 | |
Portfolio turnover | | | 54 | | | | 30 | | | | 26 | | | | 24 | | | | 34 | |
Net assets at end of period (000 omitted) | | | $434,320 | | | | $473,730 | | | | $520,750 | | | | $627,457 | | | | $713,534 | |
| |
| Service Class | | Year ended | |
| | | 12/31/17 | | | 12/31/16 | | | 12/31/15 | | | 12/31/14 | | | 12/31/13 | |
Net asset value, beginning of period | | | $10.16 | | | | $10.12 | | | | $10.20 | | | | $10.30 | | | | $10.28 | |
| Income (loss) from investment operations | | | | | | | | | | | | | | | | | | | | |
Net investment income (loss) (d) | | | $0.16 | | | | $0.12 | (c) | | | $0.09 | | | | $0.09 | | | | $0.10 | |
Net realized and unrealized gain (loss) | | | (0.01 | ) | | | 0.03 | | | | (0.06 | ) | | | (0.04 | ) | | | (0.05 | ) |
Total from investment operations | | | $0.15 | | | | $0.15 | | | | $0.03 | | | | $0.05 | | | | $0.05 | |
| Less distributions declared to shareholders | | | | | | | | | | | | | | | | | | | | |
From net investment income | | | $(0.14 | ) | | | $(0.11 | ) | | | $(0.11 | ) | | | $(0.11 | ) | | | $— | |
From net realized gain | | | — | | | | — | | | | — | | | | (0.04 | ) | | | (0.03 | ) |
Total distributions declared to shareholders | | | $(0.14 | ) | | | $(0.11 | ) | | | $(0.11 | ) | | | $(0.15 | ) | | | $(0.03 | ) |
Net asset value, end of period (x) | | | $10.17 | | | | $10.16 | | | | $10.12 | | | | $10.20 | | | | $10.30 | |
Total return (%) (k)(r)(s)(x) | | | 1.45 | | | | 1.48 | (c) | | | 0.28 | | | | 0.49 | | | | 0.48 | |
Ratios (%) (to average net assets)
and Supplemental data: | | | | | | | | | | | | | | | | | | | | |
Expenses before expense reductions (f) | | | 0.70 | | | | 0.68 | (c) | | | 0.70 | | | | 0.69 | | | | 0.70 | |
Expenses after expense reductions (f) | | | 0.70 | | | | 0.67 | (c) | | | 0.69 | | | | 0.69 | | | | 0.70 | |
Net investment income (loss) | | | 1.52 | | | | 1.18 | (c) | | | 0.88 | | | | 0.85 | | | | 0.94 | |
Portfolio turnover | | | 54 | | | | 30 | | | | 26 | | | | 24 | | | | 34 | |
Net assets at end of period (000 omitted) | | | $142,696 | | | | $153,979 | | | | $172,581 | | | | $211,505 | | | | $229,865 | |
See Notes to Financial Statements
18
MFS Limited Maturity Portfolio
Financial Highlights – continued
| (c) | | Amount reflects a one-time reimbursement of expenses by the custodian (or former custodian) without which net investment income and performance would be lower and expenses would be higher. |
| (d) | | Per share data is based on average shares outstanding. |
| (f) | | Ratios do not reflect reductions from fees paid indirectly, if applicable. |
| (k) | | The total return does not reflect expenses that apply to separate accounts. Inclusion of these charges would reduce the total return figures for all periods shown. |
| (r) | | Certain expenses have been reduced without which performance would have been lower. |
| (s) | | From time to time the fund may receive proceeds from litigation settlements, without which performance would be lower. |
| (w) | | Per share amount was less than $0.01. |
| (x) | | The net asset values and total returns have been calculated on net assets which include adjustments made in accordance with U.S. generally accepted accounting principles required at period end for financial reporting purposes. |
See Notes to Financial Statements
19
MFS Limited Maturity Portfolio
NOTES TO FINANCIAL STATEMENTS
| (1) | | Business and Organization |
MFS Limited Maturity Portfolio (the fund) is a diversified series of MFS Variable Insurance Trust III (the trust). The trust is organized as a Delaware statutory trust and is registered under the Investment Company Act of 1940, as amended, as an open-end management investment company. The shareholders of each series of the trust are separate accounts of insurance companies, which offer variable annuity and/or life insurance products, and qualified retirement and pension plans.
The fund is an investment company and accordingly follows the investment company accounting and reporting guidance of the Financial Accounting Standards Board (FASB) Accounting Standards Codification Topic 946 Financial Services – Investment Companies.
| (2) | | Significant Accounting Policies |
General – The preparation of financial statements in conformity with U.S. generally accepted accounting principles requires management to make estimates and assumptions that affect the reported amounts of assets and liabilities, and disclosure of contingent assets and liabilities at the date of the financial statements and the reported amounts of increases and decreases in net assets from operations during the reporting period. Actual results could differ from those estimates. In the preparation of these financial statements, management has evaluated subsequent events occurring after the date of the fund’s Statement of Assets and Liabilities through the date that the financial statements were issued. The fund invests in foreign securities. Investments in foreign securities are vulnerable to the effects of changes in the relative values of the local currency and the U.S. dollar and to the effects of changes in each country’s legal, political, and economic environment.
In October 2016, the Securities and Exchange Commission (SEC) released its final rule on Investment Company Reporting Modernization (the “Rule”). The Rule, which introduced two new regulatory reporting forms for investment companies – Form N-PORT and Form N-CEN – also contained amendments to Regulation S-X which impact financial statement presentation, particularly the presentation of derivative investments, for all reporting periods ending after August 1, 2017. The fund has adopted the Rule’s Regulation S-X amendments and believes that the fund’s financial statements are in compliance with those amendments.
In March 2017, the FASB issued Accounting Standards Update 2017-08, Receivables – Nonrefundable Fees and Other Costs (Subtopic 310-20) – Premium Amortization on Purchased Callable Debt Securities (“ASU 2017-08”). For entities that hold callable debt securities at a premium, ASU 2017-08 requires that the premium be amortized to the earliest call date. ASU 2017-08 will be effective for fiscal years beginning after December 15, 2018, and interim periods within those fiscal years. Management is still evaluating the potential impacts of ASU 2017-08 but believes that adoption of ASU 2017-08 will not have a material effect on the fund’s overall financial position or its overall results of operations.
Balance Sheet Offsetting – The fund’s accounting policy with respect to balance sheet offsetting is that, absent an event of default by the counterparty or a termination of the agreement, the International Swaps and Derivatives Association (ISDA) Master Agreement, or similar agreement, does not result in an offset of reported amounts of financial assets and financial liabilities in the Statement of Assets and Liabilities across transactions between the fund and the applicable counterparty. The fund’s right to setoff may be restricted or prohibited by the bankruptcy or insolvency laws of the particular jurisdiction to which a specific master netting agreement counterparty is subject. Balance sheet offsetting disclosures, to the extent applicable to the fund, have been included in the fund’s Significant Accounting Policies note under the captions for each of the fund’s in-scope financial instruments and transactions.
Investment Valuations – Debt instruments and floating rate loans, including restricted debt instruments, are generally valued at an evaluated or composite bid as provided by a third-party pricing service. Short-term instruments with a maturity at issuance of 60 days or less may be valued at amortized cost, which approximates market value. Open-end investment companies are generally valued at net asset value per share. Securities and other assets generally valued on the basis of information from a third-party pricing service may also be valued at a broker/dealer bid quotation. Values obtained from third-party pricing services can utilize both transaction data and market information such as yield, quality, coupon rate, maturity, type of issue, trading characteristics, and other market data. The values of foreign securities and other assets and liabilities expressed in foreign currencies are converted to U.S. dollars using the mean of bid and asked prices for rates provided by a third-party pricing service.
The Board of Trustees has delegated primary responsibility for determining or causing to be determined the value of the fund’s investments (including any fair valuation) to the adviser pursuant to valuation policies and procedures approved by the Board. If the adviser determines that reliable market quotations are not readily available, investments are valued at fair value as determined in good faith by the adviser in accordance with such procedures under the oversight of the Board of Trustees. Under the fund’s valuation policies and procedures, market quotations are not considered to be readily available for most types of debt instruments and floating rate loans and many types of derivatives. These investments are generally valued at fair value based on information from third-party pricing services. In addition, investments may be valued at fair value if the adviser determines that an investment’s value has been materially affected by events occurring after the close of the exchange or market on which the investment is principally traded (such as foreign exchange or market) and prior to the determination of the fund’s net asset value, or after the halting of
20
MFS Limited Maturity Portfolio
Notes to Financial Statements – continued
trading of a specific security where trading does not resume prior to the close of the exchange or market on which the security is principally traded. The adviser generally relies on third-party pricing services or other information (such as the correlation with price movements of similar securities in the same or other markets; the type, cost and investment characteristics of the security; the business and financial condition of the issuer; and trading and other market data) to assist in determining whether to fair value and at what value to fair value an investment. The value of an investment for purposes of calculating the fund’s net asset value can differ depending on the source and method used to determine value. When fair valuation is used, the value of an investment used to determine the fund’s net asset value may differ from quoted or published prices for the same investment. There can be no assurance that the fund could obtain the fair value assigned to an investment if it were to sell the investment at the same time at which the fund determines its net asset value per share.
Various inputs are used in determining the value of the fund’s assets or liabilities. These inputs are categorized into three broad levels. In certain cases, the inputs used to measure fair value may fall into different levels of the fair value hierarchy. In such cases, an investment’s level within the fair value hierarchy is based on the lowest level of input that is significant to the fair value measurement. The fund’s assessment of the significance of a particular input to the fair value measurement in its entirety requires judgment, and considers factors specific to the investment. Level 1 includes unadjusted quoted prices in active markets for identical assets or liabilities. Level 2 includes other significant observable market-based inputs (including quoted prices for similar securities, interest rates, prepayment speed, and credit risk). Level 3 includes unobservable inputs, which may include the adviser’s own assumptions in determining the fair value of investments. The following is a summary of the levels used as of December 31, 2017 in valuing the fund’s assets or liabilities:
| | | | | | | | | | | | | | | | |
| Financial Instruments | | Level 1 | | | Level 2 | | | Level 3 | | | Total | |
| U.S. Treasury Bonds & U.S. Government Agency & Equivalents | | | $— | | | | $42,304,795 | | | | $— | | | | $42,304,795 | |
| Non-U.S. Sovereign Debt | | | — | | | | 24,629,130 | | | | — | | | | 24,629,130 | |
| Municipal Bonds | | | — | | | | 3,422,531 | | | | — | | | | 3,422,531 | |
| U.S. Corporate Bonds | | | — | | | | 201,638,408 | | | | — | | | | 201,638,408 | |
| Residential Mortgage-Backed Securities | | | — | | | | 18,490,239 | | | | — | | | | 18,490,239 | |
| Commercial Mortgage-Backed Securities | | | — | | | | 15,794,768 | | | | — | | | | 15,794,768 | |
| Asset-Backed Securities (including CDOs) | | | — | | | | 116,724,229 | | | | — | | | | 116,724,229 | |
| Foreign Bonds | | | — | | | | 133,671,397 | | | | — | | | | 133,671,397 | |
| Mutual Funds | | | 17,895,193 | | | | — | | | | — | | | | 17,895,193 | |
| Total | | | $17,895,193 | | | | $556,675,497 | | | | $— | | | | $574,570,690 | |
For further information regarding security characteristics, see the Portfolio of Investments.
Foreign Currency Translation – Purchases and sales of foreign investments, income, and expenses are converted into U.S. dollars based upon currency exchange rates prevailing on the respective dates of such transactions or on the reporting date for foreign denominated receivables and payables. Gains and losses attributable to foreign currency exchange rates on sales of securities are recorded for financial statement purposes as net realized gains and losses on investments. Gains and losses attributable to foreign exchange rate movements on receivables, payables, income and expenses are recorded for financial statement purposes as foreign currency transaction gains and losses. That portion of both realized and unrealized gains and losses on investments that results from fluctuations in foreign currency exchange rates is not separately disclosed.
Derivatives – The fund uses derivatives for different purposes, primarily to increase or decrease exposure to a particular market or segment of the market, or security, to increase or decrease interest rate or currency exposure, or as alternatives to direct investments. Derivatives are used for hedging or non-hedging purposes. While hedging can reduce or eliminate losses, it can also reduce or eliminate gains. When the fund uses derivatives as an investment to increase market exposure, or for hedging purposes, gains and losses from derivative instruments may be substantially greater than the derivative’s original cost.
The derivative instruments used by the fund during the period were futures contracts. Depending on the type of derivative, the fund may exit a derivative position by entering into an offsetting transaction with a counterparty or exchange, negotiating an agreement with the derivative counterparty, or novating the position to a third party. At December 31, 2017, the fund did not have any outstanding derivative instruments.
The following table presents, by major type of derivative contract, the realized gain (loss) on derivatives held by the fund for the year ended December 31, 2017 as reported in the Statement of Operations:
| | | | |
| Risk | | Futures Contracts | |
| Interest Rate | | | $553,572 | |
21
MFS Limited Maturity Portfolio
Notes to Financial Statements – continued
The following table presents, by major type of derivative contract, the change in unrealized appreciation (depreciation) on derivatives held by the fund for the year ended December 31, 2017 as reported in the Statement of Operations:
| | | | |
| Risk | | Futures Contracts | |
| Interest Rate | | | $(48,122 | ) |
Derivative counterparty credit risk is managed through formal evaluation of the creditworthiness of all potential counterparties. On certain, but not all, uncleared derivatives, the fund attempts to reduce its exposure to counterparty credit risk whenever possible by entering into an ISDA Master Agreement on a bilateral basis. The ISDA Master Agreement gives each party to the agreement the right to terminate all transactions traded under such agreement if there is a specified deterioration in the credit quality of the other party. Upon an event of default or a termination of the ISDA Master Agreement, the non-defaulting party has the right to close out all transactions traded under such agreement and to net amounts owed under each agreement to one net amount payable by one party to the other. This right to close out and net payments across all transactions traded under the ISDA Master Agreement could result in a reduction of the fund’s credit risk to such counterparty equal to any amounts payable by the fund under the applicable transactions, if any.
Collateral and margin requirements differ by type of derivative. For cleared derivatives (e.g., futures contracts, cleared swaps, and exchange-traded options), margin requirements are set by the clearing broker and the clearing house and collateral, in the form of cash or securities, is posted by the fund directly with the clearing broker. Collateral terms are counterparty agreement specific for uncleared derivatives (e.g., forward foreign currency exchange contracts, uncleared swap agreements, and uncleared options) and collateral, in the form of cash and securities, is held in segregated accounts with the fund’s custodian in connection with these agreements. For derivatives traded under an ISDA Master Agreement, which contains a collateral support annex, the collateral requirements are netted across all transactions traded under such counterparty-specific agreement and one amount is posted from one party to the other to collateralize such obligations. Cash that has been segregated or delivered to cover the fund’s collateral or margin obligations under derivative contracts, if any, will be reported separately in the Statement of Assets and Liabilities as restricted cash for uncleared derivatives and/or deposits with brokers for cleared derivatives, respectively. Securities pledged as collateral or margin for the same purpose, if any, are noted in the Portfolio of Investments. The fund may be required to make payments of interest on uncovered collateral or margin obligations with the broker. Any such payments are included in “Miscellaneous” expense in the Statement of Operations.
Futures Contracts – The fund entered into futures contracts which may be used to hedge against or obtain broad market exposure, interest rate exposure, currency exposure, or to manage duration. A futures contract represents a commitment for the future purchase or sale of an asset at a specified price on a specified date.
Upon entering into a futures contract, the fund is required to deposit with the broker, either in cash or securities, an initial margin in an amount equal to a certain percentage of the notional amount of the contract. Subsequent payments (variation margin) are made or received by the fund each day, depending on the daily fluctuations in the value of the contract, and are recorded for financial statement purposes as unrealized gain or loss by the fund until the contract is closed or expires at which point the gain or loss on futures contracts is realized.
The fund bears the risk of interest rates, exchange rates or securities prices moving unexpectedly, in which case, the fund may not achieve the anticipated benefits of the futures contracts and may realize a loss. While futures contracts may present less counterparty risk to the fund since the contracts are exchange traded and the exchange’s clearinghouse guarantees payments to the broker, there is still counterparty credit risk due to the insolvency of the broker. The fund’s maximum risk of loss due to counterparty credit risk is equal to the margin posted by the fund to the broker plus any gains or minus any losses on the outstanding futures contracts.
Indemnifications – Under the fund’s organizational documents, its officers and Trustees may be indemnified against certain liabilities and expenses arising out of the performance of their duties to the fund. Additionally, in the normal course of business, the fund enters into agreements with service providers that may contain indemnification clauses. The fund’s maximum exposure under these agreements is unknown as this would involve future claims that may be made against the fund that have not yet occurred.
Investment Transactions and Income – Investment transactions are recorded on the trade date. Interest income is recorded on the accrual basis. All premium and discount is amortized or accreted for financial statement purposes in accordance with U.S. generally accepted accounting principles. Interest payments received in additional securities are recorded on the ex-interest date in an amount equal to the value of the security on such date.
The fund may receive proceeds from litigation settlements. Any proceeds received from litigation involving portfolio holdings are reflected in the Statement of Operations in realized gain/loss if the security has been disposed of by the fund or in unrealized gain/loss if the security is still held by the fund. Any other proceeds from litigation not related to portfolio holdings are reflected as other income in the Statement of Operations.
22
MFS Limited Maturity Portfolio
Notes to Financial Statements – continued
The fund invests a significant portion of its assets in asset-backed and/or mortgage-backed securities. For these securities, the value of the debt instrument also depends on the credit quality and adequacy of the underlying assets or collateral as well as whether there is a security interest in the underlying assets or collateral. Enforcing rights, if any, against the underlying assets or collateral may be difficult. U.S. Government securities not supported as to the payment of principal or interest by the U.S. Treasury, such as those issued by Fannie Mae, Freddie Mac, and the Federal Home Loan Banks, are subject to greater credit risk than are U.S. Government securities supported by the U.S. Treasury, such as those issued by Ginnie Mae.
The fund purchased or sold debt securities on a when-issued or delayed delivery basis, or in a “To Be Announced” (TBA) or “forward commitment” transaction with delivery or payment to occur at a later date beyond the normal settlement period. At the time a fund enters into a commitment to purchase or sell a security, the transaction is recorded and the value of the security acquired is reflected in the fund’s net asset value. The price of such security and the date that the security will be delivered and paid for are fixed at the time the transaction is negotiated. The value of the security may vary with market fluctuations. No interest accrues to the fund until payment takes place. At the time that a fund enters into this type of transaction, the fund is required to have sufficient cash and/or liquid securities to cover its commitments. Losses may arise due to changes in the value of the underlying securities or if the counterparty does not perform under the contract’s terms, or if the issuer does not issue the securities due to political, economic or other factors. Additionally, losses may arise due to declines in the value of the securities prior to settlement date.
To mitigate this risk of loss on TBA securities and other types of forward settling mortgage-backed securities, the fund whenever possible enters into a Master Securities Forward Transaction Agreement (“MSFTA”) on a bilateral basis with each of the counterparties with whom it undertakes a significant volume of transactions. The MSFTA gives each party to the agreement the right to terminate all transactions traded under such agreement if there is a certain deterioration in the credit quality of the other party. Upon an event of default or a termination of the MSFTA, the non-defaulting party has the right to close out all transactions traded under such agreement and to net amounts owed under each transaction to one net amount payable by one party to the other. This right to close out and net payments across all transactions traded under the MSFTA could result in a reduction of the fund’s credit risk to such counterparty equal to any amounts payable by the fund under the applicable transactions, if any.
For mortgage-backed securities traded under a MSFTA, the collateral and margining requirements are contract specific. Collateral amounts across all transactions traded under such agreement are netted and one amount is posted from one party to the other to collateralize such obligations. Cash that has been pledged to cover the fund’s collateral or margin obligations under a MSFTA, if any, will be reported separately on the Statement of Assets and Liabilities as restricted cash. Securities pledged as collateral or margin for the same purpose, if any, are noted in the Portfolio of Investments.
Tax Matters and Distributions – The fund intends to qualify as a regulated investment company, as defined under Subchapter M of the Internal Revenue Code, and to distribute all of its taxable income, including realized capital gains. As a result, no provision for federal income tax is required. The fund’s federal tax returns, when filed, will remain subject to examination by the Internal Revenue Service for a three year period. Management has analyzed the fund’s tax positions taken on federal and state tax returns for all open tax years and does not believe that there are any uncertain tax positions that require recognition of a tax liability. Foreign taxes, if any, have been accrued by the fund in the accompanying financial statements in accordance with the applicable foreign tax law. Foreign income taxes may be withheld by certain countries in which the fund invests. Additionally, capital gains realized by the fund on securities issued in or by certain foreign countries may be subject to capital gains tax imposed by those countries.
Distributions to shareholders are recorded on the ex-dividend date. Income and capital gain distributions are determined in accordance with income tax regulations, which may differ from U.S. generally accepted accounting principles. Certain capital accounts in the financial statements are periodically adjusted for permanent differences in order to reflect their tax character. These adjustments have no impact on net assets or net asset value per share. Temporary differences which arise from recognizing certain items of income, expense, gain or loss in different periods for financial statement and tax purposes will reverse at some time in the future. Distributions in excess of net investment income or net realized gains are temporary overdistributions for financial statement purposes resulting from differences in the recognition or classification of income or distributions for financial statement and tax purposes.
During the year ended December 31, 2017, there were no significant adjustments due to differences between book and tax accounting.
The tax character of distributions declared to shareholders for the last two fiscal years is as follows:
| | | | | | | | |
| | | Year ended
12/31/17 | | | Year ended
12/31/16 | |
| Ordinary income (including any short-term capital gains) | | | $9,144,192 | | | | $8,450,814 | |
23
MFS Limited Maturity Portfolio
Notes to Financial Statements – continued
The federal tax cost and the tax basis components of distributable earnings were as follows:
| | | | |
| As of 12/31/17 | | | | |
| Cost of investments | | | $575,579,028 | |
| Gross appreciation | | | 991,043 | |
| Gross depreciation | | | (1,999,381 | ) |
| Net unrealized appreciation (depreciation) | | | $(1,008,338 | ) |
| Undistributed ordinary income | | | 10,354,473 | |
| Capital loss carryforwards | | | (607,744 | ) |
As of December 31, 2017, the fund had capital loss carryforwards available to offset future realized gains. These net capital losses may be carried forward indefinitely and their character is retained as short-term and/or long-term losses. Such losses are characterized as follows:
Multiple Classes of Shares of Beneficial Interest – The fund offers multiple classes of shares, which differ in their respective distribution and/or service fees. The fund’s income, realized and unrealized gain (loss), and common expenses are allocated to shareholders based on the daily net assets of each class. Dividends are declared separately for each class. Differences in per share dividend rates are generally due to differences in separate class expenses. The fund’s distributions declared to shareholders as reported in the Statements of Changes in Net Assets are presented by class as follows:
| | | | | | | | |
| | | From net investment
income | |
| | | Year ended
12/31/17 | | | Year ended
12/31/16 | |
| Initial Class | | | $7,201,547 | | | | $6,727,090 | |
| Service Class | | | 1,942,645 | | | | 1,723,724 | |
| Total | | | $9,144,192 | | | | $8,450,814 | |
| (3) | | Transactions with Affiliates |
Investment Adviser – The fund has an investment advisory agreement with MFS to provide overall investment management and related administrative services and facilities to the fund. The management fee is computed daily and paid monthly at an annual rate of 0.40% of the fund’s average daily net assets.
MFS has agreed in writing to reduce its management fee by a specified amount if certain MFS mutual fund assets exceed thresholds agreed to by MFS and the fund’s Board of Trustees. For the year ended December 31, 2017, this management fee reduction amounted to $48,111, which is included in the reduction of total expenses in the Statement of Operations. The management fee incurred for the year ended December 31, 2017 was equivalent to an annual effective rate of 0.39% of the fund’s average daily net assets.
Distributor – MFS Fund Distributors, Inc. (MFD), a wholly-owned subsidiary of MFS, is the distributor of shares of the fund. The Trustees have adopted a distribution plan for the Service Class shares pursuant to Rule 12b-1 under the Investment Company Act of 1940.
The fund’s distribution plan provides that the fund will pay MFD distribution and/or service fees equal to 0.25% per annum of its average daily net assets attributable to Service Class shares as partial consideration for services performed and expenses incurred by MFD and financial intermediaries (including participating insurance companies that invest in the fund to fund variable annuity and variable life insurance contracts, sponsors of qualified retirement and pension plans that invest in the fund, and affiliates of these participating insurance companies and plan sponsors) in connection with the sale and distribution of the Service Class shares. MFD may subsequently pay all, or a portion, of the distribution and/or service fees to financial intermediaries.
Shareholder Servicing Agent – MFS Service Center, Inc. (MFSC), a wholly-owned subsidiary of MFS, receives a fee from the fund for its services as shareholder servicing agent. For the year ended December 31, 2017, the fee was $9,598, which equated to 0.0016% annually of the fund’s average daily net assets. MFSC also receives payment from the fund for out-of-pocket expenses paid by MFSC on behalf of the fund. For the year ended December 31, 2017, these costs amounted to $727.
Administrator – MFS provides certain financial, legal, shareholder communications, compliance, and other administrative services to the fund. Under an administrative services agreement, the fund reimburses MFS the costs incurred to provide these services. The fund is charged an annual fixed amount of $17,500 plus a fee based on average daily net assets. The administrative services fee incurred for the year ended December 31, 2017 was equivalent to an annual effective rate of 0.0174% of the fund’s average daily net assets.
24
MFS Limited Maturity Portfolio
Notes to Financial Statements – continued
Trustees’ and Officers’ Compensation – The fund pays compensation to independent Trustees in the form of a retainer, attendance fees, and additional compensation to Board and Committee chairpersons. The fund does not pay compensation directly to Trustees or officers of the fund who are also officers of the investment adviser, all of whom receive remuneration for their services to the fund from MFS. Certain officers and Trustees of the fund are officers or directors of MFS, MFD, and MFSC.
Other – This fund and certain other funds managed by MFS (the funds) have entered into a service agreement (the ISO Agreement) which provides for payment of fees solely by the funds to Tarantino LLC in return for the provision of services of an Independent Senior Officer (ISO) for the funds. Frank L. Tarantino serves as the ISO and is an officer of the funds and the sole member of Tarantino LLC. The funds can terminate the ISO Agreement with Tarantino LLC at any time under the terms of the ISO Agreement. For the year ended December 31, 2017, the fee paid by the fund under this agreement was $1,078 and is included in “Miscellaneous” expense in the Statement of Operations. MFS has agreed to bear all expenses associated with office space, other administrative support, and supplies provided to the ISO.
The fund invests in the MFS Institutional Money Market Portfolio which is managed by MFS and seeks current income consistent with preservation of capital and liquidity. This money market fund does not pay a management fee to MFS.
For the year ended December 31, 2017, purchases and sales of investments, other than short-term obligations, were as follows:
| | | | | | | | |
| | | Purchases | | | Sales | |
| U.S. Government securities | | | $41,293,763 | | | | $8,881,208 | |
| Non-U.S. Government securities | | | $275,466,092 | | | | $342,842,269 | |
| (5) | | Shares of Beneficial Interest |
The fund’s Declaration of Trust permits the Trustees to issue an unlimited number of full and fractional shares of beneficial interest. Transactions in fund shares were as follows:
| | | | | | | | | | | | | | | | |
| | | Year ended 12/31/17 | | | Year ended 12/31/16 | |
| | | Shares | | | Amount | | | Shares | | | Amount | |
| Shares sold | | | | | | | | | | | | | | | | |
Initial Class | | | 2,833,100 | | | | $28,942,654 | | | | 2,860,810 | | | | $29,260,624 | |
Service Class | | | 1,288,904 | | | | 13,145,834 | | | | 1,467,372 | | | | 14,957,986 | |
| | | 4,122,004 | | | | $42,088,488 | | | | 4,328,182 | | | | $44,218,610 | |
| Shares issued to shareholders in reinvestment of distributions | | | | | | | | | | | | | | | | |
Initial Class | | | 706,727 | | | | $7,201,547 | | | | 659,519 | | | | $6,727,090 | |
Service Class | | | 190,830 | | | | 1,942,645 | | | | 169,158 | | | | 1,723,724 | |
| | | 897,557 | | | | $9,144,192 | | | | 828,677 | | | | $8,450,814 | |
| Shares reacquired | | | | | | | | | | | | | | | | |
Initial Class | | | (7,449,956 | ) | | | $(76,219,352 | ) | | | (8,327,171 | ) | | | $(85,073,262 | ) |
Service Class | | | (2,606,511 | ) | | | (26,612,552 | ) | | | (3,537,803 | ) | | | (36,086,199 | ) |
| | | (10,056,467 | ) | | | $(102,831,904 | ) | | | (11,864,974 | ) | | | $(121,159,461 | ) |
| Net change | | | | | | | | | | | | | | | | |
Initial Class | | | (3,910,129 | ) | | | $(40,075,151 | ) | | | (4,806,842 | ) | | | $(49,085,548 | ) |
Service Class | | | (1,126,777 | ) | | | (11,524,073 | ) | | | (1,901,273 | ) | | | (19,404,489 | ) |
| | | (5,036,906 | ) | | | $(51,599,224 | ) | | | (6,708,115 | ) | | | $(68,490,037 | ) |
The fund is one of several mutual funds in which certain MFS funds may invest. The MFS funds do not invest in the underlying funds for the purpose of exercising management or control. At the end of the period, the MFS Moderate Allocation Portfolio, the MFS Conservative Allocation Portfolio, and the MFS Growth Allocation Portfolio were the owners of record of approximately 12%, 12%, and 1%, respectively, of the value of outstanding voting shares of the fund.
The fund and certain other funds managed by MFS participate in a $1.25 billion unsecured committed line of credit, subject to a $1 billion sublimit, provided by a syndication of banks under a credit agreement. Borrowings may be made for temporary financing needs. Interest is charged to each fund, based on its borrowings, generally at a rate equal to the higher of the Overnight Federal Reserve funds rate or daily one month LIBOR plus an agreed upon spread. A commitment fee, based on the average daily, unused portion of the committed line of credit, is allocated among the participating funds at the end of each calendar quarter. In addition, the fund and other funds managed by MFS have established unsecured uncommitted borrowing arrangements with certain banks for temporary financing needs. Interest is charged to each fund, based on its borrowings, at a rate equal to the Overnight Federal Reserve funds rate plus an agreed upon spread. For the year ended December 31, 2017, the fund’s commitment fee and interest expense were $4,106 and $0, respectively, and are included in “Miscellaneous” expense in the Statement of Operations.
25
MFS Limited Maturity Portfolio
Notes to Financial Statements – continued
| (7) | | Investments in Affiliated Issuers |
An affiliated issuer may be considered one in which the fund owns 5% or more of the outstanding voting securities, or a company which is under common control. For the purposes of this report, the fund assumes the following to be affiliated issuers:
| | | | | | | | | | | | | | | | | | |
| Affiliated Issuers | | | | Beginning
Shares/Par
Amount | | | Acquisitions
Shares/Par
Amount | | | Dispositions
Shares/Par
Amount | | | Ending Shares/Par Amount | |
| MFS Institutional Money Market Portfolio | | | | | 23,249,759 | | | | 265,534,672 | | | | (270,887,448 | ) | | | 17,896,983 | |
| | | | | |
| Affilated Issuers | | Realized
Gain (Loss) | | Change in
Unrealized
Appreciation
(Depreciation) | | | Capital Gain
Distributions | | | Dividend
Income | | | Ending
Value | |
| MFS Institutional Money Market Portfolio | | $(3,878) | | | $(272 | ) | | | $— | | | | $112,595 | | | | $17,895,193 | |
26
MFS Limited Maturity Portfolio
REPORT OF INDEPENDENT REGISTERED PUBLIC ACCOUNTING FIRM
To the Board of Trustees of MFS Variable Insurance Trust III and the Shareholders of
MFS Limited Maturity Portfolio:
Opinion on the Financial Statements and Financial Highlights
We have audited the accompanying statement of assets and liabilities of MFS Limited Maturity Portfolio (one of the series of MFS Variable Insurance Trust III) (the “Fund”), including the portfolio of investments, as of December 31, 2017, the related statement of operations for the year then ended, the statements of changes in net assets for each of the two years in the period then ended, the financial highlights for each of the five years in the period then ended, and the related notes. In our opinion, the financial statements and financial highlights present fairly, in all material respects, the financial position of the Fund as of December 31, 2017, and the results of its operations for the year then ended, the changes in its net assets for each of the two years in the period then ended, and the financial highlights for each of the five years in the period then ended, in conformity with accounting principles generally accepted in the United States of America.
Basis for Opinion
These financial statements and financial highlights are the responsibility of the Fund’s management. Our responsibility is to express an opinion on the Fund’s financial statements and financial highlights based on our audits. We are a public accounting firm registered with the Public Company Accounting Oversight Board (United States) (PCAOB) and are required to be independent with respect to the Fund in accordance with the U.S. federal securities laws and the applicable rules and regulations of the Securities and Exchange Commission and the PCAOB.
We conducted our audits in accordance with the standards of the PCAOB. Those standards require that we plan and perform the audit to obtain reasonable assurance about whether the financial statements and financial highlights are free of material misstatement, whether due to error or fraud. The Fund is not required to have, nor were we engaged to perform, an audit of its internal control over financial reporting. As part of our audits we are required to obtain an understanding of internal control over financial reporting but not for the purpose of expressing an opinion on the effectiveness of the Fund’s internal control over financial reporting. Accordingly, we express no such opinion.
Our audits included performing procedures to assess the risks of material misstatement of the financial statements and financial highlights, whether due to error or fraud, and performing procedures that respond to those risks. Such procedures included examining, on a test basis, evidence regarding the amounts and disclosures in the financial statements and financial highlights. Our audits also included evaluating the accounting principles used and significant estimates made by management, as well as evaluating the overall presentation of the financial statements and financial highlights. Our procedures included confirmation of securities owned as of December 31, 2017, by correspondence with the custodian and brokers. We believe that our audits provide a reasonable basis for our opinion.
DELOITTE & TOUCHE LLP
Boston, Massachusetts
February 15, 2018
We have served as the auditor of one or more of the MFS investment companies since 1924.
27
MFS Limited Maturity Portfolio
TRUSTEES AND OFFICERS – IDENTIFICATION AND BACKGROUND
The Trustees and Officers of the Trust, as of February 1, 2018, are listed below, together with their principal occupations during the past five years. (Their titles may have varied during that period.) The address of each Trustee and Officer is 111 Huntington Avenue, Boston, Massachusetts 02199-7618.
| | | | | | | | | | |
Name, Age | | Position(s)
Held with Fund | | Trustee/Officer
Since (h) | | Number of
MFS Funds
overseen by the
Trustee | | Principal Occupations
During the Past Five Years | | Other Directorships
During the Past Five Years (j) |
| INTERESTED TRUSTEES |
Robert J. Manning (k) (age 54) | | Trustee | | February 2004 | | 137 | | Massachusetts Financial Services Company, Executive Chairman (since January 2017); Director; Chairman of the Board; Chief Executive Officer (until 2015); Co-Chief Executive Officer (2015-2016) | | N/A |
| | | | | |
Robin A. Stelmach (k) (age 56) | | Trustee | | January 2014 | | 137 | | Massachusetts Financial Services Company, Vice Chair (since January 2017); Chief Operating Officer and Executive Vice President (until January 2017) | | N/A |
| | | | |
| INDEPENDENT TRUSTEES | | | | | | | | |
John P. Kavanaugh (age 63) | | Trustee and Chair of Trustees | | January 2009 | | 137 | | Private investor | | N/A |
| | | | | |
Steven E. Buller (age 66) | | Trustee | | February 2014 | | 137 | | Financial Accounting Standards Advisory Council, Chairman (2014-2015); Public Company Accounting Oversight Board, Standing Advisory Group, Member (until 2014); BlackRock, Inc. (investment management), Managing Director (until 2014), BlackRock Finco UK (investment management), Director (until 2014) | | N/A |
| | | | | |
John A. Caroselli (age 63) | | Trustee | | March 2017 | | 137 | | JC Global Advisors, LLC (management consulting), President (since 2015); First Capital Corporation (commercial finance), Executive Vice President (until 2015) | | N/A |
| | | | | |
Maureen R. Goldfarb (age 62) | | Trustee | | January 2009 | | 137 | | Private investor | | N/A |
| | | | | |
Michael Hegarty (age 73) | | Trustee | | December 2004 | | 137 | | Private investor | | Rouse Properties Inc., Director (until 2016); Capmark Financial Group Inc., Director (until 2015) |
| | | | | |
Clarence Otis, Jr. (age 61) | | Trustee | | March 2017 | | 137 | | Darden Restaurants, Inc., Chief Executive Officer (until 2014) | | VF Corporation, Director; Verizon Communications, Inc., Director; The Travelers Companies, Director; Federal Reserve Bank of Atlanta, Director (until 2015) |
| | | | | |
Maryanne L. Roepke (age 61) | | Trustee | | May 2014 | | 137 | | American Century Investments (investment management), Senior Vice President and Chief Compliance Officer (until 2014) | | N/A |
| | | | | |
Laurie J. Thomsen (age 60) | | Trustee | | March 2005 | | 137 | | Private investor | | The Travelers Companies, Director; Dycom Industries, Inc., Director (since 2015) |
28
MFS Limited Maturity Portfolio
Trustees and Officers – continued
| | | | | | | | |
Name, Age | | Position(s)
Held with Fund | | Trustee/Officer
Since (h) | | Number of
MFS Funds
for which the
Person is an
Officer | | Principal Occupations During the Past Five Years |
| OFFICERS | | | | | | | | |
Christopher R. Bohane (k) (age 44) | | Assistant Secretary and Assistant Clerk | | July 2005 | | 137 | | Massachusetts Financial Services Company, Vice President and Assistant General Counsel |
| | | | |
Kino Clark (k) (age 49) | | Assistant Treasurer | | January 2012 | | 137 | | Massachusetts Financial Services Company, Vice President |
| | | | |
John W. Clark, Jr. (k) (age 50) | | Assistant Treasurer | | April 2017 | | 137 | | Massachusetts Financial Services Company, Vice President (since March 2017); Deutsche Bank (financial services), Department Head – Treasurer’s Office (until February 2017) |
| | | | |
Thomas H. Connors (k) (age 58) | | Assistant Secretary and Assistant Clerk | | September 2012 | | 137 | | Massachusetts Financial Services Company, Vice President and Senior Counsel |
| | | | |
Ethan D. Corey (k) (age 54) | | Assistant Secretary and Assistant Clerk | | July 2005 | | 137 | | Massachusetts Financial Services Company, Senior Vice President and Associate General Counsel |
| | | | |
David L. DiLorenzo (k) (age 49) | | President | | July 2005 | | 137 | | Massachusetts Financial Services Company, Senior Vice President |
| | | | |
Heidi W. Hardin (k) (age 50) | | Secretary and Clerk | | April 2017 | | 137 | | Massachusetts Financial Services Company, Executive Vice President and General Counsel (since March 2017); Harris Associates (investment management), General Counsel (from September 2015 to January 2017); Janus Capital Management LLC (investment management), Senior Vice President and General Counsel (until September 2015) |
| | | | |
Brian E. Langenfeld (k) (age 44) | | Assistant Secretary and Assistant Clerk | | June 2006 | | 137 | | Massachusetts Financial Services Company, Vice President and Senior Counsel |
| | | | |
Susan A. Pereira (k) (age 47) | | Assistant Secretary and Assistant Clerk | | July 2005 | | 137 | | Massachusetts Financial Services Company, Vice President and Senior Counsel |
| | | | |
Kasey L. Phillips (k) (age 47) | | Assistant Treasurer | | September 2012 | | 137 | | Massachusetts Financial Services Company, Vice President |
| | | | |
Matthew A. Stowe (k) (age 43) | | Assistant Secretary and Assistant Clerk | | October 2014 | | 137 | | Massachusetts Financial Services Company, Vice President and Assistant General Counsel |
| | | | |
Frank L. Tarantino (age 73) | | Independent Senior Officer | | June 2004 | | 137 | | Tarantino LLC (provider of compliance services), Principal |
| | | | |
Richard S. Weitzel (k) (age 47) | | Assistant Secretary and Assistant Clerk | | October 2007 | | 137 | | Massachusetts Financial Services Company, Senior Vice President and Associate General Counsel |
| | | | |
Martin J. Wolin (k) (age 50) | | Chief Compliance Officer | | July 2015 | | 137 | | Massachusetts Financial Services Company, Senior Vice President and Chief Compliance Officer (since July 2015); Mercer (financial service provider), Chief Risk and Compliance Officer, North America and Latin America (until June 2015) |
| | | | |
James O. Yost (k) (age 57) | | Treasurer | | September 1990 | | 137 | | Massachusetts Financial Services Company, Senior Vice President |
| (h) | Date first appointed to serve as Trustee/officer of an MFS Fund. Each Trustee has served continuously since appointment unless indicated otherwise. For the period from December 15, 2004 until February 22, 2005, Mr. Manning served as Advisory Trustee. Prior to January 2012, Messrs. DiLorenzo and Yost served as Assistant Treasurers of the Funds. From January 2012 through December 2016, Messrs. DiLorenzo and Yost served as Treasurer and Deputy Treasurer of the Funds, respectively. |
| (j) | Directorships or trusteeships of companies required to report to the Securities and Exchange Commission (i.e., “public companies”). |
| (k) | “Interested person” of the Trust within the meaning of the Investment Company Act of 1940 (referred to as the 1940 Act), which is the principal federal law governing investment companies like the fund, as a result of a position with MFS. The address of MFS is 111 Huntington Avenue, Boston, Massachusetts 02199-7618. |
29
MFS Limited Maturity Portfolio
Trustees and Officers – continued
Each Trustee has been elected by shareholders and each Trustee and officer holds office until his or her successor is chosen and qualified or until his or her earlier death, resignation, retirement or removal. The Trust does not hold annual meetings for the purpose of electing Trustees, and Trustees are not elected for fixed terms. Under the terms of the Board’s retirement policy, an Independent Trustee shall retire at the end of the calendar year in which he or she reaches the earlier of 75 years of age or 15 years of service on the Board (or, in the case of any Independent Trustee who joined the Board prior to 2015, 20 years of service on the Board).
Messrs. Buller and Otis and Ms. Roepke are members of the Trust’s Audit Committee.
Each of the Interested Trustees and certain Officers hold comparable officer positions with certain affiliates of MFS.
The Statement of Additional Information for a Fund includes further information about the Trustees and is available without charge upon request by calling 1-800-225-2606.
| | |
Investment Adviser Massachusetts Financial Services Company 111 Huntington Avenue Boston, MA 02199-7618 | | Custodian State Street Bank and Trust Company 1 Lincoln Street Boston, MA 02111-2900 |
Distributor MFS Fund Distributors, Inc. 111 Huntington Avenue Boston, MA 02199-7618 | | Independent Registered Public Accounting Firm Deloitte & Touche LLP 200 Berkeley Street Boston, MA 02116 |
Portfolio Manager(s) Philipp Burgener Alexander Mackey | | |
30
MFS Limited Maturity Portfolio
BOARD REVIEW OF INVESTMENT ADVISORY AGREEMENT
The Investment Company Act of 1940 requires that both the full Board of Trustees and a majority of the non-interested (“independent”) Trustees, voting separately, annually approve the continuation of the Fund’s investment advisory agreement with MFS. The Trustees consider matters bearing on the Fund and its advisory arrangements at their meetings throughout the year, including a review of performance data at each regular meeting. In addition, the independent Trustees met several times over the course of three months beginning in May and ending in July, 2017 (“contract review meetings”) for the specific purpose of considering whether to approve the continuation of the investment advisory agreement for the Fund and the other investment companies that the Board oversees (the “MFS Funds”). The independent Trustees were assisted in their evaluation of the Fund’s investment advisory agreement by independent legal counsel, from whom they received separate legal advice and with whom they met separately from MFS during various contract review meetings. The independent Trustees were also assisted in this process by the MFS Funds’ Independent Senior Officer, a senior officer appointed by and reporting to the independent Trustees.
In connection with their deliberations regarding the continuation of the investment advisory agreement, the Trustees, including the independent Trustees, considered such information and factors as they believed, in light of the legal advice furnished to them and their own business judgment, to be relevant. The investment advisory agreement for the Fund was considered separately, although the Trustees also took into account the common interests of all MFS Funds in their review. As described below, the Trustees considered the nature, quality, and extent of the various investment advisory, administrative, and shareholder services performed by MFS under the existing investment advisory agreement and other arrangements with the Fund.
In connection with their contract review meetings, the Trustees received and relied upon materials that included, among other items: (i) information provided by Broadridge Financial Solutions, Inc. (“Broadridge”), an independent third party, on the investment performance of the Fund for various time periods ended December 31, 2016 and the investment performance of a group of funds with substantially similar investment classifications/objectives (the “Lipper performance universe”), (ii) information provided by Broadridge on the Fund’s advisory fees and other expenses and the advisory fees and other expenses of comparable funds identified by Broadridge (the “Broadridge expense group”), (iii) information provided by MFS on the advisory fees of portfolios of other clients of MFS, including institutional separate accounts and other clients, (iv) information as to whether and to what extent applicable expense waivers, reimbursements or fee “breakpoints” are observed for the Fund, (v) information regarding MFS’ financial results and financial condition, including MFS’ and certain of its affiliates’ estimated profitability from services performed for the Fund and the MFS Funds as a whole, and compared to MFS’ institutional business, (vi) MFS’ views regarding the outlook for the mutual fund industry and the strategic business plans of MFS, (vii) descriptions of various functions performed by MFS for the Funds, such as compliance monitoring and portfolio trading practices, and (viii) information regarding the overall organization of MFS, including information about MFS’ senior management and other personnel providing investment advisory, administrative and other services to the Fund and the other MFS Funds. The comparative performance, fee and expense information prepared and provided by Broadridge was not independently verified and the independent Trustees did not independently verify any information provided to them by MFS.
The Trustees’ conclusion as to the continuation of the investment advisory agreement was based on a comprehensive consideration of all information provided to the Trustees and not the result of any single factor. Some of the factors that figured particularly in the Trustees’ deliberations are described below, although individual Trustees may have evaluated the information presented differently from one another, giving different weights to various factors. It is also important to recognize that the fee arrangements for the Fund and other MFS Funds are the result of years of review and discussion between the independent Trustees and MFS, that certain aspects of such arrangements may receive greater scrutiny in some years than in others, and that the Trustees’ conclusions may be based, in part, on their consideration of these same arrangements during the course of the year and in prior years.
Based on information provided by Broadridge and MFS, the Trustees reviewed the Fund’s total return investment performance as well as the performance of peer groups of funds over various time periods. The Trustees placed particular emphasis on the total return performance of the Fund’s Initial Class shares in comparison to the performance of funds in its Lipper performance universe over the three-year period ended December 31, 2016, which the Trustees believed was a long enough period to reflect differing market conditions. The total return performance of the Fund’s Initial Class shares was in the 1st quintile relative to the other funds in the universe for this three-year period (the 1st quintile being the best performers and the 5th quintile being the worst performers). The total return performance of the Fund’s Initial Class shares was in the 2nd quintile for each of the one- and five-year periods ended December 31, 2016 relative to the Lipper performance universe. Because of the passage of time, these performance results may differ from the performance results for more recent periods, including those shown elsewhere in this report.
In the course of their deliberations, the Trustees took into account information provided by MFS in connection with the contract review meetings, as well as during investment review meetings conducted with portfolio management personnel during the course of the year regarding the Fund’s performance. After reviewing these and related factors, the Trustees concluded, within the context of their overall conclusions regarding the investment advisory agreement, that they were satisfied with MFS’ responses and efforts relating to investment performance.
31
MFS Limited Maturity Portfolio
Board Review of Investment Advisory Agreement – continued
In assessing the reasonableness of the Fund’s advisory fee, the Trustees considered, among other information, the Fund’s advisory fee and the total expense ratio of the Fund’s Initial Class shares as a percentage of average daily net assets and the advisory fee and total expense ratios of peer groups of funds based on information provided by Broadridge. The Trustees considered that, according to the data provided by Broadridge (which takes into account any fee reductions or expense limitations that were in effect during the Fund’s last fiscal year), the Fund’s effective advisory fee rate and total expense ratio were each approximately at the Broadridge expense group median.
The Trustees also considered the advisory fees charged by MFS to any institutional separate accounts advised by MFS (“separate accounts”) and unaffiliated investment companies for which MFS serves as subadviser (“subadvised funds”) that have comparable investment strategies to the Fund, if any. In comparing these fees, the Trustees considered information provided by MFS as to the generally broader scope of services provided by MFS to the Fund, as well as the more extensive regulatory burdens imposed on MFS in managing the Fund, in comparison to separate accounts and subadvised funds. The Trustees also considered the higher demands placed on MFS’ investment personnel and trading infrastructure as a result of the daily cash in-flows and out-flows of the Fund in comparison to separate accounts.
The Trustees also considered whether the Fund may benefit from any economies of scale in the management of the Fund in the event of growth in assets of the Fund and/or growth in assets of the MFS Funds as a whole. They noted that the Fund’s advisory fee rate schedule is not subject to any breakpoints. Taking into account that the Fund’s effective advisory fee rate was approximately at the Broadridge expense group median described above, the Trustees determined not to recommend any advisory fee breakpoints for the Fund at this time. The Trustees also noted that MFS has agreed in writing to waive a portion of the management fees of certain MFS Funds, including the Fund, if the total combined assets of certain funds within the MFS Funds’ complex increase above agreed upon thresholds (the “group fee waiver”), enabling the Fund’s shareholders to share in the benefits from any economies of scale at the complex level. The group fee waiver is reviewed and renewed annually between the Board and MFS. The Trustees concluded that the group fee waiver was sufficient to allow the Fund to benefit from economies of scale as its assets and overall complex assets grow.
The Trustees also considered information prepared by MFS relating to MFS’ costs and profits with respect to the Fund, the MFS Funds considered as a group, and other investment companies and accounts advised by MFS, as well as MFS’ methodologies used to determine and allocate its costs to the MFS Funds, the Fund and other accounts and products for purposes of estimating profitability.
After reviewing these and other factors described herein, the Trustees concluded, within the context of their overall conclusions regarding the investment advisory agreement, that the advisory fees charged to the Fund represent reasonable compensation in light of the services being provided by MFS to the Fund.
In addition, the Trustees considered MFS’ resources and related efforts to continue to retain, attract and motivate capable personnel to serve the Fund. The Trustees also considered current and developing conditions in the financial services industry, including the presence of large and well-capitalized companies which are spending, and appear to be prepared to continue to spend, substantial sums to engage personnel and to provide services to competing investment companies. In this regard, the Trustees also considered the financial resources of MFS and its ultimate parent, Sun Life Financial Inc. The Trustees also considered the advantages and possible disadvantages to the Fund of having an adviser that also serves other investment companies as well as other accounts.
The Trustees also considered the nature, quality, cost, and extent of administrative, transfer agency, and distribution services provided to the Fund by MFS and its affiliates under agreements and plans other than the investment advisory agreement, including any 12b-1 fees the Fund pays to MFS Fund Distributors, Inc., an affiliate of MFS. The Trustees also considered the nature, extent and quality of certain other services MFS performs or arranges for on the Fund’s behalf, which may include securities lending programs, directed expense payment programs, class action recovery programs, and MFS’ interaction with third-party service providers, principally custodians and sub-custodians. The Trustees concluded that the various non-advisory services provided by MFS and its affiliates on behalf of the Fund were satisfactory.
The Trustees also considered benefits to MFS from the use of the Fund’s portfolio brokerage commissions, if applicable, to pay for investment research and various other factors. Additionally, the Trustees considered so-called “fall-out benefits” to MFS such as reputational value derived from serving as investment manager to the Fund.
Based on their evaluation of factors that they deemed to be material, including those factors described above, the Board of Trustees, including the independent Trustees, concluded that the Fund’s investment advisory agreement with MFS should be continued for an additional one-year period, commencing August 1, 2017.
32
MFS Limited Maturity Portfolio
PROXY VOTING POLICIES AND INFORMATION
MFS votes proxies on behalf of the fund pursuant to proxy voting policies and procedures that are available without charge, upon request, by calling 1-800-225-2606, by visiting mfs.com/proxyvoting, or by visiting the SEC’s Web site at http://www.sec.gov.
Information regarding how the fund voted proxies relating to portfolio securities during the most recent twelve-month period ended June 30 is available by August 31 of each year without charge by visiting mfs.com/proxyvoting, or by visiting the SEC’s Web site at http://www.sec.gov.
QUARTERLY PORTFOLIO DISCLOSURE
The fund will file a complete schedule of portfolio holdings with the Securities and Exchange Commission (the Commission) for the first and third quarters of each fiscal year on Form N-Q. The fund’s Form N-Q is available on the EDGAR database on the Commission’s Internet Web site at http://www.sec.gov, and may be reviewed and copied at the:
Public Reference Room
Securities and Exchange Commission
100 F Street, NE, Room 1580
Washington, D.C. 20549
Information on the operation of the Public Reference Room may be obtained by calling the Commission at 1-800-SEC-0330. Copies of the fund’s Form N-Q also may be obtained, upon payment of a duplicating fee, by electronic request at the following e-mail address: publicinfo@sec.gov or by writing the Public Reference Section at the above address.
FURTHER INFORMATION
From time to time, MFS may post important information about the fund or the MFS funds on the MFS web site (mfs.com). This information is available at https://www.mfs.com/en-us/what-we-do/announcements.html or at mfs.com/vit3 by choosing the fund’s name.
INFORMATION ABOUT FUND CONTRACTS AND LEGAL CLAIMS
The fund has entered into contractual arrangements with an investment adviser, administrator, distributor, shareholder servicing agent, 529 program manager (if applicable), and custodian who each provide services to the fund. Unless expressly stated otherwise, shareholders are not parties to, or intended beneficiaries of these contractual arrangements, and these contractual arrangements are not intended to create any shareholder right to enforce them against the service providers or to seek any remedy under them against the service providers, either directly or on behalf of the fund.
Under the Trust’s By-Laws and Declaration of Trust, any claims asserted against or on behalf of the MFS Funds, including claims against Trustees and Officers, must be brought in state and federal courts located within the Commonwealth of Massachusetts.
33
rev. 3/16
| | | | |
| FACTS | | WHAT DOES MFS DO WITH YOUR
PERSONAL INFORMATION? | |  |
| | |
| Why? | | Financial companies choose how they share your personal information. Federal law gives consumers the right to limit some but not all sharing. Federal law also requires us to tell you how we collect, share, and protect your personal information. Please read this notice carefully to understand what we do. |
| | |
| What? | | The types of personal information we collect and share depend on the product or service you have with us. This information can include: • Social Security number and account balances • Account transactions and transaction history • Checking account information and wire transfer instructions When you are no longer our customer, we continue to share your information as described in this notice. |
| | |
| How? | | All financial companies need to share customers’ personal information to run their everyday business. In the section below, we list the reasons financial companies can share their customers’ personal information; the reasons MFS chooses to share; and whether you can limit this sharing. |
| | | | |
Reasons we can share your
personal information | | Does MFS share? | | Can you limit this
sharing? |
For our everyday business purposes – such as to process your transactions, maintain your account(s), respond to court orders and legal investigations, or report to credit bureaus | | Yes | | No |
For our marketing purposes – to offer our products and services to you | | No | | We don’t share |
| For joint marketing with other financial companies | | No | | We don’t share |
For our affiliates’ everyday business purposes – information about your transactions and experiences | | No | | We don’t share |
For our affiliates’ everyday business purposes – information about your creditworthiness | | No | | We don’t share |
| For nonaffiliates to market to you | | No | | We don’t share |
| | |
| Questions? | | Call 800-225-2606 or go to mfs.com. |
34
| | |
| Who we are |
| Who is providing this notice? | | MFS Funds, MFS Investment Management, MFS Institutional Advisors, Inc., and MFS Heritage Trust Company. |
| | |
| What we do |
| How does MFS protect my personal information? | | To protect your personal information from unauthorized access and use, we use security measures that comply with federal law. These measures include procedural, electronic, and physical safeguards for the protection of the personal information we collect about you. |
How does MFS
collect my personal information? | | We collect your personal information, for example, when you • open an account or provide account information • direct us to buy securities or direct us to sell your securities • make a wire transfer We also collect your personal information from others, such as credit bureaus, affiliates, or other companies. |
| Why can’t I limit all sharing? | | Federal law gives you the right to limit only • sharing for affiliates’ everyday business purposes – information about your creditworthiness • affiliates from using your information to market to you • sharing for nonaffiliates to market to you State laws and individual companies may give you additional rights to limit sharing. |
| | |
| Definitions |
| Affiliates | | Companies related by common ownership or control. They can be financial and nonfinancial companies. • MFS does not share personal information with affiliates, except for everyday business purposes as described on page one of this notice. |
| Nonaffiliates | | Companies not related by common ownership or control. They can be financial and nonfinancial companies. • MFS does not share with nonaffiliates so they can market to you. |
| Joint marketing | | A formal agreement between nonaffiliated financial companies that together market financial products or services to you. • MFS doesn’t jointly market. |
| | |
| Other important information |
| If you own an MFS product or receive an MFS service in the name of a third party such as a bank or broker-dealer, their privacy policy may apply to you instead of ours. |
35
ANNUAL REPORT
December 31, 2017

MFS® MID CAP
VALUE PORTFOLIO
MFS® Variable Insurance Trust III

VMC-ANN
MFS® MID CAP VALUE PORTFOLIO
CONTENTS
The report is prepared for the general information of contract owners. It is authorized for distribution to prospective investors only when preceded or accompanied by a current prospectus.
NOT FDIC INSURED • MAY LOSE VALUE • NO BANK OR CREDIT UNION GUARANTEE • NOT A DEPOSIT • NOT INSURED BY ANY FEDERAL GOVERNMENT AGENCY OR NCUA/NCUSIF
MFS Mid Cap Value Portfolio
LETTER FROM THE EXECUTIVE CHAIRMAN

Dear Contract Owners:
Rising bond yields have led to a measurable uptick in market volatility, which has been a departure from the low-volatility environment that prevailed for much of 2017. In spite of this, global markets remain elevated amid synchronized economic growth. Although the U.S. Federal Reserve continues to gradually raise interest rates and shrink its balance sheet, monetary policy remains accommodative around the world, with many central banks taking only tentative steps toward tighter policies. However, interest rates have begun to rise globally of late as investors anticipate that central policy shifts may be necessary in the months ahead.
Newly enacted U.S. tax reforms have been welcomed by equity markets while emerging market economies have been boosted by a weaker U.S. dollar. Around the world, inflation remains largely subdued but tight labor markets and solid global demand have investors on the lookout for its potential resurgence amid robust global trade and recovering commodity prices.
At MFS®, we believe having a disciplined, long-term investment approach through a full market cycle is essential to capturing the best opportunities while also managing risk. In our view, such a strategy, along with the professional guidance of a financial advisor, will help you reach your investment objectives.
Respectfully,

Robert J. Manning
Executive Chairman
MFS Investment Management
February 15, 2018
The opinions expressed in this letter are subject to change and may not be relied upon for investment advice. No forecasts can be guaranteed.
1
MFS Mid Cap Value Portfolio
PORTFOLIO COMPOSITION
Portfolio structure

| | | | |
| Top ten holdings | | | | |
| Hartford Financial Services Group, Inc. | | | 1.4% | |
| KeyCorp | | | 1.3% | |
| Stanley Black & Decker, Inc. | | | 1.3% | |
| Pinnacle Foods, Inc. | | | 1.2% | |
| Comerica, Inc. | | | 1.2% | |
| Discover Financial Services | | | 1.2% | |
| NASDAQ, Inc. | | | 1.2% | |
| Unum Group | | | 1.2% | |
| Huntington Bancshares, Inc. | | | 1.2% | |
| Citizens Financial Group, Inc. | | | 1.1% | |
| | | | |
| Equity sectors | | | | |
| Financial Services | | | 28.7% | |
| Industrial Goods & Services | | | 9.3% | |
| Utilities & Communications | | | 8.4% | |
| Basic Materials | | | 7.5% | |
| Energy | | | 7.0% | |
| Consumer Staples | | | 6.8% | |
| Technology | | | 6.5% | |
| Health Care | | | 6.4% | |
| Autos & Housing | | | 5.3% | |
| Retailing | | | 4.6% | |
| Special Products & Services | | | 3.3% | |
| Leisure | | | 2.7% | |
| Transportation | | | 2.5% | |
Cash & Cash Equivalents includes any cash, investments in money market funds, short-term securities, and other assets less liabilities. Please see the Statement of Assets and Liabilities for additional information related to the fund’s cash position and other assets and liabilities.
Percentages are based on net assets as of December 31, 2017.
The portfolio is actively managed and current holdings may be different.
2
MFS Mid Cap Value Portfolio
MANAGEMENT REVIEW
Summary of Results
For the twelve months ended December 31, 2017, Initial Class shares of the MFS Mid Cap Value Portfolio (“fund”) provided a total return of 13.67%, while Service Class shares of the fund provided a total return of 13.41%. These compare with a return of 13.34% over the same period for the fund’s benchmark, the Russell Midcap® Value Index.
Market Environment
For the first time in many years, the global economy experienced a period of synchronized economic growth over the reporting period. The rebound in emerging markets (“EM”) economies was more pronounced (despite the slight deceleration in Chinese growth at the end of the period), helped by larger economies, such as Brazil and Russia, emerging from recessions. At the same time, developed markets (“DM”) economies continued to grow at or above potential. Market confidence increased in the US during the period fueled, in part, by a more lenient US regulatory backdrop and hopes for a significant cut in corporate tax rates, which came to fruition at the end of the period.
Globally, markets benefited from a reflation trade as commodity prices strengthened, activity and growth prospects improved, and inflation moved higher, though within moderate bounds. As a result, there were more tightening signals and actions by DM central banks. The US Federal Reserve increased interest rates by 25 basis points three times during the period, bringing the total number of quarter-percent hikes in the federal funds rate to five, since December 2015. The European Central Bank announced an extension of its quantitative easing program at the end of the period, but reduced the pace of its monthly asset purchases by half. In addition, the Bank of England hiked its base rate for the first time in a decade, late in the end of the period. Markets were comforted, along with central banks, by the decline in fears of a populist surge in Europe after establishment candidates won the Dutch and French elections, though a right-wing populist party gained seats in the German parliament for the first time in the post-World War II era. Additionally, European growth reflected a generally calmer political economic backdrop.
In recent months, the US dollar reversed the sharp rise seen early in the period, easing what had been a substantial headwind to earnings for multinationals. US consumer spending held up well during the second half of the period amid a modest increase in real wages and relatively low gasoline prices. However, demand for autos cooled from the record level logged early in the period, while the housing market improved, albeit constrained by below-average inventory levels. Global trade, which was sluggish early in the period, showed signs of improvement in the period’s second half, a positive indicator of global economic activity and prospects. Early in the period, there was a selloff in EM due to fears that President Trump would follow through on various campaign threats and promises that were judged to be detrimental to EM. While President Trump withdrew the US from the Trans-Pacific Partnership and began the renegotiation of the North American Free Trade Agreement, significant additional policy action was lacking on economic issues involving EM. As a result, EM resumed their upward trajectory, powered by strong inflows throughout 2017.
Contributors to Performance
Strong stock selection in the financial services sector was a primary factor that benefited performance relative to the Russell Midcap® Value Index. Within this sector, the fund’s holdings of alternative investment manager Apollo Global Management (b) lifted relative returns as rising financial markets helped drive solid earnings growth.
Both security selection and an overweight position in the health care sector further supported relative results. Within this sector, not holding shares of poor-performing healthcare services provider Cardinal Health aided relative performance. Shares of Cardinal Health declined due to deflationary pressures in the generic drug market which negatively impacted the company’s earnings.
An overweight position in the autos & housing sector also contributed to relative performance. Within this sector, the fund’s overweight positions in residential and commercial building materials manufacturer Owens Corning and power and hand tool manufacturer Stanley Black & Decker, as well as holdings of vehicle components manufacturer Aptiv (b)(h), strengthened relative returns. Shares of Owens Corning advanced throughout the period on the back of strong roofing and composites sales.
Elsewhere, an overweight position in chemical research company FMC, as well as owning shares of communications and aviation electronics product manufacturer Rockwell Collins (b)(h), agricultural equipment manufacturer Deere & Company (b) and integrated circuit manufacturer Maxim Integrated Products (b), positively impacted relative performance. Not holding shares of oilfield products and solutions provider Baker Hughes also helped.
Detractors from Performance
Security selection in both the technology and energy sectors hurt relative performance during the reporting period. Within the technology sector, not holding shares of semiconductor company Micron Technology, and owning shares of consumer transaction solutions provider NCR (b), detracted from relative results. NCR’s stock fell as weaker-than-expected revenues appeared to have weighed on investor sentiment. Within the energy sector, overweight positions in tubular services provider Frank’s International and
3
MFS Mid Cap Value Portfolio
Management Review – continued
oilfield equipment and service provider Superior Energy Services, as well as holding shares of natural gas and crude oil company PDC Energy (b), oilfield engineering solutions provider Oil States International (b) and oilfield product company Forum Energy Technologies (b), hindered relative returns.
The combination of an overweight position and stock selection in the consumer staples sector further diminished relative returns. Within this sector, the fund’s overweight position in Treehouse Foods weakened relative results as pricing and competitive pressures translated into sales and earnings that missed expectations.
Stocks in other sectors that detracted from relative returns included overweight positions in beauty supply retailer Sally Beauty Holdings (h) and advertising and marketing services conglomerate Interpublic Group. Shares of Sally Beauty Holdings lagged the benchmark as disappointing same-store sales hurt the company’s financial results.
Respectfully,
Portfolio Manager(s)
Kevin Schmitz and Brooks Taylor
| (b) | Security is not a benchmark constituent. |
| (h) | Security was not held in the portfolio at period end. |
The views expressed in this report are those of the portfolio manager(s) only through the end of the period of the report as stated on the cover and do not necessarily reflect the views of MFS or any other person in the MFS organization. These views are subject to change at any time based on market or other conditions, and MFS disclaims any responsibility to update such views. These views may not be relied upon as investment advice or an indication of trading intent on behalf of any MFS portfolio. References to specific securities are not recommendations of such securities, and may not be representative of any MFS portfolio’s current or future investments.
4
MFS Mid Cap Value Portfolio
PERFORMANCE SUMMARY THROUGH 12/31/17
The following chart illustrates the historical performance of the fund in comparison to its benchmark(s). Benchmarks are unmanaged and may not be invested in directly. Benchmark returns do not reflect any fees or expenses. The performance of other share classes will be greater than or less than that of the class depicted below. (See Notes to Performance Summary.)
Performance data shown represents past performance and is no guarantee of future results. Investment return and principal value fluctuate so your units, when sold, may be worth more or less than the original cost; current performance may be lower or higher than quoted. The performance shown does not reflect the deduction of taxes, if any, that a contract holder would pay on fund distributions or the redemption of contract units. The returns for the fund shown also do not reflect the deduction of expenses associated with variable products, such as mortality and expense risk charges, separate account charges, and sales charges imposed by the insurance company separate accounts. Such expenses would reduce the overall returns shown.
Growth of a Hypothetical $10,000 Investment (t)
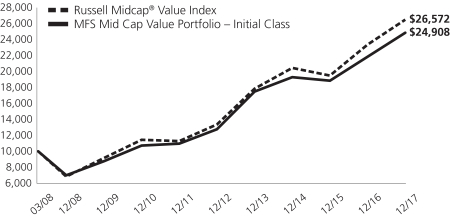
Total Returns through 12/31/17
Average annual total returns
| | | | | | | | | | | | |
| | | Share Class | | Class Inception Date | | 1-yr | | 5-yr | | Life (t) | | |
| | | Initial Class | | 3/07/08 | | 13.67% | | 14.24% | | 9.74% | | |
| | | Service Class | | 3/07/08 | | 13.41% | | 13.96% | | 9.45% | | |
| | | | |
| Comparative benchmark(s) | | | | | | | | |
| | | Russell Midcap® Value Index (f) | | 13.34% | | 14.68% | | 10.46% | | |
| (f) | Source: FactSet Research Systems Inc. |
| (t) | For the period from the class inception date through the stated period end. (See Notes to Performance Summary.) |
Benchmark Definition(s)
Russell Midcap® Value Index – constructed to provide a comprehensive barometer for value securities in the mid-cap segment of the U.S. equity universe. Companies in this index generally have lower price-to-book ratios and lower forecasted growth values. The Russell Midcap® Value Index is a trademark/service mark of the Frank Russell Company. Russell® is a trademark of the Frank Russell Company.
It is not possible to invest directly in an index.
Notes to Performance Summary
Average annual total return represents the average annual change in value for each share class for the periods presented. Life returns are presented where the share class has less than 10 years of performance history and represent the average annual total return from the class inception date to the stated period end date.
Performance results reflect any applicable expense subsidies and waivers in effect during the periods shown. Without such subsidies and waivers the fund’s performance results would be less favorable. Please see the prospectus and financial statements for complete details. All results are historical and assume the reinvestment of any dividends and capital gains distributions.
5
MFS Mid Cap Value Portfolio
Performance Summary – continued
Performance prior to close of business December 7, 2012, reflects time periods when another adviser or subadviser was responsible for selecting investments for the fund under a different investment objective and different investment strategies.
Performance results do not include adjustments made for financial reporting purposes in accordance with U.S. generally accepted accounting principles and may differ from amounts reported in the financial highlights.
From time to time the fund may receive proceeds from litigation settlements, without which performance would be lower.
6
MFS Mid Cap Value Portfolio
EXPENSE TABLE
Fund Expenses Borne by the Contract Holders during the Period, July 1, 2017 through December 31, 2017
As a contract holder of the fund, you incur ongoing costs, including management fees; distribution and/or service (12b-1) fees; and other fund expenses. This example is intended to help you understand your ongoing costs (in dollars) of investing in the fund and to compare these costs with the ongoing costs of investing in other mutual funds.
The example is based on an investment of $1,000 invested at the beginning of the period and held for the entire period July 1, 2017 through December 31, 2017.
Actual Expenses
The first line for each share class in the following table provides information about actual account values and actual expenses. You may use the information in this line, together with the amount you invested, to estimate the expenses that you paid over the period. Simply divide your account value by $1,000 (for example, an $8,600 account value divided by $1,000 = 8.6), then multiply the result by the number in the first line under the heading entitled “Expenses Paid During Period” to estimate the expenses you paid on your account during this period.
Hypothetical Example for Comparison Purposes
The second line for each share class in the following table provides information about hypothetical account values and hypothetical expenses based on the fund’s actual expense ratio and an assumed rate of return of 5% per year before expenses, which is not the fund’s actual return. The hypothetical account values and expenses may not be used to estimate the actual ending account balance or expenses you paid for the period. You may use this information to compare the ongoing costs of investing in the fund and other funds. To do so, compare this 5% hypothetical example with the 5% hypothetical examples that appear in the shareholder reports of the other funds.
Please note that the expenses shown in the table are meant to highlight the fund’s ongoing costs only and do not take into account the fees and expenses imposed under the variable contracts through which your investment in the fund is made. Therefore, the second line for each share class in the table is useful in comparing ongoing costs associated with an investment in vehicles (such as the fund) which fund benefits under variable annuity and variable life insurance contracts and to qualified pension and retirement plans only, and will not help you determine the relative total costs of investing in the fund through variable annuity and variable life insurance contracts. If the fees and expenses imposed under the variable contracts were included, your costs would have been higher.
| | | | | | | | | | | | | | | | | | |
| Share Class | | | | Annualized
Expense Ratio | | | Beginning
Account Value
7/01/17 | | | Ending
Account Value
12/31/17 | | | Expenses Paid
During Period (p)
7/01/17-12/31/17 | |
| Initial Class | | Actual | | | 0.81% | | | | $1,000.00 | | | | $1,072.08 | | | | $4.23 | |
| | Hypothetical (h) | | | 0.81% | | | | $1,000.00 | | | | $1,021.12 | | | | $4.13 | |
| Service Class | | Actual | | | 1.05% | | | | $1,000.00 | | | | $1,070.27 | | | | $5.48 | |
| | Hypothetical (h) | | | 1.05% | | | | $1,000.00 | | | | $1,019.91 | | | | $5.35 | |
| (h) | 5% class return per year before expenses. |
| (p) | “Expenses Paid During Period” are equal to each class’s annualized expense ratio, as shown above, multiplied by the average account value over the period, multiplied by 184/365 (to reflect the one-half year period). |
7
MFS Mid Cap Value Portfolio
PORTFOLIO OF INVESTMENTS – 12/31/17
The Portfolio of Investments is a complete list of all securities owned by your fund. It is categorized by broad-based asset classes.
| | | | | | | | |
| Issuer | | Shares/Par | | | Value ($) | |
| COMMON STOCKS – 99.0% | | | | | | | | |
| Aerospace – 2.6% | | | | | | | | |
| Harris Corp. | | | 18,964 | | | $ | 2,686,251 | |
| L3 Technologies, Inc. | | | 20,259 | | | | 4,008,243 | |
| Leidos Holdings, Inc. | | | 37,231 | | | | 2,404,006 | |
| | | | | | | | |
| | | | | | $ | 9,098,500 | |
| | | | | | | | |
| Airlines – 1.3% | | | | | | | | |
| Alaska Air Group, Inc. | | | 21,576 | | | $ | 1,586,052 | |
| Delta Air Lines, Inc. | | | 52,992 | | | | 2,967,552 | |
| | | | | | | | |
| | | | | | $ | 4,553,604 | |
| | | | | | | | |
| Alcoholic Beverages – 0.6% | | | | | | | | |
| Molson Coors Brewing Co. | | | 24,443 | | | $ | 2,006,037 | |
| | | | | | | | |
| Apparel Manufacturers – 1.2% | | | | | | | | |
| Hanesbrands, Inc. | | | 83,754 | | | $ | 1,751,296 | |
| PVH Corp. | | | 17,697 | | | | 2,428,205 | |
| | | | | | | | |
| | | | | | $ | 4,179,501 | |
| | | | | | | | |
| Automotive – 1.9% | | | | | | | | |
| Goodyear Tire & Rubber Co. | | | 59,641 | | | $ | 1,927,001 | |
| Harley-Davidson, Inc. | | | 44,016 | | | | 2,239,534 | |
| LKQ Corp. (a) | | | 66,735 | | | | 2,714,112 | |
| | | | | | | | |
| | | | | | $ | 6,880,647 | |
| | | | | | | | |
| Broadcasting – 0.8% | | | | | | | | |
| Interpublic Group of Companies, Inc. | | | 135,202 | | | $ | 2,725,672 | |
| | | | | | | | |
| Brokerage & Asset Managers – 4.5% | | | | | |
| Apollo Global Management LLC, “A” | | | 69,922 | | | $ | 2,340,289 | |
| Invesco Ltd. | | | 106,307 | | | | 3,884,458 | |
| NASDAQ, Inc. | | | 53,450 | | | | 4,106,564 | |
| Raymond James Financial, Inc. | | | 34,613 | | | | 3,090,941 | |
| TD Ameritrade Holding Corp. | | | 52,212 | | | | 2,669,600 | |
| | | | | | | | |
| | | | | | $ | 16,091,852 | |
| | | | | | | | |
| Business Services – 3.3% | | | | | | | | |
| Amdocs Ltd. | | | 46,366 | | | $ | 3,036,046 | |
| Brenntag AG | | | 23,224 | | | | 1,465,001 | |
| Fidelity National Information Services, Inc. | | | 38,109 | | | | 3,585,676 | |
| First Data Corp. (a) | | | 93,711 | | | | 1,565,911 | |
| Global Payments, Inc. | | | 20,822 | | | | 2,087,197 | |
| | | | | | | | |
| | | | | | $ | 11,739,831 | |
| | | | | | | | |
| Cable TV – 0.2% | | | | | | | | |
| Altice USA, Inc. (a)(l) | | | 42,988 | | | $ | 912,635 | |
| | | | | | | | |
| Chemicals – 3.2% | | | | | | | | |
| Celanese Corp. | | | 28,194 | | | $ | 3,019,014 | |
| Eastman Chemical Co. | | | 30,231 | | | | 2,800,600 | |
| FMC Corp. | | | 28,003 | | | | 2,650,764 | |
| PPG Industries, Inc. | | | 23,770 | | | | 2,776,811 | |
| | | | | | | | |
| | | | | | $ | 11,247,189 | |
| | | | | | | | |
| | | | | | | | |
| Issuer | | Shares/Par | | | Value ($) | |
| COMMON STOCKS – continued | | | | | |
| Computer Software – 1.3% | | | | | | | | |
| Check Point Software Technologies Ltd. (a) | | | 14,997 | | | $ | 1,553,989 | |
| Sabre Corp. | | | 46,901 | | | | 961,471 | |
| Symantec Corp. | | | 71,991 | | | | 2,020,067 | |
| | | | | | | | |
| | | | | | $ | 4,535,527 | |
| | | | | | | | |
| Computer Software – Systems – 2.3% | | | | | |
| NCR Corp. (a) | | | 64,516 | | | $ | 2,192,899 | |
| NICE Systems Ltd., ADR | | | 24,623 | | | | 2,263,100 | |
| Verint Systems, Inc. (a) | | | 25,770 | | | | 1,078,475 | |
| Xerox Corp. | | | 85,005 | | | | 2,477,896 | |
| | | | | | | | |
| | | | | | $ | 8,012,370 | |
| | | | | | | | |
| Construction – 2.5% | | | | | | | | |
| Owens Corning | | | 30,623 | | | $ | 2,815,479 | |
| Stanley Black & Decker, Inc. | | | 27,231 | | | | 4,620,828 | |
| Toll Brothers, Inc. | | | 29,393 | | | | 1,411,452 | |
| | | | | | | | |
| | | | | | $ | 8,847,759 | |
| | | | | | | | |
| Consumer Products – 1.3% | | | | | | | | |
| Coty, Inc., “A” | | | 101,910 | | | $ | 2,026,990 | |
| Newell Brands, Inc. | | | 81,085 | | | | 2,505,527 | |
| | | | | | | | |
| | | | | | $ | 4,532,517 | |
| | | | | | | | |
| Containers – 2.1% | | | | | | | | |
| Berry Global Group, Inc. (a) | | | 44,199 | | | $ | 2,593,155 | |
| Graphic Packaging Holding Co. | | | 160,129 | | | | 2,473,993 | |
| Sealed Air Corp. | | | 46,545 | | | | 2,294,669 | |
| | | | | | | | |
| | | | | | $ | 7,361,817 | |
| | | | | | | | |
| Electrical Equipment – 2.2% | | | | | | | | |
| HD Supply Holdings, Inc. (a) | | | 53,493 | | | $ | 2,141,325 | |
| Sensata Technologies Holding B.V. (a) | | | 47,883 | | | | 2,447,300 | |
| TE Connectivity Ltd. | | | 20,391 | | | | 1,937,961 | |
| WESCO International, Inc. (a) | | | 20,671 | | | | 1,408,729 | |
| | | | | | | | |
| | | | | | $ | 7,935,315 | |
| | | | | | | | |
| Electronics – 2.3% | | | | | | | | |
| Analog Devices, Inc. | | | 35,067 | | | $ | 3,122,015 | |
| Keysight Technologies, Inc. (a) | | | 52,876 | | | | 2,199,642 | |
| Maxim Integrated Products, Inc. | | | 55,650 | | | | 2,909,382 | |
| | | | | | | | |
| | | | | | $ | 8,231,039 | |
| | | | | | | | |
| Energy – Independent – 5.3% | | | | | | | | |
| Cabot Oil & Gas Corp. | | | 107,247 | | | $ | 3,067,264 | |
| Concho Resources, Inc. (a) | | | 10,360 | | | | 1,556,279 | |
| Energen Corp. (a) | | | 44,351 | | | | 2,553,287 | |
| EQT Corp. | | | 38,052 | | | | 2,165,920 | |
| Hess Corp. | | | 51,480 | | | | 2,443,756 | |
| HollyFrontier Corp. | | | 42,812 | | | | 2,192,831 | |
| PDC Energy, Inc. (a) | | | 32,626 | | | | 1,681,544 | |
| Pioneer Natural Resources Co. | | | 17,605 | | | | 3,043,024 | |
| | | | | | | | |
| | | | | | $ | 18,703,905 | |
| | | | | | | | |
8
MFS Mid Cap Value Portfolio
Portfolio of Investments – continued
| | | | | | | | |
| Issuer | | Shares/Par | | | Value ($) | |
| COMMON STOCKS – continued | | | | | |
| Engineering – Construction – 0.7% | | | | | | | | |
| KBR, Inc. | | | 120,117 | | | $ | 2,381,920 | |
| | | | | | | | |
| Entertainment – 0.3% | | | | | | | | |
| Madison Square Garden Co., “A” (a) | | | 4,972 | | | $ | 1,048,346 | |
| | | | | | | | |
| Food & Beverages – 4.9% | |
| Archer Daniels Midland Co. | | | 52,345 | | | $ | 2,097,988 | |
| Bunge Ltd. | | | 9,185 | | | | 616,130 | |
| Cal-Maine Foods, Inc. (a)(l) | | | 19,978 | | | | 888,022 | |
| Coca-Cola European Partners PLC | | | 54,616 | | | | 2,176,448 | |
| J.M. Smucker Co. | | | 20,113 | | | | 2,498,839 | |
| Pinnacle Foods, Inc. | | | 70,249 | | | | 4,177,708 | |
| TreeHouse Foods, Inc. (a) | | | 35,336 | | | | 1,747,719 | |
| Tyson Foods, Inc., “A” | | | 39,734 | | | | 3,221,235 | |
| | | | | | | | |
| | | $ | 17,424,089 | |
| | | | | | | | |
| Food & Drug Stores – 0.9% | |
| Kroger Co. | | | 78,790 | | | $ | 2,162,786 | |
| Tesco PLC | | | 320,014 | | | | 904,101 | |
| | | | | | | | |
| | | | | | $ | 3,066,887 | |
| | | | | | | | |
| Furniture & Appliances – 0.9% | |
| Whirlpool Corp. | | | 18,219 | | | $ | 3,072,452 | |
| | | | | | | | |
| Gaming & Lodging – 0.7% | |
| Royal Caribbean Cruises Ltd. | | | 20,051 | | | $ | 2,391,683 | |
| | | | | | | | |
| Insurance – 7.3% | |
| Arthur J. Gallagher & Co. | | | 41,614 | | | $ | 2,633,334 | |
| Assurant, Inc. | | | 18,195 | | | | 1,834,784 | |
| Brighthouse Financial, Inc. (a) | | | 11,584 | | | | 679,286 | |
| Everest Re Group Ltd. | | | 10,797 | | | | 2,388,944 | |
| Hanover Insurance Group, Inc. | | | 20,896 | | | | 2,258,440 | |
| Hartford Financial Services Group, Inc. | | | 90,662 | | | | 5,102,457 | |
| Lincoln National Corp. | | | 27,934 | | | | 2,147,287 | |
| Unum Group | | | 74,726 | | | | 4,101,710 | |
| Validus Holdings Ltd. | | | 31,839 | | | | 1,493,886 | |
| XL Group Ltd. | | | 86,861 | | | | 3,054,033 | |
| | | | | | | | |
| | | | | | $ | 25,694,161 | |
| | | | | | | | |
| Machinery & Tools – 3.0% | |
| Deere & Co. | | | 17,579 | | | $ | 2,751,289 | |
| Eaton Corp. PLC | | | 41,349 | | | | 3,266,984 | |
| ITT, Inc. | | | 51,322 | | | | 2,739,055 | |
| Regal Beloit Corp. | | | 25,272 | | | | 1,935,835 | |
| | | | | | | | |
| | | | | | $ | 10,693,163 | |
| | | | | | | | |
| Major Banks – 3.6% | |
| Comerica, Inc. | | | 47,569 | | | $ | 4,129,465 | |
| Huntington Bancshares, Inc. | | | 279,694 | | | | 4,072,344 | |
| KeyCorp | | | 232,148 | | | | 4,682,425 | |
| | | | | | | | |
| | | | | | $ | 12,884,234 | |
| | | | | | | | |
| Medical & Health Technology & Services – 3.0% | |
| AmerisourceBergen Corp. | | | 29,173 | | | $ | 2,678,665 | |
| LifePoint Health, Inc. (a) | | | 30,661 | | | | 1,526,918 | |
| MEDNAX, Inc. (a) | | | 23,455 | | | | 1,253,435 | |
| Premier, Inc., “A” (a) | | | 36,783 | | | | 1,073,696 | |
| | | | | | | | |
| Issuer | | Shares/Par | | | Value ($) | |
| COMMON STOCKS – continued | | | | | |
| Medical & Health Technology & Services – continued | |
| Quest Diagnostics, Inc. | | | 24,824 | | | $ | 2,444,916 | |
| Universal Health Services, Inc. | | | 13,587 | | | | 1,540,086 | |
| | | | | | | | |
| | | | | | $ | 10,517,716 | |
| | | | | | | | |
| Medical Equipment – 2.9% | |
| Dentsply Sirona, Inc. | | | 30,265 | | | $ | 1,992,345 | |
| PerkinElmer, Inc. | | | 25,020 | | | | 1,829,462 | |
| Steris PLC | | | 30,499 | | | | 2,667,748 | |
| Zimmer Biomet Holdings, Inc. | | | 30,938 | | | | 3,733,288 | |
| | | | | | | | |
| | | | | | $ | 10,222,843 | |
| | | | | | | | |
| Natural Gas – Distribution – 1.0% | |
| NiSource, Inc. | | | 63,821 | | | $ | 1,638,285 | |
| Sempra Energy | | | 19,095 | | | | 2,041,637 | |
| | | | | | | | |
| | | | | | $ | 3,679,922 | |
| | | | | | | | |
| Natural Gas – Pipeline – 0.7% | |
| Plains GP Holdings LP | | | 111,238 | | | $ | 2,441,674 | |
| | | | | | �� | | |
| Network & Telecom – 0.6% | |
| Motorola Solutions, Inc. | | | 25,341 | | | $ | 2,289,306 | |
| | | | | | | | |
| Oil Services – 1.7% | |
| Forum Energy Technologies, Inc. (a) | | | 88,648 | | | $ | 1,378,476 | |
| Frank’s International N.V. | | | 178,716 | | | | 1,188,461 | |
| NOW, Inc. (a) | | | 91,846 | | | | 1,013,061 | |
| Oil States International, Inc. (a) | | | 52,113 | | | | 1,474,798 | |
| Superior Energy Services, Inc. (a) | | | 113,310 | | | | 1,091,175 | |
| | | | | | | | |
| | | | | | $ | 6,145,971 | |
| | | | | | | | |
| Other Banks & Diversified Financials – 7.4% | |
| Citizens Financial Group, Inc. | | | 96,656 | | | $ | 4,057,619 | |
| Discover Financial Services | | | 53,467 | | | | 4,112,682 | |
| Element Fleet Management Corp. | | | 177,150 | | | | 1,338,842 | |
| Fifth Third Bancorp | | | 126,245 | | | | 3,830,273 | |
| M&T Bank Corp. | | | 17,794 | | | | 3,042,596 | |
| Northern Trust Corp. | | | 31,299 | | | | 3,126,457 | |
| SunTrust Banks, Inc. | | | 62,261 | | | | 4,021,438 | |
| Wintrust Financial Corp. | | | 31,553 | | | | 2,599,021 | |
| | | | | | | | |
| | | | | | $ | 26,128,928 | |
| | | | | | | | |
| Pharmaceuticals – 0.5% | |
| Mylan N.V. (a) | | | 43,137 | | | $ | 1,825,126 | |
| | | | | | | | |
| Pollution Control – 0.8% | |
| Clean Harbors, Inc. (a) | | | 50,660 | | | $ | 2,745,772 | |
| | | | | | | | |
| Railroad & Shipping – 0.7% | |
| Kansas City Southern Co. | | | 23,843 | | | $ | 2,508,760 | |
| | | | | | | | |
| Real Estate – 5.9% | |
| Annaly Capital Management, Inc., REIT | | | 111,196 | | | $ | 1,322,120 | |
| Brixmor Property Group Inc., REIT | | | 112,085 | | | | 2,091,506 | |
| EPR Properties, REIT | | | 28,676 | | | | 1,877,131 | |
| Life Storage, Inc., REIT | | | 41,807 | | | | 3,723,749 | |
| Medical Properties Trust, Inc., REIT | | | 236,558 | | | | 3,259,769 | |
| Mid-America Apartment Communities, Inc., REIT | | | 22,804 | | | | 2,293,170 | |
| Realogy Holdings Corp. | | | 47,488 | | | | 1,258,432 | |
9
MFS Mid Cap Value Portfolio
Portfolio of Investments – continued
| | | | | | | | |
| Issuer | | Shares/Par | | | Value ($) | |
| COMMON STOCKS – continued | | | | | |
| Real Estate – continued | |
| Sun Communities, Inc., REIT | | | 21,847 | | | $ | 2,026,965 | |
| Washington Prime Group, Inc., REIT | | | 164,863 | | | | 1,173,825 | |
| Weyerhaeuser Co., REIT | | | 55,517 | | | | 1,957,529 | |
| | | | | | | | |
| | | | | | $ | 20,984,196 | |
| | | | | | | | |
| Restaurants – 0.7% | |
| Aramark | | | 55,190 | | | $ | 2,358,821 | |
| | | | | | | | |
| Specialty Chemicals – 2.2% | |
| Axalta Coating Systems Ltd. (a) | | | 72,800 | | | $ | 2,355,808 | |
| RPM International, Inc. | | | 57,382 | | | | 3,007,964 | |
| Univar, Inc. (a) | | | 81,513 | | | | 2,523,642 | |
| | | | | | | | |
| | | $ | 7,887,414 | |
| | | | | | | | |
| Specialty Stores – 2.5% | |
| AutoZone, Inc. (a) | | | 1,784 | | | $ | 1,269,084 | |
| L Brands, Inc. | | | 31,868 | | | | 1,919,091 | |
| Michaels Co., Inc. (a) | | | 67,537 | | | | 1,633,720 | |
| Tractor Supply Co. | | | 28,021 | | | | 2,094,570 | |
| Urban Outfitters, Inc. (a) | | | 58,271 | | | | 2,042,981 | |
| | | | | | | | |
| | | $ | 8,959,446 | |
| | | | | | | | |
| Trucking – 0.5% | |
| Schneider National, Inc. | | | 58,084 | | | $ | 1,658,879 | |
| | | | | | | | |
| Utilities – Electric Power – 6.7% | |
| AES Corp. | | | 144,900 | | | $ | 1,569,267 | |
| Ameren Corp. | | | 32,450 | | | | 1,914,226 | |
| CMS Energy Corp. | | | 66,126 | | | | 3,127,760 | |
| DTE Energy Co. | | | 30,659 | | | | 3,355,934 | |
| Eversource Energy | | | 48,932 | | | | 3,091,524 | |
| FirstEnergy Corp. | | | 55,972 | | | | 1,713,863 | |
| Pinnacle West Capital Corp. | | | 35,327 | | | | 3,009,154 | |
| Public Service Enterprise Group, Inc. | | | 70,128 | | | | 3,611,592 | |
| WEC Energy Group, Inc. | | | 36,542 | | | | 2,427,485 | |
| | | | | | | | |
| | | $ | 23,820,805 | |
| | | | | | | | |
Total Common Stocks
(Identified Cost, $259,106,295) | | | | | | $ | 350,428,231 | |
| | | | | | | | |
| | | | | | | | |
| Issuer | | Shares/Par | | | Value ($) | |
| INVESTMENT COMPANIES (h) – 1.0% | | | | | |
| MONEY MARKET FUNDS – 1.0% | |
| MFS Institutional Money Market Portfolio, 1.25% (v) (Identified Cost, $3,633,692) | | | 3,634,056 | | | $ | 3,633,692 | |
| | | | | | | | |
|
| COLLATERAL FOR SECURITIES LOANED – 0.1% | |
| State Street Navigator Securities Lending Government Money Market Portfolio, 1.3% (j) (Identified Cost, $109,851) | | | 109,851 | | | $ | 109,851 | |
| | | | | | | | |
OTHER ASSETS, LESS
LIABILITIES – (0.1)% | | | | (238,239 | ) |
| | | | | | | | |
| NET ASSETS – 100.0% | | | $ | 353,933,535 | |
| | | | | | | | |
| (a) | | Non-income producing security. |
| (h) | | An affiliated issuer may be considered one in which the fund owns 5% or more of the outstanding voting securities, or a company which is under common control. At period end, the aggregate values of the fund’s investments in affiliated issuers and in unaffiliated issuers were $3,633,692 and $350,538,082, respectively. |
| (j) | | The rate quoted is the annualized seven-day yield of the fund at period end. |
| (l) | | A portion of this security is on loan. |
| (v) | | Affiliated issuer that is available only to investment companies managed by MFS. The rate quoted for the MFS Institutional Money Market Portfolio is the annualized seven-day yield of the fund at period end. |
The following abbreviations are used in this report and are defined:
| ADR | | American Depositary Receipt |
| PLC | | Public Limited Company |
| REIT | | Real Estate Investment Trust |
See Notes to Financial Statements
10
MFS Mid Cap Value Portfolio
FINANCIAL STATEMENTS | STATEMENT OF ASSETS AND LIABILITIES
This statement represents your fund’s balance sheet, which details the assets and liabilities comprising the total value of the fund.
| | | | |
At 12/31/17 | | | | |
Assets | | | | |
Investments in unaffiliated issuers, at value, including $490,110 of securities on loan (identified cost, $259,216,146) | | | $350,538,082 | |
Investments in affiliated issuers, at value (identified cost, $3,633,692) | | | 3,633,692 | |
Receivables for | | | | |
Fund shares sold | | | 6,735 | |
Interest and dividends | | | 465,184 | |
Other assets | | | 2,493 | |
Total assets | | | $354,646,186 | |
Liabilities | | | | |
Payable for fund shares reacquired | | | $512,006 | |
Collateral for securities loaned, at value (c) | | | 109,851 | |
Payable to affiliates | | | | |
Investment adviser | | | 29,504 | |
Shareholder servicing costs | | | 144 | |
Distribution and/or service fees | | | 2,355 | |
Payable for independent Trustees’ compensation | | | 59 | |
Accrued expenses and other liabilities | | | 58,732 | |
Total liabilities | | | $712,651 | |
Net assets | | | $353,933,535 | |
Net assets consist of | | | | |
Paid-in capital | | | $240,794,905 | |
Unrealized appreciation (depreciation) | | | 91,321,762 | |
Accumulated net realized gain (loss) | | | 18,957,190 | |
Undistributed net investment income | | | 2,859,678 | |
Net assets | | | $353,933,535 | |
Shares of beneficial interest outstanding | | | 39,354,638 | |
| | | | | | | | | | | | |
| | | Net assets | | | Shares
outstanding | | | Net asset value
per share | |
Initial Class | | | $268,290,525 | | | | 29,766,537 | | | | $9.01 | |
Service Class | | | 85,643,010 | | | | 9,588,101 | | | | 8.93 | |
| (c) | Non cash collateral is not included. |
Net asset value per share is calculated using actual net assets and shares outstanding rather than amounts that have been rounded for presentation purposes.
See Notes to Financial Statements
11
MFS Mid Cap Value Portfolio
FINANCIAL STATEMENTS | STATEMENT OF OPERATIONS
This statement describes how much your fund earned in investment income and accrued in expenses. It also describes any gains and/or losses generated by fund operations.
| | | | |
Year ended 12/31/17 | | | | |
Net investment income (loss) | |
Income | | | | |
Dividends | | | $5,517,432 | |
Dividends from affiliated issuers | | | 43,851 | |
Income on securities loaned | | | 9,181 | |
Foreign taxes withheld | | | (15,822 | ) |
Total investment income | | | $5,554,642 | |
Expenses | | | | |
Management fee | | | $2,552,807 | |
Distribution and/or service fees | | | 173,845 | |
Shareholder servicing costs | | | 14,564 | |
Administrative services fee | | | 63,315 | |
Independent Trustees’ compensation | | | 9,010 | |
Custodian fee | | | 19,483 | |
Shareholder communications | | | 33,819 | |
Audit and tax fees | | | 53,109 | |
Legal fees | | | 4,864 | |
Miscellaneous | | | 18,461 | |
Total expenses | | | $2,943,277 | |
Reduction of expenses by investment adviser | | | (27,263 | ) |
Net expenses | | | $2,916,014 | |
Net investment income (loss) | | | $2,638,628 | |
Realized and unrealized gain (loss) | | | | |
Realized gain (loss) (identified cost basis) | | | | |
Unaffiliated issuers | | | $20,697,650 | |
Affiliated issuers | | | 65 | |
Foreign currency | | | 4,168 | |
Net realized gain (loss) | | | $20,701,883 | |
Change in unrealized appreciation (depreciation) | | | | |
Unaffiliated issuers | | | $21,478,749 | |
Translation of assets and liabilities in foreign currencies | | | 608 | |
Net unrealized gain (loss) | | | $21,479,357 | |
Net realized and unrealized gain (loss) | | | $42,181,240 | |
Change in net assets from operations | | | $44,819,868 | |
See Notes to Financial Statements
12
MFS Mid Cap Value Portfolio
FINANCIAL STATEMENTS | STATEMENTS OF CHANGES IN NET ASSETS
These statements describe the increases and/or decreases in net assets resulting from operations, any distributions, and any shareholder transactions.
| | | | | | | | |
| | | Year ended | |
| | | 12/31/17 | | | | 12/31/16 | |
Change in net assets | | | | | | | | |
From operations | | | | | | | | |
Net investment income (loss) | | | $2,638,628 | | | | $4,102,943 | |
Net realized gain (loss) | | | 20,701,883 | | | | 9,918,490 | |
Net unrealized gain (loss) | | | 21,479,357 | | | | 35,069,272 | |
Change in net assets from operations | | | $44,819,868 | | | | $49,090,705 | |
Distributions declared to shareholders | | | | | | | | |
From net investment income | | | $(4,029,207 | ) | | | $(2,686,243 | ) |
| From net realized gain | | | (10,126,455 | ) | | | (26,538,253 | ) |
Total distributions declared to shareholders | | | $(14,155,662 | ) | | | $(29,224,496 | ) |
Change in net assets from fund share transactions | | | $(7,277,298 | ) | | | $(19,173,427 | ) |
Total change in net assets | | | $23,386,908 | | | | $692,782 | |
Net assets | | | | | | | | |
At beginning of period | | | 330,546,627 | | | | 329,853,845 | |
At end of period (including undistributed net investment income of $2,859,678 and
$4,263,444, respectively) | | | $353,933,535 | | | | $330,546,627 | |
See Notes to Financial Statements
13
MFS Mid Cap Value Portfolio
FINANCIAL STATEMENTS | FINANCIAL HIGHLIGHTS
The financial highlights table is intended to help you understand the fund’s financial performance for the past 5 years. Certain information reflects financial results for a single fund share. The total returns in the table represent the rate that an investor would have earned (or lost) on an investment in the fund share class (assuming reinvestment of all distributions) held for the entire period.
| | | | | | | | | | | | | | | | | | | | |
| Initial Class | | Year ended | |
| | | 12/31/17 | | | 12/31/16 | | | 12/31/15 | | | 12/31/14 | | | 12/31/13 | |
Net asset value, beginning of period | | | $8.29 | | | | $7.84 | | | | $9.80 | | | | $10.05 | | | | $8.75 | |
| Income (loss) from investment operations | | | | | | | | | | | | | | | | | | | | |
Net investment income (loss) (d) | | | $0.07 | | | | $0.10 | (c) | | | $0.08 | | | | $0.09 | | | | $0.10 | |
Net realized and unrealized gain (loss) | | | 1.03 | | | | 1.12 | | | | (0.37 | ) | | | 0.93 | | | | 2.93 | |
Total from investment operations | | | $1.10 | | | | $1.22 | | | | $(0.29 | ) | | | $1.02 | | | | $3.03 | |
| Less distributions declared to shareholders | | | | | | | | | | | | | | | | | | | | |
From net investment income | | | $(0.11 | ) | | | $(0.07 | ) | | | $(0.10 | ) | | | $(0.11 | ) | | | $(0.12 | ) |
From net realized gain | | | (0.27 | ) | | | (0.70 | ) | | | (1.57 | ) | | | (1.16 | ) | | | (1.61 | ) |
Total distributions declared to shareholders | | | $(0.38 | ) | | | $(0.77 | ) | | | $(1.67 | ) | | | $(1.27 | ) | | | $(1.73 | ) |
Net asset value, end of period (x) | | | $9.01 | | | | $8.29 | | | | $7.84 | | | | $9.80 | | | | $10.05 | |
Total return (%) (k)(r)(s)(x) | | | 13.67 | | | | 15.98 | (c) | | | (2.33 | ) | | | 10.36 | | | | 36.91 | |
Ratios (%) (to average net assets)
and Supplemental data: | | | | | | | | | | | | | | | | | | | | |
Expenses before expense reductions (f) | | | 0.81 | | | | 0.77 | (c) | | | 0.82 | | | | 0.81 | | | | 0.81 | |
Expenses after expense reductions (f) | | | 0.81 | | | | 0.76 | (c) | | | 0.81 | | | | 0.81 | | | | 0.81 | |
Net investment income (loss) | | | 0.82 | | | | 1.31 | (c) | | | 0.82 | | | | 0.86 | | | | 0.99 | |
Portfolio turnover | | | 36 | | | | 32 | | | | 51 | | | | 55 | | | | 49 | |
Net assets at end of period (000 omitted) | | | $268,291 | | | | $271,001 | | | | $274,753 | | | | $322,888 | | | | $348,322 | |
| |
| Service Class | | Year ended | |
| | | 12/31/17 | | | 12/31/16 | | | 12/31/15 | | | 12/31/14 | | | 12/31/13 | |
Net asset value, beginning of period | | | $8.22 | | | | $7.78 | | | | $9.74 | | | | $9.99 | | | | $8.71 | |
| Income (loss) from investment operations | | | | | | | | | | | | | | | | | | | | |
Net investment income (loss) (d) | | | $0.05 | | | | $0.08 | (c) | | | $0.06 | | | | $0.06 | | | | $0.07 | |
Net realized and unrealized gain (loss) | | | 1.02 | | | | 1.12 | | | | (0.38 | ) | | | 0.93 | | | | 2.92 | |
Total from investment operations | | | $1.07 | | | | $1.20 | | | | $(0.32 | ) | | | $0.99 | | | | $2.99 | |
| Less distributions declared to shareholders | | | | | | | | | | | | | | | | | | | | |
From net investment income | | | $(0.09 | ) | | | $(0.06 | ) | | | $(0.07 | ) | | | $(0.08 | ) | | | $(0.10 | ) |
From net realized gain | | | (0.27 | ) | | | (0.70 | ) | | | (1.57 | ) | | | (1.16 | ) | | | (1.61 | ) |
Total distributions declared to shareholders | | | $(0.36 | ) | | | $(0.76 | ) | | | $(1.64 | ) | | | $(1.24 | ) | | | $(1.71 | ) |
Net asset value, end of period (x) | | | $8.93 | | | | $8.22 | | | | $7.78 | | | | $9.74 | | | | $9.99 | |
Total return (%) (k)(r)(s)(x) | | | 13.41 | | | | 15.76 | (c) | | | (2.66 | ) | | | 10.16 | | | | 36.52 | |
Ratios (%) (to average net assets)
and Supplemental data: | | | | | | | | | | | | | | | | | | | | |
Expenses before expense reductions (f) | | | 1.06 | | | | 1.02 | (c) | | | 1.07 | | | | 1.06 | | | | 1.06 | |
Expenses after expense reductions (f) | | | 1.05 | | | | 1.01 | (c) | | | 1.06 | | | | 1.06 | | | | 1.06 | |
Net investment income (loss) | | | 0.59 | | | | 1.06 | (c) | | | 0.62 | | | | 0.62 | | | | 0.75 | |
Portfolio turnover | | | 36 | | | | 32 | | | | 51 | | | | 55 | | | | 49 | |
Net assets at end of period (000 omitted) | | | $85,643 | | | | $59,545 | | | | $55,100 | | | | $38,611 | | | | $38,371 | |
See Notes to Financial Statements
14
MFS Mid Cap Value Portfolio
Financial Highlights – continued
| (c) | Amount reflects a one-time reimbursement of expenses by the custodian (or former custodian) without which net investment income and performance would be lower and expenses would be higher. |
| (d) | Per share data is based on average shares outstanding. |
| (f) | Ratios do not reflect reductions from fees paid indirectly, if applicable. |
| (k) | The total return does not reflect expenses that apply to separate accounts. Inclusion of these charges would reduce the total return figures for all periods shown. |
| (r) | Certain expenses have been reduced without which performance would have been lower. |
| (s) | From time to time the fund may receive proceeds from litigation settlements, without which performance would be lower. |
| (x) | The net asset values and total returns have been calculated on net assets which include adjustments made in accordance with U.S. generally accepted accounting principles required at period end for financial reporting purposes. |
See Notes to Financial Statements
15
MFS Mid Cap Value Portfolio
NOTES TO FINANCIAL STATEMENTS
| (1) | | Business and Organization |
MFS Mid Cap Value Portfolio (the fund) is a diversified series of MFS Variable Insurance Trust III (the trust). The trust is organized as a Delaware statutory trust and is registered under the Investment Company Act of 1940, as amended, as an open-end management investment company. The shareholders of each series of the trust are separate accounts of insurance companies, which offer variable annuity and/or life insurance products, and qualified retirement and pension plans.
The fund is an investment company and accordingly follows the investment company accounting and reporting guidance of the Financial Accounting Standards Board (FASB) Accounting Standards Codification Topic 946 Financial Services – Investment Companies.
| (2) | | Significant Accounting Policies |
General – The preparation of financial statements in conformity with U.S. generally accepted accounting principles requires management to make estimates and assumptions that affect the reported amounts of assets and liabilities, and disclosure of contingent assets and liabilities at the date of the financial statements and the reported amounts of increases and decreases in net assets from operations during the reporting period. Actual results could differ from those estimates. In the preparation of these financial statements, management has evaluated subsequent events occurring after the date of the fund’s Statement of Assets and Liabilities through the date that the financial statements were issued.
In October 2016, the Securities and Exchange Commission (SEC) released its final rule on Investment Company Reporting Modernization (the “Rule”). The Rule, which introduced two new regulatory reporting forms for investment companies – Form N-PORT and Form N-CEN – also contained amendments to Regulation S-X which impact financial statement presentation, particularly the presentation of derivative investments, for all reporting periods ending after August 1, 2017. The fund has adopted the Rule’s Regulation S-X amendments and believes that the fund’s financial statements are in compliance with those amendments.
Balance Sheet Offsetting – The fund’s accounting policy with respect to balance sheet offsetting is that, absent an event of default by the counterparty or a termination of the agreement, the International Swaps and Derivatives Association (ISDA) Master Agreement, or similar agreement, does not result in an offset of reported amounts of financial assets and financial liabilities in the Statement of Assets and Liabilities across transactions between the fund and the applicable counterparty. The fund’s right to setoff may be restricted or prohibited by the bankruptcy or insolvency laws of the particular jurisdiction to which a specific master netting agreement counterparty is subject. Balance sheet offsetting disclosures, to the extent applicable to the fund, have been included in the fund’s Significant Accounting Policies note under the captions for each of the fund’s in-scope financial instruments and transactions.
Investment Valuations – Equity securities, including restricted equity securities, are generally valued at the last sale or official closing price on their primary market or exchange as provided by a third-party pricing service. Equity securities, for which there were no sales reported that day, are generally valued at the last quoted daily bid quotation on their primary market or exchange as provided by a third-party pricing service. Short-term instruments with a maturity at issuance of 60 days or less may be valued at amortized cost, which approximates market value. Open-end investment companies are generally valued at net asset value per share. Securities and other assets generally valued on the basis of information from a third-party pricing service may also be valued at a broker/dealer bid quotation. Values obtained from third-party pricing services can utilize both transaction data and market information such as yield, quality, coupon rate, maturity, type of issue, trading characteristics, and other market data. The values of foreign securities and other assets and liabilities expressed in foreign currencies are converted to U.S. dollars using the mean of bid and asked prices for rates provided by a third-party pricing service.
The Board of Trustees has delegated primary responsibility for determining or causing to be determined the value of the fund’s investments (including any fair valuation) to the adviser pursuant to valuation policies and procedures approved by the Board. If the adviser determines that reliable market quotations are not readily available, investments are valued at fair value as determined in good faith by the adviser in accordance with such procedures under the oversight of the Board of Trustees. Under the fund’s valuation policies and procedures, market quotations are not considered to be readily available for most types of debt instruments and floating rate loans and many types of derivatives. These investments are generally valued at fair value based on information from third-party pricing services. In addition, investments may be valued at fair value if the adviser determines that an investment’s value has been materially affected by events occurring after the close of the exchange or market on which the investment is principally traded (such as foreign exchange or market) and prior to the determination of the fund’s net asset value, or after the halting of trading of a specific security where trading does not resume prior to the close of the exchange or market on which the security is principally traded. Events that occur on a frequent basis after foreign markets close (such as developments in foreign markets and significant movements in the U.S. markets) and prior to the determination of the fund’s net asset value may be deemed to have a material effect on the value of securities traded in foreign markets. Accordingly, the fund’s foreign equity securities may often be valued at fair value. The adviser generally relies on third-party pricing services or other information (such as the correlation with price
16
MFS Mid Cap Value Portfolio
Notes to Financial Statements – continued
movements of similar securities in the same or other markets; the type, cost and investment characteristics of the security; the business and financial condition of the issuer; and trading and other market data) to assist in determining whether to fair value and at what value to fair value an investment. The value of an investment for purposes of calculating the fund’s net asset value can differ depending on the source and method used to determine value. When fair valuation is used, the value of an investment used to determine the fund’s net asset value may differ from quoted or published prices for the same investment. There can be no assurance that the fund could obtain the fair value assigned to an investment if it were to sell the investment at the same time at which the fund determines its net asset value per share.
Various inputs are used in determining the value of the fund’s assets or liabilities. These inputs are categorized into three broad levels. In certain cases, the inputs used to measure fair value may fall into different levels of the fair value hierarchy. In such cases, an investment’s level within the fair value hierarchy is based on the lowest level of input that is significant to the fair value measurement. The fund’s assessment of the significance of a particular input to the fair value measurement in its entirety requires judgment, and considers factors specific to the investment. Level 1 includes unadjusted quoted prices in active markets for identical assets or liabilities. Level 2 includes other significant observable market-based inputs (including quoted prices for similar securities, interest rates, prepayment speed, and credit risk). Level 3 includes unobservable inputs, which may include the adviser’s own assumptions in determining the fair value of investments. The following is a summary of the levels used as of December 31, 2017 in valuing the fund’s assets or liabilities:
| | | | | | | | | | | | | | | | |
| Financial Instruments | | Level 1 | | | Level 2 | | | Level 3 | | | Total | |
| Equity Securities: | | | | | | | | | | | | | | | | |
United States | | | $340,726,750 | | | | $— | | | | $— | | | | $340,726,750 | |
Israel | | | 3,817,089 | | | | — | | | | — | | | | 3,817,089 | |
United Kingdom | | | 3,080,548 | | | | — | | | | — | | | | 3,080,548 | |
Germany | | | — | | | | 1,465,001 | | | | — | | | | 1,465,001 | |
Canada | | | 1,338,843 | | | | — | | | | — | | | | 1,338,843 | |
| Mutual Funds | | | 3,743,543 | | | | — | | | | — | | | | 3,743,543 | |
| Total | | | $352,706,773 | | | | $1,465,001 | | | | $— | | | | $354,171,774 | |
For further information regarding security characteristics, see the Portfolio of Investments.
Foreign Currency Translation – Purchases and sales of foreign investments, income, and expenses are converted into U.S. dollars based upon currency exchange rates prevailing on the respective dates of such transactions or on the reporting date for foreign denominated receivables and payables. Gains and losses attributable to foreign currency exchange rates on sales of securities are recorded for financial statement purposes as net realized gains and losses on investments. Gains and losses attributable to foreign exchange rate movements on receivables, payables, income and expenses are recorded for financial statement purposes as foreign currency transaction gains and losses. That portion of both realized and unrealized gains and losses on investments that results from fluctuations in foreign currency exchange rates is not separately disclosed.
Security Loans – Under its Securities Lending Agency Agreement with the fund, State Street Bank and Trust Company (“State Street”), as lending agent, loans the securities of the fund to certain qualified institutions (the “Borrowers”) approved by the fund. Security loans can be terminated at the discretion of either the lending agent or the fund and the related securities must be returned within the earlier of the standard trade settlement period for such securities or within three business days. The loans are collateralized by cash and/or U.S. Treasury and federal agency obligations in an amount typically at least equal to the market value of the securities loaned. On loans collateralized by cash, the cash collateral is invested in a money market fund. The market value of the loaned securities is determined at the close of business of the fund and any additional required collateral is delivered to the fund on the next business day. State Street provides the fund with indemnification against Borrower default. In the event of Borrower default, State Street will, for the benefit of the fund, either purchase securities identical to those loaned or, when such purchase is commercially impracticable, pay the fund the market value of the loaned securities. In return, State Street assumes the fund’s rights to the related collateral. If the collateral value is less than the cost to purchase identical securities, State Street is responsible for the shortfall, but only to the extent that such shortfall is not due to a decline in collateral value resulting from collateral reinvestment for which the fund bears the risk of loss. At period end, the fund had investment securities on loan, all of which were classified as equity securities in the fund’s Portfolio of Investments, with a fair value of $490,110. The fair value of the fund’s investment securities on loan and a related liability of $109,851 for cash collateral received on securities loaned are both presented gross in the Statement of Assets and Liabilities. Additionally, these loans were collateralized by U.S. Treasury obligations of $385,907. The collateral received on loans exceeded the value of securities on loan at period end. The liability for cash collateral for securities loaned is carried at fair value, which is categorized as level 2 within the fair value hierarchy. A portion of the income generated upon investment of the collateral is remitted to the Borrowers, and the remainder is allocated between the fund and the lending agent. On loans collateralized by U.S. Treasury and/or federal agency obligations, a fee is received from the Borrower, and is allocated between the
17
MFS Mid Cap Value Portfolio
Notes to Financial Statements – continued
fund and the lending agent. Income from securities lending is separately reported in the Statement of Operations. The dividend and interest income earned on the securities loaned is accounted for in the same manner as other dividend and interest income.
Indemnifications – Under the fund’s organizational documents, its officers and Trustees may be indemnified against certain liabilities and expenses arising out of the performance of their duties to the fund. Additionally, in the normal course of business, the fund enters into agreements with service providers that may contain indemnification clauses. The fund’s maximum exposure under these agreements is unknown as this would involve future claims that may be made against the fund that have not yet occurred.
Investment Transactions and Income – Investment transactions are recorded on the trade date. Interest income is recorded on the accrual basis. Dividends received in cash are recorded on the ex-dividend date. Certain dividends from foreign securities will be recorded when the fund is informed of the dividend if such information is obtained subsequent to the ex-dividend date. Dividend payments received in additional securities are recorded on the ex-dividend date in an amount equal to the value of the security on such date.
The fund may receive proceeds from litigation settlements. Any proceeds received from litigation involving portfolio holdings are reflected in the Statement of Operations in realized gain/loss if the security has been disposed of by the fund or in unrealized gain/loss if the security is still held by the fund. Any other proceeds from litigation not related to portfolio holdings are reflected as other income in the Statement of Operations.
Tax Matters and Distributions – The fund intends to qualify as a regulated investment company, as defined under Subchapter M of the Internal Revenue Code, and to distribute all of its taxable income, including realized capital gains. As a result, no provision for federal income tax is required. The fund’s federal tax returns, when filed, will remain subject to examination by the Internal Revenue Service for a three year period. Management has analyzed the fund’s tax positions taken on federal and state tax returns for all open tax years and does not believe that there are any uncertain tax positions that require recognition of a tax liability. Foreign taxes, if any, have been accrued by the fund in the accompanying financial statements in accordance with the applicable foreign tax law. Foreign income taxes may be withheld by certain countries in which the fund invests. Additionally, capital gains realized by the fund on securities issued in or by certain foreign countries may be subject to capital gains tax imposed by those countries.
Distributions to shareholders are recorded on the ex-dividend date. Income and capital gain distributions are determined in accordance with income tax regulations, which may differ from U.S. generally accepted accounting principles. Certain capital accounts in the financial statements are periodically adjusted for permanent differences in order to reflect their tax character. These adjustments have no impact on net assets or net asset value per share. Temporary differences which arise from recognizing certain items of income, expense, gain or loss in different periods for financial statement and tax purposes will reverse at some time in the future. Distributions in excess of net investment income or net realized gains are temporary overdistributions for financial statement purposes resulting from differences in the recognition or classification of income or distributions for financial statement and tax purposes.
Book/tax differences primarily relate to wash sale loss deferrals.
The tax character of distributions declared to shareholders for the last two fiscal years is as follows:
| | | | | | | | |
| | | Year ended | | | Year ended | |
| | | 12/31/17 | | | 12/31/16 | |
| Ordinary income (including any short-term capital gains) | | | $4,671,333 | | | | $9,712,780 | |
| Long-term capital gains | | | 9,484,329 | | | | 19,511,716 | |
| Total distributions | | | $14,155,662 | | | | $29,224,496 | |
The federal tax cost and the tax basis components of distributable earnings were as follows:
| | | | |
| As of 12/31/17 | | | | |
| Cost of investments | | | $264,731,165 | |
| Gross appreciation | | | 96,500,081 | |
| Gross depreciation | | | (7,059,472 | ) |
| Net unrealized appreciation (depreciation) | | | $89,440,609 | |
| Undistributed ordinary income | | | 6,272,132 | |
| Undistributed long-term capital gain | | | 17,309,822 | |
| Other temporary differences | | | 116,067 | |
Multiple Classes of Shares of Beneficial Interest – The fund offers multiple classes of shares, which differ in their respective distribution and/or service fees. The fund’s income, realized and unrealized gain (loss), and common expenses are allocated to
18
MFS Mid Cap Value Portfolio
Notes to Financial Statements – continued
shareholders based on the daily net assets of each class. Dividends are declared separately for each class. Differences in per share dividend rates are generally due to differences in separate class expenses. The fund’s distributions declared to shareholders as reported in the Statements of Changes in Net Assets are presented by class as follows:
| | | | | | | | | | | | | | | | |
| | | From net investment
income | | | From net realized gain on
investments | |
| | | Year ended
12/31/17 | | | Year ended
12/31/16 | | | Year ended
12/31/17 | | | Year ended
12/31/16 | |
| Initial Class | | | $3,360,693 | | | | $2,295,049 | | | | $8,162,163 | | | | $21,855,898 | |
| Service Class | | | 668,514 | | | | 391,194 | | | | 1,964,292 | | | | 4,682,355 | |
| Total | | | $4,029,207 | | | | $2,686,243 | | | | $10,126,455 | | | | $26,538,253 | |
| (3) | | Transactions with Affiliates |
Investment Adviser – The fund has an investment advisory agreement with MFS to provide overall investment management and related administrative services and facilities to the fund. The management fee is computed daily and paid monthly at the following annual rates based on the fund’s average daily net assets:
| | | | |
| Up to $1 billion | | | 0.75% | |
| In excess of $1 billion | | | 0.70% | |
MFS has agreed in writing to reduce its management fee by a specified amount if certain MFS mutual fund assets exceed thresholds agreed to by MFS and the fund’s Board of Trustees. For the year ended December 31, 2017, this management fee reduction amounted to $27,263, which is included in the reduction of total expenses in the Statement of Operations. The management fee incurred for the year ended December 31, 2017 was equivalent to an annual effective rate of 0.74% of the fund’s average daily net assets.
Distributor – MFS Fund Distributors, Inc. (MFD), a wholly-owned subsidiary of MFS, is the distributor of shares of the fund. The Trustees have adopted a distribution plan for the Service Class shares pursuant to Rule 12b-1 under the Investment Company Act of 1940.
The fund’s distribution plan provides that the fund will pay MFD distribution and/or service fees equal to 0.25% per annum of its average daily net assets attributable to Service Class shares as partial consideration for services performed and expenses incurred by MFD and financial intermediaries (including participating insurance companies that invest in the fund to fund variable annuity and variable life insurance contracts, sponsors of qualified retirement and pension plans that invest in the fund, and affiliates of these participating insurance companies and plan sponsors) in connection with the sale and distribution of the Service Class shares. MFD may subsequently pay all, or a portion, of the distribution and/or service fees to financial intermediaries.
Shareholder Servicing Agent – MFS Service Center, Inc. (MFSC), a wholly-owned subsidiary of MFS, receives a fee from the fund for its services as shareholder servicing agent. For the year ended December 31, 2017, the fee was $13,114, which equated to 0.0039% annually of the fund’s average daily net assets. MFSC also receives payment from the fund for out-of-pocket expenses paid by MFSC on behalf of the fund. For the year ended December 31, 2017, these costs amounted to $1,450.
Administrator – MFS provides certain financial, legal, shareholder communications, compliance, and other administrative services to the fund. Under an administrative services agreement, the fund reimburses MFS the costs incurred to provide these services. The fund is charged an annual fixed amount of $17,500 plus a fee based on average daily net assets. The administrative services fee incurred for the year ended December 31, 2017 was equivalent to an annual effective rate of 0.0186% of the fund’s average daily net assets.
Trustees’ and Officers’ Compensation – The fund pays compensation to independent Trustees in the form of a retainer, attendance fees, and additional compensation to Board and Committee chairpersons. The fund does not pay compensation directly to Trustees or officers of the fund who are also officers of the investment adviser, all of whom receive remuneration for their services to the fund from MFS. Certain officers and Trustees of the fund are officers or directors of MFS, MFD, and MFSC.
Other – This fund and certain other funds managed by MFS (the funds) have entered into a service agreement (the ISO Agreement) which provides for payment of fees solely by the funds to Tarantino LLC in return for the provision of services of an Independent Senior Officer (ISO) for the funds. Frank L. Tarantino serves as the ISO and is an officer of the funds and the sole member of Tarantino LLC. The funds can terminate the ISO Agreement with Tarantino LLC at any time under the terms of the ISO Agreement. For the year ended December 31, 2017, the fee paid by the fund under this agreement was $605 and is included in “Miscellaneous” expense in the Statement of Operations. MFS has agreed to bear all expenses associated with office space, other administrative support, and supplies provided to the ISO.
The fund invests in the MFS Institutional Money Market Portfolio which is managed by MFS and seeks current income consistent with preservation of capital and liquidity. This money market fund does not pay a management fee to MFS.
19
MFS Mid Cap Value Portfolio
Notes to Financial Statements – continued
The fund is permitted to engage in purchase and sale transactions with funds and accounts for which MFS serves as investment adviser or sub-adviser (“cross-trades”) pursuant to a policy adopted by the Board of Trustees. This policy has been designed to ensure that cross-trades conducted by the fund comply with Rule 17a-7 under the Investment Company Act of 1940. During the year ended December 31, 2017, the fund engaged in purchase transactions pursuant to this policy, which amounted to $833,932.
For the year ended December 31, 2017, purchases and sales of investments, other than short-term obligations, aggregated $120,134,826 and $138,039,601, respectively.
| (5) | | Shares of Beneficial Interest |
The fund’s Declaration of Trust permits the Trustees to issue an unlimited number of full and fractional shares of beneficial interest. Transactions in fund shares were as follows:
| | | | | | | | | | | | | | | | |
| | | Year ended 12/31/17 | | | Year ended 12/31/16 | |
| | | Shares | | | Amount | | | Shares | | | Amount | |
| Shares sold | | | | | | | | | | | | | | | | |
Initial Class | | | 1,411,404 | | | | $12,144,591 | | | | 2,201,765 | | | | $17,138,283 | |
Service Class | | | 2,990,095 | | | | 24,813,034 | | | | 978,217 | | | | 7,813,669 | |
| | | 4,401,499 | | | | $36,957,625 | | | | 3,179,982 | | | | $24,951,952 | |
| Shares issued to shareholders in reinvestment of distributions | | | | | | | | | | | | | | | | |
Initial Class | | | 1,400,024 | | | | $11,522,200 | | | | 3,041,641 | | | | $24,150,626 | |
Service Class | | | 322,253 | | | | 2,632,806 | | | | 643,851 | | | | 5,073,549 | |
| | | 1,722,277 | | | | $14,155,006 | | | | 3,685,492 | | | | $29,224,175 | |
| Shares reacquired | | | | | | | | | | | | | | | | |
Initial Class | | | (5,754,275 | ) | | | $(50,046,081 | ) | | | (7,599,621 | ) | | | $(61,741,837 | ) |
Service Class | | | (971,461 | ) | | | (8,343,848 | ) | | | (1,455,995 | ) | | | (11,607,717 | ) |
| | | (6,725,736 | ) | | | $(58,389,929 | ) | | | (9,055,616 | ) | | | $(73,349,554 | ) |
| Net change | | | | | | | | | | | | | | | | |
Initial Class | | | (2,942,847 | ) | | | $(26,379,290 | ) | | | (2,356,215 | ) | | | $(20,452,928 | ) |
Service Class | | | 2,340,887 | | | | 19,101,992 | | | | 166,073 | | | | 1,279,501 | |
| | | (601,960 | ) | | | $(7,277,298 | ) | | | (2,190,142 | ) | | | $(19,173,427 | ) |
The fund is one of several mutual funds in which certain MFS funds may invest. The MFS funds do not invest in the underlying funds for the purpose of exercising management or control. At the end of the period, the MFS Moderate Allocation Portfolio, the MFS Growth Allocation Portfolio, and the MFS Conservative Allocation Portfolio were the owners of record of approximately 33%, 11%, and 6%, respectively, of the value of outstanding voting shares of the fund.
The fund and certain other funds managed by MFS participate in a $1.25 billion unsecured committed line of credit, subject to a $1 billion sublimit, provided by a syndication of banks under a credit agreement. Borrowings may be made for temporary financing needs. Interest is charged to each fund, based on its borrowings, generally at a rate equal to the higher of the Overnight Federal Reserve funds rate or daily one month LIBOR plus an agreed upon spread. A commitment fee, based on the average daily, unused portion of the committed line of credit, is allocated among the participating funds at the end of each calendar quarter. In addition, the fund and other funds managed by MFS have established unsecured uncommitted borrowing arrangements with certain banks for temporary financing needs. Interest is charged to each fund, based on its borrowings, at a rate equal to the Overnight Federal Reserve funds rate plus an agreed upon spread. For the year ended December 31, 2017, the fund’s commitment fee and interest expense were $2,279 and $0, respectively, and are included in “Miscellaneous” expense in the Statement of Operations.
20
MFS Mid Cap Value Portfolio
Notes to Financial Statements – continued
| (7) | | Investments in Affiliated Issuers |
An affiliated issuer may be considered one in which the fund owns 5% or more of the outstanding voting securities, or a company which is under common control. For the purposes of this report, the fund assumes the following to be affiliated issuers:
| | | | | | | | | | | | | | | | | | |
| Underlying Affiliated Funds | | | | Beginning
Shares/Par
Amount | | | Acquisitions
Shares/Par
Amount | | | Dispositions
Shares/Par
Amount | | | Ending
Shares/Par
Amount | |
| MFS Institutional Money Market Portfolio | | | | | 4,336,715 | | | | 92,938,959 | | | | (93,641,618 | ) | | | 3,634,056 | |
| | | | | |
| Affiliated Issuers | | Realized
Gain (Loss) | | Change in Unrealized
Appreciation
(Depreciation) | | | Capital Gain Distributions | | | Dividend
Income | | | Ending
Value | |
| MFS Institutional Money Market Portfolio | | $65 | | | $— | | | | $— | | | | $43,851 | | | | $3,633,692 | |
21
MFS Mid Cap Value Portfolio
REPORT OF INDEPENDENT REGISTERED PUBLIC ACCOUNTING FIRM
To the Board of Trustees of MFS Variable Insurance Trust III and the Shareholders of
MFS Mid Cap Value Portfolio:
Opinion on the Financial Statements and Financial Highlights
We have audited the accompanying statement of assets and liabilities of MFS Mid Cap Value Portfolio (one of the series of MFS Variable Insurance Trust III) (the “Fund”), including the portfolio of investments, as of December 31, 2017, the related statement of operations for the year then ended, the statements of changes in net assets for each of the two years in the period then ended, the financial highlights for each of the five years in the period then ended, and the related notes. In our opinion, the financial statements and financial highlights present fairly, in all material respects, the financial position of the Fund as of December 31, 2017, and the results of its operations for the year then ended, the changes in its net assets for each of the two years in the period then ended, and the financial highlights for each of the five years in the period then ended, in conformity with accounting principles generally accepted in the United States of America.
Basis for Opinion
These financial statements and financial highlights are the responsibility of the Fund’s management. Our responsibility is to express an opinion on the Fund’s financial statements and financial highlights based on our audits. We are a public accounting firm registered with the Public Company Accounting Oversight Board (United States) (PCAOB) and are required to be independent with respect to the Fund in accordance with the U.S. federal securities laws and the applicable rules and regulations of the Securities and Exchange Commission and the PCAOB.
We conducted our audits in accordance with the standards of the PCAOB. Those standards require that we plan and perform the audit to obtain reasonable assurance about whether the financial statements and financial highlights are free of material misstatement, whether due to error or fraud. The Fund is not required to have, nor were we engaged to perform, an audit of its internal control over financial reporting. As part of our audits we are required to obtain an understanding of internal control over financial reporting but not for the purpose of expressing an opinion on the effectiveness of the Fund’s internal control over financial reporting. Accordingly, we express no such opinion.
Our audits included performing procedures to assess the risks of material misstatement of the financial statements and financial highlights, whether due to error or fraud, and performing procedures that respond to those risks. Such procedures included examining, on a test basis, evidence regarding the amounts and disclosures in the financial statements and financial highlights. Our audits also included evaluating the accounting principles used and significant estimates made by management, as well as evaluating the overall presentation of the financial statements and financial highlights. Our procedures included confirmation of securities owned as of December 31, 2017, by correspondence with the custodian and brokers. We believe that our audits provide a reasonable basis for our opinion.
DELOITTE & TOUCHE LLP
Boston, Massachusetts
February 15, 2018
We have served as the auditor of one or more of the MFS investment companies since 1924.
22
MFS Mid Cap Value Portfolio
TRUSTEES AND OFFICERS – IDENTIFICATION AND BACKGROUND
The Trustees and Officers of the Trust, as of February 1, 2018, are listed below, together with their principal occupations during the past five years. (Their titles may have varied during that period.) The address of each Trustee and Officer is 111 Huntington Avenue, Boston, Massachusetts 02199-7618.
| | | | | | | | | | |
Name, Age | | Position(s)
Held with Fund | | Trustee/Officer
Since (h) | | Number of
MFS Funds
overseen by the
Trustee | | Principal Occupations
During the Past Five Years | | Other Directorships
During the Past Five Years (j) |
| INTERESTED TRUSTEES |
Robert J. Manning (k) (age 54) | | Trustee | | February 2004 | | 137 | | Massachusetts Financial Services Company, Executive Chairman (since January 2017); Director; Chairman of the Board; Chief Executive Officer (until 2015); Co-Chief Executive Officer (2015-2016) | | N/A |
| | | | | |
Robin A. Stelmach (k) (age 56) | | Trustee | | January 2014 | | 137 | | Massachusetts Financial Services Company, Vice Chair (since January 2017); Chief Operating Officer and Executive Vice President (until January 2017) | | N/A |
| | | | |
| INDEPENDENT TRUSTEES | | | | | | | | |
John P. Kavanaugh (age 63) | | Trustee and Chair of Trustees | | January 2009 | | 137 | | Private investor | | N/A |
| | | | | |
Steven E. Buller (age 66) | | Trustee | | February 2014 | | 137 | | Financial Accounting Standards Advisory Council, Chairman (2014-2015); Public Company Accounting Oversight Board, Standing Advisory Group, Member (until 2014); BlackRock, Inc. (investment management), Managing Director (until 2014), BlackRock Finco UK (investment management), Director (until 2014) | | N/A |
| | | | | |
John A. Caroselli (age 63) | | Trustee | | March 2017 | | 137 | | JC Global Advisors, LLC (management consulting), President (since 2015); First Capital Corporation (commercial finance), Executive Vice President (until 2015) | | N/A |
| | | | | |
Maureen R. Goldfarb (age 62) | | Trustee | | January 2009 | | 137 | | Private investor | | N/A |
| | | | | |
Michael Hegarty (age 73) | | Trustee | | December 2004 | | 137 | | Private investor | | Rouse Properties Inc., Director (until 2016); Capmark Financial Group Inc., Director (until 2015) |
| | | | | |
Clarence Otis, Jr. (age 61) | | Trustee | | March 2017 | | 137 | | Darden Restaurants, Inc., Chief Executive Officer (until 2014) | | VF Corporation, Director; Verizon Communications, Inc., Director; The Travelers Companies, Director; Federal Reserve Bank of Atlanta, Director (until 2015) |
| | | | | |
Maryanne L. Roepke (age 61) | | Trustee | | May 2014 | | 137 | | American Century Investments (investment management), Senior Vice President and Chief Compliance Officer (until 2014) | | N/A |
| | | | | |
Laurie J. Thomsen (age 60) | | Trustee | | March 2005 | | 137 | | Private investor | | The Travelers Companies, Director; Dycom Industries, Inc., Director (since 2015) |
23
MFS Mid Cap Value Portfolio
Trustees and Officers – continued
| | | | | | | | |
Name, Age | | Position(s)
Held with Fund | | Trustee/Officer
Since (h) | | Number of
MFS Funds
for which the
Person is an
Officer | | Principal Occupations During the Past Five Years |
| OFFICERS | | | | | | | | |
Christopher R. Bohane (k) (age 44) | | Assistant Secretary and Assistant Clerk | | July 2005 | | 137 | | Massachusetts Financial Services Company, Vice President and Assistant General Counsel |
| | | | |
Kino Clark (k) (age 49) | | Assistant Treasurer | | January 2012 | | 137 | | Massachusetts Financial Services Company, Vice President |
| | | | |
John W. Clark, Jr. (k) (age 50) | | Assistant Treasurer | | April 2017 | | 137 | | Massachusetts Financial Services Company, Vice President (since March 2017); Deutsche Bank (financial services), Department Head – Treasurer’s Office (until February 2017) |
| | | | |
Thomas H. Connors (k) (age 58) | | Assistant Secretary and Assistant Clerk | | September 2012 | | 137 | | Massachusetts Financial Services Company, Vice President and Senior Counsel |
| | | | |
Ethan D. Corey (k) (age 54) | | Assistant Secretary and Assistant Clerk | | July 2005 | | 137 | | Massachusetts Financial Services Company, Senior Vice President and Associate General Counsel |
| | | | |
David L. DiLorenzo (k) (age 49) | | President | | July 2005 | | 137 | | Massachusetts Financial Services Company, Senior Vice President |
| | | | |
Heidi W. Hardin (k) (age 50) | | Secretary and Clerk | | April 2017 | | 137 | | Massachusetts Financial Services Company, Executive Vice President and General Counsel (since March 2017); Harris Associates (investment management), General Counsel (from September 2015 to January 2017); Janus Capital Management LLC (investment management), Senior Vice President and General Counsel (until September 2015) |
| | | | |
Brian E. Langenfeld (k) (age 44) | | Assistant Secretary and Assistant Clerk | | June 2006 | | 137 | | Massachusetts Financial Services Company, Vice President and Senior Counsel |
| | | | |
Susan A. Pereira (k) (age 47) | | Assistant Secretary and Assistant Clerk | | July 2005 | | 137 | | Massachusetts Financial Services Company, Vice President and Senior Counsel |
| | | | |
Kasey L. Phillips (k) (age 47) | | Assistant Treasurer | | September 2012 | | 137 | | Massachusetts Financial Services Company, Vice President |
| | | | |
Matthew A. Stowe (k) (age 43) | | Assistant Secretary and Assistant Clerk | | October 2014 | | 137 | | Massachusetts Financial Services Company, Vice President and Assistant General Counsel |
| | | | |
Frank L. Tarantino (age 73) | | Independent Senior Officer | | June 2004 | | 137 | | Tarantino LLC (provider of compliance services), Principal |
| | | | |
Richard S. Weitzel (k) (age 47) | | Assistant Secretary and Assistant Clerk | | October 2007 | | 137 | | Massachusetts Financial Services Company, Senior Vice President and Associate General Counsel |
| | | | |
Martin J. Wolin (k) (age 50) | | Chief Compliance Officer | | July 2015 | | 137 | | Massachusetts Financial Services Company, Senior Vice President and Chief Compliance Officer (since July 2015); Mercer (financial service provider), Chief Risk and Compliance Officer, North America and Latin America (until June 2015) |
| | | | |
James O. Yost (k) (age 57) | | Treasurer | | September 1990 | | 137 | | Massachusetts Financial Services Company, Senior Vice President |
| (h) | Date first appointed to serve as Trustee/officer of an MFS Fund. Each Trustee has served continuously since appointment unless indicated otherwise. For the period from December 15, 2004 until February 22, 2005, Mr. Manning served as Advisory Trustee. Prior to January 2012, Messrs. DiLorenzo and Yost served as Assistant Treasurers of the Funds. From January 2012 through December 2016, Messrs. DiLorenzo and Yost served as Treasurer and Deputy Treasurer of the Funds, respectively. |
| (j) | Directorships or trusteeships of companies required to report to the Securities and Exchange Commission (i.e., “public companies”). |
| (k) | “Interested person” of the Trust within the meaning of the Investment Company Act of 1940 (referred to as the 1940 Act), which is the principal federal law governing investment companies like the fund, as a result of a position with MFS. The address of MFS is 111 Huntington Avenue, Boston, Massachusetts 02199-7618. |
24
MFS Mid Cap Value Portfolio
Trustees and Officers – continued
Each Trustee has been elected by shareholders and each Trustee and officer holds office until his or her successor is chosen and qualified or until his or her earlier death, resignation, retirement or removal. The Trust does not hold annual meetings for the purpose of electing Trustees, and Trustees are not elected for fixed terms. Under the terms of the Board’s retirement policy, an Independent Trustee shall retire at the end of the calendar year in which he or she reaches the earlier of 75 years of age or 15 years of service on the Board (or, in the case of any Independent Trustee who joined the Board prior to 2015, 20 years of service on the Board).
Messrs. Buller and Otis and Ms. Roepke are members of the Trust’s Audit Committee.
Each of the Interested Trustees and certain Officers hold comparable officer positions with certain affiliates of MFS.
The Statement of Additional Information for a Fund includes further information about the Trustees and is available without charge upon request by calling 1-800-225-2606.
| | |
Investment Adviser Massachusetts Financial Services Company 111 Huntington Avenue Boston, MA 02199-7618 | | Custodian State Street Bank and Trust Company 1 Lincoln Street Boston, MA 02111-2900 |
Distributor MFS Fund Distributors, Inc. 111 Huntington Avenue Boston, MA 02199-7618 | | Independent Registered Public Accounting Firm Deloitte & Touche LLP 200 Berkeley Street Boston, MA 02116 |
Portfolio Manager(s) Kevin Schmitz Brooks Taylor | | |
25
MFS Mid Cap Value Portfolio
BOARD REVIEW OF INVESTMENT ADVISORY AGREEMENT
The Investment Company Act of 1940 requires that both the full Board of Trustees and a majority of the non-interested (“independent”) Trustees, voting separately, annually approve the continuation of the Fund’s investment advisory agreement with MFS. The Trustees consider matters bearing on the Fund and its advisory arrangements at their meetings throughout the year, including a review of performance data at each regular meeting. In addition, the independent Trustees met several times over the course of three months beginning in May and ending in July, 2017 (“contract review meetings”) for the specific purpose of considering whether to approve the continuation of the investment advisory agreement for the Fund and the other investment companies that the Board oversees (the “MFS Funds”). The independent Trustees were assisted in their evaluation of the Fund’s investment advisory agreement by independent legal counsel, from whom they received separate legal advice and with whom they met separately from MFS during various contract review meetings. The independent Trustees were also assisted in this process by the MFS Funds’ Independent Senior Officer, a senior officer appointed by and reporting to the independent Trustees.
In connection with their deliberations regarding the continuation of the investment advisory agreement, the Trustees, including the independent Trustees, considered such information and factors as they believed, in light of the legal advice furnished to them and their own business judgment, to be relevant. The investment advisory agreement for the Fund was considered separately, although the Trustees also took into account the common interests of all MFS Funds in their review. As described below, the Trustees considered the nature, quality, and extent of the various investment advisory, administrative, and shareholder services performed by MFS under the existing investment advisory agreement and other arrangements with the Fund.
In connection with their contract review meetings, the Trustees received and relied upon materials that included, among other items: (i) information provided by Broadridge Financial Solutions, Inc. (“Broadridge”), an independent third party, on the investment performance of the Fund for various time periods ended December 31, 2016 and the investment performance of a group of funds with substantially similar investment classifications/objectives (the “Lipper performance universe”), (ii) information provided by Broadridge on the Fund’s advisory fees and other expenses and the advisory fees and other expenses of comparable funds identified by Broadridge (the “Broadridge expense group”), (iii) information provided by MFS on the advisory fees of portfolios of other clients of MFS, including institutional separate accounts and other clients, (iv) information as to whether and to what extent applicable expense waivers, reimbursements or fee “breakpoints” are observed for the Fund, (v) information regarding MFS’ financial results and financial condition, including MFS’ and certain of its affiliates’ estimated profitability from services performed for the Fund and the MFS Funds as a whole, and compared to MFS’ institutional business, (vi) MFS’ views regarding the outlook for the mutual fund industry and the strategic business plans of MFS, (vii) descriptions of various functions performed by MFS for the Funds, such as compliance monitoring and portfolio trading practices, and (viii) information regarding the overall organization of MFS, including information about MFS’ senior management and other personnel providing investment advisory, administrative and other services to the Fund and the other MFS Funds. The comparative performance, fee and expense information prepared and provided by Broadridge was not independently verified and the independent Trustees did not independently verify any information provided to them by MFS.
The Trustees’ conclusion as to the continuation of the investment advisory agreement was based on a comprehensive consideration of all information provided to the Trustees and not the result of any single factor. Some of the factors that figured particularly in the Trustees’ deliberations are described below, although individual Trustees may have evaluated the information presented differently from one another, giving different weights to various factors. It is also important to recognize that the fee arrangements for the Fund and other MFS Funds are the result of years of review and discussion between the independent Trustees and MFS, that certain aspects of such arrangements may receive greater scrutiny in some years than in others, and that the Trustees’ conclusions may be based, in part, on their consideration of these same arrangements during the course of the year and in prior years.
Based on information provided by Broadridge and MFS, the Trustees reviewed the Fund’s total return investment performance as well as the performance of peer groups of funds over various time periods. The Trustees placed particular emphasis on the total return performance of the Fund’s Initial Class shares in comparison to the performance of funds in its Lipper performance universe over the three-year period ended December 31, 2016, which the Trustees believed was a long enough period to reflect differing market conditions. The total return performance of the Fund’s Initial Class shares was in the 3rd quintile relative to the other funds in the universe for this three-year period (the 1st quintile being the best performers and the 5th quintile being the worst performers). The total return performance of the Fund’s Initial Class shares was in the 4th quintile for the one-year period and the 3rd quintile for the five-year period ended December 31, 2016 relative to the Lipper performance universe. Because of the passage of time, these performance results may differ from the performance results for more recent periods, including those shown elsewhere in this report.
In the course of their deliberations, the Trustees took into account information provided by MFS in connection with the contract review meetings, as well as during investment review meetings conducted with portfolio management personnel during the course of the year regarding the Fund’s performance. After reviewing these and related factors, the Trustees concluded, within the context of their overall conclusions regarding the investment advisory agreement, that they were satisfied with MFS’ responses and efforts relating to investment performance.
26
MFS Mid Cap Value Portfolio
Board Review of Investment Advisory Agreement – continued
In assessing the reasonableness of the Fund’s advisory fee, the Trustees considered, among other information, the Fund’s advisory fee and the total expense ratio of the Fund’s Initial Class shares as a percentage of average daily net assets and the advisory fee and total expense ratios of peer groups of funds based on information provided by Broadridge. The Trustees considered that, according to the data provided by Broadridge (which takes into account any fee reductions or expense limitations that were in effect during the Fund’s last fiscal year), the Fund’s effective advisory fee rate was approximately at the Broadridge expense group median and the Fund’s total expense ratio was lower than the Broadridge expense group median.
The Trustees also considered the advisory fees charged by MFS to any institutional separate accounts advised by MFS (“separate accounts”) and unaffiliated investment companies for which MFS serves as subadviser (“subadvised funds”) that have comparable investment strategies to the Fund, if any. In comparing these fees, the Trustees considered information provided by MFS as to the generally broader scope of services provided by MFS to the Fund, as well as the more extensive regulatory burdens imposed on MFS in managing the Fund, in comparison to separate accounts and subadvised funds. The Trustees also considered the higher demands placed on MFS’ investment personnel and trading infrastructure as a result of the daily cash in-flows and out-flows of the Fund in comparison to separate accounts.
The Trustees also considered whether the Fund may benefit from any economies of scale in the management of the Fund in the event of growth in assets of the Fund and/or growth in assets of the MFS Funds as a whole. They noted that the Fund’s advisory fee rate schedule is subject to a contractual breakpoint that reduces the Fund’s advisory fee rate on average daily net assets over $1 billion. The Trustees also noted that MFS has agreed in writing to waive a portion of the management fees of certain MFS Funds, including the Fund, if the total combined assets of certain funds within the MFS Funds’ complex increase above agreed upon thresholds (the “group fee waiver”), enabling the Fund’s shareholders to share in the benefits from any economies of scale at the complex level. The group fee waiver is reviewed and renewed annually between the Board and MFS. The Trustees concluded that the breakpoint and the group fee waiver were sufficient to allow the Fund to benefit from economies of scale as its assets and overall complex assets grow.
The Trustees also considered information prepared by MFS relating to MFS’ costs and profits with respect to the Fund, the MFS Funds considered as a group, and other investment companies and accounts advised by MFS, as well as MFS’ methodologies used to determine and allocate its costs to the MFS Funds, the Fund and other accounts and products for purposes of estimating profitability.
After reviewing these and other factors described herein, the Trustees concluded, within the context of their overall conclusions regarding the investment advisory agreement, that the advisory fees charged to the Fund represent reasonable compensation in light of the services being provided by MFS to the Fund.
In addition, the Trustees considered MFS’ resources and related efforts to continue to retain, attract and motivate capable personnel to serve the Fund. The Trustees also considered current and developing conditions in the financial services industry, including the presence of large and well-capitalized companies which are spending, and appear to be prepared to continue to spend, substantial sums to engage personnel and to provide services to competing investment companies. In this regard, the Trustees also considered the financial resources of MFS and its ultimate parent, Sun Life Financial Inc. The Trustees also considered the advantages and possible disadvantages to the Fund of having an adviser that also serves other investment companies as well as other accounts.
The Trustees also considered the nature, quality, cost, and extent of administrative, transfer agency, and distribution services provided to the Fund by MFS and its affiliates under agreements and plans other than the investment advisory agreement, including any 12b-1 fees the Fund pays to MFS Fund Distributors, Inc., an affiliate of MFS. The Trustees also considered the nature, extent and quality of certain other services MFS performs or arranges for on the Fund’s behalf, which may include securities lending programs, directed expense payment programs, class action recovery programs, and MFS’ interaction with third-party service providers, principally custodians and sub-custodians. The Trustees concluded that the various non-advisory services provided by MFS and its affiliates on behalf of the Fund were satisfactory.
The Trustees also considered benefits to MFS from the use of the Fund’s portfolio brokerage commissions, if applicable, to pay for investment research and various other factors. Additionally, the Trustees considered so-called “fall-out benefits” to MFS such as reputational value derived from serving as investment manager to the Fund.
Based on their evaluation of factors that they deemed to be material, including those factors described above, the Board of Trustees, including the independent Trustees, concluded that the Fund’s investment advisory agreement with MFS should be continued for an additional one-year period, commencing August 1, 2017.
27
MFS Mid Cap Value Portfolio
PROXY VOTING POLICIES AND INFORMATION
MFS votes proxies on behalf of the fund pursuant to proxy voting policies and procedures that are available without charge, upon request, by calling 1-800-225-2606, by visiting mfs.com/proxyvoting, or by visiting the SEC’s Web site at http://www.sec.gov.
Information regarding how the fund voted proxies relating to portfolio securities during the most recent twelve-month period ended June 30 is available by August 31 of each year without charge by visiting mfs.com/proxyvoting, or by visiting the SEC’s Web site at http://www.sec.gov.
QUARTERLY PORTFOLIO DISCLOSURE
The fund will file a complete schedule of portfolio holdings with the Securities and Exchange Commission (the Commission) for the first and third quarters of each fiscal year on Form N-Q. The fund’s Form N-Q is available on the EDGAR database on the Commission’s Internet Web site at http://www.sec.gov, and may be reviewed and copied at the:
Public Reference Room
Securities and Exchange Commission
100 F Street, NE, Room 1580
Washington, D.C. 20549
Information on the operation of the Public Reference Room may be obtained by calling the Commission at 1-800-SEC-0330. Copies of the fund’s Form N-Q also may be obtained, upon payment of a duplicating fee, by electronic request at the following e-mail address: publicinfo@sec.gov or by writing the Public Reference Section at the above address.
FURTHER INFORMATION
From time to time, MFS may post important information about the fund or the MFS funds on the MFS web site (mfs.com). This information is available at https://www.mfs.com/en-us/what-we-do/announcements.html or at mfs.com/vit3 by choosing the fund’s name.
INFORMATION ABOUT FUND CONTRACTS AND LEGAL CLAIMS
The fund has entered into contractual arrangements with an investment adviser, administrator, distributor, shareholder servicing agent, 529 program manager (if applicable), and custodian who each provide services to the fund. Unless expressly stated otherwise, shareholders are not parties to, or intended beneficiaries of these contractual arrangements, and these contractual arrangements are not intended to create any shareholder right to enforce them against the service providers or to seek any remedy under them against the service providers, either directly or on behalf of the fund.
Under the Trust’s By-Laws and Declaration of Trust, any claims asserted against or on behalf of the MFS Funds, including claims against Trustees and Officers, must be brought in state and federal courts located within the Commonwealth of Massachusetts.
FEDERAL TAX INFORMATION (unaudited)
The following information is provided pursuant to provisions of the Internal Revenue Code.
The fund designates $10,433,000 as capital gain dividends paid during the fiscal year.
For corporate shareholders, 97.46% of the ordinary income dividends paid during the fiscal year qualify for the corporate dividends received deduction.
28
rev. 3/16
| | | | |
| FACTS | | WHAT DOES MFS DO WITH YOUR
PERSONAL INFORMATION? | |  |
| | |
| Why? | | Financial companies choose how they share your personal information. Federal law gives consumers the right to limit some but not all sharing. Federal law also requires us to tell you how we collect, share, and protect your personal information. Please read this notice carefully to understand what we do. |
| | |
| What? | | The types of personal information we collect and share depend on the product or service you have with us. This information can include: • Social Security number and account balances • Account transactions and transaction history • Checking account information and wire transfer instructions When you are no longer our customer, we continue to share your information as described in this notice. |
| | |
| How? | | All financial companies need to share customers’ personal information to run their everyday business. In the section below, we list the reasons financial companies can share their customers’ personal information; the reasons MFS chooses to share; and whether you can limit this sharing. |
| | | | |
Reasons we can share your
personal information | | Does MFS share? | | Can you limit this
sharing? |
For our everyday business purposes – such as to process your transactions, maintain your account(s), respond to court orders and legal investigations, or report to credit bureaus | | Yes | | No |
For our marketing purposes – to offer our products and services to you | | No | | We don’t share |
| For joint marketing with other financial companies | | No | | We don’t share |
For our affiliates’ everyday business purposes – information about your transactions and experiences | | No | | We don’t share |
For our affiliates’ everyday business purposes – information about your creditworthiness | | No | | We don’t share |
| For nonaffiliates to market to you | | No | | We don’t share |
| | |
| Questions? | | Call 800-225-2606 or go to mfs.com. |
29
| | |
| Who we are |
| Who is providing this notice? | | MFS Funds, MFS Investment Management, MFS Institutional Advisors, Inc., and MFS Heritage Trust Company. |
| | |
| What we do |
| How does MFS protect my personal information? | | To protect your personal information from unauthorized access and use, we use security measures that comply with federal law. These measures include procedural, electronic, and physical safeguards for the protection of the personal information we collect about you. |
How does MFS
collect my personal information? | | We collect your personal information, for example, when you • open an account or provide account information • direct us to buy securities or direct us to sell your securities • make a wire transfer We also collect your personal information from others, such as credit bureaus, affiliates, or other companies. |
| Why can’t I limit all sharing? | | Federal law gives you the right to limit only • sharing for affiliates’ everyday business purposes – information about your creditworthiness • affiliates from using your information to market to you • sharing for nonaffiliates to market to you State laws and individual companies may give you additional rights to limit sharing. |
| | |
| Definitions |
| Affiliates | | Companies related by common ownership or control. They can be financial and nonfinancial companies. • MFS does not share personal information with affiliates, except for everyday business purposes as described on page one of this notice. |
| Nonaffiliates | | Companies not related by common ownership or control. They can be financial and nonfinancial companies. • MFS does not share with nonaffiliates so they can market to you. |
| Joint marketing | | A formal agreement between nonaffiliated financial companies that together market financial products or services to you. • MFS doesn’t jointly market. |
| | |
| Other important information |
| If you own an MFS product or receive an MFS service in the name of a third party such as a bank or broker-dealer, their privacy policy may apply to you instead of ours. |
30
ANNUAL REPORT
December 31, 2017

MFS® MODERATE ALLOCATION PORTFOLIO
MFS® Variable Insurance Trust III

VMA-ANN
MFS® MODERATE ALLOCATION PORTFOLIO
CONTENTS
The report is prepared for the general information of contract owners. It is authorized for distribution to prospective investors only when preceded or accompanied by a current prospectus.
NOT FDIC INSURED • MAY LOSE VALUE • NO BANK OR CREDIT UNION GUARANTEE • NOT A DEPOSIT • NOT INSURED BY ANY FEDERAL GOVERNMENT AGENCY OR NCUA/NCUSIF
MFS Moderate Allocation Portfolio
LETTER FROM THE EXECUTIVE CHAIRMAN

Dear Contract Owners:
Rising bond yields have led to a measurable uptick in market volatility, which has been a departure from the low-volatility environment that prevailed for much of 2017. In spite of this, global markets remain elevated amid synchronized economic growth. Although the U.S. Federal Reserve continues to gradually raise interest rates and shrink its balance sheet, monetary policy remains accommodative around the world, with many central banks taking only tentative steps toward tighter policies. However, interest rates have begun to rise globally of late as investors anticipate that central policy shifts may be necessary in the months ahead.
Newly enacted U.S. tax reforms have been welcomed by equity markets while emerging market economies have been boosted by a weaker U.S. dollar. Around the world, inflation remains largely subdued but tight labor markets and solid global demand have investors on the lookout for its potential resurgence amid robust global trade and recovering commodity prices.
At MFS®, we believe having a disciplined, long-term investment approach through a full market cycle is essential to capturing the best opportunities while also managing risk. In our view, such a strategy, along with the professional guidance of a financial advisor, will help you reach your investment objectives.
Respectfully,

Robert J. Manning
Executive Chairman
MFS Investment Management
February 15, 2018
The opinions expressed in this letter are subject to change and may not be relied upon for investment advice. No forecasts can be guaranteed.
1
MFS Moderate Allocation Portfolio
PORTFOLIO COMPOSITION
Portfolio target allocation
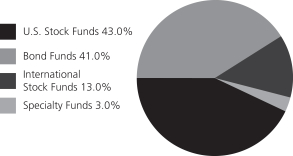
| | | | |
| Portfolio holdings | | | | |
| MFS Total Return Bond Series | | | 12.0% | |
| MFS Government Securities Portfolio | | | 10.0% | |
| MFS Value Series | | | 9.0% | |
| MFS Growth Series | | | 8.9% | |
| MFS Research Series | | | 8.0% | |
| MFS Research International Portfolio | | | 7.0% | |
| MFS Mid Cap Growth Series | | | 7.0% | |
| MFS Mid Cap Value Portfolio | | | 7.0% | |
| MFS Inflation-Adjusted Bond Portfolio | | | 5.0% | |
| MFS Global Governments Portfolio | | | 5.0% | |
| MFS High Yield Portfolio | | | 5.0% | |
| MFS Limited Maturity Portfolio | | | 4.0% | |
| MFS Global Real Estate Portfolio | | | 3.0% | |
| MFS International Growth Portfolio | | | 3.0% | |
| MFS International Value Portfolio | | | 3.0% | |
| MFS New Discovery Series | | | 1.5% | |
| MFS New Discovery Value Portfolio | | | 1.5% | |
| Cash & Cash Equivalents | | | 0.1% | |
Portfolio actual allocation
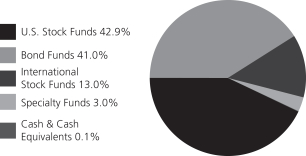
Cash & Cash Equivalents includes any cash, investments in money market funds, short-term securities, and other assets less liabilities. MFS endeavors to fully invest all MFS funds-of-funds in underlying funds on a daily basis. Any divergence from 0.0% in Cash & Cash Equivalents is typically due to the timing of fund subscriptions/redemptions and the settlement of subsequent investment in/divestment from the underlying funds. While the MFS funds-of-funds’ subscriptions/redemptions are processed at the same day NAV of the underlying funds, a positive/negative cash balance will be reflected on the MFS funds-of-funds’ Statement of Assets and Liabilities until the trades with the underlying funds settle. Please see the Statement of Assets and Liabilities for additional information related to the fund’s cash position and other assets and liabilities.
Percentages are based on net assets as of December 31, 2017.
The portfolio is actively managed and current holdings may be different.
2
MFS Moderate Allocation Portfolio
MANAGEMENT REVIEW
Summary of Results
For the twelve months ended December 31, 2017, Initial Class shares of the MFS Moderate Allocation Portfolio (“fund”) provided a total return of 15.52%, while Service Class shares of the fund provided a total return of 15.23%. These compare with a return of 21.83% for the fund’s benchmark, the Standard & Poor’s 500 Stock Index (“S&P 500 Index”). The fund’s other benchmark, the MFS Moderate Allocation Portfolio Blended Index (“Blended Index”), generated a return of 14.08%. The Blended Index reflects the blended returns of various equity and fixed income market indices, with percentage allocations to each index designed to resemble the allocations of the fund. The market indices and related percentage allocations used to compile the Blended Index are set forth in the Performance Summary.
Market Environment
For the first time in many years, the global economy experienced a period of synchronized economic growth over the reporting period. The rebound in emerging markets (“EM”) economies was more pronounced (despite the slight deceleration in Chinese growth at the end of the period), helped by larger economies, such as Brazil and Russia, emerging from recessions. At the same time, developed markets (“DM”) economies continued to grow at or above potential. Market confidence increased in the US during the period fueled, in part, by a more lenient US regulatory backdrop and hopes for a significant cut in corporate tax rates, which came to fruition at the end of the period.
Globally, markets benefited from a reflation trade as commodity prices strengthened, activity and growth prospects improved, and inflation moved higher, though within moderate bounds. As a result, there were more tightening signals and actions by DM central banks. The US Federal Reserve increased interest rates by 25 basis points three times during the period, bringing the total number of quarter-percent hikes in the federal funds rate to five, since December 2015. The European Central Bank announced an extension of its quantitative easing program at the end of the period, but reduced the pace of its monthly asset purchases by half. In addition, the Bank of England hiked its base rate for the first time in a decade, late in the end of the period. Markets were comforted, along with central banks, by the decline in fears of a populist surge in Europe after establishment candidates won the Dutch and French elections, though a right-wing populist party gained seats in the German parliament for the first time in the post-World War II era. Additionally, European growth reflected a generally calmer political economic backdrop.
In recent months, the US dollar reversed the sharp rise seen early in the period, easing what had been a substantial headwind to earnings for multinationals. US consumer spending held up well during the second half of the period amid a modest increase in real wages and relatively low gasoline prices. However, demand for autos cooled from the record level logged early in the period, while the housing market improved, albeit constrained by below-average inventory levels. Global trade, which was sluggish early in the period, showed signs of improvement in the period’s second half, a positive indicator of global economic activity and prospects. Early in the period, there was a selloff in EM due to fears that President Trump would follow through on various campaign threats and promises that were judged to be detrimental to EM. While President Trump withdrew the US from the Trans-Pacific Partnership and began the renegotiation of the North American Free Trade Agreement, significant additional policy action was lacking on economic issues involving EM. As a result, EM resumed their upward trajectory, powered by strong inflows throughout 2017.
Factors Affecting Performance
During the reporting period, the fund underperformed its benchmark, the S&P 500 Index, as equities outpaced both the fixed income and real estate markets. However, the fund outperformed the Blended Index.
Within the U.S. equity asset class, the fund’s diversification down the market capitalization spectrum held back performance relative to the Blended Index. However, this was more than offset by strong active performance across most of the fund’s underlying portfolios, with the MFS Mid Cap Value Portfolio a notable standout.
The fixed income asset class was also a primary contributor to relative performance. The fund’s allocation to the MFS Inflation-Adjusted Bond Portfolio and MFS Global Governments Portfolio benefited relative performance, as global markets in US dollar terms, performed well over the reporting period. Additionally, the fund’s allocation to the MFS High Yield Portfolio also strengthened relative returns, as credit markets also performed well. Conversely, the fund’s exposure to the MFS Government Securities Portfolio and MFS Limited Maturity Portfolio held back relative performance during the reporting period.
The international equity segment strengthened relative performance, as the MFS Research International Portfolio and the MFS International Value Portfolio outperformed their respective benchmarks during the reporting period. Additionally, the fund’s allocation to MFS International Growth Portfolio benefited relative returns, driven by the strong performance of emerging markets.
3
MFS Moderate Allocation Portfolio
Management Review – continued
Respectfully,
| | | | |
| Portfolio Manager(s) | | | | |
| Joseph Flaherty | | | | |
The views expressed in this report are those of the portfolio manager(s) only through the end of the period of the report as stated on the cover and do not necessarily reflect the views of MFS or any other person in the MFS organization. These views are subject to change at any time based on market or other conditions, and MFS disclaims any responsibility to update such views. These views may not be relied upon as investment advice or an indication of trading intent on behalf of any MFS portfolio. References to specific securities are not recommendations of such securities, and may not be representative of any MFS portfolio’s current or future investments.
4
MFS Moderate Allocation Portfolio
PERFORMANCE SUMMARY THROUGH 12/31/17
The following chart illustrates the historical performance of the fund in comparison to its benchmark(s). Benchmarks are unmanaged and may not be invested in directly. Benchmark returns do not reflect any fees or expenses. The performance of other share classes will be greater than or less than that of the class depicted below. (See Notes to Performance Summary.)
Performance data shown represents past performance and is no guarantee of future results. Investment return and principal value fluctuate so your units, when sold, may be worth more or less than the original cost; current performance may be lower or higher than quoted. The performance shown does not reflect the deduction of taxes, if any, that a contract holder would pay on fund distributions or the redemption of contract units. The returns for the fund shown also do not reflect the deduction of expenses associated with variable products, such as mortality and expense risk charges, separate account charges, and sales charges imposed by the insurance company separate accounts. Such expenses would reduce the overall returns shown.
Growth of a Hypothetical $10,000 Investment (t)
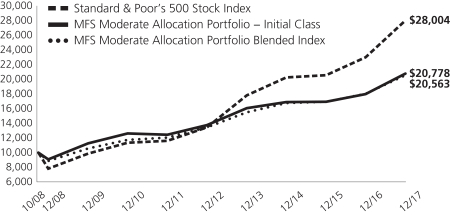
Total Returns through 12/31/17
Average annual total returns
| | | | | | | | | | | | |
| | | Share Class | | Class Inception Date | | 1-yr | | 5-yr | | Life (t) | | |
| | | Initial Class | | 10/01/08 | | 15.52% | | 8.65% | | 8.22% | | |
| | | Service Class | | 10/01/08 | | 15.23% | | 8.37% | | 7.95% | | |
| | | | |
| Comparative benchmark(s) | | | | | | | | |
| | | Standard & Poor’s 500 Stock Index (f) | | 21.83% | | 15.79% | | 11.77% | | |
| | | MFS Moderate Allocation Portfolio Blended Index (f)(w) | | 14.08% | | 8.86% | | 8.10% | | |
| | | Bloomberg Barclays U.S. Aggregate Bond Index (f) | | 3.54% | | 2.10% | | 4.26% | | |
| | | FTSE EPRA/NAREIT Developed Real Estate Index (net div) (f) | | 10.36% | | 6.32% | | 6.53% | | |
| | | MSCI EAFE Index (net div) (f) | | 25.03% | | 7.90% | | 5.99% | | |
| (f) | | Source: FactSet Research Systems Inc. |
| (t) | | For the period from the class inception date through the stated period end. (See Notes to Performance Summary.) |
| (w) | | As of December 31, 2017, the MFS Moderate Allocation Portfolio Blended Index was comprised of 43% Standard & Poor’s 500 Stock Index, 41% Bloomberg Barclays U.S. Aggregate Bond Index, 13% MSCI EAFE Index (net div), and 3% FTSE EPRA/NAREIT Developed Real Estate Index (net div). |
Benchmark Definition(s)
Bloomberg Barclays U.S. Aggregate Bond Index – a market capitalization-weighted index that measures the performance of the U.S. investment-grade, fixed rate bond market, with index components for government and corporate securities, mortgage pass-through securities, and asset-backed securities with at least one year to final maturity.
FTSE EPRA/NAREIT Developed Real Estate Index (net div) – measures the performance of eligible real estate equities worldwide that generate a majority of their revenue and income through the ownership, disposure and development of income-producing real estate.
MSCI EAFE (Europe, Australasia, Far East) Index (net div) – a market capitalization index that is designed to measure equity market performance in the developed markets, excluding the U.S. and Canada.
5
MFS Moderate Allocation Portfolio
Performance Summary – continued
Standard & Poor’s 500 Stock Index – a market capitalization-weighted index of 500 widely held equity securities, designed to measure broad U.S. equity performance.
It is not possible to invest directly in an index.
Notes to Performance Summary
Average annual total return represents the average annual change in value for each share class for the periods presented. Life returns are presented where the share class has less than 10 years of performance history and represent the average annual total return from the class inception date to the stated period end date.
Performance results reflect any applicable expense subsidies and waivers in effect during the periods shown. Without such subsidies and waivers the fund’s performance results would be less favorable. Please see the prospectus and financial statements for complete details. All results are historical and assume the reinvestment of any dividends and capital gains distributions.
Performance prior to close of business December 7, 2012, reflects time periods when another adviser or subadviser was responsible for selecting investments for the fund under a different investment objective and different investment strategies, underlying fund selections, and underlying fund target weightings of the fund.
Performance results do not include adjustments made for financial reporting purposes in accordance with U.S. generally accepted accounting principles and may differ from amounts reported in the financial highlights.
From time to time the fund may receive proceeds from litigation settlements, without which performance would be lower.
6
MFS Moderate Allocation Portfolio
EXPENSE TABLE
Fund Expenses Borne by the Contract Holders during the Period,
July 1, 2017 through December 31, 2017
As a contract holder of the fund, you incur ongoing costs, including distribution and/or service (12b-1) fees; and other fund expenses. This example is intended to help you understand your ongoing costs (in dollars) of investing in the fund and to compare these costs with the ongoing costs of investing in other mutual funds.
In addition to the fees and expenses which the fund bears directly, the fund indirectly bears a pro rata share of the fees and expenses of the underlying funds in which the fund invests. Because the underlying funds have varied expenses and fee levels and the fund may own different proportions of the underlying funds at different times, the amount of fees and expenses incurred indirectly by the fund will vary. If these indirect costs were included, your costs would have been higher.
The example is based on an investment of $1,000 invested at the beginning of the period and held for the entire period July 1, 2017 through December 31, 2017.
Actual Expenses
The first line for each share class in the following table provides information about actual account values and actual expenses. You may use the information in this line, together with the amount you invested, to estimate the expenses that you paid over the period. Simply divide your account value by $1,000 (for example, an $8,600 account value divided by $1,000 = 8.6), then multiply the result by the number in the first line under the heading entitled “Expenses Paid During Period” to estimate the expenses you paid on your account during this period.
Hypothetical Example for Comparison Purposes
The second line for each share class in the following table provides information about hypothetical account values and hypothetical expenses based on the fund’s actual expense ratio and an assumed rate of return of 5% per year before expenses, which is not the fund’s actual return. The hypothetical account values and expenses may not be used to estimate the actual ending account balance or expenses you paid for the period. You may use this information to compare the ongoing costs of investing in the fund and other funds. To do so, compare this 5% hypothetical example with the 5% hypothetical examples that appear in the shareholder reports of the other funds.
Please note that the expenses shown in the table are meant to highlight the fund’s ongoing costs only and do not take into account the fees and expenses imposed under the variable contracts through which your investment in the fund is made. Therefore, the second line for each share class in the table is useful in comparing ongoing costs associated with an investment in vehicles (such as the fund) which fund benefits under variable annuity and variable life insurance contracts and to qualified pension and retirement plans only, and will not help you determine the relative total costs of investing in the fund through variable annuity and variable life insurance contracts. If the fees and expenses imposed under the variable contracts were included, your costs would have been higher.
| | | | | | | | | | | | | | | | | | |
| Share Class | | | | Annualized
Expense Ratio | | | Beginning
Account Value
7/01/17 | | | Ending Account Value
12/31/17 | | | Expenses Paid
During Period (p)
7/01/17-12/31/17 | |
| Initial Class | | Actual | | | 0.01% | | | | $1,000.00 | | | | $1,064.81 | | | | $0.05 | |
| | Hypothetical (h) | | | 0.01% | | | | $1,000.00 | | | | $1,025.16 | | | | $0.05 | |
| Service Class | | Actual | | | 0.26% | | | | $1,000.00 | | | | $1,063.68 | | | | $1.35 | |
| | Hypothetical (h) | | | 0.26% | | | | $1,000.00 | | | | $1,023.89 | | | | $1.33 | |
| (h) | 5% class return per year before expenses. |
| (p) | “Expenses Paid During Period” are equal to each class’s annualized expense ratio, as shown above, multiplied by the average account value over the period, multiplied by 184/365 (to reflect the one-half year period). In addition to the fees and expenses which the fund bears directly, the fund indirectly bears a pro rata share of the fees and expenses of the underlying funds in which the fund invests. If these indirect costs were included, your costs would have been higher. |
7
MFS Moderate Allocation Portfolio
PORTFOLIO OF INVESTMENTS – 12/31/17
The Portfolio of Investments is a complete list of all securities owned by your fund. It is categorized by broad-based asset classes.
| | | | | | | | |
| Issuer | | Shares/Par | | | Value ($) | |
| INVESTMENT COMPANIES (h) – 100.0% | |
| Bond Funds – 41.0% | | | | | |
| MFS Global Governments Portfolio – Initial Class (a) | | | 8,017,102 | | | $ | 84,660,597 | |
| MFS Government Securities Portfolio – Initial Class | | | 13,652,904 | | | | 169,159,481 | |
| MFS High Yield Portfolio – Initial Class | | | 14,658,937 | | | | 84,582,067 | |
| MFS Inflation-Adjusted Bond Portfolio – Initial Class (a) | | | 7,836,431 | | | | 84,711,822 | |
| MFS Limited Maturity Portfolio – Initial Class | | | 6,643,380 | | | | 67,629,607 | |
| MFS Total Return Bond Series – Initial Class | | | 15,356,076 | | | | 203,007,324 | |
| | | | | | | | |
| | | | | | $ | 693,750,898 | |
| | | | | | | | |
| International Stock Funds – 13.0% | | | | | |
| MFS International Growth Portfolio – Initial Class | | | 3,280,462 | | | $ | 50,847,154 | |
| MFS International Value Portfolio – Initial Class | | | 1,798,268 | | | | 50,801,058 | |
| MFS Research International Portfolio – Initial Class | | | 6,957,247 | | | | 118,621,061 | |
| | | | | | | | |
| | | | | | $ | 220,269,273 | |
| | | | | | | | |
| Specialty Funds – 3.0% | | | | | |
| MFS Global Real Estate Portfolio – Initial Class | | | 3,563,341 | | | $ | 50,848,883 | |
| | | | | | | | |
| U.S. Stock Funds – 42.9% | | | | | |
| MFS Growth Series – Initial Class | | | 3,102,150 | | | $ | 151,695,137 | |
| MFS Mid Cap Growth Series – Initial Class | | | 12,435,101 | | | | 118,257,807 | |
| MFS Mid Cap Value Portfolio – Initial Class | | | 13,124,085 | | | | 118,248,009 | |
| MFS New Discovery Series – Initial Class | | | 1,261,710 | | | | 25,360,364 | |
| MFS New Discovery Value Portfolio – Initial Class | | | 2,278,555 | | | | 25,360,320 | |
| MFS Research Series – Initial Class | | | 4,573,372 | | | | 134,914,485 | |
| MFS Value Series – Initial Class | | | 7,261,373 | | | | 151,907,933 | |
| | | | | | | | |
| | | | | | $ | 725,744,055 | |
| | | | | | | | |
| | | | | | | | |
| Issuer | | Shares/Par | | | Value ($) | |
| INVESTMENT COMPANIES (h) – continued | |
| Money Market Funds – 0.1% | | | | | |
| MFS Institutional Money Market Portfolio, 1.25% (v) | | | 1,547,664 | | | $ | 1,547,509 | |
| | | | | | | | |
Total Investment Companies
(Identified Cost, $1,426,664,719) | | | | | | $ | 1,692,160,618 | |
| | | | | | | | |
OTHER ASSETS, LESS
LIABILITIES – (0.0)% | | | | | | | (103,602 | ) |
| | | | | | | | |
| NET ASSETS – 100.0% | | | | | | $ | 1,692,057,016 | |
| | | | | | | | |
| (a) | | Non-income producing security. |
| (h) | | An affiliated issuer may be considered one in which the fund owns 5% or more of the outstanding voting securities, or a company which is under common control. At period end, the aggregate values of the fund’s investments in affiliated issuers and in unaffiliated issuers were $1,692,160,618 and $0, respectively. |
| (v) | | Affiliated issuer that is available only to investment companies managed by MFS. The rate quoted for the MFS Institutional Money Market Portfolio is the annualized seven-day yield of the fund at period end. |
See Notes to Financial Statements
8
MFS Moderate Allocation Portfolio
FINANCIAL STATEMENTS | STATEMENT OF ASSETS AND LIABILITIES
This statement represents your fund’s balance sheet, which details the assets and liabilities comprising the total value of the fund.
| | | | |
At 12/31/17 | | | | |
Assets | | | | |
Investments in affiliated issuers, at value (identified cost, $1,426,664,719) | | | $1,692,160,618 | |
Receivables for | | | | |
Investments sold | | | 2,076,596 | |
Fund shares sold | | | 2,039 | |
Other assets | | | 9,742 | |
Total assets | | | $1,694,248,995 | |
Liabilities | | | | |
Payable for fund shares reacquired | | | $2,076,997 | |
Payable to affiliates | | | | |
Administrator | | | 190 | |
Shareholder servicing costs | | | 297 | |
Distribution and/or service fees | | | 46,258 | |
Payable for independent Trustees’ compensation | | | 42 | |
Accrued expenses and other liabilities | | | 68,195 | |
Total liabilities | | | $2,191,979 | |
Net assets | | | $1,692,057,016 | |
Net assets consist of | | | | |
Paid-in capital | | | $1,329,333,817 | |
Unrealized appreciation (depreciation) | | | 265,495,899 | |
Accumulated net realized gain (loss) | | | 68,568,763 | |
Undistributed net investment income | | | 28,658,537 | |
Net assets | | | $1,692,057,016 | |
Shares of beneficial interest outstanding | | | 127,066,128 | |
| | | | | | | | | | | | |
| | | Net assets | | | Shares
outstanding | | | Net asset value
per share | |
Initial Class | | | $6,053,222 | | | | 454,084 | | | | $13.33 | |
Service Class | | | 1,686,003,794 | | | | 126,612,044 | | | | 13.32 | |
Net asset value per share is calculated using actual net assets and shares outstanding rather than amounts that have been rounded for presentation purposes.
See Notes to Financial Statements
9
MFS Moderate Allocation Portfolio
FINANCIAL STATEMENTS | STATEMENT OF OPERATIONS
This statement describes how much your fund earned in investment income and accrued in expenses. It also describes any gains and/or losses generated by fund operations.
| | | | |
Year ended 12/31/17 | | | | |
Net investment income (loss) | | | | |
Dividends from affiliated issuers | | | $33,195,291 | |
Expenses | | | | |
Distribution and/or service fees | | | $4,288,465 | |
Shareholder servicing costs | | | 31,075 | |
Administrative services fee | | | 17,500 | |
Independent Trustees’ compensation | | | 32,251 | |
Custodian fee | | | 27,269 | |
Shareholder communications | | | 38,534 | |
Audit and tax fees | | | 38,355 | |
Legal fees | | | 20,483 | |
Miscellaneous | | | 42,558 | |
Total expenses | | | $4,536,490 | |
Net investment income (loss) | | | $28,658,801 | |
Realized and unrealized gain (loss) | | | | |
Realized gain (loss) (identified cost basis) | | | | |
Affiliated issuers | | | $36,152,843 | |
Capital gain distributions from affiliated issuers | | | 36,924,954 | |
Net realized gain (loss) | | | $73,077,797 | |
Change in unrealized appreciation (depreciation) | | | | |
Affiliated issuers | | | 142,345,119 | |
Net realized and unrealized gain (loss) | | | $215,422,916 | |
Change in net assets from operations | | | $244,081,717 | |
See Notes to Financial Statements
10
MFS Moderate Allocation Portfolio
FINANCIAL STATEMENTS | STATEMENTS OF CHANGES IN NET ASSETS
These statements describe the increases and/or decreases in net assets resulting from operations, any distributions, and any shareholder transactions.
| | | | | | | | |
| | | Year ended | |
| | | 12/31/17 | | | | 12/31/16 | |
Change in net assets | | | | | | | | |
| From operations | | | | | | | | |
Net investment income (loss) | | | $28,658,801 | | | | $30,617,893 | |
Net realized gain (loss) | | | 73,077,797 | | | | 63,702,612 | |
Net unrealized gain (loss) | | | 142,345,119 | | | | 8,213,774 | |
Change in net assets from operations | | | $244,081,717 | | | | $102,534,279 | |
| Distributions declared to shareholders | | | | | | | | |
From net investment income | | | $(30,618,005 | ) | | | $(45,218,025 | ) |
From net realized gain | | | (64,066,257 | ) | | | (87,880,903 | ) |
Total distributions declared to shareholders | | | $(94,684,262 | ) | | | $(133,098,928 | ) |
Change in net assets from fund share transactions | | | $(184,197,023 | ) | | | $(85,217,568 | ) |
Total change in net assets | | | $(34,799,568 | ) | | | $(115,782,217 | ) |
| Net assets | | | | | | | | |
At beginning of period | | | 1,726,856,584 | | | | 1,842,638,801 | |
At end of period (including undistributed net investment income of $28,658,537 and
$30,617,741, respectively) | | | $1,692,057,016 | | | | $1,726,856,584 | |
See Notes to Financial Statements
11
MFS Moderate Allocation Portfolio
FINANCIAL STATEMENTS | FINANCIAL HIGHLIGHTS
The financial highlights table is intended to help you understand the fund’s financial performance for the past 5 years. Certain information reflects financial results for a single fund share. The total returns in the table represent the rate that an investor would have earned (or lost) on an investment in the fund share class (assuming reinvestment of all distributions) held for the entire period.
| | | | | | | | | | | | | | | | | | | | |
| Initial Class | | Year ended | |
| | | 12/31/17 | | | 12/31/16 | | | 12/31/15 | | | 12/31/14 | | | 12/31/13 | |
Net asset value, beginning of period | | | $12.25 | | | | $12.48 | | | | $13.34 | | | | $13.02 | | | | $12.20 | |
| Income (loss) from investment operations | | | | | | | | | | | | | | | | | | | | |
Net investment income (loss) (d)(l) | | | $0.26 | | | | $0.24 | (c) | | | $0.29 | | | | $0.21 | | | | $0.09 | |
Net realized and unrealized gain (loss) | | | 1.60 | | | | 0.55 | | | | (0.27 | ) | | | 0.48 | | | | 1.88 | |
Total from investment operations | | | $1.86 | | | | $0.79 | | | | $0.02 | | | | $0.69 | | | | $1.97 | |
| Less distributions declared to shareholders | | | | | | | | | | | | | | | | | | | | |
From net investment income | | | $(0.28 | ) | | | $(0.37 | ) | | | $(0.55 | ) | | | $(0.21 | ) | | | $(0.35 | ) |
From net realized gain | | | (0.50 | ) | | | (0.65 | ) | | | (0.33 | ) | | | (0.16 | ) | | | (0.80 | ) |
Total distributions declared to shareholders | | | $(0.78 | ) | | | $(1.02 | ) | | | $(0.88 | ) | | | $(0.37 | ) | | | $(1.15 | ) |
Net asset value, end of period (x) | | | $13.33 | | | | $12.25 | | | | $12.48 | | | | $13.34 | | | | $13.02 | |
Total return (%) (k)(s)(x) | | | 15.52 | | | | 6.16 | (c) | | | 0.35 | | | | 5.28 | | | | 16.87 | |
Ratios (%) (to average net assets)
and Supplemental data: | | | | | | | | | | | | | | | | | | | | |
Expenses before expense reductions (f)(h) | | | 0.01 | | | | 0.02 | (c) | | | 0.01 | | | | 0.01 | | | | 0.02 | |
Expenses after expense reductions (f)(h) | | | N/A | | | | N/A | | | | N/A | | | | 0.01 | | | | 0.02 | |
Net investment income (loss) (l) | | | 1.98 | | | | 1.95 | (c) | | | 2.16 | | | | 1.55 | | | | 0.73 | |
Portfolio turnover | | | 0 | (b) | | | 0 | (b) | | | 1 | | | | 2 | | | | 6 | |
Net assets at end of period (000 omitted) | | | $6,053 | | | | $5,460 | | | | $5,509 | | | | $7,240 | | | | $6,124 | |
| |
| Service Class | | Year ended | |
| | | 12/31/17 | | | 12/31/16 | | | 12/31/15 | | | 12/31/14 | | | 12/31/13 | |
Net asset value, beginning of period | | | $12.24 | | | | $12.47 | | | | $13.32 | | | | $13.00 | | | | $12.19 | |
| Income (loss) from investment operations | | | | | | | | | | | | | | | | | | | | |
Net investment income (loss) (d)(l) | | | $0.22 | | | | $0.21 | (c) | | | $0.22 | | | | $0.17 | | | | $0.10 | |
Net realized and unrealized gain (loss) | | | 1.60 | | | | 0.54 | | | | (0.23 | ) | | | 0.49 | | | | 1.82 | |
Total from investment operations | | | $1.82 | | | | $0.75 | | | | $(0.01 | ) | | | $0.66 | | | | $1.92 | |
| Less distributions declared to shareholders | | | | | | | | | | | | | | | | | | | | |
From net investment income | | | $(0.24 | ) | | | $(0.33 | ) | | | $(0.51 | ) | | | $(0.18 | ) | | | $(0.31 | ) |
From net realized gain | | | (0.50 | ) | | | (0.65 | ) | | | (0.33 | ) | | | (0.16 | ) | | | (0.80 | ) |
Total distributions declared to shareholders | | | $(0.74 | ) | | | $(0.98 | ) | | | $(0.84 | ) | | | $(0.34 | ) | | | $(1.11 | ) |
Net asset value, end of period (x) | | | $13.32 | | | | $12.24 | | | | $12.47 | | | | $13.32 | | | | $13.00 | |
Total return (%) (k)(s)(x) | | | 15.23 | | | | 5.87 | (c) | | | 0.13 | | | | 5.04 | | | | 16.51 | |
Ratios (%) (to average net assets)
and Supplemental data: | | | | | | | | | | | | | | | | | | | | |
Expenses before expense reductions (f)(h) | | | 0.26 | | | | 0.27 | (c) | | | 0.26 | | | | 0.26 | | | | 0.27 | |
Expenses after expense reductions (f)(h) | | | N/A | | | | N/A | | | | N/A | | | | 0.26 | | | | 0.27 | |
Net investment income (loss) (l) | | | 1.66 | | | | 1.71 | (c) | | | 1.69 | | | | 1.29 | | | | 0.76 | |
Portfolio turnover | | | 0 | (b) | | | 0 | (b) | | | 1 | | | | 2 | | | | 6 | |
Net assets at end of period (000 omitted) | | | $1,686,004 | | | | $1,721,397 | | | | $1,837,130 | | | | $2,121,968 | | | | $2,199,921 | |
See Notes to Financial Statements
12
MFS Moderate Allocation Portfolio
Financial Highlights – continued
| (c) | Amount reflects a one-time reimbursement of expenses by the custodian (or former custodian) without which net investment income and performance would be lower and expenses would be higher. |
| (d) | Per share data is based on average shares outstanding. |
| (f) | Ratios do not reflect reductions from fees paid indirectly, if applicable. |
| (h) | In addition to the fees and expenses which the fund bears directly, the fund indirectly bears a pro rata share of the fees and expenses of the underlying affiliated funds in which the fund invests. Accordingly, the expense ratio for the fund reflects only those fees and expenses borne directly by the fund. Because the underlying affiliated funds have varied expense and fee levels and the fund may own different proportions of the underlying affiliated funds at different times, the amount of fees and expenses incurred indirectly by the fund will vary. |
| (k) | The total return does not reflect expenses that apply to separate accounts. Inclusion of these charges would reduce the total return figures for all periods shown. |
| (l) | Recognition of net investment income by the fund may be affected by the timing of the declaration of dividends by the underlying affiliated funds in which the fund invests. The ratios and per share amounts do not include net investment income of the underlying affiliated funds in which the fund invests. |
| (s) | From time to time the fund may receive proceeds from litigation settlements, without which performance would be lower. |
| (x) | The net asset values and total returns have been calculated on net assets which include adjustments made in accordance with U.S. generally accepted accounting principles required at period end for financial reporting purposes. |
See Notes to Financial Statements
13
MFS Moderate Allocation Portfolio
NOTES TO FINANCIAL STATEMENTS
| (1) | | Business and Organization |
MFS Moderate Allocation Portfolio (the fund) is a diversified series of MFS Variable Insurance Trust III (the trust). The trust is organized as a Delaware statutory trust and is registered under the Investment Company Act of 1940, as amended, as an open-end management investment company. The shareholders of each series of the trust are separate accounts of insurance companies, which offer variable annuity and/or life insurance products, and qualified retirement and pension plans.
The fund is an investment company and accordingly follows the investment company accounting and reporting guidance of the Financial Accounting Standards Board (FASB) Accounting Standards Codification Topic 946 Financial Services – Investment Companies.
| (2) | | Significant Accounting Policies |
General – The preparation of financial statements in conformity with U.S. generally accepted accounting principles requires management to make estimates and assumptions that affect the reported amounts of assets and liabilities, and disclosure of contingent assets and liabilities at the date of the financial statements and the reported amounts of increases and decreases in net assets from operations during the reporting period. Actual results could differ from those estimates. In the preparation of these financial statements, management has evaluated subsequent events occurring after the date of the fund’s Statement of Assets and Liabilities through the date that the financial statements were issued.
The fund is a “fund of funds”, which invests the majority of its assets in other MFS mutual funds (hereafter referred to as “underlying affiliated funds” or “underlying funds”), which may have different fiscal year ends than the funds. The underlying funds, in turn, may engage in a number of investment techniques and practices, which involve certain risks. Certain underlying funds invest their portfolio in high-yield securities rated below investment grade. Investments in below investment grade quality securities can involve a substantially greater risk of default or can already be in default, and their values can decline significantly. Below investment grade quality securities tend to be more sensitive to adverse news about the issuer, or the market or economy in general, than higher quality debt instruments. Certain underlying funds invest a significant portion of their assets in asset-backed and/or mortgage-backed securities. For these securities, the value of the debt instrument also depends on the credit quality and adequacy of the underlying assets or collateral as well as whether there is a security interest in the underlying assets or collateral. Enforcing rights, if any, against the underlying assets or collateral may be difficult. U.S. Government securities not supported as to the payment of principal or interest by the U.S. Treasury, such as those issued by Fannie Mae, Freddie Mac, and the Federal Home Loan Banks, are subject to greater credit risk than are U.S. Government securities supported by the U.S. Treasury, such as those issued by Ginnie Mae. Certain underlying funds invest in foreign securities, including securities of emerging market issuers. Investments in foreign securities are vulnerable to the effects of changes in the relative values of the local currency and the U.S. dollar and to the effects of changes in each country’s market, economic, industry, political, regulatory, geopolitical, and other conditions. Investments in emerging markets can involve additional and greater risks than the risks associated with investments in developed foreign markets. Emerging markets can have less developed markets, greater custody and operational risk, less developed legal, regulatory, and accounting systems, and greater political, social, and economic instability than developed markets.
The accounting policies of the underlying funds in which the fund invests are outlined in the underlying funds’ shareholder reports, which are available without charge by calling 1-800-225-2606, at mfs.com and on the Securities and Exchange Commission (SEC) web site at http://www.sec.gov or at the SEC’s public reference room in Washington, D.C. The underlying funds’ shareholder reports are not covered by this report.
In October 2016, the Securities and Exchange Commission (SEC) released its final rule on Investment Company Reporting Modernization (the “Rule”). The Rule, which introduced two new regulatory reporting forms for investment companies – Form N-PORT and Form N-CEN – also contained amendments to Regulation S-X which impact financial statement presentation, particularly the presentation of derivative investments, for all reporting periods ending after August 1, 2017. The fund has adopted the Rule’s Regulation S-X amendments and believes that the fund’s financial statements are in compliance with those amendments.
Investment Valuations – Open-end investment companies (underlying funds) are generally valued at their net asset value per share. The investments of underlying funds managed by the adviser are valued as described below. For purposes of this policy disclosure, “fund” also refers to the underlying funds in which the fund-of-funds invests.
Equity securities, including restricted equity securities and equity securities held short, are generally valued at the last sale or official closing price on their primary market or exchange as provided by a third-party pricing service. Equity securities, for which there were no sales reported that day, are generally valued at the last quoted daily bid quotation on their primary market or exchange as provided by a third-party pricing service. Equity securities held short, for which there were no sales reported for that day, are generally valued at the last quoted daily ask quotation on their primary market or exchange as provided by a third-party pricing service. Debt instruments and floating rate loans, including restricted debt instruments, are generally valued at an evaluated or composite bid as provided by a third-party pricing service. Short-term instruments with a maturity at issuance of 60 days or less may be valued at amortized cost, which approximates market value. Exchange-traded options are generally valued at the last sale or
14
MFS Moderate Allocation Portfolio
Notes to Financial Statements – continued
official closing price on their primary exchange as provided by a third-party pricing service. Exchange-traded options for which there were no sales reported that day are generally valued at the last daily bid quotation on their primary exchange as provided by a third-party pricing service. Options not traded on an exchange are generally valued at a broker/dealer bid quotation. Foreign currency options are generally valued at valuations provided by a third-party pricing service. Futures contracts are generally valued at last posted settlement price on their primary exchange as provided by a third-party pricing service. Futures contracts for which there were no trades that day for a particular position are generally valued at the closing bid quotation on their primary exchange as provided by a third-party pricing service. Forward foreign currency exchange contracts are generally valued at the mean of bid and asked prices for the time period interpolated from rates provided by a third-party pricing service for proximate time periods. Swap agreements are generally valued at valuations provided by a third-party pricing service, which for cleared swaps includes an evaluation of any trading activity at the clearinghouses. Open-end investment companies are generally valued at net asset value per share. Securities and other assets generally valued on the basis of information from a third-party pricing service may also be valued at a broker/dealer bid quotation. Values obtained from third-party pricing services can utilize both transaction data and market information such as yield, quality, coupon rate, maturity, type of issue, trading characteristics, and other market data. The values of foreign securities and other assets and liabilities expressed in foreign currencies are converted to U.S. dollars using the mean of bid and asked prices for rates provided by a third-party pricing service.
The Board of Trustees has delegated primary responsibility for determining or causing to be determined the value of the fund’s investments (including any fair valuation) to the adviser pursuant to valuation policies and procedures approved by the Board. If the adviser determines that reliable market quotations are not readily available, investments are valued at fair value as determined in good faith by the adviser in accordance with such procedures under the oversight of the Board of Trustees. Under the fund’s valuation policies and procedures, market quotations are not considered to be readily available for most types of debt instruments and floating rate loans and many types of derivatives. These investments are generally valued at fair value based on information from third-party pricing services. In addition, investments may be valued at fair value if the adviser determines that an investment’s value has been materially affected by events occurring after the close of the exchange or market on which the investment is principally traded (such as foreign exchange or market) and prior to the determination of the fund’s net asset value, or after the halting of trading of a specific security where trading does not resume prior to the close of the exchange or market on which the security is principally traded. Events that occur on a frequent basis after foreign markets close (such as developments in foreign markets and significant movements in the U.S. markets) and prior to the determination of the fund’s net asset value may be deemed to have a material effect on the value of securities traded in foreign markets. Accordingly, the fund’s foreign equity securities may often be valued at fair value. The adviser generally relies on third-party pricing services or other information (such as the correlation with price movements of similar securities in the same or other markets; the type, cost and investment characteristics of the security; the business and financial condition of the issuer; and trading and other market data) to assist in determining whether to fair value and at what value to fair value an investment. The value of an investment for purposes of calculating the fund’s net asset value can differ depending on the source and method used to determine value. When fair valuation is used, the value of an investment used to determine the fund’s net asset value may differ from quoted or published prices for the same investment. There can be no assurance that the fund could obtain the fair value assigned to an investment if it were to sell the investment at the same time at which the fund determines its net asset value per share.
Various inputs are used in determining the value of the fund’s assets or liabilities. These inputs are categorized into three broad levels. In certain cases, the inputs used to measure fair value may fall into different levels of the fair value hierarchy. In such cases, an investment’s level within the fair value hierarchy is based on the lowest level of input that is significant to the fair value measurement. The fund’s assessment of the significance of a particular input to the fair value measurement in its entirety requires judgment, and considers factors specific to the investment. Level 1 includes unadjusted quoted prices in active markets for identical assets or liabilities. Level 2 includes other significant observable market-based inputs (including quoted prices for similar securities, interest rates, prepayment speed, and credit risk). Level 3 includes unobservable inputs, which may include the adviser’s own assumptions in determining the fair value of investments. The following is a summary of the levels used as of December 31, 2017 in valuing the fund’s assets or liabilities:
| | | | | | | | | | | | | | | | |
| Financial Instruments | | Level 1 | | | Level 2 | | | Level 3 | | | Total | |
| Mutual Funds | | | $1,692,160,618 | | | | $— | | | | $— | | | | $1,692,160,618 | |
For further information regarding security characteristics, see the Portfolio of Investments. Please refer to the underlying funds’ shareholder reports for further information regarding the levels used in valuing the underlying funds’ assets or liabilities.
Derivatives – The fund does not invest in derivatives directly. The fund does invest in underlying funds that may use derivatives for different purposes, primarily to increase or decrease exposure to a particular market or segment of the market, or security, to increase or decrease interest rate or currency exposure, or as alternatives to direct investments. Derivatives are used for hedging or non-hedging purposes. While hedging can reduce or eliminate losses, it can also reduce or eliminate gains. When the underlying funds use derivatives as an investment to increase market exposure, or for hedging purposes, gains and losses from derivative instruments may be substantially greater than the derivative’s original cost.
15
MFS Moderate Allocation Portfolio
Notes to Financial Statements – continued
Indemnifications – Under the fund’s organizational documents, its officers and Trustees may be indemnified against certain liabilities and expenses arising out of the performance of their duties to the fund. Additionally, in the normal course of business, the fund enters into agreements with service providers that may contain indemnification clauses. The fund’s maximum exposure under these agreements is unknown as this would involve future claims that may be made against the fund that have not yet occurred.
Investment Transactions and Income – Investment transactions are recorded on the trade date. Interest income is recorded on an accrual basis. All premium and discount is amortized or accreted for financial statement purposes in accordance with U.S. generally accepted accounting principles. Distributions of income and capital gains from the underlying funds are recorded on the ex-dividend date. Recognition of net investment income by the fund is affected by the timing of the declaration of distributions by the underlying funds in which the fund invests. In determining the net gain or loss on securities sold, the cost of securities is determined on the identified cost basis.
The fund and/or the underlying funds may receive proceeds from litigation settlements. Any proceeds received from litigation involving portfolio holdings are reflected in the Statement of Operations in realized gain/loss if the security has been disposed of by the fund or in unrealized gain/loss if the security is still held by the fund. Any other proceeds from litigation not related to portfolio holdings are reflected as other income in the Statement of Operations.
Tax Matters and Distributions – The fund intends to qualify as a regulated investment company, as defined under Subchapter M of the Internal Revenue Code, and to distribute all of its taxable income, including realized capital gains. As a result, no provision for federal income tax is required. The fund’s federal tax returns, when filed, will remain subject to examination by the Internal Revenue Service for a three year period. Management has analyzed the fund’s tax positions taken on federal and state tax returns for all open tax years and does not believe that there are any uncertain tax positions that require recognition of a tax liability.
Distributions to shareholders are recorded on the ex-dividend date. Income and capital gain distributions are determined in accordance with income tax regulations, which may differ from U.S. generally accepted accounting principles. Certain capital accounts in the financial statements are periodically adjusted for permanent differences in order to reflect their tax character. These adjustments have no impact on net assets or net asset value per share. Temporary differences which arise from recognizing certain items of income, expense, gain or loss in different periods for financial statement and tax purposes will reverse at some time in the future. Distributions in excess of net investment income or net realized gains are temporary overdistributions for financial statement purposes resulting from differences in the recognition or classification of income or distributions for financial statement and tax purposes.
Book/tax differences primarily relate to wash sale loss deferrals.
The tax character of distributions declared to shareholders for the last two fiscal years is as follows:
| | | | | | | | |
| | | Year ended | | | Year ended | |
| | | 12/31/17 | | | 12/31/16 | |
| Ordinary income (including any short-term capital gains) | | | $32,261,217 | | | | $49,140,721 | |
| Long-term capital gains | | | 62,423,045 | | | | 83,958,207 | |
| Total distributions | | | $94,684,262 | | | | $133,098,928 | |
The federal tax cost and the tax basis components of distributable earnings were as follows:
| | | | |
| As of 12/31/17 | | | | |
| Cost of investments | | | $1,431,287,470 | |
| Gross appreciation | | | 284,429,912 | |
| Gross depreciation | | | (23,556,764 | ) |
| Net unrealized appreciation (depreciation) | | | $260,873,148 | |
| Undistributed ordinary income | | | 31,474,559 | |
| Undistributed long-term capital gain | | | 70,375,492 | |
Multiple Classes of Shares of Beneficial Interest – The fund offers multiple classes of shares, which differ in their respective distribution and/or service fees. The fund’s income, realized and unrealized gain (loss), and common expenses are allocated to shareholders based on the daily net assets of each class. Dividends are declared separately for each class. Differences in per share
16
MFS Moderate Allocation Portfolio
Notes to Financial Statements – continued
dividend rates are generally due to differences in separate class expenses. The fund’s distributions declared to shareholders as reported in the Statements of Changes in Net Assets are presented by class as follows:
| | | | | | | | | | | | | | | | |
| | | From net investment
income | | | From net realized gain on
investments | |
| | | Year ended
12/31/17 | | | Year ended
12/31/16 | | | Year ended
12/31/17 | | | Year ended
12/31/16 | |
| Initial Class | | | $120,775 | | | | $152,525 | | | | $220,632 | | | | $266,787 | |
| Service Class | | | 30,497,230 | | | | 45,065,500 | | | | 63,845,625 | | | | 87,614,116 | |
| Total | | | $30,618,005 | | | | $45,218,025 | | | | $64,066,257 | | | | $87,880,903 | |
| (3) | | Transactions with Affiliates |
Investment Adviser – The fund has an investment advisory agreement with MFS to provide overall investment management and related administrative services and facilities to the fund. MFS receives no compensation under this agreement; however MFS receives management fees from underlying MFS funds.
The investment adviser has agreed in writing to pay a portion of the fund’s operating expenses, excluding distribution and/or service fees, interest, taxes, extraordinary expenses, brokerage and transaction costs, and investment-related expenses such as fees and expenses associated with investments in investment companies and other similar investment vehicles such that fund operating expenses do not exceed 0.20% annually of the fund’s average daily net assets. This written agreement will continue until modified by the fund’s Board of Trustees, but such agreement will continue at least until April 30, 2019. For the year ended December 31, 2017, the fund’s actual operating expenses did not exceed the limit and therefore, the investment adviser did not pay any portion of the fund’s expenses related to this agreement.
In addition to the fees and expenses which the fund bears directly, the fund indirectly bears a pro rata share of the fees and expenses of the underlying funds in which the fund invests. Accordingly, the expense ratio for the fund reflects only those fees and expenses borne directly by the fund.
Distributor – MFS Fund Distributors, Inc. (MFD), a wholly-owned subsidiary of MFS, is the distributor of shares of the fund. The Trustees have adopted a distribution plan for the Service Class shares pursuant to Rule 12b-1 under the Investment Company Act of 1940.
The fund’s distribution plan provides that the fund will pay MFD distribution and/or service fees equal to 0.25% per annum of its average daily net assets attributable to Service Class shares as partial consideration for services performed and expenses incurred by MFD and financial intermediaries (including participating insurance companies that invest in the fund to fund variable annuity and variable life insurance contracts, sponsors of qualified retirement and pension plans that invest in the fund, and affiliates of these participating insurance companies and plan sponsors) in connection with the sale and distribution of the Service Class shares. MFD may subsequently pay all, or a portion, of the distribution and/or service fees to financial intermediaries.
Shareholder Servicing Agent – MFS Service Center, Inc. (MFSC), a wholly-owned subsidiary of MFS, receives a fee from the fund for its services as shareholder servicing agent. For the year ended December 31, 2017, the fee was $30,681 which equated to 0.0018% annually of the fund’s average daily net assets. MFSC also receives payment from the fund for out-of-pocket expenses paid by MFSC on behalf of the fund. For the year ended December 31, 2017, these costs amounted to $394.
Administrator – MFS provides certain financial, legal, shareholder communications, compliance, and other administrative services to the fund. Under an administrative services agreement, the fund reimburses MFS the costs incurred to provide these services. The fund pays an annual fixed amount of $17,500. The administrative services fee incurred for the year ended December 31, 2017 was equivalent to an annual effective rate of 0.0010% of the fund’s average daily net assets.
Trustees’ and Officers’ Compensation – The fund pays compensation to independent Trustees in the form of a retainer, attendance fees, and additional compensation to Board and Committee chairpersons. The fund does not pay compensation directly to Trustees or officers of the fund who are also officers of the investment adviser, all of whom receive remuneration for their services to the fund from MFS. Certain officers and Trustees of the fund are officers or directors of MFS, MFD, and MFSC.
Other – This fund and certain other funds managed by MFS (the funds) have entered into a service agreement (the ISO Agreement) which provides for payment of fees solely by the funds to Tarantino LLC in return for the provision of services of an Independent Senior Officer (ISO) for the funds. Frank L. Tarantino serves as the ISO and is an officer of the funds and the sole member of Tarantino LLC. The funds can terminate the ISO Agreement with Tarantino LLC at any time under the terms of the ISO Agreement. For the year ended December 31, 2017, the fee paid by the fund under this agreement was $3,061 and is included in “Miscellaneous” expense in the Statement of Operations. MFS has agreed to bear all expenses associated with office space, other administrative support, and supplies provided to the ISO.
17
MFS Moderate Allocation Portfolio
Notes to Financial Statements – continued
The fund invests in the MFS Institutional Money Market Portfolio which is managed by MFS and seeks current income consistent with preservation of capital and liquidity. This money market fund does not pay a management fee to MFS.
For the year ended December 31, 2017, purchases and sales of shares of underlying funds aggregated $1,251,568 and $284,648,516, respectively.
| (5) | | Shares of Beneficial Interest |
The fund’s Declaration of Trust permits the Trustees to issue an unlimited number of full and fractional shares of beneficial interest. Transactions in fund shares were as follows:
| | | | | | | | | | | | | | | | |
| | | Year ended 12/31/17 | | | Year ended 12/31/16 | |
| | | Shares | | | Amount | | | Shares | | | Amount | |
| Shares sold | | | | | | | | | | | | | | | | |
Initial Class | | | 32,383 | | | | $421,018 | | | | 85,157 | | | | $1,039,228 | |
Service Class | | | 656,936 | | | | 8,333,736 | | | | 1,977,620 | | | | 24,655,966 | |
| | | 689,319 | | | | $8,754,754 | | | | 2,062,777 | | | | $25,695,194 | |
| Shares issued to shareholders in reinvestment of distributions | | | | | | | | | | | | | | | | |
Initial Class | | | 26,946 | | | | $341,407 | | | | 33,625 | | | | $419,312 | |
Service Class | | | 7,452,042 | | | | 94,342,855 | | | | 10,639,905 | | | | 132,679,616 | |
| | | 7,478,988 | | | | $94,684,262 | | | | 10,673,530 | | | | $133,098,928 | |
| Shares reacquired | | | | | | | | | | | | | | | | |
Initial Class | | | (50,857 | ) | | | $(650,991 | ) | | | (114,455 | ) | | | $(1,410,022 | ) |
Service Class | | | (22,148,040 | ) | | | (286,985,048 | ) | | | (19,341,246 | ) | | | (242,601,668 | ) |
| | | (22,198,897 | ) | | | $(287,636,039 | ) | | | (19,455,701 | ) | | | $(244,011,690 | ) |
| Net change | | | | | | | | | | | | | | | | |
Initial Class | | | 8,472 | | | | $111,434 | | | | 4,327 | | | | $48,518 | |
Service Class | | | (14,039,062 | ) | | | (184,308,457 | ) | | | (6,723,721 | ) | | | (85,266,086 | ) |
| | | (14,030,590 | ) | | | $(184,197,023 | ) | | | (6,719,394 | ) | | | $(85,217,568 | ) |
The fund and certain other funds managed by MFS participate in a $1.25 billion unsecured committed line of credit, subject to a $1 billion sublimit, provided by a syndication of banks under a credit agreement. Borrowings may be made for temporary financing needs. Interest is charged to the fund, based on its borrowings, generally at a rate equal to the higher of the Overnight Federal Reserve funds rate or daily one month LIBOR plus an agreed upon spread. A commitment fee, based on the average daily, unused portion of the committed line of credit, is allocated among the participating funds at the end of each calendar quarter. In addition, the fund and other funds managed by MFS have established unsecured uncommitted borrowing arrangements with certain banks for temporary financing needs. Interest is charged to the fund, based on its borrowings, at a rate equal to the Overnight Federal Reserve funds rate plus an agreed upon spread. For the year ended December 31, 2017, the fund’s commitment fee and interest expense were $11,609 and $0, respectively, and are included in “Miscellaneous” expense in the Statement of Operations.
18
MFS Moderate Allocation Portfolio
Notes to Financial Statements – continued
| (7) | | Investments in Affiliated Issuers |
An affiliated issuer may be considered one in which the fund owns 5% or more of the outstanding voting securities, or a company which is under common control. For the purposes of this report, the fund assumes the following to be affiliated issuers:
| | | | | | | | | | | | | | | | | | | | |
| Affiliated Issuers | | | | | Beginning
Shares/Par
Amount | | | Acquisitions
Shares/Par
Amount | | | Dispositions
Shares/Par
Amount | | | Ending
Shares/Par
Amount | |
| MFS Global Governments Portfolio | | | | | | | 8,315,880 | | | | 22,296 | | | | (321,074 | ) | | | 8,017,102 | |
| MFS Global Real Estate Portfolio | | | | | | | 3,648,561 | | | | 388,001 | | | | (473,221 | ) | | | 3,563,341 | |
| MFS Government Securities Portfolio | | | | | | | 13,650,590 | | | | 451,162 | | | | (448,848 | ) | | | 13,652,904 | |
| MFS Growth Series | | | | | | | 4,003,623 | | | | 136,425 | | | | (1,037,898 | ) | | | 3,102,150 | |
| MFS High Yield Portfolio | | | | | | | 15,126,893 | | | | 962,434 | | | | (1,430,390 | ) | | | 14,658,937 | |
| MFS Inflation-Adjusted Bond Portfolio | | | | | | | 8,476,016 | | | | 20,428 | | | | (660,013 | ) | | | 7,836,431 | |
| MFS Institutional Money Market Portfolio | | | | | | | 524,356 | | | | 36,834,031 | | | | (35,810,723 | ) | | | 1,547,664 | |
| MFS International Growth Portfolio | | | | | | | 4,199,366 | | | | 131,013 | | | | (1,049,917 | ) | | | 3,280,462 | |
| MFS International Value Portfolio | | | | | | | 2,258,605 | | | | 31,074 | | | | (491,411 | ) | | | 1,798,268 | |
| MFS Limited Maturity Portfolio | | | | | | | 6,820,652 | | | | 114,890 | | | | (292,162 | ) | | | 6,643,380 | |
| MFS Mid Cap Growth Series | | | | | | | 15,257,914 | | | | 808,412 | | | | (3,631,225 | ) | | | 12,435,101 | |
| MFS Mid Cap Value Portfolio | | | | | | | 14,901,132 | | | | 623,879 | | | | (2,400,926 | ) | | | 13,124,085 | |
| MFS New Discovery Series | | | | | | | 1,617,929 | | | | 27,506 | | | | (383,725 | ) | | | 1,261,710 | |
| MFS New Discovery Value Portfolio | | | | | | | 2,488,746 | | | | 269,115 | | | | (479,306 | ) | | | 2,278,555 | |
| MFS Research International Portfolio | | | | | | | 8,963,689 | | | | 139,200 | | | | (2,145,642 | ) | | | 6,957,247 | |
| MFS Research Series | | | | | | | 5,361,202 | | | | 403,572 | | | | (1,191,402 | ) | | | 4,573,372 | |
| MFS Total Return Bond Series | | | | | | | 15,736,748 | | | | 539,429 | | | | (920,101 | ) | | | 15,356,076 | |
| MFS Value Series | | | | | | | 8,369,610 | | | | 467,810 | | | | (1,576,047 | ) | | | 7,261,373 | |
| | | | | |
| Affiliated Issuers | | Realized
Gain (Loss) | | | Change in
Unrealized
Appreciation
(Depreciation) | | | Capital Gain
Distributions | | | Dividend
Income | | | Ending Value | |
| MFS Global Governments Portfolio | | | $(184,525 | ) | | | $5,918,689 | | | | $— | | | | $— | | | | $84,660,597 | |
| MFS Global Real Estate Portfolio | | | 445,252 | | | | 864,832 | | | | 2,395,190 | | | | 2,766,060 | | | | 50,848,883 | |
| MFS Government Securities Portfolio | | | (374,493 | ) | | | (1,156,774 | ) | | | — | | | | 5,315,688 | | | | 169,159,481 | |
| MFS Growth Series | | | 11,837,916 | | | | 24,973,717 | | | | 5,967,794 | | | | 157,709 | | | | 151,695,137 | |
| MFS High Yield Portfolio | | | (449,905 | ) | | | 571,799 | | | | — | | | | 5,485,535 | | | | 84,582,067 | |
| MFS Inflation-Adjusted Bond Portfolio | | | (283,751 | ) | | | 7,141,881 | | | | — | | | | — | | | | 84,711,822 | |
| MFS Institutional Money Market Portfolio | | | (107 | ) | | | (84 | ) | | | — | | | | 10,313 | | | | 1,547,509 | |
| MFS International Growth Portfolio | | | 1,699,597 | | | | 11,176,847 | | | | 993,137 | | | | 872,487 | | | | 50,847,154 | |
| MFS International Value Portfolio | | | 3,933,710 | | | | 7,795,289 | | | | — | | | | 792,715 | | | | 50,801,058 | |
| MFS Limited Maturity Portfolio | | | 2,528 | | | | 84,729 | | | | — | | | | 1,094,331 | | | | 67,629,607 | |
| MFS Mid Cap Growth Series | | | 4,766,248 | | | | 17,296,473 | | | | 6,928,919 | | | | 144,684 | | | | 118,257,807 | |
| MFS Mid Cap Value Portfolio | | | 612,200 | | | | 9,870,885 | | | | 3,405,466 | | | | 1,727,664 | | | | 118,248,009 | |
| MFS New Discovery Series | | | 650,350 | | | | 5,017,996 | | | | 491,233 | | | | — | | | | 25,360,364 | |
| MFS New Discovery Value Portfolio | | | 512,082 | | | | 549,220 | | | | 1,988,445 | | | | 650,577 | | | | 25,360,320 | |
| MFS Research International Portfolio | | | 4,360,834 | | | | 23,839,392 | | | | — | | | | 2,191,005 | | | | 118,621,061 | |
| MFS Research Series | | | 3,225,690 | | | | 15,083,842 | | | | 8,815,939 | | | | 2,116,831 | | | | 134,914,485 | |
| MFS Total Return Bond Series | | | (500,927 | ) | | | 2,702,055 | | | | — | | | | 6,798,503 | | | | 203,007,324 | |
| MFS Value Series | | | 5,900,144 | | | | 10,614,331 | | | | 5,938,831 | | | | 3,071,189 | | | | 151,907,933 | |
| | | | | | | | | | | | | | | | | | | | |
| | | $36,152,843 | | | | $142,345,119 | | | | $36,924,954 | | | | $33,195,291 | | | | $1,692,160,618 | |
| | | | | | | | | | | | | | | | | | | | |
19
MFS Moderate Allocation Portfolio
REPORT OF INDEPENDENT REGISTERED PUBLIC ACCOUNTING FIRM
To the Board of Trustees of MFS Variable Insurance Trust III and the Shareholders of MFS Moderate Allocation Portfolio:
Opinion on the Financial Statements and Financial Highlights
We have audited the accompanying statement of assets and liabilities of MFS Moderate Allocation Portfolio (one of the series of MFS Variable Insurance Trust III) (the “Fund”), including the portfolio of investments, as of December 31, 2017, the related statement of operations for the year then ended, the statements of changes in net assets for each of the two years in the period then ended, the financial highlights for each of the five years in the period then ended, and the related notes. In our opinion, the financial statements and financial highlights present fairly, in all material respects, the financial position of the Fund as of December 31, 2017, and the results of its operations for the year then ended, the changes in its net assets for each of the two years in the period then ended, and the financial highlights for each of the five years in the period then ended, in conformity with accounting principles generally accepted in the United States of America.
Basis for Opinion
These financial statements and financial highlights are the responsibility of the Fund’s management. Our responsibility is to express an opinion on the Fund’s financial statements and financial highlights based on our audits. We are a public accounting firm registered with the Public Company Accounting Oversight Board (United States) (PCAOB) and are required to be independent with respect to the Fund in accordance with the U.S. federal securities laws and the applicable rules and regulations of the Securities and Exchange Commission and the PCAOB.
We conducted our audits in accordance with the standards of the PCAOB. Those standards require that we plan and perform the audit to obtain reasonable assurance about whether the financial statements and financial highlights are free of material misstatement, whether due to error or fraud. The Fund is not required to have, nor were we engaged to perform, an audit of its internal control over financial reporting. As part of our audits we are required to obtain an understanding of internal control over financial reporting but not for the purpose of expressing an opinion on the effectiveness of the Fund’s internal control over financial reporting. Accordingly, we express no such opinion.
Our audits included performing procedures to assess the risks of material misstatement of the financial statements and financial highlights, whether due to error or fraud, and performing procedures that respond to those risks. Such procedures included examining, on a test basis, evidence regarding the amounts and disclosures in the financial statements and financial highlights. Our audits also included evaluating the accounting principles used and significant estimates made by management, as well as evaluating the overall presentation of the financial statements and financial highlights. Our procedures included confirmation of securities owned as of December 31, 2017, by correspondence with the transfer agent. We believe that our audits provide a reasonable basis for our opinion.
DELOITTE & TOUCHE LLP
Boston, Massachusetts
February 15, 2018
We have served as the auditor of one or more of the MFS investment companies since 1924.
20
MFS Moderate Allocation Portfolio
TRUSTEES AND OFFICERS – IDENTIFICATION AND BACKGROUND
The Trustees and Officers of the Trust, as of February 1, 2018, are listed below, together with their principal occupations during the past five years. (Their titles may have varied during that period.) The address of each Trustee and Officer is 111 Huntington Avenue, Boston, Massachusetts 02199-7618.
| | | | | | | | | | |
Name, Age | | Position(s)
Held with Fund | | Trustee/Officer
Since (h) | | Number of
MFS Funds
overseen by the
Trustee | | Principal Occupations
During the Past Five Years | | Other Directorships
During the Past Five Years (j) |
| INTERESTED TRUSTEES |
Robert J. Manning (k) (age 54) | | Trustee | | February 2004 | | 137 | | Massachusetts Financial Services Company, Executive Chairman (since January 2017); Director; Chairman of the Board; Chief Executive Officer (until 2015); Co-Chief Executive Officer (2015-2016) | | N/A |
| | | | | |
Robin A. Stelmach (k) (age 56) | | Trustee | | January 2014 | | 137 | | Massachusetts Financial Services Company, Vice Chair (since January 2017); Chief Operating Officer and Executive Vice President (until January 2017) | | N/A |
| | | | |
| INDEPENDENT TRUSTEES | | | | | | | | |
John P. Kavanaugh (age 63) | | Trustee and Chair of Trustees | | January 2009 | | 137 | | Private investor | | N/A |
| | | | | |
Steven E. Buller (age 66) | | Trustee | | February 2014 | | 137 | | Financial Accounting Standards Advisory Council, Chairman (2014-2015); Public Company Accounting Oversight Board, Standing Advisory Group, Member (until 2014); BlackRock, Inc. (investment management), Managing Director (until 2014), BlackRock Finco UK (investment management), Director (until 2014) | | N/A |
| | | | | |
John A. Caroselli (age 63) | | Trustee | | March 2017 | | 137 | | JC Global Advisors, LLC (management consulting), President (since 2015); First Capital Corporation (commercial finance), Executive Vice President (until 2015) | | N/A |
| | | | | |
Maureen R. Goldfarb (age 62) | | Trustee | | January 2009 | | 137 | | Private investor | | N/A |
| | | | | |
Michael Hegarty (age 73) | | Trustee | | December 2004 | | 137 | | Private investor | | Rouse Properties Inc., Director (until 2016); Capmark Financial Group Inc., Director (until 2015) |
| | | | | |
Clarence Otis, Jr. (age 61) | | Trustee | | March 2017 | | 137 | | Darden Restaurants, Inc., Chief Executive Officer (until 2014) | | VF Corporation, Director; Verizon Communications, Inc., Director; The Travelers Companies, Director; Federal Reserve Bank of Atlanta, Director (until 2015) |
| | | | | |
Maryanne L. Roepke (age 61) | | Trustee | | May 2014 | | 137 | | American Century Investments (investment management), Senior Vice President and Chief Compliance Officer (until 2014) | | N/A |
| | | | | |
Laurie J. Thomsen (age 60) | | Trustee | | March 2005 | | 137 | | Private investor | | The Travelers Companies, Director; Dycom Industries, Inc., Director (since 2015) |
21
MFS Moderate Allocation Portfolio
Trustees and Officers – continued
| | | | | | | | |
Name, Age | | Position(s)
Held with Fund | | Trustee/Officer
Since (h) | | Number of
MFS Funds
for which the
Person is an
Officer | | Principal Occupations During the Past Five Years |
| OFFICERS | | | | | | | | |
Christopher R. Bohane (k) (age 44) | | Assistant Secretary and Assistant Clerk | | July 2005 | | 137 | | Massachusetts Financial Services Company, Vice President and Assistant General Counsel |
| | | | |
Kino Clark (k) (age 49) | | Assistant Treasurer | | January 2012 | | 137 | | Massachusetts Financial Services Company, Vice President |
| | | | |
John W. Clark, Jr. (k) (age 50) | | Assistant Treasurer | | April 2017 | | 137 | | Massachusetts Financial Services Company, Vice President (since March 2017); Deutsche Bank (financial services), Department Head – Treasurer’s Office (until February 2017) |
| | | | |
Thomas H. Connors (k) (age 58) | | Assistant Secretary and Assistant Clerk | | September 2012 | | 137 | | Massachusetts Financial Services Company, Vice President and Senior Counsel |
| | | | |
Ethan D. Corey (k) (age 54) | | Assistant Secretary and Assistant Clerk | | July 2005 | | 137 | | Massachusetts Financial Services Company, Senior Vice President and Associate General Counsel |
| | | | |
David L. DiLorenzo (k) (age 49) | | President | | July 2005 | | 137 | | Massachusetts Financial Services Company, Senior Vice President |
| | | | |
Heidi W. Hardin (k) (age 50) | | Secretary and Clerk | | April 2017 | | 137 | | Massachusetts Financial Services Company, Executive Vice President and General Counsel (since March 2017); Harris Associates (investment management), General Counsel (from September 2015 to January 2017); Janus Capital Management LLC (investment management), Senior Vice President and General Counsel (until September 2015) |
| | | | |
Brian E. Langenfeld (k) (age 44) | | Assistant Secretary and Assistant Clerk | | June 2006 | | 137 | | Massachusetts Financial Services Company, Vice President and Senior Counsel |
| | | | |
Susan A. Pereira (k) (age 47) | | Assistant Secretary and Assistant Clerk | | July 2005 | | 137 | | Massachusetts Financial Services Company, Vice President and Senior Counsel |
| | | | |
Kasey L. Phillips (k) (age 47) | | Assistant Treasurer | | September 2012 | | 137 | | Massachusetts Financial Services Company, Vice President |
| | | | |
Matthew A. Stowe (k) (age 43) | | Assistant Secretary and Assistant Clerk | | October 2014 | | 137 | | Massachusetts Financial Services Company, Vice President and Assistant General Counsel |
| | | | |
Frank L. Tarantino (age 73) | | Independent Senior Officer | | June 2004 | | 137 | | Tarantino LLC (provider of compliance services), Principal |
| | | | |
Richard S. Weitzel (k) (age 47) | | Assistant Secretary and Assistant Clerk | | October 2007 | | 137 | | Massachusetts Financial Services Company, Senior Vice President and Associate General Counsel |
| | | | |
Martin J. Wolin (k) (age 50) | | Chief Compliance Officer | | July 2015 | | 137 | | Massachusetts Financial Services Company, Senior Vice President and Chief Compliance Officer (since July 2015); Mercer (financial service provider), Chief Risk and Compliance Officer, North America and Latin America (until June 2015) |
| | | | |
James O. Yost (k) (age 57) | | Treasurer | | September 1990 | | 137 | | Massachusetts Financial Services Company, Senior Vice President |
| (h) | Date first appointed to serve as Trustee/officer of an MFS Fund. Each Trustee has served continuously since appointment unless indicated otherwise. For the period from December 15, 2004 until February 22, 2005, Mr. Manning served as Advisory Trustee. Prior to January 2012, Messrs. DiLorenzo and Yost served as Assistant Treasurers of the Funds. From January 2012 through December 2016, Messrs. DiLorenzo and Yost served as Treasurer and Deputy Treasurer of the Funds, respectively. |
| (j) | Directorships or trusteeships of companies required to report to the Securities and Exchange Commission (i.e., “public companies”). |
| (k) | “Interested person” of the Trust within the meaning of the Investment Company Act of 1940 (referred to as the 1940 Act), which is the principal federal law governing investment companies like the fund, as a result of a position with MFS. The address of MFS is 111 Huntington Avenue, Boston, Massachusetts 02199-7618. |
22
MFS Moderate Allocation Portfolio
Trustees and Officers – continued
Each Trustee has been elected by shareholders and each Trustee and officer holds office until his or her successor is chosen and qualified or until his or her earlier death, resignation, retirement or removal. The Trust does not hold annual meetings for the purpose of electing Trustees, and Trustees are not elected for fixed terms. Under the terms of the Board’s retirement policy, an Independent Trustee shall retire at the end of the calendar year in which he or she reaches the earlier of 75 years of age or 15 years of service on the Board (or, in the case of any Independent Trustee who joined the Board prior to 2015, 20 years of service on the Board).
Messrs. Buller and Otis and Ms. Roepke are members of the Trust’s Audit Committee.
Each of the Interested Trustees and certain Officers hold comparable officer positions with certain affiliates of MFS.
The Statement of Additional Information for a Fund includes further information about the Trustees and is available without charge upon request by calling 1-800-225-2606.
| | |
Investment Adviser Massachusetts Financial Services Company 111 Huntington Avenue Boston, MA 02199-7618 | | Custodian State Street Bank and Trust Company 1 Lincoln Street Boston, MA 02111-2900 |
Distributor MFS Fund Distributors, Inc. 111 Huntington Avenue Boston, MA 02199-7618 | | Independent Registered Public Accounting Firm Deloitte & Touche LLP 200 Berkeley Street Boston, MA 02116 |
Portfolio Manager(s) Joseph Flaherty | | |
23
MFS Moderate Allocation Portfolio
BOARD REVIEW OF INVESTMENT ADVISORY AGREEMENT
The Investment Company Act of 1940 requires that both the full Board of Trustees and a majority of the non-interested (“independent”) Trustees, voting separately, annually approve the continuation of the Fund’s investment advisory agreement with MFS. The Trustees consider matters bearing on the Fund and its advisory arrangements at their meetings throughout the year, including a review of performance data at each regular meeting. In addition, the independent Trustees met several times over the course of three months beginning in May and ending in July, 2017 (“contract review meetings”) for the specific purpose of considering whether to approve the continuation of the investment advisory agreement for the Fund and the other investment companies that the Board oversees (the “MFS Funds”). The independent Trustees were assisted in their evaluation of the Fund’s investment advisory agreement by independent legal counsel, from whom they received separate legal advice and with whom they met separately from MFS during various contract review meetings. The independent Trustees were also assisted in this process by the MFS Funds’ Independent Senior Officer, a senior officer appointed by and reporting to the independent Trustees.
In connection with their deliberations regarding the continuation of the investment advisory agreement, the Trustees, including the independent Trustees, considered such information and factors as they believed, in light of the legal advice furnished to them and their own business judgment, to be relevant. The investment advisory agreement for the Fund was considered separately, although the Trustees also took into account the common interests of all MFS Funds in their review. As described below, the Trustees considered the nature, quality, and extent of the various investment advisory, administrative, and shareholder services performed by MFS under the existing investment advisory agreement and other arrangements with the Fund.
In connection with their contract review meetings, the Trustees received and relied upon materials that included, among other items: (i) information provided by Broadridge Financial Solutions, Inc. (“Broadridge”), an independent third party, on the investment performance of the Fund for various time periods ended December 31, 2016 and the investment performance of a group of funds with substantially similar investment classifications/objectives (the “Lipper performance universe”), (ii) information provided by Broadridge on the Fund’s fees and expenses and the fees and expenses of comparable funds identified by Broadridge (the “Broadridge expense group”), (iii) information as to whether and to what extent applicable expense waivers and reimbursements are observed for the Fund, (iv) information regarding MFS’ financial results and financial condition, including MFS’ and certain of its affiliates’ estimated profitability from services performed for the Fund and the MFS Funds as a whole, and compared to MFS’ institutional business, (v) MFS’ views regarding the outlook for the mutual fund industry and the strategic business plans of MFS, (vi) descriptions of various functions performed by MFS for the Funds, such as compliance monitoring and portfolio trading practices, and (vii) information regarding the overall organization of MFS, including information about MFS’ senior management and other personnel providing investment advisory, administrative and other services to the Fund and the other MFS Funds. The comparative performance, fee and expense information prepared and provided by Broadridge was not independently verified and the independent Trustees did not independently verify any information provided to them by MFS.
The Trustees’ conclusion as to the continuation of the investment advisory agreement was based on a comprehensive consideration of all information provided to the Trustees and not the result of any single factor. Some of the factors that figured particularly in the Trustees’ deliberations are described below, although individual Trustees may have evaluated the information presented differently from one another, giving different weights to various factors. It is also important to recognize that the fee arrangements for the Fund and other MFS Funds are the result of years of review and discussion between the independent Trustees and MFS, that certain aspects of such arrangements may receive greater scrutiny in some years than in others, and that the Trustees’ conclusions may be based, in part, on their consideration of these same arrangements during the course of the year and in prior years.
Based on information provided by Broadridge and MFS, the Trustees reviewed the Fund’s total return investment performance as well as the performance of peer groups of funds over various time periods. The Trustees placed particular emphasis on the total return performance of the Fund’s Initial Class shares in comparison to the performance of funds in its Lipper performance universe over the three-year period ended December 31, 2016, which the Trustees believed was a long enough period to reflect differing market conditions. The total return performance of the Fund’s Initial Class shares was in the 2nd quintile relative to the other funds in the universe for this three-year period (the 1st quintile being the best performers and the 5th quintile being the worst performers). The total return performance of the Fund’s Initial Class shares was in the 3rd quintile for each of the one- and five-year periods ended December 31, 2016 relative to the Lipper performance universe. Because of the passage of time, these performance results may differ from the performance results for more recent periods, including those shown elsewhere in this report.
In the course of their deliberations, the Trustees took into account information provided by MFS in connection with the contract review meetings, as well as during investment review meetings conducted with portfolio management personnel during the course of the year regarding the Fund’s performance. After reviewing these and related factors, the Trustees concluded, within the context of their overall conclusions regarding the investment advisory agreement, that they were satisfied with MFS’ responses and efforts relating to investment performance.
The Trustees considered that MFS does not charge an advisory fee for providing investment advisory services to the Fund, but that the Fund pays its pro rata share of the advisory fees paid by the underlying funds in which it invests (the “Underlying Funds”).
24
MFS Moderate Allocation Portfolio
Board Review of Investment Advisory Agreement – continued
In assessing the reasonableness of the Fund’s expenses, the Trustees considered, among other information, the Fund’s total expense ratio of the Fund’s Initial Class shares as a percentage of average daily net assets and the total expense ratios of peer groups of funds based on information provided by Broadridge. The Trustees considered that MFS currently observes an expense limitation for the Fund, which may not be changed without the Trustees’ approval. The Trustees also considered that, according to the data provided by Broadridge (which takes into account any expense limitations that were in effect during the Fund’s last fiscal year), the Fund’s total expense ratio was lower than the Broadridge expense group median. Because the Fund does not pay an advisory fee, the Trustees did not consider the extent to which economies of scale would be realized due to the Fund’s growth of assets, whether fee levels reflect economies of scale for shareholders, or the fees paid by similar funds to other investment advisers or by similar clients of MFS.
The Trustees also considered information prepared by MFS relating to MFS’ costs and profits with respect to the Fund, the MFS Funds considered as a group, and other investment companies and accounts advised by MFS, as well as MFS’ methodologies used to determine and allocate its costs to the MFS Funds, the Fund and other accounts and products for purposes of estimating profitability.
In addition, the Trustees considered MFS’ resources and related efforts to continue to retain, attract and motivate capable personnel to serve the Fund. The Trustees also considered current and developing conditions in the financial services industry, including the presence of large and well-capitalized companies which are spending, and appear to be prepared to continue to spend, substantial sums to engage personnel and to provide services to competing investment companies. In this regard, the Trustees also considered the financial resources of MFS and its ultimate parent, Sun Life Financial Inc. The Trustees also considered the advantages and possible disadvantages to the Fund of having an adviser that also serves other investment companies as well as other accounts.
The Trustees also considered the nature, quality, cost, and extent of administrative, transfer agency, and distribution services provided to the Fund by MFS and its affiliates under agreements and plans other than the investment advisory agreement, including any 12b-1 fees the Fund pays to MFS Fund Distributors, Inc., an affiliate of MFS. The Trustees also considered the nature, extent and quality of certain other services MFS performs or arranges for on the Fund’s or the Underlying Funds’ behalf, which may include securities lending programs, directed expense payment programs, class action recovery programs, and MFS’ interaction with third-party service providers, principally custodians and sub-custodians. The Trustees concluded that the various non-advisory services provided by MFS and its affiliates on behalf of the Fund were satisfactory.
The Trustees also considered benefits to MFS from the use of the Underlying Funds’ portfolio brokerage commissions, if applicable, to pay for investment research and various other factors. Additionally, the Trustees considered so-called “fall-out benefits” to MFS such as reputational value derived from serving as investment manager to the Fund.
Based on their evaluation of factors that they deemed to be material, including those factors described above, the Board of Trustees, including the independent Trustees, concluded that the Fund’s investment advisory agreement with MFS should be continued for an additional one-year period, commencing August 1, 2017.
25
MFS Moderate Allocation Portfolio
PROXY VOTING POLICIES AND INFORMATION
MFS votes proxies on behalf of the fund pursuant to proxy voting policies and procedures that are available without charge, upon request, by calling 1-800-225-2606, by visiting mfs.com/proxyvoting, or by visiting the SEC’s Web site at http://www.sec.gov.
Information regarding how the fund voted proxies relating to portfolio securities during the most recent twelve-month period ended June 30 is available by August 31 of each year without charge by visiting mfs.com/proxyvoting, or by visiting the SEC’s Web site at http://www.sec.gov.
QUARTERLY PORTFOLIO DISCLOSURE
The fund will file a complete schedule of portfolio holdings with the Securities and Exchange Commission (the Commission) for the first and third quarters of each fiscal year on Form N-Q. The fund’s Form N-Q is available on the EDGAR database on the Commission’s Internet Web site at http://www.sec.gov, and may be reviewed and copied at the:
Public Reference Room
Securities and Exchange Commission
100 F Street, NE, Room 1580
Washington, D.C. 20549
Information on the operation of the Public Reference Room may be obtained by calling the Commission at 1-800-SEC-0330. Copies of the fund’s Form N-Q also may be obtained, upon payment of a duplicating fee, by electronic request at the following e-mail address: publicinfo@sec.gov or by writing the Public Reference Section at the above address.
FURTHER INFORMATION
From time to time, MFS may post important information about the fund or the MFS funds on the MFS web site (mfs.com). This information is available at https://www.mfs.com/en-us/what-we-do/announcements.html or at mfs.com/vit3 by choosing the fund’s name.
INFORMATION ABOUT FUND CONTRACTS AND LEGAL CLAIMS
The fund has entered into contractual arrangements with an investment adviser, administrator, distributor, shareholder servicing agent, 529 program manager (if applicable), and custodian who each provide services to the fund. Unless expressly stated otherwise, shareholders are not parties to, or intended beneficiaries of these contractual arrangements, and these contractual arrangements are not intended to create any shareholder right to enforce them against the service providers or to seek any remedy under them against the service providers, either directly or on behalf of the fund.
Under the Trust’s By-Laws and Declaration of Trust, any claims asserted against or on behalf of the MFS Funds, including claims against Trustees and Officers, must be brought in state and federal courts located within the Commonwealth of Massachusetts.
FEDERAL TAX INFORMATION (unaudited)
The following information is provided pursuant to provisions of the Internal Revenue Code.
The fund designates $68,666,000 as capital gain dividends paid during the fiscal year.
For corporate shareholders, 25.05% of the ordinary income dividends paid during the fiscal year qualify for the corporate dividends received deduction.
26
rev. 3/16
| | | | |
| FACTS | | WHAT DOES MFS DO WITH YOUR
PERSONAL INFORMATION? | |  |
| | |
| Why? | | Financial companies choose how they share your personal information. Federal law gives consumers the right to limit some but not all sharing. Federal law also requires us to tell you how we collect, share, and protect your personal information. Please read this notice carefully to understand what we do. |
| | |
| What? | | The types of personal information we collect and share depend on the product or service you have with us. This information can include: • Social Security number and account balances • Account transactions and transaction history • Checking account information and wire transfer instructions When you are no longer our customer, we continue to share your information as described in this notice. |
| | |
| How? | | All financial companies need to share customers’ personal information to run their everyday business. In the section below, we list the reasons financial companies can share their customers’ personal information; the reasons MFS chooses to share; and whether you can limit this sharing. |
| | | | |
Reasons we can share your
personal information | | Does MFS share? | | Can you limit this
sharing? |
For our everyday business purposes – such as to process your transactions, maintain your account(s), respond to court orders and legal investigations, or report to credit bureaus | | Yes | | No |
For our marketing purposes – to offer our products and services to you | | No | | We don’t share |
| For joint marketing with other financial companies | | No | | We don’t share |
For our affiliates’ everyday business purposes – information about your transactions and experiences | | No | | We don’t share |
For our affiliates’ everyday business purposes – information about your creditworthiness | | No | | We don’t share |
| For nonaffiliates to market to you | | No | | We don’t share |
| | |
| Questions? | | Call 800-225-2606 or go to mfs.com. |
27
| | |
| Who we are |
| Who is providing this notice? | | MFS Funds, MFS Investment Management, MFS Institutional Advisors, Inc., and MFS Heritage Trust Company. |
| | |
| What we do |
| How does MFS protect my personal information? | | To protect your personal information from unauthorized access and use, we use security measures that comply with federal law. These measures include procedural, electronic, and physical safeguards for the protection of the personal information we collect about you. |
How does MFS
collect my personal information? | | We collect your personal information, for example, when you • open an account or provide account information • direct us to buy securities or direct us to sell your securities • make a wire transfer We also collect your personal information from others, such as credit bureaus, affiliates, or other companies. |
| Why can’t I limit all sharing? | | Federal law gives you the right to limit only • sharing for affiliates’ everyday business purposes – information about your creditworthiness • affiliates from using your information to market to you • sharing for nonaffiliates to market to you State laws and individual companies may give you additional rights to limit sharing. |
| | |
| Definitions |
| Affiliates | | Companies related by common ownership or control. They can be financial and nonfinancial companies. • MFS does not share personal information with affiliates, except for everyday business purposes as described on page one of this notice. |
| Nonaffiliates | | Companies not related by common ownership or control. They can be financial and nonfinancial companies. • MFS does not share with nonaffiliates so they can market to you. |
| Joint marketing | | A formal agreement between nonaffiliated financial companies that together market financial products or services to you. • MFS doesn’t jointly market. |
| | |
| Other important information |
| If you own an MFS product or receive an MFS service in the name of a third party such as a bank or broker-dealer, their privacy policy may apply to you instead of ours. |
28
ANNUAL REPORT
December 31, 2017

MFS® NEW DISCOVERY VALUE PORTFOLIO
MFS® Variable Insurance Trust III

VDV-ANN
MFS® NEW DISCOVERY VALUE PORTFOLIO
CONTENTS
The report is prepared for the general information of contract owners. It is authorized for distribution to prospective investors only when preceded or accompanied by a current prospectus.
NOT FDIC INSURED • MAY LOSE VALUE • NO BANK OR CREDIT UNION GUARANTEE • NOT A DEPOSIT • NOT INSURED BY ANY FEDERAL GOVERNMENT AGENCY OR NCUA/NCUSIF
MFS New Discovery Value Portfolio
LETTER FROM THE EXECUTIVE CHAIRMAN

Dear Contract Owners:
Rising bond yields have led to a measurable uptick in market volatility, which has been a departure from the low-volatility environment that prevailed for much of 2017. In spite of this, global markets remain elevated amid synchronized economic growth. Although the U.S. Federal Reserve continues to gradually raise interest rates and shrink its balance sheet, monetary policy remains accommodative around the world, with many central banks taking only tentative steps toward tighter policies. However, interest rates have begun to rise globally of late as investors anticipate that central policy shifts may be necessary in the months ahead.
Newly enacted U.S. tax reforms have been welcomed by equity markets while emerging market economies have been boosted by a weaker U.S. dollar. Around the world, inflation remains largely subdued but tight labor markets and solid global demand have investors on the lookout for its potential resurgence amid robust global trade and recovering commodity prices.
At MFS®, we believe having a disciplined, long-term investment approach through a full market cycle is essential to capturing the best opportunities while also managing risk. In our view, such a strategy, along with the professional guidance of a financial advisor, will help you reach your investment objectives.
Respectfully,

Robert J. Manning
Executive Chairman
MFS Investment Management
February 15, 2018
The opinions expressed in this letter are subject to change and may not be relied upon for investment advice. No forecasts can be guaranteed.
1
MFS New Discovery Value Portfolio
PORTFOLIO COMPOSITION
Portfolio structure
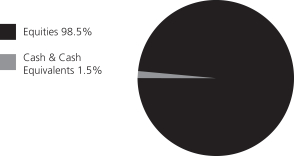
| | | | |
| Top ten holdings | | | | |
| Portland General Electric Co. | | | 1.6% | |
| Medical Properties Trust, Inc., REIT | | | 1.5% | |
| Select Income, REIT | | | 1.5% | |
| MSC Industrial Direct Co., Inc., “A” | | | 1.4% | |
| Wintrust Financial Corp. | | | 1.4% | |
| Prosperity Bancshares, Inc. | | | 1.4% | |
| Berry Global Group, Inc. | | | 1.4% | |
| Hanover Insurance Group, Inc. | | | 1.3% | |
| ITT, Inc. | | | 1.3% | |
| Black Hills Corp. | | | 1.3% | |
| | | | |
| Equity sectors | | | | |
| Financial Services | | | 33.0% | |
| Industrial Goods & Services | | | 16.7% | |
| Technology | | | 7.7% | |
| Basic Materials | | | 7.2% | |
| Utilities & Communications | | | 6.2% | |
| Health Care | | | 5.3% | |
| Energy | | | 5.1% | |
| Consumer Staples | | | 3.8% | |
| Autos & Housing | | | 3.2% | |
| Special Products & Services | | | 3.2% | |
| Retailing | | | 3.2% | |
| Leisure | | | 2.7% | |
| Transportation | | | 1.2% | |
Cash & Cash Equivalents includes any cash, investments in money market funds, short-term securities, and other assets less liabilities. Please see the Statement of Assets and Liabilities for additional information related to the fund’s cash position and other assets and liabilities.
Percentages are based on net assets as of December 31, 2017.
The portfolio is actively managed and current holdings may be different.
2
MFS New Discovery Value Portfolio
MANAGEMENT REVIEW
Summary of Results
For the twelve months ended December 31, 2017, Initial Class shares of the MFS New Discovery Value Portfolio (“fund”) provided a total return of 15.24%, while Service Class shares of the fund provided a total return of 15.01%. These compare with a return of 7.84% over the same period for the fund’s benchmark, the Russell 2000® Value Index.
Market Environment
For the first time in many years, the global economy experienced a period of synchronized economic growth over the reporting period. The rebound in emerging markets (“EM”) economies was more pronounced (despite the slight deceleration in Chinese growth at the end of the period), helped by larger economies, such as Brazil and Russia, emerging from recessions. At the same time, developed markets (“DM”) economies continued to grow at or above potential. Market confidence increased in the US during the period fueled, in part, by a more lenient US regulatory backdrop and hopes for a significant cut in corporate tax rates, which came to fruition at the end of the period.
Globally, markets benefited from a reflation trade as commodity prices strengthened, activity and growth prospects improved, and inflation moved higher, though within moderate bounds. As a result, there were more tightening signals and actions by DM central banks. The US Federal Reserve increased interest rates by 25 basis points three times during the period, bringing the total number of quarter-percent hikes in the federal funds rate to five, since December 2015. The European Central Bank announced an extension of its quantitative easing program at the end of the period, but reduced the pace of its monthly asset purchases by half. In addition, the Bank of England hiked its base rate for the first time in a decade, late in the end of the period. Markets were comforted, along with central banks, by the decline in fears of a populist surge in Europe after establishment candidates won the Dutch and French elections, though a right-wing populist party gained seats in the German parliament for the first time in the post-World War II era. Additionally, European growth reflected a generally calmer political economic backdrop.
In recent months, the US dollar reversed the sharp rise seen early in the period, easing what had been a substantial headwind to earnings for multinationals. US consumer spending held up well during the second half of the period amid a modest increase in real wages and relatively low gasoline prices. However, demand for autos cooled from the record level logged early in the period, while the housing market improved, albeit constrained by below-average inventory levels. Global trade, which was sluggish early in the period, showed signs of improvement in the period’s second half, a positive indicator of global economic activity and prospects. Early in the period, there was a selloff in EM due to fears that President Trump would follow through on various campaign threats and promises that were judged to be detrimental to EM. While President Trump withdrew the US from the Trans-Pacific Partnership and began the renegotiation of the North American Free Trade Agreement, significant additional policy action was lacking on economic issues involving EM. As a result, EM resumed their upward trajectory, powered by strong inflows throughout 2017.
Contributors to Performance
Security selection and an underweight position in the financial services sector were primary factors lifting performance relative to the Russell 2000® Value Index. Within this sector, the fund’s holdings of alternative investment manager Apollo Global Management (b) and commercial aircraft leasing company Air Lease (b) contributed to relative returns. Shares of Apollo Management advanced as rising financial markets helped drive solid earnings and fee growth.
Stock selection and an overweight position in the autos & housing sector also benefited relative performance. Holdings of commercial and residential landscape supplies distributor Siteone Landscape Supply (b)(h), residential and commercial building materials manufacturer Owens Corning (b) and residential home building company Toll Brothers (b), as well as the fund’s overweight position in insulation distributor Topbuild (h), aided relative results. Shares of Owens Corning rose throughout the period on the back of strong roofing and composites sales.
Security selection in the basic materials sector further strengthened relative returns. Within this sector, the fund’s positions in specialty materials manufacturer Ferro (b) and metals and silicon distributer Ferroglobe (United Kingdom) buoyed relative performance. Strong organic sales growth, notably in pigments and surface technologies, as well as successful efforts to control rising raw material costs, helped Ferro deliver earnings results that beat market expectations over the reporting period.
Elsewhere, the fund’s holdings of revenue management systems developer Model N (b) and apparel retailer Urban Outfitters (b) also supported relative returns.
Detractors from Performance
Stock selection in both the health care and energy sectors weakened relative performance during the reporting period. Within the health care sector, not owning shares of clinical-stage biotechnology company Bluebird Bio, and holding shares of physician services provider Mednax (b), hurt relative results. Shares of Mednax fell as a shift in the company’s customer mix, from higher-margin commercial clients to lower-margin government Medicare orders, hurt its financial results. Within the energy sector, the fund’s overweight positions in tubular services provider Frank’s International and oilfield services and equipment provider Superior Energy
3
MFS New Discovery Value Portfolio
Management Review – continued
Services hindered relative returns. Shares of Frank’s International appeared to have reacted negatively to weak business demand in both the international and Gulf of Mexico regions; weakness that eventually led to the company’s decision to suspend its dividend in the latter part of the reporting period.
Stocks in other sectors that weighed on relative performance included holdings of property and casualty insurance firm Aspen Insurance (b) (Bermuda), oil and gas pipeline company Boardwalk Pipeline Partners (b), food producer Treehouse Foods (b) and financial services firm Element Fleet Management (b) (Canada). Shares of Treehouse Foods came under pressure as increased price competition translated into lower sales and earnings that missed expectations. The fund’s overweight position in industrial services company Team, and not holding shares of supply chain solutions company XPO Logistics also detracted from relative returns.
Respectfully,
Portfolio Manager(s)
Kevin Schmitz
| (b) | Security is not a benchmark constituent. |
| (h) | Security was not held in the portfolio at period end. |
The views expressed in this report are those of the portfolio manager(s) only through the end of the period of the report as stated on the cover and do not necessarily reflect the views of MFS or any other person in the MFS organization. These views are subject to change at any time based on market or other conditions, and MFS disclaims any responsibility to update such views. These views may not be relied upon as investment advice or an indication of trading intent on behalf of any MFS portfolio. References to specific securities are not recommendations of such securities, and may not be representative of any MFS portfolio’s current or future investments.
4
MFS New Discovery Value Portfolio
PERFORMANCE SUMMARY THROUGH 12/31/17
The following chart illustrates the historical performance of the fund in comparison to its benchmark(s). Benchmarks are unmanaged and may not be invested in directly. Benchmark returns do not reflect any fees or expenses. The performance of other share classes will be greater than or less than that of the class depicted below. (See Notes to Performance Summary.)
Performance data shown represents past performance and is no guarantee of future results. Investment return and principal value fluctuate so your units, when sold, may be worth more or less than the original cost; current performance may be lower or higher than quoted. The performance shown does not reflect the deduction of taxes, if any, that a contract holder would pay on fund distributions or the redemption of contract units. The returns for the fund shown also do not reflect the deduction of expenses associated with variable products, such as mortality and expense risk charges, separate account charges, and sales charges imposed by the insurance company separate accounts. Such expenses would reduce the overall returns shown.
Growth of a Hypothetical $10,000 Investment (t)
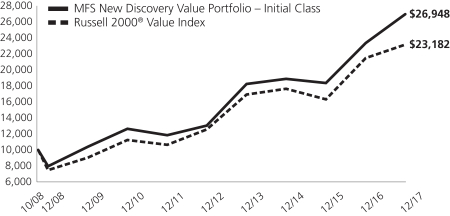
Total Returns through 12/31/17
Average annual total returns
| | | | | | | | | | | | |
| | | Share Class | | Class Inception Date | | 1-yr | | 5-yr | | Life (t) | | |
| | | Initial Class | | 10/01/08 | | 15.24% | | 15.61% | | 11.31% | | |
| | | Service Class | | 10/01/08 | | 15.01% | | 15.33% | | 11.03% | | |
| | | | |
| Comparative benchmark(s) | | | | | | | | |
| | | Russell 2000® Value Index (f) | | 7.84% | | 13.01% | | 9.51% | | |
| (f) | Source: FactSet Research Systems Inc. |
| (t) | For the period from the class inception date through the stated period end. (See Notes to Performance Summary.) |
Benchmark Definition(s)
Russell 2000® Value Index – a market-capitalization-weighted, value-oriented index that measures the performance of small-capitalization stocks that have relatively low price-to-book ratios and lower forecasted growth values. The Russell 2000® Value Index is a trademark/service mark of the Frank Russell Company. Russell® is a trademark of the Frank Russell Company.
It is not possible to invest directly in an index.
Notes to Performance Summary
Average annual total return represents the average annual change in value for each share class for the periods presented. Life returns are presented where the share class has less than 10 years of performance history and represent the average annual total return from the class inception date to the stated period end date.
Performance results reflect any applicable expense subsidies and waivers in effect during the periods shown. Without such subsidies and waivers the fund’s performance results would be less favorable. Please see the prospectus and financial statements for complete details. All results are historical and assume the reinvestment of any dividends and capital gains distributions.
Performance prior to close of business December 7, 2012, reflects time periods when another adviser or subadviser was responsible for selecting investments for the fund under a different investment objective and different investment strategies.
5
MFS New Discovery Value Portfolio
Performance Summary – continued
Performance results do not include adjustments made for financial reporting purposes in accordance with U.S. generally accepted accounting principles and may differ from amounts reported in the financial highlights.
From time to time the fund may receive proceeds from litigation settlements, without which performance would be lower.
6
MFS New Discovery Value Portfolio
EXPENSE TABLE
Fund Expenses Borne by the Contract Holders during the Period, July 1, 2017 through December 31, 2017
As a contract holder of the fund, you incur ongoing costs, including management fees; distribution and/or service (12b-1) fees; and other fund expenses. This example is intended to help you understand your ongoing costs (in dollars) of investing in the fund and to compare these costs with the ongoing costs of investing in other mutual funds.
The example is based on an investment of $1,000 invested at the beginning of the period and held for the entire period July 1, 2017 through December 31, 2017.
Actual Expenses
The first line for each share class in the following table provides information about actual account values and actual expenses. You may use the information in this line, together with the amount you invested, to estimate the expenses that you paid over the period. Simply divide your account value by $1,000 (for example, an $8,600 account value divided by $1,000 = 8.6), then multiply the result by the number in the first line under the heading entitled “Expenses Paid During Period” to estimate the expenses you paid on your account during this period.
Hypothetical Example for Comparison Purposes
The second line for each share class in the following table provides information about hypothetical account values and hypothetical expenses based on the fund’s actual expense ratio and an assumed rate of return of 5% per year before expenses, which is not the fund’s actual return. The hypothetical account values and expenses may not be used to estimate the actual ending account balance or expenses you paid for the period. You may use this information to compare the ongoing costs of investing in the fund and other funds. To do so, compare this 5% hypothetical example with the 5% hypothetical examples that appear in the shareholder reports of the other funds.
Please note that the expenses shown in the table are meant to highlight the fund’s ongoing costs only and do not take into account the fees and expenses imposed under the variable contracts through which your investment in the fund is made. Therefore, the second line for each share class in the table is useful in comparing ongoing costs associated with an investment in vehicles (such as the fund) which fund benefits under variable annuity and variable life insurance contracts and to qualified pension and retirement plans only, and will not help you determine the relative total costs of investing in the fund through variable annuity and variable life insurance contracts. If the fees and expenses imposed under the variable contracts were included, your costs would have been higher.
| | | | | | | | | | | | | | | | | | |
| Share Class | | | | Annualized
Expense Ratio | | | Beginning
Account Value
7/01/17 | | | Ending Account Value
12/31/17 | | | Expenses Paid
During Period (p)
7/01/17-12/31/17 | |
| Initial Class | | Actual | | | 0.88% | | | | $1,000.00 | | | | $1,109.26 | | | | $4.68 | |
| | Hypothetical (h) | | | 0.88% | | | | $1,000.00 | | | | $1,020.77 | | | | $4.48 | |
| Service Class | | Actual | | | 1.13% | | | | $1,000.00 | | | | $1,107.75 | | | | $6.00 | |
| | Hypothetical (h) | | | 1.13% | | | | $1,000.00 | | | | $1,019.51 | | | | $5.75 | |
| (h) | 5% class return per year before expenses. |
| (p) | “Expenses Paid During Period” are equal to each class’s annualized expense ratio, as shown above, multiplied by the average account value over the period, multiplied by 184/365 (to reflect the one-half year period). |
7
MFS New Discovery Value Portfolio
PORTFOLIO OF INVESTMENTS – 12/31/17
The Portfolio of Investments is a complete list of all securities owned by your fund. It is categorized by broad-based asset classes.
| | | | | | | | |
| Issuer | | Shares/Par | | | Value ($) | |
| COMMON STOCKS – 98.5% | | | | | | | | |
| Aerospace – 2.0% | | | | | | | | |
| CACI International, Inc., “A” (a) | | | 3,345 | | | $ | 442,711 | |
| ManTech International Corp., “A” | | | 14,119 | | | | 708,632 | |
| | | | | | | | |
| | | | | | $ | 1,151,343 | |
| | | | | | | | |
| Automotive – 0.0% | | | | | | | | |
| Fenix Parts, Inc. (a) | | | 47,044 | | | $ | 11,291 | |
| | | | | | | | |
| Brokerage & Asset Managers – 1.6% | | | | | | | | |
| Apollo Global Management LLC, “A” | | | 14,052 | | | $ | 470,321 | |
| TMX Group Ltd. | | | 8,045 | | | | 450,827 | |
| | | | | | | | |
| | | | | | $ | 921,148 | |
| | | | | | | | |
| Business Services – 2.7% | | | | | | | | |
| Forrester Research, Inc. | | | 6,525 | | | $ | 288,405 | |
| PRA Group, Inc. (a) | | | 17,194 | | | | 570,841 | |
| Travelport Worldwide Ltd. | | | 51,845 | | | | 677,614 | |
| | | | | | | | |
| | | | | | $ | 1,536,860 | |
| | | | | | | | |
| Chemicals – 0.7% | | | | | | | | |
| Ingevity Corp. (a) | | | 5,416 | | | $ | 381,666 | |
| | | | | | | | |
| Computer Software – 1.1% | | | | | | | | |
| Sabre Corp. | | | 31,054 | | | $ | 636,607 | |
| | | | | | | | |
| Computer Software – Systems – 4.0% | | | | | | | | |
| Model N, Inc. (a) | | | 26,737 | | | $ | 421,108 | |
| NICE Systems Ltd., ADR | | | 6,698 | | | | 615,613 | |
| Presidio, Inc. (a) | | | 27,085 | | | | 519,220 | |
| Verint Systems, Inc. (a) | | | 16,972 | | | | 710,278 | |
| | | | | | | | |
| | | | | | $ | 2,266,219 | |
| | | | | | | | |
| Construction – 3.2% | | | | | | | | |
| Armstrong World Industries, Inc. (a) | | | 8,269 | | | $ | 500,688 | |
| GMS, Inc. (a) | | | 11,736 | | | | 441,743 | |
| Owens Corning | | | 4,707 | | | | 432,762 | |
| Toll Brothers, Inc. | | | 8,822 | | | | 423,632 | |
| | | | | | | | |
| | | | | | $ | 1,798,825 | |
| | | | | | | | |
| Consumer Products – 1.0% | | | | | | | | |
| Sensient Technologies Corp. | | | 7,447 | | | $ | 544,748 | |
| | | | | | | | |
| Consumer Services – 0.5% | | | | | | | | |
| ServiceMaster Global Holdings, Inc. (a) | | | 5,094 | | | $ | 261,169 | |
| | | | | | | | |
| Containers – 2.4% | | | | | | | | |
| Berry Global Group, Inc. (a) | | | 13,081 | | | $ | 767,463 | |
| Graphic Packaging Holding Co. | | | 39,085 | | | | 603,863 | |
| | | | | | | | |
| | | | | | $ | 1,371,326 | |
| | | | | | | | |
| Electrical Equipment – 4.9% | | | | | | | | |
| AZZ, Inc. | | | 6,199 | | | $ | 316,769 | |
| HD Supply Holdings, Inc. (a) | | | 16,023 | | | | 641,400 | |
| MSC Industrial Direct Co., Inc., “A” | | | 8,230 | | | | 795,512 | |
| TriMas Corp. (a) | | | 22,768 | | | | 609,044 | |
| WESCO International, Inc. (a) | | | 6,253 | | | | 426,142 | |
| | | | | | | | |
| | | | | | $ | 2,788,867 | |
| | | | | | | | |
| | | | | | | | |
| Issuer | | Shares/Par | | | Value ($) | |
| COMMON STOCKS – continued | | | | | | | | |
| Electronics – 2.6% | | | | | | | | |
| Integrated Device Technology, Inc. (a) | | | 11,873 | | | $ | 352,984 | |
| OSI Systems, Inc. (a) | | | 5,865 | | | | 377,589 | |
| Plexus Corp. (a) | | | 12,035 | | | | 730,765 | |
| | | | | | | | |
| | | | | | $ | 1,461,338 | |
| | | | | | | | |
| Energy – Independent – 1.0% | | | | | | | | |
| Energen Corp. (a) | | | 9,464 | | | $ | 544,842 | |
| | | | | | | | |
| Engineering – Construction – 1.7% | | | | | | | | |
| KBR, Inc. | | | 34,847 | | | $ | 691,016 | |
| Team, Inc. (a) | | | 17,208 | | | | 256,399 | |
| | | | | | | | |
| | | | | | $ | 947,415 | |
| | | | | | | | |
| Entertainment – 1.4% | | | | | | | | |
| IMAX Corp. (a) | | | 18,629 | | | $ | 431,262 | |
| Parques Reunidos Servicios Centrales | | | | | | | | |
| S.A.U. | | | 19,621 | | | | 349,602 | |
| | | | | | | | |
| | | | | | $ | 780,864 | |
| | | | | | | | |
| Food & Beverages – 2.8% | | | | | | | | |
| Cal-Maine Foods, Inc. (a)(l) | | | 12,058 | | | $ | 535,978 | |
| Hostess Brands, Inc. (a) | | | 44,720 | | | | 662,303 | |
| TreeHouse Foods, Inc. (a) | | | 7,928 | | | | 392,119 | |
| | | | | | | | |
| | | | | | $ | 1,590,400 | |
| | | | | | | | |
| Insurance – 4.2% | | | | | | | | |
| Aspen Insurance Holdings Ltd. | | | 8,181 | | | $ | 332,149 | |
| Everest Re Group Ltd. | | | 1,733 | | | | 383,444 | |
| Hanover Insurance Group, Inc. | | | 6,980 | | | | 754,398 | |
| Safety Insurance Group, Inc. | | | 6,053 | | | | 486,661 | |
| Third Point Reinsurance Ltd. (a) | | | 26,756 | | | | 391,975 | |
| | | | | | | | |
| | | | | | $ | 2,348,627 | |
| | | | | | | | |
| Leisure & Toys – 1.3% | | | | | | | | |
| Brunswick Corp. | | | 13,127 | | | $ | 724,873 | |
| | | | | | | | |
| Machinery & Tools – 5.8% | | | | | | | | |
| Gardner Denver Holdings, Inc. (a) | | | 10,337 | | | $ | 350,734 | |
| Herman Miller, Inc. | | | 14,970 | | | | 599,549 | |
| ITT, Inc. | | | 14,116 | | | | 753,371 | |
| Regal Beloit Corp. | | | 7,089 | | | | 543,017 | |
| Ritchie Bros. Auctioneers, Inc. | | | 16,612 | | | | 497,197 | |
| SPX FLOW, Inc. (a) | | | 10,720 | | | | 509,736 | |
| | | | | | | | |
| | | | | | $ | 3,253,604 | |
| | | | | | | | |
| Medical & Health Technology & Services – 3.9% | | | | | |
| HMS Holdings Corp. (a) | | | 30,801 | | | $ | 522,077 | |
| LifePoint Hospitals, Inc. (a) | | | 8,053 | | | | 401,039 | |
| MEDNAX, Inc. (a) | | | 10,642 | | | | 568,709 | |
| Premier, Inc., “A” (a) | | | 24,347 | | | | 710,689 | |
| | | | | | | | |
| | | | | | $ | 2,202,514 | |
| | | | | | | | |
| Medical Equipment – 0.8% | | | | | | | | |
| Steris PLC | | | 5,326 | | | $ | 465,865 | |
| | | | | | | | |
8
MFS New Discovery Value Portfolio
Portfolio of Investments – continued
| | | | | | | | |
| Issuer | | Shares/Par | | | Value ($) | |
| COMMON STOCKS – continued | | | | | | | | |
| Natural Gas – Distribution – 1.1% | | | | | | | | |
| New Jersey Resources Corp. | | | 15,474 | | | $ | 622,055 | |
| | | | | | | | |
| Natural Gas – Pipeline – 1.0% | | | | | | | | |
| Boardwalk Pipeline Partners LP | | | 42,530 | | | $ | 549,062 | |
| | | | | | | | |
| Oil Services – 4.1% | | | | | | | | |
| Forum Energy Technologies, Inc. (a) | | | 23,442 | | | $ | 364,523 | |
| Frank’s International N.V. | | | 79,121 | | | | 526,155 | |
| Keane Group, Inc. (a)(l) | | | 29,421 | | | | 559,293 | |
| NOW, Inc. (a) | | | 35,349 | | | | 389,900 | |
| Superior Energy Services, Inc. (a) | | | 27,242 | | | | 262,340 | |
| U.S. Silica Holdings, Inc. | | | 6,430 | | | | 209,361 | |
| | | | | | | | |
| | | | | | $ | 2,311,572 | |
| | | | | | | | |
| Other Banks & Diversified Financials – 19.3% | | | | | |
| Air Lease Corp. | | | 13,716 | | | $ | 659,602 | |
| Berkshire Hills Bancorp, Inc. | | | 15,442 | | | | 565,177 | |
| Brookline Bancorp, Inc. | | | 28,121 | | | | 441,500 | |
| Cathay General Bancorp, Inc. | | | 13,312 | | | | 561,367 | |
| Element Fleet Management Corp. | | | 92,265 | | | | 697,309 | |
| First Hawaiian, Inc. | | | 23,665 | | | | 690,545 | |
| First Interstate BancSystem, Inc. | | | 17,426 | | | | 697,911 | |
| Glacier Bancorp, Inc. | | | 18,201 | | | | 716,937 | |
| Hanmi Financial Corp. | | | 15,734 | | | | 477,527 | |
| Lakeland Financial Corp. | | | 11,822 | | | | 573,249 | |
| Prosperity Bancshares, Inc. | | | 11,073 | | | | 775,885 | |
| Sandy Spring Bancorp, Inc. | | | 12,599 | | | | 491,613 | |
| Santander Consumer USA Holdings, Inc. | | | 23,519 | | | | 437,924 | |
| TCF Financial Corp. | | | 34,158 | | | | 700,239 | |
| Texas Capital Bancshares, Inc. (a) | | | 4,484 | | | | 398,628 | |
| Textainer Group Holdings Ltd. (a) | | | 22,906 | | | | 492,479 | |
| UMB Financial Corp. | | | 10,082 | | | | 725,098 | |
| Wintrust Financial Corp. | | | 9,576 | | | | 788,775 | |
| | | | | | | | |
| | | | | | $ | 10,891,765 | |
| | | | | | | | |
| Pharmaceuticals – 0.6% | | | | | | | | |
| Genomma Lab Internacional S.A., “B” (a) | | | 307,677 | | | $ | 321,095 | |
| | | | | | | | |
| Pollution Control – 2.3% | | | | | | | | |
| Advanced Disposal Services, Inc. (a) | | | 16,542 | | | $ | 396,016 | |
| Clean Harbors, Inc. (a) | | | 10,492 | | | | 568,666 | |
| Evoqua Water Technologies LLC (a) | | | 13,273 | | | | 314,703 | |
| | | | | | | | |
| | | | | | $ | 1,279,385 | |
| | | | | | | | |
| Real Estate – 7.9% | | | | | | | | |
| Brixmor Property Group Inc., REIT | | | 18,923 | | | $ | 353,103 | |
| Corporate Office Properties Trust, REIT | | | 16,060 | | | | 468,952 | |
| Life Storage, Inc., REIT | | | 7,721 | | | | 687,710 | |
| Medical Properties Trust, Inc., REIT | | | 62,917 | | | | 866,996 | |
| Select Income, REIT | | | 33,208 | | | | 834,517 | |
| STAG Industrial, Inc., REIT | | | 25,291 | | | | 691,203 | |
| Store Capital Corp., REIT | | | 21,853 | | | | 569,052 | |
| | | | | | | | |
| | | | | | $ | 4,471,533 | |
| | | | | | | | |
| Specialty Chemicals – 4.1% | | | | | | | | |
| Ferro Corp. (a) | | | 19,028 | | | $ | 448,871 | |
| Ferroglobe PLC (a) | | | 18,547 | | | | 300,461 | |
| Orion Engineered Carbons S.A. | | | 23,070 | | | | 590,592 | |
| | | | | | | | |
| Issuer | | Shares/Par | | | Value ($) | |
| COMMON STOCKS – continued | | | | | | | | |
| Specialty Chemicals – continued | | | | | | | | |
| RPM International, Inc. | | | 10,225 | | | $ | 535,994 | |
| Univar, Inc. (a) | | | 13,349 | | | | 413,285 | |
| | | | | | | | |
| | | | | | $ | 2,289,203 | |
| | | | | | | | |
| Specialty Stores – 3.2% | | | | | | | | |
| Express, Inc. (a) | | | 15,085 | | | $ | 153,113 | |
| Michaels Co., Inc. (a) | | | 20,902 | | | | 505,619 | |
| Tuesday Morning Corp. (a)(l) | | | 37,876 | | | | 104,159 | |
| Urban Outfitters, Inc. (a) | | | 17,787 | | | | 623,612 | |
| Zumiez, Inc. (a) | | | 18,738 | | | | 390,219 | |
| | | | | | | | |
| | | | | | $ | 1,776,722 | |
| | | | | | | | |
| Trucking – 1.2% | | | | | | | | |
| Marten Transport Ltd. | | | 15,310 | | | $ | 310,793 | |
| Werner Enterprises, Inc. | | | 9,861 | | | | 381,128 | |
| | | | | | | | |
| | | | | | $ | 691,921 | |
| | | | | | | | |
| Utilities – Electric Power – 4.1% | | | | | | | | |
| Black Hills Corp. | | | 12,214 | | | $ | 734,184 | |
| El Paso Electric Co. | | | 12,060 | | | | 667,521 | |
| Portland General Electric Co. | | | 20,123 | | | | 917,206 | |
| | | | | | | | |
| | | | | | $ | 2,318,911 | |
| | | | | | | | |
Total Common Stocks
(Identified Cost, $43,184,222) | | | | | | $ | 55,513,635 | |
| | | | | | | | |
| |
| INVESTMENT COMPANIES (h) – 0.2% | | | | | |
| Money Market Funds – 0.2% | | | | | | | | |
| MFS Institutional Money Market Portfolio, 1.25% (v) (Identified Cost, $125,090) | | | 125,102 | | | $ | 125,090 | |
| | | | | | | | |
|
| COLLATERAL FOR SECURITIES LOANED – 0.6% | |
State Street Navigator Securities Lending Government Money Market Portfolio,
1.3% (j) (Identified Cost, $347,929) | | | 347,929 | | | $ | 347,929 | |
| | | | | | | | |
OTHER ASSETS, LESS
LIABILITIES – 0.7% | | | | | | | 390,785 | |
| | | | | | | | |
| NET ASSETS – 100.0% | | | | | | $ | 56,377,439 | |
| | | | | | | | |
| (a) | | Non-income producing security. |
| (h) | | An affiliated issuer may be considered one in which the fund owns 5% or more of the outstanding voting securities, or a company which is under common control. At period end, the aggregate values of the fund’s investments in affiliated issuers and in unaffiliated issuers were $125,090 and $55,861,564, respectively. |
| (j) | | The rate quoted is the annualized seven-day yield of the fund at period end. |
| (l) | | A portion of this security is on loan. |
| (v) | | Affiliated issuer that is available only to investment companies managed by MFS. The rate quoted for the MFS Institutional Money Market Portfolio is the annualized seven-day yield of the fund at period end. |
The following abbreviations are used in this report and are defined:
| ADR | | American Depositary Receipt |
| PLC | | Public Limited Company |
| REIT | | Real Estate Investment Trust |
See Notes to Financial Statements
9
MFS New Discovery Value Portfolio
FINANCIAL STATEMENTS | STATEMENT OF ASSETS AND LIABILITIES
This statement represents your fund’s balance sheet, which details the assets and liabilities comprising the total value of the fund.
| | | | |
At 12/31/17 | | | | |
Assets | | | | |
Investments in unaffiliated issuers, at value, including $341,137 of securities on loan (identified cost, $43,532,151) | | | $55,861,564 | |
Investments in affiliated issuers, at value (identified cost, $125,090) | | | 125,090 | |
Cash | | | 4,197 | |
Receivables for | | | | |
Investments sold | | | 765,240 | |
Fund shares sold | | | 60 | |
Interest and dividends | | | 66,681 | |
Receivable from investment adviser | | | 4,350 | |
Other assets | | | 699 | |
Total assets | | | $56,827,881 | |
Liabilities | | | | |
Payables for | | | | |
Fund shares reacquired | | | $64,557 | |
Collateral for securities loaned, at value | | | 347,929 | |
Payable to affiliates | | | | |
Shareholder servicing costs | | | 32 | |
Distribution and/or service fees | | | 300 | |
Payable for independent Trustees’ compensation | | | 43 | |
Accrued expenses and other liabilities | | | 37,581 | |
Total liabilities | | | $450,442 | |
Net assets | | | $56,377,439 | |
Net assets consist of | | | | |
Paid-in capital | | | $36,248,973 | |
Unrealized appreciation (depreciation) | | | 12,329,476 | |
Accumulated net realized gain (loss) | | | 7,555,115 | |
Undistributed net investment income | | | 243,875 | |
Net assets | | | $56,377,439 | |
Shares of beneficial interest outstanding | | | 5,073,978 | |
| | | | | | | | | | | | |
| | | Net assets | | | Shares
outstanding | | | Net asset value
per share | |
Initial Class | | | $45,470,150 | | | | 4,086,502 | | | | $11.13 | |
Service Class | | | 10,907,289 | | | | 987,476 | | | | 11.05 | |
Net asset value per share is calculated using actual net assets and shares outstanding rather than amounts that have been rounded for presentation purposes.
See Notes to Financial Statements
10
MFS New Discovery Value Portfolio
FINANCIAL STATEMENTS | STATEMENT OF OPERATIONS
This statement describes how much your fund earned in investment income and accrued in expenses. It also describes any gains and/or losses generated by fund operations.
| | | | |
Year ended 12/31/17 | | | | |
Net investment income (loss) | | | | |
Income | | | | |
Dividends | | | $762,813 | |
Dividends from affiliated issuers | | | 7,445 | |
Income on securities loaned | | | 7,346 | |
Interest | | | 83 | |
Foreign taxes withheld | | | (8,796 | ) |
Total investment income | | | $768,891 | |
Expenses | | | | |
Management fee | | | $508,404 | |
Distribution and/or service fees | | | 26,897 | |
Shareholder servicing costs | | | 3,803 | |
Administrative services fee | | | 18,526 | |
Independent Trustees’ compensation | | | 2,628 | |
Custodian fee | | | 6,276 | |
Shareholder communications | | | 6,434 | |
Audit and tax fees | | | 51,610 | |
Legal fees | | | 1,680 | |
Miscellaneous | | | 11,302 | |
Total expenses | | | $637,560 | |
Reduction of expenses by investment adviser | | | (112,846 | ) |
Net expenses | | | $524,714 | |
Net investment income (loss) | | | $244,177 | |
Realized and unrealized gain (loss) | | | | |
Realized gain (loss) (identified cost basis) | | | | |
Unaffiliated issuers | | | $7,830,758 | |
Affiliated issuers | | | (85 | ) |
Foreign currency | | | 269 | |
Net realized gain (loss) | | | $7,830,942 | |
Change in unrealized appreciation (depreciation) | | | | |
Unaffiliated issuers | | | $(23,000 | ) |
Translation of assets and liabilities in foreign currencies | | | 52 | |
Net unrealized gain (loss) | | | $(22,948 | ) |
Net realized and unrealized gain (loss) | | | $7,807,994 | |
Change in net assets from operations | | | $8,052,171 | |
See Notes to Financial Statements
11
MFS New Discovery Value Portfolio
FINANCIAL STATEMENTS | STATEMENTS OF CHANGES IN NET ASSETS
These statements describe the increases and/or decreases in net assets resulting from operations, any distributions, and any shareholder transactions.
| | | | | | | | |
| | | Year ended | |
| | | 12/31/17 | | | 12/31/16 | |
Change in net assets | | | | | | | | |
| From operations | | | | | | | | |
Net investment income (loss) | | | $244,177 | | | | $480,528 | |
Net realized gain (loss) | | | 7,830,942 | | | | 5,385,189 | |
Net unrealized gain (loss) | | | (22,948 | ) | | | 7,578,064 | |
Change in net assets from operations | | | $8,052,171 | | | | $13,443,781 | |
| Distributions declared to shareholders | | | | | | | | |
From net investment income | | | $(523,089 | ) | | | $(482,043 | ) |
From net realized gain | | | (5,264,061 | ) | | | (5,204,769 | ) |
Total distributions declared to shareholders | | | $(5,787,150 | ) | | | $(5,686,812 | ) |
Change in net assets from fund share transactions | | | $(899,193 | ) | | | $(8,250,152 | ) |
Total change in net assets | | | $1,365,828 | | | | $(493,183 | ) |
| Net assets | | | | | | | | |
At beginning of period | | | 55,011,611 | | | | 55,504,794 | |
At end of period (including undistributed net investment income of $243,875 and
$482,857, respectively) | | | $56,377,439 | | | | $55,011,611 | |
See Notes to Financial Statements
12
MFS New Discovery Value Portfolio
FINANCIAL STATEMENTS | FINANCIAL HIGHLIGHTS
The financial highlights table is intended to help you understand the fund’s financial performance for the past 5 years. Certain information reflects financial results for a single fund share. The total returns in the table represent the rate that an investor would have earned (or lost) on an investment in the fund share class (assuming reinvestment of all distributions) held for the entire period.
| | | | | | | | | | | | | | | | | | | | |
| Initial Class | | Year ended | |
| | | 12/31/17 | | | 12/31/16 | | | 12/31/15 | | | 12/31/14 | | | 12/31/13 | |
Net asset value, beginning of period | | | $10.79 | | | | $9.44 | | | | $10.74 | | | | $12.12 | | | | $8.85 | |
| Income (loss) from investment operations | | | | | | | | | | | | | | | | | | | | |
Net investment income (loss) (d) | | | $0.05 | | | | $0.09 | (c) | | | $0.09 | | | | $0.06 | | | | $0.06 | |
Net realized and unrealized gain (loss) | | | 1.44 | | | | 2.34 | | | | (0.40 | ) | | | 0.35 | | | | 3.44 | |
Total from investment operations | | | $1.49 | | | | $2.43 | | | | $(0.31 | ) | | | $0.41 | | | | $3.50 | |
| Less distributions declared to shareholders | | | | | | | | | | | | | | | | | | | | |
From net investment income | | | $(0.11 | ) | | | $(0.10 | ) | | | $(0.07 | ) | | | $(0.07 | ) | | | $(0.12 | ) |
From net realized gain | | | (1.04 | ) | | | (0.98 | ) | | | (0.92 | ) | | | (1.72 | ) | | | (0.11 | ) |
Total distributions declared to shareholders | | | $(1.15 | ) | | | $(1.08 | ) | | | $(0.99 | ) | | | $(1.79 | ) | | | $(0.23 | ) |
Net asset value, end of period (x) | | | $11.13 | | | | $10.79 | | | | $9.44 | | | | $10.74 | | | | $12.12 | |
Total return (%) (k)(r)(s)(x) | | | 15.24 | | | | 27.03 | (c) | | | (2.56 | ) | | | 3.44 | | | | 39.94 | |
Ratios (%) (to average net assets)
and Supplemental data: | | | | | | | | | | | | | | | | | | | | |
Expenses before expense reductions (f) | | | 1.08 | | | | 1.05 | (c) | | | 1.10 | | | | 1.10 | | | | 1.06 | |
Expenses after expense reductions (f) | | | 0.88 | | | | 0.87 | (c) | | | 0.88 | | | | 0.98 | | | | 1.05 | |
Net investment income (loss) | | | 0.48 | | | | 0.91 | (c) | | | 0.83 | | | | 0.56 | | | | 0.55 | |
Portfolio turnover | | | 52 | | | | 48 | | | | 53 | | | | 49 | | | | 55 | |
Net assets at end of period (000 omitted) | | | $45,470 | | | | $46,635 | | | | $47,068 | | | | $54,917 | | | | $57,686 | |
| |
| Service Class | | Year ended | |
| | | 12/31/17 | | | 12/31/16 | | | 12/31/15 | | | 12/31/14 | | | 12/31/13 | |
Net asset value, beginning of period | | | $10.72 | | | | $9.38 | | | | $10.68 | | | | $12.06 | | | | $8.80 | |
| Income (loss) from investment operations | | | | | | | | | | | | | | | | | | | | |
Net investment income (loss) (d) | | | $0.03 | | | | $0.06 | (c) | | | $0.06 | | | | $0.03 | | | | $0.03 | |
Net realized and unrealized gain (loss) | | | 1.43 | | | | 2.33 | | | | (0.40 | ) | | | 0.34 | | | | 3.43 | |
Total from investment operations | | | $1.46 | | | | $2.39 | | | | $(0.34 | ) | | | $0.37 | | | | $3.46 | |
| Less distributions declared to shareholders | | | | | | | | | | | | | | | | | | | | |
From net investment income | | | $(0.09 | ) | | | $(0.07 | ) | | | $(0.04 | ) | | | $(0.03 | ) | | | $(0.09 | ) |
From net realized gain | | | (1.04 | ) | | | (0.98 | ) | | | (0.92 | ) | | | (1.72 | ) | | | (0.11 | ) |
Total distributions declared to shareholders | | | $(1.13 | ) | | | $(1.05 | ) | | | $(0.96 | ) | | | $(1.75 | ) | | | $(0.20 | ) |
Net asset value, end of period (x) | | | $11.05 | | | | $10.72 | | | | $9.38 | | | | $10.68 | | | | $12.06 | |
Total return (%) (k)(r)(s)(x) | | | 15.01 | | | | 26.73 | (c) | | | (2.90 | ) | | | 3.19 | | | | 39.68 | |
Ratios (%) (to average net assets)
and Supplemental data: | | | | | | | | | | | | | | | | | | | | |
Expenses before expense reductions (f) | | | 1.33 | | | | 1.30 | (c) | | | 1.35 | | | | 1.35 | | | | 1.31 | |
Expenses after expense reductions (f) | | | 1.13 | | | | 1.12 | (c) | | | 1.13 | | | | 1.23 | | | | 1.30 | |
Net investment income (loss) | | | 0.24 | | | | 0.66 | (c) | | | 0.58 | | | | 0.30 | | | | 0.29 | |
Portfolio turnover | | | 52 | | | | 48 | | | | 53 | | | | 49 | | | | 55 | |
Net assets at end of period (000 omitted) | | | $10,907 | | | | $8,376 | | | | $8,437 | | | | $10,305 | | | | $11,434 | |
See Notes to Financial Statements
13
MFS New Discovery Value Portfolio
Financial Highlights – continued
| (c) | Amount reflects a one-time reimbursement of expenses by the custodian (or former custodian) without which net investment income and performance would be lower and expenses would be higher. |
| (d) | Per share data is based on average shares outstanding. |
| (f) | Ratios do not reflect reductions from fees paid indirectly, if applicable. |
| (k) | The total return does not reflect expenses that apply to separate accounts. Inclusion of these charges would reduce the total return figures for all periods shown. |
| (r) | Certain expenses have been reduced without which performance would have been lower. |
| (s) | From time to time the fund may receive proceeds from litigation settlements, without which performance would be lower. |
| (x) | The net asset values and total returns have been calculated on net assets which include adjustments made in accordance with U.S. generally accepted accounting principles required at period end for financial reporting purposes. |
See Notes to Financial Statements
14
MFS New Discovery Value Portfolio
NOTES TO FINANCIAL STATEMENTS
| (1) | | Business and Organization |
MFS New Discovery Value Portfolio (the fund) is a diversified series of MFS Variable Insurance Trust III (the trust). The trust is organized as a Delaware statutory trust and is registered under the Investment Company Act of 1940, as amended, as an open-end management investment company. The shareholders of each series of the trust are separate accounts of insurance companies, which offer variable annuity and/or life insurance products, and qualified retirement and pension plans.
The fund is an investment company and accordingly follows the investment company accounting and reporting guidance of the Financial Accounting Standards Board (FASB) Accounting Standards Codification Topic 946 Financial Services – Investment Companies.
| (2) | | Significant Accounting Policies |
General – The preparation of financial statements in conformity with U.S. generally accepted accounting principles requires management to make estimates and assumptions that affect the reported amounts of assets and liabilities, and disclosure of contingent assets and liabilities at the date of the financial statements and the reported amounts of increases and decreases in net assets from operations during the reporting period. Actual results could differ from those estimates. In the preparation of these financial statements, management has evaluated subsequent events occurring after the date of the fund’s Statement of Assets and Liabilities through the date that the financial statements were issued. The fund will generally focus on securities of small size companies which may be more volatile than those of larger companies.
In October 2016, the Securities and Exchange Commission (SEC) released its final rule on Investment Company Reporting Modernization (the “Rule”). The Rule, which introduced two new regulatory reporting forms for investment companies – Form N-PORT and Form N-CEN – also contained amendments to Regulation S-X which impact financial statement presentation, particularly the presentation of derivative investments, for all reporting periods ending after August 1, 2017. The fund has adopted the Rule’s Regulation S-X amendments and believes that the fund’s financial statements are in compliance with those amendments.
Balance Sheet Offsetting – The fund’s accounting policy with respect to balance sheet offsetting is that, absent an event of default by the counterparty or a termination of the agreement, the International Swaps and Derivatives Association (ISDA) Master Agreement, or similar agreement, does not result in an offset of reported amounts of financial assets and financial liabilities in the Statement of Assets and Liabilities across transactions between the fund and the applicable counterparty. The fund’s right to setoff may be restricted or prohibited by the bankruptcy or insolvency laws of the particular jurisdiction to which a specific master netting agreement counterparty is subject. Balance sheet offsetting disclosures, to the extent applicable to the fund, have been included in the fund’s Significant Accounting Policies note under the captions for each of the fund’s in-scope financial instruments and transactions.
Investment Valuations – Equity securities, including restricted equity securities, are generally valued at the last sale or official closing price on their primary market or exchange as provided by a third-party pricing service. Equity securities, for which there were no sales reported that day, are generally valued at the last quoted daily bid quotation on their primary market or exchange as provided by a third-party pricing service. Short-term instruments with a maturity at issuance of 60 days or less may be valued at amortized cost, which approximates market value. Open-end investment companies are generally valued at net asset value per share. Securities and other assets generally valued on the basis of information from a third-party pricing service may also be valued at a broker/dealer bid quotation. Values obtained from third-party pricing services can utilize both transaction data and market information such as yield, quality, coupon rate, maturity, type of issue, trading characteristics, and other market data. The values of foreign securities and other assets and liabilities expressed in foreign currencies are converted to U.S. dollars using the mean of bid and asked prices for rates provided by a third-party pricing service.
The Board of Trustees has delegated primary responsibility for determining or causing to be determined the value of the fund’s investments (including any fair valuation) to the adviser pursuant to valuation policies and procedures approved by the Board. If the adviser determines that reliable market quotations are not readily available, investments are valued at fair value as determined in good faith by the adviser in accordance with such procedures under the oversight of the Board of Trustees. Under the fund’s valuation policies and procedures, market quotations are not considered to be readily available for most types of debt instruments and floating rate loans and many types of derivatives. These investments are generally valued at fair value based on information from third-party pricing services. In addition, investments may be valued at fair value if the adviser determines that an investment’s value has been materially affected by events occurring after the close of the exchange or market on which the investment is principally traded (such as foreign exchange or market) and prior to the determination of the fund’s net asset value, or after the halting of trading of a specific security where trading does not resume prior to the close of the exchange or market on which the security is principally traded. Events that occur on a frequent basis after foreign markets close (such as developments in foreign markets and significant movements in the U.S. markets) and prior to the determination of the fund’s net asset value may be deemed to have a material effect on the value of securities traded in foreign markets. Accordingly, the fund’s foreign equity securities may often be valued at fair value. The adviser generally relies on third-party pricing services or other information (such as the correlation with price movements of similar securities in the same or other markets; the type, cost and investment characteristics of the security; the
15
MFS New Discovery Value Portfolio
Notes to Financial Statements – continued
business and financial condition of the issuer; and trading and other market data) to assist in determining whether to fair value and at what value to fair value an investment. The value of an investment for purposes of calculating the fund’s net asset value can differ depending on the source and method used to determine value. When fair valuation is used, the value of an investment used to determine the fund’s net asset value may differ from quoted or published prices for the same investment. There can be no assurance that the fund could obtain the fair value assigned to an investment if it were to sell the investment at the same time at which the fund determines its net asset value per share.
Various inputs are used in determining the value of the fund’s assets or liabilities. These inputs are categorized into three broad levels. In certain cases, the inputs used to measure fair value may fall into different levels of the fair value hierarchy. In such cases, an investment’s level within the fair value hierarchy is based on the lowest level of input that is significant to the fair value measurement. The fund’s assessment of the significance of a particular input to the fair value measurement in its entirety requires judgment, and considers factors specific to the investment. Level 1 includes unadjusted quoted prices in active markets for identical assets or liabilities. Level 2 includes other significant observable market-based inputs (including quoted prices for similar securities, interest rates, prepayment speed, and credit risk). Level 3 includes unobservable inputs, which may include the adviser’s own assumptions in determining the fair value of investments. The following is a summary of the levels used as of December 31, 2017 in valuing the fund’s assets or liabilities:
| | | | | | | | | | | | | | | | |
| Financial Instruments | | Level 1 | | | Level 2 | | | Level 3 | | | Total | |
| Equity Securities | | | $55,513,635 | | | | $— | | | | $— | | | | $55,513,635 | |
| Mutual Funds | | | 473,019 | | | | — | | | | — | | | | 473,019 | |
| Total | | | $55,986,654 | | | | $— | | | | $— | | | | $55,986,654 | |
For further information regarding security characteristics, see the Portfolio of Investments. The fund held worthless level 3 securities at the beginning of the period which were disposed of during the period for $0 and no realized gain or loss.
Foreign Currency Translation – Purchases and sales of foreign investments, income, and expenses are converted into U.S. dollars based upon currency exchange rates prevailing on the respective dates of such transactions or on the reporting date for foreign denominated receivables and payables. Gains and losses attributable to foreign currency exchange rates on sales of securities are recorded for financial statement purposes as net realized gains and losses on investments. Gains and losses attributable to foreign exchange rate movements on receivables, payables, income and expenses are recorded for financial statement purposes as foreign currency transaction gains and losses. That portion of both realized and unrealized gains and losses on investments that results from fluctuations in foreign currency exchange rates is not separately disclosed.
Security Loans – Under its Securities Lending Agency Agreement with the fund, State Street Bank and Trust Company (“State Street”), as lending agent, loans the securities of the fund to certain qualified institutions (the “Borrowers”) approved by the fund. Security loans can be terminated at the discretion of either the lending agent or the fund and the related securities must be returned within the earlier of the standard trade settlement period for such securities or within three business days. The loans are collateralized by cash and/or U.S. Treasury and federal agency obligations in an amount typically at least equal to the market value of the securities loaned. On loans collateralized by cash, the cash collateral is invested in a money market fund. The market value of the loaned securities is determined at the close of business of the fund and any additional required collateral is delivered to the fund on the next business day. State Street provides the fund with indemnification against Borrower default. In the event of Borrower default, State Street will, for the benefit of the fund, either purchase securities identical to those loaned or, when such purchase is commercially impracticable, pay the fund the market value of the loaned securities. In return, State Street assumes the fund’s rights to the related collateral. If the collateral value is less than the cost to purchase identical securities, State Street is responsible for the shortfall, but only to the extent that such shortfall is not due to a decline in collateral value resulting from collateral reinvestment for which the fund bears the risk of loss. At period end, the fund had investment securities on loan, all of which were classified as equity securities in the fund’s Portfolio of Investments, with a fair value of $341,137. The fair value of the fund’s investment securities on loan and a related liability of $347,929 for cash collateral received on securities loaned are both presented gross in the Statement of Assets and Liabilities. The collateral on securities loaned exceeded the value of securities on loan at period end. The liability for cash collateral for securities loaned is carried at fair value, which is categorized as level 2 within the fair value hierarchy. A portion of the income generated upon investment of the collateral is remitted to the Borrowers, and the remainder is allocated between the fund and the lending agent. On loans collateralized by U.S. Treasury and/or federal agency obligations, a fee is received from the Borrower, and is allocated between the fund and the lending agent. Income from securities lending is separately reported in the Statement of Operations. The dividend and interest income earned on the securities loaned is accounted for in the same manner as other dividend and interest income.
Indemnifications – Under the fund’s organizational documents, its officers and Trustees may be indemnified against certain liabilities and expenses arising out of the performance of their duties to the fund. Additionally, in the normal course of business, the fund enters into agreements with service providers that may contain indemnification clauses. The fund’s maximum exposure under these agreements is unknown as this would involve future claims that may be made against the fund that have not yet occurred.
16
MFS New Discovery Value Portfolio
Notes to Financial Statements – continued
Investment Transactions and Income – Investment transactions are recorded on the trade date. Interest income is recorded on the accrual basis. Dividends received in cash are recorded on the ex-dividend date. Certain dividends from foreign securities will be recorded when the fund is informed of the dividend if such information is obtained subsequent to the ex-dividend date. Dividend payments received in additional securities are recorded on the ex-dividend date in an amount equal to the value of the security on such date.
The fund may receive proceeds from litigation settlements. Any proceeds received from litigation involving portfolio holdings are reflected in the Statement of Operations in realized gain/loss if the security has been disposed of by the fund or in unrealized gain/loss if the security is still held by the fund. Any other proceeds from litigation not related to portfolio holdings are reflected as other income in the Statement of Operations.
Tax Matters and Distributions – The fund intends to qualify as a regulated investment company, as defined under Subchapter M of the Internal Revenue Code, and to distribute all of its taxable income, including realized capital gains. As a result, no provision for federal income tax is required. The fund’s federal tax returns, when filed, will remain subject to examination by the Internal Revenue Service for a three year period. Management has analyzed the fund’s tax positions taken on federal and state tax returns for all open tax years and does not believe that there are any uncertain tax positions that require recognition of a tax liability. Foreign taxes, if any, have been accrued by the fund in the accompanying financial statements in accordance with the applicable foreign tax law. Foreign income taxes may be withheld by certain countries in which the fund invests. Additionally, capital gains realized by the fund on securities issued in or by certain foreign countries may be subject to capital gains tax imposed by those countries.
Distributions to shareholders are recorded on the ex-dividend date. Income and capital gain distributions are determined in accordance with income tax regulations, which may differ from U.S. generally accepted accounting principles. Certain capital accounts in the financial statements are periodically adjusted for permanent differences in order to reflect their tax character. These adjustments have no impact on net assets or net asset value per share. Temporary differences which arise from recognizing certain items of income, expense, gain or loss in different periods for financial statement and tax purposes will reverse at some time in the future. Distributions in excess of net investment income or net realized gains are temporary overdistributions for financial statement purposes resulting from differences in the recognition or classification of income or distributions for financial statement and tax purposes.
Book/tax differences primarily relate to wash sale loss deferrals.
The tax character of distributions declared to shareholders for the last two fiscal years is as follows:
| | | | | | | | |
| | | Year ended
12/31/17 | | | Year ended
12/31/16 | |
| Ordinary income (including any short-term capital gains) | | | $1,411,113 | | | | $1,506,595 | |
| Long-term capital gains | | | 4,376,037 | | | | 4,180,217 | |
| Total distributions | | | $5,787,150 | | | | $5,686,812 | |
The federal tax cost and the tax basis components of distributable earnings were as follows:
| | | | |
| As of 12/31/17 | | | | |
| Cost of investments | | | $43,968,021 | |
| Gross appreciation | | | 13,690,520 | |
| Gross depreciation | | | (1,671,887 | ) |
| Net unrealized appreciation (depreciation) | | | $12,018,633 | |
| Undistributed ordinary income | | | 1,717,496 | |
| Undistributed long-term capital gain | | | 6,365,723 | |
| Other temporary differences | | | 26,614 | |
Multiple Classes of Shares of Beneficial Interest – The fund offers multiple classes of shares, which differ in their respective distribution and/or service fees. The fund’s income, realized and unrealized gain (loss), and common expenses are allocated to shareholders based on the daily net assets of each class. Dividends are declared separately for each class. Differences in per share dividend rates are generally due to differences in separate class expenses. The fund’s distributions declared to shareholders as reported in the Statements of Changes in Net Assets are presented by class as follows:
| | | | | | | | | | | | | | | | |
| | | From net investment
income | | | From net realized gain on
investments | |
| | | Year ended
12/31/17 | | | Year ended
12/31/16 | | | Year ended
12/31/17 | | | Year ended
12/31/16 | |
| Initial Class | | | $439,568 | | | | $429,416 | | | | $4,255,688 | | | | $4,421,516 | |
| Service Class | | | 83,521 | | | | 52,627 | | | | 1,008,373 | | | | 783,253 | |
| Total | | | $523,089 | | | | $482,043 | | | | $5,264,061 | | | | $5,204,769 | |
17
MFS New Discovery Value Portfolio
Notes to Financial Statements – continued
| (3) | | Transactions with Affiliates |
Investment Adviser – The fund has an investment advisory agreement with MFS to provide overall investment management and related administrative services and facilities to the fund. The management fee is computed daily and paid monthly at the following annual rates based on the fund’s average daily net assets:
| | | | |
| Up to $250 million | | | 0.90% | |
| In excess of $250 million | | | 0.85% | |
MFS has agreed in writing to reduce its management fee by a specified amount if certain MFS mutual fund assets exceed thresholds agreed to by MFS and the fund’s Board of Trustees. For the year ended December 31, 2017, this management fee reduction amounted to $4,520, which is included in the reduction of total expenses in the Statement of Operations. The management fee incurred for the year ended December 31, 2017 was equivalent to an annual effective rate of 0.89% of the fund’s average daily net assets.
The investment adviser has agreed in writing to pay a portion of the fund’s total annual operating expenses, excluding interest, taxes, extraordinary expenses, brokerage and transaction costs, and investment-related expenses, such that total annual operating expenses do not exceed 0.88% of average daily net assets for the Initial Class shares and 1.13% of average daily net assets for the Service Class shares. This written agreement will continue until modified by the fund’s Board of Trustees, but such agreement will continue at least until April 30, 2019. For the year ended December 31, 2017, this reduction amounted to $108,326, which is included in the reduction of total expenses in the Statement of Operations.
Distributor – MFS Fund Distributors, Inc. (MFD), a wholly-owned subsidiary of MFS, is the distributor of shares of the fund. The Trustees have adopted a distribution plan for the Service Class shares pursuant to Rule 12b-1 under the Investment Company Act of 1940.
The fund’s distribution plan provides that the fund will pay MFD distribution and/or service fees equal to 0.25% per annum of its average daily net assets attributable to Service Class shares as partial consideration for services performed and expenses incurred by MFD and financial intermediaries (including participating insurance companies that invest in the fund to fund variable annuity and variable life insurance contracts, sponsors of qualified retirement and pension plans that invest in the fund, and affiliates of these participating insurance companies and plan sponsors) in connection with the sale and distribution of the Service Class shares. MFD may subsequently pay all, or a portion, of the distribution and/or service fees to financial intermediaries.
Shareholder Servicing Agent – MFS Service Center, Inc. (MFSC), a wholly-owned subsidiary of MFS, receives a fee from the fund for its services as shareholder servicing agent. For the year ended December 31, 2017, the fee was $3,359, which equated to 0.0059% annually of the fund’s average daily net assets. MFSC also receives payment from the fund for out-of-pocket expenses paid by MFSC on behalf of the fund. For the year ended December 31, 2017, these costs amounted to $444.
Administrator – MFS provides certain financial, legal, shareholder communications, compliance, and other administrative services to the fund. Under an administrative services agreement, the fund reimburses MFS the costs incurred to provide these services. The fund is charged an annual fixed amount of $17,500 plus a fee based on average daily net assets. The administrative services fee incurred for the year ended December 31, 2017 was equivalent to an annual effective rate of 0.0328% of the fund’s average daily net assets.
Trustees’ and Officers’ Compensation – The fund pays compensation to independent Trustees in the form of a retainer, attendance fees, and additional compensation to Board and Committee chairpersons. The fund does not pay compensation directly to Trustees or officers of the fund who are also officers of the investment adviser, all of whom receive remuneration for their services to the fund from MFS. Certain officers and Trustees of the fund are officers or directors of MFS, MFD, and MFSC.
Other – This fund and certain other funds managed by MFS (the funds) have entered into a service agreement (the ISO Agreement) which provides for payment of fees solely by the funds to Tarantino LLC in return for the provision of services of an Independent Senior Officer (ISO) for the funds. Frank L. Tarantino serves as the ISO and is an officer of the funds and the sole member of Tarantino LLC. The funds can terminate the ISO Agreement with Tarantino LLC at any time under the terms of the ISO Agreement. For the year ended December 31, 2017, the fee paid by the fund under this agreement was $100 and is included in “Miscellaneous” expense in the Statement of Operations. MFS has agreed to bear all expenses associated with office space, other administrative support, and supplies provided to the ISO.
The fund invests in the MFS Institutional Money Market Portfolio which is managed by MFS and seeks current income consistent with preservation of capital and liquidity. This money market fund does not pay a management fee to MFS.
The fund is permitted to engage in purchase and sale transactions with funds and accounts for which MFS serves as investment adviser or sub-adviser (“cross-trades”) pursuant to a policy adopted by the Board of Trustees. This policy has been designed to ensure that cross-trades conducted by the fund comply with Rule 17a-7 under the Investment Company Act of 1940. During the year ended December 31, 2017, the fund engaged in purchase and sale transactions pursuant to this policy, which amounted to $42,927 and $129,321, respectively. The sales transactions resulted in net realized gains (losses) of $53,426.
18
MFS New Discovery Value Portfolio
Notes to Financial Statements – continued
For the year ended December 31, 2017, purchases and sales of investments, other than short-term obligations, aggregated $28,932,632 and $36,052,773, respectively.
| (5) | | Shares of Beneficial Interest |
The fund’s Declaration of Trust permits the Trustees to issue an unlimited number of full and fractional shares of beneficial interest. Transactions in fund shares were as follows:
| | | | | | | | | | | | | | | | |
| | | Year ended 12/31/17 | | | Year ended 12/31/16 | |
| | | Shares | | | Amount | | | Shares | | | Amount | |
| Shares sold | | | | | | | | | | | | | | | | |
Initial Class | | | 93,805 | | | | $1,023,916 | | | | 190,429 | | | | $1,881,992 | |
Service Class | | | 371,261 | | | | 4,044,312 | | | | 110,795 | | | | 1,102,645 | |
| | | 465,066 | | | | $5,068,228 | | | | 301,224 | | | | $2,984,637 | |
| Shares issued to shareholders in reinvestment of distributions | | | | | | | | | | | | | | | | |
Initial Class | | | 478,619 | | | | $4,695,256 | | | | 500,096 | | | | $4,850,932 | |
Service Class | | | 111,989 | | | | 1,091,894 | | | | 86,619 | | | | 835,880 | |
| | | 590,608 | | | | $5,787,150 | | | | 586,715 | | | | $5,686,812 | |
| Shares reacquired | | | | | | | | | | | | | | | | |
Initial Class | | | (807,724 | ) | | | $(8,747,810 | ) | | | (1,357,333 | ) | | | $(13,806,560 | ) |
Service Class | | | (276,792 | ) | | | (3,006,761 | ) | | | (315,861 | ) | | | (3,115,041 | ) |
| | | (1,084,516 | ) | | | $(11,754,571 | ) | | | (1,673,194 | ) | | | $(16,921,601 | ) |
| Net change | | | | | | | | | | | | | | | | |
Initial Class | | | (235,300 | ) | | | $(3,028,638 | ) | | | (666,808 | ) | | | $(7,073,636 | ) |
Service Class | | | 206,458 | | | | 2,129,445 | | | | (118,447 | ) | | | (1,176,516 | ) |
| | | (28,842 | ) | | | $(899,193 | ) | | | (785,255 | ) | | | $(8,250,152 | ) |
The fund is one of several mutual funds in which certain MFS funds may invest. The MFS funds do not invest in the underlying funds for the purpose of exercising management or control. At the end of the period, the MFS Moderate Allocation Portfolio, the MFS Growth Allocation Portfolio, and the MFS Conservative Allocation Portfolio were the owners of record of approximately 45%, 15%, and 10%, respectively, of the value of outstanding voting shares of the fund.
The fund and certain other funds managed by MFS participate in a $1.25 billion unsecured committed line of credit, subject to a $1 billion sublimit, provided by a syndication of banks under a credit agreement. Borrowings may be made for temporary financing needs. Interest is charged to each fund, based on its borrowings, generally at a rate equal to the higher of the Overnight Federal Reserve funds rate or daily one month LIBOR plus an agreed upon spread. A commitment fee, based on the average daily, unused portion of the committed line of credit, is allocated among the participating funds at the end of each calendar quarter. In addition, the fund and other funds managed by MFS have established unsecured uncommitted borrowing arrangements with certain banks for temporary financing needs. Interest is charged to each fund, based on its borrowings, at a rate equal to the Overnight Federal Reserve funds rate plus an agreed upon spread. For the year ended December 31, 2017, the fund’s commitment fee and interest expense were $382 and $0, respectively, and are included in “Miscellaneous” expense in the Statement of Operations.
| (7) | | Investments in Affiliated Issuers |
An affiliated issuer may be considered one in which the fund owns 5% or more of the outstanding voting securities, or a company which is under common control. For the purposes of this report, the fund assumes the following to be affiliated issuers:
| | | | | | | | | | | | | | | | | | |
| Affiliated Issuers | | | | Beginning
Shares/Par
Amount | | | Acquisitions
Shares/Par
Amount | | | Dispositions
Shares/Par
Amount | | | Ending
Shares/Par
Amount | |
| MFS Institutional Money Market Portfolio | | | | | 416,540 | | | | 14,708,983 | | | | (15,000,421 | ) | | | 125,102 | |
| | | | | |
| Affiliated Issuers | | Realized
Gain (Loss) | | Change in
Unrealized
Appreciation
(Depreciation) | | | Capital Gain
Distributions | | | Dividend
Income | | | Ending
Value | |
| MFS Institutional Money Market Portfolio | | $(85) | | | $— | | | | $— | | | | $7,445 | | | | $125,090 | |
19
MFS New Discovery Value Portfolio
REPORT OF INDEPENDENT REGISTERED PUBLIC ACCOUNTING FIRM
To the Board of Trustees of MFS Variable Insurance Trust III and the Shareholders of
MFS New Discovery Value Portfolio:
Opinion on the Financial Statements and Financial Highlights
We have audited the accompanying statement of assets and liabilities of MFS New Discovery Value Portfolio (one of the series of MFS Variable Insurance Trust III) (the “Fund”), including the portfolio of investments, as of December 31, 2017, the related statement of operations for the year then ended, the statements of changes in net assets for each of the two years in the period then ended, the financial highlights for each of the five years in the period then ended, and the related notes. In our opinion, the financial statements and financial highlights present fairly, in all material respects, the financial position of the Fund as of December 31, 2017, and the results of its operations for the year then ended, the changes in its net assets for each of the two years in the period then ended, and the financial highlights for each of the five years in the period then ended, in conformity with accounting principles generally accepted in the United States of America.
Basis for Opinion
These financial statements and financial highlights are the responsibility of the Fund’s management. Our responsibility is to express an opinion on the Fund’s financial statements and financial highlights based on our audits. We are a public accounting firm registered with the Public Company Accounting Oversight Board (United States) (PCAOB) and are required to be independent with respect to the Fund in accordance with the U.S. federal securities laws and the applicable rules and regulations of the Securities and Exchange Commission and the PCAOB.
We conducted our audits in accordance with the standards of the PCAOB. Those standards require that we plan and perform the audit to obtain reasonable assurance about whether the financial statements and financial highlights are free of material misstatement, whether due to error or fraud. The Fund is not required to have, nor were we engaged to perform, an audit of its internal control over financial reporting. As part of our audits we are required to obtain an understanding of internal control over financial reporting but not for the purpose of expressing an opinion on the effectiveness of the Fund’s internal control over financial reporting. Accordingly, we express no such opinion.
Our audits included performing procedures to assess the risks of material misstatement of the financial statements and financial highlights, whether due to error or fraud, and performing procedures that respond to those risks. Such procedures included examining, on a test basis, evidence regarding the amounts and disclosures in the financial statements and financial highlights. Our audits also included evaluating the accounting principles used and significant estimates made by management, as well as evaluating the overall presentation of the financial statements and financial highlights. Our procedures included confirmation of securities owned as of December 31, 2017, by correspondence with the custodian and brokers. We believe that our audits provide a reasonable basis for our opinion.
DELOITTE & TOUCHE LLP
Boston, Massachusetts
February 15, 2018
We have served as the auditor of one or more of the MFS investment companies since 1924.
20
MFS New Discovery Value Portfolio
TRUSTEES AND OFFICERS – IDENTIFICATION AND BACKGROUND
The Trustees and Officers of the Trust, as of February 1, 2018, are listed below, together with their principal occupations during the past five years. (Their titles may have varied during that period.) The address of each Trustee and Officer is 111 Huntington Avenue, Boston, Massachusetts 02199-7618.
| | | | | | | | | | |
Name, Age | | Position(s)
Held with Fund | | Trustee/Officer
Since (h) | | Number of
MFS Funds
overseen by the
Trustee | | Principal Occupations
During the Past Five Years | | Other Directorships
During the Past Five Years (j) |
| INTERESTED TRUSTEES |
Robert J. Manning (k) (age 54) | | Trustee | | February 2004 | | 137 | | Massachusetts Financial Services Company, Executive Chairman (since January 2017); Director; Chairman of the Board; Chief Executive Officer (until 2015); Co-Chief Executive Officer (2015-2016) | | N/A |
| | | | | |
Robin A. Stelmach (k) (age 56) | | Trustee | | January 2014 | | 137 | | Massachusetts Financial Services Company, Vice Chair (since January 2017); Chief Operating Officer and Executive Vice President (until January 2017) | | N/A |
| | | | |
| INDEPENDENT TRUSTEES | | | | | | | | |
John P. Kavanaugh (age 63) | | Trustee and Chair of Trustees | | January 2009 | | 137 | | Private investor | | N/A |
| | | | | |
Steven E. Buller (age 66) | | Trustee | | February 2014 | | 137 | | Financial Accounting Standards Advisory Council, Chairman (2014-2015); Public Company Accounting Oversight Board, Standing Advisory Group, Member (until 2014); BlackRock, Inc. (investment management), Managing Director (until 2014), BlackRock Finco UK (investment management), Director (until 2014) | | N/A |
| | | | | |
John A. Caroselli (age 63) | | Trustee | | March 2017 | | 137 | | JC Global Advisors, LLC (management consulting), President (since 2015); First Capital Corporation (commercial finance), Executive Vice President (until 2015) | | N/A |
| | | | | |
Maureen R. Goldfarb (age 62) | | Trustee | | January 2009 | | 137 | | Private investor | | N/A |
| | | | | |
Michael Hegarty (age 73) | | Trustee | | December 2004 | | 137 | | Private investor | | Rouse Properties Inc., Director (until 2016); Capmark Financial Group Inc., Director (until 2015) |
| | | | | |
Clarence Otis, Jr. (age 61) | | Trustee | | March 2017 | | 137 | | Darden Restaurants, Inc., Chief Executive Officer (until 2014) | | VF Corporation, Director; Verizon Communications, Inc., Director; The Travelers Companies, Director; Federal Reserve Bank of Atlanta, Director (until 2015) |
| | | | | |
Maryanne L. Roepke (age 61) | | Trustee | | May 2014 | | 137 | | American Century Investments (investment management), Senior Vice President and Chief Compliance Officer (until 2014) | | N/A |
| | | | | |
Laurie J. Thomsen (age 60) | | Trustee | | March 2005 | | 137 | | Private investor | | The Travelers Companies, Director; Dycom Industries, Inc., Director (since 2015) |
21
MFS New Discovery Value Portfolio
Trustees and Officers – continued
| | | | | | | | |
Name, Age | | Position(s)
Held with Fund | | Trustee/Officer
Since (h) | | Number of
MFS Funds
for which the
Person is an
Officer | | Principal Occupations During the Past Five Years |
| OFFICERS | | | | | | | | |
Christopher R. Bohane (k) (age 44) | | Assistant Secretary and Assistant Clerk | | July 2005 | | 137 | | Massachusetts Financial Services Company, Vice President and Assistant General Counsel |
| | | | |
Kino Clark (k) (age 49) | | Assistant Treasurer | | January 2012 | | 137 | | Massachusetts Financial Services Company, Vice President |
| | | | |
John W. Clark, Jr. (k) (age 50) | | Assistant Treasurer | | April 2017 | | 137 | | Massachusetts Financial Services Company, Vice President (since March 2017); Deutsche Bank (financial services), Department Head – Treasurer’s Office (until February 2017) |
| | | | |
Thomas H. Connors (k) (age 58) | | Assistant Secretary and Assistant Clerk | | September 2012 | | 137 | | Massachusetts Financial Services Company, Vice President and Senior Counsel |
| | | | |
Ethan D. Corey (k) (age 54) | | Assistant Secretary and Assistant Clerk | | July 2005 | | 137 | | Massachusetts Financial Services Company, Senior Vice President and Associate General Counsel |
| | | | |
David L. DiLorenzo (k) (age 49) | | President | | July 2005 | | 137 | | Massachusetts Financial Services Company, Senior Vice President |
| | | | |
Heidi W. Hardin (k) (age 50) | | Secretary and Clerk | | April 2017 | | 137 | | Massachusetts Financial Services Company, Executive Vice President and General Counsel (since March 2017); Harris Associates (investment management), General Counsel (from September 2015 to January 2017); Janus Capital Management LLC (investment management), Senior Vice President and General Counsel (until September 2015) |
| | | | |
Brian E. Langenfeld (k) (age 44) | | Assistant Secretary and Assistant Clerk | | June 2006 | | 137 | | Massachusetts Financial Services Company, Vice President and Senior Counsel |
| | | | |
Susan A. Pereira (k) (age 47) | | Assistant Secretary and Assistant Clerk | | July 2005 | | 137 | | Massachusetts Financial Services Company, Vice President and Senior Counsel |
| | | | |
Kasey L. Phillips (k) (age 47) | | Assistant Treasurer | | September 2012 | | 137 | | Massachusetts Financial Services Company, Vice President |
| | | | |
Matthew A. Stowe (k) (age 43) | | Assistant Secretary and Assistant Clerk | | October 2014 | | 137 | | Massachusetts Financial Services Company, Vice President and Assistant General Counsel |
| | | | |
Frank L. Tarantino (age 73) | | Independent Senior Officer | | June 2004 | | 137 | | Tarantino LLC (provider of compliance services), Principal |
| | | | |
Richard S. Weitzel (k) (age 47) | | Assistant Secretary and Assistant Clerk | | October 2007 | | 137 | | Massachusetts Financial Services Company, Senior Vice President and Associate General Counsel |
| | | | |
Martin J. Wolin (k) (age 50) | | Chief Compliance Officer | | July 2015 | | 137 | | Massachusetts Financial Services Company, Senior Vice President and Chief Compliance Officer (since July 2015); Mercer (financial service provider), Chief Risk and Compliance Officer, North America and Latin America (until June 2015) |
| | | | |
James O. Yost (k) (age 57) | | Treasurer | | September 1990 | | 137 | | Massachusetts Financial Services Company, Senior Vice President |
| (h) | Date first appointed to serve as Trustee/officer of an MFS Fund. Each Trustee has served continuously since appointment unless indicated otherwise. For the period from December 15, 2004 until February 22, 2005, Mr. Manning served as Advisory Trustee. Prior to January 2012, Messrs. DiLorenzo and Yost served as Assistant Treasurers of the Funds. From January 2012 through December 2016, Messrs. DiLorenzo and Yost served as Treasurer and Deputy Treasurer of the Funds, respectively. |
| (j) | Directorships or trusteeships of companies required to report to the Securities and Exchange Commission (i.e., “public companies”). |
| (k) | “Interested person” of the Trust within the meaning of the Investment Company Act of 1940 (referred to as the 1940 Act), which is the principal federal law governing investment companies like the fund, as a result of a position with MFS. The address of MFS is 111 Huntington Avenue, Boston, Massachusetts 02199-7618. |
22
MFS New Discovery Value Portfolio
Trustees and Officers – continued
Each Trustee has been elected by shareholders and each Trustee and officer holds office until his or her successor is chosen and qualified or until his or her earlier death, resignation, retirement or removal. The Trust does not hold annual meetings for the purpose of electing Trustees, and Trustees are not elected for fixed terms. Under the terms of the Board’s retirement policy, an Independent Trustee shall retire at the end of the calendar year in which he or she reaches the earlier of 75 years of age or 15 years of service on the Board (or, in the case of any Independent Trustee who joined the Board prior to 2015, 20 years of service on the Board).
Messrs. Buller and Otis and Ms. Roepke are members of the Trust’s Audit Committee.
Each of the Interested Trustees and certain Officers hold comparable officer positions with certain affiliates of MFS.
The Statement of Additional Information for a Fund includes further information about the Trustees and is available without charge upon request by calling 1-800-225-2606.
| | |
Investment Adviser Massachusetts Financial Services Company 111 Huntington Avenue Boston, MA 02199-7618 | | Custodian State Street Bank and Trust Company 1 Lincoln Street Boston, MA 02111-2900 |
Distributor MFS Fund Distributors, Inc. 111 Huntington Avenue Boston, MA 02199-7618 | | Independent Registered Public Accounting Firm Deloitte & Touche LLP 200 Berkeley Street Boston, MA 02116 |
Portfolio Manager(s) Kevin Schmitz | | |
23
MFS New Discovery Value Portfolio
BOARD REVIEW OF INVESTMENT ADVISORY AGREEMENT
The Investment Company Act of 1940 requires that both the full Board of Trustees and a majority of the non-interested (“independent”) Trustees, voting separately, annually approve the continuation of the Fund’s investment advisory agreement with MFS. The Trustees consider matters bearing on the Fund and its advisory arrangements at their meetings throughout the year, including a review of performance data at each regular meeting. In addition, the independent Trustees met several times over the course of three months beginning in May and ending in July, 2017 (“contract review meetings”) for the specific purpose of considering whether to approve the continuation of the investment advisory agreement for the Fund and the other investment companies that the Board oversees (the “MFS Funds”). The independent Trustees were assisted in their evaluation of the Fund’s investment advisory agreement by independent legal counsel, from whom they received separate legal advice and with whom they met separately from MFS during various contract review meetings. The independent Trustees were also assisted in this process by the MFS Funds’ Independent Senior Officer, a senior officer appointed by and reporting to the independent Trustees.
In connection with their deliberations regarding the continuation of the investment advisory agreement, the Trustees, including the independent Trustees, considered such information and factors as they believed, in light of the legal advice furnished to them and their own business judgment, to be relevant. The investment advisory agreement for the Fund was considered separately, although the Trustees also took into account the common interests of all MFS Funds in their review. As described below, the Trustees considered the nature, quality, and extent of the various investment advisory, administrative, and shareholder services performed by MFS under the existing investment advisory agreement and other arrangements with the Fund.
In connection with their contract review meetings, the Trustees received and relied upon materials that included, among other items: (i) information provided by Broadridge Financial Solutions, Inc. (“Broadridge”), an independent third party, on the investment performance of the Fund for various time periods ended December 31, 2016 and the investment performance of a group of funds with substantially similar investment classifications/objectives (the “Lipper performance universe”), (ii) information provided by Broadridge on the Fund’s advisory fees and other expenses and the advisory fees and other expenses of comparable funds identified by Broadridge (the “Broadridge expense group”), (iii) information provided by MFS on the advisory fees of portfolios of other clients of MFS, including institutional separate accounts and other clients, (iv) information as to whether and to what extent applicable expense waivers, reimbursements or fee “breakpoints” are observed for the Fund, (v) information regarding MFS’ financial results and financial condition, including MFS’ and certain of its affiliates’ estimated profitability from services performed for the Fund and the MFS Funds as a whole, and compared to MFS’ institutional business, (vi) MFS’ views regarding the outlook for the mutual fund industry and the strategic business plans of MFS, (vii) descriptions of various functions performed by MFS for the Funds, such as compliance monitoring and portfolio trading practices, and (viii) information regarding the overall organization of MFS, including information about MFS’ senior management and other personnel providing investment advisory, administrative and other services to the Fund and the other MFS Funds. The comparative performance, fee and expense information prepared and provided by Broadridge was not independently verified and the independent Trustees did not independently verify any information provided to them by MFS.
The Trustees’ conclusion as to the continuation of the investment advisory agreement was based on a comprehensive consideration of all information provided to the Trustees and not the result of any single factor. Some of the factors that figured particularly in the Trustees’ deliberations are described below, although individual Trustees may have evaluated the information presented differently from one another, giving different weights to various factors. It is also important to recognize that the fee arrangements for the Fund and other MFS Funds are the result of years of review and discussion between the independent Trustees and MFS, that certain aspects of such arrangements may receive greater scrutiny in some years than in others, and that the Trustees’ conclusions may be based, in part, on their consideration of these same arrangements during the course of the year and in prior years.
Based on information provided by Broadridge and MFS, the Trustees reviewed the Fund’s total return investment performance as well as the performance of peer groups of funds over various time periods. The Trustees placed particular emphasis on the total return performance of the Fund’s Initial Class shares in comparison to the performance of funds in its Lipper performance universe over the three-year period ended December 31, 2016, which the Trustees believed was a long enough period to reflect differing market conditions. The total return performance of the Fund’s Initial Class shares was in the 2nd quintile relative to the other funds in the universe for this three-year period (the 1st quintile being the best performers and the 5th quintile being the worst performers). The total return performance of the Fund’s Initial Class shares was in the 3rd quintile for each of the one- and five-year periods ended December 31, 2016 relative to the Lipper performance universe. Because of the passage of time, these performance results may differ from the performance results for more recent periods, including those shown elsewhere in this report.
In the course of their deliberations, the Trustees took into account information provided by MFS in connection with the contract review meetings, as well as during investment review meetings conducted with portfolio management personnel during the course of the year regarding the Fund’s performance. After reviewing these and related factors, the Trustees concluded, within the context of their overall conclusions regarding the investment advisory agreement, that they were satisfied with MFS’ responses and efforts relating to investment performance.
24
MFS New Discovery Value Portfolio
Board Review of Investment Advisory Agreement – continued
In assessing the reasonableness of the Fund’s advisory fee, the Trustees considered, among other information, the Fund’s advisory fee and the total expense ratio of the Fund’s Initial Class shares as a percentage of average daily net assets and the advisory fee and total expense ratios of peer groups of funds based on information provided by Broadridge. The Trustees considered that MFS currently observes an expense limitation for the Fund, which may not be changed without the Trustees’ approval. The Trustees also considered that, according to the data provided by Broadridge (which takes into account any fee reductions or expense limitations that were in effect during the Fund’s last fiscal year), the Fund’s effective advisory fee rate and total expense ratio were each approximately at the Broadridge expense group median.
The Trustees also considered the advisory fees charged by MFS to any institutional separate accounts advised by MFS (“separate accounts”) and unaffiliated investment companies for which MFS serves as subadviser (“subadvised funds”) that have comparable investment strategies to the Fund, if any. In comparing these fees, the Trustees considered information provided by MFS as to the generally broader scope of services provided by MFS to the Fund, as well as the more extensive regulatory burdens imposed on MFS in managing the Fund, in comparison to separate accounts and subadvised funds. The Trustees also considered the higher demands placed on MFS’ investment personnel and trading infrastructure as a result of the daily cash in-flows and out-flows of the Fund in comparison to separate accounts.
The Trustees also considered whether the Fund may benefit from any economies of scale in the management of the Fund in the event of growth in assets of the Fund and/or growth in assets of the MFS Funds as a whole. They noted that the Fund’s advisory fee rate schedule is subject to a contractual breakpoint that reduces the Fund’s advisory fee rate on average daily net assets over $250 million. The Trustees also noted that MFS has agreed in writing to waive a portion of the management fees of certain MFS Funds, including the Fund, if the total combined assets of certain funds within the MFS Funds’ complex increase above agreed upon thresholds (the “group fee waiver”), enabling the Fund’s shareholders to share in the benefits from any economies of scale at the complex level. The group fee waiver is reviewed and renewed annually between the Board and MFS. The Trustees concluded that the breakpoint and the group fee waiver were sufficient to allow the Fund to benefit from economies of scale as its assets and overall complex assets grow.
The Trustees also considered information prepared by MFS relating to MFS’ costs and profits with respect to the Fund, the MFS Funds considered as a group, and other investment companies and accounts advised by MFS, as well as MFS’ methodologies used to determine and allocate its costs to the MFS Funds, the Fund and other accounts and products for purposes of estimating profitability.
After reviewing these and other factors described herein, the Trustees concluded, within the context of their overall conclusions regarding the investment advisory agreement, that the advisory fees charged to the Fund represent reasonable compensation in light of the services being provided by MFS to the Fund.
In addition, the Trustees considered MFS’ resources and related efforts to continue to retain, attract and motivate capable personnel to serve the Fund. The Trustees also considered current and developing conditions in the financial services industry, including the presence of large and well-capitalized companies which are spending, and appear to be prepared to continue to spend, substantial sums to engage personnel and to provide services to competing investment companies. In this regard, the Trustees also considered the financial resources of MFS and its ultimate parent, Sun Life Financial Inc. The Trustees also considered the advantages and possible disadvantages to the Fund of having an adviser that also serves other investment companies as well as other accounts.
The Trustees also considered the nature, quality, cost, and extent of administrative, transfer agency, and distribution services provided to the Fund by MFS and its affiliates under agreements and plans other than the investment advisory agreement, including any 12b-1 fees the Fund pays to MFS Fund Distributors, Inc., an affiliate of MFS. The Trustees also considered the nature, extent and quality of certain other services MFS performs or arranges for on the Fund’s behalf, which may include securities lending programs, directed expense payment programs, class action recovery programs, and MFS’ interaction with third-party service providers, principally custodians and sub-custodians. The Trustees concluded that the various non-advisory services provided by MFS and its affiliates on behalf of the Fund were satisfactory.
The Trustees also considered benefits to MFS from the use of the Fund’s portfolio brokerage commissions, if applicable, to pay for investment research and various other factors. Additionally, the Trustees considered so-called “fall-out benefits” to MFS such as reputational value derived from serving as investment manager to the Fund.
Based on their evaluation of factors that they deemed to be material, including those factors described above, the Board of Trustees, including the independent Trustees, concluded that the Fund’s investment advisory agreement with MFS should be continued for an additional one-year period, commencing August 1, 2017.
25
MFS New Discovery Value Portfolio
PROXY VOTING POLICIES AND INFORMATION
MFS votes proxies on behalf of the fund pursuant to proxy voting policies and procedures that are available without charge, upon request, by calling 1-800-225-2606, by visiting mfs.com/proxyvoting, or by visiting the SEC’s Web site at http://www.sec.gov.
Information regarding how the fund voted proxies relating to portfolio securities during the most recent twelve-month period ended June 30 is available by August 31 of each year without charge by visiting mfs.com/proxyvoting, or by visiting the SEC’s Web site at http://www.sec.gov.
QUARTERLY PORTFOLIO DISCLOSURE
The fund will file a complete schedule of portfolio holdings with the Securities and Exchange Commission (the Commission) for the first and third quarters of each fiscal year on Form N-Q. The fund’s Form N-Q is available on the EDGAR database on the Commission’s Internet Web site at http://www.sec.gov, and may be reviewed and copied at the:
Public Reference Room
Securities and Exchange Commission
100 F Street, NE, Room 1580
Washington, D.C. 20549
Information on the operation of the Public Reference Room may be obtained by calling the Commission at 1-800-SEC-0330. Copies of the fund’s Form N-Q also may be obtained, upon payment of a duplicating fee, by electronic request at the following e-mail address: publicinfo@sec.gov or by writing the Public Reference Section at the above address.
FURTHER INFORMATION
From time to time, MFS may post important information about the fund or the MFS funds on the MFS web site (mfs.com). This information is available at https://www.mfs.com/en-us/what-we-do/announcements.html or at mfs.com/vit3 by choosing the fund’s name.
INFORMATION ABOUT FUND CONTRACTS AND LEGAL CLAIMS
The fund has entered into contractual arrangements with an investment adviser, administrator, distributor, shareholder servicing agent, 529 program manager (if applicable), and custodian who each provide services to the fund. Unless expressly stated otherwise, shareholders are not parties to, or intended beneficiaries of these contractual arrangements, and these contractual arrangements are not intended to create any shareholder right to enforce them against the service providers or to seek any remedy under them against the service providers, either directly or on behalf of the fund.
Under the Trust’s By-Laws and Declaration of Trust, any claims asserted against or on behalf of the MFS Funds, including claims against Trustees and Officers, must be brought in state and federal courts located within the Commonwealth of Massachusetts.
FEDERAL TAX INFORMATION (unaudited)
The following information is provided pursuant to provisions of the Internal Revenue Code.
The fund designates $4,814,000 as capital gain dividends paid during the fiscal year.
For corporate shareholders, 37.49% of the ordinary income dividends paid during the fiscal year qualify for the corporate dividends received deduction.
26
rev. 3/16
| | | | |
| FACTS | | WHAT DOES MFS DO WITH YOUR
PERSONAL INFORMATION? | |  |
| | |
| Why? | | Financial companies choose how they share your personal information. Federal law gives consumers the right to limit some but not all sharing. Federal law also requires us to tell you how we collect, share, and protect your personal information. Please read this notice carefully to understand what we do. |
| | |
| What? | | The types of personal information we collect and share depend on the product or service you have with us. This information can include: • Social Security number and account balances • Account transactions and transaction history • Checking account information and wire transfer instructions When you are no longer our customer, we continue to share your information as described in this notice. |
| | |
| How? | | All financial companies need to share customers’ personal information to run their everyday business. In the section below, we list the reasons financial companies can share their customers’ personal information; the reasons MFS chooses to share; and whether you can limit this sharing. |
| | | | |
Reasons we can share your
personal information | | Does MFS share? | | Can you limit this
sharing? |
For our everyday business purposes – such as to process your transactions, maintain your account(s), respond to court orders and legal investigations, or report to credit bureaus | | Yes | | No |
For our marketing purposes – to offer our products and services to you | | No | | We don’t share |
| For joint marketing with other financial companies | | No | | We don’t share |
For our affiliates’ everyday business purposes – information about your transactions and experiences | | No | | We don’t share |
For our affiliates’ everyday business purposes – information about your creditworthiness | | No | | We don’t share |
| For nonaffiliates to market to you | | No | | We don’t share |
| | |
| Questions? | | Call 800-225-2606 or go to mfs.com. |
27
| | |
| Who we are |
| Who is providing this notice? | | MFS Funds, MFS Investment Management, MFS Institutional Advisors, Inc., and MFS Heritage Trust Company. |
| | |
| What we do |
| How does MFS protect my personal information? | | To protect your personal information from unauthorized access and use, we use security measures that comply with federal law. These measures include procedural, electronic, and physical safeguards for the protection of the personal information we collect about you. |
How does MFS
collect my personal information? | | We collect your personal information, for example, when you • open an account or provide account information • direct us to buy securities or direct us to sell your securities • make a wire transfer We also collect your personal information from others, such as credit bureaus, affiliates, or other companies. |
| Why can’t I limit all sharing? | | Federal law gives you the right to limit only • sharing for affiliates’ everyday business purposes – information about your creditworthiness • affiliates from using your information to market to you • sharing for nonaffiliates to market to you State laws and individual companies may give you additional rights to limit sharing. |
| | |
| Definitions |
| Affiliates | | Companies related by common ownership or control. They can be financial and nonfinancial companies. • MFS does not share personal information with affiliates, except for everyday business purposes as described on page one of this notice. |
| Nonaffiliates | | Companies not related by common ownership or control. They can be financial and nonfinancial companies. • MFS does not share with nonaffiliates so they can market to you. |
| Joint marketing | | A formal agreement between nonaffiliated financial companies that together market financial products or services to you. • MFS doesn’t jointly market. |
| | |
| Other important information |
| If you own an MFS product or receive an MFS service in the name of a third party such as a bank or broker-dealer, their privacy policy may apply to you instead of ours. |
28
The Registrant has adopted a Code of Ethics (the “Code”) pursuant to Section 406 of the Sarbanes-Oxley Act and as defined in Form N-CSR that applies to the Registrant’s principal executive officer and principal financial and accounting officer. Effective January 1, 2017, the Code was amended to (i) clarify that the term “for profit” company as used in Section II.B of the Code excludes the investment adviser and its subsidiaries and pooled investment vehicles sponsored by the investment adviser or its subsidiaries, (ii) align the Code’s provisions regarding receipt of gifts and entertainment in Section II.B of the Code with the gifts and entertainment policy of the Funds’ investment adviser, and (iii) make other administrative changes. During the period covered by the report, the Registrant has not granted a waiver, including an implicit waiver, from any provision of the Code.
A copy of the Code effective as of January 1, 2017 is filed as an exhibit to this Form N-CSR.
| ITEM 3. | AUDIT COMMITTEE FINANCIAL EXPERT. |
Messrs. Steven E. Buller, and Clarence Otis, Jr. and Ms. Maryanne L. Roepke, members of the Audit Committee, have been determined by the Board of Trustees in their reasonable business judgment to meet the definition of “audit committee financial expert” as such term is defined in Form N-CSR. In addition, Messrs. Buller and Otis and Ms. Roepke are “independent” members of the Audit Committee (as such term has been defined by the Securities and Exchange Commission in regulations implementing Section 407 of the Sarbanes-Oxley Act of 2002). The Securities and Exchange Commission has stated that the designation of a person as an audit committee financial expert pursuant to this Item 3 on the Form N-CSR does not impose on such a person any duties, obligations or liability that are greater than the duties, obligations or liability imposed on such person as a member of the Audit Committee and the Board of Trustees in the absence of such designation or identification.
| ITEM 4. | PRINCIPAL ACCOUNTANT FEES AND SERVICES. |
Items 4(a) through 4(d) and 4(g):
The Board of Trustees has appointed Deloitte & Touche LLP (“Deloitte”) to serve as independent accountants to the Registrant (hereinafter the “Registrant” or the “Fund”). The tables below set forth the audit fees billed to the Fund as well as fees for non-audit services provided to the Fund and/or to the Fund’s investment adviser, Massachusetts Financial Services Company (“MFS”), and to various entities either controlling, controlled by, or under common control with MFS that provide ongoing services to the Fund (“MFS Related Entities”).
For the fiscal years ended December 31, 2017 and 2017, audit fees billed to the Fund by Deloitte were as follows:
| | | | | | | | |
| | | Audit Fees | |
| | | 2017 | | | 2016 | |
Fees billed by Deloitte: | | | | | | | | |
MFS Blended Research Small Cap Equity Portfolio | | | 43,618 | | | | 42,731 | |
MFS Conservative Allocation Portfolio | | | 29,683 | | | | 29,070 | |
MFS Global Real Estate Portfolio | | | 44,549 | | | | 43,644 | |
MFS Growth Allocation Portfolio | | | 29,683 | | | | 29,070 | |
MFS Inflation-Adjusted Bond Portfolio | | | 34,266 | | | | 33,563 | |
MFS Limited Maturity Portfolio | | | 54,618 | | | | 53,515 | |
MFS Mid Cap Value Portfolio | | | 44,955 | | | | 44,042 | |
MFS Moderate Allocation Portfolio | | | 29,683 | | | | 29,070 | |
MFS New Discovery Value Portfolio | | | 43,618 | | | | 42,731 | |
| | | | | | | | |
Total | | | 354,673 | | | | 347,436 | |
For the fiscal years ended December 31, 2017 and 2016, fees billed by Deloitte for audit-related, tax and other services provided to each Fund and for audit-related, tax and other services provided to MFS and MFS Related Entities were as follows:
| | | | | | | | | | | | | | | | | | | | | | | | |
| | | Audit-Related Fees1 | | | Tax Fees2 | | | All Other Fees3 | |
| | | 2017 | | | 2016 | | | 2017 | | | 2016 | | | 2017 | | | 2016 | |
Fees billed by Deloitte: | | | | | | | | | | | | | | | | | | | | | | | | |
To MFS Blended Research Small Cap Equity Portfolio | | | 2,400 | | | | 2,400 | | | | 4,878 | | | | 4,806 | | | | 0 | | | | 0 | |
To MFS Conservative Allocation Portfolio | | | 2,400 | | | | 2,400 | | | | 4,878 | | | | 4,806 | | | | 0 | | | | 0 | |
To MFS Global Real Estate Portfolio | | | 2,400 | | | | 2,400 | | | | 5,200 | | | | 5,123 | | | | 0 | | | | 0 | |
To MFS Growth Allocation Portfolio | | | 2,400 | | | | 2,400 | | | | 4,878 | | | | 4,806 | | | | 0 | | | | 0 | |
To MFS Inflation-Adjusted Bond Portfolio | | | 2,400 | | | | 2,400 | | | | 4,064 | | | | 4,004 | | | | 0 | | | | 0 | |
To MFS Limited Maturity Portfolio | | | 2,400 | | | | 2,400 | | | | 4,878 | | | | 4,806 | | | | 0 | | | | 0 | |
To MFS Mid Cap Value Portfolio | | | 2,400 | | | | 2,400 | | | | 4,878 | | | | 4,806 | | | | 0 | | | | 0 | |
To MFS Moderate Allocation Portfolio | | | 2,400 | | | | 2,400 | | | | 4,878 | | | | 4,806 | | | | 0 | | | | 0 | |
To MFS New Discovery Value Portfolio | | | 2,400 | | | | 2,400 | | | | 4,878 | | | | 4,806 | | | | 0 | | | | 0 | |
Total fees billed by Deloitte To above Funds: | | | 21,600 | | | | 21,600 | | | | 43,410 | | | | 42,769 | | | | 0 | | | | 0 | |
| | | | | | | | | | | | | | | | | | | | | | | | |
| | | Audit-Related Fees1 | | | Tax Fees2 | | | All Other Fees3 | |
| | | 2017 | | | 2016 | | | 2017 | | | 2016 | | | 2017 | | | 2016 | |
Fees billed by Deloitte: | | | | | | | | | | | | | | | | | | | | | | | | |
To MFS and MFS Related Entities of MFS Blended Research Small Cap Equity Portfolio* | | | 0 | | | | 0 | | | | 0 | | | | 0 | | | | 5,390 | | | | 5,000 | |
To MFS and MFS Related Entities of MFS Conservative Allocation Portfolio* | | | 0 | | | | 0 | | | | 0 | | | | 0 | | | | 5,390 | | | | 5,000 | |
To MFS and MFS Related Entities of MFS Global Real Estate Portfolio* | | | 0 | | | | 0 | | | | 0 | | | | 0 | | | | 5,390 | | | | 5,000 | |
To MFS and MFS Related Entities of MFS Growth Allocation Portfolio* | | | 0 | | | | 0 | | | | 0 | | | | 0 | | | | 5,390 | | | | 5,000 | |
To MFS and MFS Related Entities of MFS Inflation-Adjusted Bond Portfolio* | | | 0 | | | | 0 | | | | 0 | | | | 0 | | | | 5,390 | | | | 5,000 | |
To MFS and MFS Related Entities of MFS Limited Maturity Portfolio* | | | 0 | | | | 0 | | | | 0 | | | | 0 | | �� | | 5,390 | | | | 5,000 | |
To MFS and MFS Related Entities of MFS Mid Cap Value Portfolio* | | | 0 | | | | 0 | | | | 0 | | | | 0 | | | | 5,390 | | | | 5,000 | |
To MFS and MFS Related Entities of MFS Moderate Allocation Portfolio* | | | 0 | | | | 0 | | | | 0 | | | | 0 | | | | 5,390 | | | | 5,000 | |
To MFS and MFS Related Entities of MFS New Discovery Value Portfolio* | | | 0 | | | | 0 | | | | 0 | | | | 0 | | | | 5,390 | | | | 5,000 | |
| | | | | | | | |
| | | Aggregate fees for non-audit
services: | |
| | | 2017 | | | 2016 | |
Fees billed by Deloitte: | | | | | | | | |
To MFS Blended Research Small Cap Equity Portfolio, MFS and MFS Related Entities# | | | 811,904 | | | | 117,718 | |
To MFS Conservative Allocation Portfolio, MFS and MFS Related Entities# | | | 811,904 | | | | 117,718 | |
To MFS Global Real Estate Portfolio, MFS and MFS Related Entities# | | | 812,226 | | | | 118,035 | |
To MFS Growth Allocation Portfolio, MFS and MFS Related Entities# | | | 811,904 | | | | 117,718 | |
To MFS Inflation-Adjusted Bond Portfolio, MFS and MFS Related Entities# | | | 811,090 | | | | 116,916 | |
To MFS Limited Maturity Portfolio, MFS and MFS Related Entities# | | | 811,904 | | | | 117,718 | |
To MFS Mid Cap Value Portfolio, MFS and MFS Related Entities# | | | 811,904 | | | | 117,718 | |
To MFS Moderate Allocation Portfolio, MFS and MFS Related Entities# | | | 811,904 | | | | 117,718 | |
To MFS New Discovery Value Portfolio, MFS and MFS Related Entities# | | | 811,904 | | | | 117,718 | |
| * | This amount reflects the fees billed to MFS and MFS Related Entities for non-audit services relating directly to the operations and financial reporting of the Fund (portions of which services also related to the operations and financial reporting of other funds within the MFS Funds complex). |
| # | This amount reflects the aggregate fees billed by Deloitte for non-audit services rendered to the Fund and for non-audit services rendered to MFS and the MFS Related Entities. |
| 1 | The fees included under “Audit-Related Fees” are fees related to assurance and related services that are reasonably related to the performance of the audit or review of financial statements, but not reported under “Audit Fees,” including accounting consultations, agreed-upon procedure reports, attestation reports, comfort letters and internal control reviews. |
| 2 | The fees included under “Tax Fees” are fees associated with tax compliance, tax advice and tax planning, including services relating to the filing or amendment of federal, state or local income tax returns, regulated investment company qualification reviews and tax distribution and analysis. |
| 3 | The fees included under “All Other Fees” are fees for products and services provided by Deloitte other than those reported under “Audit Fees,” “Audit-Related Fees” and “Tax Fees”. |
Item 4(e)(1):
Set forth below are the policies and procedures established by the Audit Committee of the Board of Trustees relating to the pre-approval of audit and non-audit related services:
To the extent required by applicable law, pre-approval by the Audit Committee of the Board is needed for all audit and permissible non-audit services rendered to the Fund and all permissible non-audit services rendered to MFS or MFS Related Entities if the services relate directly to the operations and financial reporting of the Registrant. Pre-approval is currently on an engagement-by-engagement basis. In the event pre-approval of such services is necessary between regular meetings of the Audit Committee and it is not practical to wait to seek pre-approval at the next regular meeting of the Audit Committee, pre-approval of such services may be referred to the Chair of the Audit Committee for approval; provided that the Chair may not pre-approve any individual engagement for such services exceeding $50,000 or multiple engagements for such services in the aggregate exceeding $100,000 in each period between regular meetings of the Audit Committee. Any engagement pre-approved by the Chair between regular meetings of the Audit Committee shall be presented for ratification by the entire Audit Committee at its next regularly scheduled meeting.
Item 4(e)(2):
None, or 0%, of the services relating to the Audit-Related Fees, Tax Fees and All Other Fees paid by the Fund and MFS and MFS Related Entities relating directly to the operations and financial reporting of the Registrant disclosed above were approved by the audit committee pursuant to paragraphs (c)(7)(i)(C) of Rule 2-01 of Regulation S-X (which permits audit committee approval after the start of the engagement with respect to services other than audit, review or attest services, if certain conditions are satisfied).
Item 4(f):
Not applicable.
Item 4(h): The Registrant’s Audit Committee has considered whether the provision by a Registrant’s independent registered public accounting firm of non-audit services to MFS and MFS Related Entities that were not pre-approved by the Committee (because such services did not relate directly to the operations and financial reporting of the Registrant) was compatible with maintaining the independence of the independent registered public accounting firm as the Registrant’s principal auditors.
| ITEM 5. | AUDIT COMMITTEE OF LISTED REGISTRANTS. |
Not applicable to the Registrant.
| ITEM 6. | SCHEDULE OF INVESTMENTS |
A schedule of investments of the Registrant is included as part of the report to shareholders of such series under Item 1 of this Form N-CSR.
| ITEM 7. | DISCLOSURE OF PROXY VOTING POLICIES AND PROCEDURES FOR CLOSED-END MANAGEMENT INVESTMENT COMPANIES. |
Not applicable to the Registrant.
| ITEM 8. | PORTFOLIO MANAGERS OF CLOSED-END MANAGEMENT INVESTMENT COMPANIES. |
Not applicable to the Registrant.
| ITEM 9. | PURCHASES OF EQUITY SECURITIES BY CLOSED-END MANAGEMENT INVESTMENT COMPANY AND AFFILIATED PURCHASERS. |
Not applicable to the Registrant.
| ITEM 10. | SUBMISSION OF MATTERS TO A VOTE OF SECURITY HOLDERS. |
There were no material changes to the procedures by which shareholders may send recommendations to the Board for nominees to the Registrant’s Board since the Registrant last provided disclosure as to such procedures in response to the requirements of Item 407 (c)(2)(iv) of Regulation S-K or this Item.
| ITEM 11. | CONTROLS AND PROCEDURES. |
| (a) | Based upon their evaluation of the effectiveness of the registrant’s disclosure controls and procedures (as defined in Rule 30a-3(c) under the Investment Company Act of 1940 (the “Act”)) as conducted within 90 days of the filing date of this report on Form N-CSR, the registrant’s principal financial officer and principal executive officer have concluded that those disclosure controls and procedures provide reasonable assurance that the material information required to be disclosed by the registrant on this report is recorded, processed, summarized and reported within the time periods specified in the Securities and Exchange Commission’s rules and forms. |
| (b) | There were no changes in the Registrant’s internal controls over financial reporting (as defined in Rule 30a-3(d) under the Act) that occurred during the second fiscal quarter of the period covered by the report that have materially affected, or are reasonably likely to materially affect, the Registrant’s internal control over financial reporting. |
| ITEM 12. | DISCLOSURE OF SECURITIES LENDING ACTIVITIES FOR CLOSED-END MANAGEMENT INVESTMENT COMPANIES. |
Not applicable to the Registrant.
| (a) | File the exhibits listed below as part of this form. Letter or number the exhibits in the sequence indicated. |
| | (1) | Any code of ethics, or amendment thereto, that is the subject of the disclosure required by Item 2, to the extent that the registrant intends to satisfy the Item 2 requirements through filing of an exhibit: Code of Ethics attached hereto. |
| | (2) | A separate certification for each principal executive officer and principal financial officer of the registrant as required by Rule 30a-2(a) under the Act (17 CFR 270.30a-2): Attached hereto. |
| (b) | If the report is filed under Section 13(a) or 15(d) of the Exchange Act, provide the certifications required by Rule 30a-2(b) under the Act (17 CFR 270.30a-2(b)), Rule 13a-14(b) or Rule 15d-14(b) under the Exchange Act (17 CFR 240.13a-14(b) or 240.15d-14(b)) and Section 1350 of Chapter 63 of Title 18 of the United States Code (18 U.S.C. 1350) as an exhibit. A certification furnished pursuant to this paragraph will not be deemed “filed” for the purposes of Section 18 of the Exchange Act (15 U.S.C. 78r), or otherwise subject to the liability of that section. Such certification will not be deemed to be incorporated by reference into any filing under the Securities Act of 1933 or the Exchange Act, except to the extent that the registrant specifically incorporates it by reference: Attached hereto. |
Notice
Notice is hereby given that this instrument is executed on behalf of the Registrant by an officer of the Registrant as an officer and not individually and the obligations of or arising out of this instrument are not binding upon any of the Trustees or shareholders individually, but are binding only upon the assets and property of the respective constituent series of the Registrant.
SIGNATURES
Pursuant to the requirements of the Securities Exchange Act of 1934 and the Investment Company Act of 1940, the registrant has duly caused this report to be signed on its behalf by the undersigned, thereunto duly authorized.
(Registrant) MFS VARIABLE INSURANCE TRUST III
| | |
| By (Signature and Title)* | | DAVID L. DILORENZO |
| | David L. DiLorenzo, President |
Date: February 15, 2018
Pursuant to the requirements of the Securities Exchange Act of 1934 and the Investment Company Act of 1940, this report has been signed below by the following persons on behalf of the registrant and in the capacities and on the dates indicated.
| | |
| By (Signature and Title)* | | DAVID L. DILORENZO |
| | David L. DiLorenzo, President (Principal Executive Officer) |
Date: February 15, 2018
| | |
| By (Signature and Title)* | | JAMES O. YOST |
| | James O. Yost, Treasurer (Principal Financial Officer and Accounting Officer) |
Date: February 15, 2018
| * | Print name and title of each signing officer under his or her signature. |