UNITED STATES
SECURITIES AND EXCHANGE COMMISSION
Washington, D.C. 20549
FORM N-CSR
CERTIFIED SHAREHOLDER REPORT OF
REGISTERED MANAGEMENT INVESTMENT COMPANIES
Investment Company Act file number 811-08879
MFS VARIABLE INSURANCE TRUST III
(Exact name of registrant as specified in charter)
111 Huntington Avenue, Boston, Massachusetts 02199
(Address of principal executive offices) (Zip code)
Susan S. Newton
Massachusetts Financial Services Company
111 Huntington Avenue
Boston, Massachusetts 02199
(Name and address of agents for service)
Registrant’s telephone number, including area code: (617) 954-5000
Date of fiscal year end: December 31
Date of reporting period: December 31, 2014
| ITEM 1. | REPORTS TO STOCKHOLDERS. |
ANNUAL REPORT
December 31, 2014

MFS® BLENDED RESEARCH® SMALL CAP EQUITY PORTFOLIO
MFS® Variable Insurance Trust III

VSC-ANN
MFS® BLENDED RESEARCH® SMALL CAP EQUITY PORTFOLIO
CONTENTS
The report is prepared for the general information of contract owners. It is authorized for distribution to prospective investors only when preceded or accompanied by a current prospectus.
NOT FDIC INSURED Ÿ MAY LOSE VALUE Ÿ NO BANK OR CREDIT UNION GUARANTEE Ÿ NOT A DEPOSIT Ÿ NOT INSURED BY ANY FEDERAL GOVERNMENT AGENCY OR NCUA/NCUSIF
MFS Blended Research Small Cap Equity Portfolio
LETTER FROM THE CHAIRMAN

Dear Contract Owners:
As 2015 begins, sharply lower oil prices are reshaping the global economy, adding to deflationary pressures in the eurozone and exacerbating challenges faced by oil exporters such as Russia. The U.S. economy stands on firmer ground, having expanded steadily over the past year. The U.S. labor market has regained momentum, consumer confidence is buoyant and gasoline prices have tumbled, boosting prospects for a stronger economic rebound in 2015.
Other regions are struggling. The eurozone economy is barely expanding, and the European Central Bank (ECB) has introduced large-scale asset purchases.
Despite Japan’s efforts to strengthen its economy, its sales tax increase last spring tipped the country into a recession, leading to additional monetary stimulus from the Bank of Japan. China’s economy is slowing as it transitions to a more sustainable basis, and its growth rate will likely continue to decline.
As always, active risk management is integral to how we at MFS® manage your investments. We use a collaborative process, sharing insights across asset classes, regions and economic sectors. Our global investment team uses a diversified, multidisciplined, long-term approach.
Applying proven principles, such as asset allocation and diversification, can best serve investors over the long term. We are confident that this approach can help you as you work with your financial advisors to reach your goals in the years ahead.
Respectfully,

Robert J. Manning
Chairman
MFS Investment Management
February 13, 2015
The opinions expressed in this letter are subject to change and may not be relied upon for investment advice. No forecasts can be guaranteed.
1
MFS Blended Research Small Cap Equity Portfolio
PORTFOLIO COMPOSITION
Portfolio structure

| | | | |
| Top ten holdings | | | | |
| SS&C Technologies Holdings, Inc. | | | 1.7% | |
| OraSure Technologies, Inc. | | | 1.7% | |
| Office Depot, Inc. | | | 1.5% | |
| PrivateBancorp, Inc. | | | 1.5% | |
| Burlington Stores, Inc. | | | 1.5% | |
| MiMedx Group, Inc. | | | 1.4% | |
| PTC, Inc. | | | 1.4% | |
| Carriage Services, Inc. | | | 1.4% | |
| Medical Properties Trust, Inc., REIT | | | 1.4% | |
| Aspen Technology, Inc. | | | 1.3% | |
| | | | |
| Equity sectors | | | | |
| Financial Services | | | 20.6% | |
| Technology | | | 18.6% | |
| Health Care | | | 13.8% | |
| Industrial Goods & Services | | | 7.3% | |
| Special Products & Services | | | 7.3% | |
| Retailing | | | 5.7% | |
| Basic Materials | | | 5.5% | |
| Energy | | | 4.5% | |
| Utilities & Communications | | | 4.4% | |
| Leisure | | | 3.3% | |
| Autos & Housing | | | 3.3% | |
| Consumer Staples | | | 2.4% | |
| Transportation | | | 2.4% | |
Cash & Other can include cash, other assets less liabilities, offsets to derivative positions, and short-term securities.
Percentages are based on net assets as of 12/31/14.
The portfolio is actively managed and current holdings may be different.
2
MFS Blended Research Small Cap Equity Portfolio
MANAGEMENT REVIEW
Summary of Results
For the twelve months ended December 31, 2014, Initial Class shares of the MFS Blended Research Small Cap Equity Portfolio (“fund”) provided a total return of 7.29%, while Service Class shares of the fund provided a total return of 7.04%. These compare with a return of 4.89% over the same period for the fund’s benchmark, the Russell 2000 Index.
Market Environment
Early in the period, US equities suffered what proved to be a temporary setback due to concerns over emerging markets as well as what was perceived at the time to be a pause in US economic growth, partially caused by extreme weather events and a weak December 2013 labor market report. Markets soon recovered as the economic pause concluded and investors appeared to have become increasingly comfortable that newly-installed US Federal Reserve (“Fed”) Chair Janet Yellen would not make any substantial changes to the trajectory of Fed monetary policy.
A generally risk-friendly, carry trade environment persisted from February 2014 until mid-year. While geopolitical tensions flared in the Middle East and Russia/Ukraine, any market setbacks were short-lived as improving economic growth in the US, coupled with prospects for easier monetary policy in regions with slowing growth, such as Japan, Europe and China, supported risk assets. For example, the European Central Bank (“ECB”) cut policy interest rates into negative territory and, by the end of the period, expectations were for additional rate cuts and the announcement for non-conventional easing measures. Similarly, the Bank of Japan surprised markets late in the period with fresh stimulus measures given lackluster growth trends. The related decline in developed market government bond yields and credit spreads were also supportive for equity markets. At the end of the period, the US equity market was trading close to all-time highs and US Treasury yields were close to their lows for the period. However, credit markets did not fare as well in the second half of 2014, particularly US high yield and emerging market debt. The higher weightings of oil and gas credits in these asset classes resulted in widening spreads and increased volatility as oil prices began to decline in an accelerated fashion in the fourth quarter.
Contributors to Performance
Strong stock selection in the health care sector contributed to performance relative to the Russell 2000 Index. Within this sector, overweight positions in medical device manufacturers, Mimedx Group, Orasure Technologies, Nxstage Medical, Volcano and Dexcom (h), and in program and services provider for under-insured individuals Centene, boosted relative returns. Shares of Mimedx Group surged towards the end of the period on the back of strong results driven primarily by better-than-expected revenue growth. The share price of Orasure Technologies rose during the period as a result of higher sales of its infectious disease testing products.
Stock selection within the energy sector also aided relative results, led by an overweight position in independent exploration and production company Athlon Energy (h). Shares of Athlon Energy appreciated following the acquisition by Canadian natural gas company Encana.
Strong stock selection also provided a boost to relative performance in the telecommunication services sector. However, there were no individual stocks within this sector that were among the fund’s top relative contributors.
Elsewhere, overweight positions in poultry products manufacturer Pilgrim’s Pride, urban fashion apparel retailer Burlington Stores and semiconductor image sensor device developer Omnivision Technologies (h) boosted relative returns. Shares of Pilgrim’s Pride benefited from a favorable operating environment, driven primarily by strong chicken demand, limited supply growth, high prices of competitive protein products and falling feed costs.
Detractors from Performance
Weak stock selection within the information technology sector detracted from relative performance. Within this sector, overweight positions in data and information management software provider CommVault Systems, online business ratings and reviews provider Yelp and software solutions provider Fleetmatics Group held back relative returns. Shares of CommVault Systems plummeted as the company reported poor earnings results and increased expenses during the second half of the year. The company witnessed the slowest growth rate in their software business in the past thirteen quarters.
Elsewhere, other top relative detractors for the period included the fund’s overweight positions in education services company ITT Educational Services (h), oil & gas services provider Basic Energy Services, skin health company PhotoMedex (h), technology workflow management solutions provider Performant Financial, premium audio and consumer accessory manufacturer VOXX International and independent oil & gas company Clayton Williams Energy. Shares of ITT Educational Services declined during the period reflecting weaker trends in new student enrollment and potential regulatory issues brought forward by the Security and Exchange Commission (SEC). In addition, the Department of Education introduced sanctions against ITT Educational Services as the company did not submit
3
MFS Blended Research Small Cap Equity Portfolio
Management Review – continued
2013 audited financials within the deadline date which further pressured the stock. The share price of Basic Energy Services weakened in the second half of the year as a result of reduced spending by oil companies that scaled back their activities due to less attractive oil prices. Not holding strong-performing biotechnology company Intermune also hurt relative performance.
Respectfully,
Matthew Krummell
Portfolio Manager
| (h) | Security was not held in the portfolio at period end. |
The views expressed in this report are those of the portfolio manager only through the end of the period of the report as stated on the cover and do not necessarily reflect the views of MFS or any other person in the MFS organization. These views are subject to change at any time based on market or other conditions, and MFS disclaims any responsibility to update such views. These views may not be relied upon as investment advice or an indication of trading intent on behalf of any MFS portfolio. References to specific securities are not recommendations of such securities, and may not be representative of any MFS portfolio’s current or future investments.
4
MFS Blended Research Small Cap Equity Portfolio
PERFORMANCE SUMMARY THROUGH 12/31/14
The following chart illustrates the historical performance of the fund in comparison to its benchmark(s). Benchmarks are unmanaged and may not be invested in directly. Benchmark returns do not reflect any fees or expenses. The performance of other share classes will be greater than or less than that of the class depicted below. (See Notes to Performance Summary.)
Performance data shown represents past performance and is no guarantee of future results. Investment return and principal value fluctuate so your units, when sold, may be worth more or less than the original cost; current performance may be lower or higher than quoted. The performance shown does not reflect the deduction of taxes, if any, that a contract holder would pay on fund distributions or the redemption of contract units. The returns for the fund shown also do not reflect the deduction of expenses associated with variable products, such as mortality and expense risk charges, separate account charges, and sales charges imposed by the insurance company separate accounts. Such expenses would reduce the overall returns shown.
Growth of a Hypothetical $10,000 Investment
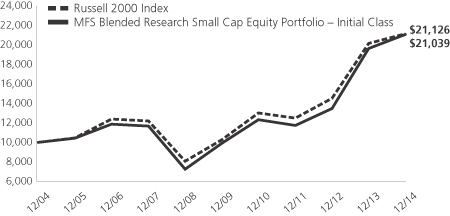
Total Returns through 12/31/14
Average annual total returns
| | | | | | | | | | | | | | |
| | | Share Class | | Class inception date | | 1-yr | | 5-yr | | 10-yr | | Life (t) | | |
| | | Initial Class | | 7/17/00 | | 7.29% | | 16.26% | | 7.72% | | N/A | | |
| | | Service Class | | 5/01/06 | | 7.04% | | 15.95% | | N/A | | 6.59% | | |
| | | | | |
| Comparative benchmark | | | | | | | | | | |
| | | Russell 2000 Index (f) | | 4.89% | | 15.55% | | 7.77% | | N/A | | |
| (f) | Source: FactSet Research Systems Inc. |
| (t) | For the period from the class inception date through the stated period end (for those share classes with less than 10 years of performance history). No comparative benchmark performance information is provided for “life” periods. (See Notes to Performance Summary.) |
Benchmark Definition
Russell 2000 Index – constructed to provide a comprehensive barometer for securities in the small-cap segment of the U.S. equity universe. The index includes 2,000 of the smallest U.S. companies based on total market capitalization, representing approximately 10% of the investable U.S. equity market.
It is not possible to invest directly in an index.
Notes to Performance Summary
Average annual total return represents the average annual change in value for each share class for the periods presented. Life returns are presented where the share class has less than 10 years of performance history and represent the average annual total return from the class inception date to the stated period end date. As the fund’s share classes may have different inception dates, the life returns may represent different time periods and may not be comparable. As a result, no comparative benchmark performance information is provided for life periods.
Performance results reflect any applicable expense subsidies and waivers in effect during the periods shown. Without such subsidies and waivers the fund’s performance results would be less favorable. Please see the prospectus and financial statements for complete details. All results are historical and assume the reinvestment of any dividends and capital gains distributions.
5
MFS Blended Research Small Cap Equity Portfolio
Performance Summary – continued
Performance prior to close of business December 7, 2012, reflects time periods when another adviser or subadviser was responsible for selecting investments for the fund under a different investment objective and different investment strategies.
Performance results do not include adjustments made for financial reporting purposes in accordance with U.S. generally accepted accounting principles and may differ from amounts reported in the financial highlights.
From time to time the fund may receive proceeds from litigation settlements, without which performance would be lower.
6
MFS Blended Research Small Cap Equity Portfolio
EXPENSE TABLE
Fund Expenses Borne by the Contract Holders During the Period,
July 1, 2014 through December 31, 2014
As a contract holder of the fund, you incur ongoing costs, including management fees; distribution and/or service (12b-1) fees; and other fund expenses. This example is intended to help you understand your ongoing costs (in dollars) of investing in the fund and to compare these costs with the ongoing costs of investing in other mutual funds.
The example is based on an investment of $1,000 invested at the beginning of the period and held for the entire period July 1, 2014 through December 31, 2014.
Actual Expenses
The first line for each share class in the following table provides information about actual account values and actual expenses. You may use the information in this line, together with the amount you invested, to estimate the expenses that you paid over the period. Simply divide your account value by $1,000 (for example, an $8,600 account value divided by $1,000 = 8.6), then multiply the result by the number in the first line under the heading entitled “Expenses Paid During Period” to estimate the expenses you paid on your account during this period.
Hypothetical Example for Comparison Purposes
The second line for each share class in the following table provides information about hypothetical account values and hypothetical expenses based on the fund’s actual expense ratio and an assumed rate of return of 5% per year before expenses, which is not the fund’s actual return. The hypothetical account values and expenses may not be used to estimate the actual ending account balance or expenses you paid for the period. You may use this information to compare the ongoing costs of investing in the fund and other funds. To do so, compare this 5% hypothetical example with the 5% hypothetical examples that appear in the shareholder reports of the other funds.
Please note that the expenses shown in the table are meant to highlight the fund’s ongoing costs only and do not take into account the fees and expenses imposed under the variable contracts through which your investment in the fund is made. Therefore, the second line for each share class in the table is useful in comparing ongoing costs associated with an investment in vehicles (such as the fund) which fund benefits under variable annuity and variable life insurance contracts and to qualified pension and retirement plans only, and will not help you determine the relative total costs of investing in the fund through variable annuity and variable life insurance contracts. If the fees and expenses imposed under the variable contracts were included, your costs would have been higher.
| | | | | | | | | | | | | | | | | | |
| Share Class | | | | Annualized
Expense Ratio | | | Beginning
Account Value
7/01/14 | | | Ending
Account Value
12/31/14 | | | Expenses Paid
During Period (p)
7/01/14-12/31/14 | |
| Initial Class | | Actual | | | 0.47% | | | | $1,000.00 | | | | $1,012.39 | | | | $2.38 | |
| | Hypothetical (h) | | | 0.47% | | | | $1,000.00 | | | | $1,022.84 | | | | $2.40 | |
| Service Class | | Actual | | | 0.72% | | | | $1,000.00 | | | | $1,010.73 | | | | $3.65 | |
| | Hypothetical (h) | | | 0.72% | | | | $1,000.00 | | | | $1,021.58 | | | | $3.67 | |
| (h) | 5% class return per year before expenses. |
| (p) | “Expenses Paid During Period” are equal to each class’s annualized expense ratio, as shown above, multiplied by the average account value over the period, multiplied by 184/365 (to reflect the one-half year period). |
7
MFS Blended Research Small Cap Equity Portfolio
PORTFOLIO OF INVESTMENTS – 12/31/14
The Portfolio of Investments is a complete list of all securities owned by your fund. It is categorized by broad-based asset classes.
| | | | | | | | |
| Issuer | | Shares/Par | | | Value ($) | |
| | | | | | | | |
| COMMON STOCKS – 99.1% | | | | | |
| Aerospace – 1.6% | | | | | |
| AAR Corp. | | | 19,278 | | | $ | 535,542 | |
| Ducommun, Inc. (a) | | | 27,443 | | | | 693,759 | |
| Engility Holdings, Inc. (a) | | | 23,111 | | | | 989,151 | |
| | | | | | | | |
| | | $ | 2,218,452 | |
| | | | | | | | |
| Airlines – 0.6% | | | | | |
| Republic Airways Holdings, Inc. (a) | | | 54,942 | | | $ | 801,604 | |
| | | | | | | | |
| Automotive – 0.4% | | | | | |
| Meritor, Inc. (a) | | | 32,003 | | | $ | 484,845 | |
| | | | | | | | |
| Biotechnology – 3.6% | | | | | |
| Affymetrix, Inc. (a) | | | 112,826 | | | $ | 1,113,593 | |
| Emergent BioSolutions, Inc. (a) | | | 3,766 | | | | 102,548 | |
| Epizyme, Inc. (a) | | | 20,103 | | | | 379,344 | |
| Foundation Medicine, Inc. (a)(l) | | | 62,254 | | | | 1,383,284 | |
| MiMedx Group, Inc. (a) | | | 169,778 | | | | 1,957,540 | |
| | | | | | | | |
| | | $ | 4,936,309 | |
| | | | | | | | |
| Brokerage & Asset Managers – 0.1% | | | | | |
| Investment Technology Group, Inc. (a) | | | 4,089 | | | $ | 85,133 | |
| | | | | | | | |
| Business Services – 4.9% | | | | | |
| Forrester Research, Inc. | | | 44,299 | | | $ | 1,743,609 | |
| Jones Lang LaSalle, Inc. | | | 7,118 | | | | 1,067,202 | |
| Performant Financial Corp. (a) | | | 158,243 | | | | 1,052,316 | |
| RE/MAX Holdings, Inc., “A” | | | 30,638 | | | | 1,049,352 | |
| Resources Connection, Inc. | | | 108,585 | | | | 1,786,223 | |
| | | | | | | | |
| | | $ | 6,698,702 | |
| | | | | | | | |
| Computer Software – 4.6% | | | | | |
| Aspen Technology, Inc. (a) | | | 52,173 | | | $ | 1,827,098 | |
| CommVault Systems, Inc. (a) | | | 34,947 | | | | 1,806,410 | |
| PTC, Inc. (a) | | | 52,600 | | | | 1,927,790 | |
| SolarWinds, Inc. (a) | | | 12,675 | | | | 631,595 | |
| | | | | | | | |
| | | $ | 6,192,893 | |
| | | | | | | | |
| Computer Software – Systems – 5.8% | | | | | |
| Cvent, Inc. (a) | | | 21,312 | | | $ | 593,326 | |
| Fleetmatics Group PLC (a) | | | 47,825 | | | | 1,697,309 | |
| Ingram Micro, Inc., “A” (a) | | | 53,232 | | | | 1,471,332 | |
| Insight Enterprises, Inc. (a) | | | 31,591 | | | | 817,891 | |
| NCR Corp. (a) | | | 2,842 | | | | 82,816 | |
| Premiere Global Services, Inc. (a) | | | 58,191 | | | | 617,988 | |
| SS&C Technologies Holdings, Inc. | | | 39,088 | | | | 2,286,257 | |
| Vantiv, Inc., “A” (a) | | | 9,577 | | | | 324,852 | |
| | | | | | | | |
| | | $ | 7,891,771 | |
| | | | | | | | |
| Construction – 2.9% | | | | | |
| Eagle Materials, Inc. | | | 12,510 | | | $ | 951,135 | |
| Lennox International, Inc. | | | 17,207 | | | | 1,635,869 | |
| Patrick Industries, Inc. (a) | | | 16,517 | | | | 726,418 | |
| Pool Corp. | | | 10,122 | | | | 642,140 | |
| | | | | | | | |
| | | $ | 3,955,562 | |
| | | | | | | | |
| | | | | | | | |
| Issuer | | Shares/Par | | | Value ($) | |
| | | | | | | | |
| COMMON STOCKS – continued | | | | | |
| Consumer Products – 0.1% | | | | | |
| USANA Health Sciences, Inc. (a) | | | 759 | | | $ | 77,866 | |
| | | | | | | | |
| Consumer Services – 2.3% | | | | | |
| Carriage Services, Inc. | | | 91,493 | | | $ | 1,916,778 | |
| Grand Canyon Education, Inc. (a) | | | 26,638 | | | | 1,242,929 | |
| | | | | | | | |
| | | | | | $ | 3,159,707 | |
| | | | | | | | |
| Containers – 0.3% | | | | | |
| Graphic Packaging Holding Co. (a) | | | 26,515 | | | $ | 361,134 | |
| | | | | | | | |
| Electrical Equipment – 0.2% | | | | | |
| WESCO International, Inc. (a) | | | 4,359 | | | $ | 332,199 | |
| | | | | | | | |
| Electronics – 3.5% | | | | | |
| Amkor Technology, Inc. (a) | | | 23,830 | | | $ | 169,193 | |
| Jabil Circuit, Inc. | | | 46,500 | | | | 1,015,095 | |
| MaxLinear, Inc., “A” (a) | | | 96,033 | | | | 711,605 | |
| Photronics, Inc. (a) | | | 24,083 | | | | 200,130 | |
| Sanmina Corp. (a) | | | 40,445 | | | | 951,671 | |
| Silicon Laboratories, Inc. (a) | | | 29,130 | | | | 1,387,171 | |
| Vishay Intertechnology, Inc. | | | 18,316 | | | | 259,171 | |
| | | | | | | | |
| | | | | | $ | 4,694,036 | |
| | | | | | | | |
| Energy – Independent – 2.8% | | | | | |
| Alon USA Energy, Inc. | | | 45,916 | | | $ | 581,756 | |
| Clayton Williams Energy, Inc. (a) | | | 13,522 | | | | 862,704 | |
| Delek U.S. Holdings, Inc. | | | 27,210 | | | | 742,289 | |
| PBF Energy, Inc., “A” | | | 26,242 | | | | 699,087 | |
| Western Refining Co. LP | | | 22,506 | | | | 850,277 | |
| | | | | | | | |
| | | | | | $ | 3,736,113 | |
| | | | | | | | |
| Entertainment – 0.1% | | | | | |
| Cinemark Holdings, Inc. | | | 3,795 | | | $ | 135,026 | |
| | | | | | | | |
| Food & Beverages – 2.4% | | | | | |
| Diamond Foods, Inc. (a) | | | 890 | | | $ | 25,125 | |
| Pilgrim’s Pride Corp. (a) | | | 31,913 | | | | 1,046,427 | |
| Pinnacle Foods, Inc. | | | 38,583 | | | | 1,361,980 | |
| Sanderson Farms, Inc. | | | 9,000 | | | | 756,225 | |
| | | | | | | | |
| | | | | | $ | 3,189,757 | |
| | | | | | | | |
| Food & Drug Stores – 0.7% | | | | | |
| SUPERVALU, Inc. (a) | | | 92,174 | | | $ | 894,088 | |
| | | | | | | | |
| Forest & Paper Products – 0.1% | | | | | |
| Domtar Corp. | | | 2,933 | | | $ | 117,965 | |
| | | | | | | | |
| Gaming & Lodging – 1.1% | | | | | |
| Global Cash Access Holdings, Inc. (a) | | | 98,477 | | | $ | 704,111 | |
| Isle of Capri Casinos, Inc. (a) | | | 93,500 | | | | 782,595 | |
| | | | | | | | |
| | | | | | $ | 1,486,706 | |
| | | | | | | | |
| Health Maintenance Organizations – 1.0% | | | | | |
| Centene Corp. (a) | | | 9,908 | | | $ | 1,028,946 | |
| Health Net, Inc. (a) | | | 3,155 | | | | 168,887 | |
| Molina Healthcare, Inc. (a) | | | 3,244 | | | | 173,651 | |
| | | | | | | | |
| | | | | | $ | 1,371,484 | |
| | | | | | | | |
8
MFS Blended Research Small Cap Equity Portfolio
Portfolio of Investments – continued
| | | | | | | | |
| Issuer | | Shares/Par | | | Value ($) | |
| | | | | | | | |
| COMMON STOCKS – continued | | | | | |
| Insurance – 5.1% | | | | | |
| Assurant, Inc. | | | 19,480 | | | $ | 1,333,016 | |
| Hanover Insurance Group, Inc. | | | 1,698 | | | | 121,101 | |
| HCI Group, Inc. | | | 20,828 | | | | 900,603 | |
| Maiden Holdings Ltd. | | | 6,904 | | | | 88,302 | |
| Safety Insurance Group, Inc. | | | 13,391 | | | | 857,158 | |
| Symetra Financial Corp. | | | 78,261 | | | | 1,803,916 | |
| Third Point Reinsurance Ltd. (a) | | | 43,020 | | | | 623,360 | |
| Validus Holdings Ltd. | | | 27,886 | | | | 1,158,942 | |
| | | | | | | | |
| | | $ | 6,886,398 | |
| | | | | | | | |
| Internet – 3.6% | | | | | |
| AVG Technologies N.V. (a) | | | 21,889 | | | $ | 432,089 | |
| Dice Holdings, Inc. (a) | | | 10,227 | | | | 102,372 | |
| Shutterfly, Inc. (a) | | | 35,180 | | | | 1,466,830 | |
| Shutterstock, Inc. (a) | | | 24,295 | | | | 1,678,785 | |
| Yelp, Inc. (a) | | | 23,036 | | | | 1,260,760 | |
| | | | | | | | |
| | | $ | 4,940,836 | |
| | | | | | | | |
| Leisure & Toys – 0.6% | | | | | |
| Brunswick Corp. | | | 2,045 | | | $ | 104,827 | |
| Malibu Boats, Inc., “A” (a) | | | 34,667 | | | | 668,033 | |
| | | | | | | | |
| | | $ | 772,860 | |
| | | | | | | | |
| Machinery & Tools – 5.4% | | | | | |
| Allison Transmission Holdings, Inc. | | | 38,069 | | | $ | 1,290,539 | |
| Columbus McKinnon Corp. | | | 60,693 | | | | 1,701,832 | |
| Herman Miller, Inc. | | | 43,671 | | | | 1,285,238 | |
| IPG Photonics Corp. (a) | | | 22,360 | | | | 1,675,211 | |
| Kadant, Inc. | | | 3,510 | | | | 149,842 | |
| Park-Ohio Holdings Corp. | | | 14,212 | | | | 895,782 | |
| SPX Corp. | | | 3,826 | | | | 328,730 | |
| | | | | | | | |
| | | $ | 7,327,174 | |
| | | | | | | | |
| Medical & Health Technology & Services – 0.6% | |
| Kindred Healthcare, Inc. | | | 45,732 | | | $ | 831,408 | |
| | | | | | | | |
| Medical Equipment – 7.6% | | | | | |
| Analogic Corp. | | | 4,662 | | | $ | 394,452 | |
| AngioDynamics, Inc. (a) | | | 34,687 | | | | 659,400 | |
| AtriCure, Inc. (a) | | | 80,064 | | | | 1,598,077 | |
| GenMark Diagnostics, Inc. (a) | | | 33,826 | | | | 460,372 | |
| Heartware International, Inc. (a) | | | 4,174 | | | | 306,497 | |
| Masimo Corp. (a) | | | 12,998 | | | | 342,367 | |
| NxStage Medical, Inc. (a) | | | 87,755 | | | | 1,573,447 | |
| OraSure Technologies, Inc. (a) | | | 222,473 | | | | 2,255,876 | |
| Orthofix International N.V. (a) | | | 24,170 | | | | 726,550 | |
| STERIS Corp. | | | 5,296 | | | | 343,446 | |
| Symmetry Surgical, Inc. (a) | | | 10,360 | | | | 80,704 | |
| Volcano Corp. (a) | | | 84,613 | | | | 1,512,880 | |
| | | | | | | | |
| | | $ | 10,254,068 | |
| | | | | | | | |
| Metals & Mining – 2.1% | | | | | |
| AK Steel Holding Corp. (a) | | | 89,368 | | | $ | 530,846 | |
| Century Aluminum Co. (a) | | | 29,044 | | | | 708,674 | |
| Olympic Steel, Inc. | | | 22,698 | | | | 403,570 | |
| U.S. Silica Holdings, Inc. | | | 27,128 | | | | 696,918 | |
| United States Steel Corp. | | | 20,768 | | | | 555,336 | |
| | | | | | | | |
| | | $ | 2,895,344 | |
| | | | | | | | |
| | | | | | | | |
| Issuer | | Shares/Par | | | Value ($) | |
| | | | | | | | |
| COMMON STOCKS – continued | | | | | |
| Natural Gas – Distribution – 0.1% | | | | | |
| Atmos Energy Corp. | | | 2,740 | | | $ | 152,728 | |
| | | | | | | | |
| Network & Telecom – 1.1% | | | | | |
| Emulex Corp. (a) | | | 128,691 | | | $ | 729,678 | |
| Voxx International Corp. (a) | | | 83,773 | | | | 733,851 | |
| | | | | | | | |
| | | $ | 1,463,529 | |
| | | | | | | | |
| Oil Services – 1.7% | | | | | |
| Basic Energy Services, Inc. (a) | | | 139,763 | | | $ | 979,739 | |
| Furmanite Corp. (a) | | | 28,500 | | | | 222,870 | |
| Oil States International, Inc. (a) | | | 5,782 | | | | 282,740 | |
| Superior Energy Services, Inc. | | | 18,102 | | | | 364,755 | |
| Willbros Group, Inc. (a) | | | 82,310 | | | | 516,084 | |
| | | | | | | | |
| | | $ | 2,366,188 | |
| | | | | | | | |
| Other Banks & Diversified Financials – 8.0% | | | | | |
| BancorpSouth, Inc. | | | 73,178 | | | $ | 1,647,237 | |
| Berkshire Hills Bancorp, Inc. | | | 13,406 | | | | 357,404 | |
| East West Bancorp, Inc. | | | 10,761 | | | | 416,558 | |
| First Interstate BancSystem, Inc. | | | 58,239 | | | | 1,620,209 | |
| Metro Bancorp, Inc. (a) | | | 16,507 | | | | 427,861 | |
| Nationstar Mortgage Holdings, Inc. (a) | | | 18,379 | | | | 518,104 | |
| Nelnet, Inc., “A” | | | 17,748 | | | | 822,265 | |
| Ocwen Financial Corp. (a) | | | 5,667 | | | | 85,572 | |
| PacWest Bancorp | | | 20,011 | | | | 909,700 | |
| Popular, Inc. (a) | | | 22,348 | | | | 760,949 | |
| PrivateBancorp, Inc. | | | 62,170 | | | | 2,076,478 | |
| Western Alliance Bancorp. (a) | | | 15,065 | | | | 418,807 | |
| World Acceptance Corp. (a) | | | 9,947 | | | | 790,289 | |
| | | | | | | | |
| | | $ | 10,851,433 | |
| | | | | | | | |
| Pharmaceuticals – 0.9% | | | | | |
| Alere, Inc. (a) | | | 6,016 | | | $ | 228,608 | |
| Impax Laboratories, Inc. (a) | | | 8,847 | | | | 280,273 | |
| Receptos, Inc. (a) | | | 6,331 | | | | 775,611 | |
| | | | | | | | |
| | | $ | 1,284,492 | |
| | | | | | | | |
| Printing & Publishing – 1.1% | | | | | |
| Quad/Graphics, Inc. | | | 34,886 | | | $ | 800,983 | |
| R.R. Donnelley & Sons Co. | | | 41,333 | | | | 694,601 | |
| | | | | | | | |
| | | $ | 1,495,584 | |
| | | | | | | | |
| Railroad & Shipping – 0.2% | | | | | |
| Safe Bulkers, Inc. | | | 85,860 | | | $ | 335,713 | |
| | | | | | | | |
| Real Estate – 7.5% | | | | | |
| Ashford Hospitality Prime, REIT | | | 10,827 | | | $ | 185,791 | |
| Ashford Hospitality Trust, REIT | | | 67,885 | | | | 711,435 | |
| Corporate Office Properties Trust, REIT | | | 11,800 | | | | 334,766 | |
| Gramercy Property Trust, Inc., REIT | | | 76,757 | | | | 529,623 | |
| Hilltop Holdings, Inc. (a) | | | 31,484 | | | | 628,106 | |
| Home Properties, Inc., REIT | | | 15,318 | | | | 1,004,861 | |
| Hospitality Properties Trust | | | 6,801 | | | | 210,831 | |
| Medical Properties Trust, Inc., REIT | | | 136,440 | | | | 1,880,143 | |
| Mid-America Apartment Communities, Inc., REIT | | | 14,521 | | | | 1,084,428 | |
| Potlatch Corp., REIT | | | 24,431 | | | | 1,022,926 | |
9
MFS Blended Research Small Cap Equity Portfolio
Portfolio of Investments – continued
| | | | | | | | |
| Issuer | | Shares/Par | | | Value ($) | |
| | | | | | | | |
| COMMON STOCKS – continued | | | | | |
| Real Estate – continued | | | | | |
| Resource Capital Corp., REIT | | | 27,629 | | | $ | 139,250 | |
| RLJ Lodging Trust, REIT | | | 32,350 | | | | 1,084,696 | |
| Ryman Hospitality Properties, Inc., REIT | | | 6,555 | | | | 345,711 | |
| Tanger Factory Outlet Centers, Inc., REIT | | | 26,180 | | | | 967,613 | |
| | | | | | | | |
| | | $ | 10,130,180 | |
| | | | | | | | |
| Restaurants – 0.5% | | | | | |
| Chuy’s Holdings, Inc. (a) | | | 7,622 | | | $ | 149,925 | |
| Jack in the Box, Inc. | | | 2,950 | | | | 235,882 | |
| Red Robin Gourmet Burgers, Inc. (a) | | | 2,623 | | | | 201,905 | |
| Ruby Tuesday, Inc. (a) | | | 8,038 | | | | 54,980 | |
| | | | | | | | |
| | | $ | 642,692 | |
| | | | | | | | |
| Specialty Chemicals – 3.1% | | | | | |
| A. Schulman, Inc. | | | 14,805 | | | $ | 600,047 | |
| Andersons, Inc. | | | 17,931 | | | | 952,853 | |
| Green Plains, Inc. | | | 28,070 | | | | 695,575 | |
| Pacific Ethanol, Inc. (a) | | | 46,993 | | | | 485,438 | |
| REX American Resources Corp. (a) | | | 10,983 | | | | 680,617 | |
| Trinseo S.A. (a) | | | 41,304 | | | | 720,755 | |
| | | | | | | | |
| | | $ | 4,135,285 | |
| | | | | | | | |
| Specialty Stores – 5.1% | | | | | |
| Barnes & Noble, Inc. (a) | | | 10,502 | | | $ | 243,856 | |
| Build-A-Bear Workshop, Inc. (a) | | | 26,076 | | | | 524,128 | |
| Burlington Stores, Inc. (a) | | | 42,055 | | | | 1,987,519 | |
| Children’s Place, Inc. | | | 22,279 | | | | 1,269,903 | |
| Express, Inc. (a) | | | 49,858 | | | | 732,414 | |
| Office Depot, Inc. (a) | | | 244,911 | | | | 2,100,112 | |
| | | | | | | | |
| | | $ | 6,857,932 | |
| | | | | | | | |
| Telecommunications – Wireless – 0.5% | | | | | |
| Intelsat S.A. (a) | | | 40,036 | | | $ | 695,025 | |
| | | | | | | | |
| Telephone Services – 1.5% | | | | | |
| Inteliquent, Inc. | | | 62,745 | | | $ | 1,231,684 | |
| Shenandoah Telecommunications Co. | | | 25,099 | | | | 784,344 | |
| West Corp. | | | 2,045 | | | | 67,485 | |
| | | | | | | | |
| | | $ | 2,083,513 | |
| | | | | | | | |
| Trucking – 1.5% | | | | | |
| Celadon Group, Inc. | | | 29,774 | | | $ | 675,572 | |
| Swift Transportation Co. (a) | | | 49,758 | | | | 1,424,572 | |
| | | | | | | | |
| | | $ | 2,100,144 | |
| | | | | | | | |
| Utilities – Electric Power – 1.7% | | | | | |
| Great Plains Energy, Inc. | | | 9,495 | | | $ | 269,753 | |
| NRG Yield, Inc. | | | 3,193 | | | | 150,518 | |
| PNM Resources, Inc. | | | 39,005 | | | | 1,155,718 | |
| Portland General Electric Co. | | | 19,270 | | | | 728,984 | |
| | | | | | | | |
| | | $ | 2,304,973 | |
| | | | | | | | |
| Utilities – Water – 0.5% | | | | | |
| American States Water Co. | | | 19,232 | | | $ | 724,277 | |
| | | | | | | | |
Total Common Stocks
(Identified Cost, $108,167,898) | | | | | | $ | 134,353,128 | |
| | | | | | | | |
| | | | | | | | | | | | | | | | |
| Issuer | | Strike
Price | | | First
Exercise | | | Shares/Par | | | Value ($) | |
| | | | | | | | | | | | | | | | |
| WARRANTS – 0.0% | | | | | |
| OTHER BANKS & DIVERSIFIED FINANCIALS – 0.0% | |
| Imperial Holdings, Inc. (1 share for 1 warrant) (a) | | $ | 10.75 | | | | 11/06/14 | | | | 318 | | | $ | 277 | |
| | | | | | | | | | | | | | | | |
| |
| MONEY MARKET FUNDS – 0.3% | | | | | |
| MFS Institutional Money Market Portfolio, 0.09%, at Cost and Net Asset Value (v) | | | | 408,030 | | | $ | 408,030 | |
| | | | | | | | | | | | | | | | |
|
| COLLATERAL FOR SECURITIES LOANED – 0.7% | |
| Navigator Securities Lending Prime Portfolio, 0.16%, at Cost and Net Asset Value (j) | | | | 920,398 | | | $ | 920,398 | |
| | | | | | | | | | | | | | | | |
Total Investments
(Identified Cost, $109,496,326) | | | | | | | $ | 135,681,833 | |
| | | | | | | | | | | | | | | | |
OTHER ASSETS, LESS
LIABILITIES – (0.1)% | | | | | | | | (137,769 | ) |
| | | | | | | | | | | | | | | | |
| NET ASSETS – 100.0% | | | | | | | $ | 135,544,064 | |
| | | | | | | | | | | | | | | | |
| (a) | | Non-income producing security. |
| (j) | | The rate quoted is the annualized seven-day yield of the fund at period end. |
| (l) | | A portion of this security is on loan. |
| (v) | | Underlying affiliated fund that is available only to investment companies managed by MFS. The rate quoted for the MFS Institutional Money Market Portfolio is the annualized seven-day yield of the fund at period end. |
The following abbreviations are used in this report and are defined:
| PLC | | Public Limited Company |
| REIT | | Real Estate Investment Trust |
See Notes to Financial Statements
10
MFS Blended Research Small Cap Equity Portfolio
FINANCIAL STATEMENTS | STATEMENT OF ASSETS AND LIABILITIES
This statement represents your fund’s balance sheet, which details the assets and liabilities comprising the total value of the fund.
| | | | | | | | |
At 12/31/14 | | | | | | | | |
Assets | | | | | | | | |
Investments – | | | | | | | | |
Non-affiliated issuers, at value (identified cost, $109,088,296) | | | $135,273,803 | | | | | |
Underlying affiliated funds, at cost and value | | | 408,030 | | | | | |
Total investments, at value, including $879,623 of securities on loan (identified cost, $109,496,326) | | | $135,681,833 | | | | | |
Receivables for | | | | | | | | |
Investments sold | | | 656,412 | | | | | |
Fund shares sold | | | 208,882 | | | | | |
Interest and dividends | | | 105,727 | | | | | |
Other assets | | | 1,501 | | | | | |
Total assets | | | | | | | $136,654,355 | |
Liabilities | | | | | | | | |
Payable for fund shares reacquired | | | $123,228 | | | | | |
Collateral for securities loaned, at value | | | 920,398 | | | | | |
Payable to affiliates | | | | | | | | |
Investment adviser | | | 2,325 | | | | | |
Shareholder servicing costs | | | 23 | | | | | |
Distribution and/or service fees | | | 1,442 | | | | | |
Payable for independent Trustees’ compensation | | | 82 | | | | | |
Accrued expenses and other liabilities | | | 62,793 | | | | | |
Total liabilities | | | | | | | $1,110,291 | |
Net assets | | | | | | | $135,544,064 | |
Net assets consist of | | | | | | | | |
Paid-in capital | | | $87,604,225 | | | | | |
Unrealized appreciation (depreciation) on investments | | | 26,185,507 | | | | | |
Accumulated net realized gain (loss) on investments | | | 21,270,997 | | | | | |
Undistributed net investment income | | | 483,335 | | | | | |
Net assets | | | | | | | $135,544,064 | |
Shares of beneficial interest outstanding | | | | | | | 8,569,685 | |
| | | | | | | | | | | | |
| | | Net assets | | | Shares
outstanding | | | Net asset value
per share | |
Initial Class | | | $31,323,013 | | | | 1,952,683 | | | | $16.04 | |
Service Class | | | 104,221,051 | | | | 6,617,002 | | | | 15.75 | |
See Notes to Financial Statements
11
MFS Blended Research Small Cap Equity Portfolio
FINANCIAL STATEMENTS | STATEMENT OF OPERATIONS
This statement describes how much your fund earned in investment income and accrued in expenses. It also describes any gains and/or losses generated by fund operations.
| | | | | | | | |
Year ended 12/31/14 | | | | | | | | |
Net investment income | | | | | | | | |
Income | | | | | | | | |
Dividends | | | $1,469,194 | | | | | |
Interest | | | 31,371 | | | | | |
Dividends from underlying affiliated funds | | | 848 | | | | | |
Foreign taxes withheld | | | (2,786 | ) | | | | |
Total investment income | | | | | | | $1,498,627 | |
Expenses | | | | | | | | |
Management fee | | | $569,620 | | | | | |
Distribution and/or service fees | | | 274,717 | | | | | |
Shareholder servicing costs | | | 5,020 | | | | | |
Administrative services fee | | | 29,762 | | | | | |
Independent Trustees’ compensation | | | 4,594 | | | | | |
Custodian fee | | | 44,340 | | | | | |
Shareholder communications | | | 323 | | | | | |
Audit and tax fees | | | 55,061 | | | | | |
Legal fees | | | 1,214 | | | | | |
Miscellaneous | | | 10,385 | | | | | |
Total expenses | | | | | | | $995,036 | |
Fees paid indirectly | | | (3 | ) | | | | |
Reduction of expenses by investment adviser | | | (6,738 | ) | | | | |
Net expenses | | | | | | | $988,295 | |
Net investment income | | | | | | | $510,332 | |
Realized and unrealized gain (loss) on investments | | | | | | | | |
Realized gain (loss) on investments (identified cost basis) | | | | | | | $21,857,044 | |
Change in unrealized appreciation (depreciation) on investments | | | | | | | $(12,934,875 | ) |
Net realized and unrealized gain (loss) on investments | | | | | | | $8,922,169 | |
Change in net assets from operations | | | | | | | $9,432,501 | |
See Notes to Financial Statements
12
MFS Blended Research Small Cap Equity Portfolio
FINANCIAL STATEMENTS | STATEMENTS OF CHANGES IN NET ASSETS
These statements describe the increases and/or decreases in net assets resulting from operations, any distributions, and any shareholder transactions.
| | | | | | | | |
For years ended 12/31 | | | 2014 | | | | 2013 | |
Change in net assets | | | | | | | | |
From operations | | | | | | | | |
Net investment income | | | $510,332 | | | | $721,762 | |
Net realized gain (loss) on investments | | | 21,857,044 | | | | 24,794,254 | |
Net unrealized gain (loss) on investments | | | (12,934,875 | ) | | | 31,002,423 | |
Change in net assets from operations | | | $9,432,501 | | | | $56,518,439 | |
Distributions declared to shareholders | | | | | | | | |
From net investment income | | | $(1,069,864 | ) | | | $(2,211,067 | ) |
From net realized gain on investments | | | (24,659,608 | ) | | | (9,643,715 | ) |
Total distributions declared to shareholders | | | $(25,729,472 | ) | | | $(11,854,782 | ) |
Change in net assets from fund share transactions | | | $(2,595,267 | ) | | | $(34,208,250 | ) |
Total change in net assets | | | $(18,892,238 | ) | | | $10,455,407 | |
Net assets | | | | | | | | |
At beginning of period | | | 154,436,302 | | | | 143,980,895 | |
At end of period (including undistributed net investment income of $483,335 and
$1,069,860, respectively) | | | $135,544,064 | | | | $154,436,302 | |
See Notes to Financial Statements
13
MFS Blended Research Small Cap Equity Portfolio
FINANCIAL STATEMENTS | FINANCIAL HIGHLIGHTS
The financial highlights table is intended to help you understand the fund’s financial performance for the past 5 years. Certain information reflects financial results for a single fund share. The total returns in the table represent the rate by which an investor would have earned (or lost) on an investment in the fund share class (assuming reinvestment of all distributions) held for the entire period.
| | | | | | | | | | | | | | | | | | | | |
| Initial Class | | Years ended 12/31 | |
| | | 2014 | | | 2013 | | | 2012 | | | 2011 | | | 2010 | |
Net asset value, beginning of period | | | $18.24 | | | | $13.57 | | | | $12.42 | | | | $13.12 | | | | $10.58 | |
| Income (loss) from investment operations | | | | | | | | | | | | | | | | | | | | |
Net investment income (d) | | | $0.10 | | | | $0.11 | | | | $0.16 | | | | $0.11 | | | | $0.06 | |
Net realized and unrealized gain (loss) on investments
and foreign currency | | | 1.16 | | | | 5.91 | | | | 1.68 | | | | (0.75 | ) | | | 2.52 | |
Total from investment operations | | | $1.26 | | | | $6.02 | | | | $1.84 | | | | $(0.64 | ) | | | $2.58 | |
| Less distributions declared to shareholders | | | | | | | | | | | | | | | | | | | | |
From net investment income | | | $(0.18 | ) | | | $(0.28 | ) | | | $(0.08 | ) | | | $(0.06 | ) | | | $(0.04 | ) |
From net realized gain on investments | | | (3.28 | ) | | | (1.07 | ) | | | (0.61 | ) | | | — | | | | — | |
Total distributions declared to shareholders | | | $(3.46 | ) | | | $(1.35 | ) | | | $(0.69 | ) | | | $(0.06 | ) | | | $(0.04 | ) |
Net asset value, end of period (x) | | | $16.04 | | | | $18.24 | | | | $13.57 | | | | $12.42 | | | | $13.12 | |
Total return (%) (k)(r)(s)(x) | | | 7.29 | | | | 45.71 | | | | 14.74 | | | | (4.87 | ) | | | 24.46 | |
Ratios (%) (to average net assets)
and Supplemental data: | | | | | | | | | | | | | | | | | | | | |
Expenses before expense reductions (f) | | | 0.51 | | | | 0.51 | | | | 0.58 | | | | 0.70 | | | | 0.99 | |
Expenses after expense reductions (f) | | | 0.50 | | | | 0.51 | | | | N/A | | | | 0.61 | | | | 0.95 | |
Net investment income | | | 0.56 | | | | 0.68 | | | | 1.22 | | | | 0.83 | | | | 0.57 | |
Portfolio turnover | | | 67 | | | | 69 | | | | 82 | | | | 37 | | | | 131 | |
Net assets at end of period (000 omitted) | | | $31,323 | | | | $33,401 | | | | $29,429 | | | | $71,405 | | | | $45,720 | |
See Notes to Financial Statements
14
MFS Blended Research Small Cap Equity Portfolio
Financial Highlights – continued
| | | | | | | | | | | | | | | | | | | | |
| Service Class | | Years ended 12/31 | |
| | | 2014 | | | 2013 | | | 2012 | | | 2011 | | | 2010 | |
Net asset value, beginning of period | | | $17.96 | | | | $13.38 | | | | $12.26 | | | | $12.95 | | | | $10.45 | |
| Income (loss) from investment operations | | | | | | | | | | | | | | | | | | | | |
Net investment income (d) | | | $0.05 | | | | $0.07 | | | | $0.15 | | | | $0.06 | | | | $0.04 | |
Net realized and unrealized gain (loss) on investments
and foreign currency | | | 1.15 | | | | 5.82 | | | | 1.63 | | | | (0.72 | ) | | | 2.47 | |
Total from investment operations | | | $1.20 | | | | $5.89 | | | | $1.78 | | | | $(0.66 | ) | | | $2.51 | |
| Less distributions declared to shareholders | | | | | | | | | | | | | | | | | | | | |
From net investment income | | | $(0.13 | ) | | | $(0.24 | ) | | | $(0.05 | ) | | | $(0.03 | ) | | | $(0.01 | ) |
From net realized gain on investments | | | (3.28 | ) | | | (1.07 | ) | | | (0.61 | ) | | | — | | | | — | |
Total distributions declared to shareholders | | | $(3.41 | ) | | | $(1.31 | ) | | | $(0.66 | ) | | | $(0.03 | ) | | | $(0.01 | ) |
Net asset value, end of period (x) | | | $15.75 | | | | $17.96 | | | | $13.38 | | | | $12.26 | | | | $12.95 | |
Total return (%) (k)(r)(s)(x) | | | 7.04 | | | | 45.33 | | | | 14.39 | | | | (5.09 | ) | | | 24.07 | |
Ratios (%) (to average net assets)
and Supplemental data: | | | | | | | | | | | | | | | | | | | | |
Expenses before expense reductions (f) | | | 0.76 | | | | 0.76 | | | | 0.83 | | | | 0.94 | | | | 1.23 | |
Expenses after expense reductions (f) | | | 0.75 | | | | 0.76 | | | | N/A | | | | 0.85 | | | | 1.20 | |
Net investment income | | | 0.30 | | | | 0.42 | | | | 1.11 | | | | 0.50 | | | | 0.34 | |
Portfolio turnover | | | 67 | | | | 69 | | | | 82 | | | | 37 | | | | 131 | |
Net assets at end of period (000 omitted) | | | $104,221 | | | | $121,036 | | | | $114,552 | | | | $117,293 | | | | $134,958 | |
Information prior to the close of business on December 7, 2012, reflects time periods when another adviser or subadviser was responsible for selecting investments for the fund under a different investment objective and different investment strategies.
| (d) | Per share data is based on average shares outstanding. |
| (f) | Ratios do not reflect reductions from fees paid indirectly, if applicable. |
| (k) | The total return does not reflect expenses that apply to separate accounts. Inclusion of these charges would reduce the total return figures for all periods shown. |
| (r) | Certain expenses have been reduced without which performance would have been lower. |
| (s) | From time to time the fund may receive proceeds from litigation settlements, without which performance would be lower. |
| (x) | The net asset values per share and total returns have been calculated on net assets which include adjustments made in accordance with U.S. generally accepted accounting principles required at period end for financial reporting purposes. |
See Notes to Financial Statements
15
MFS Blended Research Small Cap Equity Portfolio
NOTES TO FINANCIAL STATEMENTS
| (1) | | Business and Organization |
MFS Blended Research Small Cap Equity Portfolio (the fund) is a diversified series of MFS Variable Insurance Trust III (the trust). The trust is organized as a Delaware statutory trust and is registered under the Investment Company Act of 1940, as amended, as an open-end management investment company. The shareholders of each series of the trust are separate accounts of insurance companies, which offer variable annuity and/or life insurance products, and qualified retirement and pension plans.
The fund is an investment company and accordingly follows the investment company accounting and reporting guidance of the Financial Accounting Standards Board (FASB) Accounting Standards Codification Topic 946 Financial Services – Investment Companies.
| (2) | | Significant Accounting Policies |
General – The preparation of financial statements in conformity with U.S. generally accepted accounting principles requires management to make estimates and assumptions that affect the reported amounts of assets and liabilities, and disclosure of contingent assets and liabilities at the date of the financial statements and the reported amounts of increases and decreases in net assets from operations during the reporting period. Actual results could differ from those estimates. In the preparation of these financial statements, management has evaluated subsequent events occurring after the date of the fund’s Statement of Assets and Liabilities through the date that the financial statements were issued. The fund will generally focus on securities of small size companies which may be more volatile than those of larger companies.
In June 2014, FASB issued Accounting Standards Update 2014-11, Transfers and Servicing (Topic 860) – Repurchase-to-Maturity Transactions, Repurchase Financings, and Disclosures (“ASU 2014-11”). ASU 2014-11 changes the accounting for repurchase-to-maturity transactions (i.e., repurchase agreements that settle at the same time as the maturity of the transferred financial asset) and enhances the required disclosures for repurchase agreements and other similar transactions. Although still evaluating the potential impacts of ASU 2014-11 to the fund, management expects that the impact of the fund’s adoption will be limited to additional financial statement disclosures which would first be effective for interim reporting periods beginning after March 15, 2015.
Balance Sheet Offsetting – The fund’s accounting policy with respect to balance sheet offsetting is that, absent an event of default by the counterparty or a termination of the agreement, the International Swaps and Derivatives Association (ISDA) Master Agreement does not result in an offset of reported amounts of financial assets and financial liabilities in the Statement of Assets and Liabilities across transactions between the fund and the applicable counterparty. The fund’s right to setoff may be restricted or prohibited by the bankruptcy or insolvency laws of the particular jurisdiction to which a specific master netting agreement counterparty is subject. Balance sheet offsetting disclosures, to the extent applicable to the fund, have been included in the fund’s Significant Accounting Policies note under the captions for each of the fund’s in-scope financial instruments and transactions.
Investment Valuations – Equity securities, including restricted equity securities, are generally valued at the last sale or official closing price as provided by a third-party pricing service on the market or exchange on which they are primarily traded. Equity securities, for which there were no sales reported that day, are generally valued at the last quoted daily bid quotation as provided by a third-party pricing service on the market or exchange on which such securities are primarily traded. Short-term instruments with a maturity at issuance of 60 days or less may be valued at amortized cost, which approximates market value. Open-end investment companies are generally valued at net asset value per share. Securities and other assets generally valued on the basis of information from a third-party pricing service may also be valued at a broker/dealer bid quotation. Values obtained from third-party pricing services can utilize both transaction data and market information such as yield, quality, coupon rate, maturity, type of issue, trading characteristics, and other market data. The values of foreign securities and other assets and liabilities expressed in foreign currencies are converted to U.S. dollars using the mean of bid and asked prices for rates provided by a third-party pricing service.
The Board of Trustees has delegated primary responsibility for determining or causing to be determined the value of the fund’s investments (including any fair valuation) to the adviser pursuant to valuation policies and procedures approved by the Board. If the adviser determines that reliable market quotations are not readily available, investments are valued at fair value as determined in good faith by the adviser in accordance with such procedures under the oversight of the Board of Trustees. Under the fund’s valuation policies and procedures, market quotations are not considered to be readily available for most types of debt instruments and floating rate loans and many types of derivatives. These investments are generally valued at fair value based on information from third-party pricing services. In addition, investments may be valued at fair value if the adviser determines that an investment’s value has been materially affected by events occurring after the close of the exchange or market on which the investment is principally traded (such as foreign exchange or market) and prior to the determination of the fund’s net asset value, or after the halting of trading of a specific security where trading does not resume prior to the close of the exchange or market on which the security is principally traded. Events that occur on a frequent basis after foreign markets close (such as developments in foreign markets and significant movements in the U.S. markets) and prior to the determination of the fund’s net asset value may be deemed to have a material effect on the value of securities traded in foreign markets. Accordingly, the fund’s foreign equity securities may often be valued at fair value. The adviser generally relies on third-party pricing services or other information (such as the correlation with price movements of similar securities in the same or other markets; the type, cost and investment characteristics of the security; the
16
MFS Blended Research Small Cap Equity Portfolio
Notes to Financial Statements – continued
business and financial condition of the issuer; and trading and other market data) to assist in determining whether to fair value and at what value to fair value an investment. The value of an investment for purposes of calculating the fund’s net asset value can differ depending on the source and method used to determine value. When fair valuation is used, the value of an investment used to determine the fund’s net asset value may differ from quoted or published prices for the same investment. There can be no assurance that the fund could obtain the fair value assigned to an investment if it were to sell the investment at the same time at which the fund determines its net asset value per share.
Various inputs are used in determining the value of the fund’s assets or liabilities. These inputs are categorized into three broad levels. In certain cases, the inputs used to measure fair value may fall into different levels of the fair value hierarchy. In such cases, an investment’s level within the fair value hierarchy is based on the lowest level of input that is significant to the fair value measurement. The fund’s assessment of the significance of a particular input to the fair value measurement in its entirety requires judgment, and considers factors specific to the investment. Level 1 includes unadjusted quoted prices in active markets for identical assets or liabilities. Level 2 includes other significant observable market-based inputs (including quoted prices for similar securities, interest rates, prepayment speed, and credit risk). Level 3 includes unobservable inputs, which may include the adviser’s own assumptions in determining the fair value of investments. The following is a summary of the levels used as of December 31, 2014 in valuing the fund’s assets or liabilities:
| | | | | | | | | | | | | | | | |
| Investments at Value | | Level 1 | | | Level 2 | | | Level 3 | | | Total | |
| Equity Securities: | | | | | | | | | | | | | | | | |
United States | | | $132,890,301 | | | | $— | | | | $277 | | | | $132,890,578 | |
Luxembourg | | | 695,025 | | | | — | | | | — | | | | 695,025 | |
Netherlands | | | 432,089 | | | | — | | | | — | | | | 432,089 | |
Greece | | | 335,713 | | | | — | | | | — | | | | 335,713 | |
| Mutual Funds | | | 1,328,428 | | | | — | | | | — | | | | 1,328,428 | |
| Total Investments | | | $135,681,556 | | | | $— | | | | $277 | | | | $135,681,833 | |
For further information regarding security characteristics, see the Portfolio of Investments.
The following is a reconciliation of level 3 assets for which significant unobservable inputs were used to determine fair value. The fund’s policy is to recognize transfers between the levels as of the end of the period. The table presents the activity of level 3 securities held at the beginning and the end of the period.
| | | | |
| | | Equity Securities | |
| Balance as of 12/31/13 | | | $— | |
Acquisition via Corporate Action (Warrant Issuance) | | | 277 | |
| Balance as of 12/31/14 | | | $277 | |
The net change in unrealized appreciation (depreciation) from investments held as level 3 at December 31, 2014 is $0. At December 31, 2014, the fund held one level 3 security.
Security Loans – Under its Securities Lending Agency Agreement with the fund, State Street Bank and Trust Company (“State Street”), as lending agent, loans the securities of the fund to certain qualified institutions (the “Borrowers”) approved by the fund. The loans are collateralized by cash and/or U.S. Treasury and federal agency obligations in an amount typically at least equal to the market value of the securities loaned. On loans collateralized by cash, the cash collateral is invested in a money market fund. The market value of the loaned securities is determined at the close of business of the fund and any additional required collateral is delivered to the fund on the next business day. State Street provides the fund with indemnification against Borrower default. In the event of Borrower default, State Street will for the benefit of the fund either purchase securities identical to those loaned or, when such purchase is commercially impracticable, pay the fund the market value of the loaned securities. In return, State Street assumes the fund’s rights to the related collateral. If the collateral value is less than the cost to purchase identical securities, State Street is responsible for the shortfall, but only to the extent that such shortfall is not due to a decline in collateral value resulting from collateral reinvestment for which the fund bears the risk of loss. At period end, the fund had investment securities on loan with a fair value of $879,623 and a related liability of $920,398 for cash collateral received on securities loaned, both of which are presented gross in the Statement of Assets and Liabilities. The collateral received on securities loaned exceeded the value of securities on loan at period end. The liability for cash collateral for securities loaned is carried at fair value, which is categorized as level 2 within the fair value hierarchy. A portion of the income generated upon investment of the collateral is remitted to the Borrowers, and the remainder is allocated between the fund and the lending agent. On loans collateralized by U.S. Treasury and/or federal agency obligations, a fee is received from the Borrower, and is allocated between the fund and the lending agent. Income from securities lending is included in “Interest” income in the Statement of Operations. The dividend and interest income earned on the securities loaned is accounted for in the same manner as other dividend and interest income.
Indemnifications – Under the fund’s organizational documents, its officers and Trustees may be indemnified against certain liabilities and expenses arising out of the performance of their duties to the fund. Additionally, in the normal course of business, the
17
MFS Blended Research Small Cap Equity Portfolio
Notes to Financial Statements – continued
fund enters into agreements with service providers that may contain indemnification clauses. The fund’s maximum exposure under these agreements is unknown as this would involve future claims that may be made against the fund that have not yet occurred.
Investment Transactions and Income – Investment transactions are recorded on the trade date. Interest income is recorded on the accrual basis. Dividends received in cash are recorded on the ex-dividend date. Certain dividends from foreign securities will be recorded when the fund is informed of the dividend if such information is obtained subsequent to the ex-dividend date. Dividend and interest payments received in additional securities are recorded on the ex-dividend or ex-interest date in an amount equal to the value of the security on such date.
The fund may receive proceeds from litigation settlements. Any proceeds received from litigation involving portfolio holdings are reflected in the Statement of Operations in realized gain/loss if the security has been disposed of by the fund or in unrealized gain/loss if the security is still held by the fund. Any other proceeds from litigation not related to portfolio holdings are reflected as other income in the Statement of Operations.
Fees Paid Indirectly – The fund’s custody fee may be reduced according to an arrangement that measures the value of cash deposited with the custodian by the fund. This amount, for the year ended December 31, 2014, is shown as a reduction of total expenses in the Statement of Operations.
Tax Matters and Distributions – The fund intends to qualify as a regulated investment company, as defined under Subchapter M of the Internal Revenue Code, and to distribute all of its taxable income, including realized capital gains. As a result, no provision for federal income tax is required. The fund’s federal tax returns, when filed, will remain subject to examination by the Internal Revenue Service for a three year period. Management has analyzed the fund’s tax positions taken on federal and state tax returns for all open tax years and does not believe that there are any uncertain tax positions that require recognition of a tax liability. Foreign taxes, if any, have been accrued by the fund in the accompanying financial statements in accordance with the applicable foreign tax law. Foreign income taxes may be withheld by certain countries in which the fund invests. Additionally, capital gains realized by the fund on securities issued in or by certain foreign countries may be subject to capital gains tax imposed by those countries.
Distributions to shareholders are recorded on the ex-dividend date. Income and capital gain distributions are determined in accordance with income tax regulations, which may differ from U.S. generally accepted accounting principles. Certain capital accounts in the financial statements are periodically adjusted for permanent differences in order to reflect their tax character. These adjustments have no impact on net assets or net asset value per share. Temporary differences which arise from recognizing certain items of income, expense, gain or loss in different periods for financial statement and tax purposes will reverse at some time in the future. Distributions in excess of net investment income or net realized gains are temporary overdistributions for financial statement purposes resulting from differences in the recognition or classification of income or distributions for financial statement and tax purposes.
Book/tax differences primarily relate to wash sale loss deferrals.
The tax character of distributions declared to shareholders for the last two fiscal years is as follows:
| | | | | | | | |
| | | 12/31/14 | | | 12/31/13 | |
| Ordinary income (including any short-term capital gains) | | | $21,338,383 | | | | $2,211,067 | |
| Long-term capital gains | | | 4,391,089 | | | | 9,643,715 | |
| Total distributions | | | $25,729,472 | | | | $11,854,782 | |
The federal tax cost and the tax basis components of distributable earnings were as follows:
| | | | |
| As of 12/31/14 | | | | |
| Cost of investments | | | $109,723,523 | |
| Gross appreciation | | | 30,486,000 | |
| Gross depreciation | | | (4,527,690 | ) |
| Net unrealized appreciation (depreciation) | | | $25,958,310 | |
| Undistributed ordinary income | | | 5,178,099 | |
| Undistributed long-term capital gain | | | 16,793,798 | |
| Other temporary differences | | | 9,632 | |
Multiple Classes of Shares of Beneficial Interest – The fund offers multiple classes of shares, which differ in their respective distribution and/or service fees. The fund’s income, realized and unrealized gain (loss), and common expenses are allocated to shareholders based on the daily net assets of each class. Dividends are declared separately for each class. Differences in per share
18
MFS Blended Research Small Cap Equity Portfolio
Notes to Financial Statements – continued
dividend rates are generally due to differences in separate class expenses. The fund’s distributions declared to shareholders as reported in the Statements of Changes in Net Assets are presented by class as follows:
| | | | | | | | | | | | | | | | |
| | | From net investment
income | | | From net realized gain on
investments | |
| | | Year ended
12/31/14 | | | Year ended
12/31/13 | | | Year ended
12/31/14 | | | Year ended
12/31/13 | |
| Initial Class | | | $310,319 | | | | $516,885 | | | | $5,595,876 | | | | $1,991,337 | |
| Service Class | | | 759,545 | | | | 1,694,182 | | | | 19,063,732 | | | | 7,652,378 | |
| Total | | | $1,069,864 | | | | $2,211,067 | | | | $24,659,608 | | | | $9,643,715 | |
| (3) | | Transactions with Affiliates |
Investment Adviser – The fund has an investment advisory agreement with MFS to provide overall investment management and related administrative services and facilities to the fund. The management fee is computed daily and paid monthly at an annual rate of 0.40% of the fund’s average daily net assets.
MFS has agreed in writing to reduce its management fee by a specified amount if certain MFS mutual fund assets exceed thresholds agreed to by MFS and the fund’s Board of Trustees. For the year ended December 31, 2014, this management fee reduction amounted to $6,487, which is included in the reduction of total expenses in the Statement of Operations. The management fee incurred for the year ended December 31, 2014 was equivalent to an annual effective rate of 0.40% of the fund’s average daily net assets.
The investment adviser has agreed in writing to pay a portion of the fund’s total annual operating expenses, excluding interest, taxes, extraordinary expenses, brokerage and transaction costs, and investment-related expenses such that total annual operating expenses do not exceed 0.60% of average daily net assets for the Initial Class shares and 0.85% of average daily net assets for the Service Class shares. This written agreement will continue until modified by the fund’s Board of Trustees, but such agreement will continue at least until April 30, 2016. For the year ended December 31, 2014 the fund’s actual operating expenses did not exceed the limit and therefore, the investment adviser did not pay any portion of the fund’s expenses related to this agreement.
Distributor – MFS Fund Distributors, Inc. (MFD), a wholly-owned subsidiary of MFS, is the distributor of shares of the fund. The Trustees have adopted a distribution plan for the Service Class shares pursuant to Rule 12b-1 under the Investment Company Act of 1940.
The fund’s distribution plan provides that the fund will pay MFD distribution and/or service fees equal to 0.25% per annum of its average daily net assets attributable to Service Class shares as partial consideration for services performed and expenses incurred by MFD and financial intermediaries (including participating insurance companies that invest in the fund to fund variable annuity and variable life insurance contracts, sponsors of qualified retirement and pension plans that invest in the fund, and affiliates of these participating insurance companies and plan sponsors) in connection with the sale and distribution of the Service Class shares. MFD may subsequently pay all, or a portion, of the distribution and/or service fees to financial intermediaries.
Shareholder Servicing Agent – MFS Service Center, Inc. (MFSC), a wholly-owned subsidiary of MFS, receives a fee from the fund for its services as shareholder servicing agent. For the year ended December 31, 2014, the fee was $4,923, which equated to 0.0035% annually of the fund’s average daily net assets. MFSC also receives payment from the fund for out-of-pocket expenses paid by MFSC on behalf of the fund. For the year ended December 31, 2014, these costs amounted to $97.
Administrator – MFS provides certain financial, legal, shareholder communications, compliance, and other administrative services to the fund. Under an administrative services agreement, the fund partially reimburses MFS the costs incurred to provide these services. The fund is charged an annual fixed amount of $17,500 plus a fee based on average daily net assets. The administrative services fee incurred for the year ended December 31, 2014 was equivalent to an annual effective rate of 0.0209% of the fund’s average daily net assets.
Trustees’ and Officers’ Compensation – The fund pays compensation to independent Trustees in the form of a retainer, attendance fees, and additional compensation to Board and Committee chairpersons. The fund does not pay compensation directly to Trustees or officers of the fund who are also officers of the investment adviser, all of whom receive remuneration for their services to the fund from MFS. Certain officers and Trustees of the fund are officers or directors of MFS, MFD, and MFSC.
Other – Effective November 1, 2014, this fund and certain other funds managed by MFS (the funds) have entered into a service agreement (the ISO Agreement) which provides for payment of fees solely by the funds to Tarantino LLC in return for the provision of services of an Independent Senior Officer (ISO) for the funds. Frank L. Tarantino serves as the ISO and is an officer of the funds and the sole member of Tarantino LLC. The funds can terminate the ISO Agreement with Tarantino LLC at any time under the terms of the ISO Agreement. Prior to November 1, 2014, the funds had entered into services agreements (the Compliance Officer Agreements) which provided for payment of fees by the funds to Tarantino LLC and Griffin Compliance LLC in return for the provision of services of an Independent Chief Compliance Officer (ICCO) and Assistant ICCO, respectively, for the funds. Prior to
19
MFS Blended Research Small Cap Equity Portfolio
Notes to Financial Statements – continued
November 1, 2014, Frank L. Tarantino served as the ICCO. Effective October 31, 2014, Mr. Tarantino resigned as ICCO and the Compliance Officer Agreement between the funds and Tarantino LLC was terminated. Prior to June 1, 2014, Robyn L. Griffin served as the Assistant ICCO and was an officer of the funds. Ms. Griffin is the sole member of Griffin Compliance LLC. Effective May 31, 2014, Ms. Griffin resigned as Assistant ICCO and the Compliance Officer Agreement between the funds and Griffin Compliance LLC was terminated. For the year ended December 31, 2014, the aggregate fees paid by the fund under these agreements were $674 and are included in “Miscellaneous” expense in the Statement of Operations. MFS had agreed to reimburse the fund for a portion of the payments made by the fund for the services under the Compliance Officer Agreements in the amount of $251, which is included in the reduction of total expenses in the Statement of Operations. Additionally, MFS has agreed to bear all expenses associated with office space, other administrative support, and supplies provided to the ICCO, Assistant ICCO, and ISO.
The fund invests in the MFS Institutional Money Market Portfolio which is managed by MFS and seeks current income consistent with preservation of capital and liquidity. Income earned on this investment is included in “Dividends from underlying affiliated funds” in the Statement of Operations. This money market fund does not pay a management fee to MFS.
For the year ended December 31, 2014, purchases and sales of investments, other than short-term obligations, aggregated $95,560,555 and $122,949,846, respectively.
| (5) | | Shares of Beneficial Interest |
The fund’s Declaration of Trust permits the Trustees to issue an unlimited number of full and fractional shares of beneficial interest. Transactions in fund shares were as follows:
| | | | | | | | | | | | | | | | |
| | | Year ended 12/31/14 | | | Year ended 12/31/13 | |
| | | Shares | | | Amount | | | Shares | | | Amount | |
| Shares sold | | | | | | | | | | | | | | | | |
Initial Class | | | 164,926 | | | | $2,870,988 | | | | 64,982 | | | | $1,048,081 | |
Service Class | | | 278,229 | | | | 4,786,443 | | | | 217,153 | | | | 3,629,669 | |
| | | 443,155 | | | | $7,657,431 | | | | 282,135 | | | | $4,677,750 | |
| Shares issued to shareholders in reinvestment of distributions | | | | | | | | | | | | | | | | |
Initial Class | | | 375,473 | | | | $5,906,195 | | | | 156,764 | | | | $2,508,222 | |
Service Class | | | 1,282,230 | | | | 19,823,277 | | | | 592,680 | | | | 9,346,560 | |
| | | 1,657,703 | | | | $25,729,472 | | | | 749,444 | | | | $11,854,782 | |
| Shares reacquired | | | | | | | | | | | | | | | | |
Initial Class | | | (418,741 | ) | | | $(7,258,583 | ) | | | (559,516 | ) | | | $(9,070,000 | ) |
Service Class | | | (1,681,322 | ) | | | (28,723,587 | ) | | | (2,634,233 | ) | | | (41,670,782 | ) |
| | | (2,100,063 | ) | | | $(35,982,170 | ) | | | (3,193,749 | ) | | | $(50,740,782 | ) |
| Net change | | | | | | | | | | | | | | | | |
Initial Class | | | 121,658 | | | | $1,518,600 | | | | (337,770 | ) | | | $(5,513,697 | ) |
Service Class | | | (120,863 | ) | | | (4,113,867 | ) | | | (1,824,400 | ) | | | (28,694,553 | ) |
| | | 795 | | | | $(2,595,267 | ) | | | (2,162,170 | ) | | | $(34,208,250 | ) |
The fund and certain other funds managed by MFS participate in a $1.1 billion unsecured committed line of credit, subject to a $1 billion sublimit, provided by a syndication of banks under a credit agreement. Borrowings may be made for temporary financing needs. Interest is charged to each fund, based on its borrowings, generally at a rate equal to the higher of the Federal Reserve funds rate or one month LIBOR plus an agreed upon spread. A commitment fee, based on the average daily, unused portion of the committed line of credit, is allocated among the participating funds at the end of each calendar quarter. In addition, the fund and other funds managed by MFS have established unsecured uncommitted borrowing arrangements with certain banks for temporary financing needs. Interest is charged to each fund, based on its borrowings, at a rate equal to the Federal Reserve funds rate plus an agreed upon spread. For the year ended December 31, 2014, the fund’s commitment fee and interest expense were $530 and $0, respectively, and are included in “Miscellaneous” expense in the Statement of Operations.
20
MFS Blended Research Small Cap Equity Portfolio
Notes to Financial Statements – continued
| (7) | | Transactions in Underlying Affiliated Funds – Affiliated Issuers |
An affiliated issuer may be considered one in which the fund owns 5% or more of the outstanding voting securities, or a company which is under common control. For the purposes of this report, the fund assumes the following to be an affiliated issuer:
| | | | | | | | | | | | | | | | |
| Underlying Affiliated Fund | | Beginning Shares/Par Amount | | | Acquisitions Shares/Par Amount | | | Dispositions Shares/Par Amount | | | Ending Shares/Par Amount | |
| MFS Institutional Money Market Portfolio | | | 1,168,618 | | | | 25,855,223 | | | | (26,615,811 | ) | | | 408,030 | |
| | | | |
| Underlying Affiliated Fund | | Realized Gain (Loss) | | | Capital Gain Distributions | | | Dividend Income | | | Ending Value | |
| MFS Institutional Money Market Portfolio | | | $— | | | | $— | | | | $848 | | | | $408,030 | |
21
MFS Blended Research Small Cap Equity Portfolio
REPORT OF INDEPENDENT REGISTERED PUBLIC ACCOUNTING FIRM
To the Board of Trustees of MFS Variable Insurance Trust III and the Shareholders of
MFS Blended Research Small Cap Equity Portfolio:
We have audited the accompanying statement of assets and liabilities, including the portfolio of investments, of MFS Blended Research Small Cap Equity Portfolio (one of the series of MFS Variable Insurance Trust III) (the “Fund”) as of December 31, 2014, and the related statement of operations for the year then ended, the statements of changes in net assets for each of the two years in the period then ended, and the financial highlights for each of the five years in the period then ended. These financial statements and financial highlights are the responsibility of the Fund’s management. Our responsibility is to express an opinion on these financial statements and financial highlights based on our audits.
We conducted our audits in accordance with the standards of the Public Company Accounting Oversight Board (United States). Those standards require that we plan and perform the audit to obtain reasonable assurance about whether the financial statements and financial highlights are free of material misstatement. The Fund is not required to have, nor were we engaged to perform, an audit of its internal control over financial reporting. Our audits included consideration of internal control over financial reporting as a basis for designing audit procedures that are appropriate in the circumstances, but not for the purpose of expressing an opinion on the effectiveness of the Fund’s internal control over financial reporting. Accordingly, we express no such opinion. An audit also includes examining, on a test basis, evidence supporting the amounts and disclosures in the financial statements, assessing the accounting principles used and significant estimates made by management, as well as evaluating the overall financial statement presentation. Our procedures included confirmation of securities owned as of December 31, 2014, by correspondence with the custodian. We believe that our audits provide a reasonable basis for our opinion.
In our opinion, the financial statements and financial highlights referred to above present fairly, in all material respects, the financial position of MFS Blended Research Small Cap Equity Portfolio as of December 31, 2014, the results of its operations for the year then ended, the changes in its net assets for each of the two years in the period then ended, and the financial highlights for each of the five years in the period then ended, in conformity with accounting principles generally accepted in the United States of America.
DELOITTE & TOUCHE LLP
Boston, Massachusetts
February 13, 2015
22
MFS Blended Research Small Cap Equity Portfolio
TRUSTEES AND OFFICERS – IDENTIFICATION AND BACKGROUND
The Trustees and Officers of the Trust, as of February 1, 2015, are listed below, together with their principal occupations during the past five years. (Their titles may have varied during that period.) The address of each Trustee and Officer is 111 Huntington Avenue, Boston, Massachusetts 02199-7618.
| | | | | | | | |
Name, Age | | Position(s)
Held with Fund | | Trustee/Officer
Since (h) | | Principal Occupations
During the Past Five Years | | Other Directorships (j) |
| INTERESTED TRUSTEES |
Robert J. Manning (k) (age 51) | | Trustee | | February 2004 | | Massachusetts Financial Services Company, Chairman, Co-Chief Executive Officer and Director; President (until 2009); Chief Investment Officer (until 2010) | | N/A |
| | | | |
Robin A. Stelmach (k) (age 53) | | Trustee and President | | January 2014 | | Massachusetts Financial Services Company, Executive Vice President and Chief Operating Officer | | N/A |
| | | |
| INDEPENDENT TRUSTEES | | | | | | |
David H. Gunning (age 72) | | Trustee and Chair of Trustees | | January 2004 | | Private investor | | Lincoln Electric Holdings, Inc. (welding equipment manufacturer), Director; Development Alternatives, Inc. (consulting), Director/Non-Executive Chairman |
| | | | |
Steven E. Buller (age 63) | | Trustee | | February 2014 | | Chairman, Financial Accounting Standards Advisory Council; Standing Advisory Group, Public Company Accounting Oversight Board, Member (until 2014); BlackRock, Inc. (investment management), Managing Director (until 2014), BlackRock Finco UK (investment management), Director (until 2014) | | N/A |
| | | | |
Robert E. Butler (age 73) | | Trustee | | January 2006 | | Consultant – investment company industry regulatory and compliance matters | | N/A |
| | | | |
Maureen R. Goldfarb (age 59) | | Trustee | | January 2009 | | Private investor | | N/A |
| | | | |
William R. Gutow (age 73) | | Trustee | | December 1993 | | Private investor and real estate consultant; Capitol Entertainment Management Company (video franchise), Vice Chairman | | Texas Donuts (donut franchise), Vice Chairman (until 2010) |
| | | | |
Michael Hegarty (age 70) | | Trustee | | December 2004 | | Private investor | | Brookfield Office Properties, Inc. (real estate), Director; Rouse Properties Inc. (real estate), Director; Capmark Financial Group Inc. (real estate), Director |
| | | | |
John P. Kavanaugh (age 60) | | Trustee | | January 2009 | | Private investor | | N/A |
| | | | |
Maryanne L. Roepke (age 58) | | Trustee | | May 2014 | | American Century Investments (investment management), Senior Vice President and Chief Compliance Officer (until 2014) | | N/A |
| | | | |
Laurie J. Thomsen (age 57) | | Trustee | | March 2005 | | Private investor; New Profit, Inc. (venture philanthropy), Executive Partner (until 2010) | | The Travelers Companies (insurance), Director |
| | | | |
Robert W. Uek (age 73) | | Trustee | | January 2006 | | Consultant to investment company industry | | N/A |
| | | | |
| OFFICERS | | | | | | | | |
Christopher R. Bohane (k) (age 41) | | Assistant Secretary and Assistant Clerk | | July 2005 | | Massachusetts Financial Services Company, Vice President and Assistant General Counsel | | N/A |
| | | | |
Kino Clark (k) (age 46) | | Assistant Treasurer | | January 2012 | | Massachusetts Financial Services Company, Vice President | | N/A |
| | | | |
Thomas H. Connors (k) (age 55) | | Assistant Secretary and Assistant Clerk | | September 2012 | | Massachusetts Financial Services Company, Vice President and Senior Counsel; Deutsche Investment Management Americas Inc. (financial service provider), Director and Senior Counsel (until 2012) | | N/A |
23
MFS Blended Research Small Cap Equity Portfolio
Trustees and Officers – continued
| | | | | | | | |
Name, Age | | Position(s)
Held with Fund | | Trustee/Officer
Since (h) | | Principal Occupations
During the Past Five Years | | Other Directorships (j) |
Ethan D. Corey (k) (age 51) | | Assistant
Secretary and Assistant Clerk | | July 2005 | | Massachusetts Financial Services Company, Senior Vice President and Associate General Counsel | | N/A |
| | | | |
David L. DiLorenzo (k) (age 46) | | Treasurer | | July 2005 | | Massachusetts Financial Services Company, Senior Vice President | | N/A |
| | | | |
Timothy M. Fagan (k) (age 46) | | Chief Compliance Officer | | November 2014 | | Massachusetts Financial Services Company, Chief Compliance Officer; Vice President and Senior Counsel (until 2012) | | N/A |
| | | | |
Brian E. Langenfeld (k) (age 41) | | Assistant
Secretary and Assistant Clerk | | June 2006 | | Massachusetts Financial Services Company, Vice President and Senior Counsel | | N/A |
| | | | |
Susan S. Newton (k) (age 64) | | Assistant
Secretary and Assistant Clerk | | May 2005 | | Massachusetts Financial Services Company, Senior Vice President and Associate General Counsel | | N/A |
| | | | |
Susan A. Pereira (k) (age 44) | | Assistant
Secretary and Assistant Clerk | | July 2005 | | Massachusetts Financial Services Company, Vice President and Senior Counsel | | N/A |
| | | | |
Kasey L. Phillips (k) (age 44) | | Assistant Treasurer | | September 2012 | | Massachusetts Financial Services Company, Vice President; Wells Fargo Funds Management, LLC, Senior Vice President, Fund Treasurer (until 2012) | | N/A |
| | | | |
Mark N. Polebaum (k) (age 62) | | Secretary and
Clerk | | January 2006 | | Massachusetts Financial Services Company, Executive Vice President, General Counsel and Secretary | | N/A |
| | | | |
Matthew A. Stowe (k) (age 40) | | Assistant Secretary and Assistant Clerk | | October 2014 | | Massachusetts Financial Services Company, Vice President and Senior Counsel | | N/A |
| | | | |
Frank L. Tarantino (age 70) | | Independent
Senior Officer | | June 2004 | | Tarantino LLC (provider of compliance services), Principal | | N/A |
| | | | |
Richard S. Weitzel (k) (age 44) | | Assistant Secretary and Assistant Clerk | | October 2007 | | Massachusetts Financial Services Company, Senior Vice President and Associate General Counsel | | N/A |
| | | | |
James O. Yost (k) (age 54) | | Deputy Treasurer | | September 1990 | | Massachusetts Financial Services Company, Senior Vice President | | N/A |
| (h) | Date first appointed to serve as Trustee/officer of an MFS Fund. Each Trustee has served continuously since appointment unless indicated otherwise. For the period from December 15, 2004 until February 22, 2005, Mr. Manning served as Advisory Trustee. Prior to January 2012, Messrs. DiLorenzo and Yost served as Assistant Treasurers of the Funds. Ms. Stelmach was appointed as President of the Funds as of October 1, 2014. |
| (j) | Directorships or trusteeships of companies required to report to the Securities and Exchange Commission (i.e., “public companies”). |
| (k) | “Interested person” of the Trust within the meaning of the Investment Company Act of 1940 (referred to as the 1940 Act), which is the principal federal law governing investment companies like the fund, as a result of a position with MFS. The address of MFS is 111 Huntington Avenue, Boston, Massachusetts 02199-7618. |
Each Trustee (except Ms. Stelmach, Mr. Buller and Ms. Roepke) has been elected by shareholders and each Trustee and officer holds office until his or her successor is chosen and qualified or until his or her earlier death, resignation, retirement or removal. The Trust does not hold annual meetings for the purpose of electing Trustees, and Trustees are not elected for fixed terms. Messrs. Butler, Kavanaugh, Uek and Mses. Thomsen and Roepke are members of the Trust’s Audit Committee.
Each of the Fund’s Trustees and officers holds comparable positions with certain other funds of which MFS or a subsidiary is the investment adviser or distributor, and, in the case of the officers, with certain affiliates of MFS. As of February 1, 2015, the Trustees served as board members of 135 funds within the MFS Family of Funds.
24
MFS Blended Research Small Cap Equity Portfolio
Trustees and Officers – continued
The Statement of Additional Information for the Fund includes further information about the Trustees and is available without charge upon request by calling 1-800-225-2606.
| | |
Investment Adviser Massachusetts Financial Services Company 111 Huntington Avenue Boston, MA 02199-7618 | | Custodian State Street Bank and Trust Company 1 Lincoln Street Boston, MA 02111-2900 |
Distributor MFS Fund Distributors, Inc. 111 Huntington Avenue Boston, MA 02199-7618 | | Independent Registered Public Accounting Firm Deloitte & Touche LLP 200 Berkeley Street Boston, MA 02116 |
Portfolio Manager Matthew Krummell | | |
25
MFS Blended Research Small Cap Equity Portfolio
BOARD REVIEW OF INVESTMENT ADVISORY AGREEMENT
The Investment Company Act of 1940 requires that both the full Board of Trustees and a majority of the non-interested (“independent”) Trustees, voting separately, annually approve the continuation of the Fund’s investment advisory agreement with MFS. The Trustees consider matters bearing on the Fund and its advisory arrangements at their meetings throughout the year, including a review of performance data at each regular meeting. In addition, the independent Trustees met several times over the course of three months beginning in May and ending in July, 2014 (“contract review meetings”) for the specific purpose of considering whether to approve the continuation of the investment advisory agreement for the Fund and the other investment companies that the Board oversees (the “MFS Funds”). The independent Trustees were assisted in their evaluation of the Fund’s investment advisory agreement by independent legal counsel, from whom they received separate legal advice and with whom they met separately from MFS during various contract review meetings. The independent Trustees were also assisted in this process by the MFS Funds’ Independent Chief Compliance Officer, a full-time senior officer appointed by and reporting to the independent Trustees.
In connection with their deliberations regarding the continuation of the investment advisory agreement, the Trustees, including the independent Trustees, considered such information and factors as they believed, in light of the legal advice furnished to them and their own business judgment, to be relevant. The investment advisory agreement for the Fund was considered separately, although the Trustees also took into account the common interests of all MFS Funds in their review. As described below, the Trustees considered the nature, quality, and extent of the various investment advisory, administrative, and shareholder services performed by MFS under the existing investment advisory agreement and other arrangements with the Fund.
In connection with their contract review meetings, the Trustees received and relied upon materials that included, among other items: (i) information provided by Lipper Inc., an independent third party, on the investment performance of the Fund for various time periods ended December 31, 2013 and the investment performance of a group of funds with substantially similar investment classifications/objectives (the “Lipper performance universe”), (ii) information provided by Lipper Inc. on the Fund’s advisory fees and other expenses and the advisory fees and other expenses of comparable funds identified by Lipper Inc. (the “Lipper expense group”), (iii) information provided by MFS on the advisory fees of comparable portfolios of other clients of MFS, including institutional separate accounts and other clients, (iv) information as to whether and to what extent applicable expense waivers, reimbursements or fee “breakpoints” are observed for the Fund, (v) information regarding MFS’ financial results and financial condition, including MFS’ and certain of its affiliates’ estimated profitability from services performed for the Fund and the MFS Funds as a whole, and compared to MFS’ institutional business, (vi) MFS’ views regarding the outlook for the mutual fund industry and the strategic business plans of MFS, (vii) descriptions of various functions performed by MFS for the Funds, such as compliance monitoring and portfolio trading practices, and (viii) information regarding the overall organization of MFS, including information about MFS’ senior management and other personnel providing investment advisory, administrative and other services to the Fund and the other MFS Funds. The comparative performance, fee and expense information prepared and provided by Lipper Inc. was not independently verified and the independent Trustees did not independently verify any information provided to them by MFS.
Prior to the close of business on December 7, 2012, the Fund was a series of Sun Capital Advisers Trust and was advised by Sun Capital Advisers LLC, an affiliate of MFS, and subadvised by BlackRock Investment Management, LLC. Following shareholder approval, MFS became the investment adviser of the Fund and assumed day-to-day investment management responsibilities for the Fund effective as of the close of business on December 7, 2012.
The Trustees’ conclusion as to the continuation of the investment advisory agreement was based on a comprehensive consideration of all information provided to the Trustees and not the result of any single factor. Some of the factors that figured particularly in the Trustees’ deliberations are described below, although individual Trustees may have evaluated the information presented differently from one another, giving different weights to various factors. It is also important to recognize that the fee arrangements for the Fund and other MFS Funds are the result of years of review and discussion between the independent Trustees and MFS, that certain aspects of such arrangements may receive greater scrutiny in some years than in others, and that the Trustees’ conclusions may be based, in part, on their consideration of these same arrangements during the course of the year and in prior years.
Based on information provided by Lipper Inc. and MFS, the Trustees reviewed the Fund’s total return investment performance as well as the performance of peer groups of funds over various time periods. The Trustees placed particular emphasis on the total return performance of the Fund’s Initial Class shares in comparison to the performance of funds in its Lipper performance universe over the three-year period ended December 31, 2013, which the Trustees believed was a long enough period to reflect differing market conditions. The total return performance of the Fund’s Initial Class shares was in the 2nd quintile relative to the other funds in the universe for this three-year period (the 1st quintile being the best performers and the 5th quintile being the worst performers). The total return performance of the Fund’s Initial Class shares was in the 1st quintile for each of the one- and five-year periods ended December 31, 2013 relative to the Lipper performance universe. Because of the passage of time, these performance results may differ from the performance results for more recent periods, including those shown elsewhere in this report.
In the course of their deliberations, the Trustees took into account information provided by MFS in connection with the contract review meetings, as well as during investment review meetings conducted with portfolio management personnel during the course
26
MFS Blended Research Small Cap Equity Portfolio
Board Review of Investment Advisory Agreement – continued
of the year regarding the Fund’s performance. The Trustees noted that MFS became the Fund’s investment adviser in December 2012 and that MFS implemented certain changes in the Fund’s investment strategy. After reviewing these and related factors, the Trustees concluded, within the context of their overall conclusions regarding the investment advisory agreement, that they were satisfied with MFS’ responses and efforts relating to investment performance.
In assessing the reasonableness of the Fund’s advisory fee, the Trustees considered, among other information, the Fund’s advisory fee and the total expense ratio of the Fund’s Initial Class shares as a percentage of average daily net assets and the advisory fee and total expense ratios of peer groups of funds based on information provided by Lipper Inc. The Trustees considered that MFS currently observes an expense limitation for the Fund, which may not be changed without the Trustees’ approval. The Trustees also considered that, according to the Lipper data (which takes into account any fee reductions or expense limitations that were in effect during the Fund’s last fiscal year), the Fund’s effective advisory fee rate and total expense ratio were each lower than the Lipper expense group median.
The Trustees also considered the advisory fees charged by MFS to any comparable institutional accounts. In comparing these fees, the Trustees considered information provided by MFS as to the generally broader scope of services provided by MFS to the Fund in comparison to institutional accounts, the higher demands placed on MFS’ investment personnel and trading infrastructure as a result of the daily cash in-flows and out-flows of the Fund, and the impact on MFS and expenses associated with the more extensive regulatory regime to which the Fund is subject in comparison to institutional accounts.
The Trustees also considered whether the Fund may benefit from any economies of scale in the management of the Fund in the event of growth in assets of the Fund and/or growth in assets of the MFS Funds as a whole. They noted that the Fund’s advisory fee rate schedule is not subject to any breakpoints. Taking into account the expense limitation noted above, the Trustees determined not to recommend any advisory fee breakpoints for the Fund at this time. The Trustees also noted that MFS has agreed in writing to waive a portion of the management fees of certain MFS Funds, including the Fund, if the total combined assets of certain funds within the MFS Funds’ complex increase above agreed upon thresholds (the “group fee waiver”), enabling the Fund’s shareholders to share in the benefits from any economies of scale at the complex level. The group fee waiver is reviewed and renewed annually between the Board and MFS. The Trustees concluded that the group fee waiver was sufficient to allow the Fund to benefit from economies of scale as its assets and overall complex assets grow.
The Trustees also considered information prepared by MFS relating to MFS’ costs and profits with respect to the Fund, the MFS Funds considered as a group, and other investment companies and accounts advised by MFS, as well as MFS’ methodologies used to determine and allocate its costs to the MFS Funds, the Fund and other accounts and products for purposes of estimating profitability.
After reviewing these and other factors described herein, the Trustees concluded, within the context of their overall conclusions regarding the investment advisory agreement, that the advisory fees charged to the Fund represent reasonable compensation in light of the services being provided by MFS to the Fund.
In addition, the Trustees considered MFS’ resources and related efforts to continue to retain, attract and motivate capable personnel to serve the Fund. The Trustees also considered current and developing conditions in the financial services industry, including the presence of large and well-capitalized companies which are spending, and appear to be prepared to continue to spend, substantial sums to engage personnel and to provide services to competing investment companies. In this regard, the Trustees also considered the financial resources of MFS and its ultimate parent, Sun Life Financial Inc. The Trustees also considered the advantages and possible disadvantages to the Fund of having an adviser that also serves other investment companies as well as other accounts.
The Trustees also considered the nature, quality, cost, and extent of administrative, transfer agency, and distribution services provided to the Fund by MFS and its affiliates under agreements and plans other than the investment advisory agreement, including any 12b-1 fees the Fund pays to MFS Fund Distributors, Inc., an affiliate of MFS. The Trustees also considered the nature, extent and quality of certain other services MFS performs or arranges for on the Fund’s behalf, which may include securities lending programs, directed expense payment programs, class action recovery programs, and MFS’ interaction with third-party service providers, principally custodians and sub-custodians. The Trustees concluded that the various non-advisory services provided by MFS and its affiliates on behalf of the Fund were satisfactory.
The Trustees also considered benefits to MFS from the use of the Fund’s portfolio brokerage commissions, if applicable, to pay for investment research and various other factors. Additionally, the Trustees considered so-called “fall-out benefits” to MFS such as reputational value derived from serving as investment manager to the Fund.
Based on their evaluation of factors that they deemed to be material, including those factors described above, the Board of Trustees, including the independent Trustees, concluded that the Fund’s investment advisory agreement with MFS should be continued for an additional one-year period, commencing August 1, 2014.
27
MFS Blended Research Small Cap Equity Portfolio
PROXY VOTING POLICIES AND INFORMATION
MFS votes proxies on behalf of the fund pursuant to proxy voting policies and procedures that are available without charge, upon request, by calling 1-800-225-2606, by visiting the Proxy Voting section of mfs.com or by visiting the SEC’s Web site at http://www.sec.gov.
Information regarding how the fund voted proxies relating to portfolio securities during the most recent twelve-month period ended June 30 is available without charge by visiting the Proxy Voting section of mfs.com or by visiting the SEC’s Web site at http://www.sec.gov.
QUARTERLY PORTFOLIO DISCLOSURE
The fund will file a complete schedule of portfolio holdings with the Securities and Exchange Commission (the Commission) for the first and third quarters of each fiscal year on Form N-Q. The fund’s Form N-Q is available on the EDGAR database on the Commission’s Internet Web site at http://www.sec.gov, and may be reviewed and copied at the:
Public Reference Room
Securities and Exchange Commission
100 F Street, NE, Room 1580
Washington, D.C. 20549
Information on the operation of the Public Reference Room may be obtained by calling the Commission at 1-800-SEC-0330. Copies of the fund’s Form N-Q also may be obtained, upon payment of a duplicating fee, by electronic request at the following e-mail address: publicinfo@sec.gov or by writing the Public Reference Section at the above address.
FURTHER INFORMATION
From time to time, MFS may post important information about the fund or the MFS funds on the MFS web site (mfs.com). This information is available by visiting the “Market Commentary” and “Announcements” sub sections in the “Market Outlooks” section of mfs.com or by clicking on the fund’s name under “Variable Insurance Portfolios — VIT III” in the “Products” section of mfs.com.
FEDERAL TAX INFORMATION (unaudited)
The following information is provided pursuant to provisions of the Internal Revenue Code.
The fund designates $4,831,000 as capital gain dividends paid during the fiscal year.
For corporate shareholders, 6.15% of the ordinary income dividends paid during the fiscal year qualify for the corporate dividends received deduction.
28
rev. 3/11
| | | | |
| FACTS | | WHAT DOES MFS DO WITH YOUR
PERSONAL INFORMATION? | |  |
| | |
| Why? | | Financial companies choose how they share your personal information. Federal law gives consumers the right to limit some but not all sharing. Federal law also requires us to tell you how we collect, share, and protect your personal information. Please read this notice carefully to understand what we do. |
| | |
| What? | | The types of personal information we collect and share depend on the product or service you have with us. This information can include: • Social Security number and account balances • Account transactions and transaction history • Checking account information and wire transfer instructions When you are no longer our customer, we continue to share your information as described in this notice. |
| | |
| How? | | All financial companies need to share customers’ personal information to run their everyday business. In the section below, we list the reasons financial companies can share their customers’ personal information; the reasons MFS chooses to share; and whether you can limit this sharing. |
| | | | |
Reasons we can share your
personal information | | Does MFS share? | | Can you limit this
sharing? |
For our everyday business purposes – such as to process your transactions, maintain your account(s), respond to court orders and legal investigations, or report to credit bureaus | | Yes | | No |
For our marketing purposes – to offer our products and services to you | | No | | We don’t share |
| For joint marketing with other financial companies | | No | | We don’t share |
For our affiliates’ everyday business purposes – information about your transactions and experiences | | No | | We don’t share |
For our affiliates’ everyday business purposes – information about your creditworthiness | | No | | We don’t share |
| For nonaffiliates to market to you | | No | | We don’t share |
| | |
| Questions? | | Call 800-225-2606 or go to mfs.com. |
29
| | |
| Who we are |
| Who is providing this notice? | | MFS Funds, MFS Investment Management, MFS Institutional Advisors, Inc., MFS Fund Distributors, Inc., MFS Heritage Trust Company, and MFS Service Center, Inc. |
| | |
| What we do |
| How does MFS protect my personal information? | | To protect your personal information from unauthorized access and use, we use security measures that comply with federal law. These measures include procedural, electronic, and physical safeguards for the protection of the personal information we collect about you. |
How does MFS
collect my personal information? | | We collect your personal information, for example, when you • open an account or provide account information • direct us to buy securities or direct us to sell your securities • make a wire transfer We also collect your personal information from others, such as credit bureaus, affiliates and other companies. |
| Why can’t I limit all sharing? | | Federal law gives you the right to limit only • sharing for affiliates’ everyday business purposes – information about your creditworthiness • affiliates from using your information to market to you • sharing for nonaffiliates to market to you State laws and individual companies may give you additional rights to limit sharing. |
| | |
| Definitions |
| Affiliates | | Companies related by common ownership or control. They can be financial and nonfinancial companies. • MFS does not share personal information with affiliates, except for everyday business purposes as described on page one of this notice. |
| Nonaffiliates | | Companies not related by common ownership or control. They can be financial and nonfinancial companies. • MFS does not share with nonaffiliates so they can market to you. |
| Joint Marketing | | A formal agreement between nonaffiliated financial companies that together market financial products or services to you. • MFS doesn’t jointly market. |
| | |
| Other important information |
| If you own an MFS product or receive an MFS service in the name of a third party such as a bank or broker-dealer, their privacy policy may apply to you instead of ours. |
30
ANNUAL REPORT
December 31, 2014

MFS® CONSERVATIVE ALLOCATION PORTFOLIO
MFS® Variable Insurance Trust III

VCA-ANN
MFS® CONSERVATIVE ALLOCATION PORTFOLIO
CONTENTS
The report is prepared for the general information of contract owners. It is authorized for distribution to prospective investors only when preceded or accompanied by a current prospectus.
NOT FDIC INSURED Ÿ MAY LOSE VALUE Ÿ NO BANK OR CREDIT UNION GUARANTEE Ÿ NOT A DEPOSIT Ÿ NOT INSURED BY ANY FEDERAL GOVERNMENT AGENCY OR NCUA/NCUSIF
MFS Conservative Allocation Portfolio
LETTER FROM THE CHAIRMAN

Dear Contract Owners:
As 2015 begins, sharply lower oil prices are reshaping the global economy, adding to deflationary pressures in the eurozone and exacerbating challenges faced by oil exporters such as Russia. The U.S. economy stands on firmer ground, having expanded steadily over the past year. The U.S. labor market has regained momentum, consumer confidence is buoyant and gasoline prices have tumbled, boosting prospects for a stronger economic rebound in 2015.
Other regions are struggling. The eurozone economy is barely expanding, and the European Central Bank (ECB) has introduced large-scale asset purchases.
Despite Japan’s efforts to strengthen its economy, its sales tax increase last spring tipped the country into a recession, leading to additional monetary stimulus from the Bank of Japan. China’s economy is slowing as it transitions to a more sustainable basis, and its growth rate will likely continue to decline.
As always, active risk management is integral to how we at MFS® manage your investments. We use a collaborative process, sharing insights across asset classes, regions and economic sectors. Our global investment team uses a diversified, multidisciplined, long-term approach.
Applying proven principles, such as asset allocation and diversification, can best serve investors over the long term. We are confident that this approach can help you as you work with your financial advisors to reach your goals in the years ahead.
Respectfully,

Robert J. Manning
Chairman
MFS Investment Management
February 13, 2015
The opinions expressed in this letter are subject to change and may not be relied upon for investment advice. No forecasts can be guaranteed.
1
MFS Conservative Allocation Portfolio
PORTFOLIO COMPOSITION
Portfolio target allocation
| | | | |
| Portfolio holdings | | | | |
| MFS Research Bond Series | | | 17.1% | |
| MFS Limited Maturity Portfolio | | | 12.0% | |
| MFS Government Securities Portfolio | | | 10.0% | |
| MFS Inflation-Adjusted Bond Portfolio | | | 10.0% | |
| MFS Global Governments Portfolio | | | 8.0% | |
| MFS Value Series | | | 6.0% | |
| MFS Growth Series | | | 6.0% | |
| MFS Research Series | | | 5.9% | |
| MFS High Yield Portfolio | | | 5.0% | |
| MFS Mid Cap Growth Series | | | 4.0% | |
| MFS Mid Cap Value Portfolio | | | 4.0% | |
| MFS Research International Portfolio | | | 3.9% | |
| MFS Global Real Estate Portfolio | | | 2.0% | |
| MFS International Value Portfolio | | | 2.0% | |
| MFS International Growth Portfolio | | | 1.9% | |
| MFS New Discovery Value Portfolio | | | 1.0% | |
| MFS New Discovery Series | | | 1.0% | |
| Cash & Other | | | 0.2% | |
Portfolio actual allocation
Cash & Other can include cash, other assets less liabilities, and short-term securities.
Percentages are based on net assets as of 12/31/14.
The portfolio is actively managed and current holdings may be different.
2
MFS Conservative Allocation Portfolio
MANAGEMENT REVIEW
Summary of Results
For the twelve months ended December 31, 2014, Initial Class shares of the MFS Conservative Allocation Portfolio (“fund”) provided a total return of 4.61%, while Service Class shares of the fund provided a total return of 4.41%. These compare with a return of 5.97% for the fund’s benchmark, the Barclays U.S. Aggregate Bond Index. The fund’s other benchmark, the MFS Conservative Allocation Portfolio Blended Index (“Blended Index”), generated a return of 7.47%. The Blended Index reflects the blended returns of various equity and fixed income market indices, with percentage allocations to each index designed to resemble the allocations of the fund. The market indices and related percentage allocations used to compile the Blended Index are set forth in the Performance Summary.
Market Environment
Early in the period, US equities suffered what proved to be a temporary setback due to concerns over emerging markets as well as what was perceived at the time to be a pause in US economic growth, partially caused by extreme weather events and a weak December 2013 labor market report. Markets soon recovered as the economic pause concluded and investors appeared to have become increasingly comfortable that newly-installed US Federal Reserve (“Fed”) Chair Janet Yellen would not make any substantial changes to the trajectory of Fed monetary policy.
A generally risk-friendly, carry trade environment persisted from February 2014 until mid-year. While geopolitical tensions flared in the Middle East and Russia/Ukraine, any market setbacks were short-lived as improving economic growth in the US, coupled with prospects for easier monetary policy in regions with slowing growth, such as Japan, Europe and China, supported risk assets. For example, the European Central Bank (“ECB”) cut policy interest rates into negative territory and, by the end of the period, expectations were for additional rate cuts and the announcement for non-conventional easing measures. Similarly, the Bank of Japan surprised markets late in the period with fresh stimulus measures given lackluster growth trends. The related decline in developed market government bond yields and credit spreads were also supportive for equity markets. At the end of the period, the US equity market was trading close to all-time highs and US Treasury yields were close to their lows for the period. However, credit markets did not fare as well in the second half of 2014, particularly US high yield and emerging market debt. The higher weightings of oil and gas credits in these asset classes resulted in widening spreads and increased volatility as oil prices began to decline in an accelerated fashion in the fourth quarter.
Factors affecting Performance
The fund underperformed the Blended Index over the period. The fund’s investments in segments of the fixed income market delivered positive returns but underperformed the fixed income portion of the Blended Index as investors extended into longer maturity bonds which helped flatten the yield curve. Consequently, the fund’s allocation to the relatively shorter duration MFS Limited Maturity Portfolio dragged down performance relative to the fixed income portion of the blended index. Additionally, the fund’s investment in the MFS Global Governments Portfolio held back relative performance as international bonds underperformed US bonds.
US equities significantly outperformed international stocks during the period, however several of the funds held within the US equities market segment underperformed their respective benchmarks, particularly the fund’s holdings in the MFS Growth and MFS Research Series. Additionally, the fund’s allocations in the MFS New Discovery Value Portfolio and the MFS New Discovery Series dampened relative results as small cap stocks generally underperformed large cap stocks.
Respectfully,
Joseph Flaherty
Portfolio Manager
The views expressed in this report are those of the portfolio manager only through the end of the period of the report as stated on the cover and do
not necessarily reflect the views of MFS or any other person in the MFS organization. These views are subject to change at any time based on market or
other conditions, and MFS disclaims any responsibility to update such views. These views may not be relied upon as investment advice or an indication
of trading intent on behalf of any MFS portfolio. References to specific securities are not recommendations of such securities, and may not be
representative of any MFS portfolio’s current or future investments.
3
MFS Conservative Allocation Portfolio
PERFORMANCE SUMMARY THROUGH 12/31/14
The following chart illustrates the historical performance of the fund in comparison to its benchmark(s). Benchmarks are unmanaged and may not be invested in directly. Benchmark returns do not reflect any fees or expenses. The performance of other share classes will be greater than or less than that of the class depicted below. (See Notes to Performance Summary.)
Performance data shown represents past performance and is no guarantee of future results. Investment return and principal value fluctuate so your units, when sold, may be worth more or less than the original cost; current performance may be lower or higher than quoted. The performance shown does not reflect the deduction of taxes, if any, that a contract holder would pay on fund distributions or the redemption of contract units. The returns for the fund shown also do not reflect the deduction of expenses associated with variable products, such as mortality and expense risk charges, separate account charges, and sales charges imposed by the insurance company separate accounts. Such expenses would reduce the overall returns shown.
Growth of a Hypothetical $10,000 Investment (t)
Total Returns through 12/31/14
Average annual total returns
| | | | | | | | | | | | |
| | | Share Class | | Class inception date | | 1-yr | | 5-yr | | Life (t) | | |
| | | Initial Class | | 10/01/08 | | 4.61% | | 6.78% | | 6.96% | | |
| | | Service Class | | 10/01/08 | | 4.41% | | 6.52% | | 6.71% | | |
| | | | |
| Comparative benchmarks | | | | | | | | |
| | | Barclays U.S. Aggregate Bond Index (f) | | 5.97% | | 4.45% | | 5.25% | | |
| | | MFS Conservative Allocation Portfolio Blended Index (f)(w) | | 7.47% | | 7.98% | | 7.60% | | |
| | | FTSE EPRA/NAREIT Developed Real Estate Index (f) | | 15.89% | | 12.03% | | 8.34% | | |
| | | MSCI EAFE Index (f) | | (4.48)% | | 5.81% | | 5.61% | | |
| | | Standard & Poor’s 500 Stock Index (f) | | 13.69% | | 15.45% | | 11.94% | | |
| (f) | | Source: FactSet Research Systems Inc. |
| (t) | | For the period from the class inception date through the stated period end. (See Notes to Performance Summary.) |
| (w) | | As of December 31, 2014, the MFS Conservative Allocation Portfolio Blended Index was comprised of 62% Barclays U.S. Aggregate Bond Index, 28% Standard & Poor’s 500 Stock Index, 8% MSCI EAFE Index, and 2% FTSE EPRA/NAREIT Developed Real Estate Index. |
Benchmark Definitions
Barclays U.S. Aggregate Bond Index – a market capitalization-weighted index that measures the performance of the U.S. investment-grade, fixed rate bond market, with index components for government and corporate securities, mortgage pass-through securities, and asset-backed securities with at least one year to final maturity.
FTSE EPRA/NAREIT Developed Real Estate Index – measures the performance of eligible real estate equities worldwide that generate a majority of their revenue and income through the ownership, disposure and development of income-producing real estate.
MSCI EAFE Index – a market capitalization-weighted index that is designed to measure equity market performance in the developed markets, excluding the U.S. and Canada.
4
MFS Conservative Allocation Portfolio
Performance Summary – continued
Standard & Poor’s 500 Stock Index – a market capitalization-weighted index of 500 widely held equity securities, designed to measure broad U.S. equity performance.
It is not possible to invest directly in an index.
Notes to Performance Summary
Average annual total return represents the average annual change in value for each share class for the periods presented. Life returns are presented where the share class has less than 10 years of performance history and represent the average annual total return from the class inception date to the stated period end date.
Performance results reflect any applicable expense subsidies and waivers in effect during the periods shown. Without such subsidies and waivers the fund’s performance results would be less favorable. Please see the prospectus and financial statements for complete details. All results are historical and assume the reinvestment of any dividends and capital gains distributions.
Performance prior to close of business December 7, 2012, reflects time periods when another adviser or subadviser was responsible for selecting investments for the fund under a different investment objective and different investment strategies, underlying fund selections, and underlying fund target weightings of the fund.
Performance results do not include adjustments made for financial reporting purposes in accordance with U.S. generally accepted accounting principles and may differ from amounts reported in the financial highlights.
From time to time the fund may receive proceeds from litigation settlements, without which performance would be lower.
5
MFS Conservative Allocation Portfolio
EXPENSE TABLE
Fund Expenses Borne by the Contract Holders During the Period,
July 1, 2014 through December 31, 2014
As a contract holder of the fund, you incur ongoing costs, including distribution and/or service (12b-1) fees; and other fund expenses. This example is intended to help you understand your ongoing costs (in dollars) of investing in the fund and to compare these costs with the ongoing costs of investing in other mutual funds.
In addition to the fees and expenses which the fund bears directly, the fund indirectly bears a pro rata share of the fees and expenses of the underlying funds in which the fund invests. Because the underlying funds have varied expenses and fee levels and the fund may own different proportions of the underlying funds at different times, the amount of fees and expenses incurred indirectly by the fund will vary. If these indirect costs were included, your costs would have been higher.
The example is based on an investment of $1,000 invested at the beginning of the period and held for the entire period July 1, 2014 through December 31, 2014.
Actual Expenses
The first line for each share class in the following table provides information about actual account values and actual expenses. You may use the information in this line, together with the amount you invested, to estimate the expenses that you paid over the period. Simply divide your account value by $1,000 (for example, an $8,600 account value divided by $1,000 = 8.6), then multiply the result by the number in the first line under the heading entitled “Expenses Paid During Period” to estimate the expenses you paid on your account during this period.
Hypothetical Example for Comparison Purposes
The second line for each share class in the following table provides information about hypothetical account values and hypothetical expenses based on the fund’s actual expense ratio and an assumed rate of return of 5% per year before expenses, which is not the fund’s actual return. The hypothetical account values and expenses may not be used to estimate the actual ending account balance or expenses you paid for the period. You may use this information to compare the ongoing costs of investing in the fund and other funds. To do so, compare this 5% hypothetical example with the 5% hypothetical examples that appear in the shareholder reports of the other funds.
Please note that the expenses shown in the table are meant to highlight the fund’s ongoing costs only and do not take into account the fees and expenses imposed under the variable contracts through which your investment in the fund is made. Therefore, the second line for each share class in the table is useful in comparing ongoing costs associated with an investment in vehicles (such as the fund) which fund benefits under variable annuity and variable life insurance contracts and to qualified pension and retirement plans only, and will not help you determine the relative total costs of investing in the fund through variable annuity and variable life insurance contracts. If the fees and expenses imposed under the variable contracts were included, your costs would have been higher.
| | | | | | | | | | | | | | | | | | |
| Share Class | | | | Annualized
Expense Ratio | | | Beginning
Account Value
7/01/14 | | | Ending
Account Value
12/31/14 | | | Expenses Paid
During Period (p)
7/01/14-12/31/14 | |
| Initial Class | | Actual | | | 0.02% | | | | $1,000.00 | | | | $1,002.93 | | | | $0.10 | |
| | Hypothetical (h) | | | 0.02% | | | | $1,000.00 | | | | $1,025.10 | | | | $0.10 | |
| Service Class | | Actual | | | 0.27% | | | | $1,000.00 | | | | $1,002.67 | | | | $1.36 | |
| | Hypothetical (h) | | | 0.27% | | | | $1,000.00 | | | | $1,023.84 | | | | $1.38 | |
| (h) | 5% class return per year before expenses. |
| (p) | “Expenses Paid During Period” are equal to each class’s annualized expense ratio, as shown above, multiplied by the average account value over the period, multiplied by 184/365 (to reflect the one-half year period). In addition to the fees and expenses which the fund bears directly, the fund indirectly bears a pro rata share of the fees and expenses of the underlying funds in which the fund invests. If these indirect costs were included, your costs would have been higher. |
6
MFS Conservative Allocation Portfolio
PORTFOLIO OF INVESTMENTS – 12/31/14
The Portfolio of Investments is a complete list of all securities owned by your fund. It is categorized by broad-based asset classes.
| | | | | | | | |
| Issuer | | Shares/Par | | | Value ($) | |
| UNDERLYING AFFILIATED FUNDS – 99.8% | |
| MFS Global Governments Portfolio – Initial Class | | | 6,109,691 | | | $ | 63,968,463 | |
| MFS Global Real Estate Portfolio – Initial Class | | | 1,140,219 | | | | 16,031,476 | |
| MFS Government Securities Portfolio – Initial Class | | | 6,204,941 | | | | 80,788,336 | |
| MFS Growth Series – Initial Class | | | 1,206,691 | | | | 47,965,950 | |
| MFS High Yield Portfolio – Initial Class | | | 6,601,582 | | | | 40,335,669 | |
| MFS Inflation-Adjusted Bond Portfolio – Initial Class | | | 7,784,611 | | | | 80,337,190 | |
| MFS International Growth Portfolio – Initial Class | | | 1,194,780 | | | | 15,878,626 | |
| MFS International Value Portfolio – Initial Class | | | 733,558 | | | | 15,940,220 | |
| MFS Limited Maturity Portfolio – Initial Class | | | 9,468,235 | | | | 96,860,042 | |
| MFS Mid Cap Growth Series – Initial Class | | | 3,665,069 | | | | 32,106,002 | |
| MFS Mid Cap Value Portfolio – Initial Class | | | 3,274,777 | | | | 32,092,815 | |
| MFS New Discovery Series – Initial Class | | | 492,528 | | | | 8,038,050 | |
| MFS New Discovery Value Portfolio – Initial Class | | | 749,889 | | | | 8,053,809 | |
| MFS Research Bond Series – Initial Class | | | 10,177,550 | | | | 137,396,927 | |
| MFS Research International Portfolio – Initial Class | | | 2,145,122 | | | | 31,232,976 | |
| MFS Research Series – Initial Class | | | 1,647,582 | | | | 47,961,112 | |
| MFS Value Series – Initial Class | | | 2,358,856 | | | | 47,979,127 | |
| | | | | | | | |
| Total Underlying Affiliated Funds (Identified Cost, $743,262,058) | | | | | | $ | 802,966,790 | |
| | | | | | | | |
| | | | | | | | |
| Issuer | | Shares/Par | | | Value ($) | |
| MONEY MARKET FUNDS – 0.1% | | | | | |
| MFS Institutional Money Market Portfolio, 0.09%, at Cost and Net Asset Value (v) | | | 1,188,917 | | | $ | 1,188,917 | |
| | | | | | | | |
Total Investments
(Identified Cost, $744,450,975) | | | | | | $ | 804,155,707 | |
| | | | | | | | |
OTHER ASSETS, LESS
LIABILITIES – 0.1% | | | | 567,082 | |
| | | | | | | | |
| NET ASSETS – 100.0% | | | | | | $ | 804,722,789 | |
| | | | | | | | |
| (v) | Underlying affiliated fund that is available only to investment companies managed by MFS. The rate quoted for the MFS Institutional Money Market Portfolio is the annualized seven-day yield of the fund at period end. |
See Notes to Financial Statements
7
MFS Conservative Allocation Portfolio
FINANCIAL STATEMENTS | STATEMENT OF ASSETS AND LIABILITIES
This statement represents your fund’s balance sheet, which details the assets and liabilities comprising the total value of the fund.
| | | | | | | | |
At 12/31/14 | | | | | | | | |
Assets | | | | | | | | |
Investments – | | | | | | | | |
Underlying affiliated funds, at value (identified cost, $744,450,975) | | | $804,155,707 | | | | | |
Receivables for | | | | | | | | |
Investments sold | | | 1,180,467 | | | | | |
Fund shares sold | | | 4,193 | | | | | |
Other assets | | | 6,615 | | | | | |
Total assets | | | | | | | $805,346,982 | |
Liabilities | | | | | | | | |
Payable for fund shares reacquired | | | $553,530 | | | | | |
Payable to affiliates | | | | | | | | |
Administrator | | | 96 | | | | | |
Shareholder servicing costs | | | 97 | | | | | |
Distribution and/or service fees | | | 11,026 | | | | | |
Payable for independent Trustees’ compensation | | | 64 | | | | | |
Accrued expenses and other liabilities | | | 59,380 | | | | | |
Total liabilities | | | | | | | $624,193 | |
Net assets | | | | | | | $804,722,789 | |
Net assets consist of | | | | | | | | |
Paid-in capital | | | $707,144,386 | | | | | |
Unrealized appreciation (depreciation) on investments | | | 59,704,732 | | | | | |
Accumulated net realized gain (loss) on investments | | | 14,955,260 | | | | | |
Undistributed net investment income | | | 22,918,411 | | | | | |
Net assets | | | | | | | $804,722,789 | |
Shares of beneficial interest outstanding | | | | | | | 68,217,619 | |
| | | | | | | | | | | | |
| | | Net assets | | | Shares
outstanding | | | Net asset value
per share | |
Initial Class | | | $2,947,813 | | | | 249,999 | | | | $11.79 | |
Service Class | | | 801,774,976 | | | | 67,967,620 | | | | 11.80 | |
See Notes to Financial Statements
8
MFS Conservative Allocation Portfolio
FINANCIAL STATEMENTS | STATEMENT OF OPERATIONS
This statement describes how much your fund earned in investment income and accrued in expenses. It also describes any gains and/or losses generated by fund operations.
| | | | | | | | |
Year ended 12/31/14 | | | | | | | | |
Net investment income | | | | | | | | |
Dividends from underlying affiliated funds | | | | | | | $14,006,706 | |
Expenses | | | | | | | | |
Distribution and/or service fees | | | 2,129,015 | | | | | |
Shareholder servicing costs | | | 21,294 | | | | | |
Administrative services fee | | | 17,498 | | | | | |
Independent Trustees’ compensation | | | 16,248 | | | | | |
Custodian fee | | | 62,327 | | | | | |
Audit and tax fees | | | 41,459 | | | | | |
Legal fees | | | 7,274 | | | | | |
Miscellaneous | | | 23,180 | | | | | |
Total expenses | | | | | | | $2,318,295 | |
Fees paid indirectly | | | (2 | ) | | | | |
Reduction of expenses by investment adviser | | | (1,504 | ) | | | | |
Net expenses | | | | | | | $2,316,789 | |
Net investment income | | | | | | | $11,689,917 | |
Realized and unrealized gain (loss) on investments | | | | | | | | |
Realized gain (loss) (identified cost basis) | | | | | | | | |
Investments in underlying affiliated funds | | | $7,309,836 | | | | | |
Capital gain distributions from underlying affiliated funds | | | 20,336,550 | | | | | |
Net realized gain (loss) on investments | | | | | | | $27,646,386 | |
Change in unrealized appreciation (depreciation) on investments | | | | | | | $(2,313,607 | ) |
Net realized and unrealized gain (loss) on investments | | | | | | | $25,332,779 | |
Change in net assets from operations | | | | | | | $37,022,696 | |
See Notes to Financial Statements
9
MFS Conservative Allocation Portfolio
FINANCIAL STATEMENTS | STATEMENTS OF CHANGES IN NET ASSETS
These statements describe the increases and/or decreases in net assets resulting from operations, any distributions, and any shareholder transactions.
| | | | | | | | |
For years ended 12/31 | | | 2014 | | | | 2013 | |
Change in net assets | | | | | | | | |
| From operations | | | | | | | | |
Net investment income | | | $11,689,917 | | | | $5,845,790 | |
Net realized gain (loss) on investments | | | 27,646,386 | | | | 16,340,409 | |
Net unrealized gain (loss) on investments | | | (2,313,607 | ) | | | 63,054,147 | |
Change in net assets from operations | | | $37,022,696 | | | | $85,240,346 | |
| Distributions declared to shareholders | | | | | | | | |
From net investment income | | | $(13,163,402 | ) | | | $(25,330,153 | ) |
From net realized gain on investments | | | (9,528,404 | ) | | | (66,949,269 | ) |
Total distributions declared to shareholders | | | $(22,691,806 | ) | | | $(92,279,422 | ) |
Change in net assets from fund share transactions | | | $(110,269,542 | ) | | | $(63,442,221 | ) |
Total change in net assets | | | $(95,938,652 | ) | | | $(70,481,297 | ) |
| Net assets | | | | | | | | |
At beginning of period | | | 900,661,441 | | | | 971,142,738 | |
At end of period (including undistributed net investment income of $22,918,411 and
$13,162,734, respectively) | | | $804,722,789 | | | | $900,661,441 | |
See Notes to Financial Statements
10
MFS Conservative Allocation Portfolio
FINANCIAL STATEMENTS | FINANCIAL HIGHLIGHTS
The financial highlights table is intended to help you understand the fund’s financial performance for the past 5 years. Certain information reflects financial results for a single fund share. The total returns in the table represent the rate by which an investor would have earned (or lost) on an investment in the fund share class (assuming reinvestment of all distributions) held for the entire period.
| | | | | | | | | | | | | | | | | | | | |
| Initial Class | | Years ended 12/31 | |
| | | 2014 | | | 2013 | | | 2012 | | | 2011 | | | 2010 | |
Net asset value, beginning of period | | | $11.61 | | | | $11.80 | | | | $11.47 | | | | $11.79 | | | | $10.94 | |
| Income (loss) from investment operations | | | | | | | | | | | | | | | | | | | | |
Net investment income (d)(l) | | | $0.20 | | | | $0.11 | | | | $0.14 | | | | $0.19 | | | | $0.14 | |
Net realized and unrealized gain (loss) on investments | | | 0.34 | | | | 0.97 | | | | 0.88 | | | | (0.08 | ) | | | 0.94 | |
Total from investment operations | | | $0.54 | | | | $1.08 | | | | $1.02 | | | | $0.11 | | | | $1.08 | |
| Less distributions declared to shareholders | | | | | | | | | | | | | | | | | | | | |
From net investment income | | | $(0.22 | ) | | | $(0.37 | ) | | | $(0.35 | ) | | | $(0.17 | ) | | | $(0.16 | ) |
From net realized gain on investments | | | (0.14 | ) | | | (0.90 | ) | | | (0.34 | ) | | | (0.26 | ) | | | (0.07 | ) |
Total distributions declared to shareholders | | | $(0.36 | ) | | | $(1.27 | ) | | | $(0.69 | ) | | | $(0.43 | ) | | | $(0.23 | ) |
Net asset value, end of period (x) | | | $11.79 | | | | $11.61 | | | | $11.80 | | | | $11.47 | | | | $11.79 | |
Total return (%) (k)(r)(s)(x) | | | 4.61 | | | | 9.82 | | | | 8.90 | | | | 0.97 | | | | 9.92 | |
Ratios (%) (to average net assets)
and Supplemental data: | | | | | | | | | | | | | | | | | | | | |
Expenses before expense reductions (f)(h) | | | 0.02 | | | | 0.03 | | | | 0.16 | | | | 0.20 | | | | 0.21 | |
Expenses after expense reductions (f)(h) | | | 0.02 | | | | 0.03 | | | | N/A | | | | N/A | | | | 0.20 | |
Net investment income (l) | | | 1.66 | | | | 0.93 | | | | 1.14 | | | | 1.57 | | | | 1.27 | |
Portfolio turnover | | | 1 | | | | 1 | | | | 57 | | | | 7 | | | | 16 | |
Net assets at end of period (000 omitted) | | | $2,948 | | | | $4,167 | | | | $5,024 | | | | $5,505 | | | | $5,053 | |
See Notes to Financial Statements
11
MFS Conservative Allocation Portfolio
Financial Highlights – continued
| | | | | | | | | | | | | | | | | | | | |
| Service Class | | Years ended 12/31 | |
| | | 2014 | | | 2013 | | | 2012 | | | 2011 | | | 2010 | |
Net asset value, beginning of period | | | $11.61 | | | | $11.80 | | | | $11.46 | | | | $11.79 | | | | $10.94 | |
| Income (loss) from investment operations | | | | | | | | | | | | | | | | | | | | |
Net investment income (d)(l) | | | $0.16 | | | | $0.07 | | | | $0.14 | | | | $0.18 | | | | $0.13 | |
Net realized and unrealized gain (loss) on investments | | | 0.36 | | | | 0.98 | | | | 0.86 | | | | (0.11 | ) | | | 0.92 | |
Total from investment operations | | | $0.52 | | | | $1.05 | | | | $1.00 | | | | $0.07 | | | | $1.05 | |
| Less distributions declared to shareholders | | | | | | | | | | | | | | | | | | | | |
From net investment income | | | $(0.19 | ) | | | $(0.34 | ) | | | $(0.32 | ) | | | $(0.14 | ) | | | $(0.13 | ) |
From net realized gain on investments | | | (0.14 | ) | | | (0.90 | ) | | | (0.34 | ) | | | (0.26 | ) | | | (0.07 | ) |
Total distributions declared to shareholders | | | $(0.33 | ) | | | $(1.24 | ) | | | $(0.66 | ) | | | $(0.40 | ) | | | $(0.20 | ) |
Net asset value, end of period (x) | | | $11.80 | | | | $11.61 | | | | $11.80 | | | | $11.46 | | | | $11.79 | |
Total return (%) (k)(r)(s)(x) | | | 4.41 | | | | 9.52 | | | | 8.72 | | | | 0.63 | | | | 9.64 | |
Ratios (%) (to average net assets)
and Supplemental data: | | | | | | | | | | | | | | | | | | | | |
Expenses before expense reductions (f)(h) | | | 0.27 | | | | 0.28 | | | | 0.41 | | | | 0.45 | | | | 0.47 | |
Expenses after expense reductions (f)(h) | | | 0.27 | | | | 0.28 | | | | N/A | | | | N/A | | | | 0.45 | |
Net investment income (l) | | | 1.36 | | | | 0.62 | | | | 1.14 | | | | 1.52 | | | | 1.18 | |
Portfolio turnover | | | 1 | | | | 1 | | | | 57 | | | | 7 | | | | 16 | |
Net assets at end of period (000 omitted) | | | $801,775 | | | | $896,495 | | | | $966,119 | | | | $944,392 | | | | $756,690 | |
Information prior to the close of business on December 7, 2012, reflects time periods when another adviser or subadviser was responsible for selecting investments for the fund under a different investment objective and different investment strategies, underlying fund selections, and underlying fund target weightings of the fund.
| (d) | Per share data is based on average shares outstanding. |
| (f) | Ratios do not reflect reductions from fees paid indirectly, if applicable. |
| (h) | In addition to the fees and expenses which the fund bears directly, the fund indirectly bears a pro rata share of the fees and expenses of the underlying affiliated funds in which the fund invests. Accordingly, the expense ratio for the fund reflects only those fees and expenses borne directly by the fund. Because the underlying affiliated funds have varied expense and fee levels and the fund may own different proportions of the underlying affiliated funds at different times, the amount of fees and expenses incurred indirectly by the fund will vary. |
| (k) | The total return does not reflect expenses that apply to separate accounts. Inclusion of these charges would reduce the total return figures for all periods shown. |
| (l) | Recognition of net investment income by the fund may be affected by the timing of the declaration of dividends by the underlying affiliated funds in which the fund invests. The ratios and per share amounts do not include net investment income of the underlying affiliated funds in which the fund invests. |
| (r) | Certain expenses have been reduced without which performance would have been lower. |
| (s) | From time to time the fund may receive proceeds from litigation settlements, without which performance would be lower. |
| (x) | The net asset values per share and total returns have been calculated on net assets which include adjustments made in accordance with U.S. generally accepted accounting principles required at period end for financial reporting purposes. |
See Notes to Financial Statements
12
MFS Conservative Allocation Portfolio
NOTES TO FINANCIAL STATEMENTS
| (1) | | Business and Organization |
MFS Conservative Allocation Portfolio (the fund) is a diversified series of MFS Variable Insurance Trust III (the trust). The trust is organized as a Delaware statutory trust and is registered under the Investment Company Act of 1940, as amended, as an open-end management investment company. The shareholders of each series of the trust are separate accounts of insurance companies, which offer variable annuity and/or life insurance products, and qualified retirement and pension plans.
The fund is an investment company and accordingly follows the investment company accounting and reporting guidance of the Financial Accounting Standards Board (FASB) Accounting Standards Codification Topic 946 Financial Services – Investment Companies.
| (2) | | Significant Accounting Policies |
General – The preparation of financial statements in conformity with U.S. generally accepted accounting principles requires management to make estimates and assumptions that affect the reported amounts of assets and liabilities, and disclosure of contingent assets and liabilities at the date of the financial statements and the reported amounts of increases and decreases in net assets from operations during the reporting period. Actual results could differ from those estimates. In the preparation of these financial statements, management has evaluated subsequent events occurring after the date of the fund’s Statement of Assets and Liabilities through the date that the financial statements were issued.
The fund is a “fund of funds”, which invests the majority of its assets in other MFS mutual funds (hereafter referred to as “underlying affiliated funds” or “underlying funds”), which may have different fiscal year ends than the funds. The underlying funds, in turn, may engage in a number of investment techniques and practices, which involve certain risks. Certain underlying funds invest their portfolio in high-yield securities rated below investment grade. Investments in high-yield securities involve greater degrees of credit and market risk than investments in higher-rated securities and tend to be more sensitive to economic conditions. Certain underlying funds invest a significant portion of their assets in asset-backed and/or mortgage-backed securities. The value of these securities may depend, in part, on the issuer’s or borrower’s credit quality or ability to pay principal and interest when due and may fall if an issuer or borrower defaults on its obligation to pay principal or interest or if the instrument’s credit rating is downgraded by a credit rating agency. U.S. Government securities not supported as to the payment of principal or interest by the U.S. Treasury, such as those issued by Fannie Mae, Freddie Mac, and the Federal Home Loan Banks, are subject to greater credit risk than are U.S. Government securities supported by the U.S. Treasury, such as those issued by Ginnie Mae. Certain underlying funds invest in foreign securities, including securities of emerging market issuers. Investments in foreign securities are vulnerable to the effects of changes in the relative values of the local currency and the U.S. dollar and to the effects of changes in each country’s legal, political, and economic environment. The markets of emerging markets countries are generally more volatile than the markets of developed countries with more mature economies. All of the risks of investing in foreign securities previously described are heightened when investing in emerging markets countries.
The accounting policies of the underlying funds in which the fund invests are outlined in the underlying funds’ shareholder reports, which are available without charge by calling 1-800-225-2606, at mfs.com and on the Securities and Exchange Commission (SEC) web site at http://www.sec.gov or at the SEC’s public reference room in Washington, D.C. The underlying funds’ shareholder reports are not covered by this report.
In June 2014, FASB issued Accounting Standards Update 2014-11, Transfers and Servicing (Topic 860) – Repurchase-to-Maturity Transactions, Repurchase Financings, and Disclosures (“ASU 2014-11”). ASU 2014-11 changes the accounting for repurchase-to-maturity transactions (i.e., repurchase agreements that settle at the same time as the maturity of the transferred financial asset) and enhances the required disclosures for repurchase agreements and other similar transactions. Although still evaluating the potential impacts of ASU 2014-11 to the fund, management expects that the impact of the fund’s adoption will be limited to additional financial statement disclosures which would first be effective for interim reporting periods beginning after March 15, 2015.
Investment Valuations – Open-end investment companies (underlying funds) are generally valued at their net asset value per share. The investments of underlying funds managed by the adviser are valued as described below. For purposes of this policy disclosure, “fund” also refers to the underlying funds in which the fund-of-funds invests.
Equity securities, including restricted equity securities, are generally valued at the last sale or official closing price as provided by a third-party pricing service on the market or exchange on which they are primarily traded. Equity securities, for which there were no sales reported that day, are generally valued at the last quoted daily bid quotation as provided by a third-party pricing service on the market or exchange on which such securities are primarily traded. Equity securities held short, for which there were no sales reported for that day, are generally valued at the last quoted daily ask quotation as provided by a third-party pricing service on the market or exchange on which such securities are primarily traded. Debt instruments and floating rate loans, including restricted debt instruments, are generally valued at an evaluated or composite bid as provided by a third-party pricing service. Short-term instruments with a maturity at issuance of 60 days or less may be valued at amortized cost, which approximates market value.
13
MFS Conservative Allocation Portfolio
Notes to Financial Statements – continued
Exchange-traded options are generally valued at the last sale or official closing price as provided by a third-party pricing service on the exchange on which such options are primarily traded. Exchange-traded options for which there were no sales reported that day are generally valued at the last daily bid quotation as provided by a third-party pricing service on the exchange on which such options are primarily traded. Options not traded on an exchange are generally valued at a broker/dealer bid quotation. Foreign currency options are generally valued at valuations provided by a third-party pricing service. Futures contracts are generally valued at last posted settlement price as provided by a third-party pricing service on the market on which they are primarily traded. Futures contracts for which there were no trades that day for a particular position are generally valued at the closing bid quotation as provided by a third-party pricing service on the market on which such futures contracts are primarily traded. Forward foreign currency exchange contracts are generally valued at the mean of bid and asked prices for the time period interpolated from rates provided by a third-party pricing service for proximate time periods. Swap agreements are generally valued at valuations provided by a third-party pricing service, which for cleared swaps includes an evaluation of any trading activity at the clearinghouses. Open-end investment companies are generally valued at net asset value per share. Securities and other assets generally valued on the basis of information from a third-party pricing service may also be valued at a broker/dealer bid quotation. Values obtained from third-party pricing services can utilize both transaction data and market information such as yield, quality, coupon rate, maturity, type of issue, trading characteristics, and other market data. The values of foreign securities and other assets and liabilities expressed in foreign currencies are converted to U.S. dollars using the mean of bid and asked prices for rates provided by a third-party pricing service.
The Board of Trustees has delegated primary responsibility for determining or causing to be determined the value of the fund’s investments (including any fair valuation) to the adviser pursuant to valuation policies and procedures approved by the Board. If the adviser determines that reliable market quotations are not readily available, investments are valued at fair value as determined in good faith by the adviser in accordance with such procedures under the oversight of the Board of Trustees. Under the fund’s valuation policies and procedures, market quotations are not considered to be readily available for most types of debt instruments and floating rate loans and many types of derivatives. These investments are generally valued at fair value based on information from third-party pricing services. In addition, investments may be valued at fair value if the adviser determines that an investment’s value has been materially affected by events occurring after the close of the exchange or market on which the investment is principally traded (such as foreign exchange or market) and prior to the determination of the fund’s net asset value, or after the halting of trading of a specific security where trading does not resume prior to the close of the exchange or market on which the security is principally traded. Events that occur on a frequent basis after foreign markets close (such as developments in foreign markets and significant movements in the U.S. markets) and prior to the determination of the fund’s net asset value may be deemed to have a material effect on the value of securities traded in foreign markets. Accordingly, the fund’s foreign equity securities may often be valued at fair value. The adviser generally relies on third-party pricing services or other information (such as the correlation with price movements of similar securities in the same or other markets; the type, cost and investment characteristics of the security; the business and financial condition of the issuer; and trading and other market data) to assist in determining whether to fair value and at what value to fair value an investment. The value of an investment for purposes of calculating the fund’s net asset value can differ depending on the source and method used to determine value. When fair valuation is used, the value of an investment used to determine the fund’s net asset value may differ from quoted or published prices for the same investment. There can be no assurance that the fund could obtain the fair value assigned to an investment if it were to sell the investment at the same time at which the fund determines its net asset value per share.
Various inputs are used in determining the value of the fund’s assets or liabilities. These inputs are categorized into three broad levels. In certain cases, the inputs used to measure fair value may fall into different levels of the fair value hierarchy. In such cases, an investment’s level within the fair value hierarchy is based on the lowest level of input that is significant to the fair value measurement. The fund’s assessment of the significance of a particular input to the fair value measurement in its entirety requires judgment, and considers factors specific to the investment. Level 1 includes unadjusted quoted prices in active markets for identical assets or liabilities. Level 2 includes other significant observable market-based inputs (including quoted prices for similar securities, interest rates, prepayment speed, and credit risk). Level 3 includes unobservable inputs, which may include the adviser’s own assumptions in determining the fair value of investments. The following is a summary of the levels used as of December 31, 2014 in valuing the fund’s assets or liabilities:
| | | | | | | | | | | | | | | | |
| Investments at Value | | Level 1 | | | Level 2 | | | Level 3 | | | Total | |
| Mutual Funds | | | $804,155,707 | | | | $— | | | | $— | | | | $804,155,707 | |
For further information regarding security characteristics, see the Portfolio of Investments. Please refer to the underlying funds’ shareholder reports for further information regarding the levels used in valuing the underlying funds’ assets or liabilities.
Derivatives – The fund does not invest in derivatives directly. The fund does invest in underlying funds that may use derivatives for different purposes, primarily to increase or decrease exposure to a particular market or segment of the market, or security, to increase or decrease interest rate or currency exposure, or as alternatives to direct investments. Derivatives are used for hedging or
14
MFS Conservative Allocation Portfolio
Notes to Financial Statements – continued
non-hedging purposes. While hedging can reduce or eliminate losses, it can also reduce or eliminate gains. When the underlying funds use derivatives as an investment to increase market exposure, or for hedging purposes, gains and losses from derivative instruments may be substantially greater than the derivative’s original cost.
Indemnifications – Under the fund’s organizational documents, its officers and Trustees may be indemnified against certain liabilities and expenses arising out of the performance of their duties to the fund. Additionally, in the normal course of business, the fund enters into agreements with service providers that may contain indemnification clauses. The fund’s maximum exposure under these agreements is unknown as this would involve future claims that may be made against the fund that have not yet occurred.
Investment Transactions and Income – Investment transactions are recorded on the trade date. Interest income is recorded on an accrual basis. All premium and discount is amortized or accreted for financial statement purposes in accordance with U.S. generally accepted accounting principles. Distributions of income and capital gains from the underlying funds are recorded on the ex-dividend date. Recognition of net investment income by the fund is affected by the timing of the declaration of distributions by the underlying funds in which the fund invests. In determining the net gain or loss on securities sold, the cost of securities is determined on the identified cost basis.
The fund and/or the underlying funds may receive proceeds from litigation settlements. Any proceeds received from litigation involving portfolio holdings are reflected in the Statement of Operations in realized gain/loss if the security has been disposed of by the fund or in unrealized gain/loss if the security is still held by the fund. Any other proceeds from litigation not related to portfolio holdings are reflected as other income in the Statement of Operations.
Fees Paid Indirectly – The fund’s custody fee may be reduced according to an arrangement that measures the value of cash deposited with the custodian by the fund. This amount, for the year ended December 31, 2014, is shown as a reduction of total expenses in the Statement of Operations.
Tax Matters and Distributions – The fund intends to qualify as a regulated investment company, as defined under Subchapter M of the Internal Revenue Code, and to distribute all of its taxable income, including realized capital gains. As a result, no provision for federal income tax is required. The fund’s federal tax returns, when filed, will remain subject to examination by the Internal Revenue Service for a three year period. Management has analyzed the fund’s tax positions taken on federal and state tax returns for all open tax years and does not believe that there are any uncertain tax positions that require recognition of a tax liability.
Distributions to shareholders are recorded on the ex-dividend date. Income and capital gain distributions are determined in accordance with income tax regulations, which may differ from U.S. generally accepted accounting principles. Certain capital accounts in the financial statements are periodically adjusted for permanent differences in order to reflect their tax character. These adjustments have no impact on net assets or net asset value per share. Temporary differences which arise from recognizing certain items of income, expense, gain or loss in different periods for financial statement and tax purposes will reverse at some time in the future. Distributions in excess of net investment income or net realized gains are temporary overdistributions for financial statement purposes resulting from differences in the recognition or classification of income or distributions for financial statement and tax purposes.
Book/tax differences primarily relate to wash sale loss deferrals.
The tax character of distributions declared to shareholders for the last two fiscal years is as follows:
| | | | | | | | |
| | | 12/31/14 | | | 12/31/13 | |
| Ordinary income (including any short-term capital gains) | | | $16,966,331 | | | | $25,330,153 | |
| Long-term capital gains | | | 5,725,475 | | | | 66,949,269 | |
| Total distributions | | | $22,691,806 | | | | $92,279,422 | |
The federal tax cost and the tax basis components of distributable earnings were as follows:
| | | | |
| As of 12/31/14 | | | | |
| Cost of investments | | | $745,796,212 | |
| Gross appreciation | | | 68,362,433 | |
| Gross depreciation | | | (10,002,938 | ) |
| Net unrealized appreciation (depreciation) | | | $58,359,495 | |
| Undistributed ordinary income | | | 23,558,668 | |
| Undistributed long-term capital gain | | | 15,660,240 | |
Multiple Classes of Shares of Beneficial Interest – The fund offers multiple classes of shares, which differ in their respective distribution and/or service fees. The fund’s income, realized and unrealized gain (loss), and common expenses are allocated to shareholders based on the daily net assets of each class. Dividends are declared separately for each class. Differences in per share
15
MFS Conservative Allocation Portfolio
Notes to Financial Statements – continued
dividend rates are generally due to differences in separate class expenses. The fund’s distributions declared to shareholders as reported in the Statements of Changes in Net Assets are presented by class as follows:
| | | | | | | | | | | | | | | | |
| | | From net investment
income | | | From net realized gain on
investments | |
| | | Year ended
12/31/14 | | | Year ended
12/31/13 | | | Year ended
12/31/14 | | | Year ended
12/31/13 | |
| Initial Class | | | $74,411 | | | | $153,584 | | | | $45,756 | | | | $370,609 | |
| Service Class | | | 13,088,991 | | | | 25,176,569 | | | | 9,482,648 | | | | 66,578,660 | |
| Total | | | $13,163,402 | | | | $25,330,153 | | | | $9,528,404 | | | | $66,949,269 | |
| (3) | | Transactions with Affiliates |
Investment Adviser – The fund has an investment advisory agreement with MFS to provide overall investment management and related administrative services and facilities to the fund. MFS receives no compensation under this agreement; however MFS receives management fees from the underlying MFS funds.
The investment adviser has agreed in writing to pay a portion of the fund’s operating expenses, excluding distribution and/or service fees, interest, taxes, extraordinary expenses, brokerage and transaction costs, and investment-related expenses such as fees and expenses associated with investments in investment companies and other similar investment vehicles such that fund operating expenses do not exceed 0.20% annually of the fund’s average daily net assets. This written agreement will continue until modified by the fund’s Board of Trustees, but such agreement will continue at least until April 30, 2016. For the year ended December 31, 2014, the fund’s actual operating expenses did not exceed the limit and therefore, the investment adviser did not pay any portion of the fund’s expenses related to this agreement.
In addition to the fees and expenses which the fund bears directly, the fund indirectly bears a pro rata share of the fees and expenses of the underlying funds in which a fund invests. Accordingly, the expense ratio for the fund reflects only those fees and expenses borne directly by the fund.
Distributor – MFS Fund Distributors, Inc. (MFD), a wholly-owned subsidiary of MFS, is the distributor of shares of the fund. The Trustees have adopted a distribution plan for the Service Class shares pursuant to Rule 12b-1 under the Investment Company Act of 1940.
The fund’s distribution plan provides that the fund will pay MFD distribution and/or service fees equal to 0.25% per annum of its average daily net assets attributable to Service Class shares as partial consideration for services performed and expenses incurred by MFD and financial intermediaries (including participating insurance companies that invest in the fund to fund variable annuity and variable life insurance contracts, sponsors of qualified retirement and pension plans that invest in the fund, and affiliates of these participating insurance companies and plan sponsors) in connection with the sale and distribution of the Service Class shares. MFD may subsequently pay all, or a portion, of the distribution and/or service fees to financial intermediaries.
Shareholder Servicing Agent – MFS Service Center, Inc. (MFSC), a wholly-owned subsidiary of MFS, receives a fee from the fund for its services as shareholder servicing agent. For the year ended December 31, 2014, the fee was $21,253, which equated to 0.0025% annually of the fund’s average daily net assets. MFSC also receives payment from the fund for out-of-pocket expenses paid by MFSC on behalf of the fund. For the year ended December 31, 2014, these costs amounted to $41.
Administrator – MFS provides certain financial, legal, shareholder communications, compliance, and other administrative services to each fund. Under an administrative services agreement, each fund partially reimburses MFS the costs incurred to provide these services. Each fund pays an annual fixed amount of $17,500. The administrative services fee incurred for the year ended December 31, 2014 was equivalent to an annual effective rate of 0.0020% of the fund’s average daily net assets:
Trustees’ and Officers’ Compensation – The fund pays compensation to independent Trustees in the form of a retainer, attendance fees, and additional compensation to Board and Committee chairpersons. The fund does not pay compensation directly to Trustees or officers of the fund who are also officers of the investment adviser, all of whom receive remuneration for their services to the fund from MFS. Certain officers and Trustees of the fund are officers or directors of MFS, MFD, and MFSC.
Other – Effective November 1, 2014, this fund and certain other funds managed by MFS (the funds) have entered into a service agreement (the ISO Agreement) which provides for payment of fees solely by the funds to Tarantino LLC in return for the provision of services of an Independent Senior Officer (ISO) for the funds. Frank L. Tarantino serves as the ISO and is an officer of the funds and the sole member of Tarantino LLC. The funds can terminate the ISO Agreement with Tarantino LLC at any time under the terms of the ISO Agreement. Prior to November 1, 2014, the funds had entered into services agreements (the Compliance Officer Agreements) which provided for payment of fees by the funds to Tarantino LLC and Griffin Compliance LLC in return for the provision of services of an Independent Chief Compliance Officer (ICCO) and Assistant ICCO, respectively, for the funds. Prior to November 1, 2014, Frank L. Tarantino served as the ICCO. Effective October 31, 2014, Mr. Tarantino resigned as ICCO and the
16
MFS Conservative Allocation Portfolio
Notes to Financial Statements – continued
Compliance Officer Agreement between the funds and Tarantino LLC was terminated. Prior to June 1, 2014, Robyn L. Griffin served as the Assistant ICCO and was an officer of the funds. Ms. Griffin is the sole member of Griffin Compliance LLC. Effective May 31, 2014, Ms. Griffin resigned as Assistant ICCO and the Compliance Officer Agreement between the funds and Griffin Compliance LLC was terminated. For the year ended December 31, 2014, the aggregate fees paid by the fund under these agreements were $4,086 and are included in “Miscellaneous” expense in the Statement of Operations. MFS had agreed to reimburse the fund for a portion of the payments made by the fund for the services under the Compliance Officer Agreements in the amount of $1,504, which is included in the reduction of total expenses in the Statement of Operations. Additionally, MFS has agreed to bear all expenses associated with office space, other administrative support, and supplies provided to the ICCO, Assistant ICCO, and ISO.
The fund invests in the MFS Institutional Money Market Portfolio which is managed by MFS and seeks current income consistent with preservation of capital and liquidity. Income earned on this investment is included in “Dividends from underlying affiliated funds” in the Statement of Operations. This money market fund does not pay a management fee to MFS.
For the year ended December 31, 2014, purchases and sales of shares of underlying funds aggregated $8,272,852 and $143,560,990, respectively.
| (5) | | Shares of Beneficial Interest |
The fund’s Declaration of Trust permits the Trustees to issue an unlimited number of full and fractional shares of beneficial interest. Transactions in fund shares were as follows:
| | | | | | | | | | | | | | | | |
| | | Year ended 12/31/14 | | | Year ended 12/31/13 | |
| | | Shares | | | Amount | | | Shares | | | Amount | |
| Shares sold | | | | | | | | | | | | | | | | |
Initial Class | | | 23,221 | | | | $272,495 | | | | 28,789 | | | | $341,906 | |
Service Class | | | 915,418 | | | | 10,756,579 | | | | 1,266,568 | | | | 15,297,074 | |
| | | 938,639 | | | | $11,029,074 | | | | 1,295,357 | | | | $15,638,980 | |
| Shares issued to shareholders in reinvestment of distributions | | | | | | | | | | | | | | | | |
Initial Class | | | 10,175 | | | | $120,167 | | | | 47,654 | | | | $524,193 | |
Service Class | | | 1,909,614 | | | | 22,571,639 | | | | 8,333,808 | | | | 91,755,229 | |
| | | 1,919,789 | | | | $22,691,806 | | | | 8,381,462 | | | | $92,279,422 | |
| Shares reacquired | | | | | | | | | | | | | | | | |
Initial Class | | | (142,273 | ) | | | $(1,680,225 | ) | | | (143,242 | ) | | | $(1,644,768 | ) |
Service Class | | | (12,066,767 | ) | | | (142,310,197 | ) | | | (14,268,578 | ) | | | (169,715,855 | ) |
| | | (12,209,040 | ) | | | $(143,990,422 | ) | | | (14,411,820 | ) | | | $(171,360,623 | ) |
| Net change | | | | | | | | | | | | | | | | |
Initial Class | | | (108,877 | ) | | | $(1,287,563 | ) | | | (66,799 | ) | | | $(778,669 | ) |
Service Class | | | (9,241,735 | ) | | | (108,981,979 | ) | | | (4,668,202 | ) | | | (62,663,552 | ) |
| | | (9,350,612 | ) | | | $(110,269,542 | ) | | | (4,735,001 | ) | | | $(63,442,221 | ) |
The fund and certain other funds managed by MFS participate in a $1.1 billion unsecured committed line of credit, subject to a $1 billion sublimit, provided by a syndication of banks under a credit agreement. Borrowings may be made for temporary financing needs. Interest is charged to each fund, based on its borrowings, generally at a rate equal to the higher of the Federal Reserve funds rate or one month LIBOR plus an agreed upon spread. A commitment fee, based on the average daily, unused portion of the committed line of credit, is allocated among the participating funds at the end of each calendar quarter. In addition, the fund and other funds managed by MFS have established unsecured uncommitted borrowing arrangements with certain banks for temporary financing needs. Interest is charged to each fund, based on its borrowings, at a rate equal to the Federal Reserve funds rate plus an agreed upon spread. For the year ended December 31, 2014, the fund’s commitment fee and interest expense were $3,234 and $0, respectively, and are included in “Miscellaneous” expense in the Statement of Operations.
17
MFS Conservative Allocation Portfolio
Notes to Financial Statements – continued
| (7) | | Transactions in Underlying Affiliated Funds – Affiliated Issuers |
An affiliated issuer may be considered one in which the fund owns 5% or more of the outstanding voting securities, or a company which is under common control. For the purposes of this report, the fund assumes the following to be affiliated issuers:
| | | | | | | | | | | | | | | | |
| Underlying Affiliated Funds | | Beginning
Share/Par
Amount | | | Acquisitions
Share/Par
Amount | | | Dispositions
Share/Par
Amount | | | Ending
Share/Par
Amount | |
| MFS Global Governments Portfolio | | | 6,804,953 | | | | 80,129 | | | | (775,391 | ) | | | 6,109,691 | |
| MFS Global Real Estate Portfolio | | | 1,430,547 | | | | 32,513 | | | | (322,841 | ) | | | 1,140,219 | |
| MFS Government Securities Portfolio | | | 7,018,777 | | | | 208,739 | | | | (1,022,575 | ) | | | 6,204,941 | |
| MFS Growth Series | | | 1,391,185 | | | | 114,402 | | | | (298,896 | ) | | | 1,206,691 | |
| MFS High Yield Portfolio | | | 7,160,100 | | | | 383,828 | | | | (942,346 | ) | | | 6,601,582 | |
| MFS Inflation-Adjusted Bond Portfolio | | | 8,918,572 | | | | 102,664 | | | | (1,236,625 | ) | | | 7,784,611 | |
| MFS Institutional Money Market Portfolio | | | 1,352,298 | | | | 69,510,301 | | | | (69,673,682 | ) | | | 1,188,917 | |
| MFS International Growth Portfolio | | | 1,227,482 | | | | 87,533 | | | | (120,235 | ) | | | 1,194,780 | |
| MFS International Value Portfolio | | | 828,399 | | | | 25,605 | | | | (120,446 | ) | | | 733,558 | |
| MFS Limited Maturity Portfolio | | | 10,430,039 | | | | 224,717 | | | | (1,186,521 | ) | | | 9,468,235 | |
| MFS Mid Cap Growth Series | | | 4,027,177 | | | | 508,335 | | | | (870,443 | ) | | | 3,665,069 | |
| MFS Mid Cap Value Portfolio | | | 3,603,646 | | | | 464,996 | | | | (793,865 | ) | | | 3,274,777 | |
| MFS New Discovery Series | | | 412,017 | | | | 122,493 | | | | (41,982 | ) | | | 492,528 | |
| MFS New Discovery Value Portfolio | | | 746,782 | | | | 133,230 | | | | (130,123 | ) | | | 749,889 | |
| MFS Research Bond Series | | | 11,605,875 | | | | 367,124 | | | | (1,795,449 | ) | | | 10,177,550 | |
| MFS Research International Portfolio | | | 2,253,105 | | | | 103,080 | | | | (211,063 | ) | | | 2,145,122 | |
| MFS Research Series | | | 1,890,718 | | | | 170,658 | | | | (413,794 | ) | | | 1,647,582 | |
| MFS Value Series | | | 2,819,176 | | | | 155,186 | | | | (615,506 | ) | | | 2,358,856 | |
| | | | |
| Underlying Affiliated Funds | | Realized
Gain (Loss) | | | Capital Gain
Distributions | | | Dividend
Income | | | Ending
Value | |
| MFS Global Governments Portfolio | | | $(245,103 | ) | | | $— | | | | $361,520 | | | | $63,968,463 | |
| MFS Global Real Estate Portfolio | | | 442,379 | | | | — | | | | 371,282 | | | | 16,031,476 | |
| MFS Government Securities Portfolio | | | (554,569 | ) | | | — | | | | 2,091,696 | | | | 80,788,336 | |
| MFS Growth Series | | | 1,885,509 | | | | 3,350,920 | | | | 52,509 | | | | 47,965,950 | |
| MFS High Yield Portfolio | | | 68,803 | | | | — | | | | 2,287,638 | | | | 40,335,669 | |
| MFS Inflation-Adjusted Bond Portfolio | | | (892,701 | ) | | | — | | | | 753,577 | | | | 80,337,190 | |
| MFS Institutional Money Market Portfolio | | | — | | | | — | | | | 1,077 | | | | 1,188,917 | |
| MFS International Growth Portfolio | | | 331,347 | | | | 743,016 | | | | 150,066 | | | | 15,878,626 | |
| MFS International Value Portfolio | | | 529,935 | | | | — | | | | 322,922 | | | | 15,940,220 | |
| MFS Limited Maturity Portfolio | | | (19,859 | ) | | | 399,535 | | | | 1,291,671 | | | | 96,860,042 | |
| MFS Mid Cap Growth Series | | | 958,107 | | | | 3,654,531 | | | | — | | | | 32,106,002 | |
| MFS Mid Cap Value Portfolio | | | 803,290 | | | | 3,657,770 | | | | 332,705 | | | | 32,092,815 | |
| MFS New Discovery Series | | | 79,123 | | | | 1,689,057 | | | | — | | | | 8,038,050 | |
| MFS New Discovery Value Portfolio | | | 156,259 | | | | 1,182,045 | | | | 45,080 | | | | 8,053,809 | |
| MFS Research Bond Series | | | (1,207,399 | ) | | | — | | | | 4,143,586 | | | | 137,396,927 | |
| MFS Research International Portfolio | | | 565,752 | | | | 340,707 | | | | 616,767 | | | | 31,232,976 | |
| MFS Research Series | | | 1,663,281 | | | | 3,760,699 | | | | 414,442 | | | | 47,961,112 | |
| MFS Value Series | | | 2,745,682 | | | | 1,558,270 | | | | 770,168 | | | | 47,979,127 | |
| | | | | | | | | | | | | | | | |
| | | $7,309,836 | | | | $20,336,550 | | | | $14,006,706 | | | | $804,155,707 | |
| | | | | | | | | | | | | | | | |
18
MFS Conservative Allocation Portfolio
REPORT OF INDEPENDENT REGISTERED PUBLIC ACCOUNTING FIRM
To the Board of Trustees of MFS Variable Insurance Trust III and the Shareholders of
MFS Conservative Allocation Portfolio:
We have audited the accompanying statement of assets and liabilities, including the portfolio of investments, of MFS Conservative Allocation Portfolio (one of the series of MFS Variable Insurance Trust III) (the “Fund”) as of December 31, 2014, and the related statement of operations for the year then ended, the statements of changes in net assets for each of the two years in the period then ended, and the financial highlights for each of the five years in the period then ended. These financial statements and financial highlights are the responsibility of the Fund’s management. Our responsibility is to express an opinion on these financial statements and financial highlights based on our audits.
We conducted our audits in accordance with the standards of the Public Company Accounting Oversight Board (United States). Those standards require that we plan and perform the audit to obtain reasonable assurance about whether the financial statements and financial highlights are free of material misstatement. The Fund is not required to have, nor were we engaged to perform, an audit of its internal control over financial reporting. Our audits included consideration of internal control over financial reporting as a basis for designing audit procedures that are appropriate in the circumstances, but not for the purpose of expressing an opinion on the effectiveness of the Fund’s internal control over financial reporting. Accordingly, we express no such opinion. An audit also includes examining, on a test basis, evidence supporting the amounts and disclosures in the financial statements, assessing the accounting principles used and significant estimates made by management, as well as evaluating the overall financial statement presentation. Our procedures included confirmation of securities owned as of December 31, 2014, by correspondence with the underlying funds’ transfer agent. We believe that our audits provide a reasonable basis for our opinion.
In our opinion, the financial statements and financial highlights referred to above present fairly, in all material respects, the financial position of MFS Conservative Allocation Portfolio as of December 31, 2014, the results of its operations for the year then ended, the changes in its net assets for each of the two years in the period then ended, and the financial highlights for each of the five years in the period then ended, in conformity with accounting principles generally accepted in the United States of America.
DELOITTE & TOUCHE LLP
Boston, Massachusetts
February 13, 2015
19
MFS Conservative Allocation Portfolio
TRUSTEES AND OFFICERS – IDENTIFICATION AND BACKGROUND
The Trustees and Officers of the Trust, as of February 1, 2015, are listed below, together with their principal occupations during the past five years. (Their titles may have varied during that period.) The address of each Trustee and Officer is 111 Huntington Avenue, Boston, Massachusetts 02199-7618.
| | | | | | | | |
Name, Age | | Position(s)
Held with Fund | | Trustee/Officer
Since (h) | | Principal Occupations
During the Past Five Years | | Other Directorships (j) |
| INTERESTED TRUSTEES |
Robert J. Manning (k) (age 51) | | Trustee | | February 2004 | | Massachusetts Financial Services Company, Chairman, Co-Chief Executive Officer and Director; President (until 2009); Chief Investment Officer (until 2010) | | N/A |
| | | | |
Robin A. Stelmach (k) (age 53) | | Trustee and President | | January 2014 | | Massachusetts Financial Services Company, Executive Vice President and Chief Operating Officer | | N/A |
| | | |
| INDEPENDENT TRUSTEES | | | | | | |
David H. Gunning (age 72) | | Trustee and Chair of Trustees | | January 2004 | | Private investor | | Lincoln Electric Holdings, Inc. (welding equipment manufacturer), Director; Development Alternatives, Inc. (consulting), Director/Non-Executive Chairman |
| | | | |
Steven E. Buller (age 63) | | Trustee | | February 2014 | | Chairman, Financial Accounting Standards Advisory Council; Standing Advisory Group, Public Company Accounting Oversight Board, Member (until 2014); BlackRock, Inc. (investment management), Managing Director (until 2014), BlackRock Finco UK (investment management), Director (until 2014) | | N/A |
| | | | |
Robert E. Butler (age 73) | | Trustee | | January 2006 | | Consultant – investment company industry regulatory and compliance matters | | N/A |
| | | | |
Maureen R. Goldfarb (age 59) | | Trustee | | January 2009 | | Private investor | | N/A |
| | | | |
William R. Gutow (age 73) | | Trustee | | December 1993 | | Private investor and real estate consultant; Capitol Entertainment Management Company (video franchise), Vice Chairman | | Texas Donuts (donut franchise), Vice Chairman (until 2010) |
| | | | |
Michael Hegarty (age 70) | | Trustee | | December 2004 | | Private investor | | Brookfield Office Properties, Inc. (real estate), Director; Rouse Properties Inc. (real estate), Director; Capmark Financial Group Inc. (real estate), Director |
| | | | |
John P. Kavanaugh (age 60) | | Trustee | | January 2009 | | Private investor | | N/A |
| | | | |
Maryanne L. Roepke (age 58) | | Trustee | | May 2014 | | American Century Investments (investment management), Senior Vice President and Chief Compliance Officer (until 2014) | | N/A |
| | | | |
Laurie J. Thomsen (age 57) | | Trustee | | March 2005 | | Private investor; New Profit, Inc. (venture philanthropy), Executive Partner (until 2010) | | The Travelers Companies (insurance), Director |
| | | | |
Robert W. Uek (age 73) | | Trustee | | January 2006 | | Consultant to investment company industry | | N/A |
| | | | |
| OFFICERS | | | | | | | | |
Christopher R. Bohane (k) (age 41) | | Assistant Secretary and Assistant Clerk | | July 2005 | | Massachusetts Financial Services Company, Vice President and Assistant General Counsel | | N/A |
| | | | |
Kino Clark (k) (age 46) | | Assistant Treasurer | | January 2012 | | Massachusetts Financial Services Company, Vice President | | N/A |
| | | | |
Thomas H. Connors (k) (age 55) | | Assistant Secretary and Assistant Clerk | | September 2012 | | Massachusetts Financial Services Company, Vice President and Senior Counsel; Deutsche Investment Management Americas Inc. (financial service provider), Director and Senior Counsel (until 2012) | | N/A |
20
MFS Conservative Allocation Portfolio
Trustees and Officers – continued
| | | | | | | | |
Name, Age | | Position(s)
Held with Fund | | Trustee/Officer
Since (h) | | Principal Occupations
During the Past Five Years | | Other Directorships (j) |
Ethan D. Corey (k) (age 51) | | Assistant
Secretary and Assistant Clerk | | July 2005 | | Massachusetts Financial Services Company, Senior Vice President and Associate General Counsel | | N/A |
| | | | |
David L. DiLorenzo (k) (age 46) | | Treasurer | | July 2005 | | Massachusetts Financial Services Company, Senior Vice President | | N/A |
| | | | |
Timothy M. Fagan (k) (age 46) | | Chief Compliance Officer | | November 2014 | | Massachusetts Financial Services Company, Chief Compliance Officer; Vice President and Senior Counsel (until 2012) | | N/A |
| | | | |
Brian E. Langenfeld (k) (age 41) | | Assistant
Secretary and Assistant Clerk | | June 2006 | | Massachusetts Financial Services Company, Vice President and Senior Counsel | | N/A |
| | | | |
Susan S. Newton (k) (age 64) | | Assistant
Secretary and Assistant Clerk | | May 2005 | | Massachusetts Financial Services Company, Senior Vice President and Associate General Counsel | | N/A |
| | | | |
Susan A. Pereira (k) (age 44) | | Assistant
Secretary and Assistant Clerk | | July 2005 | | Massachusetts Financial Services Company, Vice President and Senior Counsel | | N/A |
| | | | |
Kasey L. Phillips (k) (age 44) | | Assistant Treasurer | | September 2012 | | Massachusetts Financial Services Company, Vice President; Wells Fargo Funds Management, LLC, Senior Vice President, Fund Treasurer (until 2012) | | N/A |
| | | | |
Mark N. Polebaum (k) (age 62) | | Secretary and
Clerk | | January 2006 | | Massachusetts Financial Services Company, Executive Vice President, General Counsel and Secretary | | N/A |
| | | | |
Matthew A. Stowe (k) (age 40) | | Assistant Secretary and Assistant Clerk | | October 2014 | | Massachusetts Financial Services Company, Vice President and Senior Counsel | | N/A |
| | | | |
Frank L. Tarantino (age 70) | | Independent
Senior Officer | | June 2004 | | Tarantino LLC (provider of compliance services), Principal | | N/A |
| | | | |
Richard S. Weitzel (k) (age 44) | | Assistant Secretary and Assistant Clerk | | October 2007 | | Massachusetts Financial Services Company, Senior Vice President and Associate General Counsel | | N/A |
| | | | |
James O. Yost (k) (age 54) | | Deputy Treasurer | | September 1990 | | Massachusetts Financial Services Company, Senior Vice President | | N/A |
| (h) | Date first appointed to serve as Trustee/officer of an MFS Fund. Each Trustee has served continuously since appointment unless indicated otherwise. For the period from December 15, 2004 until February 22, 2005, Mr. Manning served as Advisory Trustee. Prior to January 2012, Messrs. DiLorenzo and Yost served as Assistant Treasurers of the Funds. Ms. Stelmach was appointed as President of the Funds as of October 1, 2014. |
| (j) | Directorships or trusteeships of companies required to report to the Securities and Exchange Commission (i.e., “public companies”). |
| (k) | “Interested person” of the Trust within the meaning of the Investment Company Act of 1940 (referred to as the 1940 Act), which is the principal federal law governing investment companies like the fund, as a result of a position with MFS. The address of MFS is 111 Huntington Avenue, Boston, Massachusetts 02199-7618. |
Each Trustee (except Ms. Stelmach, Mr. Buller and Ms. Roepke) has been elected by shareholders and each Trustee and officer holds office until his or her successor is chosen and qualified or until his or her earlier death, resignation, retirement or removal. The Trust does not hold annual meetings for the purpose of electing Trustees, and Trustees are not elected for fixed terms. Messrs. Butler, Kavanaugh, Uek and Mses. Thomsen and Roepke are members of the Trust’s Audit Committee.
Each of the Fund’s Trustees and officers holds comparable positions with certain other funds of which MFS or a subsidiary is the investment adviser or distributor, and, in the case of the officers, with certain affiliates of MFS. As of February 1, 2015, the Trustees served as board members of 135 funds within the MFS Family of Funds.
21
MFS Conservative Allocation Portfolio
Trustees and Officers – continued
The Statement of Additional Information for the Fund includes further information about the Trustees and is available without charge upon request by calling 1-800-225-2606.
| | |
Investment Adviser Massachusetts Financial Services Company 111 Huntington Avenue Boston, MA 02199-7618 | | Custodian State Street Bank and Trust Company 1 Lincoln Street Boston, MA 02111-2900 |
Distributor MFS Fund Distributors, Inc. 111 Huntington Avenue Boston, MA 02199-7618 | | Independent Registered Public Accounting Firm Deloitte & Touche LLP 200 Berkeley Street Boston, MA 02116 |
Portfolio Manager Joseph Flaherty | | |
22
MFS Conservative Allocation Portfolio
BOARD REVIEW OF INVESTMENT ADVISORY AGREEMENT
The Investment Company Act of 1940 requires that both the full Board of Trustees and a majority of the non-interested (“independent”) Trustees, voting separately, annually approve the continuation of the Fund’s investment advisory agreement with MFS. The Trustees consider matters bearing on the Fund and its advisory arrangements at their meetings throughout the year, including a review of performance data at each regular meeting. In addition, the independent Trustees met several times over the course of three months beginning in May and ending in July, 2014 (“contract review meetings”) for the specific purpose of considering whether to approve the continuation of the investment advisory agreement for the Fund and the other investment companies that the Board oversees (the “MFS Funds”). The independent Trustees were assisted in their evaluation of the Fund’s investment advisory agreement by independent legal counsel, from whom they received separate legal advice and with whom they met separately from MFS during various contract review meetings. The independent Trustees were also assisted in this process by the MFS Funds’ Independent Chief Compliance Officer, a full-time senior officer appointed by and reporting to the independent Trustees.
In connection with their deliberations regarding the continuation of the investment advisory agreement, the Trustees, including the independent Trustees, considered such information and factors as they believed, in light of the legal advice furnished to them and their own business judgment, to be relevant. The investment advisory agreement for the Fund was considered separately, although the Trustees also took into account the common interests of all MFS Funds in their review. As described below, the Trustees considered the nature, quality, and extent of the various investment advisory, administrative, and shareholder services performed by MFS under the existing investment advisory agreement and other arrangements with the Fund.
In connection with their contract review meetings, the Trustees received and relied upon materials that included, among other items: (i) information provided by Lipper Inc., an independent third party, on the investment performance of the Fund for various time periods ended December 31, 2013 and the investment performance of a group of funds with substantially similar investment classifications/objectives (the “Lipper performance universe”), (ii) information provided by Lipper Inc. on the Fund’s fees and expenses and the fees and expenses of comparable funds identified by Lipper Inc. (the “Lipper expense group”), (iii) information as to whether and to what extent applicable expense waivers and reimbursements are observed for the Fund, (iv) information regarding MFS’ financial results and financial condition, including MFS’ and certain of its affiliates’ estimated profitability from services performed for the Fund and the MFS Funds as a whole, and compared to MFS’ institutional business, (v) MFS’ views regarding the outlook for the mutual fund industry and the strategic business plans of MFS, (vi) descriptions of various functions performed by MFS for the Funds, such as compliance monitoring and portfolio trading practices, and (vii) information regarding the overall organization of MFS, including information about MFS’ senior management and other personnel providing investment advisory, administrative and other services to the Fund and the other MFS Funds. The comparative performance, fee and expense information prepared and provided by Lipper Inc. was not independently verified and the independent Trustees did not independently verify any information provided to them by MFS.
Prior to the close of business on December 7, 2012, the Fund was a series of Sun Capital Advisers Trust and was advised by Sun Capital Advisers LLC, an affiliate of MFS, and subadvised by Ibbotson Associates, Inc. Following shareholder approval, MFS became the investment adviser of the Fund and assumed day-to-day investment management responsibilities for the Fund effective as of the close of business on December 7, 2012.
The Trustees’ conclusion as to the continuation of the investment advisory agreement was based on a comprehensive consideration of all information provided to the Trustees and not the result of any single factor. Some of the factors that figured particularly in the Trustees’ deliberations are described below, although individual Trustees may have evaluated the information presented differently from one another, giving different weights to various factors. It is also important to recognize that the fee arrangements for the Fund and other MFS Funds are the result of years of review and discussion between the independent Trustees and MFS, that certain aspects of such arrangements may receive greater scrutiny in some years than in others, and that the Trustees’ conclusions may be based, in part, on their consideration of these same arrangements during the course of the year and in prior years.
Based on information provided by Lipper Inc. and MFS, the Trustees reviewed the Fund’s total return investment performance as well as the performance of peer groups of funds over various time periods. The Trustees placed particular emphasis on the total return performance of the Fund’s Initial Class shares in comparison to the performance of funds in its Lipper performance universe over the three-year period ended December 31, 2013, which the Trustees believed was a long enough period to reflect differing market conditions. The total return performance of the Fund’s Initial Class shares was in the 2nd quintile relative to the other funds in the universe for this three-year period (the 1st quintile being the best performers and the 5th quintile being the worst performers). The total return performance of the Fund’s Initial Class shares was in the 2nd quintile for the one-year period and the 3rd quintile for the five-year period ended December 31, 2013 relative to the Lipper performance universe. Because of the passage of time, these performance results may differ from the performance results for more recent periods, including those shown elsewhere in this report.
In the course of their deliberations, the Trustees took into account information provided by MFS in connection with the contract review meetings, as well as during investment review meetings conducted with portfolio management personnel during the course
23
MFS Conservative Allocation Portfolio
Board Review of Investment Advisory Agreement – continued
of the year regarding the Fund’s performance. The Trustees noted that MFS became the Fund’s investment adviser in December 2012 and that MFS implemented certain changes in the Fund’s investment strategy. After reviewing these and related factors, the Trustees concluded, within the context of their overall conclusions regarding the investment advisory agreement, that they were satisfied with MFS’ responses and efforts relating to investment performance.
The Trustees considered that MFS does not charge an advisory fee for providing investment advisory services to the Fund, but that the Fund pays its pro rata share of the advisory fees paid by the underlying funds in which it invests (the “Underlying Funds”).
In assessing the reasonableness of the Fund’s expenses, the Trustees considered, among other information, the Fund’s total expense ratio of the Fund’s Initial Class shares as a percentage of average daily net assets and the total expense ratios of peer groups of funds based on information provided by Lipper Inc. The Trustees considered that MFS currently observes an expense limitation for the Fund, which may not be changed without the Trustees’ approval. The Trustees also considered that, according to the Lipper data (which takes into account any expense limitations that were in effect during the Fund’s last fiscal year), the Fund’s total expense ratio was approximately at the Lipper expense group median. Because the Fund does not pay an advisory fee, the Trustees did not consider the extent to which economies of scale would be realized due to the Fund’s growth of assets, whether fee levels reflect economies of scale for shareholders, or the fees paid by similar funds to other investment advisers or by similar clients of MFS.
The Trustees also considered information prepared by MFS relating to MFS’ costs and profits with respect to the Fund, the MFS Funds considered as a group, and other investment companies and accounts advised by MFS, as well as MFS’ methodologies used to determine and allocate its costs to the MFS Funds, the Fund and other accounts and products for purposes of estimating profitability.
In addition, the Trustees considered MFS’ resources and related efforts to continue to retain, attract and motivate capable personnel to serve the Fund. The Trustees also considered current and developing conditions in the financial services industry, including the presence of large and well-capitalized companies which are spending, and appear to be prepared to continue to spend, substantial sums to engage personnel and to provide services to competing investment companies. In this regard, the Trustees also considered the financial resources of MFS and its ultimate parent, Sun Life Financial Inc. The Trustees also considered the advantages and possible disadvantages to the Fund of having an adviser that also serves other investment companies as well as other accounts.
The Trustees also considered the nature, quality, cost, and extent of administrative, transfer agency, and distribution services provided to the Fund by MFS and its affiliates under agreements and plans other than the investment advisory agreement, including any 12b-1 fees the Fund pays to MFS Fund Distributors, Inc., an affiliate of MFS. The Trustees also considered the nature, extent and quality of certain other services MFS performs or arranges for on the Fund’s or the Underlying Funds’ behalf, which may include securities lending programs, directed expense payment programs, class action recovery programs, and MFS’ interaction with third-party service providers, principally custodians and sub-custodians. The Trustees concluded that the various non-advisory services provided by MFS and its affiliates on behalf of the Fund were satisfactory.
The Trustees also considered benefits to MFS from the use of the Underlying Funds’ portfolio brokerage commissions, if applicable, to pay for investment research and various other factors. Additionally, the Trustees considered so-called “fall-out benefits” to MFS such as reputational value derived from serving as investment manager to the Fund.
Based on their evaluation of factors that they deemed to be material, including those factors described above, the Board of Trustees, including the independent Trustees, concluded that the Fund’s investment advisory agreement with MFS should be continued for an additional one-year period, commencing August 1, 2014.
24
MFS Conservative Allocation Portfolio
PROXY VOTING POLICIES AND INFORMATION
MFS votes proxies on behalf of the fund pursuant to proxy voting policies and procedures that are available without charge, upon request, by calling 1-800-225-2606, by visiting the Proxy Voting section of mfs.com or by visiting the SEC’s Web site at http://www.sec.gov.
Information regarding how the fund voted proxies relating to portfolio securities during the most recent twelve-month period ended June 30 is available without charge by visiting the Proxy Voting section of mfs.com or by visiting the SEC’s Web site at http://www.sec.gov.
QUARTERLY PORTFOLIO DISCLOSURE
The fund will file a complete schedule of portfolio holdings with the Securities and Exchange Commission (the Commission) for the first and third quarters of each fiscal year on Form N-Q. The fund’s Form N-Q is available on the EDGAR database on the Commission’s Internet Web site at http://www.sec.gov, and may be reviewed and copied at the:
Public Reference Room
Securities and Exchange Commission
100 F Street, NE, Room 1580
Washington, D.C. 20549
Information on the operation of the Public Reference Room may be obtained by calling the Commission at 1-800-SEC-0330. Copies of the fund’s Form N-Q also may be obtained, upon payment of a duplicating fee, by electronic request at the following e-mail address: publicinfo@sec.gov or by writing the Public Reference Section at the above address.
FURTHER INFORMATION
From time to time, MFS may post important information about the fund or the MFS funds on the MFS web site (mfs.com). This information is available by visiting the “Market Commentary” and “Announcements” sub sections in the “Market Outlooks” section of mfs.com or by clicking on the fund’s name under “Variable Insurance Portfolios — VIT III” in the “Products” section of mfs.com.
FEDERAL TAX INFORMATION (unaudited)
The following information is provided pursuant to provisions of the Internal Revenue Code.
The fund designates $6,299,000 as capital gain dividends paid during the fiscal year.
For corporate shareholders, 19.08% of the ordinary income dividends paid during the fiscal year qualify for the corporate dividends received deduction.
25
rev. 3/11
| | | | |
| FACTS | | WHAT DOES MFS DO WITH YOUR
PERSONAL INFORMATION? | |  |
| | |
| Why? | | Financial companies choose how they share your personal information. Federal law gives consumers the right to limit some but not all sharing. Federal law also requires us to tell you how we collect, share, and protect your personal information. Please read this notice carefully to understand what we do. |
| | |
| What? | | The types of personal information we collect and share depend on the product or service you have with us. This information can include: • Social Security number and account balances • Account transactions and transaction history • Checking account information and wire transfer instructions When you are no longer our customer, we continue to share your information as described in this notice. |
| | |
| How? | | All financial companies need to share customers’ personal information to run their everyday business. In the section below, we list the reasons financial companies can share their customers’ personal information; the reasons MFS chooses to share; and whether you can limit this sharing. |
| | | | |
Reasons we can share your
personal information | | Does MFS share? | | Can you limit this
sharing? |
For our everyday business purposes – such as to process your transactions, maintain your account(s), respond to court orders and legal investigations, or report to credit bureaus | | Yes | | No |
For our marketing purposes – to offer our products and services to you | | No | | We don’t share |
| For joint marketing with other financial companies | | No | | We don’t share |
For our affiliates’ everyday business purposes – information about your transactions and experiences | | No | | We don’t share |
For our affiliates’ everyday business purposes – information about your creditworthiness | | No | | We don’t share |
| For nonaffiliates to market to you | | No | | We don’t share |
| | |
| Questions? | | Call 800-225-2606 or go to mfs.com. |
26
| | |
| Who we are |
| Who is providing this notice? | | MFS Funds, MFS Investment Management, MFS Institutional Advisors, Inc., MFS Fund Distributors, Inc., MFS Heritage Trust Company, and MFS Service Center, Inc. |
| | |
| What we do |
| How does MFS protect my personal information? | | To protect your personal information from unauthorized access and use, we use security measures that comply with federal law. These measures include procedural, electronic, and physical safeguards for the protection of the personal information we collect about you. |
How does MFS
collect my personal information? | | We collect your personal information, for example, when you • open an account or provide account information • direct us to buy securities or direct us to sell your securities • make a wire transfer We also collect your personal information from others, such as credit bureaus, affiliates and other companies. |
| Why can’t I limit all sharing? | | Federal law gives you the right to limit only • sharing for affiliates’ everyday business purposes – information about your creditworthiness • affiliates from using your information to market to you • sharing for nonaffiliates to market to you State laws and individual companies may give you additional rights to limit sharing. |
| | |
| Definitions |
| Affiliates | | Companies related by common ownership or control. They can be financial and nonfinancial companies. •MFS does not share personal information with affiliates, except for everyday business purposes as described on page one of this notice. |
| Nonaffiliates | | Companies not related by common ownership or control. They can be financial and nonfinancial companies. •MFS does not share with nonaffiliates so they can market to you. |
| Joint Marketing | | A formal agreement between nonaffiliated financial companies that together market financial products or services to you. •MFS doesn’t jointly market. |
| | |
| Other important information |
| If you own an MFS product or receive an MFS service in the name of a third party such as a bank or broker-dealer, their privacy policy may apply to you instead of ours. |
27
ANNUAL REPORT
December 31, 2014

MFS® GLOBAL REAL
ESTATE PORTFOLIO
MFS® Variable Insurance Trust III

VRE-ANN
MFS® GLOBAL REAL ESTATE PORTFOLIO
CONTENTS
The report is prepared for the general information of contract owners. It is authorized for distribution to prospective investors only when preceded or accompanied by a current prospectus.
NOT FDIC INSURED Ÿ MAY LOSE VALUE Ÿ NO BANK OR CREDIT UNION GUARANTEE Ÿ NOT A DEPOSIT Ÿ NOT INSURED BY ANY FEDERAL GOVERNMENT AGENCY OR NCUA/NCUSIF
MFS Global Real Estate Portfolio
LETTER FROM THE CHAIRMAN

Dear Contract Owners:
As 2015 begins, sharply lower oil prices are reshaping the global economy, adding to deflationary pressures in the eurozone and exacerbating challenges faced by oil exporters such as Russia. The U.S. economy stands on firmer ground, having expanded steadily over the past year. The U.S. labor market has regained momentum, consumer confidence is buoyant and gasoline prices have tumbled, boosting prospects for a stronger economic rebound in 2015.
Other regions are struggling. The eurozone economy is barely expanding, and the European Central Bank (ECB) has introduced large-scale asset purchases.
Despite Japan’s efforts to strengthen its economy, its sales tax increase last spring tipped the country into a recession, leading to additional monetary stimulus from the Bank of Japan. China’s economy is slowing as it transitions to a more sustainable basis, and its growth rate will likely continue to decline.
As always, active risk management is integral to how we at MFS® manage your investments. We use a collaborative process, sharing insights across asset classes, regions and economic sectors. Our global investment team uses a diversified, multidisciplined, long-term approach.
Applying proven principles, such as asset allocation and diversification, can best serve investors over the long term. We are confident that this approach can help you as you work with your financial advisors to reach your goals in the years ahead.
Respectfully,

Robert J. Manning
Chairman
MFS Investment Management
February 13, 2015
The opinions expressed in this letter are subject to change and may not be relied upon for investment advice. No forecasts can be guaranteed.
1
MFS Global Real Estate Portfolio
PORTFOLIO COMPOSITION
Portfolio structure
| | | | |
| Top ten holdings | | | | |
| Simon Property Group, Inc., REIT | | | 4.8% | |
| Vornado Realty Trust, REIT | | | 3.7% | |
| Public Storage, Inc., REIT | | | 3.6% | |
| Mitsubishi Estate Co. Ltd. | | | 3.0% | |
| Westfield Corp., REIT | | | 2.9% | |
| Mitsui Fudosan Co. Ltd. | | | 2.9% | |
| Unibail-Rodamco, REIT | | | 2.9% | |
| Equity Lifestyle Properties, Inc., REIT | | | 2.8% | |
| AvalonBay Communities, Inc., REIT | | | 2.8% | |
| Ventas, Inc., REIT | | | 2.7% | |
| |
| Equity industries | | | | |
| Real Estate | | | 95.7% | |
| Telecommunications-Wireless | | | 1.3% | |
| Medical & Health Technology & Services | | | 0.9% | |
| | | | |
| Issuer country weightings (x) | | | | |
| United States | | | 55.2% | |
| Japan | | | 9.8% | |
| Hong Kong | | | 8.2% | |
| United Kingdom | | | 6.7% | |
| Singapore | | | 3.3% | |
| Australia | | | 2.9% | |
| France | | | 2.9% | |
| Germany | | | 2.1% | |
| Brazil | | | 1.9% | |
| Other Countries | | | 7.0% | |
| |
| Currency exposure weightings (y) | | | | |
| United States Dollar | | | 55.2% | |
| Japanese Yen | | | 9.8% | |
| Euro | | | 9.2% | |
| Hong Kong Dollar | | | 8.2% | |
| British Pound Sterling | | | 6.7% | |
| Singapore Dollar | | | 3.3% | |
| Australian Dollar | | | 2.9% | |
| Brazilian Real | | | 1.9% | |
| Canadian Dollar | | | 1.6% | |
| Other Currencies | | | 1.2% | |
| (x) | Represents the portfolio’s exposure to issuer countries as a percentage of a portfolio’s net assets. For purposes of this presentation, United States includes Cash & Other. |
| (y) | Represents the portfolio’s exposure to a particular currency as a percentage of a portfolio’s net assets. For purposes of this presentation, United States Dollar includes Cash & Other. |
Cash & Other can include cash, other assets less liabilities, offsets to derivative positions, and short-term securities.
Percentages are based on net assets as of 12/31/14.
The portfolio is actively managed and current holdings may be different.
2
MFS Global Real Estate Portfolio
MANAGEMENT REVIEW
Summary of Results
For the twelve months ended December 31, 2014, Initial Class shares of the MFS Global Real Estate Portfolio (“fund”) provided a total return of 15.62%, while Service Class shares of the fund provided a total return of 15.31%. These compare with a return of 15.89% over the same period for the fund’s benchmark, the FTSE EPRA/NAREIT Developed Real Estate Index.
Market Environment
Early in the period, US equities suffered what proved to be a temporary setback due to concerns over emerging markets as well as what was perceived at the time to be a pause in US economic growth, partially caused by extreme weather events and a weak December 2013 labor market report. Markets soon recovered as the economic pause concluded and investors appeared to have become increasingly comfortable that newly-installed US Federal Reserve (“Fed”) Chair Janet Yellen would not make any substantial changes to the trajectory of Fed monetary policy.
A generally risk-friendly, carry trade environment persisted from February 2014 until mid-year. While geopolitical tensions flared in the Middle East and Russia/Ukraine, any market setbacks were short-lived as improving economic growth in the US, coupled with prospects for easier monetary policy in regions with slowing growth, such as Japan, Europe and China, supported risk assets. For example, the European Central Bank (“ECB”) cut policy interest rates into negative territory and, by the end of the period, expectations were for additional rate cuts and the announcement for non-conventional easing measures. Similarly, the Bank of Japan surprised markets late in the period with fresh stimulus measures given lackluster growth trends. The related decline in developed market government bond yields and credit spreads were also supportive for equity markets. At the end of the period, the US equity market was trading close to all-time highs and US Treasury yields were close to their lows for the period. However, credit markets did not fare as well in the second half of 2014, particularly US high yield and emerging market debt. The higher weightings of oil and gas credits in these asset classes resulted in widening spreads and increased volatility as oil prices began to decline in an accelerated fashion in the fourth quarter.
Detractors from Performance
Weak security selection within U.S. real estate investments detracted from performance relative to the FTSE EPRA/NAREIT Developed Real Estate Index. Not owning senior housing and health care real estate company Health & Retire Property and regional malls rental property company General Growth Properties detracted from relative performance. The fund’s holdings of timberland company Plum Creek Timber (b) and an underweight position in real estate company Equity Residential (h) also held back relative results.
The fund’s out-of-benchmark holdings in Brazilian real estate investments were a primary detractor from relative results. Within this sector, holdings of weak-performing shopping mall real estate company Multiplan Empreendimentos (b) hindered relative results.
Elsewhere, the fund’s overweight position in Japanese real estate companies Mitsui Fudosan, NTT Urban Development and Mitsubishi Estate, and Hong Kong-based real estate company Hang Lung Properties detracted from relative performance as all three securities underperformed the benchmark during the period. Holdings of retail real estate company Atrium European Real Estate (b) (United Kingdom) company also weakened relative returns.
Contributors to Performance
The combination of positive security selection and an underweight position in Japanese real estate investments was a positive factor for relative returns, as the Japanese real estate market was one of the weakest performing countries over the reporting period. Not holding shares of poor-performing real estate companies Sumitomo Realty & Development and Tokyo Tatemono were notable contributors to relative results.
Strong security selection in Singaporean real estate investments also contributed to relative performance. There were no individual securities within this country that were among the fund’s top relative contributors.
Elsewhere, the fund’s overweight positions in resort operator Equity Lifestyle, life science real estate company Alexandria Real Estate Equities, community real estate company AvalonBay Communities and real estate companies Vornado Realty, Henderson Land Development, and Digital Realty, strengthened relative results as all six securities outperformed the benchmark over the reporting period. In addition, the fund’s avoidance of poor-performing real estate company American Realty Capital Properties and the timing of the fund’s ownership in shares of shopping center operator Scentre (h) (Australia) also boosted relative performance.
Respectfully,
Richard Gable
Portfolio Manager
| (b) | Security is not a benchmark constituent. |
| (h) | Security was not held in the portfolio at period end. |
3
MFS Global Real Estate Portfolio
Management Review – continued
The views expressed in this report are those of the portfolio manager only through the end of the period of the report as stated on the cover and do not necessarily reflect the views of MFS or any other person in the MFS organization. These views are subject to change at any time based on market or other conditions, and MFS disclaims any responsibility to update such views. These views may not be relied upon as investment advice or an indication of trading intent on behalf of any MFS portfolio. References to specific securities are not recommendations of such securities, and may not be representative of any MFS portfolio’s current or future investments.
4
MFS Global Real Estate Portfolio
PERFORMANCE SUMMARY THROUGH 12/31/14
The following chart illustrates the historical performance of the fund in comparison to its benchmark(s). Benchmarks are unmanaged and may not be invested in directly. Benchmark returns do not reflect any fees or expenses. The performance of other share classes will be greater than or less than that of the class depicted below. (See Notes to Performance Summary.)
Performance data shown represents past performance and is no guarantee of future results. Investment return and principal value fluctuate so your units, when sold, may be worth more or less than the original cost; current performance may be lower or higher than quoted. The performance shown does not reflect the deduction of taxes, if any, that a contract holder would pay on fund distributions or the redemption of contract units. The returns for the fund shown also do not reflect the deduction of expenses associated with variable products, such as mortality and expense risk charges, separate account charges, and sales charges imposed by the insurance company separate accounts. Such expenses would reduce the overall returns shown.
Growth of a Hypothetical $10,000 Investment
Total Returns through 12/31/14
Average annual total returns
| | | | | | | | | | | | |
| | | Share Class | | Class inception date | | 1-yr | | 5-yr | | 10-yr | | |
| | | Initial Class | | 12/07/98 | | 15.62% | | 10.95% | | 4.82% | | |
| | | Service Class | | 2/01/04 | | 15.31% | | 10.67% | | 4.55% | | |
| | | | |
| Comparative benchmark | | | | | | | | |
| | | FTSE EPRA/NAREIT Developed Real Estate Index (f) | | 15.89% | | 12.03% | | 6.90% | | |
| (f) | Source: FactSet Research Systems Inc. |
Benchmark Definition
FTSE EPRA/NAREIT Developed Real Estate Index – measures the performance of eligible real estate equities worldwide that generate a majority of their revenue and income through the ownership, disposure and development of income-producing real estate.
It is not possible to invest directly in an index.
Notes to Performance Summary
Average annual total return represents the average annual change in value for each share class for the periods presented.
Performance results reflect any applicable expense subsidies and waivers in effect during the periods shown. Without such subsidies and waivers the fund’s performance results would be less favorable. Please see the prospectus and financial statements for complete details. All results are historical and assume the reinvestment of any dividends and capital gains distributions.
Performance results do not include adjustments made for financial reporting purposes in accordance with U.S. generally accepted accounting principles and may differ from amounts reported in the financial highlights.
From time to time the fund may receive proceeds from litigation settlements, without which performance would be lower.
5
MFS Global Real Estate Portfolio
EXPENSE TABLE
Fund Expenses Borne by the Contract Holders During the Period,
July 1, 2014 through December 31, 2014
As a contract holder of the fund, you incur ongoing costs, including management fees; distribution and/or service (12b-1) fees; and other fund expenses. This example is intended to help you understand your ongoing costs (in dollars) of investing in the fund and to compare these costs with the ongoing costs of investing in other mutual funds.
The example is based on an investment of $1,000 invested at the beginning of the period and held for the entire period July 1, 2014 through December 31, 2014.
Actual Expenses
The first line for each share class in the following table provides information about actual account values and actual expenses. You may use the information in this line, together with the amount you invested, to estimate the expenses that you paid over the period. Simply divide your account value by $1,000 (for example, an $8,600 account value divided by $1,000 = 8.6), then multiply the result by the number in the first line under the heading entitled “Expenses Paid During Period” to estimate the expenses you paid on your account during this period.
Hypothetical Example for Comparison Purposes
The second line for each share class in the following table provides information about hypothetical account values and hypothetical expenses based on the fund’s actual expense ratio and an assumed rate of return of 5% per year before expenses, which is not the fund’s actual return. The hypothetical account values and expenses may not be used to estimate the actual ending account balance or expenses you paid for the period. You may use this information to compare the ongoing costs of investing in the fund and other funds. To do so, compare this 5% hypothetical example with the 5% hypothetical examples that appear in the shareholder reports of the other funds.
Please note that the expenses shown in the table are meant to highlight the fund’s ongoing costs only and do not take into account the fees and expenses imposed under the variable contracts through which your investment in the fund is made. Therefore, the second line for each share class in the table is useful in comparing ongoing costs associated with an investment in vehicles (such as the fund) which fund benefits under variable annuity and variable life insurance contracts and to qualified pension and retirement plans only, and will not help you determine the relative total costs of investing in the fund through variable annuity and variable life insurance contracts. If the fees and expenses imposed under the variable contracts were included, your costs would have been higher.
| | | | | | | | | | | | | | | | | | |
| Share Class | | | | Annualized
Expense Ratio | | | Beginning
Account Value
7/01/14 | | | Ending
Account Value
12/31/14 | | | Expenses Paid
During Period (p)
7/01/14-12/31/14 | |
| Initial Class | | Actual | | | 0.95% | | | | $1,000.00 | | | | $1,030.96 | | | | $4.86 | |
| | Hypothetical (h) | | | 0.95% | | | | $1,000.00 | | | | $1,020.42 | | | | $4.84 | |
| Service Class | | Actual | | | 1.20% | | | | $1,000.00 | | | | $1,029.49 | | | | $6.14 | |
| | Hypothetical (h) | | | 1.20% | | | | $1,000.00 | | | | $1,019.16 | | | | $6.11 | |
| (h) | 5% class return per year before expenses. |
| (p) | “Expenses Paid During Period” are equal to each class’s annualized expense ratio, as shown above, multiplied by the average account value over the period, multiplied by 184/365 (to reflect the one-half year period). |
6
MFS Global Real Estate Portfolio
PORTFOLIO OF INVESTMENTS – 12/31/14
The Portfolio of Investments is a complete list of all securities owned by your fund. It is categorized by broad-based asset classes.
| | | | | | | | |
| Issuer | | Shares/Par | | | Value ($) | |
| | | | | | | | |
| COMMON STOCKS – 97.9% | | | | | |
| Medical & Health Technology & Services – 0.9% | |
| Capital Senior Living Corp. (a) | | | 89,778 | | | $ | 2,236,370 | |
| | | | | | | | |
| Real Estate – 95.7% | | | | | |
| Advance Residence Investment Corp., REIT | | | 1,190 | | | $ | 3,177,504 | |
| Alexandria Real Estate Equities, Inc., REIT | | | 45,475 | | | | 4,035,452 | |
| Ascendas India Trust, REIT | | | 7,925,000 | | | | 4,872,130 | |
| Atrium European Real Estate Ltd. | | | 842,815 | | | | 4,171,180 | |
| AvalonBay Communities, Inc., REIT | | | 41,336 | | | | 6,753,889 | |
| Big Yellow Group PLC, REIT | | | 507,056 | | | | 4,782,149 | |
| Boston Properties, Inc., REIT | | | 36,525 | | | | 4,700,402 | |
| British Land Co. PLC, REIT | | | 316,714 | | | | 3,804,712 | |
| Canadian Apartment Properties, REIT | | | 178,740 | | | | 3,866,187 | |
| Concentradora Fibra Danhos S.A. de C.V., REIT | | | 646,178 | | | | 1,591,165 | |
| Corporate Office Properties Trust, REIT | | | 141,979 | | | | 4,027,944 | |
| Digital Realty Trust, Inc., REIT | | | 41,616 | | | | 2,759,141 | |
| EastGroup Properties, Inc., REIT | | | 19,486 | | | | 1,233,854 | |
| Equity Lifestyle Properties, Inc., REIT | | | 132,036 | | | | 6,806,456 | |
| Federal Realty Investment Trust, REIT | | | 19,924 | | | | 2,659,057 | |
| Gramercy Property Trust, Inc., REIT | | | 455,077 | | | | 3,140,031 | |
| Grand City Properties S.A. (a) | | | 55,371 | | | | 815,411 | |
| Hang Lung Properties Ltd. | | | 1,244,944 | | | | 3,469,520 | |
| Henderson Land Development Co. Ltd. | | | 611,951 | | | | 4,247,810 | |
| Hibernia PLC, REIT (a) | | | 1,880,495 | | | | 2,468,910 | |
| Home Properties, Inc., REIT | | | 71,934 | | | | 4,718,870 | |
| Host Hotels & Resorts, Inc., REIT | | | 238,856 | | | | 5,677,607 | |
| Intu Properties PLC, REIT | | | 701,851 | | | | 3,629,417 | |
| Kenedix Office Investment Corp., REIT | | | 791 | | | | 4,440,528 | |
| Lar Espana Real Estate Socimi S.A., REIT (a) | | | 334,638 | | | | 3,715,626 | |
| LEG Immobilien AG | | | 34,313 | | | | 2,573,853 | |
| Link REIT | | | 943,264 | | | | 5,888,146 | |
| LondonMetric Property PLC, REIT | | | 650,559 | | | | 1,539,873 | |
| Mapletree Logistics Trust, REIT | | | 3,457,000 | | | | 3,090,542 | |
| Medical Properties Trust, Inc., REIT | | | 245,665 | | | | 3,385,264 | |
| Mid-America Apartment Communities, Inc., REIT | | | 84,148 | | | | 6,284,173 | |
| Mitsubishi Estate Co. Ltd. | | | 349,069 | | | | 7,387,820 | |
| Mitsui Fudosan Co. Ltd. | | | 260,075 | | | | 6,994,852 | |
| Multiplan Empreendimentos Imobiliarios S.A. | | | 259,684 | | | | 4,581,479 | |
| National Health Investors, Inc., REIT | | | 36,089 | | | | 2,524,786 | |
| NTT Urban Development Corp. | | | 185,200 | | | | 1,857,821 | |
| Plum Creek Timber Co. Inc., REIT | | | 151,168 | | | | 6,468,479 | |
| Prologis Property Mexico S.A. de C.V., REIT | | | 633,121 | | | | 1,171,083 | |
| Public Storage, Inc., REIT | | | 47,670 | | | | 8,811,800 | |
| Quintain Estates & Development PLC (a) | | | 1,716,639 | | | | 2,548,466 | |
| Rexford Industrial Realty, Inc., REIT | | | 282,607 | | | | 4,439,756 | |
| Simon Property Group, Inc., REIT | | | 63,669 | | | | 11,594,762 | |
| Starwood Property Trust, Inc., REIT | | | 130,767 | | | | 3,039,025 | |
| Sun Hung Kai Properties Ltd. | | | 415,433 | | | | 6,281,931 | |
| TAG Immobilien AG | | | 142,678 | | | | 1,660,869 | |
| Tanger Factory Outlet Centers, Inc., REIT | | | 164,505 | | | | 6,080,105 | |
| Unibail-Rodamco, REIT | | | 27,155 | | | | 6,940,480 | |
| | | | | | | | |
| Issuer | | Shares/Par | | | Value ($) | |
| | | | | | | | |
| COMMON STOCKS – continued | | | | | |
| Real Estate – continued | | | | | |
| Ventas, Inc., REIT | | | 90,844 | | | $ | 6,513,515 | |
| Vornado Realty Trust, REIT | | | 75,899 | | | | 8,934,071 | |
| Washington Prime Group, Inc., REIT | | | 322,886 | | | | 5,560,097 | |
| Westfield Corp., REIT | | | 964,283 | | | | 7,050,088 | |
| Weyerhaeuser Co., REIT | | | 87,586 | | | | 3,143,460 | |
| | | | | | | | |
| | | $ | 231,911,548 | |
| | | | | | | | |
| Telecommunications – Wireless – 1.3% | | | | | |
| American Tower Corp., REIT | | | 30,875 | | | $ | 3,051,994 | |
| | | | | | | | |
Total Common Stocks
(Identified Cost, $197,954,176) | | | $ | 237,199,912 | |
| | | | | | | | |
| |
| MONEY MARKET FUNDS – 2.0% | | | | | |
| MFS Institutional Money Market Portfolio, 0.09%, at Cost and Net Asset Value (v) | | | 4,745,202 | | | $ | 4,745,202 | |
| | | | | | | | |
Total Investments
(Identified Cost, $202,699,378) | | | | | | $ | 241,945,114 | |
| | | | | | | | |
OTHER ASSETS, LESS
LIABILITIES – 0.1% | | | | 349,348 | |
| | | | | | | | |
| NET ASSETS – 100.0% | | | $ | 242,294,462 | |
| | | | | | | | |
| (a) | | Non-income producing security. |
| (v) | | Underlying affiliated fund that is available only to investment companies managed by MFS. The rate quoted for the MFS Institutional Money Market Portfolio is the annualized seven-day yield of the fund at period end. |
The following abbreviations are used in this report and are defined:
| PLC | | Public Limited Company |
| REIT | | Real Estate Investment Trust |
See Notes to Financial Statements
7
MFS Global Real Estate Portfolio
FINANCIAL STATEMENTS | STATEMENT OF ASSETS AND LIABILITIES
This statement represents your fund’s balance sheet, which details the assets and liabilities comprising the total value of the fund.
| | | | | | | | |
At 12/31/14 | | | | | | | | |
Assets | | | | | | | | |
Investments – | | | | | | | | |
Non-affiliated issuers, at value (identified cost, $197,954,176) | | | $237,199,912 | | | | | |
Underlying affiliated funds, at cost and value | | | 4,745,202 | | | | | |
Total investments, at value (identified cost, $202,699,378) | | | $241,945,114 | | | | | |
Foreign currency, at value (identified cost, $24) | | | 24 | | | | | |
Receivables for | | | | | | | | |
Fund shares sold | | | 12 | | | | | |
Dividends | | | 923,023 | | | | | |
Other assets | | | 2,360 | | | | | |
Total assets | | | | | | | $242,870,533 | |
Liabilities | | | | | | | | |
Payables for fund shares reacquired | | | $406,028 | | | | | |
Payable to affiliates | | | | | | | | |
Investment adviser | | | 81,574 | | | | | |
Shareholder servicing costs | | | 31 | | | | | |
Distribution and/or service fees | | | 1,375 | | | | | |
Payable for independent Trustees’ compensation | | | 62 | | | | | |
Accrued expenses and other liabilities | | | 87,001 | | | | | |
Total liabilities | | | | | | | $576,071 | |
Net assets | | | | | | | $242,294,462 | |
Net assets consist of | | | | | | | | |
Paid-in capital | | | $216,289,043 | | | | | |
Unrealized appreciation (depreciation) on investments and translation of assets and liabilities in foreign currencies | | | 39,234,635 | | | | | |
Accumulated net realized gain (loss) on investments and foreign currency | | | (21,986,206 | ) | | | | |
Undistributed net investment income | | | 8,756,990 | | | | | |
Net assets | | | | | | | $242,294,462 | |
Shares of beneficial interest outstanding | | | | | | | 16,469,270 | |
| | | | | | | | | | | | |
| | | Net assets | | | Shares outstanding | | | Net asset value per share | |
Initial Class | | | $143,090,445 | | | | 10,178,545 | | | | $14.06 | |
Service Class | | | 99,204,017 | | | | 6,290,725 | | | | 15.77 | |
See Notes to Financial Statements
8
MFS Global Real Estate Portfolio
FINANCIAL STATEMENTS | STATEMENT OF OPERATIONS
This statement describes how much your fund earned in investment income and accrued in expenses. It also describes any gains and/or losses generated by fund operations.
| | | | | | | | |
Year ended 12/31/14 | | | | | |
Net investment income | | | | | |
Income | | | | | | | | |
Dividends | | | $7,693,112 | | | | | |
Dividends from underlying affiliated funds | | | 1,155 | | | | | |
Foreign taxes withheld | | | (263,178 | ) | | | | |
Total investment income | | | | | | | $7,431,089 | |
Expenses | | | | | | | | |
Management fee | | | $2,324,381 | | | | | |
Distribution and/or service fees | | | 271,557 | | | | | |
Shareholder servicing costs | | | 6,776 | | | | | |
Administrative services fee | | | 45,230 | | | | | |
Independent Trustees’ compensation | | | 9,024 | | | | | |
Custodian fee | | | 77,495 | | | | | |
Audit and tax fees | | | 56,930 | | | | | |
Legal fees | | | 2,247 | | | | | |
Miscellaneous | | | 13,837 | | | | | |
Total expenses | | | | | | | $2,807,477 | |
Reduction of expenses by investment adviser | | | (80,034 | ) | | | | |
Net expenses | | | | | | | $2,727,443 | |
Net investment income | | | | | | | $4,703,646 | |
Realized and unrealized gain (loss) on investments and foreign currency | | | | | | | | |
Realized gain (loss) (identified cost basis) | | | | | | | | |
Investments | | | $30,253,193 | | | | | |
Foreign currency | | | (47,098 | ) | | | | |
Net realized gain (loss) on investments and foreign currency | | | | | | | $30,206,095 | |
Change in unrealized appreciation (depreciation) | | | | | | | | |
Investments | | | $2,831,874 | | | | | |
Translation of assets and liabilities in foreign currencies | | | (12,733 | ) | | | | |
Net unrealized gain (loss) on investments and foreign currency translation | | | | | | | $2,819,141 | |
Net realized and unrealized gain (loss) on investments and foreign currency | | | | | | | $33,025,236 | |
Change in net assets from operations | | | | | | | $37,728,882 | |
See Notes to Financial Statements
9
MFS Global Real Estate Portfolio
FINANCIAL STATEMENTS | STATEMENTS OF CHANGES IN NET ASSETS
These statements describe the increases and/or decreases in net assets resulting from operations, any distributions, and any shareholder transactions.
| | | | | | | | |
For years ended 12/31 | | | 2014 | | | | 2013 | |
Change in net assets | | | | | | | | |
From operations | | | | | | | | |
Net investment income | | | $4,703,646 | | | | $5,079,157 | |
Net realized gain (loss) on investments and foreign currency | | | 30,206,095 | | | | 20,514,036 | |
Net unrealized gain (loss) on investments and foreign currency translation | | | 2,819,141 | | | | (11,713,698 | ) |
Change in net assets from operations | | | $37,728,882 | | | | $13,879,495 | |
Distributions declared to shareholders | | | | | | | | |
From net investment income | | | $(5,107,056 | ) | | | $(13,254,054 | ) |
Change in net assets from fund share transactions | | | $(55,614,359 | ) | | | $3,287,424 | |
Total change in net assets | | | $(22,992,533 | ) | | | $3,912,865 | |
Net assets | | | | | | | | |
| At beginning of period | | | 265,286,995 | | | | 261,374,130 | |
At end of period (including undistributed net investment income of $8,756,990 and
$5,230,839, respectively) | | | $242,294,462 | | | | $265,286,995 | |
See Notes to Financial Statements
10
MFS Global Real Estate Portfolio
FINANCIAL STATEMENTS | FINANCIAL HIGHLIGHTS
The financial highlights table is intended to help you understand the fund’s financial performance for the past 5 years. Certain information reflects financial results for a single fund share. The total returns in the table represent the rate by which an investor would have earned (or lost) on an investment in the fund share class (assuming reinvestment of all distributions) held for the entire period.
| | | | | | | | | | | | | | | | | | | | |
| Initial Class | | Years ended 12/31 | |
| | | 2014 | | | 2013 | | | 2012 | | | 2011 | | | 2010 | |
Net asset value, beginning of period | | | $12.43 | | | | $12.54 | | | | $9.75 | | | | $11.44 | | | | $11.23 | |
| Income (loss) from investment operations | | | | | | | | | | | | | | | | | | | | |
Net investment income (d) | | | $0.26 | | | | $0.26 | | | | $0.25 | | | | $0.21 | | | | $0.34 | |
Net realized and unrealized gain (loss) on investments
and foreign currency | | | 1.68 | | | | 0.34 | | | | 2.66 | | | | (1.08 | ) | | | 1.28 | |
Total from investment operations | | | $1.94 | | | | $0.60 | | | | $2.91 | | | | $(0.87 | ) | | | $1.62 | |
| Less distributions declared to shareholders | | | | | | | | | | | | | | | | | | | | |
From net investment income | | | $(0.31 | ) | | | $(0.71 | ) | | | $(0.12 | ) | | | $(0.82 | ) | | | $(1.41 | ) |
Net asset value, end of period (x) | | | $14.06 | | | | $12.43 | | | | $12.54 | | | | $9.75 | | | | $11.44 | |
Total return (%) (k)(r)(s)(x) | | | 15.62 | | | | 5.07 | | | | 29.93 | | | | (7.59 | ) | | | 15.28 | |
Ratios (%) (to average net assets)
and Supplemental data: | | | | | | | | | | | | | | | | | | | | |
Expenses before expense reductions (f) | | | 0.98 | | | | 1.01 | | | | 1.09 | | | | 1.15 | | | | 1.11 | |
Expenses after expense reductions (f) | | | 0.95 | | | | 0.95 | | | | 1.05 | | | | 1.10 | | | | 1.10 | |
Net investment income | | | 1.93 | | | | 2.02 | | | | 2.21 | | | | 1.89 | | | | 3.07 | |
Portfolio turnover | | | 25 | | | | 34 | | | | 54 | | | | 27 | | | | 40 | |
Net assets at end of period (000 omitted) | | | $143,090 | | | | $151,176 | | | | $147,846 | | | | $87,924 | | | | $111,981 | |
See Notes to Financial Statements
11
MFS Global Real Estate Portfolio
Financial Highlights – continued
| | | | | | | | | | | | | | | | | | | | |
| Service Class | | Years ended 12/31 | |
| | | 2014 | | | 2013 | | | 2012 | | | 2011 | | | 2010 | |
Net asset value, beginning of period | | | $13.91 | | | | $13.94 | | | | $10.84 | | | | $12.61 | | | | $12.25 | |
| Income (loss) from investment operations | | | | | | | | | | | | | | | | | | | | |
Net investment income (d) | | | $0.25 | | | | $0.26 | | | | $0.23 | | | | $0.20 | | | | $0.34 | |
Net realized and unrealized gain (loss) on investments
and foreign currency | | | 1.88 | | | | 0.38 | | | | 2.96 | | | | (1.17 | ) | | | 1.40 | |
Total from investment operations | | | $2.13 | | | | $0.64 | | | | $3.19 | | | | $(0.97 | ) | | | $1.74 | |
| Less distributions declared to shareholders | | | | | | | | | | | | | | | | | | | | |
From net investment income | | | $(0.27 | ) | | | $(0.67 | ) | | | $(0.09 | ) | | | $(0.80 | ) | | | $(1.38 | ) |
Net asset value, end of period (x) | | | $15.77 | | | | $13.91 | | | | $13.94 | | | | $10.84 | | | | $12.61 | |
Total return (%) (k)(r)(s)(x) | | | 15.31 | | | | 4.84 | | | | 29.47 | | | | (7.74 | ) | | | 14.94 | |
Ratios (%) (to average net assets)
and Supplemental data: | | | | | | | | | | | | | | | | | | | | |
Expenses before expense reductions (f) | | | 1.23 | | | | 1.26 | | | | 1.34 | | | | 1.41 | | | | 1.37 | |
Expenses after expense reductions (f) | | | 1.20 | | | | 1.20 | | | | 1.30 | | | | 1.35 | | | | 1.35 | |
Net investment income | | | 1.67 | | | | 1.78 | | | | 1.88 | | | | 1.60 | | | | 2.80 | |
Portfolio turnover | | | 25 | | | | 34 | | | | 54 | | | | 27 | | | | 40 | |
Net assets at end of period (000 omitted) | | | $99,204 | | | | $114,111 | | | | $113,528 | | | | $117,846 | | | | $142,500 | |
| (d) | Per share data is based on average shares outstanding. |
| (f) | Ratios do not reflect reductions from fees paid indirectly, if applicable. |
| (k) | The total return does not reflect expenses that apply to separate accounts. Inclusion of these charges would reduce the total return figures for all periods shown. |
| (r) | Certain expenses have been reduced without which performance would have been lower. |
| (s) | From time to time the fund may receive proceeds from litigation settlements, without which performance would be lower. |
| (x) | The net asset values per share and total returns have been calculated on net assets which include adjustments made in accordance with U.S. generally accepted accounting principles required at period end for financial reporting purposes. |
See Notes to Financial Statements
12
MFS Global Real Estate Portfolio
NOTES TO FINANCIAL STATEMENTS
| (1) | | Business and Organization |
MFS Global Real Estate Portfolio (the fund) is a diversified series of MFS Variable Insurance Trust III (the trust). The trust is organized as a Delaware statutory trust and is registered under the Investment Company Act of 1940, as amended, as an open-end management investment company. The shareholders of each series of the trust are separate accounts of insurance companies, which offer variable annuity and/or life insurance products, and qualified retirement and pension plans.
The fund is an investment company and accordingly follows the investment company accounting and reporting guidance of the Financial Accounting Standards Board (FASB) Accounting Standards Codification Topic 946 Financial Services – Investment Companies.
| (2) | | Significant Accounting Policies |
General – The preparation of financial statements in conformity with U.S. generally accepted accounting principles requires management to make estimates and assumptions that affect the reported amounts of assets and liabilities, and disclosure of contingent assets and liabilities at the date of the financial statements and the reported amounts of increases and decreases in net assets from operations during the reporting period. Actual results could differ from those estimates. In the preparation of these financial statements, management has evaluated subsequent events occurring after the date of the fund’s Statement of Assets and Liabilities through the date that the financial statements were issued. The fund invests a significant amount of its net assets in U.S. and foreign real estate related investments and as a result is subject to certain risks associated with the direct ownership of real estate and the real estate industry in general. These include risks related to general, regional and local economic conditions; fluctuations in interest rates; property tax rates, zoning laws, environmental regulations and other governmental action; cash flow dependency; increased operating expenses; lack of availability of mortgage funds; losses due to natural disasters; changes in property values and rental rates; and other factors. The fund invests in foreign securities. Investments in foreign securities are vulnerable to the effects of changes in the relative values of the local currency and the U.S. dollar and to the effects of changes in each country’s legal, political, and economic environment.
In June 2014, FASB issued Accounting Standards Update 2014-11, Transfers and Servicing (Topic 860) – Repurchase-to-Maturity Transactions, Repurchase Financings, and Disclosures (“ASU 2014-11”). ASU 2014-11 changes the accounting for repurchase-to-maturity transactions (i.e., repurchase agreements that settle at the same time as the maturity of the transferred financial asset) and enhances the required disclosures for repurchase agreements and other similar transactions. Although still evaluating the potential impacts of ASU 2014-11 to the fund, management expects that the impact of the fund’s adoption will be limited to additional financial statement disclosures which would first be effective for interim reporting periods beginning after March 15, 2015.
Balance Sheet Offsetting – The fund’s accounting policy with respect to balance sheet offsetting is that, absent an event of default by the counterparty or a termination of the agreement, the International Swaps and Derivatives Association (ISDA) Master Agreement does not result in an offset of reported amounts of financial assets and financial liabilities in the Statement of Assets and Liabilities across transactions between the fund and the applicable counterparty. The fund’s right to setoff may be restricted or prohibited by the bankruptcy or insolvency laws of the particular jurisdiction to which a specific master netting agreement counterparty is subject. Balance sheet offsetting disclosures, to the extent applicable to the fund, have been included in the fund’s Significant Accounting Policies note under the captions for each of the fund’s in-scope financial instruments and transactions.
Investment Valuations – Equity securities, including restricted equity securities, are generally valued at the last sale or official closing price as provided by a third-party pricing service on the market or exchange on which they are primarily traded. Equity securities, for which there were no sales reported that day, are generally valued at the last quoted daily bid quotation as provided by a third-party pricing service on the market or exchange on which such securities are primarily traded. Short-term instruments with a maturity at issuance of 60 days or less may be valued at amortized cost, which approximates market value. Open-end investment companies are generally valued at net asset value per share. Securities and other assets generally valued on the basis of information from a third-party pricing service may also be valued at a broker/dealer bid quotation. Values obtained from third-party pricing services can utilize both transaction data and market information such as yield, quality, coupon rate, maturity, type of issue, trading characteristics, and other market data. The values of foreign securities and other assets and liabilities expressed in foreign currencies are converted to U.S. dollars using the mean of bid and asked prices for rates provided by a third-party pricing service.
The Board of Trustees has delegated primary responsibility for determining or causing to be determined the value of the fund’s investments (including any fair valuation) to the adviser pursuant to valuation policies and procedures approved by the Board. If the adviser determines that reliable market quotations are not readily available, investments are valued at fair value as determined in good faith by the adviser in accordance with such procedures under the oversight of the Board of Trustees. Under the fund’s valuation policies and procedures, market quotations are not considered to be readily available for most types of debt instruments and floating rate loans and many types of derivatives. These investments are generally valued at fair value based on information from third-party pricing services. In addition, investments may be valued at fair value if the adviser determines that an investment’s value
13
MFS Global Real Estate Portfolio
Notes to Financial Statements – continued
has been materially affected by events occurring after the close of the exchange or market on which the investment is principally traded (such as foreign exchange or market) and prior to the determination of the fund’s net asset value, or after the halting of trading of a specific security where trading does not resume prior to the close of the exchange or market on which the security is principally traded. Events that occur on a frequent basis after foreign markets close (such as developments in foreign markets and significant movements in the U.S. markets) and prior to the determination of the fund’s net asset value may be deemed to have a material effect on the value of securities traded in foreign markets. Accordingly, the fund’s foreign equity securities may often be valued at fair value. The adviser generally relies on third-party pricing services or other information (such as the correlation with price movements of similar securities in the same or other markets; the type, cost and investment characteristics of the security; the business and financial condition of the issuer; and trading and other market data) to assist in determining whether to fair value and at what value to fair value an investment. The value of an investment for purposes of calculating the fund’s net asset value can differ depending on the source and method used to determine value. When fair valuation is used, the value of an investment used to determine the fund’s net asset value may differ from quoted or published prices for the same investment. There can be no assurance that the fund could obtain the fair value assigned to an investment if it were to sell the investment at the same time at which the fund determines its net asset value per share.
Various inputs are used in determining the value of the fund’s assets or liabilities. These inputs are categorized into three broad levels. In certain cases, the inputs used to measure fair value may fall into different levels of the fair value hierarchy. In such cases, an investment’s level within the fair value hierarchy is based on the lowest level of input that is significant to the fair value measurement. The fund’s assessment of the significance of a particular input to the fair value measurement in its entirety requires judgment, and considers factors specific to the investment. Level 1 includes unadjusted quoted prices in active markets for identical assets or liabilities. Level 2 includes other significant observable market-based inputs (including quoted prices for similar securities, interest rates, prepayment speed, and credit risk). Level 3 includes unobservable inputs, which may include the adviser’s own assumptions in determining the fair value of investments. The following is a summary of the levels used as of December 31, 2014 in valuing the fund’s assets or liabilities:
| | | | | | | | | | | | | | | | |
| Investments at Value | | Level 1 | | | Level 2 | | | Level 3 | | | Total | |
| Equity Securities: | | | | | | | | | | | | | | | | |
United States | | | $128,580,360 | | | | $— | | | | $— | | | | $128,580,360 | |
Japan | | | — | | | | 23,858,525 | | | | — | | | | 23,858,525 | |
Hong Kong | | | — | | | | 19,887,407 | | | | — | | | | 19,887,407 | |
United Kingdom | | | 2,548,466 | | | | 13,756,151 | | | | — | | | | 16,304,617 | |
Singapore | | | — | | | | 7,962,672 | | | | — | | | | 7,962,672 | |
Australia | | | — | | | | 7,050,088 | | | | — | | | | 7,050,088 | |
France | | | — | | | | 6,940,480 | | | | — | | | | 6,940,480 | |
Germany | | | 5,050,133 | | | | — | | | | — | | | | 5,050,133 | |
Brazil | | | — | | | | 4,581,479 | | | | — | | | | 4,581,479 | |
Other Countries | | | 16,984,151 | | | | — | | | | — | | | | 16,984,151 | |
| Mutual Funds | | | 4,745,202 | | | | — | | | | — | | | | 4,745,202 | |
| Total Investments | | | $157,908,312 | | | | $84,036,802 | | | | $— | | | | $241,945,114 | |
For further information regarding security characteristics, see the Portfolio of Investments.
Of the level 2 investments presented above, equity investments amounting to $54,008,764 would have been considered level 1 investments at the beginning of the period. The primary reason for changes in the classifications between levels 1 and 2 occurs when foreign equity securities are fair valued using other observable market-based inputs in place of the closing exchange price due to events occurring after the close of the exchange or market on which the investment is principally traded. The fund’s foreign equity securities may often be valued at fair value. The fund’s policy is to recognize transfers between the levels as of the end of the period.
Foreign Currency Translation – Purchases and sales of foreign investments, income, and expenses are converted into U.S. dollars based upon currency exchange rates prevailing on the respective dates of such transactions or on the reporting date for foreign denominated receivables and payables. Gains and losses attributable to foreign currency exchange rates on sales of securities are recorded for financial statement purposes as net realized gains and losses on investments. Gains and losses attributable to foreign exchange rate movements on receivables, payables, income and expenses are recorded for financial statement purposes as foreign currency transaction gains and losses. That portion of both realized and unrealized gains and losses on investments that results from fluctuations in foreign currency exchange rates is not separately disclosed.
Indemnifications – Under the fund’s organizational documents, its officers and Trustees may be indemnified against certain liabilities and expenses arising out of the performance of their duties to the fund. Additionally, in the normal course of business, the fund enters into agreements with service providers that may contain indemnification clauses. The fund’s maximum exposure under these agreements is unknown as this would involve future claims that may be made against the fund that have not yet occurred.
14
MFS Global Real Estate Portfolio
Notes to Financial Statements – continued
Investment Transactions and Income – Investment transactions are recorded on the trade date. Dividends received in cash are recorded on the ex-dividend date. Certain dividends from foreign securities will be recorded when the fund is informed of the dividend if such information is obtained subsequent to the ex-dividend date. Dividend payments received in additional securities are recorded on the ex-dividend date in an amount equal to the value of the security on such date.
The fund may receive proceeds from litigation settlements. Any proceeds received from litigation involving portfolio holdings are reflected in the Statement of Operations in realized gain/loss if the security has been disposed of by the fund or in unrealized gain/loss if the security is still held by the fund. Any other proceeds from litigation not related to portfolio holdings are reflected as other income in the Statement of Operations.
Fees Paid Indirectly – The fund’s custody fee may be reduced according to an arrangement that measures the value of cash deposited with the custodian by the fund. For the year ended December 31, 2014, custody fees were not reduced.
Tax Matters and Distributions – The fund intends to qualify as a regulated investment company, as defined under Subchapter M of the Internal Revenue Code, and to distribute all of its taxable income, including realized capital gains. As a result, no provision for federal income tax is required. The fund’s federal tax returns, when filed, will remain subject to examination by the Internal Revenue Service for a three year period. Management has analyzed the fund’s tax positions taken on federal and state tax returns for all open tax years and does not believe that there are any uncertain tax positions that require recognition of a tax liability. Foreign taxes, if any, have been accrued by the fund in the accompanying financial statements in accordance with the applicable foreign tax law. Foreign income taxes may be withheld by certain countries in which the fund invests. Additionally, capital gains realized by the fund on securities issued in or by certain foreign countries may be subject to capital gains tax imposed by those countries.
Distributions to shareholders are recorded on the ex-dividend date. Income and capital gain distributions are determined in accordance with income tax regulations, which may differ from U.S. generally accepted accounting principles. Certain capital accounts in the financial statements are periodically adjusted for permanent differences in order to reflect their tax character. These adjustments have no impact on net assets or net asset value per share. Temporary differences which arise from recognizing certain items of income, expense, gain or loss in different periods for financial statement and tax purposes will reverse at some time in the future. Distributions in excess of net investment income or net realized gains are temporary overdistributions for financial statement purposes resulting from differences in the recognition or classification of income or distributions for financial statement and tax purposes.
Book/tax differences primarily relate to passive foreign investment companies and wash sale loss deferrals.
The tax character of distributions declared to shareholders for the last two fiscal years is as follows:
| | | | | | | | |
| | | 12/31/14 | | | 12/31/13 | |
| Ordinary income (including any short-term capital gains) | | | $5,107,056 | | | | $13,254,054 | |
The federal tax cost and the tax basis components of distributable earnings were as follows:
| | | | |
| As of 12/31/14 | | | | |
| Cost of investments | | | $206,122,541 | |
| Gross appreciation | | | 39,518,017 | |
| Gross depreciation | | | (3,695,444 | ) |
| Net unrealized appreciation (depreciation) | | | $35,822,573 | |
| Undistributed ordinary income | | | 8,495,311 | |
| Capital loss carryforwards | | | (18,563,043 | ) |
| Other temporary differences | | | 250,578 | |
Under the Regulated Investment Company Modernization Act of 2010 (the “Act”), net capital losses recognized for fund fiscal years beginning after December 31, 2010 may be carried forward indefinitely, and their character is retained as short-term and/or long-term losses (“post-enactment losses”). Previously, net capital losses were carried forward for eight years and treated as short-term losses (“pre-enactment losses”). As a transition rule, the Act requires that all post-enactment net capital losses be used before pre-enactment net capital losses.
As of December 31, 2014, the fund had capital loss carryforwards available to offset future realized gains. Such pre-enactment losses expire as follows:
The availability of $18,563,043 of the capital loss carryforwards of the fund may be limited in a given year due to a change in ownership of the fund on July 31, 2013.
Multiple Classes of Shares of Beneficial Interest – The fund offers multiple classes of shares, which differ in their respective distribution and/or service fees. The fund’s income, realized and unrealized gain (loss), and common expenses are allocated to
15
MFS Global Real Estate Portfolio
Notes to Financial Statements – continued
shareholders based on the daily net assets of each class. Dividends are declared separately for each class. Differences in per share dividend rates are generally due to differences in separate class expenses. The fund’s distributions declared to shareholders as reported in the Statements of Changes in Net Assets are presented by class as follows:
| | | | | | | | |
| | | From net investment
income | |
| | | Year ended
12/31/14 | | | Year ended
12/31/13 | |
| Initial Class | | | $3,264,522 | | | | $8,107,917 | |
| Service Class | | | 1,842,534 | | | | 5,146,137 | |
| Total | | | $5,107,056 | | | | $13,254,054 | |
| (3) | | Transactions with Affiliates |
Investment Adviser – The fund has an investment advisory agreement with MFS to provide overall investment management and related administrative services and facilities to the fund. The management fee is computed daily and paid monthly at the following annual rates:
| | | | |
| First $1 billion of average daily net assets | | | 0.90% | |
| Next $1.5 billion of average daily net assets | | | 0.75% | |
| Average daily net assets in excess of $2.5 billion | | | 0.65% | |
MFS has agreed in writing to reduce its management fee by a specified amount if certain MFS mutual fund assets exceed thresholds agreed to by MFS and the fund’s Board of Trustees. For the year ended December 31, 2014, this management fee reduction amounted to $11,833, which is included in the reduction of total expenses in the Statement of Operations. The management fee incurred for the year ended December 31, 2014 was equivalent to an annual effective rate of 0.90% of the fund’s average daily net assets.
The investment adviser has agreed in writing to pay a portion of the fund’s total annual operating expenses, excluding interest, taxes, extraordinary expenses, brokerage and transaction costs, and investment-related expenses, such that total annual operating expenses do not exceed 0.95% of average daily net assets for the Initial Class shares and 1.20% of average daily net assets for the Service Class shares. This written agreement will continue until modified by the fund’s Board of Trustees, but such agreement will continue at least until April 30, 2016. For the year ended December 31, 2014, this reduction amounted to $67,749 and is included in the reduction of total expenses in the Statement of Operations.
Distributor – MFS Fund Distributors, Inc. (MFD), a wholly-owned subsidiary of MFS, is the distributor of shares of the fund. The Trustees have adopted a distribution plan for the Service Class shares pursuant to Rule 12b-1 under the Investment Company Act of 1940.
The fund’s distribution plan provides that the fund will pay MFD distribution and/or service fees equal to 0.25% per annum of its average daily net assets attributable to Service Class shares as partial consideration for services performed and expenses incurred by MFD and financial intermediaries (including participating insurance companies that invest in the fund to fund variable annuity and variable life insurance contracts, sponsors of qualified retirement and pension plans that invest in the fund, and affiliates of these participating insurance companies and plan sponsors) in connection with the sale and distribution of the Service Class shares. MFD may subsequently pay all, or a portion, of the distribution and/or service fees to financial intermediaries.
Shareholder Servicing Agent – MFS Service Center, Inc. (MFSC), a wholly-owned subsidiary of MFS, receives a fee from the fund for its services as shareholder servicing agent. For the year ended December 31, 2014, the fee was $6,676, which equated to 0.0026% annually of the fund’s average daily net assets. MFSC also receives payment from the fund for out-of-pocket expenses paid by MFSC on behalf of the fund. For the year ended December 31, 2014, these costs amounted to $100.
Administrator – MFS provides certain financial, legal, shareholder communications, compliance, and other administrative services to the fund. Under an administrative services agreement, the fund partially reimburses MFS the costs incurred to provide these services. The fund is charged an annual fixed amount of $17,500 plus a fee based on average daily net assets. The administrative services fee incurred for the year ended December 31, 2014 was equivalent to an annual effective rate of 0.0175% of the fund’s average daily net assets.
Trustees’ and Officers’ Compensation – The fund pays compensation to independent Trustees in the form of a retainer, attendance fees, and additional compensation to Board and Committee chairpersons. The fund does not pay compensation directly to Trustees or officers of the fund who are also officers of the investment adviser, all of whom receive remuneration for their services to the fund from MFS. Certain officers and Trustees of the fund are officers or directors of MFS, MFD, and MFSC.
Other – Effective November 1, 2014, this fund and certain other funds managed by MFS (the funds) have entered into a service agreement (the ISO Agreement) which provides for payment of fees solely by the funds to Tarantino LLC in return for the provision
16
MFS Global Real Estate Portfolio
Notes to Financial Statements – continued
of services of an Independent Senior Officer (ISO) for the funds. Frank L. Tarantino serves as the ISO and is an officer of the funds and the sole member of Tarantino LLC. The funds can terminate the ISO Agreement with Tarantino LLC at any time under the terms of the ISO Agreement. Prior to November 1, 2014, the funds had entered into services agreements (the Compliance Officer Agreements) which provided for payment of fees by the funds to Tarantino LLC and Griffin Compliance LLC in return for the provision of services of an Independent Chief Compliance Officer (ICCO) and Assistant ICCO, respectively, for the funds. Prior to November 1, 2014, Frank L. Tarantino served as the ICCO. Effective October 31, 2014, Mr. Tarantino resigned as ICCO and the Compliance Officer Agreement between the funds and Tarantino LLC was terminated. Prior to June 1, 2014, Robyn L. Griffin served as the Assistant ICCO and was an officer of the funds. Ms. Griffin is the sole member of Griffin Compliance LLC. Effective May 31, 2014, Ms. Griffin resigned as Assistant ICCO and the Compliance Officer Agreement between the funds and Griffin Compliance LLC was terminated. For the year ended December 31, 2014, the aggregate fees paid by the fund under these agreements were $1,219 and are included in “Miscellaneous” expense in the Statement of Operations. MFS had agreed to reimburse the fund for a portion of the payments made by the fund for the services under the Compliance Officer Agreements in the amount of $452, which is included in the reduction of total expenses in the Statement of Operations. Additionally, MFS has agreed to bear all expenses associated with office space, other administrative support, and supplies provided to the ICCO, Assistant ICCO, and ISO.
The fund invests in the MFS Institutional Money Market Portfolio which is managed by MFS and seeks current income consistent with preservation of capital and liquidity. Income earned on this investment is included in “Dividends from underlying affiliated funds” in the Statement of Operations. This money market fund does not pay a management fee to MFS.
For the year ended December 31, 2014, purchases and sales of investments, other than short-term obligations, aggregated $63,762,664 and $120,534,403, respectively.
| (5) | | Shares of Beneficial Interest |
The fund’s Declaration of Trust permits the Trustees to issue an unlimited number of full and fractional shares of beneficial interest. Transactions in fund shares were as follows:
| | | | | | | | | | | | | | | | |
| | | Year ended 12/31/14 | | | Year ended 12/31/13 | |
| | | Shares | | | Amount | | | Shares | | | Amount | |
| Shares sold | | | | | | | | | | | | | | | | |
Initial Class | | | 243,027 | | | | $3,192,041 | | | | 1,350,559 | | | | $17,005,810 | |
Service Class | | | 40,927 | | | | 616,509 | | | | 1,026,889 | | | | 14,243,203 | |
| | | 283,954 | | | | $3,808,550 | | | | 2,377,448 | | | | $31,249,013 | |
| Shares issued to shareholders in reinvestment of distributions | | | | | | | | | | | | | | | | |
Initial Class | | | 234,184 | | | | $3,264,522 | | | | 689,449 | | | | $8,107,917 | |
Service Class | | | 117,734 | | | | 1,842,534 | | | | 390,747 | | | | 5,146,137 | |
| | | 351,918 | | | | $5,107,056 | | | | 1,080,196 | | | | $13,254,054 | |
| Shares reacquired | | | | | | | | | | | | | | | | |
Initial Class | | | (2,462,450 | ) | | | $(33,387,021 | ) | | | (1,664,486 | ) | | | $(21,762,360 | ) |
Service Class | | | (2,072,905 | ) | | | (31,142,944 | ) | | | (1,355,722 | ) | | | (19,453,283 | ) |
| | | (4,535,355 | ) | | | $(64,529,965 | ) | | | (3,020,208 | ) | | | $(41,215,643 | ) |
| Net change | | | | | | | | | | | | | | | | |
Initial Class | | | (1,985,239 | ) | | | $(26,930,458 | ) | | | 375,522 | | | | $3,351,367 | |
Service Class | | | (1,914,244 | ) | | | (28,683,901 | ) | | | 61,914 | | | | (63,943 | ) |
| | | (3,899,483 | ) | | | $(55,614,359 | ) | | | 437,436 | | | | $3,287,424 | |
The fund is one of several mutual funds in which certain MFS funds may invest. The MFS funds do not invest in the underlying funds for the purpose of exercising management or control. At the end of the period, the MFS Moderate Allocation Portfolio, the MFS Growth Allocation Portfolio, and the MFS Conservative Allocation Portfolio were the owners of record of approximately 27%, 11%, and 7%, respectively, of the value of outstanding voting shares of the fund.
The fund and certain other funds managed by MFS participate in a $1.1 billion unsecured committed line of credit, subject to a $1 billion sublimit, provided by a syndication of banks under a credit agreement. Borrowings may be made for temporary financing needs. Interest is charged to each fund, based on its borrowings, generally at a rate equal to the higher of the Federal Reserve funds rate or one month LIBOR plus an agreed upon spread. A commitment fee, based on the average daily, unused portion of the committed line of credit, is allocated among the participating funds at the end of each calendar quarter. In addition, the fund and other funds managed by MFS have established unsecured uncommitted borrowing arrangements with certain banks for temporary
17
MFS Global Real Estate Portfolio
Notes to Financial Statements – continued
financing needs. Interest is charged to each fund, based on its borrowings, at a rate equal to the Federal Reserve funds rate plus an agreed upon spread. For the year ended December 31, 2014, the fund’s commitment fee and interest expense were $978 and $0, respectively, and are included in “Miscellaneous” expense in the Statement of Operations.
| (7) | | Transactions in Underlying Affiliated Funds – Affiliated Issuers |
An affiliated issuer may be considered one in which the fund owns 5% or more of the outstanding voting securities, or a company which is under common control. For the purposes of this report, the fund assumes the following to be an affiliated issuer:
| | | | | | | | | | | | | | | | |
| Underlying Affiliated Fund | | Beginning
Shares/Par
Amount | | | Acquisitions
Shares/Par
Amount | | | Dispositions
Shares/Par
Amount | | | Ending
Shares/Par
Amount | |
| MFS Institutional Money Market Portfolio | | | 2,742,543 | | | | 60,121,758 | | | | (58,119,099 | ) | | | 4,745,202 | |
| | | | |
| Underlying Affiliated Fund | | Realized
Gain (Loss) | | | Capital Gain
Distributions | | | Dividend
Income | | | Ending
Value | |
| MFS Institutional Money Market Portfolio | | | $— | | | | $— | | | | $1,155 | | | | $4,745,202 | |
18
MFS Global Real Estate Portfolio
REPORT OF INDEPENDENT REGISTERED PUBLIC ACCOUNTING FIRM
To the Board of Trustees of MFS Variable Insurance Trust III and the Shareholders of
MFS Global Real Estate Portfolio:
We have audited the accompanying statement of assets and liabilities, including the portfolio of investments, of MFS Global Real Estate Portfolio (one of the series of MFS Variable Insurance Trust III) (the “Fund”) as of December 31, 2014, and the related statement of operations for the year then ended, the statements of changes in net assets for each of the two years in the period then ended, and the financial highlights for each of the five years in the period then ended. These financial statements and financial highlights are the responsibility of the Fund’s management. Our responsibility is to express an opinion on these financial statements and financial highlights based on our audits.
We conducted our audits in accordance with the standards of the Public Company Accounting Oversight Board (United States). Those standards require that we plan and perform the audit to obtain reasonable assurance about whether the financial statements and financial highlights are free of material misstatement. The Fund is not required to have, nor were we engaged to perform, an audit of its internal control over financial reporting. Our audits included consideration of internal control over financial reporting as a basis for designing audit procedures that are appropriate in the circumstances, but not for the purpose of expressing an opinion on the effectiveness of the Fund’s internal control over financial reporting. Accordingly, we express no such opinion. An audit also includes examining, on a test basis, evidence supporting the amounts and disclosures in the financial statements, assessing the accounting principles used and significant estimates made by management, as well as evaluating the overall financial statement presentation. Our procedures included confirmation of securities owned as of December 31, 2014, by correspondence with the custodian. We believe that our audits provide a reasonable basis for our opinion.
In our opinion, the financial statements and financial highlights referred to above present fairly, in all material respects, the financial position of MFS Global Real Estate Portfolio as of December 31, 2014, the results of its operations for the year then ended, the changes in its net assets for each of the two years in the period then ended, and the financial highlights for each of the five years in the period then ended, in conformity with accounting principles generally accepted in the United States of America.
DELOITTE & TOUCHE LLP
Boston, Massachusetts
February 13, 2015
19
MFS Global Real Estate Portfolio
TRUSTEES AND OFFICERS – IDENTIFICATION AND BACKGROUND
The Trustees and Officers of the Trust, as of February 1, 2015, are listed below, together with their principal occupations during the past five years. (Their titles may have varied during that period.) The address of each Trustee and Officer is 111 Huntington Avenue, Boston, Massachusetts 02199-7618.
| | | | | | | | |
Name, Age | | Position(s)
Held with Fund | | Trustee/Officer
Since (h) | | Principal Occupations
During the Past Five Years | | Other Directorships (j) |
| INTERESTED TRUSTEES |
Robert J. Manning (k) (age 51) | | Trustee | | February 2004 | | Massachusetts Financial Services Company, Chairman, Co-Chief Executive Officer and Director; President (until 2009); Chief Investment Officer (until 2010) | | N/A |
| | | | |
Robin A. Stelmach (k) (age 53) | | Trustee and President | | January 2014 | | Massachusetts Financial Services Company, Executive Vice President and Chief Operating Officer | | N/A |
| | | |
| INDEPENDENT TRUSTEES | | | | | | |
David H. Gunning (age 72) | | Trustee and Chair of Trustees | | January 2004 | | Private investor | | Lincoln Electric Holdings, Inc. (welding equipment manufacturer), Director; Development Alternatives, Inc. (consulting), Director/Non-Executive Chairman |
| | | | |
Steven E. Buller (age 63) | | Trustee | | February 2014 | | Chairman, Financial Accounting Standards Advisory Council; Standing Advisory Group, Public Company Accounting Oversight Board, Member (until 2014); BlackRock, Inc. (investment management), Managing Director (until 2014), BlackRock Finco UK (investment management), Director (until 2014) | | N/A |
| | | | |
Robert E. Butler (age 73) | | Trustee | | January 2006 | | Consultant – investment company industry regulatory and compliance matters | | N/A |
| | | | |
Maureen R. Goldfarb (age 59) | | Trustee | | January 2009 | | Private investor | | N/A |
| | | | |
William R. Gutow (age 73) | | Trustee | | December 1993 | | Private investor and real estate consultant; Capitol Entertainment Management Company (video franchise), Vice Chairman | | Texas Donuts (donut franchise), Vice Chairman (until 2010) |
| | | | |
Michael Hegarty (age 70) | | Trustee | | December 2004 | | Private investor | | Brookfield Office Properties, Inc. (real estate), Director; Rouse Properties Inc. (real estate), Director; Capmark Financial Group Inc. (real estate), Director |
| | | | |
John P. Kavanaugh (age 60) | | Trustee | | January 2009 | | Private investor | | N/A |
| | | | |
Maryanne L. Roepke (age 58) | | Trustee | | May 2014 | | American Century Investments (investment management), Senior Vice President and Chief Compliance Officer (until 2014) | | N/A |
| | | | |
Laurie J. Thomsen (age 57) | | Trustee | | March 2005 | | Private investor; New Profit, Inc. (venture philanthropy), Executive Partner (until 2010) | | The Travelers Companies (insurance), Director |
| | | | |
Robert W. Uek (age 73) | | Trustee | | January 2006 | | Consultant to investment company industry | | N/A |
| | | | |
| OFFICERS | | | | | | | | |
Christopher R. Bohane (k) (age 41) | | Assistant Secretary and Assistant Clerk | | July 2005 | | Massachusetts Financial Services Company, Vice President and Assistant General Counsel | | N/A |
| | | | |
Kino Clark (k) (age 46) | | Assistant Treasurer | | January 2012 | | Massachusetts Financial Services Company, Vice President | | N/A |
| | | | |
Thomas H. Connors (k) (age 55) | | Assistant Secretary and Assistant Clerk | | September 2012 | | Massachusetts Financial Services Company, Vice President and Senior Counsel; Deutsche Investment Management Americas Inc. (financial service provider), Director and Senior Counsel (until 2012) | | N/A |
20
MFS Global Real Estate Portfolio
Trustees and Officers – continued
| | | | | | | | |
Name, Age | | Position(s)
Held with Fund | | Trustee/Officer
Since (h) | | Principal Occupations
During the Past Five Years | | Other Directorships (j) |
Ethan D. Corey (k) (age 51) | | Assistant
Secretary and Assistant Clerk | | July 2005 | | Massachusetts Financial Services Company, Senior Vice President and Associate General Counsel | | N/A |
| | | | |
David L. DiLorenzo (k) (age 46) | | Treasurer | | July 2005 | | Massachusetts Financial Services Company, Senior Vice President | | N/A |
| | | | |
Timothy M. Fagan (k) (age 46) | | Chief Compliance Officer | | November 2014 | | Massachusetts Financial Services Company, Chief Compliance Officer; Vice President and Senior Counsel (until 2012) | | N/A |
| | | | |
Brian E. Langenfeld (k) (age 41) | | Assistant
Secretary and Assistant Clerk | | June 2006 | | Massachusetts Financial Services Company, Vice President and Senior Counsel | | N/A |
| | | | |
Susan S. Newton (k) (age 64) | | Assistant
Secretary and Assistant Clerk | | May 2005 | | Massachusetts Financial Services Company, Senior Vice President and Associate General Counsel | | N/A |
| | | | |
Susan A. Pereira (k) (age 44) | | Assistant
Secretary and Assistant Clerk | | July 2005 | | Massachusetts Financial Services Company, Vice President and Senior Counsel | | N/A |
| | | | |
Kasey L. Phillips (k) (age 44) | | Assistant Treasurer | | September 2012 | | Massachusetts Financial Services Company, Vice President; Wells Fargo Funds Management, LLC, Senior Vice President, Fund Treasurer (until 2012) | | N/A |
| | | | |
Mark N. Polebaum (k) (age 62) | | Secretary and
Clerk | | January 2006 | | Massachusetts Financial Services Company, Executive Vice President, General Counsel and Secretary | | N/A |
| | | | |
Matthew A. Stowe (k) (age 40) | | Assistant Secretary and Assistant Clerk | | October 2014 | | Massachusetts Financial Services Company, Vice President and Senior Counsel | | N/A |
| | | | |
Frank L. Tarantino (age 70) | | Independent
Senior Officer | | June 2004 | | Tarantino LLC (provider of compliance services), Principal | | N/A |
| | | | |
Richard S. Weitzel (k) (age 44) | | Assistant Secretary and Assistant Clerk | | October 2007 | | Massachusetts Financial Services Company, Senior Vice President and Associate General Counsel | | N/A |
| | | | |
James O. Yost (k) (age 54) | | Deputy Treasurer | | September 1990 | | Massachusetts Financial Services Company, Senior Vice President | | N/A |
| (h) | Date first appointed to serve as Trustee/officer of an MFS Fund. Each Trustee has served continuously since appointment unless indicated otherwise. For the period from December 15, 2004 until February 22, 2005, Mr. Manning served as Advisory Trustee. Prior to January 2012, Messrs. DiLorenzo and Yost served as Assistant Treasurers of the Funds. Ms. Stelmach was appointed as President of the Funds as of October 1, 2014. |
| (j) | Directorships or trusteeships of companies required to report to the Securities and Exchange Commission (i.e., “public companies”). |
| (k) | “Interested person” of the Trust within the meaning of the Investment Company Act of 1940 (referred to as the 1940 Act), which is the principal federal law governing investment companies like the fund, as a result of a position with MFS. The address of MFS is 111 Huntington Avenue, Boston, Massachusetts 02199-7618. |
Each Trustee (except Ms. Stelmach, Mr. Buller and Ms. Roepke) has been elected by shareholders and each Trustee and officer holds office until his or her successor is chosen and qualified or until his or her earlier death, resignation, retirement or removal. The Trust does not hold annual meetings for the purpose of electing Trustees, and Trustees are not elected for fixed terms. Messrs. Butler, Kavanaugh, Uek and Mses. Thomsen and Roepke are members of the Trust’s Audit Committee.
Each of the Fund’s Trustees and officers holds comparable positions with certain other funds of which MFS or a subsidiary is the investment adviser or distributor, and, in the case of the officers, with certain affiliates of MFS. As of February 1, 2015, the Trustees served as board members of 135 funds within the MFS Family of Funds.
21
MFS Global Real Estate Portfolio
Trustees and Officers – continued
The Statement of Additional Information for the Fund includes further information about the Trustees and is available without charge upon request by calling 1-800-225-2606.
| | |
Investment Adviser Massachusetts Financial Services Company 111 Huntington Avenue Boston, MA 02199-7618 | | Custodian State Street Bank and Trust Company 1 Lincoln Street Boston, MA 02111-2900 |
Distributor MFS Fund Distributors, Inc. 111 Huntington Avenue Boston, MA 02199-7618 | | Independent Registered Public Accounting Firm Deloitte & Touche LLP 200 Berkeley Street Boston, MA 02116 |
Portfolio Manager Richard Gable | | |
22
MFS Global Real Estate Portfolio
BOARD REVIEW OF INVESTMENT ADVISORY AGREEMENT
The Investment Company Act of 1940 requires that both the full Board of Trustees and a majority of the non-interested (“independent”) Trustees, voting separately, annually approve the continuation of the Fund’s investment advisory agreement with MFS. The Trustees consider matters bearing on the Fund and its advisory arrangements at their meetings throughout the year, including a review of performance data at each regular meeting. In addition, the independent Trustees met several times over the course of three months beginning in May and ending in July, 2014 (“contract review meetings”) for the specific purpose of considering whether to approve the continuation of the investment advisory agreement for the Fund and the other investment companies that the Board oversees (the “MFS Funds”). The independent Trustees were assisted in their evaluation of the Fund’s investment advisory agreement by independent legal counsel, from whom they received separate legal advice and with whom they met separately from MFS during various contract review meetings. The independent Trustees were also assisted in this process by the MFS Funds’ Independent Chief Compliance Officer, a full-time senior officer appointed by and reporting to the independent Trustees.
In connection with their deliberations regarding the continuation of the investment advisory agreement, the Trustees, including the independent Trustees, considered such information and factors as they believed, in light of the legal advice furnished to them and their own business judgment, to be relevant. The investment advisory agreement for the Fund was considered separately, although the Trustees also took into account the common interests of all MFS Funds in their review. As described below, the Trustees considered the nature, quality, and extent of the various investment advisory, administrative, and shareholder services performed by MFS under the existing investment advisory agreement and other arrangements with the Fund.
In connection with their contract review meetings, the Trustees received and relied upon materials that included, among other items: (i) information provided by Lipper Inc., an independent third party, on the investment performance of the Fund for various time periods ended December 31, 2013 and the investment performance of a group of funds with substantially similar investment classifications/objectives (the “Lipper performance universe”), (ii) information provided by Lipper Inc. on the Fund’s advisory fees and other expenses and the advisory fees and other expenses of comparable funds identified by Lipper Inc. (the “Lipper expense group”), (iii) information provided by MFS on the advisory fees of comparable portfolios of other clients of MFS, including institutional separate accounts and other clients, (iv) information as to whether and to what extent applicable expense waivers, reimbursements or fee “breakpoints” are observed for the Fund, (v) information regarding MFS’ financial results and financial condition, including MFS’ and certain of its affiliates’ estimated profitability from services performed for the Fund and the MFS Funds as a whole, and compared to MFS’ institutional business, (vi) MFS’ views regarding the outlook for the mutual fund industry and the strategic business plans of MFS, (vii) descriptions of various functions performed by MFS for the Funds, such as compliance monitoring and portfolio trading practices, and (viii) information regarding the overall organization of MFS, including information about MFS’ senior management and other personnel providing investment advisory, administrative and other services to the Fund and the other MFS Funds. The comparative performance, fee and expense information prepared and provided by Lipper Inc. was not independently verified and the independent Trustees did not independently verify any information provided to them by MFS.
Prior to the close of business on December 7, 2012, the Fund was a series of Sun Capital Advisers Trust and was advised by Sun Capital Advisers LLC (“Sun Capital”), an affiliate of MFS, and subadvised by MFS. Following shareholder approval, MFS became the investment adviser of the Fund effective as of the close of business on December 7, 2012.
The Trustees’ conclusion as to the continuation of the investment advisory agreement was based on a comprehensive consideration of all information provided to the Trustees and not the result of any single factor. Some of the factors that figured particularly in the Trustees’ deliberations are described below, although individual Trustees may have evaluated the information presented differently from one another, giving different weights to various factors. It is also important to recognize that the fee arrangements for the Fund and other MFS Funds are the result of years of review and discussion between the independent Trustees and MFS, that certain aspects of such arrangements may receive greater scrutiny in some years than in others, and that the Trustees’ conclusions may be based, in part, on their consideration of these same arrangements during the course of the year and in prior years.
Based on information provided by Lipper Inc. and MFS, the Trustees reviewed the Fund’s total return investment performance as well as the performance of peer groups of funds over various time periods. The Trustees placed particular emphasis on the total return performance of the Fund’s Initial Class shares in comparison to the performance of funds in its Lipper performance universe over the three-year period ended December 31, 2013, which the Trustees believed was a long enough period to reflect differing market conditions. The total return performance of the Fund’s Initial Class shares was in the 1st quintile relative to the other funds in the universe for this three-year period (the 1st quintile being the best performers and the 5th quintile being the worst performers). The total return performance of the Fund’s Initial Class shares was in the 1st quintile for the one-year period and the 4th quintile for the five-year period ended December 31, 2013 relative to the Lipper performance universe. Because of the passage of time, these performance results may differ from the performance results for more recent periods, including those shown elsewhere in this report.
In addition to considering the performance information provided in connection with the contract review meetings, the Trustees noted that, in light of the Fund’s substandard relative performance at the time of their contract review meetings in 2013, they had
23
MFS Global Real Estate Portfolio
Board Review of Investment Advisory Agreement – continued
met at each of their regular meetings since then with MFS’ senior investment management personnel to discuss the Fund’s performance and MFS’ efforts to improve the Fund’s performance. The Trustees further noted that the Fund’s three-year performance relative to its Lipper performance universe improved for the period ended December 31, 2013, as compared to the prior year. The Trustees also noted that MFS became the Fund’s investment adviser in December 2012. Taking this information into account, the Trustees concluded, within the context of their overall conclusions regarding the investment advisory agreement, that they were satisfied with MFS’ responses and efforts relating to investment performance.
In assessing the reasonableness of the Fund’s advisory fee, the Trustees considered, among other information, the Fund’s advisory fee and the total expense ratio of the Fund’s Initial Class shares as a percentage of average daily net assets and the advisory fee and total expense ratios of peer groups of funds based on information provided by Lipper Inc. The Trustees considered that MFS currently observes an expense limitation for the Fund, which may not be changed without the Trustees’ approval. The Trustees also considered that, according to the Lipper data (which takes into account any fee reductions or expense limitations that were in effect during the Fund’s last fiscal year), the Fund’s effective advisory fee rate was higher than the Lipper expense group median and the Fund’s total expense ratio was approximately at the Lipper expense group median.
The Trustees also considered the advisory fees charged by MFS to any comparable institutional accounts. In comparing these fees, the Trustees considered information provided by MFS as to the generally broader scope of services provided by MFS to the Fund in comparison to institutional accounts, the higher demands placed on MFS’ investment personnel and trading infrastructure as a result of the daily cash in-flows and out-flows of the Fund, and the impact on MFS and expenses associated with the more extensive regulatory regime to which the Fund is subject in comparison to institutional accounts.
The Trustees also considered whether the Fund may benefit from any economies of scale in the management of the Fund in the event of growth in assets of the Fund and/or growth in assets of the MFS Funds as a whole. They noted that the Fund’s advisory fee rate schedule is subject to contractual breakpoints that reduce the Fund’s advisory fee rate on average daily net assets over $1 billion and $2.5 billion. The Trustees also noted that MFS has agreed in writing to waive a portion of the management fees of certain MFS Funds, including the Fund, if the total combined assets of certain funds within the MFS Funds’ complex increase above agreed upon thresholds (the “group fee waiver”), enabling the Fund’s shareholders to share in the benefits from any economies of scale at the complex level. The group fee waiver is reviewed and renewed annually between the Board and MFS. The Trustees concluded that the breakpoints and the group fee waiver were sufficient to allow the Fund to benefit from economies of scale as its assets and overall complex assets grow.
The Trustees also considered information prepared by MFS relating to MFS’ costs and profits with respect to the Fund, the MFS Funds considered as a group, and other investment companies and accounts advised by MFS, as well as MFS’ methodologies used to determine and allocate its costs to the MFS Funds, the Fund and other accounts and products for purposes of estimating profitability.
After reviewing these and other factors described herein, the Trustees concluded, within the context of their overall conclusions regarding the investment advisory agreement, that the advisory fees charged to the Fund represent reasonable compensation in light of the services being provided by MFS to the Fund.
In addition, the Trustees considered MFS’ resources and related efforts to continue to retain, attract and motivate capable personnel to serve the Fund. The Trustees also considered current and developing conditions in the financial services industry, including the presence of large and well-capitalized companies which are spending, and appear to be prepared to continue to spend, substantial sums to engage personnel and to provide services to competing investment companies. In this regard, the Trustees also considered the financial resources of MFS and its ultimate parent, Sun Life Financial Inc. The Trustees also considered the advantages and possible disadvantages to the Fund of having an adviser that also serves other investment companies as well as other accounts.
The Trustees also considered the nature, quality, cost, and extent of administrative, transfer agency, and distribution services provided to the Fund by MFS and its affiliates under agreements and plans other than the investment advisory agreement, including any 12b-1 fees the Fund pays to MFS Fund Distributors, Inc., an affiliate of MFS. The Trustees also considered the nature, extent and quality of certain other services MFS performs or arranges for on the Fund’s behalf, which may include securities lending programs, directed expense payment programs, class action recovery programs, and MFS’ interaction with third-party service providers, principally custodians and sub-custodians. The Trustees concluded that the various non-advisory services provided by MFS and its affiliates on behalf of the Fund were satisfactory.
The Trustees also considered benefits to MFS from the use of the Fund’s portfolio brokerage commissions, if applicable, to pay for investment research and various other factors. Additionally, the Trustees considered so-called “fall-out benefits” to MFS such as reputational value derived from serving as investment manager to the Fund.
Based on their evaluation of factors that they deemed to be material, including those factors described above, the Board of Trustees, including the independent Trustees, concluded that the Fund’s investment advisory agreement with MFS should be continued for an additional one-year period, commencing August 1, 2014.
24
MFS Global Real Estate Portfolio
PROXY VOTING POLICIES AND INFORMATION
MFS votes proxies on behalf of the fund pursuant to proxy voting policies and procedures that are available without charge, upon request, by calling 1-800-225-2606, by visiting the Proxy Voting section of mfs.com or by visiting the SEC’s Web site at http://www.sec.gov.
Information regarding how the fund voted proxies relating to portfolio securities during the most recent twelve-month period ended June 30 is available without charge by visiting the Proxy Voting section of mfs.com or by visiting the SEC’s Web site at http://www.sec.gov.
QUARTERLY PORTFOLIO DISCLOSURE
The fund will file a complete schedule of portfolio holdings with the Securities and Exchange Commission (the Commission) for the first and third quarters of each fiscal year on Form N-Q. The fund’s Form N-Q is available on the EDGAR database on the Commission’s Internet Web site at http://www.sec.gov, and may be reviewed and copied at the:
Public Reference Room
Securities and Exchange Commission
100 F Street, NE, Room 1580
Washington, D.C. 20549
Information on the operation of the Public Reference Room may be obtained by calling the Commission at 1-800-SEC-0330. Copies of the fund’s Form N-Q also may be obtained, upon payment of a duplicating fee, by electronic request at the following e-mail address: publicinfo@sec.gov or by writing the Public Reference Section at the above address.
FURTHER INFORMATION
From time to time, MFS may post important information about the fund or the MFS funds on the MFS web site (mfs.com). This information is available by visiting the “Market Commentary” and “Announcements” sub sections in the “Market Outlooks” section of mfs.com or by clicking on the fund’s name under “Variable Insurance Portfolios — VIT III” in the “Products” section of mfs.com.
25
rev. 3/11
| | | | |
| FACTS | | WHAT DOES MFS DO WITH YOUR
PERSONAL INFORMATION? | |  |
| | |
| Why? | | Financial companies choose how they share your personal information. Federal law gives consumers the right to limit some but not all sharing. Federal law also requires us to tell you how we collect, share, and protect your personal information. Please read this notice carefully to understand what we do. |
| | |
| What? | | The types of personal information we collect and share depend on the product or service you have with us. This information can include: • Social Security number and account balances • Account transactions and transaction history • Checking account information and wire transfer instructions When you are no longer our customer, we continue to share your information as described in this notice. |
| | |
| How? | | All financial companies need to share customers’ personal information to run their everyday business. In the section below, we list the reasons financial companies can share their customers’ personal information; the reasons MFS chooses to share; and whether you can limit this sharing. |
| | | | |
Reasons we can share your
personal information | | Does MFS share? | | Can you limit this
sharing? |
For our everyday business purposes – such as to process your transactions, maintain your account(s), respond to court orders and legal investigations, or report to credit bureaus | | Yes | | No |
For our marketing purposes – to offer our products and services to you | | No | | We don’t share |
| For joint marketing with other financial companies | | No | | We don’t share |
For our affiliates’ everyday business purposes – information about your transactions and experiences | | No | | We don’t share |
For our affiliates’ everyday business purposes – information about your creditworthiness | | No | | We don’t share |
| For nonaffiliates to market to you | | No | | We don’t share |
| | |
| Questions? | | Call 800-225-2606 or go to mfs.com. |
26
| | |
| Who we are |
| Who is providing this notice? | | MFS Funds, MFS Investment Management, MFS Institutional Advisors, Inc., MFS Fund Distributors, Inc., MFS Heritage Trust Company, and MFS Service Center, Inc. |
| | |
| What we do |
| How does MFS protect my personal information? | | To protect your personal information from unauthorized access and use, we use security measures that comply with federal law. These measures include procedural, electronic, and physical safeguards for the protection of the personal information we collect about you. |
How does MFS
collect my personal information? | | We collect your personal information, for example, when you • open an account or provide account information • direct us to buy securities or direct us to sell your securities • make a wire transfer We also collect your personal information from others, such as credit bureaus, affiliates and other companies. |
| Why can’t I limit all sharing? | | Federal law gives you the right to limit only • sharing for affiliates’ everyday business purposes – information about your creditworthiness • affiliates from using your information to market to you • sharing for nonaffiliates to market to you State laws and individual companies may give you additional rights to limit sharing. |
| | |
| Definitions |
| Affiliates | | Companies related by common ownership or control. They can be financial and nonfinancial companies. • MFS does not share personal information with affiliates, except for everyday business purposes as described on page one of this notice. |
| Nonaffiliates | | Companies not related by common ownership or control. They can be financial and nonfinancial companies. • MFS does not share with nonaffiliates so they can market to you. |
| Joint Marketing | | A formal agreement between nonaffiliated financial companies that together market financial products or services to you. • MFS doesn’t jointly market. |
| | |
| Other important information |
| If you own an MFS product or receive an MFS service in the name of a third party such as a bank or broker-dealer, their privacy policy may apply to you instead of ours. |
27
ANNUAL REPORT
December 31, 2014

MFS® GROWTH
ALLOCATION PORTFOLIO
MFS® Variable Insurance Trust III

VGA-ANN
MFS® GROWTH ALLOCATION PORTFOLIO
CONTENTS
The report is prepared for the general information of contract owners. It is authorized for distribution to prospective investors only when preceded or accompanied by a current prospectus.
NOT FDIC INSURED Ÿ MAY LOSE VALUE Ÿ NO BANK OR CREDIT UNION GUARANTEE Ÿ NOT A DEPOSIT Ÿ NOT INSURED BY ANY FEDERAL GOVERNMENT AGENCY OR NCUA/NCUSIF
MFS Growth Allocation Portfolio
LETTER FROM THE CHAIRMAN

Dear Contract Owners:
As 2015 begins, sharply lower oil prices are reshaping the global economy, adding to deflationary pressures in the eurozone and exacerbating challenges faced by oil exporters such as Russia. The U.S. economy stands on firmer ground, having expanded steadily over the past year. The U.S. labor market has regained momentum, consumer confidence is buoyant and gasoline prices have tumbled, boosting prospects for a stronger economic rebound in 2015.
Other regions are struggling. The eurozone economy is barely expanding, and the European Central Bank (ECB) has introduced large-scale asset purchases.
Despite Japan’s efforts to strengthen its economy, its sales tax increase last spring tipped the country into a recession, leading to additional monetary stimulus from the Bank of Japan. China’s economy is slowing as it transitions to a more sustainable basis, and its growth rate will likely continue to decline.
As always, active risk management is integral to how we at MFS® manage your investments. We use a collaborative process, sharing insights across asset classes, regions and economic sectors. Our global investment team uses a diversified, multidisciplined, long-term approach.
Applying proven principles, such as asset allocation and diversification, can best serve investors over the long term. We are confident that this approach can help you as you work with your financial advisors to reach your goals in the years ahead.
Respectfully,

Robert J. Manning
Chairman
MFS Investment Management
February 13, 2015
The opinions expressed in this letter are subject to change and may not be relied upon for investment advice. No forecasts can be guaranteed.
1
MFS Growth Allocation Portfolio
PORTFOLIO COMPOSITION
Portfolio target allocation
| | | | |
| Portfolio holdings | | | | |
| MFS Growth Series | | | 11.1% | |
| MFS Value Series | | | 11.0% | |
| MFS Research Series | | | 10.0% | |
| MFS Mid Cap Value Portfolio | | | 9.1% | |
| MFS Mid Cap Growth Series | | | 9.1% | |
| MFS Research International Portfolio | | | 8.9% | |
| MFS High Yield Portfolio | | | 5.0% | |
| MFS Global Real Estate Portfolio | | | 5.0% | |
| MFS International Growth Portfolio | | | 5.0% | |
| MFS International Value Portfolio | | | 5.0% | |
| MFS Research Bond Series | | | 5.0% | |
| MFS Inflation-Adjusted Bond Portfolio | | | 4.9% | |
| MFS Global Governments Portfolio | | | 4.0% | |
| MFS New Discovery Value Portfolio | | | 2.0% | |
| MFS New Discovery Series | | | 2.0% | |
| MFS Limited Maturity Portfolio | | | 2.0% | |
| MFS Emerging Markets Equity Portfolio | | | 0.9% | |
| Cash & Other (o) | | | 0.0% | |
Portfolio actual allocation
Cash & Other can include cash, other assets less liabilities, and short-term securities.
Percentages are based on net assets as of 12/31/14.
The portfolio is actively managed and current holdings may be different.
2
MFS Growth Allocation Portfolio
MANAGEMENT REVIEW
Summary of Results
For the twelve months ended December 31, 2014, Initial Class shares of the MFS Growth Allocation Portfolio (“fund”) provided a total return of 5.39%, while Service Class shares of the fund provided a total return of 5.04%. These compare with a return of 13.69% for the fund’s benchmark, the Standard & Poor’s 500 Stock Index (“S&P 500 Index”). The fund’s other benchmark, the MFS Growth Allocation Portfolio Blended Index (“Blended Index”), generated a return of 8.40%. The Blended Index reflects the blended returns of various equity and fixed income market indices, with percentage allocations to each index designed to resemble the allocations of the fund. The market indices and related percentage allocations used to compile the Blended Index are set forth in the Performance Summary.
Market Environment
Early in the period, US equities suffered what proved to be a temporary setback due to concerns over emerging markets as well as what was perceived at the time to be a pause in US economic growth, partially caused by extreme weather events and a weak December 2013 labor market report. Markets soon recovered as the economic pause concluded and investors appeared to have become increasingly comfortable that newly-installed US Federal Reserve (“Fed”) Chair Janet Yellen would not make any substantial changes to the trajectory of Fed monetary policy.
A generally risk-friendly, carry trade environment persisted from February 2014 until mid-year. While geopolitical tensions flared in the Middle East and Russia/Ukraine, any market setbacks were short-lived as improving economic growth in the US, coupled with prospects for easier monetary policy in regions with slowing growth, such as Japan, Europe and China, supported risk assets. For example, the European Central Bank (“ECB”) cut policy interest rates into negative territory and, by the end of the period, expectations were for additional rate cuts and the announcement for non-conventional easing measures. Similarly, the Bank of Japan surprised markets late in the period with fresh stimulus measures given lackluster growth trends. The related decline in developed market government bond yields and credit spreads were also supportive for equity markets. At the end of the period, the US equity market was trading close to all-time highs and US Treasury yields were close to their lows for the period. However, credit markets did not fare as well in the second half of 2014, particularly US high yield and emerging market debt. The higher weightings of oil and gas credits in these asset classes resulted in widening spreads and increased volatility as oil prices began to decline in an accelerated fashion in the fourth quarter.
Factors Affecting Performance
The fund underperformed the Blended Index over the period. US equities significantly outperformed international stocks during the period, however several of the funds held within the US equities market segment underperformed their respective benchmarks, particularly the fund’s holdings in the MFS Growth Series, MFS Mid Cap Value Portfolio, MFS Research Series and MFS Value Series. Additionally, the fund’s allocations in the MFS New Discovery Value Portfolio, the MFS New Discovery Series and the MFS Mid Cap Growth Series dampened relative results as mid cap growth and small cap stocks generally underperformed large cap stocks.
The fund’s investments in segments of the fixed income market delivered positive returns but underperformed the fixed income portion of the Blended Index as investors extended into longer maturity bonds which helped flatten the yield curve. Consequently, the fund’s allocation to the relatively shorter duration MFS Limited Maturity Portfolio dragged down performance relative to the fixed income portion of the blended index. Additionally, the fund’s investment in the MFS Global Governments Portfolio held back relative performance as international bonds underperformed US bonds.
Respectfully,
Joseph Flaherty
Portfolio Manager
The views expressed in this report are those of the portfolio manager only through the end of the period of the report as stated on the cover and do not necessarily reflect the views of MFS or any other person in the MFS organization. These views are subject to change at any time based on market or other conditions, and MFS disclaims any responsibility to update such views. These views may not be relied upon as investment advice or an indication of trading intent on behalf of any MFS portfolio. References to specific securities are not recommendations of such securities, and may not be representative of any MFS portfolio’s current or future investments.
3
MFS Growth Allocation Portfolio
PERFORMANCE SUMMARY THROUGH 12/31/14
The following chart illustrates the historical performance of the fund in comparison to its benchmark(s). Benchmarks are unmanaged and may not be invested in directly. Benchmark returns do not reflect any fees or expenses. The performance of other share classes will be greater than or less than that of the class depicted below. (See Notes to Performance Summary.)
Performance data shown represents past performance and is no guarantee of future results. Investment return and principal value fluctuate so your units, when sold, may be worth more or less than the original cost; current performance may be lower or higher than quoted. The performance shown does not reflect the deduction of taxes, if any, that a contract holder would pay on fund distributions or the redemption of contract units. The returns for the fund shown also do not reflect the deduction of expenses associated with variable products, such as mortality and expense risk charges, separate account charges, and sales charges imposed by the insurance company separate accounts. Such expenses would reduce the overall returns shown.
Growth of a Hypothetical $10,000 Investment (t)
Total Returns through 12/31/14
Average annual total returns
| | | | | | | | | | | | |
| | | Share Class | | Class inception date | | 1-yr | | 5-yr | | Life (t) | | |
| | | Initial Class | | 10/01/08 | | 5.39% | | 9.81% | | 9.87% | | |
| | | Service Class | | 10/01/08 | | 5.04% | | 9.54% | | 9.60% | | |
| | | | |
| Comparative benchmarks | | | | | | | | |
| | | Standard & Poor’s 500 Stock Index (f) | | 13.69% | | 15.45% | | 11.94% | | |
| | | MFS Growth Allocation Portfolio Blended Index (f)(w) | | 8.40% | | 11.20% | | 9.43% | | |
| | | Barclays U.S. Aggregate Bond Index (f) | | 5.97% | | 4.45% | | 5.25% | | |
| | | FTSE EPRA/NAREIT Developed Real Estate Index (f) | | 15.89% | | 12.03% | | 8.34% | | |
| | | MSCI EAFE Index (f) | | (4.48)% | | 5.81% | | 5.61% | | |
| (f) | | Source: FactSet Research Systems Inc. |
| (t) | | For the period from the class inception date through the stated period end. (See Notes to Performance Summary.) |
| (w) | | As of December 31, 2014, the MFS Growth Allocation Portfolio Blended Index was comprised of 54% Standard & Poor’s 500 Stock Index, 21% Barclays U.S. Aggregate Bond Index, 20% MSCI EAFE Index, and 5% FTSE EPRA/NAREIT Developed Real Estate Index. |
Benchmark Definitions
Barclays U.S. Aggregate Bond Index – a market capitalization-weighted index that measures the performance of the U.S. investment-grade, fixed rate bond market, with index components for government and corporate securities, mortgage pass-through securities, and asset-backed securities with at least one year to final maturity.
FTSE EPRA/NAREIT Developed Real Estate Index – measures the performance of eligible real estate equities worldwide that generate a majority of their revenue and income through the ownership, disposure and development of income-producing real estate.
MSCI EAFE Index – a market capitalization-weighted index that is designed to measure equity market performance in the developed markets, excluding the U.S. and Canada.
4
MFS Growth Allocation Portfolio
Performance Summary – continued
Standard & Poor’s 500 Stock Index – a market capitalization-weighted index of 500 widely held equity securities, designed to measure broad U.S. equity performance.
It is not possible to invest directly in an index.
Notes to Performance Summary
Average annual total return represents the average annual change in value for each share class for the periods presented. Life returns are presented where the share class has less than 10 years of performance history and represent the average annual total return from the class inception date to the stated period end date.
Performance results reflect any applicable expense subsidies and waivers in effect during the periods shown. Without such subsidies and waivers the fund’s performance results would be less favorable. Please see the prospectus and financial statements for complete details. All results are historical and assume the reinvestment of any dividends and capital gains distributions.
Performance prior to close of business December 7, 2012, reflects time periods when another adviser or subadviser was responsible for selecting investments for the fund under a different investment objective and different investment strategies, underlying fund selections, and underlying fund target weightings of the fund.
Performance results do not include adjustments made for financial reporting purposes in accordance with U.S. generally accepted accounting principles and may differ from amounts reported in the financial highlights.
From time to time the fund may receive proceeds from litigation settlements, without which performance would be lower.
5
MFS Growth Allocation Portfolio
EXPENSE TABLE
Fund Expenses Borne by the Contract Holders During the Period,
July 1, 2014 through December 31, 2014
As a contract holder of the fund, you incur ongoing costs, including distribution and/or service (12b-1) fees; and other fund expenses. This example is intended to help you understand your ongoing costs (in dollars) of investing in the fund and to compare these costs with the ongoing costs of investing in other mutual funds.
In addition to the fees and expenses which the fund bears directly, the fund indirectly bears a pro rata share of the fees and expenses of the underlying funds in which the fund invests. Because the underlying funds have varied expenses and fee levels and the fund may own different proportions of the underlying funds at different times, the amount of fees and expenses incurred indirectly by the fund will vary. If these indirect costs were included, your costs would have been higher.
The example is based on an investment of $1,000 invested at the beginning of the period and held for the entire period July 1, 2014 through December 31, 2014.
Actual Expenses
The first line for each share class in the following table provides information about actual account values and actual expenses. You may use the information in this line, together with the amount you invested, to estimate the expenses that you paid over the period. Simply divide your account value by $1,000 (for example, an $8,600 account value divided by $1,000 = 8.6), then multiply the result by the number in the first line under the heading entitled “Expenses Paid During Period” to estimate the expenses you paid on your account during this period.
Hypothetical Example for Comparison Purposes
The second line for each share class in the following table provides information about hypothetical account values and hypothetical expenses based on the fund’s actual expense ratio and an assumed rate of return of 5% per year before expenses, which is not the fund’s actual return. The hypothetical account values and expenses may not be used to estimate the actual ending account balance or expenses you paid for the period. You may use this information to compare the ongoing costs of investing in the fund and other funds. To do so, compare this 5% hypothetical example with the 5% hypothetical examples that appear in the shareholder reports of the other funds.
Please note that the expenses shown in the table are meant to highlight the fund’s ongoing costs only and do not take into account the fees and expenses imposed under the variable contracts through which your investment in the fund is made. Therefore, the second line for each share class in the table is useful in comparing ongoing costs associated with an investment in vehicles (such as the fund) which fund benefits under variable annuity and variable life insurance contracts and to qualified pension and retirement plans only, and will not help you determine the relative total costs of investing in the fund through variable annuity and variable life insurance contracts. If the fees and expenses imposed under the variable contracts were included, your costs would have been higher.
| | | | | | | | | | | | | | | | | | |
| Share Class | | | | Annualized
Expense Ratio | | | Beginning
Account Value
7/01/14 | | | Ending Account Value
12/31/14 | | | Expenses Paid
During Period (p)
7/01/14-12/31/14 | |
| Initial Class | | Actual | | | 0.02% | | | | $1,000.00 | | | | $1,005.22 | | | | $0.10 | |
| | Hypothetical (h) | | | 0.02% | | | | $1,000.00 | | | | $1,025.10 | | | | $0.10 | |
| Service Class | | Actual | | | 0.27% | | | | $1,000.00 | | | | $1,003.44 | | | | $1.36 | |
| | Hypothetical (h) | | | 0.27% | | | | $1,000.00 | | | | $1,023.84 | | | | $1.38 | |
| (h) | 5% class return per year before expenses. |
| (p) | “Expenses Paid During Period” are equal to each class’s annualized expense ratio, as shown above, multiplied by the average account value over the period, multiplied by 184/365 (to reflect the one-half year period). In addition to the fees and expenses which the fund bears directly, the fund indirectly bears a pro rata share of the fees and expenses of the underlying funds in which the fund invests. If these indirect costs were included, your costs would have been higher. |
6
MFS Growth Allocation Portfolio
PORTFOLIO OF INVESTMENTS – 12/31/14
The Portfolio of Investments is a complete list of all securities owned by your fund. It is categorized by broad-based asset classes.
| | | | | | | | |
| Issuer | | Shares/Par | | | Value ($) | |
| | | | | | | | |
| UNDERLYING AFFILIATED FUNDS – 100.0% | |
| MFS Emerging Markets Equity Portfolio – Initial Class | | | 382,048 | | | $ | 5,142,364 | |
| MFS Global Governments Portfolio – Initial Class | | | 2,033,298 | | | | 21,288,634 | |
| MFS Global Real Estate Portfolio – Initial Class | | | 1,930,951 | | | | 27,149,168 | |
| MFS Growth Series – Initial Class | | | 1,502,382 | | | | 59,719,670 | |
| MFS High Yield Portfolio – Initial Class | | | 4,452,046 | | | | 27,201,999 | |
| MFS Inflation-Adjusted Bond Portfolio – Initial Class | | | 2,577,297 | | | | 26,597,703 | |
| MFS International Growth Portfolio – Initial Class | | | 2,037,206 | | | | 27,074,471 | |
| MFS International Value Portfolio – Initial Class | | | 1,243,253 | | | | 27,015,896 | |
| MFS Limited Maturity Portfolio – Initial Class | | | 1,051,186 | | | | 10,753,638 | |
| MFS Mid Cap Growth Series – Initial Class | | | 5,596,692 | | | | 49,027,020 | |
| MFS Mid Cap Value Portfolio – Initial Class | | | 5,003,638 | | | | 49,035,652 | |
| MFS New Discovery Series – Initial Class | | | 668,782 | | | | 10,914,523 | |
| MFS New Discovery Value Portfolio – Initial Class | | | 1,018,510 | | | | 10,938,802 | |
| MFS Research Bond Series – Initial Class | | | 1,996,160 | | | | 26,948,164 | |
| MFS Research International Portfolio – Initial Class | | | 3,301,572 | | | | 48,070,888 | |
| MFS Research Series – Initial Class | | | 1,865,594 | | | | 54,307,448 | |
| MFS Value Series – Initial Class | | | 2,934,865 | | | | 59,695,146 | |
| | | | | | | | |
Total Underlying Affiliated Funds
(Identified Cost, $453,886,251) | | | $ | 540,881,186 | |
| | | | | | | | |
| | | | | | | | |
| Issuer | | Shares/Par | | | Value ($) | |
| | | | | | | | |
| MONEY MARKET FUNDS – 0.0% | | | | | |
| MFS Institutional Money Market Portfolio, 0.09%, at Cost and Net Asset Value (v) | | | 79,898 | | | $ | 79,898 | |
| | | | | | | | |
Total Investments
(Identified Cost, $453,966,149) | | | | | | $ | 540,961,084 | |
| | | | | | | | |
OTHER ASSETS, LESS
LIABILITIES – 0.0% | | | | | | | 141,945 | |
| | | | | | | | |
| NET ASSETS – 100.0% | | | | | | $ | 541,103,029 | |
| | | | | | | | |
| (v) | | Underlying affiliated fund that is available only to investment companies managed by MFS. The rate quoted for the MFS Institutional Money Market Portfolio is the annualized seven-day yield of the fund at period end. |
See Notes to Financial Statements
7
MFS Growth Allocation Portfolio
FINANCIAL STATEMENTS | STATEMENT OF ASSETS AND LIABILITIES
This statement represents your fund’s balance sheet, which details the assets and liabilities comprising the total value of the fund.
| | | | | | | | |
At 12/31/14 | | | | | | | | |
Assets | | | | | | | | |
Investments – | | | | | | | | |
Underlying affiliated funds, at value (identified cost, $453,966,149) | | | $540,961,084 | | | | | |
Receivables for | | | | | | | | |
Investments sold | | | 1,504,410 | | | | | |
Fund shares sold | | | 216 | | | | | |
Other assets | | | 4,768 | | | | | |
Total assets | | | | | | | $542,470,478 | |
Liabilities | | | | | | | | |
Payable for fund shares reacquired | | | $1,311,100 | | | | | |
Payable to affiliates | | | | | | | | |
Administrator | | | 96 | | | | | |
Shareholder servicing costs | | | 66 | | | | | |
Distribution and/or service fees | | | 7,445 | | | | | |
Payable for independent Trustees’ compensation | | | 16 | | | | | |
Accrued expenses and other liabilities | | | 48,726 | | | | | |
Total liabilities | | | | | | | $1,367,449 | |
Net assets | | | | | | | $541,103,029 | |
Net assets consist of | | | | | | | | |
Paid-in capital | | | $410,110,925 | | | | | |
Unrealized appreciation (depreciation) on investments | | | 86,994,935 | | | | | |
Accumulated net realized gain (loss) on investments | | | 22,483,006 | | | | | |
Undistributed net investment income | | | 21,514,163 | | | | | |
Net assets | | | | | | | $541,103,029 | |
Shares of beneficial interest outstanding | | | | | | | 43,595,850 | |
| | | | | | | | | | | | |
| | | Net assets | | | Shares outstanding | | | Net asset value
per share | |
Initial Class | | | $2,938,749 | | | | 236,634 | | | | $12.42 | |
Service Class | | | 538,164,280 | | | | 43,359,216 | | | | 12.41 | |
See Notes to Financial Statements
8
MFS Growth Allocation Portfolio
FINANCIAL STATEMENTS | STATEMENT OF OPERATIONS
This statement describes how much your fund earned in investment income and accrued in expenses. It also describes any gains and/or losses generated by fund operations.
| | | | | | | | |
Year ended 12/31/14 | | | | | | | | |
Net investment income | | | | | |
Dividends from underlying affiliated funds | | | | | | | $7,493,239 | |
Expenses | | | | | | | | |
Distribution and/or service fees | | | $1,454,639 | | | | | |
Shareholder servicing costs | | | 15,019 | | | | | |
Administrative services fee | | | 17,498 | | | | | |
Independent Trustees’ compensation | | | 15,491 | | | | | |
Custodian fee | | | 49,631 | | | | | |
Shareholder communications | | | 2,215 | | | | | |
Audit and tax fees | | | 41,343 | | | | | |
Legal fees | | | 5,069 | | | | | |
Miscellaneous | | | 18,873 | | | | | |
Total expenses | | | | | | | $1,619,778 | |
Reduction of expenses by investment adviser | | | (1,030 | ) | | | | |
Net expenses | | | | | | | $1,618,748 | |
Net investment income | | | | | | | $5,874,491 | |
Realized and unrealized gain (loss) on investments | | | | | |
Realized gain (loss) (identified cost basis) | | | | | | | | |
Investments in underlying affiliated funds | | | $11,394,068 | | | | | |
Capital gain distributions from underlying affiliated funds | | | 27,665,452 | | | | | |
Net realized gain (loss) on investments | | | | | | | $39,059,520 | |
Change in unrealized appreciation (depreciation) on investments | | | | | | | $(16,027,525 | ) |
Net realized and unrealized gain (loss) on investments | | | | | | | $23,031,995 | |
Change in net assets from operations | | | | | | | $28,906,486 | |
See Notes to Financial Statements
9
MFS Growth Allocation Portfolio
FINANCIAL STATEMENTS | STATEMENTS OF CHANGES IN NET ASSETS
These statements describe the increases and/or decreases in net assets resulting from operations, any distributions, and any shareholder transactions.
| | | | | | | | |
For years ended 12/31 | | | 2014 | | | | 2013 | |
Change in net assets | | | | | | | | |
From operations | | | | | | | | |
Net investment income | | | $5,874,491 | | | | $4,234,188 | |
Net realized gain (loss) on investments | | | 39,059,520 | | | | 13,728,329 | |
Net unrealized gain (loss) on investments | | | (16,027,525 | ) | | | 101,801,780 | |
Change in net assets from operations | | | $28,906,486 | | | | $119,764,297 | |
Distributions declared to shareholders | | | | | | | | |
From net investment income | | | $(8,241,333 | ) | | | $(13,774,200 | ) |
From net realized gain on investments | | | (9,859,000 | ) | | | (52,412,075 | ) |
Total distributions declared to shareholders | | | $(18,100,333 | ) | | | $(66,186,275 | ) |
Change in net assets from fund share transactions | | | $(91,527,582 | ) | | | $5,305,733 | |
Total change in net assets | | | $(80,721,429 | ) | | | $58,883,755 | |
Net assets | | | | | | | | |
At beginning of period | | | 621,824,458 | | | | 562,940,703 | |
At end of period (including undistributed net investment income of $21,514,163 and
$8,241,012, respectively) | | | $541,103,029 | | | | $621,824,458 | |
See Notes to Financial Statements
10
MFS Growth Allocation Portfolio
FINANCIAL STATEMENTS | FINANCIAL HIGHLIGHTS
The financial highlights table is intended to help you understand the fund’s financial performance for the past 5 years. Certain information reflects financial results for a single fund share. The total returns in the table represent the rate by which an investor would have earned (or lost) on an investment in the fund share class (assuming reinvestment of all distributions) held for the entire period.
| | | | | | | | | | | | | | | | | | | | |
| Initial Class | | Years ended 12/31 | |
| | | 2014 | | | 2013 | | | 2012 | | | 2011 | | | 2010 | |
Net asset value, beginning of period | | | $12.19 | | | | $11.22 | | | | $10.70 | | | | $12.47 | | | | $11.25 | |
| Income (loss) from investment operations | | | | | | | | | | | | | | | | | | | | |
Net investment income (d)(l) | | | $0.16 | | | | $0.12 | | | | $0.26 | | | | $0.16 | | | | $0.18 | |
Net realized and unrealized gain (loss) on investments | | | 0.50 | | | | 2.28 | | | | 1.11 | | | | (0.64 | ) | | | 1.34 | |
Total from investment operations | | | $0.66 | | | | $2.40 | | | | $1.37 | | | | $(0.48 | ) | | | $1.52 | |
| Less distributions declared to shareholders | | | | | | | | | | | | | | | | | | | | |
From net investment income | | | $(0.21 | ) | | | $(0.32 | ) | | | $(0.30 | ) | | | $(0.23 | ) | | | $(0.18 | ) |
From net realized gain on investments | | | (0.22 | ) | | | (1.11 | ) | | | (0.55 | ) | | | (1.06 | ) | | | (0.12 | ) |
Total distributions declared to shareholders | | | $(0.43 | ) | | | $(1.43 | ) | | | $(0.85 | ) | | | $(1.29 | ) | | | $(0.30 | ) |
Net asset value, end of period (x) | | | $12.42 | | | | $12.19 | | | | $11.22 | | | | $10.70 | | | | $12.47 | |
Total return (%) (k)(r)(s)(x) | | | 5.39 | | | | 22.56 | | | | 12.78 | | | | (3.66 | ) | | | 13.80 | |
Ratios (%) (to average net assets)
and Supplemental data: | | | | | | | | | | | | | | | | | | | | |
Expenses before expense reductions (f)(h) | | | 0.03 | | | | 0.03 | | | | 0.18 | | | | 0.21 | | | | 0.22 | |
Expenses after expense reductions (f)(h) | | | 0.03 | | | | 0.03 | | | | N/A | | | | 0.21 | | | | 0.20 | |
Net investment income (l) | | | 1.29 | | | | 0.98 | | | | 2.31 | | | | 1.34 | | | | 1.54 | |
Portfolio turnover | | | 1 | | | | 4 | | | | 72 | | | | 16 | | | | 38 | |
Net assets at end of period (000 omitted) | | | $2,939 | | | | $2,858 | | | | $2,971 | | | | $2,143 | | | | $1,616 | |
See Notes to Financial Statements
11
MFS Growth Allocation Portfolio
Financial Highlights – continued
| | | | | | | | | | | | | | | | | | | | |
| Service Class | | Years ended 12/31 | |
| | | 2014 | | | 2013 | | | 2012 | | | 2011 | | | 2010 | |
Net asset value, beginning of period | | | $12.19 | | | | $11.21 | | | | $10.70 | | | | $12.47 | | | | $11.24 | |
| Income (loss) from investment operations | | | | | | | | | | | | | | | | | | | | |
Net investment income (d)(l) | | | $0.12 | | | | $0.08 | | | | $0.18 | | | | $0.10 | | | | $0.12 | |
Net realized and unrealized gain (loss) on investments | | | 0.50 | | | | 2.30 | | | | 1.15 | | | | (0.61 | ) | | | 1.38 | |
Total from investment operations | | | $0.62 | | | | $2.38 | | | | $1.33 | | | | $(0.51 | ) | | | $1.50 | |
| Less distributions declared to shareholders | | | | | | | | | | | | | | | | | | | | |
From net investment income | | | $(0.18 | ) | | | $(0.29 | ) | | | $(0.27 | ) | | | $(0.20 | ) | | | $(0.15 | ) |
From net realized gain on investments | | | (0.22 | ) | | | (1.11 | ) | | | (0.55 | ) | | | (1.06 | ) | | | (0.12 | ) |
Total distributions declared to shareholders | | | $(0.40 | ) | | | $(1.40 | ) | | | $(0.82 | ) | | | $(1.26 | ) | | | $(0.27 | ) |
Net asset value, end of period (x) | | | $12.41 | | | | $12.19 | | | | $11.21 | | | | $10.70 | | | | $12.47 | |
Total return (%) (k)(r)(s)(x) | | | 5.04 | | | | 22.38 | | | | 12.40 | | | | (3.90 | ) | | | 13.61 | |
Ratios (%) (to average net assets)
and Supplemental data: | | | | | | | | | | | | | | | | | | | | |
Expenses before expense reductions (f)(h) | | | 0.28 | | | | 0.28 | | | | 0.43 | | | | 0.46 | | | | 0.47 | |
Expenses after expense reductions (f)(h) | | | 0.28 | | | | 0.28 | | | | N/A | | | | 0.45 | | | | 0.45 | |
Net investment income (l) | | | 1.00 | | | | 0.71 | | | | 1.59 | | | | 0.86 | | | | 1.03 | |
Portfolio turnover | | | 1 | | | | 4 | | | | 72 | | | | 16 | | | | 38 | |
Net assets at end of period (000 omitted) | | | $538,164 | | | | $618,967 | | | | $559,969 | | | | $546,019 | | | | $588,923 | |
Information prior to the close of business on December 7, 2012, reflects time periods when another adviser or subadviser was responsible for selecting investments for the fund under a different investment objective and different investment strategies, underlying fund selections, and underlying fund target weightings of the fund.
| (d) | Per share data is based on average shares outstanding. |
| (f) | Ratios do not reflect reductions from fees paid indirectly, if applicable. |
| (h) | In addition to the fees and expenses which the fund bears directly, the fund indirectly bears a pro rata share of the fees and expenses of the underlying affiliated funds in which the fund invests. Accordingly, the expense ratio for the fund reflects only those fees and expenses borne directly by the fund. Because the underlying affiliated funds have varied expense and fee levels and the fund may own different proportions of the underlying affiliated funds at different times, the amount of fees and expenses incurred indirectly by the fund will vary. |
| (k) | The total return does not reflect expenses that apply to separate accounts. Inclusion of these charges would reduce the total return figures for all periods shown. |
| (l) | Recognition of net investment income by the fund may be affected by the timing of the declaration of dividends by the underlying affiliated funds in which the fund invests. The ratios and per share amounts do not include net investment income of the underlying affiliated funds in which the fund invests. |
| (r) | Certain expenses have been reduced without which performance would have been lower. |
| (s) | From time to time the fund may receive proceeds from litigation settlements, without which performance would be lower. |
| (x) | The net asset values per share and total returns have been calculated on net assets which include adjustments made in accordance with U.S. generally accepted accounting principles required at period end for financial reporting purposes. |
See Notes to Financial Statements
12
MFS Growth Allocation Portfolio
NOTES TO FINANCIAL STATEMENTS
| (1) | | Business and Organization |
MFS Growth Allocation Portfolio (the fund) is a diversified series of MFS Variable Insurance Trust III (the trust). The trust is organized as a Deleware statutory trust and is registered under the Investment Company Act of 1940, as amended, as an open-end management investment company. The shareholders of each series of the trust are separate accounts of insurance companies, which offer variable annuity and/or life insurance products, and qualified retirement and pension plans.
The fund is an investment company and accordingly follows the investment company accounting and reporting guidance of the Financial Accounting Standards Board (FASB) Accounting Standards Codification Topic 946 Financial Services – Investment Companies.
| (2) | | Significant Accounting Policies |
General – The preparation of financial statements in conformity with U.S. generally accepted accounting principles requires management to make estimates and assumptions that affect the reported amounts of assets and liabilities, and disclosure of contingent assets and liabilities at the date of the financial statements and the reported amounts of increases and decreases in net assets from operations during the reporting period. Actual results could differ from those estimates. In the preparation of these financial statements, management has evaluated subsequent events occurring after the date of the fund’s Statement of Assets and Liabilities through the date that the financial statements were issued.
The fund is a “fund of funds”, which invests the majority of its assets in other MFS mutual funds (hereafter referred to as “underlying affiliated funds” or “underlying funds”), which may have different fiscal year ends than the funds. The underlying funds, in turn, may engage in a number of investment techniques and practices, which involve certain risks. Certain underlying funds invest their portfolio in high-yield securities rated below investment grade. Investments in high-yield securities involve greater degrees of credit and market risk than investments in higher-rated securities and tend to be more sensitive to economic conditions. Certain underlying funds invest a significant portion of their assets in asset-backed and/or mortgage-backed securities. The value of these securities may depend, in part, on the issuer’s or borrower’s credit quality or ability to pay principal and interest when due and may fall if an issuer or borrower defaults on its obligation to pay principal or interest or if the instrument’s credit rating is downgraded by a credit rating agency. U.S. Government securities not supported as to the payment of principal or interest by the U.S. Treasury, such as those issued by Fannie Mae, Freddie Mac, and the Federal Home Loan Banks, are subject to greater credit risk than are U.S. Government securities supported by the U.S. Treasury, such as those issued by Ginnie Mae. Certain underlying funds invest in foreign securities, including securities of emerging market issuers. Investments in foreign securities are vulnerable to the effects of changes in the relative values of the local currency and the U.S. dollar and to the effects of changes in each country’s legal, political, and economic environment. The markets of emerging markets countries are generally more volatile than the markets of developed countries with more mature economies. All of the risks of investing in foreign securities previously described are heightened when investing in emerging markets countries.
The accounting policies of the underlying funds in which the fund invests are outlined in the underlying funds’ shareholder reports, which are available without charge by calling 1-800-225-2606, at mfs.com and on the Securities and Exchange Commission (SEC) web site at http://www.sec.gov or at the SEC’s public reference room in Washington, D.C. The underlying funds’ shareholder reports are not covered by this report.
In June 2014, FASB issued Accounting Standards Update 2014-11, Transfers and Servicing (Topic 860) – Repurchase-to-Maturity Transactions, Repurchase Financings, and Disclosures (“ASU 2014-11”). ASU 2014-11 changes the accounting for repurchase-to-maturity transactions (i.e., repurchase agreements that settle at the same time as the maturity of the transferred financial asset) and enhances the required disclosures for repurchase agreements and other similar transactions. Although still evaluating the potential impacts of ASU 2014-11 to the fund, management expects that the impact of the fund’s adoption will be limited to additional financial statement disclosures which would first be effective for interim reporting periods beginning after March 15, 2015.
Investment Valuations – Open-end investment companies (underlying funds) are generally valued at their net asset value per share. The investments of underlying funds managed by the adviser are valued as described below. For purposes of this policy disclosure, “fund” also refers to the underlying funds in which the fund-of-funds invests.
Equity securities, including restricted equity securities, are generally valued at the last sale or official closing price as provided by a third-party pricing service on the market or exchange on which they are primarily traded. Equity securities, for which there were no sales reported that day, are generally valued at the last quoted daily bid quotation as provided by a third-party pricing service on the market or exchange on which such securities are primarily traded. Equity securities held short, for which there were no sales reported for that day, are generally valued at the last quoted daily ask quotation as provided by a third-party pricing service on the market or exchange on which such securities are primarily traded. Debt instruments and floating rate loans, including restricted debt instruments, are generally valued at an evaluated or composite bid as provided by a third-party pricing service. Short-term instruments with a maturity at issuance of 60 days or less may be valued at amortized cost, which approximates market value.
13
MFS Growth Allocation Portfolio
Notes to Financial Statements – continued
Exchange-traded options are generally valued at the last sale or official closing price as provided by a third-party pricing service on the exchange on which such options are primarily traded. Exchange-traded options for which there were no sales reported that day are generally valued at the last daily bid quotation as provided by a third-party pricing service on the exchange on which such options are primarily traded. Options not traded on an exchange are generally valued at a broker/dealer bid quotation. Foreign currency options are generally valued at valuations provided by a third-party pricing service. Futures contracts are generally valued at last posted settlement price as provided by a third-party pricing service on the market on which they are primarily traded. Futures contracts for which there were no trades that day for a particular position are generally valued at the closing bid quotation as provided by a third-party pricing service on the market on which such futures contracts are primarily traded. Forward foreign currency exchange contracts are generally valued at the mean of bid and asked prices for the time period interpolated from rates provided by a third-party pricing service for proximate time periods. Swap agreements are generally valued at valuations provided by a third-party pricing service, which for cleared swaps includes an evaluation of any trading activity at the clearinghouses. Open-end investment companies are generally valued at net asset value per share. Securities and other assets generally valued on the basis of information from a third-party pricing service may also be valued at a broker/dealer bid quotation. Values obtained from third-party pricing services can utilize both transaction data and market information such as yield, quality, coupon rate, maturity, type of issue, trading characteristics, and other market data. The values of foreign securities and other assets and liabilities expressed in foreign currencies are converted to U.S. dollars using the mean of bid and asked prices for rates provided by a third-party pricing service.
The Board of Trustees has delegated primary responsibility for determining or causing to be determined the value of the fund’s investments (including any fair valuation) to the adviser pursuant to valuation policies and procedures approved by the Board. If the adviser determines that reliable market quotations are not readily available, investments are valued at fair value as determined in good faith by the adviser in accordance with such procedures under the oversight of the Board of Trustees. Under the fund’s valuation policies and procedures, market quotations are not considered to be readily available for most types of debt instruments and floating rate loans and many types of derivatives. These investments are generally valued at fair value based on information from third-party pricing services. In addition, investments may be valued at fair value if the adviser determines that an investment’s value has been materially affected by events occurring after the close of the exchange or market on which the investment is principally traded (such as foreign exchange or market) and prior to the determination of the fund’s net asset value, or after the halting of trading of a specific security where trading does not resume prior to the close of the exchange or market on which the security is principally traded. Events that occur on a frequent basis after foreign markets close (such as developments in foreign markets and significant movements in the U.S. markets) and prior to the determination of the fund’s net asset value may be deemed to have a material effect on the value of securities traded in foreign markets. Accordingly, the fund’s foreign equity securities may often be valued at fair value. The adviser generally relies on third-party pricing services or other information (such as the correlation with price movements of similar securities in the same or other markets; the type, cost and investment characteristics of the security; the business and financial condition of the issuer; and trading and other market data) to assist in determining whether to fair value and at what value to fair value an investment. The value of an investment for purposes of calculating the fund’s net asset value can differ depending on the source and method used to determine value. When fair valuation is used, the value of an investment used to determine the fund’s net asset value may differ from quoted or published prices for the same investment. There can be no assurance that the fund could obtain the fair value assigned to an investment if it were to sell the investment at the same time at which the fund determines its net asset value per share.
Various inputs are used in determining the value of the fund’s assets or liabilities. These inputs are categorized into three broad levels. In certain cases, the inputs used to measure fair value may fall into different levels of the fair value hierarchy. In such cases, an investment’s level within the fair value hierarchy is based on the lowest level of input that is significant to the fair value measurement. The fund’s assessment of the significance of a particular input to the fair value measurement in its entirety requires judgment, and considers factors specific to the investment. Level 1 includes unadjusted quoted prices in active markets for identical assets or liabilities. Level 2 includes other significant observable market-based inputs (including quoted prices for similar securities, interest rates, prepayment speed, and credit risk). Level 3 includes unobservable inputs, which may include the adviser’s own assumptions in determining the fair value of investments. The following is a summary of the levels used as of December 31, 2014 in valuing the fund’s assets or liabilities:
| | | | | | | | | | | | | | | | |
| Investments at Value | | Level 1 | | | Level 2 | | | Level 3 | | | Total | |
| Mutual Funds | | | $540,961,084 | | | | $— | | | | $— | | | | $540,961,084 | |
For further information regarding security characteristics, see the Portfolio of Investments. Please refer to the underlying funds’ shareholder reports for further information regarding the levels used in valuing the underlying funds’ assets or liabilities.
Derivatives – The fund does not invest in derivatives directly. The fund does invest in underlying funds that may use derivatives for different purposes, primarily to increase or decrease exposure to a particular market or segment of the market, or security, to increase or decrease interest rate or currency exposure, or as alternatives to direct investments. Derivatives are used for hedging or
14
MFS Growth Allocation Portfolio
Notes to Financial Statements – continued
non-hedging purposes. While hedging can reduce or eliminate losses, it can also reduce or eliminate gains. When the underlying funds use derivatives as an investment to increase market exposure, or for hedging purposes, gains and losses from derivative instruments may be substantially greater than the derivative’s original cost.
Indemnifications – Under the fund’s organizational documents, its officers and Trustees may be indemnified against certain liabilities and expenses arising out of the performance of their duties to the fund. Additionally, in the normal course of business, the fund enters into agreements with service providers that may contain indemnification clauses. The fund’s maximum exposure under these agreements is unknown as this would involve future claims that may be made against the fund that have not yet occurred.
Investment Transactions and Income – Investment transactions are recorded on the trade date. Interest income is recorded on an accrual basis. All premium and discount is amortized or accreted for financial statement purposes in accordance with U.S. generally accepted accounting principles. Distributions of income and capital gains from the underlying funds are recorded on the ex-dividend date. Recognition of net investment income by the fund is affected by the timing of the declaration of distributions by the underlying funds in which the fund invests. In determining the net gain or loss on securities sold, the cost of securities is determined on the identified cost basis.
The fund and/or the underlying funds may receive proceeds from litigation settlements. Any proceeds received from litigation involving portfolio holdings are reflected in the Statement of Operations in realized gain/loss if the security has been disposed of by the fund or in unrealized gain/loss if the security is still held by the fund. Any other proceeds from litigation not related to portfolio holdings are reflected as “Other” income in the Statement of Operations.
Fees Paid Indirectly – The fund’s custody fee may be reduced according to an arrangement that measures the value of cash deposited with the custodian by the fund. For the year ended December 31, 2014, custody fees were not reduced.
Tax Matters and Distributions – The fund intends to qualify as a regulated investment company, as defined under Subchapter M of the Internal Revenue Code, and to distribute all of its taxable income, including realized capital gains. As a result, no provision for federal income tax is required. The fund’s federal tax returns, when filed, will remain subject to examination by the Internal Revenue Service for a three year period. Management has analyzed the fund’s tax positions taken on federal and state tax returns for all open tax years and does not believe that there are any uncertain tax positions that require recognition of a tax liability.
Distributions to shareholders are recorded on the ex-dividend date. Income and capital gain distributions are determined in accordance with income tax regulations, which may differ from U.S. generally accepted accounting principles. Certain capital accounts in the financial statements are periodically adjusted for permanent differences in order to reflect their tax character. These adjustments have no impact on net assets or net asset value per share. Temporary differences which arise from recognizing certain items of income, expense, gain or loss in different periods for financial statement and tax purposes will reverse at some time in the future. Distributions in excess of net investment income or net realized gains are temporary overdistributions for financial statement purposes resulting from differences in the recognition or classification of income or distributions for financial statement and tax purposes.
Book/tax differences primarily relate to wash sale loss deferrals.
The tax character of distributions declared to shareholders for the last two fiscal years is as follows:
| | | | | | | | |
| | | 12/31/14 | | | 12/31/13 | |
| Ordinary income (including any short-term capital gains) | | | $10,447,293 | | | | $13,774,200 | |
| Long-term capital gains | | | 7,653,040 | | | | 52,412,075 | |
| Total distributions | | | $18,100,333 | | | | $66,186,275 | |
The federal tax cost and the tax basis components of distributable earnings were as follows:
| | | | |
| As of 12/31/14 | | | | |
| Cost of investments | | | $455,074,936 | |
| Gross appreciation | | | 88,120,028 | |
| Gross depreciation | | | (2,233,880 | ) |
| Net unrealized appreciation (depreciation) | | | $85,886,148 | |
| Undistributed ordinary income | | | 22,430,468 | |
| Undistributed long-term capital gain | | | 22,675,488 | |
Multiple Classes of Shares of Beneficial Interest – The fund offers multiple classes of shares, which differ in their respective distribution and/or service fees. The fund’s income, realized and unrealized gain (loss), and common expenses are allocated to
15
MFS Growth Allocation Portfolio
Notes to Financial Statements – continued
shareholders based on the daily net assets of each class. Dividends are declared separately for each class. Differences in per share dividend rates are generally due to differences in separate class expenses. The fund’s distributions declared to shareholders as reported in the Statements of Changes in Net Assets are presented by class as follows:
| | | | | | | | | | | | | | | | |
| | | From net investment
income | | | From net realized gain on
investments | |
| | | Year ended
12/31/14 | | | Year ended
12/31/13 | | | Year ended
12/31/14 | | | Year ended
12/31/13 | |
| Initial Class | | | $50,294 | | | | $75,329 | | | | $50,996 | | | | $260,226 | |
| Service Class | | | 8,191,039 | | | | 13,698,871 | | | | 9,808,004 | | | | 52,151,849 | |
| Total | | | $8,241,333 | | | | $13,774,200 | | | | $9,859,000 | | | | $52,412,075 | |
| (3) | | Transactions with Affiliates |
Investment Adviser – The fund has an investment advisory agreement with MFS to provide overall investment management and related administrative services and facilities to the fund. MFS receives no compensation under this agreement; however MFS receives management fees from the underlying MFS funds.
The investment adviser has agreed in writing to pay a portion of the fund’s operating expenses, excluding distribution and/or service fees, interest, taxes, extraordinary expenses, brokerage and transaction costs, and investment-related expenses such as fees and expenses associated with investments in investment companies and other similar investment vehicles such that fund operating expenses do not exceed 0.20% annually of the fund’s average daily net assets. This written agreement will continue until modified by the fund’s Board of Trustees, but such agreement will continue at least until April 30, 2016. For the year ended December 31, 2014, the fund’s actual operating expenses did not exceed the limit and therefore, the investment adviser did not pay any portion of the fund’s expenses related to this agreement.
In addition to the fees and expenses which the fund bears directly, the fund indirectly bears a pro rata share of the fees and expenses of the underlying funds in which a fund invests. Accordingly, the expense ratio for the fund reflects only those fees and expenses borne directly by the fund.
Distributor – MFS Fund Distributors, Inc. (MFD), a wholly-owned subsidiary of MFS, is the distributor of shares of the fund. The Trustees have adopted a distribution plan for the Service Class shares pursuant to Rule 12b-1 under the Investment Company Act of 1940.
The fund’s distribution plan provides that the fund will pay MFD distribution and/or service fees equal to 0.25% per annum of its average daily net assets attributable to Service Class shares as partial consideration for services performed and expenses incurred by MFD and financial intermediaries (including participating insurance companies that invest in the fund to fund variable annuity and variable life insurance contracts, sponsors of qualified retirement and pension plans that invest in the fund, and affiliates of these participating insurance companies and plan sponsors) in connection with the sale and distribution of the Service Class shares. MFD may subsequently pay all, or a portion, of the distribution and/or service fees to financial intermediaries.
Shareholder Servicing Agent – MFS Service Center, Inc. (MFSC), a wholly-owned subsidiary of MFS, receives a fee from the fund for its services as shareholder servicing agent. For the year ended December 31, 2014, the fee was $14,978, which equated to 0.0026% annually of the fund’s average daily net assets. MFSC also receives payment from the fund for out-of-pocket expenses paid by MFSC on behalf of the fund. For the year ended December 31, 2014, these costs amounted to $41.
Administrator – MFS provides certain financial, legal, shareholder communications, compliance, and other administrative services to the fund. Under an administrative services agreement, the fund partially reimburses MFS the costs incurred to provide these services. The fund pays an annual fixed amount of $17,500. The administrative services fee incurred for the year ended December 31, 2014 was equivalent to an annual effective rate of 0.0030% the fund’s average daily net assets.
Trustees’ and Officers’ Compensation – The fund pays compensation to independent Trustees in the form of a retainer, attendance fees, and additional compensation to Board and Committee chairpersons. The fund does not pay compensation directly to Trustees or officers of the fund who are also officers of the investment adviser, all of whom receive remuneration for their services to the fund from MFS. Certain officers and Trustees of the fund are officers or directors of MFS, MFD, and MFSC.
Other – Effective November 1, 2014, this fund and certain other funds managed by MFS (the funds) have entered into a service agreement (the ISO Agreement) which provides for payment of fees solely by the funds to Tarantino LLC in return for the provision of services of an Independent Senior Officer (ISO) for the funds. Frank L. Tarantino serves as the ISO and is an officer of the funds and the sole member of Tarantino LLC. The funds can terminate the ISO Agreement with Tarantino LLC at any time under the terms of the ISO Agreement. Prior to November 1, 2014, the funds had entered into services agreements (the Compliance Officer Agreements) which provided for payment of fees by the funds to Tarantino LLC and Griffin Compliance LLC in return for the provision of services of an Independent Chief Compliance Officer (ICCO) and Assistant ICCO, respectively, for the funds. Prior to November 1, 2014, Frank L. Tarantino served as the ICCO. Effective October 31, 2014, Mr. Tarantino resigned as ICCO and the
16
MFS Growth Allocation Portfolio
Notes to Financial Statements – continued
Compliance Officer Agreement between the funds and Tarantino LLC was terminated. Prior to June 1, 2014, Robyn L. Griffin served as the Assistant ICCO and was an officer of the funds. Ms. Griffin is the sole member of Griffin Compliance LLC. Effective May 31, 2014, Ms. Griffin resigned as Assistant ICCO and the Compliance Officer Agreement between the funds and Griffin Compliance LLC was terminated. For the year ended December 31, 2014, the aggregate fees paid by the fund under these agreements were $2,743 and are included in “Miscellaneous” expense in the Statement of Operations. MFS had agreed to reimburse the fund for a portion of the payments made by the fund for the services under the Compliance Officer Agreements in the amount of $1,030, which is included in the reduction of total expenses in the Statement of Operations. Additionally, MFS has agreed to bear all expenses associated with office space, other administrative support, and supplies provided to the ICCO, Assistant ICCO, and ISO.
The fund invests in the MFS Institutional Money Market Portfolio which is managed by MFS and seeks current income consistent with preservation of capital and liquidity. Income earned on this investment is included in “Dividends from underlying affiliated funds” in the Statement of Operations. This money market fund does not pay a management fee to MFS.
For the year ended December 31, 2014, purchases and sales of shares of underlying funds aggregated $6,319,068 and $117,566,900, respectively.
| (5) | | Shares of Beneficial Interest |
The fund’s Declaration of Trust permits the Trustees to issue an unlimited number of full and fractional shares of beneficial interest. Transactions in fund shares were as follows:
| | | | | | | | | | | | | | | | |
| | | Year ended 12/31/14 | | | Year ended 12/31/13 | |
| | | Shares | | | Amount | | | Shares | | | Amount | |
| Shares sold | | | | | | | | | | | | | | | | |
Initial Class | | | 22,896 | | | | $282,675 | | | | 36,900 | | | | $437,540 | |
Service Class | | | 631,045 | | | | 7,699,626 | | | | 1,291,017 | | | | 15,393,936 | |
| | | 653,941 | | | | $7,982,301 | | | | 1,327,917 | | | | $15,831,476 | |
| Shares issued to shareholders in reinvestment of distributions | | | | | | | | | | | | | | | | |
Initial Class | | | 8,142 | | | | $101,290 | | | | 30,149 | | | | $335,555 | |
Service Class | | | 1,446,868 | | | | 17,999,043 | | | | 5,916,507 | | | | 65,850,720 | |
| | | 1,455,010 | | | | $18,100,333 | | | | 5,946,656 | | | | $66,186,275 | |
| Shares reacquired | | | | | | | | | | | | | | | | |
Initial Class | | | (28,789 | ) | | | $(355,588 | ) | | | (97,508 | ) | | | $(1,144,701 | ) |
Service Class | | | (9,514,366 | ) | | | (117,254,628 | ) | | | (6,343,793 | ) | | | (75,567,317 | ) |
| | | (9,543,155 | ) | | | $(117,610,216 | ) | | | (6,441,301 | ) | | | $(76,712,018 | ) |
| Net change | | | | | | | | | | | | | | | | |
Initial Class | | | 2,249 | | | | $28,377 | | | | (30,459 | ) | | | $(371,606 | ) |
Service Class | | | (7,436,453 | ) | | | (91,555,959 | ) | | | 863,731 | | | | 5,677,339 | |
| | | (7,434,204 | ) | | | $(91,527,582 | ) | | | 833,272 | | | | $5,305,733 | |
The fund and certain other funds managed by MFS participate in a $1.1 billion unsecured committed line of credit, subject to a $1 billion sublimit, provided by a syndication of banks under a credit agreement. Borrowings may be made for temporary financing needs. Interest is charged to each fund, based on its borrowings, generally at a rate equal to the higher of the Federal Reserve funds rate or one month LIBOR plus an agreed upon spread. A commitment fee, based on the average daily, unused portion of the committed line of credit, is allocated among the participating funds at the end of each calendar quarter. In addition, the fund and other funds managed by MFS have established unsecured uncommitted borrowing arrangements with certain banks for temporary financing needs. Interest is charged to each fund, based on its borrowings, at a rate equal to the Federal Reserve funds rate plus an agreed upon spread. For the year ended December 31, 2014, the fund’s commitment fee and interest expense were $2,212 and $0, respectively, and are included in “Miscellaneous” expense in the Statement of Operations.
17
MFS Growth Allocation Portfolio
Notes to Financial Statements – continued
| (7) | | Transactions in Underlying Affiliated Funds – Affiliated Issuers |
An affiliated issuer may be considered one in which the fund owns 5% or more of the outstanding voting securities, or a company which is under common control. For the purposes of this report, the fund assumes the following to be affiliated issuers:
| | | | | | | | | | | | | | | | |
| Underlying Affiliated Funds | | Beginning Shares/Par Amount | | | Acquisitions Shares/Par Amount | | | Dispositions Shares/Par Amount | | | Ending Shares/Par Amount | |
| MFS Emerging Markets Equity Portfolio | | | 417,933 | | | | 25,268 | | | | (61,153 | ) | | | 382,048 | |
| MFS Global Governments Portfolio | | | 2,311,333 | | | | 77,169 | | | | (355,204 | ) | | | 2,033,298 | |
| MFS Global Real Estate Portfolio | | | 2,448,416 | | | | 75,240 | | | | (592,705 | ) | | | 1,930,951 | |
| MFS Growth Series | | | 1,765,573 | | | | 128,259 | | | | (391,450 | ) | | | 1,502,382 | |
| MFS High Yield Portfolio | | | 4,876,475 | | | | 296,482 | | | | (720,911 | ) | | | 4,452,046 | |
| MFS Inflation-Adjusted Bond Portfolio | | | 3,032,449 | | | | 105,981 | | | | (561,133 | ) | | | 2,577,297 | |
| MFS Institutional Money Market Portfolio | | | 13 | | | | 18,859,061 | | | | (18,779,176 | ) | | | 79,898 | |
| MFS International Growth Portfolio | | | 2,113,249 | | | | 133,972 | | | | (210,015 | ) | | | 2,037,206 | |
| MFS International Value Portfolio | | | 1,427,945 | | | | 34,145 | | | | (218,837 | ) | | | 1,243,253 | |
| MFS Limited Maturity Portfolio | | | 1,180,813 | | | | 42,669 | | | | (172,296 | ) | | | 1,051,186 | |
| MFS Mid Cap Growth Series | | | 6,275,206 | | | | 731,813 | | | | (1,410,327 | ) | | | 5,596,692 | |
| MFS Mid Cap Value Portfolio | | | 5,604,863 | | | | 650,783 | | | | (1,252,008 | ) | | | 5,003,638 | |
| MFS New Discovery Series | | | 573,127 | | | | 164,532 | | | | (68,877 | ) | | | 668,782 | |
| MFS New Discovery Value Portfolio | | | 1,034,730 | | | | 174,573 | | | | (190,793 | ) | | | 1,018,510 | |
| MFS Research Bond Series | | | 2,319,684 | | | | 97,024 | | | | (420,548 | ) | | | 1,996,160 | |
| MFS Research International Portfolio | | | 3,493,761 | | | | 124,327 | | | | (316,516 | ) | | | 3,301,572 | |
| MFS Research Series | | | 2,180,043 | | | | 170,559 | | | | (485,008 | ) | | | 1,865,594 | |
| MFS Value Series | | | 3,576,853 | | | | 153,882 | | | | (795,870 | ) | | | 2,934,865 | |
| | | | |
| Underlying Affiliated Funds | | Realized Gain Amount | | | Capital Gain Amount | | | Dividend Amount | | | Ending Value | |
| MFS Emerging Markets Equity Portfolio | | | $(12,338 | ) | | | $— | | | | $36,627 | | | | $5,142,364 | |
| MFS Global Governments Portfolio | | | (137,147 | ) | | | — | | | | 124,060 | | | | 21,288,634 | |
| MFS Global Real Estate Portfolio | | | 640,941 | | | | — | | | | 639,091 | | | | 27,149,168 | |
| MFS Growth Series | | | 2,535,615 | | | | 4,222,125 | | | | 66,161 | | | | 59,719,670 | |
| MFS High Yield Portfolio | | | 115,969 | | | | — | | | | 1,576,926 | | | | 27,201,999 | |
| MFS Inflation-Adjusted Bond Portfolio | | | (426,943 | ) | | | — | | | | 258,699 | | | | 26,597,703 | |
| MFS Institutional Money Market Portfolio | | | — | | | | — | | | | 89 | | | | 79,898 | |
| MFS International Growth Portfolio | | | 375,477 | | | | 1,284,716 | | | | 259,473 | | | | 27,074,471 | |
| MFS International Value Portfolio | | | 983,458 | | | | — | | | | 559,312 | | | | 27,015,896 | |
| MFS Limited Maturity Portfolio | | | (1,844 | ) | | | 45,714 | | | | 147,788 | | | | 10,753,638 | |
| MFS Mid Cap Growth Series | | | 1,528,811 | | | | 5,640,573 | | | | — | | | | 49,027,020 | |
| MFS Mid Cap Value Portfolio | | | 1,048,627 | | | | 5,678,751 | | | | 516,530 | | | | 49,035,652 | |
| MFS New Discovery Series | | | 39,745 | | | | 2,350,450 | | | | — | | | | 10,914,523 | |
| MFS New Discovery Value Portfolio | | | 32,270 | | | | 1,635,703 | | | | 62,381 | | | | 10,938,802 | |
| MFS Research Bond Series | | | (307,055 | ) | | | — | | | | 837,727 | | | | 26,948,164 | |
| MFS Research International Portfolio | | | 714,387 | | | | 530,398 | | | | 960,155 | | | | 48,070,888 | |
| MFS Research Series | | | 1,722,165 | | | | 4,307,265 | | | | 474,675 | | | | 54,307,448 | |
| MFS Value Series | | | 2,541,930 | | | | 1,969,757 | | | | 973,545 | | | | 59,695,146 | |
| | | | | | | | | | | | | | | | |
| | | $11,394,068 | | | | $27,665,452 | | | | $7,493,239 | | | | $540,961,084 | |
| | | | | | | | | | | | | | | | |
18
MFS Growth Allocation Portfolio
REPORT OF INDEPENDENT REGISTERED PUBLIC ACCOUNTING FIRM
To the Board of Trustees of MFS Variable Insurance Trust III and the Shareholders of
MFS Growth Allocation Portfolio:
We have audited the accompanying statement of assets and liabilities, including the portfolio of investments, of MFS Growth Allocation Portfolio (one of the series of MFS Variable Insurance Trust III) (the “Fund”) as of December 31, 2014, and the related statement of operations for the year then ended, the statements of changes in net assets for each of the two years in the period then ended, and the financial highlights for each of the five years in the period then ended. These financial statements and financial highlights are the responsibility of the Fund’s management. Our responsibility is to express an opinion on these financial statements and financial highlights based on our audits.
We conducted our audits in accordance with the standards of the Public Company Accounting Oversight Board (United States). Those standards require that we plan and perform the audit to obtain reasonable assurance about whether the financial statements and financial highlights are free of material misstatement. The Fund is not required to have, nor were we engaged to perform, an audit of its internal control over financial reporting. Our audits included consideration of internal control over financial reporting as a basis for designing audit procedures that are appropriate in the circumstances, but not for the purpose of expressing an opinion on the effectiveness of the Fund’s internal control over financial reporting. Accordingly, we express no such opinion. An audit also includes examining, on a test basis, evidence supporting the amounts and disclosures in the financial statements, assessing the accounting principles used and significant estimates made by management, as well as evaluating the overall financial statement presentation. Our procedures included confirmation of securities owned as of December 31, 2014, by correspondence with the underlying funds’ transfer agent. We believe that our audits provide a reasonable basis for our opinion.
In our opinion, the financial statements and financial highlights referred to above present fairly, in all material respects, the financial position of MFS Growth Allocation Portfolio as of December 31, 2014, the results of its operations for the year then ended, the changes in its net assets for each of the two years in the period then ended, and the financial highlights for each of the five years in the period then ended, in conformity with accounting principles generally accepted in the United States of America.
DELOITTE & TOUCHE LLP
Boston, Massachusetts
February 13, 2015
19
MFS Growth Allocation Portfolio
TRUSTEES AND OFFICERS – IDENTIFICATION AND BACKGROUND
The Trustees and Officers of the Trust, as of February 1, 2015, are listed below, together with their principal occupations during the past five years. (Their titles may have varied during that period.) The address of each Trustee and Officer is 111 Huntington Avenue, Boston, Massachusetts 02199-7618.
| | | | | | | | |
Name, Age | | Position(s)
Held with Fund | | Trustee/Officer
Since (h) | | Principal Occupations
During the Past Five Years | | Other Directorships (j) |
| INTERESTED TRUSTEES |
Robert J. Manning (k) (age 51) | | Trustee | | February 2004 | | Massachusetts Financial Services Company, Chairman, Co-Chief Executive Officer and Director; President (until 2009); Chief Investment Officer (until 2010) | | N/A |
| | | | |
Robin A. Stelmach (k) (age 53) | | Trustee and President | | January 2014 | | Massachusetts Financial Services Company, Executive Vice President and Chief Operating Officer | | N/A |
| | | |
| INDEPENDENT TRUSTEES | | | | | | |
David H. Gunning (age 72) | | Trustee and Chair of Trustees | | January 2004 | | Private investor | | Lincoln Electric Holdings, Inc. (welding equipment manufacturer), Director; Development Alternatives, Inc. (consulting), Director/Non-Executive Chairman |
| | | | |
Steven E. Buller (age 63) | | Trustee | | February 2014 | | Chairman, Financial Accounting Standards Advisory Council; Standing Advisory Group, Public Company Accounting Oversight Board, Member (until 2014); BlackRock, Inc. (investment management), Managing Director (until 2014), BlackRock Finco UK (investment management), Director (until 2014) | | N/A |
| | | | |
Robert E. Butler (age 73) | | Trustee | | January 2006 | | Consultant – investment company industry regulatory and compliance matters | | N/A |
| | | | |
Maureen R. Goldfarb (age 59) | | Trustee | | January 2009 | | Private investor | | N/A |
| | | | |
William R. Gutow (age 73) | | Trustee | | December 1993 | | Private investor and real estate consultant; Capitol Entertainment Management Company (video franchise), Vice Chairman | | Texas Donuts (donut franchise), Vice Chairman (until 2010) |
| | | | |
Michael Hegarty (age 70) | | Trustee | | December 2004 | | Private investor | | Brookfield Office Properties, Inc. (real estate), Director; Rouse Properties Inc. (real estate), Director; Capmark Financial Group Inc. (real estate), Director |
| | | | |
John P. Kavanaugh (age 60) | | Trustee | | January 2009 | | Private investor | | N/A |
| | | | |
Maryanne L. Roepke (age 58) | | Trustee | | May 2014 | | American Century Investments (investment management), Senior Vice President and Chief Compliance Officer (until 2014) | | N/A |
| | | | |
Laurie J. Thomsen (age 57) | | Trustee | | March 2005 | | Private investor; New Profit, Inc. (venture philanthropy), Executive Partner (until 2010) | | The Travelers Companies (insurance), Director |
| | | | |
Robert W. Uek (age 73) | | Trustee | | January 2006 | | Consultant to investment company industry | | N/A |
| | | | |
| OFFICERS | | | | | | | | |
Christopher R. Bohane (k) (age 41) | | Assistant Secretary and Assistant Clerk | | July 2005 | | Massachusetts Financial Services Company, Vice President and Assistant General Counsel | | N/A |
| | | | |
Kino Clark (k) (age 46) | | Assistant Treasurer | | January 2012 | | Massachusetts Financial Services Company, Vice President | | N/A |
| | | | |
Thomas H. Connors (k) (age 55) | | Assistant Secretary and Assistant Clerk | | September 2012 | | Massachusetts Financial Services Company, Vice President and Senior Counsel; Deutsche Investment Management Americas Inc. (financial service provider), Director and Senior Counsel (until 2012) | | N/A |
20
MFS Growth Allocation Portfolio
Trustees and Officers – continued
| | | | | | | | |
Name, Age | | Position(s)
Held with Fund | | Trustee/Officer
Since (h) | | Principal Occupations
During the Past Five Years | | Other Directorships (j) |
Ethan D. Corey (k) (age 51) | | Assistant
Secretary and Assistant Clerk | | July 2005 | | Massachusetts Financial Services Company, Senior Vice President and Associate General Counsel | | N/A |
| | | | |
David L. DiLorenzo (k) (age 46) | | Treasurer | | July 2005 | | Massachusetts Financial Services Company, Senior Vice President | | N/A |
| | | | |
Timothy M. Fagan (k) (age 46) | | Chief Compliance Officer | | November 2014 | | Massachusetts Financial Services Company, Chief Compliance Officer; Vice President and Senior Counsel (until 2012) | | N/A |
| | | | |
Brian E. Langenfeld (k) (age 41) | | Assistant
Secretary and Assistant Clerk | | June 2006 | | Massachusetts Financial Services Company, Vice President and Senior Counsel | | N/A |
| | | | |
Susan S. Newton (k) (age 64) | | Assistant
Secretary and Assistant Clerk | | May 2005 | | Massachusetts Financial Services Company, Senior Vice President and Associate General Counsel | | N/A |
| | | | |
Susan A. Pereira (k) (age 44) | | Assistant
Secretary and Assistant Clerk | | July 2005 | | Massachusetts Financial Services Company, Vice President and Senior Counsel | | N/A |
| | | | |
Kasey L. Phillips (k) (age 44) | | Assistant Treasurer | | September 2012 | | Massachusetts Financial Services Company, Vice President; Wells Fargo Funds Management, LLC, Senior Vice President, Fund Treasurer (until 2012) | | N/A |
| | | | |
Mark N. Polebaum (k) (age 62) | | Secretary and
Clerk | | January 2006 | | Massachusetts Financial Services Company, Executive Vice President, General Counsel and Secretary | | N/A |
| | | | |
Matthew A. Stowe (k) (age 40) | | Assistant Secretary and Assistant Clerk | | October 2014 | | Massachusetts Financial Services Company, Vice President and Senior Counsel | | N/A |
| | | | |
Frank L. Tarantino (age 70) | | Independent
Senior Officer | | June 2004 | | Tarantino LLC (provider of compliance services), Principal | | N/A |
| | | | |
Richard S. Weitzel (k) (age 44) | | Assistant Secretary and Assistant Clerk | | October 2007 | | Massachusetts Financial Services Company, Senior Vice President and Associate General Counsel | | N/A |
| | | | |
James O. Yost (k) (age 54) | | Deputy Treasurer | | September 1990 | | Massachusetts Financial Services Company, Senior Vice President | | N/A |
| (h) | Date first appointed to serve as Trustee/officer of an MFS Fund. Each Trustee has served continuously since appointment unless indicated otherwise. For the period from December 15, 2004 until February 22, 2005, Mr. Manning served as Advisory Trustee. Prior to January 2012, Messrs. DiLorenzo and Yost served as Assistant Treasurers of the Funds. Ms. Stelmach was appointed as President of the Funds as of October 1, 2014. |
| (j) | Directorships or trusteeships of companies required to report to the Securities and Exchange Commission (i.e., “public companies”). |
| (k) | “Interested person” of the Trust within the meaning of the Investment Company Act of 1940 (referred to as the 1940 Act), which is the principal federal law governing investment companies like the fund, as a result of a position with MFS. The address of MFS is 111 Huntington Avenue, Boston, Massachusetts 02199-7618. |
Each Trustee (except Ms. Stelmach, Mr. Buller and Ms. Roepke) has been elected by shareholders and each Trustee and officer holds office until his or her successor is chosen and qualified or until his or her earlier death, resignation, retirement or removal. The Trust does not hold annual meetings for the purpose of electing Trustees, and Trustees are not elected for fixed terms. Messrs. Butler, Kavanaugh, Uek and Mses. Thomsen and Roepke are members of the Trust’s Audit Committee.
Each of the Fund’s Trustees and officers holds comparable positions with certain other funds of which MFS or a subsidiary is the investment adviser or distributor, and, in the case of the officers, with certain affiliates of MFS. As of February 1, 2015, the Trustees served as board members of 135 funds within the MFS Family of Funds.
21
MFS Growth Allocation Portfolio
Trustees and Officers – continued
The Statement of Additional Information for the Fund includes further information about the Trustees and is available without charge upon request by calling 1-800-225-2606.
| | |
Investment Adviser Massachusetts Financial Services Company 111 Huntington Avenue Boston, MA 02199-7618 | | Custodian State Street Bank and Trust Company 1 Lincoln Street Boston, MA 02111-2900 |
Distributor MFS Fund Distributors, Inc. 111 Huntington Avenue Boston, MA 02199-7618 | | Independent Registered Public Accounting Firm Deloitte & Touche LLP 200 Berkeley Street Boston, MA 02116 |
Portfolio Manager Joseph Flaherty | | |
22
MFS Growth Allocation Portfolio
BOARD REVIEW OF INVESTMENT ADVISORY AGREEMENT
The Investment Company Act of 1940 requires that both the full Board of Trustees and a majority of the non-interested (“independent”) Trustees, voting separately, annually approve the continuation of the Fund’s investment advisory agreement with MFS. The Trustees consider matters bearing on the Fund and its advisory arrangements at their meetings throughout the year, including a review of performance data at each regular meeting. In addition, the independent Trustees met several times over the course of three months beginning in May and ending in July, 2014 (“contract review meetings”) for the specific purpose of considering whether to approve the continuation of the investment advisory agreement for the Fund and the other investment companies that the Board oversees (the “MFS Funds”). The independent Trustees were assisted in their evaluation of the Fund’s investment advisory agreement by independent legal counsel, from whom they received separate legal advice and with whom they met separately from MFS during various contract review meetings. The independent Trustees were also assisted in this process by the MFS Funds’ Independent Chief Compliance Officer, a full-time senior officer appointed by and reporting to the independent Trustees.
In connection with their deliberations regarding the continuation of the investment advisory agreement, the Trustees, including the independent Trustees, considered such information and factors as they believed, in light of the legal advice furnished to them and their own business judgment, to be relevant. The investment advisory agreement for the Fund was considered separately, although the Trustees also took into account the common interests of all MFS Funds in their review. As described below, the Trustees considered the nature, quality, and extent of the various investment advisory, administrative, and shareholder services performed by MFS under the existing investment advisory agreement and other arrangements with the Fund.
In connection with their contract review meetings, the Trustees received and relied upon materials that included, among other items: (i) information provided by Lipper Inc., an independent third party, on the investment performance of the Fund for various time periods ended December 31, 2013 and the investment performance of a group of funds with substantially similar investment classifications/objectives (the “Lipper performance universe”), (ii) information provided by Lipper Inc. on the Fund’s fees and expenses and the fees and expenses of comparable funds identified by Lipper Inc. (the “Lipper expense group”), (iii) information as to whether and to what extent applicable expense waivers and reimbursements are observed for the Fund, (iv) information regarding MFS’ financial results and financial condition, including MFS’ and certain of its affiliates’ estimated profitability from services performed for the Fund and the MFS Funds as a whole, and compared to MFS’ institutional business, (v) MFS’ views regarding the outlook for the mutual fund industry and the strategic business plans of MFS, (vi) descriptions of various functions performed by MFS for the Funds, such as compliance monitoring and portfolio trading practices, and (vii) information regarding the overall organization of MFS, including information about MFS’ senior management and other personnel providing investment advisory, administrative and other services to the Fund and the other MFS Funds. The comparative performance, fee and expense information prepared and provided by Lipper Inc. was not independently verified and the independent Trustees did not independently verify any information provided to them by MFS.
Prior to the close of business on December 7, 2012, the Fund was a series of Sun Capital Advisers Trust and was advised by Sun Capital Advisers LLC, an affiliate of MFS, and subadvised by Ibbotson Associates, Inc. Following shareholder approval, MFS became the investment adviser of the Fund and assumed day-to-day investment management responsibilities for the Fund effective as of the close of business on December 7, 2012.
The Trustees’ conclusion as to the continuation of the investment advisory agreement was based on a comprehensive consideration of all information provided to the Trustees and not the result of any single factor. Some of the factors that figured particularly in the Trustees’ deliberations are described below, although individual Trustees may have evaluated the information presented differently from one another, giving different weights to various factors. It is also important to recognize that the fee arrangements for the Fund and other MFS Funds are the result of years of review and discussion between the independent Trustees and MFS, that certain aspects of such arrangements may receive greater scrutiny in some years than in others, and that the Trustees’ conclusions may be based, in part, on their consideration of these same arrangements during the course of the year and in prior years.
Based on information provided by Lipper Inc. and MFS, the Trustees reviewed the Fund’s total return investment performance as well as the performance of peer groups of funds over various time periods. The Trustees placed particular emphasis on the total return performance of the Fund’s Initial Class shares in comparison to the performance of funds in its Lipper performance universe over the three-year period ended December 31, 2013, which the Trustees believed was a long enough period to reflect differing market conditions. The total return performance of the Fund’s Initial Class shares was in the 3rd quintile relative to the other funds in the universe for this three-year period (the 1st quintile being the best performers and the 5th quintile being the worst performers). The total return performance of the Fund’s Initial Class shares was in the 2nd quintile for the one-year period and the 3rd quintile for the five-year period ended December 31, 2013 relative to the Lipper performance universe. Because of the passage of time, these performance results may differ from the performance results for more recent periods, including those shown elsewhere in this report.
In the course of their deliberations, the Trustees took into account information provided by MFS in connection with the contract review meetings, as well as during investment review meetings conducted with portfolio management personnel during the course
23
MFS Growth Allocation Portfolio
Board Review of Investment Advisory Agreement – continued
of the year regarding the Fund’s performance. The Trustees noted that MFS became the Fund’s investment adviser in December 2012 and that MFS implemented certain changes in the Fund’s investment strategy. After reviewing these and related factors, the Trustees concluded, within the context of their overall conclusions regarding the investment advisory agreement, that they were satisfied with MFS’ responses and efforts relating to investment performance.
The Trustees considered that MFS does not charge an advisory fee for providing investment advisory services to the Fund, but that the Fund pays its pro rata share of the advisory fees paid by the underlying funds in which it invests (the “Underlying Funds”).
In assessing the reasonableness of the Fund’s expenses, the Trustees considered, among other information, the Fund’s total expense ratio of the Fund’s Initial Class shares as a percentage of average daily net assets and the total expense ratios of peer groups of funds based on information provided by Lipper Inc. The Trustees considered that MFS currently observes an expense limitation for the Fund, which may not be changed without the Trustees’ approval. The Trustees also considered that, according to the Lipper data (which takes into account any expense limitations that were in effect during the Fund’s last fiscal year), the Fund’s total expense ratio was approximately at the Lipper expense group median. Because the Fund does not pay an advisory fee, the Trustees did not consider the extent to which economies of scale would be realized due to the Fund’s growth of assets, whether fee levels reflect economies of scale for shareholders, or the fees paid by similar funds to other investment advisers or by similar clients of MFS.
The Trustees also considered information prepared by MFS relating to MFS’ costs and profits with respect to the Fund, the MFS Funds considered as a group, and other investment companies and accounts advised by MFS, as well as MFS’ methodologies used to determine and allocate its costs to the MFS Funds, the Fund and other accounts and products for purposes of estimating profitability.
In addition, the Trustees considered MFS’ resources and related efforts to continue to retain, attract and motivate capable personnel to serve the Fund. The Trustees also considered current and developing conditions in the financial services industry, including the presence of large and well-capitalized companies which are spending, and appear to be prepared to continue to spend, substantial sums to engage personnel and to provide services to competing investment companies. In this regard, the Trustees also considered the financial resources of MFS and its ultimate parent, Sun Life Financial Inc. The Trustees also considered the advantages and possible disadvantages to the Fund of having an adviser that also serves other investment companies as well as other accounts.
The Trustees also considered the nature, quality, cost, and extent of administrative, transfer agency, and distribution services provided to the Fund by MFS and its affiliates under agreements and plans other than the investment advisory agreement, including any 12b-1 fees the Fund pays to MFS Fund Distributors, Inc., an affiliate of MFS. The Trustees also considered the nature, extent and quality of certain other services MFS performs or arranges for on the Fund’s or the Underlying Funds’ behalf, which may include securities lending programs, directed expense payment programs, class action recovery programs, and MFS’ interaction with third-party service providers, principally custodians and sub-custodians. The Trustees concluded that the various non-advisory services provided by MFS and its affiliates on behalf of the Fund were satisfactory.
The Trustees also considered benefits to MFS from the use of the Underlying Funds’ portfolio brokerage commissions, if applicable, to pay for investment research and various other factors. Additionally, the Trustees considered so-called “fall-out benefits” to MFS such as reputational value derived from serving as investment manager to the Fund.
Based on their evaluation of factors that they deemed to be material, including those factors described above, the Board of Trustees, including the independent Trustees, concluded that the Fund’s investment advisory agreement with MFS should be continued for an additional one-year period, commencing August 1, 2014.
24
MFS Growth Allocation Portfolio
PROXY VOTING POLICIES AND INFORMATION
MFS votes proxies on behalf of the fund pursuant to proxy voting policies and procedures that are available without charge, upon request, by calling 1-800-225-2606, by visiting the Proxy Voting section of mfs.com or by visiting the SEC’s Web site at http://www.sec.gov.
Information regarding how the fund voted proxies relating to portfolio securities during the most recent twelve-month period ended June 30 is available without charge by visiting the Proxy Voting section of mfs.com or by visiting the SEC’s Web site at http://www.sec.gov.
QUARTERLY PORTFOLIO DISCLOSURE
The fund will file a complete schedule of portfolio holdings with the Securities and Exchange Commission (the Commission) for the first and third quarters of each fiscal year on Form N-Q. The fund’s Form N-Q is available on the EDGAR database on the Commission’s Internet Web site at http://www.sec.gov, and may be reviewed and copied at the:
Public Reference Room
Securities and Exchange Commission
100 F Street, NE, Room 1580
Washington, D.C. 20549
Information on the operation of the Public Reference Room may be obtained by calling the Commission at 1-800-SEC-0330. Copies of the fund’s Form N-Q also may be obtained, upon payment of a duplicating fee, by electronic request at the following e-mail address: publicinfo@sec.gov or by writing the Public Reference Section at the above address.
FURTHER INFORMATION
From time to time, MFS may post important information about the fund or the MFS funds on the MFS web site (mfs.com). This information is available by visiting the “Market Commentary” and “Announcements” sub sections in the “Market Outlooks” section of mfs.com or by clicking on the fund’s name under “Variable Insurance Portfolios — VIT III” in the “Products” section of mfs.com.
FEDERAL TAX INFORMATION (unaudited)
The following information is provided pursuant to provisions of the Internal Revenue Code.
The fund designates $8,419,000 as capital gain dividends paid during the fiscal year.
For corporate shareholders, 20.92% of the ordinary income dividends paid during the fiscal year qualify for the corporate dividends received deduction.
25
rev. 3/11
| | | | |
| FACTS | | WHAT DOES MFS DO WITH YOUR
PERSONAL INFORMATION? | |  |
| | |
| Why? | | Financial companies choose how they share your personal information. Federal law gives consumers the right to limit some but not all sharing. Federal law also requires us to tell you how we collect, share, and protect your personal information. Please read this notice carefully to understand what we do. |
| | |
| What? | | The types of personal information we collect and share depend on the product or service you have with us. This information can include: • Social Security number and account balances • Account transactions and transaction history • Checking account information and wire transfer instructions When you are no longer our customer, we continue to share your information as described in this notice. |
| | |
| How? | | All financial companies need to share customers’ personal information to run their everyday business. In the section below, we list the reasons financial companies can share their customers’ personal information; the reasons MFS chooses to share; and whether you can limit this sharing. |
| | | | |
Reasons we can share your
personal information | | Does MFS share? | | Can you limit this
sharing? |
For our everyday business purposes – such as to process your transactions, maintain your account(s), respond to court orders and legal investigations, or report to credit bureaus | | Yes | | No |
For our marketing purposes – to offer our products and services to you | | No | | We don’t share |
| For joint marketing with other financial companies | | No | | We don’t share |
For our affiliates’ everyday business purposes – information about your transactions and experiences | | No | | We don’t share |
For our affiliates’ everyday business purposes – information about your creditworthiness | | No | | We don’t share |
| For nonaffiliates to market to you | | No | | We don’t share |
| | |
| Questions? | | Call 800-225-2606 or go to mfs.com. |
26
| | |
| Who we are |
| Who is providing this notice? | | MFS Funds, MFS Investment Management, MFS Institutional Advisors, Inc., MFS Fund Distributors, Inc., MFS Heritage Trust Company, and MFS Service Center, Inc. |
| | |
| What we do |
| How does MFS protect my personal information? | | To protect your personal information from unauthorized access and use, we use security measures that comply with federal law. These measures include procedural, electronic, and physical safeguards for the protection of the personal information we collect about you. |
How does MFS
collect my personal information? | | We collect your personal information, for example, when you • open an account or provide account information • direct us to buy securities or direct us to sell your securities • make a wire transfer We also collect your personal information from others, such as credit bureaus, affiliates and other companies. |
| Why can’t I limit all sharing? | | Federal law gives you the right to limit only • sharing for affiliates’ everyday business purposes – information about your creditworthiness • affiliates from using your information to market to you • sharing for nonaffiliates to market to you State laws and individual companies may give you additional rights to limit sharing. |
| | |
| Definitions |
| Affiliates | | Companies related by common ownership or control. They can be financial and nonfinancial companies. • MFS does not share personal information with affiliates, except for everyday business purposes as described on page one of this notice. |
| Nonaffiliates | | Companies not related by common ownership or control. They can be financial and nonfinancial companies. • MFS does not share with nonaffiliates so they can market to you. |
| Joint Marketing | | A formal agreement between nonaffiliated financial companies that together market financial products or services to you. • MFS doesn’t jointly market. |
| | |
| Other important information |
| If you own an MFS product or receive an MFS service in the name of a third party such as a bank or broker-dealer, their privacy policy may apply to you instead of ours. |
27
ANNUAL REPORT
December 31, 2014

MFS® INFLATION-ADJUSTED BOND PORTFOLIO
MFS® Variable Insurance Trust III

VIA-ANN
MFS® INFLATION-ADJUSTED BOND PORTFOLIO
CONTENTS
The report is prepared for the general information of contract owners. It is authorized for distribution to prospective investors only when preceded or accompanied by a current prospectus.
NOT FDIC INSURED Ÿ MAY LOSE VALUE Ÿ NO BANK OR CREDIT UNION GUARANTEE Ÿ NOT A DEPOSIT Ÿ NOT INSURED BY ANY FEDERAL GOVERNMENT AGENCY OR NCUA/NCUSIF
MFS Inflation-Adjusted Bond Portfolio
LETTER FROM THE CHAIRMAN

Dear Contract Owners:
As 2015 begins, sharply lower oil prices are reshaping the global economy, adding to deflationary pressures in the eurozone and exacerbating challenges faced by oil exporters such as Russia. The U.S. economy stands on firmer ground, having expanded steadily over the past year. The U.S. labor market has regained momentum, consumer confidence is buoyant and gasoline prices have tumbled, boosting prospects for a stronger economic rebound in 2015.
Other regions are struggling. The eurozone economy is barely expanding, and the European Central Bank (ECB) has introduced large-scale asset purchases.
Despite Japan’s efforts to strengthen its economy, its sales tax increase last spring tipped the country into a recession, leading to additional monetary stimulus from the Bank of Japan. China’s economy is slowing as it transitions to a more sustainable basis, and its growth rate will likely continue to decline.
As always, active risk management is integral to how we at MFS® manage your investments. We use a collaborative process, sharing insights across asset classes, regions and economic sectors. Our global investment team uses a diversified, multidisciplined, long-term approach.
Applying proven principles, such as asset allocation and diversification, can best serve investors over the long term. We are confident that this approach can help you as you work with your financial advisors to reach your goals in the years ahead.
Respectfully,

Robert J. Manning
Chairman
MFS Investment Management
February 13, 2015
The opinions expressed in this letter are subject to change and may not be relied upon for investment advice. No forecasts can be guaranteed.
1
MFS Inflation-Adjusted Bond Portfolio
PORTFOLIO COMPOSITION
Portfolio structure (i)
| | | | |
| Fixed income sectors (i) | | | | |
| Non-U.S. Government Bonds | | | 53.7% | |
| U.S. Treasury Securities | | | 31.6% | |
|
| Composition including fixed income credit quality (a)(i) | |
| AAA | | | 12.4% | |
| AA | | | 35.2% | |
| A | | | 5.1% | |
| BBB | | | 1.0% | |
| U.S. Government | | | 31.6% | |
| Cash & Other | | | 14.7% | |
| | | | |
| Portfolio facts (i) | | | | |
| Average Duration (d) | | | 7.7 | |
| Average Effective Maturity (m) | | | 15.7 yrs. | |
| |
| Issuer country weightings (i)(x) | | | | |
| United States | | | 46.3% | |
| United Kingdom | | | 24.7% | |
| France | | | 9.8% | |
| Japan | | | 5.0% | |
| Germany | | | 4.8% | |
| Canada | | | 2.6% | |
| Sweden | | | 2.4% | |
| Australia | | | 2.0% | |
| Spain | | | 1.0% | |
| Other Countries | | | 1.4% | |
| |
| Currency exposure weightings (i)(y) | | | | |
| United States Dollar | | | 42.4% | |
| British Pound Sterling | | | 33.7% | |
| Euro | | | 16.1% | |
| Canadian Dollar | | | 2.6% | |
| Japanese Yen | | | 1.8% | |
| Swedish Krona | | | 1.4% | |
| Australian Dollar | | | 1.3% | |
| New Zealand Dollar | | | 0.4% | |
| Danish Krone | | | 0.3% | |
| (a) | | For all securities other than those specifically described below, ratings are assigned to underlying securities utilizing ratings from Moody’s, Fitch, and Standard & Poor’s rating agencies and applying the following hierarchy: If all three agencies provide a rating, the middle rating (after dropping the highest and lowest ratings) is assigned; if two of the three agencies rate a security, the lower of the two is assigned. Ratings are shown in the S&P and Fitch scale (e.g., AAA). Securities rated BBB or higher are considered investment grade. All ratings are subject to change. U.S. Government includes securities issued by the U.S. Department of the Treasury. The fund may not hold all of these instruments. The fund is not rated by these agencies. |
| (d) | | Duration is a measure of how much a bond’s price is likely to fluctuate with general changes in interest rates, e.g., if rates rise 1.00%, a bond with a 5-year duration is likely to lose about 5.00% of its value due to the interest rate move. |
| (i) | | For purposes of this presentation, the components include the value of securities, and reflect the impact of the equivalent exposure of derivative positions, if any. These amounts may be negative from time to time. Equivalent exposure is a calculated amount that translates the derivative position into a reasonable approximation of the amount of the underlying asset that the portfolio would have to hold at a given point in time to have the same price sensitivity that results from the portfolio’s ownership of the derivative contract. When dealing with derivatives, equivalent exposure is a more representative measure of the potential impact of a position on portfolio performance than value. The bond component will include any accrued interest amounts. |
| (m) | | In determining an instrument’s effective maturity for purposes of calculating the fund’s dollar-weighted average effective maturity, MFS uses the instrument’s stated maturity or, if applicable, an earlier date on which MFS believes it is probable that a maturity-shortening device (such as a put, pre-refunding or prepayment) will cause the instrument to be repaid. Such an earlier date can be substantially shorter than the instrument’s stated maturity. |
| (x) | | Represents the portfolio’s exposure to issuer countries as a percentage of a portfolio’s net assets. For purposes of this presentation, United States includes Cash & Other. |
| (y) | | Represents the portfolio’s exposure to a particular currency as a percentage of a portfolio’s net assets. For purposes of this presentation, United States Dollar includes Cash & Other. |
Where the fund holds convertible bonds, these are treated as part of the equity portion of the portfolio.
Cash & Other can include cash, other assets less liabilities, offsets to derivative positions, and short-term securities.
Percentages are based on net assets as of 12/31/14.
The portfolio is actively managed and current holdings may be different.
2
MFS Inflation-Adjusted Bond Portfolio
MANAGEMENT REVIEW
Summary of Results
For the twelve months ended December 31, 2014, Initial Class shares of the MFS Inflation-Adjusted Bond Portfolio (“fund”) provided a total return of 3.71%, while Service Class shares of the fund provided a total return of 3.43%. These compare with a return of 4.08% over the same period for the fund’s benchmark, the Barclays World Government Inflation-Linked Bond Index.
Market Environment
Early in the period, US equities suffered what proved to be a temporary setback due to concerns over emerging markets as well as what was perceived at the time to be a pause in US economic growth, partially caused by extreme weather events and a weak December 2013 labor market report. Markets soon recovered as the economic pause concluded and investors appeared to have become increasingly comfortable that newly-installed US Federal Reserve (“Fed”) Chair Janet Yellen would not make any substantial changes to the trajectory of Fed monetary policy.
A generally risk-friendly, carry trade environment persisted from February 2014 until mid-year. While geopolitical tensions flared in the Middle East and Russia/Ukraine, any market setbacks were short-lived as improving economic growth in the US, coupled with prospects for easier monetary policy in regions with slowing growth, such as Japan, Europe and China, supported risk assets. For example, the European Central Bank (“ECB”) cut policy interest rates into negative territory and, by the end of the period, expectations were for additional rate cuts and the announcement for non-conventional easing measures. Similarly, the Bank of Japan surprised markets late in the period with fresh stimulus measures given lackluster growth trends. The related decline in developed market government bond yields and credit spreads were also supportive for equity markets. At the end of the period, the US equity market was trading close to all-time highs and US Treasury yields were close to their lows for the period. However, credit markets did not fare as well in the second half of 2014, particularly US high yield and emerging market debt. The higher weightings of oil and gas credits in these asset classes resulted in widening spreads and increased volatility as oil prices began to decline in an accelerated fashion in the fourth quarter.
Factors Affecting Performance
During the reporting period, the portion of the fund’s return derived from yield, which was less than that of the Barclays World Government Inflation-Linked Bond Index, was a primary detractor from relative performance. The fund’s yield curve (y) positioning in United Kingdom (UK), particularly a lesser exposure to shifts in the long end (centered around maturities of 10 or more years) of the yield curve, was a negative factor for relative performance. A lesser exposure to Sweden also weakened relative returns. This was partially offset by the positive impact from yield curve positioning in the United States and Canada, most notably a greater exposure to the long end of the yield curve, as interest rates declined during the period. A lesser exposure to the euro also benefited relative returns as the euro underperformed other major currencies.
Respectfully,
Erik Weisman
Portfolio Manager
| (y) | A yield curve graphically depicts the yields of different maturity bonds of the same credit quality and type; a normal yield curve is upward sloping, with short-term rates lower than long-term rates. |
The views expressed in this report are those of the portfolio manager only through the end of the period of the report as stated on the cover and do not necessarily reflect the views of MFS or any other person in the MFS organization. These views are subject to change at any time based on market or other conditions, and MFS disclaims any responsibility to update such views. These views may not be relied upon as investment advice or an indication of trading intent on behalf of any MFS portfolio. References to specific securities are not recommendations of such securities, and may not be representative of any MFS portfolio’s current or future investments.
3
MFS Inflation-Adjusted Bond Portfolio
PERFORMANCE SUMMARY THROUGH 12/31/14
The following chart illustrates the historical performance of the fund in comparison to its benchmark(s). Benchmarks are unmanaged and may not be invested in directly. Benchmark returns do not reflect any fees or expenses. The performance of other share classes will be greater than or less than that of the class depicted below. (See Notes to Performance Summary.)
Performance data shown represents past performance and is no guarantee of future results. Investment return and principal value fluctuate so your units, when sold, may be worth more or less than the original cost; current performance may be lower or higher than quoted. The performance shown does not reflect the deduction of taxes, if any, that a contract holder would pay on fund distributions or the redemption of contract units. The returns for the fund shown also do not reflect the deduction of expenses associated with variable products, such as mortality and expense risk charges, separate account charges, and sales charges imposed by the insurance company separate accounts. Such expenses would reduce the overall returns shown.
Growth of a Hypothetical $10,000 Investment (t)
Total Returns through 12/31/14
Average annual total returns
| | | | | | | | | | | | |
| | | Share Class | | Class inception date | | 1-yr | | 5-yr | | Life (t) | | |
| | | Initial Class | | 10/01/08 | | 3.71% | | 4.55% | | 4.86% | | |
| | | Service Class | | 10/01/08 | | 3.43% | | 4.28% | | 4.58% | | |
| | | | |
| Comparative benchmark | | | | | | | | |
| | | Barclays World Government Inflation-Linked Bond Index (f) | | 4.08% | | 4.03% | | 4.25% | | |
| (f) | Source: FactSet Research Systems Inc. |
| (t) | For the period from the class inception date through the stated period end. (See Notes to Performance Summary.) |
Benchmark Definition
Barclays World Government Inflation-Linked Bond Index – measures the performance of the major government inflation-linked bond markets.
It is not possible to invest directly in an index.
Notes to Performance Summary
Average annual total return represents the average annual change in value for each share class for the periods presented. Life returns are presented where the share class has less than 10 years of performance history and represent the average annual total return from the class inception date to the stated period end date.
Performance results reflect any applicable expense subsidies and waivers in effect during the periods shown. Without such subsidies and waivers the fund’s performance results would be less favorable. Please see the prospectus and financial statements for complete details. All results are historical and assume the reinvestment of any dividends and capital gains distributions.
Performance prior to close of business December 7, 2012, reflects time periods when another adviser or subadviser was responsible for selecting investments for the fund under a different investment objective and different investment strategies.
4
MFS Inflation-Adjusted Bond Portfolio
Performance Summary – continued
Performance results do not include adjustments made for financial reporting purposes in accordance with U.S. generally accepted accounting principles and may differ from amounts reported in the financial highlights.
From time to time the fund may receive proceeds from litigation settlements, without which performance would be lower.
5
MFS Inflation-Adjusted Bond Portfolio
EXPENSE TABLE
Fund Expenses Borne by the Contract Holders During the Period,
July 1, 2014 through December 31, 2014
As a contract holder of the fund, you incur ongoing costs, including management fees; distribution and/or service (12b-1) fees; and other fund expenses. This example is intended to help you understand your ongoing costs (in dollars) of investing in the fund and to compare these costs with the ongoing costs of investing in other mutual funds.
The example is based on an investment of $1,000 invested at the beginning of the period and held for the entire period July 1, 2014 through December 31, 2014.
Actual Expenses
The first line for each share class in the following table provides information about actual account values and actual expenses. You may use the information in this line, together with the amount you invested, to estimate the expenses that you paid over the period. Simply divide your account value by $1,000 (for example, an $8,600 account value divided by $1,000 = 8.6), then multiply the result by the number in the first line under the heading entitled “Expenses Paid During Period” to estimate the expenses you paid on your account during this period.
Hypothetical Example for Comparison Purposes
The second line for each share class in the following table provides information about hypothetical account values and hypothetical expenses based on the fund’s actual expense ratio and an assumed rate of return of 5% per year before expenses, which is not the fund’s actual return. The hypothetical account values and expenses may not be used to estimate the actual ending account balance or expenses you paid for the period. You may use this information to compare the ongoing costs of investing in the fund and other funds. To do so, compare this 5% hypothetical example with the 5% hypothetical examples that appear in the shareholder reports of the other funds.
Please note that the expenses shown in the table are meant to highlight the fund’s ongoing costs only and do not take into account the fees and expenses imposed under the variable contracts through which your investment in the fund is made. Therefore, the second line for each share class in the table is useful in comparing ongoing costs associated with an investment in vehicles (such as the fund) which fund benefits under variable annuity and variable life insurance contracts and to qualified pension and retirement plans only, and will not help you determine the relative total costs of investing in the fund through variable annuity and variable life insurance contracts. If the fees and expenses imposed under the variable contracts were included, your costs would have been higher.
| | | | | | | | | | | | | | | | | | |
| Share Class | | | | Annualized
Expense Ratio | | | Beginning
Account Value
7/01/14 | | | Ending Account Value
12/31/14 | | | Expenses Paid
During Period (p)
7/01/14-12/31/14 | |
| Initial Class | | Actual | | | 0.53% | | | | $1,000.00 | | | | $977.67 | | | | $2.64 | |
| | Hypothetical (h) | | | 0.53% | | | | $1,000.00 | | | | $1,022.53 | | | | $2.70 | |
| Service Class | | Actual | | | 0.78% | | | | $1,000.00 | | | | $976.48 | | | | $3.89 | |
| | Hypothetical (h) | | | 0.78% | | | | $1,000.00 | | | | $1,021.27 | | | | $3.97 | |
| (h) | 5% class return per year before expenses. |
| (p) | “Expenses Paid During Period” are equal to each class’s annualized expense ratio, as shown above, multiplied by the average account value over the period, multiplied by 184/365 (to reflect the one-half year period). |
6
MFS Inflation-Adjusted Bond Portfolio
PORTFOLIO OF INVESTMENTS – 12/31/14
The Portfolio of Investments is a complete list of all securities owned by your fund. It is categorized by broad-based asset classes.
| | | | | | | | |
| Issuer | | Shares/Par | | | Value ($) | |
| | | | | | | | |
| BONDS – 85.0% | | | | | | | | |
| International Market Sovereign – 53.5% | | | | | |
| Commonwealth of Australia, Inflation Linked Bond, 1.25%, 2/21/22 | | AUD | 5,631,120 | | | $ | 4,839,932 | |
| Commonwealth of Australia, Inflation Linked Bond, 3%, 9/20/25 | | AUD | 2,720,816 | | | | 2,773,981 | |
| Commonwealth of Australia, Inflation Linked Bond, 2%, 8/21/35 | | AUD | 830,800 | | | | 810,855 | |
| Federal Republic of Germany, Inflation Linked Bond, 1.5%, 4/15/16 | | EUR | 5,949,512 | | | | 7,255,794 | |
| Federal Republic of Germany, Inflation Linked Bond, 1.75%, 4/15/20 | | EUR | 4,057,776 | | | | 5,475,267 | |
| Federal Republic of Germany, Inflation Linked Bond, 0.1%, 4/15/23 | | EUR | 4,974,096 | | | | 6,286,868 | |
| Federal Republic of Germany, Inflation Linked Bond, 0.5%, 4/15/30 | | EUR | 1,011,270 | | | | 1,358,844 | |
| Government of Canada, Inflation Linked Bond, 4.25%, 12/01/21 | | CAD | 1,969,851 | | | | 2,180,078 | |
| Government of Canada, Inflation Linked Bond, 4%, 12/01/31 | | CAD | 2,245,407 | | | | 3,031,067 | |
| Government of Canada, Inflation Linked Bond, 2%, 12/01/41 | | CAD | 5,219,006 | | | | 6,010,707 | |
| Government of France, Inflation Linked Bond, 1.8%, 7/25/40 | | EUR | 2,865,450 | | | | 4,699,148 | |
| Government of France, Inflation Linked Bond, 1.3%, 7/25/19 | | EUR | 1,411,119 | | | | 1,839,780 | |
| Government of France, Inflation Linked Bond, 2.25%, 7/25/20 | | EUR | 4,053,262 | | | | 5,606,497 | |
| Government of France, Inflation Linked Bond, 2.1%, 7/25/23 | | EUR | 3,019,253 | | | | 4,416,670 | |
| Government of France, Inflation Linked Bond, 3.4%, 7/25/29 | | EUR | 3,952,616 | | | | 7,171,909 | |
| Government of France, Inflation Linked Bond, 3.15%, 7/25/32 | | EUR | 5,412,213 | | | | 9,901,704 | |
| Government of Japan, Inflation Linked Bond, 1%, 6/10/16 | | JPY | 337,350,000 | | | | 2,963,289 | |
| Government of Japan, Inflation Linked Bond, 1.3%, 9/10/17 | | JPY | 775,500,000 | | | | 7,093,643 | |
| Government of Japan, Inflation Linked Bond, 1.4%, 3/10/18 | | JPY | 205,000,000 | | | | 1,902,557 | |
| Government of Japan, Inflation Linked Bond, 1.4%, 6/10/18 | | JPY | 513,000,000 | | | | 4,763,174 | |
| Government of Japan, Inflation Linked Bond, 0.1%, 9/10/23 | | JPY | 569,800,000 | | | | 5,005,135 | |
| Government of New Zealand, Inflation Linked Bond, 2%, 9/20/25 | | NZD | 2,569,750 | | | | 1,998,506 | |
| Government of New Zealand, Inflation Linked Bond, 3%, 9/20/30 | | NZD | 1,527,900 | | | | 1,314,184 | |
| Kigndom of Sweden, Inflation Linked Bond, 0.25%, 6/01/22 | | SEK | 15,131,297 | | | | 2,006,504 | |
| Kingdom of Denmark, Inflation Linked Bond, 0.1%, 11/15/23 | | DKK | 17,647,700 | | | | 2,941,909 | |
| Kingdom of Spain, Inflation Linked Bond, 1.8%, 11/30/24 | | EUR | 3,156,773 | | | | 4,231,786 | |
| | | | | | | | |
| Issuer | | Shares/Par | | | Value ($) | |
| | | | | | | | |
| BONDS – continued | | | | | |
| International Market Sovereign – continued | | | | | |
| Kingdom of Sweden, Inflation Linked Bond, 4%, 12/01/20 | | SEK | 29,901,546 | | | $ | 4,805,427 | |
| Kingdom of Sweden, Inflation Linked Bond, 3.5%, 12/01/28 | | SEK | 18,384,348 | | | | 3,532,888 | |
| Republic of France, Inflation Linked Bond, 1.1%, 7/25/22 | | EUR | 6,296,712 | | | | 8,407,634 | |
| United Kingdom Treasury, Inflation Linked Bond, 4.125%, 7/22/30 | | GBP | 1,606,241 | | | | 4,514,113 | |
| United Kingdom Treasury, Inflation Linked Bond, 1.25%, 11/22/27 | | GBP | 4,005,942 | | | | 8,023,735 | |
| United Kingdom Treasury, Inflation Linked Bond, 0.125%, 3/22/29 | | GBP | 3,073,683 | | | | 5,426,747 | |
| United Kingdom Treasury, Inflation Linked Bond, 1.25%, 11/22/32 | | GBP | 3,020,279 | | | | 6,562,835 | |
| United Kingdom Treasury, Inflation Linked Bond, 0.75%, 3/22/34 | | GBP | 3,883,600 | | | | 7,908,525 | |
| United Kingdom Treasury, Inflation Linked Bond, 2%, 1/26/35 | | GBP | 2,106,458 | | | | 5,198,514 | |
| United Kingdom Treasury, Inflation Linked Bond, 1.125%, 11/22/37 | | GBP | 3,599,361 | | | | 8,206,597 | |
| United Kingdom Treasury, Inflation Linked Bond, 0.625%, 3/22/40 | | GBP | 3,877,313 | | | | 8,257,407 | |
| United Kingdom Treasury, Inflation Linked Bond, 0.625%, 11/22/42 | | GBP | 4,038,691 | | | | 8,882,462 | |
| United Kingdom Treasury, Inflation Linked Bond, 0.75%, 11/22/47 | | GBP | 3,060,912 | | | | 7,326,380 | |
| United Kingdom Treasury, Inflation Linked Bond, 0.5%, 3/22/50 | | GBP | 3,480,015 | | | | 7,987,587 | |
| United Kingdom Treasury, Inflation Linked Bond, 0.25%, 3/22/52 | | GBP | 798,435 | | | | 1,731,927 | |
| United Kingdom Treasury, Inflation Linked Bond, 1.25%, 11/22/55 | | GBP | 3,269,943 | | | | 9,763,435 | |
| United Kingdom Treasury, Inflation Linked Bond, 0.125%, 3/22/58 | | GBP | 1,258,763 | | | | 2,739,021 | |
| United Kingdom Treasury, Inflation Linked Bond, 0.375%, 3/22/62 | | GBP | 3,435,323 | | | | 8,486,027 | |
| United Kingdom Treasury, Inflation Linked Bond, 0.125%, 3/22/68 | | GBP | 2,203,235 | | | | 5,195,999 | |
| | | | | | | | |
| | | $ | 230,837,048 | |
| | | | | | | | |
| U.S. Treasury Inflation Protected Securities – 31.5% | |
| U.S. Treasury Bonds, 0.125%, 7/15/24 | | $ | 4,958,859 | | | $ | 4,782,973 | |
| U.S. Treasury Bonds, 0.125%, 4/15/17 | | | 6,158,201 | | | | 6,161,568 | |
| U.S. Treasury Bonds, 1.625%, 1/15/18 | | | 3,283,869 | | | | 3,437,544 | |
| U.S. Treasury Bonds, 1.125%, 1/15/21 | | | 6,128,181 | | | | 6,375,220 | |
| U.S. Treasury Bonds, 0.375%, 7/15/23 | | | 7,578,174 | | | | 7,503,575 | |
| U.S. Treasury Bonds, 0.625%, 1/15/24 | | | 4,712,597 | | | | 4,741,315 | |
| U.S. Treasury Bonds, 2.375%, 1/15/25 | | | 5,634,511 | | | | 6,624,072 | |
| U.S. Treasury Bonds, 2%, 1/15/26 | | | 3,906,332 | | | | 4,481,602 | |
| U.S. Treasury Bonds, 2.375%, 1/15/27 | | | 3,600,932 | | | | 4,315,775 | |
| U.S. Treasury Bonds, 1.75%, 1/15/28 | | | 3,397,184 | | | | 3,851,822 | |
| U.S. Treasury Bonds, 3.625%, 4/15/28 | | | 2,806,319 | | | | 3,865,266 | |
7
MFS Inflation-Adjusted Bond Portfolio
Portfolio of Investments – continued
| | | | | | | | |
| Issuer | | Shares/Par | | | Value ($) | |
| | | | | | | | |
| BONDS – continued | | | | | |
| U.S. Treasury Inflation Protected Securities – continued | |
| U.S. Treasury Bonds, 2.5%, 1/15/29 | | $ | 3,101,460 | | | $ | 3,857,200 | |
| U.S. Treasury Bonds, 3.875%, 4/15/29 | | | 4,555,978 | | | | 6,533,199 | |
| U.S. Treasury Bonds, 3.375%, 4/15/32 | | | 1,386,905 | | | | 1,970,488 | |
| U.S. Treasury Bonds, 2.125%, 2/15/40 | | | 1,616,742 | | | | 2,101,386 | |
| U.S. Treasury Bonds, 2.125%, 2/15/41 | | | 2,240,669 | | | | 2,933,702 | |
| U.S. Treasury Bonds, 0.75%, 2/15/42 | | | 4,116,212 | | | | 4,012,664 | |
| U.S. Treasury Bonds, 0.625%, 2/15/43 | | | 2,766,175 | | | | 2,609,064 | |
| U.S. Treasury Bonds, 1.375%, 2/15/44 | | | 5,252,869 | | | | 5,965,289 | |
| U.S. Treasury Notes, 2.625%, 7/15/17 | | | 1,992,996 | | | | 2,136,709 | |
| U.S. Treasury Notes, 0.125%, 4/15/18 | | | 6,529,412 | | | | 6,505,436 | |
| U.S. Treasury Notes, 2.125%, 1/15/19 | | | 4,144,126 | | | | 4,456,556 | |
| U.S. Treasury Notes, 1.875%, 7/15/19 | | | 4,113,697 | | | | 4,418,691 | |
| U.S. Treasury Notes, 1.375%, 1/15/20 | | | 844,193 | | | | 886,600 | |
| U.S. Treasury Notes, 1.25%, 7/15/20 | | | 2,282,647 | | | | 2,398,028 | |
| U.S. Treasury Notes, 0.625%, 7/15/21 | | | 3,157,733 | | | | 3,201,891 | |
| U.S. Treasury Notes, 0.125%, 1/15/22 | | | 8,056,217 | | | | 7,848,520 | |
| | | | | | | | |
| Issuer | | Shares/Par | | | Value ($) | |
| | | | | | | | |
| BONDS – continued | | | | | |
| U.S. Treasury Inflation Protected Securities – continued | |
| U.S. Treasury Notes, 0.125%, 7/15/22 | | $ | 10,038,085 | | | $ | 9,792,624 | |
| U.S. Treasury Notes, 0.125%, 1/15/23 | | | 8,394,291 | | | | 8,130,005 | |
| | | | | | | | |
| | | $ | 135,898,784 | |
| | | | | | | | |
Total Bonds
(Identified Cost, $362,929,090) | | | $ | 366,735,832 | |
| | | | | | | | |
| |
| MONEY MARKET FUNDS – 14.2% | | | | | |
| MFS Institutional Money Market Portfolio, 0.09%, at Cost and Net Asset Value (v) | | | 61,422,754 | | | $ | 61,422,754 | |
| | | | | | | | |
Total Investments
(Identified Cost, $424,351,844) | | | | | | $ | 428,158,586 | |
| | | | | | | | |
OTHER ASSETS, LESS
LIABILITIES – 0.8% | | | | 3,273,197 | |
| | | | | | | | |
| NET ASSETS – 100.0% | | | $ | 431,431,783 | |
| | | | | | | | |
| (v) | | Underlying affiliated fund that is available only to investment companies managed by MFS. The rate quoted for the MFS Institutional Money Market Portfolio is the annualized seven-day yield of the fund at period end. |
Abbreviations indicate amounts shown in currencies other than the U.S. dollar. All amounts are stated in U.S. dollars unless otherwise indicated. A list of abbreviations is shown below:
Derivative Contracts at 12/31/14
Forward Foreign Currency Exchange Contracts at 12/31/14
| | | | | | | | | | | | | | | | | | | | | | | | |
| Type | | Currency | | | Counterparty | | Contracts to Deliver/Receive | | Settlement Date Range | | In Exchange For | | | Contracts at Value | | | Net Unrealized Appreciation (Depreciation) | |
| Asset Derivatives | | | | | | | | | | | | |
| SELL | | | | | AUD | | | Deutsche Bank AG | | 7,692,000 | | 1/09/15 | | $ | 6,511,836 | | | $ | 6,277,918 | | | $ | 233,918 | |
| SELL | | | | | AUD | | | Westpac Banking Corp. | | 3,506,631 | | 1/09/15 | | | 3,034,621 | | | | 2,861,979 | | | | 172,642 | |
| SELL | | | | | CAD | | | Barclays Bank PLC | | 251,000 | | 1/09/15 | | | 216,013 | | | | 216,012 | | | | 1 | |
| SELL | | | | | CAD | | | Goldman Sachs International | | 15,383,640 | | 1/09/15 | | | 13,636,793 | | | | 13,239,231 | | | | 397,562 | |
| SELL | | | | | CAD | | | Merrill Lynch International | | 3,164,894 | | 1/09/15 | | | 2,816,644 | | | | 2,723,722 | | | | 92,922 | |
| SELL | | | | | DKK | | | Barclays Bank PLC | | 5,093,565 | | 1/09/15 | | | 862,148 | | | | 827,657 | | | | 34,491 | |
| SELL | | | | | DKK | | | UBS AG | | 5,093,565 | | 1/09/15 | | | 862,074 | | | | 827,657 | | | | 34,417 | |
| SELL | | | | | EUR | | | Credit Suisse Group | | 7,919,463 | | 1/09/15 | | | 10,020,886 | | | | 9,583,356 | | | | 437,530 | |
| SELL | | | | | EUR | | | Deutsche Bank AG | | 4,933,000 | | 1/09/15 | | | 6,160,737 | | | | 5,969,432 | | | | 191,305 | |
| SELL | | | | | EUR | | | Goldman Sachs International | | 7,506,790 | | 1/09/15 | | | 9,310,596 | | | | 9,083,980 | | | | 226,616 | |
| SELL | | | | | GBP | | | Barclays Bank PLC | | 503,000 | | 1/09/15 | | | 788,891 | | | | 783,952 | | | | 4,939 | |
| SELL | | | | | GBP | | | Deutsche Bank AG | | 1,524,000 | | 1/09/15 | | | 2,422,739 | | | | 2,375,233 | | | | 47,506 | |
| SELL | | | | | GBP | | | Goldman Sachs International | | 2,677,255 | | 1/09/15 | | | 4,246,865 | | | | 4,172,641 | | | | 74,224 | |
| SELL | | | | | JPY | | | Credit Suisse Group | | 500,395,000 | | 1/09/15 | | | 4,629,553 | | | | 4,177,723 | | | | 451,830 | |
| SELL | | | | | JPY | | | Deutsche Bank AG | | 2,756,656,541 | | 1/09/15 | | | 25,098,292 | | | | 23,014,913 | | | | 2,083,379 | |
| SELL | | | | | JPY | | | Goldman Sachs International | | 958,087,403 | | 1/09/15 | | | 8,192,935 | | | | 7,998,928 | | | | 194,007 | |
| BUY | | | | | NZD | | | Goldman Sachs International | | 7,490,000 | | 1/09/15 | | | 5,782,947 | | | | 5,840,851 | | | | 57,904 | |
8
MFS Inflation-Adjusted Bond Portfolio
Portfolio of Investments – continued
Forward Foreign Currency Exchange Contracts at 12/31/14 - continued
| | | | | | | | | | | | | | | | | | | | | | | | |
| Type | | Currency | | | Counterparty | | Contracts to Deliver/Receive | | Settlement Date Range | | In Exchange For | | | Contracts at Value | | | Net Unrealized Appreciation (Depreciation) | |
| Asset Derivatives – continued | | | | | | | | | | | | |
| SELL | | | | | SEK | | | Credit Suisse Group | | 3,237,000 | | 1/09/15 | | $ | 450,188 | | | $ | 415,242 | | | $ | 34,946 | |
| SELL | | | | | SEK | | | Goldman Sachs International | | 47,263,045 | | 1/09/15 | | | 6,530,742 | | | | 6,062,905 | | | | 467,837 | |
| | | | | | | | | | | | | | | | | | | | | | | | |
| | | | | | | | | | | | | | | | | | $ | 5,237,976 | |
| | | | | | | | | | | | | | | | | | | | | | | | |
| | | | |
| Liability Derivatives | | | | | | | | | | | | |
| BUY | | | | | AUD | | | Barclays Bank PLC | | 258,000 | | 1/09/15 | | $ | 224,863 | | | $ | 210,570 | | | $ | (14,293 | ) |
| BUY | | | | | AUD | | | Goldman Sachs International | | 2,646,000 | | 1/09/15 | | | 2,200,459 | | | | 2,159,565 | | | | (40,894 | ) |
| BUY | | | | | AUD | | | Westpac Banking Corp. | | 4,889,000 | | 1/09/15 | | | 4,069,652 | | | | 3,990,216 | | | | (79,436 | ) |
| SELL | | | | | AUD | | | Deutsche Bank AG | | 212,000 | | 1/09/15 | | | 171,442 | | | | 173,026 | | | | (1,584 | ) |
| BUY | | | | | CAD | | | Deutsche Bank AG | | 4,059,206 | | 1/09/15 | | | 3,564,542 | | | | 3,493,371 | | | | (71,171 | ) |
| BUY | | | | | CAD | | | Goldman Sachs International | | 14,941,613 | | 1/09/15 | | | 13,280,256 | | | | 12,858,820 | | | | (421,436 | ) |
| BUY | | | | | EUR | | | Brown Brothers Harriman | | 3,678,404 | | 1/09/15 | | | 4,538,923 | | | | 4,451,243 | | | | (87,680 | ) |
| BUY | | | | | EUR | | | Credit Suisse Group | | 3,854,000 | | 1/09/15 | | | 4,866,717 | | | | 4,663,732 | | | | (202,985 | ) |
| BUY | | | | | EUR | | | Deutsche Bank AG | | 5,449,000 | | 1/09/15 | | | 6,795,096 | | | | 6,593,845 | | | | (201,251 | ) |
| BUY | | | | | EUR | | | Goldman Sachs International | | 3,447,000 | | 1/09/15 | | | 4,389,129 | | | | 4,171,221 | | | | (217,908 | ) |
| BUY | | | | | EUR | | | Royal Bank of Scotland Group PLC | | 1,782,000 | | 1/09/15 | | | 2,204,154 | | | | 2,156,401 | | | | (47,753 | ) |
| BUY | | | | | EUR | | | UBS AG | | 4,003,000 | | 1/09/15 | | | 5,021,563 | | | | 4,844,037 | | | | (177,526 | ) |
| BUY | | | | | GBP | | | Credit Suisse Group | | 12,308,480 | | 1/09/15 | | | 19,650,618 | | | | 19,183,407 | | | | (467,211 | ) |
| BUY | | | | | GBP | | | Deutsche Bank AG | | 1,963,166 | | 1/09/15 | | | 3,170,264 | | | | 3,059,696 | | | | (110,568 | ) |
| BUY | | | | | GBP | | | Goldman Sachs International | | 4,414,030 | | 1/09/15 | | | 6,992,096 | | | | 6,879,495 | | | | (112,601 | ) |
| BUY | | | | | GBP | | | Merrill Lynch International | | 10,912,318 | | 1/09/15 | | | 17,470,567 | | | | 17,007,416 | | | | (463,151 | ) |
| BUY | | | | | GBP | | | Morgan Stanley Capital Services, Inc. | | 778,772 | | 1/09/15 | | | 1,217,443 | | | | 1,213,756 | | | | (3,687 | ) |
| SELL | | | | | GBP | | | Goldman Sachs International | | 638,000 | | 1/09/15 | | | 989,244 | | | | 994,356 | | | | (5,112 | ) |
| BUY | | | | | JPY | | | Brown Brothers Harriman | | 497,420,000 | | 1/09/15 | | | 4,197,369 | | | | 4,152,885 | | | | (44,484 | ) |
| BUY | | | | | JPY | | | Deutsche Bank AG | | 260,874,000 | | 1/09/15 | | | 2,196,003 | | | | 2,177,998 | | | | (18,005 | ) |
| BUY | | | | | JPY | | | Goldman Sachs International | | 569,338,000 | | 1/09/15 | | | 4,898,278 | | | | 4,753,318 | | | | (144,960 | ) |
| BUY | | | | | JPY | | | JPMorgan Chase Bank N.A. | | 457,422,000 | | 1/09/15 | | | 4,208,411 | | | | 3,818,948 | | | | (389,463 | ) |
| BUY | | | | | JPY | | | Morgan Stanley Capital Services, Inc. | | 1,013,078,000 | | 1/09/15 | | | 8,597,283 | | | | 8,458,037 | | | | (139,246 | ) |
| SELL | | | | | JPY | | | Brown Brothers Harriman | | 263,573,000 | | 1/09/15 | | | 2,172,857 | | | | 2,200,532 | | | | (27,675 | ) |
| BUY | | | | | NZD | | | Barclays Bank PLC | | 5,649,000 | | 1/09/15 | | | 4,418,699 | | | | 4,405,203 | | | | (13,496 | ) |
| BUY | | | | | NZD | | | Goldman Sachs International | | 5,562,000 | | 1/09/15 | | | 4,337,552 | | | | 4,337,359 | | | | (193 | ) |
| SELL | | | | | NZD | | | Goldman Sachs International | | 13,352,554 | | 1/09/15 | | | 10,365,003 | | | | 10,412,588 | | | | (47,585 | ) |
| SELL | | | | | NZD | | | Westpac Banking Corp. | | 7,092,706 | | 1/09/15 | | | 5,488,549 | | | | 5,531,034 | | | | (42,485 | ) |
| BUY | | | | | SEK | | | Barclays Bank PLC | | 2,279,000 | | 1/09/15 | | | 316,631 | | | | 292,350 | | | | (24,281 | ) |
| BUY | | | | | SEK | | | Goldman Sachs International | | 13,812,292 | | 1/09/15 | | | 1,800,261 | | | | 1,771,841 | | | | (28,420 | ) |
| | | | | | | | | | | | | | | | | | | | | | | | |
| | | | | | | | | | | | | | | | | | $ | (3,646,540 | ) |
| | | | | | | | | | | | | | | | | | | | | | | | |
At December 31, 2014, the fund had cash collateral of $540,000 to cover any commitments for certain derivative contracts. Cash collateral is comprised of “Restricted cash” in the Statement of Assets and Liabilities.
See Notes to Financial Statements
9
MFS Inflation-Adjusted Bond Portfolio
FINANCIAL STATEMENTS | STATEMENT OF ASSETS AND LIABILITIES
This statement represents your fund’s balance sheet, which details the assets and liabilities comprising the total value of the fund.
| | | | | | | | |
At 12/31/14 | | | | | | | | |
Assets | | | | | | | | |
Investments – | | | | | | | | |
Non-affiliated issuers, at value (identified cost, $362,929,090) | | | $366,735,832 | | | | | |
Underlying affiliated funds, at cost and value | | | 61,422,754 | | | | | |
Total investments, at value (identified cost, $424,351,844) | | | $428,158,586 | | | | | |
Restricted cash | | | 540,000 | | | | | |
Receivables for | | | | | | | | |
Forward foreign currency exchange contracts | | | 5,237,976 | | | | | |
Interest | | | 1,299,538 | | | | | |
Other assets | | | 3,782 | | | | | |
Total assets | | | | | | | $435,239,882 | |
Liabilities | | | | | | | | |
Payables for | | | | | | | | |
Forward foreign currency exchange contracts | | | $3,646,540 | | | | | |
Fund shares reacquired | | | 83,157 | | | | | |
Payable to affiliates | | | | | | | | |
Investment adviser | | | 9,473 | | | | | |
Shareholder servicing costs | | | 40 | | | | | |
Distribution and/or service fees | | | 2,969 | | | | | |
Payable for independent Trustees’ compensation | | | 26 | | | | | |
Accrued expenses and other liabilities | | | 65,894 | | | | | |
Total liabilities | | | | | | | $3,808,099 | |
Net assets | | | | | | | $431,431,783 | |
Net assets consist of | | | | | | | | |
Paid-in capital | | | $435,782,514 | | | | | |
Unrealized appreciation (depreciation) on investments and translation of assets and liabilities in foreign currencies | | | 5,359,358 | | | | | |
Accumulated net realized gain (loss) on investments and foreign currency | | | (10,423,815 | ) | | | | |
Undistributed net investment income | | | 713,726 | | | | | |
Net assets | | | | | | | $431,431,783 | |
Shares of beneficial interest outstanding | | | | | | | 41,972,190 | |
| | | | | | | | | | | | |
| | | Net assets | | | Shares outstanding | | | Net asset value per share | |
Initial Class | | | $214,183,126 | | | | 20,759,134 | | | | $10.32 | |
Service Class | | | 217,248,657 | | | | 21,213,056 | | | | 10.24 | |
See Notes to Financial Statements
10
MFS Inflation-Adjusted Bond Portfolio
FINANCIAL STATEMENTS | STATEMENT OF OPERATIONS
This statement describes how much your fund earned in investment income and accrued in expenses. It also describes any gains and/or losses generated by fund operations.
| | | | | | | | |
Year ended 12/31/14 | | | | | | | | |
Net investment income | | | | | | | | |
Income | | | | | | | | |
Interest | | | $5,876,555 | | | | | |
Dividends from underlying affiliated funds | | | 30,089 | | | | | |
Total investment income | | | | | | | $5,906,644 | |
Expenses | | | | | | | | |
Management fee | | | $2,303,031 | | | | | |
Distribution and/or service fees | | | 585,567 | | | | | |
Shareholder servicing costs | | | 8,786 | | | | | |
Administrative services fee | | | 72,279 | | | | | |
Independent Trustees’ compensation | | | 9,518 | | | | | |
Custodian fee | | | 74,110 | | | | | |
Audit and tax fees | | | 42,174 | | | | | |
Legal fees | | | 4,121 | | | | | |
Miscellaneous | | | 18,015 | | | | | |
Total expenses | | | | | | | $3,117,601 | |
Fees paid indirectly | | | (3 | ) | | | | |
Reduction of expenses by investment adviser | | | (21,906 | ) | | | | |
Net expenses | | | | | | | $3,095,692 | |
Net investment income | | | | | | | $2,810,952 | |
Realized and unrealized gain (loss) on investments and foreign currency | | | | | | | | |
Realized gain (loss) (identified cost basis) | | | | | | | | |
Investments | | | $(5,014,441 | ) | | | | |
Foreign currency | | | 3,206,338 | | | | | |
Net realized gain (loss) on investments and foreign currency | | | | | | | $(1,808,103 | ) |
Change in unrealized appreciation (depreciation) | | | | | | | | |
Investments | | | $17,224,446 | | | | | |
Translation of assets and liabilities in foreign currencies | | | (1,131,699 | ) | | | | |
Net unrealized gain (loss) on investments and foreign currency translation | | | | | | | $16,092,747 | |
Net realized and unrealized gain (loss) on investments and foreign currency | | | | | | | $14,284,644 | |
Change in net assets from operations | | | | | | | $17,095,596 | |
See Notes to Financial Statements
11
MFS Inflation-Adjusted Bond Portfolio
FINANCIAL STATEMENTS | STATEMENTS OF CHANGES IN NET ASSETS
These statements describe the increases and/or decreases in net assets resulting from operations, any distributions, and any shareholder transactions.
| | | | | | | | |
For years ended 12/31 | | | 2014 | | | | 2013 | |
Change in net assets | | | | | | | | |
From operations | | | | | | | | |
Net investment income | | | $2,810,952 | | | | $486,905 | |
Net realized gain (loss) on investments and foreign currency | | | (1,808,103 | ) | | | (7,629,854 | ) |
Net unrealized gain (loss) on investments and foreign currency translation | | | 16,092,747 | | | | (20,150,589 | ) |
Change in net assets from operations | | | $17,095,596 | | | | $(27,293,538 | ) |
Distributions declared to shareholders | | | | | | | | |
From net investment income | | | $(3,430,180 | ) | | | $— | |
From net realized gain on investments | | | — | | | | (30,280,009 | ) |
Total distributions declared to shareholders | | | $(3,430,180 | ) | | | $(30,280,009 | ) |
Change in net assets from fund share transactions | | | $(61,164,878 | ) | | | $5,105,894 | |
Total change in net assets | | | $(47,499,462 | ) | | | $(52,467,653 | ) |
Net assets | | | | | | | | |
At beginning of period | | | 478,931,245 | | | | 531,398,898 | |
At end of period (including undistributed net investment income of $713,726 and
$676,011, respectively) | | | $431,431,783 | | | | $478,931,245 | |
See Notes to Financial Statements
12
MFS Inflation-Adjusted Bond Portfolio
FINANCIAL STATEMENTS | FINANCIAL HIGHLIGHTS
The financial highlights table is intended to help you understand the fund’s financial performance for the past 5 years. Certain information reflects financial results for a single fund share. The total returns in the table represent the rate by which an investor would have earned (or lost) on an investment in the fund share class (assuming reinvestment of all distributions) held for the entire period.
| | | | | | | | | | | | | | | | | | | | |
| Initial Class | | Years ended 12/31 | |
| | | 2014 | | | 2013 | | | 2012 | | | 2011 | | | 2010 | |
Net asset value, beginning of period | | | $10.04 | | | | $11.29 | | | | $11.34 | | | | $10.64 | | | | $10.34 | |
| Income (loss) from investment operations | | | | | | | | | | | | | | | | | | | | |
Net investment income (d) | | | $0.08 | | | | $0.02 | | | | $0.10 | | | | $0.25 | | | | $0.14 | |
Net realized and unrealized gain (loss) on investments
and foreign currency | | | 0.29 | | | | (0.61 | ) | | | 0.76 | | | | 1.00 | | | | 0.40 | |
Total from investment operations | | | $0.37 | | | | $(0.59 | ) | | | $0.86 | | | | $1.25 | | | | $0.54 | |
| Less distributions declared to shareholders | | | | | | | | | | | | | | | | | | | | |
From net investment income | | | $(0.09 | ) | | | $— | | | | $(0.10 | ) | | | $(0.26 | ) | | | $(0.14 | ) |
From net realized gain on investments | | | — | | | | (0.66 | ) | | | (0.81 | ) | | | (0.29 | ) | | | (0.10 | ) |
Total distributions declared to shareholders | | | $(0.09 | ) | | | $(0.66 | ) | | | $(0.91 | ) | | | $(0.55 | ) | | | $(0.24 | ) |
Net asset value, end of period (x) | | | $10.32 | | | | $10.04 | | | | $11.29 | | | | $11.34 | | | | $10.64 | |
Total return (%) (k)(r)(s)(x) | | | 3.71 | | | | (5.07 | ) | | | 7.74 | | | | 11.90 | | | | 5.24 | |
Ratios (%) (to average net assets)
and Supplemental data: | | | | | | | | | | | | | | | | | | | | |
Expenses before expense reductions (f) | | | 0.55 | | | | 0.56 | | | | 0.65 | | | | 0.66 | | | | 0.66 | |
Expenses after expense reductions (f) | | | 0.54 | | | | 0.56 | | | | N/A | | | | 0.65 | | | | 0.65 | |
Net investment income | | | 0.72 | | | | 0.22 | | | | 0.87 | | | | 2.23 | | | | 1.34 | |
Portfolio turnover | | | 24 | | | | 51 | | | | 520 | | | | 430 | | | | 388 | |
Net assets at end of period (000 omitted) | | | $214,183 | | | | $230,805 | | | | $227,553 | | | | $264,474 | | | | $217,591 | |
See Notes to Financial Statements
13
MFS Inflation-Adjusted Bond Portfolio
Financial Highlights – continued
| | | | | | | | | | | | | | | | | | | | |
| Service Class | | Years ended 12/31 | |
| | | 2014 | | | 2013 | | | 2012 | | | 2011 | | | 2010 | |
Net asset value, beginning of period | | | $9.96 | | | | $11.23 | | | | $11.31 | | | | $10.61 | | | | $10.32 | |
| Income (loss) from investment operations | | | | | | | | | | | | | | | | | | | | |
Net investment income (loss) (d) | | | $0.05 | | | | $(0.00 | )(w) | | | $0.07 | | | | $0.20 | | | | $0.12 | |
Net realized and unrealized gain (loss) on investments
and foreign currency | | | 0.29 | | | | (0.61 | ) | | | 0.75 | | | | 1.03 | | | | 0.38 | |
Total from investment operations | | | $0.34 | | | | $(0.61 | ) | | | $0.82 | | | | $1.23 | | | | $0.50 | |
| Less distributions declared to shareholders | | | | | | | | | | | | | | | | | | | | |
From net investment income | | | $(0.06 | ) | | | $— | | | | $(0.09 | ) | | | $(0.24 | ) | | | $(0.11 | ) |
From net realized gain on investments | | | — | | | | (0.66 | ) | | | (0.81 | ) | | | (0.29 | ) | | | (0.10 | ) |
Total distributions declared to shareholders | | | $(0.06 | ) | | | $(0.66 | ) | | | $(0.90 | ) | | | $(0.53 | ) | | | $(0.21 | ) |
Net asset value, end of period (x) | | | $10.24 | | | | $9.96 | | | | $11.23 | | | | $11.31 | | | | $10.61 | |
Total return (%) (k)(r)(s)(x) | | | 3.43 | | | | (5.28 | ) | | | 7.42 | | | | 11.70 | | | | 4.91 | |
Ratios (%) (to average net assets)
and Supplemental data: | | | | | | | | | | | | | | | | | | | | |
Expenses before expense reductions (f) | | | 0.80 | | | | 0.81 | | | | 0.90 | | | | 0.91 | | | | 0.91 | |
Expenses after expense reductions (f) | | | 0.79 | | | | 0.81 | | | | N/A | | | | 0.90 | | | | 0.90 | |
Net investment income (loss) | | | 0.46 | | | | (0.00 | )(w) | | | 0.61 | | | | 1.78 | | | | 1.09 | |
Portfolio turnover | | | 24 | | | | 51 | | | | 520 | | | | 430 | | | | 388 | |
Net assets at end of period (000 omitted) | | | $217,249 | | | | $248,127 | | | | $303,846 | | | | $280,788 | | | | $161,359 | |
Information prior to the close of business on December 7, 2012, reflects time periods when another adviser or subadviser was responsible for selecting investments for the fund under a different investment objective and different investment strategies.
| (d) | | Per share data is based on average shares outstanding. |
| (f) | | Ratios do not reflect reductions from fees paid indirectly, if applicable. |
| (k) | | The total return does not reflect expenses that apply to separate accounts. Inclusion of these charges would reduce the total return figures for all periods shown. |
| (r) | | Certain expenses have been reduced without which performance would have been lower. |
| (s) | | From time to time the fund may receive proceeds from litigation settlements, without which performance would be lower. |
| (w) | | Per share amount was less than $0.01 and total return or ratio was less than 0.01%, as applicable. |
| (x) | | The net asset values per share and total returns have been calculated on net assets which include adjustments made in accordance with U.S. generally accepted accounting principles required at period end for financial reporting purposes. |
See Notes to Financial Statements
14
MFS Inflation-Adjusted Bond Portfolio
NOTES TO FINANCIAL STATEMENTS
| (1) | | Business and Organization |
MFS Inflation-Adjusted Bond Portfolio (the fund) is a non-diversified series of MFS Variable Insurance Trust III (the trust). The trust is organized as a Delaware statutory trust and is registered under the Investment Company Act of 1940, as amended, as an open-end management investment company. The shareholders of each series of the trust are separate accounts of insurance companies, which offer variable annuity and/or life insurance products, and qualified retirement and pension plans.
The fund is an investment company and accordingly follows the investment company accounting and reporting guidance of the Financial Accounting Standards Board (FASB) Accounting Standards Codification Topic 946 Financial Services – Investment Companies.
| (2) | | Significant Accounting Policies |
General – The preparation of financial statements in conformity with U.S. generally accepted accounting principles requires management to make estimates and assumptions that affect the reported amounts of assets and liabilities, and disclosure of contingent assets and liabilities at the date of the financial statements and the reported amounts of increases and decreases in net assets from operations during the reporting period. Actual results could differ from those estimates. In the preparation of these financial statements, management has evaluated subsequent events occurring after the date of the fund’s Statement of Assets and Liabilities through the date that the financial statements were issued. The fund invests in foreign securities. Investments in foreign securities are vulnerable to the effects of changes in the relative values of the local currency and the U.S. dollar and to the effects of changes in each country’s legal, political, and economic environment.
In June 2014, FASB issued Accounting Standards Update 2014-11, Transfers and Servicing (Topic 860) – Repurchase-to-Maturity Transactions, Repurchase Financings, and Disclosures (“ASU 2014-11”). ASU 2014-11 changes the accounting for repurchase-to-maturity transactions (i.e., repurchase agreements that settle at the same time as the maturity of the transferred financial asset) and enhances the required disclosures for repurchase agreements and other similar transactions. Although still evaluating the potential impacts of ASU 2014-11 to the fund, management expects that the impact of the fund’s adoption will be limited to additional financial statement disclosures which would first be effective for interim reporting periods beginning after March 15, 2015.
Balance Sheet Offsetting – The fund’s accounting policy with respect to balance sheet offsetting is that, absent an event of default by the counterparty or a termination of the agreement, the International Swaps and Derivatives Association (ISDA) Master Agreement does not result in an offset of reported amounts of financial assets and financial liabilities in the Statement of Assets and Liabilities across transactions between the fund and the applicable counterparty. The fund’s right to setoff may be restricted or prohibited by the bankruptcy or insolvency laws of the particular jurisdiction to which a specific master netting agreement counterparty is subject. Balance sheet offsetting disclosures, to the extent applicable to the fund, have been included in the fund’s Significant Accounting Policies note under the captions for each of the fund’s in-scope financial instruments and transactions.
Investment Valuations – Debt instruments and floating rate loans, including restricted debt instruments, are generally valued at an evaluated or composite bid as provided by a third-party pricing service. Short-term instruments with a maturity at issuance of 60 days or less may be valued at amortized cost, which approximates market value. Forward foreign currency exchange contracts are generally valued at the mean of bid and asked prices for the time period interpolated from rates provided by a third-party pricing service for proximate time periods. Open-end investment companies are generally valued at net asset value per share. Securities and other assets generally valued on the basis of information from a third-party pricing service may also be valued at a broker/dealer bid quotation. Values obtained from third-party pricing services can utilize both transaction data and market information such as yield, quality, coupon rate, maturity, type of issue, trading characteristics, and other market data. The values of foreign securities and other assets and liabilities expressed in foreign currencies are converted to U.S. dollars using the mean of bid and asked prices for rates provided by a third-party pricing service.
The Board of Trustees has delegated primary responsibility for determining or causing to be determined the value of the fund’s investments (including any fair valuation) to the adviser pursuant to valuation policies and procedures approved by the Board. If the adviser determines that reliable market quotations are not readily available, investments are valued at fair value as determined in good faith by the adviser in accordance with such procedures under the oversight of the Board of Trustees. Under the fund’s valuation policies and procedures, market quotations are not considered to be readily available for most types of debt instruments and floating rate loans and many types of derivatives. These investments are generally valued at fair value based on information from third-party pricing services. In addition, investments may be valued at fair value if the adviser determines that an investment’s value has been materially affected by events occurring after the close of the exchange or market on which the investment is principally traded (such as foreign exchange or market) and prior to the determination of the fund’s net asset value, or after the halting of trading of a specific security where trading does not resume prior to the close of the exchange or market on which the security is principally traded. The adviser generally relies on third-party pricing services or other information (such as the correlation with price movements of similar securities in the same or other markets; the type, cost and investment characteristics of the security; the business and financial condition of the issuer; and trading and other market data) to assist in determining whether to fair value and
15
MFS Inflation-Adjusted Bond Portfolio
Notes to Financial Statements – continued
at what value to fair value an investment. The value of an investment for purposes of calculating the fund’s net asset value can differ depending on the source and method used to determine value. When fair valuation is used, the value of an investment used to determine the fund’s net asset value may differ from quoted or published prices for the same investment. There can be no assurance that the fund could obtain the fair value assigned to an investment if it were to sell the investment at the same time at which the fund determines its net asset value per share.
Various inputs are used in determining the value of the fund’s assets or liabilities. These inputs are categorized into three broad levels. In certain cases, the inputs used to measure fair value may fall into different levels of the fair value hierarchy. In such cases, an investment’s level within the fair value hierarchy is based on the lowest level of input that is significant to the fair value measurement. The fund’s assessment of the significance of a particular input to the fair value measurement in its entirety requires judgment, and considers factors specific to the investment. Level 1 includes unadjusted quoted prices in active markets for identical assets or liabilities. Level 2 includes other significant observable market-based inputs (including quoted prices for similar securities, interest rates, prepayment speed, and credit risk). Level 3 includes unobservable inputs, which may include the adviser’s own assumptions in determining the fair value of investments. Other financial instruments are derivative instruments not reflected in total investments, such as forward foreign currency exchange contracts. The following is a summary of the levels used as of December 31, 2014 in valuing the fund’s assets or liabilities:
| | | | | | | | | | | | | | | | |
| Investments at Value | | Level 1 | | | Level 2 | | | Level 3 | | | Total | |
| U.S. Treasury Bonds & U.S. Government Agency & Equivalents | | | $— | | | | $135,898,784 | | | | $— | | | | $135,898,784 | |
| Non-U.S. Sovereign Debt | | | — | | | | 230,837,048 | | | | — | | | | 230,837,048 | |
| Mutual Funds | | | 61,422,754 | | | | — | | | | — | | | | 61,422,754 | |
| Total Investments | | | $61,422,754 | | | | $366,735,832 | | | | $— | | | | $428,158,586 | |
| | | | |
| Other Financial Instruments | | | | | | | | | | | | |
| Forward Foreign Currency Exchange Contracts | | | $— | | | | $1,591,436 | | | | $— | | | | $1,591,436 | |
For further information regarding security characteristics, see the Portfolio of Investments.
Inflation-Adjusted Debt Securities – The fund invests in inflation-adjusted debt securities issued by the U.S. Treasury. The fund also invests in inflation-adjusted debt securities issued by U.S. Government agencies and instrumentalities other than the U.S. Treasury and by other entities such as U.S. and foreign corporations and foreign governments. The principal value of these debt securities is adjusted through income according to changes in the Consumer Price Index or another general price or wage index. These debt securities typically pay a fixed rate of interest, but this fixed rate is applied to the inflation-adjusted principal amount. The principal paid at maturity of the debt security is typically equal to the inflation-adjusted principal amount, or the security’s original par value, whichever is greater. Other types of inflation-adjusted securities may use other methods to adjust for other measures of inflation.
Foreign Currency Translation – Purchases and sales of foreign investments, income, and expenses are converted into U.S. dollars based upon currency exchange rates prevailing on the respective dates of such transactions or on the reporting date for foreign denominated receivables and payables. Gains and losses attributable to foreign currency exchange rates on sales of securities are recorded for financial statement purposes as net realized gains and losses on investments. Gains and losses attributable to foreign exchange rate movements on receivables, payables, income and expenses are recorded for financial statement purposes as foreign currency transaction gains and losses. That portion of both realized and unrealized gains and losses on investments that results from fluctuations in foreign currency exchange rates is not separately disclosed.
Derivatives – The fund uses derivatives for different purposes, primarily to increase or decrease exposure to a particular market or segment of the market, or security, to increase or decrease interest rate or currency exposure, or as alternatives to direct investments. Derivatives are used for hedging or non-hedging purposes. While hedging can reduce or eliminate losses, it can also reduce or eliminate gains. When the fund uses derivatives as an investment to increase market exposure, or for hedging purposes, gains and losses from derivative instruments may be substantially greater than the derivative’s original cost.
The derivative instruments used by the fund were forward foreign currency exchange contracts. The fund’s period end derivatives, as presented in the Portfolio of Investments and the associated Derivative Contract tables, generally are indicative of the volume of its derivative activity during the period.
The following table presents, by major type of derivative contract, the fair value, on a gross basis, of the asset and liability components of derivatives held by the fund at December 31, 2014 as reported in the Statement of Assets and Liabilities:
| | | | | | | | | | |
| | | | | Fair Value | |
| Risk | | Derivative Contracts | | Asset Derivatives | | | Liability Derivatives | |
| Foreign Exchange | | Forward Foreign Currency Exchange | | | $5,237,976 | | | | $(3,646,540 | ) |
16
MFS Inflation-Adjusted Bond Portfolio
Notes to Financial Statements – continued
The following table presents, by major type of derivative contract, the realized gain (loss) on derivatives held by the fund for the year ended December 31, 2014 as reported in the Statement of Operations:
| | | | |
| Risk | | Foreign Currency | |
| Foreign Exchange | | | $3,254,806 | |
The following table presents, by major type of derivative contract, the change in unrealized appreciation (depreciation) on derivatives held by the fund for the year ended December 31, 2014 as reported in the Statement of Operations:
| | | | |
| Risk | | Translation of
Assets and
Liabilities in
Foreign Currencies | |
| Foreign Exchange | | | $(1,067,447 | ) |
Derivative counterparty credit risk is managed through formal evaluation of the creditworthiness of all potential counterparties. On certain, but not all, over-the-counter derivatives, the fund attempts to reduce its exposure to counterparty credit risk whenever possible by entering into an ISDA Master Agreement on a bilateral basis with each of the counterparties with whom it undertakes a significant volume of transactions. The ISDA Master Agreement gives each party to the agreement the right to terminate all transactions traded under such agreement if there is a certain deterioration in the credit quality of the other party. Upon an event of default or a termination of the ISDA Master Agreement, the non-defaulting party has the right to close out all transactions traded under such agreement and to net amounts owed under each transaction to one net amount payable by one party to the other. This right to close out and net payments across all transactions traded under the ISDA Master Agreement could result in a reduction of the fund’s credit risk to such counterparty equal to any amounts payable by the fund under the applicable transactions, if any. The fund’s right to setoff may be restricted or prohibited by the bankruptcy or insolvency laws of the particular jurisdiction to which a specific ISDA counterparty is subject.
Collateral and margin requirements differ by type of derivative. Margin requirements are set by the broker or clearing house for cleared derivatives (i.e., futures contracts, cleared swaps, and exchange-traded options) while collateral terms are contract specific for over-the-counter traded derivatives (i.e., forward foreign currency exchange contracts, uncleared swap agreements, and over-the-counter options). For derivatives traded under an ISDA Master Agreement, the collateral requirements are netted across all transactions traded under such agreement and one amount is posted from one party to the other to collateralize such obligations. Cash that has been segregated to cover the fund’s collateral or margin obligations under derivative contracts, if any, will be reported separately in the Statement of Assets and Liabilities as “Restricted cash” or “Deposits with brokers.” Securities pledged as collateral or margin for the same purpose, if any, are noted in the Portfolio of Investments.
Forward Foreign Currency Exchange Contracts – The fund entered into forward foreign currency exchange contracts for the purchase or sale of a specific foreign currency at a fixed price on a future date. These contracts may be used to hedge the fund’s currency risk or for non-hedging purposes. For hedging purposes, the fund may enter into contracts to deliver or receive foreign currency that the fund will receive from or use in its normal investment activities. The fund may also use contracts to hedge against declines in the value of foreign currency denominated securities due to unfavorable exchange rate movements. For non-hedging purposes, the fund may enter into contracts with the intent of changing the relative exposure of the fund’s portfolio of securities to different currencies to take advantage of anticipated exchange rate changes.
Forward foreign currency exchange contracts are adjusted by the daily exchange rate of the underlying currency and any unrealized gains or losses are recorded as a receivable or payable for forward foreign currency exchange contracts until the contract settlement date. On contract settlement date, any gain or loss on the contract is recorded as realized gains or losses on foreign currency.
Risks may arise upon entering into these contracts from unanticipated movements in the value of the contract and from the potential inability of counterparties to meet the terms of their contracts. Generally, the fund’s maximum risk due to counterparty credit risk is the unrealized gain on the contract due to the use of Continuous Linked Settlement, an industry accepted settlement system. This risk is mitigated in cases where there is an ISDA Master Agreement between the fund and the counterparty providing for netting as described above and for posting of collateral by the counterparty to the fund to cover the fund’s exposure to the counterparty under such ISDA Master Agreement.
Indemnifications – Under the fund’s organizational documents, its officers and Trustees may be indemnified against certain liabilities and expenses arising out of the performance of their duties to the fund. Additionally, in the normal course of business, the fund enters into agreements with service providers that may contain indemnification clauses. The fund’s maximum exposure under these agreements is unknown as this would involve future claims that may be made against the fund that have not yet occurred.
Investment Transactions and Income – Investment transactions are recorded on the trade date. Interest income is recorded on the accrual basis. All premium and discount is amortized or accreted for financial statement purposes in accordance with U.S. generally
17
MFS Inflation-Adjusted Bond Portfolio
Notes to Financial Statements – continued
accepted accounting principles. Inflation-indexed bonds are fixed-income securities whose principal value is periodically adjusted upward or downward based on the rate of inflation. Interest is accrued based on the principal value, which is adjusted for inflation. Any increase or decrease in the principal amount of an inflation-indexed bond is generally recorded as an increase or decrease in interest income, respectively, even though the adjusted principal is not received until maturity. Interest payments received in additional securities are recorded on ex-interest date in an amount equal to the value of the security on such date.
The fund may receive proceeds from litigation settlements. Any proceeds received from litigation involving portfolio holdings are reflected in the Statement of Operations in realized gain/loss if the security has been disposed of by the fund or in unrealized gain/loss if the security is still held by the fund. Any other proceeds from litigation not related to portfolio holdings are reflected as other income in the Statement of Operations.
Fees Paid Indirectly – The fund’s custody fee may be reduced according to an arrangement that measures the value of cash deposited with the custodian by the fund. This amount, for the year ended December 31, 2014, is shown as a reduction of total expenses in the Statement of Operations.
Tax Matters and Distributions – The fund intends to qualify as a regulated investment company, as defined under Subchapter M of the Internal Revenue Code, and to distribute all of its taxable income, including realized capital gains. As a result, no provision for federal income tax is required. The fund’s federal tax returns, when filed, will remain subject to examination by the Internal Revenue Service for a three year period. Management has analyzed the fund’s tax positions taken on federal and state tax returns for all open tax years and does not believe that there are any uncertain tax positions that require recognition of a tax liability. Foreign taxes, if any, have been accrued by the fund in the accompanying financial statements in accordance with the applicable foreign tax law. Foreign income taxes may be withheld by certain countries in which the fund invests. Additionally, capital gains realized by the fund on securities issued in or by certain foreign countries may be subject to capital gains tax imposed by those countries.
Distributions to shareholders are recorded on the ex-dividend date. Income and capital gain distributions are determined in accordance with income tax regulations, which may differ from U.S. generally accepted accounting principles. Certain capital accounts in the financial statements are periodically adjusted for permanent differences in order to reflect their tax character. These adjustments have no impact on net assets or net asset value per share. Temporary differences which arise from recognizing certain items of income, expense, gain or loss in different periods for financial statement and tax purposes will reverse at some time in the future. Distributions in excess of net investment income or net realized gains are temporary overdistributions for financial statement purposes resulting from differences in the recognition or classification of income or distributions for financial statement and tax purposes.
Book/tax differences primarily relate to wash sale loss deferrals and derivative transactions.
The tax character of distributions declared to shareholders for the last two fiscal years is as follows:
| | | | | | | | |
| | | 12/31/14 | | | 12/31/13 | |
| Ordinary income (including any short-term capital gains) | | | $3,430,180 | | | | $24,069,446 | |
| Long-term capital gains | | | — | | | | 6,210,563 | |
| Total distributions | | | $3,430,180 | | | | $30,280,009 | |
The federal tax cost and the tax basis components of distributable earnings were as follows:
| | | | |
| As of 12/31/14 | | | | |
| Cost of investments | | | $425,853,209 | |
| Gross appreciation | | | 17,305,801 | |
| Gross depreciation | | | (15,000,424 | ) |
| Net unrealized appreciation (depreciation) | | | $2,305,377 | |
| Undistributed ordinary income | | | 2,265,736 | |
| Capital loss carryforwards | | | (8,722,511 | ) |
| Other temporary differences | | | (199,333 | ) |
As of December 31, 2014, the fund had capital loss carryforwards available to offset future realized gains. Such losses are characterized as follows:
| | | | |
| Short-Term | | | $(4,410,922 | ) |
| Long-Term | | | (4,311,589 | ) |
| Total | | | $(8,722,511 | ) |
Under the Regulated Investment Company Modernization Act of 2010 (the “Act”), the above net capital losses may be carried forward indefinitely, and their character is retained as short-term and/or long-term losses. Previously, net capital losses were carried forward for eight years and treated as short-term losses.
18
MFS Inflation-Adjusted Bond Portfolio
Notes to Financial Statements – continued
Multiple Classes of Shares of Beneficial Interest – The fund offers multiple classes of shares, which differ in their respective distribution and/or service fees. The fund’s income, realized and unrealized gain (loss), and common expenses are allocated to shareholders based on the daily net assets of each class. Dividends are declared separately for each class. Differences in per share dividend rates are generally due to differences in separate class expenses. The fund’s distributions declared to shareholders as reported in the Statements of Changes in Net Assets are presented by class as follows:
| | | | | | | | | | | | | | | | |
| | | From net investment
income | | | From net realized gain on
investments | |
| | | Year ended
12/31/14 | | | Year ended
12/31/13 | | | Year ended
12/31/14 | | | Year ended
12/31/13 | |
| Initial Class | | | $2,011,219 | | | | $— | | | | $— | | | | $14,003,841 | |
| Service Class | | | 1,418,961 | | | | — | | | | — | | | | 16,276,168 | |
| Total | | | $3,430,180 | | | | $— | | | | $— | | | | $30,280,009 | |
| (3) | | Transactions with Affiliates |
Investment Adviser – The fund has an investment advisory agreement with MFS to provide overall investment management and related administrative services and facilities to the fund. The management fee is computed daily and paid monthly at an annual rate of 0.50% of the fund’s average daily net assets.
MFS has agreed in writing to reduce its management fee by a specified amount if certain MFS mutual fund assets exceed thresholds agreed to by MFS and the fund’s Board of Trustees. For the year ended December 31, 2014, this management fee reduction amounted to $21,096, which is included in the reduction of total expenses in the Statement of Operations. The management fee incurred for the year ended December 31, 2014 was equivalent to an annual effective rate of 0.50% of the fund’s average daily net assets.
Distributor – MFS Fund Distributors, Inc. (MFD), a wholly-owned subsidiary of MFS, is the distributor of shares of the fund. The Trustees have adopted a distribution plan for the Service Class shares pursuant to Rule 12b-1 under the Investment Company Act of 1940.
The fund’s distribution plan provides that the fund will pay MFD distribution and/or service fees equal to 0.25% per annum of its average daily net assets attributable to Service Class shares as partial consideration for services performed and expenses incurred by MFD and financial intermediaries (including participating insurance companies that invest in the fund to fund variable annuity and variable life insurance contracts, sponsors of qualified retirement and pension plans that invest in the fund, and affiliates of these participating insurance companies and plan sponsors) in connection with the sale and distribution of the Service Class shares. MFD may subsequently pay all, or a portion, of the distribution and/or service fees to financial intermediaries.
Shareholder Servicing Agent – MFS Service Center, Inc. (MFSC), a wholly-owned subsidiary of MFS, receives a fee from the fund for its services as shareholder servicing agent. For the year ended December 31, 2014, the fee was $8,719, which equated to 0.0019% annually of the fund’s average daily net assets. MFSC also receives payment from the fund for out-of-pocket expenses paid by MFSC on behalf of the fund. For the year ended December 31, 2014, these costs amounted to $67.
Administrator – MFS provides certain financial, legal, shareholder communications, compliance, and other administrative services to the fund. Under an administrative services agreement, the fund partially reimburses MFS the costs incurred to provide these services. The fund is charged an annual fixed amount of $17,500 plus a fee based on average daily net assets. The administrative services fee incurred for the year ended December 31, 2014 was equivalent to an annual effective rate of 0.0157% of the fund’s average daily net assets.
Trustees’ and Officers’ Compensation – The fund pays compensation to independent Trustees in the form of a retainer, attendance fees, and additional compensation to Board and Committee chairpersons. The fund does not pay compensation directly to Trustees or officers of the fund who are also officers of the investment adviser, all of whom receive remuneration for their services to the fund from MFS. Certain officers and Trustees of the fund are officers or directors of MFS, MFD, and MFSC.
Other – Effective November 1, 2014, this fund and certain other funds managed by MFS (the funds) have entered into a service agreement (the ISO Agreement) which provides for payment of fees solely by the funds to Tarantino LLC in return for the provision of services of an Independent Senior Officer (ISO) for the funds. Frank L. Tarantino serves as the ISO and is an officer of the funds and the sole member of Tarantino LLC. The funds can terminate the ISO Agreement with Tarantino LLC at any time under the terms of the ISO Agreement. Prior to November 1, 2014, the funds had entered into services agreements (the Compliance Officer Agreements) which provided for payment of fees by the funds to Tarantino LLC and Griffin Compliance LLC in return for the provision of services of an Independent Chief Compliance Officer (ICCO) and Assistant ICCO, respectively, for the funds. Prior to November 1, 2014, Frank L. Tarantino served as the ICCO. Effective October 31, 2014, Mr. Tarantino resigned as ICCO and the Compliance Officer Agreement between the funds and Tarantino LLC was terminated. Prior to June 1, 2014, Robyn L. Griffin served as the Assistant ICCO and was an officer of the funds. Ms. Griffin is the sole member of Griffin Compliance LLC. Effective
19
MFS Inflation-Adjusted Bond Portfolio
Notes to Financial Statements – continued
May 31, 2014, Ms. Griffin resigned as Assistant ICCO and the Compliance Officer Agreement between the funds and Griffin Compliance LLC was terminated. For the year ended December 31, 2014, the aggregate fees paid by the fund under these agreements were $2,205 and are included in “Miscellaneous” expense in the Statement of Operations. MFS had agreed to reimburse the fund for a portion of the payments made by the fund for the services under the Compliance Officer Agreements in the amount of $810, which is included in the reduction of total expenses in the Statement of Operations. Additionally, MFS has agreed to bear all expenses associated with office space, other administrative support, and supplies provided to the ICCO, Assistant ICCO, and ISO.
The fund invests in the MFS Institutional Money Market Portfolio which is managed by MFS and seeks current income consistent with preservation of capital and liquidity. Income earned on this investment is included in “Dividends from underlying affiliated funds” in the Statement of Operations. This money market fund does not pay a management fee to MFS.
For the year ended December 31, 2014, purchases and sales of investments, other than short-term obligations, were as follows:
| | | | | | | | |
| | | Purchases | | | Sales | |
| U.S. Government securities | | | $56,299,438 | | | | $112,593,276 | |
| Investments (non-U.S. Government securities) | | | $43,459,767 | | | | $61,524,216 | |
| (5) | | Shares of Beneficial Interest |
The fund’s Declaration of Trust permits the Trustees to issue an unlimited number of full and fractional shares of beneficial interest. Transactions in fund shares were as follows:
| | | | | | | | | | | | | | | | |
| | | Year ended 12/31/14 | | | Year ended 12/31/13 | |
| | | Shares | | | Amount | | | Shares | | | Amount | |
| Shares sold | | | | | | | | | | | | | | | | |
Initial Class | | | 325,231 | | | | $3,326,715 | | | | 2,338,408 | | | | $24,593,406 | |
Service Class | | | 709,444 | | | | 7,334,743 | | | | 2,829,388 | | | | 29,787,750 | |
| | | 1,034,675 | | | | $10,661,458 | | | | 5,167,796 | | | | $54,381,156 | |
| Shares issued to shareholders in reinvestment of distributions | | | | | | | | | | | | | | | | |
Initial Class | | | 189,917 | | | | $2,011,219 | | | | 1,431,886 | | | | $14,003,841 | |
Service Class | | | 134,754 | | | | 1,418,961 | | | | 1,674,503 | | | | 16,276,168 | |
| | | 324,671 | | | | $3,430,180 | | | | 3,106,389 | | | | $30,280,009 | |
| Shares reacquired | | | | | | | | | | | | | | | | |
Initial Class | | | (2,751,116 | ) | | | $(28,695,208 | ) | | | (932,212 | ) | | | $(9,958,556 | ) |
Service Class | | | (4,545,696 | ) | | | (46,561,308 | ) | | | (6,636,783 | ) | | | (69,596,715 | ) |
| | | (7,296,812 | ) | | | $(75,256,516 | ) | | | (7,568,995 | ) | | | $(79,555,271 | ) |
| Net change | | | | | | | | | | | | | | | | |
Initial Class | | | (2,235,968 | ) | | | $(23,357,274 | ) | | | 2,838,082 | | | | $28,638,691 | |
Service Class | | | (3,701,498 | ) | | | (37,807,604 | ) | | | (2,132,892 | ) | | | (23,532,797 | ) |
| | | (5,937,466 | ) | | | $(61,164,878 | ) | | | 705,190 | | | | $5,105,894 | |
The fund is one of several mutual funds in which certain MFS funds may invest. The MFS funds do not invest in the underlying funds for the purpose of exercising management or control. At the end of the period, the MFS Moderate Allocation Portfolio, the MFS Conservative Allocation Portfolio, and the MFS Growth Allocation Portfolio were the owners of record of approximately 25%, 19%, and 6%, respectively, of the value of outstanding voting shares of the fund.
The fund and certain other funds managed by MFS participate in a $1.1 billion unsecured committed line of credit, subject to a $1 billion sublimit, provided by a syndication of banks under a credit agreement. Borrowings may be made for temporary financing needs. Interest is charged to each fund, based on its borrowings, generally at a rate equal to the higher of the Federal Reserve funds rate or one month LIBOR plus an agreed upon spread. A commitment fee, based on the average daily, unused portion of the committed line of credit, is allocated among the participating funds at the end of each calendar quarter. In addition, the fund and other funds managed by MFS have established unsecured uncommitted borrowing arrangements with certain banks for temporary financing needs. Interest is charged to each fund, based on its borrowings, at a rate equal to the Federal Reserve funds rate plus an agreed upon spread. For the year ended December 31, 2014, the fund’s commitment fee and interest expense were $1,741 and $0, respectively, and are included in “Miscellaneous” expense in the Statement of Operations.
20
MFS Inflation-Adjusted Bond Portfolio
Notes to Financial Statements – continued
| (7) | | Transactions in Underlying Affiliated Funds – Affiliated Issuers |
An affiliated issuer may be considered one in which the fund owns 5% or more of the outstanding voting securities, or a company which is under common control. For the purposes of this report, the fund assumes the following to be an affiliated issuer:
| | | | | | | | | | | | | | | | |
| Underlying Affiliated Fund | | Beginning
Shares/Par
Amount | | | Acquisitions
Shares/Par
Amount | | | Dispositions
Shares/Par
Amount | | | Ending
Shares/Par
Amount | |
| MFS Institutional Money Market Portfolio | | | 49,905,363 | | | | 148,199,128 | | | | (136,681,737 | ) | | | 61,422,754 | |
| | | | |
| Underlying Affiliated Fund | | Realized
Gain (Loss) | | | Capital Gain
Distributions | | | Dividend
Income | | | Ending
Value | |
| MFS Institutional Money Market Portfolio | | | $— | | | | $— | | | | $30,089 | | | | $61,422,754 | |
21
MFS Inflation-Adjusted Bond Portfolio
REPORT OF INDEPENDENT REGISTERED PUBLIC ACCOUNTING FIRM
To the Board of Trustees of MFS Variable Insurance Trust III and the Shareholders of
MFS Inflation-Adjusted Bond Portfolio:
We have audited the accompanying statement of assets and liabilities, including the portfolio of investments, of MFS Inflation-Adjusted Bond Portfolio (one of the series of MFS Variable Insurance Trust III) (the “Fund”) as of December 31, 2014, and the related statement of operations for the year then ended, the statements of changes in net assets for each of the two years in the period then ended, and the financial highlights for each of the five years in the period then ended. These financial statements and financial highlights are the responsibility of the Fund’s management. Our responsibility is to express an opinion on these financial statements and financial highlights based on our audits.
We conducted our audits in accordance with the standards of the Public Company Accounting Oversight Board (United States). Those standards require that we plan and perform the audit to obtain reasonable assurance about whether the financial statements and financial highlights are free of material misstatement. The Fund is not required to have, nor were we engaged to perform, an audit of its internal control over financial reporting. Our audits included consideration of internal control over financial reporting as a basis for designing audit procedures that are appropriate in the circumstances, but not for the purpose of expressing an opinion on the effectiveness of the Fund’s internal control over financial reporting. Accordingly, we express no such opinion. An audit also includes examining, on a test basis, evidence supporting the amounts and disclosures in the financial statements, assessing the accounting principles used and significant estimates made by management, as well as evaluating the overall financial statement presentation. Our procedures included confirmation of securities owned as of December 31, 2014, by correspondence with the custodian. We believe that our audits provide a reasonable basis for our opinion.
In our opinion, the financial statements and financial highlights referred to above present fairly, in all material respects, the financial position of MFS Inflation-Adjusted Bond Portfolio as of December 31, 2014, the results of its operations for the year then ended, the changes in its net assets for each of the two years in the period then ended, and the financial highlights for each of the five years in the period then ended, in conformity with accounting principles generally accepted in the United States of America.
DELOITTE & TOUCHE LLP
Boston, Massachusetts
February 13, 2015
22
MFS Inflation-Adjusted Bond Portfolio
TRUSTEES AND OFFICERS – IDENTIFICATION AND BACKGROUND
The Trustees and Officers of the Trust, as of February 1, 2015, are listed below, together with their principal occupations during the past five years. (Their titles may have varied during that period.) The address of each Trustee and Officer is 111 Huntington Avenue, Boston, Massachusetts 02199-7618.
| | | | | | | | |
Name, Age | | Position(s)
Held with Fund | | Trustee/Officer
Since (h) | | Principal Occupations
During the Past Five Years | | Other Directorships (j) |
| INTERESTED TRUSTEES |
Robert J. Manning (k) (age 51) | | Trustee | | February 2004 | | Massachusetts Financial Services Company, Chairman, Co-Chief Executive Officer and Director; President (until 2009); Chief Investment Officer (until 2010) | | N/A |
| | | | |
Robin A. Stelmach (k) (age 53) | | Trustee and President | | January 2014 | | Massachusetts Financial Services Company, Executive Vice President and Chief Operating Officer | | N/A |
| | | |
| INDEPENDENT TRUSTEES | | | | | | |
David H. Gunning (age 72) | | Trustee and Chair of Trustees | | January 2004 | | Private investor | | Lincoln Electric Holdings, Inc. (welding equipment manufacturer), Director; Development Alternatives, Inc. (consulting), Director/Non-Executive Chairman |
| | | | |
Steven E. Buller (age 63) | | Trustee | | February 2014 | | Chairman, Financial Accounting Standards Advisory Council; Standing Advisory Group, Public Company Accounting Oversight Board, Member (until 2014); BlackRock, Inc. (investment management), Managing Director (until 2014), BlackRock Finco UK (investment management), Director (until 2014) | | N/A |
| | | | |
Robert E. Butler (age 73) | | Trustee | | January 2006 | | Consultant – investment company industry regulatory and compliance matters | | N/A |
| | | | |
Maureen R. Goldfarb (age 59) | | Trustee | | January 2009 | | Private investor | | N/A |
| | | | |
William R. Gutow (age 73) | | Trustee | | December 1993 | | Private investor and real estate consultant; Capitol Entertainment Management Company (video franchise), Vice Chairman | | Texas Donuts (donut franchise), Vice Chairman (until 2010) |
| | | | |
Michael Hegarty (age 70) | | Trustee | | December 2004 | | Private investor | | Brookfield Office Properties, Inc. (real estate), Director; Rouse Properties Inc. (real estate), Director; Capmark Financial Group Inc. (real estate), Director |
| | | | |
John P. Kavanaugh (age 60) | | Trustee | | January 2009 | | Private investor | | N/A |
| | | | |
Maryanne L. Roepke (age 58) | | Trustee | | May 2014 | | American Century Investments (investment management), Senior Vice President and Chief Compliance Officer (until 2014) | | N/A |
| | | | |
Laurie J. Thomsen (age 57) | | Trustee | | March 2005 | | Private investor; New Profit, Inc. (venture philanthropy), Executive Partner (until 2010) | | The Travelers Companies (insurance), Director |
| | | | |
Robert W. Uek (age 73) | | Trustee | | January 2006 | | Consultant to investment company industry | | N/A |
| | | | |
| OFFICERS | | | | | | | | |
Christopher R. Bohane (k) (age 41) | | Assistant Secretary and Assistant Clerk | | July 2005 | | Massachusetts Financial Services Company, Vice President and Assistant General Counsel | | N/A |
| | | | |
Kino Clark (k) (age 46) | | Assistant Treasurer | | January 2012 | | Massachusetts Financial Services Company, Vice President | | N/A |
| | | | |
Thomas H. Connors (k) (age 55) | | Assistant Secretary and Assistant Clerk | | September 2012 | | Massachusetts Financial Services Company, Vice President and Senior Counsel; Deutsche Investment Management Americas Inc. (financial service provider), Director and Senior Counsel (until 2012) | | N/A |
23
MFS Inflation-Adjusted Bond Portfolio
Trustees and Officers – continued
| | | | | | | | |
Name, Age | | Position(s)
Held with Fund | | Trustee/Officer
Since (h) | | Principal Occupations
During the Past Five Years | | Other Directorships (j) |
Ethan D. Corey (k) (age 51) | | Assistant
Secretary and Assistant Clerk | | July 2005 | | Massachusetts Financial Services Company, Senior Vice President and Associate General Counsel | | N/A |
| | | | |
David L. DiLorenzo (k) (age 46) | | Treasurer | | July 2005 | | Massachusetts Financial Services Company, Senior Vice President | | N/A |
| | | | |
Timothy M. Fagan (k) (age 46) | | Chief Compliance Officer | | November 2014 | | Massachusetts Financial Services Company, Chief Compliance Officer; Vice President and Senior Counsel (until 2012) | | N/A |
| | | | |
Brian E. Langenfeld (k) (age 41) | | Assistant
Secretary and Assistant Clerk | | June 2006 | | Massachusetts Financial Services Company, Vice President and Senior Counsel | | N/A |
| | | | |
Susan S. Newton (k) (age 64) | | Assistant
Secretary and Assistant Clerk | | May 2005 | | Massachusetts Financial Services Company, Senior Vice President and Associate General Counsel | | N/A |
| | | | |
Susan A. Pereira (k) (age 44) | | Assistant
Secretary and Assistant Clerk | | July 2005 | | Massachusetts Financial Services Company, Vice President and Senior Counsel | | N/A |
| | | | |
Kasey L. Phillips (k) (age 44) | | Assistant Treasurer | | September 2012 | | Massachusetts Financial Services Company, Vice President; Wells Fargo Funds Management, LLC, Senior Vice President, Fund Treasurer (until 2012) | | N/A |
| | | | |
Mark N. Polebaum (k) (age 62) | | Secretary and
Clerk | | January 2006 | | Massachusetts Financial Services Company, Executive Vice President, General Counsel and Secretary | | N/A |
| | | | |
Matthew A. Stowe (k) (age 40) | | Assistant Secretary and Assistant Clerk | | October 2014 | | Massachusetts Financial Services Company, Vice President and Senior Counsel | | N/A |
| | | | |
Frank L. Tarantino (age 70) | | Independent
Senior Officer | | June 2004 | | Tarantino LLC (provider of compliance services), Principal | | N/A |
| | | | |
Richard S. Weitzel (k) (age 44) | | Assistant Secretary and Assistant Clerk | | October 2007 | | Massachusetts Financial Services Company, Senior Vice President and Associate General Counsel | | N/A |
| | | | |
James O. Yost (k) (age 54) | | Deputy Treasurer | | September 1990 | | Massachusetts Financial Services Company, Senior Vice President | | N/A |
| (h) | Date first appointed to serve as Trustee/officer of an MFS Fund. Each Trustee has served continuously since appointment unless indicated otherwise. For the period from December 15, 2004 until February 22, 2005, Mr. Manning served as Advisory Trustee. Prior to January 2012, Messrs. DiLorenzo and Yost served as Assistant Treasurers of the Funds. Ms. Stelmach was appointed as President of the Funds as of October 1, 2014. |
| (j) | Directorships or trusteeships of companies required to report to the Securities and Exchange Commission (i.e., “public companies”). |
| (k) | “Interested person” of the Trust within the meaning of the Investment Company Act of 1940 (referred to as the 1940 Act), which is the principal federal law governing investment companies like the fund, as a result of a position with MFS. The address of MFS is 111 Huntington Avenue, Boston, Massachusetts 02199-7618. |
Each Trustee (except Ms. Stelmach, Mr. Buller and Ms. Roepke) has been elected by shareholders and each Trustee and officer holds office until his or her successor is chosen and qualified or until his or her earlier death, resignation, retirement or removal. The Trust does not hold annual meetings for the purpose of electing Trustees, and Trustees are not elected for fixed terms. Messrs. Butler, Kavanaugh, Uek and Mses. Thomsen and Roepke are members of the Trust’s Audit Committee.
Each of the Fund’s Trustees and officers holds comparable positions with certain other funds of which MFS or a subsidiary is the investment adviser or distributor, and, in the case of the officers, with certain affiliates of MFS. As of February 1, 2015, the Trustees served as board members of 135 funds within the MFS Family of Funds.
24
MFS Inflation-Adjusted Bond Portfolio
Trustees and Officers – continued
The Statement of Additional Information for the Fund includes further information about the Trustees and is available without charge upon request by calling 1-800-225-2606.
| | |
Investment Adviser Massachusetts Financial Services Company 111 Huntington Avenue Boston, MA 02199-7618 | | Custodian State Street Bank and Trust Company 1 Lincoln Street Boston, MA 02111-2900 |
Distributor MFS Fund Distributors, Inc. 111 Huntington Avenue Boston, MA 02199-7618 | | Independent Registered Public Accounting Firm Deloitte & Touche LLP 200 Berkeley Street Boston, MA 02116 |
Portfolio Manager Erik Weisman | | |
25
MFS Inflation-Adjusted Bond Portfolio
BOARD REVIEW OF INVESTMENT ADVISORY AGREEMENT
The Investment Company Act of 1940 requires that both the full Board of Trustees and a majority of the non-interested (“independent”) Trustees, voting separately, annually approve the continuation of the Fund’s investment advisory agreement with MFS. The Trustees consider matters bearing on the Fund and its advisory arrangements at their meetings throughout the year, including a review of performance data at each regular meeting. In addition, the independent Trustees met several times over the course of three months beginning in May and ending in July, 2014 (“contract review meetings”) for the specific purpose of considering whether to approve the continuation of the investment advisory agreement for the Fund and the other investment companies that the Board oversees (the “MFS Funds”). The independent Trustees were assisted in their evaluation of the Fund’s investment advisory agreement by independent legal counsel, from whom they received separate legal advice and with whom they met separately from MFS during various contract review meetings. The independent Trustees were also assisted in this process by the MFS Funds’ Independent Chief Compliance Officer, a full-time senior officer appointed by and reporting to the independent Trustees.
In connection with their deliberations regarding the continuation of the investment advisory agreement, the Trustees, including the independent Trustees, considered such information and factors as they believed, in light of the legal advice furnished to them and their own business judgment, to be relevant. The investment advisory agreement for the Fund was considered separately, although the Trustees also took into account the common interests of all MFS Funds in their review. As described below, the Trustees considered the nature, quality, and extent of the various investment advisory, administrative, and shareholder services performed by MFS under the existing investment advisory agreement and other arrangements with the Fund.
In connection with their contract review meetings, the Trustees received and relied upon materials that included, among other items: (i) information provided by Lipper Inc., an independent third party, on the investment performance of the Fund for various time periods ended December 31, 2013 and the investment performance of a group of funds with substantially similar investment classifications/objectives (the “Lipper performance universe”), (ii) information provided by Lipper Inc. on the Fund’s advisory fees and other expenses and the advisory fees and other expenses of comparable funds identified by Lipper Inc. (the “Lipper expense group”), (iii) information provided by MFS on the advisory fees of comparable portfolios of other clients of MFS, including institutional separate accounts and other clients, (iv) information as to whether and to what extent applicable expense waivers, reimbursements or fee “breakpoints” are observed for the Fund, (v) information regarding MFS’ financial results and financial condition, including MFS’ and certain of its affiliates’ estimated profitability from services performed for the Fund and the MFS Funds as a whole, and compared to MFS’ institutional business, (vi) MFS’ views regarding the outlook for the mutual fund industry and the strategic business plans of MFS, (vii) descriptions of various functions performed by MFS for the Funds, such as compliance monitoring and portfolio trading practices, and (viii) information regarding the overall organization of MFS, including information about MFS’ senior management and other personnel providing investment advisory, administrative and other services to the Fund and the other MFS Funds. The comparative performance, fee and expense information prepared and provided by Lipper Inc. was not independently verified and the independent Trustees did not independently verify any information provided to them by MFS.
Prior to the close of business on December 7, 2012, the Fund was a series of Sun Capital Advisers Trust and was advised by Sun Capital Advisers LLC, an affiliate of MFS, and subadvised by BlackRock Financial Management, Inc. Following shareholder approval, MFS became the investment adviser of the Fund and assumed day-to-day investment management responsibilities for the Fund effective as of the close of business on December 7, 2012.
The Trustees’ conclusion as to the continuation of the investment advisory agreement was based on a comprehensive consideration of all information provided to the Trustees and not the result of any single factor. Some of the factors that figured particularly in the Trustees’ deliberations are described below, although individual Trustees may have evaluated the information presented differently from one another, giving different weights to various factors. It is also important to recognize that the fee arrangements for the Fund and other MFS Funds are the result of years of review and discussion between the independent Trustees and MFS, that certain aspects of such arrangements may receive greater scrutiny in some years than in others, and that the Trustees’ conclusions may be based, in part, on their consideration of these same arrangements during the course of the year and in prior years.
Based on information provided by Lipper Inc. and MFS, the Trustees reviewed the Fund’s total return investment performance as well as the performance of peer groups of funds over various time periods. The Trustees placed particular emphasis on the total return performance of the Fund’s Initial Class shares in comparison to the performance of funds in its Lipper performance universe over the three-year period ended December 31, 2013, which the Trustees believed was a long enough period to reflect differing market conditions. The total return performance of the Fund’s Initial Class shares was in the 1st quintile relative to the other funds in the universe for this three-year period (the 1st quintile being the best performers and the 5th quintile being the worst performers). The total return performance of the Fund’s Initial Class shares was in the 1st quintile for the one-year period and the 3rd quintile for the five-year period ended December 31, 2013 relative to the Lipper performance universe. Because of the passage of time, these performance results may differ from the performance results for more recent periods, including those shown elsewhere in this report.
26
MFS Inflation-Adjusted Bond Portfolio
Board Review of Investment Advisory Agreement – continued
In addition to considering the performance information provided in connection with the contract review meetings, the Trustees noted that, in light of the Fund’s substandard relative performance at the time of their contract review meetings in 2013, they had met at each of their regular meetings since then with MFS’ senior investment management personnel to discuss the Fund’s performance and MFS’ efforts to improve the Fund’s performance. The Trustees further noted that MFS became the Fund’s investment adviser in December 2012 and that the Fund’s three-year performance as compared to its benchmark improved for the period ended December 31, 2013, as compared to the prior year. Taking this information into account, the Trustees concluded, within the context of their overall conclusions regarding the investment advisory agreement, that they were satisfied with MFS’ responses and efforts relating to investment performance.
In assessing the reasonableness of the Fund’s advisory fee, the Trustees considered, among other information, the Fund’s advisory fee and the total expense ratio of the Fund’s Initial Class shares as a percentage of average daily net assets and the advisory fee and total expense ratios of peer groups of funds based on information provided by Lipper Inc. The Trustees considered that, according to the Lipper data (which takes into account any fee reductions or expense limitations that were in effect during the Fund’s last fiscal year), the Fund’s effective advisory fee rate and total expense ratio were each approximately at the Lipper expense group median.
The Trustees also considered the advisory fees charged by MFS to any comparable institutional accounts. In comparing these fees, the Trustees considered information provided by MFS as to the generally broader scope of services provided by MFS to the Fund in comparison to institutional accounts, the higher demands placed on MFS’ investment personnel and trading infrastructure as a result of the daily cash in-flows and out-flows of the Fund, and the impact on MFS and expenses associated with the more extensive regulatory regime to which the Fund is subject in comparison to institutional accounts.
The Trustees also considered whether the Fund may benefit from any economies of scale in the management of the Fund in the event of growth in assets of the Fund and/or growth in assets of the MFS Funds as a whole. They noted that the Fund’s advisory fee rate schedule is not subject to any breakpoints. Taking into account the Fund’s lower total expense ratio under MFS’ management, effective as of the close of business on December 7, 2012, the Trustees determined not to recommend any advisory fee breakpoints for the Fund at this time. The Trustees also noted that MFS has agreed in writing to waive a portion of the management fees of certain MFS Funds, including the Fund, if the total combined assets of certain funds within the MFS Funds’ complex increase above agreed upon thresholds (the “group fee waiver”), enabling the Fund’s shareholders to share in the benefits from any economies of scale at the complex level. The group fee waiver is reviewed and renewed annually between the Board and MFS. The Trustees concluded that the group fee waiver was sufficient to allow the Fund to benefit from economies of scale as its assets and overall complex assets grow.
The Trustees also considered information prepared by MFS relating to MFS’ costs and profits with respect to the Fund, the MFS Funds considered as a group, and other investment companies and accounts advised by MFS, as well as MFS’ methodologies used to determine and allocate its costs to the MFS Funds, the Fund and other accounts and products for purposes of estimating profitability.
After reviewing these and other factors described herein, the Trustees concluded, within the context of their overall conclusions regarding the investment advisory agreement, that the advisory fees charged to the Fund represent reasonable compensation in light of the services being provided by MFS to the Fund.
In addition, the Trustees considered MFS’ resources and related efforts to continue to retain, attract and motivate capable personnel to serve the Fund. The Trustees also considered current and developing conditions in the financial services industry, including the presence of large and well-capitalized companies which are spending, and appear to be prepared to continue to spend, substantial sums to engage personnel and to provide services to competing investment companies. In this regard, the Trustees also considered the financial resources of MFS and its ultimate parent, Sun Life Financial Inc. The Trustees also considered the advantages and possible disadvantages to the Fund of having an adviser that also serves other investment companies as well as other accounts.
The Trustees also considered the nature, quality, cost, and extent of administrative, transfer agency, and distribution services provided to the Fund by MFS and its affiliates under agreements and plans other than the investment advisory agreement, including any 12b-1 fees the Fund pays to MFS Fund Distributors, Inc., an affiliate of MFS. The Trustees also considered the nature, extent and quality of certain other services MFS performs or arranges for on the Fund’s behalf, which may include securities lending programs, directed expense payment programs, class action recovery programs, and MFS’ interaction with third-party service providers, principally custodians and sub-custodians. The Trustees concluded that the various non-advisory services provided by MFS and its affiliates on behalf of the Fund were satisfactory.
The Trustees also considered benefits to MFS from the use of the Fund’s portfolio brokerage commissions, if applicable, to pay for investment research and various other factors. Additionally, the Trustees considered so-called “fall-out benefits” to MFS such as reputational value derived from serving as investment manager to the Fund.
Based on their evaluation of factors that they deemed to be material, including those factors described above, the Board of Trustees, including the independent Trustees, concluded that the Fund’s investment advisory agreement with MFS should be continued for an additional one-year period, commencing August 1, 2014.
27
MFS Inflation-Adjusted Bond Portfolio
PROXY VOTING POLICIES AND INFORMATION
MFS votes proxies on behalf of the fund pursuant to proxy voting policies and procedures that are available without charge, upon request, by calling 1-800-225-2606, by visiting the Proxy Voting section of mfs.com or by visiting the SEC’s Web site at http://www.sec.gov.
Information regarding how the fund voted proxies relating to portfolio securities during the most recent twelve-month period ended June 30 is available without charge by visiting the Proxy Voting section of mfs.com or by visiting the SEC’s Web site at http://www.sec.gov.
QUARTERLY PORTFOLIO DISCLOSURE
The fund will file a complete schedule of portfolio holdings with the Securities and Exchange Commission (the Commission) for the first and third quarters of each fiscal year on Form N-Q. The fund’s Form N-Q is available on the EDGAR database on the Commission’s Internet Web site at http://www.sec.gov, and may be reviewed and copied at the:
Public Reference Room
Securities and Exchange Commission
100 F Street, NE, Room 1580
Washington, D.C. 20549
Information on the operation of the Public Reference Room may be obtained by calling the Commission at 1-800-SEC-0330. Copies of the fund’s Form N-Q also may be obtained, upon payment of a duplicating fee, by electronic request at the following e-mail address: publicinfo@sec.gov or by writing the Public Reference Section at the above address.
FURTHER INFORMATION
From time to time, MFS may post important information about the fund or the MFS funds on the MFS web site (mfs.com). This information is available by visiting the “Market Commentary” and “Announcements” sub sections in the “Market Outlooks” section of mfs.com or by clicking on the fund’s name under “Variable Insurance Portfolios — VIT III” in the “Products” section of mfs.com.
28
rev. 3/11
| | | | |
| FACTS | | WHAT DOES MFS DO WITH YOUR
PERSONAL INFORMATION? | |  |
| | |
| Why? | | Financial companies choose how they share your personal information. Federal law gives consumers the right to limit some but not all sharing. Federal law also requires us to tell you how we collect, share, and protect your personal information. Please read this notice carefully to understand what we do. |
| | |
| What? | | The types of personal information we collect and share depend on the product or service you have with us. This information can include: • Social Security number and account balances • Account transactions and transaction history • Checking account information and wire transfer instructions When you are no longer our customer, we continue to share your information as described in this notice. |
| | |
| How? | | All financial companies need to share customers’ personal information to run their everyday business. In the section below, we list the reasons financial companies can share their customers’ personal information; the reasons MFS chooses to share; and whether you can limit this sharing. |
| | | | |
Reasons we can share your
personal information | | Does MFS share? | | Can you limit this
sharing? |
For our everyday business purposes – such as to process your transactions, maintain your account(s), respond to court orders and legal investigations, or report to credit bureaus | | Yes | | No |
For our marketing purposes – to offer our products and services to you | | No | | We don’t share |
| For joint marketing with other financial companies | | No | | We don’t share |
For our affiliates’ everyday business purposes – information about your transactions and experiences | | No | | We don’t share |
For our affiliates’ everyday business purposes – information about your creditworthiness | | No | | We don’t share |
| For nonaffiliates to market to you | | No | | We don’t share |
| | |
| Questions? | | Call 800-225-2606 or go to mfs.com. |
29
| | |
| Who we are |
| Who is providing this notice? | | MFS Funds, MFS Investment Management, MFS Institutional Advisors, Inc., MFS Fund Distributors, Inc., MFS Heritage Trust Company, and MFS Service Center, Inc. |
| | |
| What we do |
| How does MFS protect my personal information? | | To protect your personal information from unauthorized access and use, we use security measures that comply with federal law. These measures include procedural, electronic, and physical safeguards for the protection of the personal information we collect about you. |
How does MFS
collect my personal information? | | We collect your personal information, for example, when you • open an account or provide account information • direct us to buy securities or direct us to sell your securities • make a wire transfer We also collect your personal information from others, such as credit bureaus, affiliates and other companies. |
| Why can’t I limit all sharing? | | Federal law gives you the right to limit only • sharing for affiliates’ everyday business purposes – information about your creditworthiness • affiliates from using your information to market to you • sharing for nonaffiliates to market to you State laws and individual companies may give you additional rights to limit sharing. |
| | |
| Definitions |
| Affiliates | | Companies related by common ownership or control. They can be financial and nonfinancial companies. •MFS does not share personal information with affiliates, except for everyday business purposes as described on page one of this notice. |
| Nonaffiliates | | Companies not related by common ownership or control. They can be financial and nonfinancial companies. •MFS does not share with nonaffiliates so they can market to you. |
| Joint Marketing | | A formal agreement between nonaffiliated financial companies that together market financial products or services to you. •MFS doesn’t jointly market. |
| | |
| Other important information |
| If you own an MFS product or receive an MFS service in the name of a third party such as a bank or broker-dealer, their privacy policy may apply to you instead of ours. |
30
ANNUAL REPORT
December 31, 2014

MFS® LIMITED
MATURITY PORTFOLIO
MFS® Variable Insurance Trust III

VLT-ANN
MFS® LIMITED MATURITY PORTFOLIO
CONTENTS
The report is prepared for the general information of contract owners. It is authorized for distribution to prospective investors only when preceded or accompanied by a current prospectus.
NOT FDIC INSURED Ÿ MAY LOSE VALUE Ÿ NO BANK OR CREDIT UNION GUARANTEE Ÿ NOT A DEPOSIT Ÿ NOT INSURED BY ANY FEDERAL GOVERNMENT AGENCY OR NCUA/NCUSIF
MFS Limited Maturity Portfolio
LETTER FROM THE CHAIRMAN

Dear Contract Owners:
As 2015 begins, sharply lower oil prices are reshaping the global economy, adding to deflationary pressures in the eurozone and exacerbating challenges faced by oil exporters such as Russia. The U.S. economy stands on firmer ground, having expanded steadily over the past year. The U.S. labor market has regained momentum, consumer confidence is buoyant and gasoline prices have tumbled, boosting prospects for a stronger economic rebound in 2015.
Other regions are struggling. The eurozone economy is barely expanding, and the European Central Bank (ECB) has introduced large-scale asset purchases.
Despite Japan’s efforts to strengthen its economy, its sales tax increase last spring tipped the country into a recession, leading to additional monetary stimulus from the Bank of Japan. China’s economy is slowing as it transitions to a more sustainable basis, and its growth rate will likely continue to decline.
As always, active risk management is integral to how we at MFS® manage your investments. We use a collaborative process, sharing insights across asset classes, regions and economic sectors. Our global investment team uses a diversified, multidisciplined, long-term approach.
Applying proven principles, such as asset allocation and diversification, can best serve investors over the long term. We are confident that this approach can help you as you work with your financial advisors to reach your goals in the years ahead.
Respectfully,

Robert J. Manning
Chairman
MFS Investment Management
February 13, 2015
The opinions expressed in this letter are subject to change and may not be relied upon for investment advice. No forecasts can be guaranteed.
1
MFS Limited Maturity Portfolio
PORTFOLIO COMPOSITION
Portfolio structure (i)
| | | | |
| Fixed income sectors (i) | | | | |
| Investment Grade Corporates | | | 71.6% | |
| Asset-Backed Securities | | | 9.2% | |
| Non-U.S. Government Bonds | | | 8.0% | |
| Mortgage-Backed Securities | | | 3.8% | |
| U.S. Government Agencies | | | 2.0% | |
| Municipal Bonds | | | 1.6% | |
| Emerging Markets Bonds | | | 1.6% | |
| Commercial Mortgage-Backed Securities | | | 0.9% | |
| Collateralized Debt Obligations | | | 0.8% | |
| Residential Mortgage-Backed Securities | | | 0.4% | |
| U.S. Treasury Securities | | | (1.8)% | |
| | | | |
| Composition including fixed income credit quality (a)(i) | |
| AAA | | | 19.2% | |
| AA | | | 12.5% | |
| A | | | 36.9% | |
| BBB | | | 25.4% | |
| Federal Agencies | | | 5.8% | |
| Not Rated | | | (1.7)% | |
| Cash & Other | | | 1.9% | |
| |
| Portfolio facts (i) | | | | |
| Average Duration (d) | | | 1.4 | |
| Average Effective Maturity (m) | | | 2.0 yrs. | |
| |
| Issuer country weightings (i)(x) | | | | |
| United States | | | 60.7% | |
| United Kingdom | | | 5.9% | |
| France | | | 4.0% | |
| Netherlands | | | 3.9% | |
| Norway | | | 3.7% | |
| Australia | | | 3.5% | |
| Japan | | | 3.5% | |
| Sweden | | | 3.3% | |
| Canada | | | 2.7% | |
| Other Countries | | | 8.8% | |
| (a) | | For all securities other than those specifically described below, ratings are assigned to underlying securities utilizing ratings from Moody’s, Fitch, and Standard & Poor’s rating agencies and applying the following hierarchy: If all three agencies provide a rating, the middle rating (after dropping the highest and lowest ratings) is assigned; if two of the three agencies rate a security, the lower of the two is assigned. Ratings are shown in the S&P and Fitch scale (e.g., AAA). Securities rated BBB or higher are considered investment grade. All ratings are subject to change. Federal Agencies includes rated and unrated U.S. Agency fixed-income securities, U.S. Agency mortgage-backed securities, and collateralized mortgage obligations of U.S. Agency mortgage-backed securities. Not Rated includes fixed income securities, including fixed income futures contracts, which have not been rated by any rating agency. The fund may not hold all of these instruments. The fund is not rated by these agencies. |
| (d) | | Duration is a measure of how much a bond’s price is likely to fluctuate with general changes in interest rates, e.g., if rates rise 1.00%, a bond with a 5-year duration is likely to lose about 5.00% of its value due to the interest rate move. |
| (i) | | For purposes of this presentation, the components include the value of securities, and reflect the impact of the equivalent exposure of derivative positions, if any. These amounts may be negative from time to time. Equivalent exposure is a calculated amount that translates the derivative position into a reasonable approximation of the amount of the underlying asset that the portfolio would have to hold at a given point in time to have the same price sensitivity that results from the portfolio’s ownership of the derivative contract. When dealing with derivatives, equivalent exposure is a more representative measure of the potential impact of a position on portfolio performance than value. The bond component will include any accrued interest amounts. |
| (m) | | In determining an instrument’s effective maturity for purposes of calculating the fund’s dollar-weighted average effective maturity, MFS uses the instrument’s stated maturity or, if applicable, an earlier date on which MFS believes it is probable that a maturity-shortening device (such as a put, pre-refunding or prepayment) will cause the instrument to be repaid. Such an earlier date can be substantially shorter than the instrument’s stated maturity. |
| (x) | | Represents the portfolio’s exposure to issuer countries as a percentage of a portfolio’s net assets. For purposes of this presentation, United States includes Cash & Other. |
Where the fund holds convertible bonds, these are treated as part of the equity portion of the portfolio.
Cash & Other can include cash, other assets less liabilities, offsets to derivative positions, and short-term securities.
Percentages are based on net assets as of 12/31/14.
The portfolio is actively managed and current holdings may be different.
2
MFS Limited Maturity Portfolio
MANAGEMENT REVIEW
Summary of Results
For the twelve months ended December 31, 2014, Initial Class shares of the MFS Limited Maturity Portfolio (“fund”) provided a total return of 0.80%, while Service Class shares of the fund provided a total return of 0.49%. These compare with a return of 0.77% over the same period for the fund’s benchmark, the Barclays 1-3 Year U.S. Government/Credit Bond Index.
Market Environment
Early in the period, US equities suffered what proved to be a temporary setback due to concerns over emerging markets as well as what was perceived at the time to be a pause in US economic growth, partially caused by extreme weather events and a weak December 2013 labor market report. Markets soon recovered as the economic pause concluded and investors appeared to have become increasingly comfortable that newly-installed US Federal Reserve (“Fed”) Chair Janet Yellen would not make any substantial changes to the trajectory of Fed monetary policy.
A generally risk-friendly, carry trade environment persisted from February 2014 until mid-year. While geopolitical tensions flared in the Middle East and Russia/Ukraine, any market setbacks were short-lived as improving economic growth in the US, coupled with prospects for easier monetary policy in regions with slowing growth, such as Japan, Europe and China, supported risk assets. For example, the European Central Bank (“ECB”) cut policy interest rates into negative territory and, by the end of the period, expectations were for additional rate cuts and the announcement for non-conventional easing measures. Similarly, the Bank of Japan surprised markets late in the period with fresh stimulus measures given lackluster growth trends. The related decline in developed market government bond yields and credit spreads were also supportive for equity markets. At the end of the period, the US equity market was trading close to all-time highs and US Treasury yields were close to their lows for the period. However, credit markets did not fare as well in the second half of 2014, particularly US high yield and emerging market debt. The higher weightings of oil and gas credits in these asset classes resulted in widening spreads and increased volatility as oil prices began to decline in an accelerated fashion in the fourth quarter.
Factors Affecting Performance
During the reporting period, the fund’s greater exposure to “A” and “BBB” rated (r) securities detracted from performance relative to the Barclays 1-3 Year U.S. Government/Credit Bond Index.
On the positive side, strong bond selection and a greater exposure to both the financial and industrial sectors contributed to relative returns.
Respectfully,
James Calmas
Portfolio Manager
| (r) | Bonds rated “BBB”, “Baa”, or higher are considered investment grade; bonds rated “BB”, “Ba”, or below are considered non-investment grade. The source for bond quality ratings is Moody’s Investors Service, Standard & Poor’s and Fitch, Inc. and are applied using the following hierarchy: If all three agencies provide a rating, the middle rating (after dropping the highest and lowest ratings) is assigned; if two of the three agencies rate a security, the lower of the two is assigned. Ratings are shown in the S&P and Fitch scale (e.g., AAA). For securities which are not rated by any of the three agencies, the security is considered Not Rated. |
The views expressed in this report are those of the portfolio manager only through the end of the period of the report as stated on the cover and do not necessarily reflect the views of MFS or any other person in the MFS organization. These views are subject to change at any time based on market or other conditions, and MFS disclaims any responsibility to update such views. These views may not be relied upon as investment advice or an indication of trading intent on behalf of any MFS portfolio. References to specific securities are not recommendations of such securities, and may not be representative of any MFS portfolio’s current or future investments.
3
MFS Limited Maturity Portfolio
PERFORMANCE SUMMARY THROUGH 12/31/14
The following chart illustrates the historical performance of the fund in comparison to its benchmark(s). Benchmarks are unmanaged and may not be invested in directly. Benchmark returns do not reflect any fees or expenses. The performance of other share classes will be greater than or less than that of the class depicted below. (See Notes to Performance Summary.)
Performance data shown represents past performance and is no guarantee of future results. Investment return and principal value fluctuate so your units, when sold, may be worth more or less than the original cost; current performance may be lower or higher than quoted. The performance shown does not reflect the deduction of taxes, if any, that a contract holder would pay on fund distributions or the redemption of contract units. The returns for the fund shown also do not reflect the deduction of expenses associated with variable products, such as mortality and expense risk charges, separate account charges, and sales charges imposed by the insurance company separate accounts. Such expenses would reduce the overall returns shown.
Growth of a Hypothetical $10,000 Investment (t)
Total Returns through 12/31/14
Average annual total returns
| | | | | | | | | | | | |
| | | Share Class | | Class inception date | | 1-yr | | 5-yr | | Life (t) | | |
| | | Initial Class | | 3/07/08 | | 0.80% | | 1.34% | | 2.00% | | |
| | | Service Class | | 3/07/08 | | 0.49% | | 1.06% | | 1.73% | | |
| | | | |
| Comparative benchmark | | | | | | | | |
| | | Barclays 1-3 Year U.S. Government/Credit Bond Index (f) | | 0.77% | | 1.41% | | 1.92% | | |
| (f) | Source: FactSet Research Systems Inc. |
| (t) | For the period from the class inception date through the stated period end. (See Notes to Performance Summary.) |
Benchmark Definition
Barclays 1-3 Year U.S. Government/Credit Bond Index – a market capitalization-weighted index that measures the performance of the short-term (1 to 3 years) investment-grade corporate and U.S. government bond markets.
It is not possible to invest directly in an index.
Notes to Performance Summary
Average annual total return represents the average annual change in value for each share class for the periods presented. Life returns are presented where the share class has less than 10 years of performance history and represent the average annual total return from the class inception date to the stated period end date.
Performance results reflect any applicable expense subsidies and waivers in effect during the periods shown. Without such subsidies and waivers the fund’s performance results would be less favorable. Please see the prospectus and financial statements for complete details. All results are historical and assume the reinvestment of any dividends and capital gains distributions.
Performance prior to close of business December 7, 2012, reflects time periods when another adviser or subadviser was responsible for selecting investments for the fund under a different investment objective and different investment strategies.
4
MFS Limited Maturity Portfolio
Performance Summary – continued
Performance results do not include adjustments made for financial reporting purposes in accordance with U.S. generally accepted accounting principles and may differ from amounts reported in the financial highlights.
From time to time the fund may receive proceeds from litigation settlements, without which performance would be lower.
5
MFS Limited Maturity Portfolio
EXPENSE TABLE
Fund Expenses Borne by the Contract Holders During the Period,
July 1, 2014 through December 31, 2014
As a contract holder of the fund, you incur ongoing costs, including management fees; distribution and/or service (12b-1) fees; and other fund expenses. This example is intended to help you understand your ongoing costs (in dollars) of investing in the fund and to compare these costs with the ongoing costs of investing in other mutual funds.
The example is based on an investment of $1,000 invested at the beginning of the period and held for the entire period July 1, 2014 through December 31, 2014.
Actual Expenses
The first line for each share class in the following table provides information about actual account values and actual expenses. You may use the information in this line, together with the amount you invested, to estimate the expenses that you paid over the period. Simply divide your account value by $1,000 (for example, an $8,600 account value divided by $1,000 = 8.6), then multiply the result by the number in the first line under the heading entitled “Expenses Paid During Period” to estimate the expenses you paid on your account during this period.
Hypothetical Example for Comparison Purposes
The second line for each share class in the following table provides information about hypothetical account values and hypothetical expenses based on the fund’s actual expense ratio and an assumed rate of return of 5% per year before expenses, which is not the fund’s actual return. The hypothetical account values and expenses may not be used to estimate the actual ending account balance or expenses you paid for the period. You may use this information to compare the ongoing costs of investing in the fund and other funds. To do so, compare this 5% hypothetical example with the 5% hypothetical examples that appear in the shareholder reports of the other funds.
Please note that the expenses shown in the table are meant to highlight the fund’s ongoing costs only and do not take into account the fees and expenses imposed under the variable contracts through which your investment in the fund is made. Therefore, the second line for each share class in the table is useful in comparing ongoing costs associated with an investment in vehicles (such as the fund) which fund benefits under variable annuity and variable life insurance contracts and to qualified pension and retirement plans only, and will not help you determine the relative total costs of investing in the fund through variable annuity and variable life insurance contracts. If the fees and expenses imposed under the variable contracts were included, your costs would have been higher.
| | | | | | | | | | | | | | | | | | |
| Share Class | | | | Annualized
Expense Ratio | | | Beginning Account Value
7/01/14 | | | Ending Account Value
12/31/14 | | | Expenses Paid
During Period (p)
7/01/14-12/31/14 | |
| Initial Class | | Actual | | | 0.43% | | | | $1,000.00 | | | | $999.31 | | | | $2.17 | |
| | Hypothetical (h) | | | 0.43% | | | | $1,000.00 | | | | $1,023.04 | | | | $2.19 | |
| Service Class | | Actual | | | 0.68% | | | | $1,000.00 | | | | $998.09 | | | | $3.42 | |
| | Hypothetical (h) | | | 0.68% | | | | $1,000.00 | | | | $1,021.78 | | | | $3.47 | |
| (h) | 5% class return per year before expenses. |
| (p) | “Expenses Paid During Period” are equal to each class’s annualized expense ratio, as shown above, multiplied by the average account value over the period, multiplied by 184/365 (to reflect the one-half year period). |
6
MFS Limited Maturity Portfolio
PORTFOLIO OF INVESTMENTS – 12/31/14
The Portfolio of Investments is a complete list of all securities owned by your fund. It is categorized by broad-based asset classes.
| | | | | | | | |
| Issuer | | Shares/Par | | | Value ($) | |
| | | | | | | | |
| BONDS – 99.4% | | | | | | | | |
| Asset-Backed & Securitized – 11.2% | | | | | |
| AmeriCredit Automobile Receivables Trust, “A2”, 0.74%, 11/08/16 | | $ | 1,025,659 | | | $ | 1,025,908 | |
| AmeriCredit Automobile Receivables Trust, 2014-2, “A2B”, FRN, 0.437%, 10/10/17 | | | 2,490,000 | | | | 2,489,243 | |
| ARI Fleet Lease Trust, “A2”, 0.81%, 11/15/22 (n) | | | 1,630,000 | | | | 1,628,833 | |
| Babson Ltd., CLO, “A1”, FRN, 0.455%, 1/18/21 (z) | | | 1,457,497 | | | | 1,455,510 | |
| Bank of America Auto Trust, “A-3”, 0.78%, 6/15/16 | | | 759,511 | | | | 759,608 | |
| BMW Vehicle Lease Trust, “A2”, 0.45%, 3/21/16 | | | 2,568,128 | | | | 2,567,714 | |
| Capital Auto Receivables Asset Trust, 2013-4, “A1”, FRN, 0.545%, 3/21/16 | | | 2,680,063 | | | | 2,679,945 | |
| Carmax Auto Owner Trust, 2014-4, “A2A”, 0.67%, 2/15/18 | | | 3,360,000 | | | | 3,356,294 | |
| Cent CDO XI Ltd., “A1”, FRN, 0.493%, 4/25/19 (n) | | | 2,270,881 | | | | 2,247,277 | |
| Chesapeake Funding LLC, “A”, FRN, 0.607%, 1/07/25 (n) | | | 2,807,932 | | | | 2,805,284 | |
| Chrysler Capital Auto Receivables Trust, 2013-AA, “A2”, 0.61%, 11/15/16 (n) | | | 1,159,660 | | | | 1,159,827 | |
| Citigroup/Deutsche Bank Commercial Mortgage Trust, 5.322%, 12/11/49 | | | 1,005,000 | | | | 1,063,930 | |
| CNH Equipment Trust, “A2”, 0.63%, 6/15/16 | | | 2,810,000 | | | | 2,808,626 | |
| CNH Equipment Trust, “A2”, 0.63%, 1/17/17 | | | 805,410 | | | | 805,611 | |
| CNH Wholesale Master Note Trust, “A”, FRN, 0.76%, 8/15/19 (n) | | | 4,280,000 | | | | 4,289,536 | |
| Credit Suisse Commercial Mortgage Trust, “A4”, FRN, 5.898%, 9/15/39 | | | 1,481,614 | | | | 1,593,440 | |
| CWCapital Cobalt Ltd., “A4”, FRN, 5.765%, 5/15/46 | | | 1,718,154 | | | | 1,864,762 | |
| DT Auto Owner Trust, 0.98%, 4/16/18 (n) | | | 2,900,000 | | | | 2,898,246 | |
| Education Loan Asset-Backed Trust, “A-1”, FRN, 0.619%, 6/25/22 (z) | | | 117,920 | | | | 117,924 | |
| Enterprise Fleet Financing LLC, 2014-1, “A2”, 0.87%, 9/20/19 (n) | | | 3,795,513 | | | | 3,794,086 | |
| FDIC Stuctured Sale Guaranteed Notes, “1-A”, FRN, 0.719%, 2/25/48 (n) | | | 531,112 | | | | 531,313 | |
| Ford Credit Auto Owner Trust, 2014-1,“A”, 2.26%, 11/15/25 (n) | | | 1,104,000 | | | | 1,109,932 | |
| Ford Credit Auto Owner Trust, 2014-2,“A”, 2.31%, 4/15/26 (n) | | | 3,515,000 | | | | 3,524,097 | |
| Ford Credit Floorplan Master Owner Trust, “A”, 1.92%, 1/15/19 | | | 2,310,000 | | | | 2,336,071 | |
| GE Dealer Floorplan Master Note Trust, 2014-1, “A”, FRN, 0.545%, 7/20/19 | | | 3,210,000 | | | | 3,206,899 | |
| GE Equipment Small Ticket LLC, “A2”, 0.73%, 1/25/16 (n) | | | 465,852 | | | | 466,251 | |
| | | | | | | | |
| Issuer | | Shares/Par | | | Value ($) | |
| | | | | | | | |
| BONDS – continued | | | | | | | | |
| Asset-Backed & Securitized – continued | | | | | |
| GE Equipment Transportation LLC, 2013-2, “A2”, 0.61%, 6/24/16 | | $ | 2,494,480 | | | $ | 2,496,144 | |
| GM Financial Automobile Leasing Trust, 2014-2A, “A2”, 0.73%, 2/20/17 (n) | | | 3,130,000 | | | | 3,131,315 | |
| Hertz Fleet Lease Funding LP, 2013-3, “A”, FRN, 0.711%, 12/10/27 (n) | | | 4,460,000 | | | | 4,461,699 | |
| HLSS Servicer Advance Receivables Trust, 2014-T1, “A1”, 1.243%, 1/17/45 (n) | | | 1,400,000 | | | | 1,400,000 | |
| Honda Auto Receivables Owner Trust, “A2”, 0.54%, 1/15/16 | | | 888,627 | | | | 888,669 | |
| Hyundai Auto Lease Securitization Trust, “A2”, 0.75%, 3/15/16 (n) | | | 1,821,499 | | | | 1,822,468 | |
| Hyundai Auto Receivables Trust, “A-3”, 0.62%, 9/15/16 | | | 649,510 | | | | 649,734 | |
| John Deere Owner Trust, “A2”, 0.55%, 1/15/16 | | | 272,125 | | | | 272,161 | |
| JPMorgan Chase Commercial Mortgage Securities Corp., 5.42%, 1/15/49 | | | 2,458,474 | | | | 2,625,395 | |
| Kingsland III Ltd., “A1”, CDO, FRN, 0.447%, 8/24/21 (n) | | | 1,226,017 | | | | 1,220,531 | |
| Kubota Credit Owner Trust, “A2”, 0.58%, 2/15/17 (n) | | | 1,630,000 | | | | 1,629,439 | |
| Lanark Master Issuer PLC, “1-A”, FRN, 1.632%, 12/22/54 | | | 3,480,025 | | | | 3,512,194 | |
| Mercedes-Benz Auto Lease Trust, 2013-B, “A2”, 0.53%, 9/15/15 | | | 1,182,329 | | | | 1,182,456 | |
| Motor PLC, “A1”, FRN, 0.649%, 8/25/21 (n) | | | 1,922,816 | | | | 1,922,885 | |
| Race Point CLO Ltd., “A1A”, FRN, 0.432%, 8/01/21 (n) | | | 1,767,799 | | | | 1,757,896 | |
| SLM Student Loan Trust, “A-2”, FRN, 0.433%, 1/25/16 | | | 53,329 | | | | 53,327 | |
| SLM Student Loan Trust, “A-4”, FRN, 0.313%, 10/25/21 | | | 2,292,338 | | | | 2,288,162 | |
| Student Loan Consolidation Center, “A”, FRN, 1.389%, 10/25/27 (n) | | | 1,205,958 | | | | 1,237,694 | |
| Volkswagen Auto Lease Trust, 2014-A, “A2B”, FRN, 0.375%, 10/20/16 | | | 1,494,367 | | | | 1,493,391 | |
| Volkswagen Credit Auto Master Trust, 2014-1A, “A1”, FRN, 0.515%, 7/22/19 (n) | | | 4,620,000 | | | | 4,623,137 | |
| Volvo Financial Equipment LLC, “A2”, 0.53%, 11/16/15 (n) | | | 37,017 | | | | 37,012 | |
| Wheels SPV LLC, 2014-1A, “A2”, 0.84%, 3/20/23 (n) | | | 1,600,000 | | | | 1,600,085 | |
| World Omni Auto Receivables Trust, “A-3”, 0.64%, 2/15/17 | | | 1,445,425 | | | | 1,445,994 | |
| | | | | | | | |
| | | | | | $ | 94,337,955 | |
| | | | | | | | |
| Automotive – 4.1% | | | | | |
| American Honda Finance Corp., 1.6%, 2/16/18 (n) | | $ | 4,500,000 | | | $ | 4,478,090 | |
| American Honda Finance Corp., FRN, 0.609%, 5/26/16 (n) | | | 1,530,000 | | | | 1,532,898 | |
7
MFS Limited Maturity Portfolio
Portfolio of Investments – continued
| | | | | | | | |
| Issuer | | Shares/Par | | | Value ($) | |
| | | | | | | | |
| BONDS – continued | | | | | | | | |
| Automotive – continued | | | | | |
| American Honda Finance Corp., FRN, 0.731%, 10/07/16 | | $ | 2,000,000 | | | $ | 2,008,730 | |
| Daimler Finance North America LLC, 2.4%, 4/10/17 (n) | | | 1,800,000 | | | | 1,837,649 | |
| Daimler Finance North America LLC, FRN, 0.912%, 8/01/16 (n) | | | 3,820,000 | | | | 3,840,349 | |
| Ford Motor Credit Co. LLC, 8%, 12/15/16 | | | 3,500,000 | | | | 3,918,166 | |
| Harley-Davidson Financial Services, 3.875%, 3/15/16 (n) | | | 2,841,000 | | | | 2,932,602 | |
| Nissan Motor Acceptance Corp., FRN, 0.954%, 9/26/16 (n) | | | 3,480,000 | | | | 3,500,090 | |
| Nissan Motor Acceptance Corp., FRN, 0.784%, 3/03/17 (n) | | | 1,890,000 | | | | 1,896,012 | |
| Toyota Motor Credit Corp., FRN, 0.618%, 1/17/19 | | | 3,370,000 | | | | 3,360,611 | |
| Volkswagen Group of America Finance LLC, FRN, 0.602%, 5/23/17 (n) | | | 2,090,000 | | | | 2,083,983 | |
| Volkswagen Group of America Finance LLC, FRN, 0.671%, 11/20/17 (n) | | | 1,080,000 | | | | 1,078,431 | |
| Volkswagen International Finance N.V., 1.125%, 11/18/16 (n) | | | 1,620,000 | | | | 1,618,709 | |
| | | | | | | | |
| | | | | | $ | 34,086,320 | |
| | | | | | | | |
| Banks & Diversified Financials (Covered Bonds) – 3.3% | |
| Australia & New Zealand Banking Group, 1%, 10/06/15 (n) | | $ | 3,800,000 | | | $ | 3,811,408 | |
| Bank of Nova Scotia, 2.15%, 8/03/16 (n) | | | 2,200,000 | | | | 2,241,180 | |
| Bank of Nova Scotia, 1.75%, 3/22/17 (n) | | | 1,200,000 | | | | 1,212,395 | |
| Bank of Scotland PLC, 5.25%, 2/21/17 (n) | | | 3,900,000 | | | | 4,233,064 | |
| DnB Nor Boligkreditt A.S., 2.1%, 10/14/15 (n) | | | 5,000,000 | | | | 5,057,720 | |
| Northern Rock Asset Management, 5.625%, 6/22/17 (n) | | | 2,400,000 | | | | 2,629,706 | |
| Royal Bank of Canada, 1.125%, 7/22/16 | | | 1,450,000 | | | | 1,456,334 | |
| SpareBank 1 Boligkreditt A.S., 2.625%, 5/27/16 (n) | | | 2,900,000 | | | | 2,972,283 | |
| SpareBank 1 Boligkreditt A.S., 2.3%, 6/30/17 (n) | | | 4,100,000 | | | | 4,204,312 | |
| | | | | | | | |
| | | | | | $ | 27,818,402 | |
| | | | | | | | |
| Biotechnology – 0.2% | | | | | |
| Life Technologies Corp., 3.5%, 1/15/16 | | $ | 1,425,000 | | | $ | 1,442,478 | |
| | | | | | | | |
| Broadcasting – 0.2% | | | | | |
| Scripps Networks Interactive, 2.75%, 11/15/19 | | $ | 902,000 | | | $ | 905,775 | |
| SES Global Americas Holdings GP, 2.5%, 3/25/19 (n) | | | 1,141,000 | | | | 1,135,266 | |
| | | | | | | | |
| | | | | | $ | 2,041,041 | |
| | | | | | | | |
| Business Services – 0.5% | | | | | |
| Cisco Systems, Inc., FRN, 0.514%, 3/03/17 | | $ | 3,850,000 | | | $ | 3,850,659 | |
| | | | | | | | |
| Cable TV – 0.7% | | | | | |
| DIRECTV Holdings LLC, 3.5%, 3/01/16 | | $ | 4,875,000 | | | $ | 5,003,057 | |
| NBCUniversal Enterprise Co., FRN, 0.767%, 4/15/16 (n) | | | 1,000,000 | | | | 1,001,805 | |
| | | | | | | | |
| | | | | | $ | 6,004,862 | |
| | | | | | | | |
| | | | | | | | |
| Issuer | | Shares/Par | | | Value ($) | |
| | | | | | | | |
| BONDS – continued | | | | | | | | |
| Chemicals – 0.4% | | | | | |
| CF Industries, Inc., 6.875%, 5/01/18 | | $ | 2,348,000 | | | $ | 2,669,491 | |
| LyondellBasell Industries N.V., 5%, 4/15/19 | | | 950,000 | | | | 1,036,226 | |
| | | | | | | | |
| | | | | | $ | 3,705,717 | |
| | | | | | | | |
| Computer Software – Systems – 0.4% | | | | | |
| Apple, Inc., FRN, 0.482%, 5/03/18 | | $ | 3,030,000 | | | $ | 3,032,033 | |
| | | | | | | | |
| Conglomerates – 1.6% | | | | | |
| ABB Finance (USA), Inc., 1.625%, 5/08/17 | | $ | 930,000 | | | $ | 933,122 | |
| ABB Treasury Center (USA), Inc., 2.5%, 6/15/16 (n) | | | 3,860,000 | | | | 3,937,486 | |
| General Electric Co., 0.85%, 10/09/15 | | | 5,775,000 | | | | 5,790,471 | |
| Pentair Finance S.A., 1.35%, 12/01/15 | | | 2,860,000 | | | | 2,865,105 | |
| | | | | | | | |
| | | | | | $ | 13,526,184 | |
| | | | | | | | |
| Consumer Products – 1.1% | | | | | |
| Mattel, Inc., 1.7%, 3/15/18 | | $ | 1,232,000 | | | $ | 1,216,632 | |
| Newell Rubbermaid, Inc., 2.875%, 12/01/19 | | | 3,470,000 | | | | 3,471,305 | |
| Procter & Gamble Co., 0.75%, 11/04/16 | | | 2,130,000 | | | | 2,130,264 | |
| Reckitt Benckiser PLC, 2.125%, 9/21/18 (n) | | | 2,480,000 | | | | 2,494,000 | |
| | | | | | | | |
| | | | | | $ | 9,312,201 | |
| | | | | | | | |
| Consumer Services – 0.8% | | | | | |
| eBay, Inc., 1.35%, 7/15/17 | | $ | 1,425,000 | | | $ | 1,414,183 | |
| Experian Finance PLC, 2.375%, 6/15/17 (n) | | | 1,788,000 | | | | 1,801,837 | |
| Western Union Co., FRN, 1.231%, 8/21/15 | | | 3,620,000 | | | | 3,631,801 | |
| | | | | | | | |
| | | | | | $ | 6,847,821 | |
| | | | | | | | |
| Electrical Equipment – 0.2% | | | | | |
| Amphenol Corp., 1.55%, 9/15/17 | | $ | 1,230,000 | | | $ | 1,226,663 | |
| Arrow Electronics, Inc., 3%, 3/01/18 | | | 919,000 | | | | 942,377 | |
| | | | | | | | |
| | | | | | $ | 2,169,040 | |
| | | | | | | | |
| Electronics – 1.0% | | | | | |
| Intel Corp., 1.95%, 10/01/16 | | $ | 3,175,000 | | | $ | 3,237,459 | |
| Tyco Electronics Group S.A., 2.375%, 12/17/18 | | | 971,000 | | | | 979,367 | |
| Tyco Electronics Group S.A., FRN, 0.432%, 1/29/16 | | | 3,120,000 | | | | 3,119,108 | |
| Xilinx, Inc., 2.125%, 3/15/19 | | | 1,490,000 | | | | 1,480,427 | |
| | | | | | | | |
| | | | | | $ | 8,816,361 | |
| | | | | | | | |
| Emerging Market Quasi-Sovereign – 0.9% | | | | | |
| CNOOC Finance (2013) Ltd., 1.125%, 5/09/16 | | $ | 2,410,000 | | | $ | 2,401,965 | |
| Korea Development Bank, 1%, 1/22/16 | | | 2,770,000 | | | | 2,766,175 | |
| Petroleos Mexicanos, 3.125%, 1/23/19 | | | 487,000 | | | | 488,218 | |
| State Grid International Development Co. Ltd., 1.75%, 5/22/18 (n) | | | 1,862,000 | | | | 1,826,138 | |
| | | | | | | | |
| | | | | | $ | 7,482,496 | |
| | | | | | | | |
| Energy – Independent – 0.7% | | | | | |
| Anadarko Petroleum Corp., 6.375%, 9/15/17 | | $ | 1,100,000 | | | $ | 1,223,065 | |
| Canadian Natural Resources Ltd., FRN, 0.631%, 3/30/16 | | | 990,000 | | | | 988,236 | |
| Encana Corp., 5.9%, 12/01/17 | | | 2,500,000 | | | | 2,727,095 | |
| Southwestern Energy Co., 7.5%, 2/01/18 | | | 1,220,000 | | | | 1,374,467 | |
| | | | | | | | |
| | | | | | $ | 6,312,863 | |
| | | | | | | | |
8
MFS Limited Maturity Portfolio
Portfolio of Investments – continued
| | | | | | | | |
| Issuer | | Shares/Par | | | Value ($) | |
| | | | | | | | |
| BONDS – continued | | | | | | | | |
| Energy – Integrated – 1.9% | | | | | |
| BG Energy Capital PLC, 2.875%, 10/15/16 (n) | | $ | 2,900,000 | | | $ | 2,973,338 | |
| BP Capital Markets PLC, 3.125%, 10/01/15 | | | 4,350,000 | | | | 4,428,518 | |
| BP Capital Markets PLC, 2.521%, 1/15/20 | | | 1,371,000 | | | | 1,372,603 | |
| Chevron Corp., 0.889%, 6/24/16 | | | 1,170,000 | | | | 1,173,283 | |
| Shell International Finance B.V., FRN, 0.442%, 11/15/16 | | | 3,280,000 | | | | 3,281,161 | |
| Total Capital International S.A., 1.5%, 2/17/17 | | | 2,900,000 | | | | 2,919,418 | |
| | | | | | | | |
| | | | | | $ | 16,148,321 | |
| | | | | | | | |
| Financial Institutions – 0.7% | | | | | |
| General Electric Capital Corp., 2.375%, 6/30/15 | | $ | 2,100,000 | | | $ | 2,120,536 | |
| General Electric Capital Corp., FRN, 0.46%, 1/14/16 | | | 660,000 | | | | 659,997 | |
| LeasePlan Corp. N.V., 2.5%, 5/16/18 (n) | | | 2,949,000 | | | | 2,950,265 | |
| | | | | | | | |
| | | | | | $ | 5,730,798 | |
| | | | | | | | |
| Food & Beverages – 5.7% | | | | | |
| Anheuser-Busch InBev S.A., 0.8%, 1/15/16 | | $ | 2,300,000 | | | $ | 2,304,083 | |
| Coca-Cola Co., 1.15%, 4/01/18 | | | 1,690,000 | | | | 1,670,599 | |
| Coca-Cola Co., FRN, 0.332%, 11/01/16 | | | 1,940,000 | | | | 1,940,683 | |
| Diageo Capital PLC, 1.5%, 5/11/17 | | | 2,000,000 | | | | 2,002,784 | |
| General Mills, Inc., FRN , 0.532%, 1/29/16 | | | 1,650,000 | | | | 1,650,404 | |
| Heineken N.V., 1.4%, 10/01/17 (n) | | | 4,300,000 | | | | 4,275,529 | |
| Ingredion, Inc., 1.8%, 9/25/17 | | | 1,950,000 | | | | 1,944,536 | |
| Kellogg Co., 4.45%, 5/30/16 | | | 690,000 | | | | 725,819 | |
| Kraft Foods Group, Inc., 1.625%, 6/04/15 | | | 2,750,000 | | | | 2,761,897 | |
| Kraft Foods Group, Inc., 6.125%, 8/23/18 | | | 1,800,000 | | | | 2,058,147 | |
| Molson Coors Brewing Co., 2%, 5/01/17 | | | 3,525,000 | | | | 3,554,871 | |
| PepsiCo, Inc., 2.5%, 5/10/16 | | | 2,600,000 | | | | 2,656,867 | |
| Pernod-Ricard S.A., 2.95%, 1/15/17 (n) | | | 4,060,000 | | | | 4,154,192 | |
| SABMiller Holdings, Inc., 1.85%, 1/15/15 (n) | | | 6,850,000 | | | | 6,852,672 | |
| Tyson Foods, Inc., 6.6%, 4/01/16 | | | 3,320,000 | | | | 3,539,804 | |
| Tyson Foods, Inc., 2.65%, 8/15/19 | | | 968,000 | | | | 976,818 | |
| Want Want China Finance Co., 1.875%, 5/14/18 (n) | | | 1,970,000 | | | | 1,927,720 | |
| Wm. Wrigley Jr. Co., 1.4%, 10/21/16 (n) | | | 2,289,000 | | | | 2,291,493 | |
| Wm. Wrigley Jr. Co., 2.4%, 10/21/18 (n) | | | 334,000 | | | | 336,352 | |
| | | | | | | | |
| | | | | | $ | 47,625,270 | |
| | | | | | | | |
| Food & Drug Stores – 0.9% | | | | | |
| CVS Health Corp., 1.2%, 12/05/16 | | $ | 830,000 | | | $ | 832,542 | |
| CVS Health Corp., 5.75%, 6/01/17 | | | 1,333,000 | | | | 1,471,249 | |
| Walgreen Co., 1%, 3/13/15 | | | 3,000,000 | | | | 3,002,874 | |
| Walgreens Boots Alliance, Inc., 1.75%, 11/17/17 | | | 1,910,000 | | | | 1,914,872 | |
| | | | | | | | |
| | | | | | $ | 7,221,537 | |
| | | | | | | | |
| Gaming & Lodging – 0.3% | | | | | |
| Wyndham Worldwide Corp., 2.95%, 3/01/17 | | $ | 2,526,000 | | | $ | 2,579,776 | |
| | | | | | | | |
| Insurance – 2.1% | | | | | |
| American International Group, Inc., 5.85%, 1/16/18 | | $ | 1,226,000 | | | $ | 1,370,791 | |
| | | | | | | | |
| Issuer | | Shares/Par | | | Value ($) | |
| | | | | | | | |
| BONDS – continued | | | | | | | | |
| Insurance – continued | | | | | |
| MetLife Global Funding I, FRN, 0.609%, 4/10/17 (n) | | $ | 4,770,000 | | | $ | 4,782,860 | |
| MetLife, Inc., 1.756%, 12/15/17 | | | 1,875,000 | | | | 1,881,328 | |
| New York Life Global Funding, 3%, 5/04/15 (n) | | | 4,725,000 | | | | 4,766,382 | |
| PRICOA Global Funding I, FRN, 0.501%, 8/19/15 (n) | | | 1,610,000 | | | | 1,611,311 | |
| Prudential Financial, Inc., FRN, 1.012%, 8/15/18 | | | 1,500,000 | | | | 1,509,063 | |
| Voya Financial, Inc., 2.9%, 2/15/18 | | | 1,645,000 | | | | 1,684,074 | |
| | | | | | | | |
| | | | | | $ | 17,605,809 | |
| | | | | | | | |
| Insurance – Property & Casualty – 0.2% | | | | | |
| Marsh & McLennan Cos., Inc., 2.35%, 9/10/19 | | $ | 1,740,000 | | | $ | 1,742,546 | |
| | | | | | | | |
| International Market Quasi-Sovereign – 5.9% | | | | | |
| Bank Nederlandse Gemeenten N.V., 1.375%, 3/19/18 (n) | | $ | 4,000,000 | | | $ | 3,994,656 | |
| Dexia Credit Local S.A., 1.25%, 10/18/16 (n) | | | 3,220,000 | | | | 3,233,173 | |
| Dexia Credit Local S.A., 2.25%, 1/30/19 (n) | | | 1,390,000 | | | | 1,407,546 | |
| Electricite de France, 2.15%, 1/22/19 (n) | | | 2,500,000 | | | | 2,506,155 | |
| FMS Wertmanagement, 0.625%, 4/18/16 | | | 2,310,000 | | | | 2,311,155 | |
| KfW Bankengruppe, 0.5%, 9/30/15 | | | 2,210,000 | | | | 2,212,548 | |
| Kommunalbanken A.S., 0.375%, 4/10/15 (n) | | | 4,190,000 | | | | 4,190,851 | |
| Kommunalbanken A.S., 1%, 3/15/18 (n) | | | 5,000,000 | | | | 4,925,540 | |
| Kreditanstalt für Wiederaufbau, FRN, 0.214%, 1/23/15 | | | 4,500,000 | | | | 4,500,113 | |
| Municipality Finance PLC, 2.375%, 5/16/16 | | | 2,350,000 | | | | 2,406,548 | |
| Nederlandse Waterschapsbank N.V., 0.75%, 3/29/16 (n) | | | 3,570,000 | | | | 3,578,022 | |
| Nederlandse Waterschapsbank N.V., 1.5%, 4/16/18 (n) | | | 1,520,000 | | | | 1,523,662 | |
| Statoil A.S.A., 7.375%, 5/01/16 (n) | | | 3,870,000 | | | | 4,197,576 | |
| Statoil A.S.A., FRN, 0.522%, 5/15/18 | | | 911,000 | | | | 909,813 | |
| Statoil A.S.A., FRN, 0.691%, 11/08/18 | | | 1,600,000 | | | | 1,602,403 | |
| Swedish Export Credit Corp., FRN, 0.53%, 1/23/17 | | | 6,320,000 | | | | 6,343,365 | |
| | | | | | | | |
| | | | | | $ | 49,843,126 | |
| | | | | | | | |
| International Market Sovereign – 1.2% | | | | | |
| Kingdom of Denmark, 0.875%, 3/20/17 (n) | | $ | 4,240,000 | | | $ | 4,239,322 | |
| Kingdom of Sweden, 1%, 2/27/18 (n) | | | 3,040,000 | | | | 3,011,585 | |
| Republic of Iceland, 4.875%, 6/16/16 (n) | | | 2,520,000 | | | | 2,636,815 | |
| | | | | | | | |
| | | | | | $ | 9,887,722 | |
| | | | | | | | |
| Internet – 0.1% | | | | | |
| Baidu, Inc., 2.75%, 6/09/19 | | $ | 440,000 | | | $ | 438,065 | |
| | | | | | | | |
| Local Authorities – 0.6% | | | | | |
| Kommuninvest i Sverige AB, 0.5%, 6/15/16 (n) | | $ | 2,400,000 | | | $ | 2,395,409 | |
| State of Illinois, 4.961%, 3/01/16 | | | 2,215,000 | | | | 2,307,432 | |
| | | | | | | | |
| | | | | | $ | 4,702,841 | |
| | | | | | | | |
9
MFS Limited Maturity Portfolio
Portfolio of Investments – continued
| | | | | | | | |
| Issuer | | Shares/Par | | | Value ($) | |
| | | | | | | | |
| BONDS – continued | | | | | | | | |
| Major Banks – 15.0% | | | | | |
| ABN AMRO Bank N.V., 1.375%, 1/22/16 (n) | | $ | 1,700,000 | | | $ | 1,706,877 | |
| ABN AMRO Bank N.V., 4.25%, 2/02/17 (n) | | | 2,530,000 | | | | 2,665,760 | |
| ABN AMRO Bank N.V., FRN, 0.645%, 6/06/16 (n) | | | 1,640,000 | | | | 1,637,861 | |
| Bank of America Corp., 3.625%, 3/17/16 | | | 1,925,000 | | | | 1,979,452 | |
| Bank of America Corp., 5.625%, 10/14/16 | | | 1,150,000 | | | | 1,231,849 | |
| Bank of America Corp., 6%, 9/01/17 | | | 5,050,000 | | | | 5,568,771 | |
| Bank of America Corp., FRN, 0.52%, 6/15/16 | | | 1,330,000 | | | | 1,321,015 | |
| Bank of Montreal, FRN, 0.831%, 4/09/18 | | | 1,380,000 | | | | 1,385,781 | |
| Bank of New York Mellon Corp., 2.2%, 5/15/19 | | | 2,470,000 | | | | 2,476,909 | |
| Bank of Nova Scotia, FRN, 0.75%, 7/15/16 | | | 1,300,000 | | | | 1,302,969 | |
| Barclays Bank PLC, 2.5%, 2/20/19 | | | 1,860,000 | | | | 1,884,712 | |
| BNP Paribas, 2.7%, 8/20/18 | | | 2,720,000 | | | | 2,779,881 | |
| BNP Paribas, FRN, 0.829%, 12/12/16 | | | 790,000 | | | | 791,510 | |
| BNP Paribas, FRN, 0.722%, 3/17/17 | | | 1,860,000 | | | | 1,858,285 | |
| Canadian Imperial Bank of Commerce, FRN, 0.75%, 7/18/16 | | | 1,490,000 | | | | 1,496,160 | |
| Commonwealth Bank of Australia, FRN, 0.747%, 9/20/16 (n) | | | 1,750,000 | | | | 1,755,035 | |
| Commonwealth Bank of Australia, FRN, 0.6%, 3/13/17 (n) | | | 2,160,000 | | | | 2,161,307 | |
| Commonwealth Bank of Australia, FRN, 0.505%, 9/08/17 (n) | | | 1,700,000 | | | | 1,699,023 | |
| DNB Bank A.S.A., 3.2%, 4/03/17 (n) | | | 2,815,000 | | | | 2,917,649 | |
| Goldman Sachs Group, Inc., 1.6%, 11/23/15 | | | 3,400,000 | | | | 3,418,278 | |
| Goldman Sachs Group, Inc., FRN, 1.432%, 4/30/18 | | | 1,580,000 | | | | 1,598,538 | |
| Goldman Sachs Group, Inc., FRN, 1.332%, 11/15/18 | | | 3,100,000 | | | | 3,130,377 | |
| Goldman Sachs Group, Inc., FRN, 1.25%, 10/23/19 | | | 2,040,000 | | | | 2,049,480 | |
| HSBC Bank PLC, FRN, 0.872%, 5/15/18 (n) | | | 2,273,000 | | | | 2,282,078 | |
| HSBC USA, Inc., 1.625%, 1/16/18 | | | 3,720,000 | | | | 3,705,674 | |
| Huntington National Bank, FRN, 0.657%, 4/24/17 | | | 3,470,000 | | | | 3,466,398 | |
| ING Bank N.V., 2%, 9/25/15 (n) | | | 550,000 | | | | 554,291 | |
| ING Bank N.V., FRN, 1.185%, 3/07/16 (n) | | | 1,400,000 | | | | 1,407,241 | |
| JPMorgan Chase & Co., 1.875%, 3/20/15 | | | 4,000,000 | | | | 4,012,056 | |
| JPMorgan Chase & Co., 3.45%, 3/01/16 | | | 6,550,000 | | | | 6,724,145 | |
| Mizuho Bank Ltd., FRN, 0.704%, 9/25/17 (n) | | | 960,000 | | | | 960,723 | |
| Morgan Stanley, 4.1%, 1/26/15 | | | 3,250,000 | | | | 3,256,451 | |
| Morgan Stanley, 5.75%, 10/18/16 | | | 1,850,000 | | | | 1,986,902 | |
| Morgan Stanley, 5.45%, 1/09/17 | | | 2,475,000 | | | | 2,659,108 | |
| Morgan Stanley, 4.75%, 3/22/17 | | | 1,675,000 | | | | 1,784,300 | |
| Nordea Bank AB, FRN, 0.693%, 5/13/16 (n) | | | 1,887,000 | | | | 1,891,382 | |
| Nordea Bank AB, FRN, 0.591%, 4/04/17 (n) | | | 1,730,000 | | | | 1,731,931 | |
| PNC Bank N.A., 1.3%, 10/03/16 | | | 1,290,000 | | | | 1,296,717 | |
| PNC Bank N.A., 1.15%, 11/01/16 | | | 2,610,000 | | | | 2,614,189 | |
| PNC Bank N.A., 2.25%, 7/02/19 | | | 3,080,000 | | | | 3,075,269 | |
| PNC Bank N.A., FRN, 0.543%, 1/28/16 | | | 2,190,000 | | | | 2,192,617 | |
| Royal Bank of Canada, FRN, 0.695%, 9/09/16 | | | 1,820,000 | | | | 1,826,701 | |
| | | | | | | | |
| Issuer | | Shares/Par | | | Value ($) | |
| | | | | | | | |
| BONDS – continued | | | | | | | | |
| Major Banks – continued | | | | | |
| Royal Bank of Scotland PLC, 2.55%, 9/18/15 | | $ | 3,025,000 | | | $ | 3,055,244 | |
| Santander U.S. Debt S.A.U., 3.724%, 1/20/15 (n) | | | 1,200,000 | | | | 1,201,642 | |
| Standard Chartered PLC, 3.85%, 4/27/15 (n) | | | 3,150,000 | | | | 3,180,060 | |
| Sumitomo Mitsui Banking Corp., 1.35%, 7/18/15 | | | 3,475,000 | | | | 3,491,211 | |
| Sumitomo Mitsui Banking Corp., FRN, 0.55%, 7/11/17 | | | 2,430,000 | | | | 2,419,699 | |
| Wells Fargo & Co., 1.5%, 7/01/15 | | | 1,925,000 | | | | 1,935,484 | |
| Wells Fargo & Co., FRN, 0.76%, 7/20/16 | | | 2,340,000 | | | | 2,347,200 | |
| Wells Fargo & Co., FRN, 0.495%, 9/08/17 | | | 4,090,000 | | | | 4,078,973 | |
| Westpac Banking Corp., 1.125%, 9/25/15 | | | 5,800,000 | | | | 5,831,134 | |
| Westpac Banking Corp., FRN, 0.561%, 5/19/17 | | | 1,890,000 | | | | 1,889,049 | |
| | | | | | | | |
| | | | | | $ | 125,675,348 | |
| | | | | | | | |
| Medical & Health Technology & Services – 1.8% | | | | | |
| Becton, Dickinson and Co., 1.75%, 11/08/16 | | $ | 2,900,000 | | | $ | 2,922,229 | |
| Becton, Dickinson and Co., 1.8%, 12/15/17 | | | 200,000 | | | | 200,753 | |
| CareFusion Corp., 1.45%, 5/15/17 | | | 1,140,000 | | | | 1,132,346 | |
| Covidien International Finance S.A., 6%, 10/15/17 | | | 1,485,000 | | | | 1,661,967 | |
| Express Scripts Holding Co., 3.125%, 5/15/16 | | | 1,175,000 | | | | 1,208,088 | |
| McKesson Corp., 3.25%, 3/01/16 | | | 3,075,000 | | | | 3,148,951 | |
| McKesson Corp., FRN, 0.637%, 9/10/15 | | | 2,200,000 | | | | 2,200,686 | |
| Medco Health Solutions, Inc., 2.75%, 9/15/15 | | | 2,700,000 | | | | 2,735,737 | |
| | | | | | | | |
| | | | | | $ | 15,210,757 | |
| | | | | | | | |
| Medical Equipment – 0.1% | | | | | |
| Medtronic, Inc., 1.5%, 3/15/18 (n) | | $ | 1,320,000 | | | $ | 1,313,801 | |
| | | | | | | | |
| Metals & Mining – 1.3% | | | | | |
| Barrick Gold Corp., 2.5%, 5/01/18 | | $ | 1,200,000 | | | $ | 1,202,410 | |
| Barrick International (Barbados) Corp., 5.75%, 10/15/16 (n) | | | 842,000 | | | | 895,048 | |
| Freeport-McMoRan Copper & Gold, Inc., 2.15%, 3/01/17 | | | 330,000 | | | | 330,562 | |
| Freeport-McMoRan Copper & Gold, Inc., 2.375%, 3/15/18 | | | 800,000 | | | | 791,204 | |
| Glencore Funding LLC, FRN, 1.395%, 5/27/16 (n) | | | 3,240,000 | | | | 3,256,148 | |
| Rio Tinto Financial USA PLC, 1.125%, 3/20/15 | | | 4,750,000 | | | | 4,755,030 | |
| | | | | | | | |
| | | | | | $ | 11,230,402 | |
| | | | | | | | |
| Midstream – 1.7% | | | | | |
| Energy Transfer Partners LP, 5.95%, 2/01/15 | | $ | 1,010,000 | | | $ | 1,013,345 | |
| EnLink Midstream Partners LP, 2.7%, 4/01/19 | | | 1,342,000 | | | | 1,321,522 | |
| Enterprise Products Operating LP, 6.5%, 1/31/19 | | | 630,000 | | | | 722,080 | |
| Enterprise Products Partners LP, 1.25%, 8/13/15 | | | 3,775,000 | | | | 3,785,332 | |
| Kinder Morgan (Delaware), Inc., 2%, 12/01/17 | | | 1,460,000 | | | | 1,451,076 | |
10
MFS Limited Maturity Portfolio
Portfolio of Investments – continued
| | | | | | | | |
| Issuer | | Shares/Par | | | Value ($) | |
| | | | | | | | |
| BONDS – continued | | | | | | | | |
| Midstream – continued | | | | | |
| ONEOK Partners LP, 6.15%, 10/01/16 | | $ | 1,200,000 | | | $ | 1,288,756 | |
| ONEOK Partners LP, 2%, 10/01/17 | | | 775,000 | | | | 770,728 | |
| TransCanada PipeLines Ltd., FRN, 0.936%, 6/30/16 | | | 3,750,000 | | | | 3,767,738 | |
| | | | | | | | |
| | | | | | $ | 14,120,577 | |
| | | | | | | | |
| Mortgage-Backed – 3.8% | | | | | |
| Fannie Mae, 2.8%, 3/01/18 | | $ | 3,145,493 | | | $ | 3,254,342 | |
| Fannie Mae, 3.75%, 3/01/18 | | | 3,940,147 | | | | 4,188,719 | |
| Fannie Mae, 3.743%, 6/01/18 | | | 13,389,713 | | | | 14,248,527 | |
| Fannie Mae, 5.5%, 5/01/25 | | | 2,920,605 | | | | 3,089,308 | |
| Fannie Mae, 5%, 3/01/30 - 6/01/41 | | | 2,700,769 | | | | 2,984,082 | |
| Fannie Mae, 5%, 7/01/39 (f) | | | 1,718,545 | | | | 1,897,143 | |
| Fannie Mae, FRN, 0.407%, 5/25/18 | | | 2,348,398 | | | | 2,348,616 | |
| | | | | | | | |
| | | | | | $ | 32,010,737 | |
| | | | | | | | |
| Municipals – 1.6% | | | | | |
| Florida Hurricane Catastrophe Fund Finance Corp. Rev., “A”, 1.298%, 7/01/16 | | $ | 4,860,000 | | | $ | 4,886,244 | |
| Pennsylvania Higher Education Assistance Agency, “A-1”, FRN, 0.833%, 4/25/19 | | | 95,291 | | | | 95,402 | |
| State of California, 3.95%, 11/01/15 | | | 1,950,000 | | | | 2,004,327 | |
| State of Illinois, 4.421%, 1/01/15 | | | 6,500,000 | | | | 6,500,000 | |
| | | | | | | | |
| | | | | | $ | 13,485,973 | |
| | | | | | | | |
| Natural Gas – Distribution – 0.3% | | | | | |
| GDF SUEZ, 1.625%, 10/10/17 (n) | | $ | 2,500,000 | | | $ | 2,497,130 | |
| | | | | | | | |
| Network & Telecom – 3.5% | | | | | |
| AT&T, Inc., 2.95%, 5/15/16 | | $ | 2,800,000 | | | $ | 2,871,299 | |
| AT&T, Inc., 2.4%, 8/15/16 | | | 7,950,000 | | | | 8,112,816 | |
| British Telecommunications PLC, 2.35%, 2/14/19 | | | 1,860,000 | | | | 1,857,329 | |
| Telefonica Emisiones SAU, 6.421%, 6/20/16 | | | 1,325,000 | | | | 1,417,735 | |
| Verizon Communications, Inc., 0.7%, 11/02/15 | | | 6,325,000 | | | | 6,322,995 | |
| Verizon Communications, Inc., 1.35%, 6/09/17 | | | 2,200,000 | | | | 2,190,643 | |
| Verizon Communications, Inc., FRN, 1.77%, 9/15/16 | | | 1,650,000 | | | | 1,679,915 | |
| Verizon Communications, Inc., FRN, 1.012%, 6/17/19 | | | 4,600,000 | | | | 4,623,819 | |
| | | | | | | | |
| | | | | | $ | 29,076,551 | |
| | | | | | | | |
| Oil Services – 0.8% | | | | | |
| Transocean, Inc., 4.95%, 11/15/15 | | $ | 1,806,000 | | | $ | 1,810,510 | |
| Transocean, Inc., 5.05%, 12/15/16 | | | 3,125,000 | | | | 3,140,872 | |
| Transocean, Inc., 2.5%, 10/15/17 | | | 1,875,000 | | | | 1,657,699 | |
| | | | | | | | |
| | | | | | $ | 6,609,081 | |
| | | | | | | | |
| Other Banks & Diversified Financials – 9.8% | | | | | |
| Abbey National Treasury Services PLC, 3.05%, 8/23/18 | | $ | 1,521,000 | | | $ | 1,574,720 | |
| American Express Credit Co., 2.75%, 9/15/15 | | | 5,200,000 | | | | 5,280,798 | |
| Banco Santander Chile, FRN, 1.13%, 4/11/17 (n) | | | 510,000 | | | | 507,723 | |
| | | | | | | | |
| Issuer | | Shares/Par | | | Value ($) | |
| | | | | | | | |
| BONDS – continued | | | | | | | | |
| Other Banks & Diversified Financials – continued | | | | | |
| Bank of Tokyo-Mitsubishi UFJ Ltd., FRN, 0.684%, 2/26/16 (n) | | $ | 1,450,000 | | | $ | 1,451,369 | |
| Bank of Tokyo-Mitsubishi UFJ Ltd., FRN, 0.845%, 9/09/16 (n) | | | 3,880,000 | | | | 3,894,197 | |
| Banque Federative du Credit Mutuel, FRN, 1.083%, 10/28/16 (n) | | | 4,070,000 | | | | 4,095,596 | |
| Banque Federative du Credit Mutuel, FRN, 1.08%, 1/20/17 (n) | | | 800,000 | | | | 805,499 | |
| Capital One Financial Corp., 2.45%, 4/24/19 | | | 1,160,000 | | | | 1,157,342 | |
| Capital One Financial Corp., 1%, 11/06/15 | | | 1,275,000 | | | | 1,273,952 | |
| Citigroup, Inc., 5.85%, 8/02/16 | | | 4,825,000 | | | | 5,163,894 | |
| Citigroup, Inc., FRN, 1.002%, 4/08/19 | | | 2,650,000 | | | | 2,659,940 | |
| Corpbanca, 3.875%, 9/22/19 (n) | | | 1,047,000 | | | | 1,049,618 | |
| Danske Bank A.S., 3.75%, 4/01/15 (n) | | | 240,000 | | | | 241,542 | |
| Fifth Third Bancorp, 1.35%, 6/01/17 | | | 3,620,000 | | | | 3,617,426 | |
| Fifth Third Bancorp, 2.3%, 3/01/19 | | | 1,171,000 | | | | 1,172,754 | |
| First Republic Bank, 2.375%, 6/17/19 | | | 849,000 | | | | 853,000 | |
| Groupe BPCE S.A., 2.5%, 12/10/18 | | | 2,980,000 | | | | 3,020,626 | |
| Groupe BPCE S.A., FRN, 1.483%, 4/25/16 | | | 4,340,000 | | | | 4,387,875 | |
| Intesa Sanpaolo S.p.A., 3.125%, 1/15/16 | | | 2,550,000 | | | | 2,590,716 | |
| Intesa Sanpaolo S.p.A., 2.375%, 1/13/17 | | | 1,240,000 | | | | 1,250,919 | |
| Macquarie Bank Ltd., 5%, 2/22/17 (n) | | | 3,000,000 | | | | 3,199,989 | |
| Macquarie Bank Ltd., FRN, 0.863%, 10/27/17 (n) | | | 2,670,000 | | | | 2,672,921 | |
| Rabobank Nederland N.V., 3.375%, 1/19/17 | | | 3,000,000 | | | | 3,129,726 | |
| Rabobank Nederland N.V., FRN, 0.722%, 3/18/16 | | | 1,380,000 | | | | 1,384,126 | |
| Santander Holdings USA, Inc., 3%, 9/24/15 | | | 1,725,000 | | | | 1,745,650 | |
| Skandinaviska Enskilda, 1.75%, 3/19/18 (n) | | | 1,721,000 | | | | 1,712,238 | |
| SunTrust Banks, Inc., 3.5%, 1/20/17 | | | 3,000,000 | | | | 3,127,533 | |
| Svenska Handelsbanken AB, 2.875%, 4/04/17 | | | 2,500,000 | | | | 2,584,080 | |
| Svenska Handelsbanken AB, FRN, 0.697%, 3/21/16 | | | 3,150,000 | | | | 3,160,052 | |
| Swedbank AB, 2.125%, 9/29/17 (n) | | | 5,039,000 | | | | 5,097,442 | |
| UBS AG, 3.875%, 1/15/15 | | | 3,269,000 | | | | 3,272,468 | |
| UBS AG, FRN, 0.613%, 8/14/17 | | | 2,050,000 | | | | 2,054,719 | |
| Union Bank N.A., 2.125%, 6/16/17 | | | 2,825,000 | | | | 2,856,612 | |
| | | | | | | | |
| | | | | | $ | 82,047,062 | |
| | | | | | | | |
| Pharmaceuticals – 3.0% | | | | | |
| AbbVie, Inc., 1.75%, 11/06/17 | | $ | 5,300,000 | | | $ | 5,311,909 | |
| Bayer U.S. Finance LLC, 1.5%, 10/06/17 (n) | | | 1,550,000 | | | | 1,551,107 | |
| Bristol-Myers Squibb Co., 0.875%, 8/01/17 | | | 3,896,000 | | | | 3,861,294 | |
| Celgene Corp., 2.45%, 10/15/15 | | | 3,000,000 | | | | 3,029,793 | |
| Mylan, Inc., 1.8%, 6/24/16 | | | 1,470,000 | | | | 1,479,202 | |
| Mylan, Inc., 1.35%, 11/29/16 | | | 1,355,000 | | | | 1,348,728 | |
| Sanofi, 1.25%, 4/10/18 | | | 3,500,000 | | | | 3,466,596 | |
| Watson Pharmaceuticals, Inc., 1.875%, 10/01/17 | | | 5,250,000 | | | | 5,230,024 | |
| | | | | | | | |
| | | | | | $ | 25,278,653 | |
| | | | | | | | |
| Printing & Publishing – 0.3% | | | | | |
| Thomson Reuters Corp., 0.875%, 5/23/16 | | $ | 2,380,000 | | | $ | 2,368,179 | |
| | | | | | | | |
11
MFS Limited Maturity Portfolio
Portfolio of Investments – continued
| | | | | | | | |
| Issuer | | Shares/Par | | | Value ($) | |
| | | | | | | | |
| BONDS – continued | | | | | | | | |
| Real Estate – Healthcare – 0.4% | | | | | |
| Health Care, Inc., REIT, 4.7%, 9/15/17 | | $ | 1,845,000 | | | $ | 1,982,493 | |
| Ventas Realty LP, REIT, 1.55%, 9/26/16 | | | 1,390,000 | | | | 1,395,945 | |
| | | | | | | | |
| | | | | | $ | 3,378,438 | |
| | | | | | | | |
| Real Estate – Office – 0.2% | | | | | |
| Vornado Realty LP, REIT, 2.5%, 6/30/19 | | $ | 1,824,000 | | | $ | 1,808,199 | |
| | | | | | | | |
| Real Estate – Retail – 0.3% | | | | | |
| Simon Property Group, Inc., REIT, 1.5%, 2/01/18 (n) | | $ | 1,208,000 | | | $ | 1,200,341 | |
| WEA Finance LLC/Westfield Co., REIT, 1.75%, 9/15/17 (n) | | | 1,190,000 | | | | 1,183,679 | |
| | | | | | | | |
| | | | | | $ | 2,384,020 | |
| | | | | | | | |
| Retailers – 0.5% | | | | | |
| Target Corp., 2.3%, 6/26/19 | | $ | 2,460,000 | | | $ | 2,490,258 | |
| Wesfarmers Ltd., 1.874%, 3/20/18 (n) | | | 1,593,000 | | | | 1,587,455 | |
| | | | | | | | |
| | | | | | $ | 4,077,713 | |
| | | | | | | | |
| Specialty Chemicals – 0.7% | | | | | |
| Air Products & Chemicals, Inc., 2%, 8/02/16 | | $ | 736,000 | | | $ | 748,188 | |
| Ecolab, Inc., 1%, 8/09/15 | | | 3,025,000 | | | | 3,033,168 | |
| Ecolab, Inc., 3%, 12/08/16 | | | 1,850,000 | | | | 1,910,730 | |
| | | | | | | | |
| | | | | | $ | 5,692,086 | |
| | | | | | | | |
| Supranational – 0.8% | | | | | |
| Corporacion Andina de Fomento, 1.5%, 8/08/17 | | $ | 1,650,000 | | | $ | 1,639,895 | |
| International Bank for Reconstruction and Development, 0.5%, 4/15/16 | | | 4,850,000 | | | | 4,847,066 | |
| | | | | | | | |
| | | | | | $ | 6,486,961 | |
| | | | | | | | |
| Telecommunications – Wireless – 0.9% | | | | | |
| American Tower Trust I, REIT, 1.551%, 3/15/18 (n) | | $ | 1,900,000 | | | $ | 1,877,647 | |
| Crown Castle Towers LLC, 3.214%, 8/15/15 (n) | | | 3,000,000 | | | | 3,035,913 | |
| SBA Tower Trust, 2.898%, 10/15/19 (n) | | | 2,395,000 | | | | 2,401,311 | |
| | | | | | | | |
| | | | | | $ | 7,314,871 | |
| | | | | | | | |
| Telephone Services – 0.2% | | | | | |
| Qwest Corp., 6.5%, 6/01/17 | | $ | 1,640,000 | | | $ | 1,793,087 | |
| | | | | | | | |
| Tobacco – 0.2% | | | | | |
| Imperial Tobacco Finance PLC, 2.05%, 2/11/18 (n) | | $ | 1,441,000 | | | $ | 1,432,926 | |
| | | | | | | | |
| Transportation – Services – 0.4% | | | | | |
| ERAC USA Finance Co., 2.75%, 3/15/17 (n) | | $ | 3,000,000 | | | $ | 3,080,136 | |
| | | | | | | | |
| U.S. Government Agencies and Equivalents – 2.0% | |
| Government of Ukraine, 1.844%, 5/16/19 | | $ | 225,000 | | | $ | 226,519 | |
| Hashemite Kingdom of Jordan, 1.945%, 6/23/19 | | | 2,040,000 | | | | 2,053,845 | |
| | | | | | | | |
| Issuer | | Shares/Par | | | Value ($) | |
| | | | | | | | |
| BONDS – continued | | | | | | | | |
| U.S. Government Agencies and Equivalents – continued | |
| National Credit Union Administration, 1.84%, 10/07/20 | | $ | 119,729 | | | $ | 120,450 | |
| National Credit Union Administration, “1-A”, FRN, 0.607%, 1/08/20 | | | 1,576,685 | | | | 1,585,421 | |
| National Credit Union Administration, “1-A”, FRN, 0.537%, 3/06/20 | | | 1,756,855 | | | | 1,761,473 | |
| National Credit Union Administration, FRN, 0.527%, 11/06/17 | | | 1,366,946 | | | | 1,370,726 | |
| National Credit Union Administration, FRN, 0.558%, 3/11/20 | | | 2,448,014 | | | | 2,456,238 | |
| National Credit Union Administration, FRN, 0.537%, 4/06/20 | | | 1,322,656 | | | | 1,324,516 | |
| National Credit Union Administration, FRN, 0.537%, 5/07/20 | | | 670,682 | | | | 671,128 | |
| National Credit Union Administration, FRN, 0.607%, 10/07/20 | | | 758,767 | | | | 763,322 | |
| National Credit Union Administration, FRN, 0.511%, 12/07/20 | | | 999,719 | | | | 1,000,849 | |
| Private Export Funding Corp., 1.875%, 7/15/18 | | | 3,440,000 | | | | 3,476,939 | |
| | | | | | | | |
| | | | | | $ | 16,811,426 | |
| | | | | | | | |
| Utilities – Electric Power – 2.9% | | | | | |
| Duke Energy Corp., FRN, 0.612%, 4/03/17 | | $ | 2,650,000 | | | $ | 2,653,543 | |
| Duke Energy Indiana, Inc., FRN, 0.579%, 7/11/16 | | | 1,150,000 | | | | 1,151,914 | |
| Enel Finance International S.A., 6.25%, 9/15/17 (n) | | | 680,000 | | | | 754,808 | |
| NextEra Energy Capital Co., 1.2%, 6/01/15 | | | 3,000,000 | | | | 3,005,634 | |
| NextEra Energy Capital Holdings, Inc., 1.339%, 9/01/15 | | | 1,450,000 | | | | 1,454,351 | |
| PG&E Corp., 2.4%, 3/01/19 | | | 2,129,000 | | | | 2,132,223 | |
| PPL WEM Holdings PLC, 3.9%, 5/01/16 (n) | | | 3,475,000 | | | | 3,578,256 | |
| Sierra Pacific Power Co., 6%, 5/15/16 | | | 3,450,000 | | | | 3,684,124 | |
| Southern Co., 2.45%, 9/01/18 | | | 3,000,000 | | | | 3,061,578 | |
| Virginia Electric and Power Co., 1.2%, 1/15/18 | | | 2,790,000 | | | | 2,755,412 | |
| | | | | | | | |
| | | | | | $ | 24,231,843 | |
| | | | | | | | |
Total Bonds
(Identified Cost, $830,978,519) | | | | | | $ | 833,728,201 | |
| | | | | | | | |
| |
| MONEY MARKET FUNDS – 0.3% | | | | | |
| MFS Institutional Money Market Portfolio, 0.09%, at Cost and Net Asset Value (v) | | | 2,357,718 | | | $ | 2,357,718 | |
| | | | | | | | |
Total Investments
(Identified Cost, $833,336,237) | | | | | | $ | 836,085,919 | |
| | | | | | | | |
OTHER ASSETS, LESS
LIABILITIES – 0.3% | | | | | | | 2,876,793 | |
| | | | | | | | |
| NET ASSETS – 100.0% | | | | | | $ | 838,962,712 | |
| | | | | | | | |
12
MFS Limited Maturity Portfolio
Portfolio of Investments – continued
| (f) | | All or a portion of the security has been segregated as collateral for open futures contracts. |
| (n) | | Securities exempt from registration under Rule 144A of the Securities Act of 1933. These securities may be sold in the ordinary course of business in transactions exempt from registration, normally to qualified institutional buyers. At period end, the aggregate value of these securities was $273,545,382, representing 32.6% of net assets. |
| (v) | | Underlying affiliated fund that is available only to investment companies managed by MFS. The rate quoted for the MFS Institutional Money Market Portfolio is the annualized seven-day yield of the fund at period end. |
| (z) | | Restricted securities are not registered under the Securities Act of 1933 and are subject to legal restrictions on resale. These securities generally may be resold in transactions exempt from registration or to the public if the securities are subsequently registered. Disposal of these securities may involve time-consuming negotiations and prompt sale at an acceptable price may be difficult. The fund holds the following restricted securities: |
| | | | | | | | | | |
| Restricted Securities | | Acquisition
Date | |
Cost | | | Value | |
| Babson Ltd., CLO, “A1”, FRN, 0.455%, 1/18/21 | | 6/24/14 | | | $1,445,716 | | | | $1,455,510 | |
| Education Loan Asset-Backed Trust, “A-1”, FRN, 0.619%, 6/25/22 | | 9/19/12 | | | 117,920 | | | | 117,924 | |
| Total Restricted Securities | | | | $1,573,434 | |
| % of Net assets | | | | 0.2% | |
The following abbreviations are used in this report and are defined:
| CDO | | Collateralized Debt Obligation |
| CLO | | Collateralized Loan Obligation |
| FRN | | Floating Rate Note. Interest rate resets periodically and may not be the rate reported at period end. |
| PLC | | Public Limited Company |
| REIT | | Real Estate Investment Trust |
Derivative Contracts at 12/31/14
Futures Contracts at 12/31/14
| | | | | | | | | | | | | | | | | | |
| Description | | Currency | | | Contracts | | | Value | | Expiration
Date | | | Unrealized
Appreciation
(Depreciation) | |
| Liability Derivatives | | | | | | | | | | | | | | | | | | |
| Interest Rate Futures | | | | | | | | | | | | | | | | | | |
| U.S. Treasury Note 5 yr (Short) | | | USD | | | | 125 | | | $14,866,211 | | | March - 2015 | | | | $(2,391 | ) |
| | | | | | | | | | | | | | | | | | |
At December 31, 2014, the fund had liquid securities with an aggregate value of $130,059 to cover any commitments for certain derivative contracts.
See Notes to Financial Statements
13
MFS Limited Maturity Portfolio
FINANCIAL STATEMENTS | STATEMENT OF ASSETS AND LIABILITIES
This statement represents your fund’s balance sheet, which details the assets and liabilities comprising the total value of the fund.
| | | | | | | | |
At 12/31/14 | | | | | | | | |
Assets | | | | | | | | |
Investments – | | | | | | | | |
Non-affiliated issuers, at value (identified cost, $830,978,519) | | | $833,728,201 | | | | | |
Underlying affiliated funds, at cost and value | | | 2,357,718 | | | | | |
Total investments, at value (identified cost, $833,336,237) | | | $836,085,919 | | | | | |
Cash | | | 78,275 | | | | | |
Receivables for | | | | | | | | |
Investments sold | | | 17 | | | | | |
Fund shares sold | | | 27 | | | | | |
Interest | | | 3,859,649 | | | | | |
Other assets | | | 6,924 | | | | | |
Total assets | | | | | | | $840,030,811 | |
Liabilities | | | | | | | | |
Payables for | | | | | | | | |
Daily variation margin on open futures contracts | | | $19,531 | | | | | |
Fund shares reacquired | | | 917,410 | | | | | |
Payable to affiliates | | | | | | | | |
Investment adviser | | | 13,826 | | | | | |
Shareholder servicing costs | | | 87 | | | | | |
Distribution and/or service fees | | | 2,897 | | | | | |
Payable for independent Trustees’ compensation | | | 55 | | | | | |
Accrued expenses and other liabilities | | | 114,293 | | | | | |
Total liabilities | | | | | | | $1,068,099 | |
Net assets | | | | | | | $838,962,712 | |
Net assets consist of | | | | | | | | |
Paid-in capital | | | $827,715,007 | | | | | |
Unrealized appreciation (depreciation) on investments | | | 2,747,291 | | | | | |
Accumulated distributions in excess of net realized gain on investments | | | (1,218,032 | ) | | | | |
Undistributed net investment income | | | 9,718,446 | | | | | |
Net assets | | | | | | | $838,962,712 | |
Shares of beneficial interest outstanding | | | | | | | 82,067,578 | |
| | | | | | | | | | | | |
| | | Net assets | | | Shares
outstanding | | | Net asset value
per share | |
Initial Class | | | $627,457,475 | | | | 61,339,972 | | | | $10.23 | |
Service Class | | | 211,505,237 | | | | 20,727,606 | | | | 10.20 | |
See Notes to Financial Statements
14
MFS Limited Maturity Portfolio
FINANCIAL STATEMENTS | STATEMENT OF OPERATIONS
This statement describes how much your fund earned in investment income and accrued in expenses. It also describes any gains and/or losses generated by fund operations.
| | | | | | | | |
Year ended 12/31/14 | | | | | | | | |
Net investment income | | | | | |
Income | | | | | | | | |
Interest | | | $13,983,745 | | | | | |
Dividends from underlying affiliated funds | | | 17,004 | | | | | |
Total investment income | | | | | | | $14,000,749 | |
Expenses | | | | | | | | |
Management fee | | | $3,638,428 | | | | | |
Distribution and/or service fees | | | 566,099 | | | | | |
Shareholder servicing costs | | | 19,593 | | | | | |
Administrative services fee | | | 132,156 | | | | | |
Independent Trustees’ compensation | | | 16,390 | | | | | |
Custodian fee | | | 99,026 | | | | | |
Audit and tax fees | | | 63,583 | | | | | |
Legal fees | | | 7,823 | | | | | |
Miscellaneous | | | 30,609 | | | | | |
Total expenses | | | | | | | $4,573,707 | |
Fees paid indirectly | | | (401 | ) | | | | |
Reduction of expenses by investment adviser | | | (43,223 | ) | | | | |
Net expenses | | | | | | | $4,530,083 | |
Net investment income | | | | | | | $9,470,666 | |
Realized and unrealized gain (loss) on investments | | | | | | | | |
Realized gain (loss) (identified cost basis) | | | | | | | | |
Investments | | | $276,679 | | | | | |
Futures contracts | | | (190,957 | ) | | | | |
Net realized gain (loss) on investments | | | | | | | $85,722 | |
Change in unrealized appreciation (depreciation) | | | | | | | | |
Investments | | | $(2,181,064 | ) | | | | |
Futures contracts | | | (615,537 | ) | | | | |
Net unrealized gain (loss) on investments | | | | | | | $(2,796,601 | ) |
Net realized and unrealized gain (loss) on investments | | | | | | | $(2,710,879 | ) |
Change in net assets from operations | | | | | | | $6,759,787 | |
See Notes to Financial Statements
15
MFS Limited Maturity Portfolio
FINANCIAL STATEMENTS | STATEMENTS OF CHANGES IN NET ASSETS
These statements describe the increases and/or decreases in net assets resulting from operations, any distributions, and any shareholder transactions.
| | | | | | | | |
For years ended 12/31 | | | 2014 | | | | 2013 | |
Change in net assets | | | | | | | | |
From operations | | | | | | | | |
Net investment income | | | $9,470,666 | | | | $10,413,885 | |
Net realized gain (loss) on investments | | | 85,722 | | | | 3,335,226 | |
Net unrealized gain (loss) on investments | | | (2,796,601 | ) | | | (7,058,348 | ) |
Change in net assets from operations | | | $6,759,787 | | | | $6,690,763 | |
Distributions declared to shareholders | | | | | | | | |
From net investment income | | | $(10,989,698 | ) | | | $(943,171 | ) |
From net realized gain on investments | | | (3,551,708 | ) | | | (2,605,347 | ) |
Total distributions declared to shareholders | | | $(14,541,406 | ) | | | $(3,548,518 | ) |
Change in net assets from fund share transactions | | | $(96,654,985 | ) | | | $35,917,152 | |
Total change in net assets | | | $(104,436,604 | ) | | | $39,059,397 | |
Net assets | | | | | | | | |
At beginning of period | | | 943,399,316 | | | | 904,339,919 | |
At end of period (including undistributed net investment income of $9,718,446 and
$10,989,470, respectively) | | | $838,962,712 | | | | $943,399,316 | |
See Notes to Financial Statements
16
MFS Limited Maturity Portfolio
FINANCIAL STATEMENTS | FINANCIAL HIGHLIGHTS
The financial highlights table is intended to help you understand the fund’s financial performance for the past 5 years. Certain information reflects financial results for a single fund share. The total returns in the table represent the rate by which an investor would have earned (or lost) on an investment in the fund share class (assuming reinvestment of all distributions) held for the entire period.
| | | | | | | | | | | | | | | | | | | | |
| Initial Class | | Years ended 12/31 | |
| | | 2014 | | | 2013 | | | 2012 | | | 2011 | | | 2010 | |
Net asset value, beginning of period | | | $10.32 | | | | $10.29 | | | | $10.18 | | | | $10.31 | | | | $10.23 | |
| Income (loss) from investment operations | | | | | | | | | | | | | | | | | | | | |
Net investment income (d) | | | $0.11 | | | | $0.12 | | | | $0.11 | | | | $0.12 | | | | $0.14 | |
Net realized and unrealized gain (loss) on investments | | | (0.03 | ) | | | (0.05 | ) | | | 0.12 | | | | (0.07 | ) | | | 0.11 | |
Total from investment operations | | | $0.08 | | | | $0.07 | | | | $0.23 | | | | $0.05 | | | | $0.25 | |
| Less distributions declared to shareholders | | | | | | | | | | | | | | | | | | | | |
From net investment income | | | $(0.13 | ) | | | $(0.01 | ) | | | $(0.12 | ) | | | $(0.12 | ) | | | $(0.16 | ) |
From net realized gain on investments | | | (0.04 | ) | | | (0.03 | ) | | | — | | | | (0.06 | ) | | | (0.01 | ) |
From tax return of capital | | | — | | | | — | | | | — | | | | (0.00 | )(w) | | | — | |
Total distributions declared to shareholders | | | $(0.17 | ) | | | $(0.04 | ) | | | $(0.12 | ) | | | $(0.18 | ) | | | $(0.17 | ) |
Net asset value, end of period (x) | | | $10.23 | | | | $10.32 | | | | $10.29 | | | | $10.18 | | | | $10.31 | |
Total return (%) (k)(r)(s)(x) | | | 0.80 | | | | 0.71 | | | | 2.24 | | | | 0.53 | | | | 2.41 | |
Ratios (%) (to average net assets)
and Supplemental data: | | | | | | | | | | | | | | | | | | | | |
Expenses before expense reductions (f) | | | 0.44 | | | | 0.45 | | | | 0.64 | | | | 0.65 | | | | 0.65 | |
Expenses after expense reductions (f) | | | 0.44 | | | | 0.45 | | | | N/A | | | | N/A | | | | N/A | |
Net investment income | | | 1.10 | | | | 1.19 | | | | 1.12 | | | | 1.14 | | | | 1.32 | |
Portfolio turnover | | | 24 | | | | 34 | | | | 213 | | | | 154 | | | | 122 | |
Net assets at end of period (000 omitted) | | | $627,457 | | | | $713,534 | | | | $723,068 | | | | $993,705 | | | | $1,004,464 | |
See Notes to Financial Statements
17
MFS Limited Maturity Portfolio
Financial Highlights – continued
| | | | | | | | | | | | | | | | | | | | |
| Service Class | | Years ended 12/31 | |
| | | 2014 | | | 2013 | | | 2012 | | | 2011 | | | 2010 | |
Net asset value, beginning of period | | | $10.30 | | | | $10.28 | | | | $10.17 | | | | $10.31 | | | | $10.23 | |
| Income (loss) from investment operations | | | | | | | | | | | | | | | | | | | | |
Net investment income (d) | | | $0.09 | | | | $0.10 | | | | $0.09 | | | | $0.09 | | | | $0.11 | |
Net realized and unrealized gain (loss) on investments | | | (0.04 | ) | | | (0.05 | ) | | | 0.11 | | | | (0.07 | ) | | | 0.11 | |
Total from investment operations | | | $0.05 | | | | $0.05 | | | | $0.20 | | | | $0.02 | | | | $0.22 | |
| Less distributions declared to shareholders | | | | | | | | | | | | | | | | | | | | |
From net investment income | | | $(0.11 | ) | | | $— | | | | $(0.09 | ) | | | $(0.10 | ) | | | $(0.13 | ) |
From net realized gain on investments | | | (0.04 | ) | | | (0.03 | ) | | | — | | | | (0.06 | ) | | | (0.01 | ) |
From tax return of capital | | | — | | | | — | | | | — | | | | (0.00 | )(w) | | | — | |
Total distributions declared to shareholders | | | $(0.15 | ) | | | $(0.03 | ) | | | $(0.09 | ) | | | $(0.16 | ) | | | $(0.14 | ) |
Net asset value, end of period (x) | | | $10.20 | | | | $10.30 | | | | $10.28 | | | | $10.17 | | | | $10.31 | |
Total return (%) (k)(r)(s)(x) | | | 0.49 | | | | 0.48 | | | | 2.01 | | | | 0.17 | | | | 2.16 | |
Ratios (%) (to average net assets)
and Supplemental data: | | | | | | | | | | | | | | | | | | | | |
Expenses before expense reductions (f) | | | 0.69 | | | | 0.70 | | | | 0.88 | | | | 0.90 | | | | 0.90 | |
Expenses after expense reductions (f) | | | 0.69 | | | | 0.70 | | | | N/A | | | | N/A | | | | N/A | |
Net investment income | | | 0.85 | | | | 0.94 | | | | 0.87 | | | | 0.89 | | | | 1.05 | |
Portfolio turnover | | | 24 | | | | 34 | | | | 213 | | | | 154 | | | | 122 | |
Net assets at end of period (000 omitted) | | | $211,505 | | | | $229,865 | | | | $181,272 | | | | $191,313 | | | | $149,752 | |
Information prior to the close of business on December 7, 2012, reflects time periods when another adviser or subadviser was responsible for selecting investments for the fund under a different investment objective and different investment strategies.
| (d) | | Per share data is based on average shares outstanding. |
| (f) | | Ratios do not reflect reductions from fees paid indirectly, if applicable. |
| (k) | | The total return does not reflect expenses that apply to separate accounts. Inclusion of these charges would reduce the total return figures for all periods shown. |
| (r) | | Certain expenses have been reduced without which performance would have been lower. |
| (s) | | From time to time the fund may receive proceeds from litigation settlements, without which performance would be lower. |
| (w) | | Per share amount was less than $0.01. |
| (x) | | The net asset values per share and total returns have been calculated on net assets which include adjustments made in accordance with U.S. generally accepted accounting principles required at period end for financial reporting purposes. |
See Notes to Financial Statements
18
MFS Limited Maturity Portfolio
NOTES TO FINANCIAL STATEMENTS
| (1) | | Business and Organization |
MFS Limited Maturity Portfolio (the fund) is a diversified series of MFS Variable Insurance Trust III (the trust). The trust is organized as a Delaware statutory trust and is registered under the Investment Company Act of 1940, as amended, as an open-end management investment company. The shareholders of each series of the trust are separate accounts of insurance companies, which offer variable annuity and/or life insurance products, and qualified retirement and pension plans.
The fund is an investment company and accordingly follows the investment company accounting and reporting guidance of the Financial Accounting Standards Board (FASB) Accounting Standards Codification Topic 946 Financial Services – Investment Companies.
| (2) | | Significant Accounting Policies |
General – The preparation of financial statements in conformity with U.S. generally accepted accounting principles requires management to make estimates and assumptions that affect the reported amounts of assets and liabilities, and disclosure of contingent assets and liabilities at the date of the financial statements and the reported amounts of increases and decreases in net assets from operations during the reporting period. Actual results could differ from those estimates. In the preparation of these financial statements, management has evaluated subsequent events occurring after the date of the fund’s Statement of Assets and Liabilities through the date that the financial statements were issued. The fund invests in foreign securities. Investments in foreign securities are vulnerable to the effects of changes in the relative values of the local currency and the U.S. dollar and to the effects of changes in each country’s legal, political, and economic environment.
In June 2014, FASB issued Accounting Standards Update 2014-11, Transfers and Servicing (Topic 860) – Repurchase-to-Maturity Transactions, Repurchase Financings, and Disclosures (“ASU 2014-11”). ASU 2014-11 changes the accounting for repurchase-to-maturity transactions (i.e., repurchase agreements that settle at the same time as the maturity of the transferred financial asset) and enhances the required disclosures for repurchase agreements and other similar transactions. Although still evaluating the potential impacts of ASU 2014-11 to the fund, management expects that the impact of the fund’s adoption will be limited to additional financial statement disclosures which would first be effective for interim reporting periods beginning after March 15, 2015.
Balance Sheet Offsetting – The fund’s accounting policy with respect to balance sheet offsetting is that, absent an event of default by the counterparty or a termination of the agreement, the International Swaps and Derivatives Association (ISDA) Master Agreement does not result in an offset of reported amounts of financial assets and financial liabilities in the Statement of Assets and Liabilities across transactions between the fund and the applicable counterparty. The fund’s right to setoff may be restricted or prohibited by the bankruptcy or insolvency laws of the particular jurisdiction to which a specific master netting agreement counterparty is subject. Balance sheet offsetting disclosures, to the extent applicable to the fund, have been included in the fund’s Significant Accounting Policies note under the captions for each of the fund’s in-scope financial instruments and transactions.
Investment Valuations – Debt instruments and floating rate loans, including restricted debt instruments, are generally valued at an evaluated or composite bid as provided by a third-party pricing service. Short-term instruments with a maturity at issuance of 60 days or less may be valued at amortized cost, which approximates market value. Futures contracts are generally valued at last posted settlement price as provided by a third-party pricing service on the market on which they are primarily traded. Futures contracts for which there were no trades that day for a particular position are generally valued at the closing bid quotation as provided by a third-party pricing service on the market on which such futures contracts are primarily traded. Open-end investment companies are generally valued at net asset value per share. Securities and other assets generally valued on the basis of information from a third-party pricing service may also be valued at a broker/dealer bid quotation. Values obtained from third-party pricing services can utilize both transaction data and market information such as yield, quality, coupon rate, maturity, type of issue, trading characteristics, and other market data. The values of foreign securities and other assets and liabilities expressed in foreign currencies are converted to U.S. dollars using the mean of bid and asked prices for rates provided by a third-party pricing service.
The Board of Trustees has delegated primary responsibility for determining or causing to be determined the value of the fund’s investments (including any fair valuation) to the adviser pursuant to valuation policies and procedures approved by the Board. If the adviser determines that reliable market quotations are not readily available, investments are valued at fair value as determined in good faith by the adviser in accordance with such procedures under the oversight of the Board of Trustees. Under the fund’s valuation policies and procedures, market quotations are not considered to be readily available for most types of debt instruments and floating rate loans and many types of derivatives. These investments are generally valued at fair value based on information from third-party pricing services. In addition, investments may be valued at fair value if the adviser determines that an investment’s value has been materially affected by events occurring after the close of the exchange or market on which the investment is principally traded (such as foreign exchange or market) and prior to the determination of the fund’s net asset value, or after the halting of trading of a specific security where trading does not resume prior to the close of the exchange or market on which the security is principally traded. The adviser generally relies on third-party pricing services or other information (such as the correlation with price movements of similar securities in the same or other markets; the type, cost and investment characteristics of the security; the
19
MFS Limited Maturity Portfolio
Notes to Financial Statements – continued
business and financial condition of the issuer; and trading and other market data) to assist in determining whether to fair value and at what value to fair value an investment. The value of an investment for purposes of calculating the fund’s net asset value can differ depending on the source and method used to determine value. When fair valuation is used, the value of an investment used to determine the fund’s net asset value may differ from quoted or published prices for the same investment. There can be no assurance that the fund could obtain the fair value assigned to an investment if it were to sell the investment at the same time at which the fund determines its net asset value per share.
Various inputs are used in determining the value of the fund’s assets or liabilities. These inputs are categorized into three broad levels. In certain cases, the inputs used to measure fair value may fall into different levels of the fair value hierarchy. In such cases, an investment’s level within the fair value hierarchy is based on the lowest level of input that is significant to the fair value measurement. The fund’s assessment of the significance of a particular input to the fair value measurement in its entirety requires judgment, and considers factors specific to the investment. Level 1 includes unadjusted quoted prices in active markets for identical assets or liabilities. Level 2 includes other significant observable market-based inputs (including quoted prices for similar securities, interest rates, prepayment speed, and credit risk). Level 3 includes unobservable inputs, which may include the adviser’s own assumptions in determining the fair value of investments. Other financial instruments are derivative instruments not reflected in total investments, such as futures contracts. The following is a summary of the levels used as of December 31, 2014 in valuing the fund’s assets or liabilities:
| | | | | | | | | | | | | | | | |
| Investments at Value | | Level 1 | | | Level 2 | | | Level 3 | | | Total | |
| U.S. Treasury Bonds & U.S. Government Agency & Equivalents | | | $— | | | | $16,811,426 | | | | $— | | | | $16,811,426 | |
| Non-U.S. Sovereign Debt | | | — | | | | 73,700,305 | | | | — | | | | 73,700,305 | |
| Municipal Bonds | | | — | | | | 13,485,973 | | | | — | | | | 13,485,973 | |
| U.S. Corporate Bonds | | | — | | | | 354,177,250 | | | | — | | | | 354,177,250 | |
| Residential Mortgage-Backed Securities | | | — | | | | 36,054,244 | | | | — | | | | 36,054,244 | |
| Commercial Mortgage-Backed Securities | | | — | | | | 7,147,528 | | | | — | | | | 7,147,528 | |
| Asset-Backed Securities (including CDOs) | | | — | | | | 83,146,921 | | | | — | | | | 83,146,921 | |
| Foreign Bonds | | | — | | | | 249,204,554 | | | | — | | | | 249,204,554 | |
| Mutual Funds | | | 2,357,718 | | | | — | | | | — | | | | 2,357,718 | |
| Total Investments | | | $2,357,718 | | | | $833,728,201 | | | | $— | | | | $836,085,919 | |
| | | | |
| Other Financial Instruments | | | | | | | | | | | | |
| Futures Contracts | | | $(2,391 | ) | | | $— | | | | $— | | | | $(2,391 | ) |
For further information regarding security characteristics, see the Portfolio of Investments.
Foreign Currency Translation – Purchases and sales of foreign investments, income, and expenses are converted into U.S. dollars based upon currency exchange rates prevailing on the respective dates of such transactions or on the reporting date for foreign denominated receivables and payables. Gains and losses attributable to foreign currency exchange rates on sales of securities are recorded for financial statement purposes as net realized gains and losses on investments. Gains and losses attributable to foreign exchange rate movements on receivables, payables, income and expenses are recorded for financial statement purposes as foreign currency transaction gains and losses. That portion of both realized and unrealized gains and losses on investments that results from fluctuations in foreign currency exchange rates is not separately disclosed.
Derivatives – The fund uses derivatives for different purposes, primarily to increase or decrease exposure to a particular market or segment of the market, or security, to increase or decrease interest rate or currency exposure, or as alternatives to direct investments. Derivatives are used for hedging or non-hedging purposes. While hedging can reduce or eliminate losses, it can also reduce or eliminate gains. When the fund uses derivatives as an investment to increase market exposure, or for hedging purposes, gains and losses from derivative instruments may be substantially greater than the derivative’s original cost.
The derivative instruments used by the fund were futures contracts. The fund’s period end derivatives, as presented in the Portfolio of Investments and the associated Derivative Contract tables, generally are indicative of the volume of its derivative activity during the period.
The following table presents, by major type of derivative contract, the fair value, on a gross basis, of the asset and liability components of derivatives held by the fund at December 31, 2014 as reported in the Statement of Assets and Liabilities:
| | | | | | |
| | | | | Fair Value (a) | |
| Risk | | Derivative Contracts | | Liability Derivatives | |
| Interest Rate | | Interest Rate Futures | | | $(2,391 | ) |
| (a) | The value of futures contracts includes cumulative appreciation (depreciation) as reported in the fund’s Portfolio of Investments. Only the current day variation margin for futures contracts is separately reported within the fund’s Statement of Assets and Liabilities. |
20
MFS Limited Maturity Portfolio
Notes to Financial Statements – continued
The following table presents, by major type of derivative contract, the realized gain (loss) on derivatives held by the fund for the year ended December 31, 2014 as reported in the Statement of Operations:
| | | | |
| Risk | | Futures Contracts | |
| Interest Rate | | | $(190,957 | ) |
The following table presents, by major type of derivative contract, the change in unrealized appreciation (depreciation) on derivatives held by the fund for the year ended December 31, 2014 as reported in the Statement of Operations:
| | | | |
| Risk | | Futures Contracts | |
| Interest Rate | | | $(615,537 | ) |
Derivative counterparty credit risk is managed through formal evaluation of the creditworthiness of all potential counterparties. On certain, but not all, over-the-counter derivatives, the fund attempts to reduce its exposure to counterparty credit risk whenever possible by entering into an ISDA Master Agreement on a bilateral basis with each of the counterparties with whom it undertakes a significant volume of transactions. The ISDA Master Agreement gives each party to the agreement the right to terminate all transactions traded under such agreement if there is a certain deterioration in the credit quality of the other party. Upon an event of default or a termination of the ISDA Master Agreement, the non-defaulting party has the right to close out all transactions traded under such agreement and to net amounts owed under each transaction to one net amount payable by one party to the other. This right to close out and net payments across all transactions traded under the ISDA Master Agreement could result in a reduction of the fund’s credit risk to such counterparty equal to any amounts payable by the fund under the applicable transactions, if any. The fund’s right to setoff may be restricted or prohibited by the bankruptcy or insolvency laws of the particular jurisdiction to which a specific ISDA counterparty is subject.
Collateral and margin requirements differ by type of derivative. Margin requirements are set by the broker or clearing house for cleared derivatives (i.e., futures contracts, cleared swaps, and exchange-traded options) while collateral terms are contract specific for over-the-counter traded derivatives (i.e., forward foreign currency exchange contracts, uncleared swap agreements, and over-the-counter options). For derivatives traded under an ISDA Master Agreement, the collateral requirements are netted across all transactions traded under such agreement and one amount is posted from one party to the other to collateralize such obligations. Cash that has been segregated to cover the fund’s collateral or margin obligations under derivative contracts, if any, will be reported separately in the Statement of Assets and Liabilities as “Restricted cash” or “Deposits with brokers.” Securities pledged as collateral or margin for the same purpose, if any, are noted in the Portfolio of Investments.
Futures Contracts – The fund entered into futures contracts which may be used to hedge against or obtain broad market exposure, interest rate exposure, currency exposure, or to manage duration. A futures contract represents a commitment for the future purchase or sale of an asset at a specified price on a specified date.
Upon entering into a futures contract, the fund is required to deposit with the broker, either in cash or securities, an initial margin in an amount equal to a certain percentage of the notional amount of the contract. Subsequent payments (variation margin) are made or received by the fund each day, depending on the daily fluctuations in the value of the contract, and are recorded for financial statement purposes as unrealized gain or loss by the fund until the contract is closed or expires at which point the gain or loss on futures contracts is realized.
The fund bears the risk of interest rates, exchange rates or securities prices moving unexpectedly, in which case, the fund may not achieve the anticipated benefits of the futures contracts and may realize a loss. While futures contracts may present less counterparty risk to the fund since the contracts are exchange traded and the exchange’s clearinghouse guarantees payments to the broker, there is still counterparty credit risk due to the insolvency of the broker. The fund’s maximum risk of loss due to counterparty credit risk is equal to the margin posted by the fund to the broker plus any gains or minus any losses on the outstanding futures contracts.
Indemnifications – Under the fund’s organizational documents, its officers and Trustees may be indemnified against certain liabilities and expenses arising out of the performance of their duties to the fund. Additionally, in the normal course of business, the fund enters into agreements with service providers that may contain indemnification clauses. The fund’s maximum exposure under these agreements is unknown as this would involve future claims that may be made against the fund that have not yet occurred.
Investment Transactions and Income – Investment transactions are recorded on the trade date. Interest income is recorded on the accrual basis. All premium and discount is amortized or accreted for financial statement purposes in accordance with U.S. generally accepted accounting principles. Interest payments received in additional securities are recorded on the ex-interest date in an amount equal to the value of the security on such date.
The fund may receive proceeds from litigation settlements. Any proceeds received from litigation involving portfolio holdings are reflected in the Statement of Operations in realized gain/loss if the security has been disposed of by the fund or in unrealized gain/loss if the security is still held by the fund. Any other proceeds from litigation not related to portfolio holdings are reflected as other income in the Statement of Operations.
21
MFS Limited Maturity Portfolio
Notes to Financial Statements – continued
The fund invests a significant portion of its assets in asset-backed and/or mortgage-backed securities. The value of these securities may depend, in part, on the issuer’s or borrower’s credit quality or ability to pay principal and interest when due and may fall if an issuer or borrower defaults on its obligation to pay principal or interest or if the instrument’s credit rating is downgraded by a credit rating agency. U.S. Government securities not supported as to the payment of principal or interest by the U.S. Treasury, such as those issued by Fannie Mae, Freddie Mac, and the Federal Home Loan Banks, are subject to greater credit risk than are U.S. Government securities supported by the U.S. Treasury, such as those issued by Ginnie Mae.
The fund purchased or sold debt securities on a when-issued or delayed delivery basis, or in a “To Be Announced” (TBA) or “forward commitment” transaction with delivery or payment to occur at a later date beyond the normal settlement period. At the time a fund enters into a commitment to purchase or sell a security, the transaction is recorded and the value of the security acquired is reflected in the fund’s net asset value. The price of such security and the date that the security will be delivered and paid for are fixed at the time the transaction is negotiated. The value of the security may vary with market fluctuations. No interest accrues to the fund until payment takes place. At the time that a fund enters into this type of transaction, the fund is required to have sufficient cash and/or liquid securities to cover its commitments. Losses may arise due to changes in the value of the underlying securities or if the counterparty does not perform under the contract’s terms, or if the issuer does not issue the securities due to political, economic or other factors. Additionally, losses may arise due to declines in the value of the securities prior to settlement date.
To mitigate this risk of loss on TBA securities and other types of forward settling mortgage-backed securities, the fund whenever possible enters into a Master Securities Forward Transaction Agreement (“MSFTA”) on a bilateral basis with each of the counterparties with whom it undertakes a significant volume of transactions. The MSFTA gives each party to the agreement the right to terminate all transactions traded under such agreement if there is a certain deterioration in the credit quality of the other party. Upon an event of default or a termination of the MSFTA, the non-defaulting party has the right to close out all transactions traded under such agreement and to net amounts owed under each transaction to one net amount payable by one party to the other. This right to close out and net payments across all transactions traded under the MSFTA could result in a reduction of the fund’s credit risk to such counterparty equal to any amounts payable by the fund under the applicable transactions, if any.
For mortgage-backed securities traded under a MSFTA, the collateral and margining requirements are contract specific. Collateral amounts across all transactions traded under such agreement are netted and one amount is posted from one party to the other to collateralize such obligations. Cash that has been pledged to cover the fund’s collateral or margin obligations under a MSFTA, if any, will be reported separately on the Statement of Assets and Liabilities as restricted cash. Securities pledged as collateral or margin for the same purpose, if any, are noted in the Portfolio of Investments.
Fees Paid Indirectly – The fund’s custody fee may be reduced according to an arrangement that measures the value of cash deposited with the custodian by the fund. This amount, for the year ended December 31, 2014, is shown as a reduction of total expenses in the Statement of Operations.
Tax Matters and Distributions – The fund intends to qualify as a regulated investment company, as defined under Subchapter M of the Internal Revenue Code, and to distribute all of its taxable income, including realized capital gains. As a result, no provision for federal income tax is required. The fund’s federal tax returns, when filed, will remain subject to examination by the Internal Revenue Service for a three year period. Management has analyzed the fund’s tax positions taken on federal and state tax returns for all open tax years and does not believe that there are any uncertain tax positions that require recognition of a tax liability. Foreign taxes, if any, have been accrued by the fund in the accompanying financial statements in accordance with the applicable foreign tax law. Foreign income taxes may be withheld by certain countries in which the fund invests. Additionally, capital gains realized by the fund on securities issued in or by certain foreign countries may be subject to capital gains tax imposed by those countries.
Distributions to shareholders are recorded on the ex-dividend date. Income and capital gain distributions are determined in accordance with income tax regulations, which may differ from U.S. generally accepted accounting principles. Certain capital accounts in the financial statements are periodically adjusted for permanent differences in order to reflect their tax character. These adjustments have no impact on net assets or net asset value per share. Temporary differences which arise from recognizing certain items of income, expense, gain or loss in different periods for financial statement and tax purposes will reverse at some time in the future. Distributions in excess of net investment income or net realized gains are temporary overdistributions for financial statement purposes resulting from differences in the recognition or classification of income or distributions for financial statement and tax purposes.
Book/tax differences primarily relate to amortization and accretion of debt securities.
The tax character of distributions declared to shareholders for the last two fiscal years is as follows:
| | | | | | | | |
| | | 12/31/14 | | | 12/31/13 | |
| Ordinary income (including any short-term capital gains) | | | $11,838,525 | | | | $3,548,518 | |
| Long-term capital gains | | | 2,702,881 | | | | — | |
| Total distributions | | | $14,541,406 | | | | $3,548,518 | |
22
MFS Limited Maturity Portfolio
Notes to Financial Statements – continued
The federal tax cost and the tax basis components of distributable earnings were as follows:
| | | | |
| As of 12/31/14 | | | | |
| Cost of investments | | | $833,940,970 | |
| Gross appreciation | | | 4,095,046 | |
| Gross depreciation | | | (1,950,097 | ) |
| Net unrealized appreciation (depreciation) | | | $2,144,949 | |
| Undistributed ordinary income | | | 9,718,446 | |
| Capital loss carryforwards | | | (615,690 | ) |
As of December 31, 2014, the fund had capital loss carryforwards available to offset future realized gains. Such losses are characterized as follows:
| | | | |
| Short-Term | | | $(236,541 | ) |
| Long-Term | | | (379,149 | ) |
| Total | | | $(615,690 | ) |
Under the Regulated Investment Company Modernization Act of 2010 (the “Act”), the above net capital losses may be carried forward indefinitely, and their character is retained as short-term and/or long-term losses. Previously, net capital losses were carried forward for eight years and treated as short-term losses.
Multiple Classes of Shares of Beneficial Interest – The fund offers multiple classes of shares, which differ in their respective distribution and/or service fees. The fund’s income, realized and unrealized gain (loss), and common expenses are allocated to shareholders based on the daily net assets of each class. Dividends are declared separately for each class. Differences in per share dividend rates are generally due to differences in separate class expenses. The fund’s distributions declared to shareholders as reported in the Statements of Changes in Net Assets are presented by class as follows:
| | | | | | | | | | | | | | | | |
| | | From net investment
income | | | From net realized gain on
investments | |
| | | Year ended
12/31/14 | | | Year ended
12/31/13 | | | Year ended
12/31/14 | | | Year ended
12/31/13 | |
| Initial Class | | | $8,586,272 | | | | $943,171 | | | | $2,655,876 | | | | $2,029,100 | |
| Service Class | | | 2,403,426 | | | | — | | | | 895,832 | | | | 576,247 | |
| Total | | | $10,989,698 | | | | $943,171 | | | | $3,551,708 | | | | $2,605,347 | |
| (3) | | Transactions with Affiliates |
Investment Adviser – The fund has an investment advisory agreement with MFS to provide overall investment management and related administrative services and facilities to the fund. The management fee is computed daily and paid monthly at an annual rate of 0.40% of the fund’s average daily net assets.
MFS has agreed in writing to reduce its management fee by a specified amount if certain MFS mutual fund assets exceed thresholds agreed to by MFS and the fund’s Board of Trustees. For the year ended December 31, 2014, this management fee reduction amounted to $41,624, which is included in the reduction of total expenses in the Statement of Operations. The management fee incurred for the year ended December 31, 2014 was equivalent to an annual effective rate of 0.40% of the fund’s average daily net assets.
Distributor – MFS Fund Distributors, Inc. (MFD), a wholly-owned subsidiary of MFS, is the distributor of shares of the fund. The Trustees have adopted a distribution plan for the Service Class shares pursuant to Rule 12b-1 under the Investment Company Act of 1940.
The fund’s distribution plan provides that the fund will pay MFD distribution and/or service fees equal to 0.25% per annum of its average daily net assets attributable to Service Class shares as partial consideration for services performed and expenses incurred by MFD and financial intermediaries (including participating insurance companies that invest in the fund to fund variable annuity and variable life insurance contracts, sponsors of qualified retirement and pension plans that invest in the fund, and affiliates of these participating insurance companies and plan sponsors) in connection with the sale and distribution of the Service Class shares. MFD may subsequently pay all, or a portion, of the distribution and/or service fees to financial intermediaries.
Shareholder Servicing Agent – MFS Service Center, Inc. (MFSC), a wholly-owned subsidiary of MFS, receives a fee from the fund for its services as shareholder servicing agent. For the year ended December 31, 2014, the fee was $19,499, which equated to 0.0021% annually of the fund’s average daily net assets. MFSC also receives payment from the fund for out-of-pocket expenses paid by MFSC on behalf of the fund. For the year ended December 31, 2014, these costs amounted to $94.
Administrator – MFS provides certain financial, legal, shareholder communications, compliance, and other administrative services to the fund. Under an administrative services agreement, the fund partially reimburses MFS the costs incurred to provide these services.
23
MFS Limited Maturity Portfolio
Notes to Financial Statements – continued
The fund is charged an annual fixed amount of $17,500 plus a fee based on average daily net assets. The administrative services fee incurred for the year ended December 31, 2014 was equivalent to an annual effective rate of 0.0145% of the fund’s average daily net assets.
Trustees’ and Officers’ Compensation – The fund pays compensation to independent Trustees in the form of a retainer, attendance fees, and additional compensation to Board and Committee chairpersons. The fund does not pay compensation directly to Trustees or officers of the fund who are also officers of the investment adviser, all of whom receive remuneration for their services to the fund from MFS. Certain officers and Trustees of the fund are officers or directors of MFS, MFD, and MFSC.
Other – Effective November 1, 2014, this fund and certain other funds managed by MFS (the funds) have entered into a service agreement (the ISO Agreement) which provides for payment of fees solely by the funds to Tarantino LLC in return for the provision of services of an Independent Senior Officer (ISO) for the funds. Frank L. Tarantino serves as the ISO and is an officer of the funds and the sole member of Tarantino LLC. The funds can terminate the ISO Agreement with Tarantino LLC at any time under the terms of the ISO Agreement. Prior to November 1, 2014, the funds had entered into services agreements (the Compliance Officer Agreements) which provided for payment of fees by the funds to Tarantino LLC and Griffin Compliance LLC in return for the provision of services of an Independent Chief Compliance Officer (ICCO) and Assistant ICCO, respectively, for the funds. Prior to November 1, 2014, Frank L. Tarantino served as the ICCO. Effective October 31, 2014, Mr. Tarantino resigned as ICCO and the Compliance Officer Agreement between the funds and Tarantino LLC was terminated. Prior to June 1, 2014, Robyn L. Griffin served as the Assistant ICCO and was an officer of the funds. Ms. Griffin is the sole member of Griffin Compliance LLC. Effective May 31, 2014, Ms. Griffin resigned as Assistant ICCO and the Compliance Officer Agreement between the funds and Griffin Compliance LLC was terminated. For the year ended December 31, 2014, the aggregate fees paid by the fund under these agreements were $4,268 and are included in “Miscellaneous” expense in the Statement of Operations. MFS had agreed to reimburse the fund for a portion of the payments made by the fund for the services under the Compliance Officer Agreements in the amount of $1,599, which is included in the reduction of total expenses in the Statement of Operations. Additionally, MFS has agreed to bear all expenses associated with office space, other administrative support, and supplies provided to the ICCO, Assistant ICCO, and ISO.
The fund invests in the MFS Institutional Money Market Portfolio which is managed by MFS and seeks current income consistent with preservation of capital and liquidity. Income earned on this investment is included in “Dividends from underlying affiliated funds” in the Statement of Operations. This money market fund does not pay a management fee to MFS.
For the year ended December 31, 2014, purchases and sales of investments, other than short-term obligations, were as follows:
| | | | | | | | |
| | | Purchases | | | Sales | |
| U.S. Government securities | | | $2,369,365 | | | | $4,155,168 | |
| Investments (non-U.S. Government securities) | | | $209,388,040 | | | | $279,901,828 | |
| (5) | | Shares of Beneficial Interest |
The fund’s Declaration of Trust permits the Trustees to issue an unlimited number of full and fractional shares of beneficial interest. Transactions in fund shares were as follows:
| | | | | | | | | | | | | | | | |
| | | Year ended 12/31/14 | | | Year ended 12/31/13 | |
| | | Shares | | | Amount | | | Shares | | | Amount | |
| Shares sold | | | | | | | | | | | | | | | | |
Initial Class | | | 3,638,547 | | | | $37,683,565 | | | | 9,203,447 | | | | $94,755,012 | |
Service Class | | | 2,020,931 | | | | 20,895,360 | | | | 6,369,137 | | | | 65,433,366 | |
| | | 5,659,478 | | | | $58,578,925 | | | | 15,572,584 | | | | $160,188,378 | |
| Shares issued to shareholders in reinvestment of distributions | | | | | | | | | | | | | | | | |
Initial Class | | | 1,097,866 | | | | $11,242,148 | | | | 290,261 | | | | $2,972,271 | |
Service Class | | | 322,824 | | | | 3,299,258 | | | | 56,384 | | | | 576,247 | |
| | | 1,420,690 | | | | $14,541,406 | | | | 346,645 | | | | $3,548,518 | |
| Shares reacquired | | | | | | | | | | | | | | | | |
Initial Class | | | (12,526,552 | ) | | | $(129,275,889 | ) | | | (10,659,855 | ) | | | $(109,834,785 | ) |
Service Class | | | (3,933,022 | ) | | | (40,499,427 | ) | | | (1,747,855 | ) | | | (17,984,959 | ) |
| | | (16,459,574 | ) | | | $(169,775,316 | ) | | | (12,407,710 | ) | | | $(127,819,744 | ) |
| Net change | | | | | | | | | | | | | | | | |
Initial Class | | | (7,790,139 | ) | | | $(80,350,176 | ) | | | (1,166,147 | ) | | | $(12,107,502 | ) |
Service Class | | | (1,589,267 | ) | | | (16,304,809 | ) | | | 4,677,666 | | | | 48,024,654 | |
| | | (9,379,406 | ) | | | $(96,654,985 | ) | | | 3,511,519 | | | | $35,917,152 | |
24
MFS Limited Maturity Portfolio
Notes to Financial Statements – continued
The fund is one of several mutual funds in which certain MFS funds may invest. The MFS funds do not invest in the underlying funds for the purpose of exercising management or control. At the end of the period, the MFS Conservative Allocation Portfolio, the MFS Moderate Allocation Portfolio, and the MFS Growth Allocation Portfolio were the owners of record of approximately 12%, 10%, and 1%, respectively, of the value of outstanding voting shares of the fund.
The fund and certain other funds managed by MFS participate in a $1.1 billion unsecured committed line of credit, subject to a $1 billion sublimit, provided by a syndication of banks under a credit agreement. Borrowings may be made for temporary financing needs. Interest is charged to each fund, based on its borrowings, generally at a rate equal to the higher of the Federal Reserve funds rate or one month LIBOR plus an agreed upon spread. A commitment fee, based on the average daily, unused portion of the committed line of credit, is allocated among the participating funds at the end of each calendar quarter. In addition, the fund and other funds managed by MFS have established unsecured uncommitted borrowing arrangements with certain banks for temporary financing needs. Interest is charged to each fund, based on its borrowings, at a rate equal to the Federal Reserve funds rate plus an agreed upon spread. For the year ended December 31, 2014, the fund’s commitment fee and interest expense were $3,451 and $0, respectively, and are included in “Miscellaneous” expense in the Statement of Operations.
| (7) | | Transactions in Underlying Affiliated Funds – Affiliated Issuers |
An affiliated issuer may be considered one in which the fund owns 5% or more of the outstanding voting securities, or a company which is under common control. For the purposes of this report, the fund assumes the following to be an affiliated issuer:
| | | | | | | | | | | | | | | | |
| Underlying Affiliated Fund | | Beginning Shares/Par Amount | | | Acquisitions Shares/Par Amount | | | Dispositions Shares/Par Amount | | | Ending Shares/Par Amount | |
| MFS Institutional Money Market Portfolio | | | 24,316,082 | | | | 216,265,185 | | | | (238,223,549 | ) | | | 2,357,718 | |
| | | | |
| Underlying Affiliated Fund | | Realized Gain (Loss) | | | Capital Gain Distributions | | | Dividend Income | | | Ending Value | |
| MFS Institutional Money Market Portfolio | | | $— | | | | $— | | | | $17,004 | | | | $2,357,718 | |
25
MFS Limited Maturity Portfolio
REPORT OF INDEPENDENT REGISTERED PUBLIC ACCOUNTING FIRM
To the Board of Trustees of MFS Variable Insurance Trust III and the Shareholders of
MFS Limited Maturity Portfolio:
We have audited the accompanying statement of assets and liabilities, including the portfolio of investments, of MFS Limited Maturity Portfolio (one of the series of MFS Variable Insurance Trust III) (the “Fund”) as of December 31, 2014, and the related statement of operations for the year then ended, the statements of changes in net assets for each of the two years in the period then ended, and the financial highlights for each of the five years in the period then ended. These financial statements and financial highlights are the responsibility of the Fund’s management. Our responsibility is to express an opinion on these financial statements and financial highlights based on our audits.
We conducted our audits in accordance with the standards of the Public Company Accounting Oversight Board (United States). Those standards require that we plan and perform the audit to obtain reasonable assurance about whether the financial statements and financial highlights are free of material misstatement. The Fund is not required to have, nor were we engaged to perform, an audit of its internal control over financial reporting. Our audits included consideration of internal control over financial reporting as a basis for designing audit procedures that are appropriate in the circumstances, but not for the purpose of expressing an opinion on the effectiveness of the Fund’s internal control over financial reporting. Accordingly, we express no such opinion. An audit also includes examining, on a test basis, evidence supporting the amounts and disclosures in the financial statements, assessing the accounting principles used and significant estimates made by management, as well as evaluating the overall financial statement presentation. Our procedures included confirmation of securities owned as of December 31, 2014, by correspondence with the custodian. We believe that our audits provide a reasonable basis for our opinion.
In our opinion, the financial statements and financial highlights referred to above present fairly, in all material respects, the financial position of MFS Limited Maturity Portfolio as of December 31, 2014, the results of its operations for the year then ended, the changes in its net assets for each of the two years in the period then ended, and the financial highlights for each of the five years in the period then ended, in conformity with accounting principles generally accepted in the United States of America.
DELOITTE & TOUCHE LLP
Boston, Massachusetts
February 13, 2015
26
MFS Limited Maturity Portfolio
TRUSTEES AND OFFICERS – IDENTIFICATION AND BACKGROUND
The Trustees and Officers of the Trust, as of February 1, 2015, are listed below, together with their principal occupations during the past five years. (Their titles may have varied during that period.) The address of each Trustee and Officer is 111 Huntington Avenue, Boston, Massachusetts 02199-7618.
| | | | | | | | |
Name, Age | | Position(s)
Held with Fund | | Trustee/Officer
Since (h) | | Principal Occupations
During the Past Five Years | | Other Directorships (j) |
| INTERESTED TRUSTEES |
Robert J. Manning (k) (age 51) | | Trustee | | February 2004 | | Massachusetts Financial Services Company, Chairman, Co-Chief Executive Officer and Director; President (until 2009); Chief Investment Officer (until 2010) | | N/A |
| | | | |
Robin A. Stelmach (k) (age 53) | | Trustee and President | | January 2014 | | Massachusetts Financial Services Company, Executive Vice President and Chief Operating Officer | | N/A |
| | | |
| INDEPENDENT TRUSTEES | | | | | | |
David H. Gunning (age 72) | | Trustee and Chair of Trustees | | January 2004 | | Private investor | | Lincoln Electric Holdings, Inc. (welding equipment manufacturer), Director; Development Alternatives, Inc. (consulting), Director/Non-Executive Chairman |
| | | | |
Steven E. Buller (age 63) | | Trustee | | February 2014 | | Chairman, Financial Accounting Standards Advisory Council; Standing Advisory Group, Public Company Accounting Oversight Board, Member (until 2014); BlackRock, Inc. (investment management), Managing Director (until 2014), BlackRock Finco UK (investment management), Director (until 2014) | | N/A |
| | | | |
Robert E. Butler (age 73) | | Trustee | | January 2006 | | Consultant – investment company industry regulatory and compliance matters | | N/A |
| | | | |
Maureen R. Goldfarb (age 59) | | Trustee | | January 2009 | | Private investor | | N/A |
| | | | |
William R. Gutow (age 73) | | Trustee | | December 1993 | | Private investor and real estate consultant; Capitol Entertainment Management Company (video franchise), Vice Chairman | | Texas Donuts (donut franchise), Vice Chairman (until 2010) |
| | | | |
Michael Hegarty (age 70) | | Trustee | | December 2004 | | Private investor | | Brookfield Office Properties, Inc. (real estate), Director; Rouse Properties Inc. (real estate), Director; Capmark Financial Group Inc. (real estate), Director |
| | | | |
John P. Kavanaugh (age 60) | | Trustee | | January 2009 | | Private investor | | N/A |
| | | | |
Maryanne L. Roepke (age 58) | | Trustee | | May 2014 | | American Century Investments (investment management), Senior Vice President and Chief Compliance Officer (until 2014) | | N/A |
| | | | |
Laurie J. Thomsen (age 57) | | Trustee | | March 2005 | | Private investor; New Profit, Inc. (venture philanthropy), Executive Partner (until 2010) | | The Travelers Companies (insurance), Director |
| | | | |
Robert W. Uek (age 73) | | Trustee | | January 2006 | | Consultant to investment company industry | | N/A |
| | | | |
| OFFICERS | | | | | | | | |
Christopher R. Bohane (k) (age 41) | | Assistant Secretary and Assistant Clerk | | July 2005 | | Massachusetts Financial Services Company, Vice President and Assistant General Counsel | | N/A |
| | | | |
Kino Clark (k) (age 46) | | Assistant Treasurer | | January 2012 | | Massachusetts Financial Services Company, Vice President | | N/A |
| | | | |
Thomas H. Connors (k) (age 55) | | Assistant Secretary and Assistant Clerk | | September 2012 | | Massachusetts Financial Services Company, Vice President and Senior Counsel; Deutsche Investment Management Americas Inc. (financial service provider), Director and Senior Counsel (until 2012) | | N/A |
27
MFS Limited Maturity Portfolio
Trustees and Officers – continued
| | | | | | | | |
Name, Age | | Position(s)
Held with Fund | | Trustee/Officer
Since (h) | | Principal Occupations
During the Past Five Years | | Other Directorships (j) |
Ethan D. Corey (k) (age 51) | | Assistant
Secretary and Assistant Clerk | | July 2005 | | Massachusetts Financial Services Company, Senior Vice President and Associate General Counsel | | N/A |
| | | | |
David L. DiLorenzo (k) (age 46) | | Treasurer | | July 2005 | | Massachusetts Financial Services Company, Senior Vice President | | N/A |
| | | | |
Timothy M. Fagan (k) (age 46) | | Chief Compliance Officer | | November 2014 | | Massachusetts Financial Services Company, Chief Compliance Officer; Vice President and Senior Counsel (until 2012) | | N/A |
| | | | |
Brian E. Langenfeld (k) (age 41) | | Assistant
Secretary and Assistant Clerk | | June 2006 | | Massachusetts Financial Services Company, Vice President and Senior Counsel | | N/A |
| | | | |
Susan S. Newton (k) (age 64) | | Assistant
Secretary and Assistant Clerk | | May 2005 | | Massachusetts Financial Services Company, Senior Vice President and Associate General Counsel | | N/A |
| | | | |
Susan A. Pereira (k) (age 44) | | Assistant
Secretary and Assistant Clerk | | July 2005 | | Massachusetts Financial Services Company, Vice President and Senior Counsel | | N/A |
| | | | |
Kasey L. Phillips (k) (age 44) | | Assistant Treasurer | | September 2012 | | Massachusetts Financial Services Company, Vice President; Wells Fargo Funds Management, LLC, Senior Vice President, Fund Treasurer (until 2012) | | N/A |
| | | | |
Mark N. Polebaum (k) (age 62) | | Secretary and
Clerk | | January 2006 | | Massachusetts Financial Services Company, Executive Vice President, General Counsel and Secretary | | N/A |
| | | | |
Matthew A. Stowe (k) (age 40) | | Assistant Secretary and Assistant Clerk | | October 2014 | | Massachusetts Financial Services Company, Vice President and Senior Counsel | | N/A |
| | | | |
Frank L. Tarantino (age 70) | | Independent
Senior Officer | | June 2004 | | Tarantino LLC (provider of compliance services), Principal | | N/A |
| | | | |
Richard S. Weitzel (k) (age 44) | | Assistant Secretary and Assistant Clerk | | October 2007 | | Massachusetts Financial Services Company, Senior Vice President and Associate General Counsel | | N/A |
| | | | |
James O. Yost (k) (age 54) | | Deputy Treasurer | | September 1990 | | Massachusetts Financial Services Company, Senior Vice President | | N/A |
| (h) | Date first appointed to serve as Trustee/officer of an MFS Fund. Each Trustee has served continuously since appointment unless indicated otherwise. For the period from December 15, 2004 until February 22, 2005, Mr. Manning served as Advisory Trustee. Prior to January 2012, Messrs. DiLorenzo and Yost served as Assistant Treasurers of the Funds. Ms. Stelmach was appointed as President of the Funds as of October 1, 2014. |
| (j) | Directorships or trusteeships of companies required to report to the Securities and Exchange Commission (i.e., “public companies”). |
| (k) | “Interested person” of the Trust within the meaning of the Investment Company Act of 1940 (referred to as the 1940 Act), which is the principal federal law governing investment companies like the fund, as a result of a position with MFS. The address of MFS is 111 Huntington Avenue, Boston, Massachusetts 02199-7618. |
Each Trustee (except Ms. Stelmach, Mr. Buller and Ms. Roepke) has been elected by shareholders and each Trustee and officer holds office until his or her successor is chosen and qualified or until his or her earlier death, resignation, retirement or removal. The Trust does not hold annual meetings for the purpose of electing Trustees, and Trustees are not elected for fixed terms. Messrs. Butler, Kavanaugh, Uek and Mses. Thomsen and Roepke are members of the Trust’s Audit Committee.
Each of the Fund’s Trustees and officers holds comparable positions with certain other funds of which MFS or a subsidiary is the investment adviser or distributor, and, in the case of the officers, with certain affiliates of MFS. As of February 1, 2015, the Trustees served as board members of 135 funds within the MFS Family of Funds.
28
MFS Limited Maturity Portfolio
Trustees and Officers – continued
The Statement of Additional Information for the Fund includes further information about the Trustees and is available without charge upon request by calling 1-800-225-2606.
| | |
Investment Adviser Massachusetts Financial Services Company 111 Huntington Avenue Boston, MA 02199-7618 | | Custodian State Street Bank and Trust Company 1 Lincoln Street Boston, MA 02111-2900 |
Distributor MFS Fund Distributors, Inc. 111 Huntington Avenue Boston, MA 02199-7618 | | Independent Registered Public Accounting Firm Deloitte & Touche LLP 200 Berkeley Street Boston, MA 02116 |
Portfolio Manager James Calmas | | |
29
MFS Limited Maturity Portfolio
BOARD REVIEW OF INVESTMENT ADVISORY AGREEMENT
The Investment Company Act of 1940 requires that both the full Board of Trustees and a majority of the non-interested (“independent”) Trustees, voting separately, annually approve the continuation of the Fund’s investment advisory agreement with MFS. The Trustees consider matters bearing on the Fund and its advisory arrangements at their meetings throughout the year, including a review of performance data at each regular meeting. In addition, the independent Trustees met several times over the course of three months beginning in May and ending in July, 2014 (“contract review meetings”) for the specific purpose of considering whether to approve the continuation of the investment advisory agreement for the Fund and the other investment companies that the Board oversees (the “MFS Funds”). The independent Trustees were assisted in their evaluation of the Fund’s investment advisory agreement by independent legal counsel, from whom they received separate legal advice and with whom they met separately from MFS during various contract review meetings. The independent Trustees were also assisted in this process by the MFS Funds’ Independent Chief Compliance Officer, a full-time senior officer appointed by and reporting to the independent Trustees.
In connection with their deliberations regarding the continuation of the investment advisory agreement, the Trustees, including the independent Trustees, considered such information and factors as they believed, in light of the legal advice furnished to them and their own business judgment, to be relevant. The investment advisory agreement for the Fund was considered separately, although the Trustees also took into account the common interests of all MFS Funds in their review. As described below, the Trustees considered the nature, quality, and extent of the various investment advisory, administrative, and shareholder services performed by MFS under the existing investment advisory agreement and other arrangements with the Fund.
In connection with their contract review meetings, the Trustees received and relied upon materials that included, among other items: (i) information provided by Lipper Inc., an independent third party, on the investment performance of the Fund for various time periods ended December 31, 2013 and the investment performance of a group of funds with substantially similar investment classifications/objectives (the “Lipper performance universe”), (ii) information provided by Lipper Inc. on the Fund’s advisory fees and other expenses and the advisory fees and other expenses of comparable funds identified by Lipper Inc. (the “Lipper expense group”), (iii) information provided by MFS on the advisory fees of comparable portfolios of other clients of MFS, including institutional separate accounts and other clients, (iv) information as to whether and to what extent applicable expense waivers, reimbursements or fee “breakpoints” are observed for the Fund, (v) information regarding MFS’ financial results and financial condition, including MFS’ and certain of its affiliates’ estimated profitability from services performed for the Fund and the MFS Funds as a whole, and compared to MFS’ institutional business, (vi) MFS’ views regarding the outlook for the mutual fund industry and the strategic business plans of MFS, (vii) descriptions of various functions performed by MFS for the Funds, such as compliance monitoring and portfolio trading practices, and (viii) information regarding the overall organization of MFS, including information about MFS’ senior management and other personnel providing investment advisory, administrative and other services to the Fund and the other MFS Funds. The comparative performance, fee and expense information prepared and provided by Lipper Inc. was not independently verified and the independent Trustees did not independently verify any information provided to them by MFS.
Prior to the close of business on December 7, 2012, the Fund was a series of Sun Capital Advisers Trust and was advised by Sun Capital Advisers LLC, an affiliate of MFS, and subadvised by Goldman Sachs Asset Management, L.P. Following shareholder approval, MFS became the investment adviser of the Fund and assumed day-to-day investment management responsibilities for the Fund effective as of the close of business on December 7, 2012.
The Trustees’ conclusion as to the continuation of the investment advisory agreement was based on a comprehensive consideration of all information provided to the Trustees and not the result of any single factor. Some of the factors that figured particularly in the Trustees’ deliberations are described below, although individual Trustees may have evaluated the information presented differently from one another, giving different weights to various factors. It is also important to recognize that the fee arrangements for the Fund and other MFS Funds are the result of years of review and discussion between the independent Trustees and MFS, that certain aspects of such arrangements may receive greater scrutiny in some years than in others, and that the Trustees’ conclusions may be based, in part, on their consideration of these same arrangements during the course of the year and in prior years.
Based on information provided by Lipper Inc. and MFS, the Trustees reviewed the Fund’s total return investment performance as well as the performance of peer groups of funds over various time periods. The Trustees placed particular emphasis on the total return performance of the Fund’s Initial Class shares in comparison to the performance of funds in its Lipper performance universe over the three-year period ended December 31, 2013, which the Trustees believed was a long enough period to reflect differing market conditions. The total return performance of the Fund’s Initial Class shares was in the 4th quintile relative to the other funds in the universe for this three-year period (the 1st quintile being the best performers and the 5th quintile being the worst performers). The total return performance of the Fund’s Initial Class shares was in the 1st quintile for the one-year period and the 5th quintile for the five-year period ended December 31, 2013 relative to the Lipper performance universe. Because of the passage of time, these performance results may differ from the performance results for more recent periods, including those shown elsewhere in this report.
30
MFS Limited Maturity Portfolio
Board Review of Investment Advisory Agreement – continued
In the course of their deliberations, the Trustees took into account information provided by MFS in connection with the contract review meetings, as well as during investment review meetings conducted with portfolio management personnel during the course of the year regarding the Fund’s performance. The Trustees noted that MFS became the Fund’s investment adviser in December 2012 and that MFS implemented certain changes in the Fund’s investment strategy. After reviewing these and related factors, the Trustees concluded, within the context of their overall conclusions regarding the investment advisory agreement, that they were satisfied with MFS’ responses and efforts relating to investment performance.
In assessing the reasonableness of the Fund’s advisory fee, the Trustees considered, among other information, the Fund’s advisory fee and the total expense ratio of the Fund’s Initial Class shares as a percentage of average daily net assets and the advisory fee and total expense ratios of peer groups of funds based on information provided by Lipper Inc. The Trustees considered that, according to the Lipper data (which takes into account any fee reductions or expense limitations that were in effect during the Fund’s last fiscal year), the Fund’s effective advisory fee rate and total expense ratio were each approximately at the Lipper expense group median.
The Trustees also considered the advisory fees charged by MFS to any comparable institutional accounts. In comparing these fees, the Trustees considered information provided by MFS as to the generally broader scope of services provided by MFS to the Fund in comparison to institutional accounts, the higher demands placed on MFS’ investment personnel and trading infrastructure as a result of the daily cash in-flows and out-flows of the Fund, and the impact on MFS and expenses associated with the more extensive regulatory regime to which the Fund is subject in comparison to institutional accounts.
The Trustees also considered whether the Fund may benefit from any economies of scale in the management of the Fund in the event of growth in assets of the Fund and/or growth in assets of the MFS Funds as a whole. They noted that the Fund’s advisory fee rate schedule is not subject to any breakpoints. Taking into account the Fund’s lower total expense ratio under MFS’ management, effective as of the close of business on December 7, 2012, the Trustees determined not to recommend any advisory fee breakpoints for the Fund at this time. The Trustees also noted that MFS has agreed in writing to waive a portion of the management fees of certain MFS Funds, including the Fund, if the total combined assets of certain funds within the MFS Funds’ complex increase above agreed upon thresholds (the “group fee waiver”), enabling the Fund’s shareholders to share in the benefits from any economies of scale at the complex level. The group fee waiver is reviewed and renewed annually between the Board and MFS. The Trustees concluded that the group fee waiver was sufficient to allow the Fund to benefit from economies of scale as its assets and overall complex assets grow.
The Trustees also considered information prepared by MFS relating to MFS’ costs and profits with respect to the Fund, the MFS Funds considered as a group, and other investment companies and accounts advised by MFS, as well as MFS’ methodologies used to determine and allocate its costs to the MFS Funds, the Fund and other accounts and products for purposes of estimating profitability.
After reviewing these and other factors described herein, the Trustees concluded, within the context of their overall conclusions regarding the investment advisory agreement, that the advisory fees charged to the Fund represent reasonable compensation in light of the services being provided by MFS to the Fund.
In addition, the Trustees considered MFS’ resources and related efforts to continue to retain, attract and motivate capable personnel to serve the Fund. The Trustees also considered current and developing conditions in the financial services industry, including the presence of large and well-capitalized companies which are spending, and appear to be prepared to continue to spend, substantial sums to engage personnel and to provide services to competing investment companies. In this regard, the Trustees also considered the financial resources of MFS and its ultimate parent, Sun Life Financial Inc. The Trustees also considered the advantages and possible disadvantages to the Fund of having an adviser that also serves other investment companies as well as other accounts.
The Trustees also considered the nature, quality, cost, and extent of administrative, transfer agency, and distribution services provided to the Fund by MFS and its affiliates under agreements and plans other than the investment advisory agreement, including any 12b-1 fees the Fund pays to MFS Fund Distributors, Inc., an affiliate of MFS. The Trustees also considered the nature, extent and quality of certain other services MFS performs or arranges for on the Fund’s behalf, which may include securities lending programs, directed expense payment programs, class action recovery programs, and MFS’ interaction with third-party service providers, principally custodians and sub-custodians. The Trustees concluded that the various non-advisory services provided by MFS and its affiliates on behalf of the Fund were satisfactory.
The Trustees also considered benefits to MFS from the use of the Fund’s portfolio brokerage commissions, if applicable, to pay for investment research and various other factors. Additionally, the Trustees considered so-called “fall-out benefits” to MFS such as reputational value derived from serving as investment manager to the Fund.
Based on their evaluation of factors that they deemed to be material, including those factors described above, the Board of Trustees, including the independent Trustees, concluded that the Fund’s investment advisory agreement with MFS should be continued for an additional one-year period, commencing August 1, 2014.
31
MFS Limited Maturity Portfolio
PROXY VOTING POLICIES AND INFORMATION
MFS votes proxies on behalf of the fund pursuant to proxy voting policies and procedures that are available without charge, upon request, by calling 1-800-225-2606, by visiting the Proxy Voting section of mfs.com or by visiting the SEC’s Web site at http://www.sec.gov.
Information regarding how the fund voted proxies relating to portfolio securities during the most recent twelve-month period ended June 30 is available without charge by visiting the Proxy Voting section of mfs.com or by visiting the SEC’s Web site at http://www.sec.gov.
QUARTERLY PORTFOLIO DISCLOSURE
The fund will file a complete schedule of portfolio holdings with the Securities and Exchange Commission (the Commission) for the first and third quarters of each fiscal year on Form N-Q. The fund’s Form N-Q is available on the EDGAR database on the Commission’s Internet Web site at http://www.sec.gov, and may be reviewed and copied at the:
Public Reference Room
Securities and Exchange Commission
100 F Street, NE, Room 1580
Washington, D.C. 20549
Information on the operation of the Public Reference Room may be obtained by calling the Commission at 1-800-SEC-0330. Copies of the fund’s Form N-Q also may be obtained, upon payment of a duplicating fee, by electronic request at the following e-mail address: publicinfo@sec.gov or by writing the Public Reference Section at the above address.
FURTHER INFORMATION
From time to time, MFS may post important information about the fund or the MFS funds on the MFS web site (mfs.com). This information is available by visiting the “Market Commentary” and “Announcements” sub sections in the “Market Outlooks” section of mfs.com or by clicking on the fund’s name under “Variable Insurance Portfolios — VIT III” in the “Products” section of mfs.com.
FEDERAL TAX INFORMATION (unaudited)
The following information is provided pursuant to provisions of the Internal Revenue Code.
The fund designates $2,974,000 as capital gain dividends paid during the fiscal year.
32
rev. 3/11
| | | | |
| FACTS | | WHAT DOES MFS DO WITH YOUR
PERSONAL INFORMATION? | |  |
| | |
| Why? | | Financial companies choose how they share your personal information. Federal law gives consumers the right to limit some but not all sharing. Federal law also requires us to tell you how we collect, share, and protect your personal information. Please read this notice carefully to understand what we do. |
| | |
| What? | | The types of personal information we collect and share depend on the product or service you have with us. This information can include: • Social Security number and account balances • Account transactions and transaction history • Checking account information and wire transfer instructions When you are no longer our customer, we continue to share your information as described in this notice. |
| | |
| How? | | All financial companies need to share customers’ personal information to run their everyday business. In the section below, we list the reasons financial companies can share their customers’ personal information; the reasons MFS chooses to share; and whether you can limit this sharing. |
| | | | |
Reasons we can share your
personal information | | Does MFS share? | | Can you limit this
sharing? |
For our everyday business purposes – such as to process your transactions, maintain your account(s), respond to court orders and legal investigations, or report to credit bureaus | | Yes | | No |
For our marketing purposes – to offer our products and services to you | | No | | We don’t share |
| For joint marketing with other financial companies | | No | | We don’t share |
For our affiliates’ everyday business purposes – information about your transactions and experiences | | No | | We don’t share |
For our affiliates’ everyday business purposes – information about your creditworthiness | | No | | We don’t share |
| For nonaffiliates to market to you | | No | | We don’t share |
| | |
| Questions? | | Call 800-225-2606 or go to mfs.com. |
33
| | |
| Who we are |
| Who is providing this notice? | | MFS Funds, MFS Investment Management, MFS Institutional Advisors, Inc., MFS Fund Distributors, Inc., MFS Heritage Trust Company, and MFS Service Center, Inc. |
| | |
| What we do |
| How does MFS protect my personal information? | | To protect your personal information from unauthorized access and use, we use security measures that comply with federal law. These measures include procedural, electronic, and physical safeguards for the protection of the personal information we collect about you. |
How does MFS
collect my personal information? | | We collect your personal information, for example, when you • open an account or provide account information • direct us to buy securities or direct us to sell your securities • make a wire transfer We also collect your personal information from others, such as credit bureaus, affiliates and other companies. |
| Why can’t I limit all sharing? | | Federal law gives you the right to limit only • sharing for affiliates’ everyday business purposes – information about your creditworthiness • affiliates from using your information to market to you • sharing for nonaffiliates to market to you State laws and individual companies may give you additional rights to limit sharing. |
| | |
| Definitions |
| Affiliates | | Companies related by common ownership or control. They can be financial and nonfinancial companies. • MFS does not share personal information with affiliates, except for everyday business purposes as described on page one of this notice. |
| Nonaffiliates | | Companies not related by common ownership or control. They can be financial and nonfinancial companies. • MFS does not share with nonaffiliates so they can market to you. |
| Joint Marketing | | A formal agreement between nonaffiliated financial companies that together market financial products or services to you. • MFS doesn’t jointly market. |
| | |
| Other important information |
| If you own an MFS product or receive an MFS service in the name of a third party such as a bank or broker-dealer, their privacy policy may apply to you instead of ours. |
34
ANNUAL REPORT
December 31, 2014

MFS® MID CAP VALUE PORTFOLIO
MFS® Variable Insurance Trust III

VMC-ANN
MFS® MID CAP VALUE PORTFOLIO
CONTENTS
The report is prepared for the general information of contract owners. It is authorized for distribution to prospective investors only when preceded or accompanied by a current prospectus.
NOT FDIC INSURED Ÿ MAY LOSE VALUE Ÿ NO BANK OR CREDIT UNION GUARANTEE Ÿ NOT A DEPOSIT Ÿ NOT INSURED BY ANY FEDERAL GOVERNMENT AGENCY OR NCUA/NCUSIF
MFS Mid Cap Value Portfolio
LETTER FROM THE CHAIRMAN

Dear Contract Owners:
As 2015 begins, sharply lower oil prices are reshaping the global economy, adding to deflationary pressures in the eurozone and exacerbating challenges faced by oil exporters such as Russia. The U.S. economy stands on firmer ground, having expanded steadily over the past year. The U.S. labor market has regained momentum, consumer confidence is buoyant and gasoline prices have tumbled, boosting prospects for a stronger economic rebound in 2015.
Other regions are struggling. The eurozone economy is barely expanding, and the European Central Bank (ECB) has introduced large-scale asset purchases.
Despite Japan’s efforts to strengthen its economy, its sales tax increase last spring tipped the country into a recession, leading to additional monetary stimulus from the Bank of Japan. China’s economy is slowing as it transitions to a more sustainable basis, and its growth rate will likely continue to decline.
As always, active risk management is integral to how we at MFS® manage your investments. We use a collaborative process, sharing insights across asset classes, regions and economic sectors. Our global investment team uses a diversified, multidisciplined, long-term approach.
Applying proven principles, such as asset allocation and diversification, can best serve investors over the long term. We are confident that this approach can help you as you work with your financial advisors to reach your goals in the years ahead.
Respectfully,

Robert J. Manning
Chairman
MFS Investment Management
February 13, 2015
The opinions expressed in this letter are subject to change and may not be relied upon for investment advice. No forecasts can be guaranteed.
1
MFS Mid Cap Value Portfolio
PORTFOLIO COMPOSITION
Portfolio structure
| | | | |
| Top ten holdings | | | | |
| Newell Rubbermaid, Inc. | | | 1.3% | |
| NASDAQ OMX Group, Inc. | | | 1.3% | |
| Xerox Corp. | | | 1.1% | |
| Crown Holdings, Inc. | | | 1.1% | |
| Fifth Third Bancorp | | | 1.0% | |
| Stanley Black & Decker, Inc. | | | 1.0% | |
| Molson Coors Brewing Co. | | | 1.0% | |
| Discover Financial Services | | | 1.0% | |
| PerkinElmer, Inc. | | | 1.0% | |
| Quest Diagnostics, Inc. | | | 1.0% | |
| | | | |
| Equity sectors | | | | |
| Financial Services | | | 23.7% | |
| Utilities & Communications | | | 10.7% | |
| Health Care | | | 8.9% | |
| Basic Materials | | | 8.4% | |
| Consumer Staples | | | 7.8% | |
| Technology | | | 7.8% | |
| Industrial Goods & Services | | | 7.5% | |
| Retailing | | | 7.3% | |
| Energy | | | 5.5% | |
| Autos & Housing | | | 4.5% | |
| Leisure | | | 2.8% | |
| Special Products & Services | | | 2.6% | |
| Transportation | | | 1.8% | |
Cash & Other can include cash, other assets less liabilities, offsets to derivative positions, and short-term securities.
Percentages are based on net assets as of 12/31/14.
The portfolio is actively managed and current holdings may be different.
2
MFS Mid Cap Value Portfolio
MANAGEMENT REVIEW
Summary of Results
For the twelve months ended December 31, 2014, Initial Class shares of the MFS Mid Cap Value Portfolio (“fund”) provided a total return of 10.36%, while Service Class shares of the fund provided a total return of 10.16%. These compare with a return of 14.75% over the same period for the fund’s benchmark, the Russell Midcap Value Index.
Market Environment
Early in the period, US equities suffered what proved to be a temporary setback due to concerns over emerging markets as well as what was perceived at the time to be a pause in US economic growth, partially caused by extreme weather events and a weak December 2013 labor market report. Markets soon recovered as the economic pause concluded and investors appeared to have become increasingly comfortable that newly-installed US Federal Reserve (“Fed”) Chair Janet Yellen would not make any substantial changes to the trajectory of Fed monetary policy.
A generally risk-friendly, carry trade environment persisted from February 2014 until mid-year. While geopolitical tensions flared in the Middle East and Russia/Ukraine, any market setbacks were short-lived as improving economic growth in the US, coupled with prospects for easier monetary policy in regions with slowing growth, such as Japan, Europe and China, supported risk assets. For example, the European Central Bank (“ECB”) cut policy interest rates into negative territory and, by the end of the period, expectations were for additional rate cuts and the announcement for non-conventional easing measures. Similarly, the Bank of Japan surprised markets late in the period with fresh stimulus measures given lackluster growth trends. The related decline in developed market government bond yields and credit spreads were also supportive for equity markets. At the end of the period, the US equity market was trading close to all-time highs and US Treasury yields were close to their lows for the period. However, credit markets did not fare as well in the second half of 2014, particularly US high yield and emerging market debt. The higher weightings of oil and gas credits in these asset classes resulted in widening spreads and increased volatility as oil prices began to decline in an accelerated fashion in the fourth quarter.
Detractors from Performance
The combination of an overweight position and weak stock selection in the energy sector detracted from performance relative to the Russell Midcap Value Index. Holdings of poor-performing independent energy company SM Energy (b), offshore drilling contractors Ensco (b) (United Kingdom) and diversified energy company Pacific Drilling (b) (Luxembourg), and an overweight position in shares of energy company Cobalt International Energy, detracted from relative performance. Shares of SM Energy declined during the reporting period due to decreased volume, higher costs and weak energy prices.
Security selection in both the financial services and basic materials sectors also dampened relative results. Within financial services, there were no individual securities that were among the funds’ top relative detractors for the reporting period. Within basic materials, holdings of specialty chemical company FMC (b) and electrode producer Graftech (b)(h) held back relative results. Shares of Graftech depreciated due to a poor pricing environment for graphite, decreased order volume and a decline in market growth.
Stocks in other sectors that detracted from relative performance included an overweight position in shares of toy manufacturer Mattel, not holding strong-performing semiconductor company Micron Technologies, and the timing of the fund’s ownership in shares of office products retailer Staples (h).
The fund’s cash and/or cash equivalents position during the period also held back relative performance. Under normal market conditions, the fund strives to be fully invested and generally holds cash to buy new holdings and to provide liquidity. In a period when equity markets rose, as measured by the fund’s benchmark, holding cash hurt performance versus the benchmark, which has no cash position.
During the reporting period, the fund’s relative currency exposure, resulting primarily from differences between the fund’s and the benchmark’s exposure to holdings of securities denominated in foreign currencies, was another detractor from relative performance. All of MFS’ investment decisions are driven by the fundamentals of each individual opportunity and as such, it is common for our portfolios to have different currency exposure than the benchmark.
Contributors to Performance
Positive stock selection in both the transportation and autos & housing sectors were primary contributors to relative performance during the reporting period. Within the transportation sector, overweight positions in shares of US-based airline companies, Alaska Air and Delta Airlines, contributed to relative performance. Shares of Delta Airlines appreciated steadily throughout the reporting period due to lower fuel costs, positive demand and management’s decision to continue the company’s share repurchase program. Within the autos & housing sector, the fund’s overweight position in automotive parts manufacturer TRW Automotive (h) benefited relative performance as the stock outperformed the benchmark.
3
MFS Mid Cap Value Portfolio
Management Review – continued
Security selection in the retailing sector was another contributor to relative results. Here, the timing of the fund’s ownership in shares of multinational retailer Best Buy (h) and retail drug store chain Rite Aid, and holdings of strong-performing retailer Burlington Stores (b) strengthened relative performance. Shares of Burlington Stores rose as the company reported an increase in same-store-sales, improved consumer demand and positive revenue growth.
Elsewhere, avoiding shares of weak-performing offshore drilling contractor Seadrill, holdings of semiconductor company NXP Semiconductors (b)(h) (Netherlands), and overweight positions in shares of communications company Frontier Communications and food company Pinnacle Foods, contributed to relative results.
Respectfully,
| | |
| Kevin Schmitz | | Brooks Taylor |
| Portfolio Manager | | Portfolio Manager |
| (b) | Security is not a benchmark constituent. |
| (h) | Security was not held in the portfolio at period end. |
The views expressed in this report are those of the portfolio managers only through the end of the period of the report as stated on the cover and do not necessarily reflect the views of MFS or any other person in the MFS organization. These views are subject to change at any time based on market or other conditions, and MFS disclaims any responsibility to update such views. These views may not be relied upon as investment advice or an indication of trading intent on behalf of any MFS portfolio. References to specific securities are not recommendations of such securities, and may not be representative of any MFS portfolio’s current or future investments.
4
MFS Mid Cap Value Portfolio
PERFORMANCE SUMMARY THROUGH 12/31/14
The following chart illustrates the historical performance of the fund in comparison to its benchmark(s). Benchmarks are unmanaged and may not be invested in directly. Benchmark returns do not reflect any fees or expenses. The performance of other share classes will be greater than or less than that of the class depicted below. (See Notes to Performance Summary.)
Performance data shown represents past performance and is no guarantee of future results. Investment return and principal value fluctuate so your units, when sold, may be worth more or less than the original cost; current performance may be lower or higher than quoted. The performance shown does not reflect the deduction of taxes, if any, that a contract holder would pay on fund distributions or the redemption of contract units. The returns for the fund shown also do not reflect the deduction of expenses associated with variable products, such as mortality and expense risk charges, separate account charges, and sales charges imposed by the insurance company separate accounts. Such expenses would reduce the overall returns shown.
Growth of a Hypothetical $10,000 Investment (t)
Total Returns through 12/31/14
Average annual total returns
| | | | | | | | | | | | |
| | | Share Class | | Class inception date | | 1-yr | | 5-yr | | Life (t) | | |
| | | Initial Class | | 3/07/08 | | 10.36% | | 17.09% | | 10.15% | | |
| | | Service Class | | 3/07/08 | | 10.16% | | 16.78% | | 9.87% | | |
| | | | |
| Comparative benchmark | | | | | | | | |
| | | Russell Midcap Value Index (f) | | 14.75% | | 17.43% | | 11.10% | | |
| (f) | Source: FactSet Research Systems Inc. |
| (t) | For the period from the class inception date through the stated period end. (See Notes to Performance Summary.) |
Benchmark Definition
Russell Midcap Value Index – constructed to provide a comprehensive barometer for value securities in the mid-cap segment of the U.S. equity universe. Companies in this index generally have lower price-to-book ratios and lower forecasted growth values.
It is not possible to invest directly in an index.
Notes to Performance Summary
Average annual total return represents the average annual change in value for each share class for the periods presented. Life returns are presented where the share class has less than 10 years of performance history and represent the average annual total return from the class inception date to the stated period end date.
Performance results reflect any applicable expense subsidies and waivers in effect during the periods shown. Without such subsidies and waivers the fund’s performance results would be less favorable. Please see the prospectus and financial statements for complete details. All results are historical and assume the reinvestment of any dividends and capital gains distributions.
Performance prior to close of business December 7, 2012, reflects time periods when another adviser or subadviser was responsible for selecting investments for the fund under a different investment objective and different investment strategies.
Performance results do not include adjustments made for financial reporting purposes in accordance with U.S. generally accepted accounting principles and may differ from amounts reported in the financial highlights.
From time to time the fund may receive proceeds from litigation settlements, without which performance would be lower.
5
MFS Mid Cap Value Portfolio
EXPENSE TABLE
Fund Expenses Borne by the Contract Holders During the Period,
July 1, 2014 through December 31, 2014
As a contract holder of the fund, you incur ongoing costs, including management fees; distribution and/or service (12b-1) fees; and other fund expenses. This example is intended to help you understand your ongoing costs (in dollars) of investing in the fund and to compare these costs with the ongoing costs of investing in other mutual funds.
The example is based on an investment of $1,000 invested at the beginning of the period and held for the entire period July 1, 2014 through December 31, 2014.
Actual Expenses
The first line for each share class in the following table provides information about actual account values and actual expenses. You may use the information in this line, together with the amount you invested, to estimate the expenses that you paid over the period. Simply divide your account value by $1,000 (for example, an $8,600 account value divided by $1,000 = 8.6), then multiply the result by the number in the first line under the heading entitled “Expenses Paid During Period” to estimate the expenses you paid on your account during this period.
Hypothetical Example for Comparison Purposes
The second line for each share class in the following table provides information about hypothetical account values and hypothetical expenses based on the fund’s actual expense ratio and an assumed rate of return of 5% per year before expenses, which is not the fund’s actual return. The hypothetical account values and expenses may not be used to estimate the actual ending account balance or expenses you paid for the period. You may use this information to compare the ongoing costs of investing in the fund and other funds. To do so, compare this 5% hypothetical example with the 5% hypothetical examples that appear in the shareholder reports of the other funds.
Please note that the expenses shown in the table are meant to highlight the fund’s ongoing costs only and do not take into account the fees and expenses imposed under the variable contracts through which your investment in the fund is made. Therefore, the second line for each share class in the table is useful in comparing ongoing costs associated with an investment in vehicles (such as the fund) which fund benefits under variable annuity and variable life insurance contracts and to qualified pension and retirement plans only, and will not help you determine the relative total costs of investing in the fund through variable annuity and variable life insurance contracts. If the fees and expenses imposed under the variable contracts were included, your costs would have been higher.
| | | | | | | | | | | | | | | | | | |
| Share Class | | | | Annualized
Expense Ratio | | | Beginning
Account Value 7/01/14 | | | Ending Account Value 12/31/14 | | | Expenses Paid During Period (p) 7/01/14-12/31/14 | |
| Initial Class | | Actual | | | 0.80% | | | | $1,000.00 | | | | $1,013.86 | | | | $4.06 | |
| | Hypothetical (h) | | | 0.80% | | | | $1,000.00 | | | | $1,021.17 | | | | $4.08 | |
| Service Class | | Actual | | | 1.05% | | | | $1,000.00 | | | | $1,013.38 | | | | $5.33 | |
| | Hypothetical (h) | | | 1.05% | | | | $1,000.00 | | | | $1,019.91 | | | | $5.35 | |
| (h) | 5% class return per year before expenses. |
| (p) | “Expenses Paid During Period” are equal to each class’s annualized expense ratio, as shown above, multiplied by the average account value over the period, multiplied by 184/365 (to reflect the one-half year period). |
6
MFS Mid Cap Value Portfolio
PORTFOLIO OF INVESTMENTS – 12/31/14
The Portfolio of Investments is a complete list of all securities owned by your fund. It is categorized by broad-based asset classes.
| | | | | | | | |
| Issuer | | Shares/Par | | | Value ($) | |
| | | | | | | | |
| COMMON STOCKS – 99.0% | | | | | |
| Aerospace – 1.0% | | | | | | | | |
| MTU Aero Engines Holding AG | | | 18,516 | | | $ | 1,616,758 | |
| Triumph Group, Inc. | | | 29,366 | | | | 1,973,983 | |
| | | | | | | | |
| | | | | | $ | 3,590,741 | |
| | | | | | | | |
| Airlines – 1.3% | | | | | | | | |
| Alaska Air Group, Inc. | | | 30,521 | | | $ | 1,823,935 | |
| Delta Air Lines, Inc. | | | 54,046 | | | | 2,658,523 | |
| | | | | | | | |
| | | | | | $ | 4,482,458 | |
| | | | | | | | |
| Alcoholic Beverages – 1.0% | | | | | | | | |
| Molson Coors Brewing Co. | | | 48,160 | | | $ | 3,588,883 | |
| | | | | | | | |
| Apparel Manufacturers – 1.3% | | | | | | | | |
| Polo Ralph Lauren Corp. | | | 13,130 | | | $ | 2,431,151 | |
| PVH Corp. | | | 18,210 | | | | 2,333,976 | |
| | | | | | | | |
| | | | | | $ | 4,765,127 | |
| | | | | | | | |
| Automotive – 2.1% | | | | | | | | |
| BorgWarner Transmission Systems, Inc. | | | 47,009 | | | $ | 2,583,145 | |
| Delphi Automotive PLC | | | 37,486 | | | | 2,725,982 | |
| Harley-Davidson, Inc. | | | 33,337 | | | | 2,197,242 | |
| | | | | | | | |
| | | | | | $ | 7,506,369 | |
| | | | | | | | |
| Broadcasting – 0.7% | | | | | | | | |
| Interpublic Group of Companies, Inc. | | | 127,310 | | | $ | 2,644,229 | |
| | | | | | | | |
| Brokerage & Asset Managers – 2.5% | |
| Affiliated Managers Group, Inc. (a) | | | 10,580 | | | $ | 2,245,499 | |
| NASDAQ OMX Group, Inc. | | | 100,310 | | | | 4,810,868 | |
| TD Ameritrade Holding Corp. | | | 55,370 | | | | 1,981,139 | |
| | | | | | | | |
| | | | | | $ | 9,037,506 | |
| | | | | | | | |
| Business Services – 2.6% | | | | | | | | |
| Brenntag AG | | | 32,505 | | | $ | 1,829,363 | |
| Equifax, Inc. | | | 28,176 | | | | 2,278,593 | |
| Fidelity National Information Services, Inc. | | | 45,592 | | | | 2,835,822 | |
| Realogy Holdings Corp. (a) | | | 56,986 | | | | 2,535,307 | |
| | | | | | | | |
| | | | | | $ | 9,479,085 | |
| | | | | | | | |
| Chemicals – 0.7% | | | | | | | | |
| Celanese Corp. | | | 40,639 | | | $ | 2,436,714 | |
| | | | | | | | |
| Computer Software – 0.6% | | | | | | | | |
| Symantec Corp. | | | 81,882 | | | $ | 2,100,683 | |
| | | | | | | | |
| Computer Software – Systems – 3.9% | |
| Ingram Micro, Inc., “A” (a) | | | 98,215 | | | $ | 2,714,663 | |
| NCR Corp. (a) | | | 73,290 | | | | 2,135,671 | |
| NICE Systems Ltd., ADR | | | 49,828 | | | | 2,523,788 | |
| Sabre Corp. | | | 134,044 | | | | 2,717,072 | |
| Xerox Corp. | | | 297,360 | | | | 4,121,410 | |
| | | | | | | | |
| | | | | | $ | 14,212,604 | |
| | | | | | | | |
| Construction – 2.4% | | | | | | | | |
| Armstrong World Industries, Inc. (a) | | | 50,313 | | | $ | 2,572,001 | |
| Fortune Brands Home & Security, Inc. | | | 52,851 | | | | 2,392,565 | |
| | | | | | | | |
| Issuer | | Shares/Par | | | Value ($) | |
| | | | | | | | |
| COMMON STOCKS – continued | | | | | |
| Construction – continued | | | | | | | | |
| Stanley Black & Decker, Inc. | | | 38,116 | | | $ | 3,662,185 | |
| | | | | | | | |
| | | | | | $ | 8,626,751 | |
| | | | | | | | |
| Consumer Products – 1.9% | | | | | | | | |
| Newell Rubbermaid, Inc. | | | 127,786 | | | $ | 4,867,369 | |
| Sensient Technologies Corp. | | | 34,710 | | | | 2,094,401 | |
| | | | | | | | |
| | | | | | $ | 6,961,770 | |
| | | | | | | | |
| Containers – 2.8% | | | | | | | | |
| Crown Holdings, Inc. (a) | | | 80,750 | | | $ | 4,110,175 | |
| Graphic Packaging Holding Co. (a) | | | 144,023 | | | | 1,961,593 | |
| Greif, Inc., “A” | | | 36,122 | | | | 1,706,042 | |
| Owens-Illinois, Inc. (a) | | | 85,583 | | | | 2,309,885 | |
| | | | | | | | |
| | | | | | $ | 10,087,695 | |
| | | | | | | | |
| Electrical Equipment – 2.2% | | | | | | | | |
| Pentair PLC | | | 41,053 | | | $ | 2,726,740 | |
| Tyco International PLC | | | 71,378 | | | | 3,130,639 | |
| WESCO International, Inc. (a) | | | 28,929 | | | | 2,204,679 | |
| | | | | | | | |
| | | | | | $ | 8,062,058 | |
| | | | | | | | |
| Electronics – 3.3% | | | | | | | | |
| Altera Corp. | | | 62,223 | | | $ | 2,298,518 | |
| Analog Devices, Inc. | | | 51,349 | | | | 2,850,896 | |
| Avago Technologies Ltd. | | | 9,645 | | | | 970,191 | |
| Freescale Semiconductor Ltd. (a) | | | 38,346 | | | | 967,470 | |
| Keysight Technologies, Inc. (a) | | | 70,363 | | | | 2,376,159 | |
| Microchip Technology, Inc. | | | 52,361 | | | | 2,362,005 | |
| | | | | | | | |
| | | | | | $ | 11,825,239 | |
| | | | | | | | |
| Energy – Independent – 4.2% | | | | | | | | |
| Cimarex Energy Co. | | | 14,355 | | | $ | 1,521,630 | |
| Cobalt International Energy, Inc. (a) | | | 114,359 | | | | 1,016,652 | |
| CONSOL Energy, Inc. | | | 52,672 | | | | 1,780,840 | |
| Energen Corp. | | | 34,270 | | | | 2,185,055 | |
| EQT Corp. | | | 22,373 | | | | 1,693,636 | |
| HollyFrontier Corp. | | | 45,183 | | | | 1,693,459 | |
| Noble Energy, Inc. | | | 37,712 | | | | 1,788,680 | |
| PDC Energy, Inc. (a) | | | 31,346 | | | | 1,293,649 | |
| Peabody Energy Corp. | | | 76,367 | | | | 591,081 | |
| SM Energy Co. | | | 41,465 | | | | 1,599,720 | |
| | | | | | | | |
| | | | | | $ | 15,164,402 | |
| | | | | | | | |
| Entertainment – 1.0% | | | | | | | | |
| AMC Networks, Inc., “A” (a) | | | 27,949 | | | $ | 1,782,308 | |
| Cinemark Holdings, Inc. | | | 51,170 | | | | 1,820,629 | |
| | | | | | | | |
| | | | | | $ | 3,602,937 | |
| | | | | | | | |
| Food & Beverages – 4.9% | | | | | | | | |
| Bunge Ltd. | | | 30,835 | | | $ | 2,803,210 | |
| Coca-Cola Enterprises, Inc. | | | 45,627 | | | | 2,017,626 | |
| Flowers Foods, Inc. | | | 122,478 | | | | 2,350,353 | |
| Ingredion, Inc. | | | 36,947 | | | | 3,134,583 | |
| J.M. Smucker Co. | | | 30,117 | | | | 3,041,215 | |
7
MFS Mid Cap Value Portfolio
Portfolio of Investments – continued
| | | | | | | | |
| Issuer | | Shares/Par | | | Value ($) | |
| | | | | | | | |
| COMMON STOCKS – continued | | | | | |
| Food & Beverages – continued | | | | | | | | |
| Pinnacle Foods, Inc. | | | 77,865 | | | $ | 2,748,635 | |
| Snyders-Lance, Inc. | | | 50,609 | | | | 1,546,105 | |
| | | | | | | | |
| | | | | | $ | 17,641,727 | |
| | | | | | | | |
| Food & Drug Stores – 1.0% | | | | | | | | |
| Empire Co. Ltd. | | | 23,781 | | | $ | 1,793,503 | |
| Rite Aid Corp. (a) | | | 255,175 | | | | 1,918,916 | |
| | | | | | | | |
| | | | | | $ | 3,712,419 | |
| | | | | | | | |
| Gaming & Lodging – 0.5% | | | | | | | | |
| Wynn Resorts Ltd. | | | 11,671 | | | $ | 1,736,178 | |
| | | | | | | | |
| General Merchandise – 0.6% | | | | | | | | |
| Kohl’s Corp. | | | 37,577 | | | $ | 2,293,700 | |
| | | | | | | | |
| Insurance – 7.5% | | | | | | | | |
| Arthur J. Gallagher & Co. | | | 58,250 | | | $ | 2,742,410 | |
| Everest Re Group Ltd. | | | 17,209 | | | | 2,930,693 | |
| Hanover Insurance Group, Inc. | | | 23,962 | | | | 1,708,970 | |
| Hartford Financial Services Group, Inc. | | | 46,807 | | | | 1,951,384 | |
| HCC Insurance Holdings, Inc. | | | 52,893 | | | | 2,830,833 | |
| Lincoln National Corp. | | | 56,001 | | | | 3,229,578 | |
| Symetra Financial Corp. | | | 108,639 | | | | 2,504,129 | |
| Third Point Reinsurance Ltd. (a) | | | 105,465 | | | | 1,528,188 | |
| Unum Group | | | 89,681 | | | | 3,128,073 | |
| Validus Holdings Ltd. | | | 59,199 | | | | 2,460,310 | |
| XL Group PLC | | | 62,234 | | | | 2,138,983 | |
| | | | | | | | |
| | | | | | $ | 27,153,551 | |
| | | | | | | | |
| Leisure & Toys – 0.6% | | | | | | | | |
| Mattel, Inc. | | | 68,926 | | | $ | 2,132,915 | |
| | | | | | | | |
| Machinery & Tools – 4.3% | | | | | | | | |
| Allison Transmission Holdings, Inc. | | | 83,386 | | | $ | 2,826,785 | |
| Cummins, Inc. | | | 14,174 | | | | 2,043,466 | |
| Eaton Corp. PLC | | | 42,671 | | | | 2,899,921 | |
| Joy Global, Inc. | | | 32,833 | | | | 1,527,391 | |
| Oshkosh Corp. | | | 47,118 | | | | 2,292,291 | |
| Regal Beloit Corp. | | | 26,798 | | | | 2,015,210 | |
| SPX Corp. | | | 21,880 | | | | 1,879,930 | |
| | | | | | | | |
| | | | | | $ | 15,484,994 | |
| | | | | | | | |
| Major Banks – 2.7% | | | | | | | | |
| Comerica, Inc. | | | 45,825 | | | $ | 2,146,443 | |
| Huntington Bancshares, Inc. | | | 297,645 | | | | 3,131,225 | |
| KeyCorp | | | 200,955 | | | | 2,793,275 | |
| State Street Corp. | | | 22,243 | | | | 1,746,076 | |
| | | | | | | | |
| | | | | | $ | 9,817,019 | |
| | | | | | | | |
| Medical & Health Technology & Services – 2.4% | |
| AmerisourceBergen Corp. | | | 32,424 | | | $ | 2,923,348 | |
| Quest Diagnostics, Inc. | | | 51,917 | | | | 3,481,554 | |
| Universal Health Services, Inc. | | | 19,018 | | | | 2,115,943 | |
| | | | | | | | |
| | | | | | $ | 8,520,845 | |
| | | | | | | | |
| Medical Equipment – 4.7% | | | | | | | | |
| Agilent Technologies, Inc. | | | 56,761 | | | $ | 2,323,795 | |
| Cooper Cos., Inc. | | | 10,687 | | | | 1,732,256 | |
| | | | | | | | |
| Issuer | | Shares/Par | | | Value ($) | |
| | | | | | | | |
| COMMON STOCKS – continued | | | | | |
| Medical Equipment – continued | | | | | | | | |
| DENTSPLY International, Inc. | | | 54,735 | | | $ | 2,915,733 | |
| PerkinElmer, Inc. | | | 80,343 | | | | 3,513,399 | |
| St. Jude Medical, Inc. | | | 43,049 | | | | 2,799,476 | |
| STERIS Corp. | | | 17,727 | | | | 1,149,596 | |
| Teleflex, Inc. | | | 21,724 | | | | 2,494,350 | |
| | | | | | | | |
| | | | | | $ | 16,928,605 | |
| | | | | | | | |
| Metals & Mining – 0.3% | | | | | | | | |
| United States Steel Corp. | | | 43,558 | | | $ | 1,164,741 | |
| | | | | | | | |
| Natural Gas – Distribution – 1.8% | | | | | | | | |
| NiSource, Inc. | | | 45,437 | | | $ | 1,927,438 | |
| NorthWestern Corp. | | | 39,904 | | | | 2,257,768 | |
| Spectra Energy Corp. | | | 60,755 | | | | 2,205,407 | |
| | | | | | | | |
| | | | | | $ | 6,390,613 | |
| | | | | | | | |
| Natural Gas – Pipeline – 0.6% | | | | | | | | |
| Plains GP Holdings LP | | | 84,469 | | | $ | 2,169,164 | |
| | | | | | | | |
| Oil Services – 1.3% | | | | | | | | |
| Cameron International Corp. (a) | | | 39,393 | | | $ | 1,967,680 | |
| Ensco PLC, “A” | | | 37,923 | | | | 1,135,794 | |
| Pacific Drilling S.A. (a) | | | 175,510 | | | | 814,366 | |
| Tidewater, Inc. | | | 25,623 | | | | 830,441 | |
| | | | | | | | |
| | | | | | $ | 4,748,281 | |
| | | | | | | | |
| Other Banks & Diversified Financials – 6.2% | |
| BB&T Corp. | | | 87,944 | | | $ | 3,420,142 | |
| Discover Financial Services | | | 54,698 | | | | 3,582,172 | |
| Fifth Third Bancorp | | | 181,559 | | | | 3,699,265 | |
| First Republic Bank | | | 41,783 | | | | 2,177,730 | |
| M&T Bank Corp. | | | 17,571 | | | | 2,207,269 | |
| PrivateBancorp, Inc. | | | 83,130 | | | | 2,776,542 | |
| SunTrust Banks, Inc. | | | 50,735 | | | | 2,125,797 | |
| TCF Financial Corp. | | | 158,278 | | | | 2,515,037 | |
| | | | | | | | |
| | | | | | $ | 22,503,954 | |
| | | | | | | | |
| Pharmaceuticals – 1.9% | | | | | | | | |
| Endo International PLC (a) | | | 44,982 | | | $ | 3,244,102 | |
| Hospira, Inc. (a) | | | 31,796 | | | | 1,947,505 | |
| Impax Laboratories, Inc. (a) | | | 50,239 | | | | 1,591,572 | |
| | | | | | | | |
| | | | | | $ | 6,783,179 | |
| | | | | | | | |
| Real Estate – 4.7% | | | | | | | | |
| Annaly Mortgage Management, Inc., REIT | | | 109,191 | | | $ | 1,180,355 | |
| Corporate Office Properties Trust, REIT | | | 90,777 | | | | 2,575,343 | |
| DDR Corp., REIT | | | 109,259 | | | | 2,005,995 | |
| EPR Properties, REIT | | | 45,056 | | | | 2,596,577 | |
| Equity Lifestyle Properties, Inc., REIT | | | 33,489 | | | | 1,726,358 | |
| Medical Properties Trust, Inc., REIT | | | 166,744 | | | | 2,297,732 | |
| Mid-America Apartment Communities, Inc., REIT | | | 31,923 | | | | 2,384,010 | |
| Plum Creek Timber Co. Inc., REIT | | | 54,245 | | | | 2,321,144 | |
| | | | | | | | |
| | | | | | $ | 17,087,514 | |
| | | | | | | | |
| Specialty Chemicals – 4.6% | | | | | | | | |
| Akzo Nobel N.V. | | | 33,616 | | | $ | 2,331,091 | |
| Albemarle Corp. | | | 36,743 | | | | 2,209,357 | |
8
MFS Mid Cap Value Portfolio
Portfolio of Investments – continued
| | | | | | | | |
| Issuer | | Shares/Par | | | Value ($) | |
| | | | | | | | |
| COMMON STOCKS – continued | | | | | |
| Specialty Chemicals – continued | | | | | | | | |
| Axalta Coating Systems Ltd. (a) | | | 112,971 | | | $ | 2,939,505 | |
| FMC Corp. | | | 33,684 | | | | 1,920,999 | |
| H.B. Fuller Co. | | | 49,729 | | | | 2,214,432 | |
| Rockwood Holdings, Inc. | | | 23,755 | | | | 1,871,894 | |
| Valspar Corp. | | | 36,683 | | | | 3,172,346 | |
| | | | | | | | |
| | | | | | $ | 16,659,624 | |
| | | | | | | | |
| Specialty Stores – 4.3% | | | | | | | | |
| AutoZone, Inc. (a) | | | 4,859 | | | $ | 3,008,255 | |
| Bed Bath & Beyond, Inc. (a) | | | 41,275 | | | | 3,143,917 | |
| Burlington Stores, Inc. (a) | | | 38,482 | | | | 1,818,659 | |
| Children’s Place, Inc. | | | 23,998 | | | | 1,367,886 | |
| L Brands, Inc. | | | 37,946 | | | | 3,284,226 | |
| Sally Beauty Holdings, Inc. (a) | | | 94,449 | | | | 2,903,362 | |
| | | | | | | | |
| | | | | | $ | 15,526,305 | |
| | | | | | | | |
| Telephone Services – 1.7% | | | | | | | | |
| COLT Telecom Group S.A. (a) | | | 422,536 | | | $ | 874,058 | |
| Frontier Communications Corp. | | | 347,542 | | | | 2,318,105 | |
| Quebecor, Inc., “B” | | | 58,948 | | | | 1,620,588 | |
| Windstream Holdings, Inc. | | | 176,629 | | | | 1,455,423 | |
| | | | | | | | |
| | | | | | $ | 6,268,174 | |
| | | | | | | | |
| Trucking – 0.6% | | | | | | | | |
| Swift Transportation Co. (a) | | | 73,359 | | | $ | 2,100,268 | |
| | | | | | | | |
| Utilities – Electric Power – 6.3% | | | | | | | | |
| AES Corp. | | | 215,761 | | | $ | 2,971,029 | |
| CMS Energy Corp. | | | 84,997 | | | | 2,953,646 | |
| DTE Energy Co. | | | 27,800 | | | | 2,401,086 | |
| Dynegy, Inc. (a) | | | 53,361 | | | | 1,619,506 | |
| Northeast Utilities | | | 52,183 | | | | 2,792,834 | |
| NRG Energy, Inc. | | | 93,621 | | | | 2,523,086 | |
| OGE Energy Corp. | | | 47,442 | | | | 1,683,242 | |
| Pinnacle West Capital Corp. | | | 45,785 | | | | 3,127,573 | |
| Public Service Enterprise Group, Inc. | | | 67,411 | | | | 2,791,490 | |
| | | | | | | | |
| | | | | | $ | 22,863,492 | |
| | | | | | | | |
Total Common Stocks
(Identified Cost, $287,906,987) | | | | | | $ | 357,862,513 | |
| | | | | | | | |
| | | | | | | | |
| Issuer | | Shares/Par | | | Value ($) | |
| | | | | | | | |
| PREFERRED STOCKS – 0.3% | | | | | |
| Telecommunications – Wireless – 0.3% | |
T Mobile U.S., Inc., 5.5%
(Identified Cost, $1,059,197) (a) | | | 21,228 | | | $ | 1,124,872 | |
| | | | | | | | |
| |
| MONEY MARKET FUNDS – 1.1% | | | | | |
| MFS Institutional Money Market Portfolio, 0.09%, at Cost and Net Asset Value (v) | | | 3,911,676 | | | $ | 3,911,676 | |
| | | | | | | | |
Total Investments
(Identified Cost, $292,877,860) | | | | | | $ | 362,899,061 | |
| | | | | | | | |
OTHER ASSETS, LESS
LIABILITIES – (0.4)% | | | | | | | (1,399,898 | ) |
| | | | | | | | |
| NET ASSETS – 100.0% | | | | | | $ | 361,499,163 | |
| | | | | | | | |
| (a) | | Non-income producing security. |
| (v) | | Underlying affiliated fund that is available only to investment companies managed by MFS. The rate quoted for the MFS Institutional Money Market Portfolio is the annualized seven-day yield of the fund at period end. |
The following abbreviations are used in this report and are defined:
| ADR | | American Depositary Receipt |
| PLC | | Public Limited Company |
| REIT | | Real Estate Investment Trust |
See Notes to Financial Statements
9
MFS Mid Cap Value Portfolio
FINANCIAL STATEMENTS | STATEMENT OF ASSETS AND LIABILITIES
This statement represents your fund’s balance sheet, which details the assets and liabilities comprising the total value of the fund.
| | | | | | | | |
At 12/31/14 | | | | | | | | |
Assets | | | | | | | | |
Investments – | | | | | | | | |
Non-affiliated issuers, at value (identified cost, $288,966,184) | | | $358,987,385 | | | | | |
Underlying affiliated funds, at cost and value | | | 3,911,676 | | | | | |
Total investments, at value (identified cost, $292,877,860) | | | $362,899,061 | | | | | |
Cash | | | 10,214 | | | | | |
Receivables for | | | | | | | | |
Fund shares sold | | | 134,211 | | | | | |
Dividends | | | 424,417 | | | | | |
Other assets | | | 3,289 | | | | | |
Total assets | | | | | | | $363,471,192 | |
Liabilities | | | | | | | | |
Payables for | | | | | | | | |
Investments purchased | | | $852,758 | | | | | |
Fund shares reacquired | | | 1,036,965 | | | | | |
Payable to affiliates | | | | | | | | |
Investment adviser | | | 13,131 | | | | | |
Shareholder servicing costs | | | 38 | | | | | |
Distribution and/or service fees | | | 536 | | | | | |
Payable for independent Trustees’ compensation | | | 45 | | | | | |
Accrued expenses and other liabilities | | | 68,556 | | | | | |
Total liabilities | | | | | | | $1,972,029 | |
Net assets | | | | | | | $361,499,163 | |
Net assets consist of | | | | | | | | |
Paid-in capital | | | $236,799,920 | | | | | |
Unrealized appreciation (depreciation) on investments and translation of assets and liabilities in foreign currencies | | | 70,019,131 | | | | | |
Accumulated net realized gain (loss) on investments and foreign currency | | | 51,457,486 | | | | | |
Undistributed net investment income | | | 3,222,626 | | | | | |
Net assets | | | | | | | $361,499,163 | |
Shares of beneficial interest outstanding | | | | | | | 36,913,666 | |
| | | | | | | | | | | | |
| | | Net assets | | | Shares outstanding | | | Net asset value
per share | |
Initial Class | | | $322,887,949 | | | | 32,948,971 | | | | $9.80 | |
Service Class | | | 38,611,214 | | | | 3,964,695 | | | | 9.74 | |
See Notes to Financial Statements
10
MFS Mid Cap Value Portfolio
FINANCIAL STATEMENTS | STATEMENT OF OPERATIONS
This statement describes how much your fund earned in investment income and accrued in expenses. It also describes any gains and/or losses generated by fund operations.
| | | | | | | | |
Year ended 12/31/14 | | | | | | | | |
Net investment income | | | | | | | | |
Income | | | | | | | | |
Dividends | | | $6,326,833 | | | | | |
Interest | | | 756 | | | | | |
Dividends from underlying affiliated funds | | | 4,028 | | | | | |
Foreign taxes withheld | | | (36,997 | ) | | | | |
Total investment income | | | | | | | $6,294,620 | |
Expenses | | | | | | | | |
Management fee | | | $2,827,009 | | | | | |
Distribution and/or service fees | | | 98,234 | | | | | |
Shareholder servicing costs | | | 8,203 | | | | | |
Administrative services fee | | | 61,136 | | | | | |
Independent Trustees’ compensation | | | 9,320 | | | | | |
Custodian fee | | | 79,712 | | | | | |
Shareholder communications | | | 1,076 | | | | | |
Audit and tax fees | | | 54,428 | | | | | |
Legal fees | | | 3,275 | | | | | |
Miscellaneous | | | 15,413 | | | | | |
Total expenses | | | | | | | $3,157,806 | |
Fees paid indirectly | | | (5 | ) | | | | |
Reduction of expenses by investment adviser | | | (17,954 | ) | | | | |
Net expenses | | | | | | | $3,139,847 | |
Net investment income | | | | | | | $3,154,773 | |
Realized and unrealized gain (loss) on investments and foreign currency | | | | | | | | |
Realized gain (loss) (identified cost basis) | | | | | | | | |
Investments | | | $51,996,894 | | | | | |
Foreign currency | | | (1,413 | ) | | | | |
Net realized gain (loss) on investments and foreign currency | | | | | | | $51,995,481 | |
Change in unrealized appreciation (depreciation) | | | | | | | | |
Investments | | | $(17,387,870 | ) | | | | |
Translation of assets and liabilities in foreign currencies | | | (3,348 | ) | | | | |
Net unrealized gain (loss) on investments and foreign currency translation | | | | | | | $(17,391,218 | ) |
Net realized and unrealized gain (loss) on investments and foreign currency | | | | | | | $34,604,263 | |
Change in net assets from operations | | | | | | | $37,759,036 | |
See Notes to Financial Statements
11
MFS Mid Cap Value Portfolio
FINANCIAL STATEMENTS | STATEMENTS OF CHANGES IN NET ASSETS
These statements describe the increases and/or decreases in net assets resulting from operations, any distributions, and any shareholder transactions.
| | | | | | | | |
For years ended 12/31 | | | 2014 | | | | 2013 | |
Change in net assets | | | | | | | | |
From operations | | | | | | | | |
Net investment income | | | $3,154,773 | | | | $3,665,042 | |
Net realized gain (loss) on investments and foreign currency | | | 51,995,481 | | | | 40,235,613 | |
Net unrealized gain (loss) on investments and foreign currency translation | | | (17,391,218 | ) | | | 74,292,809 | |
Change in net assets from operations | | | $37,759,036 | | | | $118,193,464 | |
Distributions declared to shareholders | | | | | | | | |
From net investment income | | | $(3,607,602 | ) | | | $(4,185,270 | ) |
From net realized gain on investments | | | (40,653,548 | ) | | | (56,212,049 | ) |
Total distributions declared to shareholders | | | $(44,261,150 | ) | | | $(60,397,319 | ) |
Change in net assets from fund share transactions | | | $(18,692,038 | ) | | | $(26,974,422 | ) |
Total change in net assets | | | $(25,194,152 | ) | | | $30,821,723 | |
Net assets | | | | | | | | |
At beginning of period | | | 386,693,315 | | | | 355,871,592 | |
At end of period (including undistributed net investment income of $3,222,626 and
$3,638,484, respectively) | | | $361,499,163 | | | | $386,693,315 | |
See Notes to Financial Statements
12
MFS Mid Cap Value Portfolio
FINANCIAL STATEMENTS | FINANCIAL HIGHLIGHTS
The financial highlights table is intended to help you understand the fund’s financial performance for the past 5 years. Certain information reflects financial results for a single fund share. The total returns in the table represent the rate by which an investor would have earned (or lost) on an investment in the fund share class (assuming reinvestment of all distributions) held for the entire period.
| | | | | | | | | | | | | | | | | | | | |
| Initial Class | | Years ended 12/31 | |
| | | 2014 | | | 2013 | | | 2012 | | | 2011 | | | 2010 | |
Net asset value, beginning of period | | | $10.05 | | | | $8.75 | | | | $8.66 | | | | $9.45 | | | | $7.93 | |
| Income (loss) from investment operations | | | | | | | | | | | | | | | | | | | | |
Net investment income (d) | | | $0.09 | | | | $0.10 | | | | $0.16 | | | | $0.12 | | | | $0.12 | |
Net realized and unrealized gain (loss) on investments
and foreign currency | | | 0.93 | | | | 2.93 | | | | 1.27 | | | | 0.06 | | | | 1.61 | |
Total from investment operations | | | $1.02 | | | | $3.03 | | | | $1.43 | | | | $0.18 | | | | $1.73 | |
| Less distributions declared to shareholders | | | | | | | | | | | | | | | | | | | | |
From net investment income | | | $(0.11 | ) | | | $(0.12 | ) | | | $(0.10 | ) | | | $(0.10 | ) | | | $— | |
From net realized gain on investments | | | (1.16 | ) | | | (1.61 | ) | | | (1.24 | ) | | | (0.87 | ) | | | (0.21 | ) |
Total distributions declared to shareholders | | | $(1.27 | ) | | | $(1.73 | ) | | | $(1.34 | ) | | | $(0.97 | ) | | | $(0.21 | ) |
Net asset value, end of period (x) | | | $9.80 | | | | $10.05 | | | | $8.75 | | | | $8.66 | | | | $9.45 | |
Total return (%) (k)(r)(s)(x) | | | 10.36 | | | | 36.91 | | | | 16.38 | | | | 2.47 | | | | 22.13 | |
Ratios (%) (to average net assets)
and Supplemental data: | | | | | | | | | | | | | | | | | | | | |
Expenses before expense reductions (f) | | | 0.81 | | | | 0.81 | | | | 1.03 | | | | 1.06 | | | | 1.06 | |
Expenses after expense reductions (f) | | | 0.81 | | | | 0.81 | | | | N/A | | | | N/A | | | | N/A | |
Net investment income | | | 0.86 | | | | 0.99 | | | | 1.72 | | | | 1.23 | | | | 1.41 | |
Portfolio turnover | | | 55 | | | | 49 | | | | 229 | | | | 50 | | | | 65 | |
Net assets at end of period (000 omitted) | | | $322,888 | | | | $348,322 | | | | $324,322 | | | | $207,483 | | | | $245,161 | |
See Notes to Financial Statements
13
MFS Mid Cap Value Portfolio
Financial Highlights – continued
| | | | | | | | | | | | | | | | | | | | |
| Service Class | | Years ended 12/31 | |
| | | 2014 | | | 2013 | | | 2012 | | | 2011 | | | 2010 | |
Net asset value, beginning of period | | | $9.99 | | | | $8.71 | | | | $8.63 | | | | $9.41 | | | | $7.93 | |
| Income (loss) from investment operations | | | | | | | | | | | | | | | | | | | | |
Net investment income (d) | | | $0.06 | | | | $0.07 | | | | $0.13 | | | | $0.10 | | | | $0.10 | |
Net realized and unrealized gain (loss) on investments
and foreign currency | | | 0.93 | | | | 2.92 | | | | 1.27 | | | | 0.07 | | | | 1.59 | |
Total from investment operations | | | $0.99 | | | | $2.99 | | | | $1.40 | | | | $0.17 | | | | $1.69 | |
| Less distributions declared to shareholders | | | | | | | | | | | | | | | | | | | | |
From net investment income | | | $(0.08 | ) | | | $(0.10 | ) | | | $(0.08 | ) | | | $(0.08 | ) | | | $— | |
From net realized gain on investments | | | (1.16 | ) | | | (1.61 | ) | | | (1.24 | ) | | | (0.87 | ) | | | (0.21 | ) |
Total distributions declared to shareholders | | | $(1.24 | ) | | | $(1.71 | ) | | | $(1.32 | ) | | | $(0.95 | ) | | | $(0.21 | ) |
Net asset value, end of period (x) | | | $9.74 | | | | $9.99 | | | | $8.71 | | | | $8.63 | | | | $9.41 | |
Total return (%) (k)(r)(s)(x) | | | 10.16 | | | | 36.52 | | | | 16.01 | | | | 2.34 | | | | 21.62 | |
Ratios (%) (to average net assets)
and Supplemental data: | | | | | | | | | | | | | | | | | | | | |
Expenses before expense reductions (f) | | | 1.06 | | | | 1.06 | | | | 1.29 | | | | 1.31 | | | | 1.31 | |
Expenses after expense reductions (f) | | | 1.06 | | | | 1.06 | | | | N/A | | | | N/A | | | | N/A | |
Net investment income | | | 0.62 | | | | 0.75 | | | | 1.38 | | | | 1.02 | | | | 1.18 | |
Portfolio turnover | | | 55 | | | | 49 | | | | 229 | | | | 50 | | | | 65 | |
Net assets at end of period (000 omitted) | | | $38,611 | | | | $38,371 | | | | $31,550 | | | | $30,039 | | | | $26,638 | |
Information prior to the close of business on December 7, 2012, reflects time periods when another adviser or subadviser was responsible for selecting investments for the fund under a different investment objective and different investment strategies.
| (d) | Per share data is based on average shares outstanding. |
| (f) | Ratios do not reflect reductions from fees paid indirectly, if applicable. |
| (k) | The total return does not reflect expenses that apply to separate accounts. Inclusion of these charges would reduce the total return figures for all periods shown. |
| (r) | Certain expenses have been reduced without which performance would have been lower. |
| (s) | From time to time the fund may receive proceeds from litigation settlements, without which performance would be lower. |
| (x) | The net asset values per share and total returns have been calculated on net assets which include adjustments made in accordance with U.S. generally accepted accounting principles required at period end for financial reporting purposes. |
See Notes to Financial Statements
14
MFS Mid Cap Value Portfolio
NOTES TO FINANCIAL STATEMENTS
| (1) | | Business and Organization |
MFS Mid Cap Value Portfolio (the fund) is a diversified series of MFS Variable Insurance Trust III (the trust). The trust is organized as a Delaware statutory trust and is registered under the Investment Company Act of 1940, as amended, as an open-end management investment company. The shareholders of each series of the trust are separate accounts of insurance companies, which offer variable annuity and/or life insurance products, and qualified retirement and pension plans.
The fund is an investment company and accordingly follows the investment company accounting and reporting guidance of the Financial Accounting Standards Board (FASB) Accounting Standards Codification Topic 946 Financial Services – Investment Companies.
| (2) | | Significant Accounting Policies |
General – The preparation of financial statements in conformity with U.S. generally accepted accounting principles requires management to make estimates and assumptions that affect the reported amounts of assets and liabilities, and disclosure of contingent assets and liabilities at the date of the financial statements and the reported amounts of increases and decreases in net assets from operations during the reporting period. Actual results could differ from those estimates. In the preparation of these financial statements, management has evaluated subsequent events occurring after the date of the fund’s Statement of Assets and Liabilities through the date that the financial statements were issued.
In June 2014, FASB issued Accounting Standards Update 2014-11, Transfers and Servicing (Topic 860) – Repurchase-to-Maturity Transactions, Repurchase Financings, and Disclosures (“ASU 2014-11”). ASU 2014-11 changes the accounting for repurchase-to-maturity transactions (i.e., repurchase agreements that settle at the same time as the maturity of the transferred financial asset) and enhances the required disclosures for repurchase agreements and other similar transactions. Although still evaluating the potential impacts of ASU 2014-11 to the fund, management expects that the impact of the fund’s adoption will be limited to additional financial statement disclosures which would first be effective for interim reporting periods beginning after March 15, 2015.
Balance Sheet Offsetting – The fund’s accounting policy with respect to balance sheet offsetting is that, absent an event of default by the counterparty or a termination of the agreement, the International Swaps and Derivatives Association (ISDA) Master Agreement does not result in an offset of reported amounts of financial assets and financial liabilities in the Statement of Assets and Liabilities across transactions between the fund and the applicable counterparty. The fund’s right to setoff may be restricted or prohibited by the bankruptcy or insolvency laws of the particular jurisdiction to which a specific master netting agreement counterparty is subject. Balance sheet offsetting disclosures, to the extent applicable to the fund, have been included in the fund’s Significant Accounting Policies note under the captions for each of the fund’s in-scope financial instruments and transactions.
Investment Valuations – Equity securities, including restricted equity securities, are generally valued at the last sale or official closing price as provided by a third-party pricing service on the market or exchange on which they are primarily traded. Equity securities, for which there were no sales reported that day, are generally valued at the last quoted daily bid quotation as provided by a third-party pricing service on the market or exchange on which such securities are primarily traded. Short-term instruments with a maturity at issuance of 60 days or less may be valued at amortized cost, which approximates market value. Open-end investment companies are generally valued at net asset value per share. Securities and other assets generally valued on the basis of information from a third-party pricing service may also be valued at a broker/dealer bid quotation. Values obtained from third-party pricing services can utilize both transaction data and market information such as yield, quality, coupon rate, maturity, type of issue, trading characteristics, and other market data. The values of foreign securities and other assets and liabilities expressed in foreign currencies are converted to U.S. dollars using the mean of bid and asked prices for rates provided by a third-party pricing service.
The Board of Trustees has delegated primary responsibility for determining or causing to be determined the value of the fund’s investments (including any fair valuation) to the adviser pursuant to valuation policies and procedures approved by the Board. If the adviser determines that reliable market quotations are not readily available, investments are valued at fair value as determined in good faith by the adviser in accordance with such procedures under the oversight of the Board of Trustees. Under the fund’s valuation policies and procedures, market quotations are not considered to be readily available for most types of debt instruments and floating rate loans and many types of derivatives. These investments are generally valued at fair value based on information from third-party pricing services. In addition, investments may be valued at fair value if the adviser determines that an investment’s value has been materially affected by events occurring after the close of the exchange or market on which the investment is principally traded (such as foreign exchange or market) and prior to the determination of the fund’s net asset value, or after the halting of trading of a specific security where trading does not resume prior to the close of the exchange or market on which the security is principally traded. Events that occur on a frequent basis after foreign markets close (such as developments in foreign markets and significant movements in the U.S. markets) and prior to the determination of the fund’s net asset value may be deemed to have a material effect on the value of securities traded in foreign markets. Accordingly, the fund’s foreign equity securities may often be valued at fair value. The adviser generally relies on third-party pricing services or other information (such as the correlation with price movements of similar securities in the same or other markets; the type, cost and investment characteristics of the security; the
15
MFS Mid Cap Value Portfolio
Notes to Financial Statements – continued
business and financial condition of the issuer; and trading and other market data) to assist in determining whether to fair value and at what value to fair value an investment. The value of an investment for purposes of calculating the fund’s net asset value can differ depending on the source and method used to determine value. When fair valuation is used, the value of an investment used to determine the fund’s net asset value may differ from quoted or published prices for the same investment. There can be no assurance that the fund could obtain the fair value assigned to an investment if it were to sell the investment at the same time at which the fund determines its net asset value per share.
Various inputs are used in determining the value of the fund’s assets or liabilities. These inputs are categorized into three broad levels. In certain cases, the inputs used to measure fair value may fall into different levels of the fair value hierarchy. In such cases, an investment’s level within the fair value hierarchy is based on the lowest level of input that is significant to the fair value measurement. The fund’s assessment of the significance of a particular input to the fair value measurement in its entirety requires judgment, and considers factors specific to the investment. Level 1 includes unadjusted quoted prices in active markets for identical assets or liabilities. Level 2 includes other significant observable market-based inputs (including quoted prices for similar securities, interest rates, prepayment speed, and credit risk). Level 3 includes unobservable inputs, which may include the adviser’s own assumptions in determining the fair value of investments. The following is a summary of the levels used as of December 31, 2014 in valuing the fund’s assets or liabilities:
| | | | | | | | | | | | | | | | |
| Investments at Value | | Level 1 | | | Level 2 | | | Level 3 | | | Total | |
| Equity Securities: | | | | | | | | | | | | | | | | |
United States | | | $345,583,863 | | | | $— | | | | $— | | | | $345,583,863 | |
Germany | | | 3,446,129 | | | | — | | | | — | | | | 3,446,129 | |
Canada | | | 3,414,090 | | | | — | | | | — | | | | 3,414,090 | |
Israel | | | 2,523,788 | | | | — | | | | — | | | | 2,523,788 | |
Netherlands | | | — | | | | 2,331,091 | | | | — | | | | 2,331,091 | |
United Kingdom | | | — | | | | 874,058 | | | | — | | | | 874,058 | |
Luxembourg | | | 814,366 | | | | — | | | | — | | | | 814,366 | |
| Mutual Funds | | | 3,911,676 | | | | — | | | | — | | | | 3,911,676 | |
| Total Investments | | | $359,693,912 | | | | $3,205,149 | | | | $— | | | | $362,899,061 | |
For further information regarding security characteristics, see the Portfolio of Investments.
Of the level 2 investments presented above, equity investments amounting to $2,331,091 would have been considered level 1 investments at the beginning of the period. The primary reason for changes in the classifications between levels 1 and 2 occurs when foreign equity securities are fair valued using other observable market-based inputs in place of the closing exchange price due to events occurring after the close of the exchange or market on which the investment is principally traded. The fund’s foreign equity securities may often be valued at fair value. The fund’s policy is to recognize transfers between the levels as of the end of the period.
Foreign Currency Translation – Purchases and sales of foreign investments, income, and expenses are converted into U.S. dollars based upon currency exchange rates prevailing on the respective dates of such transactions or on the reporting date for foreign denominated receivables and payables. Gains and losses attributable to foreign currency exchange rates on sales of securities are recorded for financial statement purposes as net realized gains and losses on investments. Gains and losses attributable to foreign exchange rate movements on receivables, payables, income and expenses are recorded for financial statement purposes as foreign currency transaction gains and losses. That portion of both realized and unrealized gains and losses on investments that results from fluctuations in foreign currency exchange rates is not separately disclosed.
Security Loans – Under its Securities Lending Agency Agreement with the fund, State Street Bank and Trust Company (“State Street”), as lending agent, loans the securities of the fund to certain qualified institutions (the “Borrowers”) approved by the fund. The loans are collateralized by cash and/or U.S. Treasury and federal agency obligations in an amount typically at least equal to the market value of the securities loaned. On loans collateralized by cash, the cash collateral is invested in a money market fund. The market value of the loaned securities is determined at the close of business of the fund and any additional required collateral is delivered to the fund on the next business day. State Street provides the fund with indemnification against Borrower default. In the event of Borrower default, State Street will for the benefit of the fund either purchase securities identical to those loaned or, when such purchase is commercially impracticable, pay the fund the market value of the loaned securities. In return, State Street assumes the fund’s rights to the related collateral. If the collateral value is less than the cost to purchase identical securities, State Street is responsible for the shortfall, but only to the extent that such shortfall is not due to a decline in collateral value resulting from collateral reinvestment for which the fund bears the risk of loss. A portion of the income generated upon investment of the collateral is remitted to the Borrowers, and the remainder is allocated between the fund and the lending agent. On loans collateralized by U.S. Treasury and/or federal agency obligations, a fee is received from the Borrower, and is allocated between the fund and the lending agent. Income from securities lending is included in “Interest” income in the Statement of Operations. The dividend and interest income earned on the securities loaned is accounted for in the same manner as other dividend and interest income. At December 31, 2014, there were no securities on loan or collateral outstanding.
16
MFS Mid Cap Value Portfolio
Notes to Financial Statements – continued
Indemnifications – Under the fund’s organizational documents, its officers and Trustees may be indemnified against certain liabilities and expenses arising out of the performance of their duties to the fund. Additionally, in the normal course of business, the fund enters into agreements with service providers that may contain indemnification clauses. The fund’s maximum exposure under these agreements is unknown as this would involve future claims that may be made against the fund that have not yet occurred.
Investment Transactions and Income – Investment transactions are recorded on the trade date. Interest income is recorded on the accrual basis. Dividends received in cash are recorded on the ex-dividend date. Certain dividends from foreign securities will be recorded when the fund is informed of the dividend if such information is obtained subsequent to the ex-dividend date. Dividend and interest payments received in additional securities are recorded on the ex-dividend or ex-interest date in an amount equal to the value of the security on such date.
The fund may receive proceeds from litigation settlements. Any proceeds received from litigation involving portfolio holdings are reflected in the Statement of Operations in realized gain/loss if the security has been disposed of by the fund or in unrealized gain/loss if the security is still held by the fund. Any other proceeds from litigation not related to portfolio holdings are reflected as other income in the Statement of Operations.
Fees Paid Indirectly – The fund’s custody fee may be reduced according to an arrangement that measures the value of cash deposited with the custodian by the fund. This amount, for the year ended December 31, 2014, is shown as a reduction of total expenses in the Statement of Operations.
Tax Matters and Distributions – The fund intends to qualify as a regulated investment company, as defined under Subchapter M of the Internal Revenue Code, and to distribute all of its taxable income, including realized capital gains. As a result, no provision for federal income tax is required. The fund’s federal tax returns, when filed, will remain subject to examination by the Internal Revenue Service for a three year period. Management has analyzed the fund’s tax positions taken on federal and state tax returns for all open tax years and does not believe that there are any uncertain tax positions that require recognition of a tax liability. Foreign taxes, if any, have been accrued by the fund in the accompanying financial statements in accordance with the applicable foreign tax law. Foreign income taxes may be withheld by certain countries in which the fund invests. Additionally, capital gains realized by the fund on securities issued in or by certain foreign countries may be subject to capital gains tax imposed by those countries.
Distributions to shareholders are recorded on the ex-dividend date. Income and capital gain distributions are determined in accordance with income tax regulations, which may differ from U.S. generally accepted accounting principles. Certain capital accounts in the financial statements are periodically adjusted for permanent differences in order to reflect their tax character. These adjustments have no impact on net assets or net asset value per share. Temporary differences which arise from recognizing certain items of income, expense, gain or loss in different periods for financial statement and tax purposes will reverse at some time in the future. Distributions in excess of net investment income or net realized gains are temporary overdistributions for financial statement purposes resulting from differences in the recognition or classification of income or distributions for financial statement and tax purposes.
Book/tax differences primarily relate to wash sale loss deferrals.
The tax character of distributions declared to shareholders for the last two fiscal years is as follows:
| | | | | | | | |
| | | 12/31/14 | | | 12/31/13 | |
| Ordinary income (including any short-term capital gains) | | | $39,655,875 | | | | $18,154,484 | |
| Long-term capital gains | | | 4,605,275 | | | | 42,242,835 | |
| Total distributions | | | $44,261,150 | | | | $60,397,319 | |
The federal tax cost and the tax basis components of distributable earnings were as follows:
| | | | |
| As of 12/31/14 | | | | |
| Cost of investments | | | $293,632,721 | |
| Gross appreciation | | | 77,464,125 | |
| Gross depreciation | | | (8,197,785 | ) |
| Net unrealized appreciation (depreciation) | | | $69,266,340 | |
| Undistributed ordinary income | | | 14,492,543 | |
| Undistributed long-term capital gain | | | 40,837,436 | |
| Other temporary differences | | | 102,924 | |
Multiple Classes of Shares of Beneficial Interest – The fund offers multiple classes of shares, which differ in their respective distribution and/or service fees. The fund’s income, realized and unrealized gain (loss), and common expenses are allocated to shareholders based on the daily net assets of each class. Dividends are declared separately for each class. Differences in per share
17
MFS Mid Cap Value Portfolio
Notes to Financial Statements – continued
dividend rates are generally due to differences in separate class expenses. The fund’s distributions declared to shareholders as reported in the Statements of Changes in Net Assets are presented by class as follows:
| | | | | | | | | | | | | | | | |
| | | From net investment
income | | | From net realized gain on
investments | |
| | | Year ended
12/31/14 | | | Year ended
12/31/13 | | | Year ended
12/31/14 | | | Year ended
12/31/13 | |
| Initial Class | | | $3,310,973 | | | | $3,842,592 | | | | $36,400,988 | | | | $50,648,239 | |
| Service Class | | | 296,629 | | | | 342,678 | | | | 4,252,560 | | | | 5,563,810 | |
| Total | | | $3,607,602 | | | | $4,185,270 | | | | $40,653,548 | | | | $56,212,049 | |
| (3) | | Transactions with Affiliates |
Investment Adviser – The fund has an investment advisory agreement with MFS to provide overall investment management and related administrative services and facilities to the fund. The management fee is computed daily and paid monthly at the following annual rates:
| | | | |
| First $1 billion of average daily net assets | | | 0.75% | |
| Average daily net assets in excess of $1 billion | | | 0.70% | |
MFS has agreed in writing to reduce its management fee by a specified amount if certain MFS mutual fund assets exceed thresholds agreed to by MFS and the fund’s Board of Trustees. For the year ended December 31, 2014, this management fee reduction amounted to $17,294, which is included in the reduction of total expenses in the Statement of Operations. The management fee incurred for the year ended December 31, 2014 was equivalent to an annual effective rate of 0.75% of the fund’s average daily net assets.
Distributor – MFS Fund Distributors, Inc. (MFD), a wholly-owned subsidiary of MFS, is the distributor of shares of the fund. The Trustees have adopted a distribution plan for the Service Class shares pursuant to Rule 12b-1 under the Investment Company Act of 1940.
The fund’s distribution plan provides that the fund will pay MFD distribution and/or service fees equal to 0.25% per annum of its average daily net assets attributable to Service Class shares as partial consideration for services performed and expenses incurred by MFD and financial intermediaries (including participating insurance companies that invest in the fund to fund variable annuity and variable life insurance contracts, sponsors of qualified retirement and pension plans that invest in the fund, and affiliates of these participating insurance companies and plan sponsors) in connection with the sale and distribution of the Service Class shares. MFD may subsequently pay all, or a portion, of the distribution and/or service fees to financial intermediaries.
Shareholder Servicing Agent – MFS Service Center, Inc. (MFSC), a wholly-owned subsidiary of MFS, receives a fee from the fund for its services as shareholder servicing agent. For the year ended December 31, 2014, the fee was $8,083, which equated to 0.0021% annually of the fund’s average daily net assets. MFSC also receives payment from the fund for out-of-pocket expenses paid by MFSC on behalf of the fund. For the year ended December 31, 2014, these costs amounted to $120.
Administrator – MFS provides certain financial, legal, shareholder communications, compliance, and other administrative services to the fund. Under an administrative services agreement, the fund partially reimburses MFS the costs incurred to provide these services. The fund is charged an annual fixed amount of $17,500 plus a fee based on average daily net assets. The administrative services fee incurred for the year ended December 31, 2014 was equivalent to an annual effective rate of 0.0162% of the fund’s average daily net assets.
Trustees’ and Officers’ Compensation – The fund pays compensation to independent Trustees in the form of a retainer, attendance fees, and additional compensation to Board and Committee chairpersons. The fund does not pay compensation directly to Trustees or officers of the fund who are also officers of the investment adviser, all of whom receive remuneration for their services to the fund from MFS. Certain officers and Trustees of the fund are officers or directors of MFS, MFD, and MFSC.
Other – Effective November 1, 2014, this fund and certain other funds managed by MFS (the funds) have entered into a service agreement (the ISO Agreement) which provides for payment of fees solely by the funds to Tarantino LLC in return for the provision of services of an Independent Senior Officer (ISO) for the funds. Frank L. Tarantino serves as the ISO and is an officer of the funds and the sole member of Tarantino LLC. The funds can terminate the ISO Agreement with Tarantino LLC at any time under the terms of the ISO Agreement. Prior to November 1, 2014, the funds had entered into services agreements (the Compliance Officer Agreements) which provided for payment of fees by the funds to Tarantino LLC and Griffin Compliance LLC in return for the provision of services of an Independent Chief Compliance Officer (ICCO) and Assistant ICCO, respectively, for the funds. Prior to November 1, 2014, Frank L. Tarantino served as the ICCO. Effective October 31, 2014, Mr. Tarantino resigned as ICCO and the Compliance Officer Agreement between the funds and Tarantino LLC was terminated. Prior to June 1, 2014, Robyn L. Griffin served as the Assistant ICCO and was an officer of the funds. Ms. Griffin is the sole member of Griffin Compliance LLC. Effective May 31, 2014, Ms. Griffin resigned as Assistant ICCO and the Compliance Officer Agreement between the funds and Griffin Compliance LLC
18
MFS Mid Cap Value Portfolio
Notes to Financial Statements – continued
was terminated. For the year ended December 31, 2014, the aggregate fees paid by the fund under these agreements were $1,760 and are included in “Miscellaneous” expense in the Statement of Operations. MFS had agreed to reimburse the fund for a portion of the payments made by the fund for the services under the Compliance Officer Agreements in the amount of $660, which is included in the reduction of total expenses in the Statement of Operations. Additionally, MFS has agreed to bear all expenses associated with office space, other administrative support, and supplies provided to the ICCO, Assistant ICCO, and ISO.
The fund invests in the MFS Institutional Money Market Portfolio which is managed by MFS and seeks current income consistent with preservation of capital and liquidity. Income earned on this investment is included in “Dividends from underlying affiliated funds” in the Statement of Operations. This money market fund does not pay a management fee to MFS.
For the year ended December 31, 2014, purchases and sales of investments, other than short-term obligations, aggregated $205,097,906 and $259,211,042, respectively.
| (5) | | Shares of Beneficial Interest |
The fund’s Declaration of Trust permits the Trustees to issue an unlimited number of full and fractional shares of beneficial interest. Transactions in fund shares were as follows:
| | | | | | | | | | | | | | | | |
| | | Year ended 12/31/14 | | | Year ended 12/31/13 | |
| | | Shares | | | Amount | | | Shares | | | Amount | |
| Shares sold | | | | | | | | | | | | | | | | |
Initial Class | | | 460,020 | | | | $4,607,608 | | | | 727,314 | | | | $6,910,340 | |
Service Class | | | 552,652 | | | | 5,509,934 | | | | 615,921 | | | | 6,013,138 | |
| | | 1,012,672 | | | | $10,117,542 | | | | 1,343,235 | | | | $12,923,478 | |
| Shares issued to shareholders in reinvestment of distributions | | | | | | | | | | | | | | | | |
Initial Class | | | 4,123,776 | | | | $39,711,961 | | | | 6,034,422 | | | | $54,490,831 | |
Service Class | | | 474,863 | | | | 4,549,189 | | | | 657,006 | | | | 5,906,488 | |
| | | 4,598,639 | | | | $44,261,150 | | | | 6,691,428 | | | | $60,397,319 | |
| Shares reacquired | | | | | | | | | | | | | | | | |
Initial Class | | | (6,304,637 | ) | | | $(63,964,119 | ) | | | (9,166,948 | ) | | | $(90,010,539 | ) |
Service Class | | | (902,775 | ) | | | (9,106,611 | ) | | | (1,055,462 | ) | | | (10,284,680 | ) |
| | | (7,207,412 | ) | | | $(73,070,730 | ) | | | (10,222,410 | ) | | | $(100,295,219 | ) |
| Net change | | | | | | | | | | | | | | | | |
Initial Class | | | (1,720,841 | ) | | | $(19,644,550 | ) | | | (2,405,212 | ) | | | $(28,609,368 | ) |
Service Class | | | 124,740 | | | | 952,512 | | | | 217,465 | | | | 1,634,946 | |
| | | (1,596,101 | ) | | | $(18,692,038 | ) | | | (2,187,747 | ) | | | $(26,974,422 | ) |
The fund is one of several mutual funds in which certain MFS funds may invest. The MFS funds do not invest in the underlying funds for the purpose of exercising management or control. At the end of the period, the MFS Moderate Allocation Portfolio, the MFS Growth Allocation Portfolio, and the MFS Conservative Allocation Portfolio were the owners of record of approximately 42%, 14%, and 9%, respectively, of the value of outstanding voting shares of the fund.
The fund and certain other funds managed by MFS participate in a $1.1 billion unsecured committed line of credit, subject to a $1 billion sublimit, provided by a syndication of banks under a credit agreement. Borrowings may be made for temporary financing needs. Interest is charged to each fund, based on its borrowings, generally at a rate equal to the higher of the Federal Reserve funds rate or one month LIBOR plus an agreed upon spread. A commitment fee, based on the average daily, unused portion of the committed line of credit, is allocated among the participating funds at the end of each calendar quarter. In addition, the fund and other funds managed by MFS have established unsecured uncommitted borrowing arrangements with certain banks for temporary financing needs. Interest is charged to each fund, based on its borrowings, at a rate equal to the Federal Reserve funds rate plus an agreed upon spread. For the year ended December 31, 2014, the fund’s commitment fee and interest expense were $1,422 and $0, respectively, and are included in “Miscellaneous” expense in the Statement of Operations.
19
MFS Mid Cap Value Portfolio
Notes to Financial Statements – continued
| (7) | | Transactions in Underlying Affiliated Funds – Affiliated Issuers |
An affiliated issuer may be considered one in which the fund owns 5% or more of the outstanding voting securities, or a company which is under common control. For the purposes of this report, the fund assumes the following to be an affiliated issuer:
| | | | | | | | | | | | | | | | |
| Underlying Affiliated Fund | | Beginning Shares/Par Amount | | | Acquisitions Shares/Par Amount | | | Dispositions Shares/Par Amount | | | Ending Shares/Par Amount | |
| MFS Institutional Money Market Portfolio | | | 2,309,015 | | | | 128,307,354 | | | | (126,704,693 | ) | | | 3,911,676 | |
| | | | |
| Underlying Affiliated Fund | | Realized
Gain (Loss) | | | Capital Gain Distributions | | | Dividend Income | | | Ending Value | |
| MFS Institutional Money Market Portfolio | | | $— | | | | $— | | | | $4,028 | | | | $3,911,676 | |
20
MFS Mid Cap Value Portfolio
REPORT OF INDEPENDENT REGISTERED PUBLIC ACCOUNTING FIRM
To the Board of Trustees of MFS Variable Insurance Trust III and the Shareholders of
MFS Mid Cap Value Portfolio:
We have audited the accompanying statement of assets and liabilities, including the portfolio of investments, of MFS Mid Cap Value Portfolio (one of the series of MFS Variable Insurance Trust III) (the “Fund”) as of December 31, 2014, and the related statement of operations for the year then ended, the statements of changes in net assets for each of the two years in the period then ended, and the financial highlights for each of the five years in the period then ended. These financial statements and financial highlights are the responsibility of the Fund’s management. Our responsibility is to express an opinion on these financial statements and financial highlights based on our audits.
We conducted our audits in accordance with the standards of the Public Company Accounting Oversight Board (United States). Those standards require that we plan and perform the audit to obtain reasonable assurance about whether the financial statements and financial highlights are free of material misstatement. The Fund is not required to have, nor were we engaged to perform, an audit of its internal control over financial reporting. Our audits included consideration of internal control over financial reporting as a basis for designing audit procedures that are appropriate in the circumstances, but not for the purpose of expressing an opinion on the effectiveness of the Fund’s internal control over financial reporting. Accordingly, we express no such opinion. An audit also includes examining, on a test basis, evidence supporting the amounts and disclosures in the financial statements, assessing the accounting principles used and significant estimates made by management, as well as evaluating the overall financial statement presentation. Our procedures included confirmation of securities owned as of December 31, 2014, by correspondence with the custodian and brokers; where replies were not received from brokers, we performed other auditing procedures. We believe that our audits provide a reasonable basis for our opinion.
In our opinion, the financial statements and financial highlights referred to above present fairly, in all material respects, the financial position of MFS Mid Cap Value Portfolio as of December 31, 2014, the results of its operations for the year then ended, the changes in its net assets for each of the two years in the period then ended, and the financial highlights for each of the five years in the period then ended, in conformity with accounting principles generally accepted in the United States of America.
DELOITTE & TOUCHE LLP
Boston, Massachusetts
February 13, 2015
21
MFS Mid Cap Value Portfolio
TRUSTEES AND OFFICERS – IDENTIFICATION AND BACKGROUND
The Trustees and Officers of the Trust, as of February 1, 2015, are listed below, together with their principal occupations during the past five years. (Their titles may have varied during that period.) The address of each Trustee and Officer is 111 Huntington Avenue, Boston, Massachusetts 02199-7618.
| | | | | | | | |
Name, Age | | Position(s)
Held with Fund | | Trustee/Officer
Since (h) | | Principal Occupations
During the Past Five Years | | Other Directorships (j) |
| INTERESTED TRUSTEES |
Robert J. Manning (k) (age 51) | | Trustee | | February 2004 | | Massachusetts Financial Services Company, Chairman, Co-Chief Executive Officer and Director; President (until 2009); Chief Investment Officer (until 2010) | | N/A |
| | | | |
Robin A. Stelmach (k) (age 53) | | Trustee and President | | January 2014 | | Massachusetts Financial Services Company, Executive Vice President and Chief Operating Officer | | N/A |
| | | |
| INDEPENDENT TRUSTEES | | | | | | |
David H. Gunning (age 72) | | Trustee and Chair of Trustees | | January 2004 | | Private investor | | Lincoln Electric Holdings, Inc. (welding equipment manufacturer), Director; Development Alternatives, Inc. (consulting), Director/Non-Executive Chairman |
| | | | |
Steven E. Buller (age 63) | | Trustee | | February 2014 | | Chairman, Financial Accounting Standards Advisory Council; Standing Advisory Group, Public Company Accounting Oversight Board, Member (until 2014); BlackRock, Inc. (investment management), Managing Director (until 2014), BlackRock Finco UK (investment management), Director (until 2014) | | N/A |
| | | | |
Robert E. Butler (age 73) | | Trustee | | January 2006 | | Consultant – investment company industry regulatory and compliance matters | | N/A |
| | | | |
Maureen R. Goldfarb (age 59) | | Trustee | | January 2009 | | Private investor | | N/A |
| | | | |
William R. Gutow (age 73) | | Trustee | | December 1993 | | Private investor and real estate consultant; Capitol Entertainment Management Company (video franchise), Vice Chairman | | Texas Donuts (donut franchise), Vice Chairman (until 2010) |
| | | | |
Michael Hegarty (age 70) | | Trustee | | December 2004 | | Private investor | | Brookfield Office Properties, Inc. (real estate), Director; Rouse Properties Inc. (real estate), Director; Capmark Financial Group Inc. (real estate), Director |
| | | | |
John P. Kavanaugh (age 60) | | Trustee | | January 2009 | | Private investor | | N/A |
| | | | |
Maryanne L. Roepke (age 58) | | Trustee | | May 2014 | | American Century Investments (investment management), Senior Vice President and Chief Compliance Officer (until 2014) | | N/A |
| | | | |
Laurie J. Thomsen (age 57) | | Trustee | | March 2005 | | Private investor; New Profit, Inc. (venture philanthropy), Executive Partner (until 2010) | | The Travelers Companies (insurance), Director |
| | | | |
Robert W. Uek (age 73) | | Trustee | | January 2006 | | Consultant to investment company industry | | N/A |
| | | | |
| OFFICERS | | | | | | | | |
Christopher R. Bohane (k) (age 41) | | Assistant Secretary and Assistant Clerk | | July 2005 | | Massachusetts Financial Services Company, Vice President and Assistant General Counsel | | N/A |
| | | | |
Kino Clark (k) (age 46) | | Assistant Treasurer | | January 2012 | | Massachusetts Financial Services Company, Vice President | | N/A |
| | | | |
Thomas H. Connors (k) (age 55) | | Assistant Secretary and Assistant Clerk | | September 2012 | | Massachusetts Financial Services Company, Vice President and Senior Counsel; Deutsche Investment Management Americas Inc. (financial service provider), Director and Senior Counsel (until 2012) | | N/A |
22
MFS Mid Cap Value Portfolio
Trustees and Officers – continued
| | | | | | | | |
Name, Age | | Position(s)
Held with Fund | | Trustee/Officer
Since (h) | | Principal Occupations
During the Past Five Years | | Other Directorships (j) |
Ethan D. Corey (k) (age 51) | | Assistant
Secretary and Assistant Clerk | | July 2005 | | Massachusetts Financial Services Company, Senior Vice President and Associate General Counsel | | N/A |
| | | | |
David L. DiLorenzo (k) (age 46) | | Treasurer | | July 2005 | | Massachusetts Financial Services Company, Senior Vice President | | N/A |
| | | | |
Timothy M. Fagan (k) (age 46) | | Chief Compliance Officer | | November 2014 | | Massachusetts Financial Services Company, Chief Compliance Officer; Vice President and Senior Counsel (until 2012) | | N/A |
| | | | |
Brian E. Langenfeld (k) (age 41) | | Assistant
Secretary and Assistant Clerk | | June 2006 | | Massachusetts Financial Services Company, Vice President and Senior Counsel | | N/A |
| | | | |
Susan S. Newton (k) (age 64) | | Assistant
Secretary and Assistant Clerk | | May 2005 | | Massachusetts Financial Services Company, Senior Vice President and Associate General Counsel | | N/A |
| | | | |
Susan A. Pereira (k) (age 44) | | Assistant
Secretary and Assistant Clerk | | July 2005 | | Massachusetts Financial Services Company, Vice President and Senior Counsel | | N/A |
| | | | |
Kasey L. Phillips (k) (age 44) | | Assistant Treasurer | | September 2012 | | Massachusetts Financial Services Company, Vice President; Wells Fargo Funds Management, LLC, Senior Vice President, Fund Treasurer (until 2012) | | N/A |
| | | | |
Mark N. Polebaum (k) (age 62) | | Secretary and
Clerk | | January 2006 | | Massachusetts Financial Services Company, Executive Vice President, General Counsel and Secretary | | N/A |
| | | | |
Matthew A. Stowe (k) (age 40) | | Assistant Secretary and Assistant Clerk | | October 2014 | | Massachusetts Financial Services Company, Vice President and Senior Counsel | | N/A |
| | | | |
Frank L. Tarantino (age 70) | | Independent
Senior Officer | | June 2004 | | Tarantino LLC (provider of compliance services), Principal | | N/A |
| | | | |
Richard S. Weitzel (k) (age 44) | | Assistant Secretary and Assistant Clerk | | October 2007 | | Massachusetts Financial Services Company, Senior Vice President and Associate General Counsel | | N/A |
| | | | |
James O. Yost (k) (age 54) | | Deputy Treasurer | | September 1990 | | Massachusetts Financial Services Company, Senior Vice President | | N/A |
| (h) | Date first appointed to serve as Trustee/officer of an MFS Fund. Each Trustee has served continuously since appointment unless indicated otherwise. For the period from December 15, 2004 until February 22, 2005, Mr. Manning served as Advisory Trustee. Prior to January 2012, Messrs. DiLorenzo and Yost served as Assistant Treasurers of the Funds. Ms. Stelmach was appointed as President of the Funds as of October 1, 2014. |
| (j) | Directorships or trusteeships of companies required to report to the Securities and Exchange Commission (i.e., “public companies”). |
| (k) | “Interested person” of the Trust within the meaning of the Investment Company Act of 1940 (referred to as the 1940 Act), which is the principal federal law governing investment companies like the fund, as a result of a position with MFS. The address of MFS is 111 Huntington Avenue, Boston, Massachusetts 02199-7618. |
Each Trustee (except Ms. Stelmach, Mr. Buller and Ms. Roepke) has been elected by shareholders and each Trustee and officer holds office until his or her successor is chosen and qualified or until his or her earlier death, resignation, retirement or removal. The Trust does not hold annual meetings for the purpose of electing Trustees, and Trustees are not elected for fixed terms. Messrs. Butler, Kavanaugh, Uek and Mses. Thomsen and Roepke are members of the Trust’s Audit Committee.
Each of the Fund’s Trustees and officers holds comparable positions with certain other funds of which MFS or a subsidiary is the investment adviser or distributor, and, in the case of the officers, with certain affiliates of MFS. As of February 1, 2015, the Trustees served as board members of 135 funds within the MFS Family of Funds.
23
MFS Mid Cap Value Portfolio
Trustees and Officers – continued
The Statement of Additional Information for the Fund includes further information about the Trustees and is available without charge upon request by calling 1-800-225-2606.
| | |
Investment Adviser Massachusetts Financial Services Company 111 Huntington Avenue Boston, MA 02199-7618 | | Custodian State Street Bank and Trust Company 1 Lincoln Street Boston, MA 02111-2900 |
Distributor MFS Fund Distributors, Inc. 111 Huntington Avenue Boston, MA 02199-7618 | | Independent Registered Public Accounting Firm Deloitte & Touche LLP 200 Berkeley Street Boston, MA 02116 |
Portfolio Managers Kevin Schmitz Brooks Taylor | | |
24
MFS Mid Cap Value Portfolio
BOARD REVIEW OF INVESTMENT ADVISORY AGREEMENT
The Investment Company Act of 1940 requires that both the full Board of Trustees and a majority of the non-interested (“independent”) Trustees, voting separately, annually approve the continuation of the Fund’s investment advisory agreement with MFS. The Trustees consider matters bearing on the Fund and its advisory arrangements at their meetings throughout the year, including a review of performance data at each regular meeting. In addition, the independent Trustees met several times over the course of three months beginning in May and ending in July, 2014 (“contract review meetings”) for the specific purpose of considering whether to approve the continuation of the investment advisory agreement for the Fund and the other investment companies that the Board oversees (the “MFS Funds”). The independent Trustees were assisted in their evaluation of the Fund’s investment advisory agreement by independent legal counsel, from whom they received separate legal advice and with whom they met separately from MFS during various contract review meetings. The independent Trustees were also assisted in this process by the MFS Funds’ Independent Chief Compliance Officer, a full-time senior officer appointed by and reporting to the independent Trustees.
In connection with their deliberations regarding the continuation of the investment advisory agreement, the Trustees, including the independent Trustees, considered such information and factors as they believed, in light of the legal advice furnished to them and their own business judgment, to be relevant. The investment advisory agreement for the Fund was considered separately, although the Trustees also took into account the common interests of all MFS Funds in their review. As described below, the Trustees considered the nature, quality, and extent of the various investment advisory, administrative, and shareholder services performed by MFS under the existing investment advisory agreement and other arrangements with the Fund.
In connection with their contract review meetings, the Trustees received and relied upon materials that included, among other items: (i) information provided by Lipper Inc., an independent third party, on the investment performance of the Fund for various time periods ended December 31, 2013 and the investment performance of a group of funds with substantially similar investment classifications/objectives (the “Lipper performance universe”), (ii) information provided by Lipper Inc. on the Fund’s advisory fees and other expenses and the advisory fees and other expenses of comparable funds identified by Lipper Inc. (the “Lipper expense group”), (iii) information provided by MFS on the advisory fees of comparable portfolios of other clients of MFS, including institutional separate accounts and other clients, (iv) information as to whether and to what extent applicable expense waivers, reimbursements or fee “breakpoints” are observed for the Fund, (v) information regarding MFS’ financial results and financial condition, including MFS’ and certain of its affiliates’ estimated profitability from services performed for the Fund and the MFS Funds as a whole, and compared to MFS’ institutional business, (vi) MFS’ views regarding the outlook for the mutual fund industry and the strategic business plans of MFS, (vii) descriptions of various functions performed by MFS for the Funds, such as compliance monitoring and portfolio trading practices, and (viii) information regarding the overall organization of MFS, including information about MFS’ senior management and other personnel providing investment advisory, administrative and other services to the Fund and the other MFS Funds. The comparative performance, fee and expense information prepared and provided by Lipper Inc. was not independently verified and the independent Trustees did not independently verify any information provided to them by MFS.
Prior to the close of business on December 7, 2012, the Fund was a series of Sun Capital Advisers Trust and was advised by Sun Capital Advisers LLC (“Sun Capital”), an affiliate of MFS, and subadvised by Goldman Sachs Asset Management, L.P. Following shareholder approval, MFS became the investment adviser of the Fund and assumed day-to-day investment management responsibilities for the Fund effective as of the close of business on December 7, 2012.
The Trustees’ conclusion as to the continuation of the investment advisory agreement was based on a comprehensive consideration of all information provided to the Trustees and not the result of any single factor. Some of the factors that figured particularly in the Trustees’ deliberations are described below, although individual Trustees may have evaluated the information presented differently from one another, giving different weights to various factors. It is also important to recognize that the fee arrangements for the Fund and other MFS Funds are the result of years of review and discussion between the independent Trustees and MFS, that certain aspects of such arrangements may receive greater scrutiny in some years than in others, and that the Trustees’ conclusions may be based, in part, on their consideration of these same arrangements during the course of the year and in prior years.
Based on information provided by Lipper Inc. and MFS, the Trustees reviewed the Fund’s total return investment performance as well as the performance of peer groups of funds over various time periods. The Trustees placed particular emphasis on the total return performance of the Fund’s Initial Class shares in comparison to the performance of funds in its Lipper performance universe over the three-year period ended December 31, 2013, which the Trustees believed was a long enough period to reflect differing market conditions. The total return performance of the Fund’s Initial Class shares was in the 1st quintile relative to the other funds in the universe for this three-year period (the 1st quintile being the best performers and the 5th quintile being the worst performers). The total return performance of the Fund’s Initial Class shares was in the 2nd quintile for the one-year period and the 4th quintile for the five-year period ended December 31, 2013 relative to the Lipper performance universe. Because of the passage of time, these performance results may differ from the performance results for more recent periods, including those shown elsewhere in this report.
25
MFS Mid Cap Value Portfolio
Board Review of Investment Advisory Agreement – continued
In the course of their deliberations, the Trustees took into account information provided by MFS in connection with the contract review meetings, as well as during investment review meetings conducted with portfolio management personnel during the course of the year regarding the Fund’s performance. The Trustees noted that MFS became the Fund’s investment advisor in December 2012 and that MFS implemented certain changes in the Fund’s investment strategy. After reviewing these and related factors, the Trustees concluded, within the context of their overall conclusions regarding the investment advisory agreement, that they were satisfied with MFS’ responses and efforts relating to investment performance.
In assessing the reasonableness of the Fund’s advisory fee, the Trustees considered, among other information, the Fund’s advisory fee and the total expense ratio of the Fund’s Initial Class shares as a percentage of average daily net assets and the advisory fee and total expense ratios of peer groups of funds based on information provided by Lipper Inc. The Trustees considered that, according to the Lipper data (which takes into account any fee reductions or expense limitations that were in effect during the Fund’s last fiscal year), the Fund’s effective advisory fee rate and total expense ratio were each lower than the Lipper expense group median.
The Trustees also considered the advisory fees charged by MFS to any comparable institutional accounts. In comparing these fees, the Trustees considered information provided by MFS as to the generally broader scope of services provided by MFS to the Fund in comparison to institutional accounts, the higher demands placed on MFS’ investment personnel and trading infrastructure as a result of the daily cash in-flows and out-flows of the Fund, and the impact on MFS and expenses associated with the more extensive regulatory regime to which the Fund is subject in comparison to institutional accounts.
The Trustees also considered whether the Fund may benefit from any economies of scale in the management of the Fund in the event of growth in assets of the Fund and/or growth in assets of the MFS Funds as a whole. They noted that the Fund’s advisory fee rate schedule is subject to a contractual breakpoint that reduces the Fund’s advisory fee rate on average daily net assets over $1 billion. The Trustees also noted that MFS has agreed in writing to waive a portion of the management fees of certain MFS Funds, including the Fund, if the total combined assets of certain funds within the MFS Funds’ complex increase above agreed upon thresholds (the “group fee waiver”), enabling the Fund’s shareholders to share in the benefits from any economies of scale at the complex level. The group fee waiver is reviewed and renewed annually between the Board and MFS. The Trustees concluded that the breakpoint and the group fee waiver were sufficient to allow the Fund to benefit from economies of scale as its assets and overall complex assets grow.
The Trustees also considered information prepared by MFS relating to MFS’ costs and profits with respect to the Fund, the MFS Funds considered as a group, and other investment companies and accounts advised by MFS, as well as MFS’ methodologies used to determine and allocate its costs to the MFS Funds, the Fund and other accounts and products for purposes of estimating profitability.
After reviewing these and other factors described herein, the Trustees concluded, within the context of their overall conclusions regarding the investment advisory agreement, that the advisory fees charged to the Fund represent reasonable compensation in light of the services being provided by MFS to the Fund.
In addition, the Trustees considered MFS’ resources and related efforts to continue to retain, attract and motivate capable personnel to serve the Fund. The Trustees also considered current and developing conditions in the financial services industry, including the presence of large and well-capitalized companies which are spending, and appear to be prepared to continue to spend, substantial sums to engage personnel and to provide services to competing investment companies. In this regard, the Trustees also considered the financial resources of MFS and its ultimate parent, Sun Life Financial Inc. The Trustees also considered the advantages and possible disadvantages to the Fund of having an adviser that also serves other investment companies as well as other accounts.
The Trustees also considered the nature, quality, cost, and extent of administrative, transfer agency, and distribution services provided to the Fund by MFS and its affiliates under agreements and plans other than the investment advisory agreement, including any 12b-1 fees the Fund pays to MFS Fund Distributors, Inc., an affiliate of MFS. The Trustees also considered the nature, extent and quality of certain other services MFS performs or arranges for on the Fund’s behalf, which may include securities lending programs, directed expense payment programs, class action recovery programs, and MFS’ interaction with third-party service providers, principally custodians and sub-custodians. The Trustees concluded that the various non-advisory services provided by MFS and its affiliates on behalf of the Fund were satisfactory.
The Trustees also considered benefits to MFS from the use of the Fund’s portfolio brokerage commissions, if applicable, to pay for investment research and various other factors. Additionally, the Trustees considered so-called “fall-out benefits” to MFS such as reputational value derived from serving as investment manager to the Fund.
Based on their evaluation of factors that they deemed to be material, including those factors described above, the Board of Trustees, including the independent Trustees, concluded that the Fund’s investment advisory agreement with MFS should be continued for an additional one-year period, commencing August 1, 2014.
26
MFS Mid Cap Value Portfolio
PROXY VOTING POLICIES AND INFORMATION
MFS votes proxies on behalf of the fund pursuant to proxy voting policies and procedures that are available without charge, upon request, by calling 1-800-225-2606, by visiting the Proxy Voting section of mfs.com or by visiting the SEC’s Web site at http://www.sec.gov.
Information regarding how the fund voted proxies relating to portfolio securities during the most recent twelve-month period ended June 30 is available without charge by visiting the Proxy Voting section of mfs.com or by visiting the SEC’s Web site at http://www.sec.gov.
QUARTERLY PORTFOLIO DISCLOSURE
The fund will file a complete schedule of portfolio holdings with the Securities and Exchange Commission (the Commission) for the first and third quarters of each fiscal year on Form N-Q. The fund’s Form N-Q is available on the EDGAR database on the Commission’s Internet Web site at http://www.sec.gov, and may be reviewed and copied at the:
Public Reference Room
Securities and Exchange Commission
100 F Street, NE, Room 1580
Washington, D.C. 20549
Information on the operation of the Public Reference Room may be obtained by calling the Commission at 1-800-SEC-0330. Copies of the fund’s Form N-Q also may be obtained, upon payment of a duplicating fee, by electronic request at the following e-mail address: publicinfo@sec.gov or by writing the Public Reference Section at the above address.
FURTHER INFORMATION
From time to time, MFS may post important information about the fund or the MFS funds on the MFS web site (mfs.com). This information is available by visiting the “Market Commentary” and “Announcements” sub sections in the “Market Outlooks” section of mfs.com or by clicking on the fund’s name under “Variable Insurance Portfolios — VIT III” in the “Products” section of mfs.com.
FEDERAL TAX INFORMATION (unaudited)
The following information is provided pursuant to provisions of the Internal Revenue Code.
The fund designates $5,066,000 as capital gain dividends paid during the fiscal year.
For corporate shareholders, 13.16% of the ordinary income dividends paid during the fiscal year qualify for the corporate dividends received deduction.
27
rev. 3/11
| | | | |
| FACTS | | WHAT DOES MFS DO WITH YOUR
PERSONAL INFORMATION? | |  |
| | |
| Why? | | Financial companies choose how they share your personal information. Federal law gives consumers the right to limit some but not all sharing. Federal law also requires us to tell you how we collect, share, and protect your personal information. Please read this notice carefully to understand what we do. |
| | |
| What? | | The types of personal information we collect and share depend on the product or service you have with us. This information can include: • Social Security number and account balances • Account transactions and transaction history • Checking account information and wire transfer instructions When you are no longer our customer, we continue to share your information as described in this notice. |
| | |
| How? | | All financial companies need to share customers’ personal information to run their everyday business. In the section below, we list the reasons financial companies can share their customers’ personal information; the reasons MFS chooses to share; and whether you can limit this sharing. |
| | | | |
Reasons we can share your
personal information | | Does MFS share? | | Can you limit this
sharing? |
For our everyday business purposes – such as to process your transactions, maintain your account(s), respond to court orders and legal investigations, or report to credit bureaus | | Yes | | No |
For our marketing purposes – to offer our products and services to you | | No | | We don’t share |
| For joint marketing with other financial companies | | No | | We don’t share |
For our affiliates’ everyday business purposes – information about your transactions and experiences | | No | | We don’t share |
For our affiliates’ everyday business purposes – information about your creditworthiness | | No | | We don’t share |
| For nonaffiliates to market to you | | No | | We don’t share |
| | |
| Questions? | | Call 800-225-2606 or go to mfs.com. |
28
| | |
| Who we are |
| Who is providing this notice? | | MFS Funds, MFS Investment Management, MFS Institutional Advisors, Inc., MFS Fund Distributors, Inc., MFS Heritage Trust Company, and MFS Service Center, Inc. |
| | |
| What we do |
| How does MFS protect my personal information? | | To protect your personal information from unauthorized access and use, we use security measures that comply with federal law. These measures include procedural, electronic, and physical safeguards for the protection of the personal information we collect about you. |
How does MFS
collect my personal information? | | We collect your personal information, for example, when you • open an account or provide account information • direct us to buy securities or direct us to sell your securities • make a wire transfer We also collect your personal information from others, such as credit bureaus, affiliates and other companies. |
| Why can’t I limit all sharing? | | Federal law gives you the right to limit only • sharing for affiliates’ everyday business purposes – information about your creditworthiness • affiliates from using your information to market to you • sharing for nonaffiliates to market to you State laws and individual companies may give you additional rights to limit sharing. |
| | |
| Definitions |
| Affiliates | | Companies related by common ownership or control. They can be financial and nonfinancial companies. • MFS does not share personal information with affiliates, except for everyday business purposes as described on page one of this notice. |
| Nonaffiliates | | Companies not related by common ownership or control. They can be financial and nonfinancial companies. • MFS does not share with nonaffiliates so they can market to you. |
| Joint Marketing | | A formal agreement between nonaffiliated financial companies that together market financial products or services to you. • MFS doesn’t jointly market. |
| | |
| Other important information |
| If you own an MFS product or receive an MFS service in the name of a third party such as a bank or broker-dealer, their privacy policy may apply to you instead of ours. |
29
ANNUAL REPORT
December 31, 2014

MFS® MODERATE ALLOCATION PORTFOLIO
MFS® Variable Insurance Trust III

VMA-ANN
MFS® MODERATE ALLOCATION PORTFOLIO
CONTENTS
The report is prepared for the general information of contract owners. It is authorized for distribution to prospective investors only when preceded or accompanied by a current prospectus.
NOT FDIC INSURED Ÿ MAY LOSE VALUE Ÿ NO BANK OR CREDIT UNION GUARANTEE Ÿ NOT A DEPOSIT Ÿ NOT INSURED BY ANY FEDERAL GOVERNMENT AGENCY OR NCUA/NCUSIF
MFS Moderate Allocation Portfolio
LETTER FROM THE CHAIRMAN

Dear Contract Owners:
As 2015 begins, sharply lower oil prices are reshaping the global economy, adding to deflationary pressures in the eurozone and exacerbating challenges faced by oil exporters such as Russia. The U.S. economy stands on firmer ground, having expanded steadily over the past year. The U.S. labor market has regained momentum, consumer confidence is buoyant and gasoline prices have tumbled, boosting prospects for a stronger economic rebound in 2015.
Other regions are struggling. The eurozone economy is barely expanding, and the European Central Bank (ECB) has introduced large-scale asset purchases.
Despite Japan’s efforts to strengthen its economy, its sales tax increase last spring tipped the country into a recession, leading to additional monetary stimulus from the Bank of Japan. China’s economy is slowing as it transitions to a more sustainable basis, and its growth rate will likely continue to decline.
As always, active risk management is integral to how we at MFS® manage your investments. We use a collaborative process, sharing insights across asset classes, regions and economic sectors. Our global investment team uses a diversified, multidisciplined, long-term approach.
Applying proven principles, such as asset allocation and diversification, can best serve investors over the long term. We are confident that this approach can help you as you work with your financial advisors to reach your goals in the years ahead.
Respectfully,

Robert J. Manning
Chairman
MFS Investment Management
February 13, 2015
The opinions expressed in this letter are subject to change and may not be relied upon for investment advice. No forecasts can be guaranteed.
1
MFS Moderate Allocation Portfolio
PORTFOLIO COMPOSITION
Portfolio target allocation
| | | | |
| Portfolio holdings | | | | |
| MFS Research Bond Series | | | 12.1% | |
| MFS Government Securities Portfolio | | | 10.1% | |
| MFS Value Series | | | 9.0% | |
| MFS Growth Series | | | 9.0% | |
| MFS Research Series | | | 8.0% | |
| MFS Mid Cap Value Portfolio | | | 7.1% | |
| MFS Mid Cap Growth Series | | | 7.1% | |
| MFS Research International Portfolio | | | 6.7% | |
| MFS High Yield Portfolio | | | 5.0% | |
| MFS Inflation-Adjusted Bond Portfolio | | | 5.0% | |
| MFS Global Governments Portfolio | | | 4.9% | |
| MFS Limited Maturity Portfolio | | | 4.0% | |
| MFS Global Real Estate Portfolio | | | 3.0% | |
| MFS International Value Portfolio | | | 3.0% | |
| MFS International Growth Portfolio | | | 2.9% | |
| MFS New Discovery Value Portfolio | | | 1.5% | |
| MFS New Discovery Series | | | 1.5% | |
| Cash & Other | | | 0.1% | |
Portfolio actual allocation
Cash & Other can include cash, other assets less liabilities, and short-term securities.
Percentages are based on net assets as of 12/31/14.
The portfolio is actively managed and current holdings may be different.
2
MFS Moderate Allocation Portfolio
MANAGEMENT REVIEW
Summary of Results
For the twelve months ended December 31, 2014, Initial Class shares of the MFS Moderate Allocation Portfolio (“fund”) provided a total return of 5.28%, while Service Class shares of the fund provided a total return of 5.04%. These compare with a return of 13.69% for the fund’s benchmark, the Standard & Poor’s 500 Stock Index (“S&P 500 Index”). The fund’s other benchmark, the MFS Moderate Allocation Portfolio Blended Index (“Blended Index”), generated a return of 8.16%. The Blended Index reflects the blended returns of various equity and fixed income market indices, with percentage allocations to each index designed to resemble the allocations of the fund. The market indices and related percentage allocations used to compile the Blended Index are set forth in the Performance Summary.
Market Environment
Early in the period, US equities suffered what proved to be a temporary setback due to concerns over emerging markets as well as what was perceived at the time to be a pause in US economic growth, partially caused by extreme weather events and a weak December 2013 labor market report. Markets soon recovered as the economic pause concluded and investors appeared to have become increasingly comfortable that newly-installed US Federal Reserve (“Fed”) Chair Janet Yellen would not make any substantial changes to the trajectory of Fed monetary policy.
A generally risk-friendly, carry trade environment persisted from February 2014 until mid-year. While geopolitical tensions flared in the Middle East and Russia/Ukraine, any market setbacks were short-lived as improving economic growth in the US, coupled with prospects for easier monetary policy in regions with slowing growth, such as Japan, Europe and China, supported risk assets. For example, the European Central Bank (“ECB”) cut policy interest rates into negative territory and, by the end of the period, expectations were for additional rate cuts and the announcement for non-conventional easing measures. Similarly, the Bank of Japan surprised markets late in the period with fresh stimulus measures given lackluster growth trends. The related decline in developed market government bond yields and credit spreads were also supportive for equity markets. At the end of the period, the US equity market was trading close to all-time highs and US Treasury yields were close to their lows for the period. However, credit markets did not fare as well in the second half of 2014, particularly US high yield and emerging market debt. The higher weightings of oil and gas credits in these asset classes resulted in widening spreads and increased volatility as oil prices began to decline in an accelerated fashion in the fourth quarter.
Factors Affecting Performance
The fund underperformed the Blended Index over the period. US equities significantly outperformed international stocks during the period, however several of the funds held within the US equities market segment underperformed their respective benchmarks, particularly the fund’s holdings in the MFS Growth Series, MFS Mid Cap Value Portfolio and MFS Research Series. Additionally, the fund’s allocations in the MFS New Discovery Value Portfolio, the MFS New Discovery Series and the MFS Mid Cap Growth Series dampened relative results as mid cap growth and small cap stocks generally underperformed large cap stocks.
The fund’s investments in segments of the fixed income market delivered positive returns but underperformed the fixed income portion of the Blended Index as investors extended into longer maturity bonds which helped flatten the yield curve. Consequently, the fund’s allocation to the relatively shorter duration MFS Limited Maturity Portfolio dragged down performance relative to the fixed income portion of the blended index. Additionally, the fund’s investment in the MFS Global Governments Portfolio held back relative performance as international bonds underperformed US bonds.
Respectfully,
Joseph Flaherty
Portfolio Manager
The views expressed in this report are those of the portfolio manager only through the end of the period of the report as stated on the cover and do not necessarily reflect the views of MFS or any other person in the MFS organization. These views are subject to change at any time based on market or other conditions, and MFS disclaims any responsibility to update such views. These views may not be relied upon as investment advice or an indication of trading intent on behalf of any MFS portfolio. References to specific securities are not recommendations of such securities, and may not be representative of any MFS portfolio’s current or future investments.
3
MFS Moderate Allocation Portfolio
PERFORMANCE SUMMARY THROUGH 12/31/14
The following chart illustrates the historical performance of the fund in comparison to its benchmark(s). Benchmarks are unmanaged and may not be invested in directly. Benchmark returns do not reflect any fees or expenses. The performance of other share classes will be greater than or less than that of the class depicted below. (See Notes to Performance Summary.)
Performance data shown represents past performance and is no guarantee of future results. Investment return and principal value fluctuate so your units, when sold, may be worth more or less than the original cost; current performance may be lower or higher than quoted. The performance shown does not reflect the deduction of taxes, if any, that a contract holder would pay on fund distributions or the redemption of contract units. The returns for the fund shown also do not reflect the deduction of expenses associated with variable products, such as mortality and expense risk charges, separate account charges, and sales charges imposed by the insurance company separate accounts. Such expenses would reduce the overall returns shown.
Growth of a Hypothetical $10,000 Investment (t)
Total Returns through 12/31/14
Average annual total returns
| | | | | | | | | | | | |
| | | Share Class | | Class inception date | | 1-yr | | 5-yr | | Life (t) | | |
| | | Initial Class | | 10/01/08 | | 5.28% | | 8.48% | | 8.74% | | |
| | | Service Class | | 10/01/08 | | 5.04% | | 8.21% | | 8.46% | | |
| | | | |
| Comparative benchmarks | | | | | | | | |
| | | Standard & Poor’s 500 Stock Index (f) | | 13.69% | | 15.45% | | 11.94% | | |
| | | MFS Moderate Allocation Portfolio Blended Index (f)(w) | | 8.16% | | 9.79% | | 8.69% | | |
| | | Barclays U.S. Aggregate Bond Index (f) | | 5.97% | | 4.45% | | 5.25% | | |
| | | FTSE EPRA/NAREIT Developed Real Estate Index (f) | | 15.89% | | 12.03% | | 8.34% | | |
| | | MSCI EAFE (Europe, Australasia, Far East) Index (f) | | (4.48)% | | 5.81% | | 5.61% | | |
| (f) | | Source: FactSet Research Systems Inc. |
| (t) | | For the period from the class inception date through the stated period end. (See Notes to Performance Summary.) |
| (w) | | As of December 31, 2014, the MFS Moderate Allocation Portfolio Blended Index was comprised of 43% Standard & Poor’s 500 Stock Index, 41% Barclays U.S. Aggregate Bond Index, 13% MSCI EAFE (Europe, Australasia, Far East) Index, 3% FTSE EPRA/NAREIT Developed Real Estate Index. |
Benchmark Definitions
Barclays U.S. Aggregate Bond Index – a market capitalization-weighted index that measures the performance of the U.S. investment-grade, fixed rate bond market, with index components for government and corporate securities, mortgage pass-through securities, and asset-backed securities with at least one year to final maturity.
FTSE EPRA/NAREIT Developed Real Estate Index – measures the performance of eligible real estate equities worldwide that generate a majority of their revenue and income through the ownership, disposure and development of income-producing real estate.
MSCI EAFE (Europe, Australasia, Far East) Index – a market capitalization-weighted index that is designed to measure equity market performance in the developed markets, excluding the U.S. and Canada.
4
MFS Moderate Allocation Portfolio
Performance Summary – continued
Standard & Poor’s 500 Stock Index – a market capitalization-weighted index of 500 widely held equity securities, designed to measure broad U.S. equity performance.
It is not possible to invest directly in an index.
Notes to Performance Summary
Average annual total return represents the average annual change in value for each share class for the periods presented. Life returns are presented where the share class has less than 10 years of performance history and represent the average annual total return from the class inception date to the stated period end date.
Performance results reflect any applicable expense subsidies and waivers in effect during the periods shown. Without such subsidies and waivers the fund’s performance results would be less favorable. Please see the prospectus and financial statements for complete details. All results are historical and assume the reinvestment of any dividends and capital gains distributions.
Performance prior to close of business December 7, 2012, reflects time periods when another adviser or subadviser was responsible for selecting investments for the fund under a different investment objective and different investment strategies, underlying fund selections, and underlying fund target weightings of the fund.
Performance results do not include adjustments made for financial reporting purposes in accordance with U.S. generally accepted accounting principles and may differ from amounts reported in the financial highlights.
From time to time the fund may receive proceeds from litigation settlements, without which performance would be lower.
5
MFS Moderate Allocation Portfolio
EXPENSE TABLE
Fund Expenses Borne by the Contract Holders During the Period,
July 1, 2014 through December 31, 2014
As a contract holder of the fund, you incur ongoing costs, including distribution and/or service (12b-1) fees; and other fund expenses. This example is intended to help you understand your ongoing costs (in dollars) of investing in the fund and to compare these costs with the ongoing costs of investing in other mutual funds.
In addition to the fees and expenses which the fund bears directly, the fund indirectly bears a pro rata share of the fees and expenses of the underlying funds in which the fund invests. Because the underlying funds have varied expenses and fee levels and the fund may own different proportions of the underlying funds at different times, the amount of fees and expenses incurred indirectly by the fund will vary. If these indirect costs were included, your costs would have been higher.
The example is based on an investment of $1,000 invested at the beginning of the period and held for the entire period July 1, 2014 through December 31, 2014.
Actual Expenses
The first line for each share class in the following table provides information about actual account values and actual expenses. You may use the information in this line, together with the amount you invested, to estimate the expenses that you paid over the period. Simply divide your account value by $1,000 (for example, an $8,600 account value divided by $1,000 = 8.6), then multiply the result by the number in the first line under the heading entitled “Expenses Paid During Period” to estimate the expenses you paid on your account during this period.
Hypothetical Example for Comparison Purposes
The second line for each share class in the following table provides information about hypothetical account values and hypothetical expenses based on the fund’s actual expense ratio and an assumed rate of return of 5% per year before expenses, which is not the fund’s actual return. The hypothetical account values and expenses may not be used to estimate the actual ending account balance or expenses you paid for the period. You may use this information to compare the ongoing costs of investing in the fund and other funds. To do so, compare this 5% hypothetical example with the 5% hypothetical examples that appear in the shareholder reports of the other funds.
Please note that the expenses shown in the table are meant to highlight the fund’s ongoing costs only and do not take into account the fees and expenses imposed under the variable contracts through which your investment in the fund is made. Therefore, the second line for each share class in the table is useful in comparing ongoing costs associated with an investment in vehicles (such as the fund) which fund benefits under variable annuity and variable life insurance contracts and to qualified pension and retirement plans only, and will not help you determine the relative total costs of investing in the fund through variable annuity and variable life insurance contracts. If the fees and expenses imposed under the variable contracts were included, your costs would have been higher.
| | | | | | | | | | | | | | | | | | |
| Share Class | | | | Annualized
Expense Ratio | | | Beginning
Account Value
7/01/14 | | | Ending Account Value
12/31/14 | | | Expenses Paid
During Period (p)
7/01/14-12/31/14 | |
| Initial Class | | Actual | | | 0.01% | | | | $1,000.00 | | | | $1,007.89 | | | | $0.05 | |
| | Hypothetical (h) | | | 0.01% | | | | $1,000.00 | | | | $1,025.16 | | | | $0.05 | |
| Service Class | | Actual | | | 0.26% | | | | $1,000.00 | | | | $1,006.27 | | | | $1.31 | |
| | Hypothetical (h) | | | 0.26% | | | | $1,000.00 | | | | $1,023.89 | | | | $1.33 | |
| (h) | 5% class return per year before expenses. |
| (p) | “Expenses Paid During Period” are equal to each class’s annualized expense ratio, as shown above, multiplied by the average account value over the period, multiplied by 184/365 (to reflect the one-half year period). In addition to the fees and expenses which the fund bears directly, the fund indirectly bears a pro rata share of the fees and expenses of the underlying funds in which the fund invests. If these indirect costs were included, your costs would have been higher. |
6
MFS Moderate Allocation Portfolio
PORTFOLIO OF INVESTMENTS – 12/31/14
The Portfolio of Investments is a complete list of all securities owned by your fund. It is categorized by broad-based asset classes.
| | | | | | | | |
| Issuer | | Shares/Par | | | Value ($) | |
| | | | | | | | |
| UNDERLYING AFFILIATED FUNDS – 99.9% | |
| MFS Global Governments Portfolio – Initial Class | | | 10,000,800 | | | $ | 104,708,380 | |
| MFS Global Real Estate Portfolio – Initial Class | | | 4,569,387 | | | | 64,245,587 | |
| MFS Government Securities Portfolio – Initial Class | | | 16,478,830 | | | | 214,554,367 | |
| MFS Growth Series – Initial Class | | | 4,840,128 | | | | 192,395,074 | |
| MFS High Yield Portfolio – Initial Class | | | 17,387,298 | | | | 106,236,388 | |
| MFS Inflation-Adjusted Bond Portfolio – Initial Class | | | 10,249,517 | | | | 105,775,011 | |
| MFS International Growth Portfolio – Initial Class | | | 4,672,941 | | | | 62,103,380 | |
| MFS International Value Portfolio – Initial Class | | | 2,929,229 | | | | 63,652,140 | |
| MFS Limited Maturity Portfolio – Initial Class | | | 8,346,898 | | | | 85,388,768 | |
| MFS Mid Cap Growth Series – Initial Class | | | 17,155,908 | | | | 150,285,753 | |
| MFS Mid Cap Value Portfolio – Initial Class | | | 15,344,494 | | | | 150,376,039 | |
| MFS New Discovery Series – Initial Class | | | 1,963,668 | | | | 32,047,054 | |
| MFS New Discovery Value Portfolio – Initial Class | | | 3,012,679 | | | | 32,356,177 | |
| MFS Research Bond Series – Initial Class | | | 19,073,468 | | | | 257,491,812 | |
| MFS Research International Portfolio – Initial Class | | | 9,749,083 | | | | 141,946,645 | |
| MFS Research Series – Initial Class | | | 5,876,352 | | | | 171,060,603 | |
| MFS Value Series – Initial Class | | | 9,470,352 | | | | 192,626,955 | |
| | | | | | | | |
Total Underlying Affiliated Funds
(Identified Cost, $1,887,492,096) | | | | | | $ | 2,127,250,133 | |
| | | | | | | | |
| | | | | | | | |
| Issuer | | Shares/Par | | | Value ($) | |
| | | | | | | | |
| MONEY MARKET FUNDS – 0.0% | | | | | |
| MFS Institutional Money Market Portfolio, 0.09%, at Cost and Net Asset Value (v) | | | 888,569 | | | $ | 888,569 | |
| | | | | | | | |
Total Investments
(Identified Cost, $1,888,380,665) | | | | | | $ | 2,128,138,702 | |
| | | | | | | | |
OTHER ASSETS, LESS
LIABILITIES – 0.1% | | | | | | | 1,068,835 | |
| | | | | | | | |
| NET ASSETS – 100.0% | | | | | | $ | 2,129,207,537 | |
| | | | | | | | |
| (v) | | Underlying affiliated fund that is available only to investment companies managed by MFS. The rate quoted for the MFS Institutional Money Market Portfolio is the annualized seven-day yield of the fund at period end. |
See Notes to Financial Statements
7
MFS Moderate Allocation Portfolio
FINANCIAL STATEMENTS | STATEMENT OF ASSETS AND LIABILITIES
This statement represents your fund’s balance sheet, which details the assets and liabilities comprising the total value of the fund.
| | | | | | | | |
At 12/31/14 | | | | | | | | |
Assets | | | | | | | | |
Investments – | | | | | | | | |
Underlying affiliated funds, at value (identified cost, $1,888,380,665) | | | $2,128,138,702 | | | | | |
Receivables for | | | | | | | | |
Investments sold | | | 2,985,997 | | | | | |
Fund shares sold | | | 2,229 | | | | | |
Other assets | | | 16,339 | | | | | |
Total assets | | | | | | | $2,131,143,267 | |
Liabilities | | | | | | | | |
Payable for fund shares reacquired | | | $1,821,772 | | | | | |
Payable to affiliates | | | | | | | | |
Administrator | | | 96 | | | | | |
Shareholder servicing costs | | | 247 | | | | | |
Distribution and/or service fees | | | 29,260 | | | | | |
Payable for independent Trustees’ compensation | | | 44 | | | | | |
Accrued expenses and other liabilities | | | 84,311 | | | | | |
Total liabilities | | | | | | | $1,935,730 | |
Net assets | | | | | | | $2,129,207,537 | |
Net assets consist of | | | | | | | | |
Paid-in capital | | | $1,769,065,857 | | | | | |
Unrealized appreciation (depreciation) on investments | | | 239,758,037 | | | | | |
Accumulated net realized gain (loss) on investments | | | 45,471,854 | | | | | |
Undistributed net investment income | | | 74,911,789 | | | | | |
Net assets | | | | | | | $2,129,207,537 | |
Shares of beneficial interest outstanding | | | | | | | 159,878,222 | |
| | | | | | | | | | | | |
| | | Net assets | | | Shares
outstanding | | | Net asset value
per share | |
Initial Class | | | $7,239,980 | | | | 542,791 | | | | $13.34 | |
Service Class | | | 2,121,967,557 | | | | 159,335,431 | | | | 13.32 | |
See Notes to Financial Statements
8
MFS Moderate Allocation Portfolio
FINANCIAL STATEMENTS | STATEMENT OF OPERATIONS
This statement describes how much your fund earned in investment income and accrued in expenses. It also describes any gains and/or losses generated by fund operations.
| | | | | | | | |
Year ended 12/31/14 | | | | | | | | |
Net investment income | | | | | | | | |
Income | | | | | | | | |
Dividends from underlying affiliated funds | | | $34,332,811 | | | | | |
Expenses | | | | | | | | |
Distribution and/or service fees | | | $5,502,420 | | | | | |
Shareholder servicing costs | | | 52,357 | | | | | |
Administrative services fee | | | 17,500 | | | | | |
Independent Trustees’ compensation | | | 41,634 | | | | | |
Custodian fee | | | 87,296 | | | | | |
Audit and tax fees | | | 41,928 | | | | | |
Legal fees | | | 19,234 | | | | | |
Miscellaneous | | | 45,849 | | | | | |
Total expenses | | | | | | | $5,808,218 | |
Fees paid indirectly | | | (5 | ) | | | | |
Reduction of expenses by investment adviser | | | (3,847 | ) | | | | |
Net expenses | | | | | | | $5,804,366 | |
Net investment income | | | | | | | $28,528,445 | |
Realized and unrealized gain (loss) on investments | | | | | | | | |
Realized gain (loss) (identified cost basis) | | | | | | | | |
Investments in underlying affiliated funds | | | $12,118,093 | | | | | |
Capital gain distributions from underlying affiliated funds | | | 81,954,225 | | | | | |
Net realized gain (loss) on investments | | | | | | | $94,072,318 | |
Change in unrealized appreciation (depreciation) on investments | | | | | | | $(13,362,580 | ) |
Net realized and unrealized gain (loss) on investments | | | | | | | $80,709,738 | |
Change in net assets from operations | | | | | | | $109,238,183 | |
See Notes to Financial Statements
9
MFS Moderate Allocation Portfolio
FINANCIAL STATEMENTS | STATEMENTS OF CHANGES IN NET ASSETS
These statements describe the increases and/or decreases in net assets resulting from operations, any distributions, and any shareholder transactions.
| | | | | | | | |
For years ended 12/31 | | | 2014 | | | | 2013 | |
Change in net assets | | | | | | | | |
From operations | | | | | | | | |
Net investment income | | | $28,528,445 | | | | $15,942,443 | |
Net realized gain (loss) on investments | | | 94,072,318 | | | | 38,513,121 | |
Net unrealized gain (loss) on investments | | | (13,362,580 | ) | | | 264,683,122 | |
Change in net assets from operations | | | $109,238,183 | | | | $319,138,686 | |
Distributions declared to shareholders | | | | | | | | |
From net investment income | | | $(29,243,091 | ) | | | $(49,362,527 | ) |
From net realized gain on investments | | | (25,586,026 | ) | | | (125,759,031 | ) |
Total distributions declared to shareholders | | | $(54,829,117 | ) | | | $(175,121,558 | ) |
Change in net assets from fund share transactions | | | $(131,246,791 | ) | | | $71,470,406 | |
Total change in net assets | | | $(76,837,725 | ) | | | $215,487,534 | |
Net assets | | | | | | | | |
At beginning of period | | | 2,206,045,262 | | | | 1,990,557,728 | |
At end of period (including undistributed net investment income of $74,911,789 and
$29,243,030, respectively) | | | $2,129,207,537 | | | | $2,206,045,262 | |
See Notes to Financial Statements
10
MFS Moderate Allocation Portfolio
FINANCIAL STATEMENTS | FINANCIAL HIGHLIGHTS
The financial highlights table is intended to help you understand the fund’s financial performance for the past 5 years. Certain information reflects financial results for a single fund share. The total returns in the table represent the rate by which an investor would have earned (or lost) on an investment in the fund share class (assuming reinvestment of all distributions) held for the entire period.
| | | | | | | | | | | | | | | | | | | | |
| Initial Class | | Years ended 12/31 | |
| | | 2014 | | | 2013 | | | 2012 | | | 2011 | | | 2010 | |
Net asset value, beginning of period | | | $13.02 | | | | $12.20 | | | | $11.60 | | | | $12.37 | | | | $11.21 | |
| Income (loss) from investment operations | | | | | | | | | | | | | | | | | | | | |
Net investment income (d)(l) | | | $0.21 | | | | $0.09 | | | | $0.31 | | | | $0.20 | | | | $0.20 | |
Net realized and unrealized gain (loss) on investments | | | 0.48 | | | | 1.88 | | | | 0.92 | | | | (0.40 | ) | | | 1.15 | |
Total from investment operations | | | $0.69 | | | | $1.97 | | | | $1.23 | | | | $(0.20 | ) | | | $1.35 | |
| Less distributions declared to shareholders | | | | | | | | | | | | | | | | | | | | |
From net investment income | | | $(0.21 | ) | | | $(0.35 | ) | | | $(0.32 | ) | | | $(0.17 | ) | | | $(0.13 | ) |
From net realized gain on investments | | | (0.16 | ) | | | (0.80 | ) | | | (0.31 | ) | | | (0.40 | ) | | | (0.06 | ) |
Total distributions declared to shareholders | | | $(0.37 | ) | | | $(1.15 | ) | | | $(0.63 | ) | | | $(0.57 | ) | | | $(0.19 | ) |
Net asset value, end of period (x) | | | $13.34 | | | | $13.02 | | | | $12.20 | | | | $11.60 | | | | $12.37 | |
Total return (%) (k)(r)(s)(x) | | | 5.28 | | | | 16.87 | | | | 10.56 | | | | (1.56 | ) | | | 12.18 | |
Ratios (%) (to average net assets)
and Supplemental data: | | | | | | | | | | | | | | | | | | | | |
Expenses before expense reductions (f)(h) | | | 0.01 | | | | 0.02 | | | | 0.15 | | | | 0.19 | | | | 0.21 | |
Expenses after expense reductions (f)(h) | | | 0.01 | | | | 0.02 | | | | N/A | | | | N/A | | | | 0.20 | |
Net investment income (l) | | | 1.55 | | | | 0.73 | | | | 2.52 | | | | 1.61 | | | | 1.75 | |
Portfolio turnover | | | 2 | | | | 6 | | | | 67 | | | | 7 | | | | 27 | |
Net assets at end of period (000 omitted) | | | $7,240 | | | | $6,124 | | | | $4,279 | | | | $3,150 | | | | $1,687 | |
See Notes to Financial Statements
11
MFS Moderate Allocation Portfolio
Financial Highlights – continued
| | | | | | | | | | | | | | | | | | | | |
| Service Class | | Years ended 12/31 | |
| | | 2014 | | | 2013 | | | 2012 | | | 2011 | | | 2010 | |
Net asset value, beginning of period | | | $13.00 | | | | $12.19 | | | | $11.58 | | | | $12.35 | | | | $11.20 | |
| Income (loss) from investment operations | | | | | | | | | | | | | | | | | | | | |
Net investment income (d)(l) | | | $0.17 | | | | $0.10 | | | | $0.19 | | | | $0.16 | | | | $0.15 | |
Net realized and unrealized gain (loss) on investments | | | 0.49 | | | | 1.82 | | | | 1.02 | | | | (0.39 | ) | | | 1.16 | |
Total from investment operations | | | $0.66 | | | | $1.92 | | | | $1.21 | | | | $(0.23 | ) | | | $1.31 | |
| Less distributions declared to shareholders | | | | | | | | | | | | | | | | | | | | |
From net investment income | | | $(0.18 | ) | | | $(0.31 | ) | | | $(0.29 | ) | | | $(0.14 | ) | | | $(0.10 | ) |
From net realized gain on investments | | | (0.16 | ) | | | (0.80 | ) | | | (0.31 | ) | | | (0.40 | ) | | | (0.06 | ) |
Total distributions declared to shareholders | | | $(0.34 | ) | | | $(1.11 | ) | | | $(0.60 | ) | | | $(0.54 | ) | | | $(0.16 | ) |
Net asset value, end of period (x) | | | $13.32 | | | | $13.00 | | | | $12.19 | | | | $11.58 | | | | $12.35 | |
Total return (%) (k)(r)(s)(x) | | | 5.04 | | | | 16.51 | | | | 10.39 | | | | (1.81 | ) | | | 11.82 | |
Ratios (%) (to average net assets)
and Supplemental data: | | | | | | | | | | | | | | | | | | | | |
Expenses before expense reductions (f)(h) | | | 0.26 | | | | 0.27 | | | | 0.40 | | | | 0.44 | | | | 0.46 | |
Expenses after expense reductions (f)(h) | | | 0.26 | | | | 0.27 | | | | N/A | | | | N/A | | | | 0.45 | |
Net investment income (l) | | | 1.29 | | | | 0.76 | | | | 1.55 | | | | 1.32 | | | | 1.30 | |
Portfolio turnover | | | 2 | | | | 6 | | | | 67 | | | | 7 | | | | 27 | |
Net assets at end of period (000 omitted) | | | $2,121,968 | | | | $2,199,921 | | | | $1,986,278 | | | | $1,850,101 | | | | $1,444,241 | |
Information prior to the close of business on December 7, 2012, reflects time periods when another adviser or subadviser was responsible for selecting investments for the fund under a different investment objective and different investment strategies, underlying fund selections, and underlying fund target weightings of the fund.
| (d) | Per share data is based on average shares outstanding. |
| (f) | Ratios do not reflect reductions from fees paid indirectly, if applicable. |
| (h) | In addition to the fees and expenses which the fund bears directly, the fund indirectly bears a pro rata share of the fees and expenses of the underlying affiliated funds in which the fund invests. Accordingly, the expense ratio for the fund reflects only those fees and expenses borne directly by the fund. Because the underlying affiliated funds have varied expense and fee levels and the fund may own different proportions of the underlying affiliated funds at different times, the amount of fees and expenses incurred indirectly by the fund will vary. |
| (k) | The total return does not reflect expenses that apply to separate accounts. Inclusion of these charges would reduce the total return figures for all periods shown. |
| (l) | Recognition of net investment income by the fund may be affected by the timing of the declaration of dividends by the underlying affiliated funds in which the fund invests. The ratios and per share amounts do not include net investment income of the underlying affiliated funds in which the fund invests. |
| (r) | Certain expenses have been reduced without which performance would have been lower. |
| (s) | From time to time the fund may receive proceeds from litigation settlements, without which performance would be lower. |
| (x) | The net asset values per share and total returns have been calculated on net assets which include adjustments made in accordance with U.S. generally accepted accounting principles required at period end for financial reporting purposes. |
See Notes to Financial Statements
12
MFS Moderate Allocation Portfolio
NOTES TO FINANCIAL STATEMENTS
| (1) | | Business and Organization |
MFS Moderate Allocation Portfolio (the fund) is a diversified series of MFS Variable Insurance Trust III (the trust). The trust is organized as a Delaware statutory trust and is registered under the Investment Company Act of 1940, as amended, as an open-end management investment company. The shareholders of each series of the trust are separate accounts of insurance companies, which offer variable annuity and/or life insurance products, and qualified retirement and pension plans.
The fund is an investment company and accordingly follows the investment company accounting and reporting guidance of the Financial Accounting Standards Board (FASB) Accounting Standards Codification Topic 946 Financial Services – Investment Companies.
| (2) | | Significant Accounting Policies |
General – The preparation of financial statements in conformity with U.S. generally accepted accounting principles requires management to make estimates and assumptions that affect the reported amounts of assets and liabilities, and disclosure of contingent assets and liabilities at the date of the financial statements and the reported amounts of increases and decreases in net assets from operations during the reporting period. Actual results could differ from those estimates. In the preparation of these financial statements, management has evaluated subsequent events occurring after the date of the fund’s Statement of Assets and Liabilities through the date that the financial statements were issued.
The fund is a “fund of funds”, which invests the majority of its assets in other MFS mutual funds (hereafter referred to as “underlying affiliated funds” or “underlying funds”), which may have different fiscal year ends than the funds. The underlying funds, in turn, may engage in a number of investment techniques and practices, which involve certain risks. Certain underlying funds invest their portfolio in high-yield securities rated below investment grade. Investments in high-yield securities involve greater degrees of credit and market risk than investments in higher-rated securities and tend to be more sensitive to economic conditions. Certain underlying funds invest a significant portion of their assets in asset-backed and/or mortgage-backed securities. The value of these securities may depend, in part, on the issuer’s or borrower’s credit quality or ability to pay principal and interest when due and may fall if an issuer or borrower defaults on its obligation to pay principal or interest or if the instrument’s credit rating is downgraded by a credit rating agency. U.S. Government securities not supported as to the payment of principal or interest by the U.S. Treasury, such as those issued by Fannie Mae, Freddie Mac, and the Federal Home Loan Banks, are subject to greater credit risk than are U.S. Government securities supported by the U.S. Treasury, such as those issued by Ginnie Mae. Certain underlying funds invest in foreign securities, including securities of emerging market issuers. Investments in foreign securities are vulnerable to the effects of changes in the relative values of the local currency and the U.S. dollar and to the effects of changes in each country’s legal, political, and economic environment. The markets of emerging markets countries are generally more volatile than the markets of developed countries with more mature economies. All of the risks of investing in foreign securities previously described are heightened when investing in emerging markets countries.
The accounting policies of the underlying funds in which the fund invests are outlined in the underlying funds’ shareholder reports, which are available without charge by calling 1-800-225-2606, at mfs.com and on the Securities and Exchange Commission (SEC) web site at http://www.sec.gov or at the SEC’s public reference room in Washington, D.C. The underlying funds’ shareholder reports are not covered by this report.
In June 2014, FASB issued Accounting Standards Update 2014-11, Transfers and Servicing (Topic 860) – Repurchase-to-Maturity Transactions, Repurchase Financings, and Disclosures (“ASU 2014-11”). ASU 2014-11 changes the accounting for repurchase-to-maturity transactions (i.e., repurchase agreements that settle at the same time as the maturity of the transferred financial asset) and enhances the required disclosures for repurchase agreements and other similar transactions. Although still evaluating the potential impacts of ASU 2014-11 to the fund, management expects that the impact of the fund’s adoption will be limited to additional financial statement disclosures which would first be effective for interim reporting periods beginning after March 15, 2015.
Investment Valuations – Open-end investment companies (underlying funds) are generally valued at their net asset value per share. The investments of underlying funds managed by the adviser are valued as described below. For purposes of this policy disclosure, “fund” also refers to the underlying funds in which the fund-of-funds invests.
Equity securities, including restricted equity securities, are generally valued at the last sale or official closing price as provided by a third-party pricing service on the market or exchange on which they are primarily traded. Equity securities, for which there were no sales reported that day, are generally valued at the last quoted daily bid quotation as provided by a third-party pricing service on the market or exchange on which such securities are primarily traded. Equity securities held short, for which there were no sales reported for that day, are generally valued at the last quoted daily ask quotation as provided by a third-party pricing service on the market or exchange on which such securities are primarily traded. Debt instruments and floating rate loans, including restricted debt instruments, are generally valued at an evaluated or composite bid as provided by a third-party pricing service. Short-term instruments with a maturity at issuance of 60 days or less may be valued at amortized cost, which approximates market value.
13
MFS Moderate Allocation Portfolio
Notes to Financial Statements – continued
Exchange-traded options are generally valued at the last sale or official closing price as provided by a third-party pricing service on the exchange on which such options are primarily traded. Exchange-traded options for which there were no sales reported that day are generally valued at the last daily bid quotation as provided by a third-party pricing service on the exchange on which such options are primarily traded. Options not traded on an exchange are generally valued at a broker/dealer bid quotation. Foreign currency options are generally valued at valuations provided by a third-party pricing service. Futures contracts are generally valued at last posted settlement price as provided by a third-party pricing service on the market on which they are primarily traded. Futures contracts for which there were no trades that day for a particular position are generally valued at the closing bid quotation as provided by a third-party pricing service on the market on which such futures contracts are primarily traded. Forward foreign currency exchange contracts are generally valued at the mean of bid and asked prices for the time period interpolated from rates provided by a third-party pricing service for proximate time periods. Swap agreements are generally valued at valuations provided by a third-party pricing service, which for cleared swaps includes an evaluation of any trading activity at the clearinghouses. Open-end investment companies are generally valued at net asset value per share. Securities and other assets generally valued on the basis of information from a third-party pricing service may also be valued at a broker/dealer bid quotation. Values obtained from third-party pricing services can utilize both transaction data and market information such as yield, quality, coupon rate, maturity, type of issue, trading characteristics, and other market data. The values of foreign securities and other assets and liabilities expressed in foreign currencies are converted to U.S. dollars using the mean of bid and asked prices for rates provided by a third-party pricing service.
The Board of Trustees has delegated primary responsibility for determining or causing to be determined the value of the fund’s investments (including any fair valuation) to the adviser pursuant to valuation policies and procedures approved by the Board. If the adviser determines that reliable market quotations are not readily available, investments are valued at fair value as determined in good faith by the adviser in accordance with such procedures under the oversight of the Board of Trustees. Under the fund’s valuation policies and procedures, market quotations are not considered to be readily available for most types of debt instruments and floating rate loans and many types of derivatives. These investments are generally valued at fair value based on information from third-party pricing services. In addition, investments may be valued at fair value if the adviser determines that an investment’s value has been materially affected by events occurring after the close of the exchange or market on which the investment is principally traded (such as foreign exchange or market) and prior to the determination of the fund’s net asset value, or after the halting of trading of a specific security where trading does not resume prior to the close of the exchange or market on which the security is principally traded. Events that occur on a frequent basis after foreign markets close (such as developments in foreign markets and significant movements in the U.S. markets) and prior to the determination of the fund’s net asset value may be deemed to have a material effect on the value of securities traded in foreign markets. Accordingly, the fund’s foreign equity securities may often be valued at fair value. The adviser generally relies on third-party pricing services or other information (such as the correlation with price movements of similar securities in the same or other markets; the type, cost and investment characteristics of the security; the business and financial condition of the issuer; and trading and other market data) to assist in determining whether to fair value and at what value to fair value an investment. The value of an investment for purposes of calculating the fund’s net asset value can differ depending on the source and method used to determine value. When fair valuation is used, the value of an investment used to determine the fund’s net asset value may differ from quoted or published prices for the same investment. There can be no assurance that the fund could obtain the fair value assigned to an investment if it were to sell the investment at the same time at which the fund determines its net asset value per share.
Various inputs are used in determining the value of the fund’s assets or liabilities. These inputs are categorized into three broad levels. In certain cases, the inputs used to measure fair value may fall into different levels of the fair value hierarchy. In such cases, an investment’s level within the fair value hierarchy is based on the lowest level of input that is significant to the fair value measurement. The fund’s assessment of the significance of a particular input to the fair value measurement in its entirety requires judgment, and considers factors specific to the investment. Level 1 includes unadjusted quoted prices in active markets for identical assets or liabilities. Level 2 includes other significant observable market-based inputs (including quoted prices for similar securities, interest rates, prepayment speed, and credit risk). Level 3 includes unobservable inputs, which may include the adviser’s own assumptions in determining the fair value of investments. The following is a summary of the levels used as of December 31, 2014 in valuing the fund’s assets or liabilities:
| | | | | | | | | | | | | | | | |
| Investments at Value | | Level 1 | | | Level 2 | | | Level 3 | | | Total | |
| Mutual Funds | | | $2,128,138,702 | | | | $— | | | | $— | | | | $2,128,138,702 | |
For further information regarding security characteristics, see the Portfolio of Investments. Please refer to the underlying funds’ shareholder reports for further information regarding the levels used in valuing the underlying funds’ assets or liabilities.
Derivatives – The fund does not invest in derivatives directly. The fund does invest in underlying funds that may use derivatives for different purposes, primarily to increase or decrease exposure to a particular market or segment of the market, or security, to increase or decrease interest rate or currency exposure, or as alternatives to direct investments. Derivatives are used for hedging or
14
MFS Moderate Allocation Portfolio
Notes to Financial Statements – continued
non-hedging purposes. While hedging can reduce or eliminate losses, it can also reduce or eliminate gains. When the underlying funds use derivatives as an investment to increase market exposure, or for hedging purposes, gains and losses from derivative instruments may be substantially greater than the derivative’s original cost.
Indemnifications – Under the fund’s organizational documents, its officers and Trustees may be indemnified against certain liabilities and expenses arising out of the performance of their duties to the fund. Additionally, in the normal course of business, the fund enters into agreements with service providers that may contain indemnification clauses. The fund’s maximum exposure under these agreements is unknown as this would involve future claims that may be made against the fund that have not yet occurred.
Investment Transactions and Income – Investment transactions are recorded on the trade date. Interest income is recorded on an accrual basis. All premium and discount is amortized or accreted for financial statement purposes in accordance with U.S. generally accepted accounting principles. Distributions of income and capital gains from the underlying funds are recorded on the ex-dividend date. Recognition of net investment income by the fund is affected by the timing of the declaration of distributions by the underlying funds in which the fund invests. In determining the net gain or loss on securities sold, the cost of securities is determined on the identified cost basis.
The fund and/or the underlying funds may receive proceeds from litigation settlements. Any proceeds received from litigation involving portfolio holdings are reflected in the Statement of Operations in realized gain/loss if the security has been disposed of by the fund or in unrealized gain/loss if the security is still held by the fund. Any other proceeds from litigation not related to portfolio holdings are reflected as other income in the Statement of Operations.
Fees Paid Indirectly – The fund’s custody fee may be reduced according to an arrangement that measures the value of cash deposited with the custodian by the fund. This amount, for the year ended December 31, 2014, is shown as a reduction of total expenses in the Statement of Operations.
Tax Matters and Distributions – The fund intends to qualify as a regulated investment company, as defined under Subchapter M of the Internal Revenue Code, and to distribute all of its taxable income, including realized capital gains. As a result, no provision for federal income tax is required. The fund’s federal tax returns, when filed, will remain subject to examination by the Internal Revenue Service for a three year period. Management has analyzed the fund’s tax positions taken on federal and state tax returns for all open tax years and does not believe that there are any uncertain tax positions that require recognition of a tax liability.
Distributions to shareholders are recorded on the ex-dividend date. Income and capital gain distributions are determined in accordance with income tax regulations, which may differ from U.S. generally accepted accounting principles. Certain capital accounts in the financial statements are periodically adjusted for permanent differences in order to reflect their tax character. These adjustments have no impact on net assets or net asset value per share. Temporary differences which arise from recognizing certain items of income, expense, gain or loss in different periods for financial statement and tax purposes will reverse at some time in the future. Distributions in excess of net investment income or net realized gains are temporary overdistributions for financial statement purposes resulting from differences in the recognition or classification of income or distributions for financial statement and tax purposes.
Book/tax differences primarily relate to wash sale loss deferrals.
The tax character of distributions declared to shareholders for the last two fiscal years is as follows:
| | | | | | | | |
| | | 12/31/14 | | | 12/31/13 | |
| Ordinary income (including any short-term capital gains) | | | $33,803,139 | | | | $49,362,527 | |
| Long-term capital gains | | | 21,025,978 | | | | 125,759,031 | |
| Total distributions | | | $54,829,117 | | | | $175,121,558 | |
The federal tax cost and the tax basis components of distributable earnings were as follows:
| | | | |
| As of 12/31/14 | | | | |
| Cost of investments | | | $1,891,090,214 | |
| Gross appreciation | | | 256,441,854 | |
| Gross depreciation | | | (19,393,366 | ) |
| Net unrealized appreciation (depreciation) | | | $237,048,488 | |
| Undistributed ordinary income | | | 78,576,624 | |
| Undistributed long-term capital gain | | | 44,516,568 | |
Multiple Classes of Shares of Beneficial Interest – The fund offers multiple classes of shares, which differ in their respective distribution and service fees. The fund’s income, realized and unrealized gain (loss), and common expenses are allocated to shareholders based on the daily net assets of each class. Dividends are declared separately for each class. Differences in per share
15
MFS Moderate Allocation Portfolio
Notes to Financial Statements – continued
dividend rates are generally due to differences in separate class expenses. The fund’s distributions declared to shareholders as reported in the Statements of Changes in Net Assets are presented by class as follows:
| | | | | | | | | | | | | | | | |
| | | From net investment
income | | | From net realized gain on
investments | |
| | | Year ended
12/31/14 | | | Year ended
12/31/13 | | | Year ended
12/31/14 | | | Year ended
12/31/13 | |
| Initial Class | | | $100,677 | | | | $98,293 | | | | $74,786 | | | | $227,867 | |
| Service Class | | | 29,142,414 | | | | 49,264,234 | | | | 25,511,240 | | | | 125,531,164 | |
| Total | | | $29,243,091 | | | | $49,362,527 | | | | $25,586,026 | | | | $125,759,031 | |
| (3) | | Transactions with Affiliates |
Investment Adviser – The fund has an investment advisory agreement with MFS to provide overall investment management and related administrative services and facilities to the fund. MFS receives no compensation under this agreement; however MFS receives management fees from the underlying MFS funds.
The investment adviser has agreed in writing to pay a portion of the fund’s operating expenses, excluding distribution and/or service fees, interest, taxes, extraordinary expenses, brokerage and transaction costs, and investment-related expenses such as fees and expenses associated with investments in investment companies and other similar investment vehicles such that operating expenses do not exceed 0.20% annually of the fund’s average daily net assets. This written agreement will continue until modified by the fund’s Board of Trustees, but such agreement will continue at least until April 30, 2016. For the year ended December 31, 2014, the fund’s actual operating expenses did not exceed the limit and therefore, the investment adviser did not pay any portion of the fund’s expenses related to this agreement.
In addition to the fees and expenses which the fund bears directly, the fund indirectly bears a pro rata share of the fees and expenses of the underlying funds in which the fund invests. Accordingly, the expense ratio for the fund reflects only those fees and expenses borne directly by the fund.
Distributor – MFS Fund Distributors, Inc. (MFD), a wholly-owned subsidiary of MFS, is the distributor of shares of the fund. The Trustees have adopted a distribution plan for the Service Class shares pursuant to Rule 12b-1 under the Investment Company Act of 1940.
The fund’s distribution plan provides that the fund will pay MFD distribution and/or service fees equal to 0.25% per annum of its average daily net assets attributable to Service Class shares as partial consideration for services performed and expenses incurred by MFD and financial intermediaries (including participating insurance companies that invest in the fund to fund variable annuity and variable life insurance contracts, sponsors of qualified retirement and pension plans that invest in the fund, and affiliates of these participating insurance companies and plan sponsors) in connection with the sale and distribution of the Service Class shares. MFD may subsequently pay all, or a portion, of the distribution and/or service fees to financial intermediaries.
Shareholder Servicing Agent – MFS Service Center, Inc. (MFSC), a wholly-owned subsidiary of MFS, receives a fee from the fund for its services as shareholder servicing agent. For the year ended December 31, 2014, the fee was $52,316, which equated to 0.0024% annually of the fund’s average daily net assets. MFSC also receives payment from the fund for out-of-pocket expenses paid by MFSC on behalf of the fund. For the year ended December 31, 2014, these costs amounted to $41.
Administrator – MFS provides certain financial, legal, shareholder communications, compliance, and other administrative services to the fund. Under an administrative services agreement, the fund partially reimburses MFS the costs incurred to provide these services. The fund pays an annual fixed amount of $17,500. The administrative services fee incurred for the year ended December 31, 2014 was equivalent to an annual effective rate of 0.0008% of the fund’s average daily net assets.
Trustees’ and Officers’ Compensation – The fund pays compensation to independent Trustees in the form of a retainer, attendance fees, and additional compensation to Board and Committee chairpersons. The fund does not pay compensation directly to Trustees or officers of the fund who are also officers of the investment adviser, all of whom receive remuneration for their services to the fund from MFS. Certain officers and Trustees of the fund are officers or directors of MFS, MFD, and MFSC.
Other – Effective November 1, 2014, this fund and certain other funds managed by MFS (the funds) have entered into a service agreement (the ISO Agreement) which provides for payment of fees solely by the funds to Tarantino LLC in return for the provision of services of an Independent Senior Officer (ISO) for the funds. Frank L. Tarantino serves as the ISO and is an officer of the funds and the sole member of Tarantino LLC. The funds can terminate the ISO Agreement with Tarantino LLC at any time under the terms of the ISO Agreement. Prior to November 1, 2014, the funds had entered into services agreements (the Compliance Officer Agreements) which provided for payment of fees by the funds to Tarantino LLC and Griffin Compliance LLC in return for the provision of services of an Independent Chief Compliance Officer (ICCO) and Assistant ICCO, respectively, for the funds. Prior to November 1, 2014, Frank L. Tarantino served as the ICCO. Effective October 31, 2014, Mr. Tarantino resigned as ICCO and the Compliance Officer Agreement between the funds and Tarantino LLC was terminated. Prior to June 1, 2014, Robyn L. Griffin served
16
MFS Moderate Allocation Portfolio
Notes to Financial Statements – continued
as the Assistant ICCO and was an officer of the funds. Ms. Griffin is the sole member of Griffin Compliance LLC. Effective May 31, 2014, Ms. Griffin resigned as Assistant ICCO and the Compliance Officer Agreement between the funds and Griffin Compliance LLC was terminated. For the year ended December 31, 2014, the aggregate fees paid by the fund under these agreements were $10,240 and are included in “Miscellaneous” expense in the Statement of Operations. MFS had agreed to reimburse the fund for a portion of the payments made by the fund for the services under the Compliance Officer Agreements in the amount of $3,847, which is included in the reduction of total expenses in the Statement of Operations. Additionally, MFS has agreed to bear all expenses associated with office space, other administrative support, and supplies provided to the ICCO, Assistant ICCO, and ISO.
The fund invests in the MFS Institutional Money Market Portfolio which is managed by MFS and seeks current income consistent with preservation of capital and liquidity. Income earned on this investment is included in “Dividends from underlying affiliated funds” in the Statement of Operations. This money market fund does not pay a management fee to MFS.
For the year ended December 31, 2014, purchases and sales of shares of underlying funds aggregated $42,198,034 and $234,091,881, respectively.
| (5) | | Shares of Beneficial Interest |
The fund’s Declaration of Trust permits the Trustees to issue an unlimited number of full and fractional shares of beneficial interest. Transactions in fund shares were as follows:
| | | | | | | | | | | | | | | | |
| | | Year ended 12/31/14 | | | Year ended 12/31/13 | |
| | | Shares | | | Amount | | | Shares | | | Amount | |
| Shares sold | | | | | | | | | | | | | | | | |
Initial Class | | | 94,860 | | | | $1,233,854 | | | | 337,493 | | | | $4,194,281 | |
Service Class | | | 3,947,963 | | | | 51,668,478 | | | | 5,284,193 | | | | 67,697,262 | |
| | | 4,042,823 | | | | $52,902,332 | | | | 5,621,686 | | | | $71,891,543 | |
| Shares issued to shareholders in reinvestment of distributions | | | | | | | | | | | | | | | | |
Initial Class | | | 13,173 | | | | $175,463 | | | | 27,000 | | | | $326,160 | |
Service Class | | | 4,106,210 | | | | 54,653,654 | | | | 14,469,818 | | | | 174,795,398 | |
| | | 4,119,383 | | | | $54,829,117 | | | | 14,496,818 | | | | $175,121,558 | |
| Shares reacquired | | | | | | | | | | | | | | | | |
Initial Class | | | (35,755 | ) | | | $(468,928 | ) | | | (244,672 | ) | | | $(3,192,341 | ) |
Service Class | | | (17,975,771 | ) | | | (238,509,312 | ) | | | (13,479,779 | ) | | | (172,350,354 | ) |
| | | (18,011,526 | ) | | | $(238,978,240 | ) | | | (13,724,451 | ) | | | $(175,542,695 | ) |
| Net change | | | | | | | | | | | | | | | | |
Initial Class | | | 72,278 | | | | $940,389 | | | | 119,821 | | | | $1,328,100 | |
Service Class | | | (9,921,598 | ) | | | (132,187,180 | ) | | | 6,274,232 | | | | 70,142,306 | |
| | | (9,849,320 | ) | | | $(131,246,791 | ) | | | 6,394,053 | | | | $71,470,406 | |
The fund and certain other funds managed by MFS participate in a $1.1 billion unsecured committed line of credit, subject to a $1 billion sublimit, provided by a syndication of banks under a credit agreement. Borrowings may be made for temporary financing needs. Interest is charged to each fund, based on its borrowings, generally at a rate equal to the higher of the Federal Reserve funds rate or one month LIBOR plus an agreed upon spread. A commitment fee, based on the average daily, unused portion of the committed line of credit, is allocated among the participating funds at the end of each calendar quarter. In addition, the fund and other funds managed by MFS have established unsecured uncommitted borrowing arrangements with certain banks for temporary financing needs. Interest is charged to each fund, based on its borrowings, at a rate equal to the Federal Reserve funds rate plus an agreed upon spread. For the year ended December 31, 2014, the fund’s commitment fee and interest expense were $8,274 and $0, respectively, and are included in “Miscellaneous” expense in the Statement of Operations.
17
MFS Moderate Allocation Portfolio
Notes to Financial Statements – continued
| (7) | | Transactions in Underlying Affiliated Funds – Affiliated Issuers |
An affiliated issuer may be considered one in which the fund owns 5% or more of the outstanding voting securities, or a company which is under common control. For the purposes of this report, the fund assumes the following to be affiliated issuers:
| | | | | | | | | | | | | | | | |
| Underlying Affiliated Funds | | Beginning
Shares/Par
Amount | | | Acquisitions
Shares/Par
Amount | | | Dispositions
Shares/Par
Amount | | | Ending Shares/Par
Amount | |
| MFS Global Governments Portfolio | | | 10,415,734 | | | | 250,212 | | | | (665,146 | ) | | | 10,000,800 | |
| MFS Global Real Estate Portfolio | | | 5,334,590 | | | | 121,609 | | | | (886,812 | ) | | | 4,569,387 | |
| MFS Government Securities Portfolio | | | 17,111,780 | | | | 798,687 | | | | (1,431,637 | ) | | | 16,478,830 | |
| MFS Growth Series | | | 5,104,948 | | | | 473,943 | | | | (738,763 | ) | | | 4,840,128 | |
| MFS High Yield Portfolio | | | 17,424,880 | | | | 1,107,337 | | | | (1,144,919 | ) | | | 17,387,298 | |
| MFS Inflation-Adjusted Bond Portfolio | | | 10,882,484 | | | | 279,735 | | | | (912,702 | ) | | | 10,249,517 | |
| MFS Institutional Money Market Portfolio | | | 1,689,823 | | | | 111,240,337 | | | | (112,041,591 | ) | | | 888,569 | |
| MFS International Growth Portfolio | | | 4,527,618 | | | | 377,362 | | | | (232,039 | ) | | | 4,672,941 | |
| MFS International Value Portfolio | | | 3,054,205 | | | | 100,226 | | | | (225,202 | ) | | | 2,929,229 | |
| MFS Limited Maturity Portfolio | | | 8,469,239 | | | | 396,576 | | | | (518,917 | ) | | | 8,346,898 | |
| MFS Mid Cap Growth Series | | | 17,250,923 | | | | 2,461,222 | | | | (2,556,237 | ) | | | 17,155,908 | |
| MFS Mid Cap Value Portfolio | | | 15,452,866 | | | | 1,986,013 | | | | (2,094,385 | ) | | | 15,344,494 | |
| MFS New Discovery Series | | | 1,516,163 | | | | 525,643 | | | | (78,138 | ) | | | 1,963,668 | |
| MFS New Discovery Value Portfolio | | | 2,742,947 | | | | 541,273 | | | | (271,541 | ) | | | 3,012,679 | |
| MFS Research Bond Series | | | 19,910,826 | | | | 909,012 | | | | (1,746,370 | ) | | | 19,073,468 | |
| MFS Research International Portfolio | | | 9,696,444 | | | | 525,510 | | | | (472,871 | ) | | | 9,749,083 | |
| MFS Research Series | | | 6,173,522 | | | | 560,304 | | | | (857,474 | ) | | | 5,876,352 | |
| MFS Value Series | | | 10,363,058 | | | | 641,998 | | | | (1,534,704 | ) | | | 9,470,352 | |
| | | | |
| Underlying Affiliated Funds | | Realized Gain (Loss) | | | Capital Gain
Distributions | | | Dividend
Income | | | Ending Value | |
| MFS Global Governments Portfolio | | | $(184,432 | ) | | | $— | | | | $590,098 | | | | $104,708,380 | |
| MFS Global Real Estate Portfolio | | | 974,965 | | | | — | | | | 1,456,400 | | | | 64,245,587 | |
| MFS Government Securities Portfolio | | | (756,588 | ) | | | — | | | | 5,469,200 | | | | 214,554,367 | |
| MFS Growth Series | | | 3,100,441 | | | | 13,131,072 | | | | 205,765 | | | | 192,395,074 | |
| MFS High Yield Portfolio | | | (100,551 | ) | | | — | | | | 5,987,652 | | | | 106,236,388 | |
| MFS Inflation-Adjusted Bond Portfolio | | | (733,291 | ) | | | — | | | | 984,249 | | | | 105,775,011 | |
| MFS Institutional Money Market Portfolio | | | — | | | | — | | | | 1,198 | | | | 888,569 | |
| MFS International Growth Portfolio | | | 171,389 | | | | 2,924,032 | | | | 590,564 | | | | 62,103,380 | |
| MFS International Value Portfolio | | | 762,321 | | | | — | | | | 1,272,287 | | | | 63,652,140 | |
| MFS Limited Maturity Portfolio | | | (24,883 | ) | | | 348,066 | | | | 1,125,273 | | | | 85,388,768 | |
| MFS Mid Cap Growth Series | | | 1,907,394 | | | | 16,688,774 | | | | — | | | | 150,285,753 | |
| MFS Mid Cap Value Portfolio | | | 1,798,502 | | | | 16,768,752 | | | | 1,525,258 | | | | 150,376,039 | |
| MFS New Discovery Series | | | 4,792 | | | | 6,654,337 | | | | — | | | | 32,047,054 | |
| MFS New Discovery Value Portfolio | | | 102,464 | | | | 4,655,921 | | | | 177,565 | | | | 32,356,177 | |
| MFS Research Bond Series | | | (1,211,876 | ) | | | — | | | | 7,650,201 | | | | 257,491,812 | |
| MFS Research International Portfolio | | | 668,069 | | | | 1,562,740 | | | | 2,828,956 | | | | 141,946,645 | |
| MFS Research Series | | | 1,712,172 | | | | 13,101,477 | | | | 1,443,827 | | | | 171,060,603 | |
| MFS Value Series | | | 3,927,205 | | | | 6,119,054 | | | | 3,024,318 | | | | 192,626,955 | |
| | | | | | | | | | | | | | | | |
| | | $12,118,093 | | | | $81,954,225 | | | | $34,332,811 | | | | $2,128,138,702 | |
| | | | | | | | | | | | | | | | |
18
MFS Moderate Allocation Portfolio
REPORT OF INDEPENDENT REGISTERED PUBLIC ACCOUNTING FIRM
To the Board of Trustees of MFS Variable Insurance Trust III and the Shareholders of
MFS Moderate Allocation Portfolio:
We have audited the accompanying statement of assets and liabilities, including the portfolio of investments, of MFS Moderate Allocation Portfolio (one of the series of MFS Variable Insurance Trust III) (the “Fund”) as of December 31, 2014, and the related statement of operations for the year then ended, the statements of changes in net assets for each of the two years in the period then ended, and the financial highlights for each of the five years in the period then ended. These financial statements and financial highlights are the responsibility of the Fund’s management. Our responsibility is to express an opinion on these financial statements and financial highlights based on our audits.
We conducted our audits in accordance with the standards of the Public Company Accounting Oversight Board (United States). Those standards require that we plan and perform the audit to obtain reasonable assurance about whether the financial statements and financial highlights are free of material misstatement. The Fund is not required to have, nor were we engaged to perform, an audit of its internal control over financial reporting. Our audits included consideration of internal control over financial reporting as a basis for designing audit procedures that are appropriate in the circumstances, but not for the purpose of expressing an opinion on the effectiveness of the Fund’s internal control over financial reporting. Accordingly, we express no such opinion. An audit also includes examining, on a test basis, evidence supporting the amounts and disclosures in the financial statements, assessing the accounting principles used and significant estimates made by management, as well as evaluating the overall financial statement presentation. Our procedures included confirmation of securities owned as of December 31, 2014, by correspondence with the underlying funds’ transfer agent. We believe that our audits provide a reasonable basis for our opinion.
In our opinion, the financial statements and financial highlights referred to above present fairly, in all material respects, the financial position of MFS Moderate Allocation Portfolio as of December 31, 2014, the results of its operations for the year then ended, the changes in its net assets for each of the two years in the period then ended, and the financial highlights for each of the five years in the period then ended, in conformity with accounting principles generally accepted in the United States of America.
DELOITTE & TOUCHE LLP
Boston, Massachusetts
February 13, 2015
19
MFS Moderate Allocation Portfolio
TRUSTEES AND OFFICERS – IDENTIFICATION AND BACKGROUND
The Trustees and Officers of the Trust, as of February 1, 2015, are listed below, together with their principal occupations during the past five years. (Their titles may have varied during that period.) The address of each Trustee and Officer is 111 Huntington Avenue, Boston, Massachusetts 02199-7618.
| | | | | | | | |
Name, Age | | Position(s)
Held with Fund | | Trustee/Officer
Since (h) | | Principal Occupations
During the Past Five Years | | Other Directorships (j) |
| INTERESTED TRUSTEES |
Robert J. Manning (k) (age 51) | | Trustee | | February 2004 | | Massachusetts Financial Services Company, Chairman, Co-Chief Executive Officer and Director; President (until 2009); Chief Investment Officer (until 2010) | | N/A |
| | | | |
Robin A. Stelmach (k) (age 53) | | Trustee and President | | January 2014 | | Massachusetts Financial Services Company, Executive Vice President and Chief Operating Officer | | N/A |
| | | |
| INDEPENDENT TRUSTEES | | | | | | |
David H. Gunning (age 72) | | Trustee and Chair of Trustees | | January 2004 | | Private investor | | Lincoln Electric Holdings, Inc. (welding equipment manufacturer), Director; Development Alternatives, Inc. (consulting), Director/Non-Executive Chairman |
| | | | |
Steven E. Buller (age 63) | | Trustee | | February 2014 | | Chairman, Financial Accounting Standards Advisory Council; Standing Advisory Group, Public Company Accounting Oversight Board, Member (until 2014); BlackRock, Inc. (investment management), Managing Director (until 2014), BlackRock Finco UK (investment management), Director (until 2014) | | N/A |
| | | | |
Robert E. Butler (age 73) | | Trustee | | January 2006 | | Consultant – investment company industry regulatory and compliance matters | | N/A |
| | | | |
Maureen R. Goldfarb (age 59) | | Trustee | | January 2009 | | Private investor | | N/A |
| | | | |
William R. Gutow (age 73) | | Trustee | | December 1993 | | Private investor and real estate consultant; Capitol Entertainment Management Company (video franchise), Vice Chairman | | Texas Donuts (donut franchise), Vice Chairman (until 2010) |
| | | | |
Michael Hegarty (age 70) | | Trustee | | December 2004 | | Private investor | | Brookfield Office Properties, Inc. (real estate), Director; Rouse Properties Inc. (real estate), Director; Capmark Financial Group Inc. (real estate), Director |
| | | | |
John P. Kavanaugh (age 60) | | Trustee | | January 2009 | | Private investor | | N/A |
| | | | |
Maryanne L. Roepke (age 58) | | Trustee | | May 2014 | | American Century Investments (investment management), Senior Vice President and Chief Compliance Officer (until 2014) | | N/A |
| | | | |
Laurie J. Thomsen (age 57) | | Trustee | | March 2005 | | Private investor; New Profit, Inc. (venture philanthropy), Executive Partner (until 2010) | | The Travelers Companies (insurance), Director |
| | | | |
Robert W. Uek (age 73) | | Trustee | | January 2006 | | Consultant to investment company industry | | N/A |
| | | | |
| OFFICERS | | | | | | | | |
Christopher R. Bohane (k) (age 41) | | Assistant Secretary and Assistant Clerk | | July 2005 | | Massachusetts Financial Services Company, Vice President and Assistant General Counsel | | N/A |
| | | | |
Kino Clark (k) (age 46) | | Assistant Treasurer | | January 2012 | | Massachusetts Financial Services Company, Vice President | | N/A |
| | | | |
Thomas H. Connors (k) (age 55) | | Assistant Secretary and Assistant Clerk | | September 2012 | | Massachusetts Financial Services Company, Vice President and Senior Counsel; Deutsche Investment Management Americas Inc. (financial service provider), Director and Senior Counsel (until 2012) | | N/A |
20
MFS Moderate Allocation Portfolio
Trustees and Officers – continued
| | | | | | | | |
Name, Age | | Position(s)
Held with Fund | | Trustee/Officer
Since (h) | | Principal Occupations
During the Past Five Years | | Other Directorships (j) |
Ethan D. Corey (k) (age 51) | | Assistant
Secretary and Assistant Clerk | | July 2005 | | Massachusetts Financial Services Company, Senior Vice President and Associate General Counsel | | N/A |
| | | | |
David L. DiLorenzo (k) (age 46) | | Treasurer | | July 2005 | | Massachusetts Financial Services Company, Senior Vice President | | N/A |
| | | | |
Timothy M. Fagan (k) (age 46) | | Chief Compliance Officer | | November 2014 | | Massachusetts Financial Services Company, Chief Compliance Officer; Vice President and Senior Counsel (until 2012) | | N/A |
| | | | |
Brian E. Langenfeld (k) (age 41) | | Assistant
Secretary and Assistant Clerk | | June 2006 | | Massachusetts Financial Services Company, Vice President and Senior Counsel | | N/A |
| | | | |
Susan S. Newton (k) (age 64) | | Assistant
Secretary and Assistant Clerk | | May 2005 | | Massachusetts Financial Services Company, Senior Vice President and Associate General Counsel | | N/A |
| | | | |
Susan A. Pereira (k) (age 44) | | Assistant
Secretary and Assistant Clerk | | July 2005 | | Massachusetts Financial Services Company, Vice President and Senior Counsel | | N/A |
| | | | |
Kasey L. Phillips (k) (age 44) | | Assistant Treasurer | | September 2012 | | Massachusetts Financial Services Company, Vice President; Wells Fargo Funds Management, LLC, Senior Vice President, Fund Treasurer (until 2012) | | N/A |
| | | | |
Mark N. Polebaum (k) (age 62) | | Secretary and
Clerk | | January 2006 | | Massachusetts Financial Services Company, Executive Vice President, General Counsel and Secretary | | N/A |
| | | | |
Matthew A. Stowe (k) (age 40) | | Assistant Secretary and Assistant Clerk | | October 2014 | | Massachusetts Financial Services Company, Vice President and Senior Counsel | | N/A |
| | | | |
Frank L. Tarantino (age 70) | | Independent
Senior Officer | | June 2004 | | Tarantino LLC (provider of compliance services), Principal | | N/A |
| | | | |
Richard S. Weitzel (k) (age 44) | | Assistant Secretary and Assistant Clerk | | October 2007 | | Massachusetts Financial Services Company, Senior Vice President and Associate General Counsel | | N/A |
| | | | |
James O. Yost (k) (age 54) | | Deputy Treasurer | | September 1990 | | Massachusetts Financial Services Company, Senior Vice President | | N/A |
| (h) | Date first appointed to serve as Trustee/officer of an MFS Fund. Each Trustee has served continuously since appointment unless indicated otherwise. For the period from December 15, 2004 until February 22, 2005, Mr. Manning served as Advisory Trustee. Prior to January 2012, Messrs. DiLorenzo and Yost served as Assistant Treasurers of the Funds. Ms. Stelmach was appointed as President of the Funds as of October 1, 2014. |
| (j) | Directorships or trusteeships of companies required to report to the Securities and Exchange Commission (i.e., “public companies”). |
| (k) | “Interested person” of the Trust within the meaning of the Investment Company Act of 1940 (referred to as the 1940 Act), which is the principal federal law governing investment companies like the fund, as a result of a position with MFS. The address of MFS is 111 Huntington Avenue, Boston, Massachusetts 02199-7618. |
Each Trustee (except Ms. Stelmach, Mr. Buller and Ms. Roepke) has been elected by shareholders and each Trustee and officer holds office until his or her successor is chosen and qualified or until his or her earlier death, resignation, retirement or removal. The Trust does not hold annual meetings for the purpose of electing Trustees, and Trustees are not elected for fixed terms. Messrs. Butler, Kavanaugh, Uek and Mses. Thomsen and Roepke are members of the Trust’s Audit Committee.
Each of the Fund’s Trustees and officers holds comparable positions with certain other funds of which MFS or a subsidiary is the investment adviser or distributor, and, in the case of the officers, with certain affiliates of MFS. As of February 1, 2015, the Trustees served as board members of 135 funds within the MFS Family of Funds.
21
MFS Moderate Allocation Portfolio
Trustees and Officers – continued
The Statement of Additional Information for the Fund includes further information about the Trustees and is available without charge upon request by calling 1-800-225-2606.
| | |
Investment Adviser Massachusetts Financial Services Company 111 Huntington Avenue Boston, MA 02199-7618 | | Custodian State Street Bank and Trust Company 1 Lincoln Street Boston, MA 02111-2900 |
Distributor MFS Fund Distributors, Inc. 111 Huntington Avenue Boston, MA 02199-7618 | | Independent Registered Public Accounting Firm Deloitte & Touche LLP 200 Berkeley Street Boston, MA 02116 |
Portfolio Manager Joseph Flaherty | | |
22
MFS Moderate Allocation Portfolio
BOARD REVIEW OF INVESTMENT ADVISORY AGREEMENT
The Investment Company Act of 1940 requires that both the full Board of Trustees and a majority of the non-interested (“independent”) Trustees, voting separately, annually approve the continuation of the Fund’s investment advisory agreement with MFS. The Trustees consider matters bearing on the Fund and its advisory arrangements at their meetings throughout the year, including a review of performance data at each regular meeting. In addition, the independent Trustees met several times over the course of three months beginning in May and ending in July, 2014 (“contract review meetings”) for the specific purpose of considering whether to approve the continuation of the investment advisory agreement for the Fund and the other investment companies that the Board oversees (the “MFS Funds”). The independent Trustees were assisted in their evaluation of the Fund’s investment advisory agreement by independent legal counsel, from whom they received separate legal advice and with whom they met separately from MFS during various contract review meetings. The independent Trustees were also assisted in this process by the MFS Funds’ Independent Chief Compliance Officer, a full-time senior officer appointed by and reporting to the independent Trustees.
In connection with their deliberations regarding the continuation of the investment advisory agreement, the Trustees, including the independent Trustees, considered such information and factors as they believed, in light of the legal advice furnished to them and their own business judgment, to be relevant. The investment advisory agreement for the Fund was considered separately, although the Trustees also took into account the common interests of all MFS Funds in their review. As described below, the Trustees considered the nature, quality, and extent of the various investment advisory, administrative, and shareholder services performed by MFS under the existing investment advisory agreement and other arrangements with the Fund.
In connection with their contract review meetings, the Trustees received and relied upon materials that included, among other items: (i) information provided by Lipper Inc., an independent third party, on the investment performance of the Fund for various time periods ended December 31, 2013 and the investment performance of a group of funds with substantially similar investment classifications/objectives (the “Lipper performance universe”), (ii) information provided by Lipper Inc. on the Fund’s fees and expenses and the fees and expenses of comparable funds identified by Lipper Inc. (the “Lipper expense group”), (iii) information as to whether and to what extent applicable expense waivers and reimbursements are observed for the Fund, (iv) information regarding MFS’ financial results and financial condition, including MFS’ and certain of its affiliates’ estimated profitability from services performed for the Fund and the MFS Funds as a whole, and compared to MFS’ institutional business, (v) MFS’ views regarding the outlook for the mutual fund industry and the strategic business plans of MFS, (vi) descriptions of various functions performed by MFS for the Funds, such as compliance monitoring and portfolio trading practices, and (vii) information regarding the overall organization of MFS, including information about MFS’ senior management and other personnel providing investment advisory, administrative and other services to the Fund and the other MFS Funds. The comparative performance, fee and expense information prepared and provided by Lipper Inc. was not independently verified and the independent Trustees did not independently verify any information provided to them by MFS.
Prior to the close of business on December 7, 2012, the Fund was a series of Sun Capital Advisers Trust and was advised by Sun Capital Advisers LLC (“Sun Capital”), an affiliate of MFS, and subadvised by Ibbotson Associates, Inc. Following shareholder approval, MFS became the investment adviser of the Fund and assumed day-to-day investment management responsibilities for the Fund effective as of the close of business on December 7, 2012.
The Trustees’ conclusion as to the continuation of the investment advisory agreement was based on a comprehensive consideration of all information provided to the Trustees and not the result of any single factor. Some of the factors that figured particularly in the Trustees’ deliberations are described below, although individual Trustees may have evaluated the information presented differently from one another, giving different weights to various factors. It is also important to recognize that the fee arrangements for the Fund and other MFS Funds are the result of years of review and discussion between the independent Trustees and MFS, that certain aspects of such arrangements may receive greater scrutiny in some years than in others, and that the Trustees’ conclusions may be based, in part, on their consideration of these same arrangements during the course of the year and in prior years.
Based on information provided by Lipper Inc. and MFS, the Trustees reviewed the Fund’s total return investment performance as well as the performance of peer groups of funds over various time periods. The Trustees placed particular emphasis on the total return performance of the Fund’s Initial Class shares in comparison to the performance of funds in its Lipper performance universe over the three-year period ended December 31, 2013, which the Trustees believed was a long enough period to reflect differing market conditions. The total return performance of the Fund’s Initial Class shares was in the 3rd quintile relative to the other funds in the universe for this three-year period (the 1st quintile being the best performers and the 5th quintile being the worst performers). The total return performance of the Fund’s Initial Class shares was in the 2nd quintile for the one-year period and the 3rd quintile for the five-year period ended December 31, 2013 relative to the Lipper performance universe. Because of the passage of time, these performance results may differ from the performance results for more recent periods, including those shown elsewhere in this report.
In the course of their deliberations, the Trustees took into account information provided by MFS in connection with the contract review meetings, as well as during investment review meetings conducted with portfolio management personnel during the course
23
MFS Moderate Allocation Portfolio
Board Review of Investment Advisory Agreement – continued
of the year regarding the Fund’s performance. The Trustees noted that MFS became the Fund’s investment adviser in December 2012 and that MFS implemented certain changes in the Fund’s investment strategy. After reviewing these and related factors, the Trustees concluded, within the context of their overall conclusions regarding the investment advisory agreement, that they were satisfied with MFS’ responses and efforts relating to investment performance.
The Trustees considered that MFS does not charge an advisory fee for providing investment advisory services to the Fund, but that the Fund pays its pro rata share of the advisory fees paid by the underlying funds in which it invests (the “Underlying Funds”).
In assessing the reasonableness of the Fund’s expenses, the Trustees considered, among other information, the Fund’s total expense ratio of the Fund’s Initial Class shares as a percentage of average daily net assets and the total expense ratios of peer groups of funds based on information provided by Lipper Inc. The Trustees considered that MFS currently observes an expense limitation for the Fund, which may not be changed without the Trustees’ approval. The Trustees also considered that, according to the Lipper data (which takes into account any expense limitations that were in effect during the Fund’s last fiscal year), the Fund’s total expense ratio was approximately at the Lipper expense group median. Because the Fund does not pay an advisory fee, the Trustees did not consider the extent to which economies of scale would be realized due to the Fund’s growth of assets, whether fee levels reflect economies of scale for shareholders, or the fees paid by similar funds to other investment advisers or by similar clients of MFS.
The Trustees also considered information prepared by MFS relating to MFS’ costs and profits with respect to the Fund, the MFS Funds considered as a group, and other investment companies and accounts advised by MFS, as well as MFS’ methodologies used to determine and allocate its costs to the MFS Funds, the Fund and other accounts and products for purposes of estimating profitability.
In addition, the Trustees considered MFS’ resources and related efforts to continue to retain, attract and motivate capable personnel to serve the Fund. The Trustees also considered current and developing conditions in the financial services industry, including the presence of large and well-capitalized companies which are spending, and appear to be prepared to continue to spend, substantial sums to engage personnel and to provide services to competing investment companies. In this regard, the Trustees also considered the financial resources of MFS and its ultimate parent, Sun Life Financial Inc. The Trustees also considered the advantages and possible disadvantages to the Fund of having an adviser that also serves other investment companies as well as other accounts.
The Trustees also considered the nature, quality, cost, and extent of administrative, transfer agency, and distribution services provided to the Fund by MFS and its affiliates under agreements and plans other than the investment advisory agreement, including any 12b-1 fees the Fund pays to MFS Fund Distributors, Inc., an affiliate of MFS. The Trustees also considered the nature, extent and quality of certain other services MFS performs or arranges for on the Fund’s or the Underlying Funds’ behalf, which may include securities lending programs, directed expense payment programs, class action recovery programs, and MFS’ interaction with third-party service providers, principally custodians and sub-custodians. The Trustees concluded that the various non-advisory services provided by MFS and its affiliates on behalf of the Fund were satisfactory.
The Trustees also considered benefits to MFS from the use of the Underlying Funds’ portfolio brokerage commissions, if applicable, to pay for investment research and various other factors. Additionally, the Trustees considered so-called “fall-out benefits” to MFS such as reputational value derived from serving as investment manager to the Fund.
Based on their evaluation of factors that they deemed to be material, including those factors described above, the Board of Trustees, including the independent Trustees, concluded that the Fund’s investment advisory agreement with MFS should be continued for an additional one-year period, commencing August 1, 2014.
24
MFS Moderate Allocation Portfolio
PROXY VOTING POLICIES AND INFORMATION
MFS votes proxies on behalf of the fund pursuant to proxy voting policies and procedures that are available without charge, upon request, by calling 1-800-225-2606, by visiting the Proxy Voting section of mfs.com or by visiting the SEC’s Web site at http://www.sec.gov.
Information regarding how the fund voted proxies relating to portfolio securities during the most recent twelve-month period ended June 30 is available without charge by visiting the Proxy Voting section of mfs.com or by visiting the SEC’s Web site at http://www.sec.gov.
QUARTERLY PORTFOLIO DISCLOSURE
The fund will file a complete schedule of portfolio holdings with the Securities and Exchange Commission (the Commission) for the first and third quarters of each fiscal year on Form N-Q. The fund’s Form N-Q is available on the EDGAR database on the Commission’s Internet Web site at http://www.sec.gov, and may be reviewed and copied at the:
Public Reference Room
Securities and Exchange Commission
100 F Street, NE, Room 1580
Washington, D.C. 20549
Information on the operation of the Public Reference Room may be obtained by calling the Commission at 1-800-SEC-0330. Copies of the fund’s Form N-Q also may be obtained, upon payment of a duplicating fee, by electronic request at the following e-mail address: publicinfo@sec.gov or by writing the Public Reference Section at the above address.
FURTHER INFORMATION
From time to time, MFS may post important information about the fund or the MFS funds on the MFS web site (mfs.com). This information is available by visiting the “Market Commentary” and “Announcements” sub sections in the “Market Outlooks” section of mfs.com or by clicking on the fund’s name under “Variable Insurance Portfolios — VIT III” in the “Products” section of mfs.com.
FEDERAL TAX INFORMATION (unaudited)
The following information is provided pursuant to provisions of the Internal Revenue Code.
The fund designates $23,129,000 as capital gain dividends paid during the fiscal year.
For corporate shareholders, 18.20% of the ordinary income dividends paid during the fiscal year qualify for the corporate dividends received deduction.
25
rev. 3/11
| | | | |
| FACTS | | WHAT DOES MFS DO WITH YOUR
PERSONAL INFORMATION? | |  |
| | |
| Why? | | Financial companies choose how they share your personal information. Federal law gives consumers the right to limit some but not all sharing. Federal law also requires us to tell you how we collect, share, and protect your personal information. Please read this notice carefully to understand what we do. |
| | |
| What? | | The types of personal information we collect and share depend on the product or service you have with us. This information can include: • Social Security number and account balances • Account transactions and transaction history • Checking account information and wire transfer instructions When you are no longer our customer, we continue to share your information as described in this notice. |
| | |
| How? | | All financial companies need to share customers’ personal information to run their everyday business. In the section below, we list the reasons financial companies can share their customers’ personal information; the reasons MFS chooses to share; and whether you can limit this sharing. |
| | | | |
Reasons we can share your
personal information | | Does MFS share? | | Can you limit this
sharing? |
For our everyday business purposes – such as to process your transactions, maintain your account(s), respond to court orders and legal investigations, or report to credit bureaus | | Yes | | No |
For our marketing purposes – to offer our products and services to you | | No | | We don’t share |
| For joint marketing with other financial companies | | No | | We don’t share |
For our affiliates’ everyday business purposes – information about your transactions and experiences | | No | | We don’t share |
For our affiliates’ everyday business purposes – information about your creditworthiness | | No | | We don’t share |
| For nonaffiliates to market to you | | No | | We don’t share |
| | |
| Questions? | | Call 800-225-2606 or go to mfs.com. |
26
| | |
| Who we are |
| Who is providing this notice? | | MFS Funds, MFS Investment Management, MFS Institutional Advisors, Inc., MFS Fund Distributors, Inc., MFS Heritage Trust Company, and MFS Service Center, Inc. |
| | |
| What we do |
| How does MFS protect my personal information? | | To protect your personal information from unauthorized access and use, we use security measures that comply with federal law. These measures include procedural, electronic, and physical safeguards for the protection of the personal information we collect about you. |
How does MFS
collect my personal information? | | We collect your personal information, for example, when you • open an account or provide account information • direct us to buy securities or direct us to sell your securities • make a wire transfer We also collect your personal information from others, such as credit bureaus, affiliates and other companies. |
| Why can’t I limit all sharing? | | Federal law gives you the right to limit only • sharing for affiliates’ everyday business purposes – information about your creditworthiness • affiliates from using your information to market to you • sharing for nonaffiliates to market to you State laws and individual companies may give you additional rights to limit sharing. |
| | |
| Definitions |
| Affiliates | | Companies related by common ownership or control. They can be financial and nonfinancial companies. •MFS does not share personal information with affiliates, except for everyday business purposes as described on page one of this notice. |
| Nonaffiliates | | Companies not related by common ownership or control. They can be financial and nonfinancial companies. •MFS does not share with nonaffiliates so they can market to you. |
| Joint Marketing | | A formal agreement between nonaffiliated financial companies that together market financial products or services to you. •MFS doesn’t jointly market. |
| | |
| Other important information |
| If you own an MFS product or receive an MFS service in the name of a third party such as a bank or broker-dealer, their privacy policy may apply to you instead of ours. |
27
ANNUAL REPORT
December 31, 2014

MFS® NEW DISCOVERY VALUE PORTFOLIO
MFS® Variable Insurance Trust III

VDV-ANN
MFS® NEW DISCOVERY VALUE PORTFOLIO
CONTENTS
The report is prepared for the general information of contract owners. It is authorized for distribution to prospective investors only when preceded or accompanied by a current prospectus.
NOT FDIC INSURED Ÿ MAY LOSE VALUE Ÿ NO BANK OR CREDIT UNION GUARANTEE Ÿ NOT A DEPOSIT Ÿ NOT INSURED BY ANY FEDERAL GOVERNMENT AGENCY OR NCUA/NCUSIF
MFS New Discovery Value Portfolio
LETTER FROM THE CHAIRMAN

Dear Contract Owners:
As 2015 begins, sharply lower oil prices are reshaping the global economy, adding to deflationary pressures in the eurozone and exacerbating challenges faced by oil exporters such as Russia. The U.S. economy stands on firmer ground, having expanded steadily over the past year. The U.S. labor market has regained momentum, consumer confidence is buoyant and gasoline prices have tumbled, boosting prospects for a stronger economic rebound in 2015.
Other regions are struggling. The eurozone economy is barely expanding, and the European Central Bank (ECB) has introduced large-scale asset purchases.
Despite Japan’s efforts to strengthen its economy, its sales tax increase last spring tipped the country into a recession, leading to additional monetary stimulus from the Bank of Japan. China’s economy is slowing as it transitions to a more sustainable basis, and its growth rate will likely continue to decline.
As always, active risk management is integral to how we at MFS® manage your investments. We use a collaborative process, sharing insights across asset classes, regions and economic sectors. Our global investment team uses a diversified, multidisciplined, long-term approach.
Applying proven principles, such as asset allocation and diversification, can best serve investors over the long term. We are confident that this approach can help you as you work with your financial advisors to reach your goals in the years ahead.
Respectfully,

Robert J. Manning
Chairman
MFS Investment Management
February 13, 2015
The opinions expressed in this letter are subject to change and may not be relied upon for investment advice. No forecasts can be guaranteed.
1
MFS New Discovery Value Portfolio
PORTFOLIO COMPOSITION
Portfolio structure
| | | | |
| Top ten holdings | | | | |
| NICE Systems Ltd., ADR | | | 1.9% | |
| PrivateBancorp, Inc. | | | 1.8% | |
| Resources Connection, Inc. | | | 1.8% | |
| Everest Re Group Ltd. | | | 1.8% | |
| Cross Country Healthcare, Inc. | | | 1.7% | |
| NASDAQ OMX Group, Inc. | | | 1.6% | |
| Global Payments, Inc. | | | 1.6% | |
| Progressive Waste Solutions Ltd. | | | 1.6% | |
| TriMas Corp. | | | 1.6% | |
| Huntington Bancshares, Inc. | | | 1.6% | |
| | | | |
| Equity sectors | | | | |
| Financial Services | | | 34.8% | |
| Industrial Goods & Services | | | 11.4% | |
| Technology | | | 9.5% | |
| Special Products & Services | | | 7.5% | |
| Health Care | | | 5.5% | |
| Basic Materials | | | 5.5% | |
| Energy | | | 5.4% | |
| Leisure | | | 5.3% | |
| Retailing | | | 5.1% | |
| Utilities & Communications | | | 3.6% | |
| Transportation | | | 3.5% | |
| Consumer Staples | | | 1.4% | |
| Autos & Housing | | | 1.2% | |
Cash & Other can include cash, other assets less liabilities, offsets to derivative positions, and short-term securities.
Percentages are based on net assets as of 12/31/14.
The portfolio is actively managed and current holdings may be different.
2
MFS New Discovery Value Portfolio
MANAGEMENT REVIEW
Summary of Results
For the twelve months ended December 31, 2014, Initial Class shares of the MFS New Discovery Value Portfolio (“fund”) provided a total return of 3.44%, while Service Class shares of the fund provided a total return of 3.19%. These compare with a return of 4.22% over the same period for the fund’s benchmark, the Russell 2000 Value Index.
Market Environment
Early in the period, US equities suffered what proved to be a temporary setback due to concerns over emerging markets as well as what was perceived at the time to be a pause in US economic growth, partially caused by extreme weather events and a weak December 2013 labor market report. Markets soon recovered as the economic pause concluded and investors appeared to have become increasingly comfortable that newly-installed US Federal Reserve (“Fed”) Chair Janet Yellen would not make any substantial changes to the trajectory of Fed monetary policy.
A generally risk-friendly, carry trade environment persisted from February 2014 until mid-year. While geopolitical tensions flared in the Middle East and Russia/Ukraine, any market setbacks were short-lived as improving economic growth in the US, coupled with prospects for easier monetary policy in regions with slowing growth, such as Japan, Europe and China, supported risk assets. For example, the European Central Bank (“ECB”) cut policy interest rates into negative territory and, by the end of the period, expectations were for additional rate cuts and the announcement for non-conventional easing measures. Similarly, the Bank of Japan surprised markets late in the period with fresh stimulus measures given lackluster growth trends. The related decline in developed market government bond yields and credit spreads were also supportive for equity markets. At the end of the period, the US equity market was trading close to all-time highs and US Treasury yields were close to their lows for the period. However, credit markets did not fare as well in the second half of 2014, particularly US high yield and emerging market debt. The higher weightings of oil and gas credits in these asset classes resulted in widening spreads and increased volatility as oil prices began to decline in an accelerated fashion in the fourth quarter.
Detractors from Performance
Weak stock selection in the transportation sector detracted from performance relative to the Russell 2000 Value Index. The fund’s ownership in shares of shipping company Diana Shipping (b) hurt relative results. Shares of Diana Shipping weakened in the second half of the period after the company posted consecutive quarterly losses due to a sluggish demand environment.
Stock selection within the retailing sector was another negative factor for relative returns. Within this sector, an overweight position in department store operator Gordmans Stores held back relative returns after the company experienced various merchandising and supply chain issues as well as an adverse impact from warmer-than-expected weather during the fall season.
Underweight positions in both the utilities & communications and financial services sectors also weighed on relative performance. However, there were no individual securities within either sector that were among the fund’s top relative detractors.
Elsewhere, other top relative detractors for the period included the fund’s overweight positions in postsecondary education provider ITT Educational Services (h), graphite and carbon materials producer Graftech International, crystalline products manufacturer Rubicon Technology, metallurgical coal producer Walter Energy (h) and oilfield technologies company Tesco. Shares of ITT Educational Services declined during the period reflecting weaker trends in new student enrollment and potential regulatory issues brought forward by the Securities and Exchange Commission (SEC). In addition, the Department of Education introduced sanctions against ITT Educational Services as the company did not submit 2013 audited financials by the end of June which further pressured the stock. Shares of Graftech International dipped sharply towards the end of third quarter after the company cut earnings guidance. The company’s Engineered Solutions segment suffered the most on the back of weak consumer electronic product launches that hit profitability. Additionally, sales of graphite electrodes continued to diminish due to oversupply in the market which caused the reduction of shipments for 2015 and lowered production rates. The fund’s holdings in international service company Serco (b)(h) (United Kingdom), independent energy company Sm Energy (b) and offshore service vessels and marine support services provider Tidewater (b) also detracted from relative returns. Shares of Serco declined towards the end of the period following lower-than-expected guidance on current and future year operating profitability, 1.5 billion pounds in write-downs and provisions for future losses as well as contract pipelines having remained at low levels.
During the reporting period, the fund’s relative currency exposure, resulting primarily from differences between the fund’s and the benchmark’s exposures to holdings of securities denominated in foreign currencies, was another detractor from relative performance. All of MFS’ investment decisions are driven by the fundamentals of each individual opportunity and as such, it is common for our portfolios to have different currency exposure than the benchmark.
3
MFS New Discovery Value Portfolio
Management Review – continued
Contributors to Performance
Strong stock selection within the leisure sector contributed to relative performance, led by the fund’s position in Stroer Media (b) (Germany). The company’s share price surged in the second half of the year reflecting strong earnings and better-than-expected full year guidance for the 2014 year.
Stock selection in the industrial goods & services sector also aided relative returns. Overweight positions in pipe producer Advanced Drainage Systems and snow and ice control equipment manufacturer Douglas Dynamics helped relative performance. Shares of Advanced Drainage Systems grew substantially after the company went public in late July. Strong volume growth, considerable market share gains reflecting material conversion and increased spending on infrastructure were the main factors driving the stock price.
Positive stock selection within the health care sector was another factor that benefited relative results. Here, an overweight position in healthcare staffing and workforce management company Cross Country Healthcare, and holdings of healthcare services provider Molina Healthcare, bolstered relative returns. Despite disappointing results at the beginning of the year, shares of Cross Country Healthcare recovered later in the period on the back of improved profitability and revenue as well as lower-than-expected operational costs.
Elsewhere, holdings of strong-performing analog power integrated circuits Micrel (b) and data recording products provider Nice Systems (b) (Israel) supported relative returns. Shares of Micrel surged towards the end of the reporting period due to solid growth numbers driven by resumption of capital spending in key analog end-markets like industrial, communications and automotive. Additionally, the fund’s overweight positions in urban fashion apparel retailer Burlington Stores, furniture rental company Rent-A-Center and hydraulic fracturing, coiled tubing, wireline, and other complementary services provider C&J Energy Services (h) also aided relative performance.
Respectfully,
Kevin Schmitz
Portfolio Manager
| (b) | Security is not a benchmark constituent. |
| (h) | Security was not held in the portfolio at period end. |
The views expressed in this report are those of the portfolio manager only through the end of the period of the report as stated on the cover and do not necessarily reflect the views of MFS or any other person in the MFS organization. These views are subject to change at any time based on market or other conditions, and MFS disclaims any responsibility to update such views. These views may not be relied upon as investment advice or an indication of trading intent on behalf of any MFS portfolio. References to specific securities are not recommendations of such securities, and may not be representative of any MFS portfolio’s current or future investments.
4
MFS New Discovery Value Portfolio
PERFORMANCE SUMMARY THROUGH 12/31/14
The following chart illustrates the historical performance of the fund in comparison to its benchmark(s). Benchmarks are unmanaged and may not be invested in directly. Benchmark returns do not reflect any fees or expenses. The performance of other share classes will be greater than or less than that of the class depicted below. (See Notes to Performance Summary.)
Performance data shown represents past performance and is no guarantee of future results. Investment return and principal value fluctuate so your units, when sold, may be worth more or less than the original cost; current performance may be lower or higher than quoted. The performance shown does not reflect the deduction of taxes, if any, that a contract holder would pay on fund distributions or the redemption of contract units. The returns for the fund shown also do not reflect the deduction of expenses associated with variable products, such as mortality and expense risk charges, separate account charges, and sales charges imposed by the insurance company separate accounts. Such expenses would reduce the overall returns shown.
Growth of a Hypothetical $10,000 Investment (t)
Total Returns through 12/31/14
Average annual total returns
| | | | | | | | | | | | |
| | | Share Class | | Class inception date | | 1-yr | | 5-yr | | Life (t) | | |
| | | Initial Class | | 10/01/08 | | 3.44% | | 12.63% | | 10.71% | | |
| | | Service Class | | 10/01/08 | | 3.19% | | 12.38% | | 10.44% | | |
| | | | |
| Comparative benchmark | | | | | | | | |
| | | Russell 2000 Value Index (f) | | 4.22% | | 14.26% | | 9.49% | | |
| (f) | Source: FactSet Research Systems Inc. |
| (t) | For the period from the class inception date through the stated period end. (See Notes to Performance Summary.) |
Benchmark Definition
Russell 2000 Value Index – a market-capitalization-weighted, value-oriented index that measures the performance of small-capitalization stocks that have relatively low price-to-book ratios and lower forecasted growth values.
It is not possible to invest directly in an index.
Notes to Performance Summary
Average annual total return represents the average annual change in value for each share class for the periods presented. Life returns are presented where the share class has less than 10 years of performance history and represent the average annual total return from the class inception date to the stated period end date.
Performance results reflect any applicable expense subsidies and waivers in effect during the periods shown. Without such subsidies and waivers the fund’s performance results would be less favorable. Please see the prospectus and financial statements for complete details. All results are historical and assume the reinvestment of any dividends and capital gains distributions.
Performance prior to close of business December 7, 2012, reflects time periods when another adviser or subadviser was responsible for selecting investments for the fund under a different investment objective and different investment strategies.
5
MFS New Discovery Value Portfolio
Performance Summary – continued
Performance results do not include adjustments made for financial reporting purposes in accordance with U.S. generally accepted accounting principles and may differ from amounts reported in the financial highlights.
From time to time the fund may receive proceeds from litigation settlements, without which performance would be lower.
6
MFS New Discovery Value Portfolio
EXPENSE TABLE
Fund Expenses Borne by the Contract Holders During the Period,
July 1, 2014 through December 31, 2014
As a contract holder of the fund, you incur ongoing costs, including management fees; distribution and/or service (12b-1) fees; and other fund expenses. This example is intended to help you understand your ongoing costs (in dollars) of investing in the fund and to compare these costs with the ongoing costs of investing in other mutual funds.
The example is based on an investment of $1,000 invested at the beginning of the period and held for the entire period July 1, 2014 through December 31, 2014.
Actual Expenses
The first line for each share class in the following table provides information about actual account values and actual expenses. You may use the information in this line, together with the amount you invested, to estimate the expenses that you paid over the period. Simply divide your account value by $1,000 (for example, an $8,600 account value divided by $1,000 = 8.6), then multiply the result by the number in the first line under the heading entitled “Expenses Paid During Period” to estimate the expenses you paid on your account during this period.
Hypothetical Example for Comparison Purposes
The second line for each share class in the following table provides information about hypothetical account values and hypothetical expenses based on the fund’s actual expense ratio and an assumed rate of return of 5% per year before expenses, which is not the fund’s actual return. The hypothetical account values and expenses may not be used to estimate the actual ending account balance or expenses you paid for the period. You may use this information to compare the ongoing costs of investing in the fund and other funds. To do so, compare this 5% hypothetical example with the 5% hypothetical examples that appear in the shareholder reports of the other funds.
Please note that the expenses shown in the table are meant to highlight the fund’s ongoing costs only and do not take into account the fees and expenses imposed under the variable contracts through which your investment in the fund is made. Therefore, the second line for each share class in the table is useful in comparing ongoing costs associated with an investment in vehicles (such as the fund) which fund benefits under variable annuity and variable life insurance contracts and to qualified pension and retirement plans only, and will not help you determine the relative total costs of investing in the fund through variable annuity and variable life insurance contracts. If the fees and expenses imposed under the variable contracts were included, your costs would have been higher.
| | | | | | | | | | | | | | | | | | |
| Share Class | | | | Annualized
Expense Ratio | | | Beginning
Account Value
7/01/14 | | | Ending Account Value
12/31/14 | | | Expenses Paid
During Period (p)
7/01/14-12/31/14 | |
| Initial Class | | Actual | | | 0.91% | | | | $1,000.00 | | | | $1,000.53 | | | | $4.59 | |
| | Hypothetical (h) | | | 0.91% | | | | $1,000.00 | | | | $1,020.62 | | | | $4.63 | |
| Service Class | | Actual | | | 1.16% | | | | $1,000.00 | | | | $999.60 | | | | $5.85 | |
| | Hypothetical (h) | | | 1.16% | | | | $1,000.00 | | | | $1,019.36 | | | | $5.90 | |
| (h) | 5% class return per year before expenses. |
| (p) | “Expenses Paid During Period” are equal to each class’s annualized expense ratio, as shown above, multiplied by the average account value over the period, multiplied by 184/365 (to reflect the one-half year period). |
Notes to Expense Table
Changes to the fund’s fee arrangements occurred during the six month period. Had these fee changes been in effect throughout the entire six month period, the annualized expense ratios, the actual expenses paid during the period and the hypothetical expenses paid during the period would have been approximately 0.88%, $4.44 and $4.48 for Initial Class and 1.13%, $5.70 and $5.75 for Service Class. For further information about the fund’s fee arrangements and changes to those fee arrangements, please see Note 3 in the Notes to Financial Statements.
7
MFS New Discovery Value Portfolio
PORTFOLIO OF INVESTMENTS –12/31/14
The Portfolio of Investments is a complete list of all securities owned by your fund. It is categorized by broad-based asset classes.
| | | | | | | | |
| Issuer | | Shares/Par | | | Value ($) | |
| | | | | | | | |
| COMMON STOCKS – 99.7% | |
| Broadcasting – 1.0% | | | | | | | | |
| Stroer Out-of-Home Media AG | | | 22,804 | | | $ | 678,989 | |
| | | | | | | | |
| Brokerage & Asset Managers – 2.8% | |
| FXCM, Inc., “A” | | | 24,915 | | | $ | 412,837 | |
| GAIN Capital Holdings, Inc. | | | 37,193 | | | | 335,481 | |
| NASDAQ OMX Group, Inc. | | | 22,411 | | | | 1,074,832 | |
| | | | | | | | |
| | | $ | 1,823,150 | |
| | | | | | | | |
| Business Services – 5.4% | | | | | | | | |
| Forrester Research, Inc. | | | 17,677 | | | $ | 695,767 | |
| Global Payments, Inc. | | | 13,249 | | | | 1,069,592 | |
| RE/MAX Holdings, Inc., “A” | | | 18,785 | | | | 643,386 | |
| Resources Connection, Inc. | | | 69,663 | | | | 1,145,956 | |
| | | | | | | | |
| | | $ | 3,554,701 | |
| | | | | | | | |
| Computer Software – 0.6% | | | | | | | | |
| Rovi Corp. (a) | | | 16,560 | | | $ | 374,090 | |
| | | | | | | | |
| Computer Software – Systems – 4.5% | |
| Ingram Micro, Inc., “A” (a) | | | 32,900 | | | $ | 909,356 | |
| Model N, Inc. (a) | | | 40,190 | | | | 426,818 | |
| NICE Systems Ltd., ADR | | | 24,572 | | | | 1,244,572 | |
| Sabre Corp. | | | 17,963 | | | | 364,110 | |
| | | | | | | | |
| | | $ | 2,944,856 | |
| | | | | | | | |
| Construction – 1.2% | | | | | | | | |
| Beacon Roofing Supply, Inc. (a) | | | 15,342 | | | $ | 426,508 | |
| Interface, Inc. | | | 21,474 | | | | 353,677 | |
| | | | | | | | |
| | | $ | 780,185 | |
| | | | | | | | |
| Consumer Products – 1.4% | | | | | | | | |
| Sensient Technologies Corp. | | | 15,528 | | | $ | 936,960 | |
| | | | | | | | |
| Consumer Services – 2.0% | | | | | | | | |
| Capella Education Co. | | | 6,311 | | | $ | 485,695 | |
| Carriage Services, Inc. | | | 21,614 | | | | 452,813 | |
| Servicemaster Global Holdings, Inc. (a) | | | 14,273 | | | | 382,088 | |
| | | | | | | | |
| | | $ | 1,320,596 | |
| | | | | | | | |
| Containers – 2.0% | | | | | | | | |
| Graphic Packaging Holding Co. (a) | | | 35,446 | | | $ | 482,775 | |
| Greif, Inc., “A” | | | 16,752 | | | | 791,197 | |
| | | | | | | | |
| | | $ | 1,273,972 | |
| | | | | | | | |
| Electrical Equipment – 2.7% | | | | | | | | |
| Advanced Drainage Systems, Inc. | | | 30,545 | | | $ | 701,924 | |
| TriMas Corp. (a) | | | 33,731 | | | | 1,055,443 | |
| | | | | | | | |
| | | $ | 1,757,367 | |
| | | | | | | | |
| Electronics – 2.9% | | | | | | | | |
| Lattice Semiconductor Corp. (a) | | | 58,110 | | | $ | 400,378 | |
| Micrel, Inc. | | | 35,067 | | | | 508,822 | |
| Plexus Corp. (a) | | | 12,389 | | | | 510,551 | |
| Rubicon Technology, Inc. (a)(l) | | | 35,497 | | | | 162,221 | |
| Ultratech, Inc. (a) | | | 17,872 | | | | 331,704 | |
| | | | | | | | |
| | | $ | 1,913,676 | |
| | | | | | | | |
| | | | | | | | |
| Issuer | | Shares/Par | | | Value ($) | |
| | | | | | | | |
| COMMON STOCKS – continued | |
| Energy – Independent – 2.6% | | | | | | | | |
| Energen Corp. | | | 9,644 | | | $ | 614,901 | |
| Memorial Resource Development Corp. (a) | | | 14,702 | | | | 265,077 | |
| Rosetta Resources, Inc. (a) | | | 10,434 | | | | 232,783 | |
| SM Energy Co. | | | 14,601 | | | | 563,307 | |
| | | | | | | | |
| | | $ | 1,676,068 | |
| | | | | | | | |
| Entertainment – 2.9% | | | | | | | | |
| AMC Entertainment Holdings, Inc., “A” | | | 25,581 | | | $ | 669,711 | |
| Cinemark Holdings, Inc. | | | 24,474 | | | | 870,785 | |
| International Speedway Corp. | | | 11,146 | | | | 352,771 | |
| | | | | | | | |
| | | $ | 1,893,267 | |
| | | | | | | | |
| Food & Drug Stores – 0.2% | | | | | | | | |
| Brazil Pharma S.A. (a) | | | 101,210 | | | $ | 98,613 | |
| | | | | | | | |
| Health Maintenance Organizations – 0.6% | | | | | |
| Molina Healthcare, Inc. (a) | | | 7,203 | | | $ | 385,577 | |
| | | | | | | | |
| Insurance – 8.6% | | | | | | | | |
| Allied World Assurance Co. | | | 24,782 | | | $ | 939,733 | |
| Aspen Insurance Holdings Ltd. | | | 11,080 | | | | 484,972 | |
| Everest Re Group Ltd. | | | 6,705 | | | | 1,141,862 | |
| Hanover Insurance Group, Inc. | | | 10,092 | | | | 719,761 | |
| Safety Insurance Group, Inc. | | | 9,073 | | | | 580,763 | |
| Stewart Information Services Corp. | | | 16,191 | | | | 599,715 | |
| Symetra Financial Corp. | | | 21,902 | | | | 504,841 | |
| Third Point Reinsurance Ltd. (a) | | | 44,243 | | | | 641,081 | |
| | | | | | | | |
| | | $ | 5,612,728 | |
| | | | | | | | |
| Leisure & Toys – 1.3% | | | | | | | | |
| Brunswick Corp. | | | 6,518 | | | $ | 334,113 | |
| Callaway Golf Co. | | | 67,296 | | | | 518,179 | |
| | | | | | | | |
| | | $ | 852,292 | |
| | | | | | | | |
| Machinery & Tools – 7.1% | | | | | | | | |
| Columbus McKinnon Corp. | | | 23,279 | | | $ | 652,743 | |
| Douglas Dynamics, Inc. | | | 19,838 | | | | 425,128 | |
| Herman Miller, Inc. | | | 21,278 | | | | 626,212 | |
| Joy Global, Inc. | | | 14,560 | | | | 677,331 | |
| Kennametal, Inc. | | | 15,421 | | | | 551,918 | |
| Oshkosh Corp. | | | 8,357 | | | | 406,568 | |
| Polypore International, Inc. (a) | | | 9,607 | | | | 452,009 | |
| Regal Beloit Corp. | | | 11,223 | | | | 843,970 | |
| | | | | | | | |
| | | $ | 4,635,879 | |
| | | | | | | | |
| Major Banks – 1.6% | | | | | | | | |
| Huntington Bancshares, Inc. | | | 97,438 | | | $ | 1,025,048 | |
| | | | | | | | |
| Medical & Health Technology & Services – 2.8% | |
| Cross Country Healthcare, Inc. (a) | | | 87,959 | | | $ | 1,097,728 | |
| MEDNAX, Inc. (a) | | | 11,112 | | | | 734,614 | |
| | | | | | | | |
| | | $ | 1,832,342 | |
| | | | | | | | |
8
MFS New Discovery Value Portfolio
Portfolio of Investments – continued
| | | | | | | | |
| Issuer | | Shares/Par | | | Value ($) | |
| | | | | | | | |
| COMMON STOCKS – continued | |
| Medical Equipment – 2.1% | | | | | | | | |
| Masimo Corp. (a) | | | 16,383 | | | $ | 431,528 | |
| Teleflex, Inc. | | | 8,371 | | | | 961,158 | |
| | | | | | | | |
| | | $ | 1,392,686 | |
| | | | | | | | |
| Metals & Mining – 1.1% | | | | | | | | |
| GrafTech International Ltd. (a) | | | 59,775 | | | $ | 302,462 | |
| Iluka Resources Ltd. | | | 86,149 | | | | 414,133 | |
| | | | | | | | |
| | | $ | 716,595 | |
| | | | | | | | |
| Natural Gas – Distribution – 0.8% | | | | | | | | |
| AGL Resources, Inc. | | | 9,161 | | | $ | 499,366 | |
| | | | | | | | |
| Natural Gas – Pipeline – 0.4% | | | | | | | | |
| StealthGas, Inc. (a) | | | 39,490 | | | $ | 249,182 | |
| | | | | | | | |
| Network & Telecom – 1.5% | | | | | | | | |
| Ixia (a) | | | 53,847 | | | $ | 605,779 | |
| Polycom, Inc. (a) | | | 26,883 | | | | 362,921 | |
| | | | | | | | |
| | | $ | 968,700 | |
| | | | | | | | |
| Oil Services – 2.8% | | | | | | | | |
| Helix Energy Solutions Group, Inc. (a) | | | 17,633 | | | $ | 382,636 | |
| Superior Energy Services, Inc. | | | 16,968 | | | | 341,905 | |
| Tesco Corp. | | | 40,014 | | | | 512,979 | |
| Tidewater, Inc. | | | 18,392 | | | | 596,085 | |
| | | | | | | | |
| | | $ | 1,833,605 | |
| | | | | | | | |
| Other Banks & Diversified Financials – 14.4% | | | | | |
| Berkshire Hills Bancorp, Inc. | | | 20,617 | | | $ | 549,649 | |
| Brookline Bancorp, Inc. | | | 87,781 | | | | 880,443 | |
| CAI International, Inc. (a) | | | 42,579 | | | | 987,833 | |
| Cathay General Bancorp, Inc. | | | 29,264 | | | | 748,866 | |
| EZCORP, Inc., “A” (a) | | | 61,499 | | | | 722,613 | |
| First Interstate BancSystem, Inc. | | | 22,336 | | | | 621,388 | |
| Great Western Bancorp, Inc. (a) | | | 27,510 | | | | 626,953 | |
| PrivateBancorp, Inc. | | | 34,980 | | | | 1,168,332 | |
| Regional Management Corp. (a) | | | 51,379 | | | | 812,302 | |
| Sandy Spring Bancorp, Inc. | | | 24,045 | | | | 627,094 | |
| TCF Financial Corp. | | | 55,158 | | | | 876,461 | |
| Texas Capital Bancshares, Inc. (a) | | | 13,979 | | | | 759,479 | |
| | | | | | | | |
| | | $ | 9,381,413 | |
| | | | | | | | |
| Pollution Control – 1.6% | | | | | | | | |
| Progressive Waste Solutions Ltd. | | | 35,201 | | | $ | 1,058,846 | |
| | | | | | | | |
| Railroad & Shipping – 1.0% | | | | | | | | |
| Diana Shipping, Inc. (a) | | | 94,442 | | | $ | 633,706 | |
| | | | | | | | |
| Real Estate – 7.4% | | | | | | | | |
| BioMed Realty Trust, Inc., REIT | | | 30,479 | | | $ | 656,518 | |
| Corporate Office Properties Trust, REIT | | | 25,385 | | | | 720,172 | |
| EPR Properties, REIT | | | 16,983 | | | | 978,730 | |
| Hatteras Financial Corp., REIT | | | 34,102 | | | | 628,500 | |
| Medical Properties Trust, Inc., REIT | | | 53,723 | | | | 740,303 | |
| Select Income, REIT | | | 31,258 | | | | 763,008 | |
| Store Capital Corp., REIT | | | 16,056 | | | | 346,970 | |
| | | | | | | | |
| | | $ | 4,834,201 | |
| | | | | | | | |
| | | | | | | | |
| Issuer | | Shares/Par | | | Value ($) | |
| | | | | | | | |
| COMMON STOCKS – continued | |
| Specialty Chemicals – 2.5% | | | | | | | | |
| Amira Nature Foods Ltd. (a) | | | 16,183 | | | $ | 232,226 | |
| H.B. Fuller Co. | | | 10,506 | | | | 467,832 | |
| Kronos Worldwide, Inc. | | | 25,057 | | | | 326,242 | |
| Tronox Ltd., “A” | | | 24,306 | | | | 580,427 | |
| | | | | | | | |
| | | $ | 1,606,727 | |
| | | | | | | | |
| Specialty Stores – 5.0% | | | | | | | | |
| Burlington Stores, Inc. (a) | | | 11,845 | | | $ | 559,795 | |
| Children’s Place, Inc. | | | 15,373 | | | | 876,261 | |
| Citi Trends, Inc. (a) | | | 16,776 | | | | 423,594 | |
| Gordmans Stores, Inc. (a) | | | 71,926 | | | | 196,358 | |
| Kirkland’s, Inc. (a) | | | 35,322 | | | | 835,012 | |
| Rent-A-Center, Inc. | | | 9,914 | | | | 360,076 | |
| | | | | | | | |
| | | $ | 3,251,096 | |
| | | | | | | | |
| Trucking – 2.5% | | | | | | | | |
| Atlas Air Worldwide Holdings, Inc. (a) | | | 10,902 | | | $ | 537,469 | |
| Celadon Group, Inc. | | | 22,547 | | | | 511,591 | |
| Marten Transport Ltd. | | | 27,567 | | | | 602,615 | |
| | | | | | | | |
| | | $ | 1,651,675 | |
| | | | | | | | |
| Utilities – Electric Power – 2.4% | | | | | | | | |
| El Paso Electric Co. | | | 18,726 | | | $ | 750,164 | |
| Great Plains Energy, Inc. | | | 28,822 | | | | 818,833 | |
| | | | | | | | |
| | | $ | 1,568,997 | |
| | | | | | | | |
Total Common Stocks
(Identified Cost, $53,226,525) | | | | | | $ | 65,017,151 | |
| | | | | | | | |
|
| MONEY MARKET FUNDS – 0.6% | |
| MFS Institutional Money Market Portfolio, 0.09%, at Cost and Net Asset Value (v) | | | 432,375 | | | $ | 432,375 | |
| | | | | | | | |
|
| COLLATERAL FOR SECURITIES LOANED – 0.2% | |
| Navigator Securities Lending Prime Portfolio, 0.16%, at Cost and Net Asset Value (j) | | | 116,604 | | | $ | 116,604 | |
| | | | | | | | |
Total Investments
(Identified Cost, $53,775,504) | | | | | | $ | 65,566,130 | |
| | | | | | | | |
OTHER ASSETS, LESS
LIABILITIES – (0.5)% | | | | | | | (343,835 | ) |
| | | | | | | | |
| NET ASSETS – 100.0% | | | $ | 65,222,295 | |
| | | | | | | | |
| (a) | | Non-income producing security. |
| (j) | | The rate quoted is the annualized seven-day yield of the fund at period end. |
| (l) | | A portion of this security is on loan. |
| (v) | | Underlying affiliated fund that is available only to investment companies managed by MFS. The rate quoted for the MFS Institutional Money Market Portfolio is the annualized seven-day yield of the fund at period end. |
The following abbreviations are used in this report and are defined:
| ADR | | American Depositary Receipt |
| REIT | | Real Estate Investment Trust |
See Notes to Financial Statements
9
MFS New Discovery Value Portfolio
FINANCIAL STATEMENTS | STATEMENT OF ASSETS AND LIABILITIES
This statement represents your fund’s balance sheet, which details the assets and liabilities comprising the total value of the fund.
| | | | | | | | |
At 12/31/14 | | | | | | | | |
Assets | | | | | | | | |
Investments – | | | | | | | | |
Non-affiliated issuers, at value (identified cost, $53,343,129) | | | $65,133,755 | | | | | |
Underlying affiliated funds, at cost and value | | | 432,375 | | | | | |
Total investments, at value, including $118,418 of securities on loan (identified cost, $53,775,504) | | | $65,566,130 | | | | | |
Receivables for | | | | | | | | |
Interest and dividends | | | 86,066 | | | | | |
Receivable from investment adviser | | | 15,377 | | | | | |
Other assets | | | 891 | | | | | |
Total assets | | | | | | | $65,668,464 | |
Liabilities | | | | | | | | |
Payable for fund shares reacquired | | | $286,691 | | | | | |
Collateral for securities loaned, at value | | | 116,604 | | | | | |
Payable to affiliates | | | | | | | | |
Shareholder servicing costs | | | 18 | | | | | |
Distribution and/or service fees | | | 143 | | | | | |
Payable for independent Trustees’ compensation | | | 89 | | | | | |
Accrued expenses and other liabilities | | | 42,624 | | | | | |
Total liabilities | | | | | | | $446,169 | |
Net assets | | | | | | | $65,222,295 | |
Net assets consist of | | | | | | | | |
Paid-in capital | | | $48,503,368 | | | | | |
Unrealized appreciation (depreciation) on investments and translation of assets and liabilities in foreign currencies | | | 11,790,562 | | | | | |
Accumulated net realized gain (loss) on investments and foreign currency | | | 4,584,067 | | | | | |
Undistributed net investment income | | | 344,298 | | | | | |
Net assets | | | | | | | $65,222,295 | |
Shares of beneficial interest outstanding | | | | | | | 6,077,741 | |
| | | | | | | | | | | | |
| | | Net assets | | | Shares
outstanding | | | Net asset value
per share | |
Initial Class | | | $54,917,471 | | | | 5,112,578 | | | | $10.74 | |
Service Class | | | 10,304,824 | | | | 965,163 | | | | 10.68 | |
See Notes to Financial Statements
10
MFS New Discovery Value Portfolio
FINANCIAL STATEMENTS | STATEMENT OF OPERATIONS
This statement describes how much your fund earned in investment income and accrued in expenses. It also describes any gains and/or losses generated by fund operations.
| | | | | | | | |
Year ended 12/31/14 | | | | | | | | |
Net investment income | | | | | | | | |
Income | | | | | | | | |
Dividends | | | $1,031,264 | | | | | |
Interest | | | 5,747 | | | | | |
Dividends from underlying affiliated funds | | | 928 | | | | | |
Foreign taxes withheld | | | (6,617 | ) | | | | |
Total investment income | | | | | | | $1,031,322 | |
Expenses | | | | | | | | |
Management fee | | | $603,990 | | | | | |
Distribution and/or service fees | | | 26,905 | | | | | |
Shareholder servicing costs | | | 3,745 | | | | | |
Administrative services fee | | | 19,764 | | | | | |
Independent Trustees’ compensation | | | 2,766 | | | | | |
Custodian fee | | | 32,625 | | | | | |
Shareholder communications | | | 7,696 | | | | | |
Audit and tax fees | | | 55,062 | | | | | |
Legal fees | | | 583 | | | | | |
Miscellaneous | | | 9,205 | | | | | |
Total expenses | | | | | | | $762,341 | |
Fees paid indirectly | | | (15 | ) | | | | |
Reduction of expenses by investment adviser | | | (77,137 | ) | | | | |
Net expenses | | | | | | | $685,189 | |
Net investment income | | | | | | | $346,133 | |
Realized and unrealized gain (loss) on investments and foreign currency | | | | | | | | |
Realized gain (loss) (identified cost basis) | | | | | | | | |
Investments | | | $4,921,056 | | | | | |
Foreign currency | | | (1,770 | ) | | | | |
Net realized gain (loss) on investments and foreign currency | | | | | | | $4,919,286 | |
Change in unrealized appreciation (depreciation) | | | | | | | | |
Investments | | | $(2,936,309 | ) | | | | |
Translation of assets and liabilities in foreign currencies | | | (86 | ) | | | | |
Net unrealized gain (loss) on investments and foreign currency translation | | | | | | | $(2,936,395 | ) |
Net realized and unrealized gain (loss) on investments and foreign currency | | | | | | | $1,982,891 | |
Change in net assets from operations | | | | | | | $2,329,024 | |
See Notes to Financial Statements
11
MFS New Discovery Value Portfolio
FINANCIAL STATEMENTS | STATEMENTS OF CHANGES IN NET ASSETS
These statements describe the increases and/or decreases in net assets resulting from operations, any distributions, and any shareholder transactions.
| | | | | | | | |
For years ended 12/31 | | | 2014 | | | | 2013 | |
Change in net assets | | | | | | | | |
From operations | �� | | | | | | | |
Net investment income | | | $346,133 | | | | $335,565 | |
Net realized gain (loss) on investments and foreign currency | | | 4,919,286 | | | | 9,267,084 | |
Net unrealized gain (loss) on investments and foreign currency translation | | | (2,936,395 | ) | | | 12,775,184 | |
Change in net assets from operations | | | $2,329,024 | | | | $22,377,833 | |
Distributions declared to shareholders | | | | | | | | |
From net investment income | | | $(331,977 | ) | | | $(710,005 | ) |
From net realized gain on investments | | | (9,423,538 | ) | | | (679,626 | ) |
Total distributions declared to shareholders | | | $(9,755,515 | ) | | | $(1,389,631 | ) |
Change in net assets from fund share transactions | | | $3,528,701 | | | | $(16,059,096 | ) |
Total change in net assets | | | $(3,897,790 | ) | | | $4,929,106 | |
Net assets | | | | | | | | |
At beginning of period | | | 69,120,085 | | | | 64,190,979 | |
At end of period (including undistributed net investment income of $344,298 and
$331,912, respectively) | | | $65,222,295 | | | | $69,120,085 | |
See Notes to Financial Statements
12
MFS New Discovery Value Portfolio
FINANCIAL STATEMENTS | FINANCIAL HIGHLIGHTS
The financial highlights table is intended to help you understand the fund’s financial performance for the past 5 years. Certain information reflects financial results for a single fund share. The total returns in the table represent the rate by which an investor would have earned (or lost) on an investment in the fund share class (assuming reinvestment of all distributions) held for the entire period.
| | | | | | | | | | | | | | | | | | | | |
| Initial Class | | Years ended 12/31 | |
| | | 2014 | | | 2013 | | | 2012 | | | 2011 | | | 2010 | |
Net asset value, beginning of period | | | $12.12 | | | | $8.85 | | | | $8.33 | | | | $11.18 | | | | $10.08 | |
| Income (loss) from investment operations | | | | | | | | | | | | | | | | | | | | |
Net investment income (d) | | | $0.06 | | | | $0.06 | | | | $0.11 | | | | $0.04 | | | | $0.07 | |
Net realized and unrealized gain (loss) on investments
and foreign currency | | | 0.35 | | | | 3.44 | | | | 0.72 | | | | (0.88 | ) | | | 1.93 | |
Total from investment operations | | | $0.41 | | | | $3.50 | | | | $0.83 | | | | $(0.84 | ) | | | $2.00 | |
| Less distributions declared to shareholders | | | | | | | | | | | | | | | | | | | | |
From net investment income | | | $(0.07 | ) | | | $(0.12 | ) | | | $(0.01 | ) | | | $(0.07 | ) | | | $— | |
From net realized gain on investments | | | (1.72 | ) | | | (0.11 | ) | | | (0.30 | ) | | | (1.94 | ) | | | (0.90 | ) |
Total distributions declared to shareholders | | | $(1.79 | ) | | | $(0.23 | ) | | | $(0.31 | ) | | | $(2.01 | ) | | | $(0.90 | ) |
Net asset value, end of period (x) | | | $10.74 | | | | $12.12 | | | | $8.85 | | | | $8.33 | | | | $11.18 | |
Total return (%) (k)(r)(s)(x) | | | 3.44 | | | | 39.94 | | | | 9.90 | | | | (6.32 | ) | | | 21.62 | |
Ratios (%) (to average net assets)
and Supplemental data: | | | | | | | | | | | | | | | | | | | | |
Expenses before expense reductions (f) | | | 1.10 | | | | 1.06 | | | | 1.13 | | | | 1.24 | | | | 1.41 | |
Expenses after expense reductions (f) | | | 0.98 | | | | 1.05 | | | | N/A | | | | 1.15 | | | | 1.15 | |
Net investment income | | | 0.56 | | | | 0.55 | | | | 1.23 | | | | 0.36 | | | | 0.68 | |
Portfolio turnover | | | 49 | | | | 55 | | | | 146 | | | | 50 | | | | 139 | |
Net assets at end of period (000 omitted) | | | $54,917 | | | | $57,686 | | | | $52,375 | | | | $43,958 | | | | $48,782 | |
See Notes to Financial Statements
13
MFS New Discovery Value Portfolio
Financial Highlights – continued
| | | | | | | | | | | | | | | | | | | | |
| Service Class | | Years ended 12/31 | |
| | | 2014 | | | 2013 | | | 2012 | | | 2011 | | | 2010 | |
Net asset value, beginning of period | | | $12.06 | | | | $8.80 | | | | $8.30 | | | | $11.14 | | | | $10.07 | |
| Income (loss) from investment operations | | | | | | | | | | | | | | | | | | | | |
Net investment income (d) | | | $0.03 | | | | $0.03 | | | | $0.08 | | | | $0.01 | | | | $0.05 | |
Net realized and unrealized gain (loss) on investments
and foreign currency | | | 0.34 | | | | 3.43 | | | | 0.72 | | | | (0.86 | ) | | | 1.92 | |
Total from investment operations | | | $0.37 | | | | $3.46 | | | | $0.80 | | | | $(0.85 | ) | | | $1.97 | |
| Less distributions declared to shareholders | | | | | | | | | | | | | | | | | | | | |
From net investment income | | | $(0.03 | ) | | | $(0.09 | ) | | | $— | | | | $(0.05 | ) | | | $— | |
From net realized gain on investments | | | (1.72 | ) | | | (0.11 | ) | | | (0.30 | ) | | | (1.94 | ) | | | (0.90 | ) |
Total distributions declared to shareholders | | | $(1.75 | ) | | | $(0.20 | ) | | | $(0.30 | ) | | | $(1.99 | ) | | | $(0.90 | ) |
Net asset value, end of period (x) | | | $10.68 | | | | $12.06 | | | | $8.80 | | | | $8.30 | | | | $11.14 | |
Total return (%) (k)(r)(s)(x) | | | 3.19 | | | | 39.68 | | | | 9.60 | | | | (6.50 | ) | | | 21.33 | |
Ratios (%) (to average net assets)
and Supplemental data: | | | | | | | | | | | | | | | | | | | | |
Expenses before expense reductions (f) | | | 1.35 | | | | 1.31 | | | | 1.38 | | | | 1.48 | | | | 1.67 | |
Expenses after expense reductions (f) | | | 1.23 | | | | 1.30 | | | | N/A | | | | 1.40 | | | | 1.40 | |
Net investment income | | | 0.30 | | | | 0.29 | | | | 0.91 | | | | 0.12 | | | | 0.47 | |
Portfolio turnover | | | 49 | | | | 55 | | | | 146 | | | | 50 | | | | 139 | |
Net assets at end of period (000 omitted) | | | $10,305 | | | | $11,434 | | | | $11,816 | | | | $11,847 | | | | $12,293 | |
Information prior to the close of business on December 7, 2012, reflects time periods when another adviser or subadviser was responsible for selecting investments for the fund under a different investment objective and different investment strategies.
| (d) | Per share data is based on average shares outstanding. |
| (f) | Ratios do not reflect reductions from fees paid indirectly, if applicable. |
| (k) | The total return does not reflect expenses that apply to separate accounts. Inclusion of these charges would reduce the total return figures for all periods shown. |
| (r) | Certain expenses have been reduced without which performance would have been lower. |
| (s) | From time to time the fund may receive proceeds from litigation settlements, without which performance would be lower. |
| (x) | The net asset values per share and total returns have been calculated on net assets which include adjustments made in accordance with U.S. generally accepted accounting principles required at period end for financial reporting purposes. |
See Notes to Financial Statements
14
MFS New Discovery Value Portfolio
NOTES TO FINANCIAL STATEMENTS
| (1) | | Business and Organization |
MFS New Discovery Value Portfolio (the fund) is a diversified series of MFS Variable Insurance Trust III (the trust). The trust is organized as a Delaware statutory trust and is registered under the Investment Company Act of 1940, as amended, as an open-end management investment company. The shareholders of each series of the trust are separate accounts of insurance companies, which offer variable annuity and/or life insurance products, and qualified retirement and pension plans.
The fund is an investment company and accordingly follows the investment company accounting and reporting guidance of the Financial Accounting Standards Board (FASB) Accounting Standards Codification Topic 946 Financial Services – Investment Companies.
| (2) | | Significant Accounting Policies |
General – The preparation of financial statements in conformity with U.S. generally accepted accounting principles requires management to make estimates and assumptions that affect the reported amounts of assets and liabilities, and disclosure of contingent assets and liabilities at the date of the financial statements and the reported amounts of increases and decreases in net assets from operations during the reporting period. Actual results could differ from those estimates. In the preparation of these financial statements, management has evaluated subsequent events occurring after the date of the fund’s Statement of Assets and Liabilities through the date that the financial statements were issued.
In June 2014, FASB issued Accounting Standards Update 2014-11, Transfers and Servicing (Topic 860) – Repurchase-to-Maturity Transactions, Repurchase Financings, and Disclosures (“ASU 2014-11”). ASU 2014-11 changes the accounting for repurchase-to-maturity transactions (i.e., repurchase agreements that settle at the same time as the maturity of the transferred financial asset) and enhances the required disclosures for repurchase agreements and other similar transactions. Although still evaluating the potential impacts of ASU 2014-11 to the fund, management expects that the impact of the fund’s adoption will be limited to additional financial statement disclosures which would first be effective for interim reporting periods beginning after March 15, 2015.
Balance Sheet Offsetting – The fund’s accounting policy with respect to balance sheet offsetting is that, absent an event of default by the counterparty or a termination of the agreement, the International Swaps and Derivatives Association (ISDA) Master Agreement does not result in an offset of reported amounts of financial assets and financial liabilities in the Statement of Assets and Liabilities across transactions between the fund and the applicable counterparty. The fund’s right to setoff may be restricted or prohibited by the bankruptcy or insolvency laws of the particular jurisdiction to which a specific master netting agreement counterparty is subject. Balance sheet offsetting disclosures, to the extent applicable to the fund, have been included in the fund’s Significant Accounting Policies note under the captions for each of the fund’s in-scope financial instruments and transactions.
Investment Valuations – Equity securities, including restricted equity securities, are generally valued at the last sale or official closing price as provided by a third-party pricing service on the market or exchange on which they are primarily traded. Equity securities, for which there were no sales reported that day, are generally valued at the last quoted daily bid quotation as provided by a third-party pricing service on the market or exchange on which such securities are primarily traded. Short-term instruments with a maturity at issuance of 60 days or less may be valued at amortized cost, which approximates market value. Open-end investment companies are generally valued at net asset value per share. Securities and other assets generally valued on the basis of information from a third-party pricing service may also be valued at a broker/dealer bid quotation. Values obtained from third-party pricing services can utilize both transaction data and market information such as yield, quality, coupon rate, maturity, type of issue, trading characteristics, and other market data. The values of foreign securities and other assets and liabilities expressed in foreign currencies are converted to U.S. dollars using the mean of bid and asked prices for rates provided by a third-party pricing service.
The Board of Trustees has delegated primary responsibility for determining or causing to be determined the value of the fund’s investments (including any fair valuation) to the adviser pursuant to valuation policies and procedures approved by the Board. If the adviser determines that reliable market quotations are not readily available, investments are valued at fair value as determined in good faith by the adviser in accordance with such procedures under the oversight of the Board of Trustees. Under the fund’s valuation policies and procedures, market quotations are not considered to be readily available for most types of debt instruments and floating rate loans and many types of derivatives. These investments are generally valued at fair value based on information from third-party pricing services. In addition, investments may be valued at fair value if the adviser determines that an investment’s value has been materially affected by events occurring after the close of the exchange or market on which the investment is principally traded (such as foreign exchange or market) and prior to the determination of the fund’s net asset value, or after the halting of trading of a specific security where trading does not resume prior to the close of the exchange or market on which the security is principally traded. Events that occur on a frequent basis after foreign markets close (such as developments in foreign markets and significant movements in the U.S. markets) and prior to the determination of the fund’s net asset value may be deemed to have a material effect on the value of securities traded in foreign markets. Accordingly, the fund’s foreign equity securities may often be valued at fair value. The adviser generally relies on third-party pricing services or other information (such as the correlation with price movements of similar securities in the same or other markets; the type, cost and investment characteristics of the security; the
15
MFS New Discovery Value Portfolio
Notes to Financial Statements – continued
business and financial condition of the issuer; and trading and other market data) to assist in determining whether to fair value and at what value to fair value an investment. The value of an investment for purposes of calculating the fund’s net asset value can differ depending on the source and method used to determine value. When fair valuation is used, the value of an investment used to determine the fund’s net asset value may differ from quoted or published prices for the same investment. There can be no assurance that the fund could obtain the fair value assigned to an investment if it were to sell the investment at the same time at which the fund determines its net asset value per share.
Various inputs are used in determining the value of the fund’s assets or liabilities. These inputs are categorized into three broad levels. In certain cases, the inputs used to measure fair value may fall into different levels of the fair value hierarchy. In such cases, an investment’s level within the fair value hierarchy is based on the lowest level of input that is significant to the fair value measurement. The fund’s assessment of the significance of a particular input to the fair value measurement in its entirety requires judgment, and considers factors specific to the investment. Level 1 includes unadjusted quoted prices in active markets for identical assets or liabilities. Level 2 includes other significant observable market-based inputs (including quoted prices for similar securities, interest rates, prepayment speed, and credit risk). Level 3 includes unobservable inputs, which may include the adviser’s own assumptions in determining the fair value of investments. The following is a summary of the levels used as of December 31, 2014 in valuing the fund’s assets or liabilities:
| | | | | | | | | | | | | | | | |
| Investments at Value | | Level 1 | | | Level 2 | | | Level 3 | | | Total | |
| Equity Securities: | | | | | | | | | | | | | | | | |
United States | | | $60,406,884 | | | | $— | | | | $— | | | | $60,406,884 | |
Israel | | | 1,244,572 | | | | — | | | | — | | | | 1,244,572 | |
Canada | | | 1,058,846 | | | | — | | | | — | | | | 1,058,846 | |
Greece | | | 882,888 | | | | — | | | | — | | | | 882,888 | |
Germany | | | — | | | | 678,989 | | | | — | | | | 678,989 | |
Australia | | | — | | | | 414,133 | | | | — | | | | 414,133 | |
United Arab Emirates | | | 232,226 | | | | — | | | | — | | | | 232,226 | |
Brazil | | | 98,613 | | | | — | | | | — | | | | 98,613 | |
| Mutual Funds | | | 548,979 | | | | — | | | | — | | | | 548,979 | |
| Total Investments | | | $64,473,008 | | | | $1,093,122 | | | | $— | | | | $65,566,130 | |
For further information regarding security characteristics, see the Portfolio of Investments.
Of the level 2 investments presented above, equity investments amounting to $1,093,122 would have been considered level 1 investments at the beginning of the period. The primary reason for changes in the classifications between levels 1 and 2 occurs when foreign equity securities are fair valued using other observable market-based inputs in place of the closing exchange price due to events occurring after the close of the exchange or market on which the investment is principally traded. The fund’s foreign equity securities may often be valued at fair value. The fund’s policy is to recognize transfers between the levels as of the end of the period.
Foreign Currency Translation – Purchases and sales of foreign investments, income, and expenses are converted into U.S. dollars based upon currency exchange rates prevailing on the respective dates of such transactions or on the reporting date for foreign denominated receivables and payables. Gains and losses attributable to foreign currency exchange rates on sales of securities are recorded for financial statement purposes as net realized gains and losses on investments. Gains and losses attributable to foreign exchange rate movements on receivables, payables, income and expenses are recorded for financial statement purposes as foreign currency transaction gains and losses. That portion of both realized and unrealized gains and losses on investments that results from fluctuations in foreign currency exchange rates is not separately disclosed.
Security Loans – Under its Securities Lending Agency Agreement with the fund, State Street Bank and Trust Company (“State Street”), as lending agent, loans the securities of the fund to certain qualified institutions (the “Borrowers”) approved by the fund. The loans are collateralized by cash and/or U.S. Treasury and federal agency obligations in an amount typically at least equal to the market value of the securities loaned. On loans collateralized by cash, the cash collateral is invested in a money market fund. The market value of the loaned securities is determined at the close of business of the fund and any additional required collateral is delivered to the fund on the next business day. State Street provides the fund with indemnification against Borrower default. In the event of Borrower default, State Street will for the benefit of the fund either purchase securities identical to those loaned or, when such purchase is commercially impracticable, pay the fund the market value of the loaned securities. In return, State Street assumes the fund’s rights to the related collateral. If the collateral value is less than the cost to purchase identical securities, State Street is responsible for the shortfall, but only to the extent that such shortfall is not due to a decline in collateral value resulting from collateral reinvestment for which the fund bears the risk of loss. At period end, the fund had investment securities on loan with a fair value of $118,418 and a related liability of $116,604 for cash collateral received on securities loaned, both of which are presented gross in the Statement of Assets and Liabilities. The value of the fund’s securities on loan net of the related collateral is $1,814 at period end. The liability for cash collateral for securities loaned is carried at fair value, which is categorized as level 2 within the fair
16
MFS New Discovery Value Portfolio
Notes to Financial Statements – continued
value hierarchy. A portion of the income generated upon investment of the collateral is remitted to the Borrowers, and the remainder is allocated between the fund and the lending agent. On loans collateralized by U.S. Treasury and/or federal agency obligations, a fee is received from the Borrower, and is allocated between the fund and the lending agent. Income from securities lending is included in “Interest” income in the Statement of Operations. The dividend and interest income earned on the securities loaned is accounted for in the same manner as other dividend and interest income.
Indemnifications – Under the fund’s organizational documents, its officers and Trustees may be indemnified against certain liabilities and expenses arising out of the performance of their duties to the fund. Additionally, in the normal course of business, the fund enters into agreements with service providers that may contain indemnification clauses. The fund’s maximum exposure under these agreements is unknown as this would involve future claims that may be made against the fund that have not yet occurred.
Investment Transactions and Income – Investment transactions are recorded on the trade date. Interest income is recorded on the accrual basis. Dividends received in cash are recorded on the ex-dividend date. Certain dividends from foreign securities will be recorded when the fund is informed of the dividend if such information is obtained subsequent to the ex-dividend date. Dividend payments received in additional securities are recorded on the ex-dividend in an amount equal to the value of the security on such date.
The fund may receive proceeds from litigation settlements. Any proceeds received from litigation involving portfolio holdings are reflected in the Statement of Operations in realized gain/loss if the security has been disposed of by the fund or in unrealized gain/loss if the security is still held by the fund. Any other proceeds from litigation not related to portfolio holdings are reflected as other income in the Statement of Operations.
Fees Paid Indirectly – The fund’s custody fee may be reduced according to an arrangement that measures the value of cash deposited with the custodian by the fund. This amount, for the year ended December 31, 2014, is shown as a reduction of total expenses in the Statement of Operations.
Tax Matters and Distributions – The fund intends to qualify as a regulated investment company, as defined under Subchapter M of the Internal Revenue Code, and to distribute all of its taxable income, including realized capital gains. As a result, no provision for federal income tax is required. The fund’s federal tax returns, when filed, will remain subject to examination by the Internal Revenue Service for a three year period. Management has analyzed the fund’s tax positions taken on federal and state tax returns for all open tax years and does not believe that there are any uncertain tax positions that require recognition of a tax liability. Foreign taxes, if any, have been accrued by the fund in the accompanying financial statements in accordance with the applicable foreign tax law. Foreign income taxes may be withheld by certain countries in which the fund invests. Additionally, capital gains realized by the fund on securities issued in or by certain foreign countries may be subject to capital gains tax imposed by those countries.
Distributions to shareholders are recorded on the ex-dividend date. Income and capital gain distributions are determined in accordance with income tax regulations, which may differ from U.S. generally accepted accounting principles. Certain capital accounts in the financial statements are periodically adjusted for permanent differences in order to reflect their tax character. These adjustments have no impact on net assets or net asset value per share. Temporary differences which arise from recognizing certain items of income, expense, gain or loss in different periods for financial statement and tax purposes will reverse at some time in the future. Distributions in excess of net investment income or net realized gains are temporary overdistributions for financial statement purposes resulting from differences in the recognition or classification of income or distributions for financial statement and tax purposes.
Book/tax differences primarily relate to wash sale loss deferrals.
The tax character of distributions declared to shareholders for the last two fiscal years is as follows:
| | | | | | | | |
| | | 12/31/14 | | | 12/31/13 | |
| Ordinary income (including any short-term capital gains) | | | $8,638,871 | | | | $1,221,873 | |
| Long-term capital gains | | | 1,116,644 | | | | 167,758 | |
| Total distributions | | | $9,755,515 | | | | $1,389,631 | |
The federal tax cost and the tax basis components of distributable earnings were as follows:
| | | | |
| As of 12/31/14 | | | | |
| Cost of investments | | | $54,204,787 | |
| Gross appreciation | | | 13,991,795 | |
| Gross depreciation | | | (2,630,452 | ) |
| Net unrealized appreciation (depreciation) | | | $11,361,343 | |
| Undistributed ordinary income | | | 648,529 | |
| Undistributed long-term capital gain | | | 4,709,119 | |
| Other temporary differences | | | (64 | ) |
17
MFS New Discovery Value Portfolio
Notes to Financial Statements – continued
Multiple Classes of Shares of Beneficial Interest – The fund offers multiple classes of shares, which differ in their respective distribution and/or service fees. The fund’s income, realized and unrealized gain (loss), and common expenses are allocated to shareholders based on the daily net assets of each class. Dividends are declared separately for each class. Differences in per share dividend rates are generally due to differences in separate class expenses. The fund’s distributions declared to shareholders as reported in the Statements of Changes in Net Assets are presented by class as follows:
| | | | | | | | | | | | | | | | |
| | | From net investment
income | | | From net realized gain on
investments | |
| | | Year ended
12/31/14 | | | Year ended
12/31/13 | | | Year ended
12/31/14 | | | Year ended
12/31/13 | |
| Initial Class | | | $302,310 | | | | $614,461 | | | | $7,926,867 | | | | $564,255 | |
| Service Class | | | 29,667 | | | | 95,544 | | | | 1,496,671 | | | | 115,371 | |
| Total | | | $331,977 | | | | $710,005 | | | | $9,423,538 | | | | $679,626 | |
| (3) | | Transactions with Affiliates |
Investment Adviser – The fund has an investment advisory agreement with MFS to provide overall investment management and related administrative services and facilities to the fund. The management fee is computed daily and paid monthly at the following annual rates:
| | | | |
| First $250 million of average daily net assets | | | 0.90% | |
| Average daily net assets in excess of $250 million | | | 0.85% | |
MFS has agreed in writing to reduce its management fee by a specified amount if certain MFS mutual fund assets exceed thresholds agreed to by MFS and the fund’s Board of Trustees. For the year ended December 31, 2014, this management fee reduction amounted to $3,081, which is included in the reduction of total expenses in the Statement of Operations. The management fee incurred for the year ended December 31, 2014 was equivalent to an annual effective rate of 0.90% of the fund’s average daily net assets.
The investment adviser has agreed in writing to pay a portion of the fund’s total annual operating expenses, excluding interest, taxes, extraordinary expenses, brokerage and transaction costs, and investment-related expenses, such that total annual operating expenses do not exceed 1.05% of average daily net assets for the Initial Class shares and 1.30% of average daily net assets for Service Class shares. This written agreement expired on July 31, 2014. For the period January 1, 2014 to July 31, 2014, this reduction amounted to $9,049 and is included in the reduction of total expenses in the Statement of Operations. Effective August 1, 2014, the investment adviser has agreed in writing to pay a portion of the fund’s total annual operating expenses, excluding interest, taxes, extraordinary expenses, brokerage and transaction costs, and investment-related expenses, such that total annual operating expenses do not exceed 0.88% of average daily net assets for the Initial Class shares and 1.13% of average daily net assets for the Service Class shares. This written agreement will continue until modified by the fund’s Board of Trustees, but such agreement will continue at least until April 30, 2016. For the period August 1, 2014 to December 31, 2014, this reduction amounted to $64,890 and is included in the reduction of total expenses in the Statement of Operations.
Distributor – MFS Fund Distributors, Inc. (MFD), a wholly-owned subsidiary of MFS, is the distributor of shares of the fund. The Trustees have adopted a distribution plan for the Service Class shares pursuant to Rule 12b-1 under the Investment Company Act of 1940.
The fund’s distribution plan provides that the fund will pay MFD distribution and/or service fees equal to 0.25% per annum of its average daily net assets attributable to Service Class shares as partial consideration for services performed and expenses incurred by MFD and financial intermediaries (including participating insurance companies that invest in the fund to fund variable annuity and variable life insurance contracts, sponsors of qualified retirement and pension plans that invest in the fund, and affiliates of these participating insurance companies and plan sponsors) in connection with the sale and distribution of the Service Class shares. MFD may subsequently pay all, or a portion, of the distribution and/or service fees to financial intermediaries.
Shareholder Servicing Agent – MFS Service Center, Inc. (MFSC), a wholly-owned subsidiary of MFS, receives a fee from the fund for its services as shareholder servicing agent. For the year ended December 31, 2014, the fee was $3,678, which equated to 0.0055% annually of the fund’s average daily net assets. MFSC also receives payment from the fund for out-of-pocket expenses paid by MFSC on behalf of the fund. For the year ended December 31, 2014, these costs amounted to $67.
Administrator – MFS provides certain financial, legal, shareholder communications, compliance, and other administrative services to the fund. Under an administrative services agreement, the fund partially reimburses MFS the costs incurred to provide these services. The fund is charged an annual fixed amount of $17,500 plus a fee based on average daily net assets. The administrative services fee incurred for the year ended December 31, 2014 was equivalent to an annual effective rate of 0.0294% of the fund’s average daily net assets.
Trustees’ and Officers’ Compensation – The fund pays compensation to independent Trustees in the form of a retainer, attendance fees, and additional compensation to Board and Committee chairpersons. The fund does not pay compensation directly
18
MFS New Discovery Value Portfolio
Notes to Financial Statements – continued
to Trustees or officers of the fund who are also officers of the investment adviser, all of whom receive remuneration for their services to the fund from MFS. Certain officers and Trustees of the fund are officers or directors of MFS, MFD, and MFSC.
Other – Effective November 1, 2014, this fund and certain other funds managed by MFS (the funds) have entered into a service agreement (the ISO Agreement) which provides for payment of fees solely by the funds to Tarantino LLC in return for the provision of services of an Independent Senior Officer (ISO) for the funds. Frank L. Tarantino serves as the ISO and is an officer of the funds and the sole member of Tarantino LLC. The funds can terminate the ISO Agreement with Tarantino LLC at any time under the terms of the ISO Agreement. Prior to November 1, 2014, the funds had entered into services agreements (the Compliance Officer Agreements) which provided for payment of fees by the funds to Tarantino LLC and Griffin Compliance LLC in return for the provision of services of an Independent Chief Compliance Officer (ICCO) and Assistant ICCO, respectively, for the funds. Prior to November 1, 2014, Frank L. Tarantino served as the ICCO. Effective October 31, 2014, Mr. Tarantino resigned as ICCO and the Compliance Officer Agreement between the funds and Tarantino LLC was terminated. Prior to June 1, 2014, Robyn L. Griffin served as the Assistant ICCO and was an officer of the funds. Ms. Griffin is the sole member of Griffin Compliance LLC. Effective May 31, 2014, Ms. Griffin resigned as Assistant ICCO and the Compliance Officer Agreement between the funds and Griffin Compliance LLC was terminated. For the year ended December 31, 2014, the aggregate fees paid by the fund under these agreements were $312 and are included in “Miscellaneous” expense in the Statement of Operations. MFS had agreed to reimburse the fund for a portion of the payments made by the fund for the services under the Compliance Officer Agreements in the amount of $117, which is included in the reduction of total expenses in the Statement of Operations. Additionally, MFS has agreed to bear all expenses associated with office space, other administrative support, and supplies provided to the ICCO, Assistant ICCO, and ISO.
The fund invests in the MFS Institutional Money Market Portfolio which is managed by MFS and seeks current income consistent with preservation of capital and liquidity. Income earned on this investment is included in “Dividends from underlying affiliated funds” in the Statement of Operations. This money market fund does not pay a management fee to MFS.
For the year ended December 31, 2014, purchases and sales of investments, other than short-term obligations, aggregated $32,413,388 and $37,363,316, respectively.
| (5) | | Shares of Beneficial Interest |
The fund’s Declaration of Trust permits the Trustees to issue an unlimited number of full and fractional shares of beneficial interest. Transactions in fund shares were as follows:
| | | | | | | | | | | | | | | | |
| | | Year ended 12/31/14 | | | Year ended 12/31/13 | |
| | | Shares | | | Amount | | | Shares | | | Amount | |
| Shares sold | | | | | | | | | | | | | | | | |
Initial Class | | | 235,293 | | | | $2,729,779 | | | | 167,676 | | | | $1,737,222 | |
Service Class | | | 94,960 | | | | 1,080,146 | | | | 189,581 | | | | 1,984,498 | |
| | | 330,253 | | | | $3,809,925 | | | | 357,257 | | | | $3,721,720 | |
| Shares issued to shareholders in reinvestment of distributions | | | | | | | | | | | | | | | | |
Initial Class | | | 771,244 | | | | $8,229,177 | | | | 110,470 | | | | $1,178,716 | |
Service Class | | | 143,858 | | | | 1,526,338 | | | | 19,860 | | | | 210,915 | |
| | | 915,102 | | | | $9,755,515 | | | | 130,330 | | | | $1,389,631 | |
| Shares reacquired | | | | | | | | | | | | | | | | |
Initial Class | | | (652,644 | ) | | | $(7,509,781 | ) | | | (1,439,898 | ) | | | $(15,099,414 | ) |
Service Class | | | (221,933 | ) | | | (2,526,958 | ) | | | (604,080 | ) | | | (6,071,033 | ) |
| | | (874,577 | ) | | | $(10,036,739 | ) | | | (2,043,978 | ) | | | $(21,170,447 | ) |
| Net change | | | | | | | | | | | | | | | | |
Initial Class | | | 353,893 | | | | $3,449,175 | | | | (1,161,752 | ) | | | $(12,183,476 | ) |
Service Class | | | 16,885 | | | | 79,526 | | | | (394,639 | ) | | | (3,875,620 | ) |
| | | 370,778 | | | | $3,528,701 | | | | (1,556,391 | ) | | | $(16,059,096 | ) |
The fund is one of several mutual funds in which certain MFS funds may invest. The MFS funds do not invest in the underlying funds for the purpose of exercising management or control. At the end of the period, the MFS Moderate Allocation Portfolio, the MFS Growth Allocation Portfolio, and the MFS Conservative Allocation Portfolio were the owners of record of approximately 50%, 17%, and 12%, respectively, of the value of outstanding voting shares of the fund.
The fund and certain other funds managed by MFS participate in a $1.1 billion unsecured committed line of credit, subject to a $1 billion sublimit, provided by a syndication of banks under a credit agreement. Borrowings may be made for temporary financing needs. Interest is charged to each fund, based on its borrowings, generally at a rate equal to the higher of the Federal Reserve funds
19
MFS New Discovery Value Portfolio
Notes to Financial Statements – continued
rate or one month LIBOR plus an agreed upon spread. A commitment fee, based on the average daily, unused portion of the committed line of credit, is allocated among the participating funds at the end of each calendar quarter. In addition, the fund and other funds managed by MFS have established unsecured uncommitted borrowing arrangements with certain banks for temporary financing needs. Interest is charged to each fund, based on its borrowings, at a rate equal to the Federal Reserve funds rate plus an agreed upon spread. For the year ended December 31, 2014, the fund’s commitment fee and interest expense were $251 and $0, respectively, and are included in “Miscellaneous” expense in the Statement of Operations.
| (7) | | Transactions in Underlying Affiliated Funds – Affiliated Issuers |
An affiliated issuer may be considered one in which the fund owns 5% or more of the outstanding voting securities, or a company which is under common control. For the purposes of this report, the fund assumes the following to be an affiliated issuer:
| | | | | | | | | | | | | | | | |
| Underlying Affiliated Fund | | Beginning Shares/Par Amount | | | Acquisitions Shares/Par Amount | | | Dispositions Shares/Par Amount | | | Ending Shares/Par Amount | |
| MFS Institutional Money Market Portfolio | | | 98,206 | | | | 19,746,284 | | | | (19,412,115 | ) | | | 432,375 | |
| | | | |
| Underlying Affiliated Fund | | Realized Gain (Loss) | | | Capital Gain Distributions | | | Dividend Income | | | Ending Value | |
| MFS Institutional Money Market Portfolio | | | $— | | | | $— | | | | $928 | | | | $432,375 | |
20
MFS New Discovery Value Portfolio
REPORT OF INDEPENDENT REGISTERED PUBLIC ACCOUNTING FIRM
To the Board of Trustees of MFS Variable Insurance Trust III and the Shareholders of
MFS New Discovery Value Portfolio:
We have audited the accompanying statement of assets and liabilities, including the portfolio of investments, of MFS New Discovery Value Portfolio (one of the series of MFS Variable Insurance Trust III) (the “Fund”) as of December 31, 2014, and the related statement of operations for the year then ended, the statements of changes in net assets for each of the two years in the period then ended, and the financial highlights for each of the five years in the period then ended. These financial statements and financial highlights are the responsibility of the Fund’s management. Our responsibility is to express an opinion on these financial statements and financial highlights based on our audits.
We conducted our audits in accordance with the standards of the Public Company Accounting Oversight Board (United States). Those standards require that we plan and perform the audit to obtain reasonable assurance about whether the financial statements and financial highlights are free of material misstatement. The Fund is not required to have, nor were we engaged to perform, an audit of its internal control over financial reporting. Our audits included consideration of internal control over financial reporting as a basis for designing audit procedures that are appropriate in the circumstances, but not for the purpose of expressing an opinion on the effectiveness of the Fund’s internal control over financial reporting. Accordingly, we express no such opinion. An audit also includes examining, on a test basis, evidence supporting the amounts and disclosures in the financial statements, assessing the accounting principles used and significant estimates made by management, as well as evaluating the overall financial statement presentation. Our procedures included confirmation of securities owned as of December 31, 2014, by correspondence with the custodian. We believe that our audits provide a reasonable basis for our opinion.
In our opinion, the financial statements and financial highlights referred to above present fairly, in all material respects, the financial position of MFS New Discovery Value Portfolio as of December 31, 2014, the results of its operations for the year then ended, the changes in its net assets for each of the two years in the period then ended, and the financial highlights for each of the five years in the period then ended, in conformity with accounting principles generally accepted in the United States of America.
DELOITTE & TOUCHE LLP
Boston, Massachusetts
February 13, 2015
21
MFS New Discovery Value Portfolio
TRUSTEES AND OFFICERS – IDENTIFICATION AND BACKGROUND
The Trustees and Officers of the Trust, as of February 1, 2015, are listed below, together with their principal occupations during the past five years. (Their titles may have varied during that period.) The address of each Trustee and Officer is 111 Huntington Avenue, Boston, Massachusetts 02199-7618.
| | | | | | | | |
Name, Age | | Position(s)
Held with Fund | | Trustee/Officer
Since (h) | | Principal Occupations
During the Past Five Years | | Other Directorships (j) |
| INTERESTED TRUSTEES |
Robert J. Manning (k) (age 51) | | Trustee | | February 2004 | | Massachusetts Financial Services Company, Chairman, Co-Chief Executive Officer and Director; President (until 2009); Chief Investment Officer (until 2010) | | N/A |
| | | | |
Robin A. Stelmach (k) (age 53) | | Trustee and President | | January 2014 | | Massachusetts Financial Services Company, Executive Vice President and Chief Operating Officer | | N/A |
| | | |
| INDEPENDENT TRUSTEES | | | | | | |
David H. Gunning (age 72) | | Trustee and Chair of Trustees | | January 2004 | | Private investor | | Lincoln Electric Holdings, Inc. (welding equipment manufacturer), Director; Development Alternatives, Inc. (consulting), Director/Non-Executive Chairman |
| | | | |
Steven E. Buller (age 63) | | Trustee | | February 2014 | | Chairman, Financial Accounting Standards Advisory Council; Standing Advisory Group, Public Company Accounting Oversight Board, Member (until 2014); BlackRock, Inc. (investment management), Managing Director (until 2014), BlackRock Finco UK (investment management), Director (until 2014) | | N/A |
| | | | |
Robert E. Butler (age 73) | | Trustee | | January 2006 | | Consultant – investment company industry regulatory and compliance matters | | N/A |
| | | | |
Maureen R. Goldfarb (age 59) | | Trustee | | January 2009 | | Private investor | | N/A |
| | | | |
William R. Gutow (age 73) | | Trustee | | December 1993 | | Private investor and real estate consultant; Capitol Entertainment Management Company (video franchise), Vice Chairman | | Texas Donuts (donut franchise), Vice Chairman (until 2010) |
| | | | |
Michael Hegarty (age 70) | | Trustee | | December 2004 | | Private investor | | Brookfield Office Properties, Inc. (real estate), Director; Rouse Properties Inc. (real estate), Director; Capmark Financial Group Inc. (real estate), Director |
| | | | |
John P. Kavanaugh (age 60) | | Trustee | | January 2009 | | Private investor | | N/A |
| | | | |
Maryanne L. Roepke (age 58) | | Trustee | | May 2014 | | American Century Investments (investment management), Senior Vice President and Chief Compliance Officer (until 2014) | | N/A |
| | | | |
Laurie J. Thomsen (age 57) | | Trustee | | March 2005 | | Private investor; New Profit, Inc. (venture philanthropy), Executive Partner (until 2010) | | The Travelers Companies (insurance), Director |
| | | | |
Robert W. Uek (age 73) | | Trustee | | January 2006 | | Consultant to investment company industry | | N/A |
| | | | |
| OFFICERS | | | | | | | | |
Christopher R. Bohane (k) (age 41) | | Assistant Secretary and Assistant Clerk | | July 2005 | | Massachusetts Financial Services Company, Vice President and Assistant General Counsel | | N/A |
| | | | |
Kino Clark (k) (age 46) | | Assistant Treasurer | | January 2012 | | Massachusetts Financial Services Company, Vice President | | N/A |
| | | | |
Thomas H. Connors (k) (age 55) | | Assistant Secretary and Assistant Clerk | | September 2012 | | Massachusetts Financial Services Company, Vice President and Senior Counsel; Deutsche Investment Management Americas Inc. (financial service provider), Director and Senior Counsel (until 2012) | | N/A |
22
MFS New Discovery Value Portfolio
Trustees and Officers – continued
| | | | | | | | |
Name, Age | | Position(s)
Held with Fund | | Trustee/Officer
Since (h) | | Principal Occupations
During the Past Five Years | | Other Directorships (j) |
Ethan D. Corey (k) (age 51) | | Assistant
Secretary and Assistant Clerk | | July 2005 | | Massachusetts Financial Services Company, Senior Vice President and Associate General Counsel | | N/A |
| | | | |
David L. DiLorenzo (k) (age 46) | | Treasurer | | July 2005 | | Massachusetts Financial Services Company, Senior Vice President | | N/A |
| | | | |
Timothy M. Fagan (k) (age 46) | | Chief Compliance Officer | | November 2014 | | Massachusetts Financial Services Company, Chief Compliance Officer; Vice President and Senior Counsel (until 2012) | | N/A |
| | | | |
Brian E. Langenfeld (k) (age 41) | | Assistant
Secretary and Assistant Clerk | | June 2006 | | Massachusetts Financial Services Company, Vice President and Senior Counsel | | N/A |
| | | | |
Susan S. Newton (k) (age 64) | | Assistant
Secretary and Assistant Clerk | | May 2005 | | Massachusetts Financial Services Company, Senior Vice President and Associate General Counsel | | N/A |
| | | | |
Susan A. Pereira (k) (age 44) | | Assistant
Secretary and Assistant Clerk | | July 2005 | | Massachusetts Financial Services Company, Vice President and Senior Counsel | | N/A |
| | | | |
Kasey L. Phillips (k) (age 44) | | Assistant Treasurer | | September 2012 | | Massachusetts Financial Services Company, Vice President; Wells Fargo Funds Management, LLC, Senior Vice President, Fund Treasurer (until 2012) | | N/A |
| | | | |
Mark N. Polebaum (k) (age 62) | | Secretary and
Clerk | | January 2006 | | Massachusetts Financial Services Company, Executive Vice President, General Counsel and Secretary | | N/A |
| | | | |
Matthew A. Stowe (k) (age 40) | | Assistant Secretary and Assistant Clerk | | October 2014 | | Massachusetts Financial Services Company, Vice President and Senior Counsel | | N/A |
| | | | |
Frank L. Tarantino (age 70) | | Independent
Senior Officer | | June 2004 | | Tarantino LLC (provider of compliance services), Principal | | N/A |
| | | | |
Richard S. Weitzel (k) (age 44) | | Assistant Secretary and Assistant Clerk | | October 2007 | | Massachusetts Financial Services Company, Senior Vice President and Associate General Counsel | | N/A |
| | | | |
James O. Yost (k) (age 54) | | Deputy Treasurer | | September 1990 | | Massachusetts Financial Services Company, Senior Vice President | | N/A |
| (h) | Date first appointed to serve as Trustee/officer of an MFS Fund. Each Trustee has served continuously since appointment unless indicated otherwise. For the period from December 15, 2004 until February 22, 2005, Mr. Manning served as Advisory Trustee. Prior to January 2012, Messrs. DiLorenzo and Yost served as Assistant Treasurers of the Funds. Ms. Stelmach was appointed as President of the Funds as of October 1, 2014. |
| (j) | Directorships or trusteeships of companies required to report to the Securities and Exchange Commission (i.e., “public companies”). |
| (k) | “Interested person” of the Trust within the meaning of the Investment Company Act of 1940 (referred to as the 1940 Act), which is the principal federal law governing investment companies like the fund, as a result of a position with MFS. The address of MFS is 111 Huntington Avenue, Boston, Massachusetts 02199-7618. |
Each Trustee (except Ms. Stelmach, Mr. Buller and Ms. Roepke) has been elected by shareholders and each Trustee and officer holds office until his or her successor is chosen and qualified or until his or her earlier death, resignation, retirement or removal. The Trust does not hold annual meetings for the purpose of electing Trustees, and Trustees are not elected for fixed terms. Messrs. Butler, Kavanaugh, Uek and Mses. Thomsen and Roepke are members of the Trust’s Audit Committee.
Each of the Fund’s Trustees and officers holds comparable positions with certain other funds of which MFS or a subsidiary is the investment adviser or distributor, and, in the case of the officers, with certain affiliates of MFS. As of February 1, 2015, the Trustees served as board members of 135 funds within the MFS Family of Funds.
23
MFS New Discovery Value Portfolio
Trustees and Officers – continued
The Statement of Additional Information for the Fund includes further information about the Trustees and is available without charge upon request by calling 1-800-225-2606.
| | |
Investment Adviser Massachusetts Financial Services Company 111 Huntington Avenue Boston, MA 02199-7618 | | Custodian State Street Bank and Trust Company 1 Lincoln Street Boston, MA 02111-2900 |
Distributor MFS Fund Distributors, Inc. 111 Huntington Avenue Boston, MA 02199-7618 | | Independent Registered Public Accounting Firm Deloitte & Touche LLP 200 Berkeley Street Boston, MA 02116 |
Portfolio Manager Kevin Schmitz | | |
24
MFS New Discovery Value Portfolio
BOARD REVIEW OF INVESTMENT ADVISORY AGREEMENT
The Investment Company Act of 1940 requires that both the full Board of Trustees and a majority of the non-interested (“independent”) Trustees, voting separately, annually approve the continuation of the Fund’s investment advisory agreement with MFS. The Trustees consider matters bearing on the Fund and its advisory arrangements at their meetings throughout the year, including a review of performance data at each regular meeting. In addition, the independent Trustees met several times over the course of three months beginning in May and ending in July, 2014 (“contract review meetings”) for the specific purpose of considering whether to approve the continuation of the investment advisory agreement for the Fund and the other investment companies that the Board oversees (the “MFS Funds”). The independent Trustees were assisted in their evaluation of the Fund’s investment advisory agreement by independent legal counsel, from whom they received separate legal advice and with whom they met separately from MFS during various contract review meetings. The independent Trustees were also assisted in this process by the MFS Funds’ Independent Chief Compliance Officer, a full-time senior officer appointed by and reporting to the independent Trustees.
In connection with their deliberations regarding the continuation of the investment advisory agreement, the Trustees, including the independent Trustees, considered such information and factors as they believed, in light of the legal advice furnished to them and their own business judgment, to be relevant. The investment advisory agreement for the Fund was considered separately, although the Trustees also took into account the common interests of all MFS Funds in their review. As described below, the Trustees considered the nature, quality, and extent of the various investment advisory, administrative, and shareholder services performed by MFS under the existing investment advisory agreement and other arrangements with the Fund.
In connection with their contract review meetings, the Trustees received and relied upon materials that included, among other items: (i) information provided by Lipper Inc., an independent third party, on the investment performance of the Fund for various time periods ended December 31, 2013 and the investment performance of a group of funds with substantially similar investment classifications/objectives (the “Lipper performance universe”), (ii) information provided by Lipper Inc. on the Fund’s advisory fees and other expenses and the advisory fees and other expenses of comparable funds identified by Lipper Inc. (the “Lipper expense group”), (iii) information provided by MFS on the advisory fees of comparable portfolios of other clients of MFS, including institutional separate accounts and other clients, (iv) information as to whether and to what extent applicable expense waivers, reimbursements or fee “breakpoints” are observed for the Fund, (v) information regarding MFS’ financial results and financial condition, including MFS’ and certain of its affiliates’ estimated profitability from services performed for the Fund and the MFS Funds as a whole, and compared to MFS’ institutional business, (vi) MFS’ views regarding the outlook for the mutual fund industry and the strategic business plans of MFS, (vii) descriptions of various functions performed by MFS for the Funds, such as compliance monitoring and portfolio trading practices, and (viii) information regarding the overall organization of MFS, including information about MFS’ senior management and other personnel providing investment advisory, administrative and other services to the Fund and the other MFS Funds. The comparative performance, fee and expense information prepared and provided by Lipper Inc. was not independently verified and the independent Trustees did not independently verify any information provided to them by MFS.
Prior to the close of business on December 7, 2012, the Fund was a series of Sun Capital Advisers Trust and was advised by Sun Capital Advisers LLC (“Sun Capital”), an affiliate of MFS, and subadvised by Columbia Management Investment Advisers, LLC. Following shareholder approval, MFS became the investment adviser of the Fund and assumed day-to-day investment management responsibilities for the Fund effective as of the close of business on December 7, 2012.
The Trustees’ conclusion as to the continuation of the investment advisory agreement was based on a comprehensive consideration of all information provided to the Trustees and not the result of any single factor. Some of the factors that figured particularly in the Trustees’ deliberations are described below, although individual Trustees may have evaluated the information presented differently from one another, giving different weights to various factors. It is also important to recognize that the fee arrangements for the Fund and other MFS Funds are the result of years of review and discussion between the independent Trustees and MFS, that certain aspects of such arrangements may receive greater scrutiny in some years than in others, and that the Trustees’ conclusions may be based, in part, on their consideration of these same arrangements during the course of the year and in prior years.
Based on information provided by Lipper Inc. and MFS, the Trustees reviewed the Fund’s total return investment performance as well as the performance of peer groups of funds over various time periods. The Trustees placed particular emphasis on the total return performance of the Fund’s Initial Class shares in comparison to the performance of funds in its Lipper performance universe over the three-year period ended December 31, 2013, which the Trustees believed was a long enough period to reflect differing market conditions. The total return performance of the Fund’s Initial Class shares was in the 4th quintile relative to the other funds in the universe for this three-year period (the 1st quintile being the best performers and the 5th quintile being the worst performers). The total return performance of the Fund’s Initial Class shares was in the 1th quintile for the one-year period and the 4th quintile for the five-year period ended December 31, 2013 relative to the Lipper performance universe. Because of the passage of time, these performance results may differ from the performance results for more recent periods, including those shown elsewhere in this report.
25
MFS New Discovery Value Portfolio
Board Review of Investment Advisory Agreement – continued
In the course of their deliberations, the Trustees took into account information provided by MFS in connection with the contract review meetings, as well as during investment review meetings conducted with portfolio management personnel during the course of the year regarding the Fund’s performance. The Trustees noted that MFS became the Fund’s investment adviser in December 2012 and that MFS implemented certain changes in the Fund’s investment strategy. After reviewing these and related factors, the Trustees concluded, within the context of their overall conclusions regarding the investment advisory agreement, that they were satisfied with MFS’ responses and efforts relating to investment performance.
In assessing the reasonableness of the Fund’s advisory fee, the Trustees considered, among other information, the Fund’s advisory fee and the total expense ratio of the Fund’s Initial Class shares as a percentage of average daily net assets and the advisory fee and total expense ratios of peer groups of funds based on information provided by Lipper Inc. The Trustees considered that MFS currently observes an expense limitation for the Fund, and that MFS has agreed to further reduce such expense limitation for the Fund, which may not be changed without the Trustees’ approval. The Trustees also considered that, according to the Lipper data (which takes into account any fee reductions or expense limitations that were in effect during the Fund’s last fiscal year), the Fund’s effective advisory fee rate and total expense ratio were each higher than the Lipper expense group median.
The Trustees also considered the advisory fees charged by MFS to any comparable institutional accounts. In comparing these fees, the Trustees considered information provided by MFS as to the generally broader scope of services provided by MFS to the Fund in comparison to institutional accounts, the higher demands placed on MFS’ investment personnel and trading infrastructure as a result of the daily cash in-flows and out-flows of the Fund, and the impact on MFS and expenses associated with the more extensive regulatory regime to which the Fund is subject in comparison to institutional accounts.
The Trustees also considered whether the Fund may benefit from any economies of scale in the management of the Fund in the event of growth in assets of the Fund and/or growth in assets of the MFS Funds as a whole. They noted that the Fund’s advisory fee rate schedule is subject to a contractual breakpoint that reduces the Fund’s advisory fee rate on average daily net assets over $250 million. The Trustees also noted that MFS has agreed in writing to waive a portion of the management fees of certain MFS Funds, including the Fund, if the total combined assets of certain funds within the MFS Funds’ complex increase above agreed upon thresholds (the “group fee waiver”), enabling the Fund’s shareholders to share in the benefits from any economies of scale at the complex level. The group fee waiver is reviewed and renewed annually between the Board and MFS. The Trustees concluded that the breakpoint and the group fee waiver were sufficient to allow the Fund to benefit from economies of scale as its assets and overall complex assets grow.
The Trustees also considered information prepared by MFS relating to MFS’ costs and profits with respect to the Fund, the MFS Funds considered as a group, and other investment companies and accounts advised by MFS, as well as MFS’ methodologies used to determine and allocate its costs to the MFS Funds, the Fund and other accounts and products for purposes of estimating profitability.
After reviewing these and other factors described herein, the Trustees concluded, within the context of their overall conclusions regarding the investment advisory agreement, that the advisory fees charged to the Fund represent reasonable compensation in light of the services being provided by MFS to the Fund.
In addition, the Trustees considered MFS’ resources and related efforts to continue to retain, attract and motivate capable personnel to serve the Fund. The Trustees also considered current and developing conditions in the financial services industry, including the presence of large and well-capitalized companies which are spending, and appear to be prepared to continue to spend, substantial sums to engage personnel and to provide services to competing investment companies. In this regard, the Trustees also considered the financial resources of MFS and its ultimate parent, Sun Life Financial Inc. The Trustees also considered the advantages and possible disadvantages to the Fund of having an adviser that also serves other investment companies as well as other accounts.
The Trustees also considered the nature, quality, cost, and extent of administrative, transfer agency, and distribution services provided to the Fund by MFS and its affiliates under agreements and plans other than the investment advisory agreement, including any 12b-1 fees the Fund pays to MFS Fund Distributors, Inc., an affiliate of MFS. The Trustees also considered the nature, extent and quality of certain other services MFS performs or arranges for on the Fund’s behalf, which may include securities lending programs, directed expense payment programs, class action recovery programs, and MFS’ interaction with third-party service providers, principally custodians and sub-custodians. The Trustees concluded that the various non-advisory services provided by MFS and its affiliates on behalf of the Fund were satisfactory.
The Trustees also considered benefits to MFS from the use of the Fund’s portfolio brokerage commissions, if applicable, to pay for investment research and various other factors. Additionally, the Trustees considered so-called “fall-out benefits” to MFS such as reputational value derived from serving as investment manager to the Fund.
Based on their evaluation of factors that they deemed to be material, including those factors described above, the Board of Trustees, including the independent Trustees, concluded that the Fund’s investment advisory agreement with MFS should be continued for an additional one-year period, commencing August 1, 2014.
26
MFS New Discovery Value Portfolio
PROXY VOTING POLICIES AND INFORMATION
MFS votes proxies on behalf of the fund pursuant to proxy voting policies and procedures that are available without charge, upon request, by calling 1-800-225-2606, by visiting the Proxy Voting section of mfs.com or by visiting the SEC’s Web site at http://www.sec.gov.
Information regarding how the fund voted proxies relating to portfolio securities during the most recent twelve-month period ended June 30 is available without charge by visiting the Proxy Voting section of mfs.com or by visiting the SEC’s Web site at http://www.sec.gov.
QUARTERLY PORTFOLIO DISCLOSURE
The fund will file a complete schedule of portfolio holdings with the Securities and Exchange Commission (the Commission) for the first and third quarters of each fiscal year on Form N-Q. The fund’s Form N-Q is available on the EDGAR database on the Commission’s Internet Web site at http://www.sec.gov, and may be reviewed and copied at the:
Public Reference Room
Securities and Exchange Commission
100 F Street, NE, Room 1580
Washington, D.C. 20549
Information on the operation of the Public Reference Room may be obtained by calling the Commission at 1-800-SEC-0330. Copies of the fund’s Form N-Q also may be obtained, upon payment of a duplicating fee, by electronic request at the following e-mail address: publicinfo@sec.gov or by writing the Public Reference Section at the above address.
FURTHER INFORMATION
From time to time, MFS may post important information about the fund or the MFS funds on the MFS web site (mfs.com). This information is available by visiting the “Market Commentary” and “Announcements” sub sections in the “Market Outlooks” section of mfs.com or by clicking on the fund’s name under “Variable Insurance Portfolios — VIT III” in the “Products” section of mfs.com.
FEDERAL TAX INFORMATION (unaudited)
The following information is provided pursuant to provisions of the Internal Revenue Code.
The fund designates $1,229,000 as capital gain dividends paid during the fiscal year.
For corporate shareholders, 8.19% of the ordinary income dividends paid during the fiscal year qualify for the corporate dividends received deduction
27
rev. 3/11
| | | | |
| FACTS | | WHAT DOES MFS DO WITH YOUR
PERSONAL INFORMATION? | |  |
| | |
| Why? | | Financial companies choose how they share your personal information. Federal law gives consumers the right to limit some but not all sharing. Federal law also requires us to tell you how we collect, share, and protect your personal information. Please read this notice carefully to understand what we do. |
| | |
| What? | | The types of personal information we collect and share depend on the product or service you have with us. This information can include: • Social Security number and account balances • Account transactions and transaction history • Checking account information and wire transfer instructions When you are no longer our customer, we continue to share your information as described in this notice. |
| | |
| How? | | All financial companies need to share customers’ personal information to run their everyday business. In the section below, we list the reasons financial companies can share their customers’ personal information; the reasons MFS chooses to share; and whether you can limit this sharing. |
| | | | |
Reasons we can share your
personal information | | Does MFS share? | | Can you limit this
sharing? |
For our everyday business purposes – such as to process your transactions, maintain your account(s), respond to court orders and legal investigations, or report to credit bureaus | | Yes | | No |
For our marketing purposes – to offer our products and services to you | | No | | We don’t share |
| For joint marketing with other financial companies | | No | | We don’t share |
For our affiliates’ everyday business purposes – information about your transactions and experiences | | No | | We don’t share |
For our affiliates’ everyday business purposes – information about your creditworthiness | | No | | We don’t share |
| For nonaffiliates to market to you | | No | | We don’t share |
| | |
| Questions? | | Call 800-225-2606 or go to mfs.com. |
28
| | |
| Who we are |
| Who is providing this notice? | | MFS Funds, MFS Investment Management, MFS Institutional Advisors, Inc., MFS Fund Distributors, Inc., MFS Heritage Trust Company, and MFS Service Center, Inc. |
| | |
| What we do |
| How does MFS protect my personal information? | | To protect your personal information from unauthorized access and use, we use security measures that comply with federal law. These measures include procedural, electronic, and physical safeguards for the protection of the personal information we collect about you. |
How does MFS
collect my personal information? | | We collect your personal information, for example, when you • open an account or provide account information • direct us to buy securities or direct us to sell your securities • make a wire transfer We also collect your personal information from others, such as credit bureaus, affiliates and other companies. |
| Why can’t I limit all sharing? | | Federal law gives you the right to limit only • sharing for affiliates’ everyday business purposes – information about your creditworthiness • affiliates from using your information to market to you • sharing for nonaffiliates to market to you State laws and individual companies may give you additional rights to limit sharing. |
| | |
| Definitions |
| Affiliates | | Companies related by common ownership or control. They can be financial and nonfinancial companies. • MFS does not share personal information with affiliates, except for everyday business purposes as described on page one of this notice. |
| Nonaffiliates | | Companies not related by common ownership or control. They can be financial and nonfinancial companies. • MFS does not share with nonaffiliates so they can market to you. |
| Joint Marketing | | A formal agreement between nonaffiliated financial companies that together market financial products or services to you. • MFS doesn’t jointly market. |
| | |
| Other important information |
| If you own an MFS product or receive an MFS service in the name of a third party such as a bank or broker-dealer, their privacy policy may apply to you instead of ours. |
29
The Registrant has adopted a Code of Ethics pursuant to Section 406 of the Sarbanes-Oxley Act and as defined in Form N-CSR that applies to the Registrant’s principal executive officer and principal financial and accounting officer. During the period covered by this report, the Registrant has not amended any provision in its Code of Ethics (the “Code”) that relates to an element of the Code’s definitions enumerated in paragraph (b) of Item 2 of this Form N-CSR. During the period covered by this report, the Registrant did not grant a waiver, including an implicit waiver, from any provision of the Code.
A copy of the Code of Ethics is filed as an exhibit to this Form N-CSR.
| ITEM 3. | AUDIT COMMITTEE FINANCIAL EXPERT. |
Messrs. Robert E. Butler, John P. Kavanaugh, and Robert W. Uek and Mses. Maryanne L. Roepke and Laurie J. Thomsen, members of the Audit Committee, have been determined by the Board of Trustees in their reasonable business judgment to meet the definition of “audit committee financial expert” as such term is defined in Form N-CSR. In addition, Messrs. Butler, Kavanaugh and Uek and Mses. Roepke and Thomsen are “independent” members of the Audit Committee (as such term has been defined by the Securities and Exchange Commission in regulations implementing Section 407 of the Sarbanes-Oxley Act of 2002). The Securities and Exchange Commission has stated that the designation of a person as an audit committee financial expert pursuant to this Item 3 on the Form N-CSR does not impose on such a person any duties, obligations or liability that are greater than the duties, obligations or liability imposed on such person as a member of the Audit Committee and the Board of Trustees in the absence of such designation or identification.
| ITEM 4. | PRINCIPAL ACCOUNTANT FEES AND SERVICES. |
Items 4(a) through 4(d) and 4(g):
The Board of Trustees has appointed Deloitte & Touche LLP (“Deloitte”) to serve as independent accountants to each series of the Registrant (each a “Fund” and collectively the “Funds”). The tables below set forth the audit fees billed to the Funds as well as fees for non-audit services provided to the Funds and/or to the Funds’ investment adviser, Massachusetts Financial Services Company (“MFS”) and to various entities either controlling, controlled by, or under common control with MFS that provide ongoing services to the Funds (“MFS Related Entities”).
For the fiscal years ended December 31, 2014 and 2013, audit fees billed to each Fund by Deloitte were as follows:
| | | | | | | | |
| | | Audit Fees | |
| | | 2014 | | | 2013 | |
Fees billed by Deloitte: | | | | | | | | |
MFS Blended Research Small Cap Equity Portfolio | | | 41,990 | | | | 41,473 | |
MFS Conservative Allocation Portfolio | | | 28,557 | | | | 28,199 | |
MFS Global Real Estate Portfolio | | | 42,888 | | | | 42,360 | |
MFS Growth Allocation Portfolio | | | 28,557 | | | | 28,199 | |
MFS Inflation-Adjusted Bond Portfolio | | | 32,877 | | | | 32,468 | |
MFS Limited Maturity Portfolio | | | 52,495 | | | | 51,854 | |
MFS Mid Cap Value Portfolio | | | 43,279 | | | | 42,747 | |
MFS Moderate Allocation Portfolio | | | 28,557 | | | | 28,199 | |
MFS New Discovery Value Portfolio | | | 41,990 | | | | 41,473 | |
| | | | | | | | |
Total | | | 341,190 | | | | 336,972 | |
For the fiscal years ended December 31, 2014 and 2013, fees billed by Deloitte for audit-related, tax and other services provided to each Fund and for audit-related, tax and other services provided to MFS and MFS Related Entities were as follows:
| | | | | | | | | | | | | | | | | | | | | | | | |
| | | Audit-Related Fees1 | | | Tax Fees2 | | | All Other Fees3 | |
| | | 2014 | | | 2013 | | | 2014 | | | 2013 | | | 2014 | | | 2013 | |
Fees billed by Deloitte: | | | | | | | | | | | | | | | | | | | | | | | | |
To MFS Blended Research Small Cap Equity Portfolio | | | 2,400 | | | | 2,400 | | | | 4,726 | | | | 4,670 | | | | 1,012 | | | | 1,204 | |
To MFS Conservative Allocation Portfolio | | | 2,400 | | | | 2,400 | | | | 4,726 | | | | 4,670 | | | | 1,076 | | | | 1,326 | |
To MFS Global Real Estate Portfolio | | | 2,400 | | | | 2,400 | | | | 5,037 | | | | 4,977 | | | | 1,022 | | | | 1,216 | |
To MFS Growth Allocation Portfolio | | | 2,400 | | | | 2,400 | | | | 4,726 | | | | 4,670 | | | | 1,049 | | | | 1,269 | |
To MFS Inflation-Adjusted Bond Portfolio | | | 2,400 | | | | 2,400 | | | | 3,937 | | | | 3,890 | | | | 1,040 | | | | 1,258 | |
To MFS Limited Maturity Portfolio | | | 2,400 | | | | 2,400 | | | | 4,726 | | | | 4,670 | | | | 1,076 | | | | 1,342 | |
To MFS Mid Cap Value Portfolio | | | 2,400 | | | | 2,400 | | | | 4,726 | | | | 4,670 | | | | 1,032 | | | | 1,229 | |
To MFS Moderate Allocation Portfolio | | | 2,400 | | | | 2,400 | | | | 4,726 | | | | 4,670 | | | | 1,179 | | | | 1,495 | |
To MFS New Discovery Value Portfolio | | | 2,400 | | | | 2,400 | | | | 4,726 | | | | 4,670 | | | | 1,006 | | | | 1,188 | |
| | | | | | | | | | | | | | | | | | | | | | | | |
Total fees billed by Deloitte To above Funds: | | | 21,600 | | | | 21,600 | | | | 42,056 | | | | 41,557 | | | | 9,492 | | | | 11,527 | |
| | | | | | | | | | | | | | | | | | | | | | | | |
| | | Audit-Related Fees1 | | | Tax Fees2 | | | All Other Fees3 | |
| | | 2014 | | | 2013 | | | 2014 | | | 2013 | | | 2014 | | | 2013 | |
Fees billed by Deloitte: | | | | | | | | | | | | | | | | | | | | | | | | |
To MFS and MFS Related Entities of MFS Blended Research Small Cap Equity Portfolio* | | | 1,686,271 | | | | 1,589,808 | | | | 0 | | | | 0 | | | | 0 | | | | 0 | |
To MFS and MFS Related Entities of MFS Conservative Allocation Portfolio* | | | 1,686,271 | | | | 1,589,808 | | | | 0 | | | | 0 | | | | 0 | | | | 0 | |
To MFS and MFS Related Entities of MFS Global Real Estate Portfolio* | | | 1,686,271 | | | | 1,589,808 | | | | 0 | | | | 0 | | | | 0 | | | | 0 | |
To MFS and MFS Related Entities of MFS Growth Allocation Portfolio* | | | 1,686,271 | | | | 1,589,808 | | | | 0 | | | | 0 | | | | 0 | | | | 0 | |
To MFS and MFS Related Entities of MFS Inflation-Adjusted Bond Portfolio* | | | 1,686,271 | | | | 1,589,808 | | | | 0 | | | | 0 | | | | 0 | | | | 0 | |
To MFS and MFS Related Entities of MFS Limited Maturity Portfolio* | | | 1,686,271 | | | | 1,589,808 | | | | 0 | | | | 0 | | | | 0 | | | | 0 | |
To MFS and MFS Related Entities of MFS Mid Cap Value Portfolio* | | | 1,686,271 | | | | 1,589,808 | | | | 0 | | | | 0 | | | | 0 | | | | 0 | |
To MFS and MFS Related Entities of MFS Moderate Allocation Portfolio* | | | 1,686,271 | | | | 1,589,808 | | | | 0 | | | | 0 | | | | 0 | | | | 0 | |
To MFS and MFS Related Entities of MFS New Discovery Value Portfolio* | | | 1,686,271 | | | | 1,589,808 | | | | 0 | | | | 0 | | | | 0 | | | | 0 | |
| | | | | | | | |
| | | Aggregate fees for non-audit
services: | |
| | | 2014 | | | 2013 | |
Fees billed by Deloitte: | | | | | | | | |
To MFS Blended Research Small Cap Equity Portfolio, MFS and MFS Related Entities# | | | 1,697,747 | | | | 1,612,902 | |
To MFS Conservative Allocation Portfolio, MFS and MFS Related Entities# | | | 1,697,811 | | | | 1,613,024 | |
To MFS Global Real Estate Portfolio, MFS and MFS Related Entities# | | | 1,698,068 | | | | 1,613,221 | |
To MFS Growth Allocation Portfolio, MFS and MFS Related Entities# | | | 1,697,784 | | | | 1,612,967 | |
To MFS Inflation-Adjusted Bond Portfolio, MFS and MFS Related Entities# | | | 1,696,986 | | | | 1,612,176 | |
To MFS Limited Maturity Portfolio, MFS and MFS Related Entities# | | | 1,697,811 | | | | 1,613,040 | |
To MFS Mid Cap Value Portfolio, MFS and MFS Related Entities# | | | 1,697,767 | | | | 1,612,927 | |
To MFS Moderate Allocation Portfolio, MFS and MFS Related Entities# | | | 1,697,914 | | | | 1,613,193 | |
To MFS New Discovery Value Portfolio, MFS and MFS Related Entities# | | | 1,697,741 | | | | 1,612,886 | |
| * | This amount reflects the fees billed to MFS and MFS Related Entities for non-audit services relating directly to the operations and financial reporting of the Funds (portions of which services also related to the operations and financial reporting of other funds within the MFS Funds complex). |
| # | This amount reflects the aggregate fees billed by Deloitte for non-audit services rendered to the Funds and for non-audit services rendered to MFS and the MFS Related Entities. |
| 1 | The fees included under “Audit-Related Fees” are fees related to assurance and related services that are reasonably related to the performance of the audit or review of financial statements, but not reported under ‘‘Audit Fees,’’ including accounting consultations, agreed-upon procedure reports, attestation reports, comfort letters and internal control reviews. |
| 2 | The fees included under “Tax Fees” are fees associated with tax compliance, tax advice and tax planning, including services relating to the filing or amendment of federal, state or local income tax returns, regulated investment company qualification reviews and tax distribution and analysis. |
| 3 | The fees included under “All Other Fees” are fees for products and services provided by Deloitte other than those reported under “Audit Fees,” “Audit-Related Fees” and “Tax Fees,” including fees for services related to review of internal controls and review of Rule 38a-1 compliance program. |
Item 4(e)(1):
Set forth below are the policies and procedures established by the Audit Committee of the Board of Trustees relating to the pre-approval of audit and non-audit related services:
To the extent required by applicable law, pre-approval by the Audit Committee of the Board is needed for all audit and permissible non-audit services rendered to the Funds and all permissible non-audit services rendered to MFS or MFS Related Entities if the services relate directly to the operations and financial reporting of the Registrant. Pre-approval is currently on an engagement-by-engagement basis. In the event pre-approval of such services is necessary between regular meetings of the Audit Committee and it is not practical to wait to seek pre-approval at the next regular meeting of the Audit Committee, pre-approval of such services may be referred to the Chair of the Audit Committee for approval; provided that the Chair may not pre-approve any individual engagement for such services exceeding $50,000 or multiple engagements for such services in the aggregate exceeding $100,000 in each period between regular meetings of the Audit Committee. Any engagement pre-approved by the Chair between regular meetings of the Audit Committee shall be presented for ratification by the entire Audit Committee at its next regularly scheduled meeting.
Item 4(e)(2):
None, or 0%, of the services relating to the Audit-Related Fees, Tax Fees and All Other Fees paid by the Fund and MFS and MFS Related Entities relating directly to the operations and financial reporting of the Registrant disclosed above were approved by the audit committee pursuant to paragraphs (c)(7)(i)(C) of Rule 2-01 of Regulation S-X (which permits audit committee approval after the start of the engagement with respect to services other than audit, review or attest services, if certain conditions are satisfied).
Item 4(f): Not applicable.
Item 4(h): The Registrant’s Audit Committee has considered whether the provision by a Registrant’s independent registered public accounting firm of non-audit services to MFS and MFS Related Entities that were not pre-approved by the Committee (because such services did not relate directly to the operations and financial reporting of the Registrant) was compatible with maintaining the independence of the independent registered public accounting firm as the Registrant’s principal auditors.
| ITEM 5. | AUDIT COMMITTEE OF LISTED REGISTRANTS. |
Not applicable to the Registrant.
| ITEM 6. | SCHEDULE OF INVESTMENTS |
A schedule of investments of the Registrant is included as part of the report to shareholders of such series under Item 1 of this Form N-CSR.
| ITEM 7. | DISCLOSURE OF PROXY VOTING POLICIES AND PROCEDURES FOR CLOSED-END MANAGEMENT INVESTMENT COMPANIES. |
Not applicable to the Registrant.
| ITEM 8. | PORTFOLIO MANAGERS OF CLOSED-END MANAGEMENT INVESTMENT COMPANIES. |
Not applicable to the Registrant.
| ITEM 9. | PURCHASES OF EQUITY SECURITIES BY CLOSED-END MANAGEMENT INVESTMENT COMPANY AND AFFILIATED PURCHASERS. |
Not applicable to the Registrant.
| ITEM 10. | SUBMISSION OF MATTERS TO A VOTE OF SECURITY HOLDERS. |
There were no material changes to the procedures by which shareholders may send recommendations to the Board for nominees to the Registrant’s Board since the Registrant last provided disclosure as to such procedures in response to the requirements of Item 407 (c)(2)(iv) of Regulation S-K or this Item.
| ITEM 11. | CONTROLS AND PROCEDURES. |
| (a) | Based upon their evaluation of the effectiveness of the registrant’s disclosure controls and procedures (as defined in Rule 30a-3(c) under the Investment Company Act of 1940 (the “Act”)) as conducted within 90 days of the filing date of this report on Form N-CSR, the registrant’s principal financial officer and principal executive officer have concluded that those disclosure controls and procedures provide reasonable assurance that the material information required to be disclosed by the registrant on this report is recorded, processed, summarized and reported within the time periods specified in the Securities and Exchange Commission’s rules and forms. |
| (b) | There were no changes in the Registrant’s internal controls over financial reporting (as defined in Rule 30a-3(d) under the Act) that occurred during the second fiscal quarter of the period covered by the report that have materially affected, or are reasonably likely to materially affect, the Registrant’s internal control over financial reporting. |
| (a) | File the exhibits listed below as part of this form. Letter or number the exhibits in the sequence indicated. |
| | (1) | Any code of ethics, or amendment thereto, that is the subject of the disclosure required by Item 2, to the extent that the registrant intends to satisfy the Item 2 requirements through filing of an exhibit: Code of Ethics attached hereto. |
| | (2) | A separate certification for each principal executive officer and principal financial officer of the registrant as required by Rule 30a-2(a) under the Act (17 CFR 270.30a-2): Attached hereto. |
| (b) | If the report is filed under Section 13(a) or 15(d) of the Exchange Act, provide the certifications required by Rule 30a-2(b) under the Act (17 CFR 270.30a-2(b)), Rule 13a-14(b) or Rule 15d-14(b) under the Exchange Act (17 CFR 240.13a-14(b) or 240.15d-14(b)) and Section 1350 of Chapter 63 of Title 18 of the United States Code (18 U.S.C. 1350) as an exhibit. A certification furnished pursuant to this paragraph will not be deemed “filed” for the purposes of Section 18 of the Exchange Act (15 U.S.C. 78r), or otherwise subject to the liability of that section. Such certification will not be deemed to be incorporated by reference into any filing under the Securities Act of 1933 or the Exchange Act, except to the extent that the registrant specifically incorporates it by reference: Attached hereto. |
Notice
Notice is hereby given that this instrument is executed on behalf of the Registrant by an officer of the Registrant as an officer and not individually and the obligations of or arising out of this instrument are not binding upon any of the Trustees or shareholders individually, but are binding only upon the assets and property of the respective constituent series of the Registrant.
SIGNATURES
Pursuant to the requirements of the Securities Exchange Act of 1934 and the Investment Company Act of 1940, the registrant has duly caused this report to be signed on its behalf by the undersigned, thereunto duly authorized.
(Registrant) MFS VARIABLE INSURANCE TRUST III
| | |
| By (Signature and Title)* | | ROBIN A. STELMACH |
| | Robin A. Stelmach, President |
Date: February 13, 2015
Pursuant to the requirements of the Securities Exchange Act of 1934 and the Investment Company Act of 1940, this report has been signed below by the following persons on behalf of the registrant and in the capacities and on the dates indicated.
| | |
| By (Signature and Title)* | | ROBIN A. STELMACH |
| | Robin A. Stelmach, President (Principal Executive Officer) |
Date: February 13, 2015
| | |
| By (Signature and Title)* | | DAVID L. DILORENZO |
| | David L. DiLorenzo, Treasurer (Principal Financial Officer and Accounting Officer) |
Date: February 13, 2015
| * | Print name and title of each signing officer under his or her signature. |